Canadian Federal Policy and Post Secondary Education
200
Canadian Federal Policy and Postsecondary Education By Donald Fisher Kjell Rubenson Jean Bernatchez Robert Clift Glen Jones Jacy Lee Madeleine MacIvor John Meredith Theresa Shanahan Claude Trottier The Centre for Policy Studies in Higher Education and Training (CHET) Faculty of Education, University of British Columbia
Transcript of Canadian Federal Policy and Post Secondary Education

Canadian Federal Policy and Postsecondary Education
By
Donald Fisher Kjell Rubenson Jean Bernatchez
Robert Clift Glen Jones
Jacy Lee Madeleine MacIvor
John Meredith Theresa Shanahan
Claude Trottier
The Centre for Policy Studies in Higher Education and Training (CHET)Faculty of Education, University of British Columbia
ii© 2006 Donald Fisher & Kjell Rubenson
0 9 8 7 6 5 4 3 2 1
All rights reserved. No part of this book may be reproduced, stored in a retrieval system
or transmitted in any form or by any means, without the prior written permission of the
publisher or, in the case of photocopying or other reprographic copying, a license from
CANCOPY (Canadian Reprography Collective), Toronto, Ontario.
The Centre for Policy Studies in Higher Education and Training (CHET)
Faculty of Education, University of British Columbia
2125 Main Mall
Vancouver, British Columbia (Canada) V6T 1Z4
www.chet.educ.ubc.ca
Canadian Cataloguing in Publication Data
Main entry under title:
Canadian Federal Policy and Postsecondary Education
Includes bibliographic references and index.
ISBN 978-0-88865-747-3
1. Canadian federal policy – History. 2. Fiscal arrangement – Economic development
– research and development – vocational and technical funding – Aboriginal education. I.
Fisher, Donald, 1944. [or Rubenson, Kjell, 1944]. II. Title.
Printed and bound in Canada by Printcrafters, Winnipeg, Manitoba.

iii
Contents
1. Introduction 1
2. Historical Development of Federal PSE Policy 9
2.1 Federal Policy, 1867 to 1977 9
3. Fiscal Arrangements 39
3.1 Transfer Payments 39
3.2. Student Financial Assistance and Tuition Fees 54
3.2.1. Trends in Tuition Fees 58
3.2.2. Income Contingent Loan Repayment 59
3.2.3 Canada Millennium Scholarship Foundation 67
3.2.4. From Universal to Piecemeal 70
3.2.5. Regressive Subsidies 72
4. Economic Development and the National Interest 77
4.1. Research and Development 77
4.2 Vocational and Technical Training 99
4.2.1 Apprenticeship and Industry Training 105
4.3 Aboriginal Education 107
4.3.1 Funding for Indian and Inuit Students 108
5. Summary and Conclusion 113
5.1 Transfer Payments 113
5.2 Research and Development 115
5.3 Student Assistance 118
5.4 Vocational and Technical Training 121
5.5 Aboriginal Education 124
5.6 Concluding Refl ections 124
Bibliography 163
Index 179

ivList of Tables, Charts and Appendixes
Tables
Table 1. Indian and Inuit Graduates 1934-76 14
Table 2. The Percentage Increase/Decrease in Federal Transfers
(Cash and Tax Points) for Health, PSE and Social Assistance,
1988-89 to 2005-06 (current and 1988 dollars) 51
Table 3. The Percentage Increase/Decrease in Federal Transfers
(Cash and Tax Points) for Health, PSE and Social Assistance,
1995-96 to 2005-06 (current and 1988 dollars) 51
Table 4. PSE Enrollment, Federal Transfer Spent on PSE, and
Spending per Capita, and Percentage Change, 1994-95 to
2004-05 53
Table 5. Need-Based Assistance to Students by Type and Source
(2003 dollars) 65
Table 6. Federal Government Tax Expenditures Related to
Postsecondary Education 75
Table 7. Share of University Research Funded by Industry (%) in
1996, 1990, and 1985 86
Table 8. Canadian Foundation for Innovation (CFI) Awards by
Research Area, June 1998 – November 2005 90
Table 9. Federal Contributions to Total Sponsored Research
Expenditures in Canadian Universities, 1971-72 to 2001-02 91
Table 10. CRC Chairs by University and as a Percentage of the
Total Number of Chairs 97
Charts
Chart 1. Federal Cash Transfers and PSE Total Expenditures
(1967-68 to1976-77 in current dollars) 30
Chart 2. Federal Cash Transfers and PSE Total Expenditures
(1977-78 to 1995-96 in current dollars) 44Chart 3. Federal Transfer Payments for Health Care and Social
Programs (1988-89 to 2005-06 in current dollars) 50
Chart 4. Federal Transfer Payments for Health Care and Social
Programs (1988-89 to 2005-06 in 1988 dollars) 50
Chart 5. Total Federal Support for Postsecondary Education and
Research (1988-89 to 2003-04 in current dollars) 52
Chart 6. Total Federal Support for Postsecondary Education and
Research (1988-89 to 2003-04 in 1988 dollars) 52
Chart 7. Federal Program Spending on Postsecondary Education
and Research (1988-89 to 2003-04 in current dollars) 54

vChart 8. Federal Program Spending on Postsecondary
Education and Research (1988-89 to 2003-04 in 1988 dollars) 55
Chart 9. Federal Transfer Payments for Postsecondary
Education (1988-89 to 2005-06 in current dollars) 55
Chart 10. Federal Transfer for Postsecondary Education
(1988-89 to 2005-06 in 1988 dollars) 55
Chart 11. Average Domestic Undergraduate Tuition Fees
(Canada) 1972-73 to 2004-05 59
Chart 12. Total Expenditures on Student Assistance in Canada
(2003 dollars) 66
Chart 13. Federal Spending on Granting Councils (1988-89 to
2003-04 in current dollars) 94
Chart 14. Federal Spending on Granting Councils (1988-89 to
2003-04 in 1988 dollars) 94
Chart 15. Federal Funding for Postsecondary Education Sector
Research – NSERC (millions in current dollars) 94
Chart 16. Federal Funding for Postsecondary Education Sector
Research – SSHRC (millions in current dollars) 95
Chart 17. Additional Federal Research Funding, Total and
Human Science 1998-2005 95
Appendices
Appendix 1. Total Federal Government Support for
Postsecondary Education and Research 1988-89 to 2003-04
(millions of current and 1988) 132
Appendix 2. Summary of Major Transfer Payments from the
Federal Government to Provincial Governments for Health
Care, Postsecondary Education and Social Assistance 1988-89
to 2005-06 (millions of current and 1988 dollars) 136
Appendix 3. Federal Government Program Spending on
Postsecondary Education and Research 1988-89 to 2003-04
(millions of current and 1988 dollars) 142
Appendix 4. Federal Government Spending on Granting Councils
1988-89 to 2003-04 (millions of current and 1988 dollars) 152
Appendix 5. Major Transfer Payments from the Federal
Government to Provincial Governments for Health Care,
Postsecondary Education and Social Assistance 1988-89 to
2005-06, Apportioned to Program Areas (millions of
current and 1988 dollars) 156
Appendix 6. Federal Funding for Postsecondary Education Sector
Research (millions of current dollars) 162
vi
List of Acronyms
ACCC Association of Canadian Community Colleges
ACST Advisory Council on Science and Technology
AFN Assembly of First Nations
AGC Auditor General of Canada
AIF Atlantic Innovation Fund
AUCC Association of Universities and Colleges of Canada
BTSD Basic Training for Skill Development
CAP Canada Assistance Program
CAAT Colleges of Applied Arts and Technology
CAUBO Canadian Association of University Business Offi cers
CAUT Canadian Association of University Teachers
CBIE Canadian Bureau for International Education
CC Canada Council
CCL Canadian Council on Learning
CEGEP Collèges d’enseignement général et professionnel
CEIC Canada Employment Insurance Commission
CEN Canadian Education Network
CESG Canada Education Savings Grant
CFHSS Canadian Federation for the Humanities and Social
Sciences
CFI Canadian Foundation for Innovation
CFS Canadian Federation of Students
CHA Canada Health Act
CHST Canada Health and Social Transfer
CHT Canada Health Transfer
CIAR Canadian Institute for Advanced Research
CIDA Canadian International Development Agency
CIHR Canadian Institute for Health Research
CITC Community Industrial Training Committees
CJS Canadian Jobs Strategy
CLFDB Canadian Labour Force Development Board
CMEC Council of Ministers of Education Canada
CMSF Canada Millennium Scholarship Foundation
COU Council of Ontario Universities
CRC Canada Research Chairs Program
CRF Consolidated Revenue Fund
CSG Canada Study Grant
CSL Canada Student Loans
CSLP Canada Student Loans Program
CSSRC Canadian Social Science Research Council
CST Canada Social Transfer
CUS Canadian Union of Students

viiDFAIT Department of Foreign Affairs and International Trade
EBSM Employment Benefi ts and Support Measures
ECC Economic Council of Canada
EI Employment Insurance
EPF Established Programs Financing Act
FPFAA Federal-Provincial Fiscal Arrangements Act
GDP Gross Domestic Product
GERD Gross Domestic Expenditure on R&D
GNP Gross National Product
HDI Human Development Index
HERD Higher Education Expenditure on R&D
HRCC Humanities Research Council of Canada
HRDC Human Resources and Development Canada
HRSDC Human Resources and Skills Development Canada
ICLR Income Contingent Loan Repayment
IIR Institute for Intergovernmental Affairs
INAC Indian and Northern Affairs Canada
IRAP Industrial Research Assistance Program
ISSP Indian Studies Support Program
ISTC Industry, Science and Technology Canada
LMDA Labour Market Development Agreements
MOSST Ministry of State for Science and Technology
MRC Medical Research Council
NABST National Advisory Board on Science and Technology
NCCU National Conference of Canadian Universities
NCE Networks of Centres of Excellence Program
NFCUS National Federation of Canadian University Students
NRC National Research Council
NSERC Natural Sciences and Engineering Council of Canada
NSLSC National Student Loans Service Centre
OCE Ontario Centres of Excellence
OECD Organization for Economic Cooperation and
Development
PSE Postsecondary Education
PSEA Postsecondary Education Assistance Program
RESP Registered Education Savings Plan
RRSP Registered Retirement Savings Plan
SIFC Saskatchewan Indian Federated College
SSHRC Social Sciences and Humanities Research Council
of Canada
SUFA Social Union Framework Agreement
TVET Technical and Vocational Education and Training
TVTA Technical and Vocational Training Assistance Act
UI Unemployment Insurance

viii
Chapter 1 / Canadian Federal Policy and Postsecondary Education (PSE) in Canada 1
Chapter 1
Canadian Federal Policy and Postsecondary
Education (PSE) in Canada1
Canada may be the only nation in the developed world that has never had a national university or higher education act, or even a government minister assigned responsibility for higher education. The federal government does play an important role in higher education policy, but it is a role that has evolved through the dance of federal-provincial relations to the frequently discordant tune of Canada’s constitutional debate. (Jones 2004)
1. Introduction
Canadian federalism is characterized by a major paradox. On the one hand is the constitutionally derived responsibility the provinces have for social welfare, health and education. On the other hand is the federal responsibility for concerns of national interest, equality of treatment and opportunity, economic development, and Indians and lands reserved for Indians. This paradox has led to a major line of tension in federal-provincial relations as each jurisdiction attempts to fulfi l these responsibilities. The provinces have to varying degrees attempted to protect the constitutional division of powers by either blocking or accommodating federal interference. Québec has played the most signifi cant role in both protecting its own autonomy and by extension pushing the federal government to observe at least the relative autonomy of the other provinces. Federal governments have used the powerful instrument of ‘federal spending power’2 to intervene with the enormous weight of federal taxes in precisely the same areas that come under provincial jurisdiction. The major line of tension is infl uenced through time by structural factors that are simultaneously national and global. The key factors that impact PSE are war, demography and the economy. The most
1. This monograph emerges in part from work that a Canadian team of researchers is
conducting on the impact of educational policy on the performance of higher education
systems in Canada, USA and Mexico. The research is funded by the Ford Foundation
through the Alliance for International Higher Education Policy Studies (AIHEPS).2. The federal spending power draws on the historic prerogative right of the Crown to
make gifts to its citizens (Cameron 2004, 7).

Canadian Federal Policy and Postsecondary Education2
recent phase in federal PSE policy with its emphasis on research leading to the creation of applied knowledge is clearly set within and has contributed to the emergence of the knowledge society (Drucker 2002).
Federal PSE policy has gone through some signifi cant and at times dramatic shifts. Because an overlap of responsibilities exists between the federal and provincial levels of government, we can observe a continuous struggle for recognition, credit and increased accountability. Federal governments have used their spending powers both as means of channelling funds directly to federal priorities and as levers for realigning the behaviour of provincial legislatures. What has emerged from the basic line of tension and the ensuing struggle is a patchwork of indirect and direct federal spending, and an assortment of conditional and unconditional federal-provincial agreements governing grants and transfers. Commentators have variously labelled the federal-provincial PSE relationship as ‘soft federalism’ (Jones 1996), ‘chequerboard federalism’ (Bakvis 2002), and, ‘collaborative federalism’ (Robinson and Simeon 1999; Noël 2002; Cameron 2004). Over the last two decades, the federal government has used its spending power to reduce indirect transfers to PSE and to channel that money into direct funding to universities for research, research chairs, research infrastructure, and the ‘indirect costs’ of research. Federal governments have become stronger and more dominant in the federal-provincial relationship since the mid-1990s. Yet as one returns to the opening quote in this paper, we should note that while federal ministerial portfolios cover health and social welfare,3 this is not the case for PSE (Young and Levin 2002)4
except in the case of Indian and Inuit education.Federal governments have always viewed PSE in relation to their
own responsibilities for national well-being. These include supra-provincial issues such as defence, foreign affairs and the national economy, as well as the imperative to ensure that all citizens enjoy similar rights and living standards regardless of their province or territory of residence. The federal case for involvement in PSE
3. Through the 1970s and into the 1990s, federal responsibility for health and social
welfare was housed in the federal Department of Health and Welfare. Human Resources
Development Canada (HRDC) took over the responsibility for social welfare when it was
created in 1994. Finally, in 2003 when HRDC was split into two ministries, Social De-
velopment Canada and Human Resources and Skills Development Canada (HRSDC), the
former took over social welfare and the latter took over the educational skills development
components.4. For the fi rst time after the 2004 election, the Liberal government appointed a Parlia-
mentary Secretary responsible for PSE in HRSDC.

Chapter 1 / Canadian Federal Policy and Postsecondary Education (PSE) in Canada 3
has repeatedly invoked the senior government’s responsibility for national economic policy including human resource development, and for the educational and occupational standards that ensure citizens’ inter-provincial mobility and equity. To these has often been added a paternalistic (but occasionally justifi ed) doubt concerning the will and/or capacity of provincial governments to make the long-term investment that their individual and collective interests entail.
Even before the Canadian state was offi cially born, PSE was an area of contention. The 1864 Charlottetown draft of what would become the constitution placed universities under federal responsibility. However, when the fi nal version of the British North America Act was signed in 1867, the entire educational sphere had been relegated to provincial jurisdiction, primarily at the urging of Lower Canada (Standing Senate Committee on National Finance and F.E. Leblanc 1987, 1-2).5 The provinces therefore have the central role in providing direct operating support to institutions and for developing legislation, regulation and coordination of those institutions. The federal government does not have a direct role in coordinating higher education institutions in Canada. Thus different arrangements exist in each province with regard to education.
Major areas of federal involvement in education evolve out of areas of federal responsibility 6 such as national defence, Indian affairs, the territories, prisons, external affairs and the economy. The federal government is responsible for the education of service personnel (and their children) through the Department of National Defence. Similarly, the solicitor general is responsible for education and training programs operated for inmates in prisons. The Department of Foreign Affairs and International Trade (DFAIT) provides education and technical assistance to other countries and funds education exchange and work-abroad programs. This work is often coordinated through direct relations with the Association of Universities and Colleges of Canada (AUCC). Since 1994, DFAIT along with Industry Canada has provided funding for the Canadian Education Network (CEN). Their mandate is to assist international students in their search for higher education in Canada. Similarly, with some funding from the Canadian International Development Agency (CIDA), the Canadian Bureau for International Education (CBIE) manages services for foreign students in Canada. In the
5. Section 93 of the Canadian Constitution Act of 1982 gives primacy to provincial au-
thority over education.6. These outlined in Section 91 of the Canadian Constitution Act of 1982.

Canadian Federal Policy and Postsecondary Education4
Yukon (Senkpiel 1997), the Northwest Territories (Hilyer 1997) and Nunavut, education is in part a federal responsibility, because departments of education in these territories are funded largely by the federal government.
Education for Aboriginal peoples is controversial and a critical historical issue in Canada. Section 91(24) of the CanadianConstitution Act of 1982 designates “Indians and Lands reserved for the Indians” as a federal responsibility. This means registered (status) Indians (living on reserve or on Crown land) are under legal jurisdiction of the Indian Act, kept on register by the Department of Indian and Northern Affairs Canada (INAC), and their schooling is a federal responsibility.7 INAC is responsible for Indian education in the three territories. However, despite the recognition of Métis as Aboriginal people in section 35(2) of the Constitution, the federal government does not accept responsibility for Métis education
The federal government is involved in educational areas that contribute to the national interest. In the 1970s and 1980s, this resulted in federal resources being allocated to the Canada Studies Program for educational programs and curricula that focus on elevating student awareness of Canada at home and abroad. This work is currently handled by the academic relations unit within DFAIT and is mostly directed toward Canadian studies programs in other countries. Similarly the Offi cial Languages in Education Program focuses on educating offi cial minority language students in their mother tongue and promoting bilingualism.8
The federal government has a history of involvement in vocational and technical training. The federal government’s role in this area is
7. Registered Indian families living off reserve do not come under federal jurisdic-
tion. Metis and non-status Aboriginal students come under provincial jurisdiction. Inuit
peoples, by force of a 1939 Supreme Court decision, became legally “Indian” under the
Constitution and therefore their affairs are also administered under the Indian Act (Miller
2004). Early implementation of the Indian Act saw the government enlist churches to
operate schools within Indian communities. Their aim was to Christianize and assimilate
Aboriginal people(s) into the lower strata of the dominant society often brutally and with-
out regard for local culture, language, traditions and values. In the 1950s the federal gov-
ernment began to operate their own schools. In the 1960s attempts were made to integrate
Indian children into provincial school systems. Since the 1970s Aboriginals have struggled
to assert jurisdiction over their own education within their claim of self-government. By
1973 the federal government accepted local control of education but much remains to be
done (Government of Canada 1996).8. This program saw the federal government enter into bilateral agreements with the
provinces to provide money for support of minority languages programs including immer-
sion programs, and also protected other minority language opportunities (Young and Levin
2002).

Chapter 1 / Canadian Federal Policy and Postsecondary Education (PSE) in Canada 5
seen as an extension of their responsibility for national economic development. Their concern with producing a well trained work force for Canada to compete in the global economy heightened in the 1980s and 1990s. The responsibility for these programs has moved between different ministries, but from 1994 was housed in Human Resources Development Canada (HRDC) and is currently housed in Human Resources and Skills Development Canada (HRSDC). This involvement is most obviously seen in the federal government’s support of community college skills training programs. Federal support for these programs reached a high point in the late 1980s. The recent agreements with the provinces have largely placed this activity in the hands of the provinces.
The federal government’s responsibility for economic development has led them to support university-based research. Through national research councils and institutes, as well as various intermediary bodies like the Canadian Foundation for Innovation (CFI), the federal government has become the largest source of support for university-based research. Consequently, the federal government wields considerable infl uence over this aspect of PSE. Similarly the federal government has a role in fi nancing student PSE, in the past through the Canada Student Loan Program (CSLP), and currently through the Canada Millennium Scholarship Foundation (CMSF). CSLP was the responsibility of the Secretary of State until 1994 when this function was taken over by HRDC and subsequently in 2003 by HRSDC. The federal government also funds PSE for Indian and Inuit students, initially through the Postsecondary Assistance Program (1977), and now through the University and College Entrance Preparation Program (1983) and the Postsecondary Student Assistance Program (1989).
Finally, there are national organizations involved in PSE that have connections with the federal government. The Council of Ministers of Education Canada (CMEC) is made up of all the provincial ministers of education and PSE and represents and protects the interests of the provinces. While it has historically had limited impact on education in Canada because it only acts when all the ministers are in agreement, there are examples of pan-Canadian activities initiated by the CMEC which are described later in this book. Some examples of national bodies representing constituent interest groups include the AUCC, the Canadian Association of University Teachers (CAUT), the Canadian Federation for the Humanities and Social Sciences (CFHSS), the Canadian Federation

Canadian Federal Policy and Postsecondary Education6
of Students (CFS), the Association of Canadian Community Colleges (ACCC), the CBIE and the CEN.
When we attempt to place Canada in an international context, we fi nd the results are quite mixed. Between 1983-84 and 1992-93, federal cash transfers for PSE as a percentage of GDP declined from 0.56 to 0.41 per cent. By 1998-99 this fi gure had dropped to 0.25 per cent and to 0.19 per cent in 2004-05 (CAUT 2006, Figure 1.1, 14). As transfer payments have decreased, Canada has strengthened its commitment to funding research and development (R and D) in higher education institutions. When compared to other Organization for Economic Cooperation and Development (OECD) countries, between 1998 and 2002, Canada ranks among the top fi ve on higher education R and D expenditures (HERD) as a percentage of total Domestic R and D expenditures. Of the 13 countries reporting in 2003, Canada was at the top with 35.7 per cent and the average was 18.7 per cent (CAUT, 2006, Figure 8.4, 53). Canada’s HERD (higher education expenditures on R&D) as a percent of GDP in 2003 was more than 35 per cent. Canada stood second just behind Sweden in the OECD ranking. R&D spending rose from $10.3 billion in 1990 to $26.3 billion in 2005. Canada recorded the fastest growth in R&D spending in the G7 between 1997 and 2003. The federal government’s support of university R&D in 2005-06 at $2.5 billion, for the fi rst time exceeded its own internal R&D expenditures (Council of Canadian Academies, 2006, Figures 4.2 and 4.3, 39-40). In 2004, the federal government intramural spending on R&D was almost $2.3 billion, a fi gure that has remained fairly constant of the previous six years (Council of Canadian Academies, 2006, Box 6.4, 109 and Figure 4.3, 39-40).
Yet when we examine Gross Domestic Expenditure on R&D (GERD) as a percentage of GDP, Canada does not have a high ranking. As a response to the 1997 bottom ranking (15th) on the OECD table, the Liberal government made a commitment in 1998 to invest in R and D and bring Canada into the top fi ve rankings. The latest ranking (2000-2003) places Canada 13th (OECD, Main Science and Technology Indicators, 2003). At 2 per cent, Canada was below the OECD mean of 2.25 per cent, and attained only half the score of the leader, Sweden (Council of Canadian Academies, 2006, Figure 4.1, p. 38). In “Global Higher Education Rankings,” Canada does reasonably well on accessibility but less well on affordability (Usher and Cervenan 2005). When compared to 15 other countries, Canada

Chapter 1 / Canadian Federal Policy and Postsecondary Education (PSE) in Canada 7
ranked 5th on accessibility, but a lowly 11th on affordability.9
This monograph will be divided into fi ve chapters. The main objective is to identify the relevant federal policies with regard to PSE and to link those polices to outcomes over the last two decades. Within these parameters the monograph has four objects of concern. The fi rst is to provide a context by tracing the history of the federal-provincial policy relationship from the early part of the 20th century through to the late 1970s. The second is to document the fi scal arrangements under two main headings: transfer payments; and student fi nancial assistance and tuition fees. The third is to document the contributions to economic development and the national interest under two main headings: research and development; and vocational and technical training. The fourth is to document federal involvement in Postsecondary Aboriginal education. The summary and conclusion will highlight the major trends in the federal-provincial PSE policy relationship and will evaluate the successes and failures by concentrating on relevant outcomes. A particular concern is the need to identify the degree of adaptive capacity displayed by the federal government.
9. This conclusion is somewhat misleading because Usher and Cervanan used the
OECD/UNESCO defi nitions of tertiary education, which means that in Canada they ex-
cluded the most accessible and affordable part of the PSE, namely the non-university sector
(for example, college transfer program, community colleges, CEGEPS and CAATS).

Canadian Federal Policy and Postsecondary Education8

Chapter 2 / Historical Development of Federal PSE Policy 9
Chapter 2
Historical Development of Federal PSE Policy
The uniqueness of the Canadian case was observed almost three decades ago by the OECD in its Review of National Policies for Education (1976, 89):
Offi cially, there is no federal presence in the area of educational policy, and the federal government behaves…as if there were none. Not only is there no federal authority with “Education” in its title, but the federal parliament eschews all debates that might bear on educational policy…In reality though…a considerable federal presence in educational policy is indeed tolerated by the provinces.
Indeed, when one closely reviews the programming supported through the Employment Insurance Fund and the Consolidated Revenue Fund (CRF), the Government of Canada has an extensive involvement in labour market training and development programs and services. This activity ranges from Employment Insurance “Employment Benefi ts” and “Support Measures” to the Canada Social Transfer (CST) and CSLP to funding of programs for Aboriginal people, persons with disabilities, at-risk youth and immigrants, to funding of sector councils, labour market information and career promotional activities to supporting national apprenticeship initiatives and literacy.
2.1 Federal Policy, 1867 to 1977
The nature and degree of federal involvement in PSE has passed through two distinct phases since confederation. For the fi rst hundred years, the federal role in higher education was direct and pragmatic. The priorities of nation building during the late nineteenth and early twentieth centuries centred on establishing population and industry in central Canada, securing sovereignty by settling the prairie provinces and British Columbia, and usurping aboriginal lands through the establishment of reserves. The land was then linked via a national railway and communication systems. While private and sectarian universities had existed in Québec since the 17th century, and in Ontario and the Maritime provinces since the early 1800s, with confederation, PSE became an affair of state.

Canadian Federal Policy and Postsecondary Education10
New universities were built in all provinces in the years following confederation, and operated either privately or with some provincial support. The fi rst federal institution of higher learning was the Military College, established in Kingston in 1874. In the 1870s, the federal government agreed to make a land grant for the subsequent founding of the University of Manitoba (1877) (Morton 1957). However, the real pattern for the fi rst phase of federal involvement in fi nancing PSE was formed in the spheres of Aboriginal education and labour force training.
In front of a crowd of some 35,000 people who gathered at Vancouver’s Empire Stadium to celebrate Canada’s 100th birthday, the late Chief Dan George delivered his famous oration, A Lament for Confederation. In that speech, Chief George lamented the changes that had come with colonization: the loss of land, resources, authority and ways of life, and looked to education as a way to bridge the divide between Aboriginal10 and non-Aboriginal peoples. He envisioned a time when “our young braves and our chiefs [will be] sitting in the houses of law and government, ruling and being ruled by the knowledge and freedom of our great land. So shall we shatter the barriers of our isolation. So shall the next hundred years be the greatest and proudest in the proud history of our tribes and nations” (George 1967).
But Chief Dan George did not live to see the changes he envisioned, and Canada has little reason for pride in how it has addressed internal disparities between Aboriginal and other Canadians. Because of Canada’s high life expectancy and educational levels and its gross domestic product, it consistently ranks as one of the best countries in which to live by United Nations Development Program Human Development Index. However, Canadian well-being is not distributed equitably. In 1999, Canada had the highest Human Development Index (HDI) score out of 127 countries. However, an HDI score for registered Indians ranked 48th of these countries. While Canada ranked fi rst in terms of educational attainment, registered Indians ranked about 70th (Beavon and Cooke 2003).
Canada became a nation in 1867. Under the British North America Act, education of non-Aboriginal people became a provincial responsibility. Despite the protests of Aboriginal people, control
10. In accordance with Section 35(2) of the Constitution Act of Canada, “Aboriginal”
refers to Indian, Inuit or Métis people. “Indian” is a legal term referring to those people
registered under the Indian Act. “First Nations” is often used to refer to a political body
representing a First Nations community or Indian band. First Nations and Indian are used
interchangeably in this paper.

Chapter 2 / Historical Development of Federal PSE Policy 11
over all aspects of “Indians and Lands reserved for the Indians” became a federal responsibility. Concerned with minimizing its fi scal responsibilities for a growing Aboriginal population, the department excluded Métis from the Indian Act during the settlement of the prairies, and only accepted responsibility for the Inuit under the Indian Act after a 1939 Supreme Court ruling (Miller 2004).
The assimilative goals of British colonial policy continued in new, more coercive forms under the Dominion of Canada. Schooling was a primary vehicle for achieving these ends. While government turned its back on Aboriginal adult education, Aboriginal people clearly understood its importance. In 1915, before the Royal Commission on Indian Affairs for the Province of British Columbia, Chief James Stacker from Pemberton, BC made these comments:
Now as soon as the fi rst white man arrived in the country, we began to get wise that we needed education - that education was as necessary to the Indian as to the white man - that they might become wise so that all the Indians here think that is necessary and they all agree to it (British Columbia 1916, 357).11
Emmanuel College, the fi rst institution dedicated to higher education for Aboriginal people, was opened by the Right Reverend John McLean in 1879 in Prince Albert, Northwest Territories (now Saskatchewan). The intent of this private initiative was to train Aboriginal catechists, teachers and interpreters, and in 1881 it added a theology degree to its offerings. In 1883, it was incorporated as part of the “University of Saskatchewan” (Stonechild 2004; Hayden 1983, 8). With the establishment of the provincial university in 1907 in Saskatoon, Emmanuel College moved to Saskatoon and became an affi liated college. In 1914, a dominion statute was passed that pretended the college was the original University of Saskatchewan. The name was changed to the University of Emmanuel College (Hayden 1983, 53-54).
By the early 1900s, only a handful of Aboriginal people had attended university. In 1902, the Department of Indian Affairs identifi ed nine Indians: three from Quebec, fi ve from Ontario and one from the Northwest Territories (now Alberta) who had successfully completed degrees (Stonechild 2004). Beginning in 1908, the department began to fund further study for graduates of
11. Evidence submitted to The Royal Commission on Indian Affairs for the Province
of British Columbia: New Westminster Agency transcripts, part II.

Canadian Federal Policy and Postsecondary Education12
federal schools who were deemed worthy by both the church and department. In 1927, department records indicated that 190 students were “studying in high school, business college and other advanced work” (Stonechild 2004). That same year, the Allied Tribes of British Columbia met with federal offi cials, and were given assurances that funding would be available to Indians pursuing higher education (Haig-Brown 1995).
Not many, however were seen to be worthy of this funding. For one thing, eligibility guidelines required that the student have completed the eighth grade by fourteen years of age, a feat that few Indian students achieved because of the half-day program available to them (Cuthand 1991). Others were denied funding because Indian agents determined that their parents could pay for their education (Haig-Brown 1995). In addition, it is likely that section 86 (1) of the 1876 Indian Act discouraged many from pursuing further study. Under this section of the act
Any Indian who may be admitted to the degree of Doctor of Medicine, or to any other degree by any University of Learning, or who may be admitted in any Province of the Dominion to practice law either as an Advocate or as a Barrister or Counselor or Solicitor or Attorney or to be a Notary Public, or who may enter Holy Orders or who may be licensed by any denomination of Christians as a Minister of the Gospel, shall ipso facto become and be enfranchised under this Act. (Cited in Stonechild 2004, 41)12
While there is no record of any Indian being enfranchised under this section of the Indian Act, it was likely a deterrent to many aspiring students. Further, professional organizations created barriers for Indian people. For example, Andrew Paull’s admission as student-at-law to the British Columbia Law Society was denied because he was not eligible to vote (Blackhouse 2003).
The case-by-case funding for individuals to continue their education was discretionary and declined during the inter-war years (Stonechild, 2004). In 1946 a Special Joint Committee of the
12 In 1880 revisions to the Indian Act did away with the involuntary enfranchisement
of educated males, but in 1920 the original clause was retrieved so that it applied to any
adult male that the Department saw fi t to enfranchise. Involuntary enfranchisement was
eliminated in the 1922 Indian Act, but reappeared in 1933 revisions, with an exception for
those Indians protected by treaty, and remained until 1951 (Miller 2004).

Chapter 2 / Historical Development of Federal PSE Policy 13
Senate and House of Commons was formed to look into the Indian Act. Squamish Chief Andrew Paull, a representative of the North American Indian Brotherhood, reminded the joint committee of the government’s earlier promise to support Indian education:
After 1927 several Indians went to technical schools….They went through their courses with fl ying colours. Then the Indian Affairs Department shut the door and would not let anybody else go …to technical school, normal school, or to the university. (cited in Haig-Brown 1995, 70).
Indian and Inuit people would have to wait until 1977 before a funding program was in place to support their educational aspirations. Federal funding for Métis has not yet been achieved.
Following 1951 changes to the Indian Act, the Department of Indian Affairs began entering into Joint Schools Agreements with provincial school boards to assume responsibility for educating Aboriginal children. In doing so, the department did not abandon its commitment to assimilation. Rather, according to a new vision proposed by Indian Affairs, desegregated education would “quicken and give meaning to the acculturative process through which they [Indian children] are passing” (Milloy 1999, 196). Desegregation proceeded quickly, and by 1961, 128 joint school contracts were signed. That number rose to 550 by 1972. However, it was not until 1969 that Indian Affairs began phasing out residential schools – a process that would take almost twenty years (Milloy 1999; Miller 2004; Wotherspoon and Satzewich 2000).
During this same period, some success was being attained by individual Aboriginal students in postsecondary education. During the 1950s, the department had no funding program in place for postsecondary education, and requests for educational support were handled individually. In 1957, the Department of Indian Affairs instituted a scholarships program totaling $25,000 as an incentive for “gifted” Indian students to pursue studies in “universities or in teacher’s colleges, or at nursing schools, technical or agricultural schools”. Scholarships ranged from $250 to $1750. By 1963 only 22 scholarships totaling $40,000 had been awarded (Stonechild 2004, 71). These scholarships were gradually incorporated into vocational training funding. In 1968-69 the department provided fi nancial assistance to 250 students for vocational training (Stonechild 2004; INAC 2000).

Canadian Federal Policy and Postsecondary Education14
Despite this lack of funding, Aboriginal people across Canada began participating in university education in greater numbers. In 1963-64 there were only 57 Indians in universities across Canada. Given that the high school dropout rate for Indians was 94 per cent compared to 12 per cent in the general population, this low postsecondary participation rate is understandable (Hawthorne 1967, vol. 2). The combined total of university and college enrollment in the mid-1960s was approximately 200 status Indian students (INAC 2000). In 1976, the department gathered information on known graduates, and the results are illustrated Table 1.
By 1976 some 750 Aboriginal people held degrees and approximately 1,500 Indian students were enrolled in universities across Canada. The experience of Aboriginal students in postsecondary institutions was similar to the experiences of Aboriginal children in the public school system. Postsecondary institutions were poorly prepared for this infl ux of students, and students experienced “culture shock, racism and alienation” (Stonechild 2004, 76).
Table 1. Indian and Inuit Graduates 1934-76
Graduates by Region Degrees Awarded Decade of Last Degree Earned
Maritimes 47 Teacher’s Certifi cate 286 1930s 1
Quebec 143 B.A. 209 1940s 2
Ontario 128 Nursing 130 1950s 30
Manitoba 98 B.Ed. 95 1960 107
Saskatchewan 93 Magistral 45 1970-76 610
Alberta 40 B.Sc. 44
British Columbia 75 M.D. 11
North West Territories
26 Law degree 9
Ph.D. 2
Total 650 Total 831 Total 750
Source: Stonechild (2004, 73-74).
When we turn our attention to labour force training, the initial contributions of the federal government can be described as being small, gingerly steps made to avoid overstepping the constitutional bounds of its responsibilities. The early intrusions into PSE were

Chapter 2 / Historical Development of Federal PSE Policy 15
limited to its constitutional responsibility for the national economy and its relationship to the workforce. In 1909, Labour Minister W. L. McKenzie King (later prime minister for 22 years over the period from 1921 to 1948) was appointed to lead a Royal Commission on Industrial Training and Vocational Education. In 1912, a year before the release of the commission’s fi ndings, the federal government introduced a system of conditional grants to the provinces for agricultural research and training (Dennison and Gallagher 1986). In 1913, the federal government initiated the Agricultural Aid Actand its successor the Agricultural Instruction Act, its fi rst ever shared cost program making available to the provinces an amount of $10 million to be allocated on a per capita basis and to be used for the support of instruction in agriculture.
The Technical Education Act of 1919 expanded the same approach into vocational-technical education (Cameron 2004:1). The new funding underwrote the rapid expansion of provincial training systems and infrastructure, but the innovative mechanism of conditional grants introduced an irritant into federal-provincial relations that would only worsen with the passing years. At this stage and certainly through the inter-war years, provincial offi cials regarded technical education as having more to do with the economy than education. The direct federal role was further extended in 1916 by the creation of the National Research Council (NRC), which provided grants to scholars and university departments for war-related scientifi c research. Until then, federal government departments had provided indirect support for university-based research through their internal applied research activities, for example, geological surveys, observatories, experimental farms, and the Dominion Bureau of Statistics (Harris 1976, 194-96, 321-23). For the most part, the NRC promoted and carried out industrial research, mainly in secondary manufacturing industries. From the outset, the NRC provided bursaries, scholarships and fellowships for graduate students and research grants for professors. In line with the original purpose of the NRC, the fellowships were designed to support industrial research projects, as students could not pursue their studies during the award period (Thistle 1966). The NRC became the mechanism by which the federal government could systematically develop and support scientifi c research in Canada (Harris 1976, 323-26).
With the adoption of the Department of Health Act in 1919, the federal government started supporting medical research and used

Canadian Federal Policy and Postsecondary Education16
the NRC as its mechanism to do so. The volume of research steadily expanded and in 1936, a separate committee was created within the NRC to deal with medical research. By 1946, a separate division for medical research had been established within NRC, and in 1960 the precursor to the Medical Research Council (MRC) (now the Canadian Institutes of Health Research) was effectively operating as a separate organisation within the NRC. In 1969, parliament adopted the Medical Research Council Act formally separating the MRC from the NRC (Health Canada 1999).
Heightened interest in federal funding for PSE probably began with the Royal Commission on Dominion Provincial Relations (Rowell-Sirois Report) (Government of Canada, 1940). Through the commission’s work, it became apparent that while PSE was not a federal jurisdiction, provinces would entertain a small federal grant to their universities to preserve high academic standards. Prior to the release of the commission’s report, the federal government introduced the Youth Training Act in 1939 and provided conditional grants to the provinces in support of student assistance, including loans and grants to students.
In Canada, science and technology policy13 is a refl ection of the indirect relationship between universities and the federal government. While the federal government funds university operations through transfer payments to the provinces, it has no direct control over higher education and receives little credit for its funding role. Funding of academic research is the only avenue open to the federal government for shaping academic activities.
At least until the 1980s, the history of Canadian science policy can be seen as a series of piecemeal attempts to encourage industrial R and D and technological innovation. The development of industrial research capacity was the mandate of the NRC. The failure of the NRC and related policy initiatives to instill a strong R and D tradition in Canadian industry is often attributed to the country’s relatively high rates of foreign direct investment (Britton and Gilmour 1978; Gertler 1996). This explanation is weak, however, since several studies show that Canadian subsidiaries have tended to invest proportionately as much or more in R and D in Canada as comparable Canadian-owned companies have done (Lamontagne Report 1970, vol. 1, 147). More likely explanations point to the historical policy choices made and the behaviours embedded in industry, state institutions and the academy.
13. This whole section relies heavily on two articles, Fisher, Atkinson-Grosjean and
House (2001) and Atkinson-Grosjean, House and Fisher (2001).

Chapter 2 / Historical Development of Federal PSE Policy 17
Canadian universities are among the most autonomous in the world.14 For science and engineering faculties, this culture of autonomy developed predominantly in the years following the Second World War, when the NRC assumed responsibility for distributing federal funds to university researchers. In the wider context, Michael Polanyi established the Society for Freedom in Science in 1941 and coined the term the “Republic of Science” to describe a model of self-governance for scientists (1962). Robert Merton codifi ed a normative structure for science in 1942, which was operationalized in the USA when Vannevar Bush submitted Science: The Endless Frontier to President Harry S. Truman in 1945 (Hollinger 1995). Premised upon a linear understanding of the relationship between science and technology, the model suggested that an unfettered science would eventually result in useful products at the technology development end of the ‘pipeline’. While most advanced capitalist countries accepted the linear model during the postwar decades, the absence of national policies for science and higher education in Canada opened a particularly hospitable space for academic science to fl ourish.
While the budget of NRC had increased dramatically during the interwar years, the focus was primarily on industry. Little money was available for university research before the mid-1950s, although it would be a mistake to conclude there was an absence of research. According to McKillop (1994), there was an emphasis on laboratory and research infrastructure beginning in the late nineteenth century as well as a growing movement towards “advancing knowledge” in many fi elds. This movement was supported by some university administrators, and as Horn (1999) makes clear, some early tenure arrangements did consider research as a component of faculty work even before the 1950s. The launch of Sputnik and the creation of the Canada Council (CC) in 1957, were markers of a major change. While the Cold War provided the justifi cation for funding research in the areas of science and technology, the CC extended research funding to the humanities and social sciences. Federal expenditures devoted to R and D grew from an estimated $5 million in 1939 to over $200 million in 1969 (Lamontagne Report 1970, vol. 1, 64). This dramatic change was based on arguments that placed R and
14 A comparative study of Australia, Britain, Canada and the USA argued that Canada’s
academic researchers had the most freedom to set their agendas and were the least involved
in activities targeted toward commercial or industrial applications (Slaughter and Leslie 1997,
12-13).

Canadian Federal Policy and Postsecondary Education18
D and education as the key elements of a strong and competitive economy.
The roots of Canada’s current federal student fi nancial assistance programs are found in the establishment of the Dominion-Provincial Youth Program in 1937. The purpose of this federal-provincial cost-sharing program was to provide vocational training for young people denied such opportunities during the depression years. In 1939, this program was expanded under the Dominion-Provincial Student Aid Program to include fi nancial assistance to university students. Five provinces agreed initially, and by 1944 all nine provinces had signed up. Newfoundland joined the program in 1950, shortly after becoming part of Canada in 1949 (Cameron 1991; Pike 1970, 131-132). National in scope, the program nonetheless relied on matching funds and administration provided by provincial governments. As a consequence, the program took on different forms in each province, with four provinces providing assistance in the form of grants and the fi ve providing loans. The only common features of the programs were that the recipients of fi nancial aid had to prove themselves of academic merit and have demonstrated fi nancial need (Pike 1970, 132).
Although intended to promote equality of educational opportunity, the effectiveness of the program in doing so was questionable. On average, fewer than 3,000 students per year benefi ted from the program, while full-time university enrollment grew from 35,903 in 1939 to 107,346 in 1960 (Pike 1970, 133; Harris 1976, 456-57). Where the program may have been most effective was in providing the impetus to provincial governments to establish their own student fi nancial assistance programs. As a consequence, prior to 1964 the bulk of fi nancial support for students came from provincial loans, grants and bursaries rather than the dominion-provincial plan (Pike 1970, 133, 135-36). Following World War II, the magnitude and mechanisms of federal involvement grew substantially, but the principles of the relationship remained unchanged until 1967.
A major change occurred when a far more effective form of assistance was put in place by the Department of Veterans Affairs, which began supporting returning veterans who enrolled as full-time university students. Through the 1945 Veterans Rehabilitation Act, the federal government provided funding to universities in the form of tuition fees for all qualifi ed veterans enrolling at a university and an additional grant of $150 per veteran. The act was the outcome of a plan worked out with the National Conference of Canadian
Chapter 2 / Historical Development of Federal PSE Policy 19
Universities (NCCU) who persuaded the federal government to respond to the fl ood of returning service personnel. The relationship between the NCCU and the federal government had been cultivated when they worked together on a policy related to exemption from active military service. As a result, veterans from all social backgrounds attended university and at their peak enrollment in 1946, numbered 34,000 full-time university students, or 45 per cent of total Canadian university enrollment (Harris 1976, 456-58; Clift 2002, 26). The grant of $150 was distributed to the universities by the NCCU. As the veteran cohort graduated, this revenue threatened to dry up.
The success of this fi nancial support for veterans also served as a demonstration of how the federal government might successfully intervene in an area of exclusive provincial legislative responsibility. The federal government argued that they were not using the money to infl uence policy, but rather to support individual students. While jealously guarding their power to determine educational policy and practice, the provinces were hard pressed to deny federal government support to veterans and to the universities that enrolled them (Harris 1976, 457-58).
In the area of vocational training, the Technical and Vocational Training Assistance Act (TVTA Act) of 1960 constituted a massive direct intervention in education, not only at the postsecondary but also at the secondary level, which clearly went beyond the federal government’s constitutional mandate. After a fractious debate during the 1930s, the federal parliament legislated a system of unemployment insurance in 1940, to be administered by the federal department of labour by means of an Unemployment Insurance Commission and a National Employment Service (HRSDC 2004). In the face of persistent and high unemployment in the early 1950s, the Diefenbaker Conservative federal government argued that investment in job training services was consistent with its responsibility for unemployment payments. The legislation focused on training for workers to meet technological and industrial changes and provided funding under a cost-sharing agreement with the provinces. Using this rationale, and spurred by the new preoccupation with human capital investment as a basis for industrial growth, the government passed the TVTA Act. Over the six-year life of the act, the government channelled $1.5 billion into capital and operating costs for provincial technical and vocational institutions, including vocational training facilities at secondary schools (Bell 2004).

Canadian Federal Policy and Postsecondary Education20
The funds provided under the act were a major impetus for the establishment of provincial community college systems (Dennison and Gallagher 1986, 15).
In 1967, changes were effected resulting in the 1976 AdultOccupational Training Act and the Canada Manpower Training Program. This program purchased training courses operated by the provinces or the private sector and paid a living allowance to trainees. The program also transfered funds to provinces to construct public institutions offering trade education. Between 1961-62 and 1971-72, the federal government provided a total of $1.5 billion dollars in transfers to the provinces for this purpose. Furthermore, between 1972-73 and 1976-77, the federal government’s annual contribution exceeded 70 per cent of all expenditures15 on manpower training programs and vocational and occupational training in Canada. The total expenditures in 1976-77 were $955 million (Statistics Canada Yearly Reports).
The emphasis on supporting scientifi c and medical research did not meet with universal acclaim in the universities, nor in the larger scholarly community. This is best illustrated by the commentary contained in the report of the Royal Commission on National Development in the Arts, Letters and Sciences (otherwise known as the Massey Commission, named for its chairperson, and future Governor General, Vincent Massey):
The humanities and social sciences suffer fi rst from that general neglect of philosophic studies already noticed which is characteristic of the modern age in the western world, although affecting Canada with peculiar force. In Canada’s formative years, western civilization was being transformed by mass industrialism. Knowledge was valued as power, and even in educational circles there appeared a neglect of what was considered impractical and academic.For the disciplines once considered important as civilizing infl uences was substituted an emphasis on material effi ciency. The rational contemplation of the good was exchanged for the triumphant contemplation of mechanical progress. Canada shared this experience of the western world but with
15. Includes expenditures of private business colleges, private trade schools and other
private schools.

Chapter 2 / Historical Development of Federal PSE Policy 21
two differences, each of them accentuating material preoccupations. First, the bonds of tradition were much less strong here than elsewhere. Second, practical problems were very pressing in a new and growing country, and there was little time or money to spare for those studies which were coming to be valued chiefl y as decorative luxuries. The natural sciences which often could add to their intellectual fascination the advantage of immediate practical application tended to crowd them out. (Government of Canada 1951, 161)
At the time, about two-thirds of federal funding for university-based scientifi c research in Canada came from NRC, with the remaining amount from the Defence Research Board (Government of Canada 1951, 136). In total, the federal government spent over $50 million annually on scientifi c research, most of which was conducted by or through the NRC (Government of Canada 1951, 172). No similar body was providing federal support for the humanities and social sciences.
Given Massey’s reputation as a patron of the arts, it was no surprise that one recommendation from the Royal Commission was the establishment of the Canada Council for the Encouragement of the Arts, Letters, Humanities and Social Sciences “to stimulate and to help voluntary organizations within these fi elds, to foster Canada’s cultural relations abroad, to perform the functions of a national commission for UNESCO, and to devise and administer a system of scholarships” (Government of Canada 1951, 377). In making this recommendation, the Royal Commission explicitly rejected a proposal to establish a National Council for the Humanities and Social Sciences parallel to the National Research Council, arguing that to do so would “subject them too rigidly to scientifi c techniques and methods of organization” (Government of Canada 1951, 377). Rather, the commissioners believed that the humanities and social sciences in Canada would best be served by encouraging international exchanges, particularly with Europe, and with keeping close touch with cultural affairs at home, and that this could best be achieved through an organization with broad scope, encompassing the humanities, the social sciences and the arts (Government of Canada 1951, 376-77).

Canadian Federal Policy and Postsecondary Education22
In 1951, the Massey Commission provided the vehicle for the federal government to make unconditional direct grants to universities. Anxious for continued funding from the federal government as the veterans funding was diminishing, the NCCU with the establishment of the Massey Commission created a fi nance committee to lobby government. The fi nance committee met with Prime Minister St. Laurent to make its case for federal funding. At the same time, through its association with Massey and his colleagues, NCCU secured a Massey recommendation that the “federal government make annual contributions to support the work of the universities” (Cameron 1991). With further support from J.W. Pickersgill, the prime minister’s principal secretary, the federal government decided to provide $7.1 million in federal grants to universities, allocated at 50 cents per capita and divided among provinces on the basis of population, and then among institutions in each province in proportion to their enrolments. Sensitive to the charge of interference in provincial affairs, federal offi cials presented the fund as a ‘supplement’, intended strictly to ensure the quality of existing programs and not to support university expansion. In an attempt to fi nesse provincial sensitivities, the federal government asked the NCCU to be the distribution agent, and they in turn created the Canada Universities Foundation (CUF) to run the program.
In 1956, with assistance from a number of researchers, the most prominent being Dr. E.F. Sheffi eld’s projections of university enrolment and associated costs, the NCCU successfully effected the doubling of federal grants to $1.00 per capita. In November, the NCCU held a conference on Canada’s crisis in higher education. The primary agenda was how to respond to the ‘crisis of numbers and dollars’. Sheffi eld’s paper, “Canadian University and College Enrolment Projected to 1965” projected that the full-time university enrolment would double between 1954-55 and 1964-65, increasing from 68,000 to 130,000. Universities and colleges did not have the capacity to absorb this increase unless more investment was made in PSE. If their plan was to send the message to government that more funding was required, they succeeded. At the conclusion of the conference, convinced of an impending crisis of numbers and dollars, Prime Minister St. Laurent announced the doubling of the operating grants to universities that were initiated in 1951-52. These grants16 were subsequently increased to $1.50 per capita in 1958-59,
16 The federal government was clear that these grants were for maintaining high qual-
ity staff and working conditions and not to increase existing facilities. The federal gov-

Chapter 2 / Historical Development of Federal PSE Policy 23
to $2.00 in 1962-63, then $5.00 per capita by 1965. Before the conference was over, St. Laurent demonstrated in a dramatic way the federal government’s commitment to PSE. He announced the establishment of the CC as a Crown Corporation. This was the last of the main recommendations from the Massey Commission to be implemented.
Even with the intense lobbying by the NCCU, the Canadian Social Science Research Council (CSSRC) and the Humanities Research Council of Canada (HRCC), the federal government had been extremely cautious. Grants for scholarships and the idea of a CC were just as unpopular in Québec as the idea of federal grants to the universities. After allowing their universities and colleges to initially accept the grants, the Québec government blocked access a year later in 1952. The CUF proceeded to place the Québec transfers into a separate holding account. This impasse remained in effect until 1959, when a change of government at both the federal and provincial level created an opportunity for compromise.
While the Québec government attempted to make up the foregone revenue, it could not keep up with the increases provided by the federal government, and Québec’s universities were becoming severely disadvantaged. Compared to the universities in other provinces, all of which were accepting federal grants, Québec universities were paying their faculty less, charging higher tuition fees and incurring large budget defi cits. The tide turned with the demise of Premier Duplessis who championed the opposition to federal funding. In 1959, the federal and the Québec governments worked out a scheme whereby the federal government increased its tax abatement for corporate taxpayers by 1 percentage point so that Québec could raise its tax revenue by the equivalent amount. Any shortfall to Québec would be made good by an equalization transfer. The scheme paved the way for future federal transfers to all provinces. As Cameron concludes, this represented a “signifi cant retreat” by the federal government and more importantly “the fi rst instance of a province opting out of a wholly federal program” (2004, 4).
ernment became a principal source of additional funds sustaining university growth and
expansion. This period saw an increase in faculty numbers and faculty salaries. Between
1956/57 and 1959/60, the median faculty salary increased by nearly 40 per cent, which was
about four times faster than increases in the consumer price index. During the same period,
full-time university enrolment increased from 79,000 to 102,000, an increase of 29 per cent
(Cameron, 1991, Table 3, 82).

Canadian Federal Policy and Postsecondary Education24
In 1957, the parliament of Canada passed the Canada Council Act, establishing the comprehensive body recommended by the Massey Commission in order “to foster and promote the study and enjoyment of, and the production of works in, the arts, humanities and social sciences”. The federal government provided the initial funds for the Council by setting up a $100 million endowment from the death duties on the estates of Nova Scotia industrialists Sir James Dunn and Izaak Walton Killam (Canada Council 2004a). Of this total, $50 million was to be spent in 10 years on university capital grants. The CC was instructed to only spend the interest from the other $50 million.
During the depression years, little had been spent on capital construction. As a result, universities met the bulge of the veteran enrolment by renting space and borrowing equipment. With the anticipated enrolment explosion in the 1960s, there was much need for new facilities and equipment. While the CC funds met part of the demand it was clearly not suffi cient. In an apparent response to repeated requests from individual university and college presidents and the National Conference of Canadian Universities and Colleges (formerly NCCU), the federal government amended the National Housing Act in 1960 to enable the Central (now Canada) Mortgage and Housing Corporation to make loans to universities for construction of student residences. Through this initiative, not only was the federal government seen to be responding to the student housing problem but also to an unemployment problem by stimulating the construction industry. Nonetheless, the universities benefi ted with subsidized interest rates, and by the end of 1964 had developed housing for more than 22,000 students or 12 per cent of the full-time student population (Cameron 1991).
CC funds were supplemented over the years by additional one-time grants and then annual allocations from the federal government and by private donations. Most signifi cant of these private donations was the $16.5 million granted in 1966 by the Killam Trusts, which were established by the estate of Dorothy J. Killam (I.W. Killam’s widow) in 1965 to “to increase the scientifi c and scholastic attainments of Canadians, to develop and expand the work of Canadian universities and to promote sympathetic understanding between Canadians and the people of other countries” (excerpt from the will of Dorothy J. Killam in Canada Council 2004b). The Killam Research Fellowships and Prizes were available to scholars in all fi elds of study and remain to this day the preeminent research awards in Canada.

Chapter 2 / Historical Development of Federal PSE Policy 25
Between 1951-52 and 1965-66, the student population in Canada grew by 222 per cent from 63,000 to over 200,000 full-time students. Approximately 141,000 new postsecondary spaces were created over this fi fteen year period. Newfoundland experienced the fastest growth rate. Even though Québec did not accept federal funding provided to institutions directly, its student population overtook Ontario’s in 1952-53 and remained the highest for the rest of this period. Sheffi eld (1961), the research offi cer for the CUF, had estimated a massive increase in full-time student enrollment over the decade 1960-61 to 1970-71. He projected an increase from 114,000 to 312,000 and recommended hiring thousands of new academic staff. Between 1960 and 1975, 16 new universities were established, and the number of universities offering graduate programs rose from 28 to 47, with a dramatic increase in the number of graduate students and the scope of offerings (Healy 1978). Federal grants constituted approximately 20 per cent of total postsecondary expenditures. Federal grants totaled approximately $894 million while the total for postsecondary expenditures was approximately $4.6 billion (Statistics Canada Yearly Reports).
Secure in their special relationship, the universities repeatedly lobbied the federal government for funding, probably for at least two reasons: the federal government had unlimited taxing powers and to maintain provincial control and the autonomy of universities. This period also coincides with a period of dramatic growth in government revenues. The total revenues accruing to all government sectors in Canada rose from about $4 billion in 1950, to $11 billion in 1961 and to $23 billion in 1968 (Provincial Economic Accounts).
Canada’s centenary year, 1967, brought the fi rst major shift in the principles for federal involvement in PSE. In the face of massive public demand for postsecondary access that promised to outstrip the system’s resources, the AUCC had commissioned its own enquiry into higher education fi nancing in 1965. The Bladen Commission’s (AUCC 1965) call for a more consolidated federal role in PSE was realized in part by Ottawa’s creation, in 1967, of a single contact point for PSE, housed in the Education Support Branch of the Department of the Secretary of State. This unit committed to annual consultations with the provinces on the adequacy of the federal contribution. The fundamental change was the Federal-Provincial Fiscal Arrangements Act (FPFAA) of 1967, which replaced the direct federal grants to the universities with a system of transfers to the provincial governments to support the
Canadian Federal Policy and Postsecondary Education26
operating costs of universities.17 This measure brought the rest of Canada into line with Québec. The per capita amount was increased to cover the cost of vocational as well as university education.
Two other reports provided a cogent rationale and avenue for the federal government to increase its contribution to PSE. The Royal Commission on Health Services (Hall Report) (Government of Canada 1964) recommended massive expansion of the training of health care professionals including physicians, and called for national fi nancial assistance to provinces for carrying out the recommendation. The Economic Council of Canada’s Second Annual Review (ECC 1965) used human capital theory to argue in favour of federal government funding for PSE, citing individual and collective economic benefi ts of education.
The English-speaking provinces were elated; not only did they regain their constitutional jurisdiction, they were assured of substantial resources for PSE. The act epitomized Québec’s victory in its struggle with the federal government for constitutional jurisdiction over PSE and freedom for each province to guide the development of PSE within its boundaries without interference from the federal government. The act also provided provincial governments with the opportunity to control university policy and establish an integrated PSE system within their province.
The universities however were not elated; there would be no doubt now that they were provincially funded public institutions and would have to conform to provincial policy directions and become part of a coordinated provincial system. In the area of research, the federal government continued to provide funding through grants and contracts not directly to institutions but to individual scholars. The interest in research was part of the Sputnik effect, whereby North America and European countries poured funds into research and development because they felt that they were lagging behind the Soviet Union in their technology (Psacharopoulos 1993).
The FPFAA introduced the principle of cost sharing. The act integrated all existing federal support except for university research
17 The 1967 legislation defi nes PSE as every course of study that requires at least ju-
nior matriculation for admission, lasts at least 24 weeks and is certifi ed as a postsecondary
course. Between 1967-68 and 1976-77, other cash transfer payments included: Old Age
and Blind Pensions, Disabled Persons Allowance, taxation agreements, Canada Assistance
Plan, Trans-Canada Highway, health grants, contributions under the Hospital Insurance
and Diagnostic Services Act, Health Resources Fund, Medicare, Offi cial Languages and
Crop Insurance Act.

Chapter 2 / Historical Development of Federal PSE Policy 27
and student loans with a new revenue sharing and equalization arrangement. The government replaced the conditional grants for vocational and technical education with a program entirely under federal control. All aspects of the occupational training of adults already in the labour force were now under the direct control of the federal government. Transfers in 1967-68 were set at either $15 per provincial capita or 50 per cent of provincial PSE operating expenses, whichever was higher. Meanwhile, the FPFAA’s consolidation of the federal role had the effect of consolidating provincial activism. With the new funds fl owing into provincial coffers, several provinces established ministries of PSE. Provinces also pushed back against rising federal intrusion, heretically expressed in the Bladen Report’s talk of a federal education ministry (Cameron 2004, 4). In 1967 the provincial governments established their own body for pan-Canadian education policy, CMEC, primarily as a bulwark against further federal intrusion. The creation of the federal Education Support Branch provided the political incentive for the provinces to act together and create this new national body that would counterbalance the potential evils of federal involvement.
By the early 1970s, both levels of government were looking for alternatives to the existing arrangement. In 1970, the provinces under the auspices of CMEC commissioned a study of postsecondary fi nance headed by S.G. Peitchinis to fi nd a common provincial position for the purpose of negotiating a revised scheme with the federal government. In July 1971, the federal minister of fi nance, E.J. Benson announced that the 1967 to 1972 fi scal arrangement would be extended for two more years to 1974, with federal transfer limited to a maximum annual increase of 15 per cent. The revised fi scal arrangement was a compromise. The 15 per cent was in line with Peitchinis’ conclusion that universities would require increases in operating funds at the rate of about 17 per cent annually in the next fi ve years (1970-71 to 1975-76) and at the rate of 14 per cent annually in the following fi ve years (1976-77 to 1980-81) (1971).18
18 The threshold enabled the federal government to cap its expenditures. Par-ties appeared to accept that the soaring costs of PSE were inevitable for Peitchinis did not contemplate ways to cap or reduce the projected costs increases. It would take another ten years before the federal government used restraint measures, although provincial governments were already starting to chip away at university expenditures little by little using funding mechanisms.
Canadian Federal Policy and Postsecondary Education28
For the long term future, a federal-provincial task force focused on fi nding a more satisfactory alternative. The establishment of the task force was probably a response to Peitchinis’ criticism of the two levels of government. The historical record contains no evidence of any consistency in government policy relating to universities. Both the federal government and the governments of the provinces appear to have responded to events and pressures as they arose, and at such times usually responded with hastily formulated programmes, without any apparent consideration of the implications for the institutions and for federal-provincial relations (Peitchinis 1971, 415-16).
Nonetheless, the federal-provincial task force failed to fi nd an acceptable alternative. As a result the 15 per cent cap was extended for another three years to 1977. The lack of agreement is symptomatic of the widely divergent views of the federal and provincial governments. While the federal government wanted to adhere to the constitutional division of powers, it also wanted some authority to dictate the outcomes for the funds it provided. The provincial governments on the other hand wanted the federal government to award a large portion of tax dollars proportional to the recognized importance of PSE to the national agenda but to be allowed to spend the money in accordance with their own provincial agenda and without interference from the federal government.
By the late 1970s, the cost-sharing approach, embodied by the FPFAA was proving unsustainable, particularly from the federal perspective. Being tied to provincial expenditures, the matching mechanism was a black hole, committing the federal government to rising and unpredictable expenses. Despite an amendment in 1972 that imposed a cap on growth, the problems persisted, partly due to ambiguities as to what counted as “matching” expenditures. Over the 10 years from 1967-68 to 1976-77, federal contributions increased 320 per cent, or on average 16 per cent per year, from $422 million to $1,778 million (Senate Standing Committee 1987, 11). Over the 10 years, the federal government spent over $10 billion, with little public awareness of where it went. The FPFAA was perceived as a mechanism for distorting provincial spending patterns, and for exacerbating provincial inequalities, as some provinces spent faster than others, and used “fi fty cent dollars” to rapidly expand their PSE and Technical and Vocational Education and Training (TVET) systems.
Chapter 2 / Historical Development of Federal PSE Policy 29
According to the FPFAA legislation, the cash and tax transfers during that period would be approximately 50 per cent of PSE operating expenditures. However, factoring the total PSE expenditures, the cash portion of the federal transfers was between 14 to 20 per cent (see Chart 1). With tax transfers added, the federal transfers covered approximately 40 per cent of total PSE expenditures. Starting in 1974-75 the PSE transfers also dropped to 7 to 8 per cent of total cash transfers from about 10 to 11 per cent in prior years.
As in other OECD countries, universities in Canada grew tremendously after the Second World War. The bulk of this growth occurred from the mid-1950s to the mid-1970s. The number of full-time university teachers increased from 6,455 in 1960 to 24,612 in 1970 and to 33,299 in 1980.19 During the FPFAA legislation, the full-time student population grew by 74 per cent from 346,000 in 1967-68 to 604,000 in 1976-77. While the growth rate appears slower than in the prior period (1951-52 to 1966-67), the actual increase in the number of postsecondary spaces is 257,000 over ten years. Over this period, federal grants constituted approximately 16 per cent of total postsecondary expenditures. Total federal grants were approximately $4 billion while the total for postsecondary expenditures was approximately $25 billion (Statistics Canada Yearly Reports).
As we turn attention to student support, the tension in federal-provincial relations was apparent in 1964 when the federal government established the CSLP. Rather than rely on provincial goodwill, the federal government made provision for provincial governments to opt out and receive instead a payment to support their own student fi nancial assistance programs, which the province of Québec did almost immediately (Clift 2002, 25-26).
The CSLP evolved out of a 1961 commitment from the federal Liberal Party leader Lester Pearson to implement a proposal from the National Federation of Canadian University Students (NFCUS) to create 10,000 scholarships of $1,000 each. The Liberals went a step further, promising a student aid fund from which students could borrow interest-free while they were attending a postsecondary institution. When the Liberals formed the government in 1963, NFCUS pressured them to live up to their earlier commitments, and in the summer of 1964 legislation was introduced establishing the CSLP (Clift 2002, 25).
19 See Table 5.1, “Full-Time Teaching Staff at Postsecondary Institutions, 1960 to
1990” (Government of Canada, Human Resources and Development Canada 1994b).
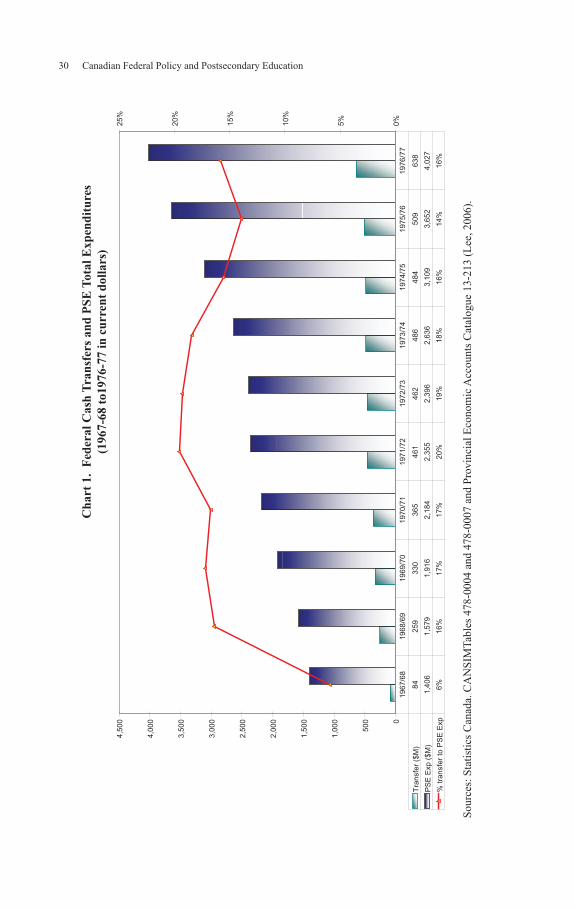
Canadian Federal Policy and Postsecondary Education30
Ch
art
1. F
eder
al
Cash
Tra
nsf
ers
an
d P
SE
Tota
l E
xp
end
itu
res
(1967-6
8 t
o1976-7
7 i
n c
urr
ent
doll
ars
)
0
500
1,0
00
1,5
00
2,0
00
2,5
00
3,0
00
3,5
00
4,0
00
4,5
00
0%
5%
10%
15%
20%
25%
Tra
nsfe
r ($
M)
84
259
330
365
461
462
486
484
509
638
PS
E E
xp (
$M
)1,4
06
1,5
79
1,9
16
2,1
84
2,3
55
2,3
96
2,6
36
3,1
09
3,6
52
4,0
27
% tra
nsfe
r to
PS
E E
xp
6%
16%
17%
17%
20%
19%
18%
16%
14%
16%
1967/6
81968/6
91969/7
01970/7
11971/7
21972/7
31973/7
41974/7
51975/7
61976/7
7
So
urc
es:
Sta
tist
ics
Can
ada.
CA
NS
IMT
able
s 478-0
004 a
nd 4
78-0
007 a
nd P
rovin
cial
Eco
nom
ic A
ccounts
Cat
alogue
13-2
13 (
Lee
, 20
06
).

Chapter 2 / Historical Development of Federal PSE Policy 31
The Canadian Union of Students (CUS) (formerly NFCUS) continued to pressure Prime Minister Pearson to provide the promised bursaries. In an October 1964 speech, Pearson acknowledged that the CSLP did not completely meet students’ fi nancial needs but that it was a step towards creating equality of opportunity. The goal of his government, he said, was to ensure that no young person with talent was turned away from university solely because of fi nancial means, and his personal belief was that education at all levels should be free, but that the government was not going to achieve that goal overnight (Clift 2002, 27).
Little evidence was available in the 1960s to support either side in the fi nancial accessibility debate. Yet clearly, students from upper middle and upper class backgrounds were disproportionately taking advantage of university education in the mid-1950s and mid-1960s, but little evidence existed about the effectiveness of different approaches to remedy this inequity. Surveys, opinion polling, and analyses of existing data were used in the 1970s and 1980s in an attempt to determine the effectiveness of various remedies, but no rigorous program of experimentation and evaluation would be attempted until 2003.20
In 1960, the Diefenbaker Conservative government established the Royal Commission on Government Organization (the Glasco Commission) to assess the effi ciency and economy of all government departments. The commission reported to Lester Pearson’s Liberal administration in 1962. The commission examined the organization, management and coordination of federally funded research activities in industry, universities and federal institutions. Finding that “the whole post-war expansion of government scientifi c activity has proceeded on a piecemeal basis without adequate coordination” (Government of Canada 1962, 218), the commission concluded that the system had failed to function as intended. The report recommended an institutional framework aimed at making government R and D activities more cohesive. Major structures in this framework included a permanent Science Secretariat to provide advice, a Science Council responsible for long range planning, and the appointment of a minister responsible for science. The fi rst two recommendations were put into effect: a Science Secretariat
20 This is a reference to the pilot projects that were conducted in British Columbia, New
Brunswick and Manitoba, see Cunningham, Redmond and Merisotis (2003); and Canadian
Career Development Foundation (2003). The general references include Porter (1965,
186); Rabinovitch (1966, 110-12); Porter, Porter and Blishen (1973); Anisef, Bertrand,
Hortian and James (1985); Guppy (1984, 79-93); Stager (1989).

Canadian Federal Policy and Postsecondary Education32
was established in 1964 and the Science Council of Canada began operation in 1966. Rather than appoint a minister for science, the government allowed the minister who chaired the Privy Council Committee on Scientifi c and Industrial Research to become the de facto minister (Dufour and de la Mothe 1993, 13).
The backdrop to the discussion about the role of science and technology was the enthusiastic embracing of human capital theory. From its inception in 1963, the Economic Council of Canada (ECC) was a strong advocate of human capital theory. The economic importance of education was discussed in ECC’s FirstAnnual Review in 1964 and highlighted again under the heading “Education and Growth” in 1965. The creation and maintenance of “an adequate supply of professional, technical, managerial and other highly skilled manpower” was described as a vital need and the basis for future growth in the Canadian economy (ECC 1965, 772–73; see also Bertram 1966). ECC (1965) concluded that
Very considerable scope would appear to exist in Canada to promote the growth of average per capita income by improving the educational stock of the labour force. The accumulating evidence and analysis suggests that the benefi ts from such improvements can be substantial for both the individuals and the economy as a whole (93).
By the late 1960s, ECC was arguing for more educational research to augment and contribute to the development of human resources.
A rapid expansion in educational research is needed, especially in the circumstances of both very rapid expansion of the educational systems in Canada, and the increasingly complex questions arising about the educational processes and possible technological changes in education itself. A signifi cant portion of such research should be focused on improving the effectiveness and effi ciency of our educational effort (ECC 1969, 167).
Education had become one of Canada’s biggest industries. By the early 1970s, ECC labelled education a social service which, competing for public funds, should be examined critically. Although the economic importance of education was not lost in these
Chapter 2 / Historical Development of Federal PSE Policy 33
discussions, a new scepticism about the economic contribution of education added one more reason for conducting research in this area (ECC 1973, 355-71).
With regard to science policy, the OECD examiners undertook an extensive survey of Canada’s science and technology infrastructure. They agreed with Glasco about the lack of coordination, noting that “the observer of Canadian science policy often fi nds himself on shifting and unknown ground. New structures that are not always readily and precisely defi ned appear side by side with other organizations left over form another period” (OECD 1969, 63). The Science Council of Canada’s 1968 report Towards a National Science Policy for Canada advocated greater collaboration between university, government and industry scientists and more use of multidisciplinary research teams. It also suggested that government laboratories work closely with industrial and university sectors, not as research performers but as research initiators and coordinators (Science Council of Canada 1968, 26).
During the late l960s and through the l970s, a series of reports continued to focus attention on the future of a national science policy. This trend began with the Science Council’s own report (1968), to be followed a year later by the Macdonald Report (The Role of the Federal Government in Support of Research in Canadian Universities, 1969)and extended through the series of volumes that were produced as part of the investigations conducted by the Senate Special Committee on Science Policy, chaired by Maurice Lamontagne. Alongside these investigations were the independent commissions on university research that resulted in the reports by Hurtubise and Rowat (l970) and Bonneau and Corry (l972).
In November 1967, Senator Lamontagne was appointed chair of the reconstituted Committee on Science Policy. The committee’s brief was to consider and report on the science policy of the federal government, its priorities, its budget and its effi ciency in comparison with other industrialized countries, in light of the requirements of the new scientifi c age. Specifi cally, the committee was charged with reporting on the research and development activities and expenditures of the federal government in the fi elds of physical, life and human sciences. The government expected the committee to come up with no less than a blueprint that would include “... the broad principles, the long-term fi nancial requirements and the structural organization of a dynamic and effi cient science policy for Canada.”21 The committee’s
21 See “Extract from the Minutes of the Proceedings of the Senate”, September l7 l968.

Canadian Federal Policy and Postsecondary Education34
fi ndings were issued in four major volumes during the 1970s (1970-1977).
In the fi rst volume of its report (1970), the Lamontagne Committee was extremely critical of government efforts to establish a science policy in Canada. The committee described their efforts as 50 years of failure and recommended a new administrative structure. In that same year, a new non-governmental organization, the Association of the Scientifi c, Technological and Engineering Community of Canada was created. This association was an attempt to marshal all parts of the science and technological community to both communicate and cooperate with government in the national interest. In l97l, the government accepted one of Lamontagne’s recommendations when it established the Ministry of State for Science and Technology (MOSST) as the organizing structure of their developing policy. Against this background the Lamontagne Committee produced the second volume of its report, Targets and Strategies for the Seventies,which drew a distinction between “curiosity-oriented” and “mission-oriented” basic research.
Canada’s traditions of academic autonomy began to change in 1977. In that year the granting agencies, including the NRC, the CC (founded 1957) and the MRC (founded 1969), were restructured to create a system of federal research councils encompassing all disciplines recognized by Canadian universities. This restructuring was the main recommendation of the Macdonald Study Group (1969). The Macdonald Report (1969) was the critical driver for a policy framework for research. Briefl y, the MacDonald report laid down three key principles: university research in all disciplines should be covered by research granting councils; institutional autonomy of universities should be respected; and federal grants should cover the full costs, direct and indirect of university research. Funding for indirect research costs had to wait for more than 30 years before it came into effect.
In the following year three councils, the MRC, the Natural Sciences and Engineering Research Council of Canada (NSERC) and the Social Sciences and Humanities Research Council of Canada (SSHRC), were assigned the functions of supporting faculty and graduate student research. The councils were subject to government scrutiny from the beginning but managed to maintain a high level of autonomy.
File, Senate of Canada, Science Policy Committee (Lamontagne). Social Science Federa-
tion of Canada, SSFC/72, Box 4. Public Archives of Canada, Ottawa.

Chapter 2 / Historical Development of Federal PSE Policy 35
If we turn our attention to Aboriginal education, Canada’s assimilationist agenda was most forcefully articulated in its 1969 White Paper, which proposed terminating distinct status and legislation for Indian people, the dismantling of Indian Affairs, and transferring services from the federal to the provincial governments. Reaction by Aboriginal organizations was strong and swift, forcing government to renounce this policy. In 1972, the National Indian Brotherhood (now the Assembly of First Nations) articulated a new policy direction for Indian education, ‘Indian Control of Indian Education’, based on the principles of parental responsibility and local control of education. This policy was adopted by the federal government in 1973 (Miller 2004; Stonechild 2004).
The National Indian Brotherhood did not limit its objective of Indian control to the elementary and secondary school system. They maintained that “it is the fi nancial responsibility of the federal government to provide education of all types and all levels to all status Indian people, whether living on or off reserve” (cited in Stonechild 2004, 85).22 Developments in Indian control at the elementary and secondary level expanded to the postsecondary system.
Manitou Community College, the fi rst Aboriginal controlled postsecondary institution opened in July of 1973 in La Macaza, Québec, on the site of the former Bomarc missile base. In partnership with University of Québec et Chicoutimi, Manitou College began offering the Amerindianization Program, a summer Indian teacher training program. In the fall of 1973, in partnership with Dawson College in Montreal, it began offering an English Collège d’enseignement général et professionnel (CEGEP) program. The College closed in December of 1976, and is now a medium security prison (Stonechild 2004).
A more successful story is the Saskatchewan Indian Federated College (SIFC). Created in 1975 as a First Nations controlled institution, SIFC was academically affi liated with the University of Regina. In 1976 it offered a degree in Indian Art, and in the next two years expanded its offerings to include degrees in Aboriginal languages, education, and management and administration. Despite the lack of stable funding, SIFC has expanded dramatically to include additional campuses in Saskatoon and Prince Albert and off-campus course delivery in Saskatchewan, British Columbia, Alberta, Manitoba, Ontario, Québec, the Northwest Territories and the Yukon. It boasts some 2,000 graduates, and serves over 1,600
22. Seventy three per cent of Status Indians live off-reserve.
Canadian Federal Policy and Postsecondary Education36
students. In 2003, SIFC was renamed the First Nations University of Canada (Stonechild 2004).
Of particular note is the development of the Gabrielle Dumont Institute of Native Studies and Applied Research in Saskatchewan, which was established as a non-profi t corporation in 1980. Initially it focused on research, but soon expanded to include curriculum development, a wide range of vocational educational programming, and the Saskatchewan Urban Native Teacher Education Program, a four year bachelor of education program. This program is the only Métis-controlled postsecondary institution in Canada (Dorion and Yang 2000).
The rest of this monograph will focus on the period from the late 1970s through to the present. In 1977 and 1978, the federal government took two gigantic steps that set a course for federal PSE policy that is still being followed today. The fi rst step was the Established Programs Financing Act (EPF), which for the fi rst time provided a system of unconditional block transfers to the provinces for PSE and health. Social welfare was covered under a separate transfer, the Canada Assistance Program (CAP). While guidelines were provided for the amount that should be allocated for PSE, the act clearly gave all the authority to the provincial jurisdictions. Henceforth, the federal government could rightly claim they were honouring the constitutional division of powers, but this has also meant that the federal government has an indirect relationship with universities and colleges. The second step was the creation of two national research councils, NSERC and SSHRC. These bodies were part of the developing federal science policy and along with the MRC, signifi ed the federal government’s commitment to support research in all the disciplines and fi elds represented in Canadian universities.

Chapter 3 / Fiscal Arrangements 37

Canadian Federal Policy and Postsecondary Education38
Chapter 3 / Fiscal Arrangements 39
Chapter 3
Fiscal Arrangements
As noted earlier, the fi nancial relationship between the provinces and the federal government is complex and controversial. In the Canadian federal system the federal government enjoys the largest share of revenues from economic growth (e.g. through income tax), however, the provinces have the main responsibility for providing essential and expensive services such as health and education. This situation creates a disparity for the provinces between their revenues and their required spending. The national fi scal arrangements allow the federal government to assist the poorer provinces so that essential services such as health and education are provided across the country at the same level of basic service (Young and Levin 2002). Similarly, federal governments have attempted to increase equality of educational opportunity nationally through their support for students. This chapter will cover the way federal spending power has been used to support PSE through transfer payments and student fi nancial assistance.
3.1 Transfer Payments
The principle of cost-sharing was abandoned in 1977. Effective April 1, 1977, the Federal-Provincial Fiscal Arrangements and Established Programs Financing Act (EPF) introduced a system of unconditional block grants to each provincial government for health and PSE. Revenue would come both from cash payments and from transfers to the provinces as a proportion of the federal government’s taxation powers. Under the provisions of this act, the federal government further reduced federal personal income taxes by approximately nine points in order to allow the provinces to raise their taxes. When added to the 1967 transfer, this brought the accumulated total to 13.5 points. The one per cent corporate tax room transferred to Québec in 1960 and other provinces in 1967 continued as well (Cameron 1991). This “tax room” was taken over by the provinces, thereby providing an immediate source of provincial revenue for health and postsecondary programs. Because tax yields would vary between provinces, these tax points were supplemented by equalization payments that raised the total value of the tax points and the supplement to the per capita national average. The principle of equalization is used to transfer resources from the “rich” to the “poor” provinces. The tax points and equalization

Canadian Federal Policy and Postsecondary Education40
payments were further supplemented by cash payments tied to the “base year” of 1975-76, growth in GNP and provincial population (Carter 1988, 1227-28).
EPF was intended to clarify and simplify federal-provincial relations in respect of PSE and health fi nancing, but a major problem arose from lumping these “established programs” together. The block transfer approach makes accountability for postsecondary funding less attainable by the federal government. As it turns out the federal government’s decision to move to a block transfer approach was based on two erroneous assumptions. The fi rst is that provinces would not shift expenditures away from these established programs. For administrative purposes, the federal government assigned 67.9 per cent of the cash payments for health and the remaining 32.1 per cent for PSE without requiring that provinces allocate funding in that proportion. The lack of any performance or accountability criteria was partly in deference to Québec at a time of separatist activism (Senate Standing Committee 1987, 15-16) as well as a recognition that all provinces wished to protect their autonomy. Still the federal government expected provincial spending on PSE to grow in proportion to the growth in the EPF transfer. Instead, according to Gunther and Van Loon the provinces saw the new program more as a format for making federal contributions directly to their Consolidated Revenue Funds (1981). The second assumption, made without provincial commitment, was that the federal government would participate with provinces in the consideration and development of postsecondary policies of national signifi cance via a transformed CMEC forum. This change was suggested by the OECD report (1976), which saw cooperative federalism as an essential foundation for policy making in education at the national level.23 CMEC denied any intent to reform itself. While federal ministers and offi cials were invited to meetings, their attendance was limited to specifi c items and discussions.
23 The external examiners of OECD recommended that CMEC be transformed “into a national forum for the working out of educational policies so that the fed-eral government may be involved in a systematic and open manner in discussions of educational policy that transcend provincial boundaries”. The OECD’s review also commented as follows: “The further development of Canadian educational policy is therefore clearly approaching a danger zone, in which more is at risk than simply the quantity of fi nance available. The virtues of an essentially prag-matic educational policy will be tested in the extreme. If those responsible for educational policy are not promptly able to base the development of school and education on a fi rm goal-oriented footing, then they risk being pushed to the side in the general political competition for resources” (1976, 98 and 102).

Chapter 3 / Fiscal Arrangements 41
Faced with the realization that the large EPF transfers did not serve any explicit federal purpose, the federal government started to look for ways to inject some federal infl uence or to reduce the transfers. Due to a commitment to allow the scheme to remain unchanged for at least fi ve years and a requirement to give three year’s notice of any proposed changes, the federal government did not introduce changes until 1982. By the early 1980s, Canada was in economic depression.24 As part of its restraint measures, the federal government announced its decision to check the growth rate of transfer payments by making the following changes: make equal contributions to all provinces beginning April 1, 1982 and discontinue the 1972 revenue guarantee program. The EPF formula was modifi ed and simplifi ed so the total federal contribution to provinces, not just the cash payments as was previously the case, would be equal in per capita terms (Carter 1988, 1231). The federal government also announced that new federal-provincial arrangements for the fi nancing of PSE and human resources development would be devised in consultation with the provinces for incorporation in the new legislation by March 31, 1983. The reasons for discontinuing the 1972 revenue guarantee were specifi ed as follows: the original purpose of the program had disappeared; provinces treat this compensation as part of their general revenue, and not as transfers to be used specifi cally for health care or PSE; and current economic circumstances call for fi scal restraint (Canada 1981).
Several reports provided the raison d’être or arguments for the changes the federal government had wanted to make for some time. The fi rst report by the Parliamentary Task Force on Federal-Provincial Fiscal Arrangements chaired by the Honourable Herb Breau was released in 1981. It provided the argument for making the EPF payments equal on a per capita basis for all provinces. The explicit reason was to eliminate the existing advantage held by the wealthiest provinces. The report also supported the need for “some form of indirect accountability for intergovernmental transfers” given that federal ministers must be accountable to parliament for use of the transferred funds. However, it rejected any federal legislation for national standards for PSE in recognition of education as a provincial jurisdiction. The report also recommended that the two components of EPF be separated and earmarked in order to prohibit their use for other purposes. This earmarking would also
24 The unemployment rate rose in 1982/83 to 11 per cent from 7.3 per cent in the previ-
ous year and it was to hover around the eleven per cent mark for the next three years.

Canadian Federal Policy and Postsecondary Education42
enable the secretary of state to report annually to parliament on the effectiveness of the transfer funds towards meeting the country’s economic and social goals.
Second was the report of the Task Force on Labour Market Development (1981) chaired by David Dodge, then in the Faculty of Economics at Queen’s University. Based on his projections of economic conditions and labour market requirements, he concluded that public spending on PSE was adequate, and might even be reduced to free up resources for other purposes. This view seemed to support the provinces’ practice of reallocating transfer payments for other purposes, which was one of the contested issues between the two levels of government. At issue was the level at which the reallocation should take place. If at the federal level, the reallocated resources would assist other federal purposes as opposed to other provincial purposes.
The third report was by another parliamentary task force, Work for Tomorrow: Employment Opportunities for the 1980s chaired by Warren Allmand (1981). It took the position that the federal government “should attempt to reallocate resources towards programs offering the greatest employment opportunities in the 1980s”. The Dodge report had recommended that within the PSE sector, resources should be reallocated from universities to other skill training programs offered by colleges. The Allmand report recommended that within the university sector, resources should be allocated away from general arts, education and public administration programs toward science, engineering and business administration. According to the report, the absence of explicit guidelines and the full provincial autonomy over spending led to perceived abuses of the transfer.
Johnson (1985) drew attention to the reductions in the growth of provincial contributions. Until the 1983 capping legislation, federal EPF transfers accounted for approximately 80 per cent of university budgets and had kept pace with the GNP. As the federal government attempted to control the increases, so did provincial governments, and the proportion of university operating grants funded by the federal government was in some cases above 80 per cent. A 1985 report to the secretary of state showed that fi ve provinces received more money from the EPF for PSE than they spent on higher education. The redirection of EPF funds to other purposes was not explicitly prohibited, and in fact the provinces had been encouraged to fi nd internal effi ciencies. However, it was clear that some provinces, notably British Columbia, had given PSE a low priority, which was inconsistent with the intent of EPF.
Chapter 3 / Fiscal Arrangements 43
In 1987 a Senate committee struck to examine federal higher education policy advised that, apart from being fi nancially unsustainable from the federal perspective, EPF threatened to undermine national standards in PSE. The committee recommended that the PSE component of EPF be terminated. In its place, the provinces would receive a larger direct transfer (probably in tax points), with the ineffectual federal strings removed; and the federal government would improve its effectiveness in the PSE sphere by developing new mechanisms for the direct transfer of federal support to students, researchers, and institutions.
The federal government chose to steer away from stipulations for funding, adhering instead to revising the block transfer arrangements. The objectives for the revisions were, “to maintain an adequate level of federal support for public health and PSE programs and to achieve that degree of restraint in the growth of transfers to provinces which applies broadly to federal expenditures and which is essential for the success of the budget’s economic strategy” (Canada 1981). From discontinuing revenue guarantees itself, estimated federal savings ranged from $818 million in 1982-83 to $1,336 million in 1986-87. From making equal per capital payments to provinces, estimated federal savings averaged $75 million a year. It may be said that whatever the federal government saved, the provincial governments lost.
By the mid-1980s, both federal and provincial governments in Canada were looking for ways to alter the relationship between the state and postsecondary education, particularly as transfers under EPF brought little or no credit to the federal government and often blame for under-funding (Skolnik 1992). Cameron (1992) dates these attempts at fi scal control to 1983 and 1984, when increases were capped at 5 per cent and 6 per cent, respectively, a formula altered in 1985 and 1989 to Gross National Product (GNP) less 2 per cent and GNP less 3 per cent, respectively. Attempting to justify these changes and searching for ways out of debt, the federal government initiated a series of national investigations and consultations on postsecondary education.
The EPF scheme was not replaced until 1996-97. Between 1982-83 and 1995-96 however, the federal government made modifi cations to change the value of the transfers. When the Canada Health Act (CHA) was passed in 1984 amalgamating the Hospital Insurance and Diagnostic Services Act and the Medical Care Act, the EPF act was renamed Federal-Provincial Fiscal Arrangements and Federal
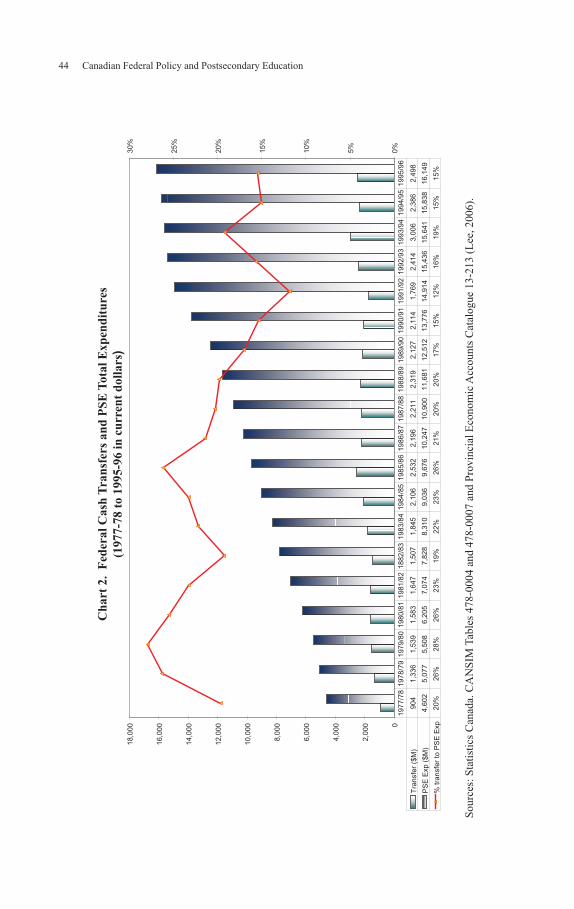
Canadian Federal Policy and Postsecondary Education44
Ch
art
2. F
eder
al
Cash
Tra
nsf
ers
an
d P
SE
Tota
l E
xp
end
itu
res
(1977-7
8 t
o 1
995-9
6 i
n c
urr
ent
doll
ars
)
0
2,0
00
4,0
00
6,0
00
8,0
00
10,0
00
12,0
00
14,0
00
16,0
00
18,0
00
0%
5%
10%
15%
20%
25%
30%
Tra
nsfe
r ($
M)
904
1,3
36
1,5
39
1,5
83
1,6
47
1,5
07
1,8
45
2,1
06
2,5
32
2,1
96
2,2
11
2,3
19
2,1
27
2,1
14
1,7
69
2,4
14
3,0
06
2,3
86
2,4
98
PS
E E
xp (
$M
)4,6
02
5,0
77
5,5
08
6,2
05
7,0
74
7,8
28
8,3
10
9,0
36
9,6
76
10,2
47
10,9
00
11,6
81
12,5
12
13,7
76
14,9
14
15,4
36
15,6
41
15,8
38
16,1
49
% tra
nsfe
r to
PS
E E
xp
20%
26%
28%
26%
23%
19%
22%
23%
26%
21%
20%
20%
17%
15%
12%
16%
19%
15%
15%
1977/7
81978/7
91979/8
01980/8
11981/8
21882/8
31983/8
41984/8
51985/8
61986/8
71987/8
81988/8
91989/9
01990/9
11991/9
21992/9
31993/9
41994/9
51
995/9
6
So
urc
es:
Sta
tist
ics
Can
ada.
CA
NS
IM T
able
s 478-0
004 a
nd 4
78-0
007 a
nd P
rovin
cial
Eco
nom
ic A
ccounts
Cat
alogue
13-2
13 (
Lee
, 2
00
6).
Chapter 3 / Fiscal Arrangements 45
PSE and Health Contributions Act (Carter 1988, 1231). With the new CHA, provinces had to meet certain health provision criteria in order to qualify for full funding under the EPF. In 1986-87, the EPF growth was reduced to 2 per cent annually. The 1989, 1990, 1991 and 1994 federal budgets announced more and more restrictions on EPF.
Chart 2 shows that EPF transfers initially increased until the federal government began modifying the scheme to cap EPF transfer growth starting in 1982-83. As these caps were imposed, the cash transfer payments covered a decreasing share of the total PSE costs. Towards the end of the EPF era, they constituted less than 10 per cent of total federal cash transfers to provinces. This appears consistent with the federal government’s view that investment in PSE was adequate and can be diverted to other areas as suggested by the Dodge report. The lowest point was 1991-92 when GDP growth was under 1 per cent. Typical of economic depression years, the unemployment rate was again around 11 per cent.
During the EPF era, the full-time student population grew by 54 per cent from 615,000 in 1977-78 to 964,000 in 1995-96. Over 15 years, along with a very large increase in student numbers, the postsecondary system saw a substantial reduction in expenditure per student: whereas 1975 spending on postsecondary education per student was $12,011, the 1990 amount had shrunk to $9,190 (Horry and Walker 1994). While the growth rate appears slower than in the prior period (1967-68 to 1976-77), the actual increase in the number of postsecondary spaces is 349,000 over 19 years. According to Statistics Canada, federal grants over this period constituted approximately 19 per cent of total postsecondary expenditures. Federal grants in total came to approximately $38 billion, while the total for postsecondary expenditures was approximately $200 billion (current dollars).
Though EPF was clearly in need of repair, reform was some time in coming, partly because complex issues of health care fi nancing dominated the agenda. The Liberal government led by Jean Chrétien replaced the Conservative government in 1993. Upon taking offi ce, the government set out to cut the defi cit, which was one of the highest among major industrialized countries. The 1995 budget announced measures that would gradually reduce the defi cit to 3 per cent of the GDP in 1996-97, down from 6 per cent in 1993-94. A major part of the savings was to come from a drastic reduction of fi nancial transfers to provinces for income assistance, health and

Canadian Federal Policy and Postsecondary Education46
PSE. The government announced that the EPF entitlement would be entirely paid for in the form of forgone taxes. This shift constituted a loss of $14 billion to the provinces.
Prior to the budget announcement, Human Resources Development Minister Lloyd Axworthy had announced in January 1994 a comprehensive review of Canada’s ‘social safety net’. In October, Axworthy released the Green Paper on social policy reform, which included a proposal to replace the Canada Student Loan Program and federal transfers to the provinces for PSE with an income-contingent loan repayment (ICLR) scheme (HRDC 1994a, 62-63). This rather radical proposal was effectively killed when as part of his budget Finance Minister Paul Martin announced a new mechanism to transfer funds to the provinces for PSE, health and social welfare programs, to be called the Canada Social Transfer (CST). This new transfer mechanism, to commence in 1996-97, replaced EPF and CAP. Subsequently, the mechanism was renamed the Canada Health and Social Transfer (CHST).
The CHST was set at $26.9 billion for 1996-97 and $25.1 billion for 1997-98. By 1997-98, the federal government had cut $4.5 billion from the cash component of the CHST. Like its predecessor, the CHST was an unconditional block grant program involving cash and tax transfers. The CHST was a signifi cant change because the targeting of funds by the federal government for PSE was made even more diffi cult with the addition of CAP to the existing mix of health and PSE funding. PSE was not even mentioned in the name of the program. In any event, the new program’s main thrust was federal cost reduction, primarily by means of devolving program responsibilities to the provinces. According to Cameron (2004, 5-6), the total federal transfer for the areas covered by the CHST was reduced by $6 billion. Predictably, the provinces responded with a combination of restraints on spending and, some provinces, the de-regulation of PSE tuition fees.
The provinces, which were also confronting their own fi scal crises in the early 1990s, had already identifi ed the need to more clearly defi ne the respective federal and provincial areas of responsibility. In 1995 a committee of all provincial fi rst ministers, with the exception of Québec, presented a manifesto inviting the federal government to negotiate a framework that would set out the division of responsibilities for social program funding. In particular, the framework would replace the ambiguous middle ground of policy, where federal and provincial governments acted in “ad hoc”
Chapter 3 / Fiscal Arrangements 47
fashion, with clear principles of federal-provincial cooperation. The Social Union Framework Agreement (SUFA) was signed by all the provinces except Québec in February 1999.
The agreement has been taken to herald a new era of “collaborative federalism”, if only on the basis of the informal agreement that each order of government would consult the other before implementing major changes in their overlapping spheres of social policy. But, whereas the provinces had originally come together to negotiate limits on the federal authority, SUFA has been interpreted as actually strengthening the principle of a federal interest in harmonized social policy, and its right to pursue this by means of its spending power (Richards 2002). For Cameron, SUFA affi rmed the contribution of this federal instrument in preserving and protecting and enhancing the social union. The agreement stated that federal transfers enable the federal government to “… support the delivery of social programs and services by provinces and territories in order to promote equality of opportunity and mobility for all Canadians and to pursue Canada-wide objectives”. With regard to future conditional grants, the agreement states that the federal government will only “proceed in a cooperative manner that is respectful of the provincial and territorial governments and their priorities”.25
Cameron further makes a powerful argument with regard to the policy signifi cance of SUFA. With this agreement the provinces were willing to recognize the legitimacy of a substantial federal role in social policy. As Cameron puts it, this was the fi rst time that the constitutional division of powers had been “so openly set aside” and in so doing the nine provinces provided the federal government with “an important, if largely symbolic, victory …” (2004, 9). SUFA also committed the provinces to remove any existing barriers to inter-provincial mobility and not to erect any new ones in the future. This set the stage for examining the comparability of PSE professional credentials and confi rmed the existing rule that provinces should not charge higher fees for out-of-province students. While Québec does charge higher fees to such students, this policy is made somewhat acceptable given that Québec has by far the lowest undergraduate fees in the country and because the out-of-province fees are set at the mean levied by the other provinces.
The cash fl oor transfer to provinces and territories announced in 1995-96 was $11 billion a year, which included a large reduction
25 Quoted in Cameron (2004, 9-10) from Canada, “A Framework to improve the Social
Union for Canadians”, February 4, 1999.

Canadian Federal Policy and Postsecondary Education48
of transfer payments to take effect in 1996-97 and 1997-98. SUFA committed the federal government to an additional $11.9 billion over fi ve years: $2 billion in 1999-2000 and 2000-01; and $2.5 billion in the three succeeding years. This money was explicitly targeted for health. Consistent with the established tradition of Québec exceptionalism, the province received its share of the increases even though it was not a signatory to the agreement. As in other areas of federal provincial relations, Québec was able to withstand the pressure from the federal government to give up part of their constitutional rights but still receive the benefi ts from the agreement. This cash fl oor was eventually increased to $12.5 billion 1998-99, and then to $15.5 billion in 2000-01, $16.2 billion in 2001-02, $15.9 billion in 2002-03 and $16.7 billion in 2003-04. With recent health pressures due to demographics, the federal government had increased the health portion by $21 billion in September 2000. In February 2003, the federal government announced that effective with the 2004-05 fi scal year, CHST would be divided into two transfers, the Canada Health Transfer (CHT) and the CST, with PSE in the latter. Budget documents explained that this would increase transparency and accountability, but more likely the intent was to increase visibility of the federal funding going to the politically popular health care system. The CHT was apportioned 62 per cent of the block and the CST was left with the remaining 38 per cent. Once again PSE does not even appear in the title of the transfer.
The 2004 election campaign was dominated by competing recipes for modernizing federal-provincial relations, particularly in respect of health care, which accounted for an increasing majority of CHST expenditures. The incumbent Liberal party and its new leader Paul Martin were reduced to Canada’s fi rst minority government in a generation, but immediately began negotiating a new federal-provincial agreement on health care. In September 2004, the provinces, territories and federal government agreed to a 10-year plan to strengthen health care resulting in new federal funding of $5.4 billion over the next ten years. No comparable agreement has been contemplated for PSE.
While it is very diffi cult to separate federal expenditures for PSE from those that go to health and social welfare, we can observe a consistent policy trend to favour health over the other two areas. This trend becomes clear in the early 1980s and is pronounced since the mid-1990s. Between 1988-89 and 2005-06, the federal transfers for health care in current dollars increased from $12.72 billion to $32.112 billion. Over the same period the nominal transfer for
Chapter 3 / Fiscal Arrangements 49
social programs increased from $9.64 billion to $15.766 billion (see Chart 3 and Appendix 2). When these amounts are converted to 1988 dollars, the health care and social programs transfers increased from $12.72 billion and $9.64 billion to $21.422 billion and $10.518 billion respectively (see Chart 4 and Appendix 2). The transfers to the provinces for health and for social programs (PSE and Social Assistance) combined in 1988 dollars increased 68.4 per cent and 9.1 per cent respectively. In other words, the increase to health was seven times greater than the increase to PSE and social assistance. The difference is even more pronounced if one only reports the cash transfers. Over the same period, again using 1988 constant dollars, we fi nd that while health increased by an enormous 106 per cent, PSE and social assistance actually declined by 14.2 per cent (see Table 2 and Appendix 2).
The gap between the transfers for health and for PSE and social assistance combined, become even more pronounced if we just focus on the last decade. Between 1995-96 and 2005-06, the federal transfers to the provinces for health increased 77.2 per cent and for PSE and social assistance combined and decreased 2.2 per cent in 1988 dollars. In other words, the increase to health was forty times greater than the increase to PSE and social assistance. The difference is even more pronounced if one only reports the cash transfers. Over the same period, again using 1988 constant dollars, we fi nd that while Health increased by an enormous 137.7 per cent, PSE and social assistance actually declined by 25.1 per cent (see Table 3 and Appendix 2).
When we examine the total federal government support for PSE and research from 1988-89 to 2003-04 (Chart 5 and Appendix 1) in current dollars, we can observe an increase from $7,810.7 billion to $9,868 billion. The picture looks somewhat different when we convert the total federal support into 1988 dollars. Over the same time period, the total value of cash and tax points decreases from $7,810.7 billion to $6,842.2 billion for a total decrease of $968.5 million or 12.4 per cent (Chart 6 and Appendix 1).

Canadian Federal Policy and Postsecondary Education50
Chart 3. Federal Transfer Payments for Health Care and
Social Programs (1988-89 to 2005-06 in current dollars)
Chart 4. Federal Transfer Payments for Health Care
and Social Programs (1988-89 to 2005-06 in 1988 dollars)
$0
$5,000
$10,000
$15,000
$20,000
$25,000
$30,000
$35,000
1988-89 2005-06 1988-89 2005-06
Cu
rren
t D
ollars
(M
illio
ns)
Tax Point Transfers
Cash Transfers
Health Care Social Programs
$0
$5,000
$10,000
$15,000
$20,000
1988-89 2005-06 1988-89 2005-06
19
88
Do
lla
rs (
Mil
lio
ns
)
Tax Point Transfers
Cash Transfers
Health Care Social Programs

Chapter 3 / Fiscal Arrangements 51
Table 2. The Percentage Increase/Decrease in
Federal Transfers (Cash and Tax Points)
for Health, PSE and Social Assistance,
1988-89 to 2005-06 (current and 1988 dollars)
Current Dollars 1988 Dollars
Cash(%)
Tax Points
(%)
Total(%)
Cash(%)
Tax Points
(%)
Total(%)
Health 208.8 90.1 152.5 106.0 26.8 68.4
PSE and Social Assistance
28.6 146.4 63.5 -14.2 64.4 9.1
Total 118.0 108.2 114.1 45.5 38.9 42.8
Table 3. The Percentage Increase/Decrease in Federal Transfers
(Cash and Tax Points) for Health, PSE and Social Assistance,
1995-96 to 2005-06 (current and 1988 dollars)
Current Dollars 1988 Dollars
Cash
(%)
Tax Points
(%)
Total
(%)
Cash
(%)
Tax Points
(%)
Total
(%)
Health 189.9 48.3 116.1 137.7 21.6 77.2
PSE and
Social
Assistance
-8.7 92.3 19.3 -25.1 57.5 -2.2
Total 76.1 62.4 70.5 44.4 33.2 39.8
In both Charts 5 and 6, we can identify the major dip in the value of the tax points in 2000-01. Furthermore, we see an identifi able dip in the total support beginning in 1995-96 and extending for two years until 1997-98. This dip corresponds to the Liberal government’s attempts to balance the budget.

Canadian Federal Policy and Postsecondary Education52
Chart 5. Total Federal Support for Postsecondary
Education and Research (1988-89 to 2003-04 in current dollars)
$0.0
$2,000.0
$4,000.0
$6,000.0
$8,000.0
$10,000.0
$12,000.0
1988-89
1990-91
1992-93
1994-95
1996-97
1998-99
2000-01
2002-03
Year
Cu
rre
nt
Do
lla
rs (
Mil
lio
ns
)
Tax Point Transfers
Tax Expenditures
Cash Transfers
Program Spending
Chart 6. Total Federal Support for Postsecondary
Education and Research (1988-89 to 2003-04 in 1988 dollars)
$0.0
$1,000.0
$2,000.0
$3,000.0
$4,000.0
$5,000.0
$6,000.0
$7,000.0
$8,000.0
$9,000.0
$10,000.0
1988-89
1990-91
1992-93
1994-95
1996-97
1998-99
2000-01
2002-03
Year
1988 D
ollars
(M
illio
ns)
Tax Point Transfers
Tax Expenditures
Cash Transfers
Progam Spending
When we remove the tax points and focus attention on federal program spending on PSE and research, then the picture changes again. Between 1988-89 and 2003-04, the total federal program spending on PSE and research in current dollars increased from $2,727.1 billion to $4,514.1 billion (Chart 7 and Appendix 3). In 1988 dollars, the amount increases from $2,727.1 billion to $3,130.6

Chapter 3 / Fiscal Arrangements 53
billion, for a total of $403.5 million or 14.8 per cent (Chart 8 and Appendix 3).
The best estimate we have of the decline in the amount of the federal transfer being spent on PSE comes from a briefi ng note to the minister of human resources and skills development obtained under the access to information legislation.26 Based on provincial spending patterns, the federal government estimates that between 1994-95 and 2004-05 the portion of the transfer going to PSE has been reduced from $6.18 to $4.5 billion, a reduction of $1.68 billion or 27.2 per cent. When student enrollment is taken into account, the amount spent per student has over the same period decreased from $10,729 to $5,732, a decrease of almost 50 per cent (see Table 4).
Table 4. PSE Enrollment, Federal Transfer Spent on PSE,
and Spending per Capita, and Percentage Change,
1994-95 to 2004-05
Enrollment Federal Transfer $ Per Capita
1994-95 576,000 $6.18B 10,729.17
2004-05 785,000 $4.50B 5,732.48
% change +36.3% -27.2% -46.6%
We have used the assumptions used in this memo to complete the series tracking federal transfer payments for PSE between 1988-89 and 2005-06 (see Appendix 5). In current dollars, the total transfer (both cash and tax points) for PSE increases from $5.084 billion in 1988-89 to $6.026 billion in 1995-96 and then decreases to $4.42 billion in 2005-06 (see Chart 9 and Appendix 5). The decrease is continuous over the same time period when the transfers are converted to 1988 dollars. The total in cash and tax points decreases from $5.084 billion in 1988-89, to $4.903 billion in 1995-96, and fi nally, to $3.031 billion in 2005-06, for a total of $2.053 billion or 40.38 per cent (see Chart 10 and Appendix 5). These startling fi gures provide a dramatic illustration of the way PSE transfers for operating budgets have moved to the bottom of the federal policy agenda. As we shall see major attention turned to funding research and infrastructure through special programs.
26 First reported in the Ottawa Citizen, 5 April 2005 and then in the CAUT April 2005
Bulletin. We would like to thank Sarah Schmidt of the National Post Ottawa Bureau for
sharing a copy of the original document.

Canadian Federal Policy and Postsecondary Education54
3.2. Student Financial Assistance and Tuition Fees
Since its inception, the CSLP has supplemented the fi nancial resources available to eligible students from other sources to assist in their pursuit of PSE. Except for changes in the amount of available assistance and some of the repayment provisions, the CSLP remained largely unchanged between 1964 and 1995. Loans were provided by fi nancial institutions to postsecondary students approved to receive fi nancial assistance. The fi nancial institutions also administered the loan repayment process. In return, the federal government guaranteed each Canada Student Loan that was issued by repaying the fi nancial institution any loan that went into default and by paying interest charges until six months after the student’s graduation. The program also provides participating provinces with fi scal compensation equal to its share of expenditures if it had a student loan program. For non-participating provinces, its fi scal compensation would be its per capita share of the actual expenditures in the participating provinces.
The CSLP provided loan assistance to full-time students with demonstrated fi nancial need; the interest on the loans was fully subsidized while the student remained enrolled in a postsecondary institution; six months after graduation (or otherwise discontinuing postsecondary studies), students were required to begin repayment of their loans at consumer rates of interest; and all loans had to be repaid within 10 years of graduation.27
Chart 7. Federal Program Spending on Postsecondary Education and
Research (1988-89 to 2003-04 in current dollars)
$1,500.0
$2,000.0
$2,500.0
$3,000.0
$3,500.0
$4,000.0
$4,500.0
$5,000.0
1988-89 1990-91 1992-93 1994-95 1996-97 1998-99 2000-01 2002-03
Year
Cu
rre
nt
Do
lla
rs (
Mil
lio
ns
)
27 The CSL limit was set at $56.25 per week of study in 1975, rose to $100 per week
in 1983, $105 per week in 1984, $165 per week in 1994, and then $210 per week in 2004
(Finnie and Schwartz 1996; also Berger, 1984).

Chapter 3 / Fiscal Arrangements 55
Chart 8. Federal Program Spending on
Postsecondary Education and Research
(1988-89 to 2003-04 in 1988 dollars)
$1,500.0
$1,700.0
$1,900.0
$2,100.0
$2,300.0
$2,500.0
$2,700.0
$2,900.0
$3,100.0
$3,300.0
1988-89 1990-91 1992-93 1994-95 1996-97 1998-99 2000-01 2002-03
Year
19
88
Do
lla
rs (
Mil
lio
ns
)
Chart 9. Federal Transfer Payments for
Postsecondary Education (1988-89 to 2005-06 in current dollars)
$0
$1,000
$2,000
$3,000
$4,000
$5,000
$6,000
$7,000
1988-89 1995-96 2005-06
Year
Cu
rren
t D
ollars
(M
illio
ns)
Tax Point Transfers
Cash Transfers
Chart 10. Federal Transfer for Postsecondary Education
(1988-89 to 2005-06 in 1988 dollars)
$0
$1,000
$2,000
$3,000
$4,000
$5,000
$6,000
1988-89 1995-96 2005-06
Year
1988 D
ollars
(M
illio
ns)
Tax Point Transfers
Cash Transfers

Canadian Federal Policy and Postsecondary Education56
Early in 1994, the federal government announced an overhaul of the CSLP. The purposes of the reform were: to increase the loan limits for full-time students (which had been frozen for the previous decade); to increase the loan limits for part-time students and change their repayment provisions; to create new Special Opportunity Grants for students with disabilities, high-need part-time students and women in doctoral programs; to change the mechanism by which student fi nancial need was assessed; to improve provisions to assist graduates in loan repayment; and to create new mechanisms for fi nancing student loans through private sector lenders (Meloshe 1994).
On 23 July, 1994, the Canada Student Financial Assistance Actreceived Royal Assent and replaced the Canada Student Loans Actfor all new loans made after 1 August, 1995. The primary purpose of this change was to provide a mechanism for the federal government to contract out the fi nancing of Canada Student Loans (CSL).28
Although private lenders had been involved in providing student loans since the inception of the program, the ultimate guarantor of the loans remained the federal government. After making a nominal effort to collect any guaranteed student loans that were in arrears, a private lender could then apply to the federal government for full reimbursement of the loan. Under the Canada Student Financial Assistance Act, the risk in making student loans was transferred from the federal government to one of nine contracted lenders. In exchange for taking the risks of making the loans, the lenders were paid a “risk premium” amounting to 5 per cent of the face value of a loan when a student began repayment. By implementing this “risk sharing”, the federal government hoped to reduce the amount of student loan debt on its books and turn over most of the work in collecting delinquent loans to the private lenders. Despite this, the lenders still had the option of returning 3 per cent of their outstanding loans to the federal government each year. The federal government would pay the lender 5 per cent of the value of the loans and then attempt to collect the loans, sharing any recoveries with the lender (Evaluation and Data Development 1997, 2-3).
Students opposed the risk sharing model on two grounds. First, that the private lenders would pressure the federal government to make changes to criteria for students to receive loans in order to reduce the fi nancial risk. Second, that students would pay substantially higher
28 “About the Canada Student Loans Program (CSLP),” 3 April 2004, <http://www.sdc.
gc.ca/asp/gateway.asp?hr=en/hip/cslp/About/01_ab_MissionProgram.shtml&hs=cxp>).

Chapter 3 / Fiscal Arrangements 57
interest rates on their loans. The federal government took great pains to assure students that the government would retain control of the student loan criteria, but inopportune comments by private lenders about linking eligibility to past credit history fuelled student anxiety. While the loss of control of loan eligibility to the private sector may have been speculative, the higher interest rates were all too real. Rather than the one percentage point above prime rate students paid under the Canada Student Loan Act, under the new rules private lenders charged students fi ve percentage points above the prime rate for fi xed rate loans or two-and-a-half percentage points above the prime rate for fl oating rate loans (CFS March 2001; Evaluation and Data Development 1997, 2-3).
In 1998, student concerns about the effect of private-sector lenders on government policy were realized when the federal government adopted legislation amending the Bankruptcy and Insolvency Act to increase the time limit prohibiting the discharge of Canada Student Loan debt from two to ten years. The same legislation amended the Canada Student Financial Assistance Actto give fi nancial institutions more latitude in setting conditions under which loans could be denied – power that was later used to deny loans to students with bad credit history. In March 1999, the CFS launched a challenge to the changes in the bankruptcy laws as discriminatory under the Charter of Rights and Freedoms. The case was heard in Ontario Superior Court on 16 August, 2004, and on 30 June, 2005 the Court ruled that the provisions dealing with student loans were not discriminatory because student loan borrowers do not constitute a protected group under section 15 of the Charter. Perhaps not coincidentally, on 3 June, 2005 a bill was introduced into the House of Commons that would reduce the prohibition on discharge of student loan debt from ten years to seven years (CFS March 2001; CFS June 2005; and Canada 2005).
Despite the changes in law and policy apparently designed to make administration of Canada Student Loans more profi table for the private lenders, in February 2000, the participating chartered banks announced that they would not seek to renew the fi ve-year agreement when it expired on 31 July, 2000. In response, the federal government reassumed the fi nancial risk for Canada Student Loans, but rather than reestablishing a department to administer these loans – as had been the case before 1995 – the work was contracted out. The administration of Canada Student Loans became the responsibility of the National Student Loans Service Centre (NSLSC). The NSLSC

Canadian Federal Policy and Postsecondary Education58
has two divisions, one to manage loans for students attending public institutions, and the other to administer loans for students attending private institutions. Although the program had returned to public hands, the interest rates, bankruptcy provisions and credit checks remained the same, suggesting perhaps the changes were more about saving the federal government money than catering to the private sector.
3.2.1. Trends in Tuition Fees
As noted earlier, tuition fees are directly related to changes in federal transfer payments. As a proportion of institutional revenue, student fees remained relatively stable during the 1980s, but then began to climb dramatically in the 1990s. By the end of the 1990s, tuition fees had climbed to 20 per cent of institutional revenues on average nationally, and upwards of 30 per cent in some provinces (Stager 1989; CAUT 1999, 3). In real dollars, average tuition fees rose by 126 per cent during the 1990s – 91 per cent after adjusting for infl ation (CAUT 1999). Between 1991-92 and 2005-06, average undergraduate arts tuition had climbed by a 135 per cent, from $1,714 to $4,028. Alberta recorded the highest percentage increase over this period at 230.6 per cent. Nova Scotia followed at 172.7 per cent and four provinces (Saskatchewan, New Brunswick, Ontario and BC) were in the 140 per cent range. Québec had the lowest increase at 53.1 per cent (CAUT 2006, Table 3.21, Map 3.3, 37). When all domestic undergraduate tuition fees are taken into account, the increase in the average in current dollars is from approximately $1,700 in 1991-92 to approximately $4,200 in 2004-05. The increase over the same period is less pronounced when the amounts are converted into 1988 dollars, going from approximately $1,400 to approximately $2,800 (see Chart 11). The increase in the average annual cost of university tuition for professional programs in Canada was much more pronounced. These fees rose from approximately $2,100, $2,000, $1,800 and $1,700 for Dentistry, Medicine, Law and Engineering in 1989 to $12,942, $10,349, $6,772 and $4,677 in 2005 respectively using 2005 constant dollars (CAUT 2006, Figure 3.6, 38).
When measured against the after-tax family income, university tuition fees increased from 6 per cent in 1990-91 to 9 per cent in 1998-99 for families in the middle income quintile, and jumped from 14 per cent to 23 per cent for families in the lowest income quintile over the same period. In constant dollars, university tuition fees

Chapter 3 / Fiscal Arrangements 59
in 2002 were the highest they had ever been at any time in the past century. Measured against the buying power of a middle income tradesman, university tuition fees in 2002 were more expensive than at anytime in the preceding 130 years, with the exception of the beginning of the Second World War (CAUT 2001a, 2, 8; CAUT 2001c, 4, 6).
Chart 11. Average Domestic Undergraduate Tuition Fees (Canada)
1972-73 to 2004-05
$0
$500
$1,000
$1,500
$2,000
$2,500
$3,000
$3,500
$4,000
$4,500
1972-731974-751976-771978-791980-811982-831984-851986-871988-891990-911992-931994-951996-971998-992000-012002-032004-05
Year
Do
llars
Current Dollars 1988 Dollars
This rapid growth in tuition fees, both in dollars and in proportion of institutional operating budgets, is directly linked to decreases in government support. Between 1984 and 2004, tuition as a share of university operating revenues nationally, increased from 13.8 per cent to 30.3 per cent. By contrast, government funding had decreased from 81.6 per cent to 57.2 per cent (CAUT 2006, Figure 1.3, 3). Although some of this decrease is due to actual cuts in government funding for universities, erosion of funding through infl ation and government-directed increases in the number of students enrolled, without compensating funding increases, also took their toll (CAUT 2001a, 3-4; CAUT 2001b).
3.2.2. Income Contingent Loan Repayment
In 1989, the Council of Ontario Universities (COU) published a monograph by University of Toronto economist David Stager outlining the history of and options for future tuition fee policies in Ontario. Stager was known for his analyses in the late 1960s and early 1970s, calculating the rates of return on investment in higher education. His 1989 work was a reasonable overview of the issues

Canadian Federal Policy and Postsecondary Education60
and the policy options but his reliance on using the lens of rate of return analysis led to the inevitable conclusion that the burden of costs for PSE should be shifted to the direct benefi ciary, the student, and that government should provide means to fi nance this personal investment in education (Stager 1972 and 1989).
Following from his work in the early 1970s, the means of fi nancing Stager advocated was Income Contingent Loan Repayment (ICLR). First proposed by economist Milton Friedman in 1955, ICLR is viewed by proponents both as an effi cient means for leveraging future earning power of graduates and a way to limit the public subsidy of higher education. Stager argued not only that greater government funding to minimize tuition increases was a regressive subsidy, but also that grants to needy students were an ineffi cient mechanism to promote accessibility because the recipients likely would have enrolled in a postsecondary institution in any event. Through ICLR, all students would have access to whatever funds they needed and those students who could not repay the loans would be subsidized either by fellow borrowers through a “tax” built into the interest rate charged on the loans or by direct government subsidy. This approach thus has the effect of transferring the cost of the benefi t of higher education on to the recipients, both individually and as a group, and allowing government to more effi ciently target its subsidy to post-graduation low wage earners (Cook and Stager 1970; Stager 1989, 89-90, 96-98, 100, 118-25).
Stager’s analysis and proposals touched off a national debate about the means of fi nancing higher education. Cash-strapped institutional administrators rallied around the prospect of increased tuition fee revenue, while students balked at the possibility of a substantial debt hanging over them for half of their working lives.
In 1990, AUCC commissioned Stuart Smith, a former psychiatry professor and former leader of the Ontario Liberal Party, to conduct a year-long study of how well universities were carrying out their educational mandates and to make recommendations for the future. In addition to recommendations about the teaching mission of the universities, curriculum design, future needs for teaching staff and quality control, Smith’s 1991 report also included recommendations about accessibility and funding. The most contentious of these latter recommendations was a proposal to increase tuition fees to 25 per cent of the general operating costs of universities, providing the federal government instituted an ICLR program (AUCC 1991, 21-23, 27, 94-96).
Chapter 3 / Fiscal Arrangements 61
Smith’s proposal reignited the debate about ICLR, tuition fees and student indebtedness and was the catalyst, along with Stager’s early work, for the AUCC and the COU to explore how an ICLR plan might be implemented. Further discussion papers in 1992 and 1993 led these organizations to endorse ICLR in principle and commence formal lobbying. In March 1994, the Ontario government announced it would host a national symposium on ICLR to be held in September of that year. Although most symposium participants said they approached the topic with open minds, the battle lines had been drawn and would play themselves out later that year in the national capital with the introduction of HRDC Minister Lloyd Axworthy’s Green Paper on social policy reform (COU 1995).
While we know Axworthy’s proposal was eventually overtaken by the Martin budget, it is worth focusing on the debate because it illustrates the tension between commitments on the one hand to a collective, state approach and on the other hand an individualistic, privatized market approach to student assistance. Under the proposal, the cash transfers and needs-based subsidized loans would have been replaced with an ICLR system. Such loans would have been available to any student, regardless of fi nancial need, and repayment would have been tied to post-graduation income levels. The “Green Paper” argued that such a system was the most equitable means to ensure that students had the fi nancial support they needed to attend college or university and that repayment of the loan would not cause undue hardship (HRDC 1994a, 63-64).
Response to the proposal was swift. The largest national student organization, the Canadian Federation of Students (CFS), roundly condemned the proposal and mounted a vigorous campaign to oppose its adoption. The federal government launched an energetic counter attack sending members of parliament from the governing Liberal party across the country to bolster support. Armed with government-prepared speaking notes to challenge the CFS position, government MPs attempted to persuade the public that the new proposal was the most equitable means of ensuring access to PSE in a time of rising tuition fees and decreasing government funding (HRDC 1994b).
CFS opposition to ICLRs stemmed from three beliefs. First, the elimination of transfer payments to fund the loans would reduce the leadership role played by the federal government in creating PSE opportunities. Second, ICLRs would lead to sharp increases in tuition fees since colleges and universities would lose the funds

Canadian Federal Policy and Postsecondary Education62
indirectly transferred to them by the federal government through the provinces. Third, student loan debt would grow dramatically and could drag out over as many as 25 years thus proving a major barrier to students from lower income backgrounds, who were averse to debt (Duncan 1994, 1-4).
Speaking notes provided to Liberal MPs stressed that the federal government would be unable to increase transfers for PSE after the 1996-97 fi scal year and so the most cost effective means to try and meet the growing demand for PSE was to leverage the federal money through the ICLR plan. The speaking notes attempted to downplay how the elimination of transfer payments would affect tuition fees despite the fact that the Green Paper itself acknowledged that such a move would “put upward pressure on tuition fees”. The notes also cast the proposal as a equitable since it would transfer the responsibility for the costs of higher education to the direct benefi ciary while at the same time providing a safety net if a graduate was unable to repay the debt. This assertion, also found in the Green Paper, was made without any details as to how the ICLR plan might be implemented (HRDC 1994a, 62-64; HRDC 1994b).
No middle ground could be found between the students and the federal government. The government insisted that unless it struck out in a new direction, the cash transfers to the provinces would disappear. The students insisted that only the ICLR scheme would ensure a continued federal presence in PSE. The students maintained that the fate of the cash transfers was a political decision and that they need not disappear. They argued the transfers could be increased and a new system of national grants could be introduced. Furthermore, the students argued that federal government assertions about ICLRs ensuring equity across social and income groups were made without any supporting evidence or even any description of how the plan would be designed to achieve this goal (CFS 1994, 1-2, 10).
The students might well have lost the argument had they not gained an unexpected ally in the university presidents. The AUCC typically said very little about tuition fees, preferring to leave it to individual institutions to decide what amounts were appropriate. Moreover, AUCC had advocated creation of an ICLR plan in a presentation to the Standing Committee on Human Resources Development during phase one of the social policy process early in 1994. They did not back away from this proposal in their November 1994 submission to the Standing Committee, but did express alarm at the all or nothing

Chapter 3 / Fiscal Arrangements 63
approach advanced in the Green Paper (AUCC 1994a, 4-5).In particular, the university presidents feared that elimination of
the federal cash transfer, either by letting it run out or by diverting it to an ICLR plan would rob institutions of valuable support for research infrastructure. One of the historic justifi cations for federal PSE transfer payments was the support of the research enterprise and the training of new researchers, areas where the federal government could claim at least some jurisdiction. If the transfer payments were eliminated, the universities would have faced serious choices about curtailing research activities or decreasing the quality of education (AUCC 1994a, 5-9; Cameron 1991, 130-132).
So despite AUCC’s continued advocacy for ICLR, it criticized the Green Paper proposal for its potential “dramatic consequences for student debt, accessibility and overall fairness”. The AUCC made these points more forcefully in a background document that called into question twelve assertions in the Green Paper proposal, seven of which dealt with tuition fees and student fi nancial assistance. The AUCC analysis revealed a pattern of the government playing loose with the data and apparently deliberately creating confusion in an attempt to bolster the merits of the proposal (AUCC 1994a, 7; AUCC 1994b).
Students took to the streets on 25 January, 1995 to protest against the Green Paper proposal and to call for more cash transfers to the provinces and a national system of needs-based grants. Tens of thousands of students from coast to coast brought greater public attention to a plan for PSE that was becoming harder for the federal government to defend (Montpetit 1995).
In its 6 February, 1995 report to the House of Commons on the Green Paper, the government-dominated Standing Committee on Human Resources Development steadfastly stood behind the proposal for an ICLR scheme, but relented on the all or nothing approach of the Green Paper. Instead, the Committee called for a concrete proposal for an ICLR system “developed in consultation with all stakeholders, including provinces, PSE institutions, and particularly, students”. The Committee also urged a gradual phase-in for such a system and special measures to ensure low-income students would not be adversely affected by “excessive debt”, despite the claims in the Green Paper that an ICLR would have no such negative effects (Standing Committee, 1995, pp. 82-86). Although the idea of the ICLR and the cancellation of PSE transfers died with the introduction of the CHST, ICLRs were again suggested as a
Canadian Federal Policy and Postsecondary Education64
means to deal with student fi nancing in the 2005 Ontario review of postsecondary education headed up by former Premier Bob Rae. This renewed interest in ICLRs in Ontario has sparked new discussions about the idea in the federal bureaucracy (Rae 2005).
In 2003 dollars, the average loan in 1990-91 was approximately $4,100 per student per year and increased to $5,400 per student per year in 2002-03. With respect to remissions and loans, the average per student was $1,900 in 1990-91 and $2,100 in 2002-03. For comparison, the average Canadian tuition fee for an undergraduate degree in Arts29 has increased from $1,800 in 1990-91 to $3,800 in 2002-03. Cost of living estimated in 2001-0230 can vary from $500 a year if living with parents to $8,000 if living away with dependents. Table 5 indicates the total amounts of net loans, remissions and grants and, the percentage of total assistance that is provided to students by the federal government. The percentage of total need-based student assistance funded by the federal government has increased from 42 per cent in 1990-91 to 56 per cent in 2002-03.
Chart 12 indicates the total student assistance expenditures in Canada in 2003 dollars. Up until 1994, spending by the CSLP remained stable at approximately $500 million per year. Thereafter, it fl uctuated between $600 million and $700 million a year except for 1995, 2000 and 2001 due to clearance of bad debts and change to accrual accounting. The program has stable costs despite a 50 per cent increase in client numbers because of declining interest rates and improved recovery rates on defaulted loans. The federalgovernment’s expenditure related to student assistance has increased from 39 per cent in 1990-91 to 57 per cent in 2002-03 when Canada Millennium Scholarships are included.
The 1998 federal budget was called the “education budget” because it contained several major education initiatives grouped together under the banner of the Canadian Opportunities Strategy. The strategy included measures for supporting research and graduate students, helping Canadians upgrade their skills, supporting youth employment, connecting Canadians to the Internet, managing student debt, encouraging families to save for their children’s education and providing fi nancial assistance to students through new targeted Canada Study Grants and Canada Millennium Scholarships (Department of Finance Canada, 1998b).
29 The average college tuition fee was $646 in 1990-91, $1,316 in 2002-03 and $1,443
in 2003-04. See Junor and Usher, 2004.30 Source: 2001-02 Expenditure Income Survey quoted in Junor and Usher, 2004.
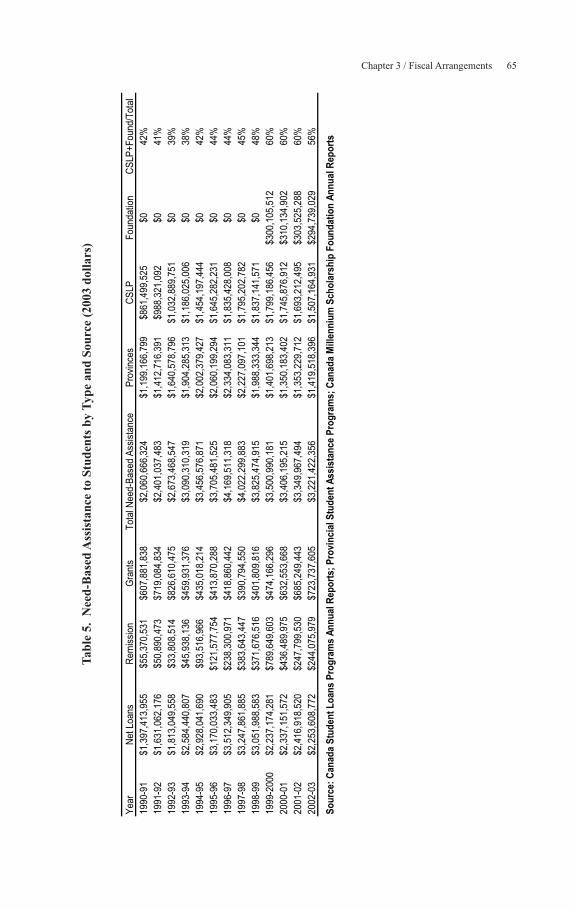
Chapter 3 / Fiscal Arrangements 65
Tab
le 5
. N
eed
-Base
d A
ssis
tan
ce t
o S
tud
ents
by T
yp
e an
d S
ou
rce
(2003 d
oll
ars
)
Yea
rN
et L
oans
Rem
issi
onG
rant
sT
otal
Nee
d-B
ased
Ass
ista
nce
Pro
vinc
esC
SLP
Fou
ndat
ion
CS
LP+
Fou
nd/T
otal
1990
-91
$1,3
97,4
13,9
55$5
5,37
0,53
1$6
07,8
81,8
38$2
,060
,666
,324
$1,1
99,1
66,7
99$8
61,4
99,5
25$0
42%
1991
-92
$1,6
31,0
62,1
76$5
0,89
0,47
3$7
19,0
84,8
34$2
,401
,037
,483
$1,4
12,7
16,3
91$9
88,3
21,0
92$0
41%
1992
-93
$1,8
13,0
49,5
58$3
3,80
8,51
4$8
26,6
10,4
75$2
,673
,468
,547
$1,6
40,5
78,7
96$1
,032
,889
,751
$039
%
1993
-94
$2,5
84,4
40,8
07$4
5,93
8,13
6$4
59,9
31,3
76$3
,090
,310
,319
$1,9
04,2
85,3
13$1
,186
,025
,006
$038
%
1994
-95
$2,9
28,0
41,6
90$9
3,51
6,96
6$4
35,0
18,2
14$3
,456
,576
,871
$2,0
02,3
79,4
27$1
,454
,197
,444
$042
%
1995
-96
$3,1
70,0
33,4
83$1
21,5
77,7
54$4
13,8
70,2
88$3
,705
,481
,525
$2,0
60,1
99,2
94$1
,645
,282
,231
$044
%
1996
-97
$3,5
12,3
49,9
05$2
38,3
00,9
71$4
18,8
60,4
42$4
,169
,511
,318
$2,3
34,0
83,3
11$1
,835
,428
,008
$044
%
1997
-98
$3,2
47,8
61,8
85$3
83,6
43,4
47$3
90,7
94,5
50$4
,022
,299
,883
$2,2
27,0
97,1
01$1
,795
,202
,782
$045
%
1998
-99
$3,0
51,9
88,5
83$3
71,6
76,5
16$4
01,8
09,8
16$3
,825
,474
,915
$1,9
88,3
33,3
44$1
,837
,141
,571
$048
%
1999
-200
0$2
,237
,174
,281
$789
,649
,603
$474
,166
,296
$3,5
00,9
90,1
81$1
,401
,698
,213
$1,7
99,1
86,4
56$3
00,1
05,5
1260
%
2000
-01
$2,3
37,1
51,5
72$4
36,4
89,9
75$6
32,5
53,6
68$3
,406
,195
,215
$1,3
50,1
83,4
02$1
,745
,876
,912
$310
,134
,902
60%
2001
-02
$2,4
16,9
18,5
20$2
47,7
99,5
30$6
85,2
49,4
43$3
,349
,967
,494
$1,3
53,2
29,7
12$1
,693
,212
,495
$303
,525
,288
60%
2002
-03
$2,2
53,6
08,7
72$2
44,0
75,9
79$7
23,7
37,6
05$3
,221
,422
,356
$1,4
19,5
18,3
96$1
,507
,164
,931
$294
,739
,029
56%
So
urc
e:
Can
ad
a S
tud
en
t L
oan
s P
rog
ram
s A
nn
ua
l R
ep
ort
s;
Pro
vin
cia
l S
tud
en
t A
ss
ista
nc
e P
rog
ram
s;
Can
ad
a M
ille
nn
ium
Sc
ho
lars
hip
Fo
un
da
tio
n A
nn
ua
l R
ep
ort
s
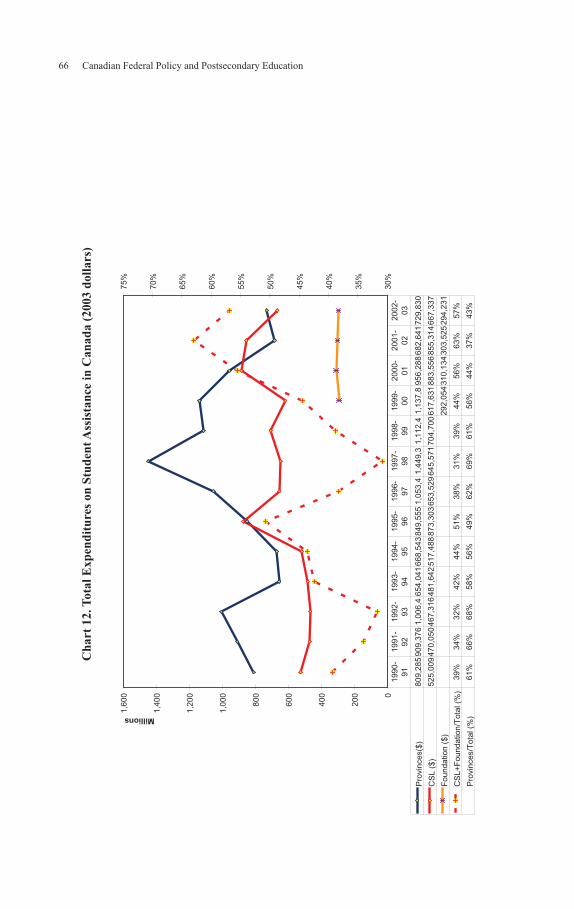
Canadian Federal Policy and Postsecondary Education66
Ch
art
12. T
ota
l E
xp
end
itu
res
on
Stu
den
t A
ssis
tan
ce i
n C
an
ad
a (
2003 d
oll
ars
)
0
200
400
600
800
1,0
00
1,2
00
1,4
00
1,6
00
Millions
30%
35%
40%
45%
50%
55%
60%
65%
70%
75%
Pro
vinces($
)809,2
85
909,3
76
1,0
06,4
654,0
41
668,5
43
849,5
55
1,0
53,4
1,4
49,3
1,1
12,4
1,1
37,8
956,2
88
682,6
41
729,8
30
CS
L (
$)
525,0
09
470,0
50
467,3
16
481,6
42
517,4
88
873,3
03
653,5
29
645,5
71
704,7
00
617,6
31
883,5
56
855,3
14
667,3
37
Foundation (
$)
292,0
54
310,1
34
303,5
25
294,2
31
CS
L+
Foundation/T
ota
l (%
)39%
34%
32%
42%
44%
51%
38%
31%
39%
44%
56%
63%
57%
Pro
vinces/T
ota
l (%
)61%
66%
68%
58%
56%
49%
62%
69%
61%
56%
44%
37%
43%
1990-
91
1991-
92
1992-
93
1993-
94
1994-
95
1995-
96
1996-
97
1997-
98
1998-
99
1999-
00
2000-
01
2001-
02
2002-
03
Chapter 3 / Fiscal Arrangements 67
3.2.3 Canada Millennium Scholarship Foundation
The centerpiece of the Canadian Opportunity Strategy was the creation of the CMSF to administer an endowment of $2.5 billion. With this money, this public foundation was charged with delivering fi nancial support to 100,000 students per year over ten years, beginning in the year 2000. The awards are available to full-time and part-time students at all types of public postsecondary institutions who demonstrate fi nancial need and exhibit academic merit. The needs-based element did not begin until 2001. The foundation provides the following awards: (1) bursaries averaging $3,000 to postsecondary education students based on fi nancial need; (2) annual millennium entrance excellence awards valued at $4,000 or $5,000, depending on the type of award, to students beginning postsecondary studies for the fi rst time who demonstrate exceptional merit; and (3) annual in-course excellence awards valued at $4,000 or $5,000, depending on the type of award, to upper year postsecondary students. The awards are to be delivered in such a way as to complement provincial systems of student fi nancial assistance (Department of Finance Canada 1998b, 20-22). Yet it should be noted the design of the program did not provide an incentive for students from poorer backgrounds to attend university because they could only gain support after they had accessed the system and been successful. By tying the awards to provincial student assistance, the program discriminated against those students who did not take out student loans, for example, many First Nations and working-poor debt-adverse students.
The proposed foundation was immediately criticized by the CFS as window-dressing on the problem of student debt and a vanity project to establish a legacy for Prime Minister Jean Chrétien. The announcement also irritated the provinces, particularly Québec, who viewed these new scholarships as an intrusion into the provincial domain. Although the foundation was able to conclude agreements with all the provinces on means to integrate the scholarships with provincial assistance programs, in some cases the agreements were made only grudgingly (CFS 2004b; Institute of Intergovernmental Relations (IIR) 2003, 28-29).
Questions were raised subsequently as to whether the foundation’s programs really increase access for low and middle income Canadians. Although some provinces reinvested the savings created from the introduction of the Millennium Scholarships directly in

Canadian Federal Policy and Postsecondary Education68
forms of student fi nancial assistance, others increased institutional funding. Given the cost pressures on institutions, it may well have been that the provinces would have increased spending in any event and that the foundation’s money actually resulted in cost savings for provincial governments (IIR 2003, 30-32, 40-46).31
This discussion inevitably led to questioning the defi nition of access. Following from the mandate provided by the federal government, access appeared to mean reducing student loan debt, which presumably both eased the cost for existing students and signaled to “debt adverse” students that the costs of PSE were manageable. While reduced student loan debts are certainly strong evidence that PSE has become more affordable, it does not follow that more people from low and middle income backgrounds will attend postsecondary institutions. Answering this question with any sort of certainty requires identifying variables that, in theory, signifi cantly affect the decision to attend college or university and then running experiments to discover if the variables are signifi cant determinants, and specifying which variables can be effectively changed to induce a positive decision to go on to PSE. This is what the foundation has set out to do (IIR 2003, 34-38, 50-52).
In 2001, the foundation launched a research program to identify gaps in knowledge, to determine what existing sources of data might lead to fi lling those gaps, and to fund new research projects where data was unavailable. In 2001 and 2002, the research concentrated on questions of costs of education, student debt levels, technical details of student fi nancial assistance programs and general questions about why students did not go on to pursue PSE. The capstone to this fi rst phase of the research program was the publication in September 2004 of The Price of Knowledge: Access and Student Finance in Canada which was a compendium of available data on student demographics, costs of education, student fi nancial resources, student fi nancial assistance programs, government expenditures on PSE, and graduate outcomes (CMSF 2001; Looker and Lowe 2001; Junor and Usher 2004).
31 Although the foundation was attacked publicly for this displacement of provincial
funds, it is by no means the only federal program to do so. The National Child Benefi t (in-
troduced in 1996) and the Canada Study Grants for students with dependents (introduced
in 1998) also displaced federal funds. In the case of the National Child Benefi t and the
foundation, apparently the displaced money was more than made up for by other provincial
investments whereas there was no provincial reinvestment arising from the Canada Study
Grants (Canada Millennium Scholarship Foundation 2003).
Chapter 3 / Fiscal Arrangements 69
In 2003, in addition to continuing on with the earlier work, the foundation’s research program began to focus on non-fi nancial determinants of postsecondary attendance such as parental attitudes, high-school counseling, literacy and the special diffi culties facing Aboriginal peoples. From this research arose three pilot projects (in British Columbia, New Brunswick and Manitoba) to test the effectiveness of different types of intervention with high school students (Cunningham, Redmond and Merisotis 2003; Canadian Career Development Foundation 2003).32
Despite the fact the foundation was carrying out research on questions that had been ignored for years due to lack of money and political will, the greatest critic of the research program was the CFS. The Federation charged that the foundation was using the program to downplay the student debt crisis and the effects of rising tuition fees, and in doing so acting as an “apologist for the federal government’s record on PSE”. The Federation further charged that the foundation downplayed its own research results indicating that many non-fi nancial barriers were indirectly related to personal or family income. The root of this dispute will not be found in the research, however, but in the use of the research (CFS 2004b).
Certainly, the foundation chose not to treat the various diffi culties in access to higher education as crises but rather encouraged a calm appraisal of the data. The foundation also reported such counter-intuitive fi ndings as an apparent correlation between rising tuition fees and rising levels of PSE participation in the 1980s and 1990s. The problem with this work was the absence of any theoretical foundation and a seeming lack of knowledge about the extensive research done in this area during the 1980s (Stager, 1989). Moreover, in hearings and presentations, the foundation did not advocate large increases in spending to increase student fi nancial assistance or to reduce tuition fees, but rather called for smarter spending. These actions no doubt offended the sensibilities of the federation and their political program for reductions in tuition fees and the establishment of a national system of grants. Rather than propping up federal government policy, or siding with the students for that matter, the foundation demonstrated through its research program that questions about access to PSE were seldom easily framed or answered. As
32 Aboriginal Peoples and PSE: What Educators Have Learned; Canada Millennium
Scholarship Foundation and British Columbia Ministry of Education, “New $5 Million
Program to Give Students a Boost,” 23 October 2003, News Release; Canada Millennium
Scholarship Foundation and New Brunswick Education, “Improving access to PSE in New
Brunswick,” 16 March 2004, News Release.

Canadian Federal Policy and Postsecondary Education70
indicated in the 2003 review of the operations of the foundation, the question is not so much “does money matter?” but rather “does money matter: when, where, to whom – and even why?” (Junor and Usher 2004, 15-17; CFS 2004b; IIR 2003, 50).
3.2.4. From Universal to Piecemeal
A common policy thread through the 1994 social policy review, the new initiatives in the 1998 “education budget” and the research conducted by CMSF, is the theme of moving from a universal student fi nancial assistance program to a collection of various programs designed to meet different needs. In particular, rather than large-scale, widely accessible assistance programs, such as the CSLP, emphasis shifted towards programs to encourage Canadians to pay their own way– through Registered Education Savings Programs and other tax measures – and to provide targeted groups with special assistance – through Canada Study Grants (CSGs) and related programs. This shift is no better illustrated than in comparing federal spending on the CMSF and the Canada Education Savings Grant.
The Canada Education Savings Grant (CESG) was established in the 1998 federal budget as a means to encourage families to save for their children’s education through Registered Education Savings Plans (RESPs). Although RESPs were fi rst established in 1972, they enjoyed limited popularity since contributions to the plan did not provide any tax relief for the contributors, and the investment income was lost if the designated child did not attend a postsecondary institution (the principal was returned, however, as non-taxable income). In many cases, fi nancial planners recommended against RESPs in favour of the fl exibility and better returns (but not as good tax treatment) of other investment tools. However, in the 1996 and 1997 federal budgets RESPs were made more attractive by increasing annual and lifetime limits, allowing transfer of the RESP to a Registered Retirement Savings Plan (RRSP), and allowing the withdrawal of money from the RESP for non-educational purposes, subject to special taxation. The CESG introduced in the 1998 budget provided an additional 20 per cent grant to top-up contributions made to a RESP to a maximum of $400 per year. If the child does not go on to PSE, however, the CESG contribution is returned to the federal government (Department of Finance Canada 1998b).
The effect of the new program was dramatic. RESP savings increased from $2.4 billion in 1997 to $11.4 billion in 2003. Total federal expenditures on the program, both through direct spending

Chapter 3 / Fiscal Arrangements 71
and forgone tax revenue, totaled $2.4 billion in the six years after it was introduced, and are projected to cost an additional $500 million in 2005 and a similar amount in each subsequent year. Even so, the fi rst phase of the RESP program was largely taken up by the middle class. In comparison, the last high-profi le, large-scale student fi nancial assistance initiative mounted by the federal government was the establishment of the CMSF, also in the 1998 budget. As noted earlier, the cost to the federal government was a one-time endowment of $2.5 billion, which with investment income amounts to about $285 million a year in scholarships over a 10-year period. Not only is this less than 60 per cent of the annual spending on RESPs, but the scholarships may well cease to exist when the endowment runs out in 2009, whereas there is no time limit on the RESP improvements (Department of Finance Canada 2004, 117; Department of Finance Canada 2003, 236). The 2004 federal budget included additional improvements both to RESPs and to the CSLP. The revisions to the RESP program focused specifi cally on low income families. In 2004-05, $105 million in new spending will go to RESP-related programs with no new spending on CSLP-related programs. In 2005-06, $165 million will go to RESP-related programs and $137 million to CSLP-related programs (Department of Finance Canada 2004, 131).
The Canada Study Grant (CSG) was introduced in the 1998 federal budget to provide grants of up to $3,000 per year through the CSLP to students in need who had children. In subsequent years, eligibility for the grants was extended to students with disabilities (up to $5,000 per year), part-time students with high fi nancial need and women in doctoral programs. This expansion of eligibility did not result in increased spending since the original annual budget of $100 million had been under-spent in each year. The expansion of eligibility was largely an effort to assist targeted groups within the set budget envelope (Department of Finance Canada 1998b, 22; Department of Finance Canada 2000, 147, 159). The 2004 federal budget added new programs to provide additional assistance to students from low income families (Canada Learning Bond), increase the value of the CESG for low and middle income families, create a new up-front grant for students with disabilities and improve provisions to assist students in repaying student loan debt (Department of Finance 2004).
The targeted approach to assistance used with the CSG and other new programs appears to be in answer to criticisms that the CSLP

Canadian Federal Policy and Postsecondary Education72
neither adequately recognized the additional expenses for some groups of students, nor provided suffi cient assistance. This approach is also evidence of the lack of desire for wholesale change to the CSLP for fear of the additional expense to government. Although the general political shift in the late 1980s and through the 1990s towards defi cit elimination, debt reduction and smaller government did not result in elimination of or reductions in the CSLP, the program stagnated at a time when student living expenses continued to rise, and tuition fees climbed by leaps and bounds. Rather than make a wholesale reinvestment in student fi nancial aid programs when it balanced its budget in 1997, the federal government took a more piecemeal approach – criticized as the “boutique” approach – to addressing student needs as evidenced by the CSG, the Canada Millennium Scholarships, and RESP enhancements.
3.2.5. Regressive Subsidies
Although this current piecemeal approach to assisting students in paying for the costs of higher education was likely taken for fi nancial and political reasons, recent research suggests there also may be sound policy reasons to do so. One of the consequences of universal social programs in a capitalist economy is that every citizen is eligible to use the programs regardless of their ability to pay. Where one socio-economic group benefi ts from a universal program to a greater extent than another group, though, such universal programs may be viewed as a disproportionate subsidy to that group. In the case of Canada’s Medicare program even though lower-income Canadians are less healthy than higher income Canadians, and therefore more likely to use universal healthcare, this disproportionate subsidy has not been viewed as unfair. In the case of PSE, a disproportionate number of students from upper income families attend postsecondary institutions (primarily universities). This situation has long given rise to charges that public funding of postsecondary institutions is an unfair subsidy for upper income Canadians (Statistics Canada 2004a; Corak, Lipps and Zhao 2003).
It appears to be a different story, however, in the case of student fi nancial assistance programs. As a means-tested, needs-based form of support, student fi nancial assistance programs exist to equalize educational opportunity ostensibly by removing, or more likely mitigating, fi nancial barriers through the provision of loans and/or some form of non-repayable assistance. It has long been assumed that the needs assessment process ensures that lower income Canadians

Chapter 3 / Fiscal Arrangements 73
are the primary benefi ciaries of such programs. Research prepared by the Educational Policy Institute reveals, however, that this holds true only as long as students are considered “dependent” on their parents. At age 22, students are considered “independent” of their parents for the purposes of Canada Student Loans, and the proportion of assistance recipients from the top income quartile jumps from 3.6 per cent for dependent status to 31.6 per cent for independent status. Since independent students also have the highest assessed need (among students with no dependents), they also receive the greatest proportion of grants and other non-repayable assistance. As a consequence, students from families in the upper half of income earners receive 58.2 per cent of grant money given to independent students, and 41.8 per cent of grant money given to students overall (Usher 2004).
Even if we accept the conclusion of the Ontario Coalition for Postsecondary Education study that upper-income families are paying their fair share of postsecondary costs through taxation, the fact that students from upper-income families are benefi ting a great deal from the current fi nancial assistance arrangements, particularly in the receipt of grants and other non-repayable assistance, is surely a perversion of the intent of the student fi nancial assistance programs (Mackenzie 2004).33
We can posit four reasons why the current policy remains intact. In the fi rst instance, the data was simply not available until recently to understand the magnitude of the regressive subsidies in student fi nancial assistance programs. Second, it is in the interest of upper-income Canadians to continue to support this subsidy to the extent it will benefi t them directly as students or parents of students. Third, it is in the interest of lower-income Canadians in the hope their children will be able to benefi t from the subsidy and the increased social and economic mobility accruing from greater education. Fourth, it is in the interest of governments to show they are directly contributing to social and economic development through education without interfering with the basic capitalist mechanisms or raising taxes.
Even if those with vested interests in the current subsidy arrangements could be persuaded of a need for change, the diffi culties
33 The coalition’s study rejects the idea that a subsidy is inherently regressive if it ben-
efi ts upper income earners and/or their families. The study then goes on to demonstrate
through taxation data that the benefi t of higher education, as measured by tax credits for
tuition fees, is more evenly distributed across income ranges than is normally thought to be
case. This is an interesting way to look at the tuition fee issue, but the methodology is not
without its problems and critics.
Canadian Federal Policy and Postsecondary Education74
in making that change may prove insurmountable. This is particularly true for middle and lower income Canadians who would be most negatively affected if any new subsidy scheme failed. The perfect example of this was the proposed shift to income contingent loan repayment (ICLR) as a mechanism for fi nancing higher education as proposed in the 1994 social policy review. Conceptually, the idea was attractive – pay for education up front by levering future earning power through loan repayments tied to future income. Such a plan had never been tried in any other jurisdiction to the extent it was being proposed for Canada, however, and there were precious few details about how the negative consequences – primarily potentially crippling debt – would be mitigated. The plan would have probably benefi ted most those middle-income Canadians with partial or no access to CSLP because of the unrealistic levels of expected parental contribution, but the prospect of carrying student debt for 20 years, even if the payments were reasonable, would have been simply too much to bear. For low-income families, the possibility of losing existing loans, grants and bursaries in order to pay for the new scheme, regardless of its potential benefi ts, was unacceptable.
Since the mid-1990s, the trend of federal fi nancing policies has been to shift from funding institutions directly to funding individuals through various programs. Apart from the CSLP and Canada Millennium Scholarship Program, the federal government has initiated a number of tax measures directed at individuals including tuition tax credit, education tax credit, tax credit for student loan interest, RESPs, and tax-free RRSP withdrawals to upgrade skills. Table 6 indicates total federal government tax expenditures in respect of postsecondary education by type. Between 1990 and 2003, there has been a signifi cant increase in the use of tax credit incentives by the federal government to encourage postsecondary education participation.

Chapter 3 / Fiscal Arrangements 75
Tab
le 6
: F
eder
al
Gover
nm
ent
Tax E
xp
end
itu
res
Rel
ate
d t
o P
ost
seco
nd
ary
Ed
uca
tion
1
19
90
19
91
19
92
19
93
19
94
19
95
19
96
19
97
19
98
19
99
20
00
20
01
20
02
20
03
Educa
tion C
redit
$4
3$
42
$5
4$
52
$5
1$
52
$6
3$
88
$1
35
$1
43
$1
34
$2
31
$2
39
$2
55
Tuit
ion F
ee C
redit
18
81
86
18
92
10
22
22
29
24
22
73
29
33
25
31
62
68
26
52
75
Tra
nsf
er o
f E
duca
tio
n/T
uit
ion C
redit
s1
49
16
12
01
22
82
45
25
23
00
34
13
77
36
43
59
46
74
69
48
5
Stu
den
t L
oan
Inte
rest
Cre
dit
00
00
00
00
52
65
64
64
63
62
Exem
pti
on o
f S
chola
rship
Inco
me
12
10
12
87
77
67
730
25
25
25
Car
ry-f
orw
ard
00
00
00
00
1182
156
278
346
405
Tax
-fre
e R
ES
P s
tatu
s0
00
00
040
36
34
44
86
82
107
130
Tota
l3
92
39
94
56
49
85
25
54
06
52
74
49
09
1,0
30
1,1
45
1,4
15
1,5
14
1,6
37
So
urc
e: G
ov
ern
men
t of
Can
ada’
s D
epar
tmen
t of
Fin
ance
Tax
Expen
dit
ure
s an
d E
val
uat
ions
2002
1
E
xtr
acte
d f
rom
Ju
no
r &
Ush
er, 2
00
4.

Canadian Federal Policy and Postsecondary Education76
Chapter 4 / Economic Development and the National Interest 77
Chapter 4
Economic Development and the National Interest
4.1. Research and Development
The humanities and social sciences remained part of the mandate of the Canada Council until 1977 when parliament adopted the Social Sciences and Humanities Research Council Act establishing a separate body for those activities, leaving the CC responsible for the arts alone (Canada Council 2004a, Doutriaux and Barker 1995, 29).
At the same time, parliament also adopted the Natural Sciences and Engineering Research Council Act, which removed funding of university-based research from the mandate of the NRC, leaving the NRC with the primary role of conducting research. The purpose of the new NSERC was:
... to encourage excellence in research; provide a base of advanced knowledge in the universities; assist in the selective concentration of research activities; aim for a regional balance in scientifi c capability; maintain a basic capacity for research training; encourage curiosity-oriented research; and encourage research with a potential contribution to national objectives. ... these objectives are intended ... to ensure long-term coherence in the federal system of university research granting (comments from the Honourable Hugh Faulkner, then Minister of State for Science and Technology 13 December, 1976, as quoted in NSERC 2004).
On 1 May, 1978 SSHRC and NSERC began operations as new, independent agencies. As noted earlier, this meant that along with the MRC, the federal government was now funding all research disciplines represented in Canadian universities.
During the Progressive Conservative reign, 1984-93, federal policy refl ected a neo-liberal ideology with an emphasis on shrinking the Keynesian welfare state and freeing the market. Privatization across most OECD countries meant the transfer of costs and responsibility from the public or state sector to the private by selling off Crown corporations to private investors and shifting from taxation to a voluntary, user- pay approach to public services

Canadian Federal Policy and Postsecondary Education78
(Stanbury 1989, p. 274). The need to become more “competitive” became the basis for the Progressive Conservative party’s economic and social policy (Abele 1992).
An enduring initiative in the attempt to soften the boundary separating industry and universities was the Industrial Research Assistance Program (IRAP). Launched in the 1960s, IRAP was one of the fi rst federal attempts to sponsor a collaborative R and D culture. However, most collaborative networks began during the high tide of neo-liberalism that marked the policy climate of the 1980s. During this time, according to Niosi (1995, 34-35), provincial and federal governments launched over one hundred new inter-sectoral research collaborations.
At the federal level, the Department of Regional Industrial Expansion merged with the Department of Science and Technology in 1984 to form Industry, Science, and Technology Canada (ISTC; subsequently Industry Canada). The new department emphasized industrial partnerships and collaborations. Both NSERC and MRC have actively supported collaborative targeted research carried out through academy-industry-state partnerships. The opportunities for SSHRC have been less pronounced. NSERC started to fund “big science” networks in the early 1980s – in the earth sciences (Lithoprobe) and integrated circuit design (Canadian Microelectronics Corporation). During 1987-88, the budget year prior to the establishment of the Networks of Centres of Excellence Program (NCE), 15 per cent of NSERC’s total budget went to targeted research (Friedman and Friedman 1990).
With the election of the Mulroney government and the consequent shift to the “new right”, the autonomy of the three national research funding councils became more tenuous. The new administration wanted to develop Canada’s science, technology and human resources in support of international competitiveness. The government hosted a Forum on Science Policy in 1986. That same year, the government launched a matching funds policy for the granting councils and an accompanying fi ve-year fi nancial plan. The plan made it clear that the councils were to work in partnership with the private sector in efforts to increase the level of university-industry collaborative activities.34 The federal and provincial governments announced the broad outlines of Canada’s fi rst formal science policy in December 1986; these were formalized in March
34 These goals were part of the ideologically driven reform (“new public management”)
of public sector institutions in OECD countries generally at this time.

Chapter 4 / Economic Development and the National Interest 79
1987 as part of the InnovAction strategy (Government of Canada 1987).
Even though the federal government has had a long-standing interest in university-industry collaborations, the national research granting councils had no strong mandate to pursue such collaborations until the introduction of Matching Policy program. The program provided $369.2 million in new funding to the research granting councils over four years in exchange for obtaining matching funding from the private sector (Doutriaux and Barker 1995, 30-31). The new money was welcomed by the research community, but this good news was tempered by the fact the federal government had frozen the base funding for the granting councils. Although the government denied this was a freeze – preferring to call it a funding “fl oor” – it was clearly the government’s intention to tie future growth in research funding to private sector involvement (Savage 1987). Even a sub-committee of the government’s hand-picked National Advisory Board on Science and Technology (NABST) called the Matching Policy program “a clever way to camoufl age a decision to constrain the growth of government funding to the granting councils” (as quoted in “Planning and Direction” 1989). Established in 1987 by the Mulroney administration to advise the prime minister on national science and technology goals, the NABST consisted of 20 members representing university, industry, labour and government interests.
Ongoing criticism from the research community and evaluations of the program made it clear the Matching Policy program was an awkward policy instrument (Doutriaux and Barker 1995, 30-31). The program was discontinued in 1990-91 and the funds were rolled into the base budgets of the granting councils. This did not mean, though, that the Conservative government had given up on bringing industry and the universities closer together.
The next step in redefi ning the state’s relationship to PSE came in late 1987. This forum was an attempt by the federal government to more clearly defi ne its role in PSE policy. Some 600 delegates, representing a cross-section of Canadian society holding a stake in the future of the country’s universities and colleges, met at the National Forum on Postsecondary Education in Saskatoon, an event co-sponsored by the federal and provincial governments (National Forum 1987, 5).35 Delegates raised the idea of centres of excellence
35 Invitations were sent to representatives from universities and colleges (30 per cent),
employers and users of research (25 per cent), labour and employee organizations (10 per
cent), federal and provincial governments (15 per cent), non-government organizations and

Canadian Federal Policy and Postsecondary Education80
that would emphasize inter-disciplinarity and involve networks of researchers representing several institutions across Canada. In 1988, the Science Council of Canada advised that prosperity depended on integrating the university with the marketplace (Science Council of Canada, 1988).36 Reinforcing this theme NABST argued that Canadian universities did not adequately exploit intellectual property, and recommended that “greater emphasis be given to funding generic pre-competitive research collaboration by university-industry in research consortia” (NABST 1988, 76). This complex of initiatives and recommendations helped to “backfi ll” the January 1988 decision to launch networks of centres of excellence partnered with industry. In the same year, the government hosted a National Conference on Innovation and Technology.
Following re-election in November 1988, the Conservative government renewed their efforts to construct on overall federal science policy. Building on the 1987 “InnovAction” strategy, the federal government announced in 1989, the NCE (Offi ce of the Auditor General of Canada 1994; Doutriaux and Barker 1995, 37-38).37 The purpose of this program was to create national research networks involving universities, federal and provincial governments, and the private sector to conduct applied research, to train scientists and engineers and to speed up the diffusion of new knowledge to industry. Unlike the Matching Policy program, the NCE program was directly funded and did not require private sector funding (Doutriaux and Barker 1995, 38). The NCE – the forging of a national research capacity under direct federal control – constituted a federal incursion on provincial powers over universities. The NCE offered a major challenge to traditional conceptions of academic autonomy and the public nature of knowledge.
The creation of the NCE in 1989 was arguably the most dramatic change in the nation’s science policy since the National Research Council was established in 1916. This policy innovation emerged in the context of the ideological dominance of the market. As the social contract (Guston and Keniston 1994) between science and society was rewritten around economistic goals, universities and their
special interest groups (Aboriginal groups, visible minorities, student groups, etc.) (15 per
cent), and the general public (5 per cent).36 The Science Council of Canada, established in 1966 to provide independent advice on
the formulation and implementation of federal science policy, was abolished in 1992 as part of
a massive restructuring of the country’s R and D system.37 This section relies heavily on two articles, Fisher, Atkinson-Grosjean and House
(2001) and Atkinson-Grosjean, House and Fisher (2001).

Chapter 4 / Economic Development and the National Interest 81
research programs were discursively repositioned as components of the national system of innovation. The internal normative structure of the “Republic of Science” (Polanyi 2000) responded, adapting to government’s explicit attempts to close the gap between academy and industry and make science more commercial.
The model chosen for the NCE program was non-governmental – the Canadian Institute for Advanced Research (CIAR).38 The CIAR was designed as a “university without walls”, linking researchers across the country in virtual networks. Corporate donations were accepted along with public funding, but neither drove the research program. The conversion of the CIAR’s model of basic-science networks into the NCE model of strategic-science networks was a response to two factors. First, in 1986, came Ontario Centres of Excellence (OCE) program. The concern arose that the province could become a vortex, attracting the best scientists from across the country. Key scientists and policy makers lobbied the federal government to set up a national program. Ottawa was receptive, viewing Ontario’s OCEs as a possible threat to regional balance. Second was the economic situation that did not allow for the creation of new fi xed OCE type centres.
Throughout the summer and fall of 1987, the federal bureaucracy was awash in rumours that a major shake-up in research funding was being planned. On 13 January, 1988, the prime minister confi rmed the rumours, announcing his intention “to establish networks of researchers and scientists across the country to conduct world-class research in areas crucial to Canada’s long-term competitiveness”.39
The networks were to be part of the wide-ranging science and technology initiatives proposed under the new InnovAction policy. The prime minister’s announcement came “out of the blue and without any consultation”.40 Specifi cally, the three granting councils responsible for university research were not consulted (Pullen 1990).
In 1990, 15 different networks – 13 administered by universities and two by industry – were awarded a total of $240 million over four years (Doutriaux and Barker 1995, 38). The initial group of networks included applied research in fi elds ranging from ageing to telecommunications, space research, tele-learning, pest management,
38 CIAR was created in 1982 by Fraser Mustard, a distinguished medical scientist and
policy actor. Prior to the NCE, this model was utilized by the Ontario Centres of Excellence
program.39 Brian Mulroney, cited in ARA Consulting Group Inc., (n.p., January 1997), 9.40 Program Offi cer, 2 October 1999, p. 2 (Fisher, Atkinson-Grosjean and House 2001).

Canadian Federal Policy and Postsecondary Education82
and concrete technology, but not the single social science NCE (Networks of Centres of Excellence 2004a).
By 1992, the networks included 35 universities, 66 federal and provincial government bodies, 800 researchers, 1300 graduate students, 415 post-doctoral fellows and 173 companies. The networks produced good quality research and were successful in training the next generation of scientists and engineers. Although the university-industry linkages had improved, the networks still fell short of government’s desires for knowledge transfer to the private sector. A 1993 consultant’s report found that even though 13 of the networks had the potential to generate signifi cant economic benefi ts, only 6 of the networks had signifi cant potential to result in the private sector bringing a new product or process to market or to increase industrial effi ciency. This report would set the next stage of development for the NCE program (Doutriaux and Barker 1995, 38-39).
This emphasis on private sector application of university-based research was reinforced in other policy arenas. In the fall of 1991, the Conservative government launched the Prosperity Initiative with two discussion papers: Learning Well…Living Well and Prosperity Through Competitiveness, dealing with formal and life-long learning and with the regulatory and policy environment respectively. These papers were the basis of a consultation process led by the Steering Group on Prosperity, an independent twenty-member panel charged with listening to Canadians and then producing an action plan to secure Canada’s economic and social well-being through the 1990s (Prosperity Secretariat 1991a, 1991b; Steering Group on Prosperity 1992).
A signifi cant portion of Prosperity through Competitivenesswas devoted to matters of science and technology, but rather than discussing support for university-based research or the mechanisms to induce the private sector to improve its own research capacity, this part of the paper discussed the shortcomings in knowledge transfer to the private sector and the need to make government expenditures on research more effective. (Prosperity Secretariat 1991b, 13-18). In their response (Inventing our Future: An Action Plan for Canada’s Prosperity), the Steering Group on Prosperity recommended additional government-subsidized support mechanisms for industry, to introduce management of technology courses at the secondary and postsecondary level, to move students and professors off the campuses and into the workplace, to allow additional tax write-offs for capital equipment, to strengthen protection of intellectual property

Chapter 4 / Economic Development and the National Interest 83
and to build a high-speed “information highway” (Steering Group on Prosperity 1992, 18-21). Clearly, the creation of knowledge was to take a back seat to the commercial exploitation of knowledge.
A symbol of the Conservative government’s shift away from funding research for its intrinsic worth came with the introduction of Bill C-93 in November 1992. The purpose of this legislation was to reorganize certain government agencies for the ostensible purpose of saving administrative costs. Included in this enabling legislation was a proposal to dismantle SSHRC and transfer its programs to the Canada Council, undoing the division that had been made in 1978. The move was condemned by all the major organizations in the Canadian academic community. During the February 1993 hearings on the legislation, federal government offi cials estimated that the merger would result in savings of $1.5 million annually, but by the time the legislation had passed through parliament in April this estimate had more than tripled to $5 million, a claim doubted by the academic community (CAUT 1993). A fi nal lobbying effort aimed at members of the Senate resulted in a group of fi ve conservative senators voting against their own party and another three conservative senators abstaining from the vote, causing the defeat of the bill on 10 June, 1993 (Winsor 1993). The bill was not reintroduced before Canadians went to the polls on 25 October, 1993.
Government support for higher education and for academic-initiated research has declined during the 1990s. According to Cameron (1991), a climate of restraint had already begun to characterize the relationship between government and universities by the late 1980s. The social demand that once directed the growth of the higher education system gradually gave way to a new, economically driven imperative that placed importance on highly developed human capital, science and technology to support Canada’s needs for economic restructuring and greater international competitiveness. This economic imperative has been amplifi ed by severe limitations on public expenditures and the emergence of an accountability movement based on a suspicion of public institutions and a belief in the greater effi ciency of free market forces. Further, the federal government decided in 1995 to cut 14 per cent over 3 years from SSHRC and NSERC. Provincial governments too, facing their own debt crises, continue to look for ways to reduce uncondi tional grants to universities.

Canadian Federal Policy and Postsecondary Education84
In the lead-up to the October 1993 general election, the opposition Liberal Party released a comprehensive election platform entitled Creating Opportunity: The Liberal Plan for Canada. This document, popularly known as the “Red Book,” emphasized employment and economic growth and prescribed closer ties between the education sector and the private sector through targeted job training and increased knowledge transfer – promises consistent with the policy initiatives of the previous nine years (Liberal Party of Canada 1993).
This consistency of approach between the Conservatives and the Liberals was no better illustrated than by the implementation of Phase II of the NCE. In 1994, a budget of $197 million was provided over the next four years for new and renewed networks. Phase II implemented policy changes recommended during the term of the previous government and in doing so more narrowly focused the program on the research needs of the private sector and the transfer of knowledge to serve commercial purposes (Doutriaux and Barker 1995, 38-40). As a consequence, fi ve research networks (ageing, space research, chemical physics, pest management, and fi sh and seafood production) did not have their funding renewed. In their place, four new networks (application of health evidence, tele-learning, sustainable forest management, and intelligent sensing) received funding (Networks of Centres of Excellence 2004a, 2004b). In total, the ten existing networks received $142 million over four years, and the four new networks received $48 million over the same period (Doutriaux and Barker 1995, 40).
The Liberal government deepened the instrumental emphasis in science policy. Reducing the defi cit was paramount. Programs were cut. Those remaining had to return “value for money” or contribute to wealth creation. The Department of Industry, Science, and Technology, Canada was reorganized almost immediately. By renaming the new department simply Industry Canada, the new government signaled that science was in the service of the economy. Industry Canada assumed an enlarged portfolio and a mandate to foster Canada’s competitiveness.
In 1994, the Liberal government embarked on a major review and consultation on science policy. The review process began with the release of a Discussion Paper, Building a Federal Science and Technology Strategy, in June 1994. This was followed in the Fall with the release of two more discussion papers (A New Framework for Economic Policy and Building a More Innovative Economy).

Chapter 4 / Economic Development and the National Interest 85
These papers launched the government’s “Agenda: Jobs and Growth” process. Both of the latter papers focused on innovation and science and technology policy (Wolfe 2002, 5). The fi nal step leading to the new policy was the release in April 1995 of the NABST report, Healthy, Wealthy and Wise: A Framework for an Integrated Federal Science and Technology Policy. The new science and technology policy (Science and Technology for the New Century: A Federal Strategy) was announced in March 1996 (Industry Canada 1996). The government’s “national systems of innovation” approach (Nelson 1996) integrated academy, industry and government research under the rubric of job creation and economic growth. In 1996, the NABST was replaced with the Advisory Council on Science and Technology (ACST), a body of twelve experts representing industry and the scientifi c community. Even so, a continued focus on defi cit reduction produced budget cuts for the research councils and reduced general funding for science and technology initiatives.
Overturning a fragmented science-policy history, both the Conservative and Liberal administrations crafted a climate of commercialization by applying a multitude of mutually reinforcing policy instruments. Available data indicate their efforts to drive science to the market have been successful. Industrial support of university research appears to be advancing more rapidly in Canada than elsewhere. Table 7 shows that while the proportion of industry funding for university research has increased in all G7 countries from 1985 to 1996, Canada’s share in 1996 was signifi cantly higher than other G7 nations. By 2002-03, non-governmental grants and contracts with business organizations accounted for 11.6 per cent of sponsored research in Canadian universities (CAUT 2005, Table 7.5, 45). However, the Canadian business sector remains a low performer, suggesting Canada’s industries continue to rely on publicly supported research rather than develop their own infrastructure. The federal government has promoted this tendency by providing the most favourable tax regime for investment in public R and D of any country among the G7.
The NCE is one of the fl agship initiatives in a federal policy framework promoting the commercialization of academic science and academy/industry partnerships. Since 1989, the NCE has established a system of national networks – “research institutes without walls” – to target and develop commercial opportunities, and transfer them to the private sector for exploitation. The emphasis is on translating university research results into marketable technologies as quickly

Canadian Federal Policy and Postsecondary Education86
as possible, in order to enhance Canada’s competitiveness in a global “knowledge-based economy”.
Table 7. Share of University Research Funded by Industry (%) in 1996,
1990, and 1985
1996 1990 1985
Canada 10.4 6.3 4.3
United States 5.8 4.7 3.8
Japan 2.4 2.3 1.5
France 3.3 4.9 1.9
Germany 7.9 7.8 5.9
Italy 4.7 2.4 1.5
United Kingdom 6.2 7.6 5.2
Source: OECD 1998, 165.
The NCE is an ideological policy instrument. The ideological goals have never been hidden: the purpose is to change the research culture itself. Program documents convey a sense that the country can no longer afford researchers who isolate themselves in the academy, pursuing esoteric problems at public expense. Instead, academic researchers must be enlisted in the “national system of innovation” and encouraged to apply their talents to more immediate ends. “The thrust of the NCE programme is to ensure that knowledge is transferred from the generators to the users and applied to benefi t the lives of Canadians” (NCE 1996-97). From the beginning of the NCE there was tension between the world of “policy”, represented by government, and the world of “science”, represented by researchers and research council offi cers. Industry Canada pressed for an emphasis on utility and application while the granting council presidents and the appointed scientists held onto basic science and knowledge for its own sake. Industry Canada wanted to privilege capital and private ownership while the granting councils wanted to privilege academic freedom, believing this would serve the “public good”. In the fi rst phase, the “basic” conception prevailed as the councils captured the program and instituted peer reviews. The process was transparent and scientifi c excellence the essential criterion. The defi nition of science was traditional and thus favoured the natural and medical sciences. Social science applications were judged to be inferior.
By the second phase, however, the political climate had changed and with it the research climate. Programs were being cut to reduce the defi cit. Public sector reform was in the air. No matter

Chapter 4 / Economic Development and the National Interest 87
how excellent the science, the NCE could no longer be justifi ed as a funding source for fundamental research. Industry Canada insisted on the reinstatement of a demonstrated commitment to “value-added” commercial relevance. Thus scientifi c excellence was brought down to the same weight as the other selection criteria. Furthermore, the culture of the NCE was changing through both the second and third phase. Government was successful in pushing the networks to appoint managers, place industrialists on their boards and, importantly, become corporate entities.
The NCE program was designed to change the traditional ethos of academic science, and network science was to be a means whereby a small economy could afford “big science”. Through the program, it was hoped that: (1) people of multiple disciplinary and institutional backgrounds would come together to resolve research problems; (2) research would be “managed” in the sense that research committees would steer scientifi c direction and terminate dead ends, while professional managers would pursue commercial opportunities; and (3) networks would be able to leverage their intellectual capital by gaining access to their partners’ social, human and economic capital. Network science thus offered the potential for a scale and scope of investigation on an order of magnitude larger than that currently available from single researchers and small groups.
Policy makers gambled that networks would appeal to scientists in part because of the elitist discourse that underpins these policies, but also because the idea of the “invisible college” has been part of the lore of science for the last three centuries. In this sense we can see a convergence of interests across government, research administrators and scientists. The boundaries between academy/industry, science/policy and basic/applied are likely more permeable because of NCE. The level of interdisciplinary and the internalization of network and commercial culture have also been furthered through this policy. Government has played a key role in redirecting the culture of Canada’s universities towards commercially oriented network science.
Yet the changes provide differential benefi t. As more external resources are directed towards elite research programs in the natural and medical sciences, more of the internal resources have to be diverted to support them. Universities and hospitals carry a large, and largely unacknowledged, proportion of the costs of the program, subsidizing the bulk of the indirect and infrastructure costs, as well as the direct costs of researchers’ salaries and benefi ts. 41
41 Nominally 10 per cent of a researcher’s time is spent on network activities but it is
Canadian Federal Policy and Postsecondary Education88
In effect, the universities and hospitals supplied the essential incubation facilities in which the networks could fl ourish. If the NCE program conveys an overall impression of fi scal prudence, it is largely because of its ability to distribute the costs of research across space and sector. The program covers only part of the direct costs of research, amounting to $2-$4 million per network each year. Industry makes only nominal contributions, despite program claims to the contrary. Other federal and provincial government agencies, tax-sheltered disease foundations, and other non-profi t organizations underwrite a substantial portion. When all the public contributions are calculated, 42 it becomes clear that the NCE is built upon state investment.
The NCE is a key example of the commercialization agenda. After coming under threat of cancellation in the mid-1990s, it was made permanent in 1997, and is now a central element in the nation’s science and technology policy. By the end of the 2000-01 fi scal year, a total of 29 networks had been funded in areas deemed strategically important to Canada’s prosperity and international competitiveness.43
Collaboration, partnership and excellence are key words in the lexicon of this effort to “stimulate leading-edge fundamental and long-term applied research of importance to Canada” (NSERC 1992). What makes this effort unique in Canadian policy history is the explicit attempt to alter the culture of science and manage research.
Just prior to the election of the Chrétien Liberals to a second term in June 1997, the government announced what was the beginning of a series of major investments in the infrastructure of R and D and, as a consequence, in universities. Restraint polices
often considerably more, due to board, committee, and leadership commitments.42 For an examination of the relative proportions of public and private funding in the
NCE program, see Janet Atkinson-Grosjean, “Excellence, Networks, and the Pursuit of
Profi t: Academic Science and Public Policy in Canada”, conference paper presented at the
Society for the Social Studies of Science (San Diego, CA. 1999).43 In 2001, 18 networks were pursuing research on arthritis, aquaculture, stroke, bacte-
rial diseases, genetic diseases, protein engineering, vaccines, telecommunications, geomat-
ics, health evidence systems, robotics, structural sensing systems, mathematics of complex
systems, wood-pulps, microelectronics, sustainable forest management, distance learning,
and photonics. In March 2001, after a year-long targeted competition, four new networks
were announced in stem cell genomics, childhood literacy, “clean water”, and advanced
automotive engineering. Earlier networks, which lost funding at some stage of the renewal
cycle, studied neuroscience, respiratory disease, concrete, ageing, molecular facial dynam-
ics, fi sheries, space science, and pest control in agriculture. The ageing network chose not
to apply for renewal for reasons related to the status of the social sciences in the early years of
the NCE program.

Chapter 4 / Economic Development and the National Interest 89
aimed at eliminating the defi cit were gradually giving way to new investments as the performance of the economy improved. In April 1997, the Canadian Foundation for Innovation (CFI) was established under Bill C-93 to fund research infrastructure through partnerships with private and voluntary sectors, and provincial governments, was aimed at universities, colleges, hospitals and other not-for-profi t institutions involved in science and technology development and targeted health, environment science and engineering needs in Canada. From the outset the CFI was charged with investing all the allocated funds not just the income from the endowment.
CFI followed in the footsteps of the CMSF as a public foundation. These two ventures mark the beginning of a new type of policy instrument that has been used extensively by the federal Liberals since this time. CFI is not subject to the scrutiny of parliament and hence effectively buffered from changes in government and government policy. The initial endowment of $800.1 million was boosted in 1998 with a transfer of $200 million, then again in 1999 with an additional $900 million. In February 2001, after the Chrétien Liberals were returned for a third term in the late fall of 2000, the CFI endowment was again boosted with a transfer of $1.25 billion. Between 1997-98 and 2003-04, the federal government invested a total of $3.59 billion in CFI, a total that includes both grants and operating expenditures (see Appendix 3). Between June 1998 and November 2005, CFI had distributed a total of $2.248 billion (Table 8). Health accounted for the largest proportion at 42.1 percent ($946.3 million), followed by Science at 29.2 percent ($656.1 million), Engineering at 22.5 percent ($505.4 million), and, Environment at 6.2 percent ($140.2 Million). The funding in the Humanities and Social Sciences is part of the Science entry and as one might expect accounts for a very small percentage of this category. The CFI ran its last scheduled competition in September 2005.
In June 1998, CFI established a College Research Development Fund. The most signifi cant change of policy came in 1999, when the then president changed the guidelines to make infrastructure projects in the social sciences and humanities eligible for CFI funding. The original intention was to clearly limit the funding to the natural, applied and health sciences. The next signifi cant change in the operation of the CFI came in 2000 when the Liberal government created the Canada Research Chairs program (CRC). This program was funded and administered through the granting councils and CIHR with infrastructure funds coming from CFI.
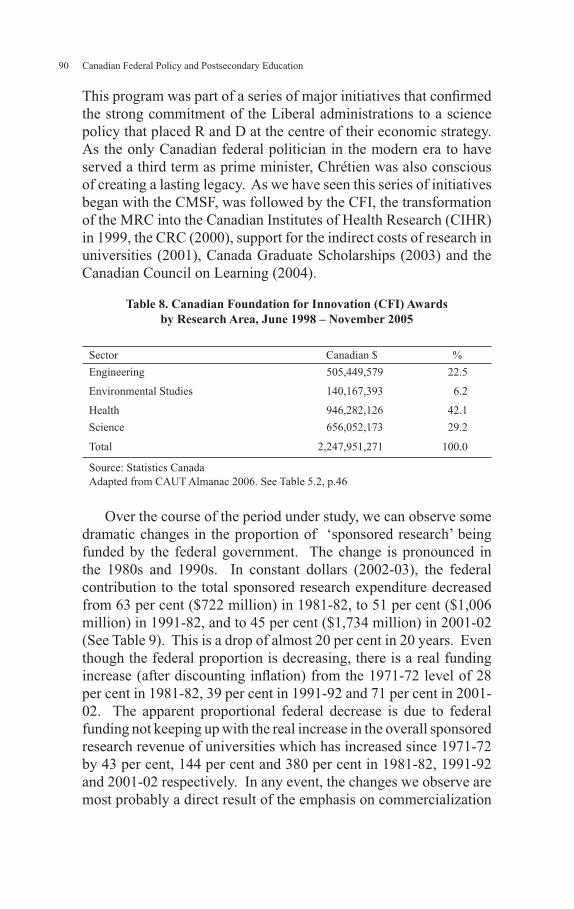
Canadian Federal Policy and Postsecondary Education90
This program was part of a series of major initiatives that confi rmed the strong commitment of the Liberal administrations to a science policy that placed R and D at the centre of their economic strategy. As the only Canadian federal politician in the modern era to have served a third term as prime minister, Chrétien was also conscious of creating a lasting legacy. As we have seen this series of initiatives began with the CMSF, was followed by the CFI, the transformation of the MRC into the Canadian Institutes of Health Research (CIHR) in 1999, the CRC (2000), support for the indirect costs of research in universities (2001), Canada Graduate Scholarships (2003) and the Canadian Council on Learning (2004).
Table 8. Canadian Foundation for Innovation (CFI) Awards
by Research Area, June 1998 – November 2005
Sector Canadian $ %
Engineering 505,449,579 22.5
Environmental Studies 140,167,393 6.2
Health 946,282,126 42.1
Science 656,052,173 29.2
Total 2,247,951,271 100.0
Source: Statistics Canada
Adapted from CAUT Almanac 2006. See Table 5.2, p.46
Over the course of the period under study, we can observe some dramatic changes in the proportion of ‘sponsored research’ being funded by the federal government. The change is pronounced in the 1980s and 1990s. In constant dollars (2002-03), the federal contribution to the total sponsored research expenditure decreased from 63 per cent ($722 million) in 1981-82, to 51 per cent ($1,006 million) in 1991-82, and to 45 per cent ($1,734 million) in 2001-02 (See Table 9). This is a drop of almost 20 per cent in 20 years. Even though the federal proportion is decreasing, there is a real funding increase (after discounting infl ation) from the 1971-72 level of 28 per cent in 1981-82, 39 per cent in 1991-92 and 71 per cent in 2001-02. The apparent proportional federal decrease is due to federal funding not keeping up with the real increase in the overall sponsored research revenue of universities which has increased since 1971-72 by 43 per cent, 144 per cent and 380 per cent in 1981-82, 1991-92 and 2001-02 respectively. In any event, the changes we observe are most probably a direct result of the emphasis on commercialization

Chapter 4 / Economic Development and the National Interest 91
in the science policy pursued by successive Conservative and Liberal governments.
The federal Liberals have since 1997-98 embarked on the task of fundamentally reforming the federal/provincial relationship with regard to PSE. For the most part, the initiative was taken in a unilateral manner at the federal level. The overall strategy is housed in federal science and technology policy and more generally the emergence of the global knowledge economy.
The CFI initiative was a creative way to lever money from provincial jurisdictions with conditional grants. CFI provided only 40 per cent of the total for each project. Matching funds had to be raised from provincial or private sources. In this way, CFI funds have levered more than $9 billion in total expenditures. This remarkable venture is slated to last until 2010, although the current endowment was all committed by the end of 2005. The CFI was a response to the under-funding of research infrastructure in Canadian universities. This program in conjunction with the NCE more than any other venture confi rmed the pre-eminence of the federal government in the area of university research. The emphasis on public/private partnerships in the natural, applied and health sciences confi rmed the federal commitment to an applied agenda.
Table 9: Federal Contributions to Total Sponsored Research Expenditures
in Canadian Universities, 1971-72 to 2001-02
Current dollars
Year Federal source Sponsored Research Total Per cent
1971/72 118,333,000 168,028,000 70%
1981/82 357,563,000 569,755,000 63%
1991/92 833,070,000 1,622,420,000 51%
2001/02 1,686,420,000 3,770,529,000 45%
Constant 2002/03 dollars
Year Federal source Sponsored Research Total Per cent
1971/72 565,527,189 803,025,382 70%
1981/82 722,410,815 1,151,117,912 63%
1991/92 1,006,450,051 1,960,081,015 51%
2001/02 1,724,089,175 3,854,750,438 45%
Source: CAUBO. Income by Fund and by Type. All Universities. Various Years
Atlantic Canada with its relatively weak private sector faced a special problem when it came to accessing CFI funding. As a means of overcoming this problem, the federal government created the Atlantic Innovation Fund (AIF) in 2001, placing it within the Atlantic Canada Opportunities Agency. This policy instrument has been used to provide an additional $300 million per year to fund

Canadian Federal Policy and Postsecondary Education92
infrastructure, primarily in the universities. AIF is a clear example of federal funds being used to compensate for weakness in the private sector.
Federal funding patterns for the national granting councils and more recently for the CIHR clearly illustrate the commitment by successive governments since the late 1980s to providing a disproportionate level of support to the natural, applied and health sciences. The commitment to knowledge production in these disciplines is based on the premise that this is not only good politics but in a knowledge society, universities should become sites for making a profi t. Intellectual property will contribute to our national economy and thereby increase our competitiveness on world markets. Between 1988-89 and 2003-04, federal spending on the four councils (SSHRC, NSERC, Canada Council and MRC/CIHR) in current dollars increased from $720.5 million to $1.742 billion (Chart 13 and Appendix 4). In 1988 constant dollars, the amount increased over the same time period from $720.5 million to $1.21 billion (Chart 14 and Appendix 4). In both Charts 13 and 14, we can observe the dip in funding during the restraint years of the middle 1990s, and then increases beginning in 1997-98. The most dramatic change occurs for MRC at the point it is transformed into the CIHR. The transformation of MRC into the CIHR was announced in the 1999 budget and then confi rmed in legislation the following year. The president of the MRC, Alan Bernstein, had lobbied on behalf of the health sciences. He was able to convince the government that a restructuring of the MRC into a series of thematic research institutes was worthy of a substantial increase in funding. Thirteen distinct institutes were created, each one targeted to particular health problems facing Canadians. The promise was the production of practical and useful knowledge. Between 1999-00 and 2003-04, the yearly funding for MRC/CIHR in 1988 dollars increased from $238 million to $474 million, an increase of approximately 100 per cent. During the same time period, the comparable increases to NSERC and SSHRC were much less at 18.25 per cent and 34.38 per cent respectively (See Appendix 4).
Federal funding for SSHRC in current dollars increased from $75 million in 1988-89 to $186 million in 2003-04. Over the same time period, the increase in 1988 constant dollars was from $75 million to $129 million, or 72 per cent. Federal funding for NSERC in current dollars increased from $364 million in 1988-89 to $719 million in 2003-04. Over the same time period, the increase in 1988 constant

Chapter 4 / Economic Development and the National Interest 93
dollars was from $364 million to $499 million or 37 per cent (See Charts 13 and 14 and Appendix 4). The higher rate of increase for SSHRC was in part due to the lower starting point but was also a result of intensive lobbying on the part of the president of SSHRC, Marc Renaud, as well as the community of academic researchers in the humanities and social sciences.
The latter have since 1996 been represented by one body, the Canadian Federation for the Humanities and Social Sciences (CFHSS). While the Council was able to maintain the focus on basic, researcher-driven funding, it also mounted signifi cant new strategic programs, like the Initiative on the New Economy, the Major Collaborative Research Initiatives, and the Community University Research Alliances.
Federal funding is focused more on natural sciences and engineering than on social sciences and humanities. When we examine the increases to both SSHRC and NSERC between 1978 and 2004 we can see that they are very similar (Charts 15 and 16; and Appendix 6), yet the starting point for NSERC in 1978 was fi ve times higher that the funding level for SSHRC.
The overwhelming emphasis in federal research funding as a whole was upon the natural, applied and health sciences. Between 1998-99 and 2004-05, the federal government added a total of $9.13 billion in new research funding. Of this total only $1.02 billion or 11.2 per cent funded research in the humanities and social sciences (Chart 17).
In 1999, the federal government announced the CRC program in the Speech from the Throne. A one-time investment of $900 million was set aside to fund 2,000 chairs over the fi ve year period, 2000-05. The chairs were to be divided equally between Tier 1 Senior Chairs worth $200,000 a year and Tier 2 Junior Chairs worth $100,000 a year. Matching funding for approved research infrastructure was to be sought from the CFI for each chair. The main criterion for the distribution of these chairs was demonstrated research strength, as measured by the level of funding from the three research councils. As a token with regard to equity, the program also guaranteed that each university would get a least one chair. While the humanists and social scientists through CFHSS and CAUT argued for more, these disciplines were allocated 20 per cent of the total chairs even though SSHRC only accounted for approximately 12 per cent of the total research council funding. Health sciences were allocated 35 per cent and the natural sciences and engineering 45 per cent.

Canadian Federal Policy and Postsecondary Education94
Chart 13. Federal Spending on Granting Councils
(1988-89 to 2003-04 in current dollars)
$0.0
$200.0
$400.0
$600.0
$800.0
$1,000.0
$1,200.0
$1,400.0
$1,600.0
$1,800.0
1988-89 1990-91 1992-93 1994-95 1996-97 1998-99 2000-01 2002-03
Year
Cu
rre
nt
Do
lla
rs (
Mil
lio
ns
)
MRC / CIHR
NSERC
SSHRC
Canada Council
Chart 14. Federal Spending on Granting Councils
(1988-89 to 2003-04 in 1988 dollars)
$0
$200
$400
$600
$800
$1,000
$1,200
1988-89 1990-91 1992-93 1994-95 1996-97 1998-99 2000-01 2002-03
Year
1988 D
ollars
(M
illio
ns)
MRC / CIHR
NSERC
SSHRC
Canada Council
Chart 15. Federal Funding for Postsecondary Education Sector Research
– NSERC (millions in current dollars)
0
500
1000
1500
2000
2500
1971
1972
1973
1974
1975
1976
1977
1978
1979
1980
1981
1982
1983
1984
1985
1986
1987
1988
1989
1990
1991
1992
1993
1994
1995
1996
1997
1998
1999
2000
2001
2002
2003
2004
0
50
100
150
200
250
300
350
$M
% Change
$M %
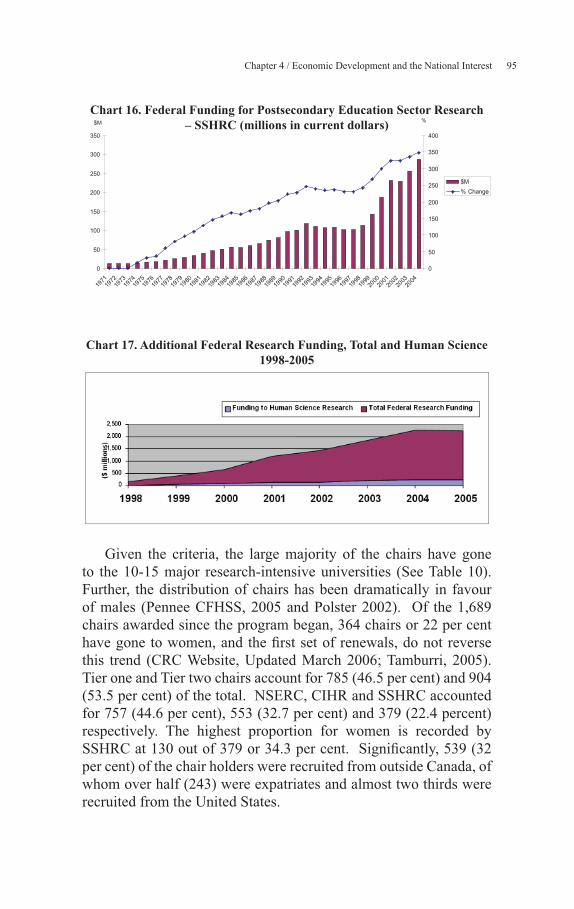
Chapter 4 / Economic Development and the National Interest 95
Chart 16. Federal Funding for Postsecondary Education Sector Research
– SSHRC (millions in current dollars)
0
50
100
150
200
250
300
350
1971
1972
1973
1974
1975
1976
1977
1978
1979
1980
1981
1982
1983
1984
1985
1986
1987
1988
1989
1990
1991
1992
1993
1994
1995
1996
1997
1998
1999
2000
2001
2002
2003
2004
0
50
100
150
200
250
300
350
400
$M
% Change
$M %
Chart 17. Additional Federal Research Funding, Total and Human Science
1998-2005
Given the criteria, the large majority of the chairs have gone to the 10-15 major research-intensive universities (See Table 10). Further, the distribution of chairs has been dramatically in favour of males (Pennee CFHSS, 2005 and Polster 2002). Of the 1,689 chairs awarded since the program began, 364 chairs or 22 per cent have gone to women, and the fi rst set of renewals, do not reverse this trend (CRC Website, Updated March 2006; Tamburri, 2005). Tier one and Tier two chairs account for 785 (46.5 per cent) and 904 (53.5 per cent) of the total. NSERC, CIHR and SSHRC accounted for 757 (44.6 per cent), 553 (32.7 per cent) and 379 (22.4 percent) respectively. The highest proportion for women is recorded by SSHRC at 130 out of 379 or 34.3 per cent. Signifi cantly, 539 (32 per cent) of the chair holders were recruited from outside Canada, of whom over half (243) were expatriates and almost two thirds were recruited from the United States.

Canadian Federal Policy and Postsecondary Education96
The CRC program is administered by a steering committee composed of the presidents of the three granting councils, the president of CFI and the deputy minister of Industry Canada. The committee is advised by a group of international scholars who are appointed to a college of reviewers. The CRC marks a clear change in the federal-provincial relationship with regard to PSE. First, the chair holders are expected to do some teaching. This means that for the fi rst time federal funds will be used directly to pay for university positions within institutions. Hitherto, such funding had been strictly under provincial and university control. Second, universities are required to prepare detailed research plans as they apply for their quota of chairs. These plans have to be approved by the CRC Steering Committee before the chairs are released to the university. These changes are a clear threat to provincial juridical autonomy and to the academic autonomy of the university.
After extensive lobbying by AUCC and the group of 10 major research universities, the federal government took an unprecedented step by agreeing in February 2001 to provide a one time grant of $200 million to alleviate the direct and indirect costs of research. These funds were distributed directly to the universities, bypassing the provinces. Two years later, in February 2003, the Indirect Costs Program was announced with a grant of $225 million per year starting with the 2003-04 fi scal year. A year later this amount was increased to $245 million a year for 2004-05 and 2005-06. The dysfunctional relationship between the universities and the federal granting agencies had long been a major bone of contention. Previously, universities were effectively penalized for being successful in the competition for research funding in that they had to provide money for the direct and indirect costs. The share of the new funds going to each university was determined using a sliding proportional scale inversely related to the value of the research grants obtained from the three granting councils. These funds go towards not only the obvious costs of light and heat but also the part of professorial salaries that covers research. The amount was calculated as 40 per cent of the direct costs of research.
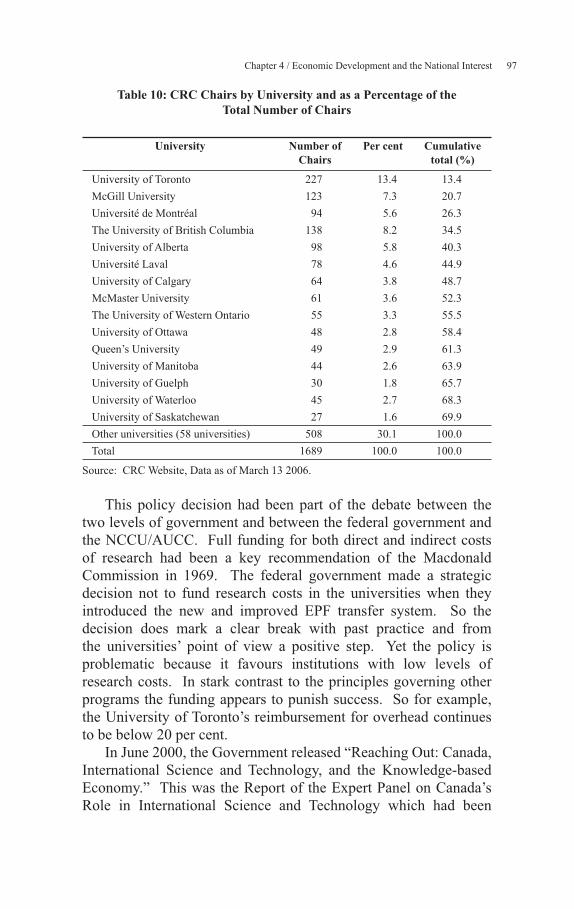
Chapter 4 / Economic Development and the National Interest 97
Table 10: CRC Chairs by University and as a Percentage of the
Total Number of Chairs
University Number of
Chairs
Per cent Cumulative
total (%)
University of Toronto 227 13.4 13.4
McGill University 123 7.3 20.7
Université de Montréal 94 5.6 26.3
The University of British Columbia 138 8.2 34.5
University of Alberta 98 5.8 40.3
Université Laval 78 4.6 44.9
University of Calgary 64 3.8 48.7
McMaster University 61 3.6 52.3
The University of Western Ontario 55 3.3 55.5
University of Ottawa 48 2.8 58.4
Queen’s University 49 2.9 61.3
University of Manitoba 44 2.6 63.9
University of Guelph 30 1.8 65.7
University of Waterloo 45 2.7 68.3
University of Saskatchewan 27 1.6 69.9
Other universities (58 universities) 508 30.1 100.0
Total 1689 100.0 100.0
Source: CRC Website, Data as of March 13 2006.
This policy decision had been part of the debate between the two levels of government and between the federal government and the NCCU/AUCC. Full funding for both direct and indirect costs of research had been a key recommendation of the Macdonald Commission in 1969. The federal government made a strategic decision not to fund research costs in the universities when they introduced the new and improved EPF transfer system. So the decision does mark a clear break with past practice and from the universities’ point of view a positive step. Yet the policy is problematic because it favours institutions with low levels of research costs. In stark contrast to the principles governing other programs the funding appears to punish success. So for example, the University of Toronto’s reimbursement for overhead continues to be below 20 per cent.
In June 2000, the Government released “Reaching Out: Canada, International Science and Technology, and the Knowledge-based Economy.” This was the Report of the Expert Panel on Canada’s Role in International Science and Technology which had been

Canadian Federal Policy and Postsecondary Education98
commissioned by the ACST. Similarly, during a 2000 Conference on Creating Canada’s Advantage in an Information Age, Paul Davenport pointed out that council grants in Canada are less than one-third their American counterparts, restricting innovation and adding to the brain drain. Building on this report and as a response to the lobbying by university presidents, the federal government carried out an extensive consultation process over a two year period, 2001 to 2003, called Canada’s Innovation Strategy. This included two policy papers: Knowledge Matters: Skills and Learning for Canadians (HRDC, 2002), and Achieving Excellence: Investing in People, Knowledge and Opportunity (Industry Canada 2002). This effort culminated in a national forum in the fall of 2002 and informed federal policy development into the mid-2000s. The new policy aimed at raising Canada’s ranking in the R and D league table to the top fi ve and to place the country among the world’s leaders in terms of its share of private sector sales from knowledge innovation and the creation of intellectual property by 2010. Industry Canada set a target of doubling federal investment in R and D and raising the per capita value of venture capital investments to the prevailing levels in the United States. HRDC focused on training and education and set a series of targets. Three objectives were posited: every high school graduate would have the opportunity to enroll in some form of PSE; 50 per cent of 25 to 64 year olds would hold a PSE credential, and the number of students admitted to magistral and doctoral programs would increase by 5 per cent each year.
AUCC supported the government’s vision and in July 2002 responded with A Strong Foundation for Innovation: An AUCC Action Plan. The action plan committed the universities to the targets set in the Innovation Strategy but made it clear that both levels of government and the private sector would have to substantially increase their investment in university research. In November 2002 the AUCC and the federal government signed an agreement, Framework of Agreed Principles on Federally Funded University Research (AUCC, 2002b). This agreement confi rmed the universities’ commitments outlined in the action plan but also included the federal government’s acceptance of the responsibility to provide the necessary levels of investment and to make ongoing contributions to the indirect costs of research. Evidence of good faith with regard to the support of graduate studies came in February 2003 with the announcement of the Canada Graduate Scholarships. The federal government committed $25 million in 2003-04, $55 million

Chapter 4 / Economic Development and the National Interest 99
in 2004-05 and $85 million in 2005-06 in new money. Signifi cantly, the formula for distributing these funds used student enrollment by discipline and fi eld rather than the amounts distributed currently by the three granting councils. This has meant that the humanities and social science disciplines have benefi ted the most.
From the late 1990s through to the present, the federal government has taken a fi rm and dominating lead in shaping PSE policy in Canada. As Cameron notes, the political strategy has aimed at “transforming Canadian universities into more innovative institutions, with closer ties to both government and private industry, more attuned to commercialization of the discoveries, and all the while admitting a growing proportion of Canadians” (Cameron 2004, 21). The overwhelming emphasis has been on research in the health, natural and applied sciences.
4.2 Vocational and Technical Training
The last twenty years have seen a dynamic evolution of federal training and labour market policy resulting in changing relationships and priorities. They have also refl ected a symbiotic relationship between both federal and provincial levels of government. As Dennison and Gallagher (1986, p. 16) observed:
These two areas of federal initiatives to support postsecondary education proved a real incentive for provincial governments to expand educational opportunity in their provinces through a heavy injection of federal funds—and it offered them an equally attractive opportunity to gain political credits within their own constituencies for expanding postsecondary education.
The start of this two-decade period saw the end of extensive federal direct involvement in vocational education and training. The government shifted away from the funding of training facilities and programs in provincial training institutes.
During the 1960s and 1970s this funding enabled many provinces to expand their adult training systems under federal-provincial training agreements and under the federal Technical and Vocational Training Assistance Act, 1960 and the Adult Occupational Training Act, 1967. Adult training was defi ned so as to separate such programs from “education”. The defi nitional criteria specifi ed clients who were
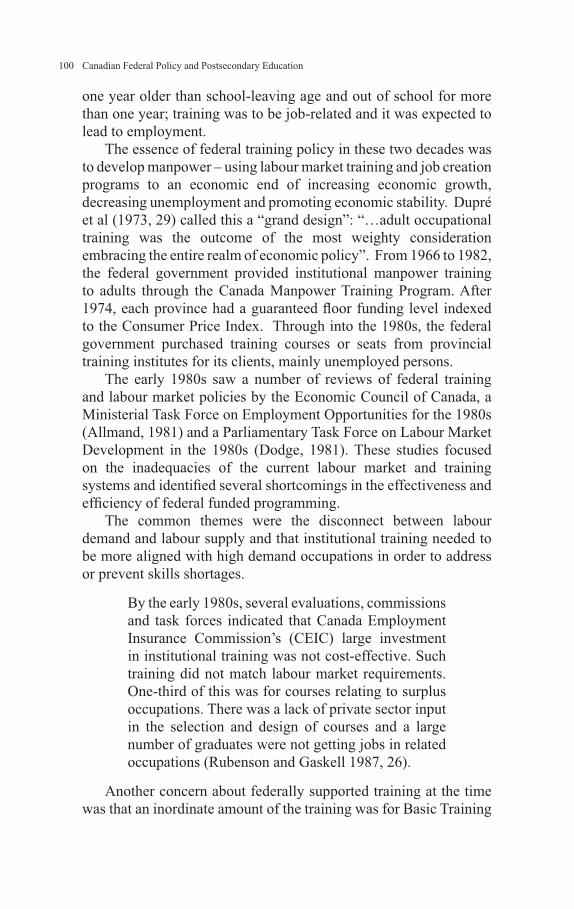
Canadian Federal Policy and Postsecondary Education100
one year older than school-leaving age and out of school for more than one year; training was to be job-related and it was expected to lead to employment.
The essence of federal training policy in these two decades was to develop manpower – using labour market training and job creation programs to an economic end of increasing economic growth, decreasing unemployment and promoting economic stability. Dupré et al (1973, 29) called this a “grand design”: “…adult occupational training was the outcome of the most weighty consideration embracing the entire realm of economic policy”. From 1966 to 1982, the federal government provided institutional manpower training to adults through the Canada Manpower Training Program. After 1974, each province had a guaranteed fl oor funding level indexed to the Consumer Price Index. Through into the 1980s, the federal government purchased training courses or seats from provincial training institutes for its clients, mainly unemployed persons.
The early 1980s saw a number of reviews of federal training and labour market policies by the Economic Council of Canada, a Ministerial Task Force on Employment Opportunities for the 1980s (Allmand, 1981) and a Parliamentary Task Force on Labour Market Development in the 1980s (Dodge, 1981). These studies focused on the inadequacies of the current labour market and training systems and identifi ed several shortcomings in the effectiveness and effi ciency of federal funded programming.
The common themes were the disconnect between labour demand and labour supply and that institutional training needed to be more aligned with high demand occupations in order to address or prevent skills shortages.
By the early 1980s, several evaluations, commissions and task forces indicated that Canada Employment Insurance Commission’s (CEIC) large investment in institutional training was not cost-effective. Such training did not match labour market requirements. One-third of this was for courses relating to surplus occupations. There was a lack of private sector input in the selection and design of courses and a large number of graduates were not getting jobs in related occupations (Rubenson and Gaskell 1987, 26).
Another concern about federally supported training at the time was that an inordinate amount of the training was for Basic Training

Chapter 4 / Economic Development and the National Interest 101
for Skill Development (BTSD) programs. Rubenson and Gaskell point to the federal program review process in the mid-1980s that concluded that these programs appear “to be directed at meeting worker needs which have resulted from defi ciencies in provincial education programs” (Rubenson and Gaskell 1987, 26). As a result, a shift in federal funding away from lower-level skill levels to higher-level skills training was seen after this review.
These reviews made recommendations that the federal government at the time could use to “better manage” the labour market. This further reinforced the federal government’s philosophy and manpower policy of using education and training as an economic tool. As a result of this debate, the early 1980s saw the introduction of the National Training Act, 1982 and a more selective direct involvement in training by the federal government through agreements with each province. The mid-1980s brought a further shift in federal training policy. This period included the election of a new Conservative government in 1984 and the completion of a comprehensive program review of federal activities.
Consistent with neo-liberal ideology, the Mulroney Conservative government (1984-93) also moved federal labour market and training policy away from government directed training and short-term job creation. In 1985 Ottawa introduced the Canadian Jobs Strategy (CJS) which attempted to increase labour mobility through skill development (Muszynski and Wolfe 1989, 259). An important element of this shift was increased privatization of training, moving it away from recognized institutions such as community colleges and Canada Employment Centres to private “managing co-coordinators” (Premiers Council 1990, 111). Community Industrial Training Committees (CITC) were organized at the local level to administer federal programs.
With the introduction of CJS, the federal government served notice to provinces that it planned to reduce institutional training purchases in coming years and to redirect these funds to private and voluntary sectors. For example, enrolment in vocational training in Canada dropped from 2 per cent to 1 per cent of the labour force in the decade ending 1987-88, mainly due to the shift in federal funding (Centre for Policy Studies in Education 1993, 9). Concomitant with this, the federal government directed more funds toward employer-sponsored training and attempted to have the private sector play a greater role in decision-making on federal training priorities. This led to reduced funding through federal-provincial training

Canadian Federal Policy and Postsecondary Education102
agreements in the late 1980s and a phasing out of such agreements by the early 1990s. During the late 1980s and early 1990s the federal government also started to fund human resource sector councils and other national structures such as the Canadian Labour Market and Productivity Centre (now the Canada Labour and Business Centre) and the Canadian Labour Force Development Board (CLFDB), which was disbanded in the late 1990s. Provincial governments also set up corresponding labour force development boards.
The federal government’s Labour Force Development Strategy was implemented in 1990 and in addition to creating CLFDB in 1991, it brought in Unemployment Insurance (UI) reforms including tougher regulations for Unemployment Insurance (UI) entitlement, tougher penalties for voluntary quitters, higher premiums for employers and employees, and more funds for training UI recipients.
During the 1980s and part of the 1990s, the federal active labour market policies fi nanced out of the Unemployment Insurance and now Employment Insurance (EI) programs were a source of tensions in federal-provincial relations. A transition period from the former training agreements saw the creation of Labour Force Development Agreements with provinces and territories in 1991-92. However, by the mid-1990s, the federal government had “devolved” much of the responsibility and funding for training to the provinces and territories through a new Employment Insurance Act, 1996, and a series of Labour Market Development Agreements (LMDA) negotiated with each province and territory. The federal government retained responsibility for inter-provincial labour mobility, national youth, Aboriginal and persons with disabilities and other pan-Canadian initiatives.
Pursuant to Part II of the Employment Insurance Act, the federal government has negotiated bilateral LMDAs with all provinces and territories except Ontario since the mid-1990s. There are two types of LMDAs. Under “co-managed” LMDAs with fi ve provinces and territories including BC and Newfoundland and Labrador, the federal government delivers Employment Benefi ts and Support Measures (EBSMs) but shares responsibility for the design, management and evaluation of these programs with provinces and territories. The Canada-Nova Scotia LMDA is a “strategic partnership” which is a derivation of the co-management model. Under “transfer” LMDAs with six provinces and territories including Alberta and Quebec, the regional jurisdictions assumed responsibility for the design, delivery and management of their own programs that are similar to EBSMs.
Chapter 4 / Economic Development and the National Interest 103
These programs are also funded through Employment Insurance (EI) Part II.
The 1996 EI legislation established guidelines for the development of “active” employment benefi ts and the maintenance of employment services to ensure that CEIC worked closely with regional jurisdictions. These active measures under Part II of the act included targeted wage subsidies, targeted earnings supplements, self-employment, job creation and skills development. Support measures include Employment Assistance Services such as counseling, research and labour market partnerships. EI clients were expected to play a more direct and active role in their training and return to work. In 2002, federal government spending on active labour market measures through the LMDAs and directly in Ontario, where there is no LMDA, was approximately $2.2 billion annually.
Many of these provisions continue today. The federal government through HRSDC also continues to support some training from its Consolidated Revenue Fund (CRF), i.e. general revenue. These include programs for certain labour market groups such as youth-at-risk, Aboriginal people, immigrants and persons with disabilities. CRF funded programs do not fall under the LMDAs.
Currently, and over the last few years, the federal government and provinces and territories have undertaken formative and summative evaluations of LMDAs, many of which have not yet been completed or publicly released. Some researchers have analyzed the trends, results and issues in LMDAs and identifi ed strengths and weaknesses. To date, there has been no defi nitive analysis that draws conclusions about the overall effi cacy of LMDAs.
The federal Liberals reversed their long-standing claim to jurisdiction over labour market training in 1996 as part of their attempt to reduce the defi cit and as a response to the threat of the sovereignty referendum in Québec. Much of the federal government’s involvement in this area devolved to the provinces and, in parallel to the introduction of the CHST, the federal government gave up a direct line of infl uence on the national economy. Québec immediately accepted this generous transfer of jurisdiction and again demonstrated the province’s exceptionalism by negotiating further limitations on what remained of the federal role. Nothing could better illustrate “checkerboard federalism” than the range of agreements that emerged between the remaining provinces and the federal government. Ontario did not sign an agreement thus maintaining the status quo. Nova Scotia negotiated a “strategic

Canadian Federal Policy and Postsecondary Education104
partnership”, while British Columbia, Newfoundland and Labrador, PEI and the Yukon chose co-management. Finally, the other four provinces and two territories (Alberta, Manitoba, Northwest Territories, Saskatchewan, New Brunswick and Nunavut) accepted devolution.
As noted in the recent Rae Commission Report on PSE in Ontario (Rae 2005, 18),
The end of Established Programs Financing and its replacement by the less generous Canada Social Transfer has meant that the federal government has been avoiding its responsibilities towards higher education. There is no dedicated federal transfer to the provinces for universities and colleges. There should be….With the substantial reductions in federal funding for skills training, colleges receive far less support from the federal government than they did ten years ago.
This situation had been somewhat modifi ed with the introduction of the Innovation Strategy in 2002. It led to a greater federal emphasis on skills and learning as they relate to improved productivity and competitiveness. In its 2003 budget, the federal government announced the investment of $41 million over the next two years to attract skilled immigrants into the Canadian labour market and facilitate the integration, the commitment of $60 million over two years to improve the Canada Student Loans Program to put more money in the hands of students and better enable postsecondary graduates to manage their debt, the putting aside of $100 million for the establishment of a Canadian Learning Institute, to improve the quality of information available on our education and learning system, and the provision of $72 million in the next two years to improve educational outcomes for Aboriginal people and ensure they are provided with training and employment opportunities in major projects. As noted earlier the Canadian Learning Institute was re-named the Canadian Council on Learning (CCL) and launched in 2004.
The Innovation Strategy also led to enhanced funding for national human resource sector councils, the creation and funding of a Canadian Apprenticeship Forum to promote increasingly important trades careers, and a Canadian Learning Bond, a savings vehicle designed to help low-income families provide for their children’s

Chapter 4 / Economic Development and the National Interest 105
postsecondary education. In 2004, the federal government gave learning a special priority in its budget, and in its 2005 budget (HRSDC 2005, 4-5), the federal government made the fi ve commitments in its human capital agenda. The fi rst is to invest $125 million over the next three years to work with stakeholders on a Workplace Skills Strategy. This will include “strengthening apprenticeship systems” and “leveraging support from workplace partners for pilot projects targeted to the currently employed”. The second is to further refi ne Employment Insurance, including a new permanent rate-setting mechanism to enhance transparency and accountability. The third is to invest $30 million to enhance literacy initiatives over the next three years and to promote literacy and learning in the workplace. The fourth is to make changes to the CSLP to extend eligibility for loan forgiveness and to amend eligibility criteria for Canada Millennium Scholarships. The fi fth is to institute a Service Canada initiative over the next three years to provide a single federal government service delivery network of “easy, one-stop access” to federal programs and services on-line, viand by phone and mail at 320 Service Canada offi ces across Canada.
4.2.1 Apprenticeship and Industry Training
One area of increasing interest to policy-makers, industry groups and educators in Canada is apprenticeship and trades training. The federal government contributes directly to apprenticeship training by providing income support through EI to apprentice during in-school training. This funding amounted to $28.4 million in 2002 (Van Walraven 2004). According to Kunin (2004), provinces and territories contributed $252 million for apprenticeship training in 2004.
While Canada’s apprenticeship system has been criticized in recent years for not keeping up with labour market trends and not providing a clear career pathway for youth (Schuetze 2003; Sharpe 1999), there has been a resurgence of interest and activity in apprenticeship programs. This was manifested at the federal level in the Workplace Skills Strategy. Interestingly, in their sequel review of apprenticeship in Canada, Sharpe and Gibson (2005) are more positive:
The apprenticeship system in Canada is more popular than ever, with 234 thousand apprentices registered in 2002. While apprenticeship remains a small part of the postsecondary education system, comprising

Canadian Federal Policy and Postsecondary Education106
13 per cent of postsecondary enrollment in 1998…its registrations have kept pace with those of universities and community colleges. Following a decline in registrations in the fi rst half of the 1990s due to the recession, apprenticeship registrations picked up signifi cantly after 1997 with stronger economic growth (Sharpe and Gibson 2005, 1).
The Workplace Skills Strategy signals a renewed federal interest in apprenticeship and workplace training. Its vision is “To generate inclusive, sustainable and internationally competitive workplaces where workers use their skills, knowledge and abilities to produce high value products and services that will increase the quality of life for all Canadians” (HRSDC 2005a, 2-3).
The fi rst of the Strategy’s three priority areas is promoting workplace skills development, which includes the better alignment of government investments in skills with the needs of employers and workers; an increase in access, availability and opportunity for adult workplace skills investments and lifelong learning beyond PSE; and increasing employer commitment to and investment in training (including awareness of the link between human capital investments and business performance). The second is Promoting Skills Recognition and Utilization, which includes a commitment to broaden recognition of skills and experience acquired outside the formal Canadian education system, the improvement of employer/educational institution collaboration for more effi cient transitions into the workplace (e.g., internships, mentorships), and an increase in the opportunities for workers to apply their skills and to increase productivity and innovation in the workplace. The third is Promoting Partnerships, Networks and Information Flows, which includes the encouragement of networks/partnerships that provide the connections that facilitate the development of employer-led workplace-skills development strategies; an increase in access of small and medium-sized enterprises’ to knowledge, resources and human resource management and planning tools; an increase in the capacity of government, sectors and employers to forecast skill requirements, fi nd skilled employees to fi ll vacancies, upgrade skills of current employees and develop strategies to address these issues; and an improvement in accuracy, relevance, timeliness and access to government-generated information. The early programs of the WSS include a Training Centre Infrastructure Funding Program to support

Chapter 4 / Economic Development and the National Interest 107
joint union-employer training centres, an Advisory Committee on Apprenticeship (chaired by Dave Haggard, a former labour leader in British Columbia), and updating LMDAs.
4.3 Aboriginal Education
Across Canada, there are a number of Aboriginal-controlled colleges and smaller, locally focused institutions that partner with mainstream institutions to deliver a wide range of educational programming. Aboriginal-controlled community learning centres provide credit and non-credit adult learning opportunities including basic education, upgrading, distance education, language courses, vocational training and locally delivered programs from larger institutions. In addition, there are a number of Aboriginal independent not-for-profi t institutes that sometimes work with public institutions to offer training related to self-government (Government of Canada 1996, vol. 3).
Many institutions receive funding from The Indian Studies Support Program (ISSP), of Indian Affairs. This funding program was established following the release of the Assembly of First Nation’s document Tradition and Education (1988) which asserted the right of Aboriginal people to control their education, including PSE. ISSP funds First Nations and mainstream institutions and educational organizations for the development and delivery of postsecondary programming. SIFC receives approximately one third of the funding. The rest is distributed to some 80 programs across Canada, which receive between $10,000 and $70,000 (Stonechild 2004).
In the late 1960s mainstream universities began responding to the educational needs of Aboriginal students and countering Eurocentric perspectives on Aboriginal issues at universities. For example, in 1969 Trent University established the fi rst Native Studies Program in Canada. Today, there are some 12 programs at universities across Canada and many other college-based programs. Aboriginal legal education began in the summer of 1971 at the University of Saskatchewan with the development of preparatory summer courses for prospective Aboriginal legal students, and in 1973 the Native Law Program opened. By 1985, there were some 20 Aboriginal teacher education programs (Stonechild 2004).
In addition to providing academic programs, mainstream universities have also been active in delivering student services for Aboriginal people. These initiatives began in the early 1970s in Alberta and Saskatchewan, and expanded rapidly in the 1990s. By

Canadian Federal Policy and Postsecondary Education108
2001, almost half (39) of Canada’s 80 universities provided some form of Aboriginal-specifi c student services (Pidgeon 2001).
4.3.1 Funding for Indian and Inuit Students
In 1977, Indian Affairs created the Postsecondary Education Assistance Program (PSEA) in order to “encourage Registered Canadian Indians and Inuit to acquire university and professional qualifi cations so that they become economically self-suffi cient and may realize their individual potential for contributions to the Indian community and Canadian society” (AGC 1988, 6). This support included tuition, books and supplies and living expenses, and was not dependent on the student’s income. While the original intent of PSEA was to facilitate university and professional education, its focus shifted gradually to encompass a broad range of postsecondary studies. The 1983 University and College Entrance Preparation Program provided further funding to assist in upgrading for university and college bound students (AGC 1988; Stonechild 2004).
With access to funding, more Indian and Inuit students began attending colleges and universities, and federal contributions to PSE increased. A 1989 evaluation of the PSEA Program revealed that by 1988-89, some 18,535 students were being funded. Three quarters of the students were attending one or two year programs in colleges; the rest were attending university. Completion rates, were a problem, with less than 15 per cent of students successfully completing their year. The poor completion rate, associated with fi nancial issues and family responsibilities, was more pronounced in university than college programs. Only 24 per cent of the students in the social sciences and 2 per cent of students in sciences and health related areas completed their programs. Even students in the University and College Entrance Preparation programs experienced a high failure rate. Ironically more students (92 per cent) who withdrew before completing their studies found employment, than those who graduated (87 per cent) (Stonechild 2004).
In 1987, concerned with the rising costs as more and more Indian and Inuit students accessed this funding, and justifying its move by concerns over completion rates, the federal government tightened eligibility requirements for postsecondary funding, implemented performance standards and established a fi xed budget. New applicants had to either wait for future funding or fi nd other ways to support their education. This was met by strong protests by Aboriginal organizations and student groups (AGC 1988; Stonechild 2004; INAC
Chapter 4 / Economic Development and the National Interest 109
2000; Wotherspoon and Satzewich, 2000). Nevertheless, the revised program called the Postsecondary Student Assistance Program was announced in February of 1989. In response, Aboriginal students across Canada organized demonstrations, including a hunger strike. The federal government responded by loosening some restrictions regarding the amount and length of funding. However, the 1989 funding limit of $130 million remained in place until 1991, when $320 million was added over fi ve years (Stonechild 2004; INAC 2000; Wotherspoon and Satzewich 2000).
The funding was inadequate for the growing number of Indian and Inuit students who wanted to pursue PSE. In 1991, Indian Affairs estimated that between 1000 and 1500 eligible students would not receive funding. The Assembly of First Nations (AFN) estimated the numbers to be as high as 4000 students (Wotherspoon and Satzewhich, 2000).
The only educational sector where the Aboriginal population outperforms the general population is in trades certifi cates or diplomas where they have a rate of 12.1 per cent versus the total Canadian population rate of 10.9 per cent. The Aboriginal population lags behind the total population in terms of both college and university certifi cates and diplomas (11.6 per cent and 1.4 per cent respectively) as compared to the Canadian population (15 per cent and 2.5 per cent). Only 4.4 per cent of the Aboriginal identity population holds university degrees, compared to 15.4 per cent of the Canadian population.
Of particular concern is the fact that the educational gains made over the last three decades may have reached a plateau and may now be declining (CFS 2004b). For example, the high school graduation rate for Indian and Inuit students declined from 33.9 per cent in 1995-96 to 29.6 per cent in 2001-02. The number of Indian and Inuit postsecondary students funded by Indian and Northern Affairs fell from 27,183 in 1995-96 to 25,075 in 2002-03 (INAC 2003). The funding for Indian and Inuit education in total was $295.7 million in 2002-03 (INAC 2004, 45). In 2000, the Assembly of First Nations reported that 9,456 students were on the waiting list for federal funding for PSE and projected that that number would grow to 39,160 by 2005-06 (Stonechild 2004).
The declining postsecondary participation is not limited to Indian and Inuit students. It is refl ected in the broader Aboriginal postsecondary participation rates at universities. In a 2004 study of 27 Canadian universities, 2 per cent of the respondents self-identifi ed

Canadian Federal Policy and Postsecondary Education110
as Aboriginal. This represents a 1 per cent decrease from a similar study in 2001. (Canadian Undergraduate Survey Consortium 2004).
Demographics show that the Aboriginal population is young and growing. The median age for Aboriginal people is 24.7 years as compared to 37.4 years in the general population. Of particular interest is the fact that one third of the Aboriginal population is under 14 years of age, compared to 19 per cent of Canada’s population (Statistics Canada 2003b). As this population ages, postsecondary institutions will be increasingly called upon to meet their academic needs and aspirations. Whether Canada’s education systems will be able or willing to respond to this challenge is unclear. The vision articulated by Chief Dan George in 1967 still remains elusive.
Canada’s Aboriginal peoples have a unique relationship with the federal government. They have the same rights and responsibilities as other Canadians, but they also have additional rights and responsibilities as defi ned by the constitution, the Indian Act,individual treaties, and the courts. In some ways, INAC acts as a virtual province for First Nations people, with its population and territory spread throughout the country. In this capacity, the federal government provides funding both to Indian bands and to individuals to support PSE for Aboriginal students.44
From the beginning of federal support for PSE for Indian and Inuit students in 1968, through to 1986, funding was provided on the basis of estimates of need. In an effort to control expenses, federal policy was changed in 1987 to limit the available funds for Aboriginal PSE and to establish a priority system for determining who would receive support for their studies. Further restrictions on funding and eligibility for funding were imposed in 1989. On top of this, increases in funding were capped at 2 per cent annually throughout the 1990s and into the 2000s.45
The expenditure cap persists even though the Aboriginal population is considerably younger than the general population and the Aboriginal birthrate is 1.5 times the general birthrate. Although the high school completion rate amongst Aboriginal people remains
44 The nature of the relationship between the federal government and Aboriginal people
is deliberately simplifi ed for the purposes of this paper. The status of Aboriginal people
within Canada is defi ned by history, treaty, law, practice and litigation. It would require
a paper several times the length of this one to give a full explanation, and even then the
explanation would be incomplete as the relationship continues to evolve; Canada, IndianAct, R.S. 1985, c. I-5.45 For a detailed history of federal support for Aboriginal postsecondary please refer to
Assembly of First Nations (2000, 17-32).

Chapter 4 / Economic Development and the National Interest 111
abysmally low in comparison to the general population, the force of demographics means that the pool of Aboriginal students eligible for PSE is projected to expand substantially in the next few years (Statistics Canada 2003c, 7-8; Assembly of First Nations 2000, 35; Four Directions Consulting Group 2004, 84-87). 46
Despite this, federal funding continues to lag behind the demand from Aboriginal students for PSE. In 2000-01, an estimated 8,475 applicants were unable to obtain funding for postsecondary studies. Indians and Inuit students denied federal funding have the option of using Canada Student Loans and related provincial student fi nancial assistance programs, but these programs are often inadequate to meet the higher expenses many students face, and fail to take into account the fact that average wages for full-time employment are 23 per cent lower for Aboriginal people than for the general population (Assembly of First Nations 2003; Statistics Canada 2003c; Malatest and Associates 2004). Further, many Aboriginal people see PSE as a treaty or aboriginal right and are therefore reluctant to apply for or take student loans. Finally, because they continue to be denied access to the PSE support available to First Nations and Inuit, Métis students depend on access to a limited number of Métis-specifi c bursaries and scholarships to fund their studies. As a result, their marginalization in PSE will likely to continue.
46 The latter study was conducted in 1997.

Canadian Federal Policy and Postsecondary Education112

Chapter 5 / Summary and Conclusion 113
Chapter 5
Summary and Conclusion
The foregoing analysis documents the federal PSE policy shifts over the last century. The two segments of policy that have experienced the most change and had the most impact are under the headings of “transfer payments” and “research and development”. This is not surprising as these policy priorities account for the majority of the federal “power of the purse”. For the remainder of this summary, we will focus on fi ve areas of policy in order of their importance as measured by their impact on PSE systems and on society as a whole. Following the two areas identifi ed above, we will focus on “student assistance”, “vocational and technical training”, and Aboriginal and First Nations education. Finally, we look forward with some concluding refl ections.
5.1 Transfer Payments
The federal government accepted the principle that funds should be transferred to support university education with the introduction of the Veterans Program in 1945. The program covered tuition fees and provided a per capita grant that was distributed by the NCCU directly to the universities. Once the principle had been established and with expectations in place, it was an easy step during the 1950s to make grants, albeit through intermediary bodies on the basis of provincial populations and student enrolment, and the need for capital development. A key turning point came in 1967 with the passage of the Federal-Provincial Fiscal Arrangements Act (FPFAA). The act replaced the direct federal grants to the universities with a system of transfers to the provincial governments to support the operating costs of universities. This measure brought the rest of Canada into line with the province of Québec that had in 1959 been allowed to opt out of the original program of direct grants. The per capita amount was increased to cover the cost of vocational as well as university education.
In what must be regarded as a fundamental change in the relationship between the two levels of government, the federal level was willing to concede to the provinces greater autonomy. From the provinces point of view this was merely a reaffi rmation of their constitutional role with regard to PSE. Yet this was not a complete victory for the provinces as the FPFAA did include conditions and cost-sharing mechanisms. As noted earlier, the changes at the
Canadian Federal Policy and Postsecondary Education114
federal level in 1967 did lead to the creation of the CMEC. The constitutional role of the provinces was fully recognized in 1977 with the passage of the EPF which for the fi rst time provided a system of unconditional block transfers to the provinces for PSE and Health. Social welfare was covered under a separate transfer, the Canadian Assistance Program (CAP). While guidelines were provided for the amount that should be allocated for PSE, the act clearly gave all the authority to the provincial jurisdictions. The EPF remained in effect until 1996.
The main story here is the withdrawal of the federal government from having control over the disbursement of the PSE funding. Unconditional bock grants provide for little or no accountability and place the federal government in an indirect relationship with PSE systems and institutions. This has also meant that the federal government gets no credit for this spending. PSE gradually became invisible in the political debates between the two levels of government. Health has been the overwhelming pre-occupation for all governments since the late 1980s. In 1996, the CHST extended the block grant approach to include social welfare (CAP), but within a framework of fi scal restraint. Education did not appear in the title of the program. The Social Union Framework Agreement of 1999 symbolized an historic acknowledgement by the majority of the provinces that such intervention is a legitimate and necessary element of the Canadian federal compromise, and one in which the provincial governments have a right to consultation. The increases that were allocated under SUFA were targeted for health.
The dominance of health as a policy priority became clearer in 2004 when the federal government divided the CHST into two transfers, the Canada Health Transfer (CHT) and the CST, with PSE in the latter. Budget documents explained that this would increase transparency and accountability, but more likely the intent was to increase visibility of the federal funding going to the politically popular health care system. The CHT was apportioned 62 per cent of the block and the CST was left with the remaining 38 per cent. Once again PSE does not even appear in the title of the transfer.
As noted in the body of the document, the differential emphasis between health and the other two parts of the federal transfers is profound. Between 1988-89 and 2005-06, the federal transfers to the provinces for health and for social programs (PSE and social assistance) combined in 1988 dollars increased 68.4 per cent and 9.1 per cent respectively. The difference is even more pronounced
Chapter 5 / Summary and Conclusion 115
if one only reports the cash transfers. Over the same period, again using 1988 constant dollars, we fi nd that while health increased by an enormous 106 per cent, PSE and social assistance actually declined by 14.2 per cent. The gap between the transfers for health and for PSE and social assistance combined, become even more pronounced if we just focus on the last decade. Between 1995-96 and 2005-06, the federal transfers to the provinces for health and for PSE and social assistance combined in 1988 dollars increased 77.2 per cent and decreased 2.2 per cent respectively. The difference is even more pronounced if one only reports the cash transfers. Over the same period, again using 1988 constant dollars, we fi nd that while health increased by an enormous 137.7 per cent, PSE and social assistance actually declined by 25.1 per cent.
In many ways the differential emphasis and the invisibility of PSE is predictable given the way decisions are made in a parliamentary democracy. Both health and social welfare have ministers at the cabinet table whereas PSE does not. The best estimate we have of the decline in federal transfers to PSE provides startling confi rmation of how this area has moved to the bottom of the policy agenda. Between 1988-89 and 2005-06, the total transfer (both cash and tax points) for PSE in 1988 dollars decreased from $5.084 billion in 1988-89, to $4.903 billion in 1995-96, and fi nally, to $3.031 billion in 2005-06, for a total of $2.053 billion or 40.38 per cent. From the late 1980s, the federal government turned its attention to funding research and infrastructure through the granting councils and special programs.
5.2 Research and Development
Alongside the decline in transfers for PSE we can observe a phenomenal increase in the resources allocated to research and development. This has occurred primarily through two mechanisms: grants directly to faculty members for research projects, and capital funding on a shared-cost basis for infrastructure projects. Both types of funding are disbursed by federal granting agencies on a competitive basis and awarded in accordance with federal criteria, which includes merit and national interests. Furthermore, these policy decisions are set within a science and technology policy that emerged from competing defi nitions of science, utility, and the “public good”. At the policy level, the interests of capital are privileged under the guise of serving the national interest. By promoting industry access to publicly funded research, the

Canadian Federal Policy and Postsecondary Education116
science and technology policy recognizes that scientifi c research is simultaneously fundamental and useful. But the policy also skews the balance in favour of private interests and commercial science.
Until 1977 the federal government’s research grants for university scholars were scattered across a range of institutions and programs, starting with the NRC and progressing through the CC and the MRC. With the creation of SSHRC and NSERC, the government of Canada made a clear commitment to fund all research disciplines represented in Canadian universities. This major policy shift was housed in the continuing interest in science and technology symbolized by the creation of the Science Secretariat in 1964, the Science Council in 1966 and MOSST in 1971. Furthermore, this shift was prompted by the MacDonald Report (1969) and the four volumes of the Lamontagne Report (1970-77).
Overturning a fragmented science-policy history, both the Conservative and Liberal administrations crafted a climate of commercialization by applying a multitude of mutually reinforcing policy instruments. Available data indicate their efforts to drive science to the market have been successful. The “matching funding” policy between government and industry and the focus on the production of intellectual property has resulted in an increase in the proportion of research being funded by non-government sources. The proportion of “sponsored research” being funded by the federal government in constant dollars (2002-03), decreased from 63 per cent ($722 million) in 1981-82, to 51 per cent ($1,006 million) in 1991-82, and to 45 per cent ($1,734 million) in 2001-02. This is a drop of almost 20 per cent in 20 years. Even though the federal proportion is decreasing, real funding increase (after discounting infl ation) from the 1971-72 level is 28 per cent in 1981-82, 39 per cent in 1991-92 and 71 per cent in 2001-02.
Yet it must be noted that between 1988-89 and 2003-04, the increase in spending in federal spending on the four councils (SSHRC, NSERC, Canada Council and MRC/CIHR) was substantial. In 1988 constant dollars, the amount increased from $720.5 million to $1.21 billion or 68 per cent. While we observed a dip in funding during the restraint years of the middle 1990s, the funding began to increase in 1997-98. The most dramatic change occurred for MRC at the point it was transformed into the CIHR. Between 1999-2000 and 2003-04, the yearly funding for MRC/CIHR in 1988 dollars increased from $233 million to $474 million, an increase of approximately 100 per cent. During the same time period, the comparable increases to

Chapter 5 / Summary and Conclusion 117
NSERC and SSHRC were much less at 18.25 per cent and 34.38 per cent respectively.
First the federal Conservatives in 1989 and then the federal Liberals since 1997-98 embarked on the task of fundamentally reforming the federal/provincial relationship with regard to PSE. For the most part, the initiatives were taken in a unilateral manner at the federal level. The NCE was the centerpiece of the federal government’s Innovaction science policy. The NCE aimed to enlist academic scientists into a national system of innovation that would translate university research into marketable technologies which in turn would enhance Canada’s competitiveness in a global, knowledge economy. By 2000-01 a total of 29 networks had been funded through this program.
In the early and mid-1990s, other concepts like “prosperity”, “healthy, wealthy and wise” were added to the lexicon used to legitimate the science and technology policy. In 1996, as one element of the new federal integrated policy, NABST was replaced by ACST, a body of 12 experts representing the scientifi c community and industry. In 1997, the Liberals created CFI as a public foundation to fund research infrastructure through partnerships with private and voluntary sectors, and provincial governments, aimed at universities, colleges, hospitals and other not-for-profi t institutions involved in science and technology development and targeting health, environment science and engineering needs in Canada. Between 1997-98 and 2003-04, the federal government invested a total of $3.59 billion in CFI, a total that includes both grants and operating expenditures and with matching grants levered a total of $9 billion. As noted in the body of this monograph, the CFI ran is last scheduled competition in September 2005.
In 1999, the federal government announced the CRC program and once again created a precedent in the federal/provincial PSE relationship. A one-time investment of $900 million was set aside to fund 2,000 chairs over the fi ve year period, 2000-05. The chairs were to be divided equally between Tier 1 Senior Chairs worth $200,000 a year and Tier 2 Junior Chairs worth $100,000 a year. Just as with the CFI program, the health, natural and applied sciences were given preference taking up 80 per cent of the chairs. Of the 1,348 chairs awarded since the program began four years ago, 270 chairs or 20 per cent have gone to women, and the fi rst set of renewals do not reverse this trend (Tamburri 2005). For the fi rst time under the CRC federal funds are being used directly to pay for university positions

Canadian Federal Policy and Postsecondary Education118
by institution and the universities have to submit research plans to a federal committee for approval as they apply for their quota of chairs. These changes are a clear threat to provincial juridical autonomy and to the academic autonomy of the university.
Against the background of policy papers referring to the knowledge economy, the federal government in 2001 took another unprecedented step when it decided to begin grants to the universities to alleviate the direct and indirect costs of research. This policy initiative has since become a permanent program distributing over $200 million a year directly to the universities without any interference from the provinces. Overall, when these programs along with others dealing with student assistance are taken into account one becomes aware of just how much the federal level of government has taken the initiative with PSE policy. We can see the balancing impact of the research and development agenda when we examine the total federal program spending on PSE and research. Between 1988-89 and 2003-04, this amount in 1988 dollars, increased from $2,727.1 billion to $3,130.6 billion, for a total of $403.5 million or 14.8 per cent. At the same time we recognize the imbalance within the research and development budget between groups of disciplines. Of the new research funding by the federal government between 1998-99 and 2004-05, only $1.02 billion or 11.2 per cent funded research in the humanities and social sciences.
5.3 Student Assistance
“Patchwork federalism” is without doubt an apt description of the federal role with regard to student assistance. Equal access within and between provinces has been the long-standing goal of federal programs. Unfortunately, this goal is as elusive now as it was in the 1930s when the fi rst federal student fi nancial assistance programs were established. Cost-sharing between the two levels of government was the modus operandi as the federal government invited provinces to sign on for assistance fi rst for students in vocational programs and then just before the Second World War for university students. The only common feature of this national program was that recipients of fi nancial aid had to prove themselves of academic merit and have demonstrated fi nancial need. The provinces administered their programs and inevitably created a patchwork of loans and grants. As noted earlier, the Veterans program was more direct and far more effective as an instrument of equalization at least for males.
Chapter 5 / Summary and Conclusion 119
The next major commitment at the federal level came in 1964 with the establishment of the CSLP. Provinces were given the choice of joining the program or opting out and receiving their share of the funds to support their own fi nancial assistance programs. Québec immediately took advantage of the opting-out provision and has remained the only province in this position. The new money for loans did not create more uniformity across the country but rather made the patchwork more complicated. Apart from increases in the amounts of available assistance, the CSLP remained largely unchanged until 1995. The CSLP provided guaranteed loans for full-time students with demonstrated fi nancial need.
Over the last 20 years, the political pressure for balancing the budget, reducing government debt, and paring down the size and scope of government has taken priority over almost all other government activities. Neo-liberalism became the basis for federal policy and as a consequence, federal policy on student fi nancial assistance and related matters in the 1990s moved away from the grand programs of the past towards more targeted, and even niche approaches, to help students pay for the rising costs of PSE. In this context, the federal Liberals overhauled the CSLP in 1994, and as part of their 1998 Canadian Opportunity Strategy created the CMSF with an endowment of $2.5 billion. The new system of awards was available to all PSE students including part-time students.
The federal government was able to negotiate agreements with all the provinces even though they saw these fellowships as an invasion into their territory. Other targeted programs introduced in 1998 included the CESG and the CSG.
On one hand, the federal government’s expenditure as a proportion of total student assistance expenditures in Canada has increased from 39 per cent in 1990-91 to 57 per cent in 2002-03. The change was a direct result of the addition of the CMSF funding. On the other hand, the general trend in federal PSE policy with regard to fi nancial assistance since the mid-1990s has been away from universal toward targeted programs and away from funding institutions to funding individuals. We have seen a signifi cant increase in the use of tax credit incentives by the federal government to encourage postsecondary education participation. While it is clear that fi nancial assistance programs do assist the students from lower income families, as these students account for approximately 60 per cent of the awards, it is also clear that the situation is reversed when one only considers “independent” students. Further, a

Canadian Federal Policy and Postsecondary Education120
disproportionate number of PSE students who attend postsecondary institutions (primarily universities) are from upper income families. It follows that these same students benefi t differentially with regard to grants and scholarships. This situation has long given rise to charges that public funding of postsecondary institutions is an unfair subsidy for upper income Canadians
Before leaving the area of student fellowships, it is important to note that the federal government has been supporting graduate students with fellowships across the whole range of disciplines. These fellowships have been administered by the national granting councils (NRC, CC, MRC [CIHR], NSERC and SSHRC) and became increasingly signifi cant after 1977. In 2003, the federal government committed signifi cant new money through the Canada Graduate Scholarships. The formula for distributing these funds broke with previous practice and used student enrollment by discipline and fi eld rather than the amounts distributed currently by the three granting councils. This has meant that for the fi rst time the Humanities and Social Science disciplines have benefi ted the most.
One fi nal note concerns the related issue of student fees. While the federal government clearly has no direct role is setting fees, federal policies do infl uence tuition fee policy. The knock-on effect of reductions in the transfer payments was the re-regulation of tuition fees by the provinces. So while tuition fees as a proportion of institutional revenue remained relatively stable during the 1980s, they began to climb dramatically in the 1990s. By the end of the 1990s, tuition fees had climbed to 20 per cent of institutional revenues on average nationally, and upwards of 30 per cent in some provinces (Stager 1989; CAUT 1999, 3). The increase in domestic undergraduate tuition fees in 1988 dollars, goes from approximately $1,400 in 1990-91 to approximately $2,800 in 2004-05 (Statistics Canada 2004). The increase in the average annual cost of university tuition for professional programs in Canada was much more pronounced. These fees rose from approximately $2,100, $2,000, $1,800 and $1,700 for Dentistry, Medicine, Law and Engineering in 1989 to $12,942, $10,349, $6,772 and $4,677 in 2005 respectively using 2005 constant dollars (CAUT 2006, Figure 3.6, 38).
When measured against the after-tax family income, university tuition fees increased from 6 per cent in 1990-91 to 9 per cent in 1998-99 for families in the middle income quintile, and jumped from 14 per cent to 23 per cent for families in the lowest income quintile over the same period. In constant dollars, university tuition fees

Chapter 5 / Summary and Conclusion 121
in 2002 were the highest they had ever been at any time in the past century. Measured against the buying power of a middle income tradesman, university tuition fees in 2002 were more expensive than at anytime in the preceding 130 years, with the exception of the beginning of the Second World War (CAUT 2001a, 2, 8; CAUT 2001c, 4, 6).
This rapid growth in tuition fees, both in dollars and in proportion of institutional operating budgets, is directly linked to decreases in government support. Between 1984 and 2004, tuition as a share of university operating revenues nationally, increased from 13.8 per cent to 30.3 per cent. By contrast, government funding had decreased from 81.6 per cent to 57.2 per cent (CAUT 2006, Figure 1.3, 3). Although some of this decrease is due to actual cuts in government funding for universities, erosion of funding through infl ation and government-directed increases in the number of students enrolled, without compensating funding increases, also took their toll (CAUT 2001a, 3-4; CAUT 2001b).
A related issue concerns international students. All provinces have set fees for international students at a higher level than for domestic students. Yet while some provinces have created intermediate bodies to coordinate and market international education, there is no such body at the national level. Policies on internationalization are undeveloped at both levels of government and at the federal level there is a complete lack of any integration of policy on international students, immigration or visa-processing. Green and Knight (2003) and Evans (2005), characterize decisions in this area as ad hoc and lacking principles or strategy. The absence of a national strategy creates inconsistencies between provinces and between the two levels of government. Also one might infer that the dearth of policy in this area is detrimental to Canadian students as it inhibits the type of learning that would allow them to compete effectively in the global economy.
5.4 Vocational and Technical Training
In some ways federal involvement in vocational and technical training issues had more impact on provincial systems of education that any other intervention. During the 1960s and 1970s, the federal government adopted a “grand design”, the essence of which was the development of “manpower”. “Manpower policy” used labour market training and job creation programs as a means to an economic end of increasing economic growth, decreasing unemployment and

Canadian Federal Policy and Postsecondary Education122
promoting economic stability. This policy translated into extensive federal direct involvement in vocational education and training. The massive infusion of funds enabled many provinces to expand their adult training systems and was the foundation upon which provinces built their community college systems. Adult training was defi ned so as to separate such programs from “education”. The defi nitional criteria were clients who were one year older than school-leaving age and out of school for more than one year, training was to be job-related and it was expected to lead to employment. Through into the 1980s, the federal government purchased training courses or seats from provincial training institutes for its clients, mainly unemployed persons.
In the 1980s, the federal government shifted away from the funding of training facilities and programs in provincial training institutes. A common theme was the disconnect between labour demand and labour supply, and that institutional training needed to be more aligned with high demand occupations in order to address or prevent skills shortages. The introduction of CJS in 1985 served notice to provinces that the federal government planned to reduce institutional training purchases in coming years and to redirect these funds to private and voluntary sectors. The federal government directed more funds toward employer-sponsored training and attempted to have the private sector play a greater role in decision-making on federal training priorities. This led to reduced funding through federal-provincial training agreements in the late 1980s, and a phasing out of such agreements by the early 1990s. The “grand design” was replaced by a Labour force Development Strategy and the CLFDB. Human capital had become human resources.
By the mid-1990s, much of the responsibility and funding for training had been devolved to the provinces and territories, through negotiated LMDAs with every jurisdiction except Ontario. A patchwork of agreements emerged including a “strategic partnership”, “co-management” and for fi ve provinces and two territories, “devolution”. This retreat from direct involvement and the transfer of jurisdiction meant the federal government gave up a direct line of infl uence on the national economy. Some interest has recently been expressed in expanding the federal role with the introduction of the Innovation Strategy which also includes a new emphasis on apprenticeship training.
While the Government of Canada’s role in training and the labour market is ever-evolving, provincial and territorial jurisdictions

Chapter 5 / Summary and Conclusion 123
in Canada have become increasingly interested in human capital and human resource strategies because of major demographic and labour demand shifts. Regional industry groups and other regional stakeholders may also take a more active role in labour market training policy and programs. This state of fl ux and dynamism in Canadian labour market policy is made further unstable by the politicization in this policy arena. As McIntosh observed:
As such, labour market policy is perhaps much more directly ‘political’ than other policy realms. The reason for this is relatively straightforward. Though policy analysts, economists, and political scientists talk about ‘attachment to the labour market,’ citizens talk about ‘what one does for a living’ – with living being the operative word. Insofar as what one’s is, for most people, an integral part of both their self-identify and the manner in which they interact with the world around them, then government policy that affects ‘the supply and demand for labour as well as the labour process itself (2000, 7-8).
While the nature of the Government of Canada’s role in training and labour market programs will inevitably change in another phase of development, there are no signs that the extent and diversity of federal involvement will decrease. The greatest challenge facing public policy in the Canadian labour market is for federal and provincial/territorial government to move more toward bilateral and pan-Canadian harmonization of vision and strategy. Lazar puts this well in a summary of a recent conference on LMDAs:
Provincial and federal governments should work toward the development of an integrated labour market development strategy that recognizes explicitly the relationships and linkages between LMDAs and other ALMMs [active labour market measures], on the one hand, and surrounding government and private systems, on the other. The focal point of such a strategy should be the individual client and the ease with which that client can move between systems and programs (2002, 74).

Canadian Federal Policy and Postsecondary Education124
5.5 Aboriginal Education
Since 1967 when Chief Dan George delivered his famous oratory, there have been many positive changes in Aboriginal education. At the PSE level, a signifi cant number of Aboriginal organizations and institutions are taking responsibility for delivering education to Aboriginal people. Many public universities and colleges are responding to Aboriginal educational needs through the provision of Aboriginal specifi c student services and programs, and through increased access. The federal government, while refusing to recognize postsecondary education as an Aboriginal right, continues to fund some First Nations and Inuit students so that they can access postsecondary education. They also support Indian and Inuit institutes and organizations involved with postsecondary education. In 2003, the First Nations University of Canada became the fi rst university dedicated to Aboriginal education. A major source of support for this institution is the federal ISSP. The federal government included in their 2003 budget the provision of $72 million over the next two years to improve educational outcomes for Aboriginal people and ensure they are provided with training and employment opportunities on major projects
Yet there is still much to be done. Participation rates in PSE for Aboriginal students, lags far behind the rates for the general population. While an increasingly large number of First Nations and Inuit students have been funded through the PSEA, completion rates are poor. Further, many eligible students do not receive support. In 2000-01 approximately 8,500 applicants were unable to obtain funding for PSE. The Assembly of First Nations project that the number of students on the waiting list for federal funding for PSE would approach 40,000 by 2005-06. Canada’s Aboriginal peoples have a unique relationship with the federal government. Through INAC the Government of Canada is charged with honoring and upholding the additional rights and responsibilities conferred on Aboriginal peoples. The question remains as to whether the federal government will recognize PSE as a treaty/Aboriginal right.
5.6 Concluding Refl ections
We began this monograph by referring to the major paradox of Canadian federalism. The constitutional division of powers between the provincial and federal structures creates major lines of tension in the Canadian State formation as the two levels of government attempt to fulfi l their overlapping responsibilities. These structural lines of

Chapter 5 / Summary and Conclusion 125
tension go beyond the mere provision of services to the population. The tension is between the “localism” and “cosmopolitanism”, between the “periphery” and the “centre”, and, between national and provincial collective visions for the future of Canadian society. With regard to PSE, the tension has become more pronounced as Canada, like every other industrialized nation, shifts to become a knowledge society. Education has become the most important legitimating institution in liberal capitalist states. Knowledge has come to be defi ned as the most important commodity for any society wishing to compete in the global economy. Human capital has once again returned to a central position when governments speak about a secure economic future. In this context PSE in Canada takes on a special signifi cance as the federal and provincial levels of government struggle for recognition, credit and accountability.
The dilemma that has faced Canadian society since Confederation is how to create both a national strategy for education and a process for implementing the policies that emerge from the strategy. The need for such a strategy was made clear by the OECD Examiners in 1976 and has been recognized implicitly through numerous commissions and parliamentary reports. As recently as 2002, the OECD as part of a Thematic Review of Adult Education made the same point using direct forceful language.
As in all countries with a federal structure, Canada has experienced a number of tensions between the provinces and its federal government, especially in the area of education. Because there are many problems that cannot be resolved without cooperative relationships, we recommend that provinces and the federal government should cease defending their prerogatives so fi ercely, and instead work toward a more constructive federalism that would benefi t all participants in adult education (Recommendation 5, 49-50).
But the problem is diffi cult and at times has seemed intractable. At stake is the shape of the territory that is the overlapping responsibilities between the provincial and federal governments. On the one hand is the constitutionally derived responsibility the provinces have for social welfare, health and education. On the other hand is the federal responsibility for concerns of national interest, equality of treatment and opportunity, and economic development.

Canadian Federal Policy and Postsecondary Education126
What has emerged from the basic line of tension and the ensuing struggle is a patchwork of indirect and direct federal spending, and an assortment of conditional and unconditional federal-provincial agreements governing grants and transfers.
The struggle over who controls the boundary territory has become more prominent since the 1970s as the federal government shifted the emphasis from indirect and unconditional funding to more direct and at times conditional funding for researchers, students and universities. Over the last two decades, the federal government has used its spending power to reduce indirect transfers to PSE and to channel that money into direct funding to universities for research, research chairs, research infrastructure, and the “indirect costs” of research. Federal governments have become stronger and more dominant in the federal-provincial relationship since the mid-1990s. National well-being housed in a free-market economic ideology has become the watchword for successive federal governments. Yet Québec has been fi rm on protecting its constitutional powers while at the same time benefi ting equally with the other provinces from federal policies. Québec “exceptionalism” has been a key feature of the federal-provincial relationship in PSE and by extension has pushed the federal government to take into account the relative autonomy of the other provinces.
Clearly the PSE funding crisis today could mean that the federal government, as in the case of health care funding would be called upon to do more. In fact the Rae Report has already called on the Ontario government to persuade the federal government to increase funding for postsecondary education. The report stated:
Federal Social Transfer funding for postsecondary education and other social programs stands at a lower level today, in nominal terms, than it did ten years ago….The end of Established Programs Financing and its replacement by the less generous Canada Social Transfer has meant that the federal government has been avoiding its responsibilities towards higher education. There is no dedicated federal transfer to the provinces for universities and colleges. There should be. (18-19)
The Consultation Paper by the Québec Parliamentary Committee on Education for the Quality, Accessibility and Funding of Universities (2004, 32) indicates:

Chapter 5 / Summary and Conclusion 127
One way to assert the importance of higher education in the development of a knowledge based society might be to re-examine the federal government’s involvement in funding university teaching and research, an issue that Québec universities share with their counterparts in the rest of Canada. The federal government’s involvement in the fi eld of education as a whole could also be reviewed in light of the proposals of the Commission on Fiscal Imbalance.
To optimize the return of the resources invested in universities, on might think that federal transfer payments should be unconditional, or at least be aligned with the Québec government’s orientation on university funding. Without reiterating all the technical analyses of the evolution, sharing and use of federal transfers, one has to question the means of renewing higher education, particularly when federal funding is involved.
Even if the federal government decides to increase its funding level for PSE, it may choose to do so outside of the traditional federal transfer payment vehicle. As Junor and Usher (2004, 272) observe:
Governments are increasingly moving away from funding postsecondary education through direct transfers to postsecondary institutions (though these still account for the largest portion of the spending) and have increased signifi cantly transfers to individuals (students and families). In 1990, over 87 per cent of all postsecondary education transfers went directly to institutions, but by 2002 that proportion had slipped to 78 per cent. This change is moving Canada closer to a type of “voucher” system where money bypasses institutions and goes directly to individuals as is the practice in the US.
This type of funding allows the federal government to bypass the provinces and thus the constitutional division of powers.

Canadian Federal Policy and Postsecondary Education128
Both levels of government are being challenged to put PSE at the top of the policy agenda. The argument posits the idea that social well-being and the accumulation of social capital are the two most important factors for improving the social and economic health of a modern society. As PSE provides both the foundation and the infrastructure for the development of both these factors, so if follows governments should invest more. Furthermore, it is recognized that Health has overwhelmed the policy agenda at the expense of PSE.
The paradox of federal PSE policy is exacerbated when it becomes clear that education is the only substantive area under the constitutional control of the provinces where the federal government has not passed legislation and given responsibility to a cabinet minister. If a constitutional line had to be crossed then it has already happened for health, social welfare and natural resources. Against this background we wonder what makes PSE and education in general so different that this area has not been accorded the same treatment.
The federal responsibility for concerns of national interest, equality of treatment and opportunity, economic development, and Indians and lands reserved for Indians has to translate into a national strategy for PSE. While provincial governments are able to further collective equality in their own provinces, they are not able to do so nationally. This is the pre-eminent role of the Government of Canada and the very reason why we have a system of equalization payments. The challenge to both levels of government is acute. The challenges presented by demographic change in all vocational and professional fi elds, and by globalization and the knowledge economy also create an unprecedented opportunity.
All indications are that the federal government and the provincial governments, through the Premiers Council and CMEC, are ready to create a national strategy for PSE. This strategy may take “Learning” and “Knowledge” as the key elements of a new accord. The creation of the Canadian Council on Learning (CCL) is perhaps a stepping stone in this direction. The Council’s fi rst annual report on PSE provides a foundation for future policy development (CCL, 2006). Certainly the models provided internally by health and externally by other federal states like Australia, Germany and the United States, should provide some guidance. This monograph has demonstrated the need for such a strategy in all areas of PSE policy (transfer payments, student assistance, research and development, vocational and technical training, Aboriginal education and training

Chapter 5 / Summary and Conclusion 129
and internationalization). The strategy must integrate all the policy areas into an approach that truly serves the national interest.
Finally, in an era when knowledge and learning will come to play an ever more important role in meeting Canadians’ social and economic aspirations there is room for a new social contract with one of the cornerstones being a pan-Canadian focus on post-secondary education.

Canadian Federal Policy and Postsecondary Education130

Appendices 131
Appendices

Canadian Federal Policy and Postsecondary Education132
Ap
pen
dix
1
Yea
r1988-8
91989-9
01990-9
11991-9
21992-9
31993-9
41
99
4-9
51
99
5-9
6
Co
nsu
mer
Pri
ce I
nd
ex f
or
Can
ad
a
U
sin
g B
ase
1992 =
100
84.8
89.0
93.3
98.5
100.0
101.8
10
2.0
10
4.2
U
sin
g B
ase
1988 =
100
100.0
105.0
110.0
116.2
117.9
120.0
12
0.3
12
2.9
Cu
rren
t D
oll
ars
(m
illi
on
s)
To
tal
Pro
gra
m S
pen
din
g$2,7
27.1
$2,9
04.7
$3,1
00.8
$2,9
94.6
$2,9
75.5
$3,0
48.9
$3
,01
0.0
$3
,03
1.1
To
tal
Cas
h T
ran
sfer
s$2,2
27.0
$2,1
66.0
$1,8
62.0
$2,1
42.0
$2,8
87.0
$2,3
78.0
$2
,48
6.0
$2
,36
5.0
Su
bto
tal
- T
ota
l C
ash
$4,9
54.1
$5,0
70.7
$4,9
62.8
$5,1
36.6
$5,8
62.5
$5,4
26.9
$5
,49
6.0
$5
,39
6.1
To
tal
Val
ue
of
Tax
Expen
dit
ure
sn.a
.n.a
.n.a
.n.a
.$374.0
$415.0
$4
39
.0$
46
0.0
To
tal
Val
ue
of
Tax
Poin
ts$2,8
56.6
$3,1
38.4
$3,2
35.0
$3,2
14.5
$3,1
79.2
$3,2
68.1
$3
,41
9.0
$3
,66
1.3
Su
bto
tal
- T
ota
l T
ax T
ransa
ctio
ns
$2,8
56.6
$3,1
38.4
$3,2
35.0
$3,2
14.5
$3,5
53.2
$3,6
83.1
$3
,85
8.0
$4
,12
1.3
To
tal
Cas
h a
nd
Tax
Tra
nsa
ctio
ns
$7,8
10.7
$8,2
09.1
$8,1
97.8
$8,3
51.1
$9,4
15.7
$9,1
10.0
$9
,35
4.0
$9
,51
7.4
19
88
Do
lla
rs (
mil
lion
s)
To
tal
Pro
gra
m S
pen
din
g$2,7
27.1
$2,7
67.6
$2,8
18.3
$2,5
78.1
$2,5
23.2
$2,5
39.8
$2
,50
2.4
$2
,46
6.8
To
tal
Cas
h T
ran
sfer
s$2,2
27.0
$2,0
63.8
$1,6
92.4
$1,8
44.1
$2,4
48.2
$1,9
80.9
$2
,06
6.8
$1
,92
4.7
Su
bto
tal
- T
ota
l C
ash
$4,9
54.1
$4,8
31.4
$4,5
10.7
$4,4
22.2
$4,9
71.4
$4,5
20.6
$4
,56
9.2
$4
,39
1.5
Tota
l V
alu
e o
f Tax E
xpenditure
sn.a
.n.a
.n.a
.n.a
.$317.2
$345.7
$365.0
$374.4
Tota
l V
alu
e o
f Tax P
oin
ts$2,8
56.6
$2,9
90.3
$2,9
40.3
$2,7
67.4
$2,6
95.9
$2,7
22.3
$2,8
42.4
$2,9
79.7
Subto
tal -
Tota
l Tax T
ransactions
$2,8
56.6
$2,9
90.3
$2,9
40.3
$2,7
67.4
$3,0
13.1
$3,0
68.0
$3,2
07.4
$3,3
54.0
Tota
l C
ash a
nd T
ax T
ransactions
$7,8
10.7
$7,8
21.7
$7,4
51.0
$7,1
89.6
$7,9
84.5
$7,5
88.7
$7,7
76.6
$7,7
45.5

Appendices 133
19
96
-97
1997-9
81998-9
91999-0
02000-0
12001-0
22002-0
32003-0
4Y
ear
Con
sum
er P
rice
In
dex
fo
r C
an
ad
a
10
5.9
107.6
108.6
110.5
113.5
116.4
119.0
122.3
Usi
ng B
ase
19
92
= 1
00
12
4.9
126.9
128.1
130.3
133.8
137.3
140.3
144.2
Usi
ng B
ase
19
88
= 1
00
Cu
rren
t D
oll
ars
(m
illi
on
s)
$2
,56
6.6
$2,6
83.1
$3,2
57.3
$3,5
59.7
$3,8
18.0
$4,0
28.8
$3,9
93.2
$4,5
14.1
Tota
l P
rogra
m S
pen
din
g
$2
,07
4.3
$1,7
67.1
$1,7
75.8
$1,7
57.8
$2,0
57.0
$1,7
20.2
$1,8
45.8
$2,0
62.4
Tota
l C
ash T
ran
sfer
s
$4
,64
0.9
$4,4
50.2
$5,0
33.1
$5,3
17.5
$5,8
75.0
$5,7
49.0
$5,8
39.0
$6,5
76.5
Subto
tal
- T
ota
l C
ash
$5
66
.0$654.0
$807.0
$1,0
09.0
$1,1
32.0
$1,2
87.0
$1,3
38.0
$1,3
97.0
Tota
l V
alue
of
Tax
Ex
pen
dit
ure
s
$3
,90
3.0
$4,2
28.9
$4,3
40.2
$4,4
59.0
$4,6
15.7
$1,7
20.0
$1,7
94.7
$1,8
94.5
Tota
l V
alue
of
Tax
Po
ints
$4
,46
9.0
$4,8
82.9
$5,1
47.2
$5,4
68.0
$5,7
47.7
$3,0
07.0
$3,1
32.7
$3,2
91.5
Subto
tal
- T
ota
l T
ax T
ran
sact
ion
s
$9
,11
0.0
$9,3
33.0
$10,1
80.4
$10,7
85.5
$11
,622.7
$8,7
56.0
$8,9
71.8
$9,8
68.0
Tota
l C
ash a
nd
Tax
Tra
nsa
ctio
ns
1988 D
oll
ars
(m
illi
on
s)
$2
,05
5.2
$2,1
14.6
$2,5
43.5
$2,7
31.8
$2,8
52.6
$2,9
35.1
$2,8
45.6
$3,1
30.0
Tota
l P
rogra
m S
pen
din
g
$1
,66
1.0
$1,3
92.6
$1,3
86.7
$1,3
49.0
$1,5
36.9
$1,2
53.2
$1,3
15.3
$1,4
30.0
Tota
l C
ash T
ran
sfer
s
$3
,71
6.2
$3,5
07.2
$3,9
30.1
$4,0
80.8
$4,3
89.4
$4,1
88.3
$4,1
60.9
$4,5
60.0
Subto
tal
- T
ota
l C
ash
$4
53
.2$515.4
$630.1
$774.3
$845.8
$937.6
$953.5
$968.6
Tota
l V
alue
of
Tax
Ex
pen
dit
ure
s
$3
,12
5.4
$3,3
32.8
$3,3
89.1
$3,4
21.9
$3,4
48.5
$1,2
53.1
$1,2
78.9
$1,3
13.6
Tota
l V
alue
of
Tax
Po
ints
$3
,57
8.6
$3,8
48.2
$4,0
19.2
$4,1
96.3
$4,2
94.3
$2,1
90.7
$2,2
32.4
$2,2
82.2
Subto
tal
- T
ota
l T
ax T
ran
sact
ion
s
$7
,29
4.8
$7,3
55.4
$7,9
49.3
$8,2
77.0
$8,6
83.7
$6,3
79.0
$6,3
93.3
$6,8
42.2
Tota
l C
ash a
nd T
ax T
ran
sact
ion
s

Canadian Federal Policy and Postsecondary Education134
Notes
- The sharp dip in total spending in 2001-02 is a consequence of the federal government
decision to beginning dividing the tax point transfer previously earmarked only for post-
secondary with social welfare programs. There is no offi cial start date for making this divi-
sion, but in drawing up the legislation to separate the Canada Health and Social Transfer
(CHST) into the Canada Health Transfer (CHT) and the Canada Social Transfer (CST),
the relative spending between health care on the one hand and postsecondary education
and social assistance programs on the other was calculated using public accounts data for
2001-02. Accordingly, this was then chosen as the year for the new method of dividing up
the transfer payments for the purposes of this analysis.
- Tax expenditure data is not currently available prior to 1992-93, and data for 1992-93 to
1995-96 underestimates the total tax expenditure in each year by no more than $35 mil-
lion.
Sources
- Consumer Price Index, Canada, All Items, 1996 Basket, 1992 = 100, Annual - CANSIM
II Series V737344

Appendices 135

Canadian Federal Policy and Postsecondary Education136
Ap
pen
dix
2
Su
mm
ary
of
Majo
r T
ran
sfer
Paym
ents
fro
m t
he
Fed
eral
Gover
nm
ent
to P
rovin
cial
Gover
nm
ents
for
Hea
lth
Ca
re, P
ost
-Sec
on
dary
Ed
uca
tion
an
d S
oci
al A
ssis
tan
ce 1
988-8
9 t
o 2
005-0
6 (
in m
illi
on
s of
curr
ent
doll
ars
)
Yea
rP
SE
& S
oci
al A
ssis
tan
ce
Ca
sh
Hea
lth
Ta
x
Poin
tsT
ota
lC
ash
Tax P
oin
tsT
ota
lC
ash
CH
ST
Tax
Poin
tsT
ota
lC
ash
To
tal
Ta
x
Po
ints
To
tal
EP
F (
Hea
lth
+ P
SE
) E
stab
lish
ed 1
977;
CA
P (
Soci
al A
ssis
tance
) E
stab
lish
ed 1
966
19
88
-89
$6,6
78
$6,0
42
$12,7
20
$6,7
83
$2,8
57
$9,6
40
$13,4
61
$8
,89
9$
22
,36
0
19
89
-90
$6,6
63
$6,6
39
$13,3
02
$7,1
72
$3,1
38
$10,3
10
$13,8
35
$9
,77
7$
23
,61
2
19
90
-91
$6,0
33
$6,8
43
$12,8
76
$7,6
50
$3,2
35
$10,8
85
$13,6
83
$1
0,0
78
$2
3,7
61
19
91
-92
$6,6
89
$6,8
00
$13,4
89
$8,2
41
$3,2
14
$11
,455
$14
,93
0$
10
,01
4$
24
,94
4
19
92
-93
$8,0
37
$6,7
25
$14,7
62
$9,5
73
$3,1
79
$12,7
52
$17
,61
0$
9,9
04
$2
7,5
14
19
93
-94
$7,2
32
$6,9
13
$14,1
45
$9,6
14
$3,2
68
$12,8
82
$16
,84
6$
10
,18
1$
27
,02
7
19
94
-95
$7,6
91
$7,2
32
$14,9
23
$9,7
52
$3,4
19
$13,1
71
$17
,44
3$
10
,65
1$
28
,09
4
19
95
-96
$7
,115
$7,7
45
$14,8
60
$9,5
56
$3,6
61
$13,2
17
$16
,67
1$
11,4
06
$2
8,0
77
EP
F a
nd
CA
P R
epla
ced w
ith C
HS
T i
n 9
6-9
7
19
96
-97
$14,7
58
$12,1
59
$26,9
17
$14,7
58
$1
2,1
59
$2
6,9
17
19
97
-98
$12,6
12
$13,1
74
$25,7
86
$12
,61
2$
13
,17
4$
25
,78
6
19
98
-99
$12,5
28
$13,5
21
$26,0
49
$12
,52
8$
13
,52
1$
26
,04
9
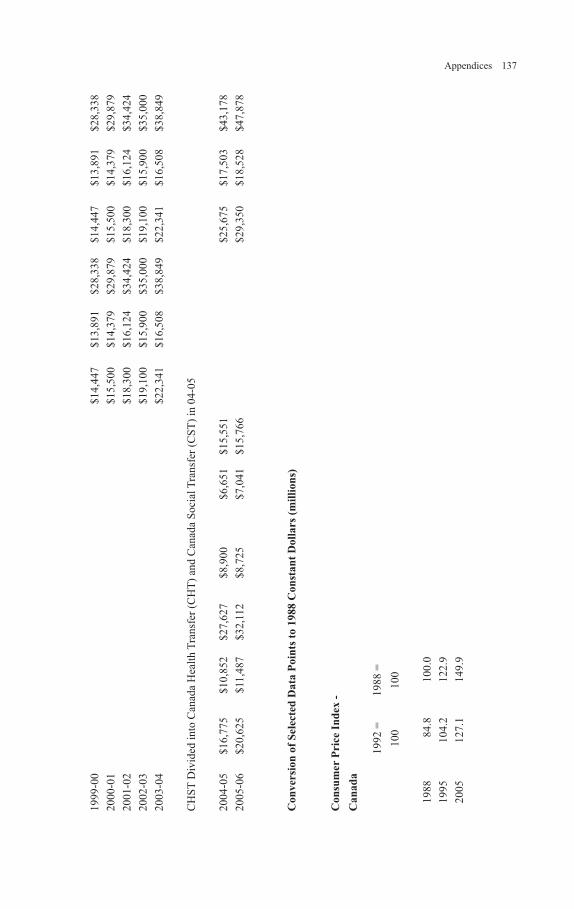
Appendices 137
19
99
-00
$14,4
47
$13,8
91
$28,3
38
$14,4
47
$1
3,8
91
$2
8,3
38
20
00
-01
$15,5
00
$14,3
79
$29,8
79
$15
,50
0$
14
,37
9$
29
,87
9
20
01
-02
$18,3
00
$16,1
24
$34,4
24
$18
,30
0$
16
,12
4$
34
,42
4
20
02
-03
$19,1
00
$15,9
00
$35,0
00
$19
,10
0$
15
,90
0$
35
,00
0
20
03
-04
$22,3
41
$16,5
08
$38,8
49
$22
,34
1$
16
,50
8$
38
,84
9
CH
ST
Div
ided
into
Can
ada
Hea
lth T
ransf
er (
CH
T)
and C
anad
a S
oci
al T
ransf
er (
CS
T)
in 0
4-0
5
20
04
-05
$1
6,7
75
$10,8
52
$27,6
27
$8,9
00
$6,6
51
$15,5
51
$25,6
75
$1
7,5
03
$4
3,1
78
20
05
-06
$2
0,6
25
$11
,487
$32,1
12
$8,7
25
$7,0
41
$15,7
66
$29,3
50
$1
8,5
28
$4
7,8
78
Co
nv
ersi
on
of
Sel
ecte
d D
ata
Poin
ts t
o 1
988 C
on
sta
nt
Doll
ars
(m
illi
on
s)
Co
nsu
mer
Pri
ce I
nd
ex -
Ca
na
da
19
92 =
10
0
1988 =
100
19
88
84.8
100.0
19
95
104.2
122.9
20
05
127.1
149.9
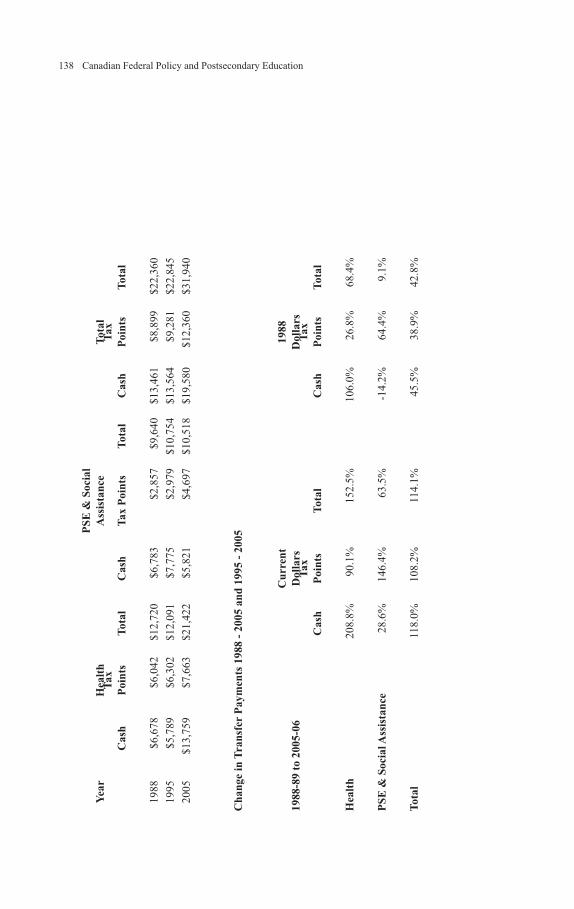
Canadian Federal Policy and Postsecondary Education138
Yea
rH
ealt
h
PS
E &
Soci
al
Ass
ista
nce
Tota
l
Ca
sh
Ta
x
Poin
tsT
ota
lC
ash
Tax P
oin
tsT
ota
lC
ash
Tax
Poin
tsT
ota
l
19
88
$6
,678
$6,0
42
$12,7
20
$6,7
83
$2,8
57
$9,6
40
$13,4
61
$8,8
99
$22,3
60
19
95
$5
,789
$6,3
02
$12,0
91
$7,7
75
$2,9
79
$10,7
54
$13,5
64
$9,2
81
$22,8
45
20
05
$1
3,7
59
$7,6
63
$21,4
22
$5,8
21
$4,6
97
$10,5
18
$19,5
80
$12,3
60
$31,9
40
Ch
an
ge
in T
ran
sfer
Paym
ents
1988 -
2005 a
nd
1995 -
2005
19
88
-89
to
20
05-0
6
Cu
rren
t
Doll
ars
1988
Doll
ars
Cash
Ta
x
Poin
tsT
ota
lC
ash
Tax
Poin
tsT
ota
l
Hea
lth
208.8
%90
.1%
152.5
%106.0
%26.8
%68.4
%
PS
E &
So
cia
l A
ssis
tan
ce28.6
%146.4
%63.5
%-1
4.2
%64.4
%9.1
%
To
tal
118.0
%108.2
%11
4.1
%45.5
%38.9
%42.8
%

Appendices 139
19
95
-96
to
20
05-0
6
Cu
rren
t
Doll
ars
1988
Doll
ars
Cash
Ta
x
Poin
tsT
ota
lC
ash
Tax
Poin
tsT
ota
l
Hea
lth
189.9
%48
.3%
116.1
%137.7
%21.6
%77.2
%
PS
E &
So
cia
l A
ssis
tan
ce-8
.7%
92.3
%19.3
%-2
5.1
%57.7
%-2
.2%
To
tal
76.1
%62.4
%70.5
%44.4
%33.2
%39.8
%

Canadian Federal Policy and Postsecondary Education140
Sources
- “Fiscal Reference Tables,” October 2004, Department of Finance - Canada, Table 11. Available on the Internet at:
http://www.fi n.gc.ca/frt/2004/frt_e.pdf
- “Federal Financial Support for the Provinces and Territories,” February 1999, Department of Finance - Canada,
Table 1 Available on the Internet at: http://www.fi n.gc.ca/budget99/fede/fed1e.html#CHST
- “Budget Plan 2000,” February 2000, Department of Finance - Canada, Chapter 6. Available on the Internet at:
http://www.fi n.gc.ca/budget00/bp/bpch6_1e.htm
- “Budget Plan 2003,” February 2003, Department of Finance - Canada, Chapter 3. Available on the Internet at:
http://www.fi n.gc.ca/budget03/bp/bpc3e.htm
- “Budget Plan 2004,” February 2004, Department of Finance - Canada, Chapter 4. Available on the Internet at:
http://www.fi n.gc.ca/budget03/bp/bpc3e.htm
- “Budget Plan 2005,” February 2005, Department of Finance - Canada, Chapter 3. Available on the Internet at:
http://www.fi n.gc.ca/budget03/bp/bpc3e.htm
- “Public Accounts of Canada - Volume II, Part I - Details of Expenditures and Revenues” for 1996 through 2004.
Available on the Internet at: http://collection.nlc-bnc.ca/100/201/301/public_accounts_can/index.html
- “Established Programs Financing: A Critical Review of the Record,” 1988, George E. Carter, Canadian Tax Journal,
Vol 36, No. 5, 1225-1243
- “EPF Cash and Tax Components,” September 10 2004, Custom Table prepared by Finance Canada
- “Federal Transfers to the Provinces and Territories,” October 2004, Department of Finance – Canada. Available on
the Internet at: http://www.fi n.gc.ca/FEDPROV/FTPTe.html
- “Major Federal Transfers to the Provinces and Territories,” October 2004, Department of Finance – Canada. Avail-
able on the Internet at: http://www.fi n.gc.ca/FEDPROV/mtpe.html
- “Total Federal Support for Health, Postsecondary Education, and Social Assistance and Social Services (2004-
05),” October 2004, Department of Finance – Canada. Available on the Internet at: http://www.fi n.gc.ca/facts/tfsh2_
e.html
- “Canada Health Transfer,” May 2004, Department of Finance - Canada, Available on the Internet at: http://www.
fi n.gc.ca/fedprov/chte.html
- “Canada Social Transfer,” April 2004, Department of Finance - Canada, Available on the Internet at: http://www.
fi n.gc.ca/fedprov/cste.html
- “A Brief History of the Health and Social Transfers,” April 2004, Department of Finance - Canada, Available on the
Internet at: http://www.fi n.gc.ca/FEDPROV/hise.html
- Consumer Price Index, Canada, All Items, 1996 Basket, 1992 = 100, Annual - CANSIM II Series V737344, 2005
CPI estimated at 2% higher the 2004
Notes
- Determining the total CHST cash transfers is not straight-forward and involves reconciling amounts reported in
budget documents, the public accounts, and Department of Finance documents. Since these documents are produced
at different points in time, there is inconsistency between the documents that can only be entirely reconciled with a
detailed analysis that is unnecessary for the purposes of this table. The margin of error of the reconciliation used in
this analysis ranges from $0 (most of the time) to about $200 million.
- CHST cash from 1996-97 onwards is apportioned to program areas and then adjusted as per the “Fiscal Reference
Tables,” Table 11
- The “Fiscal Reference Tables” report total CHST cash expenditures of $16.018 billion in 1998-99, but this includes
$3.5 billion in CHST supplements for health care in 1999-00, 2000-01 and 2001-02, as explained in the note to Table
1 of “Federal Financial Support for the Provinces and Territories.” Accordingly, the reported 1998-99 total CHST
cash expenditures have been reduced by $3.5 billion.
- The “Fiscal Reference Tables” report total CHST cash expenditures of $14,891 billion in 1999-00, but this includes
$2.5 billion in CHST supplements to be spent in 2000-01 through 2003-04, as explained in note 1 to Table 6.1 of
the “Budget Plan 2000.” Accordingly, the reported 1999-00 total CHST cash expenditures have been reduced by
$2.5 billion.

Appendices 141

Canadian Federal Policy and Postsecondary Education142
Ap
pen
dix
3

Appendices 143

Canadian Federal Policy and Postsecondary Education144
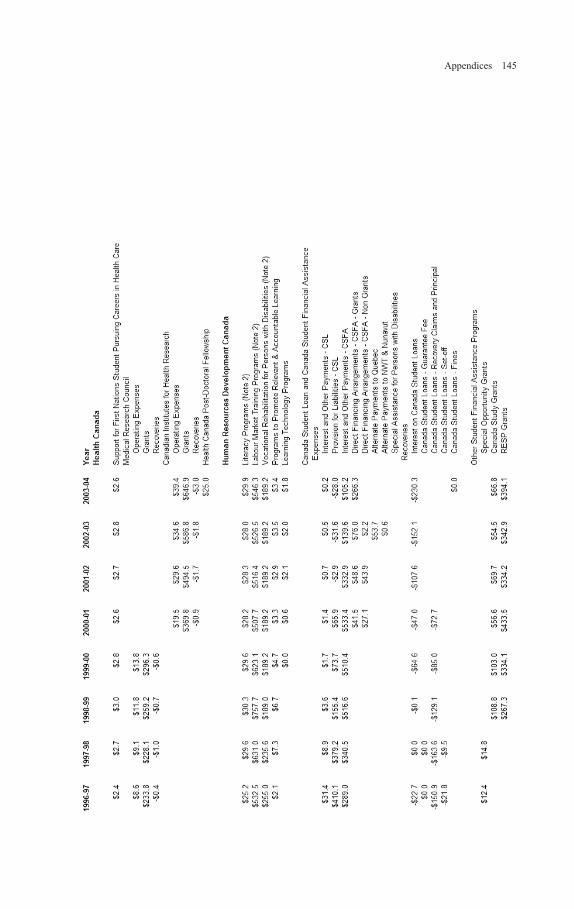
Appendices 145

Canadian Federal Policy and Postsecondary Education146

Appendices 147
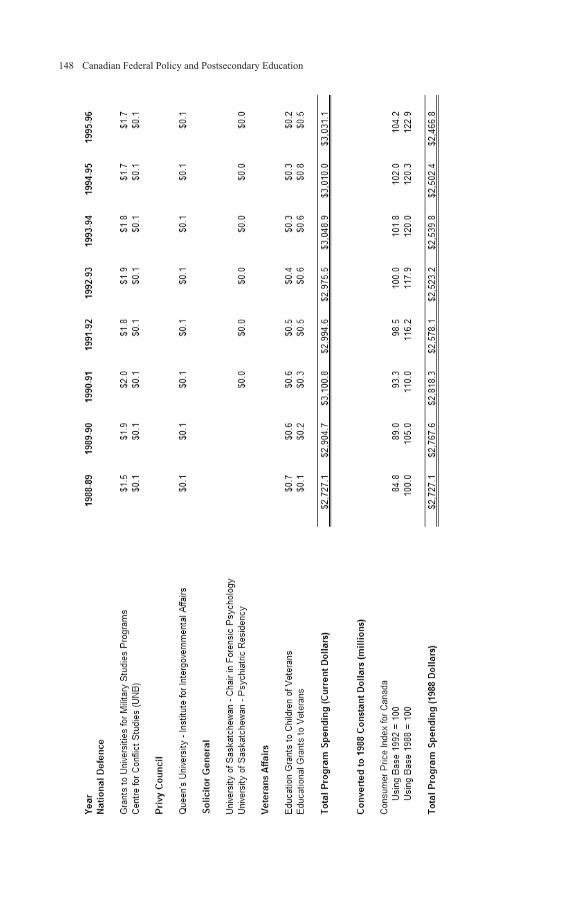
Canadian Federal Policy and Postsecondary Education148

Appendices 149

Canadian Federal Policy and Postsecondary Education150
Notes
(1) The items listed above represent the largest and most obvious program spending by
the federal government for post-secondary students and institutions to support education
and research. The list is by no means exhaustive as it includes neither those programs
that are not obviously for supporting post-secondary education or research, nor grants
made from other programs (primarily research grants). Nonetheless, the list above does
represent the vast majority of program spending by the federal government for post-
secondary education and research.
(2) A signifi cant portion of the funding for this item may be distributed to people and
programs not based at a post-secondary institution.
(3) These foundations and arm’s length agencies received endowments from the federal
government for specifi c purposes which are allocated over time. For the purpose
of this analysis, the annual expenditure by the foundation or agency is listed rather
than the payment into the endowment by the federal government. By the end of the
2003/04 fi scal year, the federal government had provided endowment funds as follows:
Canada Foundation for Innovation - $3,650.1 million, Canada Millennium Scholarship
Foundation - $2,500 million, Genome Canada - $375 million, and Canadian Council on
Learning - $85 million.
(4) The fi scal year of the Canada Millennium Scholarship Foundation is January 1
to December 31. Rather than trying to restate its fi gures to coincide with the federal
government’s fi scal year (April 1 to March 31), for the purposes of this analysis the
Foundation’s spending is assigned to the federal government fi scal year ending during the
fi scal year of the Foundation. For example, the information presented above for 2002-03
is for the Foundation’s 2003 fi scal year.
(5) Until 1992/93 Public Accounts reported both program spending and grants to
individuals for First Nations post-secondary education. In subsequent years, the
program spending for PSE is amalgamated with education program spending. The
fi gures presented here are calculated from numbers for PSE spending provided by
the Department of Indian and Northern Affairs Development to the Assembly of First
Nations. Data for 2000-01 through 2003-04 are from a custom tabulation prepared by
Indian and Northern Affairs Canada.
Sources
- “Public Accounts of Canada - Volume II, Part I - Details of Expenditures and
Revenues” for 1995 through 2004. Available on the Internet at: http://collection.nlc-bnc.
ca/100/201/301/public_accounts_can/index.html
- “Public Accounts of Canada - Volume II, Part I - Details of Expenditures and Revenues”
for 1989, 1990, 1991, 1992, 1993. Available on MICROLOG
- Annual Reports of the Canada Foundation for Innovation. Available on the Internet at:
http://www.innovation.ca/publications/index.cfm?websiteid=41
- Annual reports of the Canada Millennium Scholarship Foundation. Available on the
Internet at: http://www.millenniumscholarships.ca/en/foundation/publications/lareport/
- Annual reports of Genome Canada. Available on the Internet at: http://www.
genomecanada.ca/GCgenomeCanada/enBref/publications.asp?l=e
-”First Nations Post-Secondary Education Review”, August 2000, Assembly of First
Nations, p. 27. Available on the Internet at: http://www.afn.ca/Programs/Education/Post%
20Secondary%20Review.pdf
- Custom tabulation of post-secondary education spending prepared by Indian and
Northern Affairs Canada, May 25, 2005.

Appendices 151

Canadian Federal Policy and Postsecondary Education152
Ap
pen
dix
4

Appendices 153

Canadian Federal Policy and Postsecondary Education154

Appendices 155
No
tes
- S
ee “
Fed
eral
Pro
gra
m S
pen
din
g”
work
shee
t fo
r note
s
So
urc
es
- C
on
sum
er P
rice
Index
, C
anad
a, A
ll I
tem
s, 1
996 B
ask
et,
1992 =
100, A
nnual
- C
AN
SIM
II
Ser
ies
V737344
- S
ee “
Fed
eral
Pro
gra
m S
pen
din
g”
work
shee
t fo
r oth
er s
ourc
es

Canadian Federal Policy and Postsecondary Education156A
pp
end
ix 5

Appendices 157

Canadian Federal Policy and Postsecondary Education158
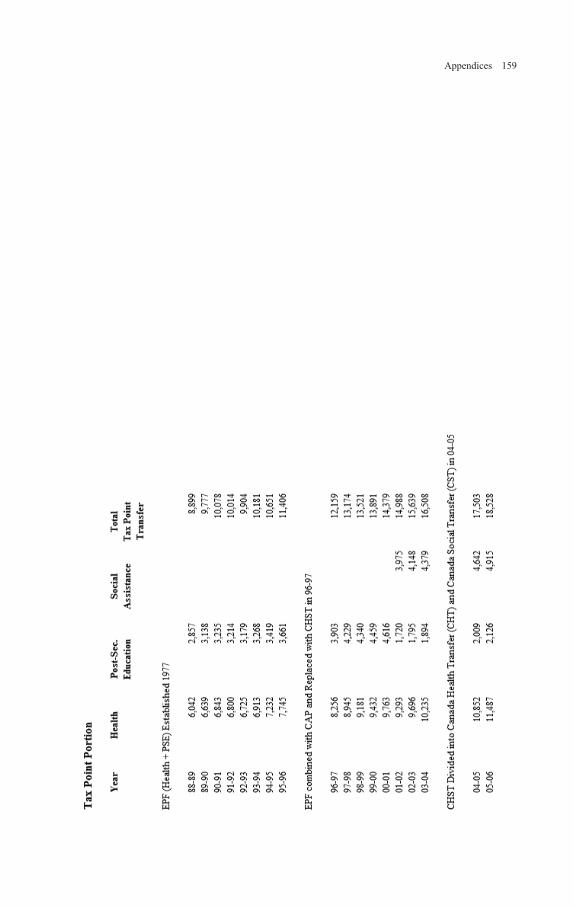
Appendices 159

Canadian Federal Policy and Postsecondary Education160
Sources
- “Fiscal Reference Tables,” October 2004, Department of Finance - Canada, Table 11.
Available on the Internet at: http://www.fi n.gc.ca/frt/2004/frt_e.pdf
- “Federal Financial Support for the Provinces and Territories,” February 1999, Depart-
ment of Finance - Canada, Table 1. Available on the Internet at: http://www.fi n.gc.ca/bud-
get99/fede/fed1e.html#CHST
- “Budget Plan 2000,” February 2000, Department of Finance - Canada, Chapter 6. Avail-
able on the Internet at: http://www.fi n.gc.ca/budget00/bp/bpch6_1e.htm
- “Budget Plan 2003,” February 2003, Department of Finance - Canada, Chapter 3. Avail-
able on the Internet at: http://www.fi n.gc.ca/budget03/bp/bpc3e.htm
- “Budget Plan 2004,” February 2004, Department of Finance - Canada, Chapter 4. Avail-
able on the Internet at: http://www.fi n.gc.ca/budget04/bp/bpc4e.htm
- “Budget Plan 2005,” February 2005, Department of Finance - Canada, Chapter 3. Avail-
able on the Internet at: http://www.fi n.gc.ca/budget05/bp/bpc3e.htm
- “Public Accounts of Canada - Volume II, Part I - Details of Expenditures and Revenues” for
1996 through 2004. Available on the Internet at: http://collection.nlc-bnc.ca/100/201/301/
public_accounts_can/index.html
- “Established Programs Financing: A Critical Review of the Record,” 1988, George E.
Carter, Canadian Tax Journal, Vol 36, No. 5, 1225-1243
- “EPF Cash and Tax Components,” September 10 2004, Custom Table prepared by De-
partment of Finance - Canada
- “Federal Transfers to the Provinces and Territories,” October 2004, Department of Finance
– Canada. Available on the Internet at: http://www.fi n.gc.ca/FEDPROV/FTPTe.html
- “Major Federal Transfers to the Provinces and Territories,” October 2004, Department
of Finance – Canada. Available on the Internet at: http://www.fi n.gc.ca/FEDPROV/mtpe.
html
- “Total Federal Support for Health, Post-Secondary Education, and Social Assistance and
Social Services (2004-05),” October 2004, Department of Finance – Canada. Available on
the Internet at: http://www.fi n.gc.ca/facts/tfsh2_e.html
- “Canada Health Transfer,” May 2004, Department of Finance - Canada, Available on the
Internet at: http://www.fi n.gc.ca/fedprov/chte.html
- “Canada Social Transfer,” April 2004, Department of Finance - Canada, Available on the
Internet at: http://www.fi n.gc.ca/fedprov/cste.html
- “A Brief History of the Health and Social Transfers,” April 2004, Department of Finance
- Canada, Available on the Internet at: http://www.fi n.gc.ca/FEDPROV/hise.html
- “Further Information on $36 Billion in Federal Spending on Education and Innovation,”
June 9, 2004, Chris Harback, Human Resources and Skills Development Canada
- “Restructuring the CHST,” May 11 2005, E-Mail prepared by Department of Finance
- Canada
- Consumer Price Index, Canada, All Items, 1996 Basket, 1992 = 100, Annual - CANSIM
II Series V737344, 2005 CPI estimated at 2% higher the 2004
Notes
- Determining the total CHST cash transfers is not straight-forward and involves reconcil-
ing amounts reported in budget documents, the public accounts, and Department of Fi-
nance documents. Since these documents are produced at different points in time, there is
inconsistency between the documents that can only be entirely reconciled with a detailed
analysis that is unnecessary for the purposes of this table, which is to provide a broad-
stroke overview.
- Apportioning of CHST cash to program areas from 1996-97 to 1999-2000 is based on
proportions in the fi nal year of EPF and CAP (1995-96). Apportioning from 2001-02 to
2003-04 is based on 62% for health care and 38% for post-secondary education and social

Appendices 161
programs as per “Restructuring the CHST.” The latter amount is further subdivided with
30.2% for post-secondary education and 69.8% for social programs as per “Further Infor-
mation on $36 Billion in Federal Spending on Education and Innovation.” From 2004-05
onwards the health amount is reported separately, and so the residual amount is appor-
tioned 30.2% / 69.8% as per above.
- Apportioning of the EPF and CHST tax transfers from 1996-97 to 1999-2000 is based on
the historical division of 67.9% for health care and 32.1% for post-secondary education as
explained in Carter (1988), p. 1231. Despite the introduction of the CHST in 1996-97, the
tax point transfers are still considered to be only for health care and post-secondary educa-
tion, and not for social welfare programs, through 1999-2000. For 2001-02 onwards, the
federal government appears to have assumed that tax point transfers are also for funding
social welfare programs, and thus the residual amount (after taking out the amount dedi-
cated for health care) is divided 30.2% for post-secondary education and 69.8% for social
welfare programs as explained above.
- CHST cash from 1996-97 onwards is apportioned to program areas and then adjusted as
per the “Fiscal Reference Tables,” Table 11
- The “Fiscal Reference Tables” report total CHST cash expenditures of $16.018 billion in
1998-99, but this includes $3.5 billion in CHST supplements for health care in 1999-00,
2000-01 and 2001-02, as explained in the note to Table 1 of “Federal Financial Support for
the Provinces and Territories.” Accordingly, the reported 1998-99 total CHST cash expen-
ditures have been reduced by $3.5 billion.
- The “Fiscal Reference Tables” report total CHST cash expenditures of $14,891 billion
in 1999-00, but this includes $2.5 billion in CHST supplements to be spent in 2000-01
through 2003-04, as explained in note 1 to Table 6.1 of the “Budget Plan 2000.” Accord-
ingly, the reported 1999-00 total CHST cash expenditures have been reduced by $2.5 bil-
lion.
- The “Fiscal Reference Tables” report total CHST cash expenditures of $21,100 billion in
2002-03, but this includes $2.5 billion in health care supplements to be spent in 2003-04
through 2005-06, as explained in note 1 to Table 4.2 of the “Budget Plan 2004.” Accord-
ingly, the reported 2002-03 total CHST cash expenditures have been reduced by $2.5 bil-
lion.

Canadian Federal Policy and Postsecondary Education162
Year
Natu
ral S
cie
nces a
nd
Engin
eering (
NS
&E
)
($M
)
%C
hange
Socia
l S
cie
nces a
nd
Hum
aniti
es (
SS
&H
)
($M
)
% C
hange
All
Researc
h (
$M
)
(Curr
ent dolla
rs)
All
Researc
h (
$M
)
(Consta
nt dolla
rs)
BS
&E
/SS
&H
1971
122
5%
12
134
640
10
1972
122
0%
12
0%
134
611
10
1973
129
6%
12
0%
141
597
11
1974
133
3%
14
17%
147
559
10
1975
140
5%
16
14%
156
538
9
1976
150
7%
17
6%
167
536
9
1977
171
14%
21
24%
192
571
8
1978
185
8%
25
19%
210
573
7
1979
205
11%
29
16%
234
585
7
1980
255
24%
33
14%
288
654
8
1981
315
24%
39
18%
354
715
8
1982
347
10%
46
18%
393
716
8
1983
406
17%
51
11%
457
787
8
1984
461
14%
56
10%
517
853
8
1985
461
0%
54
-4%
515
817
9
1986
464
1%
59
9%
523
797
8
1987
497
7%
64
8%
561
819
8
1988
551
11%
74
16%
625
877
7
1989
589
7%
80
8%
669
895
7
1990
687
17%
96
20%
783
999
7
1991
713
4%
100
4%
813
982
7
1992
731
3%
118
18%
849
1,0
10
6
1993
763
4%
110
-7%
873
1,0
21
7
1994
764
0%
106
-4%
870
1,0
15
7
1995
748
-2%
107
1%
855
976
7
1996
708
-5%
101
-6%
809
909
7
1997
692
-2%
101
0%
793
877
7
1998
751
9%
112
11%
863
946
7
1999
943
26%
142
27%
1085
1,1
68
7
2000
1106
17%
187
32%
1293
1,3
56
6
2001
1356
23%
231
24%
1587
1,6
22
6
2002
1588
17%
229
-1%
1817
1,8
17
7
2003
1779
12%
256
12%
2035
1,9
80
7
2004
1992
12%
287
12%
2279
2,1
77
7
Sourc
e: S
tatis
tics C
anada. C
AN
SIM
Table
s 3
58-0
001 (
Gro
ss E
xpenditu
res)
and 3
26-0
002 (
CP
I)
Ap
pen
dix
6
Fed
eral
Fu
nd
ing f
or
Post
seco
nd
ary
Ed
uca
tion
Sec
tor
Res
earc
h (
$M
; $C
urr
ent)

Bibliography 163
Bibliography
Abele, F. (1992). The politics of competitiveness. In F. Aberle (Ed.), How Ottawa spends, 1992-93 (pp. 1-22). Ottawa: Carleton University Press.
About the Canada Student Loans Program. Retrieved April 3, 2004, from www.
sdc.gc.ca/asp/gateway.asp?hr=en/hip/cslp/About/01_ab_MissionProgram.
shtml&hs=cxp
Allmand, W. (1981). Report: Parliamentary Task Force on Employment Opportunities for the 1980s. Work for tomorrow: Employment opportunities for the 1980s. Ottawa: House of Commons.
Anisef, P., Bertrand, M.A., Hortian,U., and James, C.E. (1985). Accessibilityto postsecondary education in Canada: A review of the literature. Ottawa:
Department of the Secretary of State of Canada.
ARA Consulting Group Inc. (1997). Evaluation of the Networks of Centres of Excellence Program, Final report. Unpublished paper prepared for the NCE
Program Evaluation Committee.
Assembly of First Nations. (2000). First Nations PSE review. Ottawa: Author.
-----. (2003). Investing in the future: First Nations education in Canada. Ottawa:
Author.
Association of Universities and Colleges of Canada. (1965). Financing higher education in Canada: Being the report of a commission [Bladen Commission].
Toronto: University of Toronto Press.
-----. (1991). Report of the Commission of Inquiry on Canadian University Education [Smith Report]. Ottawa: Author.
-----. (1994a). Notes for a presentation to the House of Commons Standing Committee on Human Resources Development regarding the federal government’s discussion paper entitled Improving Social Security in Canada.
Ottawa: Author.
-----. (1994b). Backgrounder: Social security review. Impact on postsecondary education: Clarifying contradictory data. Unpublished paper, Association of
Universities and Colleges of Canada, Ottawa.
-----. (1995). AUCC Statement on internationalization and Canadian universities.
Ottawa: Author. Retrieved May 26, 2004, from www.aucc.ca
-----. (1999). Trends: The Canadian university in profi le. Ottawa: Author.
-----. (2002a). A strong foundation for innovation: An AUCC action plan. Ottawa:
Author.
-----. (2002b). Framework of agreed principles on federally funded university research. Ottawa: Author. Available at: www.aucc.ca/_pdf/english/
reports/2002/frame_cadre_e.pdf

Canadian Federal Policy and Postsecondary Education164
-----. (2003). Public policy and advocacy statement on internationalization.
Ottawa: Author. Retrieved May 26, 2004, from www.aucc.ca
Atkinson-Grosjean, J. (1999). Excellence, networks and the pursuit of profi t:
Academic science and public policy in Canada. Unpublished conference
paper, Society for the Social Studies of Science, San Diego, CA.
Atkinson-Grosjean, J., House, D., and Fisher, D. (2001). Canadian science policy
and public research organizations in the 20th century. Science Studies: An Interdisciplinary Journal for Science and Technology Studies, 14(1), 3–25.
Auditor General of Canada. (1988). Report of the Auditor General of Canada.
Retrieved February 6, 2005, from www.oag-bvg.gc.ca/domino/reports.nsf/
html/88menu_e.html
Bakvis, H. (2002). A checkerboard federalism? Labour market development
policy in Canada. In H. Bakvis and G. Skogstad (Eds.), Canadian federalism: Performance, effectiveness, and legitimacy. Don Mills ON: Oxford.
Beavon, D. and Cooke, M. (2003). An application of the United Nations Human
Development Index to Registered Indians in Canada, 1996. In J. White,
P. Maxim, and D. Beavon (Eds.), Aboriginal conditions: Research as a foundation for public policy (pp. 201 -221). Vancouver: UBC Press.
Bell, D. (2004). 1960 Canada passes the Technical and Vocational Training Assistance Act. In D. Schugurensky (Ed.), History of education: Selected moments of the 20th century. [Online.] Retrieved September 19, 2004, from
http://fcis.oise.utoronto.ca/~daniel_schugurensky/assignment1/File
Berger, M.T. (1984). Accessibility to PSE in British Columbia. Ottawa: Canadian
Federation of Students.
Bertram, G.W. (1966). The contribution of education to economic growth (Staff
Study No. 12). Ottawa: Queen’s Printer and Controller of Stationery.
Blackhouse, C. (2003). Gender and race in the construction of legal
professionalism: Historical perspectives. Retrieved August 8, 2005, from
www.lsuc.on.ca/media/constance_backhouse_gender_and_race.pdf
Bonneau, L.P. and Corry, J.A. (1972). Quest for the optimum: Research policy in the universities of Canada. The report of a Commission to Study the Rationalisation of University Research (2 vols.). Ottawa: Association of
Universities and Colleges of Canada.
Brassard, D. (1996). Science and technology: The new federal policy. Ottawa:
Library of Parliament. Available at: www.parl.gc.ca/information/library/
PRBpubs/bp414-e.htm
British Columbia. (1916). Report of the Royal Commission on Indian Affairs. Victoria: Provincial Printer.

Bibliography 165
Britton, J. and Gilmour, J. (1978). The weakest link: A technological perspective on Canadian industrial underdevelopment. Ottawa: Science Council of
Canada.
Cameron, D. (1991). More than an academic question: Universities, government and public policy in Canada. Halifax: Institute for Research on Public
Policy.
Cameron, D.M. (1992). Higher education in federal systems: Canada. In D. Brown,
P. Cazalis, and G. Jasmin (Eds.), Higher education in federal systems (pp.
45–67). Kingston, ON: Queen’s Institute of Intergovernmental Relations.
-----. (2004). Collaborative federalism and PSE: Be careful what you wish for. Retrieved September 19, 2004, from http://jdi.econ.queensu.ca/Files/
Conferences/PSEconferencepapers/Cameronconferencepaper.pdf
Canada. (1985). Indian Act. Revised Statutes of Canada, I-5.
-----. (1997). Budget Implementation Act. 45-46 Elizabeth II. C. 26. Available at:
www.parl.gc.ca/bills/government/C-93/C-93_4/C-93_cover-E.html
-----. (1998). Budget Implementation Act. 46-47 Elizabeth II. C. 21. Available at:
www.parl.gc.ca/bills/government/C-93/C-93_4/C-93_cover-E.html
Canada, House of Commons. (2005). Bill C-55, First Session, Thirty-eighth
Parliament, 53-54 Elizabeth II, 2004-2005. Available at: www.parl.gc.ca/
PDF/38/1/parlbus/chambus/house/bills/government/C-55_1.PDF
Canada, Ministry of Finance. (1981). Fiscal arrangements in the eighties: Proposals of the Government of Canada. Presented by the Honourable Allan J MacEachern, Deputy Prime Minister and Minister of Finance. Ottawa:
Author.
Canada Council for the Arts. (2004a). A brief history of the Canada Council for the Arts. Available at: www.canadacouncil.ca/aboutus/history
-----. (2004b). Killam Prizes. Avalable at: www.canadacouncil.ca/prizes/killam/
nf127281699611562500.htm
Canada Millennium Scholarship Foundation. (2001). Does money matter?Montreal: Author.
-----. (2003). Trickle-down fi scal federalism: The use of the federal spending power for income support. Montreal: Author.
Canada Millennium Scholarship Foundation and British Columbia Ministry of
Education. (2003). New $5 million program to give students a boost. News
Release, October 23.
Canada Millennium Scholarship Foundation and New Brunswick Education.
(2004). Improving access to PSE in New Brunswick. News Release, March
16.
Canadian Federal Policy and Postsecondary Education166
Canada Millennium Scholarship Foundation and Government of Manitoba.
(2005). Manitoba and the Canada Millennium Scholarship Foundation partner to encourage Aboriginal access to postsecondary education. News
Release, March 7.
Canadian Association of University Teachers. (1993). Brief to the Standing Committee on National Finance on Bill C-93. Ottawa: Author.
-----. (1999). Not in the public interest: University fi nance in Canada 1972-1998.
CAUT Education Review, 1(3).
-----. (2001a). University and college affordability: How and why have fees
increased? CAUT Education Review, 3(2).
-----. (2001b). The growing funding gap: Government expenditures on PSE, 2000-
01. CAUT Education Review, 3(3).
-----. (2001c). Access denied: The affordability of PSE in Canada, 1857 to 2002.
CAUT Education Review, 4(1).
-----. (2005). Almanac of postsecondary education in Canada. Ottawa: Author.
-----. (2006). Almanac of postsecondary education in Canada. Ottawa: Author.
Canadian Career Development Foundation. (2003). The role of guidance in postsecondary planning. Montreal: Canada Millennium Scholarship
Foundation.
Canadian Council on Learning. (2006). Canadian post-secondary education: A positive record - an uncertain future. Report on learning in Canada 06. Retrieved December 30, 2006, from www.ccl-cca.ca/NR/rdonlyres/
BD46F091-D856-4EEB-B361-D83780BFE78C/0/PSEReport2006EN.pdf
Canadian Federation of Students. (1994). Lifelong learning or lifelong debt?Unpublished paper [November 4], Canadian Federation of Students,
Ottawa.
-----. (2001). Latest changes to the Canada Student Loan Program. Unpublished
paper, Canadian Federation of Students, Ottawa.
-----. (2004a). Bankruptcy Charter challenge. Available at: www.cfs-fcee.ca/html/
english/campaigns/bankruptcy_charter.php
-----. (2004b). Student fi nancial assistance: Millennium Scholarship Foundation.
Available at: www.cfs-fcee.ca/html/english/campaigns/millenium.php
-----. (2005). Public statement on the Ontario Superior Court judgment in student loan bankruptcy case. Retrieved August 9, 2005, from http://action.web.ca/
home/cfs/en_alerts.shtml?x=78914
Canadian Parliament, Standing Senate Committee on National Finance and
Leblanc, F.E. (1987). Federal policy on PSE: Report of the Standing Senate Committee on National Finance. Ottawa: The Committee.

Bibliography 167
Canadian Undergraduate Survey Consortium (2004). Report on Survey of First Year Undergraduates. Retrieved September 10, 2005, from www.uottawa.
ca/services/irp/eng/surveys.html
Carter, G.E. (1988). Established Programs Financing: A critical review of the
record. Canadian Tax Journal, 36, 1225-1243.
Centre for Policy Studies in Education, UBC. (1993). The changing role of vocational and technical education and training, Canada. Vancouver:
Council of Ministers of Education, Canada and Department of Employment
and Immigration.
Clift, R.F. (2002). The fullest development of human potential: The Canadian Union of Students, 1963-1969. Unpublished magistral thesis, University of
British Columbia.
Cook, G.A. and Stager, D.A.A. (1970). Contingent repayment student assistance programs: A simulated analysis. Toronto: Institute for the Quantitative
Analysis of Social and Economic Policy.
Corak, M., Lipps, G., and Zhao J. (2003). Family income and participation in PSE. Ottawa: Statistics Canada.
Council of Canadian Academies, Committee on the State of Science & Technology
in Canada. (2006). The state of science & technology in Canada. Ottawa:
Council of Canadian Academies.
Council of Ontario Universities, Ontario Ministry of Education and Training,
Association of Colleges of Applied Arts and Technology of Ontario,
Association of Universities and Colleges of Canada, and Government of
Canada. (1995). Final report of the Income Contingent Repayment Plan Symposium. Toronto: Council of Ontario Universities.
Cunningham, A., Redmond C., and Merisotis J. (2003). Investing early: Intervention programs in selected U.S. states. Montreal: Canada Millennium
Scholarship Foundation.
Cuthand, S. (1991). The Native Peoples of the prairie provinces in the 1920s
and 1930s. In J.R. Miller (Ed.), Sweet promises: A reader on Indian-White relations in Canada (pp. 381-392). Toronto: University of Toronto Press.
Davenport, P. (2000). Universities, innovation and the knowledge-based economy.Paper presented at the CERF/IRRP Conference on Creating Canada’s
Advantage in an Information Age, Ottawa.
Dennison, J.D. and Gallagher, P. (1986). Canada’s community colleges: A critical analysis. Vancouver: UBC Press.
Department of Finance Canada. (1995). Budget in brief – 1995. Ottawa: Author.
Available at: www.fi n.gc.ca/budget95/binb/brief.pdf
-----. (1996). The budget plan – 1996. Ottawa: Author. Available at: www.fi n.
gc.ca/budget96/bp/bp96e.pdf

Canadian Federal Policy and Postsecondary Education168
-----. (1997). The budget plan – 1997. Ottawa: Author. Available at: www.fi n.
gc.ca/budget97/binb/bp/bp97e.pdf
-----. (1998a). The Canada Education Savings Grant. Ottawa: Author.
-----. (1998b). The Canadian Opportunities Strategy. Ottawa: Author.
-----. (1998c). The budget plan – 1998. Ottawa: Author. Available at: www.fi n.
gc.ca/scripts/Publication_Request/request_e.asp?doc=bp98e.pdf&title=1998
percent20Budget percent20Plan
-----. (1999). The budget plan – 1999. Ottawa: Author. Available at: www.fi n.
gc.ca/budget99/bp/bpwmfe.exe
-----. (2000). The budget plan – 2000. Ottawa: Author. Available at: www.fi n.
gc.ca/budget00/pdf/bpe.pdf
-----. (2001). The budget plan – 2001. Ottawa: Author. Available at: ww.fi n.gc.ca/
budget01/pdf/bpe.pdf
-----. (2003). The budget plan – 2003. Ottawa: Author. Available at: www.fi n.
gc.ca/budget03/pdf/bp2003e.pdf
-----. (2004). The budget plan – 2004. Ottawa: Author. Available at: www.fi n.
gc.ca/budget04/pdf/bp2004e.pdf
Department of Indian Affairs and Northern Development. (2004). Basicdepartmental data – 2003. Ottawa: Author.
Dodge, D. (1981). Canada Employment and Immigration: Labour market development in the 1980s. Ottawa: Minister of Supply and Services.
Dorion, J. and Yang, K.R. (2000). Métis postsecondary education: A case study
of the Gabriel Dumont Insitutite. In M.B. Castellano, L. Davis, and L.
Lahache (Eds.), Aboriginal education: Fulfi lling the promise (pp. 176-189).
Vancouver: UBC Press.
Doutriaux, J. and Barker, M. (1995). The university-industry relationship in science and technology. Ottawa: Industry Canada. Available at: http://strategis.ic.gc.
ca/epic/internet/ineas-aes.nsf/vwapj/op11e.pdf/$FILE/op11e.pdf
Drucker, P. F. (2002). Managing the next society. New York: St. Martin’s Press.
Dufour, P. and de la Mothe, J. (1993). The historical conditioning of S&T. In
P. Dufour and J. de la Mothe (Eds.), Science and technology in Canada..London: Longman.
Duncan, C. (1994). A Critique of the federal government’s higher education proposals in the discussion paper, Improving Social Security in Canada.
Unpublished paper, Canadian Federation of Students British Columbia
Offi ce, Vancouver.

Bibliography 169
Dupre, J.S., Cameron, D., McKechnie G., and Rotenberg, T. (1973). Federalismand policy development: The case of adult occupational training in Ontario.
Toronto: University of Toronto Press.
Economic Council of Canada. (1964). First annual review. Ottawa: Author.
-----. (1965). Annual review. Ottawa: Author.
-----. (1969). Annual review. Ottawa: Author.
-----. (1973). Papers of the National Economic Conference. Montréal: Author.
-----. (1990). Good jobs, bad jobs: Employment in the service economy (Cat. No.
EC22-164/1990E). Ottawa: Author.
Evaluation and Data Development. (1997). Evaluation of the Canada Student Loans Program: Final report. Ottawa: Human Resources Development
Canada.
Evans, K. (2005). Going global with the locals: Examining the impact of internationalization on university colleges in British Columbia. Unpublished
doctoral dissertation, University of British Columbia.
Expert Panel on Canada’s Role in International Science and Technology.
(2000). Reaching out: Canada, international science and technology, and the knowledge-based economy. Ottawa: Advisory Council on Science and
Technology. Available at: http://acst-ccst.gc.ca/intel/report-web2/rw2_title_
e.html
Expert Panel on the Commercialization of University Research. (1999). Publicinvestments in university research: Reaping the benefi ts. Ottawa: Advisory
Council on Science and Technology. Available at: http://acst-ccst.gc.ca/
comm/rpaper_html/report_title_e.html
Federal Task Force on Program Review. (1986). A study report: Job creation, training and employment services. Ottawa: Supply and Services Canada.
Finnie, R. and Schwartz, S. (1996). The CSLP through the early 1990s. In Studentloans in Canada: Past, present and future. Toronto: C.D. Howe Institute.
Fisher, D., Atkinson-Grosjean, J., and House, D. (2001). Changes in academy/
industry/state relations in Canada: The creation and development of the
Networks of Centres of Excellence. Minerva, 39, 299–325.
Four Directions Consulting Group. (2004). Implications of First Nations demography: Final report. Ottawa: Department of Indian Affairs and
Northern Development.
Friedman, R.S. and Friedman, R.C. (1990). The Canadian universities and the
promotion of economic development, Minerva, 28, 272-293.
George, Chief D. (1967). Chief Dan George 1967 Canada centennial speech.
Retrieved January 18, 2005, from www.chiefdangeorge.ca/1967_centennial_
speech.htm

Canadian Federal Policy and Postsecondary Education170
Gertler, M. (1996). Capital, technological change and regional growth. In J.
Britton (Ed.), Canada and the global economy. Montreal and Kingston:
McGill-Queen’s University Press.
Government of Canada. (1939). Report of the Royal Commission on Dominion Provincial Relations [Rowell-Sirois Commission]. Ottawa: King’s Printer.
-----. (1951). Report of the Royal Commission on National Development in the Arts, Letters and Sciences, 1949-1951 [Massey Commission]. Ottawa: King’s
Printer.
-----. (1960). Technical and Vocational Training Assistance Act of 1960. Ottawa:
Queen’s Printer.
-----. (1962). Report of the Royal Commission on Government Organization[Glasco Commission]. Ottawa: Queen’s Printer.
-----. (1964). Report of the Royal Commission on Health Services [Hall
Commission]. Ottawa: Queen’s Printer.
-----. (1981). Report of the Parliamentary Task Force on Federal-Provincial Fiscal Arrangements [Breau Report]. Ottawa: Queen’s Printer.
-----. (1987). InnovAction: The Canadian strategy for science and technology.
Ottawa: Queen’s Printer.
-----. (1996). Report of the Royal Commission on Aboriginal Peoples (3 vols.).
Ottawa: Canada Communications Group.
-----. (2002a). Knowledge matters: Skills and learning for Canadians. Ottawa:
HRDC.
-----. (2002b). Achieving excellence: Investing in people, knowledge and opportunity. Ottawa: Industry Canada.
Government of Canada and Human Resources and Development Canada. (1994).
Profi le of post-secondary education in Canada, 1993 edition. Ottawa:
Ministry of Supply and Services Canada.
Green, M. (2002). Joining the world: The challenge of internationalizing
undergraduate education. Change,.May/June, pp. 13-21.
Green, M. and Knight, J. (2003, November). Cross border post secondary education in North America. Draft document prepared in collaboration with
the OECD for OECD/Norway Forum on Trade in International Services,
Trondheim, Norway.
Gunther, M. and Van Loon, R.J. (1981). Federal contribution to postsecondary
education: Trends and issues. In D.M..Nowlan and R. Bellaine (Eds.),
Financing Canadian universities: For whom and by whom? Toronto: Institute
for Policy Analysis and Canadian Association of University Teachers.
Guppy, N. (1984). Access to higher education in Canada. The Canadian Journal of Higher Education, 29(3), 79-93.

Bibliography 171
Guston, D.H. and Keniston, K. (1994). Introduction: The Social Contract for
science. In D.H. Guston and K. Keniston (Eds.), The fragile contract: University science and the federal government (pp. 1-41). Cambridge, MA:
MIT Press.
Haig-Brown, C. (1995). Taking control: Power and contradiction in First Nations adult education. Vancouver: UBC Press.
Harris, R.S. (1976). A history of higher education in Canada: 1663-1960. Toronto:
University of Toronto Press.
Hawthorne, H.B. (1967). A survey of the contemporary Indians of Canada (Vol.
2). Ottawa: Queen’s Printer.
Hayden, M. (1983). Seeking a balance: University of Saskatchewan, 1907-1982.
Vancouver: University of British Columbia Press.
Health Canada. (2004). Budget 1999: The federal role in health. Retrieved
September 12, 2005, from www.hc-sc.gc.ca/english/budget/1999/factsht7.
htm
Healy, D. (1978). Report of the Commission on Graduate Studies in the Humanities and Social Sciences [Healy Commission] (Vol. 1). Ottawa: Social Sciences
and Humanities Research Council of Canada.
Hilyer, G.M. (1997). Higher education in the Northwest Territories. In G.A. Jones
(Ed.), Higher education in Canada: Different systems, different perspectives.New York: Garland.
Hollinger, D.A. (1995). Science as a weapon in kulturkämpfe in the United States
during and after World War II. Isis, 86, 440-454.
Horn, M. (1999). Academic freedom in Canada: A history. Toronto: University
of Toronto Press.
Horry, I. and Walker, M. (1994). Government spending facts two. Vancouver: The
Fraser Institute.
Human Resources Development Canada. (1994a). Improving social security in Canada: A discussion paper. Ottawa: Government of Canada. Available at:
www.canadiansocialresearch.net/ssrdiscussionpaper.htm
-----. (1994b). Federal support to PSE reference notes. Unpublished paper,
Minister of Human Resources Development, Ottawa.
-----. (2002). Knowledge matters: Skills and learning for Canadians. Ottawa:
Author. Available at: www.11.sdc.gc.ca/sl-ca/doc/toc.shtml
Human Resources and Skills Development Canada. (2004). Labour Market Development Agreements. Available at: www.hrsdc.gc.ca/en/epb/lmd/lmda/
lmda.shtml
-----. (2005a). The Workplace Skills Strategy: Consultation backgrounder. Ottawa:
Author.
Canadian Federal Policy and Postsecondary Education172
-----. (2005b). A Report on Plans and Priorities 2005-2006. Ottawa: Author.
Hurtubise, R. and Rowat, D.C. (1970). The university, society and government.Ottawa: University of Ottawa Press.
Indian and Northern Affairs Canada. (2000). Postsecondary education for Status Indians and Inuit. Ottawa: Author.
-----. (2003). Basic departmental data – 2003. Ottawa: Author. Retrieved January
11, 2005, from http:///www.ainc-inac.gc.ca/pr/sts/bdd03/bdd03_e.pdf
-----. (2004). Individuals responsible for Indian and Northern Affairs in Canada, 1755 to 2004. Retrieved January 23, 2005, from www.ainc-inac.gc.ca/pr/
info/irp_e.html
Industry Canada. (1996). Science and technology for the new century: A federal strategy. Ottawa: Government of Canada.
-----. (2002). Achieving excellence: Investing in people, knowledge and opportunity.
Ottawa: Author. Available at: www.innovationstrategy.gc.ca/gol/innovation/
interface.nsf/vSSGBasic/in04142e.htm
Institute of Intergovernmental Relations. (2003). Canada Millennium Scholarship Foundation: Evaluation of the Foundation’s performance, 1998-2002.
Montreal: Canada Millennium Scholarship Foundation.
Johnson, A.W. (1985). Giving greater point and purpose to the federal funding of postsecondary education and research in Canada. Ottawa: Secretary of State.
Jones, G.A. (1996). Governments, governance, and Canadian universities. In J.C.
Smart (Ed.), Higher education: Handbook of theory and research (Volume
XI, pp. 337-371). New York: Agathon Press.
-----. (Ed.). (1997). Higher education in Canada: Different systems, different perspectives. New York: Garland.
-----. (2004). Canada. In J.K. Forest and P.G. Altbach (Eds.), Internationalhandbook of higher education. Dordrecht, The Netherlands: Kluwer
Academic Publishers.
Junor, S. and Usher, A. (2004). The price of knowledge 2004: Access and student fi nance in Canada (Millennium Research Series). Montreal: Millennium
Scholarship Foundation.
Kunin, R. and Associates. (2004). Provincial funding of apprenticeship programs in Canada: How much are we investing? Vancouver: HRDC.
Lamontagne, M. [Chair]. (1970 -1977). A science policy for Canada. Report of the Senate Special Committee on Science Policy [Lamontagne Report]. (4
vols.). Ottawa: Information Canada.
Lazar, H. (2002). Shifting roles: Active labour market policy in Canada under the Labour Market Development Agreements. Ottawa: Canadian Policy Research
Networks.

Bibliography 173
Lazar, H. and Klassen, T.R. (2000). The Federal-Provincial Labour Market
Development Agreements: Brave new model of collaboration. In T. McIntosh
(Ed.), Federalism, democracy and labour market policy in Canada. Kingston,
ON: Institute of Intergovernmental Relations.
Lee, J.S.H. (2005). Access to Postsecondary Education: A Comparative Study of British Columbia and Ontario. Unpublished Ph.D. thesis, University of
British Columbia.
Liberal Party of Canada. (1993). Creating opportunity: The Liberal Plan for Canada. [Ottawa]: Author.
Looker, D. and Lowe, G.S. (2001). Postsecondary access and student fi nancial aid in Canada: Current knowledge and research gaps. Ottawa: Canadian
Policy Research Networks.
Macdonald Report. (1969). The role of the federal government in support of research in Canadian universities (Special Study No. 7). Ottawa: Science
Council of Canada.
Mackenzie, H. (2004). Funding postsecondary education in Ontario: Beyond the path of least resistance. Toronto: Ontario Coalition for Postsecondary
Education.
Malatest, R.A. and Associates Ltd. (2004). First Nations Peoples and PSE: What educators have learned. Montreal: Canada Millennium Scholarship
Foundation.
Martin, P. (1995). Budget in brief. Ottawa: Department of Finance Canada.
McIntosh, T. (2000). Governing labour market policy: Canadian federalism, the
Social Union and a changing economy. In McIntosh, T. (Ed.), Federalism,democracy and labour market policy in Canada. Kingston: McGill-Queen’s
University Press.
McKillop, A.B. (1994). Matters of mind: The university in Ontario, 1791-1951.
Toronto: University of Toronto Press.
Meloshe, M. (1994). Reforms to Canada Student Loans Program. Unpublished
paper, Human Resources Development Canada, Ottawa.
Milloy, J.S. (1999). A national crime: The Canadian government and the residential school system, 1879 to 1986. Winnipeg: University of Manitoba
Press.
Miller, J.R. (2004). Lethal legacy: Current Native controversies in Canada.
Toronto: McClelland and Steward Ltd.
Morton, W.L. (1957). One university: A history of the University of Manitoba.
Toronto: McClelland and Stewart.
Muszynski, L. and Wolfe, D.A. (1989). New technology and training: Lessons
from abroad. Canadian Public Policy, 15(3), 245-264.
Canadian Federal Policy and Postsecondary Education174
National Advisory Board on Science and Technology. (1988). Report by the University Committee. Ottawa: Government of Canada.
-----. (1995). Healthy, wealthy and wise: A framework for an integrated federal science and technology policy. Ottawa: Government of Canada.
National Forum. (1987). Proceedings: National Forum on Postsecondary Education. Halifax: Institute for Research on Public Policy.
Natural Sciences and Engineering Research Council. (1992). Networks of Centres of Excellence: Powerful partnerships. Ottawa: Minister of Supply and
Services, Canada.
-----. (2004). NSERC’s history. Retrieved September 12, 2004, from www.nserc.
gc.ca/about/history.htm
Nelson, R. (1996). The sources of economic growth. Cambridge, MA: Harvard
University Press.
Networks of Centres of Excellence. (1997). Annual Report. Ottawa: Author.
-----. (2004a). Previously funded Networks. Retrieved September 20, 2004, from
www.nce.gc.ca/nets89_e.htm
-----. (2004b). Currently funded Networks. Retrieved September 22, 2004, from
www.nce.gc.ca/nets89_e.htm
Noël, A. (2002). Without Quebec: Collaborative federalism with a footnote? In
T. McIntosh (Ed.), Building the Social Union: Perspectives, directions and challenges (pp. 17-18). Regina: Saskatchewan Institute of Public Policy.
Niosi, J. (1995). Flexible innovation: Technological alliances in Canadian industry. Montreal and Kingston: McGill-Queen’s University Press.
Offi ce of the Auditor General of Canada. (1994). Science and technology: Overall
management of federal science and technology activities. In Report of the Auditor General of Canada. Ottawa: Author. Available at: www.oag-bvg.
gc.ca/domino/reports.nsf/html/9409ce.html
Organisation for Economic Co-operation and Development. (1969). Review of national science policy: Canada. Paris: Author.
-----. (1998). Science, Technology and Industry Outlook. Paris: Author.
-----. (2002). Thematic review of adult learning: Canada, Country note. Paris:
Author.
-----. (2003). Main Science and Technology Indicators. Paris: Author.
OECD and Education Committee. (1976). Reviews of national policies for education: Canada. Paris: Author.
Peitchinis, S.G. (1971). Financing post secondary education in Canada [Report
commissioned by the Council of Ministers of Education of Canada].
Unpublished paper.

Bibliography 175
Pennee, D. (2005). Response to Fifth-year evaluation of the Canada Research
Chairs Program: Final evaluation report. Ottawa: CFHSS.
Pidgeon, M. (2001). Looking forward . . . A national perspective on Aboriginal student services in Canadian universities. Unpublished magistral thesis,
Memorial University of Newfoundland.
Pike, R.M. (1970). Who doesn’t get to university – and why. Ottawa: Association
of Universities and Colleges of Canada.
Polanyi, M. (2000). The Republic of Science: Its political and economic theory.
Minerva, 38, 1-21. (Reprinted from Minerva, 1, 54-73)
Polster, C. (2002). Break from the past: Impacts and implications of the Canada
Foundation for Innovation and the Canada Research Chairs initiatives.
Canadian Review of Sociology and Anthropology, 39, 275-299.
Porter, J. (1965). The vertical mosaic. Toronto: University of Toronto Press.
Porter, M.R., Porter, J., and Blishen, B.R. (1973). Does money matter? Prospects for higher education. Downsview ON: Institute for Behavioural Research.
Premier’s Council. (1990). New Global Economy. People and Skills in the New Economy. Toronto: Queen’s Printer.
Prosperity Secretariat. (1991a). Learning well…Living well. Ottawa: Author.
-----. (1991b). Prosperity through competitiveness. Ottawa: Author.
Psacharopoulos, G. (1993). The future of higher education fi nancing. In P.G.
Altbach, J. Altbach, and D. Bruce (Eds.), The funding of higher education: International perspectives. New York and London: Garland Publishing.
-----. (1995). Building human capital for better lives. Washington: World Bank.
Pullen, J.W. (1990). Centres of Excellence (Catalogue no. SC93-2/2-1990E).
Ottawa: Minister of Supply and Services Canada.
Quebec Parliamentary Committee on Education for Quality, Accessibility and
Funding of Universities. (2004). Consultation paper. Quebec: Government
of Quebec.
Rabinovitch, R. (1966). An analysis of the Canadian post secondary student population. Part I. A report on Canadian undergraduate students. Ottawa:
Canadian Union of Students.
Rae, B. (2005). Ontario, a leader in learning: Report and recommendations.
Toronto: Queen’s Printer.
Richards, J. (2002). The paradox of the Social Union Framework Agreement(C.D. Howe Institute backgrounder, 59). Toronto: C.D. Howe Institute.
Robinson, I. and Simeon, R. (1999). The dynamics of Canadian federalism. In
J. Bickerton and A.G. Gagnon (Eds.), Canadian politics. Peterborough:
Broadview Press.
Canadian Federal Policy and Postsecondary Education176
Rubenson, K. and Gaskell, J. (1987). Education and the Canadian case. Vancouver:
UBC Centre for Policy Studies in Education.
Savage, D. (1987, May). Frank Oberle: Toward a National Science Policy. CAUT Bulletin, pp. .
Senkpiel, A. (1997). Postsecondary education in the Yukon: The last thirty years.
In G.A. Jones (Ed.), Higher education in Canada: Different systems, different perspectives. New York: Garland.
Schuetze, H. (2003). Alternation education and training in Canada. In H. Schuetze
and R. Sweet (Eds.), Integrating school and workplace learning in Canada.
Montreal: McGill-Queen’s University Press.
Science Council of Canada. (1968). Towards a National Science Policy for Canada. Ottawa: Queen’s Printer and Controller of Stationery.
-----. (1988). Winning in a world economy: University-industry interaction and economic renewal in Canada. Ottawa: Minister of Supply and Services.
Sharpe, A. (1999). Apprenticeship in Canada: A training system under siege?
Ottawa: Centre for the Study of Living Standards.
Sharpe, A. and Gibson, J. (2005). The apprenticeship system in Canada: Trends and issues. Final Report. Ottawa: Centre for the Study of Living Standards.
Sharpe, A. and Haddow, R.S. (1997). Social partnerships for training: Canada’s experiment with Labour Force Development Boards. Ottawa and Kingston:
Centre for the Study of Living Standards and Caledon Institute of Social
Policy, School of Policy Studies, Queen’s University.
Sheffi eld, E.F. (1961). University development: The past fi ve years and the next ten. Paper presented at the NCCU Conference on Canada’s Universities in a
New Age, Ottawa.
-----. (1965). Canadian university and college enrollment projected to 1965. Paper
presented at the NCCU Conference on Canada’s Crisis in Higher Education.
Skolnik, M. (1992). Higher education systems. In A.D. Gregor and G. Jasmin
(Eds.), Higher education in Canada (pp. 15-26). Ottawa: Secretary of State
of Canada in cooperation with the Association for Canadian Studies.
Slaughter, S. and Leslie, L. (1997). Academic capitalism: Politics, policies and the entrepreneurial university. Baltimore and London: Johns Hopkins University
Press.
Stager, D.A.A. (1972). Economic returns to graduate study in science, engineering
and business. Canadian Journal of Economics, 5, 182-198.
-----. (1989). Focus on fees: Alternative policies for university tuition fees.
Toronto: Council of Ontario Universities.
Bibliography 177
Stanbury, W.T. (1989). Privatization in Canada: Ideology, symbolism and
substance. In P.W. Macavoy, W.T. Stanbury, G. Yarrow, and R.J. Zekhauser
(Eds.), Privatization and state-owned enterprises: Lessons from the United States, Great Britain, and Canada (pp. 273-329). Boston: Kluwer.
Standing Committee on Human Resources Development. (1995). Security, opportunities and fairness: Canadians renewing their social programs.
Ottawa: House of Commons.
Statistics Canada. (2003a). 2001 Census: Analysis series. First Nations Peoples of Canada: A demographic profi le. Ottawa: Author.
-----. (2003b). Aboriginal Peoples of Canada: A demographic profi le. Retrieved
November 22, 2004, from www12.statcan.ca/english/census01/products/
analytic/companion/abor/canada.cfm
-----. (2003c). Selected income characteristics (35A), First Nations identity (8),
Age groups (6), Sex (3), and Area of residence (7) for population, for Canada,
provinces, and territories. 2001 Census - 20 per cent Sample Data (Catalogue
no. 97F0011XCB01046). Ottawa: Author.
-----. (2004a). Canada e-book: The people, health, social environment. Retrieved
April 10, 2004, from http://142.206.72.67/02/02b/02b_007g_e.htm
-----. (2004b). Tuition and living: Accommodation costs for fulltime students at Canadian degree-granting institutions. Ottawa: Statistics Canada.
Steering Group on Prosperity. (1992). Inventing our future: An action plan for Canada’s prosperity. Ottawa: Author.
Stonechild, B. (2004). Pursuing the new buffalo: First Nations higher education policy in Canada. Unpublished doctoral dissertation, University of Regina.
Tamburri, R. (2005, February). First renewals of Canada Research Chairs stir up
gender issue. University Affairs.
Thistle, M. (1966). The inner ring: The early history of the National Research Council of Canada. Toronto: University of Toronto Press.
Usher, A. (2004). Are the poor needy? Are the needy poor? The distribution of student loans and grants by family income quartile in Canada. Toronto:
Educational Policy Institute.
Usher, A.and Cervenan, A. (2005). Global higher education rankings. Toronto:
Educational Policy Institute.
Van Walraven, J. (2004). An inventory of government incentives or employer-sponsored worker training in Canada and the United States [Draft 2]. Ottawa:
HRDC, Industry Canada, and SSHRC.
Winsor, H. (1993, June 11). Tory senators snub Mulroney government. Globe and Mail.

Canadian Federal Policy and Postsecondary Education178
Wolfe, D.A. (2002). Innovation policy for the knowledge-based economy: From
the Red Book to the White Paper. In G.B. Doern (Ed.), How Ottawa spends, 2001-2002. Toronto: Oxford University Press. Available at: www.utoronto.
ca/progris/pdf_fi les/Wolfe_InnovationPolicy.pdf
Wotherspoon, T. and Satzewich, V. (2000). First Nations race, class and gender relations. Regina: Canadian Plains Research Centre.
Young, J. and Levin, B. (2002). Understanding Canadian schools: An introduction to educational administration (3rd edition). Toronto: Thompson Nelson.

Index 179
Index
Page numbers in italics indicate charts and tables.
AAbele, F., 78Aboriginal peoples
availability of adult education, 11defi nition of, 10ndemographics, 110–111education levels, 109effect of colonization on, 10funding for, 5, 9, 12, 13, 67, 108–111health care education funding, 144–145history of education for, 10–14institutions controlled by, 35–36, 107–108jurisdiction over own education, 4n7labour market training, 102, 103, 104responsibility for education of, 4, 4n7study, 69summary, 124
academic science, 85academic-initiated research, 83ACCC (Association of Canadian Community
Colleges), 6accessibility, 6–7, 69accountability
with block transfer system, 40, 114federal, 41, 48, 105public demand for, 83responsibility overlap, 2, 125
Achieving Excellence: Investing in People, Knowledge and Opportunity, 98
ACST (Advisory Council on Science and Technology), 85, 98, 117
active labour market measures (ALMMs), 123Adult Occupational Training Act, 20, 99adult training, defi nition, 99–100, 122Advisory Committee on Apprenticeship, 107Advisory Council on Science and Technology
(ACST), 85, 98, 117affordability, 6–7, 68AFN (Assembly of First Nations), 35, 107, 109,
111, 124, 150AGC (Auditor General of Canada), 108Agricultural Aid Act, 15Agricultural Instruction Act, 15agriculture, 15, 142–143AIF (Atlantic Innovation Fund), 91–92AIHEPS (Alliance for International Higher
Education Policy Studies), 1n1Alberta
Aboriginal students in, 14, 35, 107labour market training in, 102, 104tuition fee increases, 58
Alliance for International Higher Education Policy Studies (AIHEPS), 1n1
Allied Tribes of British Columbia, 12Allmand, Warren, 42, 100ALMMs (active labour market measures), 123Amerindianization Program, 35Anisef, P., 31n
applied knowledge, 2applied research, 80, 81–82applied sciences, 117apprenticeship programs, 9, 105–107, 122Arts program, 64, 77Assembly of First Nations (AFN), 35, 107, 109,
111, 124, 150assimilation
church schools and, 4n7desegregated education, 13policy of, 11White Paper on, 35
Association of Canadian Community Colleges (ACCC), 6
Association of the Scientifi c, Technological and Engineering Community of Canada, 34
Association of Universities and Colleges of Canada (AUCC)
agreement on research funding, 98coordination with DFAIT, 3enquiry into funding, 25, 27focus of, 5on funding policies, 96–97recommendations on tuition fees, 60–61on transfer payment elimination, 62–63
Atkinson-Grosjean, J., 16n, 80n37, 81n40, 88nAtlantic Canada, 91–92Atlantic Canada Opportunities Agency, 91–92Atlantic Innovation Fund (AIF), 91–92Atlantic Veterinary College, 142–143AUCC. See Association of Universities and
Colleges of Canada (AUCC)Auditor General of Canada (AGC), 108Australia, 17nautonomy
acknowledgement of provincial, 126chairs and, 96, 118of funding councils, 78provincial, 40, 42, 113Québec, 1, 126of universities, 8, 17, 25, 34
awards, link to student assistance, 67Axworthy, Lloyd, 46, 61
BBakvis, H., 2Bankruptcy and Insolvency Act, 57Barker, M., 77, 79, 80, 81, 82, 84basic service levels, 39Basic Training for Skill Development (BTSD),
100–101basic-science networks model, 81Beavon, D., 10Bell, D., 19Benson, E.J., 27Berger, M.T., 54nBernstein, Alan, 92Bertram, G.W., 32Bertrand, M.A., 31nbilingualism, 4Bill C-93, 83, 89

Canadian Federal Policy and Postsecondary Education180
Blackhouse, C, 12Bladen Commission, 25, 27Blishen B.R., 31nblock transfer system. See unconditional block
transfersBonneau, L.P., 33Breau, Herb, 41–42Britain, 17n, 86British Columbia
Aboriginal students in, 11, 14, 35EPF funds, 42fi nancial accessibility studies, 31nhigh school pilot project, 69labour market training, 102, 104tuition fee increases, 58
British Columbia Law Society, 12British North America Act, 3, 10Britton, J., 16BTSD (Basic Training for Skill Development),
100–101Building a Federal Science and Technology
Strategy, 84–85Building a More Innovative Economy, 84–85bursaries, 67Bush, Vannevar, 17
CCAATS (Colleges of Applied Arts and
Technology), 7nCameron, D., 1n2, 2, 15, 18, 22, 23, 24, 27, 39,
43, 46, 47, 63, 83, 99Canada, 17nCanada, Government of, 4n7, 16, 21, 26, 29n,
31, 41, 43, 57, 79, 107Canada Assistance Program (CAP), 36, 114,
136–140, 156–161Canada Council Act, 24Canada Council (CC)
establishment of, 17, 21, 23, 120funding for, 24, 92, 94, 116initial funding, 24mandate of, 77transfer of programs to, 83yearly expenditures, 142–143, 152–155
Canada Education Savings Grant (CESG), 70–71, 119
Canada Employment Centres, 101Canada Employment Insurance Commission
(CEIC), 100, 103Canada Foundation for Innovation (CFI), 5,
89–91, 96, 117, 142–143, 150Canada Graduate Scholarships, 90, 98–99, 120Canada Health Act, 43, 45Canada Health and Social Transfer (CHST)
division of transfers, 48, 114, 134establishment of, 46, 63funding allocation comparison, 136–140total transfers, 156–161
Canada Health Transfer (CHT)establishment of, 48, 114, 134funding allocation comparison, 136–140total transfers, 156–161
Canada Labour and Business Centre, 102Canada Learning Bond, 71
Canada Manpower Training Program, 20, 100Canada Millennium Scholarship Foundation
(CMSF)creation of, 67, 71, 74, 90, 119criticisms of, 72policy and, 89reforms to, 64, 105student fi nancing, 5study, 68–70tax incentives, 75yearly expenditures, 65, 66, 142–143,
146–147, 150Canada Mortgage and Housing Corporation, 24Canada Research Chairs Program (CRC), 89–90,
93, 95–96, 97, 117–118Canada Social Transfer (CST)
establishment of, 46, 48, 126, 134federal education involvement and, 9funding allocation comparison, 136–140total transfers, 156–161
Canada Student Financial Assistance Act, 56, 57Canada Student Loans Act, 56Canada Student Loans Program (CSLP)
Aboriginal peoples, 111criticisms of, 71–72establishment of, 29federal involvement in, 5, 9income contingent loan repayment and, 46,
74limits, 54noptions for provinces, 119process, 54reforms to, 56, 70, 104, 105yearly expenditures, 64, 65, 66, 144–145
Canada Studies Program, 4Canada Study Grant (CSG), 64, 68n, 70, 71–72,
119, 144–145Canada Universities Foundation (CUF), 22, 23,
25Canadian Apprenticeship Forum, 104Canadian Association of University Business
Offi cers (CAUBO), 91Canadian Association of University Teachers
(CAUT), 6, 53n, 58, 59, 83, 85, 90, 120, 121focus of, 5research chairs program and, 93
Canadian Bureau for International Education (CBIE), 3, 6
Canadian Career Development Foundation, 31n, 69
Canadian Council on Learning (CCL), 90, 104, 128, 150
Canadian Education Network (CEN), 3, 6Canadian Federation for the Humanities and
Social Sciences (CFHSS), 5, 93, 95Canadian Federation of Students (CFS), 70, 109
criticism of scholarship program, 67, 69focus of, 6income dependent loan opposition campaign,
61–62student loans challenge, 57
Canadian Institute for Advanced Research (CIAR), 81, 146–147

Index 181
Canadian Institute for Health Research (CIHR)establishment of, 120establishment of precursor, 16funding for, 92, 95programs funded by, 89–90yearly expenditures, 144–145, 152–155See also Medical Research Council (MRC)
Canadian International Development Agency (CIDA), 3
Canadian Jobs Strategy (CJS), 101, 122Canadian Labour Force Development Board
(CLFDB), 102, 122Canadian Labour Market and Productivity
Centre, 102Canadian Learning Bond, 104–105Canadian Learning Institute (now Canadian
Council on Learning), 104Canadian Microelectronics Corporation, 78Canadian Opportunities Strategy, 64, 67, 119Canadian Social Science Research Council
(CSSRC), 23Canadian Studies Programs, 142–143Canadian Undergraduate Survey Consortium,
110Canadian Union of Students (CUS), 31Canadian University and College Enrolment
Projected to 1965, 17CAP (Canada Assistance Program), 36, 114,
136–140, 156–161Carter, G.E., 40, 41, 45cash transfers
comparison to health, 49, 50, 51, 136–140decrease in, 53income dependent loans and, 62total expenditures, 44, 52, 55, 114–115,
132–133, 156–158CAUBO (Canadian Association of University
Business Offi cers), 91CAUT. See Canadian Association of University
Teachers (CAUT)CBIE (Canadian Bureau for International
Education), 3, 6CC. See Canada Council (CC)CCL. See Canadian Council on Learning (CCL)CEGEP (Collèges d’enseignement général et
professionnel), 7n, 35CEIC (Canada Employment Insurance
Commission), 100, 103CEN (Canadian Education Network), 3, 6Central Mortgage and Housing Corporation, 24Centre for Policy Studies in Education, UBC,
101centres of excellence, 79–80
See also Networks of Centres of Excellence Program (NCE)
Cervenan, A., 6, 7nCESG (Canada Education Savings Grant),
70–71, 119CFHSS (Canadian Federation for the Humanities
and Social Sciences), 5, 93, 95CFI. See Canada Foundation for Innovation
(CFI)CFS. See Canadian Federation of Students (CFS)
CHA (Canada Health Act), 43, 45chairs, research, 93, 95–96, 97, 117–118chequerboard federalism, 2Chrétien, Jean, 67Chrétien government, 45, 88–90CHST. See Canada Health and Social Transfer
(CHST)CHT. See Canada Health Transfer (CHT)churches, 4n7CIAR (Canadian Institute for Advanced
Research), 81, 146–147CIDA (Canadian International Development
Agency), 3CIHR. See Canadian Institute for Health
Research (CIHR)CITC (Community Industrial Training
Committees), 101CJS (Canadian Jobs Strategy), 101, 122CLFDB (Canadian Labour Force Development
Board), 102, 122Clift, Robert F., 19, 29, 31CMEC. See Council of Ministers of Education
Canada (CMEC)CMSF. See Canada Millennium Scholarship
Foundation (CMSF)collaborative federalism, 2, 47collaborative research and development, 33, 78,
79, 117College Research Development Fund, 89colleges
completion rates, 108establishment of, 20, 122exclusion from ranking, 7nresearch partnerships, 117training programs, 5, 101transfer programs, 7n
Collèges d’enseignement général et professionnel (CEGEP), 7n, 35
Colleges of Applied Arts and Technology (CAATS), 7n
commercial industry. See private sectorcommercialization, 85, 88, 89–90, 99, 116Commission on Fiscal Imbalance, 127Committee on Science Policy (Lamontagne
Report), 16, 17, 33–34, 116community colleges. See collegesCommunity Industrial Training Committees
(CITC), 101community learning centres, 107Community University Research Alliances, 93completion rates, 108conditional funding, 126Conference on Creating Canada’s Advantage in
an Information Age, 98Conservative government, 19, 31, 77–78, 91,
101, 116, 117Consolidated Revenue Fund (CRF), 9, 40, 103Constitution Act of 1982
Aboriginal defi nitions in, 10nAboriginal rights, 110division of powers, 124–125, 128responsibilities under, 3, 4
Consumer Price Index, 132–133, 148–149,154–155

Canadian Federal Policy and Postsecondary Education182
Cook, G.A., 60Cooke, M., 10cooperative federalism, 40Corak, M., 72corporate tax room, 39Corry, J.A., 33cost of living, 64cost sharing, 26–29, 39, 118COU (Council of Ontario Universities), 59, 61Council of Canadian Academies, 6Council of Ministers of Education Canada
(CMEC)establishment of, 27, 114focus of, 5policy development, 40, 128study, 27–28
Council of Ontario Universities (COU), 59, 61CPI (Consumer Price Index), 132–133, 148–149,
154–155CRC (Canada Research Chairs Program), 89–90,
93, 95–96, 97, 117–118Creating Opportunity: The Liberal Plan for
Canada (Red Book), 84CRF (Consolidated Revenue Fund), 9, 40, 103CSG. See Canada Study Grant (CSG)CSLP. See Canada Student Loans Program
(CSLP)CSSRC (Canadian Social Science Research
Council), 23CST. See Canada Social Transfer (CST)CUF (Canada Universities Foundation), 22, 23,
25Cunningham, A., 31n, 69curiosity-oriented research, 34CUS (Canadian Union of Students), 31Cuthand, S., 12
DDavenport, Paul, 98Dawson College, 35de la Mothe, J., 32debt, student
income contingent loan repayment, 46, 59–64, 74
reforms to loans program and, 104scholarship foundation study and, 69
defaulted loans, 64Defence Research Board, 21degrees awarded, 14Dennison, J. D., 15, 20, 99Dentistry program, 58, 120Department of Finance Canada, 64, 67, 70, 71,
75Department of Foreign Affairs and International
Trade (DFAIT), 3, 4Department of Health Act, 15–16Department of Health and Welfare, 2n3Department of Indian Affairs. See Indian and
Northern Affairs Canada (INAC)Department of Industry, Science, and
Technology, Canada. See Industry, Science and Technology Canada (ISTC)
Department of National Defence, 3, 148–149Department of Regional Industrial Expansion, 78
Department of Science and Technology, 78Department of the Secretary of State, 25Department of Veterans Affairs, 18–19, 148–149dependent students, 73, 119desegregated education, 13DFAIT (Department of Foreign Affairs and
International Trade), 3, 4Diefenbaker government, 19, 31direct grants
to faculty, 115replacement of, 25–26, 113
direct transfersincreases in, 2, 43, 126for teaching positions, 96, 127
disabilities, persons withfederal education involvement and, 9fi nancial assistance for, 56grant eligibility, 71labour market training, 102, 103
doctoral programs, 56, 71Dodge, David, 42, 45, 100Dominion Bureau of Statistics, 15Dominion-Provincial Student Aid Program, 18Dominion-Provincial Youth Program, 18Dorion, J., 36Doutriaux, J., 77, 79, 80, 81, 82, 84dropout rates, 14Drucker, P.F., 2Dufour, P., 32Duncan, C., 62Dunn, James, 24Duplessis, Maurice, 23Dupre, J.S., 100
Eearth sciences, 78EBSM (Employment Benefi ts and Support
Measures), 102Economic Council of Canada (ECC), 26, 32–33,
100economy
benefi ts to, 26, 32–33global, 125health of, 128knowledge-based, 86labour market training and, 100, 121–122policy initiatives, 82
education exchange, 3education levels, 109Education Policy Institute, 73Education Support Branch, 25, 27education tax credit, 75educational research, 32educational skills development, 2n3EI. See Employment Insurance (EI)Emmanuel College, 11employer-sponsored training, 101, 106, 122employment. See labour forceEmployment Assistance Services, 103Employment Benefi ts and Support Measures
(EBSM), 102Employment Insurance Act, 102

Index 183
Employment Insurance (EI, formerly Unemployment Insurance)
apprenticeship programs, 105establishment of, 19federal education involvement and, 9labour market training, 102, 103
enfranchisement, 12Engineering program
funding for, 89, 90, 93tuition fee increases, 58, 120
enrollmentAboriginal peoples, 109, 124apprenticeship programs, 106full-time, 23n, 25, 29, 45funding formula and, 99, 120government-directed increases, 121projected, 22transfer payments and, 53, 53vocational training, 101
Environment program, 89, 90EPF. See Established Programs Financing Act
(EPF)equalization payments, 39–40Established Programs Financing Act (EPF)
funding allocation comparison, 136–140introduction of, 36, 39, 114name change, 43problems with, 40replacement of, 126reports on, 41–42research costs and, 97total transfers, 156–161transfer caps, 45
Evaluation and Data Development, 56, 57Evans, K., 121experimental farms, 15
FFaculté de médecine vétérinaire de l’Université
de Montréal, 142–143faculty
direct payment to, 115, 117–118, 127funding for, 34number of, 29salaries, 23n
family income. See incomeFaulkner, Hugh, 77federal government
Aboriginal education, 4, 5imbalance in funding areas, 118involvement of, 27policy, 2, 9, 28, 79responsibilities of, 1, 2–3, 4, 124–126spending power leverage, 2trends in funding, 74tuition fees and, 59
Federal PSE and Health Contributions Act, 43, 45
Federal-Provincial Fiscal Arrangements Act (FPFAA), 25–29, 43, 113
federal-provincial relationshipfi nancial disparity, 39labour market development, 123overlapping responsibilities, 2, 124–126
reforms to, 91, 117task force, 28
fellowships, 120Finance Canada, Department of, 64, 67, 70, 71,
75fi nancial institutions, 54, 56–57Finnie, Ross, 54nFirst Nations, defi nition of, 10n
See also Aboriginal peoplesFirst Nations University of Canada, 36, 124Fisher, D., 16n, 80n37, 81n40foregone taxes, 46Foreign Affairs and International Trade,
Department of (DFAIT), 3, 4foreign students, 3, 121Forum on Science Policy, 78foundations, 142–143Four Directions Consulting Group, 111FPFAA (Federal-Provincial Fiscal
Arrangements Act), 25–29, 43, 113Framework of Agreed Principles on Federal
Funded University Research, 98France, 86free market forces, 83Friedman, Milton, 60Friedman, R.C., 78Friedman, R.S., 78full-time students
enrollment, 23n, 25, 29, 45fi nancial assistance for, 67
GGabrielle Dumont Institute of Native Studies and
Applied Research, 36Gallagher, P., 15, 20, 99Gaskell, J., 100–101GDP (Gross Domestic Product), 6General Trust, 156–161Genome Canada, 142–143, 150geological surveys, 15George, Dan, 10, 110, 124GERD (Gross Domestic Expenditure on R&D),
6Germany, 86Gertler, M., 16Gibson J., 105–106Gilmour J., 16Glasco Commission, 31global economy, 5, 91, 117, 121, 125“Global Higher Education Rankings”, 6–7GNP (Gross National Product), 40, 42, 43Government of Canada, 4n7, 16, 21, 26, 29n, 31,
41, 43, 57, 79, 107graduate students
funding for, 15, 34, 98–99, 120increase in programs for, 25initiatives for, 64
graduatesIndian and Inuit, 14leveraging earning power of, 60
granting agenciesadministration of research, 96funding distribution policies, 99restructuring of, 34

Canadian Federal Policy and Postsecondary Education184
trend toward, 115yearly expenditures, 94, 142–143, 152–155
grantsaccess to, 23American comparison, 98capital, 24eligibility for, 71–72federal change in policy, 2federal-provincial programs, 18non-government, 85percent of expenditures, 25, 29yearly amounts, 65
Green, M., 121Green Paper, 46, 61–63Gross Domestic Expenditure on R&D (GERD),
6Gross Domestic Product (GDP), 6Gross National Product (GNP), 40, 42, 43Gunther, M, 40Guppy, N., 31nGuston, D.H., 80
HHaggard, Dave, 107Haig-Brown, C., 12, 13Hall Report, 26Harris, R.S., 15, 18, 19Hawthorne, H.B., 14Hayden, M., 11HDI (Human Development Index), 10health
funding allocation comparison, 136–140funding for, 89, 117, 128provisions for funding, 45research program restructuring, 92total transfers, 156–161transfer payments, 46, 48, 50, 51trends in funding, 48–49, 114unconditional transfers, 36, 39
Health and Welfare, Department of, 2n3Health Canada, 16, 144–145Health Canada Post-Doctoral Fellowship,
144–145health care professionals, 26Health program, 90, 93Healthy, Wealthy and Wise: A Framework for an
Integrated Federal Science and Technology Policy, 85
HERD (Higher Education Expenditure on R&D), 6
heritage programs, 142–143high income students. See upper income studentshigh school, 109, 110–111high school pilot project, 69higher education act, 1Higher Education Expenditure on R&D
(HERD), 6Hilyer, G.M., 4Hollinger, D.A., 17Horn, M., 17Horry, I., 45Hortian, U., 31n
Hospital Insurance and Diagnostic Services Act, 43
hospitals, 88, 117House, D., 16n, 80n37, 81n40housing. See residencesHRCC (Humanities Research Council of
Canada), 23HRDC. See Human Resources and Development
Canada (HRDC)HRSDC. See Human Resources and Skills
Development Canada (HRSDC)human capital
economic benefi ts of PSE, 26, 32, 125economic restructuring, 83federal agenda, 105–106industry growth and, 19labour market training, 122, 123
Human Development Index (HDI), 10human resources
development of, 32fi nancing, 41international competitiveness, 78See also labour force
Human Resources and Development Canada (HRDC), 46, 61, 62
creation of, 2n3targets, 98vocational and technical training programs, 5yearly expenditures, 144–145
Human Resources and Skills Development Canada (HRSDC), 19, 105, 106
labour market training, 103responsibilities of, 2n3vocational and technical training programs, 5
human science, 95humanities
federal focus, 93funding for, 17, 20–23, 89, 99, 118, 120separation of from social sciences, 77
Humanities Research Council of Canada (HRCC), 23
Hurtubise, R., 33
IICLR (Income Contingent Loan Repayment),
46, 59–64, 74IIR (Institute for Intergovernmental Affairs), 67,
68, 70immersion programs, 4n8immigrants, 103, 104INAC. See Indian and Northern Affairs Canada
(INAC)income
fi nancial assistance, 119growth of, 32needs-based programs, 72–74scholarship programs, 67–68tuition fees and, 58–59, 120–121
Income Contingent Loan Repayment (ICLR), 46, 59–64, 74
independent students, 73, 119Indian Act
enfranchisement under, 12federal responsibility under, 4

Index 185
joint committee study of, 13Indian and Northern Affairs Canada (INAC),
14, 109education responsibility of, 13funding programs, 107, 108role of, 110, 124status Indian registration, 4yearly expenditures, 146–147, 150
Indian Studies Support Program (ISSP), 107, 124
Indiansdefi nition of, 10nSee also Aboriginal peoples
Indirect Costs program, 96indirect funding, 2, 15, 61–62, 126indirect relationships, 114indirect research costs, 34, 87, 90, 96–98, 118Industrial Research Assistance Program (IRAP),
78industry. See private sectorIndustry, Science and Technology Canada
(ISTC), 78, 84Industry Canada, 85
administration of research, 96establishment of, 78funding provided by, 3funding target, 98research funding, 86–87restructuring of, 84yearly expenditures, 146–147
infrastructure projects, 89, 115, 126Initiative on the New Economy, 93InnovAction strategy, 79, 80, 81, 117innovation policy review, 85Innovation Strategy, 98, 104–105, 122Institute for Intergovernmental Affairs (IIR), 67,
68, 70integrated circuit design, 78intellectual property, 80, 82–83, 92, 98, 116interest rates, student loans, 54, 57international students, 3, 121internships, 106inter-provincial mobility, 47, 101, 102Inuit
defi nition of, 10nIndian Act and, 4n7, 11See also Aboriginal peoples
involuntary enfranchisement, 12nIRAP (Industrial Research Assistance Program),
78ISSP (Indian Studies Support Program), 107,
124ISTC (Industry, Science and Technology
Canada), 78Italy, 86
JJames, C.E., 31nJapan, 86job creation, 100, 121–122
See also work forceJohnson, A.W., 42Joint Schools Agreement, 13Jones, G. A., 1, 2
Junor, S., 64n, 68, 70, 75, 127
KKeniston, K., 80Killam, Dorothy J., 24Killam, Izaak Walton, 24Killam Trusts, 24King, W.L. McKenzie, 15Kingston, Ontario, 10Knight, J., 121Knowledge Matters: Skills and Learning for
Canadians, 98knowledge society, 2, 92, 125Kunin, R., 105
Llabour force
Aboriginal peoples, 108, 111control of programs, 27economy and, 32–33literacy initiatives, 105low wage earners, 60market trends, 105mobility, 47, 101, 102requirements, 100skills development, 106training programs, 9, 14–15, 100, 103–104,
121–122unemployment rate, 41n24, 100, 121–122yearly training expenditures, 144–145youth initiatives, 64
Labour Force Development Agreements, 102, 122
Labour Market Development Agreements (LMDA), 102–103, 107, 122, 123
A Lament for Confederation, 10Lamontagne, Maurice, 33Lamontagne Report, 16, 17, 33–34, 116Law program, 58, 107, 120Lazar, H., 123Learning Well ... Living Well, 82Leblanc, F.E., 3Leslie, L., 17nLevin, B., 2, 4n8, 39Liberal government, 45, 46, 48, 61, 84, 88–90,
91, 116, 117, 119Lipps, G., 72literacy initiatives, 105, 144–145Lithoprobe, 78LMDA. See Labour Market Development
Agreements (LMDA)loans. See student fi nancial assistanceLooker, D., 68low income students
fi nancial assistance, 119needs-based programs, 72–74RESPs and, 71scholarship programs, 67–68
Lowe, G.S., 68
MMacdonald Commission, 97Macdonald Report, 33, 34, 116Mackenzie, H., 73

Canadian Federal Policy and Postsecondary Education186
Major Collaborative Research Initiatives, 93Malatest, R.A., 111Manitoba
Aboriginal students in, 14, 35fi nancial accessibility studies, 31nhigh school pilot project, 69labour market training, 104
Manitou Community College, 35manpower. See labour forceMaritime provinces, 9, 14Martin, Paul, 46, 48, 61Massey, Vincent, 20–23Massey Commission, 20–23, 24Matching Policy program, 79, 80, 116McGill University, 97McIntosh, T., 123McKillop, A.B., 17McLean, John, 11McMaster University, 97Medical Care Act, 43medical research, 15–16, 86Medical Research Council Act, 16Medical Research Council (MRC)
collaborative research, 78establishment of, 16, 36, 120funding for, 77, 92, 94, 116restructuring of, 34, 90yearly expenditures, 144–145, 152–155See also Canadian Institute for Health
Research (CIHR)Medicare program, 72Medicine program, 58, 120Meloshe, M., 56mentorships, 106Merisotis J., 31n, 69Merton, Robert, 17Métis
defi nition of, 10nfunding for, 13Indian Act and, 11institutions controlled by, 36responsibility for education of, 4, 4n7
middle income studentsincome dependent loans and, 74RESPs and, 71scholarship programs, 67–68tuition fees and, 120–121
Military College, 10military service personnel, 3Miller, J. R., 4n7, 11, 12n, 13, 35Milloy, J. S., 13Ministerial Task Force on Employment
Opportunities, 42, 100ministers, 115Ministry of State for Science and Technology
(MOSST), 34, 116minority language students, 4mission-oriented research, 34Montpetit, C., 63Morton, W. L., 10MOSST (Ministry of State for Science and
Technology), 34, 116MRC. See Medical Research Council (MRC)Mulroney, Brian, 81n39
Mulroney government, 101multidisciplinary research teams, 33Mustard, Fraser, 81n38Muszynski, L., 101
NNational Advisory Board on Science and
Technology (NABST), 79, 85, 117National Child Benefi t, 68nNational Conference of Canadian Universities
(NCCU), 18–19, 22–23, 24, 97, 113National Conference of Canadian Universities
and Colleges (formerly NCCU), 24National Conference on Innovation and
Technology, 80National Defence, 3, 148–149National Employment Service, 19National Federation of Canadian University
Students (NFCUS), 29, 31National Forum on Postsecondary Education,
79–80National Housing Act, 24National Indian Brotherhood, 35
See also Assembly of First Nations (AFN)National Research Council (NRC)
autonomy in universities and, 17establishment of, 116, 120focus of, 17medical research, 16restructuring of, 34role of, 15, 77science research, 21yearly expenditures, 146–147
national standards, 41national strategy, 125, 128National Student Loans Service Centre
(NSLSC), 57–58National Training Act, 101national university act, 1Native Law Program, 107Native Studies Program, 107natural sciences, 86, 93, 117Natural Sciences and Engineering Council of
Canada (NSERC), 88autonomy of, 34collaborative research, 78establishment of, 36, 120funding cuts, 83funding for, 92–93, 94, 95, 116–117purpose of, 77yearly expenditures, 152–155
Natural Sciences and Engineering Research Council Act, 77
NCCU (National Conference of Canadian Universities), 18–19, 22–23, 24, 97, 113
NCE. See Networks of Centres of Excellence Program (NCE)
needs-based student assistanceequalization of opportunity, 72federal funding percentage, 64in scholarship program, 67yearly expenditures, 65
Nelson, R., 85Networks of Centres of Excellence Program

Index 187
(NCE)access to funding, 91–92changes to, 82, 84establishment of, 78, 80, 117focus of, 85–87funding of, 88model, 81
New Brunswickfi nancial accessibility studies, 31nhigh school pilot project, 69labour market training, 104tuition fee increases, 58
A New Framework for Economic Policy, 84–85Newfoundland and Labrador, 18, 25, 102, 104NFCUS (National Federation of Canadian
University Students), 29, 31Niosi, J., 78Noël, A., 2non-status Indians
defi nition of, 4n7See also Aboriginal peoples
North American Indian Brotherhood, 13Northwest Territories
Aboriginal students in, 14, 35education responsibility in, 4labour market training, 104
not-for-profi t institutions, 88, 117Nova Scotia, 58, 102, 103–104NRC. See National Research Council (NRC)NSERC. See Natural Sciences and Engineering
Council of Canada (NSERC)NSLSC (National Student Loans Service
Centre), 57–58Nunavut, 4, 104
Oobservatories, 15occupational training. See apprenticeship
programs; labour force; vocational and technical training
occupations, high demand, 100OCE (Ontario Centres of Excellence), 81OECD. See Organization for Economic
Cooperation and Development (OECD)Offi ce of the Auditor General of Canada, 80Offi cial Languages Education Program, 4Ontario
Aboriginal students in, 14, 35establishment of universities, 9labour market training, 102, 103, 122research program, 81student loans proposal, 64tuition fee increases, 58
Ontario Centres of Excellence (OCE), 81Ontario Coalition for Postsecondary Education,
73Ontario Veterinary College, 142–143operating costs
federal transfers for, 25–26, 29, 53, 113, 117provincial role, 3tuition fees and, 59, 60, 121for vocational facilities, 19
operating grants, 22–23, 42Organization for Economic Cooperation and
Development (OECD), 9, 86cooperative federalism, 40on national strategy, 125privatization in member countries, 77ranking in, 6survey of science and technology, 33
Ottawa Citizen, 53nout-of-province students, 47
PParliamentary Task force on Federal-Provincial
Fiscal Arrangements, 41–42Parliamentary Task force on Labour Market
Development, 42, 45, 100partnerships in research, 33, 78, 79, 117part-time students, 67, 119Paul, Andrew, 13Paull, Andrew, 12Pearson, Lester, 29, 31Peitchinis, S. G., 27, 27n, 28Pennee, D., 95per capita grant
for agriculture, 15federal spending, 22–23, 53, 113reforms and, 41savings of, 43for vocational facilities, 26
persons with disabilitiesfederal education involvement and, 9fi nancial assistance for, 56grant eligibility, 71labour market training, 102, 103
physical, human and life sciences, 33Pickersgill, J.W., 22Pidgeon, M., 108Pike, R.M., 18Polanyi, M., 17, 81policies
consistency in, 28cooperation in development, 40federal involvement in, 9integrated, 117national strategy, 125, 128position of PSE in, 115
Polster, C., 95population
Aboriginal peoples, 110education levels, 109payments and, 40
Porter, J., 31nPorter, M.R,, 31npost-graduation low wage earners, 60Postsecondary Education Assistance Program
(PSEA), 5, 109, 124Postsecondary Education (PSE)
defi nition of, 26nfunding allocation comparison, 136–140impacts on, 1program spending, 142–150total transfers, 132–134, 156–161
Premiers Council, 101, 128The Price of Knowledge: Access and Student
Finance in Canada, 68Prince Albert, Saskatchewan, 11
Canadian Federal Policy and Postsecondary Education188
Prince Edward Island, 104prisons, 3private sector
access to research, 115–116collaborative research, 33, 78–79, 117focus of NRC, 17knowledge transfer to, 82–83labour market training, 100, 101, 122, 123partnerships in research, 91research funding, 16, 86research needs of, 84research networks, 80, 81sales from knowledge innovation, 98shift of costs to, 77–78sponsored research, 85, 90, 91, 116ties with universities, 99
Privy Council, 148–149Privy Council Committee on Scientifi c and
Industrial Research, 32program spending
for education and research, 52, 142–150total expenditures, 52yearly expenditures, 54, 55, 132–133, 150
Progressive Conservative government, 77–78Prosperity Initiative, 82Prosperity Secretariat, 82Prosperity Through Competitiveness, 82Provincial Economic Accounts, 25, 44provincial government
authority for PSE, 114autonomy, 96, 113, 118, 126establishment of PSE ministries, 27federal infl uence on, 2policy consistency, 28responsibilities of, 1, 3, 4n7, 13, 39, 128revenues, 39role of, 114See also federal-provincial relationship
Provincial Student Assistance Programs, 65Psacharopoulos, G., 26PSE. See Postsecondary Education (PSE)PSEA (Postsecondary Education Assistance
Program), 5, 109, 124Public Accounts of Canada, 150public-private partnerships. See private sectorPullen, J.W., 81
QQuébec
Aboriginal students in, 14, 35access to grants, 23autonomy of, 1, 40corporate tax room, 39enrollment rate, 25establishment of universities, 9on federal funding, 127labour market agreement in, 102out-of-province students, 47research program expenditures, 146–147student fi nancial assistance programs, 29,
67, 119SUFA and, 46–47, 48
Québec Parliamentary Committee on Education for the Quality, Accessibility and Funding of Universities, 126–127
Queen’s University, 97, 148–149
RR&D. See research and development (R&D)Rabinovitch, R., 31nRae, Bob, 64, 104Rae Commission Report on PSE, 64, 104, 126rate of return analysis, student loans and, 60Reaching Out: Canada, International Science
and Technology, and the Knowledge-based Economy, 97
Red Book (Creating Opportunity: The Liberal Plan for Canada), 84
Redmond C., 31n, 69Regional Industrial Expansion, Department of,
78Registered Education Savings Plans (RESPs),
70–71, 72, 74, 75, 144–145Registered Retirement Savings Plans (RRSPs),
70, 74Renaud, Marc, 93Report of the Expert Panel on Canada’s Role in
International Science and Technology, 97Republic of Science, 17research and development (R&D), 77–99,
115–118academic funding, 16, 17Canada’s ranking in, 98collaborative, 33, 78, 79, 117distinctions in, 34of education system, 32federal emphasis on, 2funding as percentage of GDP, 6funding focus, 93, 115grants to individuals, 15, 26indirect costs, 34, 87, 90, 96–98, 118initiatives for, 64merging programs, 83policy framework, 34private sector funding, 16, 85, 86researcher-driven funding, 93studies, 17n, 31targeted, 78
research infrastructureelimination of cash transfers and, 63emphasis on, 17funding for, 2, 15, 88–89, 91–92, 93, 106–
107, 115, 117, 126industry and, 85internal support of, 87trends in funding, 53
residences, 24residential schools, 13responsibilities, 46RESPs (Registered Education Savings Plans),
70–71, 72, 74, 75, 144–145revenues
of federal government, 39total, 25tuition fees as percent of, 59, 120
Review of National Policies for Education, 9

Index 189
Robinson, I., 2The Role of the Federal Government in support
of Research in Canadian Universities (Macdonald Report), 33, 34, 116
Rowat, D.C., 33Rowell-Sirois Report, 16Royal Commission on Dominion Provincial
Relations, 16Royal Commission on Government
Organization, 31Royal Commission on Health Services, 26Royal Commission on Indian Affairs, 11Royal Commission on Industrial Training and
Vocational Education, 15Royal Commission on National Development in
the Arts, Letters and Sciences, 20–23, 24RRSPs (Registered Retirement Savings Plans),
70, 74Rubenson, K., 100–101
SSaskatchewan
Aboriginal students in, 14, 35–36, 107labour market training, 104tuition fee increases, 58
Saskatchewan Indian Federated College (SIFC), 35, 107
Saskatchewan Urban Native Teacher Education Program, 36
Saskatoon, Saskatchewan, 11Satzewich, V., 13, 109Savage, D., 79Schmidt, Sarah, 53nscholars, 26, 116scholarship income tax exemption, 75scholarship programs. See Canada Millennium
Scholarship Foundation (CMSF)Schuetze, H., 105Schwartz, Saul, 54nscience and technology
federal-provincial relationship and, 91funding for, 21, 89, 90, 117infrastructure funding, 33initiatives for, 80international competitiveness, 78policies, 16, 33, 34, 115–116review of policy, 84–85structure for, 17support of research, 15
Science and Technology, Department of, 78Science and Technology for the New Century: A
Federal Strategy, 85Science Council of Canada, 31–32, 33, 80, 116Science program, 89Science Secretariat, 31–32, 116Science: The Endless Frontier, 17Secretary of State, Department of the, 25self-government training, 107Senate Special Committee on Science Policy
(Lamontagne Report), 16, 17, 33–34, 116Senate Standing Committee, 28, 40Senkpiel, A., 4Service Canada, 105service personnel, 3
shared-cost funding, 115Sharpe, A., 105–106Sheffi eld, E.F., 22SIFC (Saskatchewan Indian Federated College),
35, 107Simeon, R., 2Skolnik, M., 43Slaughter, S., 17nSmith, Stuart, 60–61social assistance
federal responsibilities, 2n3funding allocation comparison, 136–140total transfers, 156–161transfer payments, 36, 46, 114–115, 134trends in funding, 48–49
Social Development Canada, 2n3social policy
federal-provincial relations and, 47income dependent loans and, 62policy initiatives, 82reform proposals, 46, 61
social programsfunding responsibility division, 46–47transfer payments, 50, 51, 114–115trends in funding, 48–49
social sciencesfederal focus, 93research funding for, 17, 20–23, 86, 89, 99,
118, 120research networks, 82
Social Sciences and Humanities Research Council Act, 77
Social Sciences and Humanities Research Council of Canada (SSHRC)
establishment of, 36, 77, 120funding for, 94, 95, 116–117proposal for reform, 83role of, 34yearly expenditures, 92–93, 146–147,
152–155Social Union Framework Agreement (SUFA),
46–47, 48, 114social welfare. See social assistanceSociety for Freedom in Science, 17soft federalism, 2Solicitor General, 148–149Special Opportunity Grants, 56, 144–145special programs, 115sponsored research, 85, 90, 91, 116Sputnik, 17, 26SSHRC. See Social Sciences and Humanities
Research Council of Canada (SSHRC)St. Laurent, Louis, 22–23Stacker, James, 11Stager, D.A.A., 31n, 58, 59–61, 69, 120Stanbury, W.T., 78Standing Committee on Human Resources
Development, 62, 63Standing Senate Committee on National
Finance, 3Statistics Canada, 20, 25, 29, 30, 44, 72, 90,
110, 111Status Indians, 4, 35n
See also Aboriginal peoples

Canadian Federal Policy and Postsecondary Education190
Steering Group on Prosperity, 82–83Stonechild, B., 11, 12, 13, 14, 35, 36, 107, 108,
109strategic-science networks model, 81A Strong Foundation for Innovation: An AUCC
Action Plan, 98student debt
income contingent loan repayment, 46, 59–64, 74, 104
reforms to loans program and, 104scholarship foundation study and, 69
student fi nancial assistance, 54–75, 118–121for Aboriginal students, 13, 108–111accessibility of, 31accessibility studies, 31naid program, 29average per year, 64change proposals, 46contracting out administration of, 57–58defaulted, 64direct transfers to, 43, 127establishment of, 18–20expenditures, 64, 66federal government guaranteed program, 54federal role, 5federal-provincial programs, 18goal of, 118income level subsidies, 72–74interest tax credit, 74, 75needs-based, 64, 65, 67, 70, 72private sector risk sharing model, 56–57yearly expenditures, 144–145yearly net, 65See also Canada Millennium Scholarship
Foundation (CMSF); Canada Student Loans Program (CSLP)
student housing, 24students
debt-adverse, 67demographics, 31dependency status, 73, 119–120enrollment, 25, 29, 45expenditures and, 45minority language, 4out-of-province, 47part-time, 56services for, 107–108, 124student loan protests, 63transfer amount per, 53
SUFA (Social Union Framework Agreement), 46–47, 48, 114
Sweden, 6
TTamburri, R., 95, 117targeted research, 78Targets and Strategies for the Seventies, 34Task force on Labour Market Development
(Dodge Report), 42, 45, 100tax expenditures
for education and research, 52total, 132–134
tax point transfersdecrease in, 49, 51, 53
for education and research, 52establishment of, 39–40funding allocation comparison, 51, 136–140total transfers, 50, 55, 132–133, 159
taxesforegone, 46incentives for R&D investment, 85tax credit incentives, 73n, 74, 75, 119
tax-sheltered disease foundations, 88teacher training programs, 35, 36, 107teachers. See facultyTechnical and Vocational Education and Training
(TVET), 28Technical and Vocational Training Assistance
Act (TVTA), 19, 99Technical Education Act, 15technical training. See vocational and technical
trainingThematic Review of Adult Education, 125Thistle, M., 15Tier 1 Senior Chairs, 93, 95, 117Tier 2 Junior Chairs, 93, 95, 117Towards a National Science Policy for Canada,
33Tradition and Education, 107training, vocational and technical. See vocational
and technical trainingTraining Centre Infrastructure Funding Program,
106–107transfer payments, 39–53, 113–115
cash fl oor, 47–48changes to, 2, 41, 46comparison to health, 49, 50, 51, 136–140decline in, 53, 115, 120division of, 134extension of, 27, 28increase in, 28introduction of, 25–26, 113loan funding, 61as percentage of GDP, 6for social programs, 45–46total expenditures, 30, 55, 114–115, 156–161tuition fee increases and, 62unconditional block, 36, 127
treaties, 110Trent University, 107Truman, Harry S., 17tuition fees
deregulation of, 46family income comparison, 58–59general operating costs and, 60income dependent loans and, 61–62increases in, 58, 64, 120–121scholarship foundation study and, 69tax credits, 73n, 74, 75
TVET (Technical and Vocational Education and Training), 28
TVTA (Technical and Vocational Training Assistance Act), 19, 99
UUI (Unemployment Insurance). See Employment
Insurance (EI)unconditional block transfers
Index 191
accountability and, 114changes to, 46establishment of, 36, 39Québec on, 127shift from, 126
undergraduate tuition fees, 58, 59Unemployment Insurance (UI). See Employment
Insurance (EI)unemployment rate, 41n24, 100, 121–122United Kingdom, 17n, 86United Nations Development Program Human
Development Index, 10United States, 17n, 86, 95, 98, 127Université de Montréal, 97Université Laval, 97universities
Aboriginal students in, 14autonomy of, 17, 25, 96, 118completion rates, 108constitutional assignment of responsibilities,
3establishment of, 9–10, 25federal indirect relationship with, 36general operating costs, 60as provincially funded, 26
University and College Entrance Preparation Program, 5, 108
University of Alberta, 97University of British Columbia, 97University of Calgary, 97University of Emmanuel College, 11University of Guelph, 97University of Manitoba, 10, 97University of Ottawa, 97University of Québec at Chicoutimi, 35University of Regina, 35University of Saskatchewan, 11, 97, 107,
148–149University of Toronto, 97University of Waterloo, 97University of Western Ontario, 97upper income students
funding as subsidy, 72, 120independent status and, 73
USA, 17n, 86, 95, 98, 127Usher, A., 6, 7n, 64n, 68, 70, 73, 75, 127
VVan Loon, R.J., 40Van Walraven, J., 105Veteran Affairs, 18–19, 148–149veterans, 18–19, 24Veterans Rehabilitation Act, 18–19, 113, 118visibility, 114, 115visions, 125vocational and technical training, 99–107,
121–123for Aboriginal students, 13, 109capital and operating funding, 19expansion of, 15federal role in, 4–5, 27funding of, 20, 101, 113initiatives for, 99privatization of, 101
program for youth, 18student assistance, 118technical schools, 13trades training, 105–107
voluntary sectors, 122voucher system, 127
WWalker, M., 45war-related research, 15Western College of Veterinary Medicine,
142–143Winsor, H., 83Wolfe, D.A., 85, 101women
distribution of chairs, 95, 117doctoral programs, 56, 71
Work for Tomorrow: Employment Opportunities for the 1980s, 42, 100
work force. See labour forcework-abroad programs, 3Workplace Skills Strategy (WSS), 105–107Wotherspoon, T., 13, 109
YYang, K.R., 36Young, J., 2, 4n8, 39youth
apprenticeship program and, 105at-risk, 9employment initiatives, 64labour market training, 18, 102, 103
Youth Training Act, 16Yukon, 4, 35, 104
ZZhao J., 72