
Campaign Optimization Through Behavioral Modeling and Mobile Network Analysis
16
1 Campaign Optimization through Behavioral Modeling and Mobile Network Analysis Yaniv Altshuler 1,* , Erez Shmueli 2,* , Guy Zyskind 3 , Oren Lederman 3 , Nuria Oliver 4 , Alex (Sandy) Pentland 3 ✦ Abstract—Optimizing the use of available resources is one of the key challenges in activities that consist of interactions with a large number of “target individuals”, with the ultimate goal of “winning” as many of them as possible, such as in marketing, service provision, political campaigns, or homeland security. Typically, the cost of interactions is monotonically increasing such that a method for maximizing the performance of these campaigns is required. In this paper we propose a mathematical model to compute an optimized campaign by automatically determining the number of interacting units and their type, and how they should be allocated to different geographical regions in order to maximize the campaign’s performance. We validate our proposed model using real world mobility data. Keywords—Mobile Networks, Network Optimization, Marketing, Behav- ior Modeling 1 I NTRODUCTION I N a world of limited resources, behavior change campaigns (e.g. marketing, service provision, political or homeland security) can rely on creativity and “coolness” up to a certain point. The success of a campaign can generally be defined as the product of reach (portion of the population exposed to the campaign messages) and value of a single interaction (the ca- pacity of a message to induce a certain behavior in an exposed audience). Hence, campaign managers typically distribute their budget between content enhancement (to increase the value a single interaction) and wide reach. Yet, to date it seems that the optim trade-off between these two factors is found as a result of “intuition” rather than based on well established analysis. In this paper, we propose a novel mathematical method that, given the characteristics of the target audience and its ability to be persuaded, generates an optimized campaign strategy in terms of: (a) the quantity of interacting units, also referred to as insertions and (b) the monetary allocation to each unit. The model takes into account the population’s mobility in an urban environment as it can be inferred from real data received from a large mobile phone carrier. Even though 1 Athena Wisdom, [email protected] 2 Tel-Aviv University, Department of Industrial Engineering, [email protected] 3 MIT Media Lab, {guyz,orenled,sandy}@media.mit.edu 4 Telefonica Research, [email protected] * Indicates equal contribution different populations located in different environments would be tailored with different campaign strategies, the optimality of each strategy would be maintained. A major contribution in our optimization model is the use of network analysis methods to approximate the reach of a campaign. More specifically, given the network of mobility between the different geographic locations, and a subset of locations, we use the Group Betweenness Centrality (GBC) [54] – a network measure that calculates the percentage of shortest paths among all pairs of network nodes that pass through a pre-defined sub-set of the network’s nodes – to approximate the reach of this subset of locations. We then demonstrate that this function can be approximated using a smooth and easily analyzed Gompertz function. This tackles the main limitation of works on campaign optimization hitherto – efficiently estimating the campaign reach as a function of the number of units and their locations. Finally, we validate our campaign optimization model using a real-world mobility network inferred from CDR data, and demonstrate how GBC based deployment of campaign units outperforms several common alternatives. The rest of this paper is organized as follows. Related work is discussed in Section 2. A characterization of a campaign model and its target optimization function are presented in Section 3. An analytical optimization of the campaign’s model is shown in Section 4. A validation of the model using real world mobile data is described in Section 5. Concluding remarks appear in Section 6. 2 RELATED WORK In recent years the social sciences have been undergoing a digital revolution, heralded by the emerging field of “compu- tational social science”. Lazer, Pentland et. al [75] describe the potential of computational social science to increase our knowledge of individuals, groups, and societies, with an un- precedented breadth, depth, and scale. Computational social science combines the leading techniques from network science [19], [88], [116] with new machine learning and pattern recognition tools specialized for the understanding of people’s behavior and social interactions [50]. Marketing campaigns are essential facility in many areas of our lives, and specifically in the virtual medium. One of
Transcript of Campaign Optimization Through Behavioral Modeling and Mobile Network Analysis

1
Campaign Optimization through BehavioralModeling and Mobile Network Analysis
Yaniv Altshuler1,∗, Erez Shmueli2,∗, Guy Zyskind3, Oren Lederman3, Nuria Oliver4, Alex (Sandy) Pentland3
F
Abstract—Optimizing the use of available resources is one of the keychallenges in activities that consist of interactions with a large number of“target individuals”, with the ultimate goal of “winning” as many of themas possible, such as in marketing, service provision, political campaigns,or homeland security. Typically, the cost of interactions is monotonicallyincreasing such that a method for maximizing the performance of thesecampaigns is required. In this paper we propose a mathematical modelto compute an optimized campaign by automatically determining thenumber of interacting units and their type, and how they should beallocated to different geographical regions in order to maximize thecampaign’s performance. We validate our proposed model using realworld mobility data.
Keywords—Mobile Networks, Network Optimization, Marketing, Behav-ior Modeling
1 INTRODUCTION
I N a world of limited resources, behavior change campaigns(e.g. marketing, service provision, political or homeland
security) can rely on creativity and “coolness” up to a certainpoint. The success of a campaign can generally be defined asthe product of reach (portion of the population exposed to thecampaign messages) and value of a single interaction (the ca-pacity of a message to induce a certain behavior in an exposedaudience). Hence, campaign managers typically distribute theirbudget between content enhancement (to increase the value asingle interaction) and wide reach. Yet, to date it seems that theoptim trade-off between these two factors is found as a resultof “intuition” rather than based on well established analysis.
In this paper, we propose a novel mathematical method that,given the characteristics of the target audience and its abilityto be persuaded, generates an optimized campaign strategy interms of: (a) the quantity of interacting units, also referredto as insertions and (b) the monetary allocation to each unit.The model takes into account the population’s mobility inan urban environment as it can be inferred from real datareceived from a large mobile phone carrier. Even though
1 Athena Wisdom, [email protected] Tel-Aviv University, Department of Industrial Engineering,[email protected] MIT Media Lab, {guyz,orenled,sandy}@media.mit.edu4 Telefonica Research, [email protected]∗ Indicates equal contribution
different populations located in different environments wouldbe tailored with different campaign strategies, the optimalityof each strategy would be maintained.
A major contribution in our optimization model is the useof network analysis methods to approximate the reach of acampaign. More specifically, given the network of mobilitybetween the different geographic locations, and a subset oflocations, we use the Group Betweenness Centrality (GBC)[54] – a network measure that calculates the percentage ofshortest paths among all pairs of network nodes that passthrough a pre-defined sub-set of the network’s nodes – toapproximate the reach of this subset of locations. We thendemonstrate that this function can be approximated using asmooth and easily analyzed Gompertz function. This tacklesthe main limitation of works on campaign optimization hitherto– efficiently estimating the campaign reach as a function of thenumber of units and their locations.
Finally, we validate our campaign optimization model usinga real-world mobility network inferred from CDR data, anddemonstrate how GBC based deployment of campaign unitsoutperforms several common alternatives.
The rest of this paper is organized as follows. Related workis discussed in Section 2. A characterization of a campaignmodel and its target optimization function are presented inSection 3. An analytical optimization of the campaign’s modelis shown in Section 4. A validation of the model using realworld mobile data is described in Section 5. Concludingremarks appear in Section 6.
2 RELATED WORKIn recent years the social sciences have been undergoing adigital revolution, heralded by the emerging field of “compu-tational social science”. Lazer, Pentland et. al [75] describethe potential of computational social science to increase ourknowledge of individuals, groups, and societies, with an un-precedented breadth, depth, and scale. Computational socialscience combines the leading techniques from network science[19], [88], [116] with new machine learning and patternrecognition tools specialized for the understanding of people’sbehavior and social interactions [50].
Marketing campaigns are essential facility in many areasof our lives, and specifically in the virtual medium. One of

2
the main thrusts that propels the constant expansions andenhancement of social network based services is its immenseimpact on the “real world” in a variety of fields such as politics,traditional industry, currency and stock trading and more. Thisfield is becoming increasingly popular [51], [78], due to thepossibility of increasing the impact of campaigns by usingnetwork related information in order to optimize the allocationof resources in the campaign. This relies on the understandingthat a substantial impact of a campaign is achieved throughthe social influence of people on one another, rather thanpurely through the interaction of campaign managers with thepeople that are exposed to the campaign messages directly.A constantly growing portion of commercial and governmentmarketing budgets is being allocated to advertising in socialplatforms the main goal of which is to spark viral phenomenathat by spreading through the social networks would result inglobal “trends”.
2.1 Coverage optimization – theory and methodsThe study of optimal coverage in pre-defined regions, by adistributed system of interacting units, has been the topic ofmany works in the past couple of decades. The work of [25]considers the problem of locating the minimum number ofsensors on the network nodes in order to determine arc flowvolumes of the entire network (a variant that considers dynamicenvironments is discussed in [97]). Influencing the behaviorof large consumers population through prices manipulationcampaigns by government agencies is discussed in [38]. In[79] a model for optimizing coverage using a multitude ofunits (in the form of sensors, for traffic surveillance purposes)was discussed.
In general, most of the analytic techniques used for guaran-teeing maximal interaction using distributed actors, or “cam-paign units” use some sort of cellular decomposition of the re-gion to be covered through the campaign. For example, in [30]a decomposition method is being used which is analyticallyshown to guarantee a complete coverage of an area. Anotherinteresting work is presented in [3], discussing two methods forefficient coverage campaign using mobile units (e.g. cars withposters, or mobile advertising Zeppelins), one probabilistic andthe other based on an exact cellular decomposition. Similarresults can be found in [12], [13].
2.1.1 Diffusion optimizationAnalyzing the spreading of information has been the focus ofmany social networks studies for the last decade [67] [77].Researchers have explored both the offline networks structureby asking and incentivizing users to forward real mails andE-mails [45], and online networks by collecting and analyzingdata from various sources such as Twitter feeds [72].
Researchers believe that such techniques can help under-stand the inter-influence of individuals in nowadays entan-gled world, comprising multi-layers of social and media net-works [35], and that it can eventually lead to accurate predic-tion and active optimization and construction for successfuland low-cost viral market campaigns, such as the DARPAChallenge [94]. However, the information diffusion process on
social networks is overwhelmingly complicated: the outcomeis clearly sensitive to many parameters and model settingsthat are not entirely well understood and modeled correctly.As a result, accurate trend prediction and influence diffusionoptimization are currently among the central research topicsin the field.
The dramatic effect of the network topology on the dynam-ics of information diffusion in communities was demonstratedin works such as [36] [90]. One of the main challenges asso-ciated with modeling of behavioral dynamics in social com-munities stems from the fact that it often involves stochasticgenerative processes. While simulations on realizations fromthese models can help explore the properties of networks [63],a theoretical analysis is much more appealing and robust.
The identity and composition of an initial “seed group”in trends analysis has also been the topic of much research.Kempe et al. applied theoretical analysis on the seeds selectionproblem [70] based on two simple adoption models: LinearThreshold Model and Independent Cascade Model. Recently,Zaman et al. developed a method to trace rumors back inthe topological spreading path to identify sources in a socialnetwork [105], and suggest that methods can be used tolocate influencers in a network. Some scholars express theirdoubts and concerns for the influencer-driven viral marketingapproach, suggesting that “everyone is an influencer” [18], andcompanies “should not rely on it” [115]. They argue that thecontent of the message is also important in determining itsspreads, and likely the adoption model we were using is nota good representation for the reality.
2.1.2 Adoption model and social diffusionA fundamental building block in trends prediction that is notyet entirely clear to scholars is the adoption model, modelingindividuals’ behavior based on the social signals they areexposed to. Centola has shown both theoretical and empiricallythat a complex contagion model is indeed more precise fordiffusion [32], [33]. Using social influence relations derivedfrom online domains was discussed for example in [91]. Muchresearch concerning the prediction of users’ behavior basedon the dynamics in their community has been carried out inthe past, using a variety of approaches such as sociologicalmethods [58], [65], communities-oriented approaches [66],game theory [34] and various machine learning methods [92].Different adoption models can dramatically alter the modeloutcome [46]. In fact, a recent work on studying mobileapplication diffusions using mobile phones demonstrated thatin real world the diffusion process is a far more complicatedphenomenon, and a more realistic model was proposed in [93].
2.2 Using mobile phones data for social systemsmodeling
The use of mobile phone data for the mobility and behavioralmodeling of large population has become popular in the recentdecade. In [74] the behavior and social patterns of 2.5 millionmobile phone users, making 810 million phone calls, wereanalyzed and resulted in efficient mapping of users’ mobilityand housing patterns. Similar result appears in [61],

3
In another example, it was shown that the penetration ofcellular phones to the Israeli market is very high, even tolower income households, and specially among individualsin the ages of 10 to 70 (the main focus of travel behaviorstudies) [23]. This widespread use of cellular phones enablesthe collection of accurate mobility data that can be used toanalyze and optimize coverage and monitoring campaigns.
For example, this data was shown in [23] and [118] toprovide a high quality coverage of the network, tracking 94%of the trips (defined as at least 2km in urban areas, and at least10km in rural areas). The resulting data contained a wealth oftraffic properties for a network of over 6,000 nodes, and 15,000directed links. In addition, the network was accompanied withan Origin Destination (OD) matrix, specifying start and endpoints of trips.
2.3 Campaign optimization studiesWhenever a company wishes to introduce a new product,increase its market share or merely retain the current one,it needs to engage itself in marketing efforts. In fact, theglobal marketing spend has been rising fast for several decades,and is currently estimated at 1 trillion dollars a year, whichmakes it between 1 to 2 percent of global GDP [56]. Oneimportant decision with regard to marketing involves findingthe optimal balance between cost and effectiveness of themarketing campaign. An appropriate optimization method canhelp either to obtain more effective marketing results for agiven budget or to reduce the marketing cost.
The advertising budgeting problem has been addressed inliterature from different perspectives. Early models were rela-tively simple. [87] focused on the relationship between currentmarketing spending and future demand. In [112], Vidale andWolfe represented sales response using three parameters - salesdecay, saturation level and a response constant. Building uponthe Vidale-Wolfe model, [104] used optimal control theory toobtain an optimal advertising strategy and [43] extended it toinclude competition in a duopoly.
[81] reviewed aggregate advertising models - functions thatshow the relationship between product sales and advertisingspending for a market as a whole. He stressed that mostmodels at the time often contradicted one another and missedkey components, making it difficult to put these models intopractical use.
Several works, such as [98] and [52], suggested that at leastthe short term response to advertising is S-shaped. Meaningthat an increase in advertising is typically followed by aperiod of diminishing returns. In [84], Mesak and Hani provideoligopolistic justification for a pulsing advertising policy whereS-shaped response functions are present.
[43] determines the optimal advertising expenditures fora duopoly in an equilibrium. [99] characterized the brands’choice and Nash equilibrium advertising expenditures in anoligopoly. [59] shows a model of oligopolistic competition inwhich advertising enters into the demand functions of firms,resulting in a positive relationship between product price andthe degree of advertising cooperativeness. [89] incorporatedrandom demand for a product to show how demand uncertainty
affects advertising decisions. [68] showed that when the marketis saturated, a brand should choose a defensive strategy, inwhich the goal is preserving the existing customers and sales.[22] explains how to choose between generic advertising andbrand advertising strategies in a dynamic duopoly.
Several researchers sought methods of helping marketingmanagers allocate a given budget and optimize response.[83] focused on assisting marketing managers in optimizingadvertising budget. They presented the first comprehensiveallocation model that, given a fixed budget, finds the optimalspread over time and market segments. Using simple inputs,the model created by [101] efficiently select advertising sched-ules for network television.
Instead of looking at advertising as an expense, [40] arguesthat advertising should be regarded as an investment with long-lived effects. They then lay out an approach for calculating thelevel of spending that generates optimal return. Following thisapproach, [41] supplies the formulas required for calculatingthe level of spending that maximizes ROI. [85] uses a Markovdecision process to formulate a stochastic, sequential modelthat takes into account the maturity and past advertising of theproduct and determines the optimal advertising spending. [73]considers the advertising investment in a spatial monopoly,contrasting the socially optimal behavior of a benevolentplanner against that of a profit seeking monopolist.
The formulas in [41] provide a solution for a single product,single medium and a single stage. [48] addresses the multi-product advertising budgeting problem, in which the cross-effects of the advertised products are taken into consideration,as well the effect of the promoted products on the rest ofthe products portfolio. [106] and others studied multistageadvertising budgeting, showing the short-term and long-termimpact on demand.
Additional work has been done by [24], who addressedthe multistage multiproduct advertising budgeting problem -optimizing the budget and allocation for multiple products,multiple sale attributes over multiple periods. They tested theirmodel in an actual campaign and observed a clear increasein profits compared to other approaches. In the second partof their work, [24], they introduce a stochastic optimizationmodel and compare it with the deterministic model presentedon their early work.
So far, we have reviewed models used for finding optimalexpenditures and coverage in marketing campaign. However, avariation of these problems can be found in other domains aswell. For example, in [2], the authors discuss two methods forefficient coverage using mobile units, one probabilistic andthe other based on an exact cellular decomposition. Similarresults and methods can be found in [12], [14]. The work of[26] considers the problem of locating the minimum numberof sensors on the network nodes in order to determine arcflow volumes of the entire network. The dynamic environmentsvariant is discussed in [97]. The study of the correlation be-tween topological features of a marketing environment networkand the efficiency of a distributed group of (mobile) units isdiscussed in [16]. In [80] a model for optimizing coverageusing a multitude of units (in the form of sensors, for trafficsurveillance purposes) was discussed. In general, most of the

4
analytic techniques used for guaranteeing maximal interactionusing distributed actors, or campaign units use some sort ofcellular decomposition of the region to be covered through thecampaign. For example, in [31] a decomposition method isbeing used which is analytically shown to guarantee a completecoverage of an area. These methods are the equivalent of theoptimization methods used for finding the optimal coverageusing various media (e.g. cars with posters, or mobile adver-tising, Zeppelins) in the world of marketing campaigns.
2.4 Campaign optimization in practiceThe author of [82] pointed out that a model that is to beused by a manager should be simple, robust, easy to control,adaptive, as complete as possible and easy to communicatewith. In accordance with this recommendation, the models thatwe survey in this section are simple but realistic enough to beused in the advertising industry.
2.4.1 Estimating effectivenessIn the past, short-term measurement of advertising effective-ness was extremely problematic because of the inherently long-term nature of advertising impact and the very small short-term effects of advertising [1], [29], [110], [111]. Thus, as apractical matter, the media planner often employed a proxyfor advertising effectiveness [41]. Popular choices for such aproxy include reach [41], effective reach [4], [39], [86] andaverage frequency [41]. Reach is the proportion of the targetaudience exposed to at least one insertion of the advertisement.Effective reach is the proportion of the target audience exposedto at least three insertions of the advertisement. Frequency isthe average number of times a person from the reach audienceis exposed to an advertisement.
Exposure to an advertisement is often measured in GrossRating Points (GRPs): the product of reach and frequency. Forexample, 100 GRPs could mean that 100% of the market isexposed once to an advertisement or that 50% of the market isexposed twice [62]. According to [21], it is usually preferredto measure advertising in GRPs and not in dollars since: (1)most managers evaluate the effectiveness of their campaignsin terms of demand generated per GRP; and (2) it is not clearhow much advertising exposure can be purchased for a givenbudget, and thus GRPs provide a clearer picture of advertisinginput.
We denote the reach for k insertions as rk, and for g GRPsas rg . Similarly, we denote the effective reach for k insertionsas erk, and for g GRPs as erg .
Traditionally, advertising campaigns are quantitatively de-scribed by the exposure distribution (ED), defined as theprobability of exposure to none, one, up to all of the adsin the campaign [42], [102]. Denoting the exposure randomvariable as X, ranging from 0, 1 . . . k, where k is the totalnumber of insertions in the campaign. It was found in [76]that the most frequently used nonproprietary model for X isthe beta-binomial distribution (BBD), with mass function:
fX(x) =
(k
x
)· Γ(α+ β) · Γ(α+ x)
Γ(α+ β + k) · Γ(α)· Γ(β + k − x)
Γ(β)
where Γ is the gamma function and α, β > 0. The authorsof [41] showed that under the BBD model, the reach functioncan be modeled as:
rk = 1−k−1∏j=0
β + j
α+ β + j
and the number of GRPs can be modeled as:
g = 100k · α
α+ β
That is, the number of GRPs g depends linearly on thenumber of insertions k. At first, this result may seem strange,as the same value of GRPs may have several correspondinginsertions values. In reality, however, for a moderately largenumber of insertions, the GRPs-insertions curve is quite flat.This means that, although there are many possible insertionsvalues for the same GRPs, the fluctuation in GRPs for thesecombinations are small [109].
In recent years, it has become significantly easier to estimatethe effectiveness function directly. We are living the era of BigData, where companies gather and manage huge databases.By using market response models we can transform this rawmarketing information into ’ready to use’ information [62]. Asa concrete example, [24] models the sales due to advertisingas a function of the number of GRPs, denoted as salesg .
Regardless of whether the effectiveness function fg is esti-mated directly or via a proxy, in the single product scenario, itcorresponds to an increasing concave function which modelsdiminishing returns [62].
The authors of [41] argue that the effectiveness proxiesrg and erg can be well approximated by a function of thefollowing form:
fg ≈ 1− γg−λ
where γ, λ > 0 and g > g0 for some lower threshold value ofGRPs.
The authors of [62] argue that a better choice for approxi-mating fg is the so called ’modified exponential’ function:
fg ≈ γ(1− e−δg)
In the multi product scenario, however, there exist crosselasticities among the products due to relationships of comple-mentarity or substitution [48]. In the case of complementarity(positive elasticity), advertising on one product increases salesof another product and this cross effect can be modeled by anincreasing concave function. In the case of substitution (neg-ative elasticity), however, advertising on one product reducessales of the other product (this cross effect is known as canni-balization [24]). The cannibalization effect can be modeled bya decreasing convex function. If this function is strictly convex,the resulting effectiveness function may not be concave. As iswell known, concavity of the objective function is a desirableproperty in a maximization problem since it guarantees globaloptimality (assuming a convex feasible domain). Having saidthat, the cross product effects are usually small relative to the

5
direct advertising effects, and therefore, in most cases, it isreasonable to assume that the effectiveness function can bemodeled by an increasing concave function.
In Section 4, we suggest a method to derive the reachfunction using real-world data, and propose to model it us-ing a Gompertz function instead of a ’modified exponential’function.
2.4.2 Estimating costthe authors of [40] have proposed a mathematical relationshipbetween cost and GRPs. The function employed makes twoassumptions: (1) more GRPs cost more than fewer GRPs andthus cost is a monotonically increasing function of GRPs; and(2) buying a large number of GRPs can result in discounts andthus the cost curve is concave. The authors further suggest thefollowing flexible functional form to model the cost functioncg .
cg = C · gδ
where C > 0 is a constant and 0 ≤ δ ≤ 1 is a parameterwhich reflects the expected discounting extent.
In the remainder of this paper we assume that no discountingoccurs and thus δ = 1.
cg = C · g
2.4.3 Optimal criteriaThe authors of [40] and [41] categorize spending criteria intopopular ad hoc criteria, and optimal criteria, which are basedon modeling and solving an optimization problem. Althoughcriteria that are actively used in practice often tend to be inthe ad hoc category, we focus here on the optimal category.
The three primary approaches for optimizing the level ofmarketing spending are: (1) maximizing advertising profitabil-ity, (2) maximizing advertising productivity (efficiency), and(3) maximizing the return on investment of advertising.
Maximizing advertising profitabilityThis approach, developed by Kaplan and Shocker [69] startswith the assumption that an advertising effectiveness measureexists (perhaps effective reach), and that this measure isdirectly related to revenue. This seemingly strong assumptionis not so unreasonable, because almost all media planners (in-cluding the most sophisticated ones) currently use surrogatesof advertising effectiveness.
If we denote profitability as E1, the measure of advertisingeffectiveness as fg , where g is the number of GRPs, and cg isthe cost of buying g GRPs, then the profitability is:
E1 = K · fg − cgwhere K is the dollar value of one unit of effectiveness.
Maximizing advertising productivity (efficiency)Maximizing productivity or efficiency is another alternative.Economists often emphasize the importance to the economy
of increasing productivity, and management scholars recognizethat the greatest potential for gains in productivity are in theknowledge and service sectors of the economy [49].
Using the above notations, productivity (efficiency) is cal-culated as:
E2 =K · fgcg
Maximizing the return on investmentThis approach was proposed in [44]. Using the above notations,return on investment (ROI) is calculated as:
E3 =K · fg − cg
cg=K · fgcg
− 1
3 CHARACTERIZATION OF A CAMPAIGNLet us define a campaign as an activity confined in time andspace with a limited budget whose objective is to send amessage or engage with the maximum number of individualswho are located in that space.
More specifically, based on the conventions laid out in theprevious section, let us define an insertion as some kind ofinduced intervention that is designed to incentivize certainkinds of inclined behavior in the audience. Such insertionscan be for example large billboards, human agents who handcoupons to passing pedestrians, etc. Let us also define adeployment scheme as a specific allocation algorithm that fora given number of insertions k outputs a set of k locations forsaid insertions. Finally, let us define the reach function, rk,as the number of individuals exposed to at least one insertion(given that exactly k insertions were deployed according to thegiven deployment scheme).
Selecting profitability as our optimal criteria (see Section2.4.3), the reach function rg as the effectiveness measurefg , and C · g as the cost function cg (see Section 2.4.2),the Optimized Campaign Problem aims at maximizing thefollowing target function:
Eg = K · rg − C · g (1)
Given that k ≈ g (see Section 2.4.1), the above equationcan be rewritten to use the number of insertions k instead ofthe number of GRPs g.
Ek = K · rk − C · k (2)
Next, we are left with efficiently modeling the reach functionrk. Assume that the network of mobility between all possiblelocations is available (In section 5 we demonstrate such amobility network which is inferred from CDR data). Givena number of insertions k and a deployment scheme, the reachfunction rk can be well approximated by calculating the GroupBetweenness Centrality (GBC) [54] of the k locations (i.e.nodes) which are returned by the deployment scheme.
Betweenness Centrality (BC) stands for the ability of an in-dividual node to control the communication flow in a network

6
and is defined as the total fraction of shortest paths betweeneach pair of vertices that pass through a given node [17], [57].In recent years Betweenness was extensively applied to analyzevarious complex networks [20], [108] including social net-works [103], [114], computer communication networks [55],[119], and protein interaction networks [27]. Holme [64] hasshown that Betweenness is highly correlated with congestion inparticle hopping systems. Extensions of the original definitionof BC are applicable for directed and weighted networks [28],[117] as well as for multilayer networks where the underlyinginfrastructure and the origin-destination overlay are explicitlydefined [95].
The GBC of a given group (U ⊆ V ) of vertices accounts forall routes that pass through at least one member of the group.Let σs,t be the number of shortest-path routes from s to t, andlet σs,t(U) be the number of shortest-path routes from s to tpassing through at least one vertex in U :
GBC(U) =∑
s,t∈V \C|s6=t
σs,t(U)
σs,t(3)
While the “optimal deployment scheme”, by definition,would select the set of k locations that yield the maximalgroup betweeness centrality, our proposed model does notassume any constraint on the deployment scheme and enablesthe planners to select the optimal number and type of theunits, as a function of the deployment scheme used. Morespecifically, in many cases the optimal deployment schememight be unfeasible, involve additional costs, or be subjectto various regulatory constraints. In such cases campaignmanagers may choose a different, non-optimal, deploymentscheme. Regardless of the deployment scheme chosen, it wouldof course still provide monotonically increasing reach (andGBC), albeit with a lower incline rate compared to the optimalone.
Finally, we model the approximated reach function, usingthe well-known Gompertz function [60]:
rk = aebeck
(4)
The Gompertz function is widely used for modeling agreat variety of processes, (due to the flexible way it can becontrolled using the parameters a, b and c), such as mobilephone uptake [100] or population in a confined space [53].Its ability to model the progress of optimization process as afunction of the available resources can be seen for examplein [5]–[7], [15]. In Section 5, we present empirical evidencewhich illustrates how the reach function rk approximated bythe GBC of three different deployment schemes can be fittedefficiently into a Gompertz function.
Assigning the values of Equation 4 back into Equation 2,results in the following target function:
Ek = K · aebeck
− C · k (5)
The campaign will be optimized by determining the op-timal number of insertions (k) and the optimal cost (C) ofeach individual insertion that would maximize the campaign’sperformance.
4 OPTIMIZED CAMPAIGNS
At this point, we have a clear model for estimating theefficiency of a campaign, that is dependent on the numberof insertions and the cost of each insertion.
4.1 Optimizing the Number of InsertionsWe now turn our attention to finding the optimal numberof insertions k that would maximize the profitability of thecampaign. First, we obtain the derivative to find the criticalpoints of the function we seek to optimize:
∂Ek∂k
= K · ∂(aebeck
)
∂k− C (6)
Nullifying Equation 6 results in:
∂(aebeck
)
∂k=C
K(7)
In that case, using Equation 7 we obtain:
a · b · c · eck · ebeck
=C
K
which in turn implies:
beck + ck − lnC
a · b · c ·K= 0 (8)
We note that a, b, c > 0. Analyzing Equation 8 we can thensee that in cases where:
C
K≤ −a · c
e(9)
and where W (x) is the Lambert product log, that can becalculated using the series:
W (x) =
∞∑n=1
(−1)n−1nn−2
(n− 1)!xn (10)
the optimal value of k would equal:
k1 =ln(
1a·b·c ·
CK
)−W
(1a·c ·
CK
)c
k2 =ln(
1a·b·c ·
CK
)−W−1
(1a·c ·
CK
)c
(11)
Note that W (x) is the Lambert product log, and Wk(x) isits analytic continuation over the complex plane (the values ofthe functions W (x) and W−1(x) in the segment implied bythe constraint of Equation 9 are illustrated in Figure 1).
Returning to the optimization of the campaign, we nowassign the values of the optimal number of insertions ofEquation 11 into the definition of Ek, as follows:
Ek1 = K · aebeck1 − k1 · C
Ek2 = K · aebeck2 − k2 · C

7
Fig. 1. The upper and lower charts depict the values ofthe Lambert functions W (x) and W−1(x) in the segment[− 1
e , 0], respectively. The segment is implied by the con-straint of Equation 9.
and using the properties of the W function, simplify it intothe following form:
Ekmax = max{Ek1 , Ek2} where: (12)
Ek1 = a · b ·K · γ ·(W (b · γ) +
1
W (b · γ)− ln (γ)
)Ek2 = a · b ·K · γ ·
(W−1 (b · γ) +
1
W−1 (b · γ)− ln (γ)
)where the Campaign Benefit Factor γ is defined as:
γ =1
a · b · c· CK
From Equation 12 we see that the optimization of a cam-paign is a function of the Campaign Benefit Factor γ, whichtakes into account the dollar value of one unit of effectiveness,the total cost, as well as the deployment scheme (characterizedby the values of a, b and c). Notice that the value of C doesnot affect the values of a, b and c (as they are solely derivedfrom the coverage efficiency of the mobility patterns).
4.2 Optimizing the Cost of a Single InsertionWe now proceed to finding the optimal type of units that shouldbe deployed, by optimizing Equation 12 with respect to thecost of various possible kinds of insertions.
Definition 1: Let CostBase denote the cost of the “mostexpensive” insertions which we will assume are the units thatprovide the highest value to the initiators of the campaign,
namely — those insertions that persuade the maximal amountof individuals to take the desired action.
We hereby define K, the dollar value of one unit of effec-tiveness, as a function dependent on the proportion betweenthe cost of the given type of insertions and the cost of theoptimal, but most expensive, insertions:
K = fS
(C
CostBase
)(13)
We now look into finding the optimal cost of insertions thatwould maximize the profitability of a campaign. To do so,we first revise Equation 12 in order to take into account thedifferent types of insertions:
(14)
Ek1 = a · b · fS · γ ·(W (b · γ) +
1
W (b · γ)− ln (γ)
)
Ek2 = a · b · fS · γ ·(W−1 (b · γ) +
1
W−1 (b · γ)− ln (γ)
)and where:
γ =1
a · b · c· CfS
We then maximize the financial merits of the campaign(namely, max{Ek1 , Ek2}), by calculating the partial deriva-tives ∂Ek1
∂C and ∂Ek2
∂C :∂Ek1∂C
= (15)
1
c·
(W (b · γ)− ln(γ) +
1− ∂fS∂C ·
CCostBase·fS
W (b · γ)
)and:
∂Ek2∂C
=
1
c·
(W−1(b · γ)− ln(γ) +
1− ∂fS∂C ·
CCostBase·fS
W−1(b · γ)
)Once again, by nullifying the partial derivative and finding thecritical points, we obtain the following set of equations:
(16)
0 = W (b · γ)− ln(γ)+
1− CCostBase
· ∂fS∂C
[C
CostBase
]·(fS
[C
CostBase
])−1W (b · γ)
or :
0 = W−1(b · γ)− ln(γ)+
1− CCostBase
· ∂fS∂C
[C
CostBase
]·(fS
[C
CostBase
])−1W−1(b · γ)
where :
γ =1
a · b · c· CK·(fS
[C
CostBase
])−1

8
Equation 16 can now be used to calculate the exact optimalcost of a single insertion, for every cost-value relation, and forevery deployment scheme!
5 CAMPAIGN OPTIMIZATION FOR A REAL-WORLD MOBILITY NETWORK
In this section we validate our campaign optimization modelusing a real-world mobility network inferred from CDR data.
5.1 The DatasetWe used Call Data Records (CDR) from a large mobile carrierto create a network that captures the traveling patterns amongdifferent urban areas. CDR are readily available today, asthey are collected by all carriers and in most (if not all)countries. Furthermore, these records are constantly collectedin an automated manner, thus increasing the likelihood ofthe data being objective and uniform across locations andoperators.
More specifically, we denote G = 〈V,E〉 to be theundirected network graph, where V is the set of verticesrepresenting the cell towers and E is the set of weighted edgesrepresenting trips or movements of people between two celltowers. The weight of each edge represents the number oftrips that people made between the cell towers connected bythat edge.
Each CDR contains an anonymized identifier of thecaller/callee, the call time, and the cell tower that the phonewas connected to when the call (or SMS) originated. A trip isdefined as a change of location by the caller/callee, detectedby the existence of two consecutive calls from two differenttowers or by a change in the cell tower during an existing call.
As shown in figure 2 (left), the weights of the edges inthe network seem to follow a power-law distribution. Weused the method suggested in [37] and [113] to determinethe best Xmin and corresponding γ values that fit a power-law distribution. Since the focus of this paper is not relatedto the network’s topology, our analysis did not include thestatistical tests performed in [37]. Figure 2 (right) shows theProbability Density Function (PDF) and the best power-law fitwith Xmin = 3 and γ = 1.87.
In order to focus on the network’s structure that representsurban mobility patterns of large populations, we retainedonly edges with weights higher than 10 (arbitrarily chosenthreshold), producing a graph with |V | = 18, 315 and |E| =130, 313.
The Complementary Cumulative Distribution Function(CCDF) of node degrees is shown in Figure 3 (left). Onceagain, we used the method suggested by [37] and [113] to findthe parameters that best fit a power-law distribution. Figure3 (right) shows the PDF and the best power-law fit withXmin = 45 and γ = 5.05.
5.2 Optimized Deployment SchemesAcquiring information regarding the mobility patterns of theaudience members, and the specific network that is generated
through those patterns can be used to subsequently deriveoptimized locations for the campaign units, or to the very least,provide a way of measuring the utilization of a set of locations,by calculating the GBC of the set, and comparing it to that ofthe optimal one.
Several combinatorial optimization techniques can be usedto find a group of nodes of given size that has the largestGBC, including greedy approximation [47], a classical DepthFirst Branch and Bound (DFBnB) heuristic search algorithm[71], or the recently proposed Potential Search [107]. Boththe DFBnB and the Potential algorithms are anytime searchalgorithms [120], meaning that their execution can be stoppedat any point of time, yielding the best solution found so far.
Similarly to [96], in this section, we examine three methodsfor finding the group of size k with the highest GBC, andapply them on our real-world mobility network. The firstmethod, Random Deployment, simply selects a random set ofk vertices. The second method, BC Deployment, chooses thek vertices with the highest individual Betweeness Centralityscores. The third method, GBC Deployment, uses a greedyalgorithm which iteratively finds the vertex which improvesthe group’s GBC score the most and adds it to the group.
Due to the runtime complexity of the GBC calculation andthe GBC deployment scheme, we performed two stages ofsampling our mobility network. First, a subset of 5000 verticeswas randomly selected. Then, we retained only the largestconnected component, denoted by G, a network containing991 vertices and 3,304 edges. An illustration of the resultingnetwork is shown in figure 4.
Fig. 4. Network G’
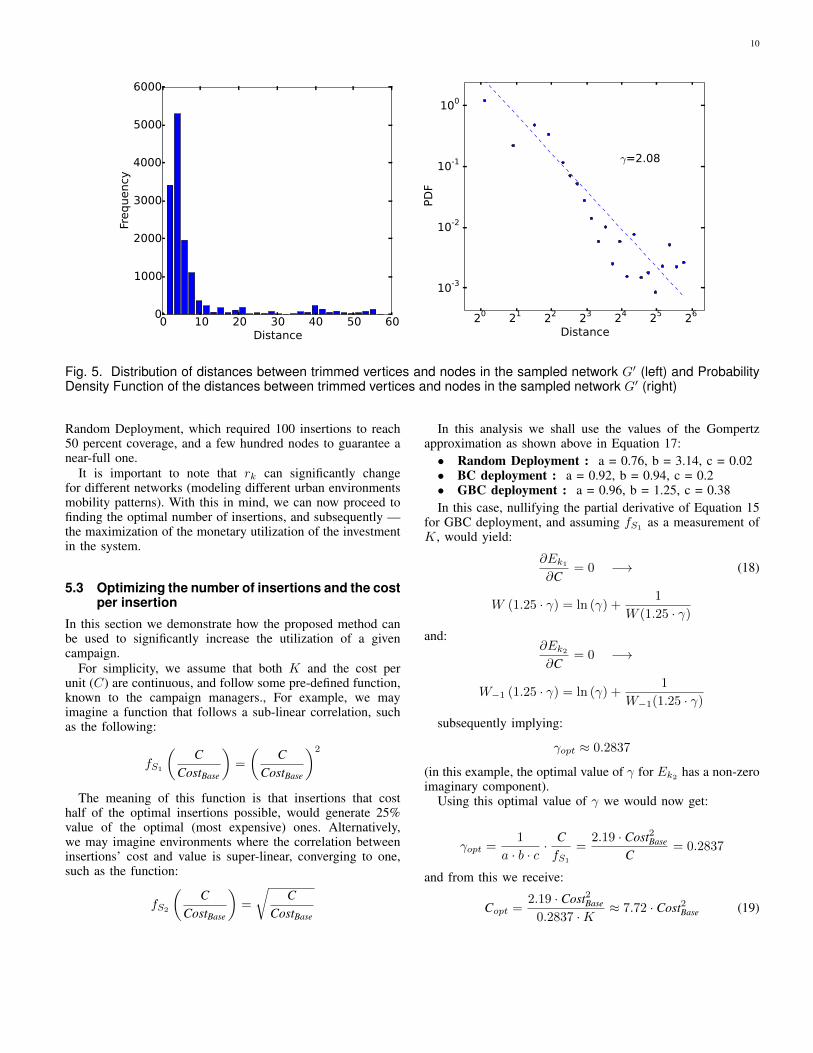
It can be seen that this network is a good sampling of theoriginal network, as the median distance from each trimmednode to the closest node in the sampled network is 4, whilethe diameter of the graph itself is 22. Figure 5 (left) shows thedistribution of distances of trimmed vertices from nodes in thesampled network and Figure 5 (right) depicts the PDF and thebest power-law fit with Xmin = 3 and γ = 2.08.
We examined the three deplyment schemes variants, calcu-

9
0 500 1000 1500 2000 2500 3000 3500Weight
100
101
102
103
104
105
106
107
Frequency
20 21 22 23 24 25 26 27 28 29 210211212
Weight
10-8
10-7
10-6
10-5
10-4
10-3
10-2
10-1
100
γ=1.87
Fig. 2. Edge weights in network G. The left figure shows distribution of edge weights. The right figure depicts theProbability Density Function
20 21 22 23 24 25 26 27
Degree
10-4
10-3
10-2
10-1
100
CCDF
25 26 27
Degree
10-3
10-2
10-1PDF
γ=5.05
Fig. 3. Distribution of the node degrees ofG. The left figure depicts the Complementary Cumulative Distribution Functionfor all degrees. The right figure illustrates the Probability Density Function for all degrees higher than Xmin
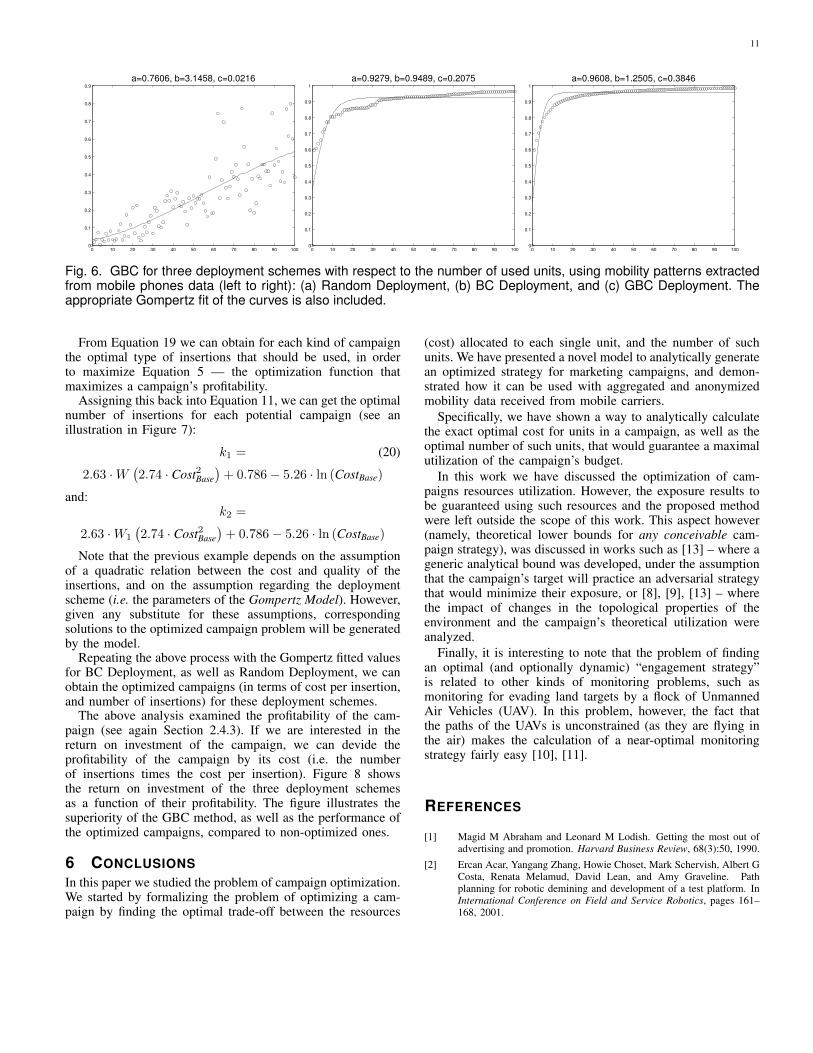
lated their corresponding GBC values, and fitted them onto aGompertz function using regression. Figure 6 illustrates thethree deployment schemes for our mobility network. Theirfitting yielded the following Gompertz regressions:
Random Deployment : rk = 0.76e−3.14e−0.02k
(17)
BC Deployment : rk = 0.92e−0.94e−0.2k
GBC Deployment : rk = 0.96e−1.25e−0.38k
The regressions had the following fit quality (in terms of
R2):
1) Random Deployment - 0.66832) BC Deployment - 0.80353) GBC Deployment - 0.8531
Consistently with [95], using the GBC Deployment we sawthat it is possible to cover the vast majority of the mostpopular mobility nodes with a few dozen insertions. TheBC Deployment produced high quality deployments as well,although based on our findings it required a higher number ofinsertions. It seems that both schemes significantly outperform
10
0 10 20 30 40 50 60Distance
0
1000
2000
3000
4000
5000
6000
Frequency
20 21 22 23 24 25 26
Distance
10-3
10-2
10-1
100
PD
F
γ=2.08
Fig. 5. Distribution of distances between trimmed vertices and nodes in the sampled network G′ (left) and ProbabilityDensity Function of the distances between trimmed vertices and nodes in the sampled network G′ (right)
Random Deployment, which required 100 insertions to reach50 percent coverage, and a few hundred nodes to guarantee anear-full one.
It is important to note that rk can significantly changefor different networks (modeling different urban environmentsmobility patterns). With this in mind, we can now proceed tofinding the optimal number of insertions, and subsequently —the maximization of the monetary utilization of the investmentin the system.
5.3 Optimizing the number of insertions and the costper insertion
In this section we demonstrate how the proposed method canbe used to significantly increase the utilization of a givencampaign.
For simplicity, we assume that both K and the cost perunit (C) are continuous, and follow some pre-defined function,known to the campaign managers., For example, we mayimagine a function that follows a sub-linear correlation, suchas the following:
fS1
(C
CostBase
)=
(C
CostBase
)2
The meaning of this function is that insertions that costhalf of the optimal insertions possible, would generate 25%value of the optimal (most expensive) ones. Alternatively,we may imagine environments where the correlation betweeninsertions’ cost and value is super-linear, converging to one,such as the function:
fS2
(C
CostBase
)=
√C
CostBase
In this analysis we shall use the values of the Gompertzapproximation as shown above in Equation 17:• Random Deployment : a = 0.76, b = 3.14, c = 0.02• BC deployment : a = 0.92, b = 0.94, c = 0.2• GBC deployment : a = 0.96, b = 1.25, c = 0.38In this case, nullifying the partial derivative of Equation 15
for GBC deployment, and assuming fS1 as a measurement ofK, would yield:
∂Ek1∂C
= 0 −→ (18)
W (1.25 · γ) = ln (γ) +1
W (1.25 · γ)
and:∂Ek2∂C
= 0 −→
W−1 (1.25 · γ) = ln (γ) +1
W−1(1.25 · γ)
subsequently implying:
γopt ≈ 0.2837
(in this example, the optimal value of γ for Ek2 has a non-zeroimaginary component).
Using this optimal value of γ we would now get:
γopt =1
a · b · c· CfS1
=2.19 · Cost2Base
C= 0.2837
and from this we receive:
Copt =2.19 · Cost2Base
0.2837 ·K≈ 7.72 · Cost2Base (19)
11
0 10 20 30 40 50 60 70 80 90 1000
0.1
0.2
0.3
0.4
0.5
0.6
0.7
0.8
0.9a=0.7606, b=3.1458, c=0.0216
0 10 20 30 40 50 60 70 80 90 1000
0.1
0.2
0.3
0.4
0.5
0.6
0.7
0.8
0.9
1a=0.9279, b=0.9489, c=0.2075
0 10 20 30 40 50 60 70 80 90 1000
0.1
0.2
0.3
0.4
0.5
0.6
0.7
0.8
0.9
1a=0.9608, b=1.2505, c=0.3846
Fig. 6. GBC for three deployment schemes with respect to the number of used units, using mobility patterns extractedfrom mobile phones data (left to right): (a) Random Deployment, (b) BC Deployment, and (c) GBC Deployment. Theappropriate Gompertz fit of the curves is also included.
From Equation 19 we can obtain for each kind of campaignthe optimal type of insertions that should be used, in orderto maximize Equation 5 — the optimization function thatmaximizes a campaign’s profitability.
Assigning this back into Equation 11, we can get the optimalnumber of insertions for each potential campaign (see anillustration in Figure 7):
k1 = (20)
2.63 ·W(2.74 · Cost2Base
)+ 0.786− 5.26 · ln (CostBase)
and:k2 =
2.63 ·W1
(2.74 · Cost2Base
)+ 0.786− 5.26 · ln (CostBase)
Note that the previous example depends on the assumptionof a quadratic relation between the cost and quality of theinsertions, and on the assumption regarding the deploymentscheme (i.e. the parameters of the Gompertz Model). However,given any substitute for these assumptions, correspondingsolutions to the optimized campaign problem will be generatedby the model.
Repeating the above process with the Gompertz fitted valuesfor BC Deployment, as well as Random Deployment, we canobtain the optimized campaigns (in terms of cost per insertion,and number of insertions) for these deployment schemes.
The above analysis examined the profitability of the cam-paign (see again Section 2.4.3). If we are interested in thereturn on investment of the campaign, we can devide theprofitability of the campaign by its cost (i.e. the numberof insertions times the cost per insertion). Figure 8 showsthe return on investment of the three deployment schemesas a function of their profitability. The figure illustrates thesuperiority of the GBC method, as well as the performance ofthe optimized campaigns, compared to non-optimized ones.
6 CONCLUSIONSIn this paper we studied the problem of campaign optimization.We started by formalizing the problem of optimizing a cam-paign by finding the optimal trade-off between the resources
(cost) allocated to each single unit, and the number of suchunits. We have presented a novel model to analytically generatean optimized strategy for marketing campaigns, and demon-strated how it can be used with aggregated and anonymizedmobility data received from mobile carriers.
Specifically, we have shown a way to analytically calculatethe exact optimal cost for units in a campaign, as well as theoptimal number of such units, that would guarantee a maximalutilization of the campaign’s budget.
In this work we have discussed the optimization of cam-paigns resources utilization. However, the exposure results tobe guaranteed using such resources and the proposed methodwere left outside the scope of this work. This aspect however(namely, theoretical lower bounds for any conceivable cam-paign strategy), was discussed in works such as [13] – where ageneric analytical bound was developed, under the assumptionthat the campaign’s target will practice an adversarial strategythat would minimize their exposure, or [8], [9], [13] – wherethe impact of changes in the topological properties of theenvironment and the campaign’s theoretical utilization wereanalyzed.
Finally, it is interesting to note that the problem of findingan optimal (and optionally dynamic) “engagement strategy”is related to other kinds of monitoring problems, such asmonitoring for evading land targets by a flock of UnmannedAir Vehicles (UAV). In this problem, however, the fact thatthe paths of the UAVs is unconstrained (as they are flying inthe air) makes the calculation of a near-optimal monitoringstrategy fairly easy [10], [11].
REFERENCES
[1] Magid M Abraham and Leonard M Lodish. Getting the most out ofadvertising and promotion. Harvard Business Review, 68(3):50, 1990.
[2] Ercan Acar, Yangang Zhang, Howie Choset, Mark Schervish, Albert GCosta, Renata Melamud, David Lean, and Amy Graveline. Pathplanning for robotic demining and development of a test platform. InInternational Conference on Field and Service Robotics, pages 161–168, 2001.

12
0 0.005 0.01 0.015 0.02 0.025 0.03 0.035 0.04 0.045 0.0515
20
25
30
35
40
Cost of a single unit / Maximal campaign impact
Opt
imal
num
ber o
f cam
paig
n un
its
Optimal number of campaign units, assuming GBC deployment
Fig. 7. An illustration of Equation 16, under the GBC Deployment scheme, as approximated by the Gompertz functionmodeling of Equation 17. For example, when a single unit costs 1% of the maximal campaign impact, the optimal numberof campaign units would be 25, whereas if cheaper units are used (such as units that cost merely 1
2% of the maximalcampaign impact) the optimal number of units would be 28. Alternatively, for expensive units that cost 5% of the maximalcampaign’s impact, the optimal number of campaign units would drop to 16.
0 1 2 3 4 5 6 7 8 9 10
x 106
0
0.1
0.2
0.3
0.4
0.5
0.6
0.7
0.8
0.9
1Comparative analysis of the campaign utilization of three deployment schemes
Maximal impact of the campaign (upper bound over the campaign’s overall budget)
Cam
paig
n ut
iliza
tin
GBCBCRandom
Fig. 8. Comparative analysis of 3 deployment schemes – GBC Deployment, BC Deployment and Random Deployment,in terms of their return on investment, as a function of their profitability. It can be see that the return on investment of allmethods is monotonically increasing. However, it can clearly be seen that whereas Random Deployment achieves onlya slow increase in return on investment, the performance of GBC Deployment and BC Deployment are much better.
[3] E.U. Acar, Y. Zhang, H. Choset, M. Schervish, A.G. Costa, R. Mela-mud, D.C. Lean, and A. Gravelin. Path planning for robotic deminingand development of a test platform. In International Conference onField and Service Robotics, pages 161–168, 2001.
[4] Alvin A Achenbaum. Effective exposure: A new way of evaluatingmedia. In Association of National Advertisers Media Workshop, NewYork, 1977.
[5] Y. Altshuler, N. Aharony, M. Fire, Y. Elovici, and A Pentland.Incremental learning with accuracy prediction of social and individualproperties from mobile-phone data. CoRR, 2011.
[6] Y. Altshuler, N. Aharony, A. Pentland, Y. Elovici, and M. Cebrian.Stealing reality: When criminals become data scientists (or vice versa).Intelligent Systems, IEEE, 26(6):22–30, nov.-dec. 2011.
[7] Y. Altshuler, M. Fire, N. Aharony, Y. Elovici, and A Pentland. Howmany makes a crowd? on the correlation between groups’ size andthe accuracy of modeling. In International Conference on SocialComputing, Behavioral-Cultural Modeling and Prediction, pages 43–52. Springer, 2012.
[8] Y. Altshuler, I.A. Wagner, and A.M. Bruckstein. Shape factor‘s effecton a dynamic cleaners swarm. In Third International Conference onInformatics in Control, Automation and Robotics (ICINCO), the Sec-ond International Workshop on Multi-Agent Robotic Systems (MARS),pages 13–21, 2006.
[9] Y. Altshuler, I.A. Wagner, and A.M. Bruckstein. On swarm optimalityin dynamic and symmetric environments. volume 7, page 11, 2008.
[10] Y. Altshuler, V. Yanovski, I.A. Wagner, and A.M. Bruckstein. The

13
cooperative hunters - efficient cooperative search for smart targetsusing uav swarms. In Second International Conference on Informaticsin Control, Automation and Robotics (ICINCO), the First InternationalWorkshop on Multi-Agent Robotic Systems (MARS), pages 165–170,2005.
[11] Y. Altshuler, V. Yanovsky, A.M. Bruckstein, and I.A. Wagner. Efficientcooperative search of smart targets using uav swarms. ROBOTICA,26:551–557, 2008.
[12] Y. Altshuler, V. Yanovsky, I. Wagner, and A. Bruckstein. Swarmintelligencesearchers, cleaners and hunters. Swarm Intelligent Systems,pages 93–132, 2006.
[13] Yaniv Altshuler and Alfred M. Bruckstein. Static and expanding gridcoverage with ant robots: Complexity results. Theoretical ComputerScience, 412(35):4661–4674, 2011.
[14] Yaniv Altshuler and Alfred M Bruckstein. Static and expanding gridcoverage with ant robots: Complexity results. Theoretical ComputerScience, 412(35):4661–4674, 2011.
[15] Yaniv Altshuler, Michael Fire, Nadav Aharony, Zeev Volkovich, YuvalElovici, and Alex Sandy Pentland. Trade-offs in social and behavioralmodeling in mobile networks. In Social Computing, Behavioral-Cultural Modeling and Prediction, pages 412–423. Springer, 2013.
[16] Yaniv Altshuler, Israel A Wagner, and Alfred M Bruckstein. On swarmoptimality in dynamic and symmetric environments. economics, 7:11,2008.
[17] J. M. Anthonisse. The rush in a directed graph. Technical Report BN9/71, Stichting Mathematisch Centrum, Amsterdam, 1971.
[18] E. Bakshy, J.M. Hofman, W.A. Mason, and D.J. Watts. Everyone’san influencer: quantifying influence on twitter. In Proceedings of thefourth ACM international conference on Web search and data mining,pages 65–74. ACM, 2011.
[19] Albert-Laszlo Barabasi and R. Albert. Emergence of scaling in randomnetworks. Science, 286(5439):509–512, 1999.
[20] M. Barthelemy. Betweenness centrality in large complex networks.The European Physical Journal B – Condensed Matter, 38(2):163–168, March 2004.
[21] Frank M Bass, Norris Bruce, Sumit Majumdar, and BPS Murthi.Wearout effects of different advertising themes: A dynamic bayesianmodel of the advertising-sales relationship. Marketing Science,26(2):179–195, 2007.
[22] Frank M Bass, Anand Krishnamoorthy, Ashutosh Prasad, and Suresh PSethi. Generic and brand advertising strategies in a dynamic duopoly.Marketing Science, 24(4):556–568, 2005.
[23] Shlomo Bekhor, Yehoshua Cohen, and Charles Solomon. Evaluatinglong-distance travel patterns in israel by tracking cellular phonepositions. Journal of Advanced Transportation, pages n/a–n/a, 2011.
[24] Cesar Beltran-Royo, H Zhang, LA Blanco, and J Almagro. Multistagemultiproduct advertising budgeting. European Journal of OperationalResearch, 2012.
[25] Confessore G. Gentili M. Bianco, L. Combinatorial aspects of thesensor location problem. Annals of Operation Research, 144(1):201–234, 2006.
[26] Lucio Bianco, Giuseppe Confessore, and Monica Gentili. Combina-torial aspects of the sensor location problem. Annals of OperationsResearch, 144(1):201–234, 2006.
[27] P. Bork, L. J. Jensen, C. von Mering, A. K. Ramani, I. Lee, and E. M.Marcotte. Protein interaction networks from yeast to human. Curr.Opin. Struct. Biol., 14(3):292–299, 2004.
[28] U. Brandes. On variants of shortest-path betweenness centrality andtheir generic computation. Social Networks, 30(2):136–145, 2008.
[29] Simon Broadbent. Point of view-what is a small advertising elasticity.Journal of Advertising Research, 29(4):37–39, 1989.
[30] Z. Butler, A. Rizzi, and R. Hollis. Distributed coverage of rectilinearenvironments. In Proceedings of the Workshop on the AlgorithmicFoundations of Robotics, 2001.
[31] Zack J Butler. Distributed coverage of rectilinear environments. PhDthesis, Carnegie Mellon University, 2000.
[32] D. Centola. The spread of behavior in an online social networkexperiment. science, 329(5996):1194, 2010.
[33] D. Centola and M. Macy. Complex contagions and the weakness oflong ties. American Journal of Sociology, 113(3):702, 2007.
[34] N. Cesa-Bianchi and G. Lugosi. Potential-based algorithms in on-lineprediction and game theory. Machine Learning, 51:239–261, 2003.
[35] M. Cha, H. Haddadi, F. Benevenuto, and K.P. Gummadi. Measuringuser influence in twitter: The million follower fallacy. In 4th Inter-national AAAI Conference on Weblogs and Social Media (ICWSM),2010.
[36] H. Choi, S.H. Kim, and J. Lee. Role of network structure and networkeffects in diffusion of innovations. Industrial Marketing Management,39(1):170–177, 2010.
[37] Aaron Clauset, Cosma Rohilla Shalizi, and Mark EJ Newman. Power-law distributions in empirical data. SIAM review, 51(4):661–703, 2009.
[38] M. C. Cohen and P. Harsha. Designing price incentives in a networkwith social interactions. Submitted, 2013.
[39] C Samuel Craig and Avijit Ghosh. Using household-level viewing datato maximize effective reach. Journal of Advertising Research, 1993.
[40] Peter J Danaher and Roland T Rust. Determining the optimal level ofmedia spending. Journal of Advertising Research, 34(1):28–34, 1994.
[41] Peter J Danaher and Roland T Rust. Determining the optimal returnon investment for an advertising campaign. European Journal ofOperational Research, 95(3):511–521, 1996.
[42] PJ Danaher. Parameter estimation and applications for a generalisationof the beta-binomial distribution. Australian Journal of Statistics,30(3):263–275, 1988.
[43] Kenneth R Deal. Optimizing advertising expenditures in a dynamicduopoly. Operations Research, 27(4):682–692, 1979.
[44] Norman K Dhalla. Assessing the long term value of advertising.Harvard Business Review, 56(1):87–95, 1978.
[45] P.S. Dodds, R. Muhamad, and D.J. Watts. An experimental study ofsearch in global social networks. Science, 301(5634):827, 2003.
[46] P.S. Dodds and D.J. Watts. Universal behavior in a generalized modelof contagion. Physical Review Letters, 92(21):218701, 2004.
[47] S. Dolev, Y. Elovici, R. Puzis, and P. Zilberman. Incremental deploy-ment of network monitors based on group betweenness centrality. Inf.Proc. Letters, 109:1172–1176, 2009.
[48] Peter Doyle and John Saunders. Multiproduct advertising budgeting.Marketing Science, 9(2):97–113, 1990.
[49] Peter F Drucker. The new productivity challenge. Quality in HigherEducation, 37, 1995.
[50] N. Eagle, A. Pentland, and D. Lazer. Inferring social network structureusing mobile phone data. Proceedings of the National Academy ofSciences (PNAS), 106:15274–15278, 2009.
[51] Nathan Eagle, Michael Macy, and Rob Claxton. Network diversityand economic development. Science, 328(5981):1029–1031, 2010.
[52] Joseph O Eastlack and Ambar G Rao. Modeling response to adver-tising and pricing changes for v-8 cocktail vegetable juice. MarketingScience, 5(3):245–259, 1986.
[53] G.M. Erickson, P.J. Currie, B.D. Inouye, and A.A. Winn. Tyrannosaurlife tables: An example of nonavian dinosaur population biology.Science, 313(5784):213–217, 2006.
[54] M. G. Everett and S. P. Borgatti. The centrality of groups and classes.Mathematical Sociology, 23(3):181–201, 1999.
[55] M. Faloutsos, P. Faloutsos, and C. Faloutsos. On power-law rela-tionships of the internet topology. SIGCOMM Comput. Comm. Rev.,29(4):251–262, 1999.
[56] McKinsey Chief Marketing & Sales Officer Forum. Big Data,Analytics, and the Future of Marketing & Sales. 2013.

14
[57] L. C. Freeman. A set of measures of centrality based on betweenness.Sociometry, 40(1):35–41, 1977.
[58] D. Friedman, A. Steed, and M. Slater. Spatial social behavior in secondlife. In Proc. Intelligent Virtual Agents LNAI 4722, pages 252–263,2007.
[59] James W Friedman. Advertising and oligopolistic equilibrium. TheBell Journal of Economics, pages 464–473, 1983.
[60] Benjamin Gompertz. On the nature of the function expressive of thelaw of human mortality, and on a new mode of determining the valueof life contingencies. Philosophical Transactions of the Royal Societyof London, 115:513–583, 1825.
[61] Marta C. Gonzalez, Cesar A. Hidalgo, and Albert-Laszlo Barabasi.Understanding individual human mobility patterns. Nature,453(7196):779–782, 06 2008.
[62] Dominique M Hanssens, Leonard J Parsons, and Randall L Schultz.Market response models: Econometric and time series analysis, vol-ume 12. Springer, 2003.
[63] C.P. Herrero. Ising model in scale-free networks: A monte carlosimulation. Physical Review E, 69(6):067109, 2004.
[64] P. Holme. Congestion and centrality in traffic flow on complexnetworks. Advances in Complex Systems, 6(2):163–176, 2003.
[65] C.L. Hsu and H.P. Lu. Why do people play on-line games? an extendedtam with social influences and flow experience. Information andManagement, 41:853–868, 2004.
[66] C.L. Hsu and H.P. Lu. Consumer behavior in online game communi-ties: A motivational factor perspective. Computers in Human Behavior,23:1642–1659, 2007.
[67] B.A. Huberman, D.M. Romero, and F. Wu. Social networks thatmatter: Twitter under the microscope. First Monday, 14(1):8, 2009.
[68] John Philip Jones. How Much is Enough?: Getting the Most from YourAdvertising Dollar. Lexington Books, 1992.
[69] Robert S Kaplan and Allan D Shocker. Discount effects on mediaplans. Journal of Advertising Research, 11(3):37–43, 1971.
[70] D. Kempe, J. Kleinberg, and E. Tardos. Maximizing the spread ofinfluence through a social network. In Proceedings of the ninth ACMSIGKDD international conference on Knowledge discovery and datamining, pages 137–146. ACM, 2003.
[71] R. E. Korf and W. Zhang. Performance of linear-space searchalgorithms. Artificial Intelligence, 79(2):241–292, 1995.
[72] H. Kwak, C. Lee, H. Park, and S. Moon. What is twitter, a socialnetwork or a news media? In Proceedings of the 19th internationalconference on World wide web, pages 591–600. ACM, 2010.
[73] Luca Lambertini. Advertising in a dynamic spatial monopoly. Euro-pean journal of operational research, 166(2):547–556, 2005.
[74] Renaud Lambiotte, Vincent D. Blondel, Cristobald de Kerchove,Etienne Huens, Christophe Prieur, Zbigniew Smoreda, and Paul VanDooren. Geographical dispersal of mobile communication networks.Physica A: Statistical Mechanics and its Applications, 387(21):5317– 5325, 2008.
[75] David Lazer, Alex Pentland, Lada Adamic, Sinan Aral, Albert-LaszloBarabasi, Devon Brewer, Nicholas Christakis, Noshir Contractor,James Fowler, Myron Gutmann, Tony Jebara, Gary King, MichaelMacy, Deb Roy, and Marshall Van Alstyne. Social science: Compu-tational social science. Science, 323(5915):721–723, 2009.
[76] John D Leckenby and Shizue Kishi. How media directors viewreach/frequency estimation. Director, 9:9–9, 1994.
[77] J. Leskovec, L. Backstrom, and J. Kleinberg. Meme-tracking andthe dynamics of the news cycle. In Proceedings of the 15th ACMSIGKDD international conference on Knowledge discovery and datamining, pages 497–506. Citeseer, 2009.
[78] Jure Leskovec, Lada A. Adamic, and Bernardo A. Huberman. Thedynamics of viral marketing. ACM Trans. Web, 1, May 2007.
[79] Ouyang Y. Li, X. Reliable sensor deployment for network trafficsurveillance. Transportation Research Part B, 45:218–231, 2011.
[80] Xiaopeng Li and Yanfeng Ouyang. Reliable sensor deploymentfor network traffic surveillance. Transportation research part B:methodological, 45(1):218–231, 2011.
[81] John DC Little. Aggregate advertising models: The state of the art.Operations Research, 27(4):629–667, 1979.
[82] John DC Little. Models and managers: The concept of a decisioncalculus. Management science, 50(12 supplement):1841–1853, 2004.
[83] John DC Little and Leonard M Lodish. A media planning calculus.Operations Research, 17(1):1–35, 1969.
[84] Hani I Mesak. On the generalizability of advertising pulsationmonopoly results to an oligopoly. European Journal of OperationalResearch, 117(3):429–449, 1999.
[85] George E Monahan. Optimal advertising with stochastic demand.Management Science, 29(1):106–117, 1983.
[86] Michael J Naples. Effective frequency: the relationship betweenfrequency and advertising effectiveness. Association of NationalAdvertisers New York, 1979.
[87] Marc Nerlove and Kenneth J Arrow. Optimal advertising policy underdynamic conditions. Economica, pages 129–142, 1962.
[88] M.E.J. Newman. The structure and function of complex networks.SIAM Review, 45:167–256, 2003.
[89] Dung Nguyen. An analysis of optimal advertising under uncertainty.Management Science, 31(5):622–633, 1985.
[90] V. Nicosia, F. Bagnoli, and V. Latora. Impact of network structure ona model of diffusion and competitive interaction. EPL (EurophysicsLetters), 94:68009, 2011.
[91] Jukka-Pekka Onnela and Felix Reed-Tsochas. Spontaneous emergenceof social influence in online systems. Proc. Natl. Academy of Sciences,107(43), 2010.
[92] J. Orwant. Heterogeneous learning in the doppelganger user modelingsystem. User Modeling and User-Adapted Interaction, 4:107–130,1994.
[93] Wei Pan, Nadav Aharony, and Alex Pentland. Composite socialnetwork for predicting mobile apps installation. In Proceedings ofthe 25th Conference on Artificial Intelligence (AAAI), pages 821 –827, 2011.
[94] G. Pickard, W. Pan, I. Rahwan, M. Cebrian, R. Crane, A. Madan,and A. Pentland. Time-critical social mobilization. Science,334(6055):509–512, 2011.
[95] R. Puzis, M. D. Klippel, Y. Elovici, and S. Dolev. Optimization of nidsplacement for protection of intercommunicating critical infrastructures.In EuroISI, 2007.
[96] Rami Puzis, Yuval Elovici, and Shlomi Dolev. Finding the mostprominent group in complex networks. AI communications, 20(4):287–296, 2007.
[97] Vitorino Ramos, Carlos Fernandes, and Agostinho C Rosa. Societalimplicit memory and his speed on tracking extrema in dynamicenvironments using self-regulatory swarms. Journal of Systems Ar-chitecture, Farooq M. and Menezes R.(Eds.), special issue on NatureInspired Applied Systems, Elsevier, Summer, 2006.
[98] Ambar G Rao and Peter Miller. Advertising–sales Response Functions.New York University, Graduate School of Business Administration,1975.
[99] Ram C Rao. Advertising decisions in oligopoly: An industry equilib-rium analysis. Optimal Control Applications and Methods, 5(4):331–344, 1984.
[100] Petri Rouvinen. Diffusion of digital mobile telephony: Are developingcountries different? Telecommunications Policy, 30(1):46 – 63, 2006.
[101] Roland T Rust. Selecting network television advertising schedules.Journal of Business Research, 13(6):483–494, 1985.
[102] Roland T Rust. Advertising media models: A practical guide. Lex-ington Books Lexington, MA, 1986.
[103] J. Scott. Social Network Analysis: A Handbook. Sage Publications,London, 2000.
15
[104] Suresh P Sethi. Optimal control of the vidale-wolfe advertising model.Operations Research, 21(4):998–1013, 1973.
[105] D. Shah and T. Zaman. Rumors in a network: Who’s the culprit?Arxiv preprint arXiv:0909.4370, 2009.
[106] Srinivasaraghavan Sriram and Manohar U Kalwani. Optimal advertis-ing and promotion budgets in dynamic markets with brand equity asa mediating variable. Management Science, 53(1):46–60, 2007.
[107] R. Stern, R. Puzis, and A. Felner. Potential search: a bounded-costsearch algorithm. In AAAI 21st International Conference on AutomatedPlanning and Scheduling (ICAPS), 2011.
[108] S. H. Strogatz. Exploring complex networks. Nature, 410:268–276,March 2001.
[109] Jim Surmanek. Media planning: a practical guide, volume 49. NTCBusiness Books Chicago, IL, 1996.
[110] Gerard J Tellis. The price elasticity of selective demand: A meta-analysis of econometric models of sales. Journal of MarketingResearch, pages 331–341, 1988.
[111] Gerard J Tellis. Interpreting advertising and price elasticities. Journalof Advertising Research, 29(4):40–43, 1989.
[112] ML Vidale and HB Wolfe. An operations-research study of salesresponse to advertising. Operations Research, 5(3):370–381, 1957.
[113] Yogesh Virkar and Aaron Clauset. Power-law distributions in binnedempirical data. arXiv preprint arXiv:1208.3524, 2012.
[114] S. Wasserman and K. Faust. Social network analysis: Methods andapplications. Cambridge, England: Cambridge University Press., 1994.
[115] D.J. Watts, J. Peretti, and Harvard Business School. Viral marketingfor the real world. 2007.
[116] D.J. Watts and S.H. Strogatz. Collective dynamics of ’small-world’networks. Nature, 393(6684):440–442, 1998.
[117] D. R. White and S. P. Borgatti. Betweenness centrality measures fordirected graphs. Social Networks, 16:335–346, 1994.
[118] Charles Solomon Leonid Kheifits Yehuda J. Gur, Shlomo Bekhor.Intercity person trip tables for nationwide transportation planning inisrael obtained from massive cell phone data. Transportation ResearchRecord: Journal of the Transportation Research Board, 2121:145–151,2009.
[119] S.H. Yook, H. Jeong, and A.-L. Barabasi. Modeling the internet’slarge-scale topology. Proceedings of the National Academy of Science,99(21):13382–13386, Oct. 2002.
[120] Shlomo Zilberstein. Using anytime algorithms in intelligent systems.AI Magazine, 17(3):73–83, 1996.
Yaniv Altshuler is the CTO and Chief Scientistof Athena Wisdom, and a researcher at MIT(Media Lab). He received his BA (with high-est honors) in Computer Science at the IsraeliInstitute of Technology, and his MSc and PhD(with honors) in Computer Science at the IsraeliInstitute of Technology. Altshuler spent 3 yearsas a post-doc at MIT at the Human Dynamicsgroup, headed by Prof. Alex Sandy Pentland.Yaniv specializes in big data, social physics, andnetwork analysis. Altshuler has published over
60 academic papers and filed 15 patent applications.
Erez Shmueli is a senior lecturer at the depart-ment of Industrial Engineering at Tel-Aviv Uni-versity and a research affiliate at the MIT MediaLab. He received his BA degree (with highesthonors) in Computer Science from the OpenUniversity of Israel, and MSc and PhD degreesin Information Systems Engineering from Ben-Gurion University of the Negev, Israel, under thesupervision of Prof. Yuval Elovici. After complet-ing his PhD, Erez spent two years as a post-doctoral associate at the MIT Media Lab, at the
Human Dynamics group headed by Prof. Alex Sandy Pentland. His mainresearch interests include Big Data, Complex Networks, ComputationalSocial Science and Information Security and Privacy. His professionalexperience includes five years as a programmer and a team leader inthe Israeli Air-Force and three years as a project manager in DeutscheTelekom Laboratories at Ben-Gurion University of the Negev.
Guy Zyskind is a graduate student in the Hu-man Dynamics group at the MIT Media Lab. Heholds a B.Sc degree in Electrical Engineeringand Computer Science from Tel Aviv Universityand is currently pursuing a M.S degree underthe supervision of Prof. Alex ”Sandy” Pentland.Before joining the Media Lab, Guy has led thedevelopment of several start-ups in the Big Dataand consumer spaces. His research interestsintersect the study of Social Networks and BigData, Privacy and Distributed Systems.
Oren Lederman is a graduate student at the MITMedia Lab, Human Dynamics group. He holdsa B.Sc. in Computer Science and Economicsfrom Tel Aviv University, Israel. His professionalexperience includes five years as developer andteam leader in the Israeli army, founding a mobilesocial network startup, four years as data infras-tructures team leader in an influencers-basedmarketing startup, and a research engineer posi-tion at the Singapore-MIT Alliance for Researchand Technology. His research interests include
big data and personal data, group dynamics and studying innovationteams.

16
Nuria Oliver (PhD, MIT 2000) is currently theScientific Director and founder of the User, Dataand Media Intelligence research areas in Tele-fonica Research, working on data analytics, ma-chine learning, user modeling and HCI in a vari-ety of domains. Prior to this position, she was aresearcher at Microsoft Research in Redmond,WA for over 7 years. She has written over 90scientific papers in international conferences,journals and book chapters. Her work has beenwidely recognized by the scientific community
with over 7700 citations. Nuria has over 40 patent applications andgranted patents. She is in the organizing and/or program committee ofthe top conferences in her research areas.
She believes in the power of technology to empower and increase thequality of life of people. She has received a number of awards, includinga 10 Year Technical Impact Award (ACM ICMI), a Rising Start Award bythe Women’s Forum for the Economy and Society (2009), MITs TR100Young Innovators Award (2004) and the First Spanish Award of EECSgraduates (1994). She is senior member of the ACM.
Her work has been widely featured on multiple newspapers, maga-zines, radio and TV stations both in Spain and the US. She has beenfeatured in EL PAIS Sunday magazine as one of a few ’female directorsin technology’ (2012), named Rising Talent by the Women’s Forum forEconomy & Society (October 2009), one of the ’most influential youngwomen in Spain’ (MujerHoy Magazine, 2012), one of ’100 leaders of thefuture ’ by Capital Magazine (May 2009) and one of the ’Generation XXI:40 Spanish youngsters that will make news in the Third Millenium ’ byEL PAIS (2000).
She has given two TEDx talks and one WIRED talk. She is also co-organizing the first TEDxBarcelona event devoted to Education.
Alex ’Sandy’ Pentland directs MITs HumanDynamics Laboratory and the MIT Media LabEntrepreneurship Program, co-leads the WorldEconomic Forum Big Data and Personal Datainitiatives, and is a Board member for Nissan,Motorola Mobility, Telefonica, and Harvard Busi-ness Review. He has previously helped createand direct MITs Media Laboratory, the Media LabAsia laboratories at the Indian Institutes of Tech-nology, and Strong Hospitals Center for FutureHealth. In 2012 Forbes named Sandy one of the
’seven most powerful data scientists in the world’, along with Googlefounders and the CTO of the United States, and in 2013 he won theMcKinsey Award from Harvard Business Review. He is among the most-cited computational scientists in the world, and a pioneer in computa-tional social science, organizational engineering, wearable computing(Google Glass), image understanding, and modern biometrics. His mostrecent book is ‘Social Physics,’ published by Penguin Press.