caGEDA
-
Upload
ipaknowledge -
Category
Documents
-
view
4 -
download
0
Transcript of caGEDA
Applied Bioinformatics 2004:3(1) 49–62© 2004 Open Mind Journals Limited. All rights reserved.
49
A P P L I C AT I O N N O T E
caGEDA: a web application for the integratedanalysis of global gene expression patterns incancerSatish Patel1 and James Lyons-Weiler1–7
1University of Pittsburgh Cancer Institute, 2Department of Pathology, 3Cancer Biomarkers Laboratory, 4Center for
Pathology Informatics, 5Benedum Center for Oncology Informatics, 6Center for Biomedical Informatics, 7Interdisciplinary
Biomedical Graduate Program; University of Pittsburgh Medical School, Pittsburgh, PA, USA
Abstract: The explosion of microarray data from pilot studies, basic research and large-scale clinical trials requires the development of
integrative computational tools that can not only analyse gene expression patterns but that can also evaluate the methods of analysis
adopted and then provide a boost to post-analysis translational interpretation of those patterns. We have developed a web application
called caGEDA (cancer gene expression data analyzer) that can: (1) upload gene expression profiles from cDNA or oligonucleotide
microarrays; (2) conduct a diverse range of serial linear normalisations; (3) identify differentially expressed genes using a variety of tests
– either threshold or permutation tests; (4) produce tables of literature references to papers reporting that specific genes (identified by
accession numbers) are up- or down-regulated in specific cancers; (5) estimate the error of sample class prediction using the significant
gene set for features; (6) perform low-bias and accurate validated learning using three computational validation techniques (leave-one-
out validation, k-fold validation, random resampling validation); and (7) validate a classifier with a randomly selected or user-defined
validation set. Significant genes are reported in a table of links to entries in the following databases: LocusLink, Genome View, UCSC,
Ensembl, UniGene, dbSNP, AmiGO and OMIM. caGEDA is seamlessly integrated via embedded forms with UCSD’s (University of
California at San Diego) 2HAPI server (for medical subject heading (MeSH) term exploration) and EZ-Retrieve (to identify common
transcription factors located upstream of sets of genes that exhibit similar modes of differential expression). caGEDA offers a variety of
previously described and novel tests for differentially expressed genes, most notably the permutation percentile separability test, which
is most appropriate for identifying genes that are significantly differentially expressed in a subset of patients. caGEDA, which is open
source and free to academic users, will soon be greatly enhanced by operating with the components of the National Cancer Institute’s new
cancer bioinformatics grid (caBIG).
Keywords: microarray analysis, cancer, genomics
Availability: http://bioinformatics.upmc.edu/GE2/GEDA.html
Contact: James Lyons-Weiler ([email protected])
Correspondence: James Lyons-Weiler, UPCI, Benedum OncologyInformatics Center, 304 Cancer Pavilion, 5150 Centre Avenue, Pittsburgh,PA 15232, USA; tel +14126237866; fax +14126475380; [email protected]
IntroductionMicroarray technologies permit the simultaneous monitoring
of gene expression values for tens of thousands of genes in
one experiment (Schena et al 1995; Lockhart et al 1996;
DeRisi et al 1997). These extremely powerful technologies
have revolutionised functional genomics by allowing cross-
tissue comparisons of expression profiles. Methods for the
analysis of global patterns of gene expression from
microarray studies are typically used to address two important
aims: (1) to identify genes that are differentially expressed
between cell populations (tissue types, or diseased and
normal tissue sample groups); and (2) to determine whether,
and how, the set of differentially expressed genes can be
used either to erect a classification of sample groups (class
discovery) or to predict class membership of new unknown
samples. Microarrays are now being used to study expression
patterns in a wide variety of diseases including, and most
notably, cancer, but also: diabetes (Susztak et al 2003);
arthritis (Urbanowska et al 2003); pancreatitis (Ji et al 2003);
neurological degenerative diseases, including Alzheimer’s
disease (Loring et al 2001; Pasinetti 2001), Parkinson’s
disease (Mandel et al 2003) and Amyotrophic Lateral
Scelorosis (ALS; Lou Gehrig’s disease) (Dangood et al 2004);
heart disease (Ueno et al 2003); and a variety of other diseases
(Hawse et al 2003; Hayden et al 2003; Minning et al 2003).
A multitude of comparisons are being made in the study of
COMPLIMENTARY COPY, PLEASE CIRCULATESubscribe via www.openmindjournals.com/2004_subs.pdfUse discount code 9FEM87 and get a 33% discount off the normal price
Patel and Lyons-Weiler
Applied Bioinformatics 2004:3(1)50
cancer, including normal with tumour, metastatic withquiescent (Chakrabarti et al 2002; Seftor et al 2002; van’tVeer et al 2002; Chopra et al 2003; Cooper et al 2003;DePrimo et al 2003; Kikuchi et al 2003; Nagata et al 2003;Ramaswamy et al 2003; Takahashi et al 2003), organ-confinedwith aggressive tumours (Luo et al 2002), drug responderswith nonresponders (Lyons-Weiler et al 2003; Ohno andNakamura 2003) and survivors with nonsurvivors (Miura etal 2002). (See also references listed in Lyons-Weiler et al 2004.)
In the field of cancer research, the set of differentiallyexpressed genes represents a potential goldmine of markersfor molecular medicine. Specifically, studies havedemonstrated the vast potential of differentially expressedgenes as biomarkers for molecular diagnosis (DeRisi et al1996; Welford et al 1998), including stage and grade (Nocitoet al 2001; Rickman et al 2001; Allander et al 2002; Inoue etal 2002; Sasaki 2002; Luo et al 2004), prognosis (Beer et al2002; Inoue et al 2002), therapy outcome prediction (Kiharaet al 2002; Okutsu et al 2002; Lyons-Weiler et al 2003),malignancy and metastasis (Li et al 2001; Shih 2001; Gildeaet al 2002; Ramaswamy et al 2003) and tumouraggressiveness (Chan and Huang 2001). With the ability todetect drug-resistant tumours using a drug response indexthat summarises signature profiles (positive and negative),physicians will be able to prescribe drugs that are less likelyto fail and thus generate more individualised prescriptionsthat have higher positive response rates. Eventual uses of thisinformation will extend beyond profiling. Targetedtherapeutics under development include antisense oligo-nucleotides designed to suppress the expression of genes, withthe aim of altering drug responsiveness. These may alsosomeday be used as a direct therapy by inducing cell cyclearrest, apoptosis and suppression of anchorage-dependent cellgrowth. A number of recent studies highlight this potential.Okutsu et al (2002) identified 28 genes whose presenceappears to correlate well with chemosensitivity of AMLpatients. Chang et al (2003) report genes whose presenceappears to predict the response of breast cancer patients todocetaxel. Kihara et al (2001) have identified 52 genes whosepresence appears to predict the response of oesophagealtumours to adjuvant chemotherapy. Dan et al (2002) reportsome success in finding genes that may be predictive of aresponse to a variety of drugs in 39 cancer cell lines.
Because drug responses can be expected to involve veryspecific metabolic and transfer pathways, success in thepreliminary identification and subsequent validation ofpredictive gene sets is key to the success of basic andtranslational research in this area, and is required beforeindividualised therapy can take place and become the
normative approach to the treatment of cancer. One ultimategoal of such research is the development of highlyindividualised treatments by predicting which of an array ofpossible treatment options is optimal for a specific patient(Eyster and Lindahl 2001; Kallioniemi 2001; Miyachi 2002).For some treatments, this may include molecular predictionof drug toxicity (Cunningham et al 2000; Kaminski et al2000; Vrana et al 2003) and then optimising the dosage.Microarrays are also being considered for use in matchingdonors for organ transplantation (Chua and Sarwal 2003).
Microarray data from medical research projects includedata from pilot studies, basic research (in vitro and modelanimal), pre-clinical studies and large-scale clinical trials.Each new study reporting results from microarrayexperiments is accompanied by new methods of analysis.These creative efforts have led to a wealth of methods but adearth of comprehension on the comparative performanceof these methods. Researchers should employ methods ofanalysis that do the least harm to, and that can most accuratelysummarise and represent, the clinically significantinformation in the data. A series of decisions is required inan ‘analysis decision tree’. Selection of an option at eachnode of the tree always involves a trade-off between lossand gain of information, and most studies are conducted withlittle idea of the knowledge required to optimise the gain/loss ratio for the complex series of decisions along any pathin the tree. Ways of optimising the gain/loss ratio includemethods for normalisation that lead to the least loss of signalwhen normalisation is applied where it is not required, andthat also lead to the recovery of the greatest amount ofinformation that would have been lost due to the intrusionof nuisance factors that arise despite careful study design.Tests for identifying differentially expressed genes shouldbe as powerful (sensitive) and yet as specific as possible.Classification approaches should be capable of accuratelyrepresenting patterns that reflect true relationships amongsamples and genes, and the entire process should be asimmune as possible to the hazards of overtraining. Thesoftware should provide feedback to the user on data qualityand the fundamentals of experimental design.
Such high standards are goals shared by all involved inthe development and deployment of methods for the analysisof microarray data. The ability to traverse the analysisdecision tree first requires building the tree (ie assemblingthe many methods of pre-interpretive analysis) for findingdifferentially expressed genes, for performing classificationoperations and for evaluating the application of any suchpath with computational validation (statistical machine
learning). Ideally, one would also be able to explore these
caGEDA
Applied Bioinformatics 2004:3(1) 51
analysis options with additional datasets, some of which arelike and others unlike the specific dataset at hand. Given aset of results from such analysis, additional functional andtranslational interpretation (such as gene ontology andtranscription factor analysis) should be facilitated by aseamless integration of the results of the analysis (ie the listof differentially expressed genes) with existing genomicdatabases. Researchers should be able to relate their newdiscoveries to existing knowledge on gene and proteindysregulation with a minimum of effort. Finally, the softwareitself should be designed with best practices, and it shouldbe sufficiently modular, extensible and open source to notrestrict the researcher to one paradigm of analysis.
There is a growing demand for easy-to-use tools for theanalysis and interpretation of global patterns of geneexpression from microarray experiments. While commercialplatforms are available, most are specifically designed fordata from one platform. Most of the software for arrayanalysis available from academia requires updates viadownloads from the Web, which often both limits the numberof platforms on which the software can run and requires theuse of plug-ins or additional software downloads. In contrast,server-based application designs, using servlets andJavaServer Pages™ (JSP), allow users to upload their datasecurely to a server bank where the options for analysis areselected through the graphical interface in the users’browsers. Server-side analysis allows users to performmultiple tasks on the same computer that they are using forbrowsing without burdening their local CPU for analysis orfor 0-second ‘instant upgrades’ every time they load theGEDA.html file into their browsers. Moreover, server-sideapplications can be easily mirrored at a large number of sites,which can then (in principle) become a coordinated grid,ensuring sufficient CPU resources for complex analyses. Thisis part of the strategy in the development of the new caBIG(cancer bioinformatics grid) initiative of the National CancerInstitute (NCI) (http://cabig.nci.nih.gov).
There were therefore sufficient reasons for buildingcaGEDA, the first such application developed specificallyto facilitate the evaluation of a researcher’s decisionprocesses by integrating a diversity of options at each nodein the analysis decision tree in a systematic manner that is
wrapped in a computational validation framework.
Materials and methodsSoftware design and programmingcaGEDA is written using the Java language. Java is aplatform-independent language, so the caGEDA software canrun on virtually any operating system for which the Java
runtime environment is available. caGEDA is a web-based
application with the standard HTML 4.0 and JavaScript™
interface, which is compatible with most modern Internet
browsers. caGEDA was developed using the Java Servlet
2.3 and JSP 1.1 technology. We followed the MVC (model-
view-controller) design strategy of pattern development. As
part of the development, we used Java SDK 1.4 with Apache
Tomcat 4.0.6 as an application server for testing purposes.
caGEDA requires an ACME image library (ACME 2001) to
create the GIF images, and O’Reilly’s MIME parsing library
(O’Reilly 2002) to handle file operations. All the tools,
libraries and supporting software used in the development
are either freeware or open source.
The installation of a caGEDA mirror in the new
environment is very simple. We distribute caGEDA as an
installer, which is a self-extracting executable file. This
installer runs only on the Microsoft® Windows® platform.
As a part of the installation procedure, it checks for the
required software on the user’s machine. If required
components are not installed, the installer starts their
installation. Upon successful completion of installation, the
installer creates short cuts in the start menu to access the
caGEDA web application.
Data formatsCurrently, caGEDA accepts data in two formats, caGEDA
format 1 and caGEDA format 2. They are identical with one
difference: format 2 includes the accession number to
facilitate post-analysis translational interpretation.
caGEDA format 1:
Name S1 S2 S3 S4 .................... SN
G1 I11 I12 I13 I14 .................... I1N
G2 I21 I22 I23 I24 .................... I2N
G3 I31 I32 I33 I34 .................... I3N
G4 I41 I42 I43 I44 .................... I4N
. . . . . .................... .
. . . . . .................... .
Gm
Im1 I
m2 I
m3 I
m4 .................... I
mN
caGEDA format 2:
Name ACC_NO S1 S2 S3 S4 .................... SN
G1 ACC-1I11 I12 I13 I14 .................... I1N
G2 ACC-2I21 I22 I23 I24 .................... I2N
G3 ACC-3I31 I32 I33 I34 .................... I3N
G4 ACC-4I41 I42 I43 I44 .................... I4N
. . . . . . .................... .
. . . . . . .................... .
Gm
ACC-mI
m1 I
m2 I
m3 I
m4 .................... I
mN
Patel and Lyons-Weiler
Applied Bioinformatics 2004:3(1)52
In both of these formats, the dataset is a tab-delimited text
file where the first column is the name of the gene (G1, G2
... Gm) for m genes and N samples. In caGEDA format 2, the
second column is the gene accession number, which is used
to generate links to public databases. Subsequent columns
are for individual arrays where S1, S2 ... SN are sample
names.
Forms for specifying the numbers of samples and genes,
the sample name labels and the sample group assignment
labels are found at the bottom of the web page under the
Group Settings heading. Sample names are entered as a list
with sample membership specified by a group number (1, 2,
3…) that is separated from the name by a space or tab.
Missing valuesMissing values are encoded as ‘NA’ or ‘?’ and can be
estimated using k-nearest neighbours. A total of three
neighbours in Euclidean space are used; if one of the
neighbours also has a missing value, the next neighbour is
found.
Public domain datasetsThe cancer datasets in Table 1 are available from the public
domain, and the data are ready for re-analysis with virtually
no reformatting uploading by the user. The sample number
and sample group assignment forms at the bottom of the
caGEDA page autopopulate when these datasets are selected
under the Sample Data File pull-down menu. Each of these
datasets is also an entry in the University of Pittsburgh Cancer
Microarray Dataset Link Database, located online (http://
bioinformatics.upmc.edu/Help/UPITTGED.html). Cancer
microarray researchers are invited to send us their published
datasets to be added to the database. A more permanent
repository is caArray (http://caarray.nci.nih.gov).
Text and tabular outputAll output appears in a new window. Text output summarises
the user-specific information about the data and analysis
settings: sample class label settings; whether transformation
and/or normalisation was used; whether data were tested for
differentially expressed genes; permutation or threshold
settings; distance measure (if used); classification algorithm;
and computational validation method used. A table of
significant genes is generated, with links to their respective
LocusLink, Genome View, UCSC, Ensembl, UniGene,
dbSNP, AmiGO and OMIM entries.
Data quality measuresThe text output also includes a number of simple data quality
measures, including the among-array coefficient of variance
(COV) and a confounding index (CI) for global expression,
the latter of which compares the average within-group
correlation to the average between-group correlation
according to the following equation:
(1)
given sample groups A and B, where r is the correlation
coefficient. The CI should be as close to 1.0 as possible.
Values higher than 1.0 may indicate incidental confounding
in the experimental design.
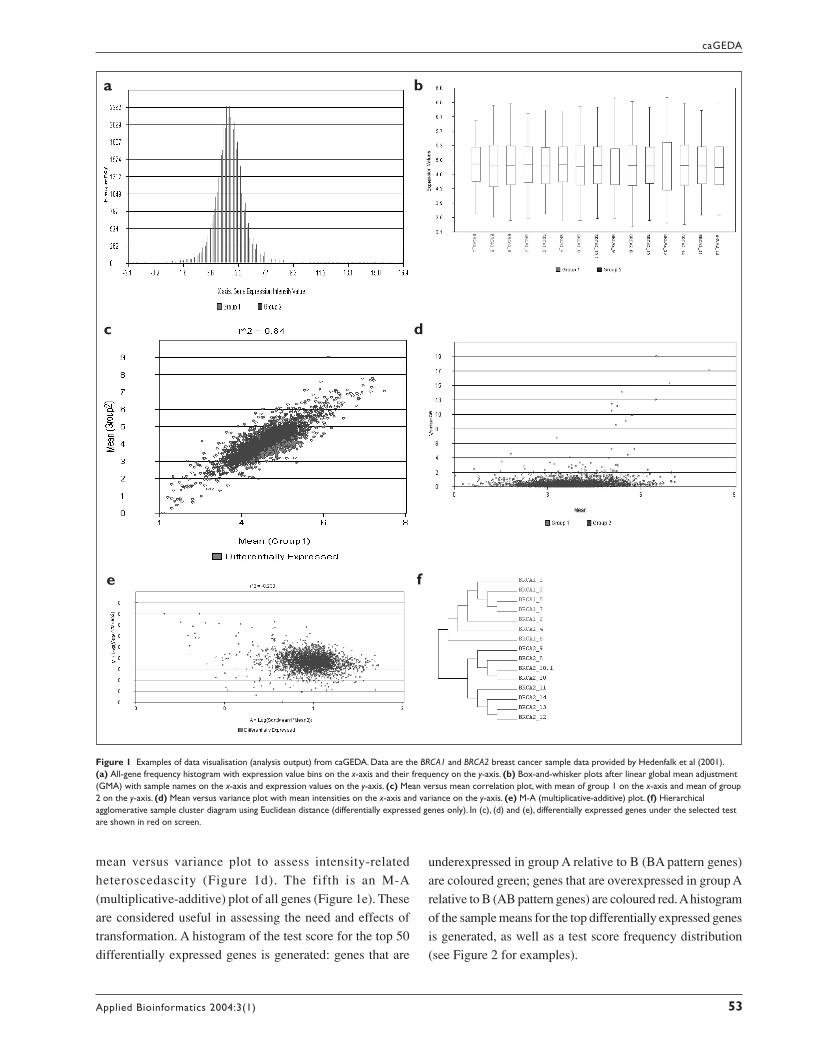
Graphical output and data visualisationcaGEDA generates a number of informative figures that aid
in pre-interpretive and post-interpretive analysis (Figures
1–3). The first is an all-gene, two-group frequency histogram
(Figure 1a). The second is a series of box-and-whisker plots,
one for each sample (Figure 1b). The third is a global
correlation plot of sample means (Figure 1c). The fourth is a
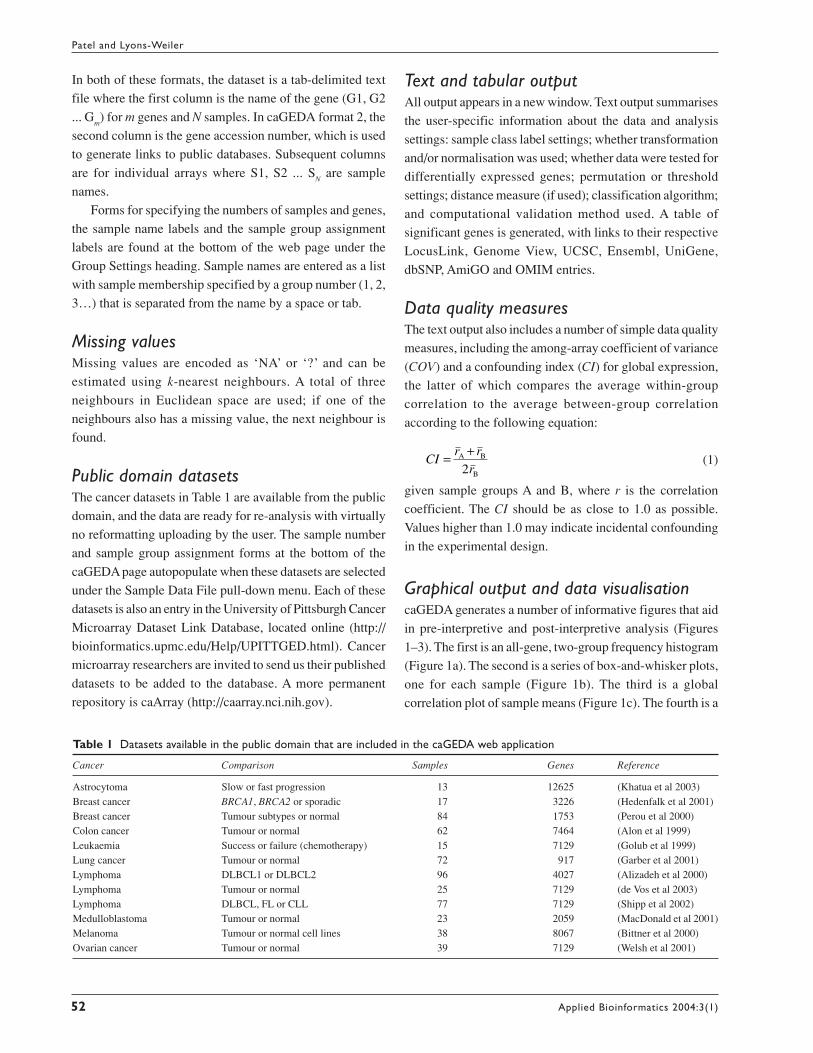
Table 1 Datasets available in the public domain that are included in the caGEDA web application
Cancer Comparison Samples Genes Reference
Astrocytoma Slow or fast progression 13 12625 (Khatua et al 2003)Breast cancer BRCA1, BRCA2 or sporadic 17 3226 (Hedenfalk et al 2001)Breast cancer Tumour subtypes or normal 84 1753 (Perou et al 2000)Colon cancer Tumour or normal 62 7464 (Alon et al 1999)Leukaemia Success or failure (chemotherapy) 15 7129 (Golub et al 1999)Lung cancer Tumour or normal 72 917 (Garber et al 2001)Lymphoma DLBCL1 or DLBCL2 96 4027 (Alizadeh et al 2000)Lymphoma Tumour or normal 25 7129 (de Vos et al 2003)Lymphoma DLBCL, FL or CLL 77 7129 (Shipp et al 2002)Medulloblastoma Tumour or normal 23 2059 (MacDonald et al 2001)Melanoma Tumour or normal cell lines 38 8067 (Bittner et al 2000)Ovarian cancer Tumour or normal 39 7129 (Welsh et al 2001)
CIr r
r= +A B
B2
caGEDA
Applied Bioinformatics 2004:3(1) 53
mean versus variance plot to assess intensity-related
heteroscedascity (Figure 1d). The fifth is an M-A
(multiplicative-additive) plot of all genes (Figure 1e). These
are considered useful in assessing the need and effects of
transformation. A histogram of the test score for the top 50
differentially expressed genes is generated: genes that are
a b
c d
e f
Figure 1 Examples of data visualisation (analysis output) from caGEDA. Data are the BRCA1 and BRCA2 breast cancer sample data provided by Hedenfalk et al (2001).(a) All-gene frequency histogram with expression value bins on the x-axis and their frequency on the y-axis. (b) Box-and-whisker plots after linear global mean adjustment(GMA) with sample names on the x-axis and expression values on the y-axis. (c) Mean versus mean correlation plot, with mean of group 1 on the x-axis and mean of group2 on the y-axis. (d) Mean versus variance plot with mean intensities on the x-axis and variance on the y-axis. (e) M-A (multiplicative-additive) plot. (f) Hierarchicalagglomerative sample cluster diagram using Euclidean distance (differentially expressed genes only). In (c), (d) and (e), differentially expressed genes under the selected testare shown in red on screen.
underexpressed in group A relative to B (BA pattern genes)
are coloured green; genes that are overexpressed in group A
relative to B (AB pattern genes) are coloured red. A histogram
of the sample means for the top differentially expressed genes
is generated, as well as a test score frequency distribution
(see Figure 2 for examples).
Patel and Lyons-Weiler
Applied Bioinformatics 2004:3(1)54
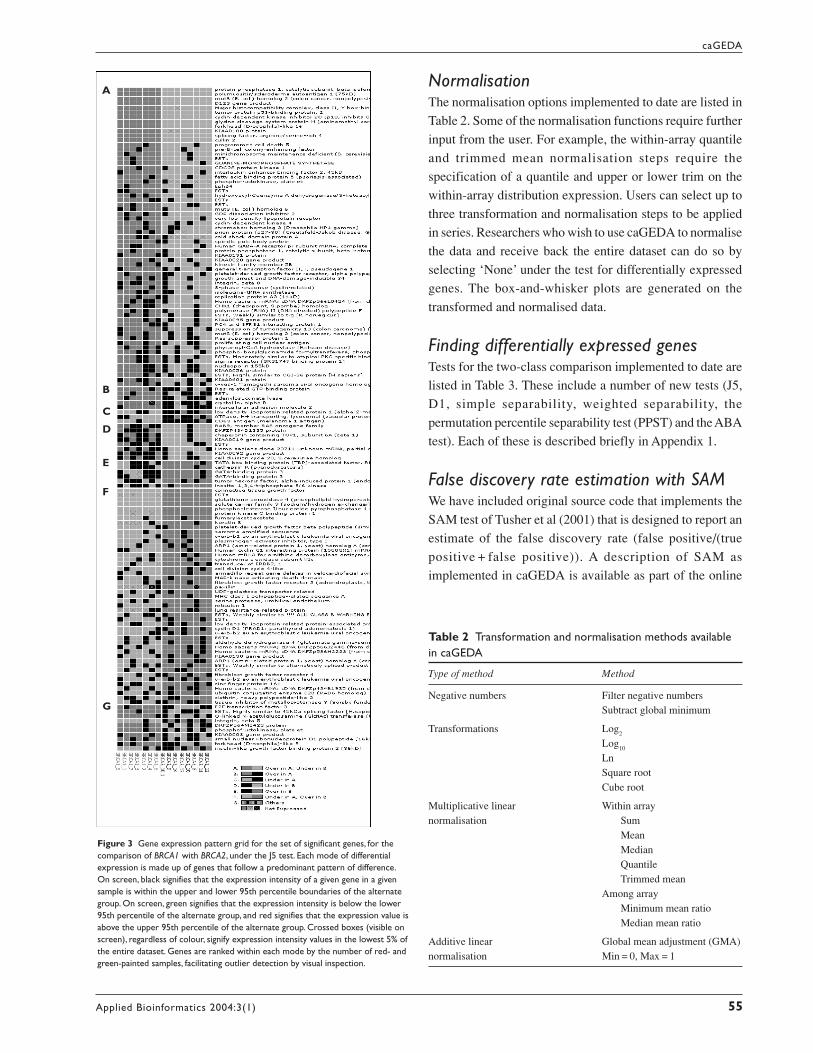
Gene expression pattern gridscaGEDA can generate an expression pattern grid that
organises the differentially expressed genes according to the
‘mode’ of differential expression. The latter is determined
by a count of the number of samples in one group that exhibit
expression intensities in the upper or lower 95th percentile
of the alternate group.
There are six predominant ‘modes’ of differential
expression in the gene expression pattern grid (see Figure
3). The two most commonly considered modes are those in
which most samples in both groups appear to be quite distinct
from the other group; for example (1) genes that are
overexpressed in A compared with B and underexpressed in
B compared with A, and (2) those that are underexpressed
in A compared with B and overexpressed in B compared
with A. In these modes, the sample block (ie individual) is
red if that value is greater than the upper 95th percentile in
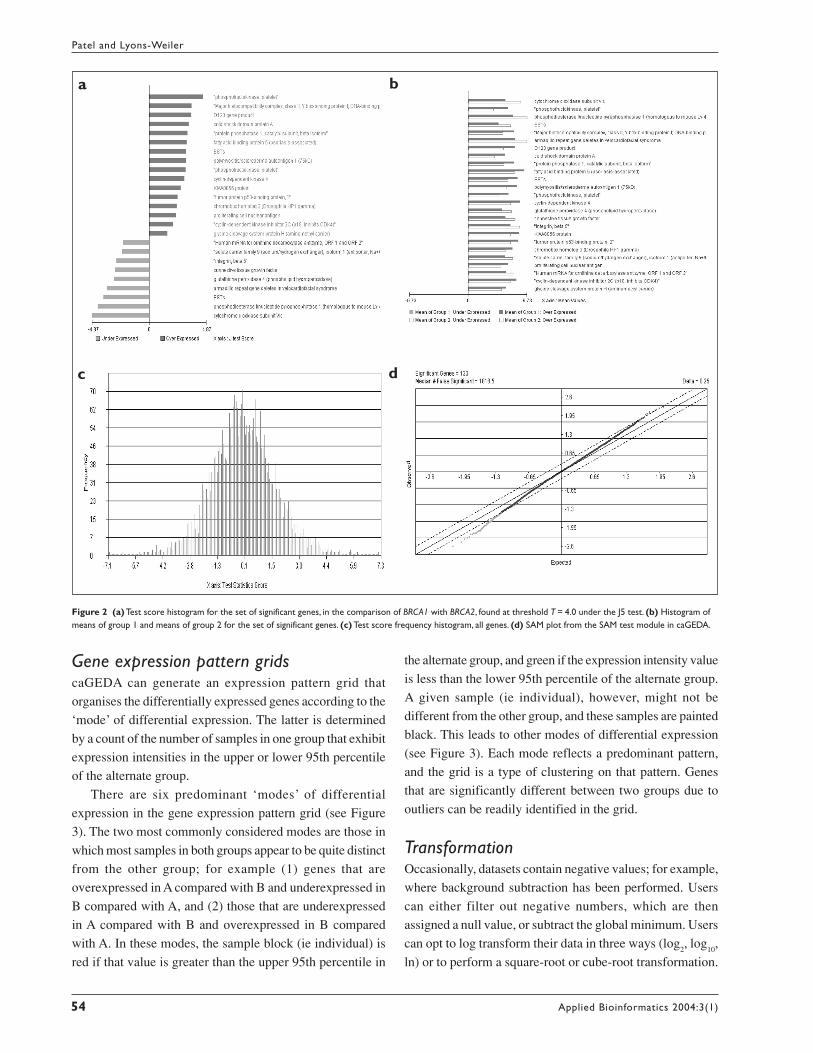
Figure 2 (a) Test score histogram for the set of significant genes, in the comparison of BRCA1 with BRCA2, found at threshold T = 4.0 under the J5 test. (b) Histogram ofmeans of group 1 and means of group 2 for the set of significant genes. (c) Test score frequency histogram, all genes. (d) SAM plot from the SAM test module in caGEDA.
a b
c d
the alternate group, and green if the expression intensity value
is less than the lower 95th percentile of the alternate group.
A given sample (ie individual), however, might not be
different from the other group, and these samples are painted
black. This leads to other modes of differential expression
(see Figure 3). Each mode reflects a predominant pattern,
and the grid is a type of clustering on that pattern. Genes
that are significantly different between two groups due to
outliers can be readily identified in the grid.
TransformationOccasionally, datasets contain negative values; for example,
where background subtraction has been performed. Users
can either filter out negative numbers, which are then
assigned a null value, or subtract the global minimum. Users
can opt to log transform their data in three ways (log2, log
10,
ln) or to perform a square-root or cube-root transformation.
caGEDA
Applied Bioinformatics 2004:3(1) 55
Table 2 Transformation and normalisation methods availablein caGEDA
Type of method Method
Negative numbers Filter negative numbersSubtract global minimum
Transformations Log2
Log10
LnSquare rootCube root
Multiplicative linear Within arraynormalisation Sum
MeanMedianQuantileTrimmed mean
Among arrayMinimum mean ratioMedian mean ratio
Additive linear Global mean adjustment (GMA)normalisation Min = 0, Max = 1
NormalisationThe normalisation options implemented to date are listed in
Table 2. Some of the normalisation functions require further
input from the user. For example, the within-array quantile
and trimmed mean normalisation steps require the
specification of a quantile and upper or lower trim on the
within-array distribution expression. Users can select up to
three transformation and normalisation steps to be applied
in series. Researchers who wish to use caGEDA to normalise
the data and receive back the entire dataset can do so by
selecting ‘None’ under the test for differentially expressed
genes. The box-and-whisker plots are generated on the
transformed and normalised data.
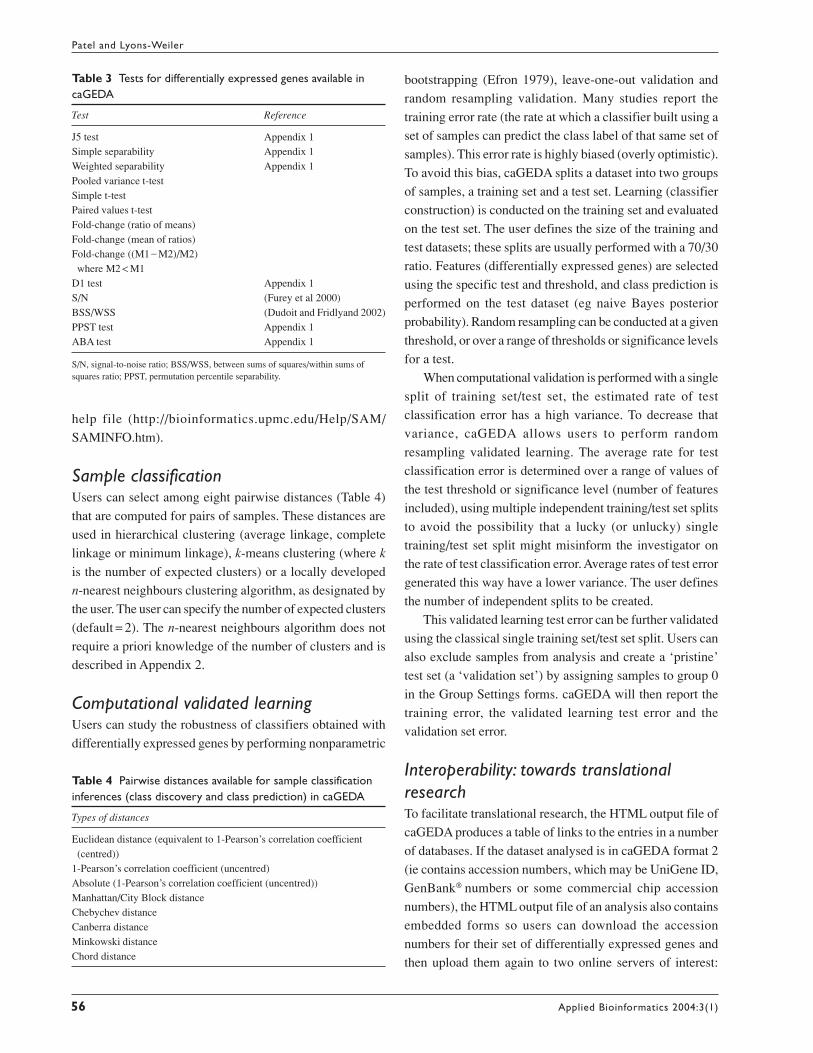
Finding differentially expressed genesTests for the two-class comparison implemented to date are
listed in Table 3. These include a number of new tests (J5,
D1, simple separability, weighted separability, the
permutation percentile separability test (PPST) and the ABA
test). Each of these is described briefly in Appendix 1.
False discovery rate estimation with SAMWe have included original source code that implements the
SAM test of Tusher et al (2001) that is designed to report an
estimate of the false discovery rate (false positive/(true
positive + false positive)). A description of SAM as
implemented in caGEDA is available as part of the online
Figure 3 Gene expression pattern grid for the set of significant genes, for thecomparison of BRCA1 with BRCA2, under the J5 test. Each mode of differentialexpression is made up of genes that follow a predominant pattern of difference.On screen, black signifies that the expression intensity of a given gene in a givensample is within the upper and lower 95th percentile boundaries of the alternategroup. On screen, green signifies that the expression intensity is below the lower95th percentile of the alternate group, and red signifies that the expression value isabove the upper 95th percentile of the alternate group. Crossed boxes (visible onscreen), regardless of colour, signify expression intensity values in the lowest 5% ofthe entire dataset. Genes are ranked within each mode by the number of red- andgreen-painted samples, facilitating outlier detection by visual inspection.
A
B
C
D
E
F
G
Patel and Lyons-Weiler
Applied Bioinformatics 2004:3(1)56
help file (http://bioinformatics.upmc.edu/Help/SAM/
SAMINFO.htm).
Sample classificationUsers can select among eight pairwise distances (Table 4)
that are computed for pairs of samples. These distances are
used in hierarchical clustering (average linkage, complete
linkage or minimum linkage), k-means clustering (where k
is the number of expected clusters) or a locally developed
n-nearest neighbours clustering algorithm, as designated by
the user. The user can specify the number of expected clusters
(default = 2). The n-nearest neighbours algorithm does not
require a priori knowledge of the number of clusters and is
described in Appendix 2.
Computational validated learningUsers can study the robustness of classifiers obtained with
differentially expressed genes by performing nonparametric
bootstrapping (Efron 1979), leave-one-out validation and
random resampling validation. Many studies report the
training error rate (the rate at which a classifier built using a
set of samples can predict the class label of that same set of
samples). This error rate is highly biased (overly optimistic).
To avoid this bias, caGEDA splits a dataset into two groups
of samples, a training set and a test set. Learning (classifier
construction) is conducted on the training set and evaluated
on the test set. The user defines the size of the training and
test datasets; these splits are usually performed with a 70/30
ratio. Features (differentially expressed genes) are selected
using the specific test and threshold, and class prediction is
performed on the test dataset (eg naive Bayes posterior
probability). Random resampling can be conducted at a given
threshold, or over a range of thresholds or significance levels
for a test.
When computational validation is performed with a single
split of training set/test set, the estimated rate of test
classification error has a high variance. To decrease that
variance, caGEDA allows users to perform random
resampling validated learning. The average rate for test
classification error is determined over a range of values of
the test threshold or significance level (number of features
included), using multiple independent training/test set splits
to avoid the possibility that a lucky (or unlucky) single
training/test set split might misinform the investigator on
the rate of test classification error. Average rates of test error
generated this way have a lower variance. The user defines
the number of independent splits to be created.
This validated learning test error can be further validated
using the classical single training set/test set split. Users can
also exclude samples from analysis and create a ‘pristine’
test set (a ‘validation set’) by assigning samples to group 0
in the Group Settings forms. caGEDA will then report the
training error, the validated learning test error and the
validation set error.
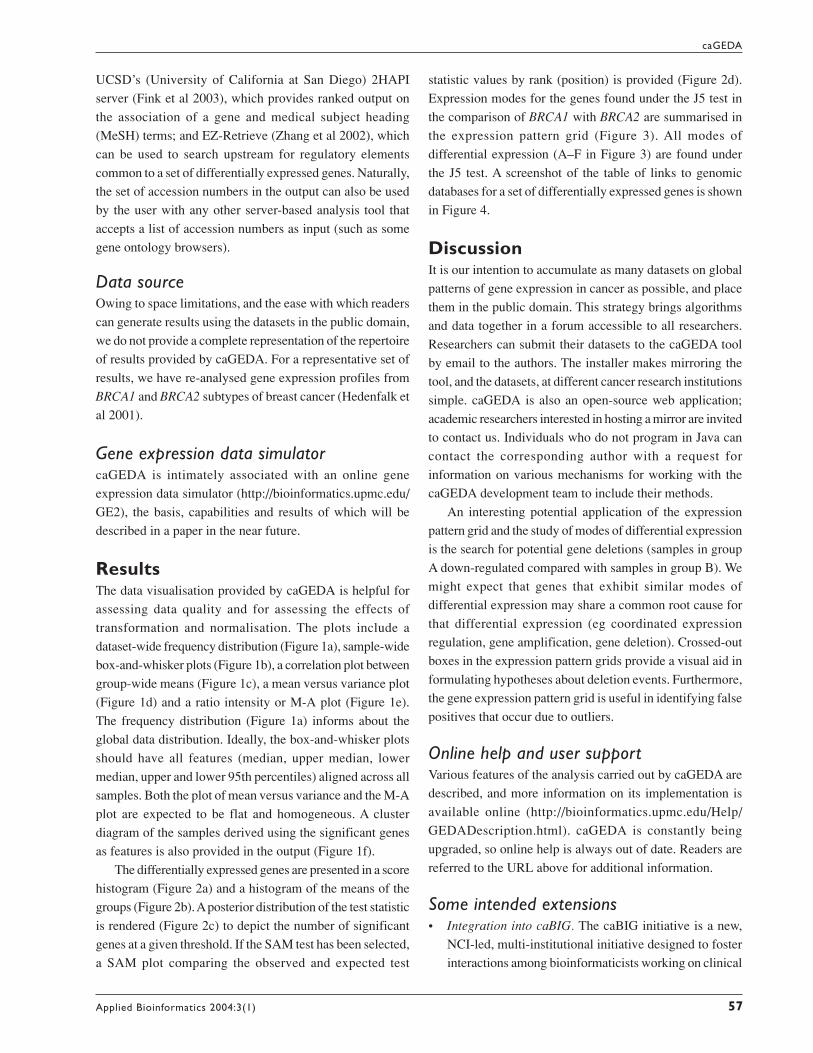
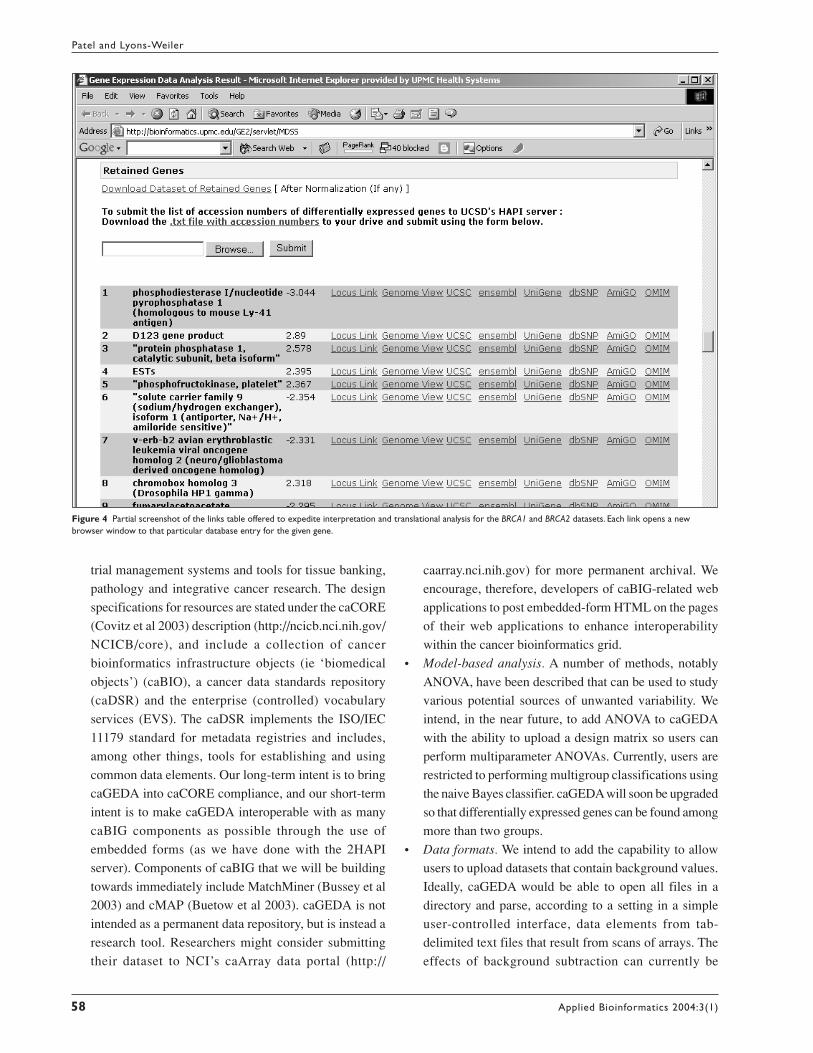
Interoperability: towards translationalresearchTo facilitate translational research, the HTML output file of
caGEDA produces a table of links to the entries in a number
of databases. If the dataset analysed is in caGEDA format 2
(ie contains accession numbers, which may be UniGene ID,
GenBank® numbers or some commercial chip accession
numbers), the HTML output file of an analysis also contains
embedded forms so users can download the accession
numbers for their set of differentially expressed genes and
then upload them again to two online servers of interest:
Table 4 Pairwise distances available for sample classificationinferences (class discovery and class prediction) in caGEDA
Types of distances
Euclidean distance (equivalent to 1-Pearson’s correlation coefficient (centred))1-Pearson’s correlation coefficient (uncentred)Absolute (1-Pearson’s correlation coefficient (uncentred))Manhattan/City Block distanceChebychev distanceCanberra distanceMinkowski distanceChord distance
Table 3 Tests for differentially expressed genes available incaGEDA
Test Reference
J5 test Appendix 1Simple separability Appendix 1Weighted separability Appendix 1Pooled variance t-testSimple t-testPaired values t-testFold-change (ratio of means)Fold-change (mean of ratios)Fold-change ((M1 – M2)/M2) where M2 < M1D1 test Appendix 1S/N (Furey et al 2000)BSS/WSS (Dudoit and Fridlyand 2002)PPST test Appendix 1ABA test Appendix 1
S/N, signal-to-noise ratio; BSS/WSS, between sums of squares/within sums ofsquares ratio; PPST, permutation percentile separability.
caGEDA
Applied Bioinformatics 2004:3(1) 57
UCSD’s (University of California at San Diego) 2HAPI
server (Fink et al 2003), which provides ranked output on
the association of a gene and medical subject heading
(MeSH) terms; and EZ-Retrieve (Zhang et al 2002), which
can be used to search upstream for regulatory elements
common to a set of differentially expressed genes. Naturally,
the set of accession numbers in the output can also be used
by the user with any other server-based analysis tool that
accepts a list of accession numbers as input (such as some
gene ontology browsers).
Data sourceOwing to space limitations, and the ease with which readers
can generate results using the datasets in the public domain,
we do not provide a complete representation of the repertoire
of results provided by caGEDA. For a representative set of
results, we have re-analysed gene expression profiles from
BRCA1 and BRCA2 subtypes of breast cancer (Hedenfalk et
al 2001).
Gene expression data simulatorcaGEDA is intimately associated with an online gene
expression data simulator (http://bioinformatics.upmc.edu/
GE2), the basis, capabilities and results of which will be
described in a paper in the near future.
ResultsThe data visualisation provided by caGEDA is helpful for
assessing data quality and for assessing the effects of
transformation and normalisation. The plots include a
dataset-wide frequency distribution (Figure 1a), sample-wide
box-and-whisker plots (Figure 1b), a correlation plot between
group-wide means (Figure 1c), a mean versus variance plot
(Figure 1d) and a ratio intensity or M-A plot (Figure 1e).
The frequency distribution (Figure 1a) informs about the
global data distribution. Ideally, the box-and-whisker plots
should have all features (median, upper median, lower
median, upper and lower 95th percentiles) aligned across all
samples. Both the plot of mean versus variance and the M-A
plot are expected to be flat and homogeneous. A cluster
diagram of the samples derived using the significant genes
as features is also provided in the output (Figure 1f).
The differentially expressed genes are presented in a score
histogram (Figure 2a) and a histogram of the means of the
groups (Figure 2b). A posterior distribution of the test statistic
is rendered (Figure 2c) to depict the number of significant
genes at a given threshold. If the SAM test has been selected,
a SAM plot comparing the observed and expected test
statistic values by rank (position) is provided (Figure 2d).
Expression modes for the genes found under the J5 test in
the comparison of BRCA1 with BRCA2 are summarised in
the expression pattern grid (Figure 3). All modes of
differential expression (A–F in Figure 3) are found under
the J5 test. A screenshot of the table of links to genomic
databases for a set of differentially expressed genes is shown
in Figure 4.
DiscussionIt is our intention to accumulate as many datasets on global
patterns of gene expression in cancer as possible, and place
them in the public domain. This strategy brings algorithms
and data together in a forum accessible to all researchers.
Researchers can submit their datasets to the caGEDA tool
by email to the authors. The installer makes mirroring the
tool, and the datasets, at different cancer research institutions
simple. caGEDA is also an open-source web application;
academic researchers interested in hosting a mirror are invited
to contact us. Individuals who do not program in Java can
contact the corresponding author with a request for
information on various mechanisms for working with the
caGEDA development team to include their methods.
An interesting potential application of the expression
pattern grid and the study of modes of differential expression
is the search for potential gene deletions (samples in group
A down-regulated compared with samples in group B). We
might expect that genes that exhibit similar modes of
differential expression may share a common root cause for
that differential expression (eg coordinated expression
regulation, gene amplification, gene deletion). Crossed-out
boxes in the expression pattern grids provide a visual aid in
formulating hypotheses about deletion events. Furthermore,
the gene expression pattern grid is useful in identifying false
positives that occur due to outliers.
Online help and user supportVarious features of the analysis carried out by caGEDA are
described, and more information on its implementation is
available online (http://bioinformatics.upmc.edu/Help/
GEDADescription.html). caGEDA is constantly being
upgraded, so online help is always out of date. Readers are
referred to the URL above for additional information.
Some intended extensions• Integration into caBIG. The caBIG initiative is a new,
NCI-led, multi-institutional initiative designed to foster
interactions among bioinformaticists working on clinical
Patel and Lyons-Weiler
Applied Bioinformatics 2004:3(1)58
trial management systems and tools for tissue banking,
pathology and integrative cancer research. The design
specifications for resources are stated under the caCORE
(Covitz et al 2003) description (http://ncicb.nci.nih.gov/
NCICB/core), and include a collection of cancer
bioinformatics infrastructure objects (ie ‘biomedical
objects’) (caBIO), a cancer data standards repository
(caDSR) and the enterprise (controlled) vocabulary
services (EVS). The caDSR implements the ISO/IEC
11179 standard for metadata registries and includes,
among other things, tools for establishing and using
common data elements. Our long-term intent is to bring
caGEDA into caCORE compliance, and our short-term
intent is to make caGEDA interoperable with as many
caBIG components as possible through the use of
embedded forms (as we have done with the 2HAPI
server). Components of caBIG that we will be building
towards immediately include MatchMiner (Bussey et al
2003) and cMAP (Buetow et al 2003). caGEDA is not
intended as a permanent data repository, but is instead a
research tool. Researchers might consider submitting
their dataset to NCI’s caArray data portal (http://
caarray.nci.nih.gov) for more permanent archival. We
encourage, therefore, developers of caBIG-related web
applications to post embedded-form HTML on the pages
of their web applications to enhance interoperability
within the cancer bioinformatics grid.
• Model-based analysis. A number of methods, notably
ANOVA, have been described that can be used to study
various potential sources of unwanted variability. We
intend, in the near future, to add ANOVA to caGEDA
with the ability to upload a design matrix so users can
perform multiparameter ANOVAs. Currently, users are
restricted to performing multigroup classifications using
the naive Bayes classifier. caGEDA will soon be upgraded
so that differentially expressed genes can be found among
more than two groups.
• Data formats. We intend to add the capability to allow
users to upload datasets that contain background values.
Ideally, caGEDA would be able to open all files in a
directory and parse, according to a setting in a simple
user-controlled interface, data elements from tab-
delimited text files that result from scans of arrays. The
effects of background subtraction can currently be
Figure 4 Partial screenshot of the links table offered to expedite interpretation and translational analysis for the BRCA1 and BRCA2 datasets. Each link opens a newbrowser window to that particular database entry for the given gene.

caGEDA
Applied Bioinformatics 2004:3(1) 59
evaluated using the computational validation options ifthe user creates and analyses two datasets (one with andone without background subtraction).
• Nonlinear normalisation. We intend to add LOWESStransformations and other nonlinear normalisationapproaches advocated by some for use with two-dyeexperiments. These normalisations provide some benefitat an, as yet, unmeasured cost of lost information.Listgarten et al (2003) recently demonstrated that print-tip LOWESS appears to be superior to others at correctingthe problems inherent to the two-dye platform (dye bias).
• Gene clustering. caGEDA has the ability to perform geneclustering, but this option has been disabled because thecomputations place a heavy burden on the serversperforming the analyses. The usefulness of clusteringgenes without taking prior knowledge into account is
generally recognised as fairly limited.
AcknowledgementsWe thank Milos Hauskrecht and Richard Pelikan for their
generous assistance in implementing the naive Bayes
algorithm and for extensive discussion on resampling-based
validation. This work was funded exclusively by Dr Lyons-Weiler’s faculty recruitment funds, provided by a grant fromthe Claude Worthington Benedum Foundation to Dr Michael
Becich and Dr Ronald Herberman.
Appendix 1
Novel tests included in the caGEDA webapplicationSimple separability testWe define N
1 as the number of samples in group A for which
the expression value for the ith gene is less than the minimumvalue of that gene of group B (the subscript i in N
1i has been
omitted for ease of reading); N2, as the number of samples
in group A for which the expression value for the ith gene isgreater than the maximum value of that gene of group B; N
3,
as the number of samples in group B for which the expressionvalue for the ith gene is less than the minimum value of thatgene of group A; and N
4, as the number of samples in group
B for which the expression value for the ith gene is greaterthan the maximum value of that gene of group A. This isequivalent to the proportion of non-overlap between the twodistributions.
The counts N1, N
2 and N
3, N
4 are paired such that in the
perfectly separable case when N1= N
A, then N
2= 0, or vice
versa; and when N3= N
B, then N
4= 0, or vice versa. Our score,
Si, which is:
Si= (N
1+ N
4)/(N
A+ N
B) or
(N2
+ N3)/(N
A+ N
B)
(whichever is greater), has an upper limit of 1.0. The
threshold, T, ranges from 0 to 1. Genes with S scores greater
than or equal to T are retained (1 = perfect separability, no
overlap in the distribution).
Weighted separabilityClearly, simple separability is not as informative as it mightbe, especially in the comparison of two sample distributionsthat are perfectly separated, one by a large magnitude andthe other by a smaller magnitude. Under weightedseparability, the score for each gene is weighted usinginformation on the magnitude of the difference between thegroup means. Specifically, the weight of each of m givengenes is:
wi= (mean
Ai– mean
Bi)/(1/m)sum(mean
Ai– mean
Bi)
Under weighted separability, the score Si becomes w
iS
i and
has a lower limit of 0 and an upper limit of NA
+ NB.
J5 testThe J5 test is a gene-specific ratio between the mean
difference in expression intensity between two groups, A and
B, to the average mean group difference of all m genes.
The J5 test is likely to be useful in pilot studies where, due
to high variance, t-tests are likely to exhibit unacceptably
low specificity (high false discovery rates). A paired sample
J5 test is under development.
D1 testThe D1 test is a twice-iterated J5 test where the remaining
genes are tested again after removing the genes found to be
significant in the first iteration.
Permutation percentile separability testPPST examines whether a gene is overexpressed (or
underexpressed) in a surprisingly large number of patients
in the test group compared with the control group, and vice
versa. This is achieved by first counting the number of
individuals in a group that exhibit an expression intensity
that is greater (or less than) than the upper (or lower) 95th
percentile of the alternate group. This number is compared
with a distribution of counts that results when an arbitrarily
large number of permutations of sample class labels are
J
m
ii i
j j
j
m5 = -
-=
ÂA B
A B1
1
Patel and Lyons-Weiler
Applied Bioinformatics 2004:3(1)60
performed. PPST identifies genes with AB (ie where A > B)
and BA (ie where B > A) patterns of differential expression.
ABA testThe ABA test is a special form of the PPST and reports genesthat show both a surprisingly large number of samples that
are overexpressed compared with the alternate group and a
surprisingly large number of samples that are underexpressed
compared with the alternate group. The test is called ABA
to reflect the pattern in which samples from the A group are
found in the tails of the B group, and it reports genes that
exhibit either significant ABA or BAB patterns. caGEDA
provides output for both, and an expression pattern grid for
the ABA pattern genes (tumour–normal–tumour). Our
convention is that tumours (cases, treatments) are assigned
group label 1, while normals (controls) are assigned group
label 2 for a two-class comparison.
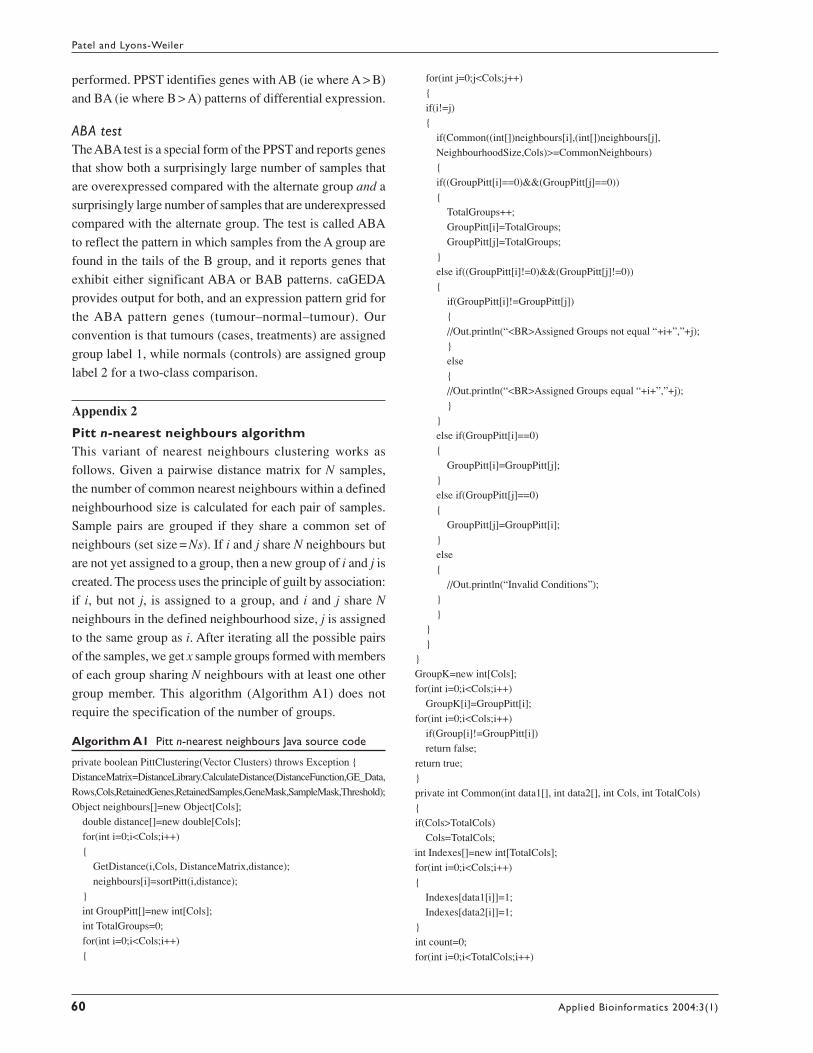
Appendix 2
Pitt n-nearest neighbours algorithmThis variant of nearest neighbours clustering works as
follows. Given a pairwise distance matrix for N samples,
the number of common nearest neighbours within a defined
neighbourhood size is calculated for each pair of samples.
Sample pairs are grouped if they share a common set of
neighbours (set size = Ns). If i and j share N neighbours but
are not yet assigned to a group, then a new group of i and j is
created. The process uses the principle of guilt by association:
if i, but not j, is assigned to a group, and i and j share N
neighbours in the defined neighbourhood size, j is assigned
to the same group as i. After iterating all the possible pairs
of the samples, we get x sample groups formed with members
of each group sharing N neighbours with at least one other
group member. This algorithm (Algorithm A1) does not
require the specification of the number of groups.
Algorithm A1 Pitt n-nearest neighbours Java source code
private boolean PittClustering(Vector Clusters) throws Exception {DistanceMatrix=DistanceLibrary.CalculateDistance(DistanceFunction,GE_Data,
Rows,Cols,RetainedGenes,RetainedSamples,GeneMask,SampleMask,Threshold);
Object neighbours[]=new Object[Cols]; double distance[]=new double[Cols];
for(int i=0;i<Cols;i++)
{
GetDistance(i,Cols, DistanceMatrix,distance);
neighbours[i]=sortPitt(i,distance);
}
int GroupPitt[]=new int[Cols];
int TotalGroups=0;
for(int i=0;i<Cols;i++) {
for(int j=0;j<Cols;j++)
{
if(i!=j) {
if(Common((int[])neighbours[i],(int[])neighbours[j],
NeighbourhoodSize,Cols)>=CommonNeighbours) {
if((GroupPitt[i]==0)&&(GroupPitt[j]==0))
{ TotalGroups++;
GroupPitt[i]=TotalGroups;
GroupPitt[j]=TotalGroups; }
else if((GroupPitt[i]!=0)&&(GroupPitt[j]!=0))
{ if(GroupPitt[i]!=GroupPitt[j])
{
//Out.println(“<BR>Assigned Groups not equal “+i+”,”+j); }
else
{
//Out.println(“<BR>Assigned Groups equal “+i+”,”+j);
}
}
else if(GroupPitt[i]==0)
{
GroupPitt[i]=GroupPitt[j];
}
else if(GroupPitt[j]==0)
{
GroupPitt[j]=GroupPitt[i];
}
else
{
//Out.println(“Invalid Conditions”);
}
}
}
}
}
GroupK=new int[Cols];
for(int i=0;i<Cols;i++)
GroupK[i]=GroupPitt[i];
for(int i=0;i<Cols;i++)
if(Group[i]!=GroupPitt[i])
return false;
return true;
}
private int Common(int data1[], int data2[], int Cols, int TotalCols)
{ if(Cols>TotalCols)
Cols=TotalCols;
int Indexes[]=new int[TotalCols]; for(int i=0;i<Cols;i++)
{
Indexes[data1[i]]=1;
Indexes[data2[i]]=1;
}
int count=0;
for(int i=0;i<TotalCols;i++)
caGEDA
Applied Bioinformatics 2004:3(1) 61
{
count+=Indexes[i];
} count=Cols*2–count;
return count;
} private Object sortPitt(int index,double Data[])
{
int Index[]=new int[Data.length]; for(int i=0;i<Index.length;i++)
Index[i]=i;
for(int i=0;i<Index.length;i++) for(int j=i+1;j<Index.length;j++)
if(Data[Index[i]]>Data[Index[j]])
{ int temp=Index[i];
Index[i]=Index[j];
Index[j]=temp; }
for(int i=0;i<Cols–1;i++)
Index[i]=Index[i+1];
return (Object)Index;
}
private void GetDistance(int index, int Cols, double
DistanceMatrix[][],double distance[])
{
for(int i=0;i<index;i++)
distance[i]=DistanceMatrix[i][index];
for(int i=index;i<Cols;i++)
distance[i]=DistanceMatrix[index][i];
}
References
ACME Laboratories. 2001. ACME Laboratories freeware [online].Accessed 7 Apr 2004. URL: http://www.acme.com
Alizadeh A, Eisen M, Davis RE et al. 2000. Distinct types of diffuse largeB-cell lymphoma identified by gene expression profiling. Nature,403:503–11.
Allander SV, Illei PB, Chen Y et al. 2002. Expression profiling of synovialsarcoma by cDNA microarrays: association of ERBB2, IGFBP2, andELF3 with epithelial differentiation. Am J Pathol, 161:1587–95.
Alon U, Barkai N, Notterman DA et al. 1999. Broad patterns of geneexpression revealed by clustering analysis of tumor and normal colontissues probed by oligonucleotide arrays. Proc Natl Acad Sci USA,96:6745–50.
Beer DG, Kardia SL, Huang CC et al. 2002. Gene-expression profilespredict survival of patients with lung adenocarcinoma. Nat Med,8:816–24.
Bittner M, Meltzer P, Chen Y et al. 2000. Molecular classification ofcutaneous malignant melanoma by gene expression profiling. Nature,406:536–40.
Buetow KH, Klausner RD, Fine H et al. 2002. Cancer molecular analysisproject: weaving a rich cancer research tapestry. Cancer Cell, 1:315–18.
Bussey KJ, Kane D, Sunshine M et al. 2003. MatchMiner: a tool for batchnavigation among gene and gene product identifiers. Genome Biol,4:R27.
Chakrabarti R, Robles LD, Gibson J et al. 2002. Profiling of differentialexpression of messenger RNA in normal, benign, and metastaticprostate cell lines. Cancer Genet Cytogenet, 139:115–25.
Chan WC, Huang JZ. 2001. Gene expression analysis in aggressive NHL.Ann Hematol, 80(Suppl 3):B38–41.
Chang JC, Wooten EC, Tsimelzon A et al. 2003. Gene expression profilingpredicts therapeutic response to docetaxel in breast cancer patients.Lancet, 362:362–9.
Chopra A, Brown KM, Rood BR et al. 2003. The use of gene expressionanalysis to gain insights into signaling mechanisms of metastaticmedulloblastoma. Pediatr Neurosurg, 39:68–74.
Chua MS, Sarwal MM. 2003. Microarrays: new tools for transplantationresearch. Pediatr Nephrol, 18:319–27.
Cooper CR, Chay CH, Gendernalik JD et al. 2003. Stromal factorsinvolved in prostate carcinoma metastasis to bone. Cancer, 97(Suppl3):739–47.
Covitz PA, Hartel F, Schaefer C et al. 2003. caCORE: a commoninfrastructure for cancer informatics. Bioinformatics, 18:2404–12.
Cunningham MJ, Liang S, Fuhrman S et al. 2000. Gene expressionmicroarray data analysis for toxicology profiling. Ann NY Acad Sci,919:52–67.
Dan S, Tsunoda T, Kitahara O et al. 2002. An integrated database ofchemosensitivity to 55 anticancer drugs and gene expression profilesof 39 human cancer cell lines. Cancer Res, 62:1139–47.
Dangond F, Hwang D, Camelo S et al. 2004. Molecular signature of late-stage human ALS revealed by expression profiling of postmortemspinal cord gray matter. Physiol Genomics, 16:229–39.
DePrimo SE, Wong LM, Khatry DB et al. 2003. Expression profiling ofblood samples from an SU5416 phase III metastatic colorectal cancerclinical trial: a novel strategy for biomarker identification. BMCCancer, 3:3.
DeRisi JL, Iyer VR, Brown PO. 1997. Exploring the metabolic and geneticcontrol of gene expression on a genomic scale. Science, 278:680–6.
de Vos S, Hofmann WK, Grogan TM et al. 2003. Cell cycle alterations inthe blastoid variant of mantle cell lymphoma (MCL-BV) as detectedby gene expression profiling of mantle cell lymphoma (MCL) andMCL-BV. Diagn Mol Pathol, 12:35–43.
Dudoit S, Fridlyand J. 2002. A prediction-based resampling method toestimate the number of clusters in a dataset. Genome Biol, 3:0036.1–0036.21.
Efron B. 1979. Bootstrap methods: another look at the jackknife. AnnStat, 7:1–26.
Eyster KM, Lindahl R. 2001. Molecular medicine: a primer for clinicians.Part XII: DNA microarrays and their application to clinical medicine.SDJ Med, 54:57–61.
Fink JL, Drewes S, Patel H et al. 2003. 2HAPI: a microarray data analysissystem. Bioinformatics, 19:1443–5.
Furey TS, Cristianini N, Duffy N et al. 2000. Support vector machineclassification and validation of cancer tissue samples using microarrayexpression data. Bioinformatics, 16:906–14.
Garber ME, Troyanskaya OG, Schluens K et al. 2001. Diversity of geneexpression in adenocarcinoma of the lung. Proc Natl Acad Sci USA,98:13784–9. [Erratum in: Proc Natl Acad Sci USA, 2002; 99:1098.]
Gildea JJ, Seraj MJ, Oxford G et al. 2002. RhoGDI2 is an invasion andmetastasis suppressor gene in human cancer. Cancer Res, 62:6418–23.
Giles ED, Singh G. 2003. Role of insulin-like growth factor bindingproteins (IGFBPs) in breast cancer proliferation and metastasis. ClinExp Metastasis, 20:481–7.
Golub TR, Slonim DK, Tamayo P et al. 1999. Molecular classification ofcancer: class discovery and class prediction by gene expressionmonitoring. Science, 286:531–7.
Hawse JR, Hejtmancik JF, Huang Q et al. 2003. Identification andfunctional clustering of global gene expression differences betweenhuman age-related cataract and clear lenses. Mol Vis, 9:515–37.
Hayden PS, El-Meanawy A, Schelling JR et al. 2003. DNA expressionanalysis: serial analysis of gene expression, microarrays and kidneydisease. Curr Opin Nephrol Hypertens, 12:407–14.
Hedenfalk I, Duggan D, Chen Y et al. 2001. Gene-expression profiles inhereditary breast cancer. N Engl J Med, 344:539–48.
Inoue H, Matsuyama A, Mimori K et al. 2002. Prognostic score of gastriccancer determined by cDNA microarray. Clin Cancer Res, 8:3475–9.
Patel and Lyons-Weiler
Applied Bioinformatics 2004:3(1)62
Ji B, Chen XQ, Misek DE et al. 2003. Pancreatic gene expression duringthe initiation of acute pancreatitis: identification of EGR-1 as a keyregulator. Physiol Genomics, 14:59–72.
Kallioniemi OP. 2001. Biochip technologies in cancer research. Ann Med,33:142–7.
Kaminski N, Allard J, Heller RA. 2000. Use of oligonucleotide arrays toanalyze drug toxicity. Ann NY Acad Sci, 919:1–8.
Khatua S, Peterson KM, Brown KM et al. 2003. Overexpression of theEGFR/FKBP12/HIF-2alpha pathway identified in childhoodastrocytomas by angiogenesis gene profiling. Cancer Res, 63:1865–70.
Kihara C, Tsunoda T, Tanaka T et al. 2001. Prediction of sensitivity ofesophageal tumors to adjuvant chemotherapy by cDNA microarrayanalysis of gene-expression profiles. Cancer Res, 61:6474–9.
Kikuchi T, Daigo Y, Katagiri T et al. 2003. Expression profiles of non-small cell lung cancers on cDNA microarrays: identification of genesfor prediction of lymph-node metastasis and sensitivity to anti-cancerdrugs. Oncogene, 22:2192–205.
Li S, Ross DT, Kadin ME et al. 2001. Comparative genome-scale analysisof gene expression profiles in T cell lymphoma cells during malignantprogression using a complementary DNA microarray. Am J Pathol,158:1231–7.
Listgarten J, Graham K, Damaraju S et al. 2003. Clinically validatedbenchmarking of normalisation techniques for two-colouroligonucleotide spotted microarray slides. Appl Bioinform, 2:219–28.
Lockhart DJ, Dong H, Byrne MC et al. 1996. Expression monitoring byhybridization to high-density oligonucleotide arrays. Nat Biotechnol,13:1675–80.
Loring JF, Wen X, Lee JM et al. 2001. A gene expression profile ofAlzheimer’s disease. DNA Cell Biol, 20:683–95.
Luo JH, Yu YP, Cieply K et al. 2002. Gene expression analysis of prostatecancers. Mol Carcinog, 33:25–35.
Lyons-Weiler J, Patel S, Bhattacharya S. 2003. A classification-basedmachine learning approach for the analysis of genome-wideexpression data. Genome Res, 13:503–12.
Lyons-Weiler J, Patel S, Ngyuen T et al. 2004. UPITT Cancer GeneExpression Data Set Link Database, maintained by the University ofPittsburgh Benedum Oncology Informatics Center [online]. Accessed12 Apr 2004. URL: http://bioinformatics.upmc.edu/Help/UPITTGED.html
MacDonald TJ, Brown KM, LaFleur B et al. 2001. Expression profilingof medulloblastoma: PDGFRA and the RAS/MAPK pathway astherapeutic targets for metastatic disease. Nat Genet, 29:143–52.
Mandel S, Weinreb O, Youdim MB. 2003. Using cDNA microarray toassess Parkinson’s disease models and the effects of neuroprotectivedrugs. Trends Pharmacol Sci, 24:184–91.
Minning TA, Bua J, Garcia GA et al. 2003. Microarray profiling of geneexpression during trypomastigote to amastigote transition inTrypanosoma cruzi. Mol Biochem Parasitol, 131:55–64.
Miura K, Bowman ED, Simon R et al. 2002. Laser capture microdissectionand microarray expression analysis of lung adenocarcinoma revealstobacco smoking- and prognosis-related molecular profiles. CancerRes, 62:3244–50.
Miyachi H. 2002. Recent advances in molecular diagnostic tests. RinshoByori, 123(Suppl):19–29.
Nagata M, Fujita H, Ida H et al. 2003. Identification of potential biomarkersof lymph node metastasis in oral squamous cell carcinoma by cDNAmicroarray analysis. Int J Cancer, 106:683–9.
Nocito A, Bubendorf L, Maria Tinner E et al. 2001. Microarrays of bladdercancer tissue are highly representative of proliferation index andhistological grade. J Pathol, 194:349–57.
Ohno R, Nakamura Y. 2003. Prediction of response to imatinib by cDNAmicroarray analysis. Semin Hematol, 40(Suppl 3):42–9.
Okutsu J, Tsunoda T, Kaneta Y et al. 2002. Prediction of chemosensitivityfor patients with acute myeloid leukemia, according to expressionlevels of 28 genes selected by genome-wide complementary DNAmicroarray analysis. Mol Cancer Ther, 1:1035–42.
O’Reilly. 2002. com.oreilly.servlet [online]. Accessed Dec 2002. URL:http://www.servlets.com/cos/index.html
Pasinetti GM. 2001. Use of cDNA microarray in the search for molecularmarkers involved in the onset of Alzheimer’s disease dementia. JNeurosci Res, 65:471–6.
Perou CM, Sorlie T, Eisen MB et al. 2000. Molecular portraits of humanbreast tumours. Nature, 406:747–52.
Ramaswamy S, Ross KN, Lander ES et al. 2003. A molecular signatureof metastasis in primary solid tumors. Nat Genet, 33:49–54.
Rickman DS, Bobek MP, Misek DE et al. 2001. Distinctive molecularprofiles of high-grade and low-grade gliomas based onoligonucleotide microarray analysis. Cancer Res, 61:6885–91.
Sasaki H, Ide N, Fukai I et al. 2002. Gene expression analysis of humanthymoma correlates with tumor stage. Int J Cancer, 101:342–7.
Schena M, Shalon D, Davis RW et al. 1995. Quantitative monitoring ofgene expression patterns with a complementary DNA microarray.Science, 270:467–70.
Seftor EA, Meltzer PS, Kirschmann DA et al. 2002. Moleculardeterminants of human uveal melanoma invasion and metastasis. ClinExp Metastasis, 19:233–46.
Shih JY, Yang SC, Hong TM et al. 2001. Collapsin response mediatorprotein-1 and the invasion and metastasis of cancer cells. J NatlCancer Inst, 93:1392–400.
Shipp MA, Ross KN, Tamayo P et al. 2002. Diffuse large B-cell lymphomaoutcome prediction by gene-expression profiling and supervisedmachine learning. Nat Med, 8:68–74.
Susztak K, Sharma K, Schiffer M et al. 2003. Genomic strategies fordiabetic nephropathy. J Am Soc Nephrol, 14(Suppl 3):S271–8.
Takahashi M, Sugimura J, Yang X et al. 2003. Gene expression profilingof renal cell carcinoma and its implications in diagnosis, prognosis,and therapeutics. Adv Cancer Res, 89:157–81.
Tusher VG, Tibshirani R, Chu G. 2001. Significance analysis ofmicroarrays applied to the ionizing radiation response. Proc Natl AcadSci USA, 98:5116–21.
Ueno S, Ohki R, Hashimoto T et al. 2003. DNA microarray analysis of invivo progression mechanism of heart failure. Biochem Biophys ResCommun, 307:771–7.
Urbanowska T, Mangialaio S, Hartmann C et al. 2003. Development ofprotein microarray technology to monitor biomarkers of rheumatoidarthritis disease. Cell Biol Toxicol, 19:189–202.
van’t Veer LJ, Dai H, van de Vijver MJ et al. 2002. Gene expressionprofiling predicts clinical outcome of breast cancer. Nature, 415:530–6.
Vrana KE, Freeman WM, Aschner M. 2003. Use of microarraytechnologies in toxicology research. Neurotoxicology, 24:321–32.
Welford SM, Gregg J, Chen E et al. 1998. Detection of differentiallyexpressed genes in primary tumor tissues using representationaldifferences analysis coupled to microarray hybridization. NucleicAcids Res, 26:3059–65.
Welsh JB, Zarrinker PP, Sapinoso LM et al. 2001. Analysis of geneexpression profiles in normal and neoplastic ovarian tissue samplesidentifies candidate molecular markers of epithelial ovarian cancer.Proc Natl Acad Sci USA, 98:1176–81.
Zhang H, Ramanathan Y, Soteropoulos P et al. 2002. EZ-Retrieve: a web-server for batch retrieval of coordinate-specified human DNAsequences and underscoring putative transcription factor-bindingsites. Nucleic Acids Res, 30:E121.

