c4dt01392a1.pdf - The Royal Society of Chemistry
10
S1 SUPPORTING INFORMATION for Mixed-ligand ruthenium polypyridyl complexes as apoptosis inducers in cancer cells, the cellular translocation and the important role of ROS-mediated signaling Zhennan Zhao, Zuandi Luo, Wenjie Zheng, * Qiong Wu, Yanxian Feng, Tianfeng Chen * Department of Chemistry, Jinan University, Guangzhou, 510632, China. * Corresponding author: Room 643, Department of Chemistry, Jinan University, Guangzhou 510632, China. Tel: +86 20-85225962; Fax: +86 20 85221263. E-mail: [email protected], [email protected] Disclosure of Potential Conflicts of Interest No potential conflicts of interest were disclosed. Electronic Supplementary Material (ESI) for Dalton Transactions. This journal is © The Royal Society of Chemistry 2014
-
Upload
khangminh22 -
Category
Documents
-
view
0 -
download
0
Transcript of c4dt01392a1.pdf - The Royal Society of Chemistry
S1
SUPPORTING INFORMATION
for
Mixed-ligand ruthenium polypyridyl complexes as apoptosis
inducers in cancer cells, the cellular translocation and the important
role of ROS-mediated signaling
Zhennan Zhao, Zuandi Luo, Wenjie Zheng,* Qiong Wu, Yanxian Feng,
Tianfeng Chen*
Department of Chemistry, Jinan University, Guangzhou, 510632, China.
* Corresponding author: Room 643, Department of Chemistry, Jinan University,
Guangzhou 510632, China. Tel: +86 20-85225962; Fax: +86 20 85221263.
E-mail: [email protected], [email protected]
Disclosure of Potential Conflicts of Interest
No potential conflicts of interest were disclosed.
Electronic Supplementary Material (ESI) for Dalton Transactions.This journal is © The Royal Society of Chemistry 2014
S2
Ru(bbp)pipCl+
Ru(bbp)(m- opip)Cl++Na
Ru(bbp)(o- opip)Cl+
Ru(bbp)(p- opip)Cl2+
Ru(bbp)(p- opip)Cl+
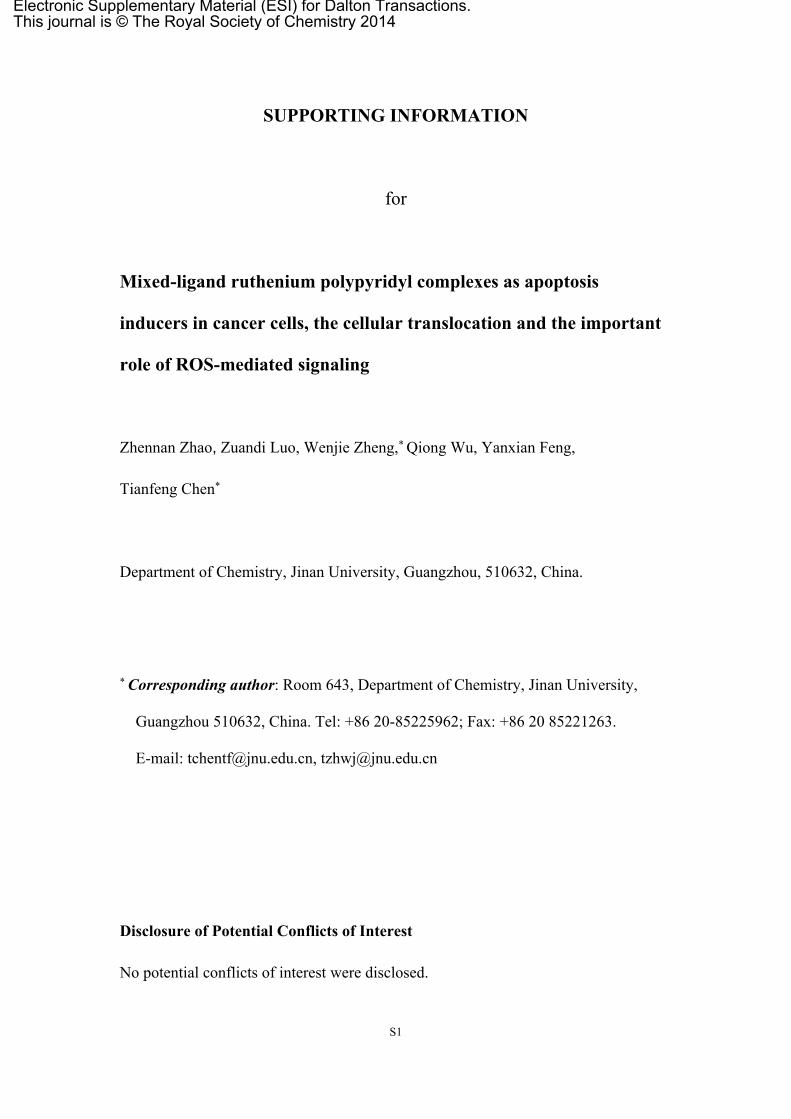
Figure S1. MS analysis of a series of ruthenium (II) complexes
S3
NN
N
N
N
RuCl
NN
N NH
122' 3
4
54'5'
a
b
c
d
e
kj
i
f
g
h
3'
66'
e,g4,4’
5,5’f,d,h
6,6’
b,j
3,3’
1,2,2’
c,i
a,k
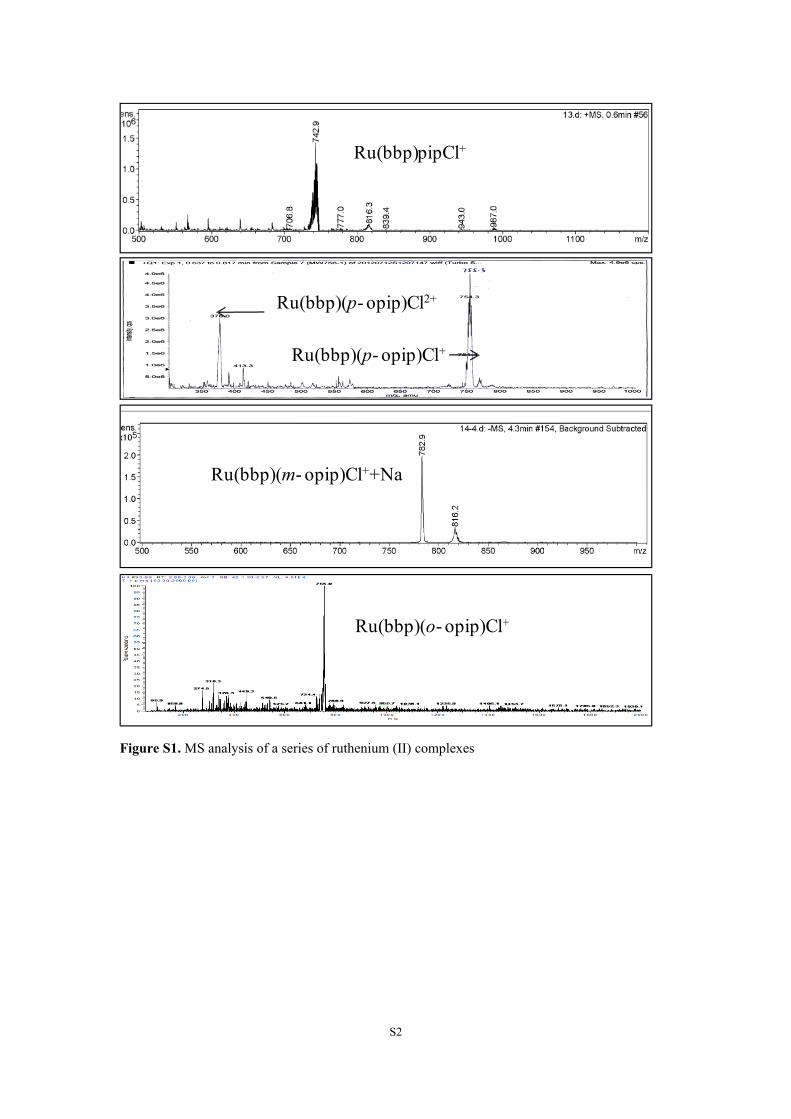
Figure S2. 1H NMR spectrum of 1.
S4
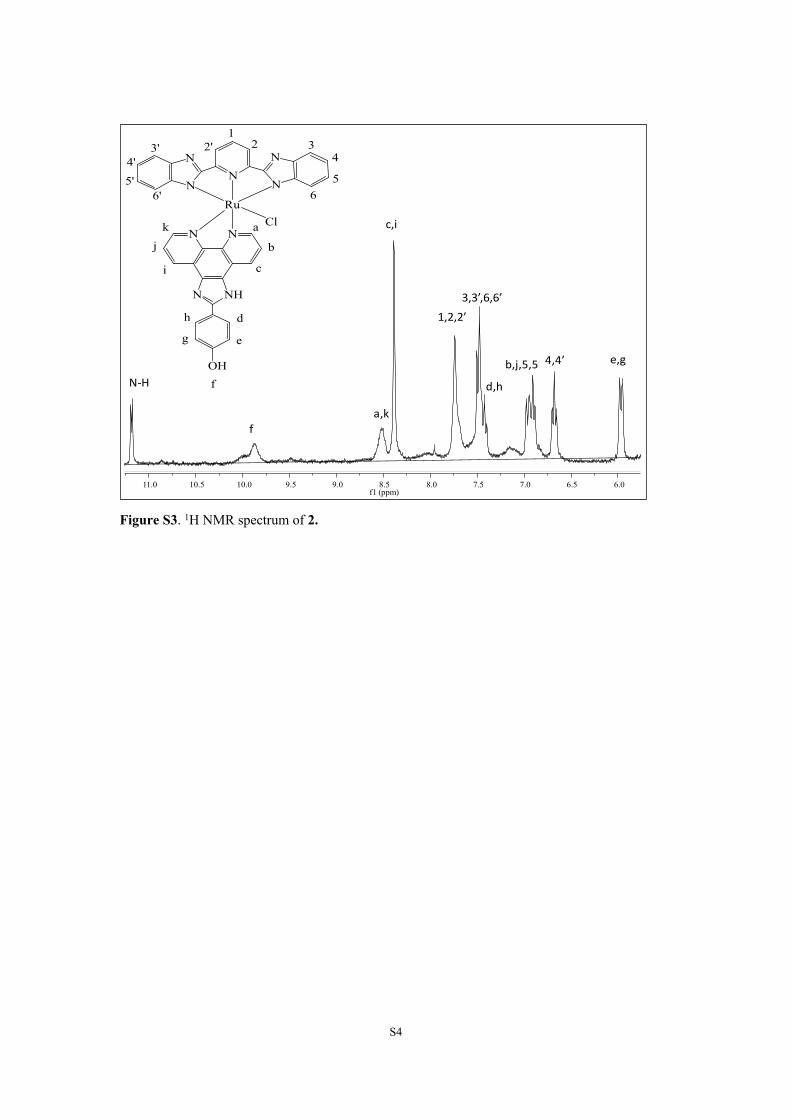
c,i
e,g4,4’,5,5’ b,j
d,h
3,3’,6,6’
a,k
N-H
1,2,2’
f
NN
N
N
N
RuCl
NN
N NH
122' 3
4
54'
5'
a
b
c
d
e
k
j
i
f
g
h
3'
66'
OH
6.06.57.07.58.08.59.09.510.010.511.0f1 (ppm)
c,i
e,g4,4’,5,5’ b,j
d,h
3,3’,6,6’
a,k
N-H
1,2,2’
f
NN
N
N
N
RuCl
NN
N NH
122' 3
4
54'
5'
a
b
c
d
e
k
j
i
f
g
h
3'
66'
OH
6.06.57.07.58.08.59.09.510.010.511.0f1 (ppm)
b,j,5,5’ 4,4’
Figure S3. 1H NMR spectrum of 2.
S5
NN
N
N
N
RuCl
NN
N NH
122' 3
4
54'
5'
a
b
c
d
e
k
j
i
f
g
h
3'
66'
OH
5.86.06.26.46.66.87.07.27.47.67.88.08.28.48.68.89.09.29.49.69.810.210.611.011.411.8f1 (ppm)
0
200
400
600
800
1000
1200
1400
600
180
2000
2200
2400
2600
2800
3000
3200
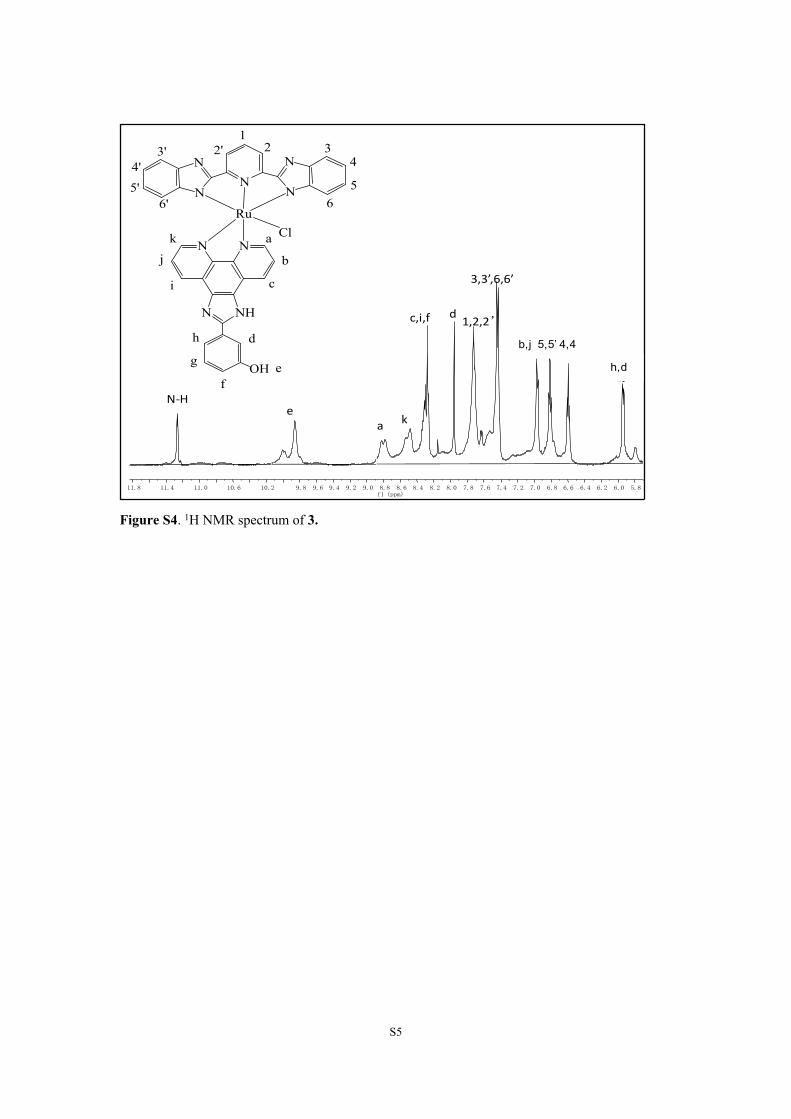
eN-H
3,3’,6,6’
b,j
c,i,f d
4,4’5,5’h,d
1,2,2’
ka
NN
N
N
N
RuCl
NN
N NH
122' 3
4
54'
5'
a
b
c
d
e
k
j
i
f
g
h
3'
66'
OH
5.86.06.26.46.66.87.07.27.47.67.88.08.28.48.68.89.09.29.49.69.810.210.611.011.411.8f1 (ppm)
0
200
400
600
800
1000
1200
1400
600
180
2000
2200
2400
2600
2800
3000
3200
eN-H
3,3’,6,6’
b,j
c,i,f d
4,4’5,5’h,d
1,2,2’
ka
NN
N
N
N
RuCl
NN
N NH
122' 3
4
54'
5'
a
b
c
d
e
k
j
i
f
g
h
3'
66'
OH
5.86.06.26.46.66.87.07.27.47.67.88.08.28.48.68.89.09.29.49.69.810.210.611.011.411.8f1 (ppm)
0
200
400
600
800
1000
1200
1400
600
180
2000
2200
2400
2600
2800
3000
3200
eN-H
3,3’,6,6’
b,j
c,i,f d
4,4’5,5’h,d
1,2,2’
ka
h,d
b,j 5,5’ 4,4
Figure S4. 1H NMR spectrum of 3.
S6
5.56.06.57.07.58.08.59.09.510.010.511.0f1 (ppm)
0
100
200
300
400
500
600
700
800
900
1000
1100
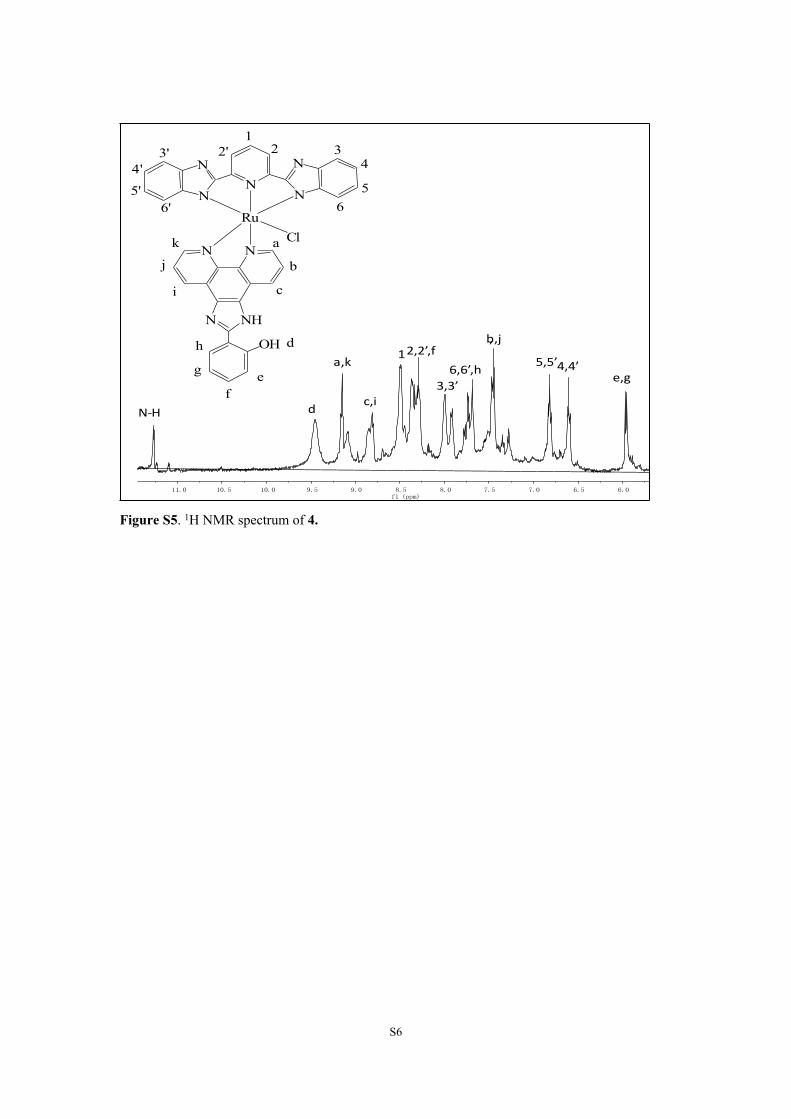
1200sample13-1301181h nmr of sample13
e,g5,5’4,4’
b,j,
6,6’,ha,k
c,i3,3’
12,2’,f
dN-H
NN
HN
N
HN
Ru
ClNN
N NH
122' 3
45
4'5'
ab
c
d
e
kj
i
fgh OH
3'
66' NN
N
N
N
RuCl
NN
N NH
122' 3
4
54'
5'
a
b
c
d
e
k
j
i
f
g
h
3'
66'
OH
Figure S5. 1H NMR spectrum of 4.
S7
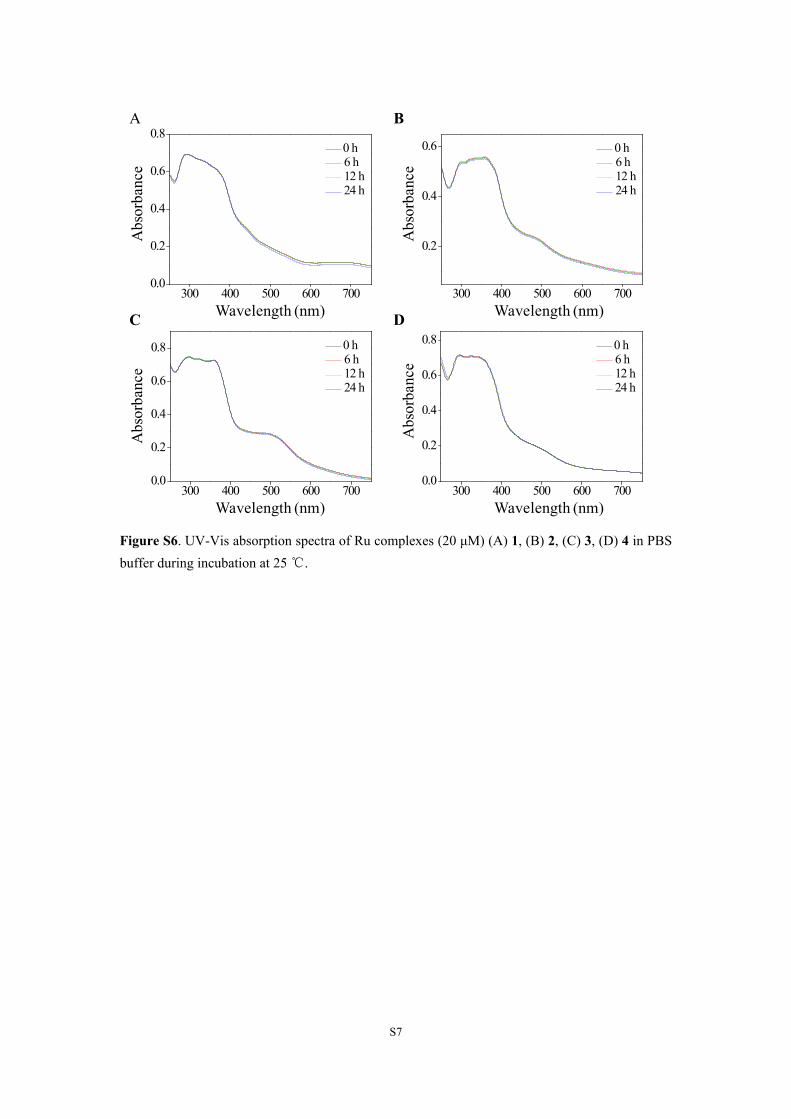
300 400 500 600 7000.0
0.2
0.4
0.6
0.8
0 h 6 h 12 h 24 h
300 400 500 600 700
0.2
0.4
0.6
0 h 6 h 12 h 24 h
300 400 500 600 7000.0
0.2
0.4
0.6
0.8
0 h 6 h 12 h 24 h
300 400 500 600 7000.0
0.2
0.4
0.6
0.8
0 h 6 h 12 h 24 h
Wavelength (nm)
Abs
orba
nce
Wavelength (nm)
Abs
orba
nce
Wavelength (nm)
Abs
orba
nce
Wavelength (nm)
Abs
orba
nce
A
C D
B
Figure S6. UV-Vis absorption spectra of Ru complexes (20 μM) (A) 1, (B) 2, (C) 3, (D) 4 in PBS buffer during incubation at 25 ℃.
S8
410 420 430 440 450
200
400
600
Ru (1) Ru (2) Ru (3) Ru (4)
Inte
nsity
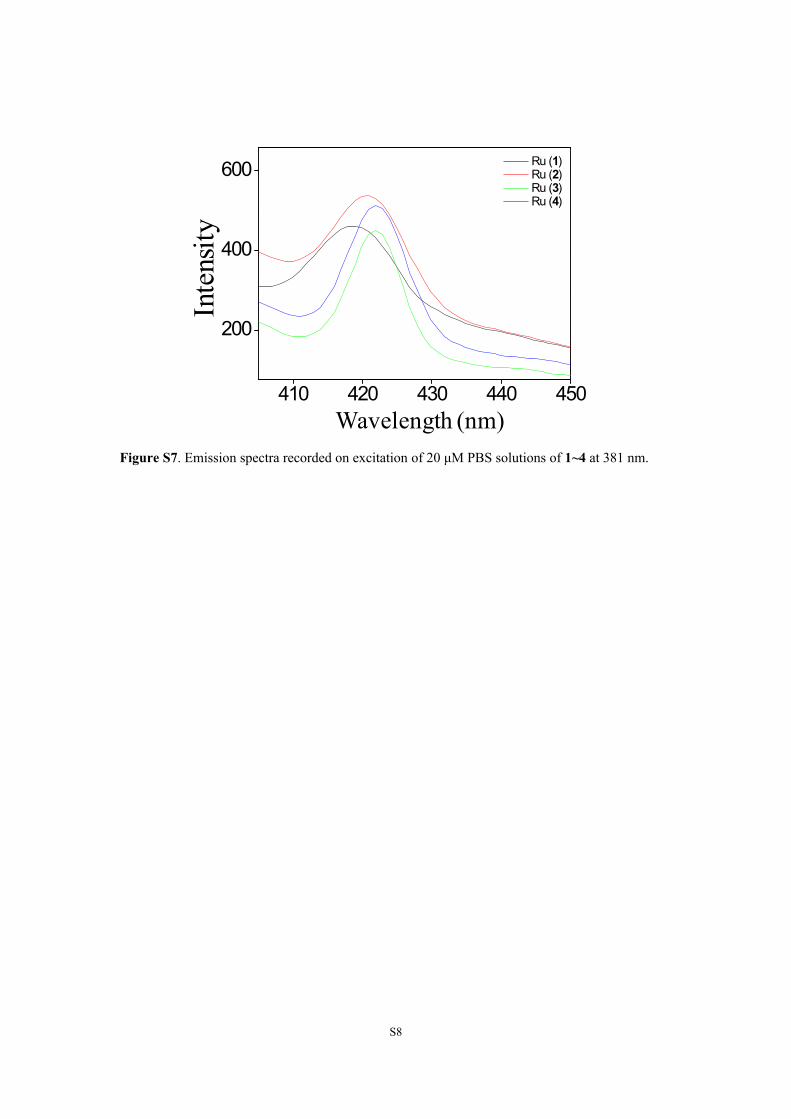
Wavelength (nm)Figure S7. Emission spectra recorded on excitation of 20 μM PBS solutions of 1~4 at 381 nm.
S9
300 400 500 600 700 800
0.2
0.4
0.6
0.8
0 1 2 3 4 50.00.20.40.60.81.0
Wavelength (nm)
(a-f
) / (
b-f
)
Abs
orba
nce
[DNA]/[1]10-2
300 400 500 600 7000.0
0.2
0.4
0.6
0 1 2 3 4 50.00.20.40.60.81.0
Wavelength (nm)
(a-f
) / (
b-f
)
Abs
orba
nce
[DNA]/[2]10-2
300 400 500 600 700
0.2
0.4
0.6
0.8
0 1 2 3 4 50.00.20.40.60.81.0
Wavelength (nm)
Abs
orba
nce
[DNA]/[3]10-2
(a-f
) / (
b-f
)
(a-f
) / (
b-f
)300 400 500 600 700
0.2
0.4
0.6
0.8
0 1 2 3 4 50.00.20.40.60.81.0
Wavelength (nm)
Abs
orba
nce
[DNA]/[4]10-2
A B
DC
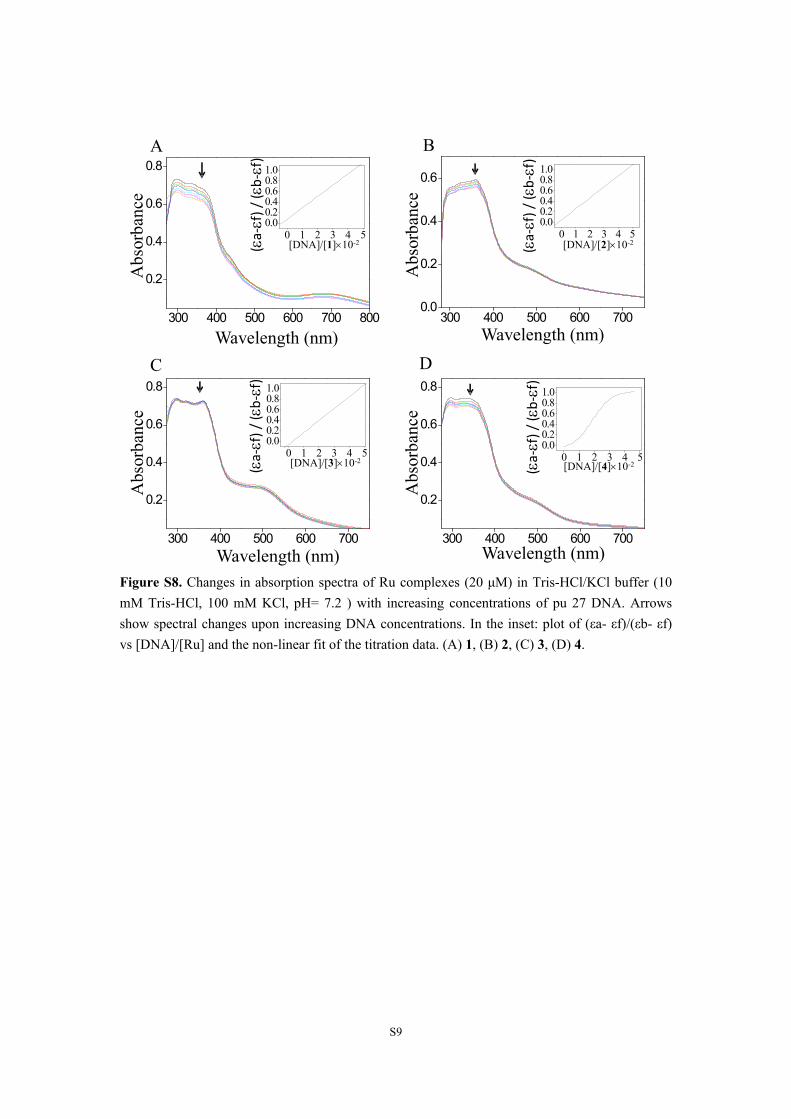
Figure S8. Changes in absorption spectra of Ru complexes (20 μM) in Tris-HCl/KCl buffer (10 mM Tris-HCl, 100 mM KCl, pH= 7.2 ) with increasing concentrations of pu 27 DNA. Arrows show spectral changes upon increasing DNA concentrations. In the inset: plot of (εa- εf)/(εb- εf) vs [DNA]/[Ru] and the non-linear fit of the titration data. (A) 1, (B) 2, (C) 3, (D) 4.
S10
0 1 2 31.0
1.2
1.4
1.6
410 420 430 440 450200
400
600
800
I/I 0
Inte
nsity
[DNA]/[1]10-2
Wavelength (nm)
0 1 2 31.0
1.1
1.2
1.3
410 420 430 440 450
200
400
600
I/I 0
Inte
nsity
[DNA]/[3]10-2
Wavelength (nm)
0 1 2 31.0
1.2
1.4
410 420 430 440 450200
400
600
800
I/I 0
Inte
nsity
[DNA]/[2]10-2
Wavelength (nm)
410 420 430 440 450200
400
600
800
1 2 31.0
1.2
1.4
I/I 0
[DNA]/[4]10-2In
tens
ity
Wavelength (nm)
A
C D
B
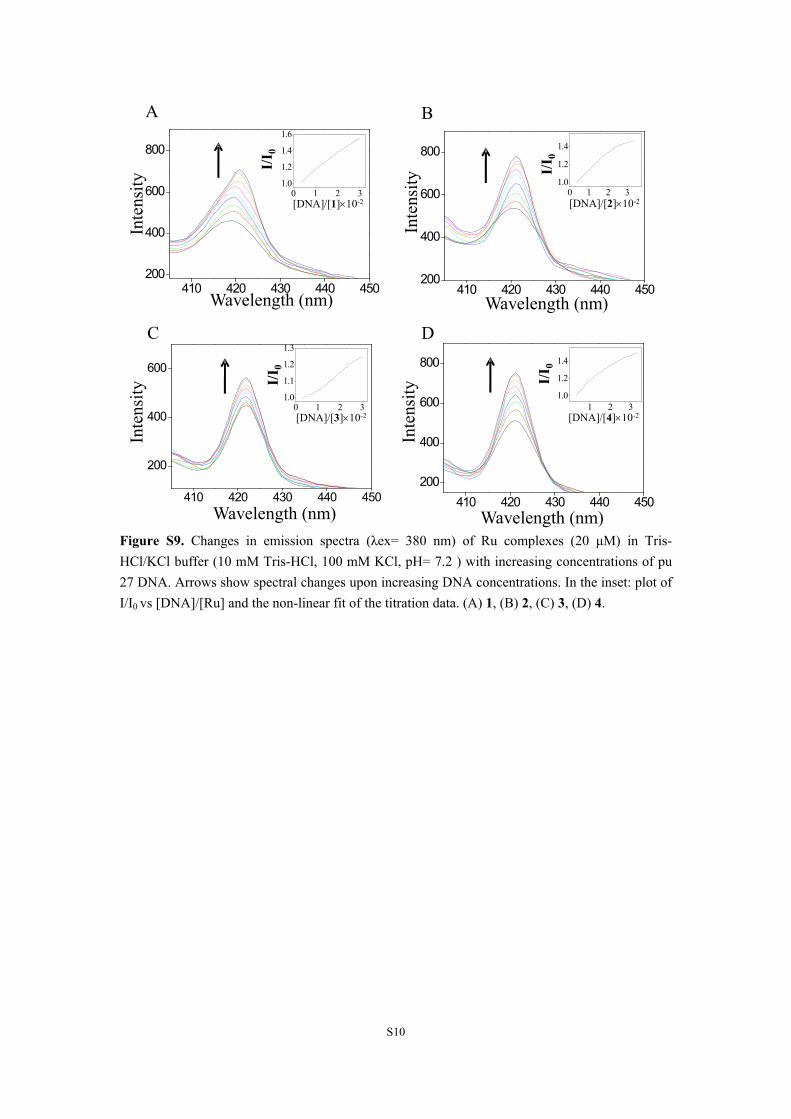
Figure S9. Changes in emission spectra (λex= 380 nm) of Ru complexes (20 μM) in Tris-HCl/KCl buffer (10 mM Tris-HCl, 100 mM KCl, pH= 7.2 ) with increasing concentrations of pu 27 DNA. Arrows show spectral changes upon increasing DNA concentrations. In the inset: plot of I/I0 vs [DNA]/[Ru] and the non-linear fit of the titration data. (A) 1, (B) 2, (C) 3, (D) 4.