Bachelor of Science in Public Administration - California State ...
Upload
khangminh22Category
view
0download
0
THE DEVELOPMENT AND USE OF AN
INTELLECTUAL CORRELATES SCALE
IN THE PREDICTION OF PRE-
MORBID INTELLIGENCE
IN ADULTS
By
DAVID EDWIN JOHNSEN I i
Bachelor of Science Oklahoma State University
Stillwater, Oklahoma 1976
Master of Science Oklahoma State University
Stillwater, Oklahoma 1978
Submitted to the Faculty of the Graduate College of the
Oklahoma State University in partial fulfillment of
the requirements for the Degree of
DOCTOR OF PHILOSOPHY December, 1987

\<\~'lb
.JLo s-sJ Q.o f· ;;J..
Dklalioma St t . .. ~ . ·-a e lJnivo Library
THE DEVELOPMENT AND USE OF AN
INTELLECTUAL CORRELATES SCALE
IN THE PREDICTION OF PRE-
MORBID INTELLIGENCE
IN ADULTS
Thesis Approved:
Dean of the Graduate College
iii
1312750

ACKNCMLEDGEMENTS
As much as I would like to individually recognize all
of the people who contributed to the successful completion
of this dissertation, the large number of people who helped
in some form or fashion precludes doing this. Therefore, I
would like to offer a general thank you to all who endured
through this process with me. However, there were certain
individuals without whom this research would not have been
completed and who deserve a special note of thanks.
I wish to acknowledge the immense contribution of Dr.
Robert Schlottmann. As chairman of my committee he offered
advice and never-ending support to an extent that few
chairman would. His willingness to give up his evenings and
weekends went well beyond normal expectations.
Additionally, the suggestions for improvements made by Dr.
Larry Brown, Dr. Kenneth Sandvold, and Dr. Barbara Wilkenson
were instrumental in enabling this project to be useful.
I also wish to thank Dr. Stephen Close and his wife
Nancy. Friendship in its finest form was demonstrated by
these individuals as they offered much more than continual
support. Dr. Close spent countless hours helping with
everything from data analysis to critiquing chapters to
listening to me bemoan my fate when unforeseen delays
occurred. Nancy's understanding of Steve's staying late
iv
after work and my middle of the night phone calls when the
computer was crashing is also appreciated.
Lastly, I want to express my sincere thanks to my wife
Kathy although words are not sufficient to convey my
appreciation. She has been a part of this goal from the
beginning and has shared the successes and frustrations
along with me. The sacrifices she made in both her personal
and professional life in order to allow me to continue my
graduate career and ultimately obtain my Ph.D. were
significant. They continue to be appreciated.
v
/
TABLE OF CONTENTS
Chapter Page
I. INTRODUCTION ••••••••••.••••.•••••••••••••••••••••.•• 1
II. REVIEW OF THE LITERATURE •••••••••••..•••..•......••• S
III. METHODOLOGY • .•••••••••••••••••••...•••••••••.•••••• 2 3
Subjects ........ · .............................. 23 Materials .•••.••••••••••.••..•.••.•••••••••••• 24 Procedure • .•••••••••••••..•••••••••••••••.•••• 2 6 Statistical Analysis ••••••.••••••.••••••••••.• 3 0
IV. RESULTS •••••••••••••••••••••••••••••••••••••••••.•• 33
Item Selection Phase •..••••••••••••••..•.••••• 33 Validation Phase .............................. 37
V. DISCUSSION ..•.••.••••••••••••••...•....•••••••••••. 46
REFERENCES • ••••••••••••••••••••••••••••••••••••••••••••••• 57
APPENDICES •••••.••••••••••••••••••••••••.••.•.•••••••••••• 65
APPENDIX A- CONSENT TO PARTICIPATE FORMS •••••••••• 65
APPENDIX B- BACKGROUND INFORMATION ••••••.••••••.•• 68
APPENDIX C - INSTRUCTIONS FOR COMPLETING THE INTELLECTUAL CORRELATES SCALE I TEl--1 POOL • ••••••••••• ~ •••••••••••••••• 71
APPENDIX D- INITIAL CONTACT LETTER .•.••••••••••••• 73
APPENDIX E - INTELLECTUAL CORRELATES SCALE QUESTIONNAIRE AND ANSWER SHEET •••••••• 75
APPENDIX F - INSTRUCTIONS FOR COt-1PLETING THE INTELLECTUAL CORRELATES SCALE QUESTIONNAIRE ••.•.•••••••••••••••••••• 8 0
APPENDIX G - VETERANS ~~MINISTRATION MEDICAL CENTER CONSENT TO PARTICIPATE FORM ••••• ~ •• ~ ••••••••••••••••••••••••• 8 2
vi

I
Chapter Page
APPENDIX H- ICS SCORING KEY ••••••••••.••••••••••.• 85
APPENDIX I - ANALYSIS OF VARIANCE Sm1MARY TABLE FOR THE VERBAL AND PERFORMANCE IQ .f\1EASURES •••••••••••••••••••••••••••••• 89
APPENDIX J - NEWMAN-KEULS PAIRWISE COMPARISONS FOR VERBAL AND PERFORMANCE IQ SCORES •••••••••••••••••••••••••••••••• 91
APPENDIX K - ANALYSIS OF VARIANCE SUMMARY TABLE FOR THE FULL SCALE IQ MEASURE • •••••••••••••••••••••••••••••• 9 9
APPEl\1DIX L - NEWMAN-KEULS PAIRWISE COMPARISONS FOR FULL SCALE IQ SCORES •••••.••••••• lOl
vii
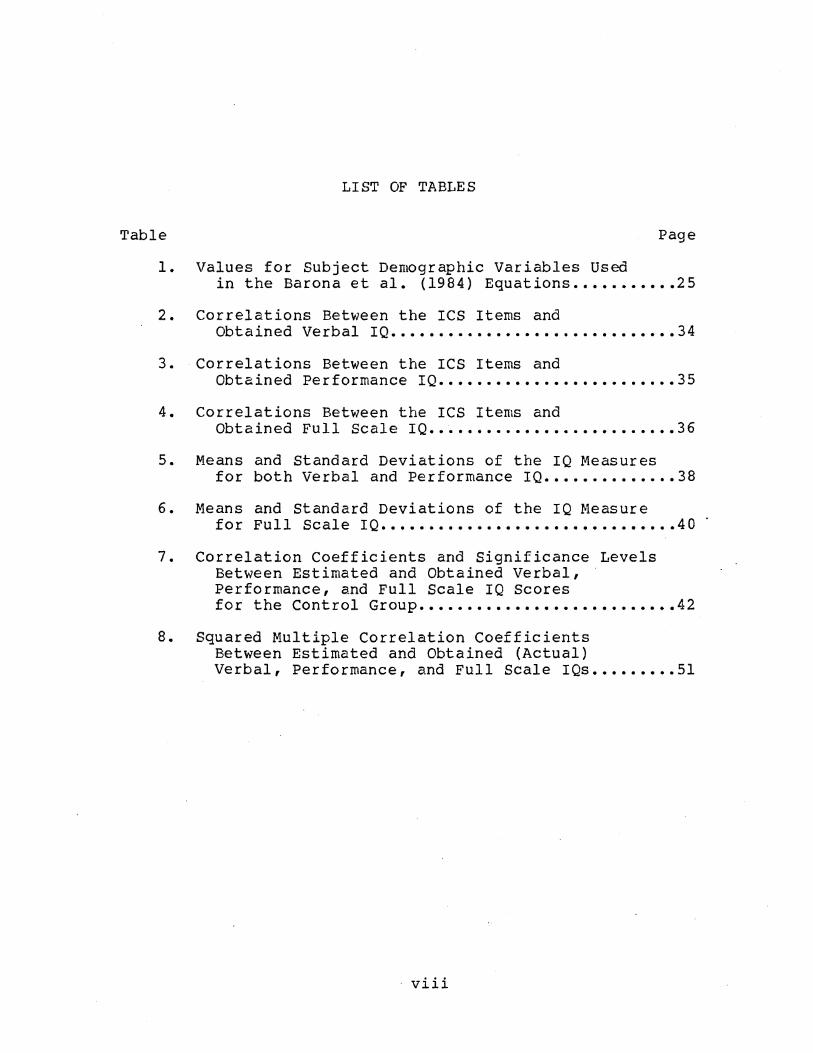
LIST OF TABLES
Table Page
1. Values for Subject Demographic Variables Used in the Barona et al. (1984) Equations ••.•.•••••• 25
2. Correlations Between the ICS Items and Obtained Verbal IQ •••••••••••••••••••••••••••••• 34
3. Correlations Between the ICS Items and Obtained Performance IQ ...••....•.•••.•••..•...• 35
4. Correlations Between the ICS Items and Obtained Full Scale IQ •..•.•...••...•.•••..•..•• 36
5. Means and Standard Deviations of the IQ Measures for both Verbal and Performance IQ •••••.••••.•.. 38
6. Means and standard Deviations of the IQ Measure for Full Scale IQ •••••.•••••••••••••••••.••••••• 40
7. Correlation Coefficients and Significance Levels Between Estimated and Obtained Verbal, Performance, and Full Scale IQ Scores for the Control Group •••••...•.•••••••••..•.•••• 42
8. Squared Multiple Correlation Coefficients Between Estimated and Obtained (Actual) Verbal, Performance, and Full Scale IQs ••••..••. 51
viii
CHAPTER I
INTRODUCTION
Accurately assessing the extent of intellectual
impairment, whether due to aging, cerebral trauma, or
disease, is a difficult task and yet is one that is facing
clinicians on an ever-increasing basis. Questions related
to intellectual impairment are corning from a broad spectrum
of our society. The tremendous increase in our elderly
population has spawned the specialty of geriatric psychology
and subsequently increased the need to determine the extent
of the impairment experienced by many of these people. such
knowledge is vital in their treatment planning as well as
rehabilitative programming for those of all ages who have
suffered damage through injury and/or disease. Similarly,
.our soc.iety~s.;.incr:ea's:ed ::fuc.us,: .on "liability and compensation
:·has·· .led: ::to;. a.:gi-:.eab inc,rease: ..in. ;t~ ·.ntiw.b:er':b:f . .!.it.,iga:tion
iss·ues in whtch·.the' px.imary,:qoesf:it)n; involved is
specifically the extent of impairment suffered by the
person.
While a comparison of test data obtained prior to and
following the specific trauma would indicate both the
presence of damage and extent of impairment, such pre-trauma
1
data are seldom available. As a result, clinicians are
often forced to estimate the individual's previous
(premorbid) intelligence from the subjective impressions of
the client, client's friends, and/or family. While often
helpful, these impressions may be based more upon emotion
than fact. In cases involving litigation, the client's
and/or relative's reports may be subject to conscious or
unconscious distortions. Similarly, the accuracy of the
.client's self reports is often questionable due to the
tendency of some individuals to react catastrophically and
subsequently exaggerate the nature of their deficits, while
others respond in the opposite fashion, denying their
deficits in the face of indisputable evidence (Lezak, 1976).
The variability of estimates of premorbid intelligence
based solely on interviews (Meehl, 1954) prompted a number
of attempts to develop objective measures of impairment. In
1944, David Wechsler introduced his Mental Deterioration
Index (MDI) in an effort to obtain such a measure (Wechsler,
1944). He had earlier noticed that mental abilities, as
measured by the Wechsler-Bellevue Intelligence Test,
deteriorated unevenly as a person aged. On some of the W-B
subtests older people performed much more poorly than did
younger ones, while on other subtests there was no
significant difference in performance. Using these
differential performance patterns as a basis for the MDI,
Wechsler devised a differential test-score method that he
purported gave him an accurate assessment of both current
2
and previous levels of intellectual functioning. These
current and previous levels were based on the individual's
performance on the "don't hold" and "hold" subtests,
respectively. Quite simply then, if the difference between
the two levels exceeded the normal level attained by the
individual's same-age peers, intellectual impairment was
indicated.
This selective deficit approach, in which it is
believed that performance on certain tasks, such as specific
Wechsler subtests, is more likely to be affected by brain
damage than performance on other tasks, was the basis for
several other impairment indicies (Hewson, 1949; Hunt, 1949;
McFie, 1975; Mahan, 1979; Reynell, 1944). The discrepancy
between tasks believed to be most and least affected is used
as a basis for measuring intellectual loss.
These objective indicies have not lived up to
expectations, however. Some of the objections to these
include questions surrounding the validity of the selective
deficit ~pproach (Russell, 1972; Swiercinsky & Warnock,
1977). Therefore, the purpose of this study was to develop
an alternative deterioration index based not on the
selective deficit model but rather on the use of personal
and vocational interests, attitudes, personal beliefs, and ~
personality traits from which to estimate premorbid
intelligence. An attempt was made to show that a group of
items, based on the aforementioned areas, that correlated
with intelligence could be found and used to develop a scale
3
that would accurately estimate current intellectual
functioning. Additionally, this research involved both a
validational study to assess the practicality of such an
index with actual brain-damaged subjects and a cross
validational evaluation of an existing method of estimating
premorbid intellectual functioning.
4
CHAPTER II
REVIEW OF THE LITERATURE
Although there had been considerable interest in
measuring intellectual impairment since the turn of the
century, it was 1930 before the first scientific attempt at
such a measurement was made (Babcock, 1930). On the basis
of her attempts to assess intellectual level and efficiency,
Babcock concluded that only vocabulary performance remained
relatively intact with respect to aging and possibly other·
cerebral dysfunction due to injury or disease.
David Wechsler first proposed the diagnostic use of
subtest scores in this area in 1944 (Wechsler, 1944). From
his observa.tions that intellectual abilities tended to
decline with age, he hypothesized that certain Wechsler
Bellevue subte.sts we.r .. e more .. r.e.si.stant t:O. the effects of
aginq·.Utan, :,we.r:e;.>other. ·subt.ests·,. - :.He 'also.·t:reli,eve;ct that there
was little psycholdg'-±c·al di·ffererrc'e'between normal mental
deterioration subsequent to aging and impairment resulting
from brain injury or disease "except as regards the rate at
which deterioration occurs, and in the case of traumatic
injury, as regards the number of mental functions involved"
(Wechsler, 1944, p. 54). Based on these hypotheses, he
5

divided the subtests up into two groups. The "hold" group
contained those subtests considered to hold up to the
effects of aging while the "don't hold" group contained
those that he felt did not. The tests believed to hold up
were Information, Comprehension, Object Assembly, and
Picture Completion. The "don't hold" group consisted of
Digit Symbol, Arithmetic, Digit Span, and Block Design. A
comparison of the performance on the "hold" versus the
"don't hold" tests on the MDI yielded a score which
indicated the extent of impairment. This score was
calculated_by subtracting the mean score of the "hold" tests
from the mean score of the "don't hold" tests, then dividing
that value by the mean score of the "hold" tests. This
ratio was thus reported as a percentage score.
Wechsler later expanded his idea of intellectual
impairment and revised the "hold" and "don't hold"
categories to reflect this change. In The Measurement and
Appraisal of Adult Intelligence (Wechsler, 1958}, Wechsler
replaced the Comprehension subtest with Vocabulary in the
"hold" category, wheras the Arithmetic subtest was replaced
by Similarities in the "don't hold" group.
Unfortunately, subsequent studies failed to provide
much support for the MDI (Allen, 1947, 1948; Anderson, 1951;
Bersoff, 1970; Cohen, 1952; Crookes, 1961; Fisher, 1962;
Gonen, 1970; Kleve & Reitan, 1959; Morrow & Mark, 1955,
Reitan, 1955, 1959; Rogers, 1950a; Vogt & Heaton, 1977;
Woo-sam, Zimmerman, & Rogal, 1971}. For example, Allen
6

(1947} evaluated the vulnerability of the Wechsler-Bellevue
Intelligence Scale subtests to brain damage by surveying the
test results of 50 patients, all of whom had suffered open
head injuries. Applying Wechsler's MDI formula resulted in
only 54% of the patients being identified as showing any
appreciable intellectual loss over that normally expected in
the patient's age group. Wechsler's recommendation was that
deterioration of 20% or greater over that normally expected
in the patient's age group was needed to indicate definite
deterioration. No loss was indicated in 28% of the cases
while only a slight indication of loss (less than 20%}
occurred in the remaining 18%. The Object Assembly subtest,
one of Wechsler's "hold" tests, was found to be the third
most highly affected subtest of the entire Wechsler-Bellevue
Intelligence Scale.
There were a number of other attempts to modify and/or
develop objective intellectual impairment indicies (Allen,
1948; Hewson, 1949; Hunt, 1949; Mahan, 1979; McFie, 1975;
Reynell, 1944}. Like Wechsler's MDI, these indicies were
based on the selective deficit model and, similarly,
received little support from subsequent research (Rogers,
1950b; McKeever & Gerstein, 1958; Fisher, 1962; Mahan, 1979;
Johnsen, Schlottmann, Kane, Bauer, & Quintana, 1985}.
Despite the high correlations between some of the
"least affected" tasks (e.g., Vocabulary) and IQ, their
insensitivity to brain damage is questionable. Russell
(1972} conducted a factor analysis of WAIS results of 113
7

subjects (87 brain-damaged,_ 26 controls) and found that
while the structure of the general verbal, performance, and
memory factors are not greatly changed, performance on all
of the WAIS subtests is affected by brain damage. T-tests
for the point biserial correlations between the WAIS
subtests and the criterion variable of brain damage were
significant at the .01 level with the exception of the
Similarities subtest which was significant at the .05 level.
With all subtests being affected, no support was found for
the "hold" versus "don't hold" concept. Similarly,
Swiercinsky and Warnock (1977) found that the Vocabulary
subtest of the WAIS, previously thought to be one of the
most resistant subtests to the effects of brain damage, was
a highly significant discriminator between brain-damaged and
normal subjects. If Vocabulary truly "held up" to the
effects of brain damage, no significant difference should
have been found between the two groups. Johnsen et al.
(1985) revealed that the Mahan (1979) method, which also
uses Vocabulary (and Picture Completion) to estimate
premorbid intelligence, was not clinically useful in
discriminating brain-damaged and normal individuals.
Estimated premorbid IQs were calculated on three brain
damaged groups (left-hemisphere damaged, right-hemisphere
damaged, and diffuse damaged) and a control group. While
statistically significant differences were obtained between
the different groups, this method failed to discriminate
brain-damaged from control patients any better than simply
8
comparing differences between WAIS Verbal IQs and
Performance IQs. Using a discriminant analysis procedure,
84% of the subjects (82% of the controls and 85% of the
brain damaged) were correctly classified when all four of
Mahan's residual scores were used as predictors. However,
the obtained Verbal and Performance IQs were also evaluated
as predictors. When used together, the two IQ scores
correctly classified 82% of the subjects (78% of the
controls and 85% of the brain damaged).
The impairment indicies have been, at best, only
marginally successful at providing cut-off scores for
indicating the presence or absence of brain damage but have
failed to establish an accurate premorbid level of
intellectual functioning. While technically, one could
consider Wechsler's MDI ratio in terms of percent loss and
extrapolate the premorbid IQ, this greatly increases the
chance for error. Lezak (1976) reflected current thinking
when she commented:
••• the first step in measuring intellectual
deficit ••• is to establish ••• the patient's pre
morbid performance level •. The shift in emphasis
from simply establishing the fact that there has
been deterioration or impairment toward the
establishment of a basic pre-morbid functioning
level may have surpassed the effectiveness of any
index of deterioration (p. 80).
9
Recent attempts to estimate premorbid intelligence have
utilized multiple regression and discriminant function
analysis. Leli and Filskov (1979} used two linear stepwise
discriminant functions in their attempt to measure
intellectual impairment. They devised two deterioration
measures: one based on the relationship between education
and Full Scale IQ and one based on the relationship between
occupation and Full Scale IQ. Their predictor variables
were these two deterioration measures (education - FSIQ and
occupation- FSIQ}, used alone and in combination with other
intelligence test scores. The first function, using Verbal
IQ, Performance IQ, Full Scale IQ, education, and the two
deterioration measures as predictor variables, yielded a 75%
correct classification rate (brain-damaged versus non-brain
damaged). The second function, using the two deterioration
measures alone as predictors, yielded an 83% correct
classification rate.
Wilson et al., (1978} developed multiple regression
equations to predict premorbid Verbal IQ, Performance IQ,
and Full Scale IQ, using an expanded set of predictor
variables (age, sex, race, occupation, and education).
Using the 1955 WAIS standardization sample (with the
exception of the Kansas City elderly subjects), Verbal,
Performance, and Full Scale IQs were regressed in a stepwise
fashion on these five demographic variables. With these
variables they accounted for 42% to 54% of the variance in
IQs. These results represented approximately a 10% increase
10
in explained IQ variance relative to the case when
educational level was the sole predictor variable. While
holding considerable promise, the clinical utility of these
equations is limited somewhat by the large standard errors
of estimate - 10.2, 11.4, and 10.2 for the Verbal,
Performance, and Full Scale IQs, respectively.
The accuracy of the Wilson et al. (1978) equations was
evaluated in five separate cross-validational studies.
Wilson, Rosenbaum, and Brown (1979) compared the performance
of 140 brain-damaged and 140 control patients with both the
Wilson et al. (1978) formulae and Wechsler's deterioration
quotient. They used a discriminant analysis procedure to
determine an optimum cut-off score from which patients were
classified as neurologically impaired or normal, based on
the difference between their predicted and obtained IQs.
Patients whose discrepancy scores fell below the cut-off
score were classified normal while those whose scores fell
above were considered impaired. The Wilson et al. (1978)
formulae correctly identified 72% of the patients while
Wechsler's deterioration quotient identified only 61%.
The second cross-validational study was completed by
Klesges, Sanchez, and Stanton (1981). They assessed the
relationship between the Wilson et al. (1978) formulae and
two clinically relevant, but neurologically unimpaired,
samples (60 psychiatric inpatients and 106 outpatients) •
The correlations between the actual and predicted Verbal,
Performance, and Full Scale IQs were .54, .36, and .50,
11
respectively, for the inpatient sample and .66, .56, and
.54, respectively, for the outpatient group. All of these
correlations were significant at greater than .001.
However, the equations were found to overpredict the actual
IQs in both inpatient and outpatient samples. Wilson et al.
(1978) foresaw this overprediction as a possible problem due
to the lower level of educational achievement obtained by
individuals in 1955 as compared to 1975. They recommended
multiplying the formulae's educational weights by .82 to
correct for this. Using this adjustment, Klesges et al.
(1981) found the formulae no longer overpredicted the IQs of
the outpatient sample, lessened the overprediction in the
inpatient sample, and reduced the number of
misclassifications. The fact t~at some overprediction of IQ
in the inpatient sample remained was not surprising since it
. is likely that a reduced intellectual efficiency results
from the presence of a mental disorder.
The initial optimism sparked by these cross
validational studies has been tempered somewhat by several
studies that have used "functional normals" as controls
(Bolter, Gouvier, Veneklasen, & Long, 1982; Gouvier, Bolter,
Veneklasen, & Long, 1983; Klesges, Fisher, Vasey, & Pheley,
1985). Rather than using non-psychiatric, non-brain-damaged
patients as controls as the initial studies did, these later
studies employed as controls individuals referred for
neuropsychological and/or neurological evaluation because of
suspected cerebral dysfunction but who were later diagnosed
12
as normal on the basis of their evaluation. The rationale
for using these individuals as control subjects was that
they are the ones the neuropsychologist is typically
required to accurately discriminate from actual brain
damaged persons.
Using both the unadjusted and adjusted Wilson et al.
(1978) formulae, Bolter et al. (1982) calculated predicted
FSIQs on two groups of head-injured patients (11 recovered
and 11 non-recovered) and their control group (n = 24).
Both recovered and non-recovered patients were evaluated
twice. The FSIQs of the "recovered" brain-damaged subjects
obtained during the second testing were used as the
premorbid intelligence levels for this brain-damaged group.
They found significant correlations between predicted
premorbid and obtained IQs, similar to those reported by
Klesges et al. (1981). Despite this, they recommended
against the use of the equations for estimating IQs with
individual head trauma cases, citing a lack of predictive
accuracy at the individual level with both the unadjusted
and adjusted versions. Only 45% of the brain-damaged
patients were correctly classified as opposed to 71% of the
normals, these classifications being based on the
interpretive guidelines of Klesges et al. (1981). By these
criteria, both recovered and non-recovered patients obtained
FSIQs during the first evaluation that fell outside of one
standard error of estimate. Correct classification of a
recovered patient occurred when the patient's estimated FSIQ
13
fell within one standard error of estimate of the obtained
FSIQ when tested the second time. For the non-recovered
patients at the second testing, placement hinged on the
estimated IQs falling outside one standard error, thereby
not showing the assumed improvement seen in the "recovered"
group. Estimated IQs for the control group were classified
by the same criterion that applied to the recovered group at
the second testing, although the controls were tested only
once. That is, the controls' estimated FSIQs were within
one standard error of estimate of their actual obtained
FSIQs. However, this discrepancy between estimated and
obtained IQs may be more a function of the criteria used to
establish the premorbid intelligence levels in the brain
damaged subjects than a function of the Wilson et al. (1978)
formulae. Problems in defining recovered from non-recovered
may have reduced the accuracy of the equations. Similarly,
with respect to the use of "functional normals" as control
subjects, a normal EEG and/or the absence of other
neurological test data identifying specific areas of
cerebral dysfunction does not always rule out the presence
of brain damage.
Recently, Barona, Reynolds, and Chastain (1984) copied
the methodology of the Wilson et al. (1978) study to devise
regression equations for predicting premorbid intelligence.
However, they used the 1981 WAIS-R (Wechsler, 1981)
standardization sample for their subject data. In addition
to the predictor variables of age, sex, race, occupation,
14

and education used by Wilson et al. (1978}, they added
urban-rural residence, geographic region of residence, and
handedness, although handedness was subsequently dropped
because of its negligible contribution to predictability.
Verbal, Performance, and Full Scale IQs were regressed in a
stepwise fashion on these seven variables resulting in
squared multiple correlations of .38, .24, and .36 for
Verbal IQ, Performance IQ, and Full Scale IQ, respectively.
Unfortunately, the same relatively large standard errors
that plague the Wilson et al. (1978} formulae are also
present in these equations (11.79, 13.23, and 12.14 for
Verbal IQ, Performance IQ,and Full Scale IQ, respectively.
Barona and Chastain (1986} attempted to improve the
accuracy of the Barona et al. (1984} equations by narrowing
their applicability. They deleted those WAIS-R
standardization subjects whose age fell between 16 and 19
years and/or who were a member of a race other than black or
white. Their reasoning was that the occupational
classification of the 16 to 19 year olds was based on the
occupation of the subjects' head of household since the
teenagers were not yet steadily employed in full-time
occupations. While this was sufficient for standardization
purposes, Barona and Chastain (1986} did not think it
accurately reflected the individual's actual occupational
status. The second deletion was based on the extremely
small number of "other" races in the standardazation sample.
Including them in the data analysis was meaningless due to
15
their small numbers. The result of these deletions were
slightly improved equations applicable to blacks and whites
between the ages of 20 and 74 years. The squared multiple
correlations for the Verbal, Performance, and Full Scale IQs
were .47, .28, and .43, respectively compared to .38, .24,
and .36 obtained with the original equations (Barona et al.
1984) •
Prior to the publication of the updated formulae
(Barona & Chastain, 1986), Eppinger, Craig, Adams, and
Parsons (1987) cross-validated the Barona et al. (1984)
equations and evaluated their accuracy in discriminating
between a group of 80 neurologically-normal but clinically
relevant criterion subjects and 83 brain-impaired subjects.
These neurologically-normal subjects were very similar to
the functional normals used by Bolter et al. (1982) and
Gouvier et al. (1983) in that they were individuals who had
been referred for neuropsychological evaluation but had
tested negative for brain damage (55%) or psychiatric
referrals (44%). Approximately 1% were referred for other
unspecified reasons. Their results generally supported the
estimation accuracy of the formulae within a neurologically
normal clinical sample although all three formulae
significantly overestimated IQ scores. In an attempt to
more accurately discriminate between the two groups Eppinger
et al. (1987) used a difference score (D-score) which was
the difference between the estimated and obtained IQs.
While this D-score provided a slightly higher rate of
16
correct classification, it was not at a greater than chance
level. Using obtained IQs, 71% of the subjects were
correctly classified, while 76% were correctly classified
with the D-score.
In a study closely patterned after that of Wilson et
al. (1978), Reynolds and Gutkin (1979) developed regression
equations designed to predict premorbid intellectual
functioning in children. Using the WISC-R standardization
sample (Wechsler, 1974) as their subject data, they
correlated the predictor variables of sex, race,
socioeconomic status, geographic region of residence, and
urban-rural residence with Verbal IQ, Performance IQ, and
Full Scale IQ. The results reported were statistically
significant (.44, .37, and .44, respectively), although
subsequent cross-validational studies (Klesges & Sanchez,
1981; Klesges, 1982) have failed to support them.
In the first cross-validational attempt, Klesges and
Sanchez (1981) found, in their sample of 76 controls and 23
neurologically-impaired children, that correlations between
actual and formula-predicted Verbal, Performance, and Full
Scale IQs were only .19, .13, and .18 for the controls, and
.18, .19, and .18 for the neurological group. Using the
Reynolds and Gutkin's (1979) difference score between actual
and predicted IQ that was necessary to infer intellectual
deterioration (a difference of at least one standard error
of estimate of the estimated IQ plus one standard error of
measurement of the obtained IQ), Klesges and Sanchez (1981)
17
obtained a classification with 65% false negative and 12%
false positive errors.
A second cross-validational study of the Reynolds and
Gutkin (1979) was conducted by Klesges (1982) in an attempt
to correct for the homogeneity of low socioeconomic status
and urban residents present in the Klesges and Sanchez
(1981) study. Klesges (1982) assessed whether the Reynolds
and Gutkin (1979) formulae predicted obtained WISC-R scores
in non-impaired patients, and to what extent the formulae
discriminated between neurologically-impaired and
neurologically-intact subjects. The correlations between
predicted and obtained IQs were .14, .13, and .14 for
Verbal, Performance, and Full Scale IQs, respectively, for
the 35 non-impaired subjects. Low correlations were also
obtained for the 26 neurological patients (.09, .04, and .07
for Verbal, Performance, and Full Scale IQ, respectively).
None of the three scales were found to discriminate between
neurologically-intact and impaired children.
In contrast to the moderate cross-validational support
for the Wilson et al. (1978) and Barona et al. (1984) adult
regression formulas, it is apparent that_there is little
support for the use of regression equations with children.
This is not particularly surprising given that the IQs of
children tend to be much more unstable due to maturational,
educational, and developmental influences (Reitan & Davison,
1974: Sattler, 1974).
18
It is evident that the recent shift from the selective
deficit approach to the use of demographic data as the basis
for estimating premorbid intellectual levels in adults has
yielded encouraging results, especially when a broad range
of variables is used to estimate premorbid functioning.
Review of the literature on correlates of intelligence
indicates that there is a possibility of estimating IQ from
a wide variety of sources. Acknowledging that
biographical/demographical data correlate well with
intelligence, Matarazzo (1972) reports that the level of
educational achievement and the independently judged
prestige of one's occupation represent intelligence
correlates of .50 or greater. Further expanding this
concept, Lezak (1976) states:
It is also assumed that a patient's premorbid
ability level can be reconstructed or estimated
from many different kinds of behavioral
observations or historical facts. Estimates of
original intellectual potential may be based on
interview impressions, reports from family and
friends, test scores, prior academic or employment
level, school grades, army rating, or an
intellectual product such as a letter or an
invention (p. 76).
Personality factors have also been found to correlate
with intelligence. Graham (1977, p. 18-102) indicated that
there were significant correlations between certain MMPI
19
subscales and intelligence. He indicated that the L scale,
scale 1 (Hypochondriasis), and the Prejudice research scale
correlated negatively with intelligence while scales 3
(Hysteria) and 5 (Masculinity-Femininity) correlated
positively. Megargee (1972, p. 74-81) indicated that the
Achievement Potential scales (Achievement via .conformance
Ac, Achievement via independence-Ai) and the Intellectual
Efficiency scale (Ie) of the California Psychological
Inventory correlated significantly with IQ.
Since education and occupation are highly correlated
with intelligence, it may be that a person's attitudes, and
interests in a particular occupation may also correlate
with intelligence. This assumption is, in part, used in the
Strong-Campbell Interest Inventory, a vocational interest
test that compares the self-reported interests of the
subject with the common interests of individuals working in
various fields. Gentry (1972) attempted to determine the
feasibility of using such items to predict intelligence. He
used general and vocational interests, along with attitudes
and biographical data to develop a 33-item, true-false scale
that correlated with intelligence as measured by the
Shipley-Hartford Institute for Living Scale (Shipley &
Burlingame, 1939). He then used this total scale score as
the predictor variable in a regression equation to predict
the estimated WAIS scores of normal college students. The
results of the Gentry (1972) feasibility study were quite
positive despite some methodological difficulties that
20
limited the scope of the study. For example, the Shipley
Hartford Institute for Living Scale is a largely verbal test
that can be quickly administered to large groups. As such,
it is most often used for general screening purposes rather
than accurate intellectual assessment. The subjects' WAIS
IQs were also only estimates, based on a partial
administration of the WAIS (Arithmetic, Vocabuiary, Block
Design, and Picture Arrangement} and the conversion of
Shipley scores to WAIS IQ equivalents (Bartz & Loy, 1970}.
Additionally, the exclusive use of college students implies
there was a restricted range of ability, although even with
the restricted range, the correlation with IQ during cross
validation was .69. Despite these problems, the results
indicate that the use of such a scale holds considerable
promise for estimating prernorbid IQ.
The present study proposed to follow the same basic
ide~ in an effort to develop such a tool. However, rather
than using college students, a more repres~ntative sample of
individuals was used to develop the Intellectual Correlates
scale (ICS). The res was also cross-validated on persons
having suffered some form of brain injury as well as a
matched group of control subjects. Additionally, the
Wechsler Adult Intelligence Scale-Revised (WAIS-R) was used
to measure intellectual functioning in place of the Shipley
Hartford.
This study involved two separate phases. The first
phase involved using personal and vocational interest
21
information, attitudes, beliefs, and personality trait
information to establish a reliable scale of items that
correlate with intelligence. A major assumption of this
study is that this information is believed to be less
affected by brain damage, at least initially, than are IQ
scores. If this assumption holds true, it could reasonably
be expected that such information could be used to predict
intelligence and that such a scale could serve as a measure
of intelligence against which current test data could be
compared. Using the scores in regression equations designed
to predict Verbal, Performance, and Full Scale IQs could
provide information as to the presence and extent of
intellectual loss.
The second phase was a validational effort to determine
the efficacy and accuracy of the regression equations when
dealing with individuals who have suffered brain damage.
These equations, if effective, would fairly accurately
predict the actual IQs of the control group but would
overestimate the obtained IQs of the brain-damaged groups.
Also during this phase, the IQ estimates generated by the
Barona et al. (1984) equations were cross-validated on the
same group of subjects and compared to the results of the
ICS equations.
CHAPTER III
METHOD
Subjects
During the item selection phase of this study, the
subjects were 33 adults between the ages of 18 and 60 who
had no reported history of organic disease or dysfunction.
This initial group was fairly evenly divided with respect to
sex (16 males, 17 females) and included 12, 11, and 10
subjects in each of three age brackets (18-29, 30-44, 45-
60), respectively. Mean educational levels for each of the
three groups were 14.8, 16.1, and 13.2 years, respectively.
The subjects were volunteers obtained through either
professional or personal contact with the researcher or
contact with acquaintances of the researcher.
The validation phas.e .. involved an additional 64 subjects (33
brain~damaged, 3V~:c,ontLoJ.s);.. '.The. brain-l"damaged ... g.roup
consisted Of ·s iridiv±duals-.who .had .suf·fered confirmed
lateralized damage in the left cerebral hemisphere, 14
individuals with confirmed lateralized damage in the right
cerebral hemisphere, and 14 individuals with diffuse, or
bilateral damage to the brain. The diagnoses of brain
damage was based on available medical or
23
neurological/neurosurgical records. Neuropsychological test
data were not used in classifying subjects. A breakdown of
the number of subjects in the various categories of brain
damage revealed that 61% were cerebral vascular accidents,
36% were closed-head injuries, and 3% were degenerative
neurological diseases. The control group consisted of
individuals who had no reported history of brain damage or
mental disorder. These subjects were matched with the
brain-damaged subjects on the variables of age and number of
years of education. The mean age of the brain-damaged
subjects was 47.61, SD = 18.93, while the mean age of the
control subjects was 45.97, SD = 17.74. The mean
educational levels for the two groups were 12.67, SD = 2.61
and 13.81, SD = 2.94, respectively. No statistically
significant differences between the two groups were found
for either age, t (62) = .36, or education, t (62) = -1.64.
Table 1 shows the results of group comparisons on the
additional Barona et al. (1984) variables of se~, race,
occupation, region, and residence along with the coded
values fer each of these categories used in the Barona et
al. (1984} analysis.
~~ials
The Wechsler Adult Intelligence Scale-Revised
{Wechsler, 1981) was used to measure intellectual
functioning. This test is designed to comprehensively
assess an individual's intellectual aptitude relevant to the
culture of the United States. It is widely used and is
24

TABLE 1
VALI.lEQ_F Q~- S'QJ)..Ji;.{:j'_J)..EJ1_0_G..RAPJ:I.J.C_.JLAJiLAJ3_L__E_S.._U_SJ~p __ l~ _';r_{J~ _ 13~RO.Na
ET AL~.-11.9 8~1._EQU8~lQN.S
BD Control
Demographic Variable Code* n % n %
Sex:
Female 2 16 48 21 68 l-1ale 1 17 52 10 32
Race:
White 3 30 91 30 97 Other 2 1 3 0 0 Black 1 2 6 1 3
Occupation:
Professional/Technical Managerial/Official 6 6 18 8 25 Clerical/Sales 5 5 15 9 29 Skilled Labor 4 1 3 3 10 Not in Labor Force 3 9 27 8 26 Semiskilled Labor 2 11 33 3 10 Unskilled Labor 1 1 3 0 0
Region:
Northeast 4 0 0 5 16 western 3 2 6 2 6 North Central 2 2 6 3 10 Bo.uthern 1 29 88 21 68
Re-s ±.ae:nc,e .: ...
Urban (> 2·~5'00) ._2 30 91 30 97 Rural (< 2,500) 1 3 9 1 3
--------·------------------------------·-----------·-----* The code number is the value assigned to the predictor variable in Barona et al. (1984).
25
often the one to which other intelligence tests are
compared. Its validity and reliability have made it one of
the most widely accepted of the intelligence tests. The
Verbal scale is made up of six individual subtests
{Information, Digit Span, Vocabulary, Arithmetic,
Comprehension, and Similarities) whereas the Performance
scale consists of five additional subtests (Picture
Completion, Picture Arrangement, Block Design, Object
Assembly, and Digit Symbol). These subtests are used to
obtain a Verbal IQ, Performance IQ, and (combined) Full
Scale IQ.
The item pool from which the Intellectual Correlates
Scale (ICS) was derived consists of 167 items reflecting
personal and vocational interests, attitudes, beliefs, and
personality traits. The items were taken primarily from the
item pool used by Gentry (1972) although 13 of them were
modified to improve readiblity.
Procedu..r..§.
For the item selection phase, all subjects who had been
contacted by telephone or in person were told that the
purpose of the study was to develop a procedure to more
accurately assess the abilities of persons having suffered
head injuries, brain trauma, or brain disease. By finding
items that have a relationship to verbal and/or non-verbal
abilities, the individual's thinking and reasoning abilities
may be more accurately estimated, thereby aiding in their
treatment. The subjects were informed that the time
26

requirement was approximately two hours and that anonymity
was guaranteed. Upon their agreement, a time and place was
scheduled for the testing to take place. Immediately prior
to the test administration, the researcher again explained
the purpose of the study and asked each subject to read and
sign a consent form agreeing to the terms of participation
(Appendix A-I) as well as complete the Background
Information Sheet (Appendix B). Before taking the ICS item
pool, each subject was asked to read the instructions
printed on the res booklet cover page (Appendix C) while the
researcher read the instructions aloud. One half of the
subjects were administered the res item pool first, then the
WAIS-R, while the other half were administered the tests in
the reverse order, thereby eliminating order of presentation
effects.
Following the collection and analyses of the data to
select items that correlated {R <.10) with Verbal IQ,
Performance IQ, and Full Scale IQ, the additio~al 64
subjects (33 brain-damaged and 31 controls) were contacted
in order to initiate the second phase of the study which was
the validational portion.
In this validational phase of the study, subjects were
obtained through contact with the neurology and
rehabilitation units of various local hospitals,
professional referral, friendship pyramiding, or personal
contact with the researcher. In regard to the various local
hospitals, a request to conduct this research was made to
27
the respective research committees. After obtaining the
necessary clearances, patients on the neurology and
rehabilitation units who fit the research criteria were
asked by their attending psychologist or physician if they
would participate in the study. The research criteria were
that the patient had suffered documented cerebral damage and
were testable. That is, patients who were experiencing
severe aphasias (expressive or receptive) and were therefore
unable to communicate in even a rudimentary fashion, were
not included in the sample. It is unknown how many patients
were excluded by this process but it is likely to have
contributed to the smaller number of left-hemisphere damaged
patients in the brain-damaged group. Upon the patients'
verbal agreement, the researcher contacted them personally.
Professional people (psychologists, physicians,
rehabilitative therapists, etc.) having 'contact with
individuals who had experienced some form of brain injury
were asked to obtain permission for participati.on from those
individuals who met the research criteria. Upon obtaining
this permission, the researcher sent the individuals a
letter (Appendix D) briefly explaining the purpose of the
study and notifying them that the researcher would be
contacting them by telephone in a few days. They were then
contacted by telephone in order to make the necessary
arrangements concerning the time and place for the testing.
The third procedure for obtaining subjects involved
asking individuals known to the researcher if they knew of
28
anyone who had experienced some type of organic damage and
was willing to participate in the study. This same question
was also posed to each participant. Any individual referred
through this process was contacted via the aforementioned
procedure to obtain their consent to participate. These
brain-damaged individuals also signed a consent to
participate form that contained a clause giving the
researcher permission to contact their physicians. In this
way pertinent medical records allowing for the documentation
of cerebral damage were obtained. Individuals meeting the
research criteria who were known personally by the
researcher were also contacted for possible participation.
All persons contacted were informed that their participation
was strictly voluntary and that no financial compensation
would be paid for taking part in the study.
All subjects were tested using the 'WAIS-R and a new
version of ICS composed of those items retained from the
original item pool (Appendix E). The testing f.ollowed the
same basic format as that previously outlined, although a
slightly different set of instructions reflecting the
changes in the ICS was presented to the subjects (Appendix
F). In three cases, where the brain damage had resulted in
a moderate to severe aphasia, rendering the individual
unable to read, the ICS was read to the subjects by the
researcher. Where possible, the family members of the
brain-damaged subjects served as the control subjects of the
study (N = 4). Additionally, some of the brain-injured
29
subjects were asked to sign a slightly different consent
form containing an added stipulation allowing the researcher
to contact their physician in order to obtain relevant
medical records (Appendix A-II). Those subjects who were
patients at one of the hospitals located in the southwestern
United States also signed another separate consent form that
was in compliance with the hospital's standard format for
such documents (Appendix G).
In the initial phase of the study, which was for the
purpose of item selection, the items on the res item pool
were correlated with the WAIS-R Verbal, Performance, and
Full Scale IQ scores by using a Pearson Product-Moment
correlation. Those items that correlated significantly (R <
.10) with one or more of the three WAIS~R IQ scores were
retained for use in the final version of the res.
Three scales, one each for VIQ, PIQ, and ~.SIQ, were
developed by correlating res scores with subjects' Verbal,
Performance, and Full Scale IQ scores. For those items that
correlated positively, subjects in. the item selection phase ....
were given a score that corresponded to their a.nswers ·(e.g.
1-Strongly Agree, 2-Agree, 3-Disagree, 4-Strongly Disagree).
For those items that correlated negatively, the item score
was subtracted from five in order to maintain the same
numerical relationship with the positive correlation item
scores. These scores were then summed, providing each item
30
selection phase subject with a Verbal IQ res score (VIeS), a
Performance IQ res score (PieS), and a Full Scale IQ res
score (FSieS). Regression equations were developed for each
of the three IQ scales using their respective res scores.
These equations were then used to compute an res-estimated
VIQ, PIQ, and FSIQ (Appendix H).
The validational phase of the study involved the
administration of the WAIS-R along with the retained items
from the ICS item pool for the additional 64 subjects.
Since the accuracy of the estimation methods (regression
coefficients) was reflected in how well they predicted the
obtained IQ scores of this control group, most of the
statistical analyses in the study involved this group alone.
Along with the obtained IQs derived directly from the WAIS
R, two additional sets of IQ scores were calculated for each
subject. Verbal, Performance, and Full 'Scale IQ scores were
estimated from the res equations (ICS VIQ, res PIQ, res
FSIQ) and from the Barona equations (BAR VIQ, BAR PIQ, BAR
FSIQ}.
In acdition to cross-validating the Barona equations,
the accuracy of the res- and Barona-based estimates in
predicting the obtained (actual) IQ scores of the control
subjects was compared. Even though the brain-damaged and
control subjects were closely matched on the variables of
age and education, a preliminary analysis assessing the need
for an analysis of covariance (ANAeOVA) was conducted. The
ANAeOVA was not indicated and the subsequent statistical
31
comparisons were made using an analysis of variance (ANOVA)
procedure.
Mean score differences for both brain-damaged and
control subjects were analyzed using a 2x3x2 ANOVA. The
independent variables were impairment status (brain-damaged
or control), rQ measure (obtained, res, or Barona), and rQ
dimension (Verbal or Performance score). Post hoc analyses
utilized the Newman-Keuls tests. Using the same measures as
mentioned for vrQ and PIQ, the FSIQs were analysed with a
2x3 ANOVA. The Newman-Keuls post hoc procedures were also
used in this analysis.
Appraisal of the predictive value of the res and Barona
scales individually was included, as well as the predictive
value of these two scales in combination. To determine the
relative contribution of these scales in predicting the
obtained IQs, multiple and semi-partial 'correlations were
calculated.
32
CHAPTER IV
RESULTS
Item Selection Phase
The number of items that significantly correlated with
VIQ, PIQ, and/or FSIQ were 28, 27, and 27, respectively.
Due to items correlating with more than one IQ measure, the
res consisted of 45 items. An additional 26 items that were
closely correlated but not significant (£ > .10 < .20) were
also included on the final version of the res for future
research purposes but were not scored in the present study.
Those items that correlated positively were items 2, 7, 8,
11, 19, 23, 24, 26, 33, 41, 43, 48, 49, 52, 57, 58, 62, 64,
67, 68, 69, and 70. Those items that correlated negatively
were items 1, 3, 4, 5, 6, 10, 12, 13, 15, 16, 27, 29, 31,
36, 40, 42, 44, 46, 53, 56, 60, 65, and 71.
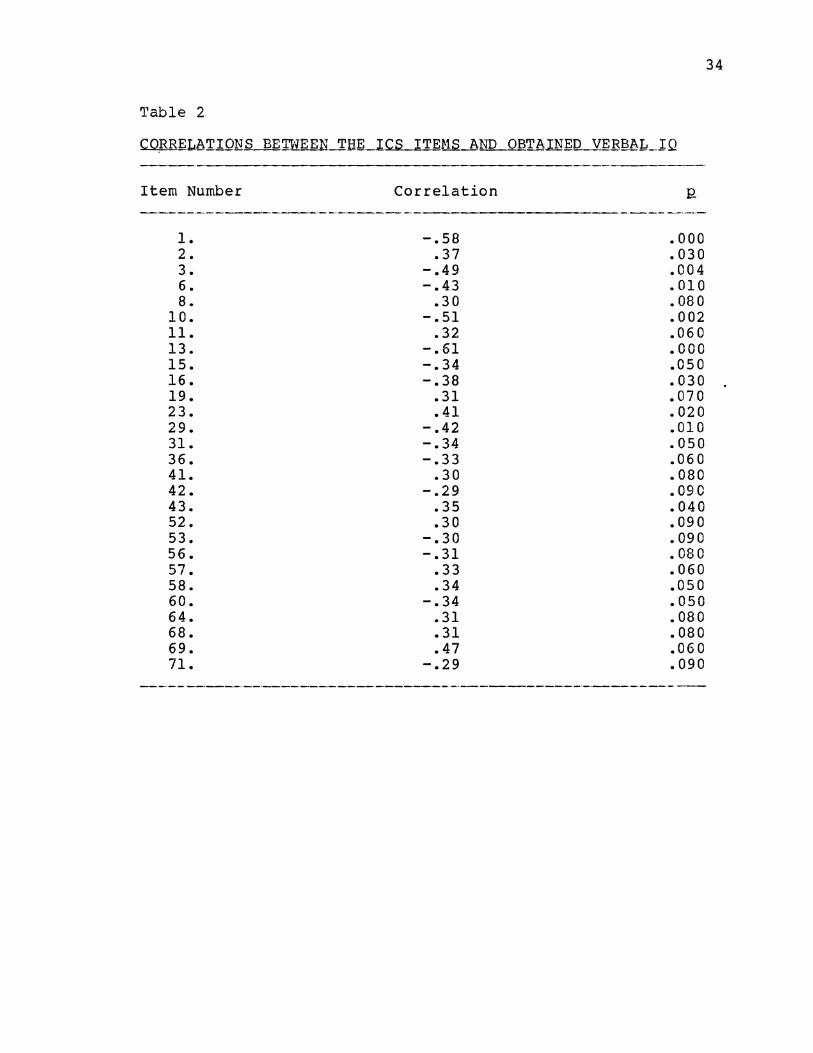
·· ··· . Tlae GVoe~r:all ;'>co-rrel'ati·o:as betwee:n·.·vrcs .and VIQ, PICS and
PIQ, FSICS and ·psiQ were .86, .84, and .87, respectively, (Q.
< .01). The individual item correlations for VIQ, PIQ, and
FSIQ are presented respectively in Tables 2, 3, and 4. The
regression equations (criterion = x independent variable
plus y-intercept) from which the res-estimated IQs were
33
'l'able 2
CORRELATIONS BE'IWEEN THE __ .l.c..s.J~EN.S AND OBTAl.N~lL VERBAL_JQ
---------Item Number
1. 2. 3. 6. 8.
10. 11. 13. 15. 16. 19. 23. 29. 31. 36. 41. 42. 43. 52. 53. 56. 57. 58. 60. 64. 68. 69. 71.
Correlation
-.58 .37
-.49 -.43
.30 -.51
.32 -.61 -.34 -.38
.31
.41 -.42 -.34 -.33
.30 -.29
.35
.30 -.30 -.31
.33
.34 -.34
.31
.31
.47 -.29
.000
.030
.004
.010 • 08 0 .002 • 06 0 .000 .050 .030 .070 .020 .010 .050 .060 .080 .090 .040 .090 .090 • 08 0 .060 .050 .050 .080 .080 • 06 0 .090
34
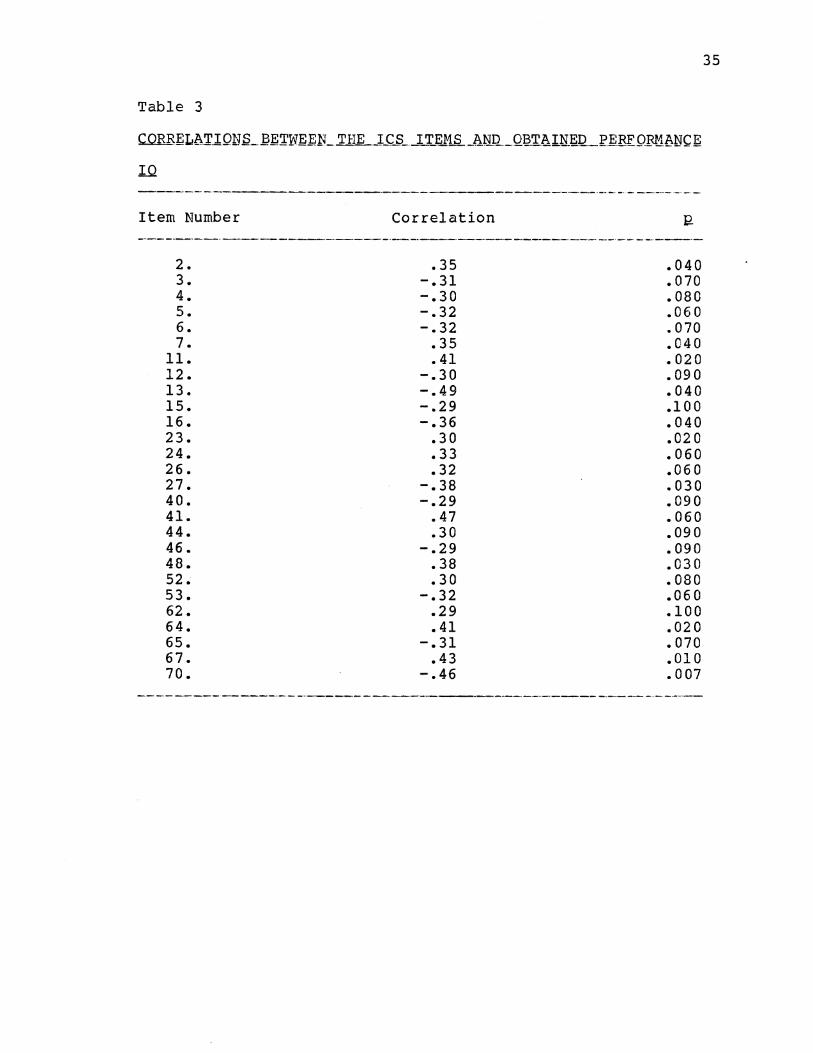
Table 3
Item Number
2. 3. 4. 5. 6. 7.
ll. 12. 13. 15. 16. 23. 24. 26. 27. 40. 41. 44. 46. 48. 52.-53. 62. 64. 65. 67. 70.
Correlation
.35 -.31 -.30 -.32 -.32
.35
.41 -.30 -.49 -.29 -.36
.30
.33
.32 -.38 -.29
.47
.30 -.29
.38
.30 -.32
.29
.41 -.31
.43 -.46
.040
.070
.080
.060
.070
.040
.020
. 09 0
.040
.1 0 0
.040
.02 0
.060
.06 0
.030
.090
.060 • 09 0 .090 .030 .080 .060 .100 .020 .070 .010 .007
35

Table 4
IQ
Item Number
1. 2. 3. 5. 6. 7.
10. 11. 13. 15. 16. 23. 24. 29. 33. 41. 43. 48. 49. 52. 53. 57. 64. 67. 68. 69. 70.
--·----------~
Correlation
-.42 .39
-.45 -.32 -.42
.33 -.41
.41 -.64 -.35 -.40
.38
.33 -.32
.33
.45 -.33
.32
.29
.32 -.35
.34
.40
.37
.32
.30
.35
J;?
.020
.020
.008
.070
. 010
.060 • 02 0 .020 .000 .050 .020 .030 .060 .070 .06 0 .009 .06 0 .070 .090 .060 .05 0 .050 • 02 0 .030 .070 .090 .040
36
obtained produced the following: res VIQ = .95 x vres
+46.42, res PIQ = 1.36 x PieS + 12.96, and res FSIQ = 1.18 x
FSieS + 30.42.
validation Pha~~
Group means and standard deviations for estimated (by
regression equation) and obtained (actual WAIS-R results)
Verbal and Performance IQ scores are presented in Table 5.
A 2x3x2 ANOVA (impairment status x IQ measure x IQ
dimension) procedure was used without a demographic
covariant with scores as the dependent variable. A
significant three-way interaction was obtained between
impairment status (brain-damaged versus control), IQ measure
(Ies versus Barona versus obtained) and IQ dimension (Verbal
versus Performance},~ (2, 124} = 10.45, R < .0001 (Appendix
I). Pairwise comparisons using the Newman-Keuls procedure
revealed that the brain-damaged group's obtained Verbal and
Performance IQ scores were significantly lower }han their
estimated Verbal and Performance IQ scores (Appendix J-1,
J-2). In contrast, the control group's obtained Verbal and
Performance IQ scores did not differ significantly from
their estimated Verbal and Performance IQ scores (Appendix
J-3, J-4). Additionally, the res-estimated Verbal and
Performance IQ scores of the control group were
statistically equal to the res-estimated Verbal and
Performance IQ scores of the brain-damaged group (Appendix
J-5). Likewise, the control and brain-damaged groups did
37
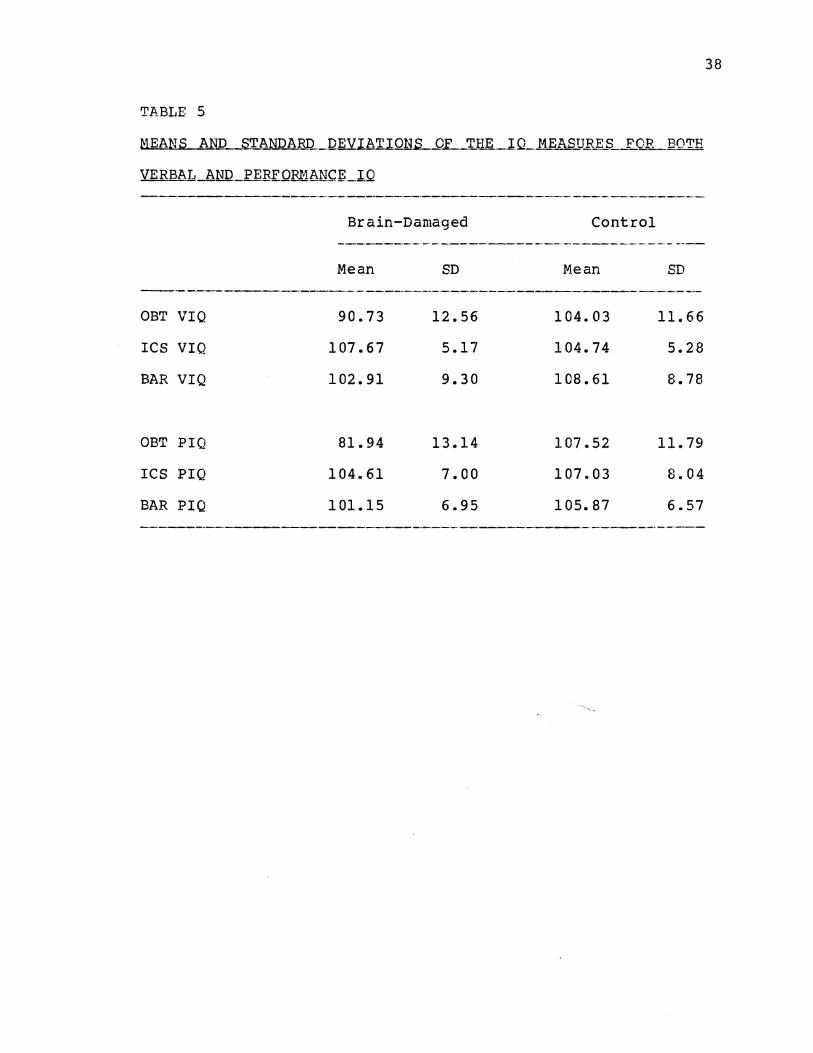
TABLE 5
NEANS AND STANDARD. DEVIATIONS OL...T_Illi.._IQ_ MEASU~.,S _ _f_('~_,_BOTH
VERBAL AND PERFOFJ.1~NCf!_lQ
OBT VIQ
ICS VIQ
BAR VIQ
OBT PIQ
ICS PIQ
BAR PIQ
Brain-Damaged
Mean
90.73
107.67
102.91
81.94
104.61
101.15
SD
12.56
5.17
9.30
13.14
7.00
6.95
Control
Mean
104.03
104.74
108.61
107.52
107.03
105.87
SD
11.66
5.28
8.78
11.79
8.04
6.57
------------·----·-------·--------· ·---·---·--·--
38
not differ significantly on the Barona-estimated Performance
rQ scores. However, the Barona-estimated Verbal rQ scores
for the brain-damaged group were significantly lower than
the Barona-estimated Verbal rQ scores for the control group
(Appendix J-6). Comparing the res and Barona estimation
methods, the res-estimated Verbal and Performance rQs were
not statistically different from the Barona-estimated Verbal
and Performance rQs (Appendix J-2, J-3, J-4).
The Full Scale rQs were evaluated in a separate
analysis. Group means and standard deviations for the
estimated and obtained FSrQs are presented in Table 6. A
2x3 ANOVA (impairment status x rQ measure) also resulted in
a significant interaction between impairment status (brain
damaged versus control), and rQ measure (res versus Barona
versus obtained), E. (2, 124) = 37.82, :12. < .0001 (Appendix
K). Pairwise comparisons using the Newman-Keuls procedure
revealed results similar to those found in the Verbal and
Performance rQ analysis. The brain-damaged gro.up' s obtained
Full Scale rQ scores were significantly lower than their
estimated Full Scale rQ scores (Appendix L-1). Likewise,
no significant differences were found between the obtained
and estimated Full Scale rQ scores for the control group
(Appendix L-2). Also, the control group's estimated Full
Scale rQ scores were statistically equal to the brain
damaged group's estimated Full Scale rQ scores (Appendix L-
3, L-4). Additionally, the res-estimated Full Scale !Qs
39

TABLE 6
f:1EAN1L _hND __ S.':!;'.8~Ql1_RD DEVI AT I Oflli _ _Q..E_':r_HE __ IQ_l-1_1:1\S_U_B..E_S_.LQR _f!.l1L.
SCALlL.IQ
Brain-Damaged Control --·---------·------.. ---·-·------------
l•iean SD r·1ean SD
OBT FS!Q 86.24 10.83 105.83 11.90
res FSIQ 105.88 5.76 106.00 7.15
BAR FSIQ 101.97 8.94 107.74 8.40
40
were not statistically different from the Barona-estimated
Full Scale IQs (Appendix L-2).
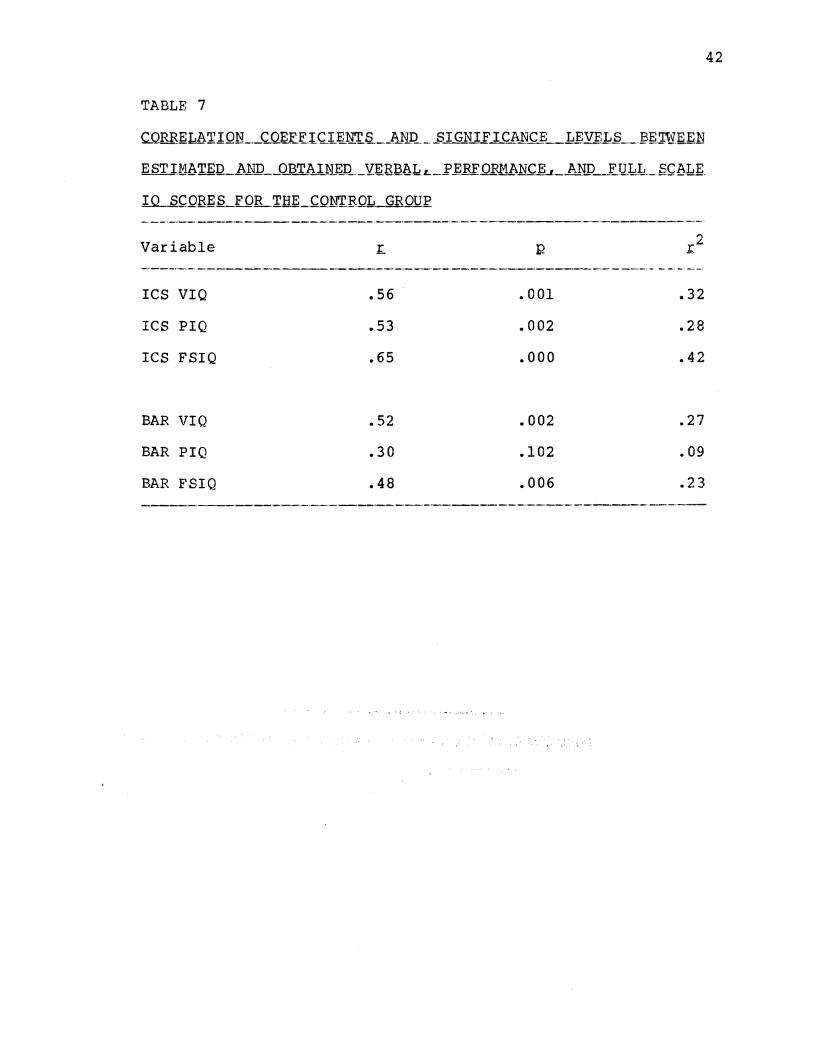
One of the major issues of the second phase of this
study was the relationship between each of the IQ estimation
methods (res and Barona) and obtained IQ scores for the
control group. Both res- and Barona-estimated IQ scores
were correlated with the respective obtained VIQ, PIQ, and
FSIQ scores. These coefficients, along with the
significance levels and squared zero-order correlations are
presented in Table 7. All three of the zero order
correlations for the res-based IQ estimates were
significantly correlated with the respective obtained IQ
scores. Similarly, the Barona-estimated VIQs and FSIQs were
also significantly correlated with the obtained IQs although
at lower significance levels. Barona-estimated PIQ was the
only estimate that did not achieve sign±ficance.
Multiple and semi-partial correlations were run in order to
determine the relative contributions of the IQ estimation
methods combined, and alone, to the actual obtained score.
That is, what proportion of the variance associated with the
obtained scores was accounted for when using the combined
res/Barona models as opposed to when only res- or Sarona
based estimations were used with the influence of the other
method removed?
An examination of the amount of variance accounted for
when using combined IQ estimates (res and Barona) revealed
41
42
TABLE 7
c.Qlllif!l&I I ON __ c_Q.~E.tC.l.~tl.T_Q__J1N_Q _ _sIGN I.f I CA_N~j:_I,..E;:VF~.Q_J?E 'njE_~N
ESTI_MbTEU_.bND __ @.~.li_lK~Q._Y:~Bl3l\L_L_j'_£;:RF.QRMANCE ,_jUll) __ _EQ.k:Jd __ ~~bLE_
l.Q_S~QR~S FOILTH~-~N'rEOL_GROUI'_
Variable
ICS VIQ
res PIQ
ICS FSIQ
BAR VIQ
BAR PIQ
BAR FSIQ
.56
.53
.65
.52
.30
.48
.001
.002
.000
.002
.102
.006
.r2
.32
.28
.42
.27
.09
• 2 3
-----·-
that the obtained VIQ and FSIQ scores of the control group
were predicted quite well. Almost one half of the total
variance associated with the obtained VIQ and FSIQ scores
were accounted with the VIQ and FSIQ estimation measures.
For the ICS VIQ/BAR VIQ model, R.2 = .45, while for the ICS
FSIQ/BAR FSIQ model, B.2 = .48. The combined amount of
variance accounted for by ICS PIQ/BAR PIQ was less
impressive, R2 = .29.
In order to determine the amount of unique variance
accounted for by the res and Barona IQ methods by
themselves, semi-partial correlation coefficients were
obtained. For example, removing the amount of variance
associated with the BAR VIQ (£2 = .27) from the amount of
variance accounted for by the ICS VIQ\BAR VIQ combined model
<B.2 = .45) left the unique variance accounted for by ICS VIQ
(.45-.27=.18). This squared semi-partial correlation
coefficient of .18 indicated that the ICS VIQ contributed a
substantial amount over and above that contributed by BAR
VIQ, E (1,28) = 8.89, ~ < .01. The BAR VIQ added a
statistically significantr although relatively small
contribution over and above that contributed by the ICS VIQ,
(.45-.32=.13), E (1,28) = 6.65, ~ < .05. This suggests that
although both measures account for a significant proportion
of the unique variance associated with obtained VIQ, when
given a choice, the ICS VIQ is preferable since it accounts
for a slightly greater amount.
43
This same pattern was also found with respect to the
estimates for PIQ and FSIQ although to an even greater
degree. The squared semi-partial correlation coefficient
for res PIQ was .20, E (1,28) = 7.17, R < .os, while for res
FSIQ it was .25, ~ (1,28) = 13.16, R < .01. Conversely,
neither the BAR PIQ or BAR FSIQ added anything significant
to the relationship between estimated and obtained IQ
scores. The BAR PIQ semi-partial correlation coefficient
was .01, ~ (1,28) = .40, ns. The BAR FSIQ semi-partial
correlation coefficient was .06, ~ (1,28) = 3.05, ns. From
this, it is evident that the three ICS-based IQ estimates
accounted for a greater percentage of the variance in
obtained IQs than did the Barona-based estimates.
The standard errors of estimate for the res-based
equations were 9.80, 10.20, and 9.22 for the VIQ, PIQ, and
FSIQ, respectively. Little difference ±n the standard
errors of estimate were found when equations were developed
using both the ICS- and Barona-based estimates combined.
These were 8.96, 10.29, and 8.90 for the VIQ, PIQ, and FSIQ,
respectively for the combined ICS/BAR model. In both cases,
the error estimates are considerably lower than those
obtained during the original Barona et al. (1984) study
(11.79, 13.23, and 12.14 for the VIQ, PIQ, and FSIQ,
respectively). The cross-validation of the Barona equations
conducted in the present study resulted in somewhat lower
standard errors of estimate (10.11, 11.44, and 10.61 for the
VIQ, PIQ; and FSIQ, respectively) than those obtained in the
44

Barona et al. (1984) study. However, they were still larger
than those standard errors of estimate generated from the
res equations alone or the combined ICS/BAR model.
45
CHAPTER V
DISCUSSION
As previously mentioned, a number of attempts have been
made to develop a method with which to accurately estimate
premorbid intellectual functioning. The majority of
methods, particularly the initial ones, were based on the
concept of selective deficits. This approach assumed that
the best of the remaining skills, such as those reflected by
certain Wechsler subtest scores, was representative of all
premorbid skills. However, follow-up research has provided
little evidence of the reliability of such approaches. In
fact, Klesges, Wilkening, and Golden (1981) reviewed a
number of premorbid intelligence indices and concluded that
the selective deficit method is a 11 Simplistic and inaccurate
approach to assessment of premorbid status 11 (p. 34) •
' .... ·More, :r.ecen:tly.·.the .. emphasis::has .sh'ift.ed. .. fro.m the
selective deficit concept to the use df regression analysis
in which selected predictor variables are used to generate
estimated premorbid IQ scores. These predictor variables
have typically employed demographic data. For the most
part, these techniques have resulted in such large standard
46
errors of estimate for criterion variables that they have
not been clinically useful.
The present study was undertaken in an effort to
develop a scale of other than demographic data items that
correlated with intelligence and which, when used in a
regression equation, would predict level of intellectual
functioning. The items of the ICS reflected attitudes,
personal and vocational interests, personal beliefs, and
personality traits. The fact that this scale was based on
an individual's unique responses suggested that it was a
more individualized procedure that might increase the
accuracy of the premorbid IQ estimates and reduce the large
standard errors of estimate that have plagued the other
methods. In addition to developing such a scale and
validating it on a brain-damaged population, a cross
validational check of a set of equations that used the
previous methodology, demographic data, as predictor
variables (Barona et al., 1984) was conducted.
The results of the present study support the use of the
ICS as a valid means of estimating premorbid IQ and does so
with a reasonable degree of accuracy. A comparison of the
obtained (actual) IQs (Verbal, Performance, and Full Scale)
on matched groups of brain-damaged and control subjects
revealed the expected differences: obtained IQs of the
brain-damaged group were significantly lower than the
control group (Appendix J-7, K-5). This was expected and
provided corroborating evidence that the brain-damaged
47
subjects had in fact suffered cerebral impairment. The
estimated IQs (res and Barona estimates) were higher than
the obtained IQs as would be expected. However, the fact
that the estimated IQs (res and Barona estimates) were
significantly greater than the obtained IQs did not
determine the accuracy of estimated IQs in predicting
premorbid intellectual functioning. This accuracy was
determined by the extent to which the estimated IQs
approximated the obtained IQs of a control group. The data
revealed no significant differences between these IQs
(estimated and obtained for controls) which suggested that
in fact the estimated IQs did meaningfully reflect premorbid
intellectual functioning.
A statistical comparison of the res and Barona methods
of estimating premorbid IQ revealed no significant
differences between them. However, with respect to the
control group, the Barona-based estimates consistently
overestimated both the obtained VIQs and FSIQs ~bile
underestimating obtained PIQs to a slightly greater degree
than did the res-based estimates although these were not
statistically significant differences.
Additionally, the semi-partial correlation coefficients
computed for each of the res- and Barona-based IQ estimates
favored the res IQ estimates. Inspection of the data
revealed that the res IQ estimates accounted for more of the
unique variance associated with the obtained IQ scores than
did the Barona estimates. The amount of unique variance in
48

obtained VIQ accounted for by ICS VIQ and that amount in
obtained FSIQ accounted for by ICS FSIQ were both
significant at the .01 level. The res PIQ accounted for an
amount of the variance in obtained PIQ that was significant
at the .OS level. In comparison, only one of the Barona
equations was significant at the point .OS level, that being
Barona VIQ. Barona estimated PIQ and FSIQ accounted for so
little variance that they were not statistically
significant.
An examination of the results using a combined
predictor model (ICS and Barona) to estimate premorbid IQ
does not appear to hold much promise of any major
improvement over the ICS method used alone except possibly
estimated VIQ. The variance in obtained VIQ accounted for
by ICS VIQ is somewhat less than that accounted for when the
ICS VIQ and Barona VIQ estimates are combined (ICS VIQ, ~2 =
.32 versus ICS VIQ/BAR VIQ, R2 = .4S). The differences are
much smaller when this comparison is made with PIQ and FSIQ.
The variances are almost equal with respect to PIQ (ICS PIQ,
~2 = .28 versus ICS PIQ/BAR PIQ, R2 = .29) and only slightly
less when evaluating FSIQ (ICS FSIQ, ~2 = .42 versus ICS
FSIQ/BAR FSIQ, R2 = .48). Similarly, the standard errors of
estimate based on the ICS estimates are nearly equal to
those based on the combined models. From an inspection of
the data, it appears that with a larger sample in selecting
items, the improvement afforded by the ICS estimates might
be even greater since a number of the rejected ICS items
49
neared significance. If the res item pool were expanded it
may be more statistically accurate than the Barona
estimates.
Interestingly enough, the squared multiple correlations
between Sarona-estimated IQs and the obtained IQs were
smaller than those reported in the Barona et al. (1984)
study and a subsequent cross-validational study by Eppinger
et al. (1987). Likewise, there were major discrepancies
between the Barona et al. (1984) and Eppinger et al. (1987)
studies. The squared multiple correlations for each of
these studies, as well as those of the present study, are
reported in Table 8. Eppinger et al. (1987) obtained higher
squared multiple correlations than the or~ginal Barona et
al. (1984) study. They attributed this to a restricted
range on the region variable. All of the Eppinger et al.
(1987) subjects fell within the same geographic region.
However, this explanation does not appear valid since the
present study had a great percentage of its subjects from
the same region and yet still obtained much lower squared
multiple correlations than reported by Barona et al. (1984).
The rather marked discrepancies between these studies
are not particularly surprising when considering the extreme
variability inherent in assigning values to individuals for
use in regression equations based on demographic data. For
example, the generalization that people living in the
northeastern section of the country are more intelligent
50

51
TABLE 8
.s..oobREIL1:1.ll.LT.JJ'J,.~_..CORRE_L_hTI_9_N COE_fJ;"I~_I_E1_N';I:'_s._ __ Q.I;;.~vEEN __ ~.Sl'1~1b.Tm
AND ___ Oj3j:' A mn (ACTUAL) VERBAL , PERF ORMAtl~h_h.NIL_F_t-l_LL _f>CbL~
1.QS_
VIQ PIQ FSIQ
Barona et al. (1984) .38 .24 .36
Eppinger et al. (1987) .61 .36 .58
Barona (present study) .27 .09 .23
res (present study) .32 .28 .42
ICS/Barona combined .45 • 29 .48
(assigned a higher score) than are people living in the
southern United States is, at best, suspect. Not only does
this disregard the spectrum of individuality but dividing an
incredibly diverse country into four quadrants and assigning
scores on the basis of them greatly oversimplifies
continental boundries. Also, the question as to how long a
person resides in a particular area of the country to
qualify a particular "region" score is as yet unanswered.
In today's society, it is more the norm to have individuals
grow up and live in different sections of the country. This
same dilemma exists with respect to determining whether or
not the individual residence is urban (population > 2500) or
rural (population < 2500). People frequently grow up in
small communities and yet move to more metropolitan areas to
take up their residence.
Other problem areas that exist with the use of
demographic data in the Barona et al. (1984) model include
ambiguous ratings for occupational status and educational
level. Within any particular occupational or educational
level there is great variability due to individual
differences. Using the Barona et al. (1984) WAIS-R
occupational classification system resulted in numerous
occupations that did not fit into the system, thereby making
the assigned values questionable. Likewise, a middle range
value (3) is assigned to tpose individuals not in the work
force. Therefore, a retired university professor would
conceivably receive the same occupational rating score as a
52
chronically unemployed welfare recipient. In the Barona et
al. (1984) system, educational level accounts for the most
variability within the verbal and full scale formulae. In
spite of this, important differences in educational level
often result in identical scores. For example, a person
graduating with honors from·high school is given the same
rating score as the person who also graduated but spent
his/her entire academic career in special education classes.
Also, a person with a bachelor's degree receives the same
rating score as someone achieving an advanced graduate
degree. An additional complication is the report by Barona
et al. (1984) that their formulae are less accurate in
estimating intellectual functioning when premorbid FSIQ
falls below 69 or above 120. Another problem occurs with
those individuals whose motivational level results in their
being either underachievers or overachievers. All of these
areas introduce considerable error into the formulae.
Given this, it is also not surprising tha~ other
methods of attempting to estimate premorbid IQ on the basis
of demographic data have yielded such large standard errors
of estimate that they are not useful at a clinical level.
This was a major problem with the Wilson et al. (1978)
equations as well as the Barona et al. (1984) equations.
Using those methods, an estimated FSIQ score of 100 with the
standard error of estimate of 12.14 (Barona et al., 1984)
implies that the individual's premorbid level of
intellectual functioning falls somewhere between low average
53
and high average. Unfortunately, a statement this broad can
be reasonably accurate without the use of a regression
equation.
An index for estimating intelligence that comprise
items reflecting a person's personality, interests, beliefs,
and attitudes appears, to some degree, to circumvent the
overgeneralizations inherent in the demographically-based
methods. These characteristics, particularly personality,
are well-developed early in life during the time
intellectual functioning is intact and typically remain
fairly stable throughout life. In cases of adult-onset
brain damage, it is reasonable to assume that these traits
are less likely to undergo significant transformations
secondary to brain damage than are specific intellectual
skills/abilities. It is believed that ideas pertaining to
characteristics such as social issues, prejudice, tolerance
of ambiguity, etc., reflect more of an individual's
premorbid intellectual functioning than do location and size
of the town of residence, sex, race, etc. It is important
to note that personality characteristics are not completely
immune from change, however. In fact, changes in
personality are often noted following brain damage,
particularly over time. Lezak (1976) indicates that some
changes occur as fairly specific behavior patterns that
reflect damage to specific anatomical sites in the brain.
However, other personality and/or behavior changes tend not
to be so much a direct product of the tissue damage as is
54
the individual's reaction to the experience of loss,
frustration, and change in style of life.
The present research shows considerable promise as far
as moving toward a more accurate estimate of premorbid
intellectual functioning in adults. The res IQ estimates
seemed to account for more of the variance associated with
the obtained (actual) IQ scores than did the Barona IQ
estimates. Additionally, although not at a statistically
significant level, the res IQ estimates more closely
approximated the obtained (actual) IQs and did so with
smaller standard errors of estimate than did the Barona et
al. (1984) equations. Increasing the size of the sample of
the present study may result in some of the borderline
significant items becoming significant, thereby contributing
further to the predictive accuracy of the res-based
estimates.
Because of the differences in the types of sequelae
seen in brain-damage stemming from eVAs versus closed- or
open-head injuries, it will be important to evaluate these
equations with respect to the type of injury sustained,
extent of laterality of damage, etc. This of course
necessitates a greater number of brain-damaged subjects. An
inspection of the data from the standpoint of laterality of
damage revealed that the res-estimated IQs generally
overpredicted the actual VIQs of left hemisphere-damaged
individuals. Likewise, it overestimated the actual PIQs of
right hemisphere-damaged individuals. Should this
55
expectation hold true under more elaborate statistical
analysis with a larger sample size, it would have
significant implications in the diagnosis of localization of
cerebral lesions or sites of damage.
Since this scale reflects interests, attitudes,
beliefs, and personality traits, it is also conceivable that
someone close to the brain-damaged person, such as a spouse,
relative, or friend might be able to answer the questions
for the patient based on their knowledge of him/her. This
holds considerable promise for those patients whose injuries
have left them with a severe aphasia and/or other
debilitating handicaps.
The question that originally formed the basis for
Gentry's (1972) study was whether one could use the score on
a scale consisting of items reflecting vocational interests,
personality traits, and general attitudes, to predict an
individual's intelligence. Despite some methodological
limitations, the outcome of his feasibility study was
positive. The present study has attempted to more
specifically address this issue with a population of
individuals for whom this is a major concern and the outcome
appears to be equally positive. The res is not ready for
clinical use at this time, however. Questions such as the
impact of laterality of damage and whether the res holds up
when used with different individuals in different locations
are, at present, unanswered. Further research is therefore
indicated to determine the answers to these questions.
56
REFERENCES
Allen, R. (1947). The test performance of the brain injured.
Journal of Clinical Peycholo~, ~, 225-230.
Allen, R. M. (1948). A note on the use of the Bellevue
Wechsler Scale Mental Deterioration Index with brain
injured patients. Journal of Clinical P§ychology, i, 88-
90.
Anderson, A. L. (1951). The effect of laterality
localization of brain damage on Wechsler-Bellevue
indicies of deterioration. Journal of Consulting and
Clinical Psychology, ~' 191-194.
Babcock, H. (1930). An experiment in the measurement of
mental deterioration. Archives of Psycholog~, la, No.
117.
Barona, A., & Chastain, R. A. (1986). An improved estimate
of premorbid IQ for blacks and whites on the WAIS-R.
International Journal of Clinical Neuropsychology
Barona, A., Reynolds, C., & Chastain, R. A. (1984). A
demograhically based index of premorbid intelligence for
the WAIS-R. Journ£1 Qf Consulting and Clinik£l
Psychology, ~' 885-887.
57
Bartz, w. & Loy, D. (1970). The Shipley-Hartford as a brief
I.Q. screening device. Journal_Qf_C_linical PsycholQgy,
2.Q. (1), 74-75.
Bersoff, D. N. (1970). The revised deterioration formula for
the Wechsler Adult Intelligence Scale: a test of
validity. Journal of Clini££l_£gy~bQlQgy,·2.§., 71-73.
Bolter, J., Gouvier, w., Veneklasen, J., & Long, c. J.
(1982) •. Using demographic information to predict
premorbid intelligence for the WAIS-R. Clinic§l
NeuroP.sycbolog_y, ~, 171-174.
Cohen, J. (1952). Factors underlying Wechsler-Bellevue
performance of three neuropsychiatric groups. Journal of
Abnormal and social Psychology, !2, 359-365.
Crookes, T. G. (1961). Wechsler's deter~oration ratio in
clinical practice. Journal of Clinical Psychology, £2,
234-238.
Eppinger, M. G., Craig, P. L., Adams, R. L., & Parsons, 0.
A. (19 87). The WAIS-R index estimating premorbid
intelligence: Cross-validation and clinical utility.
Journal of Consultina and Clinical PsycholQgy, ~ (1),
86-90.
Fisher, G. M. (1962). The efficiency of the Hewson ratios in
diagnosing cerebral pathology. Journal of NervQus and
Mental Disease, ~' 80-83.
58
Gentry, B. (1972}. A feasibility study for the development
of an intellectual correlate scale. Unpublished thesis,
Oklahoma State University.
Gonen, J. Y. (1970). The use of Wechsler's Deterioration
Quotient in cases of diffuse and symmetrical cerebral
atrophy. Journal of Clinical Psychology, ZQ, 174-177.
Gouvier, w. D., Bolter, J. F., Veneklasen, J. A., & Long, C.
J. (1983). Predicting verbal and performance IQ from
demographic data: Further fingings with head-trauma
patients. Clinical_~~~Q~~QlQgy, ~ (3), 119-121.
Graham, D. (1977). The MMEl..LA_~ii~_gLgJJJ..Qg_. New York:
Oxford University Press.
Hewson, L. R. (1949). The Wechsler-Bellevue Scale and the
Substitution test on aids in neuropsychiatric diagnosis.
Journal of Nervous Mental Disorg~~'~' pp. 158-183 and
246-266.
Hunt, w. L. (1949). The relative rates of decline of
Wechsler-Bellevue "Hold" and "Don't Hold" tests. Journal
of Consulting EsychQlQSY, ~' 440-443.
Johnsen, D., Schlottmann, R., Kane, R., Bauer, c., &
Quintana, D. (1985). An evaluation of the Mahan method
for assessing intellectual impairment. International
Journal of Clinical Neuropsychology, I (1), 8-10.
59
Klesges, R. C. (1982). Establishing premorbid levels of
intellectual functioning in children: An empirical
investigation. Clinical Ne!J.IQ~~l,Qgy, a, i (1), 15-
17.
Klesges, R. c., Fisher, L., Vasey, M., & Pheley, A. (1985).
Predicting adult premorbid funcitioning levels: another
look. InternatiQnal Journal of Clinical-Ngy£Qg§y£hQlQgy,
2 (1), 1-3.
Klesges, R. c., & Sanchez, v. C. (1981). Cross-validation of
an index of premorbid intellectual functioning in
children. Journal o.f_Consulting _ _gru:l_Clini££L££Y£h2l&g.:t.,
.4.2_, 141 •.
Klesges, R. c., Sanchez, v. C., & Stanton, A. L. (1981).
Cross-validation of an adult premorbid functioning index.
Clinical NeuropsycholQgy, ~ (1), 13-15.
Klesges, R. c., Wilkening, G. N., & Golden, C. J. (1981).
Premorbid indices of intelligence: A review. Clinical
Neuropsychology,~ {3), 32-39.
Klove, H., & Reitan, R. M. (1959). Effects of dysphasia and
distortion on wechsler-Bellevue results. Archives of
Neurology and Psychi£t£y, aQ, 708-713.
60

Leli, D. A., & Filskov, s. B. (1979). Relationship of
intelligence to education and occupation as signs of
intellectual deterioration. Journal of CQn.QJUting £nd
Clinic£1_£liY~ology, !1 (4), 702-707.
Lezak, M. D. (1976). NeuropQ.yg_bQ.lQg~£.:Lbssgssment. New
York: Oxford University Press.
Mahan, H. C. (1979) • Measuring intellectual impairment with
the WAIS: An improved approach to scoring. Clinical
Neuropsychology, l (3), 54-63.
Matarazzo, J. A. (1972). Wechsl~~Mea§prement and
Appraisal of AdullJ..ntel.l..igence. Baltimore, Md.:
Williams and Wilkens.
McFie, J. (1975). A§sessment of oraanic intellectual
impairment. New York: Academic Pres's.
McKeever, w. F. & Gerstein, A. I. (1958). Validity of the
Hewson ratios: Investigation of a fundamenb::tl
methodological consideration. Journal of CQngull.ing_
Psychology, 22, 150.
Meehl, P. (1954). Clinical versus Statistical Prediction.
Minneapolis University of Hinnesota Press.
Megargee, E. I. (1972). The California Psy.QbQ_lQgical
Inventory HandQQQK. San Francisco: Josey-Bass, Inc.
61

Morrow, R. s. & Mark, J. (1955). The correlation of
intelligence and neuorological findings on 22 patients
autopsied for brain damage. Journ,gl_.Q.f_CQD§JJ.l.tin.g
PsychQlggy, ~' 283-289.
Reitan, R. M. (1955). Certain differential effects of left
and right cerebral lesions in human adults. Journal Qf
Comparativ.e__gn£1JhYeiologif&l:lo_~Ql!QlQgy, 48, 474-477.
Reitan, R. M. (1959). The comparative effects of brain
damage on the Halstead Impairment Index and the Wechsler
Bellevue Scale. Journal_Qf __ Cl.in..ical PsyQhQlogy, 1...2., 281-
285.
Reitan, R. M. & Davison, L. A. (Eds.). (1974). Clinical
Neuropsychology: Current status aruL..gpl2.l~Bli.Qllli.. New
York: Wiley.
Reynell, w. R. (1944). A psychometric method of determining
intellectual loss following head injury. Journal of
Mental Science, ~' 710-719.
Reynolds, C. R. & Gutkin, T. B. (1979). Predicting the
premorbid intellectual status of children using
demographic data. Clinical Neuropsychology, l (2), 36-
38.
'
62
Rogers, L. s. (1950a). A comparative evaluation of the
Wechsler-Bellevue Mental Deterioration Index for various
adult groups. Journal Qf_Clinig21 PsychQlQgy, ~' 199-
202.
Rogers, L. s. (1950b). A note on Allen's Index of
Deterioration. Journal Qf_Clinical EQ.ycholQgy, ~' 203.
Russell, E. (1972). WAIS factor analysis with brain damaged
subjects using criterion measures. Journal of Consulting
and Clinical Psycholoay, li, 133-139.
Sattler, J. M. (1974). Assessment_Q.f.-.Ch.Ll.Q..r~~
Intelligence. Philadephia: Saunders.
Shipley, w. C. & Burlingame, (1939). Shipley-Hartford
Institute of Living Scale for Measuring Intellectual
Impairment: Manual of Directions and SQoring Key.
Hartford: The Institute of Living.
Swiercinsky, D.P. & Warnock, J. K. (1977). Comparison of
the neuropsychological key and discriminant analysis
approaches in predicting cerebral damage and
localization. Journal of Consulting_gnd Clinical
PsyQhology, ~' 808-814.
Vogt, A. T. & Heaton, R. K. (1977). Comparison of Wechsler
Adult Intelligence Scale indicies of cerebral
dysfunction. PerQeptual and Motor Skills, za, 66-67.
63
Wechsler, D. w. {1944). The Mea.Q.Y.t:_~_t_Qf_A@lt
Intelligence (3rd Edition). Baltimore, Md.: Williams
and Wilkens.
Wechsler, D. w. (1958). The Mea2~ID~Bnd_8QQ££i~~l_Qf
AdultJD.t~lli~~-L4tJLE9-i:tiQnl. Baltimore, Md.:
Williams and Wilkens.
Wechsler, D. w. (1974}. Manual for the We~_hsler ln.ttlli.g.e.~
Scale .fQLO!ildren=Eev.ie.~d.t.. New York: The Psychological
Corporation.
Wechsler, D. W. (1981). ~...h§.l~.r_M!ULin~.i.g.e.ng_~_.ScQ,l~
Revised. Manual. New York: The Psychological
Corporation.
Wilson, R. s., Rosenbaum, G., & Brown, G. (1979}. The
problem of premorbid intelligence in 'psychological
assessment. Journal of Clinic£l_NeurQpsycholoay, l, 49-
53.
Wilson, R. s., Rosenbaum, G., Brown, G., Rourke, D.,
Whitman, D., & Gisell, J. (1978}. An index of premorbid
intelligence. Journal of Consulting and Clinical
PsycholQgy, iQ (6), 1554-1555.
woo-sam, J., Zimmerman, I. L., & Rogal, R. (1971}. Location
of injury and Wechsler indicies of mental deterioration.
Perceptual and Motor Skills, ~, 407-411.
64

APPENDIX A
CONSENT TO PARTICIPATE FOPMS
65

CONSENT TO PARTICIPATE FORM - I
I do hereby agree to
participate in the study on assessing the abilities of
people who have sustained head injuries or brain
trauma/disease being conducted by David Johnsen, M.S. and
Robert Schlottmann, Ph.D. The purpose of this study is to
develop a method for more accurately assessing the thinking
and reasoning abilities of a person who has experienced such
medical problems. This will be accomplished, in part, by
finding items that have a relationship to verbal and/or non-
verbal abilities. This study will require me to take an
intelligence test, answer a questionnaire, and provide some
background information (e.g., age, education, occupation,
etc.). I understand that my participation will take
approximately two hours, is totally voluntary, and that I
may withdraw at any time. Furthermore, I understand that
all identifying information will be kept confidential.
Signature of Participant Witness
Date
66
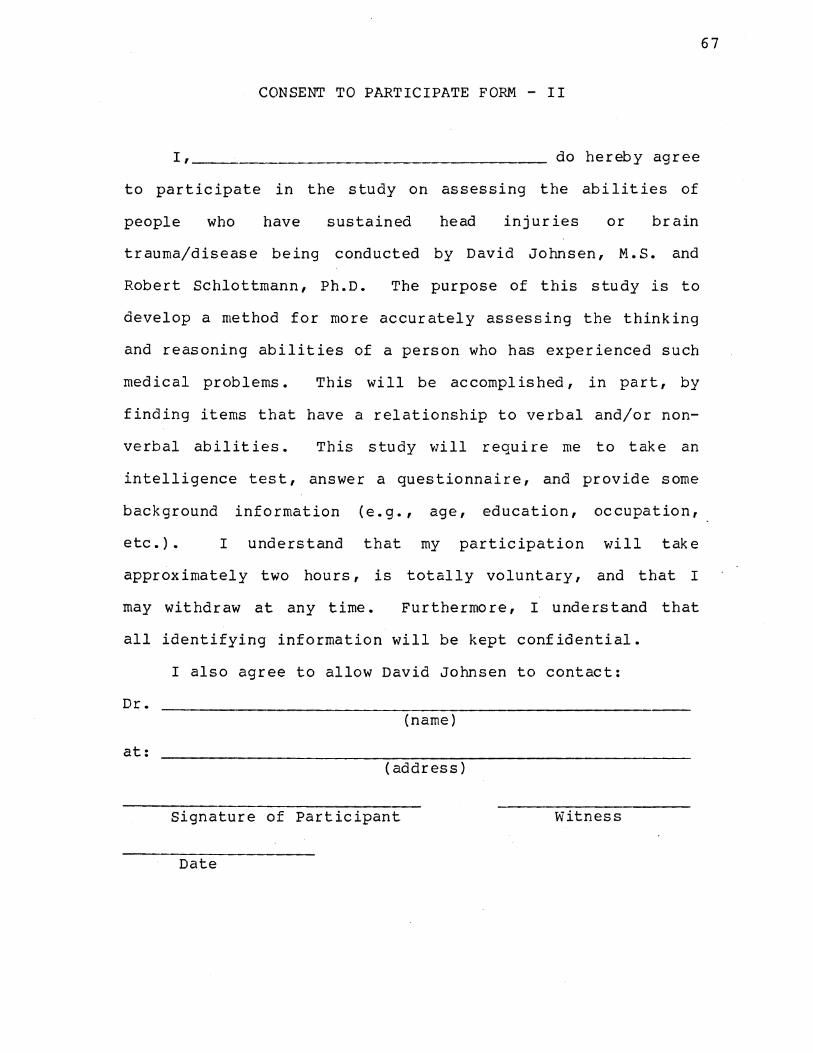
CONSENT TO PARTICIPATE FORM - II
I, ________________________________________ do hereby agree
to participate in the study on assessing the abilities of
people who have sustained head injuries or brain
trauma/disease being conducted by David Johnsen, M.S. and
Robert Schlottmann, Ph.D. The purpose of this study is to
develop a method for more accurately assessing the thinking
and reasoning abilities of a person who has experienced such
medical problems. This will be accomplished, in part, by
finding items that have a relationship to verbal and/or non-
verbal abilities. This study vlill require me to take an
intelligence test, answer a questionnaire, and provide some
background information (e.g., age, education, occupation,
etc.). I understand that my participation will take
approximately two hours, is totally voluntary, and that I
may withdraw at any time. Furthermore, I understand that
all identifying information will be kept confidential.
I also agree to allow David Johnsen to contact:
Dr. (name)
at: (address)
Signature of Participant Witness
Date
67

APPENDIX B
BACKGROUND INFORMATION
68

BACKGROUND INFORMATION
Subject Number: ____ __ Group: A(I/W) B(W/I) Age: __ _
Education: ________________________ __ Sex: ___ _ Race: __ _ (last grade completed)
Occupation: ________________________________________________ ___
List degrees, diplomas, certificates, etc. held: ____________ _
Spouse's age: ____ Education: Occupation: _____________ _
Father's age: ___ Education: Occupation: _____________ _
Mother's age: ____ Education: Occupation: ______________ _
How would you describe your family's financial situation
when you were growing up? (circle one)
a) wealthy
b) comfortable
c) barely adequate
d) poor
How would you describe your current financial situation?
(circle one)
a) wealthy
b) comfortable
c) barely adequate
d) poor
Where did you grow up? (city & state) ______________________ _
Where do you currently live? (city & state) ______________ __
69

70
Have you ever been treated or hospitalized for a head
injury? If yes, please explain.
Have you ever been treated or hospitalized for a mental
disorder? If yes, please explain.
Are you currently taking any medications? ____ _ If yes,
please explain.

APPENDIX C
INSTRUCTIONS FOR COHPLETING THE INTELLECTUAL
CORRELATES SCALE ITEM POOL
71

INSTRUCTIONS FOR COMPLETING THE INTELLECTUAL
CORRELATES SCALE ITEM POOL
The following questionnaire consists of 167 items that
reflect your interests, attitudes, and some relevant
biographical/demographical information. Read each item and
blacken in the number that most accurately reflects yQY_L
feelings about it (1-Strongly Agree, 2-Agree, 3-Disagree, 4-
Strongly Disagree). Remember to answer every item and mark
your answer on the answer sheet. Do not write on the
questionnaire booklet. Each time you complete a page on the
questionnaire booklet, you will move to the next column on
the answer sheet.
There is no time limit but respond to the questions as
quickly as you can. Your first impressions are usually the
most accurate. Are there any questions?
72

APPENDIX D
INITIAL CONTACT LETTER
73

"current date"
Dear
Thank you for your willingness to participate in the
research study on assessing the abilities of persons who
have sustained head injuries or brain trauma. The purpose
of this study is to develop a method for more accurately
assessing the thinking and reasoning abilities of a person
who has experienced such medical problems. This will be
accomplished, in part, by finding items that have a
relationship to verbal and/or non-verbal abilities.
Your participation will take approximately two hours
and will involve your taking an intelligence test, answering
a questionnaire, and providing some background information
{e.g., age, education, occupation, etc.). All information
will remain totally confidential as code numbers will be
used on the data rather than individual names. Your
participation is totally voluntary and you may withdraw at
any time.
I will be contacting you by telephone in a few days to
schedule a testing time convenient for you.
you for your cooperation.
Sincerely,
Again, thank
David E. Johnsen, M.S.
74
APPENDIX E
INTELLECTUAL CORRELATES SCALE QUESTIONNAIRE
AND ANSWER SHEET
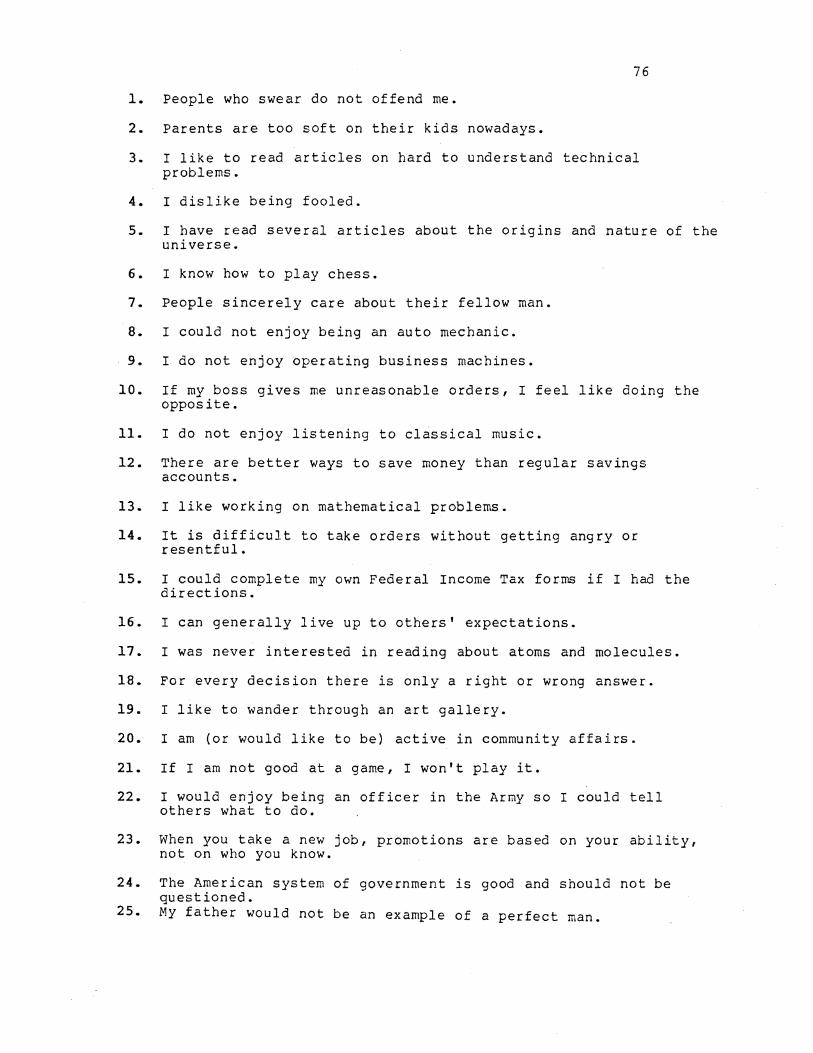
76
1. People who swear do not offend me.
2. Parents are too soft on their kids nowadays.
3. I like to read articles on hard to understand technical problems.
4. I dislike being fooled.
5. I have read several articles about the origins and nature of the universe.
6. I know how to play chess.
7. People sincerely care about their fellow man.
8. I could not enjoy being an auto mechanic.
9. I do not enjoy operating business machines.
10. If my boss gives me unreasonable orders, I feel like doing the opposite.
11. I do not enjoy listening to classical music.
12. There are better ways to save money than regular savings accounts.
13. I like working on mathematical problems.
14. It is difficult to take orders without getting angry or resentful.
15. I could complete my own Federal Income Tax forms if I had the directions.
16. I can generally live up to others' expectations.
17. I was never interested in reading about atoms and molecules.
18. For every decision there is only a right or wrong answer.
19. I like to wander through an art gallery.
20. I am (or would like to be) active in community affairs.
21. If I am not good at a game, I won't play it.
22. I would enjoy being an officer in the Army so I could tell others what to do.
23. When you take a new job, promotions are based on your ability, not on who you know.
24. The American system of government is good and should not be questioned.
25. My father would not be an example of a perfect man.
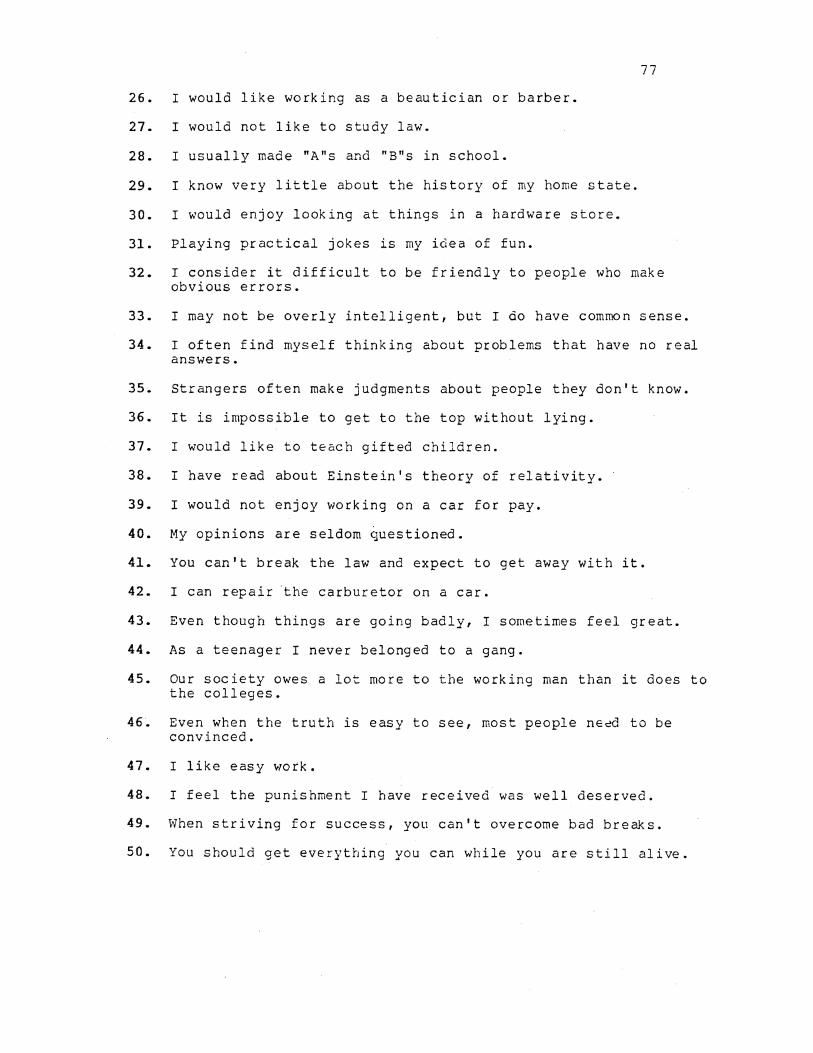
77
26. I would like working as a beautician or barber.
27. I would not like to study law.
28. I usually made "A"s and "B"s in school.
29. I know very little about the history of my home state.
30. I would enjoy looking at things in a hardware store.
31. Playing practical jokes is my idea of fun.
32. I consider it difficult to be friendly to people who make obvious errors.
33. I may not be overly intelligent, but I do have common sense.
34. I often find myself thinking about problems that have no real answers.
35. Strangers often make judgments about people they don't know.
36. It is impossible to get to the top without lying.
37. I would like to teach gifted children.
38. I have read about Einstein's theory of relativity.
39. I would not enjoy working on a car for pay.
40. My opinions are seldom questioned.
41. You can't break the law and expect to get away with it.
42. I can repair ·the carburetor on a car.
43. Even though things are going badly, I sometimes feel great.
44. As a teenager I never belonged to a gang.
45. Our society owes a lot more to the working man than it does to the colleges.
46. Even when the truth is easy to see, most people need to be convinced.
47. I like easy work.
48. I feel the punishment I have received was well deserved.
49. When striving for success, you can't overcome bad bre~s.
50. You should get everything you can while you are still alive.
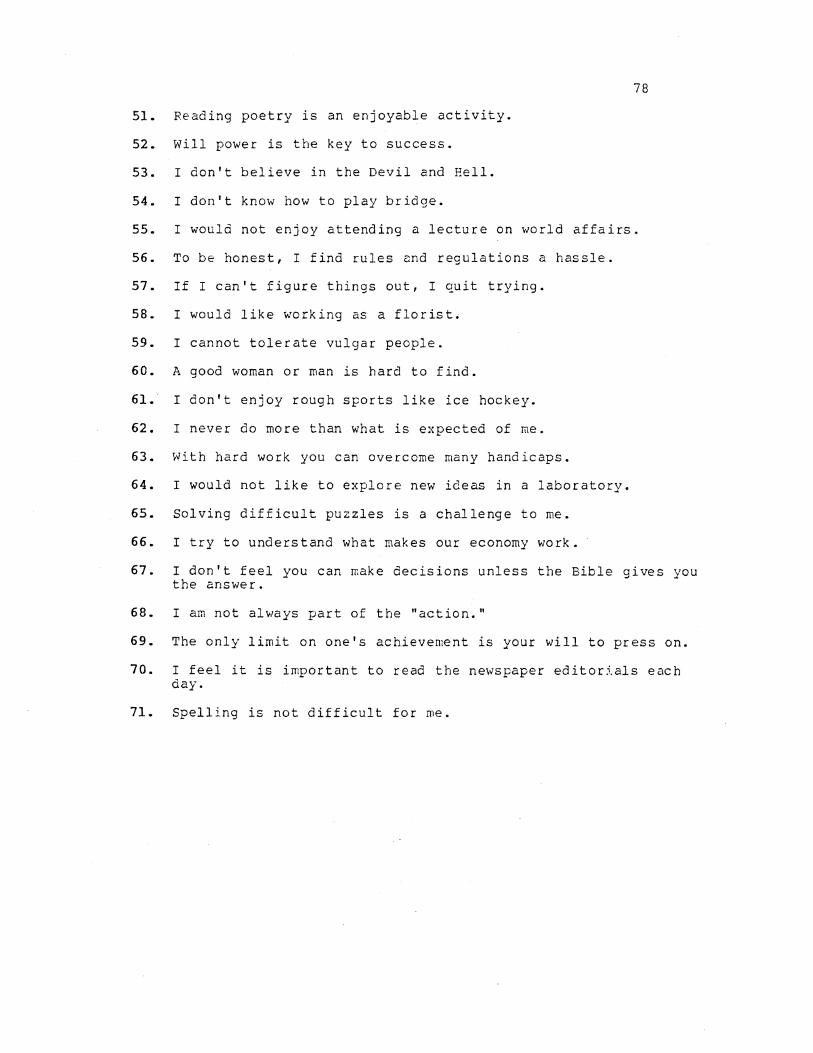
78
51. Reading poetry is an enjoyable activity.
52. Will power is the key to success.
53. I don't believe in the Devil and Hell.
54. I don't know how to play bridge.
55. I would not enjoy attending a lecture on world affairs.
56. To be honest, I find rules and regulations a hassle.
57. If I can't figure things out, I quit trying.
58. I would like working as a florist.
59. I cannot tolerate vulgar people.
60. A good woman or man is hard to find.
61. I don't enjoy rough sports like ice hockey.
62. I never do more than what is expected of me.
63. With hard work you can overcome many handicaps.
64. I would not like to explore new ideas in a laboratory.
65. Solving difficult puzzles is a challenge to me.
66. I try to understand what makes our economy work.
67. I don't feel you can make decisions unless the Bible gives you the answer.
68. I am not always part of the "action."
69. The only limit on one's achievement is your will to press on.
70. I feel it is important to read the newspaper editorials each day.
71. Spelling is not difficult for me.
79
ICS QUESTIONNAIRE ANSWER SHEET
SA A D SD SA A D SD SA A D SD
l. (1) (2) (3) (4) 26. (1) (2) (3) (4) 51. (1) (2) (3) (4)
2. (1) (2) (3) (4) 27. (1) (2) (3) (4) 52. ( 1) ( 2 ) ( 3 ) ( 4 )
3. (1) (2) (3) (4) 28. (1) (2) (3) (4) 53. (1) (2) (3) (4)
4. (1) (2) (3) (4) 29. (1) (2) (3) (4) 54. (1) (2) (3) (4)
5. (1) (2) (3) (4) 30. (1) (2) (3) (4) 55. (1) (2) (3) (4)
6. (1) (2) (3) (4) 31. (1) (2) (3) (4) 56. (1) (2) (3) (4)
7. (1) (2) (3) (4) 32. (1) (2) (3) (4) 57. (1) (2) (3) (4)
8. (1) (2) (3) (4) 33. (1) (2) (3) (4) 58. (1) (2) (3) (4)
9. (1) (2) (3) (4) 34. (1) (2) (3) (4) 59. (l) (2) (3) (4)
10. (1) (2) (3) (4) 35. (1) (2) (3) (4) 60. (1) (2) (3) (4)
11. ( 1) ( 2) ( 3) ( 4) 36. (1) (2) (3) (4) 61. (l) (2) (3) (4)
12. {1) (2) (3) (4) 37. (1) (2) (3) (4) 62. (1) (2) (3) (4)
13. (1) (2) (3) (4) 38. (1) (2) (3) (4) 63. (1) (2) (3) (4)
14. (1) (2) (3) (4) 39. (1) (2) (3) (4) 64. (l) (2) (3) (4)
15. (1) (2) (3) (4) 40. (1) (2) (3) (4) 65. (1) (2) (3) (4)
16. (1) (2) (3) (4) 41. (1) (2) (3) (4) 66. (l) (2) (3) (4)
17. (1) (2) (3) (4) 42. (1) (2) (3) (4) 67. (l) (2) (3) (4)
18. (1) (2) (3) (4) 43. (1) (2) (3) (4) 68. (l) (2) (3) (4)
19. (1) (2) (3) (4) 44. (1) (2) (3) (4) 69. (l) r2) (3) (4)
20. (1) (2) (3) (4) 45. (1) (2) (3) (4) 70. (l) (2) (3) (4)
21. (1) {2) (3) (4) 46. (1) (2) (3) (4) 71. (l) (2) (3) (4)
22. (1) (2) (3) (4) 47. (1) (2) (3) (4)
23. (1) (2) (3) (4) 48. (1) (2) (3) (4)
24. (1) (2) (3) (4) 49. (1) (2) (3) (4)
25. (1) (2) (3) (4) 50. (1) (2) (3) (4)

APPENDIX F
INSTRUCTIONS FOR CO.HPLETING THE INTELLECTUAL
CORRELATES SCALE QUESTIONNAIRE
80

INSTRUCTIONS FOR COMPLETING THE INTELLECTUAL
CORRELATES SCALE QUESTIONNAIRE
The following questionnaire consists of 71 items that
reflect your interests, beliefs, and attitudes. Read each
item and blacken in the number that most accurately reflects
your _feelings about it (1-Strongly Agree, 2-Agree, 3-
Disagree, 4-Strongly Disagree). Remember to answer every
item and mark your answer on the answer sheet. Do not write
on the questionnaire booklet. Each time you complete a page
on the questionnaire booklet, you will move to the next
column on the answer sheet.
There is no time limit but respond to the questions as
quickly as you can. Your first impressions are usually the
most accurate. Are there any questions?
81
APPENDIX G
VETERANS ADMINISTRATION MEDICAL CENTER
CONSENT TO PARTICIPATE FORMS
82
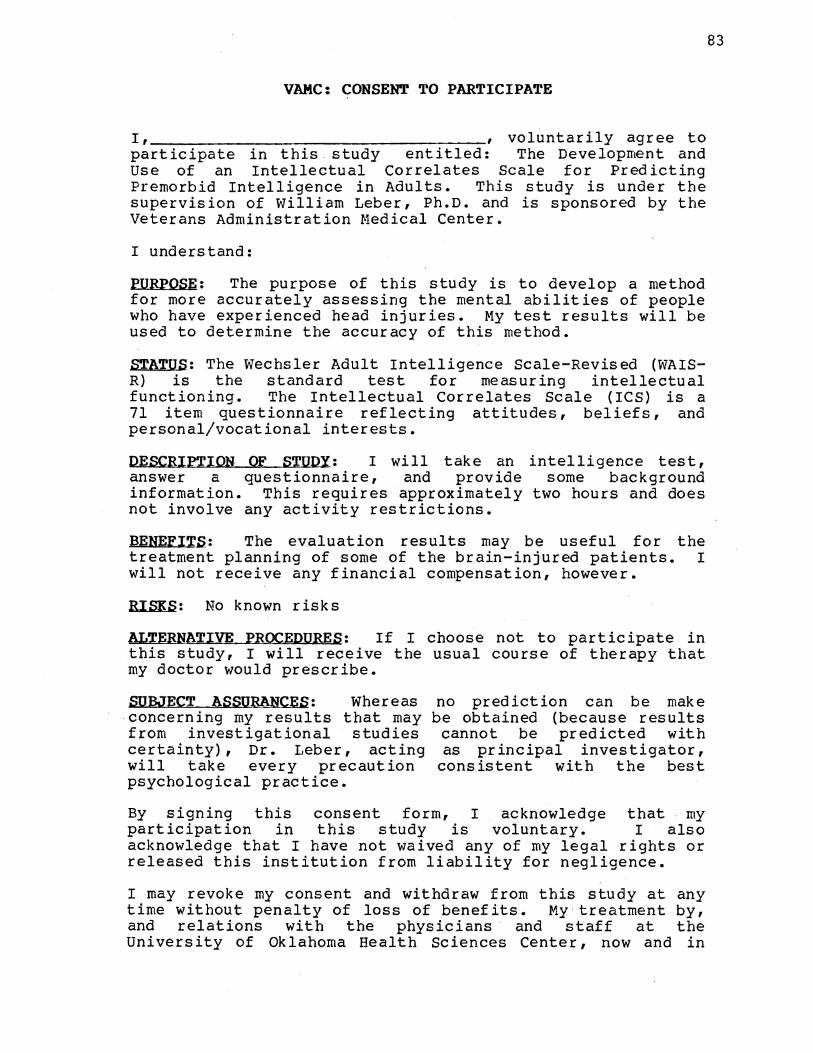
VAMC: CONSENT TO PARTICIPATE
I, , voluntarily agree to participate in this study entitled: The Development and use of an Intellectual Correlates Scale for Predicting Premorbid Intelligence in Adults. This study is under the supervision of William Leber, Ph.D. and is sponsored by the Veterans Administration Medical Center.
I understand:
PURPOSE: The purpose of this study is to develop a method for more accurately assessing the mental abilities of people who have experienced head injuries. My test results will be used to determine the accuracy of this method.
STATUS: The Wechs.ler Adult Intelligence Scale-Revised (WAISR) is the standard test for measuring intellectual functioning. The Intellectual Correlates Scale (ICS) is a 71 item questionnaire reflecting attitudes, beliefs, and personal/vocational interests.
DESCRIPTION OF STUDY: I will take an intelligence test, answer a questionnaire 1 and provide some background information. This requires approximately two hours and does not involve any activity restrictions.
BENEFITS: The evaluation results may be useful for the treatment planning of some of the brain-injured patients. I will not receive any financial compensation, however.
RISKS: No known risks
ALTERNATIVE PROCEDURES: If I choose not to participate in this study, I will receive the usual course of therapy that my doctor would prescribe.
SUBJECT ASSUM_NCE_S: Where as concerning my results that may from investigational studies certainty), Dr. Leber, acting will take every precaution psychological practice.
no prediction can be make be obtained (because results cannot be predicted with as principal investigator,
consistent with the best
By signing this consent form, I acknowledge that my participation in this study is voluntary. I also acknowledge that I have not waived any of my legal rights or released this institution from liability for negligence.
I may revoke my consent and withdraw from this study at any time without penalty of loss of benefits. My treatment by, and relations with the physicians and staff at the University of Oklahoma Health Sciences Center 1 now and in
83
the future, will not be affected in any way if I refuse to participate, or if I enter the study and withdraw later.
Records of this study will be kept confidential with respect to any written or verbal reports making it impossible to identify me individually.
If I have any questions about my rights as a research subject, I may take them to the Director of Research Administration, University of Oklahoma Health Sciences Center, Room 115, Library Building, Telephone number (405) 271-2090, or to the Associate Chief of Staff, Veterans Administration Medical Center, Telephone number {405) 272-9876, Extension 3156.
SIGNATURE~ I have read this informed consent document. I understand its contents and I freely consent to participate in this study under the conditions described in this document. I understand that I will receive a signed copy of this document.
(Date) (Signature of research subject)
(Date) (Signature of witness)
(Date) (Signature of principal investigator)
84

APPENDIX H
ICS SCORING KEY
85
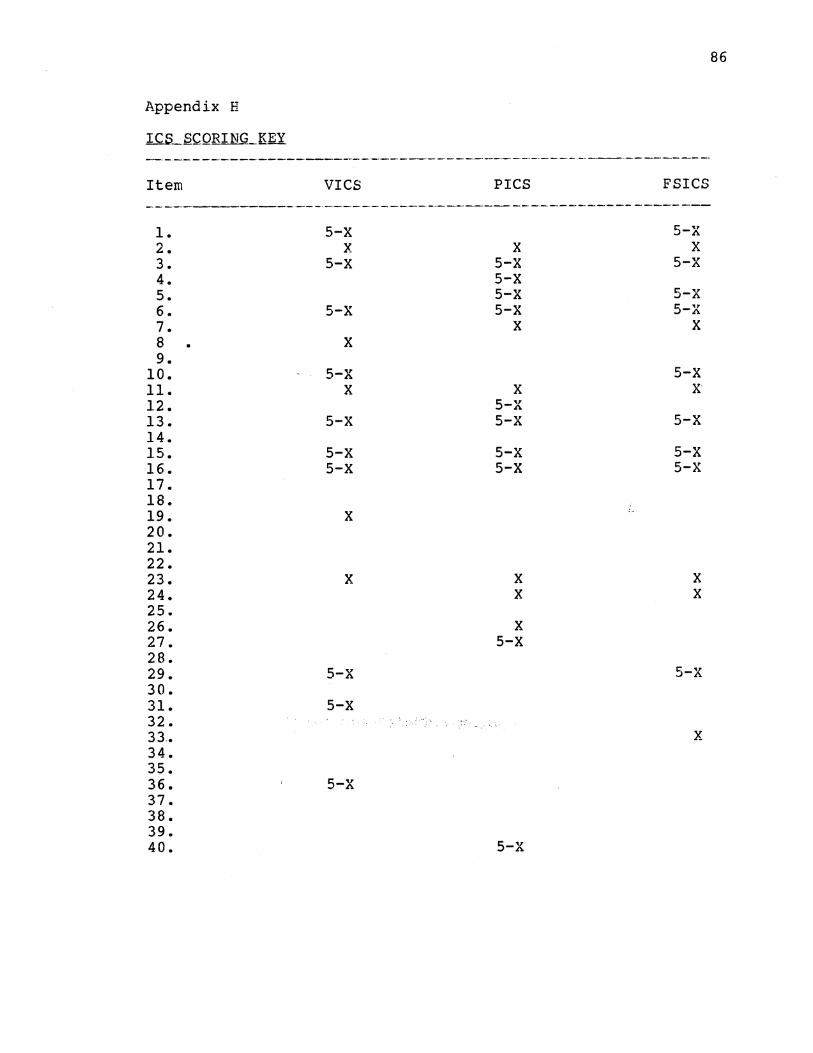
Appendix H
Item
1. 2. 3. 4. 5. 6. 7. 8 9.
10. 11. 12. 13. 14. 15. 16. 17. 18. 19. 20. 21. 22. 23. 24. 25. 26. 27. 28. 29. 30. 31. 32. 33. 34. 35. 36. 37. 38. 39. 40.
VICS
5-X X
5-X
5-X
X
5-X X
5-X
5-X 5-X
X
X
5-X
5-X
5-X
PICS
X 5-X 5-X 5-X 5-X
X
X 5-X 5-X
5-X 5-X
X X
X 5-X
5-X
FSICS
5-X X
5-X
5-X 5-X
X
5-X X
5-X
5-X 5-X
X X
5-X
X
86

lCB_SCQR.IN.G._Kll (continued) ----------------------------------·--------------
41. 42. 43. 44. 45. 46. 47. 48. 49. 50. 51. 52. 53. 54. 55. 56. 57. 58. 59. 60. 61. 62. 63. 64. 65. 66. 67. 68. 69. 70. 71.
X 5-X
X
X 5-X
5-X X X
5-X
X
X X
5-X
X
5-X
5-X
X
X 5-X
X
X 5-X
X
X
X
X
X X
X 5-X
X
X
X X X X
X - The score {number) corresponding to the item answer
{e.g., _ l:"'7St,r.o:ng1y. ;_A·gr:ee . ., -. ·2"'::'Agre.e., 3-Disagree, 4-Strong ly
Agree)
87

88
To derive the res-estimated rQ score:
1. Sum the scores from each scale (Vres, Pres,
FSieS).
2. Insert the score into the relevant regression
equation:
res VrQ = .95 x vres + 46.42
res PrQ = 1.36 X Pres + 12.96
res FSrQ = 1.18 x FSieS + 30.42
APPEliDIX I
ANALYSIS OF VARIANCE SUHMARY TABLE FOR THE
VERBAL AND PERFORMANCE IQ MEASURES
89

90
APPENDIX I
ANALX.SIS ____ Q:f ___ ~bBlbNCE _____ S!JMMbB.X ___ ~~~L~----fQB ____ 'l'.BE
VER.flAL_hNlL£EBi'QEM~NC.E __ IQJ:iJ;;8fi!JRES
Variable elf HS E. g --·-·---------------------------------------·---·-·----··--··--------·----·--,-~----
Impairment Status - A 1 6345.98 23.63 .0001
IQ Heasures - B 2 3947.52 53.58 .0001
IQ Dimension (V-P) - c 1 328.19 10.25 .0022
AB 2 3303.40 44.83 .0001
AC 1 737.50 23.04 .0001
BC 2 48.69 1.45 .2389
ABC 2 351.34 10.45 .0001
Error 383 142.70

APPENDIX J
NEWMAN KEULS PAIRWISE COMPARISONS FOR
VERBAL AND PERFORMANCE IQ SCORES
91
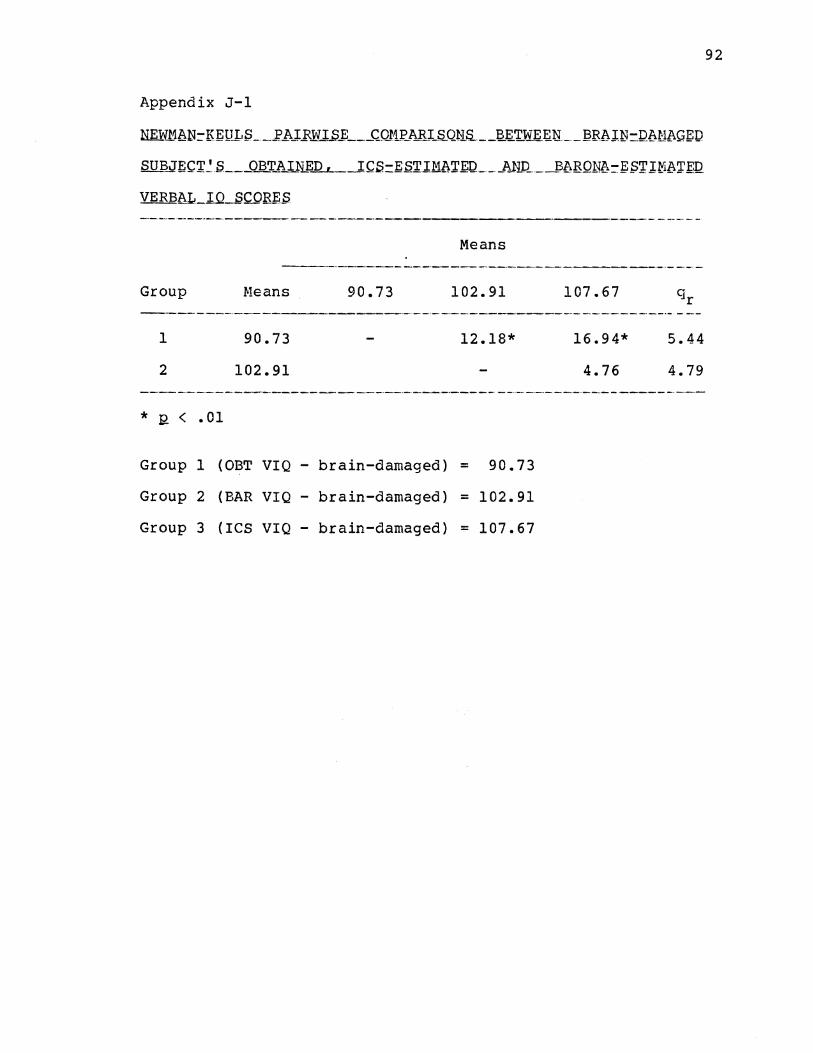
Appendix J-1
NIDY..MbN:-KEULS __ l'hJ:..FWI..S_E ___ CilllP_ARI_S..QHS.. __ I2_l;;.'r.WE_~~----12Rb.UJ=IU\.Ml\GED
SUB..JEC'r~S ___ OJ3_j:'.l\IN_i:_Q_,_ _ _IC.S=E~'rlMb.T.~IL __ A_N_Q _ _l3bBQNA=ES'1'1~b~f'.Q
VERB8L_IQ_SCQR~~
Means ------------------------------------------·----
Group
1
2
* 2 < • 01
.Heans
90.73
102.91
90.73 102.91
12.18*
Group 1 (OBT VIQ- brain-damaged) = 90.73
Group 2 (BAR VIQ- brain-damaged) = 102.91
Group 3 (ICS VIQ- brain-damaged) = 107.67
107.67
16.94* 5.44
4.76 4.79
92

Appendix J-2
N.ID:mt\N=K.&:QL.S __ ]? hJ.F.:W_l..S~ ___ C_Ql'1:t:hR.I_S-._QUS.. __ J2Ii!'t~~~~--3RA IN-Dt\Nt\~ ED
SUBJEC_T~.Q ____ QaT_ll_:t_~E_p-L.._.l~S=g_srrM8T~IL __ _A_I:iQ ___ :6t\BONb-E.STIMt\Tf!~
PERf OR!lhNC.£l_lQ_SC_QB;g;.Q
Group
1
2
* Q < • 01
f'leans
81.94
101.15
Means
81.94 101.15
19.21*
Group 1 (OBT PIQ - brain-damaged) = 81.94
Group 2 (BAR PIQ - brain-damaged) = 101.15
Group 3 (ICS PIQ - brain-damaged) = 104.61
104.61
22.67*
3.46
5.44
4.79
93
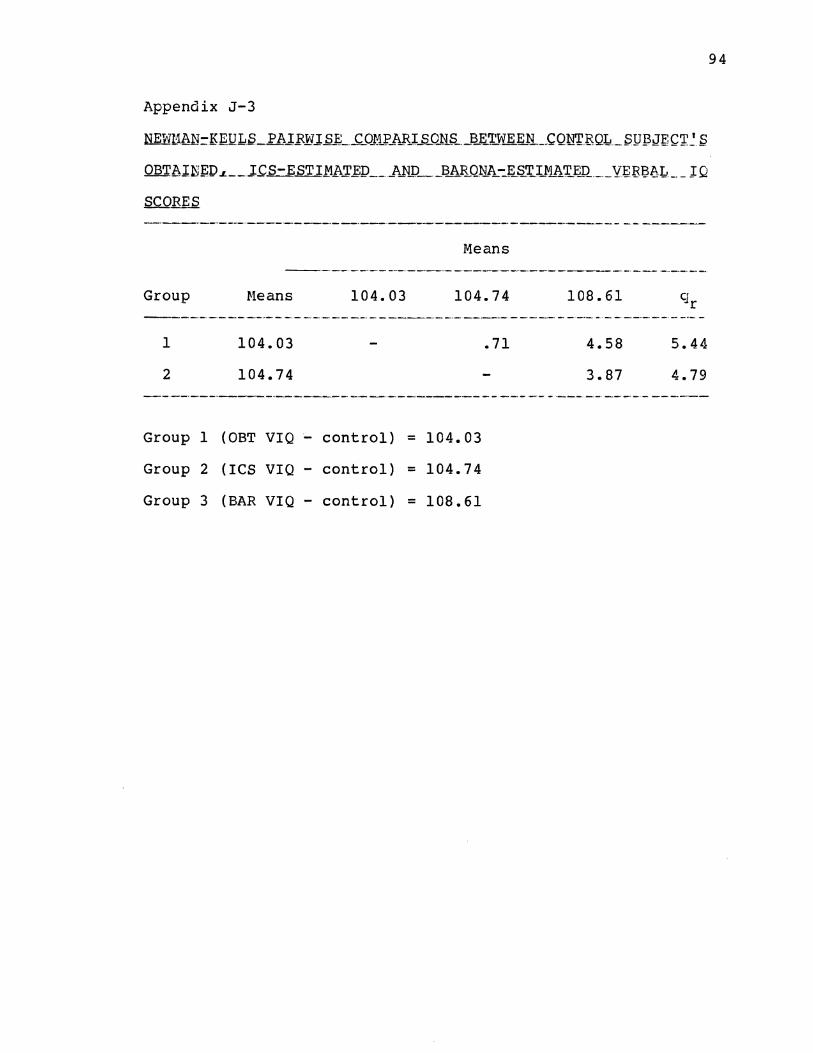
Appendix J-3
Means
Group Heans 104.03 104.74
1
2
104.03
104.74
Group 1 (OBT VIQ - control) = 104.03
Group 2 (ICS VIQ- control) = 104.74
Group 3 (BAR VIQ - control) = 108.61
.71
108.61
4.58
3.87
q r
5.44
4.79
94
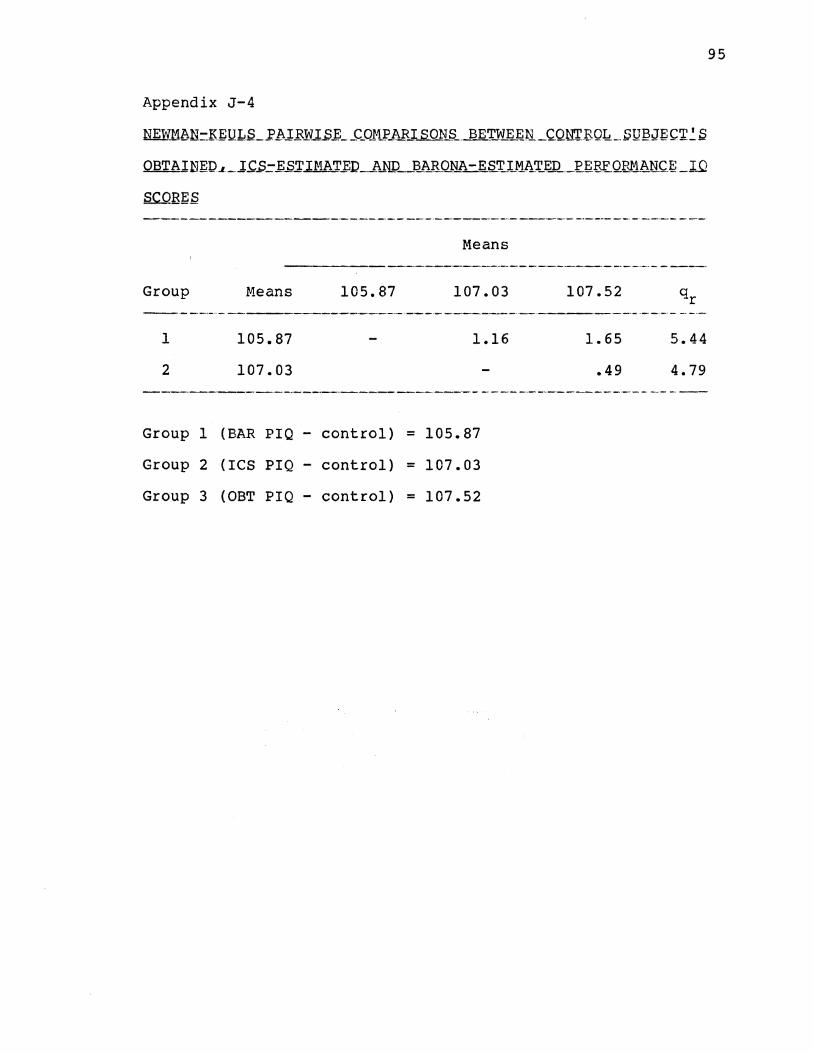
Appendix J-4
NID!11bN.:-J.{J::ULS_.I'.bl.BlV.l..S.E __ C_Ol1J'_ARJ SONS __ BET..W..li~N_C.QN'l'.BQL!. __ SQ~J~C'J'~S
I-ieans
Group Means 105.87 107.03 107.52 ----·-·---------------------·-----------------------
1
2
105.87
107.03
1.16
Group 1 (BAR PIQ - control) = 105.87
Group 2 (ICS PIQ- control) = 107.03
Group 3 (OBT PIQ- control) = 107.52
1.65
.49
5.44
4.79
95
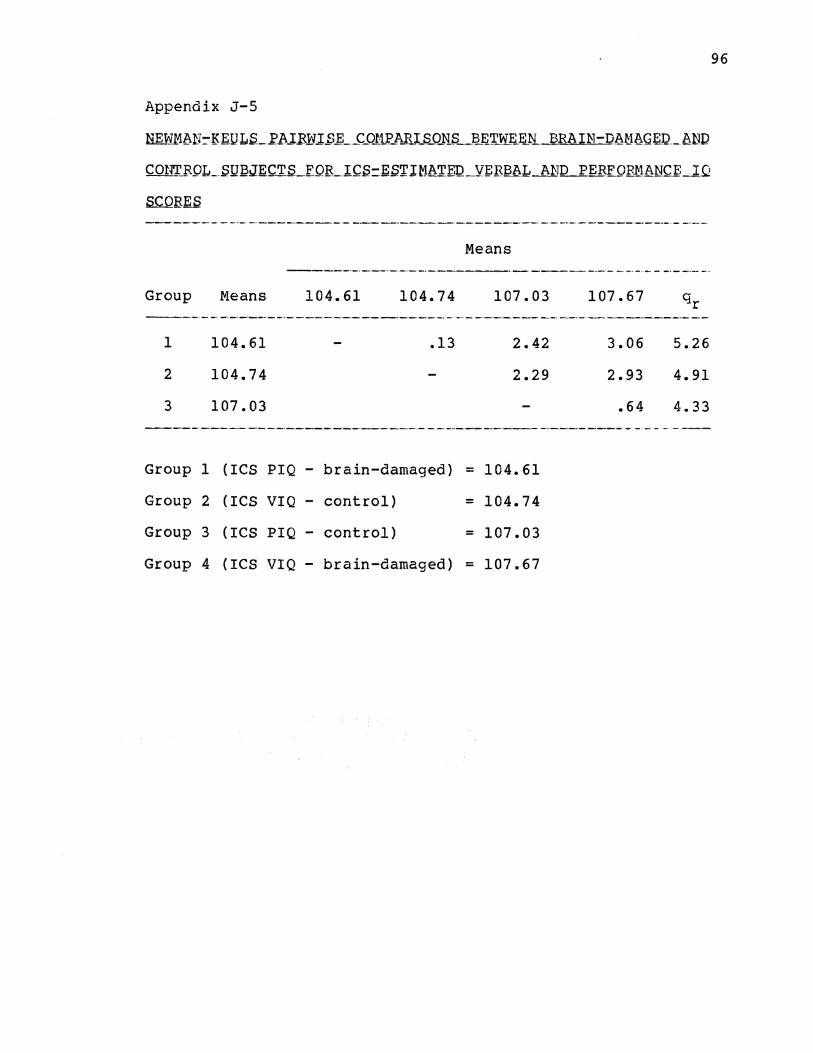
Appendix J-5
NEW1~N:::-E:.EIJLS._.I'l1-..IEN.l..S.E_..C_OJ:tr_AJU:_s_o_N_s_J)~'r_VLE.~ BRAIN-D_8M8G~ . .l:LbND
CONT_BQL_SQ~JECTS_FOILIC.S=.ES'I'.I~lAT.EQ_Yt:EB~L_li.~1D PER~QEl1~NCf._lQ
Group .Neans
1
2
3
104.61
104.74
107.03
104.61
Means
104.74 107.03
.13 2.42
2.29
Group 1 (ICS PIQ- brain-damaged) = 104.61
Group 2 (ICS VIQ - control)
Group 3 (ICS PIQ - control)
= 104.74
= 107.03
Group 4 (ICS VIQ- brain-damaged) = 107.67
107.67
3.06
2.93
.64
5.26
4.91
4.33
96

Appendix J-6
~AN=.KE!JLfLl'hl.ElVl..Si; __ CJ)lli' AR_l_S..QN__s __ fi~r:tWE~R-~EA_IN-Db,M_~GE;Q _AriD
CONTR,QL_.SUBJEC~.S_fQlL:6bBQNA-J;;.S~IMb~EP_YERBAL_AND PE.E-EQF.Mb~lC~
l.Q_SCQBf:.S
Group r1eans 101.15 102.91
1
2
3
* 2 <
Group
Group
Group
Group
101.15
102.91
105.87
.01
1 (BAR PIQ -
2 (BAR VIQ -
3 (BAR PIQ -
4 (BAR VIQ -
1.76
brain-damaged)
brain-damaged)
control)
control)
Means
=
=
=
=
105.87
4.72
2.96
101.15
102.91
105.87
108.61
108.61 Cl ~r
7.46* 5.26
5.70* 4.91
2.74 4.33
97

Appendix J-7
SCORES
Group
1
2
3
* 2 <
Group
Group
Group
Group
Neans
81.94
90.73
104.03
.01
1 (OBT
2 (OBT
3 (OBT
4 (OBT
PIQ -
VIQ -
VIQ -
PIQ -
98
Means
81.94 90.73 104.03 107.52
8.79* 22.09* 25.58* 5.26
13.30* 16.79* 4.91
3.49 4.33
brain-damaged) = 81.94
brain-damaged) = 90.73
control) = 104.03
control) = 107.52

APPENDIX K
ANALYSIS OF VARIANCE SUMl-1ARY TABLE
FOR THE FULL SCALE IQ MEASURE
99
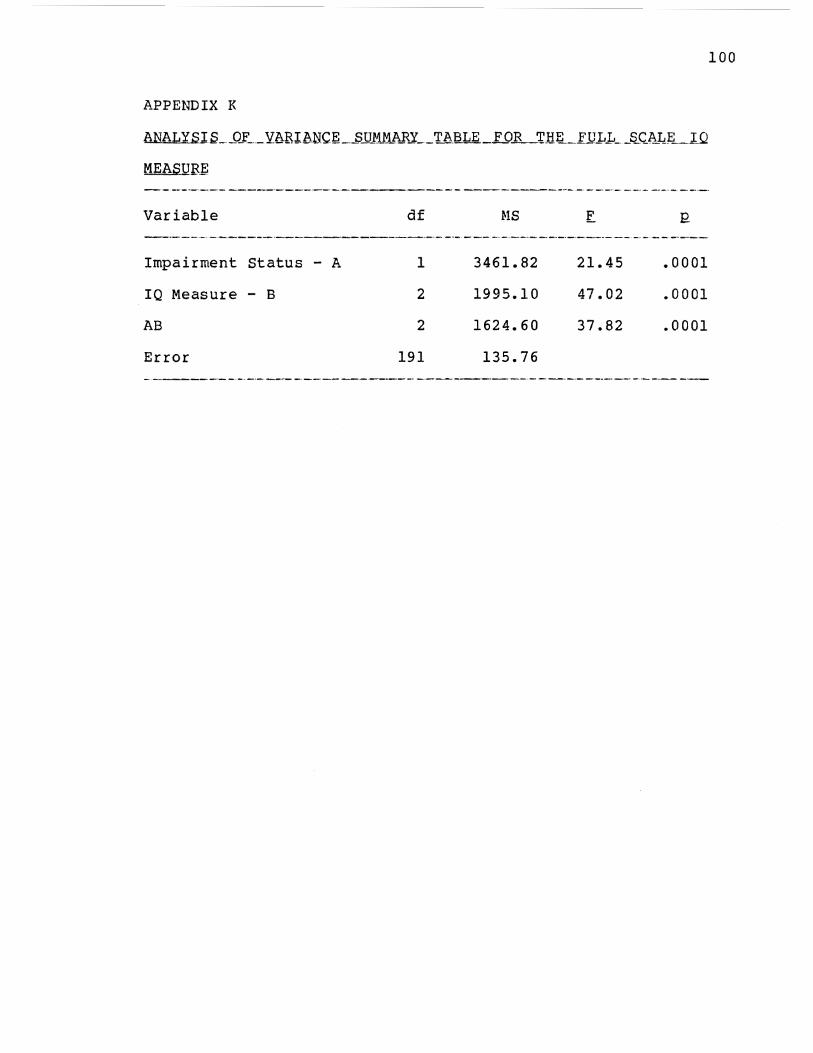
APPENDIX K
AN~J.S_J)_f ___ Yt\RibNCJ'~ _ _sjl_M_t4_li._R..Y __ TAiiLE_FOlL_TJ1~-FUJ,J .. __ ~Cli.LL_TQ
MEASQBt;
Variable
Impairment Status - A
IQ Measure - B
AB
Error
df
1
2
2
191
r.!S
3461.82
1995.10
1624.60
135.76
21.45
47.02
37.82
.0001
.0001
.0001
100

APPENDIX L
NEWMAN-KEULS PAIRWISE COMPARISONS
FOR FULL SCALE IQ SCORES
101
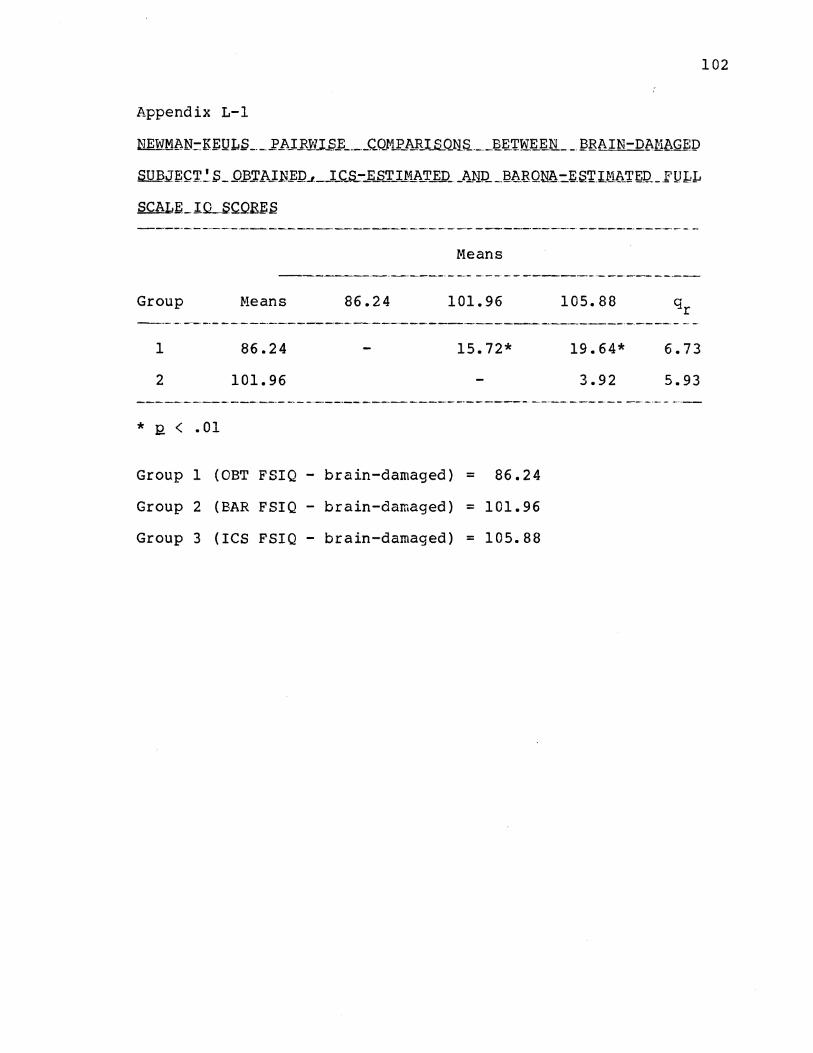
Appendix L-1
Means ------------------------------------------------
Group
1
2
* 12. < • 01
f.leans
86.24
101.96
86.24 101.96
15.72*
Group 1 (OBT FSIQ - brain-damaged) = 86.24
Group 2 (BAR FSIQ - brain-damaged) = 101.96
Group 3 (ICS FSIQ- brain-damaged) = 105.88
105.88
19.64* 6.73
3.92 5.93
102
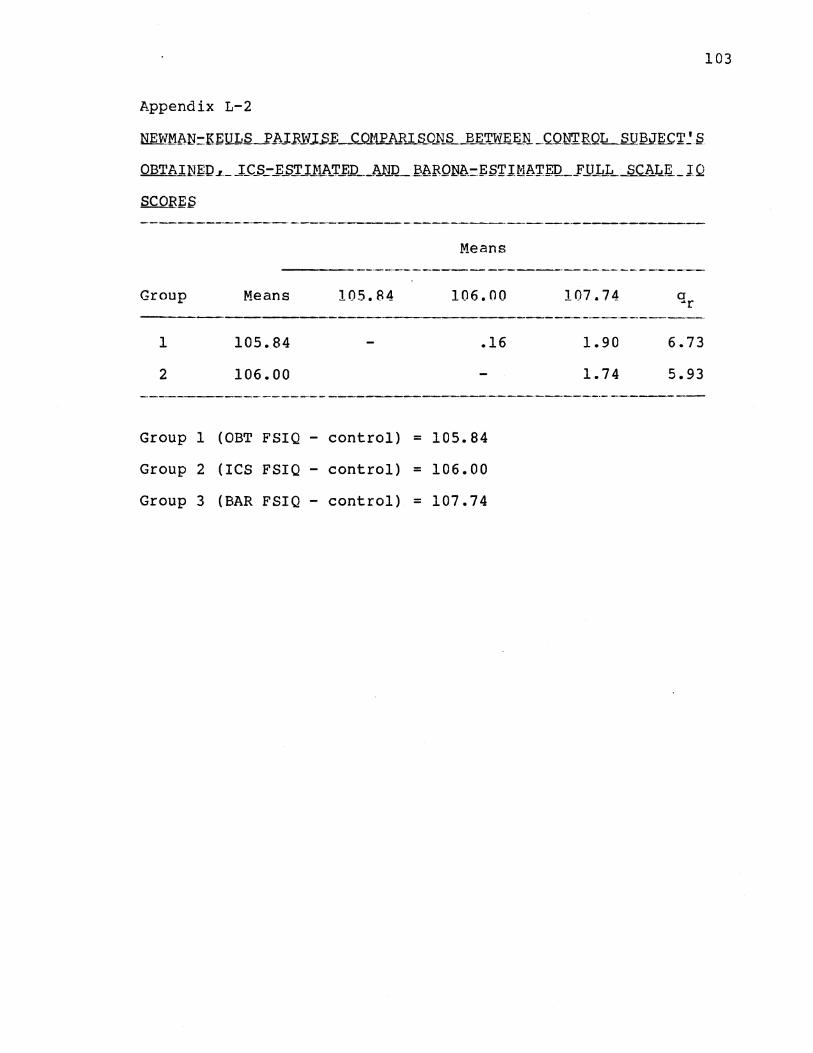
Appendix L-2
NEWMl\1~= K.EQ1QJh.l.B.W.l.S.f; __ C_011l?_l\FI S_OJ'iS_Ji.~WEJ~Ji _C.QNTRQk_S U BJE C ~~ S
OBT A.IN~D .~-._ .]_c_s_:-_i:..S~ U:L.(>._~_D ___ ARQ_ ~bFQN~=ES~IM~~f:l2 _ __FJ.TJ .. _~ _ __s_cAL.E _I Q
Means ----·------·--·-----------------·-·------·--
Group
1
2
Means
105.84
106.00
105.84 106.00
.16
Group 1 (OBT FSIQ - control) = 105.84
Group 2 (ICS FSIQ - control) = 106.00
Group 3 (BAR FSIQ- control) = 107.74
107.74
1.90
1.74
a ~r
6.73
5.93
103
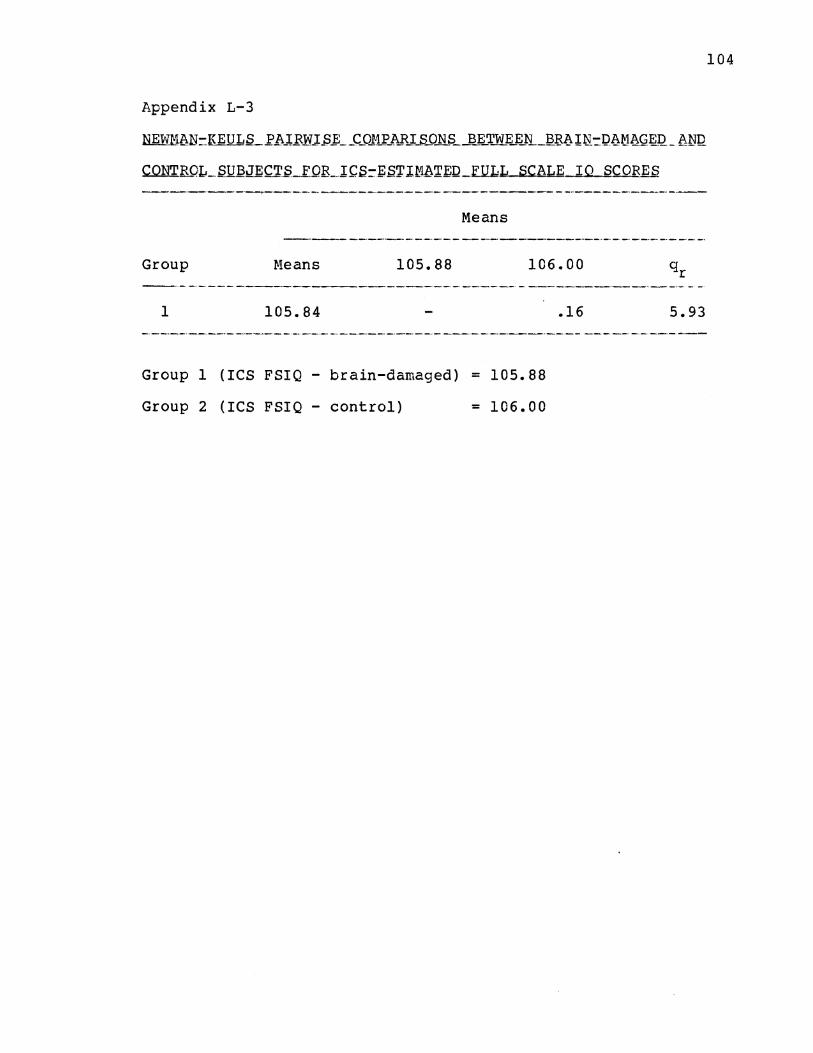
104
Appendix L-3
Means
Group Means 105.88 106.00
1 105.84 .16 5.93
Group 1 (ICS FSIQ- brain-damaged) = 105.88
Group 2 (ICS FSIQ - control) = 106.00
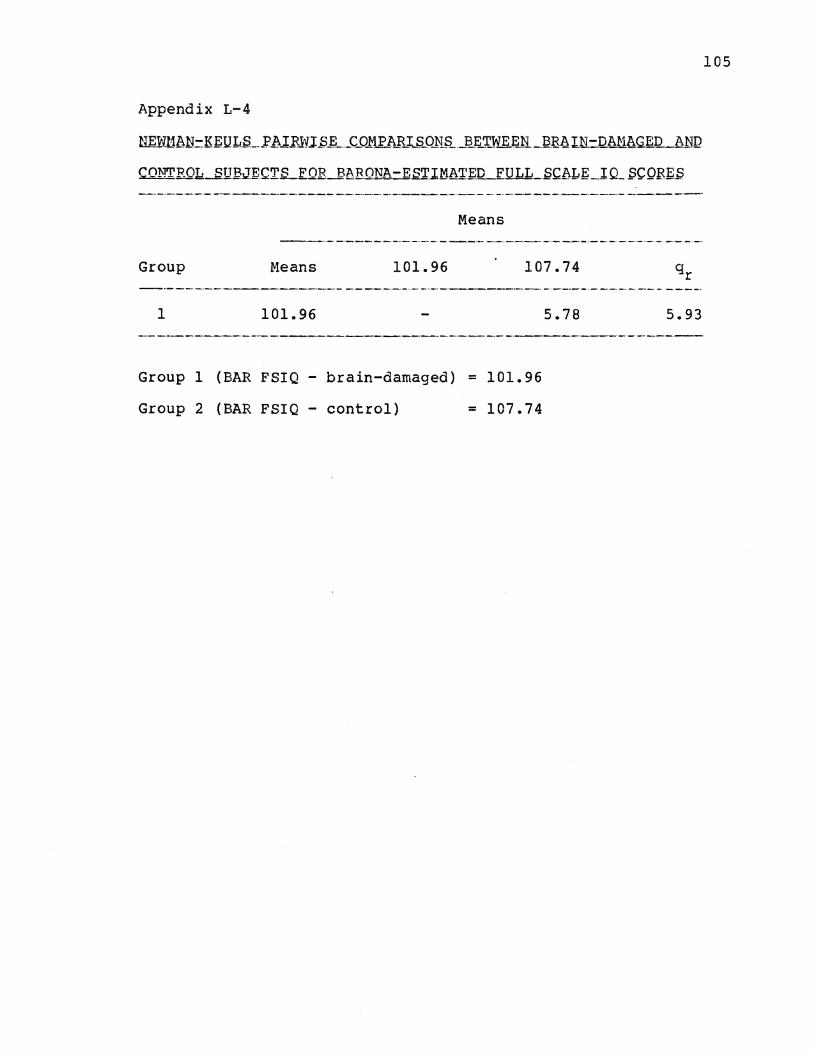
105
Appendix L-4
Means
Group Means 101.96 107.74
1 101.96 5.78 5.93
Group 1 (BAR FSIQ - brain-damaged) = 101.96
Group 2 (BAR FSIQ - control) = 107.74
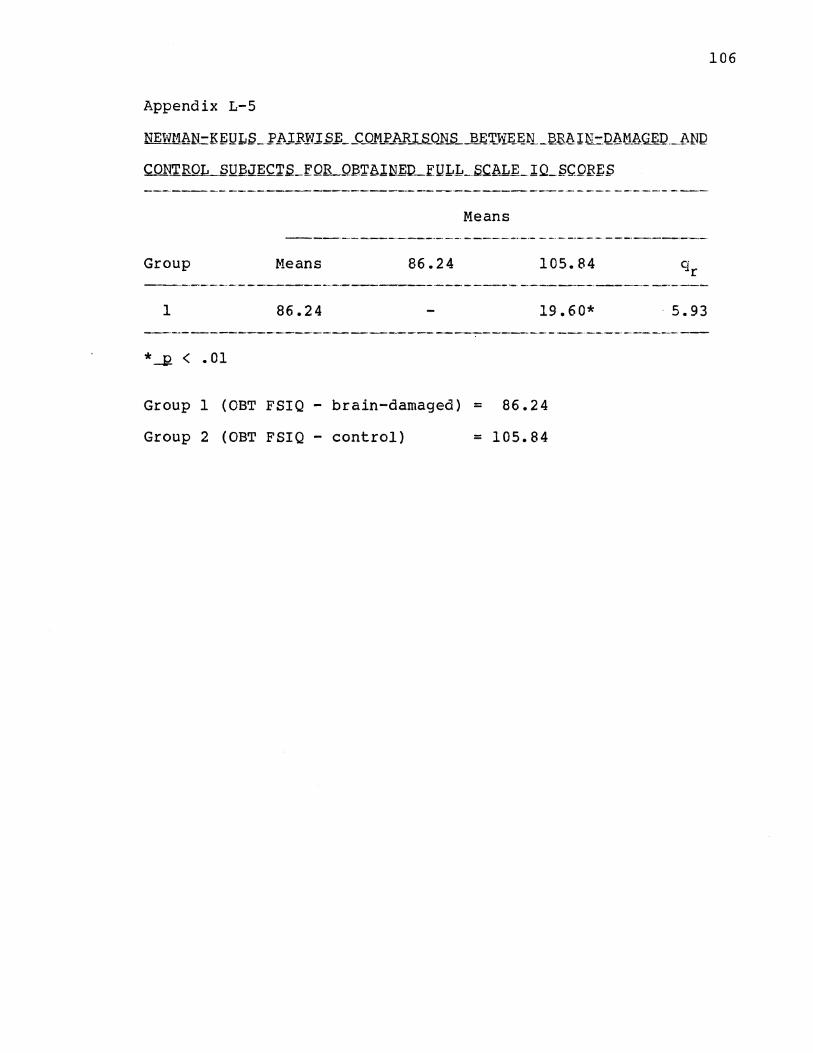
106
Appendix L-5
Means
Group r.leans 86.24 105.84
-----~--- ---·-· -----------------1 86.24 19.60* 5.93
*_!! < .01
Group 1 (OBT FSIQ - brain-damaged) = 86.24
Group 2 (OBT FSIQ - control) = 105.84

VITA
David Edwin Johnsen
Candidate for the Degree of
Doctor of Philosophy
Thesis: THE DEVELOPMENT AND USE OF AN INTELLECTUAL CORRELATES SCALE IN THE PREDICTION OF PREMORBlD INTELLIGENCE IN ADULTS
Major Field: Psychology
Biographical:
Personal Data: Born in Oklahoma City, Oklahoma, June 16, 1954, son of Odd K. Johnsen and Edith 0. Payne. Married to Kathleen L. Johnsen, August 2, 1975. One daughter, Lauren C. Johnsen, born March 27, 1984
Education: Graduated from Putnam City High School, Oklahoma City, Oklahoma, in May, 1972; received Bachelor of Science degree in Psychology from Oklahoma State University in May, 1976; received Master of Science degree in Psychology (Mental Health Specialty) from Oklahoma State University in May, 1978; completed requirements for Doctor of Philosophy degree in Psychology from Oklahoma State University in December, 1987.
Professional Experience: Psychological Assistant, Oklahoma State University, September, 1976 to August, 1977 and Bethany Guidance Center, September, 1977 to December, 1977; Mental Health Specialist Intern, Bethany Guidance Center, January, 1978 to June, 1978; Assistant Director, Bethany Guidance Center, July, 1978 to July, 1981; Teaching Assistant, Department of Psychology, Oklahoma State University, August, 1981 to May, 1982 and June, 1984 to July, 1984; Psychological Assistant, Oklahoma Department of Corrections, August, 1982 to July, 1984; Teaching Assistant, Indiana University-Purdue University at Indianapolis, August, 1984 to December, 1984; Clinical Psychology Intern, University of Indiana

School of Medicine, September, 1984 to September, 1985; Psychological Technician, September, 1984 to present; Treatment Coordinator, High Pointe Adolescent Psychiatric Treatment Center, March, 1987 to present.
Copyright © 2022 FDOKUMEN