BUSINESS PROSPECTS OF COOPERATIVES OF SMALL ...
69
BUSINESS PROSPECTS OF COOPERATIVES OF SMALL SCALE MARINE FISHERS IN WEST BENGAL A STUDY
-
Upload
khangminh22 -
Category
Documents
-
view
4 -
download
0
Transcript of BUSINESS PROSPECTS OF COOPERATIVES OF SMALL ...

BUSINESS PROSPECTS OF COOPERATIVES
OF SMALL SCALE
MARINE FISHERS IN WEST BENGAL
A STUDY

BUSINESS PROSPECTS OF COOPERATIVES OF SMALL
SCALE MARINE FISHERS IN WEST BENGAL
A STUDY
PROJECT CONSULTANT, RESEARCHER, AND AUTHOR OF THIS REPORT
Santanu Chacraverti
PROJECT SUPPORTED BY ACTIONAID INDIA
AND
SOCIETY FOR DIRECT INITIATIVE FOR SOCIAL AND HEALTH ACTION
2017

i
Preface Including a statement of procedure
Like small-scale artisans and producers everywhere in India, small-scale fishers and
fishworkers (hereafter SSF) have an uphill task surviving and making their ends
meet.
The SSF have many problems. They must operate in the market, but often do not
have what it takes to make the best of market realities and opportunities. For
example, they are handicapped by severe capital shortage, caused largely by almost
non-existent access to institutional loans at low interest. This forces them into the
hands of private credit (in the form of actual credit on interest or money advance
from merchants), which reduces their profits sharply and keeps them trapped in the
vicious cycle of capital deficiency.
What worsens matters is another usual problem—poverty of human and cultural
capital. This prevents them from exploring business prospects and opportunities
beyond the traditional, keeping them trapped in their existing way of doing
business.
One way out of this morass is governmental initiative—extending easy loans,
providing business exposure training, entrepreneurship training, and skill-training.
Unfortunately, such provisions are extremely inadequate, at least so far as West
Bengal is concerned.
The other way out is through organizing the SSF into collectives that:
Can pool monetary resources to strengthen the capital base
Can enhance the fund of social capital through cooperation and mutual aid
Can create a synergy of experiences and knowledge
Can reduce the poverty of human and cultural capital through the pooling of
whatever is available to each member
Moreover, cooperatives and other collective forms can use their joint resources to
avail opportunities that are not often available to an individual from disadvantaged
social groups. For example, they can draw on their collective resources to procure
expert help for enhancing knowledge, skill-base, and business savvy. Moreover, they
can avail governmental schemes and funds earmarked for cooperative endeavours.

ii
As studies on cooperatives show, modern collective business institutions develop
best among communities having thriving traditions of mutual aid and cooperative
behaviour. Since our concern in this study is with coastal fishworkers in West
Bengal, it is pertinent to ask whether traditional means of cooperation existed among
them. The answer is in the affirmative.
The most outstanding example of cooperation is the Khoti. We shall see what the
Khoti is in the first chapter. We shall see how it creates a democratic space for
mutual cooperation in managing the fish landing centre and the fishers’ affairs.
However, and we shall also see this, the Khoti is not a business institution per se. Let
alone being a business institution of the fishers, it does not even provide the small-
scale fishers with the means to extricate themselves from the clutches of the
moneylender of dadan-giving merchants.
But, we are running ahead of the story, which must be read in the chapters of this
study. Here, we must mention the concerns of this study.
As the title indicates, the study is concerned with finding out the business prospects
of cooperatives of small-scale marine fishers in West Bengal. The researcher has
interpreted the term ‘cooperative’ to denote not only formal cooperative societies as
defined under Indian law but any institution of collective business drawing its
membership from the local community and whose goal is the collective uplift of its
members.
The basic research was done in 2016, with most of the work concentrated during the
last few months. Since the Khoti season of 2016-17 was still underway, the economic
data collected pertained to the two previous years, i.e. to 2015-16 and 2014-15.
The following methodology was adopted in undertaking the study.
1. The literature on cooperative businesses and allied topics has been extensively
examined.
2. Initial inputs on relevant topics were taken from those deeply involved with
marine fisheries issues in West Bengal.
3. Initiation and training sessions have been conducted with key field investigators
to orient them with the objectives of the investigation. The sessions were conducted
as a two-way street, with the participants (who are experienced fieldworkers in the
fisheries sector) contributing to framing the questions to be asked and the
methodology of inquiry.

iii
4. On the basis of the above, a questionnaire-based survey accompanied by general
interviews of those surveyed and other community members were undertaken
across fishers and fisher khotis/cooperatives in Purba Medinipur and Sagar Block
of the South 24 Parganas district. The most populous set of respondents was that of
the layas, or boat-owning marine fishers who were the ones that took loans or
advances from the aratdars or byabasais. Some 30 respondents were surveyed from
3 out of the 7 Khoti-cum-cooperatives in Sagar. In Purba Medinipur District, a total
of 5 respondents were surveyed across 4 Khotis in Khejuri, 9 respondents were
surveyed from Dadanpatrapar Khoti in Ramnagar-II district, 2 respondents were
surveyed from Junput Khoti, and 1 respondent was surveyed from Soula-2 Khoti
and 1 respondent was surveyed from Baguran Jalpai-II Khoti. This makes a total of
48 layas.
The survey of the layas was two layered. The first layer was concerned with the
nature of the overall conditions of their business—the problems, possible solutions,
and overall prospects. The questions are as follows:
a) What are the main problems of the small-scale marine fishers?
b) Do you think that the total or per capita catch is declining? If yes, do you
think that this might one day lead to this business becoming unprofitable?
c) What are the raw and processed products of the small-scale marine fishers?
d) Where do the products go after they leave your hands and where do they go
from there?
e) What proportion of your products is sold raw and whether some portion of
the raw product is eaten in your home?
f) What portion of the product is dried and sold? What is the fish-drying
technique you use?
g) Do you use any chemical for conserving raw or processed fish? If you do, can
you say exactly what chemical you use? How did you learn the use of this
chemical? Where do you get it? Do you know of any harmful effect of this
chemical?
h) Who buys raw fish? What is its destination?
i) Can one process raw fish to produce other value-added products? Have you
ever thought about this? Has your khoti or cooperative ever considered this?
j) Is dried fish consumed by humans or becomes poultry feed? What proportion
of your products end up in either of the categories?
k) In what circumstances do your products become poultry feed or is considered
fit for human consumption?

iv
l) What are the steps to add value to your product and what are the paths of
distribution?
m) What are the routes and means of product distribution within and outside the
state?
n) What are the problems of procuring loans and capital?
o) What are the realities and problems of marketing of the products for the
small-scale marine fishers?
p) Are there problems of packaging and possible means of solving the problems?
q) What are the means of directly marketing the products?
See Appendices A and B for a taste of the responses in translation and original.
The second layer of questions concerned hard economic data—the amount of loans
or advances taken by the fishers, the costs incurred in fishing, the revenue from
sales, and the income. This information was taken of the two preceding seasons
(since the fishing season of 2016-17, when the survey was conducted, was still
underway). This data was not taken from the fisher from Soula-2 and from Baguran
Jalpai-II, and they were only surveyed with regard to the first set of queries. See
Appendix C for a sample survey sheet from Khejuri with responses. Of course, the
entire data is captured via tables in Chapter V.
5. Apart from the layas, some aratdars or byabasais, i.e. those who gave advances
to the layas, were also surveyed. 3 aratdars were surveyed in Sagar, 2 who
operated in Dadanpatrabar and 1 from Baguran Jalpai village. Hence, a total of 6
aratdars were surveyed. The substances of their responses have been seamlessly
incorporated in the main body of the report.
6. The principle of selection of layas and aratdars were as follows:
Given the fact that these are days of endless surveys by government departments,
NGOs, researchers, and so on, it has become difficult to get people to talk for any
length of time. There is a feeling that such surveys and interviews bring no benefit
to those surveyed and surveyors are often met with disinterest or irritation. In such
a situation, there was no question of developing a random sampling procedure—
for most randomly sampled individuals would refuse to be interviewed for any
length of time. Hence, it was useful to target only those persons who were more
likely to talk to the field investigators and would do so with sufficient interest so as
to yield useful responses. Therefore, the sampling, perforce, had to be purposive,
with a vengeance, so to say.

v
It was the same with aratdars, but for different reasons. Our field investigators
were members of the marine fishing community. Unfortunately, the issue of the
interrelationship between the aratdar and the laya is a thorny one and most
aratdars were uninterested to talk about them with members from the community.
(Of course, they would be unwilling to talk to outsiders still more, which was the
point of having investigators from within the community.) So, the investigators
could only approach aratdars who would be prepared to talk.
7. As regards the actual and possible value-added fishery products, Mr. Balaram
Basak, the former Director, MPEDA, was interviewed.
His answers have been annexed as Appendix F.
8. Since the north-east is a very important market for dried fish, an investigative
visit was made to the dry fish market in Tripura. A brief Tripura report, with
pictures, has been annexed as Appendix G.
9. The inputs from interviews, visits, and survey findings were analysed in the light
of the study concerns and the information received from other sources, including
literature review.

vi
ACKNOWLEDGEMENT
This study would not have been possible without the support of the two
organizations mentioned on the title page.
I am deeply indebted to my friends at DISHA, particularly to Sasanka Dev and
Pradip Chatterjee, for reasons which they know only too well. I thank them most for
putting up with my strange (even to me) reluctance to write this report, although the
bulk of the data was collected long back and mostly analysed. The only explanation
of the reluctance I can offer is that the findings were so depressing and some of the
issues perplexing. In this connection, I also thank my friends at ActionAid India with
all my heart.
I am particularly indebted to Debasis Shyamal, Milan Das, and Sujoy Krishna Jana
for numerous services they rendered in course of the study and putting up with my
endless demands and occasional reprimands. I wish I had their generosity and
forbearance. I am also indebted to Abdar Mullick of Sagar for his almost equal
kindness and equanimity. I am also grateful to Manasi Bera of Sagar for giving some
of her valuable time in helping me with the survey. Special thanks are due to
Gautam Bera for approaching the survey in Khejuri with a meticulous and critical
mind.
I thank all other community members at the Khotis in Dadanpatrabar, Khejuri,
Baguran Jalpai-II and I, Sagar Sangam, Khal Dhablat, and Mahishamari Hatipitia,
who have aided the study in various ways.
I will be amiss if I did not thank Srikanta Jana of Dadanpatrabar for putting up with
nagging and difficult questions about boat construction and boat prices and
Achintya Pramanik for having to wake up at midnight and answer questions about
fish prices.
I thank my friend Shyamalendu Biswas for undertaking the survey at Sheoraphuli
with such competence and at such short notice. It is the best of fortunes to have
friends whom you can shamelessly exploit.
I thank my friend Mukut Roy Choudhury for his indispensable help in arranging the
Tripura trip, accompanying me to Tripura, and vitally assisting the investigation
there. I also thank Mr. Ranen Deb Roy, officer in the Fisheries Department,
Government of Tripura for his endless help and kindness during the Tripura trip. I
also thank Mr. Swapan Kumar Das of Agartala Golbazar and Mr. Haradhan Das of

vii
Teliamura for providing important information on the dried fish trade in Tripura in
particular and the North-East in general.
Sometime in 2015, more than a year before I began this particular study, I visited
Maharashtra to study some cooperatives in that state (as part of an, as yet,
incomplete study supported by Soceo and ChildFund Germany, to both of whom I
am grateful). I had the good fortune of visiting and interviewing members of the
Arnala Fisherman Sarvodaya Sahakari Society. I am grateful to all of them and
particularly to Moreshwar Vithoba Vaiti and Rajeshji, who were extremely kind and
full of useful information about the problems of fishers’ cooperatives.
Lastly, but by no means unimportantly, I thank all those who I have forgotten to
mention in this hurriedly written statement and seek their forgiveness.
Santanu Chacraverti
Kolkata

viii
Contents
Glossary ix
Summary of the Findings x
Chapters
Chapter I : Existing traditions of cooperation 1
Chapter II : The condition of formal cooperatives
among the marine SSF 3
Chapter III : The products of the coastal SSF 5
Chapter IV : The vectors of product movement 9
Chapter V : The basic economics of fishing
and some key findings 12
Chapter VI : Summing up the economic plight
of the small-scale fisher... 38
Chapter VII: What are the business prospects of collectives
Of small-scale fishers and fishworkers... 40
References 53
Appendices
Appendix A : Sagar-sample responses
Appendix B : Dadanpatrabar Survey sample response sheet
Appendix C : Khejuri economic survey sample response
Appendix D : Balighai Market Report
Appendix E : Sheoraphuli Dried Fish Market Report
Appendix F : Interview of Balaram Basak, Summarized
Appendix G : Brief Report of the Tripura Visit

ix
Glossary of terms and abbreviations
aratdar Etymologically, one who holds stocks—a merchant; among
coastal fishing communities, the term is usually used as a
synonym for dadandar (see below); another term used is
byabasai—literally merchant
dadan Money that the fish trader (usually dried fish trader) advances
to the fisher at the beginning of the fishing season
dadandar The small trader who advances dadan to the laya (fisher)
khoti Community managed fish landing centre
laya the fisher who owns a boat, employs crew, and is the master of
his own fishing operation
SHC shuntki for human consumption
SNHC shuntki for non-human consumption
shukno mach dried fish (see shuntki)
shuntki dried fish
Often the above terms are used in plural, viz. aratdars, dadans, dadandars, layas,
etc.

x
SUMMARY OF FINDINGS
The small-scale coastal fisher’s catch has tended to decline down the years.
The main reason seems to be destructive fishing in the coastal waters
undertaken by the mechanized fishing fleet. Added to this is the pollution of
the waters.
While the overall catch has perhaps not declined, the fish stock available for
the small-scale fishers, particularly those confined to fishing close to the
shoreline has markedly decreased.
The decline in catch has been so drastic that one could have expected it to result
in disastrous decline in incomes, leading to small-scale fishing ceasing to exist
as a profession. The only reason this has not happened is that the rise in fish
prices due to rise in demand without a matching rise in supply has led to the
effect of catch poverty getting compensated to a considerable extent.
There is considerable geographical variation in incomes, as our study reveals.
But, it also reveals that very often, and strictly speaking, the laya’s business is
non-profitable. If one takes into account the capital depreciation and the
labour costs of the laya and his family, it often becomes difficult to see a profit
or even breaking-even. The business, often complemented by other economic
activity during non-fishing season, allows him and his family to survive and
barely get along.
The fact that many fishers at all break even and sometimes even make a
slender profit is because while the demand for fish has grown rapidly, the
overall catch has not kept up, leading to a steep hike in fish prices.
The following things stand in the way of the small-scale fishers making a
profit:
(a) His dearth of capital leading to his dependence on the dadandar and,
occasionally on the local moneylender;
(b) His dependence on dadan forcing him to sell his catch to the dadandar at a
price significantly less than what he could have got in the unrestricted
market;
(c) Having to sell his entire catch to the dadandar—dried or raw fish as the
case may be—preventing the small-scale fisher from exploring value-addition
options and explore the higher product and price ranges;

xi
(d) His cooperative connections, whether in the form of the khoti or the
formal cooperative, failing to provide him with either capital or advanced
market opportunities.
Why then does the fisher take dadan? One must understand that taking
dadan is a viable mode of living, even when it militates against profits. For,
the dadandar offers various advantages to the fisher, not available from other
sources. The fisher can take various freedoms with his dadandar and very
often defaults on paying back the advance. The dadandar usually takes a
lenient view of delayed payment or even long-term non-payment, for he is
more concerned with being assured of fish supply at a reduced price. The
dadandar’s economics is buying at as low a price as possible so that he can
make a higher profit when he sells the fish—other things remaining the same.
If the fisher fails to repay his dadan, it is transferred to the next season, when
it is added to the current advance and contributes to pulling down the price
that the fisher gets for his catch. This benefits the dadandar. Therefore, the
dadandar is ever-ready with his advance and even advances money for the
personal contingencies and needs of the fisher. Indeed, the relationship
between the dadandar and fisher often has a personal nature and often
involve some amount of bonding. This, in turn, hugely benefits the fisher, at
least in the short term. (But then, we largely live in the short term, and, as
Keynes said, “in the long term we are all dead”. Over time, the fisher and the
dadandar often develop a kind of personal relationship, which allows for a
degree of manoeuvring and negotiation on both sides. This personal-
economic relationship is advantageous not only to the dadandar but also to
the fisher, which partly explains why, notwithstanding occasional serious
grievances on the latter’s part, there is no serious or sustained effort to get rid
of the dadandar’s shackles. (Of course, getting rid of these shackles is far
easier said than done.)
Nevertheless, if the small-scale fisher continues to remain tied to his existing
economics of dadan-taking, notwithstanding the advantages, and the
consequent lack of access to markets near and further off there is no scope for
his profits to increase.
The main problem with the dadandar’s control over the fisher is not so much
the reduced price that the fisher gets. This is because, as we have found in this
study, even if the fisher received the open market price, it would not suffice to
keep him out of poverty. The main problem of dadan rather is the fisher’s
losing his entire catch to the dadandar. This leads to the fisher’s total lack of
control over his catch, creating a condition where one cannot think of the

xii
fisher exploring, individually or collectively, other options for his catch—for
example, that of various kinds of value addition.
Nevertheless, it is less the dadandar and more the dwindling supply and the
injuries inflicted by an increasingly unpredictable weather (in the climate
change scenario) that hurts the fisher the most.
Hence, it is difficult to conceive of a solution that might decisively empower
the fisher and lead him, within reason, to a certain degree of mastery over his
fate.
Yet, opportunities exist. For example, dry fish has a national and international
market and direct access to them or to agents further down the trade chain
can bring significantly higher earnings or profits.
This can only be ensured through better access to capital, information, and
training. Properly functional collectives can be a means to that end. In fact,
fish, even in its dried form, is a perishable item and call for technologies of
preservation. Such technologies become available only with considerable
capital, which, in the given situation of high cost of liquidity, renders
cooperative means of capital formation desirable.
However, the track record of existing cooperatives inspires little confidence in
their being able to make a new start. This is true not only for the marine
fisheries cooperatives, but for cooperatives across West Bengal, for this is one
of the states with a poor showing in cooperative success.
Moreover, as is evident to anyone acquainted with the community, and as
this study confirms, the desire for cooperative business did not emerge either
within the community or even among solitary individuals within the
community.
Further, the failure of cooperatives has created low level of optimism about
cooperative solutions.
Hence, it is unlikely to expect that successful cooperative forms will emerge
unaided within the community (and merely aided by some external support).
Rather, it seems that if cooperative forms must succeed, the basic inspiration
and guidance must come from outside.
There are some examples of this kind of successful intervention, classically in
the case of Mondragon, and subsequently, in India, in the case of SEWA in
Gujarat.
If a team of activists—with requisite vision, knowledge, practical experience,
and social capital—dedicated themselves to the task, then there is a possibility

xiii
of breaking the vicious cycle of failure leading to pessimism and low distrust,
which, in turn, leads to more failure.
However, things must be taken one step at a time. The beginnings should be
made with a single collective. A huge amount of funding would be needed,
which might possibly come, at least partly, from social investment projects.
The experiment, if successful, could act as a model for further action and
exploration.
In all this, one should not make a fetish of formal cooperative societies. It might be important to think of more dynamic and flexible forms of organization such as small producer companies and even citizens’ societies with new leadership prepared to think in a more entrepreneurial fashion.
The beginning can only be made by asking enterprising and genuinely interested community members to put together a collective of sincerely motivated and forward looking persons, including a fair share of young people, prepared to venture and experiment. Whether the collective would be a producer company or some other institutional form can be worked out later on. The experiment can take off, if only such a group comes together. If the experiment succeeds, it can form a model for others of its kind. Not all groups can succeed, nor everyone will. Nor can everyone be a successful member of an entrepreneurial group. Even inspired social development cannot produce even and uniform results.

1
Chapter I
Existing traditions of cooperation
In official documents, the term Khoti is most often translated as ‘fish landing centre’.
However, a more appropriate term is ‘community managed fishing camp and fish
landing centre’. For, the Khoti is a community of SS fishers and fishworkers coming
together, from near and relatively far, at a specific site of on the seashore (in some
cases river banks) in order to go about their business in a spirit of collective
understanding and mutuality. The business, of course, is fishing (during the entire
marine fishing season, traditionally from October to February) and allied activity.
Some of the fish must be sold raw. Others are dried and sold as shuntki (dried fish).
Sorting and drying of fish involve prolonged use of the beach and employment of
large numbers of people.
The Khoti is in many ways a democratic organization of the various stakeholders at
the landing and fish drying site. The fishers (boat owners and crew) of course
dominate in numbers, but other local service providers are included in the Khoti.
Hence, the Khoti would consist not only of fishers who own boats, the fishers who
act as crew, the driers, and the sorters, but also shopkeepers, barbers, generator
owners or any other local service provider on whom the Khoti operations depend.
The Khotis usually also include fish vendors as members.
In fact, the Khoti is in many ways an organization typical to West Bengal. This state
does not have fishing villages per se. Nor does it have genealogically and socially
defined fishing community. The coastal villages consist of families who fish and
families who do not, at least professionally. Moreover, various castes and
communities are involved in professional fishing. Last, but not the least, the fishing
operation on the sea coast involves fishers and crew members from other localities.
Therefore, a purely village-based fishing operation is not an ideal model. What is
required is a different institutional arrangement to allow fishers and fishworkers
from different castes and villages to work together.
The Khoti administration, democratically elected through voting, takes care of the
day to day management of the landing centre and allied activities, resolving conflicts
and taking steps to avoid possible avenues of friction. In addition, it deals with
government agencies and other coastal communities. For all this, the Khoti charges a
small fee from its members. From the vendors and wholesale buyers of dry fish it
also charges a small fee per sack of goods purchased, in return for the orderly
management of marketing operations it provides. Thus, this community-based
administration provides management and governance services that are, on the one
hand, low cost and, on the other, given its democratic and local-rooted character,
sensitive to the interests of the various stakeholders.

2
The Khoti is the most striking example of occupational cooperation among the
coastal SSF, particularly because it operates on a rather large scale, often with
thousands of members in a single Khoti. However, it cannot normally be described
as an institution of social enterprise. For, it is essentially a community-based
democratic administrative arrangement to facilitate individual business, but is not a
business organization per se. The Khotis in Sagar have registered themselves as
cooperatives, for reasons that will be explored in further detail in the next chapter.
However, as we shall see, even they have failed to develop themselves as genuine
community business institutions.
At Dadanpatrabar—preparing the chaataal (ground) for fish drying

3
Chapter II
The condition of formal cooperatives among SSF in
Sagar and Purba Medinipur
During the turn of the century, marine fishers’ cooperatives in Maharashtra
demanded and received loans from the National Cooperative Development
Corporation (NCDC). This opened the way for disbursing similar loans to fishers
elsewhere. However, such loans (for boats, nets, and so on) could be made available
to fishers only through fishers’ cooperatives. This resulted in the West Bengal
government encouraging development of marine fishers’ cooperatives in West
Bengal. Now, whereas in Maharashtra, and in some other states, fishers’
cooperatives had developed as community-business ventures, and sought soft loans
to further their business activities, here in West Bengal the marine cooperatives
sprang up with the sole objective of availing of the loan facility. Thereafter, once the
loans were disbursed, the cooperatives quickly went into hibernation. The formal
framework was maintained and yearly audits are done for the sole purpose of
retaining a platform that can become useful when such cooperative loans become
available again. Moreover, several malpractices emerged in the taking of the NCDC
loans and in their non-refund, which also emerged during the survey. Several
cooperatives became serious defaulters.
Hence, in Purba Medinipur, while the Khotis, which are purely community
organizations, on the whole, function actively, the cooperatives languish and merely
continue as potential government loan procuring mechanisms.
In Sagar, the historical situation was different with respect to Khotis. Here, the
Khotis emerged later than in Purba Medinipur. With the exception of Mahishamari
Hatipitia Marine Khoti Matsyajibi Samabay Samiti, the Khotis did not enjoy
complete official recognition and, hence, there was a problem with receiving the
support that is due to the Khotis from the fisheries department. Further, it became
apparent to fishers that the cooperative was a good thing for receiving various kinds
of support from the government, including the usual ones that a Khoti expects from
the fisheries department. Therefore, the various Khotis in Sagar decided to present
themselves in the guise of cooperatives. The needful formalities were completed and
Khoti members became cooperative members.1 Only Mahishamari Hatipitia was an
1 However, the creation of marine cooperatives in Sagar resulted in an interesting problem. The Khoti is an inclusive institution, which includes everyone above the age of 18 who is in some way connected to the marine fishing activity. The Khoti committee is thus an elected board representing the entire local marine community—minus the children and adolescents. The cooperative as a legal entity, however, is a different kettle of fish (no pun intended). Here, only fishers who are local residents can be members and two persons from the same family (say husband and wife) cannot be members of the same cooperative. Hence, the governing board of the cooperative represents not the entire Khoti but only a small section of the Khoti members who are eligible to become members of the cooperative.

4
officially recognized Khoti, which is precisely why it did not become a cooperative.
It only applied to become a cooperative in 2015 and its process of registration was
not completed even during the time of the survey. It became a cooperative to avail of
government schemes over and above such support as was available to the Khoti.
Table 1: Khotis and cooperatives in Sagar
Khoti
Number of cooperative members Number of Khoti members who are
not members of the cooperative
Male Female Boat-owners (all
male)
Others (mixed figures, gender
not disaggregated)
Hatipitia 18 0 80 700
Beguakhali 265 20 75 600
Sagar Matsyajibi 128 35 25 500
Sagar Sangam 60 45 46 450
Khal Dhablat 41 0 20 30
Bishalakshmi 70 15 0 20
Ma Ganga 112 40 0 50
This explains why the cooperatives in Sagar have some important activity to place
on the table, while the Purba Medinipur cooperatives come up empty handed.
Therefore, in the case of both Sagar and Purba Medinipur, marine cooperatives have
not developed with the real intention of community business. They are not real
cooperatives, but institutions of a different kind.
Further, only in the case of the two women’s cooperatives in Purba Medinipur, i.e.,
in Junput and at Dadanpatrabar, have we seen a little serious effort to do business.
The failure of business in the case of the Dadanptrabar Mahila Matsyajibi
cooperative is a case of pure business failure, and is primarily due to problem of
leadership, business savvy, skills etc. The same applies to the poor performance of
the women’s cooperative at Junput.
Yet, this board is recognized by the government and runs the Khoti. Therefore, in this vital sense, formation of cooperatives in Sagar involves a certain serious truncation of Khoti democracy.

5
Chapter III
The products of the coastal SSF
There is not much to be said about the existing products of the coastal small-scale
fishers. The catch is fish (which includes shrimp). When the catch is sold as
commodity, the broad division is that of fresh fish and dried fish. The dried fish has
two product and commodity forms—for human consumption and for non-human
consumption (fish feed and poultry feed). Thus, the essential product tree is as
follows:
Product and its break-up across the khotis
The main activities of the coastal SSF revolve around dried fish (shukno maach or
shuntki in local language). However, there is a small fraction of fresh fish catch. The
following tables indicate fractional variation in product and their utilization across
areas:
Fish (including shrimp)
Fresh Fish
Dried Fish
For human
consumption For non-human
consumption
Poultry Feed Fish Feed
Various dried fish varieties, each having
its own distinct appeal for the consumer.
However, beyond this, the product does
not appear to take on further value-
additions—except for an occasional
pickle, or fish powder. But, pickles are
not marketed and fish powder only seems
to have a market in some tribal areas of
Assam.
Various products.
However, the products are
largely prepared and
consumed at home

6
Table 2: Nature of catch in Sagar
Fresh fish Dried Fish
Proportion of total catch
2-3% of the total catch 98-97% of the total catch
Whether for human or
non-human consumption
For human consumption
Marked for human
consumption (Consists of the
larger sized edible fish varieties)
Marked for non-human consumption (Consists of very small-sized fish and shrimp): becomes a vital constituent of fish feed and poultry feed at a subsequent point in the chain
Proportion of partial catch
100% of the fresh fish catch
40-45% of the total dried fish
catch
55-60% of the total dried fish catch
Utilization
Usually 20-30% consumed by the crew and by the household
of the laya(boat-owner) and the rest
sold
The entire amount is sold; an
insignificant portion may be
retained for domestic
consumption
The entire amount is sold
At Sagar—using brooms to separate the drying fish so as to prevent getting glued together

7
Table 3: Nature of catch in Dadanpatrabar Khoti
Fresh fish Dried Fish
Proportion of total catch
10-12% of the total catch
86-88% of the total catch
Whether for human or
non-human consumption
For human consumption
Marked for human
consumption (Consists of the
larger sized edible fish varieties)
Marked for non-human consumption (Consists of very small-sized fish and shrimp): becomes a vital
constituent of fish feed and poultry feed at a
subsequent point in the chain in the chain
Proportion of partial catch
100% of the fresh fish catch
Usually 25-35% of the total dried fish
catch
Usually 65-75% of the total dried fish catch
Utilization
Usually 15-20% consumed by the crew and by the household
of the laya (boat-owner) and the rest
sold
The entire amount is sold; an
insignificant portion may be
retained for domestic
consumption
The entire amount is sold
Junput Khoti
In the case of Junput Khoti, the layas do not make shuntki. They catch the fish and
sell the fresh fish to the saudagars, vendors, and aratdars. The vendors sell the fresh
fish in the local markets. The aratdars in this case are fresh fish stockers. The
Saudagars are the ones who dry the purchased fish and sell them near and far.
Junput—Dry fish stocked

8
Table 4: Nature of catch in the Khotis in Khejuri-II
Fresh fish Dried Fish
Proportion of total catch
5-10% of the total catch
90-95% of the total catch
Whether for human or
non-human consumption
For human consumption
Marked for human
consumption (Consists of the
larger sized edible fish varieties)
Marked for non-human consumption (Consists of very small-sized fish and shrimp): becomes a vital constituent of fish feed and poultry feed at
a subsequent point in the chain
Proportion of partial catch
100% of the fresh fish catch
Usually 15-25% of the total dried fish
catch
Usually 80-85% of the total dried fish catch
Utilization
Usually 4-5% consumed by the crew and by the household
of the laya (boat-owner) and the rest
sold
The entire amount is sold; an
insignificant portion may be
retained for domestic
consumption
The entire amount is sold
Hereafter, we shall refer to the shuntki for human consumption as SHC and the
shuntki for non-human consumption as SNHC.
It ought to be noted that the bulk of the dry fish produced by the coastal SSF is
SNHC, which is a vital constituent of poultry feed and fish feed. Nowadays, poultry
feed is becoming standardized. It usually consists of different constituents, including
soybean powder, crushed corn, crushed rice grain, crushed oyster shells, vitamin
supplements and so on. Crushed dried fish is added as a vital constituent to this mix.
Something similar happens in the case of fish feed though here the constituents are
somewhat different (for example, soybean is not a part of the mix and pride of place
goes to powdered rice or wheat chaff, fish powder, and fish oil).

9
Chapter IV
The vectors of product movement
In considering the vectors of product movement, we shall concentrate on shuntki.
We shall talk about fresh fish also, but to a lesser extent and in a later chapter.
Both in Purba Medinipur and in Sagar, the local fishers sell to the local merchants.
Mostly, the sale is made to the merchant from whom the fisher takes an advance at
the beginning of the fishing season. We shall examine this particular economics later.
Right now, we shall focus on how the product leaves its source and travels out and
about.
We shall first talk about the SHC.
The boat-owners in Sagar and Purba Medinipur sell to the dadandar traders who
have made advances to them at the beginning of the season. The selling pattern of
traders tends to be determined by convention, but is flexible and can be rather
variegated.
For example, the traders in Sagar take their SHC to the Nishchintapur market and
Barkha market in South 24 Parganas. A major outlet for SHC appears to be the
Balighai market in Purba Medinipur (see Appendix: A note on Balighali shuntki
market). There is a local sale of SHC from all these markets. But, particularly in the
case of Balighai, the volume of SHC sold to local consumption is rather small
compared to sale to outside demand. Merchants come to Balighai market to buy
SHC for sending to north-eastern India, Bangladesh, Jharkhand, and Orissa.
Another gateway to north-eastern states, largely Assam and Tripura, was the market
at Sheoraphuli, in Hooghly. It collected its dried fish stock mostly from Bakkhali in
South 24 Parganas and from various points in Purba Medinipur, largely Junput. It
sold some 60% of its stock to the north-east and the rest to local retailers who came
in to buy from Hooghly, Nadia, Burdwan, Birbhum, and Murshidabad.
North-eastern India, Bangladesh, Jharkhand, and Orissa—these are the names that
usually came up during the survey, as external markets for dried fish from West
Bengal. However, there seems to be some indication from sources (particularly from
the survey in Tripura) that the trade in SHC and even SNHC is a pan-Indian trade
and merchants can buy from and sell to different purchasers across India in response
to demand. This is the key aspect of trade in shuntki (and indeed most other
dynamically traded goods)—there are supply shortages and occasional demand
hikes. Then vendors try to respond by buying stock from wherever they can,
provided the price is affordable. Indeed, the businessman’s success lies in able to
detect demand and respond to it in a manner that will not only bring profit but will
create for him new contacts and access to hitherto unexplored networks. It is this

10
nose for opportunity and flexibility in procurement that leads to sustained business
success.
Thus, dried fish from the West Bengal coast can end up anywhere and dried fish
from anywhere in India and Bangladesh can end up in West Bengal. However,
under normal circumstances, traders tend to sell to other known merchants, who in
their turn sell to their known vendors, ensuring continuance of the conventional
vectors.
There are no available figures for supply and demand to various regions and, in any
case, the present research was concerned with ordinal rather than cardinal numbers.
So, while we did not get demand data for SHC with respect to different Indian states
and Bangladesh, we did learn that the north-east is probably the most important
recipient of SHC from West Bengal. The main hub of SHC trade in the north east is
the Jagiroad market, reportedly the largest dry fish market in Asia. Jagiroad is
located 50 km east of Gauhati. Fish from all over India—West Bengal, Gujarat, Uttar
Pradesh, and Tripura—come to this market. The main stock of sea fish comes from
West Bengal and Gujarat. The market generally operates for 3 days - Thursday to
Saturday. Dry fish from the market goes to all the North-eastern states and Sikkim.
Some of the dry fish are exported to Singapore, Bhutan, Malaysia and other
Southeast Asian countries. 1000-1200 trucks come to the market every year. 70 per
cent sales happen during the peak season and 30 per cent sales happen during the
off season. The price of fish varies according to size and quality. Sea fish and
freshwater fish like Bomla, Punti, and Misa range from Rs 7 to Rs 110 per kilogram.
This is not a retail market and a minimum of one sack must be bought by a customer
(Jagiroad Dry Fish Market).
Usually, the markets in all the north-eastern states get their SHC and SNHC from
Jagiroad market. However, Tripura, which is a huge consumer of shuntki, is
somewhat independent of Jagiroad. Of course, it takes in a huge amount from
Jagiroad. But, its own traders also procure goods directly from other states (mostly
West Bengal, but also Gujarat, Tamil Nadu, and Andhra Pradesh).2
2See the Report on Tripura in Appendix.

11
Product Movement: An indicative sketch3
3 The percentages shown below are merely indicative. No rigorous data exists.
Producers and processors: The boat-owner (Laya) who
processes fish in Sagar or Purba Meinipur or traders who buy raw
fish from layas and process it (this happens in Junput but as yet
not in other khotis)
Small trader (based
or operating in Sagar
or Purba Meinipur)
from whom the laya
has taken loan
90%
Stock-holder (go-down owner) or bigger trader (mostly
based in Junput or Balighai or, occasionally, in
Sheoraphuli). They would occasionally buy from the laya,
but only from the few who are not tided to dadandars
and are free to sell their products to whomever they
choose.
Small trader
(without any loan-
nexus with laya)
7%
3%
SNHC sold directly to
poultry companies like
Suguna and fish feed
companies and fish or
poultry farms within the
state and outside
SNHC sold to
traders or
middlemen
catering to
poultry
companies and
fish feed
companies from
other states and
Bangladesh
SHC sold to
agents from
other states or
traders trading
with other
states and
EXPORTERS
Small traders operating in
Sagar sell SHC to agent of
merchants in other states or
middleman selling to other
states

12
Chapter V
The basic economics of fishing and fish sale of the coastal SSF and
some key findings
The economics and basic algebra of the fisher’s business
The fundamental economic features of marine small-scale fishing in West Bengal are
capital shortage and chronic indebtedness.
Long before the khoti season begins in October, the laya must have a substantial
amount of capital. For, he must repair his boat to make it safe for the sea, repair his
nets or buy new ones, select the crew to be hired, settle terms with them and perhaps
pay some of them an advance, buy his usual supplies, keep his establishment (the
hut on the beach which is his temporary home and office during the khoti season)
running and provided for, make any expenses necessary for fish drying on the
beach, and so on. Indeed, since he is usually a person suffering from liquidity
shortages, he might need some money to tide him through the lean months before
the khoti season. Usually, the entire or bulk of the capital (and perhaps some
domestic loan) comes as an advance from a trader (the byapari or byabasai). The
latter is ready with money long before the khoti season begins, even as early as April
or even March, close on the heels of the previous Khoti season.
Now, it must not be thought that the money advanced to the laya is in one package.
There would be a substantial amount advanced before the start of the khoti season.
However, the laya might need more money during the course of the season. Usually,
the dadandar is only too happy to advance these amounts, which simply add up to
make the total advanced.
It is important to understand the nature of the money advanced by the trader to the
laya. It is not in the form of a loan against which the laya must give an interest. It, as
we have already mentioned, is a dadan or advance. The terms of the advance are
simple. The laya must sell his entire catch to the dadandar (one who has given dadan)
trader and at a price less than what the laya would get if he were to sell it to
someone else.
How much discount is the laya compelled to give the dadandar? This varies widely
according to locality, whether the product is SHC or SNHC, and the amount of
advance taken (for greater amount of advance given, the dadandar tends to take
greater discounts). Anyway, the following might serve to give an idea of the
discount range (note, discount figures mentioned are not as compared to the highest
prices available but the usual going rate in the local market):
Discount rates are generally significantly less in Purba Medinipur. For SNHC, Rs. 1
per Kg discount is the usual rate and it could at the best be as high as Rs. 1.50. For

13
SHC, the discount rate could be as high as Rs. 3. This applies to both Dadanpatrabar
and Khejuri. (For Khejuri, the discount rate of SHC could be as high as Rs. 4 per Kg.)
In the case of Junput, the Layas sell only fresh fish and we did not get much
dependable information of dadan rates (the two layas interviewed took loans and
not dadan). In the case of the Sagar Khotis, the discount rate appears to be higher.
Layas reported discount rates for SNHC as high as Rs. 5 per Kg and discount rates
for SHC as high as Rs. 10 per Kg. However, this was in terms of the highest price in
the market during the season. More balanced rates of discount (measured against the
usual going rates) would seem to be Rs. 3 per Kg for SNHC and Rs. 6 per Kg for
SHC.
Can we try to understand the economics of the marine fisher during the fishing
season? We shall see that it can be a bit difficult.
As we have seen, the economics usually begins long before the fishing season starts
when the laya starts taking dadan from the dadandar. Moreover, this is added to the
money due to the dadandar from the previous year, if the fisher has not been able to
repay his earlier loans, as often happens.
Now, once the fishing season starts, the fisher moves in to the seashore with his
entire family. From now on, they will be staying on the shore. Members of the family
will be assisting the operation. Here, one thing must be taken into consideration.
When the fisher estimates his cost, he estimates the entire cost of running his
establishment. Thus, the family’s daily provisions for the entire fishing season are taken
into account. Indeed, the fisher’s seashore establishment and its costs are part of the
fisher’s economics. The fisher, however, does not take his and his family’s labour into
account in estimating his costs. We shall do so, but later.
Let us formulate the basic algebra of the fisher’s business.
The fisher’s cost, C, is as follows:
C = E + W + M + O
Where E is Equipment (i.e. boats, nets, etc., depreciated for the year); W is Wages; M
is Repair and maintenance; O is operational cost (i.e. diesel, food, beverages,
medicines, etc.).4
The fisher’s revenue consists of revenue from sale of dried fish and raw fish and is as
follows:
Revenue = dried fish + Fresh or raw fish, or, in obvious shorthand
4 We do not take into account the Khoti subscription. For, these are relatively small amounts. Moreover, it is certainly less in amount than the monetary value of the services the Khoti provides free of cost and which, in all fairness, should be added to the fishers’ income if the subscription must be added to his cost. So we can do without this exercise altogether.

14
R= D + F
Therefore, his profit P is as follows:
Profit = Revenue – Cost
Or, P = R – C = [D +F] – [E +W + M + O + S]
There is one other element that comes into the picture if the fisher does not take a
dadan but takes loan on interest, I.
Then P = R – (C + I)
This is straightforward and expected. Of course, the variables can take on any value,
from 0 to any positive number. Moreover, R could be less than C, making P negative.
Towards concrete information on the variables
Do we have concrete information on the variables?
This is the difficult part. Our survey has yielded data on these variables and on other
related information. However, the data is not entirely reliable, as we concluded after
detailed discussion with the surveyors. We are attaching all the survey sheets, which
readers can consult. However, it is important to give attention to several aspects of
the matter. First, the respondents surveyed are usually not in the habit of keeping
meticulous accounts and largely provided their data from memory—with obvious
attendant difficulties. Secondly, there is a natural resistance to sharing information
related to actual incomes. Thirdly, and more importantly, there is a tendency to
inflate costs so as to prove that incomes are poorer than they actually are. (This is
something that the surveyors admitted, on cross-questioning. It must be borne in
mind that some of the surveyors are actually fisher engaged in the business.)
Fourthly, there were inefficiencies on the part of the surveyors, which became
apparent on cross-examination—for example, they failed either to explain or handle
the question on capital depreciation. Further, they occasionally failed to carefully
check the information presented for gaps, inconsistencies, and incongruities—which
has resulted in an occasional submission being rejected or the data had to be
corrected after further questioning. This, of course, is not unusual in surveys. We
shall meet such instances as we proceed. However, notwithstanding all these
glitches, we have received important information on the fishers’ business and have
tried to make use of it in trying to address the main concerns of this report.
The surveyors were carefully instructed to collect the annual deprecation data in the
following simple manner.
Ask the price of the equipment (in Rs.) p
Inquire about the expected lifetime of the equipment (in yrs) f

15
Simply divide the first with the second p/f (Rs.
per year)
Major structural repairs, which add majorly to the existing value of boats and whose
effects last over years can be similarly depreciated.
The boats and nets need relatively minor repairs each year. However, those expenses
were to be included under usual costs.
The above information is inescapably individual. This is because nets and
particularly boats vary a great deal according to material and make. This is why, in
order to be very correct, information was needed from each individual fisher.
The surveyors invariably failed to procure the depreciation values. What they did
instead was to ask for and submit the repairing cost of equipment under the given
head. This might appear to be a very serious lapse. It is. However, once we analyse
the data we see that the absence of depreciation values is not as great a lacuna as it is
likely to be have been in other circumstances. We shall see why this is so. Here, we
can merely mention that most of the poorer fishers incur losses or are at the break-
even situation. Hence, adding the depreciation would only indicate the severity of
their plight, which is apparent as it is. Therefore, the absence of concrete values is
not as grave as it would have been in other circumstances.
The possible range of the depreciation—a note
The main capital expenditure of the small-scale fisher is on boat and net. The
smallest boat that the marine fisher uses easily costs Rs. 70,000. When there is even a
small engine on board, which is readily the case with sea-fishers, the price is not less
than Rs. 100,000. The less poorer fishers use boats that cost from Rs. 200,000 to Rs.
250,000. The slightly better off fishers use boats that go deeper into the sea. Here the
price can easily be from Rs. 450,000 to Rs. 500,000—depending not only on the size of
the boat but on the materials (mainly, the wood) used to build it. Now, estimating
the depreciation cost can be tricky. This is because the lifetime of the boat varies
widely, depending not only on the material used and nature of the construction but
also the geographical locale. For example, boats that get the benefit of entering a
river and anchoring there have longer lifetimes, while boats that do not get the
benefit of slightly sweeter and relatively still water (for example, in Dadanpatrabar)
endure much less.
There is another difficulty in working out the depreciation rate. Often rather than
occasionally, repairs are so extensive that they result in a major overhaul. This is
almost like buying a new boat. However, the cost would be reported under annual
repair. It would simply be more than in other years.
Therefore, in order to truly estimate the boat related cost for an individual fisher, the
best means would often be to add up all costs (purchase cum repairs) on a boat

16
during, say, the last ten years, and simply divide the quantity by ten. If, perchance,
two boats got purchased during this period, one might simply divide the total cost
by 15, for a new boat would last at least 5 years, and with only minor repairs.
However, procuring this data would be extremely difficult.
Similar issues obtain with regard to the net. A good net usually lasts for about 3
years, with relatively minor repairs. After that, and almost certainly after 4 years, the
net needs replacing. The durability varies a little with regard to the quality of the
net, the nature and locale of its use, and on contingencies.
If the depreciation were taken into account, how much difference would it make to
the actual costs? For a poor small-scale fisher’s boat costing close to Rs. 100,000, it
could be as high as Rs. 15,000 per year (for these boats do not last more than 7 years).
For larger boats costing around Rs. 250,000, the boats last easily up to 5 years and
then the repair costs continue to increase until the fisher must buy a new boat in
another five years. Therefore, the annual depreciation would be about Rs. 25,000. For
larger boats costing 400,000 to 500,000, the longevity would be around 10 years and
the annual depreciation would be Rs. 40,000 to Rs. 50,000.
Even for the poorer fishers, the behundi net would cost not less than Rs. 18,000. For
the larger and pricier nets, the price could be as high as Rs. 30,000. Thus, the annual
depreciation for the net could hover between Rs. 6,000 and Rs. 10,000.
Given the above numbers, the annual depreciation for the fisher for boat and net
could be as low as Rs. 21,000 and could be as high as Rs. 60,000, the average being
somewhere around Rs. 40,000. Once we bear this range in mind, it, if required, can
be used in the place of specific depreciation data.
In the case of marine fishing, capital depreciation, for all practical purposes, reduces
to the depreciated value of boat and net. These are the two major capital assets for
the SSF, having several-year lifetimes.
Note that data was sought from each fisher for two years, so as to allow for a sudden
annual high or low. A three-year period would have been still better, but as far back
one goes, the quality of the data tends to suffer. Therefore, data was sought only for
the two previous seasons (years).
The economic data from the Khotis
Let us start with Khejuri.
Five persons were surveyed in Khejuri. One must note that the fishers in Khejuri
often took loans on interest instead of or in addition to dadan. This has caused some
variation in the table for Khejuri.

17
Table 5: The Laya’s income in Khejuri
0 1 2 3 4 5 6 7 8 9 10 11 12
PER-
SONS YEAR
LOAN AT THE
BEGIN- NING
OF THE FISHING SEASON
LOAN AS
DADAN
LOAN ON
INT.
EXPENSE
IN TERMS
OF
WAGES, CONSU-
MABLES ETC.
EXPENSE
ON BOAT
AND NET
REVENUE FROM
SELLING OF FISH
INT. PAID
ON LOAN
INCOME: COL. 10 MINUS
(COL. 4+COL.
5+COL.7)
LABOUR (OF SELF
AND FAMILY)
IN WORKING
DAYS
MULTIPLY
COL. 6 WITH MIN
WAGE
LABOUR ACCOUNTED
INCOME: COL. 10
MINUS (COL. 4+COL.
5+COL.7)
1 2015-16 25000 0 25000 15000 12000 54000 4000 23000 100 20000 3000
2014-15 30000 20000 10000 10000 15000 70000 5000 40000 120 24000 16000
2 2015-16 25000 0 25000 12000 8000 50000 3000 27000 110 22000 5000
2014-15 40000 30000 10000 12000 10000 80000 6000 52000 120 24000 28000
3 2015-16 40000 30000 10000 8000 12000 55000 1200 33800 100 20000 13800
2014-15 35000 20000 15000 7000 15000 60000 4000 34000 120 24000 10000
4
2015-16 50000 30000 20000 50000 10000 70000 3200 6800 110 22000 -15200
2014-15 40000 20000 20000 12000 10000 90000 8000 60000 120 24000 36000
5
2015-16 65000 50000 15000 20000 10000 100000 3000 67000 120 24000 43000
2014-15 50000 30000 20000 12000 10000 90000 8000 60000 120 24000 36000
Average 40000 23000 17000 15800 11200 71900 4540 40360 114 22800 17560
Median 40000 25000 17500 12000 10000 70000 4000 37000 120 24000 14900
For a bird’s eye view, the appropriate figures to view are those indicating the twin
central tendencies—the arithmetic mean (average) and the median. As we can see
from the figures, in most of the columns the mean and median are pretty close, often
convergent, indicating normal or close to normal distribution.
The second column is highly interesting. It shows the amounts of money that the
fishers take as dadan. The mean is Rs. 23,000 and median Rs. 25,000. It is alarming
that for this relatively small sum, the fishers are compelled to sign away their catch
to the dadandar (not only is this signing away a matter of having to give the fish at
discounted rates, it is also a matter of not being able to take advantage of any price
hikes in the market.)
Column 7 is a crucial column, for it gives us the revenue figures for the whole
season. Here, we see rather humble figures (given that they are for the entire
season)—Rs. 71,900 (average) and Rs. 70,000 (median). But, of course, the main
columns of interest are columns 9 and 12, showing incomes. We see that the seasonal
incomes are rather poor. As per column 9, the average income is Rs. 40,360 and the
median income is Rs. 40,000. Now, in the case of Khejuri, the khoti fishing season is
roughly 4 months. This would imply an average of Rs. 10,000 per month for the The minimum wage rate reported is that actually prevailing in the villages concerned in the period under consideration.

18
fishing season. However, most of the fishers in this area are almost wholly fishers,
i.e. with little significant income outside fishing. Therefore, the above is the bulk of
the income for the entire year. It goes without saying that as a figure for annual
income, this is very poor indeed. Moreover, if one takes into account the cost of the
labour of the fisher and his household, we find that very little is left and in one
instance the income becomes negative. Therefore, the fishers’ incomes are very close
to that earned by labour at minimum wage rates for unskilled labour.
When confronted with such low figures, one might recall the caveat mentioned
earlier. The fisher often mentions somewhat inflated figures for cost so as to conceal
his actual income. (They are less likely to under-report sale figures, for that
information can often be checked.) Information from knowledgeable circles indicates
that the fisher could report costs higher by 20% (this would not be any higher in this
particular survey for the surveyors were from the fishing community and would be
able to see through too inflated figures). So let us apply this caveat to the present
income figures and assume that the fisher has inflated his costs by 20%. Now, by
simple arithmetic, if costs have been increased by 20% to get the present cost figures,
they must be scaled down by 16% to get the original figures. Let us now apply this to
the cost components of the average and median values. The resulting figures are as
follows:
Table 6: Effect of cost reduction on central tendencies in Khejuri
1 2 3 4 5 6 7 8 9 10 11 12
Year
Loan
at the begin-
ning of the
fishing season
Loan
as dadan
Loan
on int.
Expense
in terms of
wages, consu-
mables etc.
Expense
on boat and net
Revenue from
selling
of fish
Int. paid on
loan
Income:
col. 7 minus (col.
5+col. 6+col.8)
Labour (of self
and
family)
Multiply col. 10
with min
wage
Labour
accounted income:
col. 9 minus
col. 11
Average 40000 23000 17000 13272 9408 71900 4540 44680 114 22800 17992
Median 40000 25000 17500 10080 8400 70000 4000 40760 120 24000 14900
Compared to earlier figures, we see an immediate increase in average and median
incomes. However, the concerned cost figures were not too high in relative terms, a
16% reduction leads does not lead to serious reduction in absolute figures and,
hence, not a substantial rise in income figures. (The average income increases by Rs.
4,320 and the median income increases by Rs. 3,760.)
There is one aspect of the matter that we have not considered? What would have
happened to the income if the fisher was not compelled to sell the fish to the
dadandar at discounted prices? For Khejuri, we succeeded in getting reliable figures
on total weight of fish sold and the total discount that the fisher had to make to the
dadandar. If the fisher did not have to pay the dadandar, his income would have
increased by the corresponding amount. Let us put these figures together.

19
Table 7: Increase in income if there were no dadan or loan on interest
1 2 3 4 5 6 7 8 9
PER-
SON YEAR INCOME:
LABOUR
ACCOUNTED INCOME
TOTAL QUANTITY DRIED FISH
SOLD TO THE
DADANDAR (KG)
DISCOUNT GIVEN
PER KG (RS.)
INTEREST GIVEN
ON LOAN
TOTAL
DISCOUNT (RS.)
LOSS DUE TO
HAVING
TAKEN LOAN ON
EXCESSIVE INTEREST
INCOME INCREASE
THAT WOULD HAVE BEEN ACHIEVED
UNDER CONDITIONS
OF NO DADANDAR OR
NO PRIVATE LOAN
1 2015-16 23000 3000 1400 05 4000 0 3000 3000
2014-15 40000 16000 1500 3 0 7500 0 7500
2 2015-16 27000 5000 1800 06 0 2000 2000
2014-15 52000 28000 3000 3 0
9000 0
9000
3 2015-16 33800 13800 1500 4
0 6000
0 6000
2014-15 34000 10000 1200 3.50 0
4200 0
4200
4 2015-16 6800 -15200 2200 3.18
0 7000
0 7000
2014-15 60000 36000 3500 3 0
10500 0
10500
5 2015-16 67000 43000 3000 4
0 12000
0 12000
2014-15 60000 36000 3000 3 0
9000 0
9000
CENTRAL
TENDENCY OF
INCOME
ENHANCEMENT
AVERAGE 7020
MEDIAN 7250
These are substantial increases. We can now put together the combined incomes due
to hypothetically lessened costs and absence of dadandar or private interest.
Table 8: Central Tendencies in a situation of lessened cost, no dadan or no interest
A B C D E F
Central
Tendencies
Straight
income
(Rs.)
Labour
accounted
income
(Rs.)
Straight
income
after 16%
reduction
of cost
(Rs.)
Labour
accounted
income
after 16%
reduction
of cost
(Rs.)
C + increase in
income in the
scenario of no
dadandar and
no private
interest (Rs.)
D + increase in
income in the
scenario of no
dadandar and
no private
interest (Rs.)
Average 40360 17560 44680 17992 51700 25012
Median 37000 14900 40760 14900 48010 22150
5 Loan taken on interest and not as dadan. 6 Same as above

20
Now, we have happier figures. The chief items of interest are C and E, for these are
figures for actual incomes (or what the actual income would be if certain conditions
are met). D and F are just ways to put the incomes into perspective. Anyway, the
important thing to remember here is that for Khejuri these are seasonal figures—for
a 4-month season. Moreover, for many fisher families, these would the main annual
income figures, for most families have no other steady or substantial income. Once
the figures are divided by 12, the results are poor.
Moreover, and unfortunately, we can’t forget depreciation. For the rather small boats
used by the poor Khejuri fishers, the price would be around Rs. 80,000 to Rs. 100,000.
With appropriate repairs, such boats would easily last 8-10 years. Therefore, the
annual depreciation would be around Rs. 10,000. (This, of course, would be in
addition to repairs; but these have been taken into account). In addition, we would
have to deduct another Rs. 6,000 for depreciation on account of the net. (The Khejuri
fishers use nets that cost less than Rs. 20,000.) Once these figures are deducted, we
see that even with reduced costs and the dadandar and mahajan (private
moneylender) out of the picture, incomes take a serious dip.
What accounts for the low incomes? The main reason that comes up as a constant refrain in
the fishers’ responses is decline in catch. Without hesitation, and almost without exception,
the respondents surveyed in blamed this on destructive fishing by the heavily mechanized
boats and, occasionally, on pollution of the waters.
Now, let us look at the data from Junput. Only two persons were surveyed at
Junput. As we have noted, the fishers at Junput do not dry their fish. They catch the
fish and sell the fresh fish to the saudagars, vendors, and aratdars. The vendors sell
the fresh fish in the local markets. The aratdars in this case are fresh fish stockers.
The Saudagars are the ones who dry the purchased fish and sell them near and far.
Although only two were interviewed at Junput, the interviews yielded lots of useful
information. However, here we are concerned only with their incomes.
Table 9: Junput costs and incomes
0 1 2 3 4 5 6 7 8 9 10
PER-SONS
YEAR
LOAN AT THE
BEGIN-NING OF
THE FISHING SEASON (TAKEN
ON INTEREST)
EXPENSE IN TERMS
OF WAGES &
USUAL CONSUM-
ABLES
EXPENSES ON BOAT AND NET)
REVE-NUE
FROM SELLING OF FISH
INTEREST PAID ON
LOAN
INCOME: COL.
5MINUS (COL.
3+COL. 4+COL.6)
LABOUR (OF SELF
AND FAMILY)
MULTIPLY COL. 6 WITH MIN
WAGE
LABOUR ACCOUNT-
ED INCOME:
COL. 7 MINUS COL. 9
1 2015-16
30000 580700 16000 742500 10500 135300 210 42000 93300
2014-15 20000 563460 15000 680000 5600 95940 210 42000 53940

21
2 2015-16 0 549000 26000 700000 0 125000 210 42000 83000
2014-15 50000 552400 20000 640000 14000 53600 210 42000 11600
Average 25000 561390 19250 690625 7525 102460 210 42000 60460
Median 25000 557930 18000 690000 8050 110470 210 42000 68470
Here, the thing to note first is that no dadan has been taken. On three of the total
four occasions noted, the business has taken the help of loan on interest.
The second thing to note is that on all the four occasions, the basic income is positive
and so is the labour accounted income. Although we have only four occasions, still we
indicate the average and median values for convenience. We find that, as compared
to Khejuri, the incomes are better.
The problem arises, of course, as soon as we start thinking of applying depreciation
rates. We have seen that the annual depreciation rate for those with larger boats and
nets could be as high as Rs. 60,000. The Junput fishers do use such boats and nets. So,
we deduct Rs. 60,000 form their income (from the average and median incomes). We
see that the income takes a sharp dip and the labour accounted income almost
disappears.
However, the entire situation changes if one were to reduce the cost component by
16% (as we have done earlier) and see the result.
Table 10: The incomes at reduced costs
1 2 3 4 5 6 7 8 9 10
CENTRAL TENDENCIES
LOAN AT THE
BEGIN-NING OF
THE FISHING SEASON (TAKEN
ON INTEREST)
EXPENSE IN TERMS
OF WAGES &
USUAL CONSUM-
ABLES
EXPENSES ON BOAT AND NET)
REVE-NUE
FROM SELLING OF FISH
INTEREST PAID ON
LOAN
INCOME: COL.
5MINUS (COL.
3+COL. 4+COL.6)
LABOUR (OF SELF
AND FAMILY)
MULTIPLY COL. 6 WITH MIN
WAGE
LABOUR ACCOUNT-
ED INCOME:
COL. 7 MINUS COL. 9
Average 25000 471568 16170 690625 7525 195362 210 42000 153362
Median 25000 468661 15120 690000 8050 202747 210 42000 160747
Here, the effect is dramatic. Because the reported costs are relatively rather high, a
reduction of 16% causes a striking decrease in terms of absolute numbers resulting in
a remarkable rise in incomes. Now, the deductions for capital depreciation do not
hurt so much.
Let us now look at the data from Dadanpatrabar. But, before looking at the data, one
must take note of one thing. The fishers in Dadanpatrabar almost never take loan on
interest, at least with regard to their business. They meet their monetary needs by
taking dadan from aratdars. Therefore, in the table that follows (as in the tables
relating to Sagar), there are no columns indicating loans taken on interest and the

22
loan at the beginning of the season is shown straightaway as dadan or advance. The
table is as follows:
Table 11: Costs and incomes from Dadanpatrabar
0 1 2 3 4 5 6 7 8 9
PER-SONS
YEAR
DADAN AT THE BEGINNING OF THE FISHING SEASON
EXPENSE IN TERMS OF WAGES & USUAL CONSUMABLES
EXPENSE ON BOAT AND NET
REVENUE FROM SELLING OF FISH
INCOME: COL. 5 MINUS (COL. 4+COL. 3)
LABOUR (OF SELF AND FAMILY)
MULTIPLY COL. 7 WITH MIN WAGE
LABOUR ACCOUNTED INCOME: COL. 6 MINUS COL.8
1 2015-16 70000
150000
72000 216000 -6000 450 90000 -96000
2014-15 90000 125000 110000 204000 -31000 450 90000 -121000
2 2015-16 100000
366000
30000 340000 -56000 600 120000 -176000
2014-15 120000 261000 59000 419000 99000 600 120000 -21000
3 2015-16 80000
322000 32000
221600 -132400 450 90000 -222400
2014-15 80000 424500 100000 219000 -305500 540 108000 -413500
4 2015-16 120000 347000 30000 207500 -169500 450 90000 -259500
2014-15 140000 494800 105000 303400 -296400 720 144000 -440400
5 2015-16 70000
340000 62000 169800 -232200 540 108000 -340200
2014-15 50000 358000 30000 204000 -184000 540 108000 -292000
6 2015-16 75000 247225 30000 115000 -162225 360 72000 -234225
2014-15 90000 288550 75000 135000 -228550 540 108000 -336550
7 2015-16 50000 150400 40000 108000 -82400 360 72000 -154400
2014-15 80000 175800 75000 100000 -150800 360 72000 -222800
8 2015-16 80000 262800 40000 136000 -166800 540 108000 -274800
2014-15 135000 274100 130000 136000 -268100 540 108000 -376100
9 2015-16 75000 404000 35000 233250 -205750 360 72000 -277750
2014-15 225000 719500 155000 290700 -583800 540 108000 -691800
Average 96111 317259.7 67222 208792 -175690 497 99333 -275024
Median 80000 309775 60500 205750 -164525 540 108000 -272525
The first to notice are the revenue figures in Column 5. Once again, the mean and
median figures are close enough to suggest near normal distribution. But, the
surprise comes with the income figures in Column 6. Not only are both the mean
and the median figures negative, all except one of the actual income figures (i.e. on
one of the two years of a single laya) are also negative.
When confronted with such extremely low figures, one is only more strongly
tempted to scale down the cost figures by 16% to approach what could be truer
figures. Let us do that. The resulting figures are as follows

23
Table 12: After cost reduction by 16%
1 2 3 4 5 6 7 8 9
YEAR
DADAN AT THE
BEGINNING OF THE FISHING SEASON
EXPENSE IN TERMS OF WAGES &
USUAL CONSUMABLE
S
EXPENSE ON BOAT AND NET
REVENUE FROM
SELLING OF FISH
INCOME: COL. 5 MINUS (COL.
4+COL. 3)
LABOUR (OF SELF AND
FAMILY)
MULTIPLY COL. 7
WITH MIN
WAGE
LABOUR ACCOUNTED INCOME:
COL. 6 MINUS COL.8
Averag
e 96111 266498 56467 208792 -114173 497 99333 -213507
Median 80000 256431 50820 205750 -118111 540 108000 -203345
As we can see, this does not help. The incomes remains negative (i.e. even the basic
income figures) with the amount of loss incurred increasing alarmingly when labour
is accounted for. Since this happens in the case of both central tendencies, it is not
surprising that this also happens in the case of the majority of the instances (7 out of
the 9 persons surveyed), although we need not give details of the figures.
What happens in a hypothetical situation where there is no dadan and hence no
discount to be given to the dadandar? Let us look at the following table for
Dadanpatrabar.
Table 13: Once we remove the discount that the fishers are forced to give
1 2 3 4 5 6 7
PER-SONS
YEAR IN-COME:
LABOUR ACCOUNT-
ED IN-COME
IMPROVED INCOME AFTER
ESTIMATED COST
REDUCTION BY 16%
IMPROVED LABOUR
ACCOUNTED INCOME AFTER
ESTIMATED COST
REDUCTION BY 16%
TOTAL DIS-
COUNT GIVEN
TO DADAN-DAR ON SNHC + SHC + FRESH
SHRIMP
IMPROVED INCOME IN HYPO-THETICAL
SCENA-RIO
WHERE THERE IS
NO DADAN (COL.4 – COL.8)
IMPROVED LABOUR
ACCOUN-TED
INCOME IN HYPO-THETICAL
SCENA-RIO
WHERE THERE IS
NO DADAN (COL.4 – COL.8)
1 2015-16 -6000 -96000 29520 -60480 42500 74570 -15430
2014-15 -31000 -121000 6600 -83400 80000 91400 1400
2 2015-16 -56000 -176000 7360 -112640 37500 47110 -72890
2014-15 99000 -21000 150200 30200 40000 192600 72600
3 2015-16 -132400 -222400 -75760 -165760 50000 -22760 -112760
2014-15 -305500 -413500 -221580 -329580 122000 -92260 -200260
4 2015-16 -169500 -259500 -109180 -199180 35000 -72080 -162080
2014-15 -296400 -440400 -200432 -344432 110000 -83832 -227832
5 2015-16 -232200 -340200 -167880 -275880 -167880 -275880
2014-15 -184000 -292000 -121920 -229920 -121920 -229920
6 2015-16 -162225 -234225 -117869 -189869 29000 -87129 -159129
2014-15 -228550 -336550 -170382 -278382 27000 -141762 -249762

24
7 2015-16 -82400 -154400 -51936 -123936 24500 -25966 -97966
2014-15 -150800 -222800 -110672 -182672 17000 -92652 -164652
8 2015-16 -166800 -274800 -118352 -226352 34000 -82312 -190312
2014-15 -268100 -376100 -203444 -311444 66000 -133484 -241484
9 2015-16 -205750 -277750 -135510 -207510 37600 -95654 -167654
2014-15 -583800 -691800 -443880 -60480 41000 -400420 -508420
Columns 2 and 3 are our old acquaintances from the original table on
Dadanpatrabar. 4 and 5 are the effects of hypothetical cost reduction on each
instance of income.
In presenting the data on discounts to dadandars in Dadanpatrabar, we have
shortened our presentation by not specifying the number of Kg sold, reduction per
Kg, and so on. We have only given the data on the total discount given to the
dadandar by the laya for the season. This is given in Column 5. Note that the laya in
Dadanpatrabar sells not only dried fish but fresh shrimp to the Aratdar at a
discounted rate and hence that rate is also included in the figure. The data on
discounts from the fifth respondent was incomplete and appeared a bit inconsistent
on cross-questioning and has been rejected. So, we are dealing here with 8
respondents and 16 entries instead of 9 respondents and 18 entries.
It is evident that even in the hypothetical scenario we do not have positive figures
for the majority of instances.
Given the painfully low figures, there is little point dwelling on possible
depreciation rates. The fishers appear badly off as it is, with or without the
dadandar.
When questioned about the seriously low figures, the fishers said that the catch had
not been particularly bad during these two years. They blamed it on coastal
resources drying up due to the destructive impact of mechanized fishing. We must
leave it at that.
Below, we begin with the data from Sagar. The first data-table is of the fishers
surveyed at Sagar Sangam Khoti. Note that the data in the Sagar tables do not
include data on loans with interest. For, it is rather unusual for a Sagar fisher to take
such loans for business. They tend to meet all their monetary (business and even
otherwise) by taking advances or dadans from the aratdars.

25
Table 14: From Sagar Sangam Khoti
0 1 2 3 4 5 6 7 8 9
NAME YEAR
DADAN AT THE BEGIN-NING
OF THE FISHIN
G SEASO
N
EXPENSE IN TERMS
OF WAGES &
USUAL CONSU-MABLES
EXPENSE ON BOAT AND NET
REVENUE FROM
SELLING OF FISH
INCOME: COL. 5 MINUS (COL.
3+COL. 4)
LABOUR (OF SELF AND
FAMILY)
MULTIPLY COL. 7
WITH MIN WAGE
LABOUR- ACCOUNT-
ED INCOME:
COL. 6 MINUS COL. 8
RAMJAN
SAHA
2015-16
175000 500000 50000 429000 -121000 270 54000 -175000
2014-15
500000 475000 45000 500000 -20000 540 108000 -128000
RATAN
SHAU
2015-16
150000 400000 90000 500000 10000 240 48000 -38000
2014-15
80000 200000 50000 390000 140000 480 96000 44000
AMAR
MONDAL
2015-
16 250000 650000 100000 550000 -200000
480 96000 -296000
2014-
15 500000 550000 80000 650000 20000
480 96000 -76000
SHEIKH
MOHSIN
2015-
16 250000 300000 70000 295000 -75000
480 96000 -171000
2014-
15 200000 270000 250000 600000 80000
480 96000 -16000
SHEIKH
SIRAJ
2015-
16 230000 450000 80000 500000 -30000 840 168000 -198000
2014-15 200000 470000 75000 550000 5000 480
96000 -91000
ARJUN DAS 2015-
16 340000 500000 200000 550000 -150000 480 96000 -246000
2014-15 300000 470000 100000 700000 130000 600
120000 10000
SRIHARI
PRADHAN
2015-16 500000 800000 300000 600000 -500000 735
147000 -647000
2014-15 300000 450000 300000 550000 -200000 840
168000 -368000
UTTAM
MONDAL
2015-16 450000 400000 70000 230000 -240000 600
120000 -360000
2014-
15 240000 300000 375000 375000 -300000 600 120000 -420000
SHEIKH
RABIUL
2015-16 200000 350000 60000 270000 -140000 240
48000 -188000
2014-15 210000 340000 200000 325000 -215000 240
48000 -263000
SK. MD. ALI 2015-
16 225000 300000 150000 400000 -50000 240 48000 -98000
2014-15 210000 280000 110000 550000 160000 240
48000 112000
CENTRAL
TENDENCY
AVER
AGE 275500 422750 137750 475700 -84800 479 95850 -180650
MEDI
AN 240000 422750 100000 500000 -75000 480 96000 -175000
The central tendencies under this head are noteworthy. In column numbered 5, we
find that the mean revenue is Rs. 475,700 while the median revenue is Rs. 500,000.
Unfortunately, once the costs are deducted, we find a gloomy picture. We find that
the average income (in Col. 6) is negative—Rs. -84,800. So is the median income—Rs.

26
-75,000. The central tendencies in Col. 9 are lower still. The mean and corresponding
median, however, are close enough to suggest that the distribution is not too
skewed. The negatives would appear worrying. They suggest that both the average
fisher and the median fisher are running a losing business.
But, remembering the caveat about the fishers’ tendency to inflate costs, we again
undertake the routine reduction by 16%. Without displaying a case by case situation,
we simply show the effects on the mean and median figures.
Table 15: Central tendencies after cost reduction
1 2 3 4 5 6 7 8 9
CENTRAL TENDENCY
DADAN AT THE BEGIN-NING
OF THE FISHING SEASON
EXPENSE IN
TERMS OF
WAGES & USUAL CONSU-MABLES
EXPENSE ON
BOAT AND NET
REVENUE FROM
SELLING OF FISH
INCOME: COL. 5 MINUS (COL.
3+COL. 4)
LABOUR (OF SELF
AND FAMILY)
MULTIPLY COL. 7 WITH MIN. WAGE
LABOUR- ACCOUNT-
ED INCOME:
COL. 6 MINUS COL. 8
AVERAGE 275500 355110 115710 475700 4880 479 95850 -90970
MEDIAN 240000 378000 75600 500000 -15800 480 96000 -111800
On decreasing the costs, the negative for mean disappears from column 6 but the
negative for median doesn’t. Moreover, once we look at the labour accounted
income, the situation is almost as dismal as it was before.
What happens when we remove the discount given to the dadandar?7
Table 16: Incomes after removing discount to dadandar
1 2 3 4 5 6 7
PER-
SONS YEAR
IN-
COME:
LABOUR ACCOUNT-
ED IN-COME
IMPROVED INCOME
AFTER ESTIMATED
COST REDUCTION
BY 16%
IMPROVED LABOUR
ACCOUNTED
INCOME AFTER
ESTIMATED COST
REDUCTION
BY 16%
TOTAL
DIS-COUNT
GIVEN TO
DADAN-
DAR ON SNHC +
SHC + FRESH
FISH/ SHRIMP
IMPROVED
INCOME IN HYPO-
THETICAL SCENA-
RIO
WHERE THERE IS
NO DADAN
(COL.4 – COL.8)
IMPROVED
LABOUR ACCOUN-
TED INCOME IN HYPO-
THETICAL SCENA-
RIO WHERE
THERE IS
NO DADAN
(COL.4 – COL.8)
1 2015-16
-121000
-175000 -33000 -87000 27000 -6000 -60000
2014-15 -20000 -128000 63200 -44800 62500 125700 17700
2 2015-16 10000 -38000 88400 40400 34000 122400 74400
2014-15 140000 44000 180000 84000 10700 190700 94700
7 The Sagar layas claimed that they give discounts to dadandars at the rate of Rs. 12-15 per Kg. However, the dadandars claimed that they received discounts at the rate of Rs. 1-2 per Kg. Through repeated discussions and cross-questioning we found that it would be wise to take the average rate at Rs. 10 per Kg, across the various products.

27
3 2015-16
-
200000 -296000 -80000 -176000 37500 -42500 -138500
2014-15 20000 -76000 120800 24800 42500 163300 67300
4 2015-16 -75000 -171000 -15800 -111800 32000 16200 -79800
2014-15 80000 -16000 163200 67200 42200 205400 109400
5 2015-16 -30000 -198000 54800 -113200 32500 87300 -80700
2014-15 5000 -91000 92200 -3800 42500 134700 38700
6 2015-16
-150000
-246000 -38000 -134000 65500 27500 -68500
2014-15 130000 10000 221200 101200 55500 276700 156700
7
2015-16 -
500000 -647000 -324000 -471000 65000 -259000 -406000
2014-15 -
200000 -368000 -80000 -248000 42000 -38000 -206000
8
2015-16 -
240000 -360000 -164800 -284800 33000 -131800 -251800
2014-15 -
300000 -420000 -192000 -312000 34500 -157500 -277500
9
2015-16 -
140000 -188000 -74400 -122400 27000 -47400 -95400
2014-15 -
215000 -263000 -128600 -176600 32500 -96100 -144100
10 2015-16 -50000 -98000 22000 -26000 50000 72000 24000
2014-15 160000 112000 222400 174400 50000 272400 224400
Central Tenden-
cies
Average -84800 -180650 4880 -90970 40920 45800 -50050
Median -62500 -173000 3100 -99400 39750 49750 -64250
Since the discount to dadandars is significantly higher in the case of Sagar, the
incomes show a considerable improvement and produce positives and, more
significantly, the mean and median values are also positive in the case of the straight
income. The mean and median for the labour accounted incomes, however, remain
negative.
Unfortunately, one must take into account depreciation. This, even for the poor
fishers in this Khoti, would certainly be at least around Rs. 16,000 per annum and
could be higher in proportion to the price of boats and nets (not likely to be more
than Rs. 40,000 though, as the fishers here are not owners of expensive boats). The
consequences for the incomes are obvious and need no elaboration.
Let us now look at the situation regarding the two other Khotis surveyed.
First we look at Khal Dhablat Khoti.8 The point to note is that here we look at
information from only 7 out of the 10 surveyed. This is because there were problems
with the data from the other 3, resulting in their being thrown out.
8Please note that while 10 persons were surveyed from this Khoti, the data for two were thrown out because they appeared to be erroneous both on preliminary examination and subsequent cross-questioning of the surveyor.

28
Table 17: Cost and incomes at Khal Dhablat
0 1 2 3 4 5 6 7 8 9
PERSONS YEAR
/CT
DADAN AT THE
BEGINNING OF THE
FISHING SEASON
EXPENSE IN TERMS OF WAGES &
USUAL CONSUMABLES
EXPENSE ON
BOAT AND NET
REVENUE FROM
SELLING OF FISH
INCOME: COL. 10 MINUS (COL.
4+COL. 5+COL.7)
LABOUR (OF SELF
AND FAMILY)
MULTIPLY COL. 6 WITH MIN
WAGE
LABOUR ACCOUNTED
INCOME: COL. 10
MINUS (COL. 4+COL.
5+COL.7)
1 2015-16 200000 300000 70000 200000 -170000 240 48000 -218000
2014-15 250000 400000 90000 500000 10000 240 48000 -38000
2 2015-16 300000 300000 80000 250000 -130000 240 48000 -178000
2014-15 200000 250000 90000 300000 -40000 240 48000 -88000
3 2015-16 300000 400000 90000 300000 -190000 360 72000 -262000
2014-15 200000 300000 120000 450000 30000 360 72000 -42000
4 2015-16 300000 400000 90000 300000 -190000 480 96000 -286000
2014-15 200000 300000 120000 350000 -70000 120 24000 -94000
5 2015-16 250000 300000 250000 450000 -100000 360 72000 -172000
2014-15 300000 450000 200000 400000 -250000 360 72000 -322000
6 2015-16 300000 400000 60000 300000 -160000 240 48000 -208000
2014-15 400000 300000 70000 450000 80000 360 72000 8000
7 2015-16 150000 500000 120000 500000 -120000 240 48000 -168000
2014-15 200000 400000 90000 500000 10000 240 48000 -38000
CENTRAL
TENDEN-CIES
AVERAGE 253571 357143 110000 375000 -92143 291 58286 -150429
MEDIAN 250000 350000 90000 375000 -110000 240 48000 -170000
A single look at Column 6 shows that there is no surprise here. Negatives
predominate. No wonder, both the mean and the median are negative. Again, we go
ahead and reduce the reported cost by 16% and get the following figures (once
again, with respect to the mean and median figures).
Table 18: After cost reduction
CEN- TRAL TEN-
DENCIES
DADAN AT THE
BEGINNING OF THE
FISHING SEASON
EXPENSE IN TERMS OF WAGES &
USUAL CONSUMABLES
EXPENSE ON
BOAT AND NET
REVENUE FROM
SELLING OF FISH
INCOME: COL. 10 MINUS (COL.
4+COL. 5+COL.7)
LABOUR (OF SELF
AND FAMILY)
MULTIPLY COL. 6 WITH MIN
WAGE
LABOUR ACCOUNTED
INCOME: COL. 10
MINUS (COL. 4+COL.
5+COL.7)
AVERAGE
253571 300000 92400 375000 -17400 291 58286 -75686
MEDIAN
250000 294000 75600 375000 -16400 240 48000 -76400

29
Once the cost figures are reduced, the extent of negativity decreases considerably but
does not disappear.
Now, we follow the usual tactic of seeing what the income would be in a situation of
‘no dadandars’.
Table 19: After removing the discount to dadandars
PER-
SONS YEAR
IN-
COME:
LABOUR ACCOUNT-
ED IN-COME
IMPROVED INCOME
AFTER ESTIMATED
COST REDUCTION
BY 16%
IMPROVED
LABOUR ACCOUNTED
INCOME AFTER
ESTIMATED COST
REDUCTION
BY 16%
TOTAL
DIS-COUNT
GIVEN TO
DADAN-
DAR ON SNHC +
SHC + FRESH
FISH/ SHRIMP
IMPROVED INCOME
IN HYPO-THETICAL
SCENARIO WHERE
THERE IS NO
DADAN
(COL.4 – COL.8)
IMPROVED
LABOUR ACCOUN-
TED
INCOME IN HYPO-
THETICAL SCENA-
RIO WHERE
THERE IS
NO DADAN
(COL.4 – COL.8)
1 2015-16
-
170000 -218000 -110800 -158800 23000 -87800 -135800
2014-15 10000 -38000 88400 40400 42000 130400 82400
2 2015-16
-
130000 -178000 -69200 -117200 28000 -41200 -89200
2014-15 -40000 -88000 14400 -33600 32000 46400 -1600
3 2015-16
-
190000 -262000 -111600 -183600 34000 -77600 -149600
2014-15 30000 -42000 97200 25200 43000 140200 68200
4 2015-16
-
190000 -286000 -111600 -207600 30000 -81600 -177600
2014-15 -70000 -94000 -2800 -26800 34000 31200 7200
5
2015-16 -
100000 -172000 -12000 -84000 40000 28000 -44000
2014-15 -
250000 -322000 -146000 -218000 36000 -110000 -182000
6 2015-16
-
160000 -208000 -86400 -134400 25000 -61400 -109400
2014-15 80000 8000 139200 67200 35000 174200 102200
7 2015-16
-
120000 -168000 -20800 -68800 42000 21200 -26800
2014-15 10000 -38000 88400 40400 47000 135400 87400
Central Tenden-
cies
Average -92143 -150429 -17400 -75686 23000 17671 -40614
Median -
110000 -170000 -16400 -76400 42000 24600 -35400
Once again, there is no point dragging in the question of depreciation values. As we
can see, the income increase in a non-dadan scenario is considerable. However, it
fails to make serious headway in ridding the fishers of their poverty, as evident from
the many negatives and the central tendency values. Once we bring depreciation
rates into the picture, the income gets into serious trouble.

30
Now, let us look at the data from Mahishamari Hatipitia Khoti.
The second thing of note was that although 10 fishers were surveyed, the data for 3
respondents were rejected on suspicion of incorrect data.
Table 20: Costs and incomes at Hatipitia
0 1 2 3 4 5 6 7 8 9
PERSONS YEAR LOAN
AS DADAN
EXPENSE IN TERMS OF WAGES &
USUAL CONSUMABLES
EXPENSES ON BOAT AND NET
REVENUE FROM
SELLING OF FISH
INCOME: COL. 10 MINUS (COL.
4+COL. 5+COL.7)
LABOUR (OF SELF
AND FAMILY)
MULTIPLY COL. 6 WITH MIN
WAGE
LABOUR ACCOUNTED
INCOME: COL. 10
MINUS (COL. 4+COL.
5+COL.7)
1 2015-16 123000 150000 60000 300000 90000 480 96000 -6000
2014-15 80000 200000 50000 390000 140000 480 96000 44000
2 2015-16 150000 100000 40000 1790000 1650000 480 96000 1554000
2014-15 150000 70000 50000 1032000 912000 480 96000 816000
3 2015-16 150000 100000 40000 1790000 1650000 480 96000 1554000
2014-15 200000 250000 300000 478000 -72000 120 24000 -96000
4 2015-16 600000 500000 150000 4032000 3382000 600 120000 3262000
2014-15 400000 400000 150000 3040000 2490000 600 120000 2370000
5 2015-16 600000 700000 100000 4032000 3232000 600 120000 3112000
2014-15 400000 500000 90000 3040000 2450000 600 120000 2330000
6 2015-16 150000 170000 50000 2050000 1830000 480 96000 1734000
2014-15 130000 190000 70000 1766000 1506000 480 96000 1410000
7 2015-16 70000 90000 50000 1255200 1115200 600 120000 995200
2014-15 60000 120000 70000 1580000 1390000 480 96000 1294000
CENTRAL TENDENCIES
AVERAGE 233071 252857 90714 1898229 1554657 497 99429 1455229
MEDIAN 150000 180000 65000 1778000 1533000 480 96000 1482000
The first and hugely important thing to note is the predominance of positive numbers
in the income columns. There is a single negative entry in column 6 and, what is far
more impressive, only 2 negative entries in Column 8.
The reason is simple. Except for respondent 1, all the others have highly impressive
revenues without particularly high costs. This leads to impressive incomes. Respondent
2 shows comparatively very poor revenue for 1 year—but that, on inquiry, was found
to be due to certain grave personal-familial problems that stood in the way of regular
fishing operations. When confronted with these very high incomes (as compared to the
incomes elsewhere) we were hard put to explain it. On pressing the matter hard, it
emerged that the fishers of Hatipitia enjoyed an immense geographical advantage.

31
As we can see in the Google Map, Hatipitia enjoys the advantage of having
unobstructed access to the marine and estuarine zone at the Hooghly River mouth. The
latter offers a twofold advantage: first, the river water carries with it enormous loads of
nutrient—from the drainage outfalls of various settlements, which spew out their often
untreated waste into the Hooghly. Moreover, the Hooghly carries enormous amounts
of fresh water, which, on mixing with the seawater creates an environment that is
neither too saline nor sweet and which is hospitable both to marine species and to other
fish species who thrive better in a less saline environment than they do in a purely
saline environment (this is why estuarine waters are often more productive than both
coastal water that is entirely saline and sweet water). Unfortunately, for Sagar Sangam
and Khal Dhablat, the marine and estuarine zone in the Hooghly river mouth that does
not interfere with the main navigational channel is too far away (given their relatively
small boats, maximum 2-cylinders). Moreover there are silt bars (both visible and
submerged) in the way that prevent the journey to the desired destination from these
two Khotis. Hence, the Khotis remain excluded from the one zone in the coastal waters
of West Bengal that is exceptionally productive. Hence, Hatipitia and, reportedly, the
New Jalda Khoti in Purba Medinipur (which we did not get a chance to survey) have
the privilege of having the best hunting grounds on the West Bengal coast.
Even when confronted with high income figures, we must ask whether the fishers
surveyed were reporting excessive costs. But, we needn’t undertake the exercise of
hypothetical cost reduction in this case. The income figures are quite high as it is.
Indeed, there is little point dragging in the question of depreciation also. It is true that

32
depreciation figures for these richer fishers could be considerably higher, for some of
these fishers might be using much larger boats costing 600,000 to 800,000 and multiple
nets. But, even allowing for that and assuming a high depreciation value of Rs. 200,000
per annum, the incomes remain impressive. Since there are only few figures, we need
not go through the exercise of elaborate demonstration.
Last but not the least is the issue of what would have happened if there was no need to
accept dadan. Obviously, the incomes would have been correspondingly higher.
A last word on the figures for Hatipitia: There is considerable difference in the mean
and median figures for dadan! This seems a bit unusual in the light of the figures we
have been witnessing. The reason that the mean figure for dadan is considerably
higher is because of a solitary very high dadan figure, which has caused the mean to
become slightly “imbalanced”, i.e., considerably removed from the middling figure.
It goes without saying that this ‘imbalance’ does not extend to other figures, for
example the figures on incomes. This, again, should make us cautious. It is quite
possible that the respondents surveyed were from among the richest layas in
Hatipitia and, hence, the overall incomes are more than would be the case if we
surveyed some others. And the size of the sample presented here is not large (the
sample size is 8 out of the 98 laya members of the Khoti, i.e. slightly more than 8%).
Therefore, the overall picture presented could be somewhat less representative.
There could be other fishers who could be doing less well. Careful interrogation of
the surveyors suggested this possibility. However, it was also clear that the average
and median would not be much less even with a more representative population.
Rounding up
The picture of incomes from Dadanpatrabar is dismal. So is the picture from Sagar
Sangam Khoti and Khal Dhablat Khoti in Sagar. The picture from Khejuri is
depressing. The picture from Junput is slightly better. The best situation obtains with
Hatipitia Khoti.
What accounts for the economic picture presented in some detail above? An analysis
of the fishers’ and dadandars’ responses in the light of general information suggests
the following:
i. Indeed, no official sources claim that that overall marine catch has declined.
Publicly available statistics, notwithstanding its serious limitations, clearly
indicates that the overall marine catch has continued to rise, though the rate of
growth in marine capture fishing is pronouncedly less than in the fish culture
(Department of Animal Husbandry, Dairying and Fisheries, 2014)
ii. However, fish supply in general has obviously not kept pace with the overall
growth of demand for fish—export and domestic combined—as evidenced in the
remarkable rise in fish prices

33
iii. If overall fish catch has continued to rise, this is not true of the overall fish catch
from the small-scale fishing sector. Here, as per all anecdotal evidence, fish catch
has continued to decline and drastically so in the recent years. This is most
tragically true of riparian fishing, but is also true, though to a slightly lesser
extent, of marine fishing. Since the overall number of marine small-scale fishers
has not declined, or has not declined at a comparable rate, the per capita catch
has declined. There is now considerable published report and analysis on the
incredibly drastic decline in the share of small-scale fishing in marine
production.
iv. This has resulted in very poor incomes for poor fishers—of which everyone
connected to this sector is aware and which the present survey corroborates
v. The decline in catch has been so drastic that one could have expected it to result
in disastrous decline in incomes, leading to small-scale fishing ceasing to exist as
a profession. The only reason this has not happened is that the rise in fish prices
due to rise in demand without a matching rise in supply has led to the effect of
catch poverty getting compensated to a considerable extent.
vi. That the richer fishers at Hatipitia Khoti enjoy better incomes is due to the overly
fortunate circumstances of their geography. Unfortunately, if other fishers were
to try and crowd into the same zone (which they cannot, due to distance from
their Khotis), that would cause a fall in catch and incomes for everyone
concerned.
vii. Although destructive fishing has severely corroded marine biodiversity and
fish stocks (as attested by numerous international reports), its effect has been felt
comparatively less by the main culprits, mechanized and trawl fishing. This is
because the latter’s ability to cut a wide swath across the sea and into the depths
allows them to exploit a wider resource base.
The laya and his dadandar—the alchemy of dependence
We have seen that even the richer Hatipitia layas also take loans from dadandars.
However, if we look at the revenue figures, we will realize that the amount of the
advance is only a small portion of the monetary volume of the business. For them, it is
mostly a liquidity support that makes up for the shortfall in their capital.
On the other hand, the dadan or advance is an indispensable support for the poor
layas. Only a very small percentage of fishers in the small-scale sector have the
economic means and confidence to opt entirely for private loan. It is the poverty of the
laya which forces him into the arms of the dadandar.
The laya goes to the dadandar for the loan because he does not have any other option
for procuring ready capital. Banks are notoriously reluctant to advance even tens of

34
thousands, let alone hundreds of thousands of rupees. (Their reluctance stems at least
partly from past experience of non-recovery. There are also instances where the bank
employees have taken bribes for arranging loans, to the tune of 15-20% of the loan
amount. Once someone has paid this much, they had little concern about paying
interest or repaying the loan. The bank, on the other hand, found seizing local
immovable property difficult because of the local political trouble it provoked. The
result was they stopped giving loans. Therefore, the laya had no way out but to resort
to taking advances from the dadandar.)
One must also realize that this advance, notwithstanding the charges that come with
it, has real benefits. These are:
1. The laya can get the money almost as soon as he needs it.
2. There are no formalities to the advance
3. There is no question of any security except for the verbal assurance of giving
the entire catch to the dadandar at a discounted price
4. The laya not only gets an amount as capital before the start of the season. He
can get subsequent amounts during the season if there is some capital shortfall
or any other urgency
5. The laya is free to use the money for meeting any personal or familial needs
6. Last, but not the least, the laya can fail to make full repayment at the end of the
season. The shortfall is merely carried over to the next season, without any
additional interest. Whenever this happens, i.e. whenever there is delayed
repayment without the laya having to pay any additional charge, there is an
effective reduction of interest. This happens pretty often. If one factors-in the
defaulted repayment figures, one can see the effective interest coming down to
15% or even lower. (We are not citing actual figures here, because there is large
variation across individuals and over the years.)
It is interesting to explore how the economics works in favour of the trader giving the
dadan. For him, the dadan is a way of ensuring two things:
1. From all those to whom he gives dadan, he is ensured a supply of dry or fresh
fish as the case may be
2. He is ensured of getting the supply at a price less than he would have to pay to
someone who is a free agent—for example, a laya who has not taken dadan but
who works on his own capital or on the basis of a loan taken from a usurer.
It is worthwhile to explore the relationship between the dadandar and the laya a little
further. As is often the case for the merchant and artisan in the unorganized sector, the
relationship is often a long-standing one. Over the years, the laya usually takes dadan
from the same dadandar or from the same set of dadandars. This often results in a
kind of stable relationship. Not only do the layas and aratdars know each other

35
extremely well, there develops, notwithstanding an essential conflict of interest, some
kind of mutual understanding and tolerance. For example, it is often seen that some
amount of the advance remains unpaid over the years. As we have seen, this is likely
to happen in the years of loss, which, if our statistics is in any way representative, is by
no means uncommon. Thus, the dadan often goes un-repaid, either in part or in full.
This, unless the un-repaid amount is huge, does not prevent the dadandar from
advancing further amounts whenever the laya needs it, for business or for personal
reasons. The unpaid amount from the previous year is simply added to the money
advanced by the dadandar in this year and the size of the total un-repaid advance
determines the discount that the dadandar claims from the laya. The larger the
outstanding, the greater is the discount that the dadandar claims. However, there are
no fixed rules. The whole thing is informal, negotiable, and depends on the power
equation between the two and, to a varying extent, on the nature of the persons
concerned and interpersonal relations. The prime concern of the dadandar is not
getting back his advance fully. His main concern is having an assured supply of fish
and having it at a discounted price, which gives him an advantage on resale.
What stands in the way of the small-scale fisher making a profit?
The following things stand in the way of the poorer small-scale fishers making a
profit:
i. First, and foremost, he is in a business that is in trouble; not only has
irresponsible and destructive fishing severely hurt the biodiversity of the
coastal and near coastal waters, the harvestable potential of the Indian EEZ is
possibly being rapidly approached; 9 and the poorer the fisher, the more
9 The ecological impact of and resource destruction of the coastal waters due to large-scale heavily mechanized fishing is well attested (Rajasenan, 2015).
There have been repeated attempts to calculate the estimated harvestable potential of our EEZ. Nair and Gopinathan gave an estimate of 5.50 million tons in 1981, Matthew et al. gave an estimate of 7.46 million tons in 1989, Desai et al. pulled it drastically down to 3.66 million tons in 1990, to be followed in the same year with the GOI working group who offered a slightly higher figure of 3.90 million tons. This was followed in 2000 with another GOI working group offering the almost similar figure of 3.93 million tons. This, again, was followed by the GOI working group in 2012 offering a somewhat higher figure of 4.419 million tons of harvestable potential.
Since the last four figures are relatively close to one another, it is reasonable to accept them as being a closer approximation to the current harvestable potential in the Indian EEZ. Now, even if we choose the latest and highest estimate among the last four as the best, we notice that in our 2013-14 marine catch (3.44 million tons) we had already attained 78% of our harvestable potential (we don’t have reliable figures for more recent harvests). Therefore, it is clear that scope of expansion in the marine capture sector is already limited. Further, capture operations, like any other economic venture, is not only about possible yields, but about marginal costs and returns. Closer to maximum possible yield, the marginal costs increase and marginal returns fall, something that already appears to be happening in the industrial sector, leading often to more unsustainable behaviour and violation of fishing regulations by trawlers and large mechanized crafts. This too is already happening, something we shall get to right away. We shall also address the problems confronting the marine sector. However,

36
difficult it is becoming for him—because, as we have mentioned, his
navigational resources restrict him to a relatively small hunting ground
ii. His dearth of capital leads to his dependence on the dadandar and,
occasionally, on the local moneylender; moreover, the less his income, the more
is his dependence
iii. His dependence on dadan forces him to sell his catch to the dadandar at a price
less than what he could have got in the market;
iv. His dependence on dadan forces him to sell his entire catch to the dadandar—
dried or raw fish as the case may be—preventing the small-scale fisher from
exploring value-addition options and explore the higher product and price
ranges;
v. His cooperative connections, whether in the form of the khoti or the formal
cooperative, does not provide him with either capital or advanced market
opportunities.
It is important to realize a key aspect of the matter. The dependence on the
dadandar is a huge problem for the poor small-scale fisher but it is by no means his
main economic problem. We have seen that in case of the poorer fishers (who are
the majority), the absence of dadan would result in increase in incomes but not at
rates that would help get rid of his poverty. His main economic problem is that, in
the rather near-shore waters (which are his area of his operation) the resources are
drying up, mostly due to destructive fishing (Rajasenan, 2015) and possibly
pollution (Nambudiril, 2015) (Fishing in troubled waters, 2016); (Oceans, Fisheries
and Coastal Economies). Paradoxically, if his economic-technological capability
were to increase, so would not only his economic returns but also his per capita
ecological impact. With returns increasing, fishing would tend to become more
profitable, drawing in more fishers. Thus, the overall impact of small-scale fishing
would increase, adding to the impact of heavily mechanized fishing. This, given
that we are approaching the limits of harvestable catch in the Indian EEZ, is likely
to have adverse impact on catch and incomes in the longer run.
Why do the poorer sections of the small-scale marine fishers subsist in their
trade, if it is so inadequately rewarding? The answer is as follows:
i. Often, there is no better economic opportunity available to many of them; this
is the trade they have learnt and they have no other skill that might generate
better incomes and with less hardship
ii. Although it keeps them in poverty and mostly in chronic indebtedness, the
profession supports the family (often the whole family) during the fishing
we shall be better placed to do so after examining the situation inland. See (Chacraverti, 2016) (Gopalakrishnan & Grinson, 2014).

37
season (which can extend to 6 months) and, as we have seen, the costs of the
upkeep of the family members participating in the fishing and fish drying
operations are included in the fishing costs; they, thus, manage to scrape by—
an occasional good income helps them reduce the debt burden and makes
things a bit easier
iii. For many, fishing is not merely a source of income and habitual engagement;
it is also something they like to do; the liquid crystalline vastness, the rolling,
waves, the uncertainties, and even the perils have their attractions
Notwithstanding all the above—many fishers do leave their profession and try to
find opportunities elsewhere. We don’t have hard statistics—but anecdotal
evidence suggests that more small-scale fishers are leaving or looking forward to
leaving their professions if they can. This seems to be a prominent global trend—
though more pronounced in the developed than in developing world (2016, p.
32). In West Bengal, the fisher does not want his children to carry on this trade.
The children also tend to develop apathy or antipathy towards this profession.

38
Chapter VI
Summing up the economic plight of the small-scale fisher—the
overall lack of control: from procuring the product to selling it
The plight of the small-scale fisher lies not merely in his poverty. Rather, his poverty
is the result of his almost complete lack of control over his products.
As we have seen, they have poor control over procurement. Their supply source is at
peril, due to resource destruction coupled with their comparative economic-
technological disadvantage in procurement. (As we have also mentioned,
paradoxically, if their efficiency in procurement were to increase, this would only
increase the pressure on the resources, contributing, in the long run, to a faster
decline in overall catch. Unless the state stepped in to ensure strict sustainable
fishing policies in the marine sector, there seems no future for the capture fishing
sector—and particularly its small-scale arm. And, as the hope of this kind of
stepping in seems politically unrealistic, the future of small-scale fisheries seems
bleak.)
In fact, the small-scale fisher’s lack of control over procurement is markedly less than
that of the small and marginal farmer. The latter is also at the mercy of several
factors—natural and economic. His procurement is at the mercy of the weather. If
the rains fail, the farmer is in serious trouble. However, even here, his dependence is,
or can be, considerably less than that of the small-scale marine fisher. For, the farmer
does not capture his catch, he grows it. Therefore, he can learn to adopt almost free
of cost methods to improve water retention of the soil, select hardy traditional seed
varieties requiring considerably less water, and proceed to produce and even
increase production under inimical weather conditions. His advantage over the
fisher is the advantage of one who grows over one who captures, a fact which has
determined the entire course of humankind’s development.
The next phase of lack of control over their products, of course, stems from the
small-scale fishers’ dependence on the dadandar, which compels them to give the
dadandar their entire package of goods. But, even if they were freed of the clutches
of the dadandar, the fishers are at mercy of nature and the markets.
For example, the fishers have no means of protecting drying fish from untimely
rains. The entire problem is being aggravated by climate change. Extreme events
have increased in frequency and have become more unpredictable. Even as I write
these lines, post monsoon heavy rains have hit the fishers a second time.10 His fish
drying methods are traditional. Until now, he has the beach at his disposal and the
10 A single spell of heavy rains lasting more than two days, occasionally accompanied by stormy or cyclonic weather, in the period from 20 September to 30 October, is not unexpected; however, two such spells is almost unheard of.

39
sun does his work for him. The method was developed presumably at a time when
the period from late autumn to early March was an overwhelmingly dry period,
except for an occasional wetness in November. Moreover, the method worked well
in a period when catch was abundant and the loss of a few days’ catch did not hit the
fisher too hard—the sea yielded more than enough during the rest of the season.
Now, with occasional showers visiting in October and November and even a few
showers in January or February, and catches declining alarmingly, the fisher finds
himself in serious trouble. Whenever there is an untimely drizzle, the fishers avoids
taking his boat out. What is the point of burning diesel and paying the crew for a
catch that would get spoiled.
This leads to the fishers’ occasional use of formalin or even insecticides like Doom
(dichlorovos) to preserve the fish, leading to serious questions of food safety. This
has alarming economic consequences too. Once purchasers near and far come to
know that fishers of a particular locality are resorting to such measures, they shy
away from buying products from the area—leading to a fall in price of the product.
There is a view that if fishers had access to cheap yet safe technological means to
save large proportions of their dried fish from being spoiled their business could still
turn out a profit.
Their ability to store fresh fish is also severely limited. Even today, no Khoti or
cooperative has any large-scale refrigeration facility or even an ice mill. Therefore,
having almost non-existent means of preservation, the fisher must sell his product at
the price the market offers, even if he were to be free of the clutches of the dadandar.
He has no means to store his goods for even a little while, waiting for a better offer
or opportunity.
It goes without saying that the small-scale marine fisher in West Bengal has no
visions of value addition. The only value addition he knows is drying the fish. And
even here, as we have seen, he is at the mercy of nature. As to subsequent other
kinds of value-addition, the point is moot. It can only arise when the fisher is freed
from the clutches of the dadandar and is free to decide what to do with his catch.
Further, he can be freed from the clutches of the dadandar when he has all the
capital he thinks he can manage and at a cost he can comfortably bear.

40
Chapter VI
What are the business prospects of collectives11 of small-scale fishers
and fishworkers in coastal areas in West Bengal?
The short answer to the question that constitutes the title of this chapter is: very
poor—if it is business as usual. Collectives (cooperatives, producer companies, or
whatever) do not bring magic solutions. They can only help the individual achieve
what he cannot achieve on his own—for example, creating a combined fund of
human and economic resources that each member can draw upon. However,
collectives cannot create business opportunities where none can exist, or overcome
obstacles that can only be overcome on a national or societal level, if at all.
Systemic trouble
The problem confronting the small-scale fishing is that it is a profession suffering not
merely from economic problems in the narrow sense, such as capital shortage,
marketing problems, and so on. Rather, it is a profession that is in systemic trouble—
at least, for the poorer sections of the small scale fishers. The trouble stems from
dwindling resource supply due to factors beyond the small scale fisher’s control and
factors that will continue to be beyond their control even if they organize themselves
into well-functioning cooperatives. For example, fishing cooperatives of
Maharashtra are much better organized and have distinct better performance in
aiding the fishers’ business and helping to enhance incomes. Yet, they are also in
serious trouble as catches dwindle. As Kiran Kohli, from the Madh Island
Fishermen’s Cooperative pointed out emphatically in an interview,12 small-scale
fishing was dying because marine biodiversity was being decisively killed by
heavily mechanized trawlers and purse seiners and small-scale fishers had
tremendous difficulty making their ends meet. However, ‘dying’ is not synonymous
to ‘dead’ and nature has ways of bouncing back. Therefore, the sea will continue to
yield fruit for decades to come. The question is how far the yield with be enough for
the poorer sections of the small-scale marine fishers to be able to harvest in amounts
necessary to sustain them and their economic activity and whether the fishers will be
able to devise ways of adapting to low yields and other adversities—such as effects
of climate change—which are possibly going to increase operational costs in a
significant way.
11 Officially, the study is concerned with looking into the business prospects of cooperatives of marine fishers in West Bengal. However, for more reasons than one, the real concern is whether a collective solution to the fishers’ ills is possible—whether the collective is in the form of a cooperative, producer company, or even society (yes, there are instances of societies of producers doing successful business).
12 Taken on 6 November 2015

41
More powerful boats and attendant gear—why this is not a feasible
solution for small-scale fishers in general
The only short term solution is to have sufficient funds to have larger and more
powerful boats. The richer sections of the small-scale fishers have these boats, which
allow them to go deeper into the sea and earn better returns.
If a fisher is capable of procuring funds to buy such a boat and the gear, he is far
better placed in terms of income. He would not need to be a member of a
cooperative to ensure a far better deal than he gets now.
Can a cooperative provide funds to fisher members to purchase larger boats and
associated fishing gear so as to be able to do business that is distinctly, consistently,
and durably better—at least for the next couple of decades, until the fish stocks start
dwindling to levels that would make fishing operations uneconomic? It doesn’t seem
likely. Boats with 4-cylinder engines cost not less than Rs. 1,500,000 while those with
6-cylinder engines cost easily as much as Rs. 3,000,000. No fisher cooperative can be
conceived that can arrange for this kind of fund for its members/shareholders on a
large scale. (Unless, the cooperative/collective divides its members into groups, say,
of 10 members each, each of which pools its resources to buy one such boat and each
works as a crew member. This is a definite possibility. However, we need not
explore such practical details here in this report. Nor shall we speculate on why such
mini-collectives would need to belong to a larger collective.)
A possible solution that could work
In absence of governmental schemes tackling the problem of capital availability and
market access in a big way, the only option that might work is the formation of
genuinely entrepreneurial collectives.
Yes, these are the magic words. One can go on endlessly harping on ‘community
business,’ but putting people from the community together into a cooperative or
producer company is not going to deliver desirables. (We shall soon see why this is
so.) What we need is a collective of relatively homogeneous, entrepreneurially
oriented, yet collectively inclined individuals, who are capable of both democratic
functioning and organizational discipline. This is a great deal to ask, particularly in
the West Bengal setting—but it is only such a collective that might yield desirable
results. But, before we get into that, let us explore what the sociology of cooperative
effort teaches us.
Cooperatives: reflections that might be relevant for the small-scale
marine fishers
We shall be talking of ‘cooperatives’. But, as suggested earlier, let us not get fixated
with ‘cooperatives’ in the formal sense of the word. Here, we speak of cooperatives

42
because this has been the standard form of modern collective enterprise and the one
most studied. But, lessons derived from studying them could apply to other versions
of collective enterprise with suitable modification, if any are required.
Under what circumstances might a cooperative thrive?
Studies indicate that other things being favourable, cooperatives have a fair chance of
succeeding under the following circumstances:
a. The product that the cooperative deals in is such that its production,
processing, preservation and/or marketing call for a substantial amount of capital
while the concerned producers in their individual capacity do not have the
requisite capital. Therefore, operating in individual capacity, they tend to be at the
mercy of moneylenders, traders, processors, manufacturers, and so on. Milk and
sugarcane are good examples. Another important example is fish. Fishers down
history have been seen to engage in some form of collective activity and khotis, as
we have seen, are good examples of large-scale cooperation among marine fishers.
(However, while some amount of collective activity is essential to survival it
might not be enough for acquiring economic freedom and power, as the case of
our marine fishers proves so well.)
b. While the nature of the product might provide the basis for cooperation,
whether and how far such cooperation will lead successful business is another
question. That can only happen when four conditions are fulfilled.
I. The basic business plan is viable—that is, the cost incurred will succeed in
generating an income that shows a profit.
II. On the whole, the overall background—social, political, cultural, and
institutional—is favourable to the cooperative. (This is not to say that there
won’t be adversities. On the contrary, adversities and challenges help to
strengthen both individuals and organizations. No, this is to say that, on
the whole, the overall balance of factors in the background and
environment should not be overly hostile to the development of
cooperative business.)
III. There exists appropriate leadership, initial and subsequent
IV. The members feel that the cooperative is serving their interest and is likely
to continue doing so in future and, in more concrete terms, is generating
more and steadier income than would be possible in a non-cooperative
situation.
Applying the above to the marine fishing community in West Bengal

43
Condition I in the above has no reality for the marine fishing community in West
Bengal. There is no cooperative business worth the name and hence no real business
plan.
The following may be noted. Although the marine fishing community in West
Bengal has traditions of cooperation, it has no traditions of cooperative business
activity. That alone would not have been a hindrance but for the fact that the general
societal background contains elements inimical to the success of cooperative
businesses. The predominantly inimical element is the lack of successful examples
and the existence of a plethora of counter examples—of cooperatives taking off but
not succeeding due to poor leadership, inefficiency, and corruption. Moreover, and
nearer home for the marine fishing community, cooperatives were created with the
specific objective of availing government loans or subsidies and allowed to rot once
the loan was received and disbursed. As we have mentioned in the concerned
chapter, the classic examples of this are found in the case of Marine Fisheries
Cooperatives in Purba Medinipur. Whereas in Maharashtra, and in some other
states, fishers’ cooperatives had developed as community- business ventures, and
sought soft loans to further their business activities, here in West Bengal the marine
cooperatives sprang up with the sole objective of availing of the loan facility.
Thereafter, once the loans were disbursed, the cooperatives quickly went into
hibernation. The formal framework is maintained and yearly audits are done for the
sole purpose of retaining a platform that can become useful when such cooperative
loans become available again. Moreover, several malpractices emerged in the taking
of the NCDC loans and in their non-refund. (This has emerged during an earlier
survey.) Several cooperatives became serious defaulters. Cooperative corruption
(and/or viewing cooperatives merely as means to extract and misappropriate
government funds) is often linked to local political corruption, and involve local
political elements notorious for their cavalier attitude to public wealth. Moreover,
such elements often see cooperatives as means to gaining and exercising power and
control. All this creates a serious lack of faith in the possibility of viable cooperative
business enterprises. Moreover, such examples tend to fortify the notion that only
individual efforts to enrichment are likely to lead anywhere and collective efforts
have bleak futures.
These conditions appear to be applicable to coastal areas in which our marine fishers
ply their trade and is generally true of West Bengal, which is a state with poor
showing in cooperative performance. There have been efforts to trace regional
success or failure of cooperatives to overall historical, social, and economic realities
of the regions. We cannot go into this here. For a discussion of these themes see
(Chacraverti, The social and cultural context of cooperatives, 2017). However, the nature
of landholding and tenurial systems in West Bengal has been such as to encourage
fragmentation in social life and discourage a culture of mutual aid and collective

44
effort. This could be acting as a sort of general depressant to cooperative initiatives
in this state.
As regards the condition II (able leadership), this again is a sterile zone. In a sense,
this would seem to be a natural corollary to the above. For, where there is little faith
in cooperative business solutions among the mass of people, pioneers in cooperative
initiative are unlikely to emerge. Of course, an exceptional individual might have
emerged to try and encourage formation of and successful continuation of
cooperatives. There have been instances of individual initiative in West Bengal to
develop cooperatives even within this overall gloomy scenario. However, as of yet,
there are no instances of such leadership emerging or promising to emerge among
the marine fishing community.
Condition III has no chance of being already fulfilled in our case as there are no
cooperative business enterprises among the marine fishing community in West
Bengal.
The overall lack of confidence in the power of collective initiative came out in our
interviews. To put it more accurately, our interviews indicated that cooperatives did
not feature substantially or even considerably in the respondents’ notion of
feasibilities. The respondents did not mention cooperatives on their own and talked
about them apparently after a little prodding from the surveyor (in response to a
question about marketing the products). When asked how they thought the fish
business could flourish and the fishers could extricate themselves from dependence
on aratdars and moneylenders, the fishers occasionally spoke about government
support. Mostly, none spoke of cooperatives as a possible source of cheap capital (i.e.
capital with low interest rates). Only, occasionally, a respondent/interviewee would
mention cooperatives as a possible source of capital and a means to advancing
business. But, even in such cases, apprehensions were expressed about the long-term
viability of cooperatives. This lack of faith in a cooperative solution, as we have
mentioned above, is the greatest obstacle to the possible success of cooperatives.
Since low confidence in cooperatives contributes to cooperative failure and the latter
results in confidence remaining low, we have a vicious cycle.
Learning from historical and present examples
History shows that successful cooperatives can come up in two different ways. The
first is that the community’s own business needs lead to the setting up of a forward-
looking cooperative. The needs are felt by the community at large and particularly
by some members, who take a leading role in creating a cooperative. The classic
Indian example is that of Kaira District Cooperative Milk Producers Union, which
came to be known to the world through its marketing brand Amul.

45
The second kind of example is where a particular person within the community
plays a pioneering and leading role in setting up a cooperative. Once again, to take
an Indian example, and one that is particularly relevant to our concerns, is that of
Arnala Fishermen cooperative (the Arnala Fisherman Sarvodaya Sahakari Society),
which was formed largely because of the single handed efforts of its founder, a social
entrepreneur from the community.13
Moreshwar Vithoba Vaiti, Secretary Arnala Fisherman Sarvodaya Sahakari Society
It is clear that the above examples do not have much relevance to the situation on
the ground for the marine fishers’ cooperatives in West Bengal. For, the community,
or the individuals within the community, simply have not been able to generate the
initiative necessary for putting in place a successful cooperative enterprise. Hence,
we need to look at a different class of examples.
The other examples can be categorized under a single head—creation or promotion
of cooperatives by outside initiative. A world famous instance is that of Mondragon.
Here, the initiative of a Basque catholic priest led to the creation of an entire chain of
different kinds of cooperatives among the working class population in the
Mondragon area in Basque country, Spain (Logue, 2006).
In India, one can cite the example of the Warana cooperative movement. Here,
Tatyasaheb Kore’s efforts led to the creation of a cooperative sugar factory in
Warana. This was followed by an entire gamut of various kinds of cooperatives,
including dairy cooperatives, cooperative bank, consumer cooperatives, poultry
13 Based on interview of Moreshwar Vaiti, taken on 4 November 2015 and of others taken on 4 November 2015.

46
cooperatives, and cooperative power generation. This initiative has delivered
welfare across more than hundred villages in the Panhala area of Kolhapur, a district
in Maharashtra (Chacraverti, The Warana Initiative, 2017).
One can also cite the initiative of the SEWA. Although it can be seen as having taken
birth in the women’s trade union movement in Gujarat, the fact remains that a
separate women’s trade union movement was itself triggered largely by the vision
and persistent efforts of Ilaben Bhat. It was again Ilaben’s vision that led to the
creation of the cooperatives.
The above examples are inspiring and point towards a possible line of action.
However, even here, one must be extremely careful in learning from these examples.
Let us try to understand the issues involved.
Let us take the example of Mondragon. Here, we have a Basque Catholic community
with strong nationalistic inclinations and religious conviction. The inspiration and
leadership comes from Arizmendiarrieta, a Basque Catholic priest from a peasant
background, who had immediate acceptance among the working class in the
Mondragon area. Moreover, this is a person with an advantageous blend of
characteristics. He is deeply attached to the ideals of poverty alleviation, reduction of
social inequality, and social and democratic control over property. On the other
hand, he has no communistic aversion towards business, but rather believes that
cooperative models of business are a mode of empowerment for the poor. What is
also supremely important is that not only is this priest a man of noble convictions
and wide reading, he is also intensely practical. He has a fine sense of organizational
necessities, leadership issues, managerial needs, and awareness of the need for
technological excellence. Thus, he is able to inspire youths from the working class
community in Mondragon to receive high quality technical education at the local
technical school run by the Union Cerrajera, a company owning several iron and
steel factories in the Mondragon area and to join the Company. These youths
acquired a high level of technical education and quickly rose in the Company
hierarchy. Then they left their jobs and joined Arizmendiarrieta in setting up the
workers’ cooperatives and taking care of the managerial and engineering aspects. It
is this approach, of empowering the cooperatives with technically proficient and
dedicated personnel, which contributed to the success of the Mondragon
cooperatives See, for example, (Logue, 2006), (Molina & Miguez, 2008).
In the case of Warana again, we find that the founder, Tatyasaheb Kore, was a
successful businessman, who also had considerable experience as a sugar farmer. He
used his farming knowledge and business experience to guide the sugar cooperative.
He also inspired members of his own family to take an active interest in the
cooperative movement and developed a team of dedicated and knowledgeable
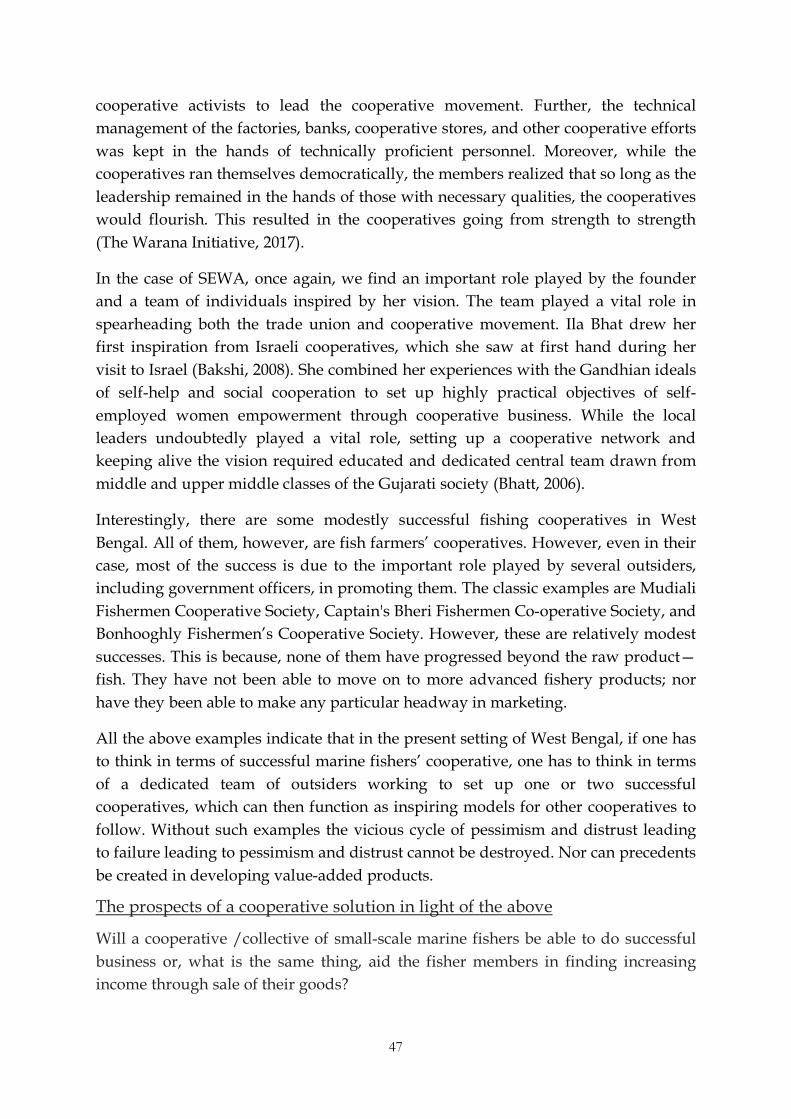
47
cooperative activists to lead the cooperative movement. Further, the technical
management of the factories, banks, cooperative stores, and other cooperative efforts
was kept in the hands of technically proficient personnel. Moreover, while the
cooperatives ran themselves democratically, the members realized that so long as the
leadership remained in the hands of those with necessary qualities, the cooperatives
would flourish. This resulted in the cooperatives going from strength to strength
(The Warana Initiative, 2017).
In the case of SEWA, once again, we find an important role played by the founder
and a team of individuals inspired by her vision. The team played a vital role in
spearheading both the trade union and cooperative movement. Ila Bhat drew her
first inspiration from Israeli cooperatives, which she saw at first hand during her
visit to Israel (Bakshi, 2008). She combined her experiences with the Gandhian ideals
of self-help and social cooperation to set up highly practical objectives of self-
employed women empowerment through cooperative business. While the local
leaders undoubtedly played a vital role, setting up a cooperative network and
keeping alive the vision required educated and dedicated central team drawn from
middle and upper middle classes of the Gujarati society (Bhatt, 2006).
Interestingly, there are some modestly successful fishing cooperatives in West
Bengal. All of them, however, are fish farmers’ cooperatives. However, even in their
case, most of the success is due to the important role played by several outsiders,
including government officers, in promoting them. The classic examples are Mudiali
Fishermen Cooperative Society, Captain's Bheri Fishermen Co-operative Society, and
Bonhooghly Fishermen’s Cooperative Society. However, these are relatively modest
successes. This is because, none of them have progressed beyond the raw product—
fish. They have not been able to move on to more advanced fishery products; nor
have they been able to make any particular headway in marketing.
All the above examples indicate that in the present setting of West Bengal, if one has
to think in terms of successful marine fishers’ cooperative, one has to think in terms
of a dedicated team of outsiders working to set up one or two successful
cooperatives, which can then function as inspiring models for other cooperatives to
follow. Without such examples the vicious cycle of pessimism and distrust leading
to failure leading to pessimism and distrust cannot be destroyed. Nor can precedents
be created in developing value-added products.
The prospects of a cooperative solution in light of the above
Will a cooperative /collective of small-scale marine fishers be able to do successful
business or, what is the same thing, aid the fisher members in finding increasing
income through sale of their goods?

48
It can be successful if it succeeds in carrying out profitable business. What would be
the conditions of profitable business for the small-scale marine fishers of West
Bengal?
The conditions would fall under two heads:
i. Economic conditions and
ii. Conditions related to human resource.
We shall take up economic conditions first.
Identifying the necessary or desirable economic conditions stems from the fact that:
a. There is supply uncertainty and shortage at the fundamental level: resources
accessible to small-scale fishers are dwindling
b. This is accentuated by increasing undesirable weather conditions leading to
loss of products
c. Hence, there is a dearth of marketable goods
d. In addition, there is severe capital shortage among the poorer majority of
small-scale marine fishers, leading to heavy dependence on the dadandar
and, consequently, lack of control over the products, which must be given to
the dadandar, and at reduced prices
e. However, even if there were no need to give discounts to the dadandar, the
income from sales is not likely to have brought sufficient revenue to yield
incomes necessary for escaping poverty
f. This is because the fishers have no means of translating their products across
time and space—they have no means of storing and preserving their products
over time so as to take advantage of better prices in future or transporting
their goods to places where it would fetch much better prices; therefore, they
are compelled to act as price takers—they have to sell their goods to those
with such resources and access, who can take in whatever stock the fishers
can provide; therefore, these traders are in a position to dictate terms and
prices—even in a non-dadan scenario
g. Further, in addition to fresh fish, the fishers have only one value-added
product at their disposal—dried fish; they have neither the means nor the
knowledge to produce any other value added product, although such
products would fetch several times the price per Kg than they received for either fresh
or dried fish
In the light of the above, the requisite economic conditions would seem to be clear
enough:
a) Availability of an initial capital that could be advanced to the
members/shareholders as loan at low interest (say about 14% per annum).

49
b) Availability of initial funds that could be utilized to take care of all
organizational overhead and cover initial losses due to bad loans
c) Availability of initial funds to hire expert personnel at all levels—from
preparing business plans to designing marketing solutions
d) Having necessary funds and appropriate facilities and technologies to take
care of preserving dry and fresh fish (for example, ice factories and nitrogen
packing facilities)
e) Facilitating the sale of members’ usual products in near and remote markets
by developing appropriate contacts and connecting to appropriate networks.
(In the given circumstances of marine small scale fishers, it would be
advisable if the collective did not purchase all the goods from the fishers and
resold them at the best prices available; rather, it would be better if it
provided a platform through which the fishers found the best market
opportunities. For example, it could take from the fishers their goods,
carefully recording the quantity and nature of the goods taken from each
member, thereby creating a total stock that would be sold. This stock would
be preserved or sold as per market reach and requirement.) Creating contacts
with remote markets—specifically the Jagiroad Dry Fish Market in Assam
and the Teliamura and Golbazar markets in Tripura—might create
opportunities of avoiding a large number of middlemen and, therefore,
procure prices considerably above what one received in the local markets.
Similarly, direct contacts with exporters exporting to Bangladesh might prove
hugely beneficial.
f) Product Study: Some products enjoyed very high regard in distant markets.
For example, dried phyasa (Setipinna phasa) and certain kinds of dried
shrimp enjoyed tremendous regard in the Tripura markets. Stressing on them
might help increase revenues.
g) Activity diversification—this is of cardinal importance in the context of small-
scale marine fishing. For, with reduced catch and the increasing uncertainties
of weather, the small-scale marine fishers seem to be looking at the prospect
of resource death, definitely in the long run. Under the circumstances,
encouraging activities that are generically related to fishing—such as fish and
crustacean farming—appears to be extremely desirable and even urgent.
These combined with value-addition (see next point) might prove useful
means of enhancing revenue
h) Continuing exploration of market opportunities for existing and possible
products (value-added) [As the brief input from Dr. Balaram Basak, the
former Director, MPEDA shows, there is a wide market value-added products
that the marine fishers can produce]. Value-added products can fetch prices
per unit weight several times that of either fresh or dried fish

50
i) Developing marketing strategies, with proper utilization of skilled personnel
and online platforms
Glimpses of the Shuntki market in Tripura
Varied shuntki products in Golbazar,
Agartala Nona Ilish, Battala Bazar, Agartala
Nona Ilish, a north-eastern favourite Putting shital Shunti (perhaps the most
preferred dried fish item in north-eastern states) in the matir kalshi (earthenware vessel)

51
Identifying the necessary or desirable human resource conditions stems from the
fact that:
a. The community as a whole is deficient in motivation; the majority tends, at
the most, to make the best of existing circumstances, but have neither the
vision, confidence, or motivation to try to change the circumstances
b. The majority are deficient in exposure and skills necessary to explore state-of-
the-art, yet appropriate, strategies and technologies
c. The younger generation tend to show little interest in the profession
In the light of the above, the requisite conditions pertaining to human resource
would seem to be:
a) General member motivation to make the cooperative a success
b) To be prepared to operate with team spirit, to bear with occasional
difficulties, to be ready to combine democracy in decision-making with
discipline in implementation
c) Development of appropriate leadership from among the members
d) Appreciating the importance of hiring skilled personnel in various domains
as indicated in the above subsection on economic requisites
e) Hiring skilled personnel for helping to develop viable business plans,
technological guidance, creative yet practical marketing solutions,
advertisement, digital technologies, and so on.
Unfortunately, ensuring all the above is an immensely difficult challenge and there
is no foreseeable way that any existing cooperative of marine small-scale fishers can
even dream of taking on these tasks. For example, they would not have even a clue
of procuring the initial funds. [In planning the quantum of initial funds, one might
proceed as follows: the highest mean and median figures for dadan in our data often
approach a seasonal total of Rs. 275,000. 14 So, if one were to think of a collective in
Sagar of µ members, one would have to keep ready a monetary provision
14 The mean and median values of the dadan vary across Khotis. In Khejuri it is Rs. 23,000 and Rs. 25,000 respectively. However, this is outstandingly low and bespeaks of the dire poverty of the fishers. In Dadanpatrabar the mean and median figures are Rs. 96,111 and Rs. 80,000 respectively. In Junput, we did not get data on dadan amounts but the loan amounts were not too high, the mean and median both being Rs. 25,000. The situation changes radically in the case of Sagar. In the Sagar Sangam Khoti at Sagar, the mean and median figures for dadan are Rs. 275,000 and Rs. 240,000 respectively. In the case of Khal Dhablat Khoti, the figures were Rs. 253,571 and Rs. 250,000 respectively. In the case of Hatipitia Khoti the figures are Rs. 233,071 and Rs. 150,000 respectively. (We have explained the considerable difference in the mean and median figures for dadan in the main text.) These figures are important in indicating the trends of financial requirement of the small-scale marine fishers.

52
approaching Rs. 275,000 µ dedicated to loan advances alone.15 For a collective of 30
members, this would mean a provision of Rs. 8,250,000 for loan advances alone.
Certainly, such funds cannot be accumulated by member donation/subscription, for
if the members had this kind of money, they would not be going to the dadandar for
advances. The members might be able to put together a small percentage of the
initial funds through stretching themselves to the limit.16 In addition to the seed
fund for providing capital support, one would need an initial fund for other
inevitable expenses—including administrative costs for the first three years,
appointing technical personnel, preservation and packaging technologies, keeping
some funds for exigencies, and so on.] Nor would the members be able to procure
expert help and advice for preparing the initial plans and programmes. Hence, the
initial impetus and guidance must come from an NGO committed to community
uplift. The funds cannot be expected to come from pure charity. Some of it could, of
course. However, the NGO must devise other strategies, for example, to invite social
investment—at terms that are deemed most suitable by the collective.
How to begin
The beginning can only be made by asking enterprising and genuinely interested
community members to put together a collective of sincerely motivated and forward
looking persons, including a fair share of young people, prepared to venture and
experiment. Whether the collective would be a producer company or some other
institutional form can be worked out later on. The experiment can take off, if only
such a group comes together. If the experiment succeeds, it can form a model for
others of its kind. Not all groups can succeed, nor everyone will. Nor can everyone
be a successful member of an entrepreneurial group. Even inspired social
development cannot produce even and uniform results.
______________________
15 It might appear that we are keeping more provisions than actually indicated, for the mean and median figures for Sagar fishers are often less than Rs. 250,000 and in other places the usual dadan is much lower. But, one needs to keep more funds than indicated by actual advances, for the fishers are likely to tend to take slightly more advance if they got better terms. Moreover, the organization needs funds to absorb initial non-repayment shocks without too much discomfort. 16 For example, the average contribution from the members could be Rs. 10,000 per head. However, they might donate a little land, say for office space and offer other support, including service, in kind.

53
References
Bakshi, R. (2008, September). A cooperative in India: the Self Employed Women’s Association
(SEWA). Retrieved from soceioeco.org: http://www.socioeco.org/bdf_fiche-document-
1749_en.html
Chacraverti, S. (2017). The social and cultural context of cooperatives: A tentative identification of
patterns. Retrieved from Soceo:
http://soceo.de/research/cooperatives/acknowledgements/essays/social-and-cultural-
context-of-cooperatives/
Chacraverti, S. (2017). The Warana Initiative: Examining a cooperative movement. Retrieved from
Soceo: http://soceo.de/research/cooperatives/acknowledgements/essays/the-warana-
initiative/
Chacraverti, S. (2016). Towards empowering small-scale fishers and fishworkers in India. Action
Aid.
Department of Animal Husbandry, Dairying and Fisheries. (2014). Handbook of Fisheries
Statistics 2014. New Delhi: Department of Animal Husbandry, Dairying and Fisheries,
Ministry of Agriculture, Government of India.
Fishing in troubled waters. (2016, December 1). Retrieved from www.thehindu.com:
http://www.thehindu.com/todays-paper/tp-opinion/Fishing-in-troubled-
waters/article15566502.ece
Gopalakrishnan, A., & Grinson, G. (2014). Empowering the marine fisheries sector with
related research and development technologies--CMFRI's initiatives and plans. Fishing
Chimes , 34 (1), 29-33.
Jagiroad Dry Fish Market. (n.d.). Retrieved from Assam Info:
http://www.assaminfo.com/tourist-places/55/jagiroad-dry-fish-market.htm
Logue, J. (2006). Economics, Cooperation, and Employee Ownership:The Emilia Romagna model –
in more detail. Retrieved October 20, 2017, from community-wealth.org: https://community-
wealth.org/content/economics-cooperation-and-employee-ownership-emilia-romagna-
model-more-detail
Molina, F., & Miguez, A. (2008, August 1). The origins of Mondragon: Catholic co-operativism
and social movement in a. Retrieved October 20, 2017, from Social History:
http://www.tandfonline.com/doi/abs/10.1080/03071020802268314?journalCode=rshi20
sNambudiril, S. (2015, May 3). Fish catch across India drops by 5%. Retrieved from
https://timesofindia.indiatimes.com: https://timesofindia.indiatimes.com/india/Fish-
catch-across-India-drops-by-5/articleshow/47135554.cms
Oceans, Fisheries and Coastal Economies. (n.d.). Retrieved from http://www.worldbank.org:
http://www.worldbank.org/en/topic/environment/brief/oceans

54
Rajasenan, D. (2015). Blue Revolution versus Fishers Livelihood: Review of the Deep Sea
Fishing Policy Embracing Multinationals in Indian Waters. Journal of Economics and
Sustainable Development , 6 (5).
(2016). The State of World Fisheries and Aquaculture: Contributing to Food Security and Nutrition
for All. Rome: FAO.