BUILDING AN ENERGY FUTURE - Annual Reports and ...
88
INVESTORS’ HANDBOOK ROYAL DUTCH SHELL PLC FINANCIAL AND BUILDING AN ENERGY FUTURE
-
Upload
khangminh22 -
Category
Documents
-
view
0 -
download
0
Transcript of BUILDING AN ENERGY FUTURE - Annual Reports and ...

INVESTORS’ HANDBOOKROYAL DUTCH SHELL PLC FINANCIAL AND
BUILDING AN ENERGY FUTURE

2COMPANY OVERVIEW
2 4 5 9 11 12 13
14UPSTREAM
15 18 18 19 21 22 23 24 27 28
30DOWNSTREAM
31 32 32 33 33 33 34 34 34 35
36PROJECTS & TECHNOLOGY
37 37 38 38 38
39CORPORATE SEGMENT
40MAPS
40 42 44 48 49
52CONSOLIDATED DATA
52 53
61UPSTREAM DATA
61 63
65 66 69
72 74
75DOWNSTREAM DATA
75 77 78
80ADDITIONAL INVESTOR INFORMATION
80 81 82 83
ABOUT THIS PUBLICATION

INTRODUCTION FROM THE CEO
At Shell we recognise the importance of communicating with investors, ensuring that they understand the Company, its progress and its plans for the future. Our Investors’ Handbook plays an important role. It includes fi nancial data going back fi ve years, giving a broad view of the Company, and explains our businesses and operations. Importantly, it explains how our businesses work together to provide enduring advantages.
In 2012, we made good progress in improving our performance, and we are on target to meet our strategic objectives. Our 2012 earnings on a current cost of supplies basis were $27 billion. Cash fl ow from operating activities was $46 billion, or $43 billion excluding working capital movements. Net capital investment amounted to $30 billion, as we build a solid foundation for future growth.
We produced 3.3 million barrels of oil equivalent per day in 2012, up 3% from 2011 excluding the effect of divestments and exits. There were important contributions from our Pearl GTL plant in Qatar, which is now ramped up, and the Pluto LNG Project in Australia, through our participation in Woodside Petroleum Ltd. Our equity LNG sales volumes of 20.2 million tonnes were up 7% compared with 2011.
Over the past three years our growth rates in earnings per share and operating cash fl ow have surpassed those of our competitors. And we continue to focus on further improving our competitiveness.
Our recent progress means that the growth agenda set out at the beginning of 2012 is on track.
Looking to the future, the world faces the challenge of meeting rising energy
demand as the population grows and living standards rise, especially in fast-growing economies. We estimate that by 2050, world energy demand could rise as much as 80% from current levels. Innovation and technology will be vital in accessing and transporting harder-to-reach resources as more available forms of energy are depleted. Shell has the scale and portfolio choices to manage a through-cycle investment strategy for sustainable growth. Innovation and a competitive mindset is at the heart of what we do.
Our work in natural gas, which now accounts for nearly 50% of our production, provides an example. We see integrated gas, comprising LNG and GTL, as a particular area with future growth potential. Our Pearl GTL plant illustrates our ability to create and operate very large scale projects working with national partners. Its output of fuels and other liquid products made from natural gas help Qatar diversify its national revenues.
In 2012, we cut the fi rst steel for the hull of our fl oating LNG facility for the Prelude gas fi eld offshore Australia. It will liquefy gas far out at sea and deliver it to tankers for export. By eliminating the need for pipelines to shore, it will demonstrate a concept that could help us reach remote gas fi elds elsewhere in the world.
To conclude, we are making good progress towards our objectives. We continue to work hard to improve our operating performance, and we have clear strategic priorities to drive growth and value for our shareholders. I hope you will fi nd plenty of information on these plans in this Investors’ Handbook.
Peter VoserChief Executive Offi cer
SHELL HAS THE SCALE AND PORTFOLIO CHOICES TO MANAGE A THROUGH-CYCLE INVESTMENT STRATEGY FOR SUSTAINABLE GROWTH. INNOVATION AND A COMPETITIVE MINDSET IS AT THE HEART OF WHAT WE DO.”
1reports.shell.com | Shell Investors’ Handbook
“
103585_SHE_Investors Handbook_V98_Cleaned_JD.indd 1 08-05-13 14:51

UPSTREAM INTERNATIONALUpstream International manages the Upstream businesses outside the Americas. It explores for and recovers crude oil, natural gas and natural gas liquids, liquefi es and transports gas, and operates the upstream and midstream infrastructure necessary to deliver oil and gas to market. Upstream International also manages Shell’s LNG and GTL businesses. Since January 2013, it manages its operations primarily by line of business, with this structure overlaying individual country organisations. This organisation is supported by activities such as Exploration and New Business Development. Previously activities were organised primarily by geographical location.
UPSTREAM AMERICASUpstream Americas manages the Upstream businesses in North and South America. It explores for and recovers crude oil, natural gas and natural gas liquids, transports gas and operates the upstream and midstream infrastructure necessary to deliver oil and gas to market. Upstream Americas also extracts bitumen from oil sands that is converted into synthetic crude oil. Additionally, it manages the US-based wind business. It manages its operations by line of business, supported by activities such as Exploration and New Business Development.
DOWNSTREAMDownstream manages Shell’s refi ning and marketing activities for oil products and chemicals. These activities are organised into globally managed classes of business, although some are managed regionally or provided through support units. Refi ning includes manufacturing, supply and shipping of crude oil. Marketing sells a range of products including fuels, lubricants, bitumen and liquefi ed petroleum gas (LPG) for home, transport and industrial use. Chemicals produces and markets petrochemicals for industrial customers, including the raw materials for plastics, coatings and detergents. Downstream also trades Shell’s fl ow of hydrocarbons and other energy-related products, supplies the Downstream businesses, governs the marketing and trading of gas and power, and provides shipping services. Additionally, Downstream oversees Shell’s interests in alternative energy (including biofuels but excluding wind) and CO2 management.
PROJECTS & TECHNOLOGYProjects & Technology manages the delivery of Shell’s major projects and drives the research and innovation to create technology solutions. It provides technical services and technology capability covering both Upstream and Downstream activities. It is also responsible for providing functional leadership across Shell in the areas of safety and environment, and contracting and procurement.
COMPANY OVERVIEW
OUR BUSINESSES
103585_SHE_Investors Handbook_V98_Cleaned_JD.indd 2 08-05-13 14:51

BUILDING AN ENERGY FUTUREGlobal energy demand is rising and so are consumer expectations – more people want energy from cleaner sources. At Shell we work with others to unlock new energy sources and squeeze more from what we have. We do this in responsible and innovative ways. In building a better energy future we all have a part to play. Shell is doing its part.
SHELL IS AN INNOVATION-DRIVEN GLOBAL GROUP OF ENERGY AND PETROCHEMICAL COMPANIES.
3reports.shell.com | Shell Investors’ HandbookCompany overview
SHELL IS AN GASfor cooking, heating, electrical power
FUELS AND LUBRICANTSfor transport
CHEMICAL PRODUCTSfor plastics, coatings, detergents
Refining oil into fuels and lubricants
Producing petrochemicals
Producing biofuels
Shipping and trading
Shipping and trading
Supply and distribution
Retail sales
Retail sales
B 2B sales
B 2B sales
Developing fi elds
Extracting bitumen
Converting gas to liquid products (GTL)
Producing oil and gas
Liquefying gas by cooling (LNG) Generating
wind power
Mining oil sands
Regasifying LNG
Exploring for oil and gas
103585_SHE_Investors Handbook_V98_Cleaned_JD.indd 3 08-05-13 14:51

Appraisal success at Appomattox discovery Shell announced a successful appraisal operation at its Appomattox discovery in deep water in the Gulf of Mexico with resources potential of about 500 million boe. The appraisal well in Mississippi Canyon Block 348, in approximately 2,212 metres of water, was drilled to a total depth of 7,879 metres and encountered approximately 46 metres of oil pay.
CNPC and Shell sign fi rst shale gas production sharing contract in ChinaCNPC and Shell signed a production sharing contract for shale gas exploration, development and production in the Fushun-Yongchuan Block in the Sichuan Basin, China.
FIRST QUARTER
Shell and partners announce LNG project in CanadaShell, KOGAS, Mitsubishi Corporation, and PetroChina announced that they are developing a proposed liquefi ed natural gas (LNG) export facility in Western Canada, near Kitimat, British Columbia.
Shell takes fi nal investment decision on two projects in NigeriaIn Nigeria, Shell took fi nal investment decisions on the Forcados Yokri Integrated Project and the Southern Swamp Associated Gas Gathering Project (Shell share 30% for both projects). These projects are expected to produce about 100 thousand boe/d and 85 thousand boe/d respectively at peak production and reduce fl aring intensity.
Shell signs share purchase agreement to acquire Gasnor Shell, previously the owner of 4.1% of the shares in Gasnor AS, signed a share purchase agreement for the remaining outstanding shares in the company for $0.1 billion.
Shell to construct world’s fi rst oil sands carbon capture and storage projectShell announced that it will go ahead with the fi rst carbon capture and storage project for an oil sands operation in Canada. The Quest project will capture and store more than one million tonnes of CO2 per year and reduce direct emissions from the Scotford Upgrader by up to 35%.
Shell increases Browse equity stakeIn Australia Shell increased its interest in the West Browse joint venture to 35% and in the East Browse joint venture to 25% in an exchange with Chevron for our 33.3% interest in Clio-Acme plus cash of approximately $0.5 billion.
Shell acquires liquids-rich shales in Texas Shell acquired acreage in Texas from Chesapeake Energy in a further step to build a leading portfolio of shale assets rich in oil and natural gas liquids for an announced consideration of $1.9 billion. The acquisition covers 618,000 net acres in the Permian Basin in West Texas that currently produce about 26 thousand boe/d and have signifi cant growth potential.
Shell increases participation in the Schiehallion fi eld and divests its Canadian Seal assets Shell announced the signing of separate agreements for the acquisition of Murphy Schiehallion Ltd’s 5.9% stake in the Schiehallion fi eld, in the UK North Sea, and for the sale of Shell’s interest in the Seal area within the Peace River oil sands of Alberta, Canada, to Murphy Oil Company Ltd.
Shell increases participation in the Beryl area fi elds in the North Sea In the UK we acquired 75% of Hess Corporation’s interests in the Beryl area fi elds and Scottish Area Gas Evacuation system. The acquisition should help to
enhance the performance and economic potential of key Shell North Sea operated and non-operated assets, lifting Shell’s production in the Beryl area fi elds from 9 thousand boe/d to 20 thousand boe/d. Shell intends to invest in these assets to substantially extend the production life, for a potentially further 20 years.
Construction begins on the Prelude FLNG project Shell celebrated the cutting of the fi rst steel for the game-changing Prelude fl oating liquefi ed natural gas (FLNG) facility’s substructure with joint venture participants, INPEX and KOGAS, and lead contractor, the Technip Samsung Consortium, at Samsung Heavy Industries’ Geoje shipyard in South Korea.
SECOND QUARTER
THIRD QUARTER
FOURTH QUARTER
4 Shell Investors’ Handbook | reports.shell.comCompany overview
HIGHLIGHTS 2012
103585_SHE_Investors Handbook_V98_Cleaned_JD.indd 4 08-05-13 14:51

We focus on a series of strategic themes, each requiring distinctive technologies and risk management:
§ our upstream and downstream ‘engines’ are strongly cash generative, mature businesses, which will underpin our fi nancial performance to at least the end of this decade;
§ our growth priorities are in three strategic themes, namely integrated gas, deep water and resources plays such as shale oil and gas. These will provide our medium-term growth, and we expect them to become core engines in the future; and
§ our future opportunities include the Arctic, Iraq, Kazakhstan, Nigeria, and heavy oil, where we believe large reserves positions could potentially become available, with the pace of development driven by market and local operating conditions.
Meeting the growing demand for energy worldwide in ways that minimise environmental and social impact is a major challenge for the global energy industry. We aim to improve energy effi ciency in our own operations and support customers in managing their energy demands.
Our commitment to technology and innovation is at the core of our strategy.
On-streamUnder construction
Long-term upside
ProductionStudy
-5
0
5
10
15
20
25
30
35
2011 2012 2012 2013+201020092008
CONVERTING RESOURCES TO PRODUCTIONbillion boe
Abadi FLNG Phase 1Tukau TimurZaedyusZabazaba
Tempa RossaMalikaiForcados YokriSouthern SwampAOSP DebottleneckingNorth American tight gas/shales
Gbaran Ubie Phase 2Rab HarweelErha North Phase 3ML SouthBC-10 Phase 3Eagle FordPermian
Majnoon FCPPetaiAmal SteamKashagan Phase 1BC-10 Phase 2NorthWest Shelf North Rankin 2AOSP Debottlenecking
Pluto (Woodside) HarweelNorth American tight gas/shalesEagle FordCaesar TongaGumusut-Kakap (early oil)
0
50
100
150
200
250
201220112010200920080
10
20
30
40
$ billion %
RETURNS
Capital otherCapital in service
Return on capital in service (%)Return on capital employed (%)
5reports.shell.com | Shell Investors’ HandbookCompany overview
STRATEGY AND OUTLOOK
STRATEGY
Shell’s strategy is competitive and innovative. We seek to continuously reinforce our position as a leader in the oil and gas industry while helping to meet global energy demand in a responsible way. We aim to create competitive returns for shareholders. Safety, environmental and social responsibility are at the heart of our activities.
Intense competition exists for access to upstream resources and to new downstream markets. But we believe our technology, project-delivery capability and operational excellence will remain key differentiators for our businesses.
In Upstream we focus on exploration for new liquids and natural gas reserves, and on developing major new projects where our technology and know-how add value for the resource holders. We expect about 80% of our capital investment in 2013 to be in our Upstream businesses.
In Downstream, our emphasis remains on sustained cash generation from our existing assets and making selective growth investments.
103585_SHE_Investors Handbook_V98_Cleaned_JD.indd 5 08-05-13 14:51

the long term. We have the potential to reach an average production of some 4.0 million boe/d in 2017–2018, compared with 3.3 million boe/d in 2012. This will be driven by the timing of investment decisions and the near-term macroeconomic outlook. In Downstream we evaluate selective growth opportunities in chemicals, biofuels and growth markets.
Shell has built up a substantial portfolio of options for a next wave of growth. This portfolio has been designed to capture energy price upside and manage Shell’s exposure to industry challenges from cost infl ation and political risk. Key elements of this opportunity set are in global exploration and established resource positions in the Gulf of Mexico, North American resources plays and Australian LNG. These projects help ensure that the portfolio has the potential to underpin production growth to the end of this decade. Shell is working to mature these projects, with an emphasis on fi nancial returns.
The statements in this Strategy and outlook section do not take into account the impact of the agreement to acquire part of Repsol S.A.’s LNG portfolio, which was announced in February 2013.
The statements in this Strategy and outlook section, including those related to our growth strategies and our expected or potential future cash fl ow from operations,
net capital investment and production, are based on management’s current expectations and certain material assumptions and, accordingly, involve risk and uncertainties that could cause actual results, performance and outcomes to differ materially from those expressed herein.
OUTLOOK
We continuously work to improve our operating performance, with an emphasis on health, safety and environment, asset performance and operating costs. Asset sales are a key element of our strategy – improving our capital effi ciency by focusing investment on the most attractive growth opportunities. Sales of non-core assets in 2010–2012 generated about $21 billion in divestment proceeds. Exits from further positions in 2013 are expected to generate up to $3 billion in divestment proceeds.
In early 2012, we set out a new growth agenda. For the period from 2012–2015, we aim to deliver cash fl ow from operations (CFFO) totalling $175-200 billion excluding working capital movements. This is about 30-50% higher compared with the 2008–2011 period. This target assumes that the Brent oil price is in the $80-100 per barrel range, and that North American natural gas prices and downstream margins will be higher than in 2012. The increased cash fl ow would fi nance an expected net capital investment programme of $120-130 billion for 2012–2015, an increase of about 10-20% compared with the 2008–2011 level, and fund competitive dividends for shareholders. Shell is on track to deliver these targets.
Shell’s strategy in Upstream is designed to drive fi nancial growth, with production growth regarded as a proxy for this over
-10
0
10
20
30
40
2013201220132012Downstream and CorporateUpstream
DivestmentsUpstream AmericasUpstream
Upstream Africa, Middle East, CISUpstream Europe
Acquisitions
TOTAL CAPITAL INVESTMENT$ billion
-20
-15
-5
5
20
10
0
201520142013201220112010r rat rr rat star
Or starOr star
-10
15
[A] CFFO outlook at $100/b Brent, assumes improved US gas environment from 2012; CFFO excludes working capital movements.
IMPACT OF KEY UPSTREAM START-UPS [A]$ bill
DIVESTMENTS 2010-2012
UpstreamDownstream
Total $21 billion
6 Shell Investors’ Handbook | reports.shell.comCompany overview
103585_SHE_Investors Handbook_V98_Cleaned_JD.indd 6 08-05-13 14:51

UPSTREAM ENGINEShell’s upstream engine focuses on cash generation from our mature basins. Focused exploration, licence renewals and the application of Shell’s advanced technology will all contribute to extending the life of these assets in a safe and responsible manner.
Our positions in Europe, south-east Asia and some of the Middle East are included in the upstream engine and should underpin the fi nancial performance of our Upstream businesses up to the end of the decade.
INTEGRATED GASShell is the leading international oil company for integrated gas, which comprises LNG and GTL. Earnings from integrated gas were more than $9 billion in 2012 (about 40% of our total group earnings) and generated $12 billion of cash fl ow from operations (more than 20% of the total).
We have 22 million tonnes per annum (mtpa) of LNG capacity on-stream today and our LNG sales volumes grew 7% in 2012. The next tranche of LNG growth for Shell will come from Australia where we have 7 mtpa under construction that will increase our capacity by 30% by 2017. We have also worked internationally to diversify our integrated gas optionality, which will then allow us to progress the most attractive options for the next tranche of growth. We are currently studying new LNG options representing 20 mtpa of capacity that could increase our output by as much as 70% after 2017.
STRATEGIC THEMES
DOWNSTREAM ENGINEIn our downstream engine, our emphasis remains on sustained cash generation from our existing assets and selective growth investments.
The implementation of our strategy will see us actively manage our assets around three themes in Downstream:
§ operational excellence and cost effi ciency, to maximise the uptime and operating performance of our asset base;§ driving the profi tability of our refi nery
portfolio by optimising integration with crude supplies, marketing outlets and petrochemical plants; and§ selective growth in countries such as
Brazil, China and India while maintaining or increasing our margins in our core countries.
0
10
20
30
40
50
CFFO excluding working capital movementsNet capital investmentDividends and buybacksMacro sensitivity [B]
2012–15 average potential [A]2009–11 average
[A] CFFO and capex outlook at $100/b Brent, assumes improved US gas, WTI and downstream environment from 2012; CFFO excludes working capital movements.
[B] Potential impact in $100/b Brent scenario from continuation of 2012 downstream environment, Henry Hub, WCS and WTI discounts.
CFFO GROWTH AND INVESTMENT PLAN$ billion
$100/b
$91/b
Free
FINANCIAL FRAMEWORK [A]
PAY-OUT
Dividend linked to business results Scrip dividend with buyback offset Expected dividend growth 2013
INVESTMENT
$120-130 billion net capex 2012–2015 ~$33 billion net capex 2013
CASH PERFORMANCE
$175-200 billion CFFO 2012–2015 CFFO drives investment and pay-out
BALANCE SHEET
0-30% gearing through cycle Balance sheet underpins investment Capital employed grows steadily
[A] CFFO and capex outlook at $80-100/b Brent and assumes improved US gas and downstream environment from 2012.
7reports.shell.com | Shell Investors’ HandbookCompany overview
103585_SHE_Investors Handbook_V98_Cleaned_JD.indd 7 08-05-13 14:51

DEEP WATERShell is one of the industry’s pioneers in the deep-water oil and gas business with some 330 thousand boe/d of production in 2012, and a strong growth outlook.
We have nine new fi elds under construction, in Brazil, the Gulf of Mexico and south-east Asia. We focus on standardising development concepts. For example, in the deep waters of the Gulf of Mexico, Shell pioneered tension-leg platform developments at the Auger fi eld in 1993. Today, the new Olympus TLP is being installed at the Mars B development, Shell’s sixth and largest tension-leg platform worldwide.
In addition to this production and development portfolio, Shell has built up new resources potential, with deep-water frontier exploration positions in a number of countries worldwide. These basins could become growth hubs for Shell in the future.
RESOURCES PLAYSHydraulic fracturing technologies have opened up an exciting new resources base for the industry and Shell intends to be a leading player in this area.
We currently have positions in resources plays – tight gas and shales – in 14 countries. Our production today is dominated by North American gas and liquids-rich plays, with exploration and appraisal activities in a number of basins worldwide. We are building up our operating capabilities and working to reduce costs in the supply chain. For example, in 2012 we incorporated Sirius Well Manufacturing Services, our 50:50 joint venture with China National Petroleum Corporation (CNPC). It will use advanced techniques to drill multiple wells for tight, shale and coalbed gas in a highly effi cient, repeatable way.
FUTURE OPPORTUNITIESThis strategic theme covers the Arctic, Iraq, Kazakhstan, Nigeria and heavy oil plays. In these areas, Shell has access to large resources positions – typically in oil – but there are surface issues that can slow down the development pace. These include community and government relations, security of staff and evolving local fi scal and environmental regulations.
We are in these provinces for their long-term potential and we expect to see a measured development pace.
0
1
2
3
4
2017–18 average
2012 2012+2011
million boe/d
OIL AND GAS PRODUCTION AND OUTCOMES
Production and potentialAsset sales
2017–182012Upstream engineIntegrated gasDeep water
Resources playsFuture opportunities
Americas
EuropeAfrica, Middle East, CIS
2017–182012
PRODUCTION OUTLOOK [A]
[A] Outlook at $80/b Brent, assumes improved US gas prices from 2012 and 250 kboe/d divestments and lease expiries 2012+.
%
Region Strategic theme
0
25
50
75
100
8 Shell Investors’ Handbook | reports.shell.comCompany overview
103585_SHE_Investors Handbook_V98_Cleaned_JD.indd 8 08-05-13 14:51

KEY PROJECTS UNDER CONSTRUCTION
SCHIEHALLIONREDEVELOPMENT CLAIR PH2
FRAMAOSP DEBOTTLENECKING
KASHAGAN PH1
MAJNOON FCPTEMPA ROSSA
GUMUSUT-KAKAPPETAIMALIKAI
SABAH GAS KEBABANGAN
NORTH RANKIN 2PRELUDE FLNG
AMAL STEAMSASBAB
BONGA NWSOUTHERN SWAMPFORCADOS YOKRI
BC-10 PH2
CORRIB
NORTH AMERICANTIGHT GAS
NORTH AMERICAN LIQUIDS-RICH SHALES
GREATER WESTERN FLANK PH A GORGON LNG T1-3
WHEATSTONE LNG
MARS B, W. BOREAS & S. DEIMOSCARDAMOM
KEY PROJECTS – POST FINAL INVESTMENT DECISION [A]
Start-up Project CountryShell interest
(%)Peak production 100% (kboe/d)
LNG 100% capacity (mtpa) Strategy theme
Shell operated
2013–2014 Amal Steam Oman 34 20 Upstream engineAOSP Debottlenecking Canada 60 10 Future opportunities l
Bab Thamama G/Bab Habshan-2 United Arab Emirates 9.5 80 Upstream engineBC-10 Phase 2 Brazil 50 35 Deep water l
Bonga North West Nigeria 55 40 Deep water l
Cardamom USA 100 50 Deep water l
Gumusut-Kakap Malaysia 33 135 Deep water l
Kashagan Phase 1 Kazakhstan 17 300 Future opportunitiesMajnoon FCP Iraq 45 >30[B] Future opportunities l
Mars B, W. Boreas & S. Deimos USA 71.5 100 Deep water l
North American liquids-rich shales USA/Canada Various ~80[C] Resources plays l
North American tight gas USA/Canada Various ~65[C] Resources plays l
North Rankin 2 Australia 21 295 Integrated gasPetai Malaysia 21 30 Deep water
SAS United Arab Emirates 9.5 115 Upstream engine 2015–2016 Clair Phase 2 UK 28 120 Upstream engine
Corrib Ireland 45 45 Upstream engine l
Forcados Yokri Integrated Project Nigeria 30 90 Future opportunities l
Fram UK 32 35 Upstream engine l
Gorgon LNG T1-3 Australia 25 440 15 Integrated gasMalikai Malaysia 35 60 Deep water l
Greater Western Flank Phase A Australia 21 90 Integrated gasSabah Gas Kebabangan (KBB) Malaysia 30 130 Deep waterSchiehallion Redevelopment UK 55 130 Upstream engineSouthern Swamp AG Nigeria 30 85 Future opportunities l
Tempa Rossa Italy 25 45 Upstream engine 2017+ Prelude FLNG Australia 67.5 110 3.6[D] Integrated gas l
Wheatstone LNG Australia 6.4 260 8.9 Integrated gas
[A] Overview as per end of January 2013.[B] Shell entitlement at $80/b.[C] Shell share (subject to investment pace).[D] Not including 1.7 mtpa NGLs.
9reports.shell.com | Shell Investors’ HandbookCompany overview
KEY
n Upstream engine
n Integrated gas
n Deep water
n Resources plays
n Future opportunities
103585_SHE_Investors Handbook_V98_Cleaned_JD.indd 9 08-05-13 14:51

KEY PROJECT S UPDATE
CARDAMOM DEEP(Shell interest 100%; Shell operated)The Cardamom reservoir lies below the Auger fi eld in the deep waters of the Gulf of Mexico. Shell discovered the Cardamom reservoir in 2010 using advanced seismic technology that was able to produce improved images versus traditional seismic methods. The fi eld is expected to produce a peak of 50 thousand boe/d through wells connected to the existing Auger platform, some directly and others via a new subsea tie-back system. The wells are currently being drilled. The start-up is expected within the next two years.
KASHAGAN PHASE 1(Shell interest 17%)Kashagan is located offshore, about 80 kilometres from Atyrau and extends over an area of approximately 75 kilometres by 45 kilometres. This is a deep, high-pressure reservoir in a region that experiences wide temperature variations from -40 to +40 degrees Celsius. Due to its size and technical complexity, the Kashagan fi eld is being developed in phases. With its current confi guration, Phase I is built to produce 300 thousand boe/d at peak production and is expected to start up later this year. The operator is North Caspian Operating Company (NCOC) and Shell has taken on signifi cant elements of the project execution and production operations to help bring the project to a timely delivery.
MAJNOON FCP(Shell interest 45%; Shell operated)In 2009, Shell and Petronas Carigali were awarded a contract for technical assistance in developing the Majnoon fi eld, which is located in Southern Iraq and is one of the largest oil fi elds in the world. Petronas holds a 30% interest and the Iraqi state has a 25% participating interest in the licence. The project is making good progress toward achieving the fi rst commercial production target of 175 thousand b/d.
MALIKAI(Shell interest 35%; Shell operated)In early 2013, Shell and partners announced the fi nal investment decision to develop the deep-water Malikai oil fi eld, located some 100 kilometres offshore Sabah, Malaysia. The fi eld, located in waters up to 500 metres deep, is part of the Block G production sharing contract awarded by Petronas in 1995, and is expected to produce 60 thousand boe/d
at peak production. Operated by Shell, it is the country’s third deep-water project. The Malikai development will require 17 wells drilled from a 23,500 tonne tension leg platform production facility, the fi rst to be fabricated and installed in Malaysia. The contracts for the engineering, procurement and construction of this platform have been awarded.
MARS B(Shell interest 71.5%; Shell operated)The Mars B project will help boost production from the Mars fi eld and bring on-stream two other nearby fi elds – West Boreas and South Deimos. The fi elds are located in water about 900 metres (some 3,000 feet) deep in the Gulf of Mexico. The Mars B project includes the construction of a new tension-leg platform. Peak production will be 100 thousand boe/d. The Mars fi eld has been one of Shell’s most important fi elds over the last 15 years. Yet by the end of 2011, the fi eld still contained around 1.1 billion boe. The Mars B project extends the life of the fi eld to at least 2050.
NORTH AMERICAN RESOURCES PLAYS(Shell interests various; Shell operated)Shell has an industry-leading portfolio of dry gas and liquids-rich shale (LRS) resources in the USA and Canada. Drilling focus has shifted away from dry gas plays to LRS, and about 75% of our 2013 capital expenditure in North American resources plays is expected to be in liquids-rich shale areas. Shell owns about 30,000 square kilometres of acreage in North America (an increase of 10,000 square kilometres in the last year), of which about 60% is LRS. The main regions of operation in the USA are Eagle Ford (Texas) and Permian (Delaware basin) where Shell is currently producing around 50 thousand boe/d. This production will also create new integrated gas options in the future.
PRELUDE FLNG(Shell interest 67.5%; Shell operated)In 2011, Shell took its fi rst fi nal investment decision to move ahead with building a fl oating liquefi ed natural gas (FLNG) facility. The fl oating processing and storage facility will be moored above an offshore gas fi eld, liquefying the gas produced from the fi eld. Ocean-going carriers will offl oad the liquefi ed natural gas, as well as other liquid by-products, for delivery to market. Located more than 200 kilometres offshore Western Australia, the Prelude FLNG facility
will be the largest offshore facility in the world, measuring 488 metres by 74 metres. Total production capacity will be 3.6 mtpa of LNG, 1.3 mtpa of condensate and 0.4 mtpa of LPG. Shell has moved forward rapidly to bring this project to reality and in October 2012, the fi rst steel was cut for the hull. First production of LNG is expected some 10 years after the Prelude gas fi eld has been discovered.
SCHIEHALLION(Shell interest 55%)The Schiehallion fi eld is located in blocks 204 and 205, approximately 175 kilometres west of the Shetland Islands, off the Scottish coast. The Schiehallion Redevelopment Project will replace an existing fl oating production, storage and offl oading unit (FPSO) with a newly built one. In so doing, the project will extend the expected life of the fi eld. The new FPSO will be capable of exporting as much as 130 thousand boe/d and store in excess of 900 thousand boe. The fi nal investment decision for the project was announced in 2011. In 2012, we announced the signing of agreements with Murphy Oil Company and Hess Corporation to increase our stake to 55%. The additional equity offers Shell access to substantial additional reserves and redevelopment potential in the UK.
10 Shell Investors’ Handbook | reports.shell.comCompany overview
103585_SHE_Investors Handbook_V98_Cleaned_JD.indd 10 08-05-13 14:51

Shell has a strong portfolio of pre-fi nal investment decision options that can support production growth up to 2020. We have about 30 projects in the concept-selection or design phase, around half of which are to be operated by Shell. The projects include not only traditional exploration and production activities, but also involve deep water, LNG, tight gas, liquids-rich shale and heavy oil. In total, these projects represent some 13 billion boe of resources. The main areas of potential growth are the deep-water fi elds such as the Gulf of Mexico, tight-gas and liquids-rich shale resources (mainly in North America) and LNG projects in Oceania.
POTENTIAL 2014–2020 START-UPS
Phase Project CountryShell interest
(%)Peak production 100% (kboe/d)
LNG 100% capacity (mtpa) Strategy theme
Shell operated
Concept AOSP Debottlenecking Canada 60 55 Future opportunities l
selection Appomattox USA 80 150 Deep water l
Basrah Gas Company Rehab & Rejuvenation Iraq 44 Future opportunitiesBonga North Nigeria 55 200 Deep water l
Bosi Field Development Nigeria 44 130 Deep waterGeronggong Brunei 50 Deep waterGorgon T4 Expansion Australia 25 250 5 Integrated gasLNG Canada Canada 40 12 Integrated gas l
Majnoon FFD [A] Iraq 45 100 Future opportunities l
Nigeria NLNG Train 7 Nigeria 26 220 8.4 Integrated gasPearls – Khazar Kazakhstan 55 50 Future opportunitiesPennsylvania Gas to Chemicals USA 100 Downstream engine l
Sunrise LNG Australia 34 120 4.1 Integrated gasTukau Timur Malaysia 50 55 Upstream engineVito USA 51 100 Deep water l
West Qurna FFD Iraq 15 200 Future opportunitiesZabazaba Nigeria 50 170 Deep water
Zaedyus French Guiana 45 Deep water l
Design Abadi FLNG Phase 1 Indonesia 30 65 2.5 Integrated gasAOSP Debottlenecking Canada 60 20 Future opportunities l
Arrow Energy LNG Australia 50 160 8 Integrated gasBC-10 Massa Phase 3 Brazil 50 30 Deep water l
Bokor Phase 3 Malaysia 40 25 Upstream engineBonga South West/Aparo Nigeria 44 200 Deep water l
Browse (BCT) LNG Australia 34 310 >10 Integrated gasCarmon Creek Expansion Phase 1 & 2 Canada 100 80 Future opportunities l
Erha North Phase 3 Nigeria 44 60 Deep waterGas to Transport USA/Canada 100 0.5 Integrated gas l
Gbaran Ubie Phase 2 Nigeria 30 165 Future opportunities l
Linnorm Norway 30 50 Upstream engine l
ML South Brunei 35 30 Upstream engineNorth American liquids-rich shales USA/Canada Various >170[B] Resources plays l
North American tight gas USA/Canada Various ~200[B] Resources plays l
Project Q (Al Karaana Petrochemicals) Qatar 20 Downstream engineRabab Harweel Integrated Project Oman 34 40 Upstream engine
Stones USA 60 60 Deep water l
[A] Shell entitlement at $80/b.[B] Shell share (subject to investment pace).
OPTIONS FOR FUTURE GROWTH
POTENTIAL 2014–2020 START-UPS
11reports.shell.com | Shell Investors’ HandbookCompany overview
KEY
n Downstream engine
n Upstream engine
n Integrated gas
n Deep water
n Resources plays
n Future opportunities
103585_SHE_Investors Handbook_V98_Cleaned_JD.indd 11 08-05-13 14:51

MARKET OVERVIEW
SHELL REALISED PRICES YEAR AVERAGE
2012 2011 2010 2009 2008 SUBS EAI SUBS EAI SUBS EAI SUBS EAI SUBS EAI Oil and natural gas liquids ($/b)
Europe 108.13 104.60 106.77 103.97 73.35 83.24 55.53 56.97 89.28 86.33Asia 107.76 67.33 103.73 62.81 76.21 44.27 57.50 36.53 95.92 49.78Oceania 91.62 90.14[A] 92.38 99.74[A] 67.90 78.05[A] 50.47 56.16[A] 85.92 99.99[A]Africa 112.45 111.70 79.63 61.45 98.52North America – USA 103.59 110.00 104.93 109.49 76.36 74.27 57.25 56.24 97.95 89.74North America – Canada 68.31 70.72 53.23 39.26 67.07[B]South America 100.01 97.33 100.44 97.76 69.99 63.57 57.76 58.00 79.42 82.25
Total 107.15 76.01 105.74 73.01 75.74 52.42 57.39 42.49 92.75 63.59 Natural gas ($/thousand scf)
Europe 9.48 9.64 9.40 8.58 6.87 6.71 7.06 8.17 9.46 10.87Asia 4.81 10.13 4.83 8.37 4.40 6.55 3.61 4.26 4.67 7.06Oceania 11.14 9.48[A] 9.95 10.09 8.59 8.79[A] 5.29 3.94[A] 2.96 4.13[A]Africa 2.74 2.32 1.96 1.71 1.67North America – USA 3.17 7.88 4.54 8.91 4.90 7.27 4.36 5.02 9.61 12.15North America – Canada 2.36 3.64 4.09 3.73 7.71South America 2.63 1.04 2.81 0.99 3.79 3.18 4.37
Total 5.53 9.81 5.92 8.58 5.28 6.81 4.83 6.73 6.85 9.63 Other ($/b)
North America – Bitumen 68.97 76.28 66.00 50.00North America – Synthetic crude oil 81.46 91.32 71.56 56.23North America – Minable oil sands 88.98
[A] Estimate based on publicly available data.[B] Includes bitumen.
-2
0
2
4
6
8
10
20122011201020092008
$/b
REFINING MARKER INDUSTRY GROSS MARGINS
US West Coast marginUS Gulf Coast coking margin [A]Rotterdam complex margin [B]Singapore
[A] US Gulf Coast margin up to and including 2009. [B] Rotterdam Brent up to and including 2009.
40
50
60
70
80
90
100
110
120
2
3
4
5
6
7
8
9
10
$/b $/MMBtu
OIL AND GAS MARKER INDUSTRY PRICES
WTIBrent
Japanese Crude Cocktail (JCC) [A]Henry Hub ($/MMBtu)
20122011201020092008
[A] Based on available market information at the end of the year.
0
200
400
600
800
1,000
20122011201020092008
$/tonne
CHEMICAL MARGINS
US ethaneWestern Europe naphtha [A]East Asia naphtha
[A] Based on available market information at the end of the year.
12 Shell Investors’ Handbook | reports.shell.comCompany overview
103585_SHE_Investors Handbook_V98_Cleaned_JD.indd 12 08-05-13 14:51

RESULTS
SUMMARY OF RESULTS $ MILLION
2012 2011 2010 2009 2008Upstream 22,162 24,455 15,935 8,354 26,506Downstream (current cost of supplies (CCS) basis) 5,350 4,289 2,950 258 5,309Corporate and non-controlling interest (468) (119) (242) 1,192 (449)CCS earnings 27,044 28,625 18,643 9,804 31,366Estimated CCS adjustment for Downstream (452) 2,293 1,484 2,714 (5,089)Income attributable to shareholders 26,592 30,918 20,127 12,518 26,277Identifi ed items 1,905 3,938 570 (1,749) 2,956CCS earnings excluding identifi ed items 25,139 24,687 18,073 11,553 28,410Basic CCS earnings per share ($) 4.32 4.61 3.04 1.60 5.09Estimated CCS adjustment per share ($) (0.07) 0.37 0.24 0.44 (0.82)Basic earnings per €0.07 ordinary share ($) 4.25 4.98 3.28 2.04 4.27Basic earnings per ADS ($) 8.50 9.96 6.56 4.08 8.54Net cash from operating activities 46,140 36,771 27,350 21,488 43,918Cash fl ow from operating activities per share ($) 7.37 5.92 4.46 3.51 7.13Dividend per share ($) 1.72 1.68 1.68 1.68 1.60Dividend per ADS ($) 3.44 3.36 3.36 3.36 3.20
-20
-10
0
10
20
30
40
50
60
ShellChevron ExxonMobil Total BP2010–2012
%
TOTAL SHAREHOLDER RETURN [A]
[A] TSR is averaged across year-end. Source: Datastream.
-5
0
5
10
15
20
25
30
201220112010
$ billion
CCS EARNINGS
UpstreamDownstreamDivestments/OtherCorporate
0
10
20
30
40
50
201220112010
$ billion
NET CASH FROM OPERATING ACTIVITIES
UpstreamDownstreamCorporate
13reports.shell.com | Shell Investors’ HandbookCompany overview
103585_SHE_Investors Handbook_V98_Cleaned_JD.indd 13 08-05-13 14:51

UPSTREAMHIGHLIGHTS§ Produced 3.3 million boe/d of oil and gas, a 3% increase excluding the effect of
divestments and exits.§ Sold 20.2 million tonnes of liquefi ed natural gas (LNG).§ Added 4 billion boe of resources in 2012 from exploration and acquisitions,
compared with 1.2 billion boe of production. § Made seven notable new discoveries and appraisals in conventional exploration,
including an appraisal at Appomattox, which now has more than 500 million boe potential.§ Took fi nal investment decisions on Forcados Yokri and Southern Swamp in Nigeria;
Tempa Rossa in Italy; Malikai in Malaysia; and North American liquids-rich shales.§ Increased participation in the Draugen, Schiehallion and Beryl fi elds in the UK
North Sea.§ Acquired liquids-rich shales acreage in the Permian basin, Texas.§ Divested three oil mining leases onshore Nigeria for a total consideration of more
than $1 billion.§ Found strategic partners for the Groundbirch project and Prelude FLNG, and diluted
our stakes in these projects.§ Signed the fi rst ever shale gas production sharing contract in China with CNPC.§ Announced a proposal for developing an LNG export facility in Western Canada
with strategic partners called LNG Canada.
103585_SHE_Investors Handbook_V98_Cleaned_JD.indd 14 08-05-13 14:51

KEY STATISTICS
2012 2011 2010 2009 2008Upstream earnings ($ million)
Upstream International 21,245 19,697 15,205 7,209 19,298Upstream Americas 917 4,758 730 1,145 7,208
Total Upstream earnings ($ million) 22,162 24,455 15,935 8,354 26,506of which Integrated gas 10,978 7,279 5,727 1,785 4,093
Total Upstream earnings excluding identifi ed items ($ million) 20,025 20,600 14,442 8,488 23,019Upstream cash fl ow from operations ($ million) [A] 32,951 33,281 24,526 18,445 35,448Liquids production (thousand b/d) [B][C] 1,508 1,551 1,637 1,600 1,693Natural gas production (million scf/d) [B] 9,449 8,986 9,305 8,483 8,569Synthetic crude oil production (thousand b/d) [B] 125 115 72 80Mined oil sands production (thousand b/d) [B] 78Total production (thousand boe/d) [B][D] 3,262 3,215 3,314 3,142 3,248Equity sales of liquefi ed natural gas (LNG) (million tonnes) 20.2 18.8 16.8 13.4 13.1Upstream net capital investment ($ million) 25,320 19,083 21,222 22,326 28,257Upstream capital employed ($ million) 139,277 126,437 113,631 98,826 83,997Upstream employees (thousands) 26 27 26 23 22
[A] Excludes net working capital movements.[B] Available for sale.[C] Includes bitumen production.[D] Natural gas volumes are converted to oil equivalent using a factor of 5,800 scf per barrel.
EXPLORATIONSTRATEGYOur exploration strategy is designed to deliver new resources that grow production, creating substantial value for shareholders. Exploration remains the most cost-effective way to access new resources, and our expertise, history and global reach give us advantages in this area. We have extensive acreage in high-potential basins around the world and have had signifi cant success discovering resources in them. Exploration in conventional basins and resources plays are managed separately at Shell.
DISCOVERIESOur exploration performance has been robust over the past few years. Seven notable new discoveries and appraisals were made worldwide during 2012 in conventional exploration. In Australia, Shell participated in three notable conventional gas exploration discoveries. One could add volumes for the Gorgon Train 4 liquefi ed natural gas facility, and the others could potentially lead to the development of an FLNG facility in the Outer Exmouth basin. In Malaysia, at the Tukau Timur well, we discovered more than 2 tcf of gas in place, which will unlock satellite fi elds, and should fl ow into Malaysia LNG. In Nigeria, the Zabazaba well appraised a sizable oil fi nd. In the Gulf of Mexico, we drilled successful appraisal wells at Appomattox (more than 500 million barrels potential) and Vito, and in Brazil on the Gato do Mato structure.
There were also 10 notable successful appraisals in resources plays in Australia, Canada, China and the USA.
ACREAGE ADDITIONS
Since 2008, Shell has acquired exploration rights to some 400,000 square kilometres. In 2012, we secured rights to more than 120,000 square kilometres, including positions in liquids-rich shales. Recent signifi cant additions are specifi ed below.
ALBANIAIn February 2012, Shell signed a farm-in agreement and a joint operating agreement (JOA) with Petromanas to acquire a 50% working interest in Blocks 2 and 3.
0
1
2
3
4
5
201220112010200920080
5
10
15
20
25
PRODUCTION
Liquids
Equity LNG sales volume (mtpa)Gas
million boe/d mtpa
5
10
15
20
25
0
$ billion
UPSTREAM EARNINGS [A]
Excluding integrated gas Integrated gas
20122011201020092008
15reports.shell.com | Shell Investors’ HandbookUpstream
103585_SHE_Investors Handbook_V98_Cleaned_JD.indd 15 08-05-13 14:51

AUSTRALIAIn July 2012, Shell Australia was awarded the W11-2 permit located in the Browse Basin offshore north-west Australia. Thenew acreage, awarded as Shell 100% equity, contains multiple prospects. This position adds to Shell’s operated footprint offshore north-west Australia.
BENINIn August 2012, Shell signed two farm-in agreements for the acquisition of a 35% participating interest in Benin Block 4 from Petrobras (15%) and Compagnie Béninoise des Hydrocarbures (20%).
BRUNEIIn September 2012, Shell signed a petroleum mining agreement, with Shell
Deepwater Borneo as operator with an interest of 53.9%, and Petroleum Brunei holding a 46.1% interest. The signing of this new petroleum mining agreement marks a further commitment by Shell to continue to explore and develop Brunei’s hydrocarbon resources.
CANADADuring 2012, Shell Canada was the successful bidder for four large exploration blocks in deep-water Nova Scotia covering more than 14,000 square kilometres and focusing on a newly-recognised oil play. Shell Canada was also the successful bidder for fi ve parcels in the deep-water Laurentian Basin as well as two parcels in the Sable Basin. In addition, several liquids-rich shale assets were accessed in the
Nordegg, Duvernay, Canol and Muskwa plays. In Groundbirch, Shell Canada added additional dry gas resources.
CHINAIn January 2012, Shell signed a binding memorandum of understanding with Ivanhoe Energy to buy its 90% participating interest in the Zitong block in the Sichuan Basin, located directly north of Shell’s JQ block. A joint study agreement was also fi nalised and signed by Sinopec and Shell in June, covering two exploration blocks (XeX1 and 2) in western Hubai Province targeting the Silurian Longmaxi Shale. In July, Shell signed two production-sharing contracts (PSCs) for offshore blocks 62/02 and 62/17 in the Yinggehai Basin. Shell also accessed the shallower prospect above the Zitong/Fushun prolifi c liquids-rich shale play in the Jurassic Daanzhai Formation, which covers a large area in the Central and Northern Sichuan basin.
COLOMBIAIn October 2012, Shell was the successful bidder for the deep-water block COL-3, located directly south-west of Shell’s GUA-3 TEA block.
GUYANAIn July 2012, an assignment deed was signed by the government of Guyana, ExxonMobil and Shell that formalised an increase in Shell’s stake in the Stabroek permit from a 25% to a 50% working interest.
MALAYSIAIn March 2012, Shell signed PSCsfor deep-water Block 2B and BlockSK318, and in September, Shellsigned a PSC with Petronas (50%) for Block SK319. These three new exploration licences offshore Sarawak, together with Block SK408, amount to just under 10,000 square kilometres of new acreage, expanding Shell’s heartland and enabling further exploration in the Luconia/North Luconia provinces. Offshore Sabah, Shell signed a PSC to access Block SB311 with a non-operated position.
NEW ZEALANDIn December 2012, Shell Great South Basin Ltd (operator) and partners were awarded the exploration licence for block 12GS2 in the Great South Basin. The permit area lies directly east of Shell’s PEP50119 block.
0
0.5
1.0
1.5
2.0
2.5
201220112010
billion boe
CONVENTIONAL RESOURCES ADDED [A]
LiquidsGasDeals
[A] Resources potential.
Iraq
Abadi BrowseNorth Sea
0
1
2
3
201220112010
billion boe
RESOURCES PLAYS ADDED [A]
LiquidsGasDeals
[A] Resources potential.
MarcellusEagle Ford
Arrow
Liquids-rich shales
Permian
0
1
2
3
4
5
6
2013E2012201120102009
$ billion
CONVENTIONAL EXPLORATION INVESTMENT
Exploration and appraisalAcreage/deals
0
2
4
6
8
2013E2012201120102009
$ billion
RESOURCES PLAYS INVESTMENT
Exploration and appraisalAcreage/deals
16 Shell Investors’ Handbook | reports.shell.comUpstream
103585_SHE_Investors Handbook_V98_Cleaned_JD.indd 16 08-05-13 14:51
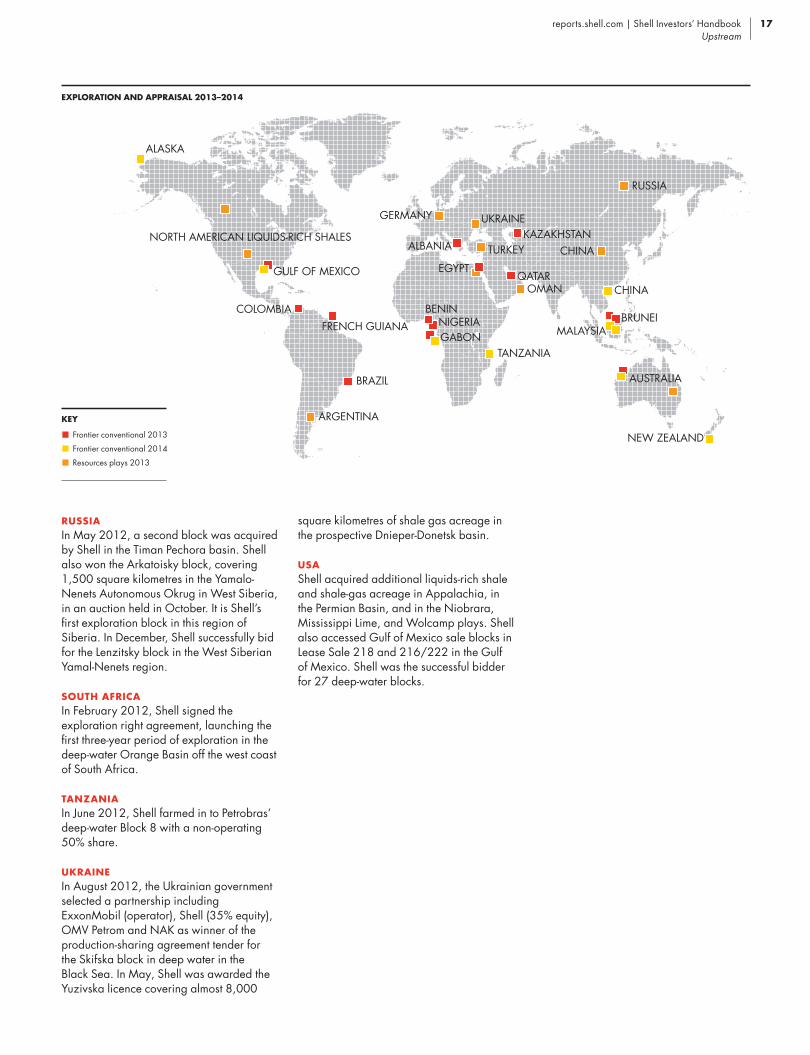
RUSSIAIn May 2012, a second block was acquired by Shell in the Timan Pechora basin. Shell also won the Arkatoisky block, covering 1,500 square kilometres in the Yamalo-Nenets Autonomous Okrug in West Siberia, in an auction held in October. It is Shell’s fi rst exploration block in this region of Siberia. In December, Shell successfully bid for the Lenzitsky block in the West Siberian Yamal-Nenets region.
SOUTH AFRICAIn February 2012, Shell signed the exploration right agreement, launching the fi rst three-year period of exploration in the deep-water Orange Basin off the west coast of South Africa.
TANZANIAIn June 2012, Shell farmed in to Petrobras’ deep-water Block 8 with a non-operating 50% share.
UKRAINEIn August 2012, the Ukrainian government selected a partnership including ExxonMobil (operator), Shell (35% equity), OMV Petrom and NAK as winner of the production-sharing agreement tender for the Skifska block in deep water in the Black Sea. In May, Shell was awarded the Yuzivska licence covering almost 8,000
square kilometres of shale gas acreage in the prospective Dnieper-Donetsk basin.
USAShell acquired additional liquids-rich shale and shale-gas acreage in Appalachia, in the Permian Basin, and in the Niobrara, Mississippi Lime, and Wolcamp plays. Shell also accessed Gulf of Mexico sale blocks in Lease Sale 218 and 216/222 in the Gulf of Mexico. Shell was the successful bidder for 27 deep-water blocks.
ALASKA
NORTH AMERICAN LIQUIDS-RICH SHALES
GULF OF MEXICO
COLOMBIAFRENCH GUIANA
BRAZIL
ARGENTINA
RUSSIA
TANZANIAGABONNIGERIA
BENIN
ALBANIA TURKEY
UKRAINEKAZAKHSTAN
GERMANY
EGYPTCHINA
CHINA
NEW ZEALAND
AUSTRALIA
OMAN
BRUNEIMALAYSIA
QATAR
n Frontier conventional 2013
n Frontier conventional 2014
n Resources plays 2013
KEY
EXPLORATION AND APPRAISAL 2013–2014
17reports.shell.com | Shell Investors’ HandbookUpstream
103585_SHE_Investors Handbook_V98_Cleaned_JD.indd 17 08-05-13 14:51

PROVED OIL AND GAS RESERVES ATTRIBUTABLE TO ROYAL DUTCH SHELL PLC SHAREHOLDERS BILLION BOE
2012 2011 2010 2009 2008Organic reserves additions 1.0[A] 1.5[A] 1.6[A] 3.2[A] 1.1[B]Production 1.2 1.2 1.2 1.2 1.2Total proved reserves 13.6 14.2 14.2 14.1 11.9
[A] Excluding acquisitions, divestments and year-average price impact.[B] Excluding acquisitions, divestments and year-end price impact.
PROVED RESERVES
commodity prices in the USA (1,076 thousand million scf) and Canada (683 thousand million scf), and sales of minerals in place in Oceania (303 thousand million scf, in Australia).
Proved reserves can be either developed or undeveloped. Subsidiaries’ proved reserves at December 31, 2012, were divided into 66% developed and 34% undeveloped on a barrel of oil equivalent basis. For the Shell share of equity-accounted investments, the proved reserves were divided into 81% developed and 19% undeveloped.
In 2012, Shell added 542 million boe of SEC proved oil and gas reserves before accounting for the year’s production. At the end of the year, total proved oil and gas reserves excluding non-controlling interest were 13,556 million boe (9,855 million boe for Shell subsidiaries and 3,701 million boe for equity-accounted investments). Reserves life (an estimate of how many years it would take to exhaust the current proved reserves at the current level of production) decreased from 11.8 years at the end of 2011 to approximately 11 years at the end of 2012. Reserves life is up from 2008, when we had 10 years of reserves.
The Reserves Replacement Ratio for Shell subsidiaries and equity-accounted investments was 44% in 2012 (and 84% over the last three years). Excluding acquisitions, divestments and price effects, the ratio was 85% in 2012, and 115% in the period 2010–2012.
Signifi cant oil and natural gas liquids (NGL) proved reserves additions in 2012 were from revisions and reclassifi cations from fi eld performance studies and development activities in Asia (270 million barrels, primarily in Brunei, Iraq, Kazakhstan, Malaysia, Oman, Russia and United Arab Emirates), Africa (95 million barrels, primarily in Gabon and Nigeria), the USA (80 million barrels) and Canada (131 million barrels), and from the purchase of minerals in place in Europe (56 million barrels, in Norway and the UK).
Signifi cant additions in natural gas reserves came from fi eld extensions and discoveries in the USA (393 thousand million scf), and from revisions and reclassifi cations in Asia (284 thousand million scf, primarily in Brunei and Russia). These additions were offset by signifi cant reductions in proved natural gas reserves from revisions and reclassifi cations associated with lower
PRODUCTIONProduction in 2012 was 3,262 thousand boe/d compared with 3,215 thousand boe/d in 2011. Liquids production was down 2% and natural gas production increased by 5% compared with 2011. Excluding the impact of divestments and exits, production volumes in 2012 were 3% higher than in 2011.
In 2012, hydrocarbon production from new start-ups and the continuing ramp-up of new projects more than offset the impact of fi eld declines, and the impact of divestments and exits. There was also further upside from new wells and improved reliability compared with 2011, partially offset by changes in contractual entitlements and other non-operational factors.
Production was mainly driven by the continued ramp-up of new projects, notably our Pearl GTL plant in Qatar, the start-upof the Pluto LNG Project in Australia, and the fi rst full year of production from Qatargas 4. Further additions also came from new start-ups such as Harweel in Oman, and the early fi rst production from Gumusut-Kakap in Malaysia.
18 Shell Investors’ Handbook | reports.shell.comUpstream
103585_SHE_Investors Handbook_V98_Cleaned_JD.indd 18 08-05-13 14:51

0
25
50
Under constructionOptions
On-stream
mtpa
~2020+2007 2012
[A] Includes feedgas from non-integrated ventures.
SHELL LNG CAPACITY GROWTH [A]
options to monetise natural gas in North America. These would be projects that involve the entire natural gas value chain and so play very much to Shell’s strengths as an integrated player.
LNGOur expertise in the LNG industry is based on the more than 45 years of technical advice that we have provided for gas
liquefaction plants around the world – including the world’s fi rst commercial plant, which came on-stream in 1964 in Algeria. LNG is fast becoming a truly global commodity and will continue its rapid expansion in the years ahead, with global demand potentially doubling to 400 mtpa by 2020 and 500 mtpa by 2025. This will be driven by the growing gas import needs of China, India, the Middle
0
10
20
30
BPBGTotalChevronExxonMobilShell
year-end mtpa
LNG LEADERSHIP [A]
20122017E
[A] Projects in operation or under construction.
PLUTO (WOODSIDE)PRELUDE FLNG
BRUNEI LNGBINTULU
GORGON WHEATSTONE
PEARL GTLQATARGAS 4
NORTH WEST SHELF
SAKHALIN-2
OMAN LNG AND QALHAT LNG
NIGERIA LNGMALAYSIA LNG
n LNG – in operation
n LNG – under construction
n Regasifi cation – in operation
n Regasifi cation – under construction
n GTL
GLOBAL INTEGRATED GAS PORTFOLIO [A]
KEY
[A] As of March 2013.
INTEGRATED GAS Strong growth in gas markets is a major opportunity for Shell. Our integrated gas earnings have more than trebled over the last fi ve years, reaching $9 billion in 2012 or about 45% of Upstream earnings. This was mainly driven by several large liquefi ed natural gas (LNG) and gas-to-liquids (GTL) projects that came on-stream, including Pearl GTL, Pluto LNG Train 1 (Woodside), Qatargas 4 and Sakhalin-2. Integrated gas earnings incorporate LNG, including LNG marketing and trading, and GTL operations. In addition, the associated upstream oil and gas production activities from the Sakhalin-2, North West Shelf, Pluto LNG Train 1 (Woodside), Qatargas 4 and Pearl GTL projects are included in integrated gas earnings. Power generation and coal gasifi cation activities are also included in integrated gas.
The Prelude fl oating LNG (FLNG) project as well as the Greater Western Flank Phase A, Gorgon LNG Trains 1-3, North Rankin 2 and Wheatstone LNG projects are currently under construction and are expected to come on-stream within the next few years. Shell is also considering GTL and LNG
19reports.shell.com | Shell Investors’ HandbookUpstream
103585_SHE_Investors Handbook_V98_Cleaned_JD.indd 19 08-05-13 14:51

FLOATING LNGWe believe that fl oating liquefi ed natural gas (FLNG) will write the next chapter in the history of the industry. In the coming years, Shell will start to produce and liquefy natural gas at sea, enabling the development of gas resources ranging from clusters of smaller and more remote offshore fi elds to potentially larger fi elds. FLNG can open up new business opportunities for countries looking to develop their natural gas resources.
In May 2011, Shell announced the world’s fi rst fi nal investment decision to build an FLNG facility. The facility will be used to develop the Prelude gas fi eld, 200 kilometres off Australia’s north-west coast (see also page 10). Prelude FLNG is the fi rst of what we expect to be multiple Shell FLNG projects, and builds on our existing capability and LNG leadership.
GTLAlmost 40 years ago, Shell began researching how to convert natural gas into liquid fuels, lubricants and chemical feedstocks. In 1993, this gas-to-liquids (GTL) technology became a commercial reality when the Shell Middle Distillate Synthesis plant started up in Bintulu, Malaysia. In total, Shell has fi led more than 3,500 patents covering all stages of the GTL process.
East and Europe – but also by new importers such as Malaysia, the Philippines, Singapore, Thailand and Vietnam.
At Shell, we are proud of our leadership in this sector of the industry. In 2012, ventures in which Shell participated supplied as much as 35% of global LNG. We have about 22 mtpa of Shell-share liquefaction capacity currently in operation in Australia, Brunei, Malaysia, Nigeria, Oman, Qatar and Russia. Qatargas 4, a joint venture between Qatar Petroleum (70%) and Shell (30%), was brought on-stream in early 2011 with a single mega-train delivering approximately 7.8 mtpa of LNG and a peak production of 280 thousand boe/d. The project opened up new markets for Qatari LNG in China and Dubai, with agreements signed in 2008. Our total LNG sales volume in 2012 was 20.2 million tonnes – up 7% from 2011. This increase mainly refl ected the increase in sales volumes from Qatargas 4 and the Pluto LNG Project. Sales volumes were also
higher from Nigeria LNG, helped by a stable gas supply, and from the Sakhalin-2 project, where production exceeded 10 mtpa.
Three LNG projects are currently under construction in Australia, with capacity totalling about 7 mtpa: Prelude FLNG (Shell interest 67.5%), Gorgon Trains 1-3 (25%) and Wheatstone (6.4%). We are also assessing additional future options with more than 20 mtpa of capacity, with projects involving: Arrow Energy; Gorgon Train 4; the Browse and Greater Sunrise fi elds offshore Australia; the Abadi fi eld of Indonesia; and LNG Canada.
In February 2013, Shell agreed to acquire part of Repsol S.A.’s LNG portfolio, including supply positions in Peru and Trinidad & Tobago, for a cash consideration of $4.4 billion. Shell will also assume and consolidate $1.8 billion of balance sheet liabilities predominantly refl ecting leases for LNG ship charters.
ßThe Pearl GTL plant in Qatar illustrates our large-scale project capabilities.
20 Shell Investors’ Handbook | reports.shell.comUpstream
103585_SHE_Investors Handbook_V98_Cleaned_JD.indd 20 08-05-13 14:51

100
0
200
400
300
500
600
MW, Shell share
INSTALLED WIND CAPACITY
USAEurope
20122011201020092008
WINDShell WindEnergy has strong operational and development capabilities, with 10 joint-venture projects: eight in North America and two in Europe (Shell share of total capacity is approximately 50%). The projects’ generating capacity totals about 1,000 megawatts – enough electricity to meet the annual requirements of 300,000 homes. Generating that amount of electricity with conventional power plants would have emitted about 3 million tons of CO2. Almost 900 MW of the total capacity came from the 722 wind turbines of the eight US projects.
We used our proprietary technology and operational experience with GTL to build Pearl, Shell’s and Qatar Petroleum’s massive plant in Qatar. Ten times bigger than the Bintulu plant, Pearl is the world’s largest GTL plant and one of the largest industrial developments in the world.
Pearl achieved full production at 90% or higher on both trains at the end of 2012, marking the completion of the ramp-up for this fl agship project. The plant delivered its 100th cargo in December and produced GTL Jet fuel, the fi rst new aviation fuel to be approved globally in over two decades. Pearl is currently producing and selling all products (GTL gasoil, GTL naphtha, normal paraffi ns, GTL base oil and GTL kerosene) from its product slate.
At peak production capacity, Pearl takes 320 thousand boe/d of gas and turns it into 140 thousand boe/d of GTL products and 120 thousand boe/d of natural gas liquids and ethane. This amounts to almost 8% of Shell’s worldwide production, making it the company’s main engine for growth in 2012. Over its lifetime, Pearl will process about three billion boe from the world’s largest single non-associated gas fi eld, the North Field, which contains more than 900 tcf of gas.
àThe Rock River Wind Farm in Wyoming, USA, is one of Shell WindEnergy’s 10 joint-venture projects.
21reports.shell.com | Shell Investors’ HandbookUpstream
103585_SHE_Investors Handbook_V98_Cleaned_JD.indd 21 08-05-13 14:51

HIGHLIGHTS§ Shell has been a leading player in the North Sea for several decades, and is also
the operator of the NAM joint venture, the largest hydrocarbon producer in the Netherlands. § Production in Europe amounted to about 800 thousand boe/d in 2012, and we
invested about $3 billion in 2012 for sustainable production in the future.§ After-tax earnings from the oil and gas exploration and production operations of our
subsidiaries and equity-accounted investments in the region were $4.2 billion. § We are participating in the development of the Clair Phase 2 and Schiehallion
Redevelopment projects in the UK, and the Corrib project in Ireland. We have increased our stakes in the offshore Beryl, Schiehallion and Draugen fi elds.
KEY FIGURES 2012 % of totalTotal production (thousand boe/d) [A] 790 24%Liquids production (thousand b/d) [A] 219 15%Natural gas production (million scf/d) [A] 3,311 35%Gross developed and undeveloped acreage (thousand acres) 14,935 6% Proved oil and gas reserves excluding non-controlling interest (million boe) [B] 3,236 24%[A] Available for sale.[B] Includes proved reserves associated with future production that will be consumed in operations.
DENMARKWe hold a non-operating interest in a producing concession covering the majority of our activities in Denmark. The concession was granted in 1962 and will expire in 2042. Our interest reduced to 36.8% from 46% in July 2012, when the government entered the partnership with a 20% interest and the government profi t share of 20% was abolished.
IRELANDWe are the operator of the Corrib Gas project (Shell interest 45%), which is currently at an advanced stage of construction. At peak production, Corrib is expected to supply a signifi cant proportion of the Ireland’s natural gas needs.
THE NETHERLANDSShell and ExxonMobil are 50:50 shareholders in Nederlandse Aardolie Maatschappij B.V. (NAM), the largest hydrocarbon producer in the Netherlands. An important part of NAM’s gas production comes from the onshore Groningen gas fi eld, in which the Dutch government has a 40% interest, with NAM holding the remaining 60%. NAM also has a 60% interest in the Schoonebeek oil fi eld, which has been redeveloped using enhanced oil recovery (EOR) technology. NAM also operates a signifi cant number of other onshore gas fi elds and offshore gas fi elds in the North Sea.
UNITED KINGDOMWe operate a signifi cant number of our interests on the UK Continental Shelf on behalf of a 50:50 joint venture with ExxonMobil. Most of our UK oil and gas production comes from the North Sea. We hold various non-operated interests in the Atlantic Margin area, principally in the West of Shetlands area. We have increased our interest in the non-operated Schiehallion fi eld to 55%, and in the Beryl area fi elds, with interests ranging from 25% to 66%.
REST OF EUROPEShell also has interests in Albania, Austria, Germany, Greece, Hungary, Italy, Slovakia, Spain and Ukraine.
á A new well is drilled by NAM, the largest hydrocarbon producer in the Netherlands.
0
0.5
1.0
1.5
2.0
2.5
3.0
201220112010
$ billion
CAPEX
United KingdomNorwayDenmarkOther
0
0.2
0.4
0.6
0.8
1.0
2017–18201220112010
million boe/d
PRODUCTION
United Kingdom The NetherlandsAsset sales 2010–2012Production outlook 2017–2018
NorwayDenmarkOther
NORWAYWe are a partner in more than 20 production licences on the Norwegian continental shelf and are the operator in six of these, including the Ormen Lange gas fi eld (Shell interest 17%) and the Draugen oil fi eld, where we increased our interest to 44.6%. We have interests in the Troll, Gjøa, and Kvitebjørn fi elds, and have further interests in the Valemon fi eld development and various other potential development assets.
EUROPE
22 Shell Investors’ Handbook | reports.shell.comUpstream
103585_SHE_Investors Handbook_V98_Cleaned_JD.indd 22 08-05-13 14:52

KEY FIGURES 2012 % of totalTotal production (thousand boe/d) [A] 442 14%Liquids production (thousand b/d) [A] 290 19%Natural gas production (million scf/d) [A] 881 9%Gross developed and undeveloped acreage (thousand acres) 35,832 13%Proved oil and gas reserves excluding non-controlling interest (million boe) [B] 1,057 8%[A] Available for sale.[B] Includes proved reserves associated with future production that will be consumed in operations.
HIGHLIGHTS§ Shell is the largest international oil company in Nigeria with interests in major
onshore, offshore and LNG activities.§ Production in Africa amounted to more than 400 thousand boe/d in 2012, mostly
from our operations in Nigeria.§ After-tax earnings from the oil and gas exploration and production operations of our
subsidiaries in the region were $3.4 billion.§ We added new exploration positions in South Africa and Tanzania in 2012.§ We are participating in the development of the Bonga North West, Forcados Yokri
and Southern Swamp projects in Nigeria.
AFRICA
EGYPTWe have a 50% interest in the Badr El-Din Petroleum Company (Bapetco), a joint venture with the Egyptian General Petroleum Corporation. Bapetco carries out fi eld operations in the West Desert, where we have interests in the BED, NEAG, NEAG Extension, West Sitra, Sitra, Obaiyed and Alam El Shawish West concession areas. In addition, we have interests in two BP-operated offshore concessions: North Damietta Offshore and North Tineh Offshore.
GABONWe have interests in eight onshore permits (one mining concession and seven PSCs), and three offshore exploration permits in addition to one of the two country export terminals. Two of the non-operated permits (Coucal and Avocette) have been converted into PSCs as of January 1, 2011.
NIGERIAShell-share production in Nigeria was approximately 365 thousand boe/d in 2012 compared with approximately 385
thousand boe/d in 2011. Security, crude oil theft and fl ooding in the Niger Delta were signifi cant challenges in 2012.
Onshore The Shell Petroleum Development Company of Nigeria Ltd (SPDC) is the operator of a joint venture (Shell interest 30%) that holds more than 25 Niger Delta onshore oil mining leases (OMLs), which expire in 2019. To provide funding, modifi ed carry agreements are in place for certain key projects and a bridge loan was drawn down by the Nigerian National Petroleum Company (NNPC) in 2010. The modifi ed carry agreements are being reimbursed, and in December 2012 NNPC repaid the bridge loan with interest. New fi nancing agreements with NNPC are under discussion and are expected to be put in place during 2013.
We have a 30% interest in the Gbaran-Ubie integrated oil and gas project in Bayelsa State, which delivered 0.9 billion scf/d of gas in 2012. Gas from Gbaran-Ubie is delivered to Nigeria LNG Ltd (NLNG) for export. In 2012, we sold our 30% interests in OMLs 30, 34 and 40 for a consideration of $1.1 billion.
Offshore Our main offshore deep-water activities are carried out by Shell Nigeria Exploration and Production Company (Shell interest 100%) which holds interests in three deep-water blocks. We operate two of the blocks, including the Bonga fi eld 120 kilometres offshore. Deep-water offshore activities are typically governed through production sharing contracts (PSCs). SPDC also holds an interest in six shallow-water offshore leases, of which fi ve expired on November 30, 2008. However, SPDC satisfi ed all the requirements of the Nigerian Petroleum Act to be entitled to an extension. Currently, the status quo is maintained following a court order issued on November 26, 2008. SPDC is pursuing a negotiated solution with the federal government of Nigeria. Production from the EA fi eld, in one of the disputed leases, continued throughout 2012.
LNG Shell has a 25.6% interest in NLNG, which operates six LNG trains with a total capacity of 22 mtpa. NLNG continued production near full capacity during 2012.
REST OF AFRICAShell also has interests in Benin, Ghana, Libya, South Africa, Tanzania and Tunisia.
á A fl oating production storage and offl oading vessel at the Bonga fi eld, 120 kilometres offshore Nigeria.
23reports.shell.com | Shell Investors’ HandbookUpstream
103585_SHE_Investors Handbook_V98_Cleaned_JD.indd 23 08-05-13 14:52

KEY FIGURES 2012 % of totalTotal production (thousand boe/d) [A] 1,126 35%Liquids production (thousand b/d) [A] 652 44%Natural gas production (million scf/d) [A] 2,752 29%Gross developed and undeveloped acreage (thousand acres) 80,449 30%Proved oil and gas reserves excluding non-controlling interest (million boe) [B] 4,517 33%[A] Available for sale.[B] Includes proved reserves associated with future production that will be consumed in operations.
HIGHLIGHTS§ Shell is the industry leader in integrated gas in Asia, with a major LNG portfolio
across the region and the world’s largest GTL plant in Qatar. § We are active in our existing heartlands of Malaysia and Brunei, and are investing
for growth in China. § Production in Asia amounted to more than 1.1 million boe/d in 2012.§ After-tax earnings from the oil and gas exploration and production operations of our
subsidiaries and equity-accounted investments in the region were $5.8 billion. § We are participating in the development of nine key projects in the region: Amal
in Oman; SAS and Bab Thamama G/Bab Habshan-2 in the United Arab Emirates; Gumusut-Kakap, Petai, Malikai and Sabah Gas Kebabangan in Malaysia; Kashagan Phase 1 in Kazakhstan; and Majnoon FCP in Iraq.
ASIA (INCLUDING MIDDLE EAST AND RUSSIA)
BRUNEIShell and the Brunei government are 50:50 shareholders in Brunei Shell Petroleum Company Sendirian Berhad (BSP). BSP holds long-term oil and gas concession rights onshore and offshore Brunei, and sells most of its natural gas production to Brunei LNG Sendirian Berhad (BLNG, Shell interest 25%). BLNG was the fi rst LNG plant in the Asia-Pacifi c region, and sells most of its LNG on long-term contracts to customers in Asia.
We are the operator for the Block A concession (Shell interest 53.9%), which is under exploration and development. We have a 35% interest in the Block B concession, where gas and condensate are produced from the Maharaja Lela Field. In addition, we have a 12.5% interest in exploration Block CA-2 under a PSC.
CHINAWe operate the onshore Changbei tight-gas fi eld under a PSC with PetroChina. The PSC was amended in July 2012 for developing tight gas in different geological layers of the same block. Shell and PetroChina have also agreed to appraise, develop and produce tight gas in the Jinqiu block under a PSC that expires in 2040 (Shell interest 49%), and signed a PSC in March 2012 for shale-gas exploration, development
and production in the Fushun Yongchuan block (Shell interest 49%), both in Sichuan. Shell and PetroChina are also assessing opportunities in coalbed methane in the Ordos Basin.
In 2012, Shell became a party to the Zitong PSC for tight gas exploration, development and production in Sichuan (Shell interest 44.1%). Shell has agreed with Chinese National Offshore Oil Corporation to appraise and potentially develop two offshore oil and gas blocks in the Yinggehai Basin under a PSC signed in July 2012 (Shell interest 49%).
INDONESIAWe have a 30% participating interest in the offshore Masela block where INPEX Masela is the operator. The Masela block contains the Abadi gas fi eld. The operator has currently selected a fl oating LNG (FLNG) concept for the fi eld’s fi rst development phase.
IRANIn compliance with international sanctions against Iran Shell halted its upstream commercial activities in Iran in 2010 and ceased buying oil from Iran in the fi rst quarter of 2012.
IRAQWe have a 45% interest in the Majnoon oil fi eld that we operate under a technical service contract that expires in 2030. The other Majnoon shareholders are Petronas (30%) and the Iraqi government (25%), which is represented by the Missan Oil Company. Majnoon is located in southern Iraq and is one of the world’s largest oil fi elds. The fi rst phase of the development is planned to bring production to approximately 175 thousand b/d from the level of 45 thousand b/d when the contract entered into effect in March 2010. We also hold a 15% interest in the West Qurna 1 fi eld. At the end of 2012, production was approximately 460 thousand b/d. According to the provisions of both contracts, Shell’s equity entitlement volumes will be lower than the Shell interest implies.
In 2012, Shell continued to work in establishing the Basrah Gas Company, a joint venture between Shell (44%), the South Gas Company (51%) and Mitsubishi Corporation (5%). The Basrah Gas Company will gather, treat and process raw gas produced from the Rumaila, West Qurna 1 and Zubair fi elds. Currently, an estimated 700 million scf/d of gas is fl ared because of a lack of infrastructure to collect and process it. The processed natural gas and associated products, such as condensate and liquefi ed petroleum gas (LPG), will be sold primarily to the domestic market with the potential to export any surplus.
KAZAKHSTANWe have a 16.8% interest in the offshore Kashagan fi eld, where the North Caspian Operating Company is the operator. This shallow-water fi eld covers an area of approximately 3,400 square kilometres. Phase 1 development of the fi eld is expected to lead to plateau production of approximately 300 thousand boe/d, increasing further with additional phases of development. NC Production Operations Company, a joint venture between Shell and KazMunayGas, will manage production operations. First production is expected to start in 2013.
We have an interest of 55% in the Pearls PSC, covering an area of approximately 900 square kilometres located in the Kazakh sector of the Caspian Sea that includes two oil discoveries (Auezov and Khazar) and several exploration prospects.
24 Shell Investors’ Handbook | reports.shell.comUpstream
103585_SHE_Investors Handbook_V98_Cleaned_JD.indd 24 08-05-13 14:52

MALAYSIAWe produce oil and gas located offshore Sabah and Sarawak under 19 PSCs, in which our interests range from 30% to 85%.
In Sabah we operate four producing offshore oil fi elds with interests ranging from 50% to 80% as part of the 2011 North Sabah EOR PSC and SB1 PSC (the latter expired at the end of December 2012). We also have additional interests ranging from 30% to 50% in PSCs for the exploration and development of fi ve deep-water blocks. These include the unitised Gumusut-Kakap deep-water fi eld (Shell interest 33%) and the Malikai fi eld (Shell interest 35%). Both these fi elds are currently being developed with Shell as the operator.
In Sarawak we are the operator of 20 gas fi elds with interests ranging from 37.5% to 70%. Nearly all of the gas produced is supplied to Malaysia LNG in Bintulu where we have a 15% interest in each of the Dua and Tiga LNG plants. We also have a 40% interest in the 2011 Baram Delta EOR PSC and a 50% interest in Block SK-307.
In 2012, we signed fi ve new exploration PSCs, deep-water blocks 2B, SK318,
SK319 and SK408, all offshore Sarawak, and SB311, offshore Sabah.
We also operate a GTL plant (Shell interest 72%), which is adjacent to the Malaysia LNG facilities in Bintulu. Using Shell technology, the plant converts natural gas into high-quality middle distillates, drilling fl uids, waxes and other speciality products.
OMANWe have a 34% interest in Petroleum Development Oman (PDO), the operator of an oil concession expiring in 2044. In 2012, production began at its Harweel EOR project, which is expected to produce approximately 30 thousand boe/d at peak production. We are also participating in the development of the Mukhaizna oil fi eld (Shell interest 17%) where steam fl ooding, an EOR method, is being applied on a large scale.
QATARPearl in Qatar is the world’s largest GTL plant. Shell operates the plant under a development and production-sharing contract with the government of Qatar. The fully integrated facility includes production, transport and processing of approximately
1.6 billion scf/d of wellhead gas from Qatar’s North Field with installed capacity of around 140 thousand boe/d of GTL and 120 thousand boe/d of NGL and ethane. Ramp-up of the project was completed in the fourth quarter of 2012. The plant delivered its 100th cargo in mid-December and produced GTL Jet fuel, with its fi rst commercial market introduction in January 2013.
We have a 30% interest in Qatargas 4, which comprises integrated facilities to produce approximately 1.4 billion scf/d of natural gas from Qatar’s North Field, an onshore gas-processing facility and an LNG train with a collective production capacity of 7.8 mtpa of LNG and 70 thousand boe/d of NGL. The train delivered its fi rst LNG in 2011 and has been operating at full capacity in 2012. The LNG is shipped mainly to markets in North America, China, Europe and the United Arab Emirates.
We are the operator of Block D under the terms of an exploration and production-sharing contract with Qatar Petroleum, representing the national government. We have a 75% interest, with PetroChina holding the remaining 25% interest.
ßThe Kashagan fi eld offshore Kazakhstan is a 300 thousand boe/d high sulphur development. Shell will be the operator from fi rst production.
25reports.shell.com | Shell Investors’ HandbookUpstream
103585_SHE_Investors Handbook_V98_Cleaned_JD.indd 25 08-05-13 14:52

RUSSIAWe have a 27.5% interest in Sakhalin-2, one of the world’s largest integrated oil and gas projects. Located in a subarctic environment, the project produced approximately 335 thousand boe/d in 2012. Following optimisation of the LNG plant, production from its two trains exceeded 10 mtpa for the year.
We have a 50% interest in the Salym fi elds in western Siberia, where production was approximately 155 thousand boe/d during 2012. We also have a 100% interest in four exploration and production licences. They are for the East Talotinskiy area in the Nenets Autonomous District, the Barun-Yustinsky block in Kalmykia and the Arkatoitsky and the Lenzitsky blocks in the Yamalo Nenets Autonomous District. We also have an exploration licence in the North-Vorkutinsky area in the Komi Republic.
UNITED ARAB EMIRATESIn Abu Dhabi we hold a concessionary interest of 9.5% in the oil and gas operations run by Abu Dhabi Company for Onshore Oil Operations (ADCO). The
licence expires in 2014. We also have a 15% interest in the licence of Abu Dhabi Gas Industries Limited (GASCO), which expires in 2028. GASCO exports propane, butane and heavier-liquid hydrocarbons that it extracts from the wet natural gas associated with the oil produced by ADCO.
REST OF ASIA (INCLUDING THE MIDDLE EAST AND RUSSIA)Shell also has interests in India, Japan, Jordan, Kuwait, the Philippines, Saudi Arabia, Singapore, South Korea and Turkey. We suspended all exploration and production activities in Syria in December 2011.
áThe Majnoon oil fi eld in Iraq is one of the largest in the world. We should reach the fi rst commercial production target of 175 thousand boe/d in 2013.
26 Shell Investors’ Handbook | reports.shell.comUpstream
103585_SHE_Investors Handbook_V98_Cleaned_JD.indd 26 08-05-13 14:52

OCEANIA
KEY FIGURES 2012 % of totalTotal production (thousand boe/d) [A] 179 5%Liquids production (thousand b/d) [A] 45 3%Natural gas production (million scf/d) [A] 777 8%Gross developed and undeveloped acreage (thousand acres) 72,278 27%Proved oil and gas reserves excluding non-controlling interest (million boe) [B] 1,314 10%[A] Available for sale.[B] Includes proved reserves associated with future production that will be consumed in operations.
HIGHLIGHTS§ Australia is a key growth country for Shell with major investment currently underway
to develop about 7 mtpa of LNG capacity in the next fi ve years. § We are building the world’s largest FLNG facility for the Prelude fi eld offshore
Australia, and participating in four other key projects: Gorgon LNG Trains 1-3; North Rankin 2; North West Shelf Gas – Greater Western Flank Phase A; and Wheatstone LNG.§ In 2012, the 4.3 mtpa capacity Pluto LNG Project (Shell indirect share 21%) delivered
its fi rst LNG cargo. § Production in Oceania amounted to nearly 200 thousand boe/d in 2012.§ After-tax earnings from the oil and gas exploration and production operations of our
subsidiaries and equity-accounted investments in the region were $3.0 billion.
AUSTRALIAWe have interests in offshore production and exploration licences in the North West Shelf (NWS) and Greater Gorgon areas of the Carnarvon Basin, as well as in the Browse Basin and Timor Sea. Some of these interests are held directly and others indirectly through a shareholding of approximately 23% in Woodside Petroleum Ltd (Woodside). All interests in Australian assets quoted below are direct interests.
Woodside is the operator of the Pluto LNG Project which produced its fi rst LNG in 2012. Woodside is also the operator on behalf of six joint-venture participants of the NWS gas, condensate and oil fi elds, which produced more than 470 thousand boe/d in 2012. Shell provides technical support for the NWS development.
We have a 50% interest in Arrow Energy Holdings Pty Limited (Arrow), a Queensland-based joint venture with PetroChina. Arrow owns coalbed methane assets, a domestic power business and the site for a proposed LNG plant on Curtis Island, near Gladstone. In January 2012, Arrow completed the acquisition of coalbed methane company Bow Energy Ltd (Shell-share consideration $0.3 billion).
We have a 25% interest in the Gorgon LNG project, which involves the development of some of the largest gas discoveries to date in Australia, beginning with the offshore Gorgon (Shell interest 25%) and Jansz-lo fi elds (Shell interest approximately 20%). It includes the construction of a 15.3 mtpa LNG plant on Barrow Island.
We are the operator of a permit in the Browse Basin in which two separate gas fi elds were found: Prelude in 2007, and Concerto in 2009. We are developing these fi elds on the basis of our innovative FLNG technology. The Prelude FLNG project is expected to produce about 110 thousand boe/d of natural gas and NGL, delivering approximately 3.6 mtpa of LNG, 1.3 mtpa of condensate and 0.4 mtpa of LPG. During 2012, we commenced construction of the Prelude FLNG project and completed the sale of a 17.5% interest to INPEX and a 10% interest to KOGAS.We also completed the sale of a 5% interest to CPC Corporation in the fi rst quarter of 2013, reducing our interest to 67.5%.We formed a joint venture to operate the Crux gas and condensate fi eld (Shell interest 82%). We also operate the AC/P41 block (Shell interest 75%).
We are a partner in the Browse joint ventures covering the Brecknock, Calliance
and Torosa gas fi elds. During 2012, we increased our interest in the West Browse joint venture to 35% and in the East Browse joint venture to 25%. The Browse resources are being assessed for development on the basis of an LNG export project.
In the Timor Sea we have a 26.6% interest in the Sunrise gas fi eld. The joint-venture partners have selected FLNG as the preferred development concept for Sunrise. The development is subject to approval from both the Australian and Timor-Leste governments.
Shell is a partner in both Shell-operated and non-operated exploration joint ventures in multiple basins including the Bonaparte, Exmouth Plataeu, Greater Gorgon, Outer Canning and South Exmouth. We also hold a 6.4% interest in the Wheatstone LNG project, which includes the construction of two LNG trains with a combined capacity of 8.9 mtpa.
NEW ZEALANDWe have an 83.8% interest in the offshore Maui gas fi eld, a 50% interest in the onshore Kapuni gas fi eld and a 48% interest in the offshore Pohokura gas fi eld. The gas produced is sold domestically, mainly under long-term contracts. Shell has interests in other exploration licence areas in the Taranaki Basin and an interest in two exploration permits in the Great South Basin (50% and 59% interest).
27reports.shell.com | Shell Investors’ HandbookUpstream
103585_SHE_Investors Handbook_V98_Cleaned_JD.indd 27 08-05-13 14:52

KEY FIGURES 2012 % of totalTotal production (thousand boe/d) [A] 725 22%Liquids production (thousand b/d) [A] 282 19%Natural gas production (million scf/d) [A] 1,728 18%Synthetic crude oil production (thousand b/d) [A] 125 4%Bitumen production (thousand b/d) [A] 20 1%Gross developed and undeveloped acreage (thousand acres) 65,479 24%Proved oil and gas reserves excluding non-controlling interest (million boe) [B] 3,432 25%[A] Available for sale.[B] Includes proved reserves associated with future production that will be consumed in operations.
AMERICAS
HIGHLIGHTS§ Shell is adding to its established deep-water position with new fi elds in the Gulf
of Mexico and offshore South America. Onshore, Shell has built major acreage positions in liquids-rich shales and in tight gas, and is progressing its potential for an integrated gas value chain.§ Production in the Americas amounted to more than 700 thousand boe/d in 2012.§ After-tax earnings from oil and gas exploration and production operations of our
subsidiaries and equity-accounted investments in the region were $0.7 billion.§ We are participating in the development of six key projects in North and South
America: AOSP Debottlenecking; BC-10 Phase 2; Cardamom; Mars B, West Boreas & South Deimos; North American tight-gas projects; and North American liquids-rich shales projects.
NORTH AMERICA
CANADAWe hold more than 2,200 mineral leases in Canada, mainly in Alberta and British Columbia. We produce and market natural gas, natural gas liquids (NGLs), synthetic crude oil and bitumen. In addition, we hold signifi cant exploration acreage offshore. Bitumen is a very heavy crude oil produced through conventional methods as well as through enhanced oil-recovery methods. Synthetic crude oil is produced by mining bitumen-saturated sands, extracting the bitumen from the sands, and transporting it to a processing facility where hydrogen is added to produce a wide range of feedstocks for refi neries.
Gas and liquids-rich shale We hold rights to more than 10,000 square kilometres of conventional gas, tight gas and liquids-rich shale acreage. We own and operate four natural gas processing and sulphur-extraction plants in southern and south-central Alberta. During 2012, we continued to develop conventional gas, tight gas and liquids-rich shale fi elds in west-central Alberta and east-central British Columbia, through
drilling programmes and investment in infrastructure facilitating new production.
Synthetic crude oil We operate the Athabasca Oil Sands Project (AOSP) in north-east Alberta as part of a joint venture (Shell interest 60%). The AOSP’s bitumen production capacity is 255 thousand boe/d. The bitumen is transported by pipeline for processing at the Scotford Upgrader, which is operated by Shell and located in the Edmonton area, Alberta. The fi rst phase of the AOSP Debottlenecking project comes online in 2013, and is expected to add an additional 10 thousand boe/d at peak production. We also took the fi nal investment decision on the Quest Carbon Capture and Storage project (Shell interest 60%), which is expected to capture and permanently store more than 1 mtpa of CO2 from the Scotford Upgrader underground.
Shell also holds a number of other minable oil sands leases in the Athabasca region with expiry dates ranging from 2018 to 2025. By completing a certain minimum level of development prior to their expiry, leases may be extended.
Bitumen We produce and market bitumen in the Peace River area of Alberta, and have a steam-assisted gravity drainage project in operation near Cold Lake, Alberta. Additional heavy oil resources and advanced recovery technologies are under evaluation on approximately 1,200 square kilometres in the Grosmont oil sands area, also in northern Alberta.
OffshoreWe have a 31.3% interest in the Sable Offshore Energy project, a natural-gas complex offshore eastern Canada. We also have a 100% operating interest in frontier deep-water acreage offshore Nova Scotia, a 20% non-operating interest in an exploration asset off the east coast of Newfoundland, and a number of exploration licences in the Mackenzie Delta in the Northwest Territories.
UNITED STATES OF AMERICAWe produce oil and gas in the Gulf of Mexico, heavy oil in California and primarily tight gas and associated liquid hydrocarbons in Louisiana, Pennsylvania, Texas and Wyoming. The majority of our oil and gas production interests are acquired under leases granted by the owner of the minerals underlying the relevant acreage (including many leases for federal onshore and offshore tracts). Such leases usually run on an initial fi xed term that is automatically extended by the establishment of production for as long as production continues, subject to compliance with the terms of the lease (including, in the case of federal leases, extensive regulations imposed by federal law).
Gulf of Mexico The Gulf of Mexico is the major production area in the USA, accounting for almost 50% of Shell’s oil and gas production in the country. We have approximately 420 federal offshore leases in the Gulf of Mexico, about one-fi fth of which are producing. Our share of production in the Gulf of Mexico averaged almost 190 thousand boe/d in 2012. Key producing assets are Auger, Brutus, Enchilada, Mars, NaKika, Perdido, Ram-Powell and Ursa.
We continued to grow our presence in the Gulf of Mexico, with the addition of two drilling rigs to our contracted offshore fl eet in 2012. We also secured 24 blocks in the 2012 central lease sale for a sum of $400 million.
28 Shell Investors’ Handbook | reports.shell.comUpstream
103585_SHE_Investors Handbook_V98_Cleaned_JD.indd 28 08-05-13 14:52

Onshore We hold more than 15,000 square kilometres of tight-gas and liquids-rich shale acreage. This includes signifi cant holdings in the Marcellus shale, centred on Pennsylvania in northeastern USA, the Eagle Ford shale formation in south Texas, the Sand Wash and Niobrara Shale in north-west Colorado, as well as the Mississippi Lime formation in south-central Kansas. In 2012, we also acquired approximately 2,200 square kilometres of mineral rights, with an additional 300 square kilometres linked to contractual conditions, in the Delaware Permian Basin in west Texas.
California We hold a 51.8% interest in Aera Energy LLC (Aera), which holds assets in the San
Joaquin Valley and Los Angeles Basin areas of southern California. Aera operates more than 15,000 wells, producing about 130 thousand boe/d of heavy oil and gas.
Alaska We hold more than 410 federal leases for exploration in the Beaufort and Chukchi seas in Alaska. During the 2012 drilling season, we drilled two exploratory wells, one each in the Beaufort and Chukchi seas. These wells are known as top holes as they do not go deep enough to reach hydrocarbon reservoirs. After drilling they were safely capped in accordance with regulatory requirements.
REST OF NORTH AMERICAShell also has interests in Greenland and Mexico.
SOUTH AMERICA
BRAZILWe are the operator of several producing fi elds offshore Brazil. They include the Bijupirá and Salema fi elds (Shell interest 80%) and the BC-10 fi eld (Shell interest 50%). We also operate one offshore exploration block in the Santos basin, BMS-54 (Shell interest 80%).
We have interests in two offshore exploration blocks in the Espirito Santo basins, BMES-23 and BMES-27, with interests of 20% and 17.5% respectively. Shell also operates fi ve blocks in the São Francisco onshore basin area. In 2012, we divested our 40% interest in the offshore Block BS-4 in the Santos basin.
We also hold an 18% interest in Brazil Companhia de Gas de São Paulo (Comgás), a natural gas distribution company in the state of São Paulo.
FRENCH GUIANAWe are the operator of an exploration block in the 24,000 square kilometre deep-water Guyane Maritime Permit (Shell interest 45%).
REST OF SOUTH AMERICAShell also has interests in Argentina, Colombia, Guyana and Venezuela.
ßThe Athabasca Oil Sands Project in north-east Alberta, Canada, has a bitumen production capacity of 255 thousand boe/d.
29reports.shell.com | Shell Investors’ HandbookUpstream
103585_SHE_Investors Handbook_V98_Cleaned_JD.indd 29 08-05-13 14:52

DOWNSTREAMHIGHLIGHTS§ Inaugurated the expansion of our joint-venture refi nery in Port Arthur, Texas, more
than doubling crude oil distillation capacity there to 620 thousand b/d. It is fl exible, able to process many types of crude oil and vary the mix of fi nal products based on demand. § In Australia, the Clyde refi nery was converted to a terminal. § Optimised ethylene delivery in Supply and distribution, resulting in a 20% increase in
throughput capacity and improved operating fl exibility. § Continued to demonstrate innovation in fuels technology and superior customer
experience in Retail with the fi rst launch of Shell V-Power Nitro+, which is now available in six countries. In China we also had the fi rst launch of Shell V-Power in Tianjin province and signed an agreement with China Union Pay to enable faster and more convenient payment options.§ Making good progress with the Raízen biofuels joint venture in Brazil, which has a 35
thousand b/d ethanol production capacity. In its fi rst full year of operations, Raízen contributed more than 10% to our 2012 Oil products earnings.§ Bought the remaining shares in Gasnor, a Norwegian supplier of LNG for shipping
and trucking. It gives us a foothold in a growing market for cleaner-burning gas as a transport fuel.§ Entered into an agreement with joint venture partners to purchase assets at the
Coryton refi nery in Essex and worked with our partners to develop a state-of-the-art import and distribution terminal. This investment will support growth in our UK retail business, which acquired 253 retail sites in 2011.§ Agreed to acquire Neste Oil Corporation’s network of 105 retail sites in Poland.
These sites are unmanned and located in major cities throughout the country.§ Progressed the proposed world-scale petrochemicals project in Ras Laffan Industrial
City in Qatar by awarding, with venture partner Qatar Petroleum, the front-end engineering and design contract.§ Agreed with our partner SABIC to expand Sadaf, our long-standing Chemicals joint
venture in Saudi Arabia – including proposed construction of new derivative units.
103585_SHE_Investors Handbook_V98_Cleaned_JD.indd 30 08-05-13 14:52

0
2
4
6
8
20132012
$ billion
DOWNSTREAM ORGANIC CAPITAL INVESTMENT
BaseGrowth
KEY STATISTICS
2012 2011 2010 2009 2008Downstream CCS earnings ($ million)
Oil products 3,959 2,235 1,439 (58) 5,153Chemicals 1,391 2,054 1,511 316 156
Total Downstream earnings ($ million) [A] 5,350 4,289 2,950 258 5,309Total Downstream earnings excluding identifi ed items
($ million) 5,311 4,274 3,873 1,940 5,744Downstream cash fl ow from operations ($ million) [B] 8,028 8,746 8,138 5,839 1,750Oil products sales volumes (thousand b/d) 6,235 6,196 6,460 6,156 6,568Chemicals sales volumes (thousand tonnes) 18,669 18,831 20,653 18,311 20,327Refi nery processing intake (thousand b/d) 2,819 2,845 3,197 3,067 3,388Refi nery availability (%) 93 92 92 93 91Chemical plant availability (%) 91 89 94 92 94Downstream net capital investment ($ million) 4,275 4,342 2,358 6,232 3,104Downstream capital employed ($ million) 71,889 71,976 67,287 62,632 54,050Downstream employees (thousands) 48 51 59 62 64
[A] With effect from 2010, Downstream segment earnings are presented on a current cost of supplies (CCS) basis. Comparative information is consistently presented.
[B] Excludes working capital movements.
MANUFACTURINGWe have interests in more than 30 refi ning sites worldwide. Together they have the capacity to process approximately 3.4 million barrels of oil per day into a wide range of products including gasoline, diesel, heating oil, aviation fuel, marine fuel, lubricants, liquefi ed petroleum gas, sulphur and bitumen. About 40% of our refi ning capacity is in Europe and Africa, 35% in the Americas and 25% in Asia-Pacifi c.
We focus on effi ciency improvements at our refi neries and petrochemicals plants. These improvements have contributed to a reduction in greenhouse gas emissions. Achieving even greater effi ciency and operational reliability will help us improve profi tability. The average availability of our refi neries, a measure of their operational excellence, was 93% in 2012.
A key part of our strategy is to divest non-core assets while selectively investing in high-growth markets, especially in Asia. We have retained the larger and more integrated refi neries, and the current portfolio is positioned for optimisation across the entire value chain. Major asset sales have been completed, but we will continue to review the portfolio regularly and improve it further where necessary.
We aim to create a Downstream portfolio that is more focused on larger, integrated refi ning and petrochemical sites that are better able to respond to tighter fuel specifi cations and growth opportunities. The Port Arthur refi nery in Texas will have a
0
1
2
3
4
5
6
7
8
9
20122011201020092008
$ billion
DOWNSTREAM CCS EARNINGS [A]
Oil productsChemicals
0
1
2
3
4
5
2012200920062002
million b/d Shell share
REFINING CAPACITY
Europe and OtherAmericas
31reports.shell.com | Shell Investors’ HandbookDownstream
103585_SHE_Investors Handbook_V98_Cleaned_JD.indd 31 08-05-13 14:52
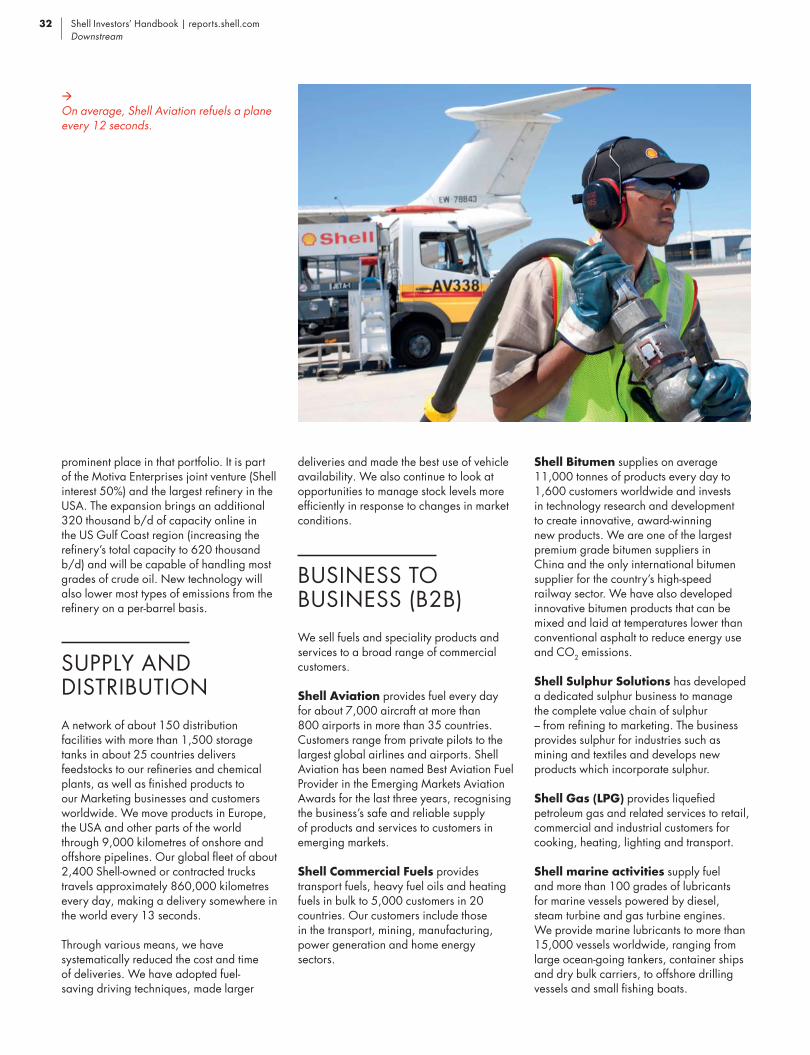
àOn average, Shell Aviation refuels a plane every 12 seconds.
deliveries and made the best use of vehicle availability. We also continue to look at opportunities to manage stock levels more effi ciently in response to changes in market conditions.
BUSINESS TO BUSINESS (B2B)We sell fuels and speciality products and services to a broad range of commercial customers.
Shell Aviation provides fuel every day for about 7,000 aircraft at more than 800 airports in more than 35 countries. Customers range from private pilots to the largest global airlines and airports. Shell Aviation has been named Best Aviation Fuel Provider in the Emerging Markets Aviation Awards for the last three years, recognising the business’s safe and reliable supply of products and services to customers in emerging markets.
Shell Commercial Fuels provides transport fuels, heavy fuel oils and heating fuels in bulk to 5,000 customers in 20 countries. Our customers include those in the transport, mining, manufacturing, power generation and home energy sectors.
prominent place in that portfolio. It is part of the Motiva Enterprises joint venture (Shell interest 50%) and the largest refi nery in the USA. The expansion brings an additional 320 thousand b/d of capacity online in the US Gulf Coast region (increasing the refi nery’s total capacity to 620 thousand b/d) and will be capable of handling most grades of crude oil. New technology will also lower most types of emissions from the refi nery on a per-barrel basis.
SUPPLY AND DISTRIBUTIONA network of about 150 distribution facilities with more than 1,500 storage tanks in about 25 countries delivers feedstocks to our refi neries and chemical plants, as well as fi nished products to our Marketing businesses and customers worldwide. We move products in Europe, the USA and other parts of the world through 9,000 kilometres of onshore and offshore pipelines. Our global fl eet of about 2,400 Shell-owned or contracted trucks travels approximately 860,000 kilometres every day, making a delivery somewhere in the world every 13 seconds.
Through various means, we have systematically reduced the cost and time of deliveries. We have adopted fuel-saving driving techniques, made larger
Shell Bitumen supplies on average 11,000 tonnes of products every day to 1,600 customers worldwide and invests in technology research and development to create innovative, award-winning new products. We are one of the largest premium grade bitumen suppliers in China and the only international bitumen supplier for the country’s high-speed railway sector. We have also developed innovative bitumen products that can be mixed and laid at temperatures lower than conventional asphalt to reduce energy use and CO2 emissions.
Shell Sulphur Solutions has developed a dedicated sulphur business to manage the complete value chain of sulphur – from refi ning to marketing. The business provides sulphur for industries such as mining and textiles and develops new products which incorporate sulphur.
Shell Gas (LPG) provides liquefi ed petroleum gas and related services to retail, commercial and industrial customers for cooking, heating, lighting and transport.
Shell marine activities supply fuel and more than 100 grades of lubricants for marine vessels powered by diesel, steam turbine and gas turbine engines. We provide marine lubricants to more than 15,000 vessels worldwide, ranging from large ocean-going tankers, container ships and dry bulk carriers, to offshore drilling vessels and small fi shing boats.
32 Shell Investors’ Handbook | reports.shell.comDownstream
103585_SHE_Investors Handbook_V98_Cleaned_JD.indd 32 08-05-13 14:53

RETAILOur branded fuel retail network is the world’s largest, with about 44,000 service stations in more than 70 countries. Our experience in fuel development, over more than 100 years, underpins our position today as a leading provider of innovative fuels. Differentiated fuels with unique formulations designed to improve performance are available in more than 60 countries under the Shell V-Power brand. In 2009, we launched Shell FuelSave fuels. These products are now available in 18 countries. Shell also sells Shell Fuel Economy, our formula for petrol and diesel in about 20 countries where Shell FuelSave has not yet been launched.
Shell has a close technical partnership with Scuderia Ferrari. Our fuel has helped the Ferrari motor racing team to achieve 10 Formula One World Constructors’ and 12 World Championship Drivers’ titles. This partnership enables our scientists and engineers to develop cutting-edge fuel technologies for the racetrack that can then be transferred to road fuels for the benefi t of our customers.
We continued to invest in selected retail markets. In 2012, we agreed to acquire Neste Oil Corporation’s network of 105 unmanned retail sites in Poland. In 2011, we acquired 253 retail sites in the UK, primarily in central and south-east England.
LUBRICANTSThe 10th annual Kline & Company report on the global lubricants sector confi rmed that Shell maintained its volume and branded leadership position, with a 13% market share (source: Kline & Company, 2012). In 2012, Shell Lubricants received the inaugural European Customer Value Enhancement Award for automotive lubricants from market analysts Frost & Sullivan.
We make and sell a wide variety of lubricants to meet customer needs across a range of applications. These include consumer motoring, heavy-duty transport, mining, power generation and general engineering. Shell also owns Jiffy Lube® franchised service centres in North America.
Our lubricants are marketed in approximately 100 countries. We have leading positions in both mature and emerging markets. We are investing in our supply chain, especially in emerging markets. We plan to build new blending plants in Indonesia and Northern China, recently opened our 18th and largest grease plant in Southern China, and started construction of a new base oil manufacturing plant in South Korea this year. We also recently had the commercial start-up of a blending plant in Russia.
We have leading lubricants research centres in Germany, Japan (through a joint venture with Showa Shell), the UK and the USA.
LNG FOR TRANSPORTAs a transport fuel, LNG has the potential to provide economic and environmental benefi ts to operators of large trucks, ships and trains. Ocean-going LNG carrier ships have been using it as a fuel for more than 45 years, and we are now bringing its benefi ts to other types of transport. When used as a fuel, LNG can lower emissions of sulphur, particulates and nitrogen oxides. Its energy density gives distance ranges that transport operators need, and it could help reduce fuel bills.
In March 2013, we announced a series of developments. Our fi rst LNG refuelling station for trucks in Canada opened in Calgary, Alberta. It is supplied with LNG by a third party, but we will provide our own LNG once a liquefaction plant is operational at our Jumping Pound natural gas facility, 30 kilometres west of Calgary. In the same month, we also announced the fi nal investment decision for two other small-scale gas liquefaction units (0.25 mtpa) in North America that will supply LNG to fuel ships, trucks and industrial customers. One plant will be at our chemical facility in Geismar, Lousiana, supplying the Gulf Coast region, with the other at our manufacturing centre in Sarnia, Ontario, Canada, supplying the Great Lakes region.
In the same month Shell launched a tank barge in the Netherlands powered entirely by LNG, the fi rst of two it has chartered. They will be part of the development of a new European LNG marine fuel industry with the potential to power inland barges, ferries, tugs and cruise ships.
Shell’s acquisition in 2012 of Gasnor, a Norwegian LNG fuel company that supplies marine and industrial customers, is another example of Shell’s investment in this growth area.
0
10
20
30
40
50
20122011201020092008
thousand, per year-end
BRANDED RETAIL SITES
Americas
EuropeOther
33reports.shell.com | Shell Investors’ HandbookDownstream
103585_SHE_Investors Handbook_V98_Cleaned_JD.indd 33 08-05-13 14:53

In Qatar, Shell and Qatar Petroleum have awarded the front-end engineering and design contract for a proposed world-scale petrochemicals project (Shell interest 20%) in Ras Laffan Industrial City. The scope includes a capacity of 1.5 mtpa of mono-ethylene glycol and 0.3 mtpa of linear alpha olefi ns. We are also developing plans to build a potential world-scale ethylene cracker with integrated polyethylene derivative units in the Appalachian region in the north-east of the USA. In 2012, we agreed with our partner SABIC to expand Sadaf, our long-standing joint venture in Saudi Arabia, including the proposed construction of new derivative units.
TRADINGShell Trading is a global organisation comprising a network of separate entities that sell crude oil to a wide range of customers within and outside Shell. The entities also trade natural gas, LNG and power around the world. Their supply portfolio includes the largest equity share of LNG of any international oil company. These entities share knowledge and best practice, use common systems and controls, and manage the risks associated with international trading in a competitive environment. Shell Trading supports Shell’s Upstream and Downstream businesses by trading natural gas, LNG, electrical power, crude oil, refi ned products, chemical feedstocks and environmental products. It also manages a shipping fl eet of more than 50 ocean-going vessels.
Shell Trading companies operate out of a variety of locations, including Dubai, Houston, London, Rotterdam and Singapore. Two major Shell Trading business units concentrate their operations in Europe and North America. Shell Energy Europe markets and trades gas, power and CO2 emissions allowances throughout Europe, serving about 7,000 customers. Together with its subsidiaries, Shell Energy North America trades and markets Shell’s North American natural gas production, benefi tting from access to power generation and gas storage assets.
BIOFUELSThe international market for biofuels is growing, driven largely by the introduction of new energy policies in Europe and the USA that call for more renewable, lower-carbon fuels for transport. Sustainable biofuels are expected to play an increasingly important role in helping to meet customers’ fuel needs and reduce CO2 emissions.
Shell has a 30-year history of biofuel development and investment. The production, purchase, trading, storage, blending and distribution of biofuels are part of our everyday business. We are one of the world’s largest distributors of biofuels, and we continue to build capacity in conventional biofuels that meet our corporate and social responsibility criteria.
In 2011, Shell and Cosan launched the Raízen biofuels joint venture (Shell interest 50%) in Brazil for the production of ethanol, sugar and power, as well as the supply, distribution and retailing of transport fuels. With an annual production capacity of more than 2 billion litres per year (35 thousand barrels per day) of ethanol from sugar cane, Raízen is one of the world’s largest ethanol producers. The deal marked Shell’s fi rst move into the mass production of biofuels and its fi rst full year of operations. In 2012, Raízen contributed over 10% to our 2012 oil products earnings.
Ethanol produced from sugar cane in Brazil is the most sustainable and cost-competitive of today’s biofuels. It can reduce net CO2 emissions by up to 70% compared with gasoline. We recognise the sustainability challenges associated with some biofuels and are working to ensure that the feedstocks and conversion processes for the biofuels we purchase today are as sustainable as possible. In 2007, we introduced environmental and social clauses into the contracts for the bio-components that we purchase for blending. And we monitor how well our suppliers adhere to those clauses. We are also working with non-governmental organisations, policymakers and industry coalitions to develop and promote robust global standards for ensuring the sustainability of biofuels production.
Advanced biofuels, which are based on new conversion processes for feedstock
CHEMICALSWe have more than 80 years of experience in the chemicals industry, and produce and sell petrochemicals to more than 1,000 industrial customers worldwide. Our range of petrochemicals includes base chemicals, such as ethylene, propylene and aromatics; and fi rst-line derivatives, such as styrene monomer, propylene oxide, solvents, detergent alcohols, and ethylene oxide. Our customers, many of them leading companies in their own fi elds, use these products to make everyday items, such as plastics, detergents, textiles, medical equipment and computers. In total, we sold more than 18 million tonnes of bulk petrochemicals in 2012.
Over many decades we have developed the proprietary technologies, processes and catalysts that enable Shell to compete strongly in our core petrochemical markets. For example, our OMEGA technology converts ethylene to ethylene oxide, which is used to make a wide range of industrial and consumer products, including polyester fi lms and fi bres, engine coolants and antifreeze. It is considered the most effi cient technology of its kind, using about 20% less steam and producing about 30% less waste water than traditional thermal conversion mono-ethylene glycol (MEG) technology with the same capacity. The technology also produces signifi cantly less carbon dioxide per tonne of MEG than conventional processes.
In Singapore, we are building a demonstration unit to manufacture the chemical ingredient diphenyl carbonate, a versatile engineering plastic used in a wide and growing variety of applications, from optical media equipment, household items and automotive components, to electronics, sheeting and fi lms.
We will continue to focus on the synergies among our petrochemical plants, refi neries and Upstream business to increase the supply of the best available feedstock for our crackers.
Our Chemicals strategy is based on selective growth at existing sites through increases in capacity, improvements in effi ciency and integration, and strengthening of our feedstock sources. It is also based on securing integrated growth projects with partners and developing technologies to convert gas to chemicals.
34 Shell Investors’ Handbook | reports.shell.comDownstream
103585_SHE_Investors Handbook_V98_Cleaned_JD.indd 34 08-05-13 14:53

ßThe Raízen joint venture in Brazil produces approximately 2 billion litres annually of ethanol from sugar cane – the most sustainable and cost-competitive of today’s biofuels.
such as crop waste or inedible plants, offer the potential for improved CO2 reductions and improved fuel characteristics. Shell was one of the fi rst energy companies to invest in advanced biofuels and we continue to invest in them. They will take time to reach commercial scale and government support will be required to accelerate their speed of development.
We have dedicated biofuels research teams and research agreements with experts in leading academic institutions across the world. We also have technical partnerships with leading companies exploring new technology platforms for the production of advanced biofuels.
PORTFOLIO ACTIONSShell acquired the remaining outstanding shares in Gasnor AS, a market leader in Norway that supplies LNG as a transport fuel to industrial and marine customers. In Australia, refi ning operations at the 79 thousand b/d Clyde refi nery ceased. The Clyde refi nery and the Gore Bay terminal are in the process of being converted into a fuel import facility.
Shell announced its intention to sell the 118,000 barrel-per-day Geelong Refi nery in south-east Australia, as Downstream continues to focus investment on large-scale sites.
In Marketing, Shell agreed to acquire Neste Oil Corporation’s network of 105 retail sites in Poland.
Shell completed the sale of the majority of its shareholding in downstream activities in Botswana, Burkina Faso, Côte d’Ivoire, Guinea, Kenya and Namibia, whilst the downstream activities in Tanzania were discontinued. The agreements form part of the divestment of Shell’s shareholding in most of its downstream activities in Africa as announced in 2011.
Shell continues to divest non-strategic Downstream positions. Divestments included retail stations in North America and most of our LPG activities in Asia-Pacifi c.
35reports.shell.com | Shell Investors’ HandbookDownstream
103585_SHE_Investors Handbook_V98_Cleaned_JD.indd 35 08-05-13 14:53

PROJECTS & TECHNOLOGYThe delivery of Shell’s business strategy depends on its capability to fi nd oil and gas resources, to develop them into productive assets and to convert the oil and gas into marketable products. The Projects & Technology (P&T) organisation is the locus of these capabilities within Shell. It drives the research and development (R&D) underlying the inventions and know-how that Shell geoscientists and engineers need – not only today but also tomorrow. P&T executes all major projects in both Upstream and Downstream, and provides a range of technical services that help maintain operational excellence. Furthermore, it provides functional leadership in contracting and procurement as well as in safety. In total, more than 10,000 people work in P&T. We have offi ces across the globe, but our main technology hubs and technical centres are located in Europe, Asia and North America.
103585_SHE_Investors Handbook_V98_Cleaned_JD.indd 36 08-05-13 14:53

INNOVATIVE TECHNOLOGYIn a fast-changing and highly competitive world, technological innovation is a key differentiator for Shell. So we have linked technology development to our strategic objectives and the needs of our customers and partners. And a single, integrated R&D organisation drives it forward, bringing together in-house developments with external scientifi c, engineering and commercial partnerships. This partnering, which sometimes involves openly sharing results, helps to ensure a healthy infl ux of new ideas and to speed up the deployment of technology.
We continue to invest in technology for our Downstream business across the range of its activities – from the refi ning of oil products to the manufacture of bulk chemicals. For example, our technology leadership in lubricants – as a portfolio of more than 150 patent series attests – provides a key competitive advantage to help create some of the most advanced oils and greases. Our catalysts lie at the heart of some of the most effi cient manufacturing units for ethylene oxide and mono-ethylene glycol. And a new process chemistry we are developing has the potential to create a more sustainable route to diphenyl carbonate: a key raw material for polycarbonates, which is used instead of glass in many products.
As Shell seeks to grow its production on the basis of deep-water fi elds and tight/shale formations onshore, drilling safely and effi ciently is becoming even more important for Shell. We are therefore commissioning state-of-the-art rigs and well technologies that comply with the highest industry standards for safety and the environment. We also took the front-runner position in implementing “underbalanced” drilling techniques. Such drilling results in higher infl ow rates after the well is completed. That extra fl ow is particularly important in tight/shale gas reservoirs, where – even under the best of circumstances – the gas moves through the rock a thousand times slower than it would through conventional reservoirs. The successful development of tight/shale resources also depends critically on drilling costs. Here too we have developed ways to save money without compromising safety or putting the environment at undue risk. Our soft-torque rotary drilling system, for instance,
dampens the uncontrolled twisting of drill pipe, making it possible to fi nish wells quicker and with fewer drill-bit changes.
We also work on technologies to reduce the environmental footprint of our operations and products. These are applied, for example, in carbon capture and storage schemes to reduce CO2, or in energy-effi ciency programmes for our refi neries or for our customers.
DELIVERING PROJECTSP&T teams manage complex projects from design to commissioning, often in challenging environments. The Mars B fi eld development, for example, is the fi rst major deep-water brownfi eld project in the Gulf of Mexico. It will use some of the largest equipment and most advanced operational systems on a tension-leg platform designed to operate for 50 years. Constructed at fi ve major locations across the globe, the platform is coming together now in Texas.
Or take our massive Prelude fl oating facility offshore Australia, which has 3.6 mtpa LNG production capacity. Its construction also requires the coordination of engineering teams at multiple locations throughout the world.
Shell projects can be huge enterprises. They involve several years of design and engineering effort, thousands of construction workers, and billions of dollars’ worth of materials and equipment.
In spite of such complexity, we are constantly looking for opportunities to simplify and standardise project execution, with the aim of improving effi ciency and reducing costs. We have also created a global community of project managers to facilitate resourcing and to build up expertise through the sharing of best practices. The Shell Project Academy invigorates this global community. It provides an accredited competence development programme that makes our project staff capable of delivering sustained top-quartile performance.
WELL MANUFACTURING SYSTEMShell and China National Petroleum Corporation formed the Sirius Well Manufacturing Services venture to develop a highly automated well manufacturing system aimed at reducing drilling’s environmental footprint and making its logistics more manageable. The system is based on specialisation, automation and an assembly-line approach. Mobile or transportable rigs carry out certain tasks, such as initiating the hole or fi nishing a well. Each rig is designed to do its job as quickly, effi ciently and safely as possible, with the smallest possible footprint. Once a rig has fi nished its specifi c task, it moves on to the next well, allowing another kind of rig to move into place to take the next step. At any given time, multiple wells may therefore be in various stages of drilling and completion throughout a fi eld. The rigs will be deployable to fi elds around the world.
This kind of well manufacturing requires standardised designs and repeatable procedures. It also relies on a computerised system that autonomously and continuously evaluates and controls the drilling process. Such automation not only lowers the cost of drilling but also improves safety, as it keeps people away from hazardous areas. It furthermore provides a way to cope with the severe shortage of trained rig crews that has been an obstacle to the large-scale development of tight gas and coalbed methane resources.
The venture is making good progress; its fi rst contract was signed with Australia-based Arrow Energy in 2012. By the end of 2013, fi ve fi t-for-purpose drilling rigs and one fracturing unit are expected to be deployed, and the fl eet is expected to grow to about 35 rigs and fracturing units by 2015. The venture had about 100 employees in 2012.
37reports.shell.com | Shell Investors’ HandbookProjects & Technology
103585_SHE_Investors Handbook_V98_Cleaned_JD.indd 37 08-05-13 14:53

CONTRACTING AND PROCUREMENTTo gain a competitive advantage within the oil and gas industry, Shell must leverage its overall buying power. P&T is accountable for deriving value from Shell’s annual third-party spend of about $65 billion. So P&T helps Shell subsidiaries focus on what and how much should be bought, and at what price. The priority is on getting the most value out of purchases, not just the lowest cost. By putting its global internal demand for certain categories of goods and services into a small number of contractual packages in the marketplace, Shell can gain in terms of safety, quality of goods and services, costs and technical innovation. The selection of preferred suppliers enables a far closer oversight of delivery and performance, better mechanisms for quality control and signifi cantly lower prices. Such contract-management improvements, coupled with increasingly effi cient operations and collaborative relationships with suppliers, saved about $5 billion between 2010 and 2012.
The Contracting and Procurement unit within P&T analyses the market, enabling it to be forward-looking in its sourcing strategies. In addition, the unit has a key role in helping Shell subsidiaries to work with contractors and suppliers who are economically, environmentally and socially responsible.
SAFETYP&T is directly responsible for project construction, where workers face many serious safety hazards. Our responsibility for safety is not limited just to construction sites, though. We are also well-positioned to help minimise the risks of process-safety incidents that result in leaks after a well or project is brought into operation. After all, P&T is responsible for the design of wells and projects, and for setting standards that are applicable across Shell. Our global standards and operating procedures defi ne the controls and physical barriers we require to prevent incidents. For example, our offshore wells are designed with at least two independent barriers to help mitigate the risk of an uncontrolled release of hydrocarbons. We regularly inspect, test and maintain these barriers to ensure they meet our standards. We help ensure that better technology also means safer technology.
We continue to strengthen the safety culture among our employees and contractors. We expect everyone working for us to intervene and stop work that may appear to be unsafe. In addition to our ongoing safety awareness programmes, we hold an annual global safety day to give workers time to refl ect on how to prevent accidents. We expect everyone working for us to comply with our 12 mandatory Life-Saving Rules. If employees break these rules, they will face disciplinary action up to and including termination of employment. If contractors break the Life-Saving Rules, they can be removed from the worksite.
400
500
600
700
800
900
0
1
2
3
4
5
total recordable cases million working hours
TOTAL RECORDABLE CASE FREQUENCY [A]
Total recordable cases per million working hours
[A] Employees and contractors per million working hours; Shell-operated facilities.
11 121009080706050403
Estimated working hours in millions
R&D EXPENDITURETechnology and innovation provide ways for Shell to stand apart from its competitors. They help our current businesses perform, and they make our future businesses possible. Over the last fi ve years our spend on R&D averaged more than $1 billion annually – more than any other international energy company. In 2012, R&D expenditures were $1.3 billion, compared with $1.1 billion in 2011 and $1.0 billion in 2010.
Sustained investment in our key business technologies pays off. The Pearl GTL plant in Qatar, for example, is the culmination of almost 40 years of dedicated investment in gas-to-liquids (GTL) R&D. As a result, we hold some 3,500 patents related to all stages of the GTL process. And there is more innovation to come, with a view to increasing the capacity of existing GTL plants, reducing the cost of the catalysts and reducing the CO2 emissions.
38 Shell Investors’ Handbook | reports.shell.comProjects & Technology
0
2
4
6
ChevronBPTotalExxonMobilShell
$ billion
RESEARCH AND DEVELOPMENT EXPENDITURE
Cumulative 2008–2012
103585_SHE_Investors Handbook_V98_Cleaned_JD.indd 38 08-05-13 14:53

CORPORATE SEGMENTThe Corporate segment covers the non-operating activities supporting Shell. It includes Shell’s treasury organisation, its headquarters and central functions as well as its risk-management and self-insurance activities. All fi nance income and expense, as well as related taxes and exchange-rate effects, are included in the Corporate segment earnings rather than in the earnings of the business segments. The Corporate segment earnings also include functional costs that have not been allocated to the other segments.
TREASURY The holdings and treasury organisation manages many of the Corporate entities and is the point of contact between Shell and the external capital markets. It is centralised in London and supported by regional centres in Singapore and Rio de Janeiro. Its daily operations include liquidity management, advising and fi nancing subsidiaries and joint ventures, arranging the effi cient investment of any surplus funds, transacting foreign exchange and managing Shell’s bank account infrastructure. The treasury organisation maintains Shell’s credit ratings and debt platforms, issues short- and long-term capital-market instruments and executes the Royal Dutch Shell dividend, scrip and share buyback programmes.
HEADQUARTERS AND CENTRAL FUNCTIONS Headquarters and central functions provide services to the Businesses (Upstream Americas, Upstream International, Downstream) as well as other functions. They also provide support for Shell’s shareholder-related activities. The services they provide cover the areas of fi nance, human resources, legal advice, information technology, real estate, communications, health, security and government relations. They also assist the Chief Executive Offi cer and the Executive Committee. The central functions have been increasingly supported by business service centres located around the world. These centres process transactions, manage data and produce statutory reports, among other services. The majority of the headquarters and central-function costs are recovered from the Business segments. Those costs that are not recovered are retained in Corporate.
RISK AND INSURANCE At Shell, we aim to drive down the total cost of risk by using robust methodologies and processes to assess, mitigate and manage it. They include the valuation of risks so that this can be properly taken into account in decision making. It also requires the causes of losses to be analysed and understood so that they can be reduced in the future. To support this, Shell’s insurable risks are mainly aggregated and retained within insurance subsidiaries, which means that Shell self-insures most of its risk exposures. The insurance subsidiaries form a key part of the Shell’s approach to risk management. They provide insurance coverage to Shell entities, generally up to $1.15 billion per event and usually limited to Shell’s percentage interest in the relevant entity. The type and extent of the coverage is equal to that which is otherwise commercially available in the third-party insurance market.
103585_SHE_Investors Handbook_V98_Cleaned_JD.indd 39 08-05-13 14:53

""
"""""
"
"
Tempa RossaVal d'Agri
ITALY
CROATIASLOVENIA
BOSNIA AND HERZEGOVINA
MONTENEGRO
SAN MARINO
TYRRHENIAN SEA
ADRIATIC SEA
IONIAN SEA
ROME
NAPLES
PALERMO
0 100 200 300 400 km
UKRAINE
SEA OF AZOV
RUSSIA
BLACK SEA
Dnieper-Donetsk
KIEV
KHARKIV
0 50 100 150 200 km
"
GREECE
ALBANIA MACEDONIA
ITALY
ADRIATIC SEA
IONIAN SEA
Shpiragu 1
TIRANA
0 25 50 75 100 km
{ Gas project
{ Oil or mixed oil and gas project Shell oil pipeline
Shell gas pipeline2012 discovery or appraisal success
{ Downstream facility{ Upstream facility
Integrated gas facility
Concession licences
EUROPEITALY UKRAINE
ALBANIA
40 Shell Investors’ Handbook | reports.shell.comMaps
MAPS
103585_SHE_Investors Handbook_V98_Cleaned_JD.indd 40 08-05-13 14:53

"
"
"
"
""""
"
"
"
"
"
"
"
""
"
"""
"
"
""
"
"
"
"
"
"
"
""
"
"""
"
"
"
"
"
" """
"
"
"
"
"
"""
"
"
"
"
"
"
"
" ""
"
"
""""
"
"
"
"
"
"
"
"
"
""
"
"
"
"
"""
"
""
"
"
"
"
"
"
"
"
"" "
""
"
"
"
"
""
"
"
"
""
"
"
"
"""
"
"
"
"
"
"
""
"
"
"
"
"
"
"
"
"
"
"
""""
"
"
"
"
"
""
"
"
"
""
"
"
"
""""""""
"
"
"
"
"
"
""
"
"
"
""
""""
""
"""
"
"
"""
"
""
"
"
"""
"
""
"
"
"
"
"
""
"
" "
"
"
""
"
"
""
"
"""
""" "
""
"
"
"
"
"
"
""
"
"
"
""
"
"
"
"
"
"
"
"
"
"
"
"
"
""
"
"
"
""
"
"
"
"
"
"
"
"
"
""
"
"
""
"
""
"
"
"
"
"
"
""
"
""
"
"
"""
"
"
"""
""
"
"
"
""
""
"
"" "
"
"
"
"
"
"
"
"""
"
"
"""
""
"
"
"
"
""
"
"
"
""
"""
"
"
"
"
""
"
"
"
"
"
"
" ""
"
"
"
"
"
"
""
"
"""
""
"
""
"
"
"
"
"
"""
"
"
"
"""
"
"
""
"
"
"
"
""
"
"
"
""
"
"
"
"""
"
"
"
"
"
"
"
"
"
"
"
"
"
"
"
"
"
"
"
"
"
"
"
"
"
"
"
"
"
"
"
"
"
"
"
"
"
"
""
"
"
"
"
"
"
"
"
""
""
""
""
NORWAY
GERMANY
FRANCE
SWEDEN
UNITED KINGDOM
IRELAND
ICELAND
BELGIUM
DENMARK
NETHERLANDS
LUXEMBOURG
NORTH SEA
CELTIC SEA
NORTHATLANTIC OCEAN
CZECH REPUBLIC
Miro
LitvinovKralupy
Schwedt
Fredericia
Harburg
Rheinland
Stanlow
Mossmorran
Moerdijk
Karlsruhe
Mongstad
St. Fergus
Bacton
Bellanaboy Bridge
Pernis
WieringaK08-FA
Bligh
Christian
Asterix
Hasselmus
Schiehallion
Loyal
Brent South
Groningen
Schoonebeek
Corrib
Halfdan
Ormen Lange
Draugen
Troll
Gjøa
Kingfisher
Goldeneye
Kvitebjorn
Beryl
Linnorm
Clair
OSLO
LONDON
DUBLIN
BERLIN
BRUSSELS
AMSTERDAM
EASINGTON
COPENHAGEN
0 100 200 300 400 km
NORTH- WEST EUROPE
41reports.shell.com | Shell Investors’ HandbookMaps
103585_SHE_Investors Handbook_V98_Cleaned_JD.indd 41 08-05-13 14:53

"
"
"
"
"
"
"
"
"
"
"
"
"
"
"
"
""
"
"
"
"
"
"
"
"
"
"
"
"
"
"
""
"
"
""
"" "
"
"" "
"
"
"
"
"
"
"
"
"
"
"
"
"
"
"
"
"
"
"
"
" "
"
"
"
"
""
"
"
"
"
"
""
"
"
"
"
"
"
""
"
"
"
"
"
"
"
"
"
"
"
"
"
"
"
"
""
"
"
""
"
"
"
"
"
""
"
"
"
"
""
"
"
"
"
"
"
"
"
"
"
"
"
"
"
"
""
"
"
"
"
"
""
"
"
"
"
"
"
"
"
"
"
"
#
""
NIGERIA
EQUATORIAL GUINEA
BIGHT OF BENIN
GULF OF GUINEA
BENIN
OML11
OML13
OPL322 OML118
OML74
OML72
OML79
OML77
OML135
OML71
Block 04
OPL245
OML133
CALABAR
WARRI
Nigeria LNG
PORTO NOVO
Forcados
LAGOS
PORT HARCOURT
Zabazaba-3
0 50 100 150 200 km
"
""
""
"
"
"""
"
"
" ""
"
"
" "
"""
"
"
"
" """
"
""
"""
"
"
"
" ""
"
"
"
"
"
""
""
""
""""
""
""
N. Tineh OffshoreN. Damietta Offshore
CAIRO
MATRUHPORT SAIDALEXANDRIA
EGYPTLIBYA
MEDITERRANEAN SEA
WS C86
Obaiyed J5
BAHGA C98
BED3 C4W-1BED3 C4W-2
Al Magd C86
SITRA C4 East
0 50 100 150 200 km
{ Gas project
{ Oil or mixed oil and gas project Shell oil pipeline
Shell gas pipeline2012 discovery or appraisal success
{ Downstream facility{ Upstream facility
Integrated gas facility
Concession licences
AFRI CA
42 Shell Investors’ Handbook | reports.shell.comMaps
NIGERIA AND BENIN
EGYPT
103585_SHE_Investors Handbook_V98_Cleaned_JD.indd 42 08-05-13 14:53

"
"
"
"
""
"
"
"
"
"
"
BCD 10
BC 9
Igoumou Marin
Awoun
Ozigo
GABON
CONGO
EQUATORIALGUINEASAO TOME
ANDPRINCIPE
ATLANTIC OCEAN
SÃO TOMÉAND PRÍNCIPE
Rabi
Koula
Totou
Atora
Damier
CoucalToucan
Gamba-Ivinga
M'BoukouAvocette
Bende-M'Bassou
MAYUMBA
LAMBARENE
LIBREVILLE
PORT GENTIL
0 50 100 150 200 km
Block 5
Block 8
Block 6
KENYA
TANZANIA
MOZAMBIQUE
INDIAN OCEAN
DODOMA
DAR ES SALAAM
0 100 200 300 400 km
"
SOUTH AFRICA
NAMIBIA
BOTSWANA
LESOTHO
INDIAN OCEAN
Orange Basin
CAPE TOWN
JOHANNESBURG
DURBANDurban Refinery
0 100 200 300 400 km
" "
"
"
LIBYA
MEDITERRANEANSEA
TUNISIA
ITALY
ALGERIA
GREECE
MALTA
ALBANIA
MACEDONIA
NC211-NC215NC212
Area 89
NC211C
Raf RafAzmour
BENGHAZI
TRIPOLI
TUNIS
Ras Lanuf
0 100 200 300 400 km
43reports.shell.com | Shell Investors’ HandbookMaps
LIBYA AND TUNISIAGABON
TANZANIA SOUTH AFRICA
103585_SHE_Investors Handbook_V98_Cleaned_JD.indd 43 08-05-13 14:53

"
"
"
"
"
"
"
""
""
"
""
"
"
"
"
"
"
"
"
"
"
"
"
"
"
"
"
"
"
"
"
"
"
"
"
"
"
"
"
"
"
"
"
"
"
"
"
"
"
"
"
"
"
"
"
"
"
"
"
""
"
"
"
"
"
"
"
"
"
"
""
"
"
"
"
""
"
"
"
"
"
"
"
"
"
"
"
"
"
"
"
"
"
"
"
"
"
"""
"
"
"
"
" "
"
"
"
"
""
"
"
"
"
"
"
"
"
"
"
"
"
"
"
"
"
"
"
"
"
"
"
"
"
"
""
"
"
"
"
"
"
"
"
"
"
"
"
"
"
"
"
"
"
""
""
"
"
"
"
"
""
""
"
"
"
"
""
"
"
"
"
"
"
"
"
"
"
"
"
"
"
"
"
"
"
"
" "
"
"
"
"
""
"
"
"
"
"
"
"
"
"
"
"
"
""
""
"
"
"
"
"
"
"
""
""
"
"
"
""
"
"
"
"
"
"
"
"
"
"
"
"
"
"
"
"
""
"
"
"
"
"
"
"
"
"
"
"
"
"
#
#
"
"
"
"
"
#
"
"
"
"
#
"
"
"
"
"
"
"
"
"
#
"
"
"
""
""
""""
IRAN
SAUDI ARABIA
OMAN
YEMEN
UNITED ARABEMIRATES
QATAR
BAHRAIN
GULF OF OMAN
ARABIAN SEA
THE GULF
Bab
Asab
SahilRuwais
Huwaila
Bu Hasa
Rumaitha
Pearl
Al Dabb'iyaBida Al Qemzan
Qatargas 4
Qatargas 3/4
Amal
Block D
Kidan
Marmul-GNR
Hanya-2H1
Mazkhour-D 5 (2011)Lekhwair-NW-B-hor
ABU DHABISUHAR
MUSCAT
Qalhat LNG
Ras Laffan
DOHA
SUR
RAYSUT
Al Jubail
QatargasPearl GTL Plant
Oman LNG
Qarn Alam Production Station
Harweel 'A' Gath. Stn.
0 50 100 150 200 km
{ Gas project
{ Oil or mixed oil and gas project Shell oil pipeline
Shell gas pipeline2012 discovery or appraisal success
{ Downstream facility{ Upstream facility
Integrated gas facility
Concession licences
ASIA
44 Shell Investors’ Handbook | reports.shell.comMaps
OMAN, QATAR, SAUDI ARABIA AND UNITED ARAB EMIRATES
103585_SHE_Investors Handbook_V98_Cleaned_JD.indd 44 08-05-13 14:53

"
"
SYRIA
TURKEY
BLACK SEA
Dadas
MEDITERRANEAN SEABati Toros
ANTALYA
Batman
Kirikale
ANKARA
0 50 100 150 200 km
Central Oil Shale
South Oil Shale
North WestOil Shale
JORDAN SAUDI ARABIA
SYRIA
EGYPT
IRAQ
ISRAEL
MEDITERRANEANSEA
AMMAN
MA'AN
0 25 50 75 100 km
45reports.shell.com | Shell Investors’ HandbookMaps
JORDAN
TURKEY
103585_SHE_Investors Handbook_V98_Cleaned_JD.indd 45 08-05-13 14:53

"
"
""
""
""
"
"
"
"
"
"
"
"
"
RUSSIA
KAZAKHSTAN
GEORGIA
AZERBAIJANARMENIA
CASPIAN SEA
TURKMENISTAN
Khazar
AktoteKairan
Auezov
Kashagan SWKalamkas More
Kashagan
Naryn
Tulpar
Barun-Yustinskiy
AKTAU
ATYRAU
ASTRAKHAN
0 100 200 300 400 km
" ""
"
RUSSIA
KARA SEA
VadelypUpper Salym
West SalymZhuravl
VORKUTA
SURGUT
Talotinsky East
Arkatoisky
Vorkutinskiy Sev.-01
0 100 200 300 400 km
A
Sakhalin
LNG PlantOil Export Terminal
Onshore ProcessingFacility (OPF)
OKHA
YUZHNO-SAKHALINSKKHOLMSK
PA-B
Lunskoye
Piltun-Astokhskoye
"#
"
"
"
"
RUSSIA SakhalinSEA OF
OKHOTSK
Lunskoye
Piltun-AstokhskoyePA-B
NOGLIKI
KHOLMSK
Sakhalin LNG
YUZHNO-SAKHALINSK
OKHA
Oil Export Terminal
Onshore Processing Facility
0 50 100 150 200 km
"
"
"
"
IRAQ
KUWAIT
IRAN
THE GULF
Majnoon
West Qurna
BASRA
0 25 50 75 100 km
{ Gas project
{ Oil or mixed oil and gas project Shell oil pipeline
Shell gas pipeline2012 discovery or appraisal success
{ Downstream facility{ Upstream facility
Integrated gas facility
Concession licences
KAZAKHSTAN AND RUSSIA
RUSSIA – SALYM RUSSIA – SAKHALIN
46 Shell Investors’ Handbook | reports.shell.comMaps
IRAQ
103585_SHE_Investors Handbook_V98_Cleaned_JD.indd 46 08-05-13 14:53

"
"
"
"
"BATANGAS
SAN JOSE DE BUENAVISTA
Tabangao
DestecadoMalampaya
San Martin
SC 38A
SC 38B
PHILIPPINES
SULU SEA
SOUTH CHINA SEA
0 50 100 150 200 km
"
"
"
"
"
""
"
"
"
"
"
""
"
"
"
"
"
"
"
"
"
"
"
"
"
""
"
"
"
"
"
" "
"
"
"
"
"
"
"
"
"
"
""
"
"
"
"
"
"
"
"
"
"
"
"
"
"
"
"
"
"
"
"
"
""
"
"
"
"
"
"
"
"
##
#"
"
"
"
""
""
""
""
""""
E6E8
F6
M3
M1
B12
G7
D12
F28
B11F23
Ubah
F13
BijanSerai
Barton
GumusutPisagan
Malikai
Saint JosephSouth Furious
F14
Jintan
Selasih
Kebabangan
Shallow Clastic
Cili Padi
E11
Petai
M4
M3S
Saderi
F29
F05E F13W
Kakap
SW AmpaFairley-Baram
Fairley
E19NE
Bugan
Champion
Geronggong
Maharaja Lela
LailaBeryl
BRUNEI
PHILIPPINES
SOUTH CHINA SEA SULU SEA
CELEBES SEAINDONESIA
MALAYSIA
BLNG
MIRI
KOTA KINABALU
BANDAR SERI BEGAWAN
SMDSMLNG
Bintulu
ND6 ND7
CA2
2B
SK318
SK408
SK319SK307
SB311
Block G
S-910
Tukau Timur Deep
CW-53, CW-57Selangkir Blk B
Iron Duke Blk 9A2
Iron Duke SWA
0 50 100 150 200 km
"
"
"
"
CHINA
LAOS
VIETNAM
THAILAND
TAIWAN
PHILIPPINES
SOUTH CHINA SEA
JinQiu
Fushun
Changbei
North Shilou
Yinggehai
Zitong
XI'AN
BEIJING
YINCHUAN
Nanhai
CHENGDU
HONG KONG
SHANGHAI
0 150 300 450 600 km
PHILIPPINES
47reports.shell.com | Shell Investors’ HandbookMaps
BRUNEI AND EAST MALAYSIA
CHINA
103585_SHE_Investors Handbook_V98_Cleaned_JD.indd 47 08-05-13 14:53

" ""
""
"
"
" ""
""""""
"
"
"""
"
"""
""
"
""
"""
"
"
"
"" "
""
"
""
"
"
"
"
"
"
"
"
#
###
#
""
""
"" "" ""
AC/P 41
WA-44-L
WA-477-P
Greater SunriseEvans Shoal
Abadi
Crux
North Rankin
TIMOR SEA
INDONESIA
AUSTRALIA
Northern TerritoryWestern AustraliaINDIAN OCEAN
Gorgon LNG
Pluto LNG (Woodside)NWS Australia LNG
Wheatstone LNG
Prelude
EXMOUTH
BROOME
DERBY
DARWIN
DAMPIER
North West Shelf
Arnhem
PinhoePontus
Satyr 2&4
0 100 200 300 400 km
"
"
"
"
""
AUSTRALIA
QueenslandNew South Wales
CORAL SEA
SouthAustralia
DaandineTipton West
Kogan North
Arrow Energy LNG
BRISBANE
GLADSTONE
MACKAY
TOWNSVILLE
Queensland CBM
0 100 200 300 400 km
""
"
"
"
"
"
""
"
"
"
"
NEW ZEALAND
TASMAN SEA
PACIFIC OCEAN
Maui
PohokuraKapuni
Great South Basin
DUNEDIN
AUCKLAND
WELLINGTON
CHRISTCHURCH
NEW PLYMOUTH
0 100 200 300 400 km
{ Gas project
{ Oil or mixed oil and gas project Shell oil pipeline
Shell gas pipeline2012 discovery or appraisal success
{ Downstream facility{ Upstream facility
Integrated gas facility
Concession licences
OCEANIAWEST AUSTRALIA AND INDONESIA
48 Shell Investors’ Handbook | reports.shell.comMaps
NEW ZEALANDEAST AUSTRALIA
103585_SHE_Investors Handbook_V98_Cleaned_JD.indd 48 08-05-13 14:53

"
"
"
"
"
"
""
"
" "
""
"
"
"
"
"
"
"
"
"
""
""""
"
"
"
"
"
" "
"
"
""
"
"
"
"
"
"
"
"
"
"
"
""
"
"
" "
"
"
"
"
""
"
"
""
"
"
"
"
"
"
"
""
""
UNITED STATES
MEXICO GULF OF MEXICO
Florida
AlabamaMississippi
Louisiana
Texas
UrsaNorth
Mars
Tonga
Antiqua
Oregano
Habanero
Enchilada
SalsaConger Cougar
GliderPopeyeBrutus
PrincessUrsaCrosby-Pastel Pink
Europa
Auger
Cognac
Ariel
Kepler
Ram-Powell
Herschel
FourierCoulombEast Anstey
Macaroni
Hickory
Troika
Stones
WD 143
NaKika
Mensa
Llano
Elmer
Caesar
KingWest Boreas
Great WhiteSilvertip
South Deimos
Vito
Appomattox
Cardamom
TobagoPerdido
Chimichanga
Olympus
Santa Fe Ranch
Chittim Ranch
Piloncillo Ranch Deimos
HOUMA
HOUSTONNEW IBERIA
BATON ROUGE
NEW ORLEANSPort Arthur Refinery
Deer Park
Convent
Norco
Geismar
Mobile
SAN ANTONIO
SHREVEPORT
MOBILE
Haynesville
Eagle Ford
0 50 100 150 200 km
"
"
#"
"
"
Permian
Pinedale
Arrowhead
LOS ANGELES
Puget Sound
Baja Regas
Martinez
CASPER
WICHITA
EL PASO
SEATTLE
DENVER
Texas
Utah
Montana
Idaho
Nevada
Arizona
Colorado
Oregon Wyoming
New Mexico
Kansas
Nebraska
North Dakota
South Dakota
Washington
OklahomaCalifornia
UNITED STATES
CANADA
MEXICOPACIFICOCEAN
0 150 300 450 600 km
"
#
"
""
""
"
"
""
"
"
""
CANADA
UNITED STATES
New York
Ohio
West Virginia Virginia
Maryland
Delaware
NewJersey
Pennsylvania
Marcellus
Guernsey
Slippery Rock
BradfordTioga
Drake 2053-6HS
Sarnia Refinery
Cove Point
CLEVELAND
BINGHAMTON
CHARLESTON
PITTSBURGH
0 50 100 150 200 km
AMERICAS
SOUTH USA AND GULF OF MEXICO
NORTH-EAST USA AND CANADA
49reports.shell.com | Shell Investors’ HandbookMaps
NORTH-WEST USA
103585_SHE_Investors Handbook_V98_Cleaned_JD.indd 49 08-05-13 14:53

"
" CANADA
Alaska
CHUKCHI SEA
BEAUFORT SEA
UNITED STATES
Yukon
NorthwesternTerritories
FAIRBANKS
BARROW
Inuvik
Central Mackenzie Valley
0 100 200 300 400 km
CANADA
UNITED STATES
Saskatch
Klappan Area
"
"
"
"
""""
"
"
"
"
"
"
""
"
"
"
"""
""
""
"
"
"
"
"
""
"
"
"
"
"
"
"
""
"
"
"
"
"
""
"
"
""
"
"
"
"
"
"
"
"
"
"
"
"
"
"
"
"
"
"
"
"
"
"
"
"
"
"
""
"
"
"
"
""
"
"
"
"
"
"
"
"
"
"
"
"
"
""
"
"
"
"
""
""
"
"
"""
""
"
"
"
"
"
" "
""
"
"
"
"
"
" "
"
"
"
" "
"
"
"
"
"
"
"
"
"
"
""
""
""
CANADA
UNITED STATES
UNITED STATES
SaskatchewanBritish Columbia
Alberta
PACIFIC OCEAN
GrosmontW. Groundbirch - Phosphate
Bakken
Deep Basin
LimestonePanther
Clearwater
Chipmunk
Seal
Ells River
Namur
Alley Cat
Angler
Fox Creek - Duvernay Shale
GrapevineMoonshine
Quest
Rocky Mountain House
Worsley
Gundy - Montney Shale
CALGARY
EDMONTON
FORT ST. JOHN
GRANDE PRAIRIE
FORT MCMURRAY
Scotford
Kitimat
Jumping Pound
Waterton
Muskeg River MinePeace River
VANCOUVER
0 100 200 300 400 km
"
Sable Island
Nova Scotia - Offshore
Newfoundland
Nova Scotia
ATLANTIC OCEAN
HALIFAX
0 100 200 300 400 km
{ Gas project
{ Oil or mixed oil and gas project Shell oil pipeline
Shell gas pipeline2012 discovery or appraisal success
{ Downstream facility{ Upstream facility
Integrated gas facility
Concession licences
Designated oil sands area
ALASKA, YUKON AND NORTHWESTERN TERRITORIES NOVA SCOTIA
50 Shell Investors’ Handbook | reports.shell.comMaps
ALBERTA AND BRITISH COLUMBIA
103585_SHE_Investors Handbook_V98_Cleaned_JD.indd 50 08-05-13 14:53

"
Stabroek
Guyane Maritime
BRAZIL
GUYANA
VENEZUELA
SURINAME FRENCHGUIANA
TRINIDAD AND TOBAGO
ATLANTIC OCEAN
MABARUMA
GEORGETOWN
PARAMARIBO
CAYENNE
0 100 200 300 400 km
"
"
COLOMBIA
VENEZUELA
PANAMA
PACIFICOCEAN
CARIBBEAN SEA
CPE 4
CPE 2
Gua-3
VMM 27 VMM 3VMM 28
Col-3
Urdaneta Oeste
Luna Llena
BOGOTA
CARACASMARACAIBOBARRANQUILLA
0 100 200 300 400 km
"
"
""
""
"
"
"
""
BRAZIL
ARGENTINA
BOLIVIA
PARAGUAY
URUGUAY
SOUTHATLANTIC OCEAN
CHILE
BRASILIA
SAO PAULO
BUENOS AIRES
RIO DE JANEIRO
Buenos Aires Refinery
Argonauta
Bijupira
AbaloneSalema
Ostra
BMS-54 Pre-SaltMacueta
San Pedrito
Neuquen
0 200 400 600 800 km
GREENLAND
CANADA
BAFFIN BAY
UPERNAVIK
Anu
Napu
0 100 200 300 400 km
FRENCH GUIANA AND GUYANAGREENLAND
51reports.shell.com | Shell Investors’ HandbookMaps
ARGENTINA AND BRAZILCOLOMBIA AND VENEZUELA
103585_SHE_Investors Handbook_V98_Cleaned_JD.indd 51 08-05-13 14:53

CONSOLIDATED DATA
EMPLOYEES BY SEGMENT (AVERAGE NUMBERS) THOUSANDS 2012 2011 2010 2009 2008Upstream 26 27 26 23 22Downstream 48 51 59 62 64Corporate [A] 13 12 12 16 16Total 87 90 97 101 102
[A] Corporate includes employees working in business service centres.
EMPLOYEES BY GEOGRAPHICAL AREA (AVERAGE NUMBERS) THOUSANDS
2012 2011 2010 2009 2008The Netherlands 8 8 8 9 9UK 6 7 7 8 8Other 10 10 13 14 15Europe 24 25 28 31 32Asia, Oceania, Africa 31 33 34 34 34USA 20 20 20 22 23Other Americas 12 12 15 14 13Total 87 90 97 101 102
EMPLOYEE EXPENSE $ MILLION 2012 2011 2010 2009 2008Remuneration 11,133 11,158 10,667 10,608 10,581Social law taxes 789 774 758 818 890Retirement benefi ts 2,502 1,804 1,980 2,679 (302)Share-based compensation 909 754 701 642 241Total 15,333 14,490 14,106 14,747 11,410
EMPLOYEES BY COUNTRY (AVERAGE NUMBERS) THOUSANDS 2012 2011 2010 2009 2008 Argentina 2 2 3 3 3Australia 2 2 2 3 3Brazil 1 1 2 2 2Canada 8 8 8 6 6China/Hong Kong 4 4 4 4 4France 1 1 1 1 2Gabon 1 1 [A] [A] [A]Germany 4 4 5 5 5India 3 3 3 2 1Italy 1 1 1 1 1Malaysia 6 6 6 7 7The Netherlands 8 8 8 9 9Nigeria 1 2 2 2 2Norway 1 1 1 1 1Philippines 4 4 4 3 3Poland 2 2 2 2 1Qatar 1 1 1 1 1Singapore 3 3 3 3 3South Africa 1 1 2 2 2Turkey 1 1 1 1 1UK 5 7 7 8 8United Arab Emirates 1 1 1 1 1USA 20 20 20 22 23 81 84 87 89 89As percentage of total (%) 93 93 90 88 87Total 87 90 97 101 102
[A] Fewer than 500 employees.
EMPLOYEES
52 Shell Investors’ Handbook | reports.shell.comConsolidated data
103585_SHE_Investors Handbook_V98_Cleaned_JD.indd 52 08-05-13 14:53

CONSOLIDATED FINANCIAL DATACONSOLIDATED STATEMENT OF INCOME $ MILLION
2012 2011 2010 2009 2008Revenue 467,153 470,171 368,056 278,188 458,361Share of profi t of equity-accounted investments 8,948 8,737 5,953 4,976 7,446Interest and other income 5,599 5,581 4,143 1,965 5,133Total revenue and other income 481,700 484,489 378,152 285,129 470,940Purchases 369,725 370,044 283,176 203,075 359,587Production and manufacturing expenses 26,280 26,458 24,458 25,301 25,565Selling, distribution and administrative expenses 14,616 14,335 15,528 17,430 16,906Research and development 1,314 1,125 1,019 1,125 1,230Exploration 3,104 2,266 2,036 2,178 1,995Depreciation, depletion and amortisation 14,615 13,228 15,595 14,458 13,656Interest expense 1,757 1,373 996 542 1,181Income before taxation 50,289 55,660 35,344 21,020 50,820Taxation 23,449 24,475 14,870 8,302 24,344Income for the period 26,840 31,185 20,474 12,718 26,476Income attributable to non-controlling interest 248 267 347 200 199Income attributable to Royal Dutch Shell plc shareholders 26,592 30,918 20,127 12,518 26,277
EARNINGS PER SHARE $ 2012 2011 2010 2009 2008
Basic earnings per €0.07 ordinary share 4.25 4.98 3.28 2.04 4.27Diluted earnings per €0.07 ordinary share 4.24 4.97 3.28 2.04 4.26
CCS EARNINGS $ MILLION 2012 2011 2010 2009 2008Income attributable to Royal Dutch Shell plc shareholders 26,592 30,918 20,127 12,518 26,277Estimated CCS adjustment for Downstream 452 (2,293) (1,484) (2,714) 5,089CCS earnings 27,044 28,625 18,643 9,804 31,366
SHARES MILLION 2012 2011 2010 2009 2008
Basic weighted average number of A and B shares 6,261.2 6,212.5 6,132.6 6,124.9 6,159.1Diluted weighted average number of A and B shares 6,267.8 6,221.7 6,139.3 6,128.9 6,171.5Shares outstanding at the end of the period 6,305.9 6,220.1 6,154.2 6,122.3 6,121.7
53reports.shell.com | Shell Investors’ HandbookConsolidated data
103585_SHE_Investors Handbook_V98_Cleaned_JD.indd 53 08-05-13 14:53

54 Shell Investors’ Handbook | reports.shell.comConsolidated data
CONSOLIDATED BALANCE SHEET (AT DECEMBER 31) $ MILLION 2012 2011 2010 2009 2008AssetsNon-current assets
Intangible assets 4,470 4,521 5,039 5,356 5,021Property, plant and equipment 172,293 152,081 142,705 131,619 112,038
Upstream 138,222 119,789 109,677 97,208 80,302Downstream 33,259 31,467 32,205 33,513 30,876Corporate 812 825 823 898 860
Equity-accounted investments 38,350 37,990 33,414 31,175 28,327Investments in securities 4,867 5,492 3,809 3,874 4,065Deferred tax 4,045 4,732 5,361 4,533 3,418Retirement benefi ts 12,575 11,408 10,368 10,009 6,198Trade and other receivables 8,991 9,256 8,970 9,158 6,764
245,591 225,480 209,666 195,724 165,831Current assets
Inventories 30,781 28,976 29,348 27,410 19,342Accounts receivable 65,403 79,509 70,102 59,328 82,040Cash and cash equivalents 18,550 11,292 13,444 9,719 15,188
114,734 119,777 112,894 96,457 116,570Total assets 360,325 345,257 322,560 292,181 282,401LiabilitiesNon-current liabilities
Debt 29,921 30,463 34,381 30,862 13,772Trade and other payables 4,175 4,921 4,250 4,586 3,677Deferred tax 15,590 14,649 13,388 13,838 12,518Retirement benefi ts 6,298 5,931 5,924 5,923 5,469Decommissioning and other provisions 17,435 15,631 14,285 14,048 12,570
73,419 71,595 72,228 69,257 48,006Current liabilities
Debt 7,833 6,712 9,951 4,171 9,497Trade and other payables 72,839 81,846 76,550 67,161 85,091Taxes payable 12,684 10,606 10,306 9,189 8,107Retirement benefi ts 402 387 377 461 383Decommissioning and other provisions 3,221 3,108 3,368 3,807 2,451
96,979 102,659 100,552 84,789 105,529Total liabilities 170,398 174,254 172,780 154,046 153,535EquityShare capital 542 536 529 527 527Shares held in trust (2,287) (2,990) (2,789) (1,711) (1,867)Other reserves 10,021 8,984 10,094 9,982 3,178Retained earnings 180,218 162,987 140,179 127,633 125,447Equity attributable to Royal Dutch Shell plc shareholders 188,494 169,517 148,013 136,431 127,285Non-controlling interest 1,433 1,486 1,767 1,704 1,581Total equity 189,927 171,003 149,780 138,135 128,866Total liabilities and equity 360,325 345,257 322,560 292,181 282,401
103585_SHE_Investors Handbook_V98_Cleaned_JD.indd 54 08-05-13 14:53

CONSOLIDATED STATEMENT OF CASH FLOWS $ MILLION 2012 2011 2010 2009 2008Cash fl ow from operating activitiesIncome for the period 26,840 31,185 20,474 12,718 26,476Adjustment for:
Current taxation 22,722 23,009 16,384 9,297 24,452Interest expense (net) 1,543 1,164 842 1,247 1,039Depreciation, depletion and amortisation 14,615 13,228 15,595 14,458 13,656Net gains on sale of assets (4,228) (4,485) (3,276) (781) (4,071)(Increase)/decrease in net working capital 3,391 (6,471) (5,929) (2,331) 7,935(Increase)/decrease in inventories (1,746) (1,930) (2,888) (7,138) 8,025Decrease/(increase) in accounts receivable 14,145 (10,109) (11,931) 23,679 (11,160)(Decrease)/increase in accounts payable and accrued liabilities (9,008) 5,568 8,890 (18,872) 11,070Share of profi t of equity-accounted investments (8,948) (8,737) (5,953) (4,976) (7,446)Dividends received from equity-accounted investments 10,573 9,681 6,519 4,903 9,325Deferred taxation and decommissioning and other provisions 461 1,768 (1,934) (1,925) (1,030)Other 201 (949) (10) (1,879) (549)
Net cash from operating activities (pre-tax) 67,170 59,393 42,712 30,731 69,787Taxation paid (21,030) (22,622) (15,362) (9,243) (25,869)Cash fl ow from operating activities 46,140 36,771 27,350 21,488 43,918Cash fl ow from investing activities
Capital expenditure (32,576) (26,301) (26,940) (26,516) (35,065)Investments in equity-accounted investments (3,028) (1,886) (2,050) (2,955) (1,885)Proceeds from sale of assets 6,346 6,990 3,325 1,325 4,737Proceeds from sale of equity-accounted investments 698 468 3,591 1,633 2,062Proceeds from sale/(purchases) of securities (net) (86) 90 (34) (105) 224Interest received 193 196 136 384 1,012
Net cash used in investing activities (28,453) (20,443) (21,972) (26,234) (28,915)Cash fl ow from fi nancing activities
Net (decrease)/increase in debt with maturity period within three months (165) (3,724) 4,647 (6,507) 4,161Other debt
New borrowings 5,108 1,249 7,849 19,742 3,555Repayments (4,960) (4,649) (3,240) (2,534) (2,890)
Interest paid (1,428) (1,665) (1,312) (902) (1,371)Change in non-controlling interest 23 8 381 62 40Cash dividends paid to:
Royal Dutch Shell plc shareholders (7,390) (6,877) (9,584) (10,526) (9,516)Non-controlling interest (292) (438) (395) (191) (325)
Repurchases of shares (1,492) (1,106) – – (3,573)Shares held in trust: net (purchases)/sales and dividends received (34) (929) 187 27 525
Net cash used in fi nancing activities (10,630) (18,131) (1,467) (829) (9,394)Currency translation differences relating to cash and cash equivalents 201 (349) (186) 106 (77)Increase/(decrease) in cash and cash equivalents 7,258 (2,152) 3,725 (5,469) 5,532Cash and cash equivalents at January 1 11,292 13,444 9,719 15,188 9,656Cash and cash equivalents at December 31 18,550 11,292 13,444 9,719 15,188
55reports.shell.com | Shell Investors’ HandbookConsolidated data
103585_SHE_Investors Handbook_V98_Cleaned_JD.indd 55 08-05-13 14:53

QUARTERLY EARNINGS BY BUSINESS SEGMENT $ MILLION 2012 2011 Q1 Q2 Q3 Q4 Year Q1 Q2 Q3 Q4 Year Upstream* [A]
Europe 1,377 1,213 734 1,244 4,568 863 1,035 1,261 1,922 5,081Asia-Pacifi c 1,402 1,350 1,822 1,749 6,323 1,139 1,539 1,806 1,223 5,707Other 2,786 2,211 2,575 2,782 10,354 1,852 2,287 2,320 2,450 8,909
Upstream International 5,565 4,774 5,131 5,775 21,245 3,854 4,861 5,387 5,595 19,697Upstream Americas 1,141 (86) (541) 403 917 1,904 1,200 684 970 4,758Total 6,706 4,688 4,590 6,178 22,162 5,758 6,061 6,071 6,565 24,455* of which integrated gas [B] 2,426 2,619 2,774 3,159 10,978 759 2,160 2,437 1,923 7,279Downstream (CCS basis)
Oil products 820 879 1,395 865 3,959 685 1,347 827 (624) 2,235Chemicals 499 481 202 209 1,391 485 536 653 380 2,054
Total 1,319 1,360 1,597 1,074 5,350 1,170 1,883 1,480 (244) 4,289Corporate and non-controlling interest
Interest and investment income/(expense) (388) (221) (239) (153) (1,001) (194) (160) (152) (118) (624)Currency exchange gains/(losses) 185 (107) 77 14 169 92 126 (270) (25) (77)Other – including taxation (61) 292 177 215 623 201 175 168 243 787Corporate (264) (36) 15 76 (209) 99 141 (254) 100 86Non-controlling interest (102) (48) (75) (34) (259) (102) (90) (51) 38 (205)
Total (366) (84) (60) 42 (468) (3) 51 (305) 138 (119)CCS earnings 7,659 5,964 6,127 7,294 27,044 6,925 7,995 7,246 6,459 28,625Estimated CCS adjustment for Downstream 1,060 (1,901) 1,012 (623) (452) 1,855 667 (270) 41 2,293Income attributable to Royal Dutch Shell plc shareholders 8,719 4,063 7,139 6,671 26,592 8,780 8,662 6,976 6,500 30,918
[A] Europe: Europe. Asia-Pacifi c: East Asia and Oceania. Other: Africa, Middle East and Commonwealth of Independent States. Americas: North and South America.[B] Integrated gas is part of the Upstream segment. It incorporates liquefi ed natural gas, including LNG marketing and trading, and gas-to-liquids operations, as
previously reported in the Gas & Power segment. In addition, the associated upstream oil and gas production activities from projects where there are integrated fi scal and ownership structures across the value chain are included in integrated gas. These include the North West Shelf, Pearl, Qatargas 4, Pluto (Woodside) and Sakhalin-2 projects that are on-stream, as well as Gorgon, Prelude and Wheatstone projects that are currently under construction. Power generation and coal gasifi cation activities are also included in integrated gas.
QUARTERLY IDENTIFIED ITEMS BY BUSINESS SEGMENT [A] $ MILLION 2012 2011
Q1 Q2 Q3 Q4 Year Q1 Q2 Q3 Q4 YearUpstream* [B]
Europe (64) 160 (357) 45 (216) (162) 85 171 450 544Asia-Pacifi c – 539 184 717 1,440 (38) 482 381 152 977Other – (373) 314 567 508 221 27 132 544 924
Upstream International (64) 326 141 1,329 1,732 21 594 684 1,146 2,445Upstream Americas 517 (145) (439) 472 405 1,099 47 (48) 312 1,410Total 453 181 (298) 1,801 2,137 1,120 641 636 1,458 3,855* of which integrated gas [C] – 539 202 835 1,576 (319) 535 534 111 861Downstream (CCS basis)
Oil products 198 32 (47) (89) 94 (479) 796 (317) 34 34Chemicals – 32 (87) – (55) (4) 6 (21) – (19)
Total 198 64 (134) (89) 39 (483) 802 (338) 34 15Corporate and non-controlling interest
Corporate (234) – – – (234) – – (53) 76 23Non-controlling interest (37) – – – (37) – – – 45 45
Total (271) – – – (271) – – (53) 121 68CCS earnings impact 380 245 (432) 1,712 1,905 637 1,443 245 1,613 3,938
[A] Identifi ed items generally relate to events with an impact of more than $50 million on earnings and are shown to provide additional insight into segment earnings and income attributable to shareholders. A detailed description of Shell’s identifi ed items per quarter can be found in the Quarterly Results Announcements.
[B] Europe: Europe. Asia-Pacifi c: East Asia and Oceania. Other: Africa, Middle East and Commonwealth of Independent States. Americas: North and South America.[C] Integrated gas is part of the Upstream segment. It incorporates liquefi ed natural gas, including LNG marketing and trading, and gas-to-liquids operations, as
previously reported in the Gas & Power segment. In addition, the associated upstream oil and gas production activities from projects where there are integrated fi scal and ownership structures across the value chain are included in integrated gas. These include the North West Shelf, Pearl, Qatargas 4 and Sakhalin-2 projects, which were on-stream in 2012. Power generation and coal gasifi cation activities are also included in integrated gas.
56 Shell Investors’ Handbook | reports.shell.comConsolidated data
103585_SHE_Investors Handbook_V98_Cleaned_JD.indd 56 08-05-13 14:53

QUARTERLY EARNINGS BY BUSINESS SEGMENT $ MILLION 2010 2009 2008
Q1 Q2 Q3 Q4 Year Q1 Q2 Q3 Q4 Year Q1 Q2 Q3 Q4 Year
1,487 910 745 1,186 4,328 1,461 209 362 724 2,756 1,748 1,240 3,213 2,608 8,8091,068 770 1,551 2,826 6,215 751 722 566 575 2,614 1,021 1,290 1,031 1,140 4,482
928 1,257 1,424 1,053 4,662 320 471 467 581 1,839 1,470 1,638 1,833 1,066 6,0073,483 2,937 3,720 5,065 15,205 2,532 1,402 1,395 1,880 7,209 4,239 4,168 6,077 4,814 19,298
932 333 (567) 32 730 (348) 689 148 656 1,145 2,100 2,689 2,570 (151) 7,2084,415 3,270 3,153 5,097 15,935 2,184 2,091 1,543 2,536 8,354 6,339 6,857 8,647 4,663 26,506
960 813 1,280 2,674 5,727 511 441 473 360 1,785 881 1,044 1,217 951 4,093
430 1,081 10 (82) 1,439 1,077 (257) 1,163 (2,041) (58) 1,195 1,075 2,303 580 5,153313 390 315 493 1,511 (74) (18) 129 279 316 201 (142) 116 (19) 156743 1,471 325 411 2,950 1,003 (275) 1,292 (1,762) 258 1,396 933 2,419 561 5,309
(98) (39) (107) (65) (309) 21 25 59 255 360 110 81 178 (41) 328(63) (160) 50 215 42 (46) 379 160 151 644 (62) 27 (264) (351) (650)(15) 87 205 81 358 158 144 (17) 21 306 98 93 43 19 253
(176) (112) 148 231 91 133 548 202 427 1,310 146 201 (43) (373) (69)(85) (100) (105) (43) (333) (23) (24) (47) (24) (118) (105) (89) (120) (66) (380)
(261) (212) 43 188 (242) 110 524 155 403 1,192 41 112 (163) (439) (449)4,897 4,529 3,521 5,696 18,643 3,297 2,340 2,990 1,177 9,804 7,776 7,902 10,903 4,785 31,366
584 (136) (58) 1,094 1,484 191 1,482 257 784 2,714 1,307 3,654 (2,455) (7,595) (5,089)5,481 4,393 3,463 6,790 20,127 3,488 3,822 3,247 1,961 12,518 9,083 11,556 8,448 (2,810) 26,277
QUARTERLY IDENTIFIED ITEMS BY BUSINESS SEGMENT [A] $ MILLION 2010 2009 2008
Q1 Q2 Q3 Q4 Year Q1 Q2 Q3 Q4 Year Q1 Q2 Q3 Q4 Year
16 (49) 339 (19) 287 233 (389) 49 (76) (183) (161) (373) 1,737 906 2,109– 6 453 1,927 2,386 65 70 46 (256) (75) – 47 (67) 35 15
(50) 11 102 (20) 43 97 – (15) (33) 49 – 132 193 430 755(34) (32) 894 1,888 2,716 395 (319) 80 (365) (209) (161) (194) 1,863 1,371 2,879
144 42 (1,178) (231) (1,223) (65) 204 (203) 139 75 84 (8) 505 27 608110 10 (284) 1,657 1,493 330 (115) (123) (226) (134) (77) (202) 2,368 1,398 3,487
9 42 405 2,023 2,479 80 (6) 125 (232) (33) – 35 104 91 230
(35) 365 (1,128) 10 (788) (186) (611) 576 (1,429) (1,650) – (269) 477 (383) (175)– (54) – (81) (135) (19) (67) (40) 94 (32) – (206) (32) (22) (260)
(35) 311 (1,128) (71) (923) (205) (678) 536 (1,335) (1,682) – (475) 445 (405) (435)
– – – – – 162 (17) (42) (36) 67 – – – (96) (96)– – – – – – – – – – – – – – –– – – – – 162 (17) (42) (36) 67 – – – (96) (96)
75 321 (1,412) 1,586 570 287 (810) 371 (1,597) (1,749) (77) (677) 2,813 897 2,956
57reports.shell.com | Shell Investors’ HandbookConsolidated data
103585_SHE_Investors Handbook_V98_Cleaned_JD.indd 57 08-05-13 14:53

ADDITIONAL SEGMENTAL INFORMATION $ MILLION 2012 2011 2010 2009 2008UpstreamSegment earnings 22,162 24,455 15,935 8,354 26,506Including:
Exploration 3,104 2,266 2,036 2,178 1,995Depreciation, depletion and amortisation 11,387 8,827 11,144 9,875 9,906Share of profi t of equity-accounted investments 8,001 7,127 4,900 3,852 7,521Production and manufacturing expenses 16,474 15,606 13,697 13,958 13,763Selling, distribution and administrative expenses 1,226 1,276 1,512 2,206 2,030
Cash fl ow from operations 33,061 30,579 24,872 19,935 38,681Less: Working capital movements 110 (2,702) 346 1,490 3,233Cash fl ow from operations excluding working capital movements 32,951 33,281 24,526 18,445 35,448Capital employed 139,277 126,437 113,631 98,826 83,997DownstreamSegment CCS earnings 5,350 4,289 2,950 258 5,309Including:
Depreciation, depletion and amortisation 3,083 4,251 4,254 4,399 3,574Share of profi t of equity-accounted investments 1,354 1,577 948 661 834Production and manufacturing expenses 9,484 10,547 10,592 11,829 12,225Selling, distribution and administrative expenses 12,996 12,920 13,716 14,505 14,451
Cash fl ow from operations 11,111 4,921 1,961 4,056 8,607Less: Working capital movements 3,083 (3,825) (6,177) (1,783) 6,857Cash fl ow from operations excluding working capital movements 8,028 8,746 8,138 5,839 1,750Capital employed 71,889 71,976 67,287 62,632 54,050CorporateSegment earnings (209) 86 91 1,310 (69)Cash fl ow from operations 1,968 1,271 517 (2,503) (3,370)Less: Working capital movements 198 56 (98) (2,039) (2,155)Cash fl ow from operations excluding working capital movements 1,770 1,215 615 (464) (1,215)Capital employed 16,515 9,765 13,194 11,710 14,088Shell groupCCS earnings 27,303 28,830 18,976 9,922 31,746Non-controlling interest (259) (205) (333) (118) (380)CCS earnings (after non-controlling interest) 27,044 28,625 18,643 9,804 31,366Cash fl ow from operations 46,140 36,771 27,350 21,488 43,918Less: Working capital movements 3,391 (6,471) (5,929) (2,332) 7,935Cash fl ow from operations excluding working capital movements 42,749 43,242 33,279 23,820 35,983Capital employed 227,681 208,178 194,112 173,168 152,135
58 Shell Investors’ Handbook | reports.shell.comConsolidated data
103585_SHE_Investors Handbook_V98_Cleaned_JD.indd 58 08-05-13 14:53
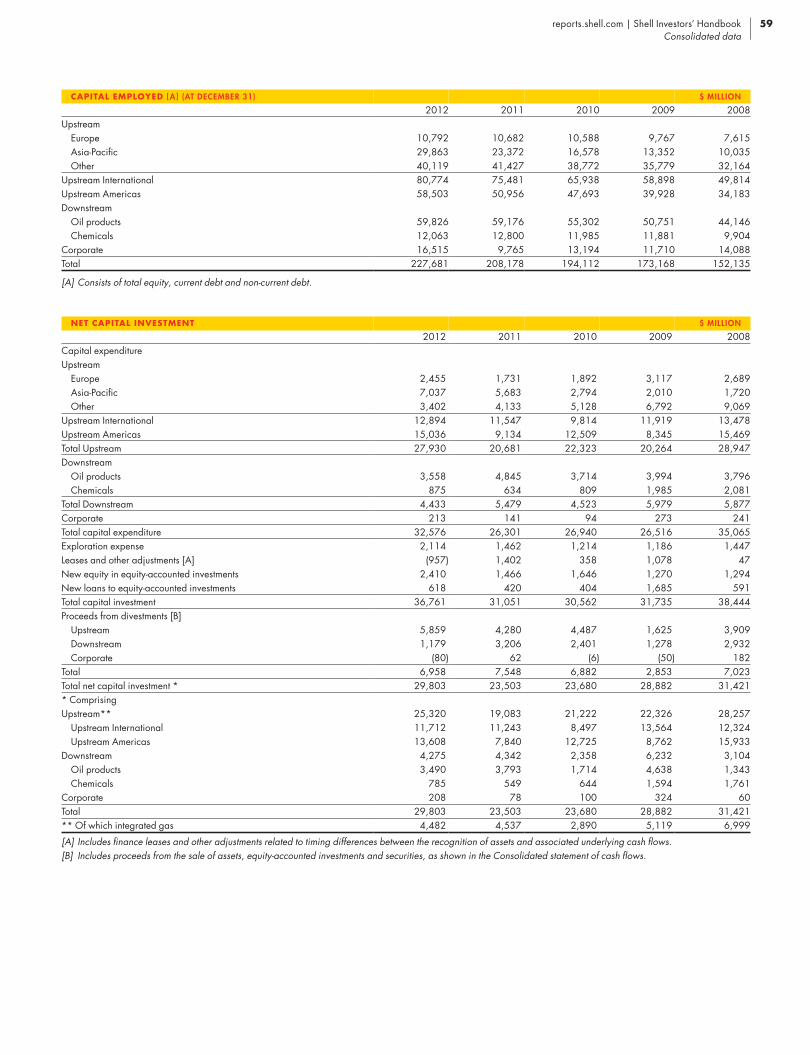
NET CAPITAL INVESTMENT $ MILLION 2012 2011 2010 2009 2008Capital expenditureUpstream
Europe 2,455 1,731 1,892 3,117 2,689Asia-Pacifi c 7,037 5,683 2,794 2,010 1,720Other 3,402 4,133 5,128 6,792 9,069
Upstream International 12,894 11,547 9,814 11,919 13,478Upstream Americas 15,036 9,134 12,509 8,345 15,469Total Upstream 27,930 20,681 22,323 20,264 28,947Downstream
Oil products 3,558 4,845 3,714 3,994 3,796Chemicals 875 634 809 1,985 2,081
Total Downstream 4,433 5,479 4,523 5,979 5,877Corporate 213 141 94 273 241Total capital expenditure 32,576 26,301 26,940 26,516 35,065Exploration expense 2,114 1,462 1,214 1,186 1,447Leases and other adjustments [A] (957) 1,402 358 1,078 47New equity in equity-accounted investments 2,410 1,466 1,646 1,270 1,294New loans to equity-accounted investments 618 420 404 1,685 591Total capital investment 36,761 31,051 30,562 31,735 38,444Proceeds from divestments [B]
Upstream 5,859 4,280 4,487 1,625 3,909Downstream 1,179 3,206 2,401 1,278 2,932Corporate (80) 62 (6) (50) 182
Total 6,958 7,548 6,882 2,853 7,023Total net capital investment * 29,803 23,503 23,680 28,882 31,421* ComprisingUpstream** 25,320 19,083 21,222 22,326 28,257
Upstream International 11,712 11,243 8,497 13,564 12,324Upstream Americas 13,608 7,840 12,725 8,762 15,933
Downstream 4,275 4,342 2,358 6,232 3,104Oil products 3,490 3,793 1,714 4,638 1,343Chemicals 785 549 644 1,594 1,761
Corporate 208 78 100 324 60Total 29,803 23,503 23,680 28,882 31,421** Of which integrated gas 4,482 4,537 2,890 5,119 6,999
[A] Includes fi nance leases and other adjustments related to timing differences between the recognition of assets and associated underlying cash fl ows. [B] Includes proceeds from the sale of assets, equity-accounted investments and securities, as shown in the Consolidated statement of cash fl ows.
CAPITAL EMPLOYED [A] (AT DECEMBER 31) $ MILLION 2012 2011 2010 2009 2008Upstream
Europe 10,792 10,682 10,588 9,767 7,615Asia-Pacifi c 29,863 23,372 16,578 13,352 10,035Other 40,119 41,427 38,772 35,779 32,164
Upstream International 80,774 75,481 65,938 58,898 49,814Upstream Americas 58,503 50,956 47,693 39,928 34,183Downstream
Oil products 59,826 59,176 55,302 50,751 44,146Chemicals 12,063 12,800 11,985 11,881 9,904
Corporate 16,515 9,765 13,194 11,710 14,088Total 227,681 208,178 194,112 173,168 152,135
[A] Consists of total equity, current debt and non-current debt.
59reports.shell.com | Shell Investors’ HandbookConsolidated data
103585_SHE_Investors Handbook_V98_Cleaned_JD.indd 59 08-05-13 14:53

FINANCIAL RATIOS 2012 2011 2010 2009 2008Return on average capital employed Income for the period adjusted for interest expense, less tax for the period,
as % of the average capital employed 12.7 15.9 11.5 8.0 18.3Return on average capital in service
Income for the year, adjusted for after-tax interest expense and depreciation on exploration and evaluation assets, as % of the average capital employed, adjusted for assets under construction and exploration and evaluation assets, for the same period 17.7 22.6 18.5 13.0 25.5
Return on sales Income for the year as % of sales proceeds (including sales taxes, etc) 4.9 5.6 4.6 3.5 4.8Return on equity Income attributable to Royal Dutch Shell plc shareholders as % of average
net assets (i.e. equity attributable to Royal Dutch Shell plc shareholders and non-controlling interest) 14.7 19.3 14.0 9.4 20.6
Current ratioCurrent assets : current liabilities 1.2 1.2 1.1 1.1 1.1
Long-term debt ratio Non-current debt as % of capital employed less current debt 13.6 15.1 18.7 18.3 9.7
Total debt ratio Non-current debt plus current debt as % of capital employed 16.6 17.9 22.8 20.2 15.3
Gearing ratio at December 31 Net debt as % of total capital 9.2 13.1 17.1 15.5 5.9
AMORTISATION $ MILLION 2012 2011 2010 2009 2008Upstream
Europe 1,583 1,519 2,732 2,746 3,113Asia-Pacifi c 1,027 1,222 1,063 1,091 1,426Other 2,458 1,603 1,445 1,507 1,944
Upstream International 5,068 4,344 5,240 5,344 6,483Upstream Americas 6,319 4,483 5,904 4,531 3,423Downstream
Oil products 2,273 3,408 3,444 3,469 2,686Chemicals 810 843 810 930 888
Corporate 145 150 197 184 176Total 14,615 13,228 15,595 14,458 13,656
FIXED ASSETS [A] (AT DECEMBER 31) $ MILLION 2012 2011 2010 2009 2008Upstream
Europe 16,860 14,327 16,119 18,478 16,550Asia-Pacifi c 35,104 27,536 20,536 16,307 13,094Other 44,469 44,913 42,868 38,637 32,886
Upstream International 96,433 86,776 79,523 73,422 62,530Upstream Americas 67,800 59,683 54,453 46,391 39,228Downstream
Oil products 41,678 39,711 37,072 38,166 35,002Chemicals 11,773 11,735 11,799 11,642 10,486
Corporate 2,296 2,180 2,120 2,403 2,205Total 219,980 200,085 184,967 172,024 149,451
[A] Comprises intangible assets, property, plant and equipment, equity-accounted investments and investments in securities.
TAXATION CHARGE 2012 2011 2010 2009 2008Current taxation ($ million) 22,722 23,009 16,384 9,297 24,452Deferred taxation ($ million) 727 1,466 (1,514) (995) (108)Total taxation charge ($ million) 23,449 24,475 14,870 8,302 24,344As percentage of income before taxation (%) 47 44 42 39 48
60 Shell Investors’ Handbook | reports.shell.comConsolidated data
103585_SHE_Investors Handbook_V98_Cleaned_JD.indd 60 08-05-13 14:53

UPSTREAM EARNINGS
[A] Asia : East Asia and Oceania.[B] Other: Africa, Middle East and Commonwealth of Independent States.
UPSTREAM DATA
2011 $ MILLIONUpstream Upstream
Europe Asia [A] Other [B] International Americas TotalRevenue (third party and inter-segment) 26,263 11,125 33,451 70,839 20,852 91,691Share of profi t of equity-accounted investments 1,527 1,111 3,121 5,759 1,368 7,127Interest and other income 42 841 1,052 1,935 2,214 4,149Total revenue and other income 27,832 13,077 37,624 78,533 24,434 102,967Purchases 9,687 2,190 4,605 16,482 5,606 22,088Production and manufacturing expenses 2,775 1,735 4,606 9,116 6,490 15,606Taxes other than income tax 390 835 1,553 2,778 239 3,017Selling, distribution and administrative expenses 1,010 83 22 1,115 161 1,276Research and development 505 15 – 520 162 682Exploration 313 413 584 1,310 956 2,266Depreciation, depletion and amortisation 1,519 1,222 1,603 4,344 4,483 8,827Interest expense 356 53 149 558 198 756Earnings before taxation 11,277 6,531 24,502 42,310 6,139 48,449Taxation 6,196 824 15,593 22,613 1,381 23,994Earnings after taxation 5,081 5,707 8,909 19,697 4,758 24,455Cash fl ow from operations 6,680 6,343 9,421 22,444 8,135 30,579Less: Net working capital movements (876) (133) (2,225) (3,234) 532 (2,702)Cash fl ow from operations excluding net working capital movements 7,556 6,476 11,646 25,678 7,603 33,281
2012 $ MILLION Upstream Upstream
Europe Asia [A] Other [B] International Americas TotalRevenue (third party and inter-segment) 26,569 13,133 36,734 76,436 18,114 94,550Share of profi t of equity-accounted investments 1,667 1,195 4,016 6,878 1,123 8,001Interest and other income 70 2,900 984 3,954 882 4,836Total revenue and other income 28,306 17,228 41,734 87,268 20,119 107,387Purchases 10,689 4,839 6,015 21,543 3,702 25,245Production and manufacturing expenses 2,555 1,794 4,717 9,066 7,408 16,474Taxes other than income tax 350 675 1,301 2,326 183 2,509Selling, distribution and administrative expenses 842 205 (2) 1,045 181 1,226Research and development 595 16 – 611 265 876Exploration 370 486 876 1,732 1,372 3,104Depreciation, depletion and amortisation 1,583 1,027 2,458 5,068 6,319 11,387Interest expense 311 58 160 529 245 774Earnings before taxation 11,011 8,128 26,209 45,348 444 45,792Taxation 6,443 1,805 15,855 24,103 (473) 23,630Earnings after taxation 4,568 6,323 10,354 21,245 917 22,162Cash fl ow from operations 6,698 5,816 14,342 26,856 6,205 33,061Less: Net working capital movements 13 317 (840) (510) 620 110Cash fl ow from operations excluding net working capital movements 6,685 5,499 15,182 27,366 5,585 32,951
61reports.shell.com | Shell Investors’ HandbookUpstream data
103585_SHE_Investors Handbook_V98_Cleaned_JD.indd 61 08-05-13 14:53

2010 $ MILLIONUpstream Upstream
Europe Asia [A] Other [B] International Americas TotalRevenue (third party and inter-segment) 21,379 7,893 22,950 52,222 15,976 68,198Share of profi t of equity-accounted investments 1,378 1,099 1,509 3,986 914 4,900Interest and other income 37 3,153 166 3,356 260 3,616Total revenue and other income 22,794 12,145 24,625 59,564 17,150 76,714Purchases 7,379 1,175 2,602 11,156 2,936 14,092Production and manufacturing expenses 2,981 1,539 3,635 8,155 5,542 13,697Taxes other than income tax 303 567 1,069 1,939 254 2,193Selling, distribution and administrative expenses 989 90 12 1,091 421 1,512Research and development 416 5 – 421 199 620Exploration 335 337 342 1,014 1,022 2,036Depreciation, depletion and amortisation 2,732 1,063 1,445 5,240 5,904 11,144Interest expense 344 37 128 509 154 663Earnings before taxation 7,315 7,332 15,392 30,039 718 30,757Taxation 2,987 1,117 10,730 14,834 (12) 14,822Earnings after taxation 4,328 6,215 4,662 15,205 730 15,935Cash fl ow from operations 5,096 5,269 8,158 18,523 6,349 24,872Less: Net working capital movements (347) 472 (135) (10) 356 346Cash fl ow from operations excluding net working capital movements 5,443 4,797 8,293 18,533 5,993 24,526
2009 $ MILLIONUpstream Upstream
Europe Asia [A] Other [B] International Americas TotalRevenue (third party and inter-segment) 20,403 6,617 15,316 42,336 12,804 55,140Share of profi t of equity-accounted investments 1,485 740 983 3,208 644 3,852Interest and other income 75 379 82 536 116 652Total revenue and other income 21,963 7,736 16,381 46,080 13,564 59,644Purchases 7,341 1,187 1,500 10,028 1,618 11,646Production and manufacturing expenses 3,229 1,705 3,548 8,482 5,414 13,896Taxes other than income tax 322 316 506 1,144 124 1,268Selling, distribution and administrative expenses 1,555 71 39 1,665 541 2,206Research and development 415 – – 415 219 634Exploration 273 276 660 1,209 969 2,178Depreciation, depletion and amortisation 2,745 1,091 1,508 5,344 4,531 9,875Interest expense 338 22 138 498 147 645Earnings before taxation 5,745 3,068 8,482 17,295 1 17,296Taxation 2,989 454 6,643 10,086 (1,144) 8,942Earnings after taxation 2,756 2,614 1,839 7,209 1,145 8,354Cash fl ow from operations 4,724 3,723 4,412 12,859 7,076 19,935Less: Net working capital movements 894 (84) (372) 438 1,052 1,490Cash fl ow from operations excluding net working capital movements 3,830 3,807 4,784 12,421 6,024 18,445
2008 $ MILLIONUpstream Upstream
Europe Asia [A] Other [B] International Americas TotalRevenue (third party and inter-segment) 28,979 10,050 25,233 64,262 24,046 88,308Share of profi t of equity-accounted investments 2,582 1,433 2,065 6,080 1,441 7,521Interest and other income 2,304 690 446 3,440 684 4,124Total revenue and other income 33,865 12,173 27,744 73,782 26,171 99,953Purchases 7,164 2,553 1,910 11,627 5,231 16,858Production and manufacturing expenses 3,131 1,494 3,465 8,090 5,572 13,662Taxes other than income tax 502 875 903 2,280 191 2,471Selling, distribution and administrative expenses 1,431 120 26 1,577 453 2,030Research and development 481 – – 481 295 776Exploration 416 185 388 989 1,006 1,995Depreciation, depletion and amortisation 3,114 1,426 1,943 6,483 3,423 9,906Interest expense 348 23 111 482 104 586Earnings before taxation 17,278 5,497 18,998 41,773 9,896 51,669Taxation 8,469 1,015 12,991 22,475 2,688 25,163Earnings after taxation 8,809 4,482 6,007 19,298 7,208 26,506Cash fl ow from operations 12,885 5,644 9,977 28,506 10,175 38,681Less: Net working capital movements 1,466 314 1,737 3,517 (284) 3,233Cash fl ow from operations excluding net working capital movements 11,419 5,330 8,240 24,989 10,459 35,448
62 Shell Investors’ Handbook | reports.shell.comUpstream data
103585_SHE_Investors Handbook_V98_Cleaned_JD.indd 62 08-05-13 14:53

OIL AND GAS EXPLORATION AND PRODUCTION ACTIVITIES EARNINGSShell subsidiaries
2011 $ MILLIONNorth America South
Europe Asia Oceania Africa USA Other [A] America TotalRevenue
Third parties 5,038 4,227 1,823 3,143 3,369 342 96 18,038Sales between businesses 10,379 14,495 1,160 10,986 4,016 6,710 1,570 49,316
Total 15,417 18,722 2,983 14,129 7,385 7,052 1,666 67,354Production costs excluding taxes 2,243 1,301 386 1,453 2,005 2,979 250 10,617Taxes other than income tax [B] 390 588 300 1,499 59 – 180 3,016Exploration 288 326 178 493 745 110 126 2,266Depreciation, depletion and amortisation 1,473 1,008 351 1,181 2,427 1,575 352 8,367Other income/(costs) (1,670) (3,242) (331) 1,071 797 (2,080) 504 (4,951)Earnings before taxation 9,353 12,257 1,437 10,574 2,946 308 1,262 38,137Taxation charge/(credit) 6,048 9,748 (15) 6,511 714 165 471 23,642Earnings after taxation 3,305 2,509 1,452 4,063 2,232 143 791 14,495
$/BOERevenue 83.64 99.60 65.91 82.19 65.91 78.54 82.99 83.01Production costs excluding taxes 12.17 6.92 8.53 8.45 17.89 33.18 12.45 13.08Taxes other than income tax [B] 2.12 3.13 6.63 8.72 0.53 – 8.97 3.72Exploration 1.56 1.73 3.93 2.87 6.65 1.23 6.28 2.79Depreciation, depletion and amortisation 7.99 5.36 7.76 6.87 21.66 17.54 17.53 10.31Other income/(costs) (9.06) (17.25) (7.31) 6.23 7.11 (23.17) 25.11 (6.10)Earnings before taxation 50.74 65.21 31.75 61.51 26.29 3.43 62.86 47.00Taxation charge/(credit) 32.81 51.86 (0.33) 37.87 6.37 1.84 23.46 29.14Earnings after taxation 17.93 13.35 32.08 23.63 19.92 1.59 39.40 17.86
[A] Comprises Canada and Greenland. [B] Includes cash paid royalties to governments outside North America.
2012 $ MILLIONNorth America South
Europe Asia Oceania Africa USA Other [A] America TotalRevenue
Third parties 4,705 3,981 1,941 2,807 3,573 207 23 17,237Sales between businesses 10,275 16,450 1,129 10,364 3,906 6,443 1,431 49,998
Total 14,980 20,431 3,070 13,171 7,479 6,650 1,454 67,235Production costs excluding taxes 2,516 1,582 395 1,540 2,486 2,986 255 11,760Taxes other than income tax [B] 350 410 322 1,248 39 – 145 2,514Exploration 347 461 175 699 801 423 198 3,104Depreciation, depletion and amortisation 1,531 1,222 304 1,261 3,837 2,037 315 10,507Other (costs)/income (1,331) (3,157) 1,769 322 (563) (2,175) (63) (5,198)Earnings before taxation 8,905 13,599 3,643 8,745 (247) (971) 478 34,152Taxation charge/(credit) 6,327 10,742 1,104 5,358 (127) (428) 137 23,113Earnings after taxation 2,578 2,857 2,539 3,387 (120) (543) 341 11,039
$/BOERevenue 86.35 97.25 70.49 81.42 60.46 68.31 92.39 81.43 Production costs excluding taxes 14.50 7.53 9.07 9.52 20.10 30.67 16.20 14.24 Taxes other than income tax [B] 2.02 1.95 7.39 7.71 0.32 – 9.21 3.04 Exploration 2.00 2.19 4.02 4.32 6.47 4.34 12.58 3.76 Depreciation, depletion and amortisation 8.83 5.82 6.98 7.79 31.02 20.92 20.02 12.73 Other (costs)/income (7.67) (15.03) 40.62 1.99 (4.55) (22.34) (4.00) (6.30)Earnings before taxation 51.33 64.73 83.64 54.06 (2.00) (9.97) 30.37 41.36 Taxation charge/(credit) 36.47 51.13 25.35 33.12 (1.03) (4.40) 8.71 27.99 Earnings after taxation 14.86 13.60 58.30 20.94 (0.97) (5.58) 21.67 13.37
63reports.shell.com | Shell Investors’ HandbookUpstream data
103585_SHE_Investors Handbook_V98_Cleaned_JD.indd 63 08-05-13 14:53

2010 $ MILLIONNorth America South
Europe Asia Oceania Africa USA Other [A] America TotalRevenue
Third parties 4,100 2,755 1,674 2,215 3,547 487 121 14,899Sales between businesses 8,572 10,672 980 8,225 3,153 4,101 1,356 37,059
Total 12,672 13,427 2,654 10,440 6,700 4,588 1,477 51,958Production costs excluding taxes 2,186 1,106 287 1,244 1,700 2,257 209 8,989Taxes other than income tax [B] 303 333 284 1,019 100 – 154 2,193Exploration 335 275 110 294 730 167 125 2,036Depreciation, depletion and amortisation 2,690 748 436 1,192 1,858 3,178 636 10,738Other income/(costs) (1,144) (2,748) 2,479 497 (528) (1,324) 72 (2,696)Earnings before taxation 6,014 8,217 4,016 7,188 1,784 (2,338) 425 25,306Taxation charge/(credit) 2,915 6,752 524 4,564 542 (614) 132 14,815Earnings after taxation 3,099 1,465 3,492 2,624 1,242 (1,724) 293 10,491
$/BOERevenue 58.55 73.72 53.86 59.47 50.85 60.72 62.26 60.81Production costs excluding taxes 10.10 6.07 5.82 7.09 12.90 29.87 8.81 10.52Taxes other than income tax [B] 1.40 1.83 5.76 5.80 0.76 – 6.49 2.57Exploration 1.55 1.51 2.23 1.67 5.54 2.21 5.27 2.38Depreciation, depletion and amortisation 12.43 4.11 8.85 6.79 14.10 42.06 26.81 12.57Other income/(costs) (5.28) (15.09) 50.30 2.82 (4.01) (17.52) 3.03 (3.15)Earnings before taxation 27.79 45.11 81.50 40.94 13.54 (30.94) 17.91 29.62Taxation charge/(credit) 13.47 37.07 10.63 25.99 4.11 (8.12) 5.56 17.34Earnings after taxation 14.32 8.04 70.87 14.95 9.43 (22.82) 12.35 12.28
2009 $ MILLION North America South
Europe Asia Oceania Africa USA Other [A] America TotalRevenue
Third parties 2,945 2,449 1,001 1,613 3,055 348 119 11,530Sales between businesses 8,271 8,170 877 5,524 2,774 3,334 486 29,436
Total 11,216 10,619 1,878 7,137 5,829 3,682 605 40,966Production costs excluding taxes 2,729 1,113 177 1,285 1,666 1,963 184 9,117Taxes other than income tax [B] 322 185 172 465 56 – 68 1,268Exploration 273 208 196 532 610 177 182 2,178Depreciation, depletion and amortisation 2,730 937 307 1,233 2,440 1,999 124 9,770Other income/(costs) (1,064) (2,458) (463) (444) (653) (1,075) (72) (6,229)Earnings before taxation 4,098 5,718 563 3,178 404 (1,532) (25) 12,404Taxation charge/(credit) 2,886 4,744 69 2,370 (458) (572) (126) 8,913Earnings after taxation 1,212 974 494 808 862 (960) 101 3,491
$/BOERevenue 48.96 55.94 38.51 53.95 42.37 47.95 42.54 49.44Production costs excluding taxes 11.91 5.86 3.63 9.71 12.11 25.56 12.94 11.00Taxes other than income tax [B] 1.41 0.97 3.53 3.51 0.41 – 4.78 1.53Exploration 1.19 1.10 4.02 4.02 4.43 2.31 12.80 2.63Depreciation, depletion and amortisation 11.92 4.94 6.29 9.32 17.74 26.03 8.72 11.79Other income/(costs) (4.64) (12.95) (9.50) (3.37) (4.74) (14.00) (5.06) (7.52)Earnings before taxation 17.89 30.12 11.54 24.02 2.94 (19.95) (1.76) 14.97Taxation charge/(credit) 12.60 24.99 1.41 17.91 (3.33) (7.45) (8.86) 10.76Earnings after taxation 5.29 5.13 10.13 6.11 6.27 (12.50) 7.10 4.21
[A] Comprises Canada and Greenland. [B] Includes cash paid royalties to governments outside North America.
64 Shell Investors’ Handbook | reports.shell.comUpstream data
103585_SHE_Investors Handbook_V98_Cleaned_JD.indd 64 08-05-13 14:53

OIL SANDS UNIT OPERATING COSTS $/B 2012 2011 2010 2009 2008Mining and upgrader cash operating costs [A] 41.74 43.00 47.74 32.49 38.15Depreciation, depletion and amortisation costs 11.73 10.21 6.99 4.88 5.68Total unit costs 53.47 53.21 54.73 37.37 43.83
[A] Unit cash operating cost defi ned as: operating, selling and general expenses plus cash costs items included in cost of goods sold excluding pre-development and centrally allocated costs divided by synthetic crude sales volumes excluding blend stock.
2008 $ MILLION North America South
Europe Asia Oceania Africa USA Other [A] America TotalRevenue
Third parties 6,210 3,764 170 3,104 5,219 1,131 479 20,077Sales between businesses 13,771 13,001 1,440 8,429 5,235 1,573 371 43,820
Total 19,981 16,765 1,610 11,533 10,454 2,704 850 63,897Production costs excluding taxes 2,383 1,331 157 1,207 1,294 750 161 7,283Taxes other than income tax [B] 501 639 258 882 101 – 90 2,471Exploration 414 131 143 300 680 180 147 1,995Depreciation, depletion and amortisation 3,102 1,299 220 1,595 2,166 880 74 9,336Other income/(costs) (440) (2,107) 8 (20) (76) (330) (41) (3,006)Earnings before taxation 13,141 11,258 840 7,529 6,137 564 337 39,806Taxation charge/(credit) 8,391 9,098 205 4,505 2,044 11 287 24,541Earnings after taxation 4,750 2,160 635 3,024 4,093 553 50 15,265
$/BOERevenue 77.53 88.66 34.99 71.91 77.05 63.69 56.79 75.50Production costs excluding taxes 9.25 7.01 3.41 7.53 9.54 17.67 10.76 8.61Taxes other than income tax [B] 1.94 3.38 5.61 5.50 0.74 – 6.01 2.92Exploration 1.61 0.69 3.11 1.87 5.01 4.24 9.82 2.36Depreciation, depletion and amortisation 12.04 6.87 4.78 9.95 15.96 20.73 4.94 11.03Other income/(costs) (1.70) (11.17) 0.17 (0.11) (0.57) (7.77) (2.75) (3.54)Earnings before taxation 50.99 59.54 18.25 46.95 45.23 13.28 22.51 47.04Taxation charge/(credit) 32.56 48.12 4.45 28.09 15.06 0.25 19.17 29.00Earnings after taxation 18.43 11.42 13.80 18.86 30.17 13.03 3.34 18.04
[A] Comprises Canada and Greenland. [B] Includes cash paid royalties to governments outside North America.
OIL SANDS
Shell share of equity-accounted investments
2012–2008 $ MILLIONNorth America South
2012 Europe Asia Oceania[A] Africa USA Other America TotalThird party revenue 6,448 12,592 1,441 – 2,715 – 341 23,537Production costs excluding taxes 411 952 372 – 453 – 41 2,229Taxes other than income tax [B] 3,574 4,861 111 – 157 – 118 8,821Exploration 17 391 155 – 10 – – 573Depreciation, depletion and amortisation 209 1,310 335 – 269 – 41 2,164Other (costs)/income 390 (128) 80 – (13) – (252) 77Earnings before taxation 2,627 4,950 548 – 1,813 – (111) 9,827Taxation 969 1,971 136 – 658 – 26 3,760Earnings after taxation 1,658 2,979 412 – 1,155 – (137) 6,0672011 1,504 2,408 300 – 1342 – – 5,5542010 1,394 1,085 518 – 818 – – 3,8152009 1,509 552 283 – 767 – (203) 2,9082008 2,519 467 535 – 1,281 3 165 4,970
[A] Includes Shell’s ownership of 23% of Woodside Petroleum Ltd as from April 2012 (previously: 24% as from November 2010; 34% before that date), a publicly listed company on the Australian Securities Exchange. We have limited access to data; accordingly, the numbers are estimated.
[B] Includes cash paid royalties to governments outside North America.
65reports.shell.com | Shell Investors’ HandbookUpstream data
103585_SHE_Investors Handbook_V98_Cleaned_JD.indd 65 08-05-13 14:53

PROVED OIL AND GAS RESERVES The tables present oil and gas reserves on a net basis which means that they include the reserves relating to (i) the Shell subsidiaries excluding the reserves attributable to non-controlling interest holders in our subsidiaries and (ii) the Shell share of equity-accounted investments. Proven minable oil sands reserves are reported separately for 2008. As a result of SEC rule changes, these proven minable oil
sands reserves have been converted to synthetic crude oil proved reserves and from 2009 onwards these are included in the proved oil and gas reserves. Moreover, from 2009 onwards bitumen proved reserves are reported separately. In previous years, the bitumen proved reserves were included in the reported proved oil and gas reserves in Canada.
PROVED CRUDE OIL AND NATURAL GAS LIQUIDS, SYNTHETIC CRUDE OIL AND BITUMEN RESERVES FOR SHELL SUBSIDIARIES AND EQUITY-ACCOUNTED INVESTMENTS [A][B][C] (AT DECEMBER 31) MILLION BARRELS
2012 2011 2010 2009 2008Europe 793 754 617 526 491Asia 1,706 1,664 2,080 1,830 1,562Oceania 174 209 109 135 124Africa 672 718 737 725 590North America – USA 903 838 843 710 588North America – Canada
Oil and NGL 33 35 35 38 48Synthetic crude oil 1,763 1,680 1,567 1,599Bitumen 49 55 51 57
South America 87 82 89 57 32Total including year-average/end price effects 6,180 6,035 6,128 5,677 3,435
PROVED NATURAL GAS RESERVES FOR SHELL SUBSIDIARIES AND EQUITY-ACCOUNTED INVESTMENTS [A][B][C][D](AT DECEMBER 31) THOUSAND MILLION SCF
2012 2011 2010 2009 2008Europe 14,168 15,401 15,566 15,835 15,732Asia 16,305 16,943 18,194 19,797 18,791Oceania 6,610 7,094 6,149 6,632 3,100Africa 2,234 2,791 2,981 3,033 1,759North America – USA 2,352 3,259 2,745 2,323 2,402North America – Canada 1,011 2,045 1,308 1,172 1,231South America 99 110 160 243 303Total including year-average/end price effects 42,779 47,643 47,103 49,035 43,318
PROVEN MINABLE OIL SANDS RESERVES (AT DECEMBER 31) MILLION BARRELS 2008 Total including year-end price effects 997
TOTAL PROVED OIL AND GAS RESERVES [A][B][C][E][F] (AT DECEMBER 31) MILLION BOE 2012 2011 2010 2009 2008Europe 3,236 3,409 3,301 3,256 3,203Asia 4,517 4,585 5,217 5,243 4,802Oceania 1,314 1,432 1,169 1,278 659Africa 1,057 1,200 1,250 1,249 893North America – USA 1,309 1,400 1,316 1,111 1,002North America – Canada 2,019 2,123 1,879 1,896 1,257South America 104 101 117 99 84Total including year-average/end price effects 13,556 14,250 14,249 14,132 11,900Year-average/end price effects (431) (235) (198) 260 19
[A] 2009–2012 includes proved reserves associated with future production that will be consumed in operations. These volumes were not included in 2008. [B] Total attributable to Royal Dutch Shell plc shareholders.[C] Year-end price effect for 2008; year-average price effect for 2009–2012.[D] These quantities have not been adjusted to standard heat content.[E] Natural gas volumes are converted to oil equivalent using a factor of 5,800 scf per barrel. Rounding difference may occur in estimate of gas reserves conversion from
scf to boe. [F] Proven minable oil sands included for 2008.
66 Shell Investors’ Handbook | reports.shell.comUpstream data
103585_SHE_Investors Handbook_V98_Cleaned_JD.indd 66 08-05-13 14:53

Changes The tables present changes in the reserves of (i) Shell subsidiaries without deduction of the reserves attributable to non-controlling interest holders in our subsidiaries and (ii) the Shell share of equity-accounted investments. Changes in proven minable oil sands reserves are reported separately for 2008. As a result of SEC rule changes, these proven minable oil sands reserves have been converted to synthetic crude oil proved reserves and from 2009 onwards these are included in the proved oil and gas reserves.
PROVED CRUDE OIL AND NATURAL GAS LIQUIDS, SYNTHETIC CRUDE OIL AND BITUMEN RESERVES CHANGES FOR SHELL SUBSIDIARIES AND EQUITY-ACCOUNTED INVESTMENTS [A][C] (AT DECEMBER 31) MILLION BARRELS
2012 2011 2010 2009 2008Revisions and reclassifi cations 629 190 856 1,205 [B] 242Improved recovery 13 34 66 42 54Extensions and discoveries 88 326 161 617 51Purchases of minerals in place 82 – 59 – 4Sales of minerals in place (66) (37) (57) (1) (65)Total additions including year-average/end price effects 746 513 1,085 1,863 286Production (598) (611) (626) (616) (619)
PROVED NATURAL GAS RESERVES CHANGES FOR SHELL SUBSIDIARIES AND EQUITY-ACCOUNTED INVESTMENTS [A][C][D] (AT DECEMBER 31) THOUSAND MILLION SCF
2012 2011 2010 2009 2008Revisions and reclassifi cations (1,343) 899 829 4,688 4,184Improved recovery 16 3 42 1 –Extensions and discoveries 667 3,504 1,288 4,326 968Purchases of minerals in place 161 – 237 16 448Sales of minerals in place (684) (394) (743) – (19)Total additions including year-average/end price effects (1,183) 4,012 1,653 9,031 5,581Production (3,687) (3,485) (3,573) (3,315) (3,137)
PROVEN MINABLE OIL SANDS RESERVES CHANGES (AT DECEMBER 31) MILLION BARRELS 2008 Revisions and reclassifi cations (85) Extensions and discoveries – Total additions including year-end price effects (85) Production (29)
TOTAL PROVED OIL AND GAS RESERVES CHANGES [A][C][E][F] (AT DECEMBER 31) MILLION BOE 2012 2011 2010 2009 2008Revisions and reclassifi cations 397 345 999 2,013 [B] 878Improved recovery 16 35 73 42 54Extensions and discoveries 203 930 383 1,363 219Purchases of minerals in place 110 – 100 3 81Sales of minerals in place (184) (105) (185) (1) (68)Total additions including year-average/end price effects 542 1,205 1,370 3,420 1,164Year-average/end price effects (431) (235) (198) 260 19Total additions excluding year-average/end price effects 973 1,440 1,568 3,160 1,145Total additions excluding acquisitions and divestments and excluding year-average/end price effects 1,047 1,545 1,653 3,158 1,132Production (1,234) (1,212) (1,242) (1,187) (1,189)
[A] 2009–2012 includes proved reserves associated with future production that will be consumed in operations. These volumes were not included in 2008. [B] Excludes the 997 million barrels of previously booked proven minable oil sands reserves.[C] Year-end price effect for 2008; year-average price effect for 2009–2012.[D] These quantities have not been adjusted to standard heat content.[E] Natural gas volumes are converted to oil equivalent using a factor of 5,800 scf per barrel. Rounding difference may occur in estimate of gas reserves conversion from
scf to boe. [F] Proven minable oil sands included for 2008.
67reports.shell.com | Shell Investors’ HandbookUpstream data
103585_SHE_Investors Handbook_V98_Cleaned_JD.indd 67 08-05-13 14:53

Changes by region 2012
PROVED CRUDE OIL AND NATURAL GAS LIQUIDS, SYNTHETIC CRUDE OIL AND BITUMEN RESERVES CHANGES FOR SHELL SUBSIDIARIES AND EQUITY-ACCOUNTED INVESTMENTS [A] (AT DECEMBER 31) MILLION BARRELS
Europe Asia Oceania Africa North America South
America Total USA Canada Oil and NGL
Oil and NGL
Oil and NGL
Oil and NGL
Oil and NGL
Oil and NGL
Syntheticcrude oil Bitumen
Oil and NGL All products
Revisions and reclassifi cations 19 270 6 95 90 3 131 1 14 629 Improved recovery – 6 – – 7 – – – – 13 Extensions and discoveries 44 4 – 1 30 1 – 1 7 88 Purchases of minerals in place 56 – – – 26 – – – – 82 Sales of minerals in place – – (25) (33) (6) (1) – (1) – (66)Total additions including year- average price effects 119 280 (19) 63 147 3 131 1 21 746 Production (80) (238) (16) (106) (82) (5) (48) (7) (16) (598)
PROVED NATURAL GAS RESERVES CHANGES FOR SHELL SUBSIDIARIES AND EQUITY-ACCOUNTED INVESTMENTS [A][B] THOUSAND MILLION SCF
Europe Asia Oceania Africa North America South
America Total USA Canada Revisions and reclassifi cations (75) 444 151 (142) (1,045) (683) 7 (1,343)Improved recovery – – – – 16 – – 16 Extensions and discoveries 71 26 – 89 393 84 4 667 Purchases of minerals in place 22 – – – 139 – – 161 Sales of minerals in place – – (324) (163) (6) (191) – (684)Total additions including year- average price effects 18 470 (173) (216) (503) (790) 11 (1,183)Production (1,251) (1,112) (311) (343) (404) (244) (22) (3,687)
TOTAL PROVED RESERVES CHANGES FOR SHELL SUBSIDIARIES AND EQUITY-ACCOUNTED INVESTMENTS [ A][ C] MILLION BOE
Europe Asia Oceania Africa North America South
America Total USA Canada Oil, NGL and gas
Oil, NGL and gas
Oil, NGL and gas
Oil, NGL and gas
Oil, NGL and gas
Oil, NGL and gas
Synthetic crude oil Bitumen
Oil, NGL and gas All products
Revisions and reclassifi cations 6 347 33 70 (91) (115) 131 1 15 397 Improved recovery – 6 – – 10 – – – – 16 Extensions and discoveries 57 8 – 16 98 15 – 1 8 203 Purchases of minerals in place 60 – – – 50 – – – – 110 Sales of minerals in place – – (81) (61) (7) (34) – (1) – (184)Total additions including year- average price effects 123 361 (48) 25 60 (134) 131 1 23 542 Year- average price effect (431)Production (296) (430) (70) (165) (151) (47) (48) (7) (20) (1,234)Reserves replacement ratio excluding acquisitions and divestments and year-average price effects 85%Total additions excluding acquisitions and divestments and including year-average price effects 50%Reserves replacement ratio including acquisitions and divestments and year-average price effects 44%
[A] Includes proved reserves associated with volumes consumed in operations.[B] These quantities have not been adjusted to standard heat content.[C] Natural gas volumes are converted to oil equivalent using a factor of 5,800 scf per barrel. Rounding difference may occur in estimate of gas reserves conversion from
scf to boe.
68 Shell Investors’ Handbook | reports.shell.comUpstream data
103585_SHE_Investors Handbook_V98_Cleaned_JD.indd 68 08-05-13 14:53

OIL, GAS, SYNTHETIC CRUDE OIL AND BITUMEN PRODUCTIONCRUDE OIL AND NATURAL GAS LIQUIDS PRODUCTION AVAILABLE FOR SALE [A] THOUSAND B/D
2012 2011 2010 2009 2008 SUBS EAI SUBS EAI SUBS EAI SUBS EAI SUBS EAIEurope
Denmark 73 – 88 – 98 – 107 – 114 –Italy 39 – 35 – 33 – 30 – 32 –Norway 40 – 37 – 48 – 62 – 67 –UK 60 – 71 – 98 – 110 – 154 –Other [B] 3 4 3 5 3 5 3 5 3 5
Total Europe 215 4 234 5 280 5 312 5 370 5Asia
Brunei 2 73 2 76 3 77 2 76 1 80Malaysia 41 – 40 – 40 – 39 – 38 –Oman 205 – 200 – 199 – 195 – 192 –Russia – 104 – 117 – 117 – 106 – 70United Arab Emirates – 145 – 144 – 135 – 127 – 146Other [B] 59 23 40 20 29 1 42 1 51 1
Total Asia 307 345 282 357 271 330 278 310 282 297Total Oceania 27 18 30 18 30 29 30 35 29 39Africa
Gabon 38 – 44 – 34 – 29 – 30 –Nigeria 240 – 262 – 302 – 231 – 266 –Other [B] 12 – 20 – 20 – 24 – 22 –
Total Africa 290 – 326 – 356 – 284 – 318 –North America
USA 155 67 141 70 163 74 195 78 190 82Other [B] 15 – 18 – 20 – 20 – 46[C] –
Total North America 170 67 159 70 183 74 215 78 236 82South America
Brazil 34 – 45 – 53 – 24 – 23 –Other [B] 1 10 1 9 1 7 1 9 1 11
Total South America 35 10 46 9 54 7 25 9 24 11Total 1,044 444 1,077 459 1,174 445 1,144 437 1,259 434
[A] Includes natural gas liquids. Royalty purchases are excluded. Refl ects 100% of production attributable to subsidiaries except in respect of PSCs, where the fi gures shown represent the entitlement of the subsidiaries concerned under those contracts.
[B] Comprises countries where 2012 production was lower than 20 thousand b/d or where specifi c disclosures are prohibited.[C] Includes bitumen production.
69reports.shell.com | Shell Investors’ HandbookUpstream data
103585_SHE_Investors Handbook_V98_Cleaned_JD.indd 69 08-05-13 14:53

NATURAL GAS PRODUCTION AVAILABLE FOR SALE [A] MILLION SCF/D 2012 2011 2010 2009 2008
SUBS EAI SUBS EAI SUBS EAI SUBS EAI SUBS EAIEurope
Denmark 202 – 256 – 328 – 335 – 406 –Germany 217 – 253 – 267 – 311 – 333 –The Netherlands – 1,808 – 1,767 – 1,997 – 1,639 – 1,741Norway 713 – 618 – 643 – 593 – 492 –UK 328 – 403 – 541 – 561 – 678 –Other [B] 43 – 41 – 38 – 31 – 29 –
Total Europe 1,503 1,808 1,571 1,767 1,817 1,997 1,831 1,639 1,938 1,741Asia
Brunei 51 512 52 524 55 497 44 473 51 499China 131 – 174 – 253 – 257 – 231 –Malaysia 572 – 763 – 807 – 886 – 874 –Russia – 374 – 382 – 359 – 192 – –Other [B] 795 317 363 246 209 – 217 – 205 –
Total Asia 1,549 1,203 1,352 1,152 1,324 856 1,404 665 1,361 499Oceania
Australia 352 243 373 167 404 204 383 216 345 215New Zealand 182 – 175 – 202 – 218 – 216 –
Total Oceania 534 243 548 167 606 204 601 216 561 215Africa
Egypt 141 – 133 – 137 – 163 – 145 –Nigeria 740 – 707 – 587 – 292 – 552 –
Total Africa 881 – 840 – 724 – 455 – 697 –North America
USA 1,062 5 961 6 1,149 4 1,055 6 1,048 5Canada 616 – 570 – 563 – 530 – 406 –
Total North America 1,678 5 1,531 6 1,712 4 1,585 6 1,454 5Total South America 44 1 51 1 61 – 81 – 98 –Total 6,189 3,260 5,893 3,093 6,244 3,061 5,957 2,526 6,109 2,460
[A] Refl ects 100% of production attributable to subsidiaries except in respect of PSCs, where the fi gures shown represent the entitlement of the subsidiaries concerned under those contracts.
[B] Other comprises countries where 2012 production was lower than 115 million scf/d or where specifi c disclosures are prohibited.
70 Shell Investors’ Handbook | reports.shell.comUpstream data
103585_SHE_Investors Handbook_V98_Cleaned_JD.indd 70 08-05-13 14:53

TOTAL PRODUCTION AVAILABLE FOR SALE [A][B] THOUSAND BOE/D 2012 2011 2010 2009 2008
SUBS EAI SUBS EAI SUBS EAI SUBS EAI SUBS EAIEurope
Denmark 108 – 132 – 155 – 164 – 184 –Germany 40 – 47 – 49 – 57 – 60 –Italy 46 – 42 – 40 – 35 – 37 –The Netherlands – 316 – 310 – 349 – 287 – 305Norway 163 – 144 – 159 164 – 152 –UK 117 – 140 – 191 – 207 – 271 –
Total Europe 474 316 505 310 594 349 627 287 704 305Asia
Brunei 11 161 11 166 12 163 10 157 10 166China 22 – 30 – 48 – 56 – 54 –Malaysia 140 – 172 – 179 – 192 – 189 –Oman 205 – 200 – 199 – 195 – 192 –Russia – 168 – 183 – 179 – 139 – 70United Arab Emirates – 145 – 144 – 135 – 127 – 146Other [C] 196 78 102 62 61 1 68 1 72 1
Total Asia 574 552 515 555 499 478 521 424 517 383Oceania
Australia 79 60 84 47 88 65 85 72 77 76New Zealand 40 – 40 – 47 – 49 – 49 –
Total Oceania 119 60 124 47 135 65 134 72 126 76Africa
Egypt 36 – 43 – 44 – 53 – 47 –Gabon 38 – 44 – 34 – 29 – 30 –Nigeria 368 – 384 – 403 – 281 – 361 –
Total Africa 442 – 471 – 481 – 363 – 438 –North America
USA 338 68 307 71 361 74 377 79 370 83Canada 121 – 116 – 117 – 111 – 116[D] –
Total North America 459 68 423 71 478 74 488 79 486 83South America
Brazil 35 – 46 – 54 – 27 – 29 –Other [C] 8 10 9 9 10 7 12 9 12 11
Total South America 43 10 55 9 64 7 39 9 41 11Total oil and gas production 2,111 1,006 2,093 992 2,251 973 2,172 871 2,312 858Synthetic oil production 125 – 115 – 72 – 80 – – –Bitumen production 20 – 15 – 18 – 19 – – –Mined oil sands production – – – – – – – – 78 –Grand total 2,256 1,006 2,223 992 2,341 973 2,271 871 2,390 858
[A] Natural gas volumes are converted to oil equivalent using a factor of 5,800 scf per barrel. [B] Includes natural gas liquids. Royalty purchases are excluded. Refl ects 100% of production attributable to subsidiaries except in respect of PSCs, where the fi gures
shown represent the entitlement of the subsidiaries concerned under those contracts. [C] Other comprises countries where 2012 production was lower than 20 thousand boe/d or where specifi c disclosures are prohibited.[D] Includes bitumen production.
71reports.shell.com | Shell Investors’ HandbookUpstream data
103585_SHE_Investors Handbook_V98_Cleaned_JD.indd 71 08-05-13 14:53

ACREAGE AND WELLS
OIL AND GAS ACREAGE (AT DECEMBER 31) THOUSAND ACRES2012 2011
Developed Undeveloped Developed Undeveloped Gross Net Gross Net Gross Net Gross NetEurope 9,091 2,659 5,844 1,964 9,016 2,586 6,688 2,376Asia 26,989 9,400 53,460 26,604 27,268 9,810 48,554 25,779Oceania 1,703 467 70,575 26,469 1,798 500 67,907 26,326Africa 5,428 2,299 30,404 23,460 6,060 2,465 20,706 15,364North America – USA 1,837 1,176 8,878 6,990 1,592 984 7,815 6,140North America – Other [A] 1,181 785 36,179 27,349 1,101 757 31,573 23,849South America 162 76 17,242 9,668 162 76 20,655 8,905Total 46,391 16,862 222,582 122,504 46,997 17,178 203,898 108,739
[A] Comprises Canada and Greenland. Greenland acreage has been reclassifi ed from Europe to North America – Other at December 31, 2010.
NUMBER OF PRODUCTIVE WELLS [A] (AT DECEMBER 31) 2012 2011
Oil Gas Oil Gas Gross Net Gross Net Gross Net Gross NetEurope 1,431 425 1,266 398 1,454 427 1,317 430Asia 7,200 2,316 243 116 7,361 2,352 289 162Oceania 48 5 574 217 48 5 557 212Africa 837 324 95 62 883 357 98 65North America – USA 15,108 7,630 4,618 2,808 14,993 7,607 3,449 2,222North America – Canada 460 393 1,165 880 476 406 1,115 906South America 73 29 7 2 67 33 7 2Total 25,157 11,122 7,968 4,483 25,282 11,187 6,832 3,999
[A] The number of productive wells with multiple completions (more than one formation producing into the same well bore) was 1,923 gross at December 31,2012 (net 696); 2011: 1,997 gross (net 739); 2010: 2,011 gross (net 779).
NUMBER OF NET PRODUCTIVE WELLS AND DRY HOLES DRILLED (AT DECEMBER 31)2012 2011
Productive Dry Productive DryExploratory [A]
Europe 1 1 1 1Asia 3 4 6 97Oceania – 1 – 2Africa 3 7 3 5North America – USA 124 3 70 2North America – Canada 37 9 21 4South America – 1 1 1
Total 168 26 102 112Development
Europe 9 – 12 1Asia 255 4 196 8Oceania 7 – – –Africa 25 – 23 2North America – USA 352 – 347 2North America – Canada 49 2 102 1South America 1 – 1 –
Total 698 6 681 14
[A] Productive wells are wells with proved reserves allocated.
The tables below refl ect Shell subsidiaries and equity-accounted investments acreage and wells. The term “gross” refers to the total activity in which Shell subsidiaries and equity-accounted
investments have an interest. The term “net” refers to the sum of the fractional interests owned by Shell subsidiaries plus the Shell share of equity-accounted investments’ fractional interests.
72 Shell Investors’ Handbook | reports.shell.comUpstream data
103585_SHE_Investors Handbook_V98_Cleaned_JD.indd 72 08-05-13 14:53

OIL AND GAS ACREAGE (AT DECEMBER 31) THOUSAND ACRES2010 2009 2008
Developed Undeveloped Developed Undeveloped Developed Undeveloped Gross Net Gross Net Gross Net Gross Net Gross Net Gross NetEurope 8,983 2,550 8,165 3,265 9,045 2,592 9,770 3,653 9,646 2,785 8,924 3,038Asia 27,496 9,970 41,781 22,800 30,969 11,108 78,382 40,547 31,252 11,260 74,749 36,811Oceania 2,274 553 81,748 24,413 2,276 568 82,945 24,326 2,146 552 79,548 23,052Africa 6,701 2,424 23,327 17,079 7,393 2,615 27,096 18,656 7,314 2,582 26,959 20,289North America – USA 1,568 952 7,003 5,834 1,030 597 6,250 5,027 1,009 593 6,238 4,973North America – Other 1,002 664 31,501 21,489 966 628 26,712 19,448 1,025 707 27,792 19,546South America 162 76 15,878 6,588 126 59 18,081 7,178 115 53 4,387 1,877Total 48,186 17,189 209,403 101,468 51,805 18,167 249,236 118,835 52,507 18,532 228,597 109,586
NUMBER OF PRODUCTIVE WELLS (AT DECEMBER 31) 2010 2009 2008
Oil Gas Oil Gas Oil Gas Gross Net Gross Net Gross Net Gross Net Gross Net Gross NetEurope 1,464 412 1,341 443 1,544 423 1,343 446 1,569 422 1,323 440Asia 7,236 2,382 298 164 6,751 2,250 207 99 6,043 2,038 200 95Oceania 39 4 608 211 39 6 566 122 42 9 319 60Africa 1,180 447 89 59 1,150 415 80 53 1,163 420 79 49North America – USA 15,322 7,771 3,884 2,457 15,425 7,835 1,640 1,170 15,505 7,828 1,412 1,037North America – Canada 433 370 1,007 764 446 382 947 713 429 365 888 665South America 73 34 6 1 72 32 12 5 68 29 12 5Total 25,747 11,420 7,233 4,099 25,427 11,343 4,795 2,608 24,819 11,111 4,233 2,351
NUMBER OF NET PRODUCTIVE WELLS AND DRY HOLES DRILLED (AT DECEMBER 31) 2010 2009 2008
Productive Dry Productive Dry Productive DryExploratory
Europe 2 4 4 3 6 3Asia 8 28 30 10 20 4Oceania – 2 1 3 – 2Africa 8 5 7 4 6 4North America – USA 75 5 16 2 7 4North America – Canada 29 8 21 19 17 46South America 1 1 1 – – 1
Total 123 53 80 41 56 64Development
Europe 20 1 15 – 7 1Asia 269 4 260 3 210 1Oceania 3 – 27 – 3 –Africa 11 – 12 1 17 1North America – USA 388 – 424 1 475 1North America – Canada 34 – 45 – 59 –South America 1 – 5 – 2 –
Total 726 5 788 5 773 4
73reports.shell.com | Shell Investors’ HandbookUpstream data
103585_SHE_Investors Handbook_V98_Cleaned_JD.indd 73 08-05-13 14:53

LNG REGASIFICATION TERMINALS (AT DECEMBER 31, 2012)Project name Location Shell capacity rights (mtpa) Capacity right period Status Shell interest (%) Start-up dateAltamira Tamaulipas, Mexico 3.3[A] from 2006 In operation Leased 2006Barcelona Barcelona, Spain 0.1 2010–2020[B] In operation Leased 1969Costa Azul Baja California, Mexico 2.9 2008–2028 In operation Leased 2008Cove Point Lusby, MD, USA 1.8 2003–2023 In operation Leased 2003Elba Expansion Elba Island, GA, USA 4.2 2010–2035 In operation Leased 2010Elba Island Elba Island, GA, USA 2.8 2006–2036 In operation Leased 2006Hazira Gujarat, India 2.2[C] from 2005 In operation 74 2005Hazira Expansion Gujarat, India 1.5[C] from 2013 Under construction 74 2013
[A] 100% capacity rights are held by Gas del Litoral JV with which Shell has a contract to supply 75% of the volumes.[B] Capacity rights have a cancellation notice period of three months. [C] 100% capacity rights are held by Hazira JV with which Shell has a contract to supply 74% of the volumes.
LNG AND GTL
LNG LIQUEFACTION PLANTS IN OPERATION (AT DECEMBER 31, 2012)
Shell interest Location (%)
100% capacity[A] (mtpa)[B]
Australia North West Shelf Karratha 21 16.3Australia Pluto 1 Karratha 21[C] 4.3Brunei LNG Lumut 25 7.8Malaysia LNG (Dua and Tiga) Bintulu 15 17.3[D]Nigeria LNG Bonny 26 22.0Oman LNG Sur 30 7.1Qalhat (Oman) LNG Sur 11 3.7Qatargas 4 Ras Laffan 30 7.8Sakhalin LNG Prigorodnoye 27.5 9.6
[A] Interest may be held via indirect shareholding.[B] As reported by the operator.[C] Based on 90% Woodside shareholding in the Pluto 1 plant.[D] Our interests in Dua and Tiga plants are due to expire in 2015 and 2023
respectively.
SHELL SHARE OF LNG SALES VOLUMES MILLION TONNES 2012 2011 2010 2009 2008Australia 3.6 3.1 3.4 3.2 2.6Brunei 1.7 1.7 1.7 1.6 1.8Malaysia 2.5 2.4 2.4 2.2 2.3Nigeria 5.1 5.0 4.5 2.9 4.2Oman 1.9 2.0 2.0 2.1 2.2Qatar 2.4 1.7 – – –Sakhalin 3.0 2.9 2.8 1.4 –Total 20.2 18.8 16.8 13.4 13.1
LNG LIQUEFACTION PLANTS UNDER CONSTRUCTION (AT DECEMBER 31, 2012)
LocationShell interest
(%)100% capacity
(mtpa)Gorgon Barrow Island 25.0 15.3Prelude Offshore Australia 72.5[A] 3.6Wheatstone Onslow 6.4 8.9
[A] We divested a further 5% interest in Prelude during the fi rst quarter 2013, reducing our interest to 67.5%.
GTL PLANTS IN OPERATION (AT DECEMBER 31, 2012)
Country Shell interest
(%)100% capacity
(b/d)Bintulu Malaysia 72 14,700Pearl Qatar 100 140,000
74 Shell Investors’ Handbook | reports.shell.comUpstream data
103585_SHE_Investors Handbook_V98_Cleaned_JD.indd 74 08-05-13 14:53

REFINERY AVAILABILITY % 2012 2011 2010 2009 2008Average worldwide 93 92 92 93 91
COST OF CRUDE OIL PROCESSED OR CONSUMED [A] $/B 2012 2011 2010 2009 2008Total 106.82 104.71 77.22 58.96 94.05
CRUDE DISTILLATION CAPACITY [B] THOUSAND B/CALENDAR DAY [C] 2012 2011 2010 2009 2008Europe 1,243 1,243 1,501 1,519 1,601Asia-Pacifi c 822 861 855 853 861Americas 1,212 1,064 1,155 1,185 1,154Other 82 83 82 82 82Total 3,360 3,251 3,594 3,639 3,698
OIL PRODUCTS – CRUDE OIL PROCESSED [D] THOUSAND B/D 2012 2011 2010 2009 2008Europe 1,069 1,058 1,306 1,323 1,428Asia-Pacifi c 704 731 729 593 790Americas 1,024 985 1,007 1,013 1,073Other 220 200 222 214 203Total 3,017 2,974 3,264 3,143 3,494
REFINERY PROCESSING INTAKE [E] THOUSAND B/D 2012 2011 2010 2009 2008Crude oil 2,620 2,652 2,939 2,819 3,122Feedstocks 199 193 258 248 266 2,819 2,845 3,197 3,067 3,388Europe 970 1,041 1,314 1,330 1,481Asia-Pacifi c 670 666 650 532 656Americas 1,117 1,075 1,158 1,141 1,178Other 62 63 75 64 73Total 2,819 2,845 3,197 3,067 3,388
REFINERY PROCESSING OUTTURN [ F] THOUSAND B/D 2012 2011 2010 2009 2008Gasolines 995 993 1,224 1,179 1,229Kerosines 321 339 354 341 375Gas/diesel oils 996 977 1,074 1,025 1,145Fuel oil 256 252 315 279 315Other products 452 385 442 432 471Total 3,020 2,946 3,409 3,256 3,535
[A] Includes Upstream margin on crude oil supplied by Shell and equity-accounted investment exploration and production companies.[B] Average operating capacity for the year, excluding mothballed capacity.[C] Calendar day capacity is the maximum sustainable capacity adjusted for normal unit down time. [D] Includes natural gas liquids, share of equity-accounted investments and processing for others.[E] Includes crude oil, natural gas liquids and feedstocks processed in crude oil distillation units and in secondary conversion units.[F] Excludes “own use” and products acquired for blending purposes.
OIL PRODUCTS AND REFINING LOCATIONS
DOWNSTREAM DATA
The tables below refl ect Shell subsidiaries, the 50% Shell interest in Motiva in the USA and instances where Shell owns the crude
or feedstock processed by a refi nery. Other equity-accounted investments are only included where explicitly stated.
75reports.shell.com | Shell Investors’ HandbookDownstream data
103585_SHE_Investors Handbook_V98_Cleaned_JD.indd 75 08-05-13 14:53

REFINERIES IN OPERATION (AT DECEMBER 31, 2012) Thousand b/calendar day, 100% capacity[B]
Location Asset classShell
interest % Crude distillation
[A] capacityThermal cracking/
visbreaking/cokingCatalyticcracking
Hydro- cracking
Europe Czech Republic Kralupy [C] 16 59 – 24 –
Litvinov [C] 16 101 14 – 30Denmark Fredericia l 100 63 40 – –Germany Harburg l 100 108 14 15 –
Miro [C] 32 310 65 89 –Rheinland nl 100 327 57 – 79Schwedt [C] 38 220 47 50 –
The Netherlands Pernis nl 90 404 45 48 81Norway Mongstad [C] l 21 205 23 55 –
Asia-Pacifi c Australia Geelong u 100 118 – 38 –Japan Mizue (Toa) [C] ul 18 60 23 38 –
Yamaguchi [C] u 13 110 – 25 –Yokkaichi [C] ul 26 193 – 55 –
Malaysia Port Dickson u 51 107 – 39 –Pakistan Karachi [C] 30 43 – – –Philippines Tabangao 67 96 31 – –Singapore Pulau Bukom nl 100 462 63 34 55Turkey Batman [C] 1 23 – – –
Izmir [C] 1 217 17 14 18Izmit [C] 1 217 – 13 25
Kirikale [C] 1 106 – – 16Americas
Argentina Buenos Aires ul 100 100 18 20 –Canada Alberta Scotford u 100 92 – – 62 Ontario Sarnia u 100 71 5 19 9USA California Martinez l 100 145 42 65 37 Louisiana Convent [C] u 50 227 – 82 45
Norco [C] n 50 229 25 107 34 Texas Deer Park nl 50 312 79 63 53
Port Arthur [C] l 50 569 138 81 67 Washington Puget Sound ul 100 137 23 52 –
Other Saudi Arabia Al Jubail [C] ul 50 292 62 – 45South Africa Durban [C] u 38 165 23 34 –
[A] Shell interest rounded to nearest whole percentage point; Shell share of production capacity may differ.[B] Calendar day capacity is the maximum sustainable capacity adjusted for normal unit downtime.[C] Not operated by Shell.
n Integrated refi nery and chemical complex. l Refi nery complex with cogeneration capacity. u Refi nery complex with chemical unit(s).
76 Shell Investors’ Handbook | reports.shell.comDownstream data
103585_SHE_Investors Handbook_V98_Cleaned_JD.indd 76 08-05-13 14:53

OIL SALES AND RETAIL SITESOIL PRODUCT SALES VOLUMES [A] THOUSAND B/D
2012 2011 2010 2009 2008Europe
Gasolines 450 467 505 520 531Kerosines 234 261 299 267 294Gas/diesel oils 909 876 953 1,003 1,148Fuel oil 180 227 205 210 343Other products 184 192 227 242 249
Total 1,957 2,023 2,189 2,242 2,565Asia-Pacifi c
Gasolines 319 315 308 303 298Kerosines 176 164 172 159 166Gas/Diesel oils 445 423 370 337 330Fuel oil 304 273 301 187 196Other products 227 220 224 214 191
Total 1,471 1,395 1,375 1,200 1,181Americas
Gasolines 1,123 1,136 1,128 1,107 1,091Kerosines 264 265 270 246 256Gas/Diesel oils 528 461 523 465 543Fuel oil 89 91 90 130 117Other products 233 236 249 208 241
Total 2,237 2,189 2,260 2,156 2,248Other
Gasolines 184 156 174 141 131Kerosines 60 93 86 69 76Gas/Diesel oils 230 236 253 226 233Fuel oil 64 60 75 77 86Other products 32 44 48 45 48
Total 570 589 636 558 574Total product sales [B][C]
Gasolines 2,076 2,074 2,115 2,071 2,051Kerosines 734 783 827 741 792Gas/diesel oils 2,112 1,996 2,099 2,031 2,254Fuel oil 637 651 671 604 742Other products 676 692 748 709 729
Total 6,235 6,196 6,460 6,156 6,568
[A] Excludes deliveries to other companies under reciprocal sale and purchase arrangements, which are in the nature of exchanges. Sales of condensate and natural gas liquids are included.
[B] Certain contracts are held for trading purposes and reported net rather than gross. The effect in 2012 was a reduction in oil product sales of approximately 856 thousand b/d (2011: 925 thousand b/d; 2010: 934 thousand b/d; 2009: 739 thousand b/d; 2008: 698 thousand b/d).
[C] Export sales as a percentage of total oil products sales volumes amounted to 27.9% in 2012 (2011: 26.0%; 2010: 24.1%; 2009: 20.0%; 2008: 20.7%).
SALES BY PRODUCT AS PERCENTAGE OF TOTAL PRODUCT SALES %
2012 2011 2010 2009 2008Gasolines 33.3 33.5 32.7 33.7 31.2Kerosines 11.8 12.6 12.8 12.0 12.1Gas/diesel oils 33.9 32.2 32.5 33.0 34.3Fuel oil 10.2 10.5 10.4 9.8 11.3Other products 10.8 11.2 11.6 11.5 11.1Total 100.0 100.0 100.0 100.0 100.0
BRANDED RETAIL SITES YEAR-END NUMBER 2012 2011 2010 2009 2008Europe 10,470 10,417 10,863 11,406 11,605Asia-Pacifi c 9,171 9,489 9,784 9,624 10,115Americas 22,322 22,359 20,141 20,691 20,500Other 2,089 2,001 2,028 2,191 2,385Total 44,052 44,266 42,816 43,912 44,605
77reports.shell.com | Shell Investors’ HandbookDownstream data
103585_SHE_Investors Handbook_V98_Cleaned_JD.indd 77 08-05-13 14:53

CHEMICAL PLANT AVAILABILITY % 2012 2011 2010 2009 2008Average worldwide 91 89 94 92 94
CHEMICALS SALES VOLUMES [A] THOUSAND TONNES 2012 2011 2010 2009 2008Europe
Base chemicals 3,771 4,006 4,507 4,610 5,531First-line derivatives and others 2,626 2,689 2,795 2,776 2,941
Total 6,397 6,695 7,302 7,386 8,472Asia-Pacifi c
Base chemicals 2,209 2,027 2,209 1,837 1,726First-line derivatives and others 3,053 3,111 3,415 2,518 2,585
Total 5,262 5,138 5,624 4,355 4,311Americas
Base chemicals 3,336 3,405 3,949 3,396 4,156First-line derivatives and others 3,145 3,193 3,134 2,698 2,774
Total 6,481 6,598 7,083 6,094 6,930Other
Base chemicals 379 229 461 323 160First-line derivatives and others 150 171 183 153 454
Total 529 400 644 476 614Total product sales
Base chemicals 9,695 9,667 11,126 10,166 11,573First-line derivatives and others 8,974 9,164 9,527 8,145 8,754
Total 18,669 18,831 20,653 18,311 20,327
[A] Excludes volumes sold by equity-accounted investments, chemical feedstock trading and by-products.
ETHYLENE CAPACITY [A] 2012 2011 2010 2009 2008Europe 1,659 1,659 1,878 1,880 1,880Asia-Pacifi c 1,556 1,556 1,565 681 950Americas 2,212 2,212 2,212 2,255 2,631Other 366 366 366 366 366Total 5,793 5,793 6,021 5,182 5,827
[A] Includes the Shell share of equity-accounted investments’ capacity entitlement (offtake rights), which may be different from nominal equity interest. Nominal capacity is quoted as at December 31.
CHEMICAL PRODUCTS AND THEIR MAJOR APPLICATIONSProduct group Some typical end usesBase chemicals: ethylene, propylene and aromatics
Feedstock for petrochemical derivatives typically used for: polyethylene fi lm for packaging, carrier bags, polypropylene for moulded plastic buckets, food
containers, polyvinyl chloride (PVC) for drainpipesEthylene oxide/glycols (EO/G) Brake fl uids, polyethylene terephthalate (PET) plastics, polyester, packaging, antifreezeHigher olefi ns and derivatives (HODer) Sunscreen, shower gel, automobile interiors, wire insulation, detergentsStyrene monomer Polystyrene, fridge insulation, tyres, food containers, crash helmets, fi lm sceneryPropylene oxide and derivatives Insulation, foam for bedding and car interiors, engineering plastics, aeroplane de-icers, cosmeticsSolvents Pharmaceuticals, paints, mining and metalworking fl uids, adhesives, inks, hand sanitisersPhenol Plywood, kitchen worktops, fi breglass boats, car parts, CDs, circuit boards
CHEMICALS AND MANUFACTURING LOCATIONS
78 Shell Investors’ Handbook | reports.shell.comDownstream data
103585_SHE_Investors Handbook_V98_Cleaned_JD.indd 78 08-05-13 14:53

MAJOR CHEMICAL PLANTS IN OPERATION [A] (AT DECEMBER 31, 2012) THOUSAND TONNES/YEAR
Location Ethylene Styrene monomer Ethylene glycol Higher olefi ns[B] Additional products[C]Europe
Germany Rheinland 272 – – – AThe Netherlands Moerdijk 972 789 155 – A, IUK Mossmorran [D] 415 – – – – Stanlow [D] – – – 330 I
Asia-Pacifi cChina Nanhai [D] 475 320 175 – A, I, PJapan Yamaguchi [D] – – – 11 A, ISingapore Jurong Island 281 720 940 – A, I, P, O Pulau Bukom 800 – – – A, I
AmericasCanada Scotford – 450 450 – A, IUSA Deer Park 836 – – – A, I
Geismar – – 375 920 I Norco 1,376 – – – A
OtherSaudi Arabia Al Jubail [D] 366 400 – – A, O
Total 5,793 2,679 2,095 1,261
[A] Includes joint-venture plants, with the exception of the Infi neum additives joint ventures.[B] Higher olefi ns are linear alpha and internal olefi ns (products range from C6-C2024).[C] A: Aromatics/ lower olefi ns. I: Intermediates. P: Polyethylene, polypropylene. O: Other.[D] Not operated by Shell.
OTHER CHEMICAL LOCATIONS Location Products[A]Europe
Germany Harburg IKarlsruhe ASchwedt A
The Netherlands Pernis A, I, OAsia-Pacifi c
Australia Geelong A, IJapan Kawasaki A, I
Yokkaichi AMalaysia Bintulu I Port Dickson A
AmericasArgentina Buenos Aires ICanada Sarnia A, IUSA Martinez O
Mobile A Puget Sound O
OtherSouth Africa Durban I
[A] A: Aromatics/ lower olefi ns. I: Intermediates. O: Other.
79reports.shell.com | Shell Investors’ HandbookDownstream data
103585_SHE_Investors Handbook_V98_Cleaned_JD.indd 79 08-05-13 14:53

SHARE PRICESEuronext Amsterdam
A sharesNew York Stock Exchange
A ADSsHigh
€Low
€Year -end
€High
$Low
$Year -end
$2008 29.63 16.25 18.75 88.73 41.62 52.942009 21.46 15.27 21.10 63.75 38.29 60.112010 25.28 19.53 24.73 68.54 49.16 66.782011 28.40 20.12 28.15 77.96 57.97 73.09 2012 29.18 24.30 25.98 74.51 60.62 68.95
London Stock ExchangeB shares
New York Stock ExchangeB ADSs
Highpence
Lowpence
Year -endpence
High$
Low$
Year -end$
2008 2,245 1,223 1,726 87.54 41.41 51.432009 1,897 1,315 1,812 62.26 37.16 58.132010 2,149 1,550 2,115 68.32 47.12 66.672011 2,476 1,768 2,454 78.75 58.42 76.01 2012 2,499 2,020 2,175 77.52 63.05 70.89
SHARE INFORMATION
ADDITIONAL INVESTOR INFORMATION
Dec 12Dec 11Dec 10Dec 09Dec 08Dec 07
€150
€125
€100
€75
€50
RDSAEuronext 100Value of hypothetical €100 holding
RDSA VERSUS EURONEXT 100
Dec 12Dec 11Dec 10Dec 09Dec 08Dec 07
RDSBFTSE 100
£150
£50
Value of hypothetical £100 holding
RDSB VERSUS FTSE 100
£125
£100
£75
The following table shows the high, low and year-end prices of the Company’s registered ordinary shares:
§ of €0.07 nominal value on the London Stock Exchange;§ of €0.07 nominal value on Euronext Amsterdam; and§ in the form of ADSs on the New York Stock Exchange (ADSs do
not have a nominal value).
HISTORICAL TSR PERFORMANCE OF ROYAL DUTCH SHELL PLC
Growth in the value of a hypothetical €100 holding and £100 holding over fi ve years. Euronext 100 and FTSE 100 comparison based on 30 trading day average values.
103585_SHE_Investors Handbook_V98_Cleaned_JD.indd 80 08-05-13 14:53
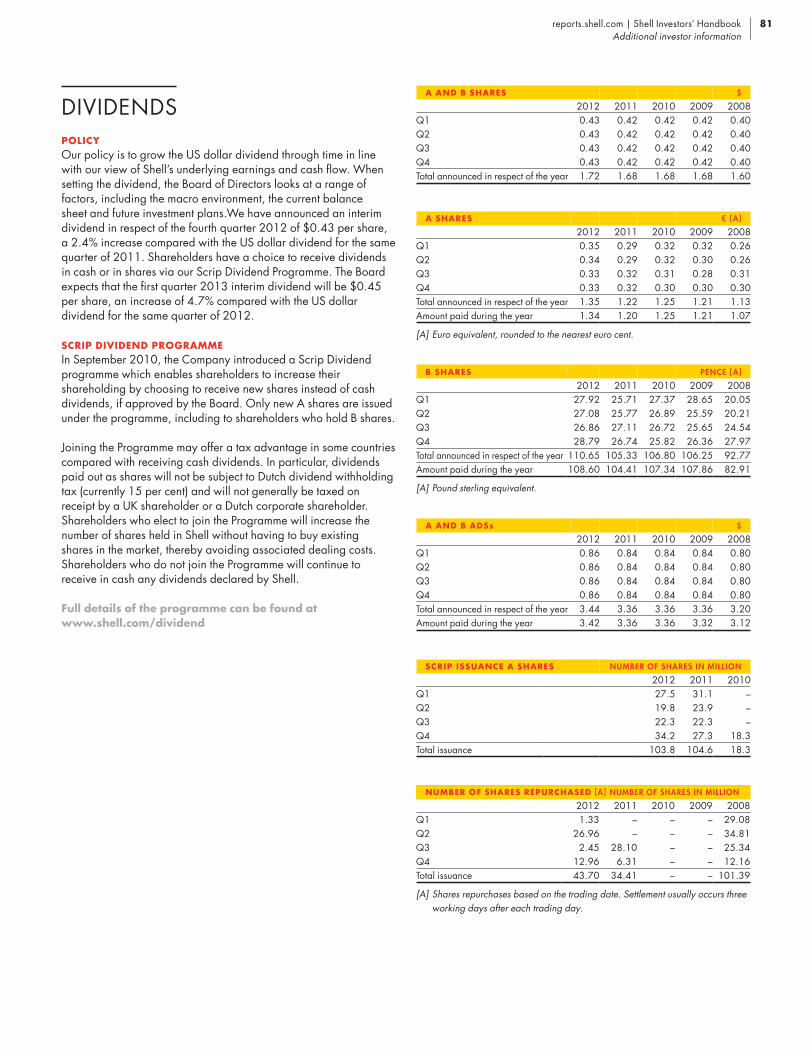
POLICYOur policy is to grow the US dollar dividend through time in line with our view of Shell’s underlying earnings and cash fl ow. When setting the dividend, the Board of Directors looks at a range of factors, including the macro environment, the current balance sheet and future investment plans.We have announced an interim dividend in respect of the fourth quarter 2012 of $0.43 per share, a 2.4% increase compared with the US dollar dividend for the same quarter of 2011. Shareholders have a choice to receive dividends in cash or in shares via our Scrip Dividend Programme. The Board expects that the fi rst quarter 2013 interim dividend will be $0.45 per share, an increase of 4.7% compared with the US dollar dividend for the same quarter of 2012.
SCRIP DIVIDEND PROGRAMMEIn September 2010, the Company introduced a Scrip Dividend programme which enables shareholders to increase their shareholding by choosing to receive new shares instead of cash dividends, if approved by the Board. Only new A shares are issued under the programme, including to shareholders who hold B shares.
Joining the Programme may offer a tax advantage in some countries compared with receiving cash dividends. In particular, dividends paid out as shares will not be subject to Dutch dividend withholding tax (currently 15 per cent) and will not generally be taxed on receipt by a UK shareholder or a Dutch corporate shareholder. Shareholders who elect to join the Programme will increase the number of shares held in Shell without having to buy existing shares in the market, thereby avoiding associated dealing costs. Shareholders who do not join the Programme will continue to receive in cash any dividends declared by Shell.
Full details of the programme can be found at www.shell.com/dividend
SCRIP ISSUANCE A SHARES NUMBER OF SHARES IN MILLION 2012 2011 2010Q1 27.5 31.1 –Q2 19.8 23.9 –Q3 22.3 22.3 –Q4 34.2 27.3 18.3Total issuance 103.8 104.6 18.3
NUMBER OF SHARES REPURCHASED [A] NUMBER OF SHARES IN MILLION 2012 2011 2010 2009 2008Q1 1.33 – – – 29.08Q2 26.96 – – – 34.81Q3 2.45 28.10 – – 25.34Q4 12.96 6.31 – – 12.16 Total issuance 43.70 34.41 – – 101.39
[A] Shares repurchases based on the trading date. Settlement usually occurs three working days after each trading day.
DIVIDENDSA AND B SHARES $
2012 2011 2010 2009 2008Q1 0.43 0.42 0.42 0.42 0.40Q2 0.43 0.42 0.42 0.42 0.40Q3 0.43 0.42 0.42 0.42 0.40Q4 0.43 0.42 0.42 0.42 0.40Total announced in respect of the year 1.72 1.68 1.68 1.68 1.60
A SHARES € [A] 2012 2011 2010 2009 2008Q1 0.35 0.29 0.32 0.32 0.26Q2 0.34 0.29 0.32 0.30 0.26Q3 0.33 0.32 0.31 0.28 0.31Q4 0.33 0.32 0.30 0.30 0.30Total announced in respect of the year 1.35 1.22 1.25 1.21 1.13Amount paid during the year 1.34 1.20 1.25 1.21 1.07
[A] Euro equivalent, rounded to the nearest euro cent.
B SHARES PENCE [A] 2012 2011 2010 2009 2008Q1 27.92 25.71 27.37 28.65 20.05Q2 27.08 25.77 26.89 25.59 20.21Q3 26.86 27.11 26.72 25.65 24.54Q4 28.79 26.74 25.82 26.36 27.97Total announced in respect of the year 110.65 105.33 106.80 106.25 92.77Amount paid during the year 108.60 104.41 107.34 107.86 82.91
[A] Pound sterling equivalent.
A AND B AD Ss $ 2012 2011 2010 2009 2008Q1 0.86 0.84 0.84 0.84 0.80Q2 0.86 0.84 0.84 0.84 0.80Q3 0.86 0.84 0.84 0.84 0.80Q4 0.86 0.84 0.84 0.84 0.80Total announced in respect of the year 3.44 3.36 3.36 3.36 3.20Amount paid during the year 3.42 3.36 3.36 3.32 3.12
81reports.shell.com | Shell Investors’ HandbookAdditional investor information
103585_SHE_Investors Handbook_V98_Cleaned_JD.indd 81 08-05-13 14:54

BONDHOLDER INFORMATION
CREDIT RATINGS (AT 31 DECEMBER 2012)
S&P Moody’s Short-term
ratingLong-term
rating OutlookShort-term
ratingLong-term
rating OutlookRoyal Dutch Shell plc A-1+ AA Stable P-1 Aa1 StableDebt of Shell International Finance BV A-1+ AA Stable P-1 Aa1 Stable
Publically traded bonds were issued by Shell International Finance BV and guaranteed by Royal Dutch Shell plc. Shell International Finance BV is a 100% subsidiary of Royal Dutch Shell plc.
PUBLICLY TRADED BONDS, CURRENT OUTSTANDING
Maturity Settlement Currency Million Coupon Listing ISIN25 Mar 2013 25 Mar 2010 USD 2,000 1.875% New York US822582AL6514 May 2013 13 May 2009 EUR 2,500 3.000% London XSO42814644221 Mar 2014 23 Mar 2009 USD 2,500 4.000% New York US822582AF9728 Jun 2015 28 Jun 2010 USD 1,750 3.100% New York US822582AQ5222 Sep 2015 22 Sep 2009 USD 1,000 3.250% New York US822582AH5304 Dec 2015 06 Dec 2012 USD 750 0.625% New York US822582AU6409 Feb 2016 09 Feb 2009 EUR 1,250 4.500% London XS041296887622 Mar 2017 22 Mar 2007 USD 750 5.200% New York US822582AC6622 May 2017 22 May 2007 EUR 1,500 4.625% London XSO30194586021 Aug 2017 21 Aug 2012 USD 1,000 1.125% New York US822582AR3614 May 2018 13 May 2009 EUR 2,500 4.375% London XSO42814709322 Sep 2019 22 Sep 2009 USD 2,000 4.300% New York US822582AJ1025 Mar 2020 25 Mar 2010 USD 1,250 4.375% New York US822582AM4921 Aug 2022 21 Aug 2012 USD 1,000 2.375% New York US822582AS1906 Jan 2023 06 Dec 2012 USD 1,000 2.250% New York US822582AV4815 Dec 2038 11 Dec 2008 USD 2,750 6.375% New York US822582AD4025 Mar 2040 25 Mar 2010 USD 1,000 5.500% New York US822582AN2221 Aug 2042 21 Aug 2012 USD 500 3.625% New York US822582AT91
0
1,000
2,000
3,000
4,000
5,000
6,000
$ million equivalent
BOND MATURITY PROFILE
USDEUR
20 21 22 23 38 4240181614 19171513
82 Shell Investors’ Handbook | reports.shell.comAdditional investor information
103585_SHE_Investors Handbook_V98_Cleaned_JD.indd 82 08-05-13 14:54

Financial year ends December 31, 2012
AnnouncementsFull year results for 2012 January 31, 2013First quarter results for 2013 May 2, 2013Second quarter results for 2013 August 1, 2013Third quarter results for 2013 October 31, 2013
Dividend timetable [A]2012 Fourth quarter interim [B]Announced January 31, 2013Ex-dividend date February 13, 2013Record date February 15, 2013Scrip reference share price announcement date February 20, 2013Closing date for scrip election and currency election [C] March 1, 2013Euro and sterling equivalents announcement date March 8, 2013Payment date March 28, 2013
2013 First quarter interimAnnounced May 2, 2013Ex-dividend date May 15, 2013Record date May 17, 2013Scrip reference share price announcement date May 22, 2013Closing date for scrip election and currency election [C] June 3, 2013Euro and sterling equivalents announcement date June 10, 2013Payment date June 27, 2013
2013 Second quarter interimAnnounced August 1, 2013Ex-dividend date August 14, 2013Record date August 16, 2013Scrip reference share price announcement date August 21, 2013Closing date for scrip election and currency election [C] September 2, 2013Euro and sterling equivalents announcement date September 9, 2013Payment date September 26, 2013
2013 Third quarter interimAnnounced October 31, 2013Ex-dividend date November 13, 2013Record date November 15, 2013Scrip reference share price announcement date November 20, 2013Closing date for scrip election and currency election [C] November 29, 2013Euro and sterling equivalents announcement date December 6, 2013Payment date December 23, 2013
Annual General Meeting May 21, 2013
[A] This timetable is the intended timetable as announced on November 1, 2012.
[B] The Directors do not propose to recommend any further distribution in respect of 2012.
[C] Different scrip and dividend currency election dates may apply to shareholders holding shares in a securities account with a bank or other fi nancial institution ultimately holding through Euroclear Nederland. Such shareholders can obtain the applicable deadlines from their broker, fi nancial intermediary, bank or other fi nancial institution where they hold their securities account. A different scrip election date may also apply to registered and non-registered ADS holders. Registered ADS holders can contact The Bank of New York Mellon for the applicable deadline. Non-registered ADS holders can contact their broker, fi nancial intermediary, bank or other fi nancial institution for the applicable election deadline.
FINANCIAL CALENDAR
83reports.shell.com | Shell Investors’ HandbookAdditional investor information
103585_SHE_Investors Handbook_V98_Cleaned_JD.indd 83 08-05-13 14:54

Reserves: Our use of the term “reserves” in this publication means SEC proved oil and gas reserves. Resources: Our use of the term “resources” in this publication includes quantities of oil and gas not yet classifi ed as SEC proved oil and gas reserves. Resources are consistent with the Society of Petroleum Engineers 2P and 2C defi nitions. Organic: Our use of the term “organic“ in this publication includes SEC proved oil and gas reserves excluding changes resulting from acquisitions, divestments and year-average pricing impact.
The companies in which Royal Dutch Shell plc directly and indirectly owns investments are separate entities. In this publication “Shell”, “Shell group” and “Royal Dutch Shell” are sometimes used for convenience where references are made to Royal Dutch Shell plc and its subsidiaries in general. Likewise, the words “we”, “us” and “our” are also used to refer to subsidiaries in general or to those who work for them. These expressions are also used where no useful purpose is served by identifying the particular company or companies. “Subsidiaries”, “Shell subsidiaries” and “Shell companies” as used in this publication refer to companies over which Royal Dutch Shell plc either directly or indirectly has control. Companies over which Shell has joint control are generally referred to “joint ventures” and companies over which Shell has signifi cant infl uence but neither control nor joint control are referred to as “associates”. In this publication, joint ventures and associates may also be referred to as “equity-accounted investments”. The term “Shell interest” is used for convenience to indicate the direct and/or indirect (for example, through our 23% shareholding in Woodside Petroleum Ltd.) ownership interest held by Shell in a venture, partnership or company, after exclusion of all third-party interest.
This publication contains forward-looking statements concerning the fi nancial condition, results of operations and businesses of Royal Dutch Shell. All statements other than statements of historical fact are, or may be deemed to be, forward-looking statements. Forward-looking statements are statements of future expectations that are based on management’s current expectations and assumptions and involve known and unknown risks and uncertainties that could cause actual results, performance or events to differ materially from those expressed or implied in these statements. Forward-looking statements include, among other things, statements concerning the potential exposure of Royal Dutch Shell to market risks and statements expressing management’s expectations, beliefs, estimates, forecasts, projections and assumptions. These forward-looking statements are identifi ed by their use of terms and phrases such as “anticipate”, “believe”, “could”, “estimate”, “expect”, “goals”, “intend”, “may”, “objectives”, “outlook”, “plan”, “probably”, “project”, “risks”, “schedule”, “seek”, “should”, “target”, “will” and similar terms and phrases. There are a number of factors that could affect the future operations of Royal Dutch Shell and could cause those results to differ materially from those expressed in the forward-looking statements included in this publication, including (without limitation): (a) price fl uctuations in crude oil and natural gas; (b) changes in demand for Shell’s products; (c) currency fl uctuations; (d) drilling and production results; (e) reserves estimates; (f) loss of market share and industry competition; (g) environmental and physical risks; (h) risks associated with the identifi cation of suitable potential acquisition properties and targets, and successful negotiation and completion of such transactions; (i) the risk of doing business in developing countries and countries subject to international sanctions; (j) legislative, fi scal and regulatory developments including regulatory measures addressing climate change; (k) economic and fi nancial market conditions in various countries and regions; (l) political risks, including the risks of expropriation and renegotiation of the terms of contracts
with governmental entities, delays or advancements in the approval of projects and delays in the reimbursement for shared costs; and (m) changes in trading conditions. All forward-looking statements contained in this publication are expressly qualifi ed in their entirety by the cautionary statements contained or referred to in this section. Readers should not place undue reliance on forward-looking statements. Additional risk factors that may affect future results are contained in Royal Dutch Shell’s 20-F for the year ended December 31, 2012 (available at www.shell.com/investor and www.sec.gov). These risk factors also expressly qualify all forward looking statements contained in this publication and should be considered by the reader. Each forward-looking statement speaks only as of the date of this publication, April 19, 2013. Neither Royal Dutch Shell plc nor any of its subsidiaries undertake any obligation to publicly update or revise any forward-looking statement as a result of new information, future events or other information. In light of these risks, results could differ materially from those stated, implied or inferred from the forward-looking statements contained in this publication.
This publication has not been subject to audit.
The maps in this publication are intended only to give an impression of the magnitude of Shell’s Upstream activities in certain parts of the world. The maps are not comprehensive and show primarily major projects and assets mentioned in this publication. The maps must not be considered authoritative, particularly in respect of delimitation of national, concession or other boundaries, nor in respect of the representation of pipeline routes and landfalls, fi eld sizes or positions. The maps mainly describe the situation as at December 31, 2012.
We may have used certain terms, such as resources, in this publication that United States Securities and Exchange Commission (SEC) strictly prohibits us from including in our fi lings with the SEC. U.S. Investors are urged to consider closely the disclosure in our Form 20-F, File No 1-32575, available on the SEC website www.sec.gov. You can also obtain these forms from the SEC by calling 1-800-SEC-0330.
About this publication
84 Shell Investors’ Handbook | reports.shell.comAdditional investor information
103585_SHE_Investors Handbook_V98_Cleaned_JD.indd 84 08-05-13 14:54
REGISTERED OFFICE
HEADQUARTERS
SHARE REGISTRATION
AMERICAN DEPOSITARY SHARES (ADSS)
USA
$ €£
MW
ABBREVIATIONS
INVESTOR RELATIONS
or
USA
REPORT ORDERING
GTL LNG LPG MEGNGL
ADS CCSCFFOCIS
CO EEAIEOR FIDFLNGJOAJVOML PSC R&D SEC
SUBS

ALL OUR REPORTS ARE AVAILABLE ATHTTP://REPORTS.SHELL.COM
DOWNLOAD OUR APPS AT WWW.SHELL.COM/MOBILE_AND_APPS
CHECK OUR LATEST NEWS