BREE 495 – Engineering Design 3 Mechanization of seeder ...
70
1 McGill University Faculty of Agricultural and Environmental Sciences Department of Bioresource Engineering BREE 495 – Engineering Design 3 Mechanization of seeder for smallholder farmers in Rwanda Submitted by: Sreedurga Cherukumalli Ange Kalitanyi Leen Mardini Professor: Dr. Chandra Madramootoo Supervisor: Dr. Vijaya Raghavan Montreal, Canada April 2020
-
Upload
khangminh22 -
Category
Documents
-
view
0 -
download
0
Transcript of BREE 495 – Engineering Design 3 Mechanization of seeder ...

1
McGill University
Faculty of Agricultural and Environmental Sciences
Department of Bioresource Engineering
BREE 495 – Engineering Design 3
Mechanization of seeder for smallholder farmers in Rwanda
Submitted by:
Sreedurga Cherukumalli
Ange Kalitanyi
Leen Mardini
Professor: Dr. Chandra Madramootoo
Supervisor: Dr. Vijaya Raghavan
Montreal, Canada
April 2020

2
Abstract
A mechanized seeder for Rwandan farmers is presented with the goal of providing
sufficient means for farmers to seed effectively and efficiently their crops during the growing
season of Rwanda. The system was designed as an alternative to the current methods used which
consist often of manual seeding. The newly proposed method of seeding aims to reduce farm losses
by increasing efficiency and precision. Soil mechanics, agronomic requirements for seed
establishment, and many more factors were taken into consideration. The proposed design is a
modification of an existing seeder. The design was modelled using CAD software and tested using
finite element modelling software for deformations. Life cycle assessment and financial analyses
are also presented. Future recommendations include testing the seeder in soil and simulating soil-
machine interactions virtually.

3
Table of Contents
Abstract ......................................................................................................................................................... 2
List of Figures ............................................................................................................................................... 5
List of Tables ................................................................................................................................................ 6
List of Acronyms and Abbreviations ............................................................................................................ 7
1. Introduction ........................................................................................................................................... 8
2. Literature Review .................................................................................................................................. 9
2.1. Agronomic requirements for crop establishment .......................................................................... 9
2.2. Functional and operational requirements for seeders .................................................................. 11
2.2.1. Seeder functional and operational requirements ................................................................. 11
2.2.2. Residue cutting device ........................................................................................................ 11
2.2.3. Furrow opener ..................................................................................................................... 11
2.2.4. Seed covering device .......................................................................................................... 12
2.2.5. Seed firming and seedbed firming devices ......................................................................... 12
2.2.6. Depth control ...................................................................................................................... 12
2.2.7. Seed metering ...................................................................................................................... 13
2.2.8. Seed delivery ....................................................................................................................... 13
2.3. Alternative seeding options ......................................................................................................... 13
2.4. Soil machine interaction.............................................................................................................. 15
2.4.1. Soil properties ..................................................................................................................... 15
2.4.2. Field efficiency ................................................................................................................... 17
2.4.3. Draft .................................................................................................................................... 18
2.4.4. Traction ............................................................................................................................... 19
2.5. Materials overview ...................................................................................................................... 20
3. Design Approach ................................................................................................................................ 21
3.1. Design criteria ............................................................................................................................. 21
3.2. Preliminary design iteration ........................................................................................................ 21
3.3. Problems with initial design ........................................................................................................ 23
4. Design Implementation ....................................................................................................................... 24
4.1. Gaspardo seeder .......................................................................................................................... 24
4.2. SOLIDWORKS model ............................................................................................................... 28
4.3. Mechanical analysis .................................................................................................................... 29
4.4. ANSYS verification .................................................................................................................... 29
5. Prototype Testing ................................................................................................................................ 29

4
5.1. Experimental testing ................................................................................................................... 29
5.2. Visual testing simulation ............................................................................................................. 30
6. Design Evaluation ............................................................................................................................... 31
6.1. Environmental impact ................................................................................................................. 31
6.1.1. Goal and Scope ......................................................................................................................... 32
6.1.2. Results ................................................................................................................................. 34
6.1.3. Interpretation ....................................................................................................................... 35
6.1.4. Data consideration............................................................................................................... 35
6.2. Socio-cultural considerations ...................................................................................................... 36
6.3. Risk Matrix ................................................................................................................................. 37
6.4. Financial analysis ........................................................................................................................ 39
6.4.1. Economic considerations in Canada ................................................................................... 39
6.4.2. Economic considerations in Rwanda .................................................................................. 44
7. Conclusion .......................................................................................................................................... 48
8. Acknowledgements ............................................................................................................................. 49
9. References ........................................................................................................................................... 50
Appendices .................................................................................................................................................. 54
Appendix A – Pugh charts from BREE 490 preliminary design ............................................................ 54
Appendix B – SOLIDWORKS models of Gaspardo seeder ................................................................... 56
Appendix C – Mechanical analysis calculations ..................................................................................... 62
Appendix D – ANSYS simulation results ............................................................................................... 65
Appendix E – Soil calculations ............................................................................................................... 67
Appendix F – Preliminary GANTT Chart .............................................................................................. 70

5
List of Figures
Figure 1. Rise in maize production in Rwanda over the years (Source: Knoema, n.d.). ................ 8
Figure 2. EarthWay Precision Garden Seeder (Source: Earthway.com, n.d.) .............................. 14
Figure 3. Glaser Seeder (Source: Johnny’s Seeds, 2019) ............................................................. 15
Figure 4. Soil moisture content (Source: Uwitonz, 2016)……………………….……………...16
Figure 5. Preliminary design of parallel seeding units. More units can be attached onto bar
extension which was to be connected to a motor. ......................................................................... 22
Figure 6. Gaspardo seeder row removed from larger unit. ........................................................... 24
Figure 7. Team member, Leen, unbolting connections between seeder and single row unit. ...... 25
Figure 8. Metering plate inside of seed metering device onto which seeds sucked by the vacuum
connected by tube underneath. ...................................................................................................... 26
Figure 9. Disconnected vacuum seed metering device with power transmitting mechanism. ..... 27
Figure 10. Seeder row without seed metering device. Ready to attach new seed metering device.
....................................................................................................................................................... 28
Figures 11 and 12. 3D renderings of Gaspardo seeder made in SOLIDWORKS. ....................... 28
Figure 13. System flowchart of the life cycle of a small-scale agricultural seeder. ..................... 33

6
List of Tables
Table 1. Results of the LCA
Table 2. Risk factor matrix
Table 3. Cost breakdown in Canada
Table 4. Depreciation table over a 5-year period in Canada
Table 5. Life cycle cost of mechanized seeder in Canada
Table 6. Cost breakdown in Rwanda
Table 7. Depreciation table over a 5-year period in Rwanda
Table 8. Life cycle cost of mechanized seeder in Rwanda

7
List of Acronyms and Abbreviations
AGRA Alliance for a Green Revolution in Africa
CAD Canadian Dollar
CIP Crop Intensification Program
DBD Dry bulk density
KNG-P1 Kigini Pedon
MISS Mechanization & Irrigation for Smallholder Systems
NEPAD New Partnership for Africa’s Development
SMC Soil moisture content
SSA Sub-Saharan Africa
USD United States Dollar

8
1. Introduction
Food needs in many developing countries are increasing with growing populations. It is
increasingly important that agricultural productivity keep up with these growing demands. One
such example is Rwanda.
In 2007, the government of Rwanda implemented the Crop Intensification Program (CIP),
aimed at increasing the agricultural productivity of high-potential food crops to improve food
security and self-sufficiency (Skoufias et al., 2013). As a result, Rwandan agriculture has seen a
shift towards growing more maize, which was identified as a stable, priority crop in the CIP.
(Fortune of Africa Rwanda, n.d.) (Fig. 1). Maize has been implemented widely in the country
(albeit not being widely liked) as it is used in a variety of applications including feed production,
biofuel production, and human consumption.
Figure 1. Rise in maize production in Rwanda over the years (Source: Knoema, n.d.).
Founded in 2006, the Alliance for a Green Revolution in Africa (AGRA) is an African-led
institution for farmers that works on transforming smallholder farms into thriving businesses.
Amongst their many goals, AGRA works on a Mechanization & Irrigation for Smallholder
Systems (MISS) strategy made to accelerate growth rates of food production to achieve food
security and improve the resilience of livelihoods of the rural population. Amidst their current

9
projects, AGRA is working on improving sowing and transplanting small-scale farm equipment,
such as the hand-hoe and other manual operations.
In fact, the availability of adequate levels of farm power is essential in increasing the
agricultural production. Most of the farms in Africa still use manual agricultural tools and depend
on human muscles as a power source, which constrains increases in agricultural productivity,
results in a stagnation in the farm’s income, and promotes drudgery, leading to poverty and hunger
of the population. Farm power is therefore a crucial key component of small farm assets. It aims
to accomplish tasks that are difficult to perform without mechanical aids, improves the quality of
work and output products, as well as reduces the laborious work of farming activities. As Africa
seeks to increase its output, its needs for farm power will also grow from its present heavy reliance
on hand labor towards the use of draught animals or powered machinery (FAO, 2003). Other issues
faced in small-scale sub-Saharan farms are the under-utilization of huge land potential for
agriculture due to the decrease in labor available and the low productivity of human labor, as well
as low yields due to failure in achieving optimal timeline of farming operations. This results in
decreased yearly harvests.
This project is the continuation of an initial project aimed at developing a mechanized
seeder for sub-Saharan African farmers to reduce farm losses by increasing efficiency and
precision.
2. Literature Review
2.1. Agronomic requirements for crop establishment
Crop establishment refers to the process of seed germination, emergence and development
through maturity (Murray et al., 2006). Lack of optimal crop establishment may result in yield
reductions, replanting costs, excess weed growth, and much more. Seed/species characteristics,
external physical, chemical and biotic environment as well as management influence plant
establishment. Some management techniques such as irrigation, fertilizer application, and
pesticide applications affect the seedling environment whereas harvest technique, storage method,
and pre-plant seed treatments modify seed properties. In addition, planting machines are very
crucial in crop establishment because they modify pre-existing seed and soil conditions and dictate
seed placement within seedbed.

10
The first step of establishment, germination, begins with the uptake of water by the seed
and culminates with elongation of embryonic axis. Oxygen demand may increase later, but no
nutrients are required. Germination is dependent on seed quality, pre-sowing treatments, and
having adequate oxygen, suitable temperatures, and moisture supply. Planting deeper in the
seedbed with optimal depth of cover has proven advantageous as the moisture supply is higher and
it is insulated from drying. It also improves the contact between seed and soil which is a vital part
of establishment. Variations is seed size and shape can influence seeder performance, therefore
some seed metering devices often can tolerate a range of sizes and shapes, while others are
designed for specific crops. If the degree of soil disturbance is too high when opening a furrow to
place the seed, there is a risk of increased moisture loss and reduced water conductivity.
After germination comes emergence, when the seedling emerges from the surface. It is
critical in seeding operations to maintain a uniform depth. The optimum seeding depth is affected
by the depth of furrow relative to the surface, which affects the moisture availability to the seed,
and the depth of soil covering the seed, which affects emergence. Raised beds or ridges can be
used to place excess soil. Press wheels may be used to modify the depth of cover and create a
depression in the soil which concentrates runoff and improves moisture status around seedlings.
Establishment is when the seedling is no longer dependent on seed reserves. Land
preparation has a large effect on establishment as tillage layers can restrict root growth and
moisture movement.
There are numerous planting patterns used depending on crop type, tillage practice, and
available tools. Broadcast planting involves random scattering of seeds. Drill planting is random
dropping of seeds into definite rows albeit randomly spaced. Precision drill planting involves
definite rows and accurate placement at equal intervals. Hill drop planting is the accurate
placement of groups (or hills) of seeds. Check row planting is planting in a square-grid pattern, in
equidistant, perpendicular rows. Dibble (or punch) planting involves placing seeds into individual
rows rather than defined rows. Drill and precision drill planting are the most extensively used,
especially for maize production.

11
2.2. Functional and operational requirements for seeders
2.2.1. Seeder functional and operational requirements
Seeders should chiefly open a furrow, meter the seed, deliver the seed into the furrow, and
cover and firm the seedbed. Inter-row spacing requirements depend on the furrow openers (spacing
may be adjustable) while intra-row spacing requirements depend on the seed meter, which
discharges seeds at a predetermined rate (Murray et al., 2006). Seed delivery should minimize
bounce and displacement to maintain accuracy. Seeder are typically classified by the number of
rows planted, power source, attachment to the power source, and planting pattern.
2.2.2. Residue cutting device
Functional requirements of residue cutting devices are cutting crop/weed residue to be
displaced sideways, cutting/disturbing hard soil layers, and cutting plant root material so that
seedbed isn’t further disturbed by the furrow opener. Residue cutting is especially important if
using tine type furrow openers while soil cutting is important when using negatively raked furrow
openers under high strength soil conditions or when the opener alone cannot create enough soil
tilth to cover the seed. Simply adding weight to better penetrate soil may result inside wall and
furrow base compaction, which is detrimental to seed establishment.
Operational requirements to meet these functional requirements include providing an
adequate vertical force and sharp cutting edge to ensure residues are cut and not simply pushed
into soil. As disc diameter increases, so do cost, vertical force, and draft requirements. Under
heavy loads, small discs push rather than cut residue, but large discs don’t penetrate as well. A
rake angle of around 45 degrees is ideal. The shape of the cutter determines the ratio of cutting to
disturbance. Residue cutters can be fitted with scrapers to remove excess soil buildup.
2.2.3. Furrow opener
Functional requirements of furrow opening devices are opening a furrow at a maintained
depth, minimizing soil disturbance, avoiding over-compaction, and allowing an appropriate
amount of soil to flow back into the furrow. Some furrow openers may displace soil down and out,
up and out, or many other ways.
12
Operational requirements of furrow opening devices are being rigid in its working position,
being adjustable to allow for changes in depth and spacing, having an effective depth controlling
mechanism, and minimizing seedbed disturbance.
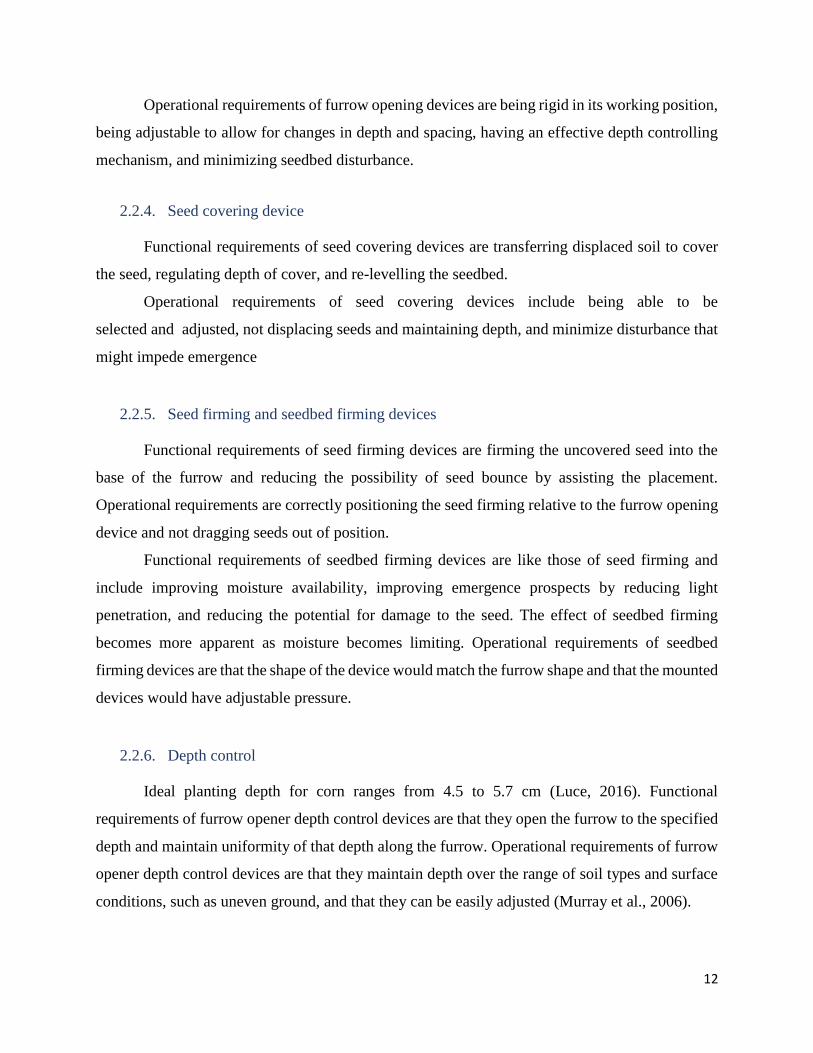
2.2.4. Seed covering device
Functional requirements of seed covering devices are transferring displaced soil to cover
the seed, regulating depth of cover, and re-levelling the seedbed.
Operational requirements of seed covering devices include being able to be
selected and adjusted, not displacing seeds and maintaining depth, and minimize disturbance that
might impede emergence
2.2.5. Seed firming and seedbed firming devices
Functional requirements of seed firming devices are firming the uncovered seed into the
base of the furrow and reducing the possibility of seed bounce by assisting the placement.
Operational requirements are correctly positioning the seed firming relative to the furrow opening
device and not dragging seeds out of position.
Functional requirements of seedbed firming devices are like those of seed firming and
include improving moisture availability, improving emergence prospects by reducing light
penetration, and reducing the potential for damage to the seed. The effect of seedbed firming
becomes more apparent as moisture becomes limiting. Operational requirements of seedbed
firming devices are that the shape of the device would match the furrow shape and that the mounted
devices would have adjustable pressure.
2.2.6. Depth control
Ideal planting depth for corn ranges from 4.5 to 5.7 cm (Luce, 2016). Functional
requirements of furrow opener depth control devices are that they open the furrow to the specified
depth and maintain uniformity of that depth along the furrow. Operational requirements of furrow
opener depth control devices are that they maintain depth over the range of soil types and surface
conditions, such as uneven ground, and that they can be easily adjusted (Murray et al., 2006).

13
Some more precise depth control devices may employ sensors, such as moisture detectors,
to gauge the depth and adjust accordingly. Depth control devices may be ‘frame section gauging’
or ‘individual row gauging’.
2.2.7. Seed metering
Functional requirements of seed metering devices are that they meter the seed at a
predetermined rate and cause minimal damage to the seed. To meet these requirements, the
operational requirements of seed metering devices include being able to meter many types of seeds
at a range of rates and being able to maintain that rate and spacing. Residue accumulation might
affect seed meter performance. Seed damage may increase with meter speed or seed size; thus,
one must be careful when operating seeders at high speeds.
2.2.8. Seed delivery
The functional requirements of seed delivery are to convey the seed from the seed meter
discharge point to the seed placement, maintain speed accuracy during seed conveyance, as well
as allow the seed to be deposited either on the soil surface with right seed spacing within the furrow
and along the row (Murray et al., 2006). The operational requirements of seed delivery systems
depend on the type of seed metering system used. On drill planters, design of the seed delivery
system has little influence on the overall outcome, as long as seed flow through the system is duly
inhibited and the exit velocity is low enough to ensure that seeds are placed on the base not the
adjacent. However, on precision planters, the design of the delivery is very important because the
functional requirement is to convert seed metering accuracy to placement accuracy.
2.3. Alternative seeding options
In highly industrialized agriculture, seeding operations are primarily done by large scale
tractors implements which can seed dozens of rows at a time. The purpose of this design was to
scale down that operation to under ten rows and simplify the mechanisms such that any farmer
could easily operate and maintain.
There exist many small-scale precision seeders on the market (Johnny’s Seeds, 2019).
The EarthWay Precision Garden Seeder is a low-cost, push-type seeder, most commonly used in

14
home gardens (Fig. 2). The Glaser Seeder is a pull-type seeder whose body opens a seed drill into
which seeds are placed (Fig. 3). None of these seeders however are motorized; they rely solely on
human power. Components of these existing models were considered in the premilinary design
criteria.
Figure 2. EarthWay Precision Garden Seeder (Source: Earthway.com, n.d.)

15
Figure 3. Glaser Seeder (Source: Johnny’s Seeds, 2019)
2.4. Soil machine interaction
2.4.1. Soil properties
Agricultural soil is subjected to two types of machinery traffic namely wheel traffic and
tillage traffic. The former compacts the soil profile while the latter loosens and redistributes
through part of the depth profile. The soil response to each traffic is a consequence of both previous
operations and total natural forces acting in the interval (Raghavan, Alvo & McKyes, 1990). That
is why in practice the effects on soil properties caused by the two traffic are dependent on each
other. Traffic parameters, and soil properties at time of traffic define the soil response to
compaction. The response of soil to compaction is described in terms of changes in dry bulk
density (DBD), porosity, penetration resistance (PR) as functions of applied pressure and soil
moisture content (SMC) (Raghavan, Alvo & McKyes, 1990). Hence, it is important to consider
the above parameters when developing any agricultural machine. The following discusses the soil
properties in Rwanda.
Since it was impossible to find soil data for every region where maize is grown in Rwanda,
one location was used as a reference. The soil data used is from a study which was carried out in
the northern part of Rwanda in Musanze District (where a profile on Kigini Pedon was excavated
(KNG-P1)).
According to the studied soils, the particle distribution of clay, silt, and sand were found to
be 16.8%, 20.1%, and 63.1%, respectively (Uwitonze, 2016). The relative proportions sand,
silt, and clay in the soil is what called soil texture. It is the most permanent characteristic of soil
that influences several other soil properties such as soil structure. When the results of clay, silt and
sand were analysed using the USDA Soil Taxonomy, the soil texture was found to be sandy loam.
The studied soil also showed bulk density to be 0.44g/cm3 (Uwitonze, 2016). Bulk density is the
weight of dry soil per unit of volume. Bulk density is a measure of soil health and soil compaction.
It affects soil porositiy, infiltration, and rooting depth. The ideal bulk density for plant growth on
sandy loam soils is less than 1.4g/cm3. The low bulk density found may be attributed to high
content of organic matter found in the soil. It suggests that the soils are not compact, plant roots
can penetrate easily and better soil tilth hence leading to easy tillage, seedling emergence, and root
development (Uwitonze, 2016). Moreover, particle density was found to be 1.93 g/cm3. Particle

16
density is the average composition of mineral density in the soil. Most soils particle density is close
to 2.65g/cm3 because the dominant mineral in particle density is quartz (has a density of
2.65g/cm3).The small value found is attributed to small amount of micas, quartz, and higher
organic matter content in the studied Pedon (Uwitonze, 2016). Nonetheless, particle density varies
little between minerals and has little practical significance except in the calculation of soil porosity.
Furthermore, soil porosity is a measure of the amount of spaces or pores in the soil that is occupied
with water, air, and other fluids. A combination of texture, structure and organic matter determines
the porosity. Soil porosity is also an indicator of the degree of compaction. The soil porosity was
measured to be 77.23% and attributed to relatively high organic matter content in the soil. Soil
resistance is also another soil property. Soil resistance is commonly used as an indicator of soil
strength (Uwitonze, 2016). Soil strength affects root growth, seedling emergence, aggregate
stability, and compaction. Soil resistance is directly proportional to bulk density. Soil resistance
found is 2.39kg/cm2. This number is attributed to low bulk density found in the soil and shows that
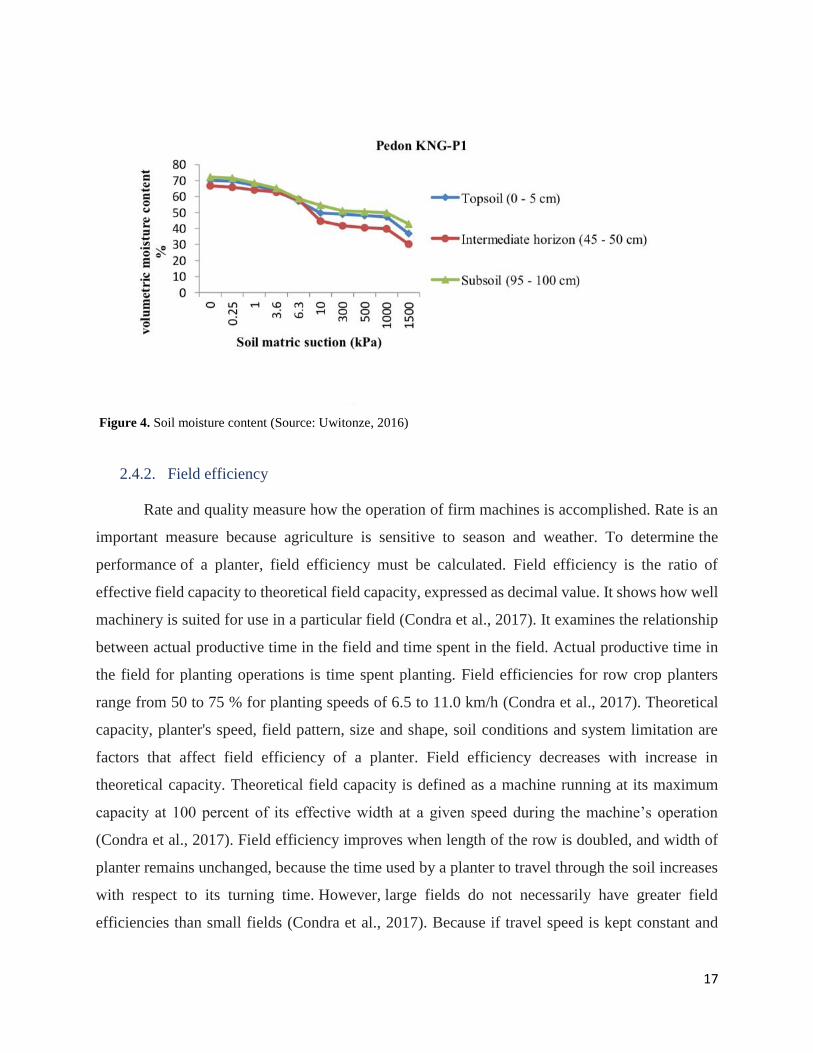
the topsoil is loose and facilitates root growth. Lastly, soil moisture content indicates the amount
of water in the soil. Lastly, soil moisture characteristic curve is dependent of organic matter content
and particle size distribution (Uwitonze, 2016). The results found suggest a high retention capacity
with a gradual decrease when suction potential increases. This fact may be attributed to high
organic matter found in the soil. Soil organic matter enhances soil water retention because of its
hydrophilic nature and its positive influence on the soil structure (Uwitonze, 2016). The figure
below shows the soil moisture content.
17
Figure 4. Soil moisture content (Source: Uwitonze, 2016)
2.4.2. Field efficiency
Rate and quality measure how the operation of firm machines is accomplished. Rate is an
important measure because agriculture is sensitive to season and weather. To determine the
performance of a planter, field efficiency must be calculated. Field efficiency is the ratio of
effective field capacity to theoretical field capacity, expressed as decimal value. It shows how well
machinery is suited for use in a particular field (Condra et al., 2017). It examines the relationship
between actual productive time in the field and time spent in the field. Actual productive time in
the field for planting operations is time spent planting. Field efficiencies for row crop planters
range from 50 to 75 % for planting speeds of 6.5 to 11.0 km/h (Condra et al., 2017). Theoretical
capacity, planter's speed, field pattern, size and shape, soil conditions and system limitation are
factors that affect field efficiency of a planter. Field efficiency decreases with increase in
theoretical capacity. Theoretical field capacity is defined as a machine running at its maximum
capacity at 100 percent of its effective width at a given speed during the machine’s operation
(Condra et al., 2017). Field efficiency improves when length of the row is doubled, and width of
planter remains unchanged, because the time used by a planter to travel through the soil increases
with respect to its turning time. However, large fields do not necessarily have greater field
efficiencies than small fields (Condra et al., 2017). Because if travel speed is kept constant and

18
turning radii is identically proportional to width, the pattern efficiency will remain the same even
if both width of the field and seed planter are doubled.
The improvement of field efficiency can be made by analyzing and varying the pattern of
field operations. Field pattern is closely related to the size and shape of the field; however, some
pattern considerations can be studied independently of field configurations (Hunt, 2008). In order
to establish an efficient field pattern, the amount of field travel needs to be reduced. The number
of nonworking turns, travel distance and nonworking travel inside the field should be avoided.
Another factor is to modify the choice of a field pattern because repeated machine travel over an
area of the field may cause compaction in some soils (Hunt, 2008). Contour planting, and contour
structures are the most important soil conservation measures to modify field pattern. For instance,
rectangular fields have high field efficiency compared to irregularly shaped fields because of their
excessive turning time. Even when the irregular fields are straight sided, the ration of turning time
to operating time will be high.
The effectiveness of a planter largely depends on its forward speed and the power unit used
to pull it through the soil. Row planting involves the movement of soil from one place to another.
When travel speed increases, field efficiency decreases (Hunt, 2008). Increased field speed will
decrease the actual working time required; however, if the time lost remain basically the same,
field efficiency will be less as in the case of a seeder. Consequently, operators should not use slow
speeds to keep the numerical field efficiency high. However, there are so many factors that affect
field speeds such as overloading the machine’s functional units, inability of the operators to steer
the machine accurately and loss of function and structural damage to the machine due to rough
ground surface (Hunt, 2008).
2.4.3. Draft
The power required to pull a planter through the soil at a given ground speed is dependent
of its draft and traction developed by the power unit (Walter, 2013). Draft is the force required to
pull farm implement through the soil. The draft force is located at the point where the tool is
attached to the power unit called the hitch. Most of the time this power unit is a tractor. Moreover,
draft force moves in the same direction as the travel of planter. To move a planter in the soil at a
given speed, the total amount of draft force is required. Draft requirements can be obtained from
engineering publications and manufacturers. To calculate the draft force of the planter, width,

19
depth, speed at which is pulled, and soil resistance are required. Soil resistance is based on soil
characteristics such as moisture content and soil texture. For example, a dry sandy loam has greater
draft than moist sandy loam soil, and hence require more power to work (Walter, 2013). This is
caused by the lubricating effect of moisture films surrounding soil particles and decrease in soil
strength transmitted by the moisture (Walter, 2013). In addition, fine textured soils require extra
power to function and becomes difficult to work with when their moisture is too low. In order to
save power and maximize the effectiveness of the machine, seedling should happen when soil is
most friable (when moisture content is near field capacity) (Walter, 2013). The speed of the
machine is directly proportional to draft. This means that if a field has a mixture of soil types, the
tractor must be sized according to the soil with the most resistance.
2.4.4. Traction
When a planter is pulled through the soil, the tractor (power unit) must overcome draft
forces created by soil resistance in order to move forward. It is easily done because modern tractors
are designed to transmit greater power to the soil (Walter, 2013). The transfer of power to the soil
is done through the drive axle on which tires and wheels are mounted. Transmitting that power
requires large frictional forces or traction (the force of forward motion derived from contact
between the tractor’s tires and soil) at the soil surface which converts the torque or rotary motion
of the tractor’s crankshaft into forward motion.
The main purpose of a planter’s tire is to support its weight while moving with a minimum
amount of resistance over the soil surface (Walter, 2013). The wheels rearrange the soil particles
in order to provide shear strength to the soil that support the weight and generates forward motion.
Shear strength is a measure of the force needed to deform the soil. Agricultural soils are a mixture
of sand, silt, and clay and therefore derives its shear strength from internal friction and cohesion.
Studies show that the strength of the clay soil depends on its cohesive properties while sand soil
depends on the force (Walter, 2013). When the planter's tire passes over a field surface, soil
deforms vertically in response to its weight and horizontally to generate traction. The amounts of
vertical and horizontal deformations of the soil are rolling resistance and wheel slippage,
respectively. Rolling resistance is achieved when a planter that is constantly exerting effort
climbing up hill against the downward pull of gravity has less power available for forward motion.
Whereas, when wheel slippage is 100%, all power is consumed in soil deformation and forward
movement cannot be achieved (Walter, 2013). Zero-wheel slippage means there is no soil

20
deformation and hence no power. However, certain amount of slippage is desirable. Wheel
slippage on planters can be managed by ballasting the tires and is usually specified by the
manufacturer. However, planters are ballasted to maximize tractive efficiency, which is the
fraction of power available at the axle that is transmitted to a planter through the drawbar. Over-
ballasting a planter may lower wheel slippage, increase rolling resistance and may also damage
the drive train (Walter, 2013).
2.5. Materials overview
The selection of the right material and treatment for a particular application of a farm
machine is crucial from the standpoints of cost, durability, and machine performance. Components
should be designed to use the lowest cost materials that will perform satisfactorily and have an
adequate life. In the case of the small-scale agricultural seeder, it might be necessary to substitute
high-cost materials and expensive treatments for low-cost materials to make up for deficiencies in
the original design. Typically, agricultural machines are consisted exclusively of iron and steel.
Brass, bronze, babbit, and wood are used less for small parts such as bearings. Belts, conveyors,
tires, and synthetic rubbers are used in a limited extend where resilient mountings are advantageous
(Anderson, 1953). Recently, a lot of research has been going on around the further development
of the material parts and components used in modern agricultural machinery. Research suggests
that aluminum will be used for future applications where resistance to corrosion and light weight
are advantageous (Anderson, 1953). Plastics can also be used where weight saving and resistance
to wear are important (Anderson, 1953). Considering that it is not widely spread yet, both
aluminum and plastics are relatively expensive to use in order to build the small-scale seeder. It
could be a possible option in the future as these two materials become more common.
The strength and durability of a farm implement largely depends on the type of materials
used in building it (Smith, 1948). The selection of the materials is based, but not limited to, the
following factors: stress-strain relationships, deflection and stability of the machine, and corrosion
resistance. In the case of this project, choosing a material was not necessary as there was only one
seeder available to redesign (explained below).

21
3. Design Approach
3.1. Design criteria
The following design criteria were established through consultation with the clients, as well
as through discussion with mentors, advisors, and technicians:
Functionality. The design must function and be suited for the soil, climatic and weather
conditions of Rwanda. It should be easy to operate and work either as an implement to a tractor or
drought animal.
Safety. The design must pose no risks to the safety of the users, or small-scale farmers.
Each element of the system must be carefully designed to minimize any risk of danger. The design
must be discussed with experts to ensure that it meets all safety codes and engineering standards.
Low maintenance requirements. The design must require minimal maintenance from the
farmer or owner of the machine. It should not require any intervention apart from being able to set
it up and attach it to the tool that will be driving it. The different components of the seeder should
be self-sustaining and should not need to be replaced on a yearly basis.
Ease of operation. The system must be easy to operate and understand. Small-scale
farmers should be able to understand the designed system without previous knowledge on the
matter, as well as operate the machine with ease.
3.2. Preliminary design iteration
The initial design from BREE 490 was a simple seeder implement that consisted of two
parallel beams which supported the seeding devices: a notched disc coulter to cut residue; a
concave disc furrow opener; a chain seed covering mechanism (not pictured); a depth gauge wheel;
a hopper with an inclined plate seed meter; and a drive wheel which was to drive the seed metering
device. These units were to be connected in parallel by another beam which could connect to the
motor (Fig. 5). The motor was to be self-propelled with a triggering mechanism similar to that of
a walk-behind lawn mower; a simple four-stroke, gasoline-powered internal combustion engine
produced by Briggs and Stratton was to be used in preliminary prototypes.

22
Figure 5. Preliminary design of parallel seeding units. More units can be attached onto bar extension which was to be
connected to a motor.
It was not deemed necessary to have all components of seeders described above in the
design. Often, residue cutting devices can function as row preparation devices (Murray et al.,
2006). Similarly, the drive wheel can serve to firm the seedbed. The design selected consisted of
a residue cutting device (which also functioned as row preparation), furrow opener, seed covering
device, depth gauge, seed meter, and drive wheel (which also functioned as row firming).
Each component of the seeder had a different function therefore unique criteria for
selection. Pugh charts were used to select between options for residue cutting, furrow opening, and
seed covering devices (see Appendix A). A simple depth gauge wheel system was used to control
seeding depth. There exist many seed metering devices (Garner et al., 2015; Deckler, 1991).
However, according to Sims and Kienzle (2006), the inclined plate seed meter is most common
over horizontal plate seed meters manufactured in southern Africa because they can handle
ungraded seed better.
One important criterion was to give the farmer flexibility in the number of rows they choose
to seed. Hence the design was to be modular in a way that any number of single row units could
be connected to a motor.

23
3.3. Problems with initial design
Upon returning for BREE 495 to continue, the team first sought to improve upon our
preliminary design. Marc Samoisette, the Chief Agronomy Technician for the Macdonald Farm
has a lot of expertise on seeders and other agricultural equipment, hence had a lot of helpful
practical feedback. He strongly recommended adding a separate component to push aside residue
in addition to the residue cutting device already there, since it is being designed for conservation
tillage. He recommended having two wheels as depth gauges (one on each side) so that the machine
is better balanced. He said that it is better to have a flat rather than curved disc for the furrow
opener to prevent compaction. For covering, he recommended cast wheels over the
chain closer because they are better in no-till situations. Many seeders at the farm used finger seed
metering, which he recommended as they can be used for any seed type. This was deemed a better
option since if the price goes up, being able to seed more crops with the same seeder would be a
better sell. He recommended designing only for two rows and making it a very strong sturdy design
that can last in conservation tillage, rather than a variable-row implement.
Scott Manktelow, Laboratory Superintendent at the Machine Shop, also had suggested to
focus on the mechanical design of the pull implement rather than the motor. He recommended
designing it such that it can be pulled by anything (motor, draught power, human, etc.). This would
also broaden the market for who can use it.
Other concerns brought up was what to do in the case of uneven ground and how to
transport the unit (addressed below). Dr. Raghavan said that levelling was not a concern of the
seeding operation and would simply require a prior levelling operation, especially in the case of
conservation agriculture.
Ultimately, as funding was unavailable and parts were very difficult to find, it was not
possible to move ahead with the preliminary designs with Marc’s recommendations. It was
considered to order existing seeders, such as the Earthway or Glaser seeders, and disassemble
them for their parts. However, Marc pointed out that these seeders are designed for conventional
tillage, thus much flimsier, and would not be suitable for conservation tillage, as is the case for
this project.
After much deliberation, the best course of action was to use an old seeder available and
not-in-use at the farm to redesign to match as closely as possible our original design. The frame
was sturdy enough, as it was designed for large scale operations, and it came fitted with most

24
necessary parts of a seeder. It was decided that two rows would be taken from this seeder and
reworked and attached together into a pull implement that could be used with any power
source. Some parts would need to be changed, the seeder tested in real soil, and any necessary
changes made in iterations. Unfortunately, this was only begun but not completed as the team no
longer had access to campus facilities due to the COVID-19 outbreak.
4. Design Implementation
4.1. Gaspardo seeder
The old seeder at the farm, referred to as the Gaspardo seeder (Fig. 6), was no longer being
used for seeding due to its seed metering mechanism. The Gaspardo seeder employed a vacuum
seed meter, which, as Marc described, volatilized and sprayed dust directly in the direction of the
operator. This posed a human health and safety risk as this dust consisted of any pesticide or
fertilizer the seeds contained.
Figure 6. Gaspardo seeder row removed from larger unit.
Therefore, the primary task was to remove the vacuum seed metering mechanism. In order
to do so, it was first necessary to separate the two rows from the larger seeder. This proved to be

25
a challenging step as most components were bolted on and connected in multiple ways, including
the frame, power transmission, and the vacuum seed meter (Fig. 7).
Figure 7. Team member, Leen, unbolting connections between seeder and single row unit.
Taking it apart also allowed for better insight into how the parts are connected and how
the mechanisms worked. One such mechanism was the power transmission and vacuum
connected to the hopper and seed meter. A rod that runs through the large red piece in
Figure X turns, causing the long red shaft to turn. This shaft is connected to what appears to be a
differential inside the seed meter, which causes the seed plate to turn (Fig. 8), singulating seeds,
and dropping them into the furrow. Once the seed meter was removed, the unit was ready to hold a
newer, safer seed metering device (Fig. 9 and 10). The remaining parts were deemed okay for use.
These included a residue cutter, furrow opener, and cast wheel furrow closer (see Appendix
B). Transporting this unit would be relatively simple; one would simply need to lift it to rest on
the cast wheels in the back, which can be easily driven anywhere and attached or stored.

26
Figure 8. Metering plate inside of seed metering device onto which seeds sucked by the vacuum connected by tube
underneath.
As it was not possible to order and install a new seed meter before facilities were closed,
emphasis was instead put on determining constraints to a hypothetical seed meter that could be
attached when the opportunity comes. The Gaspardo seeder was designed in SOLIDWORKS
and mechanical analysis was performed to determine the maximum weight that could be withheld
by the beam that would carry the new seed meter and verified in ANSYS.

27
Figure 9. Disconnected vacuum seed metering device with power transmitting mechanism.

28
Figure 10. Seeder row without seed metering device. Ready to attach new seed metering device.
4.2. SOLIDWORKS model
Measurements of crucial components of the Gaspardo seeder were meticulously taken and
noted. These measurements were translated to a 3D model in SOLIDWORKS (Fig. X)(see
Appendix B). The hope was that the new seed meter, and any changes we deemed necessary after
testing the seeder, could be easily added in the 3D model. Some modelled parts were later used in
ANSYS to verify mechanical analysis.
Figures 11 and 12. 3D renderings of Gaspardo seeder made in SOLIDWORKS.

29
4.3. Mechanical analysis
When attaching a new seed meter, it was important to make sure the beam could support
the weight of the seeder. It was found that the beam could support up to 27601.17 N of
force. Calculations can be found in Appendix C.
4.4. ANSYS verification
In order to verify that this was in fact reasonable, the beam was modelled in
SOLIDWORKS and exported to ANSYS, a finite element modelling software which can
determine the deformations, stresses, and strains in all parts of a body given the loads and boundary
conditions it is subject to. The beam was assumed to be made of structural steel, have two supports
where it was bolted or welded to two other members of the seeder and the load was treated as a
downward directed force, with a magnitude of 27601.71 N. The maximum total deformation was
0.13 mm, maximum deformation directed downward was 0.12 mm, maximum strain was 0.001
mm/mm, and maximum stress was 170.51 MPa (see Appendix D). Therefore, for
any seed meter which exerts a force under 27601.71 N, the beam will deform only tenths of
a millimeter. Any seed meter under 2813 kg would therefore be a reasonable choice for
minimizing deflections in the beam.
It was also planned to model the furrow opener in ANSYS by simulating the force exerted
by soil (see Appendix E) and support reactions to determine possible failure. However, this could
not be done as the team did not have access to school computers and was only able to download
ANSYS less than a week prior to the deadline due to technical difficulties.
5. Prototype Testing
5.1. Experimental testing
Unfortunately, the team was not able to complete assembling the seeder with new parts and
attaching the two rows together into a pull implement. If the assembly had been completed, the
next step would have been to test the seeder in real soil. Testing would have been done either at
the farm if the soil had thawed by then or at the shop, by creating a plot of soil to mimic that of a
conservation tillage.
30
When testing seeders, there are important performance indices to evaluate. In a laboratory,
seed rate, seed rate instability, unevenness of seed distribution in the working width can be
measured. In the field, average working depth, average width of strips, average depth of seed
incorporation, and measures of distributions of each such as standard deviation or coefficient of
variation can be measured for every run of the test (Dragos et al., 2016). It is important for any
seeding operation that rates and spacings are consistent and even. Nonuniformity would
compromise the health of growing plants.
5.2. Visual testing simulation
Simulation and computer-aided engineering (CAE) enables one to perform virtual testing
of equipment. In the case of simulating agricultural processes, an important aspect is to consider
the handling of the material that the machine is interacting with. Discrete Element Method (DEM)
is a particle-scale numerical method for modeling bulk behavior of granular materials including
grains, seed, crops, soils, and stems. DEM allows to recreate the behavior of these materials and
analyze how they will interact with a piece of equipment during a range of operation and process
conditions (ABAQUS, n.d.).
An example of such software is EDEM, used for the design, performance testing, and
optimization of agricultural machines such as the mechanized seeder. Using this software, bulk
material simulation as part of the design process can bring benefits to agricultural equipment such
as predicting the flow of seeds to deliver optimal flow properties, identify the risk of blockage in
the seeder due to high flow rates, model interaction responses with soils and machine, predict
kinematic responses due to impacts with compressed soils or large rocks, as well as perform testing
out of season without having to ship the built prototype to Rwanda and reducing the need for
physical prototypes (DEM Solutions, 2020). Unfortunately, access to this software was not
available and virtual simulation was out of the scope of the project. However, this is still a
promising endeavor for future trials.

31
6. Design Evaluation
6.1. Environmental impact
Agricultural production has a huge impact on the environment. Although its share of the gross
domestic product has declined steadily over several decades, farming still exerts a significant
impact on the environment. The increase in agricultural productivity over the 20th century, and the
rise in mechanization lead to an increase in labor productivity, an intensive use of fertilizers and
pesticides as well as progress in animal husbandry. Although his resulted in an increase in yields,
the excessive use of these inputs has resulted in problems such as eutrophication and toxicity. It is
also the main source of several major emissions such as methane (CH4), nitrate (NO3), and
ammonia (NH3) 93% of which comes from agricultural sources (Thoni, Seitler, & Matthaei, 2007).
Hence, the study of agricultural production systems is a priority in order to ensure minimal effect
on the environment. The proposed designed does not currently include a fertilizer spreader,
however, the design team will look at the environmental impact that it generates throughout its life
cycle.
In order to help assess theses impacts, a Life Cycle Analysis (LCA) is conducted. This will
help the design team easily identify the most polluting stages of the process and use them as a
guide to develop enhanced methods and processes in the future.
An LCA is a detailed analysis of a product; it describes the entire life span of the product. It
encompasses the production of raw materials, the manufacturing process of the machine, logistics,
use, and ends with the machine’s reuse, recycling and disposal (ART, 2007). Both the product’s
use phase and end-of-life disposal phase depend on consumer behavior; nevertheless, they are
critical stages in a product’s use phase cycle. During the manufacturing phase of the seeder, every
stage has an impact on the environment, such as energy usage and CO2 emission and waste.
The LCA is divided into four stages. The first stage includes defining the goals and scope of
the study by describing the product that is to be assessed. The second stage is the inventory, which
represents the collection of the data from all processes of the product’s life cycle. This includes
the acquisition of raw materials till the development of the final product. During this stage, energy,
raw material requirements, environmental emissions and discharges relating to the product are
computed. These data can be used to calculate the discharge from all the processes of the product’s

32
life cycle. The third stage is the impact assessment stage, in which the inventory data are translated
into their effects on human health, ecological health and resource depletion. The last stage of this
process is the interpretation stage which is based on an analysis of the impact assessment results
(Horne et al., 2009).
6.1.1. Goal and Scope
The objective of this study is to analyze the environmental impact of using a small-scale
seeder, manufactured in Canada, and used on a small-scale farm in Rwanda from a life-cycle
perspective.
The functional unit chosen for this LCA is the usage of 1 seeder over one year. Assuming
that the seeder has an average lifespan of 15 years and is used twice per year, the key parameters
are a lifespan of 15 years and used 1 every season. The reference flow is the number of seeders
needed to satisfy the functional unit of 15 years, consequently, it would be 1/15 seeder. Figure 13
describes the life cycle of the prototype from its manufacturing phase, till its end of life.

33
Figure 13. System flowchart of the life cycle of a small-scale agricultural seeder.
The blue arrows in Figure 13 represent the elementary flow linking the unit process with
the environment, whether they are inputted directly from the environment or outputted straight to
the environment such as the emissions. The white arrows represent the economic or intermediary
flows, which link the unit processes together or represent the materials, energy, services required
by the activity. The land is considered as an intermediary flow as it is providing the service for
agricultural activities, although it could also be considered as a resource to support those activity,
34
in which case it is considered as an elementary flow. Electricity however is considered as a product
and not an input from the environment and is consequently regarded as an elementary flow. The
production of electricity involves generators and engines in a power plant, as well as different steps
such as material extraction, acquisition and processing. In the system above, the preceding
processes are not included in the boundary of the study and electricity is only considered as a
production from that system. The raw materials, natural gas, electricity, fuel oil and other materials
used to manufacture the seeder, as well as the fuel/diesel and freight are considered products of
previous systems which are not included in the system boundary of the Figure 13. They are thus
represented by a white arrow, linking the processes together. Waste is assumed to be recycled and
recovered and used in some way, thus considered as intermediary flows.
Concerning the end-of-life of seeder, three different options could be considered: recycled
materials, second handed, or landfilled. The landfill option is represented as an elementary flow,
the seeder being discharged back into the environment. The recycling options is represented as an
economic flow since it would be incorporated back into the recovery and recycling facility. The
secondhand option is also assumed to be a product, since it has been produced by a previous cycle
and is going to be incorporated in a new life.
The data used for this study has been extracted from the Impact2002+ preprocessed copy of the
Ecoinvent database (https://mcgill-
my.sharepoint.com/:x:/g/personal/sreedurga_cherukumalli_mail_mcgill_ca/EWS28834E8lHjgy
D5SXtK3sB9bzFkid0d8VGXjbOYu_p0w?e=k6RmaG).
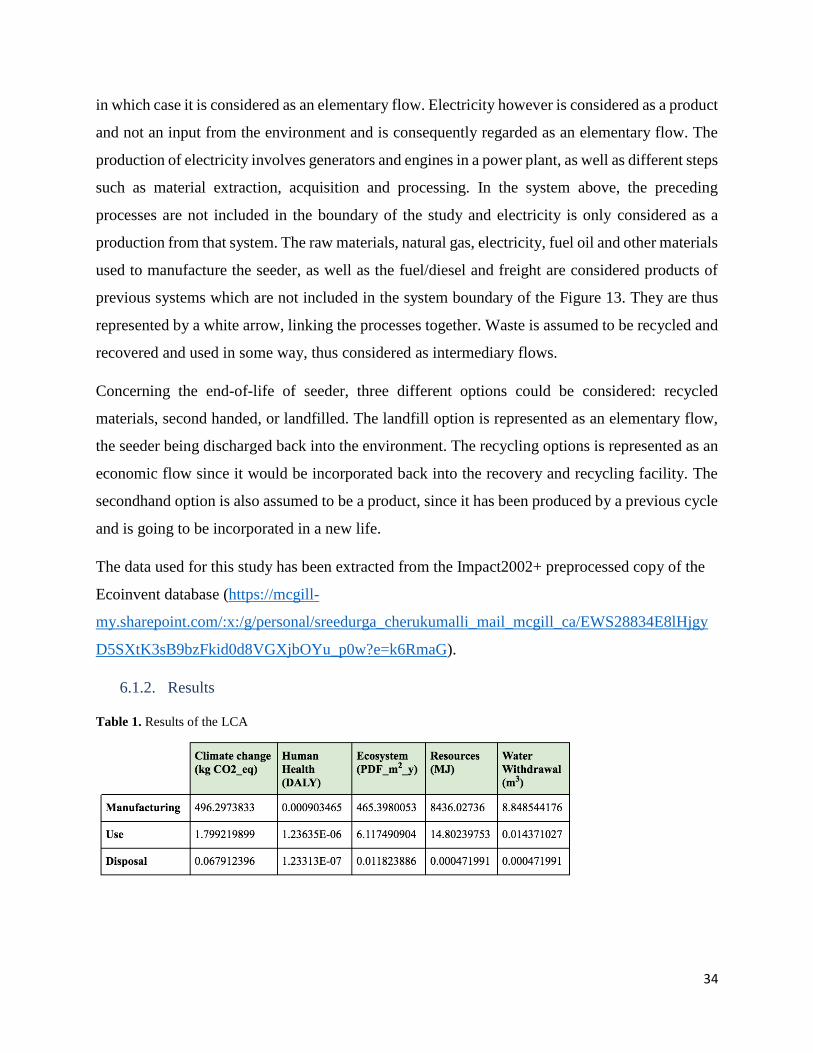
6.1.2. Results
Table 1. Results of the LCA
35
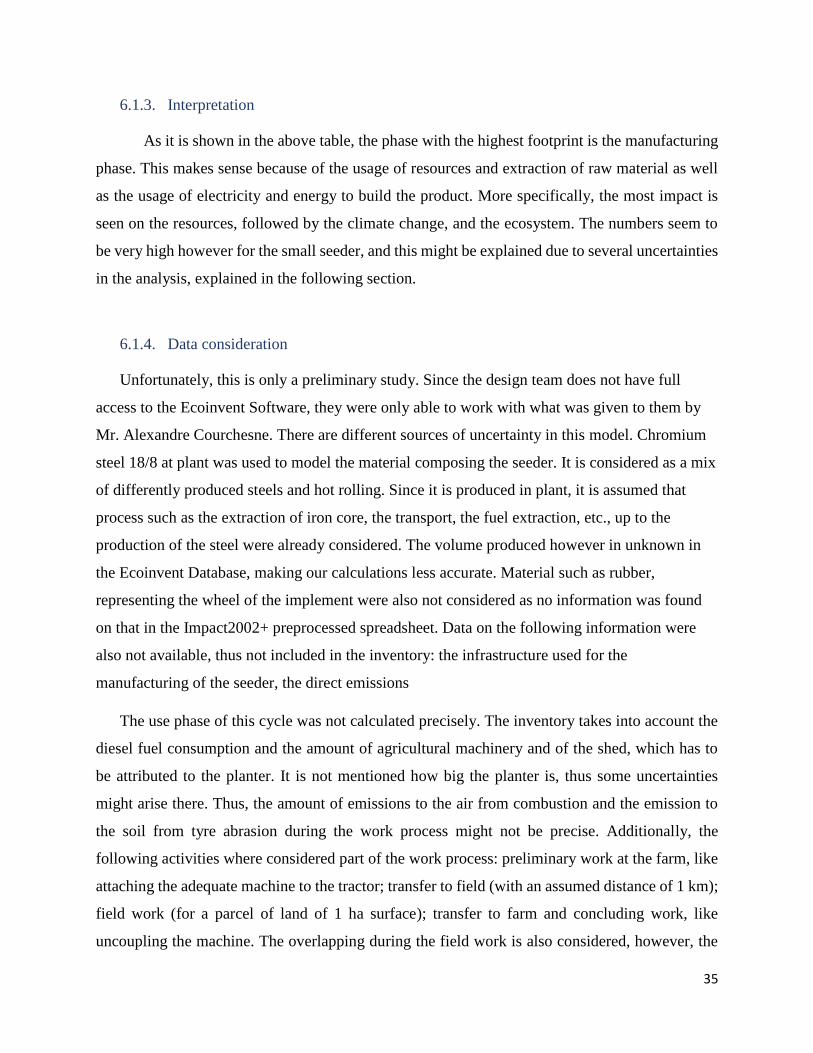
6.1.3. Interpretation
As it is shown in the above table, the phase with the highest footprint is the manufacturing
phase. This makes sense because of the usage of resources and extraction of raw material as well
as the usage of electricity and energy to build the product. More specifically, the most impact is
seen on the resources, followed by the climate change, and the ecosystem. The numbers seem to
be very high however for the small seeder, and this might be explained due to several uncertainties
in the analysis, explained in the following section.
6.1.4. Data consideration
Unfortunately, this is only a preliminary study. Since the design team does not have full
access to the Ecoinvent Software, they were only able to work with what was given to them by
Mr. Alexandre Courchesne. There are different sources of uncertainty in this model. Chromium
steel 18/8 at plant was used to model the material composing the seeder. It is considered as a mix
of differently produced steels and hot rolling. Since it is produced in plant, it is assumed that
process such as the extraction of iron core, the transport, the fuel extraction, etc., up to the
production of the steel were already considered. The volume produced however in unknown in
the Ecoinvent Database, making our calculations less accurate. Material such as rubber,
representing the wheel of the implement were also not considered as no information was found
on that in the Impact2002+ preprocessed spreadsheet. Data on the following information were
also not available, thus not included in the inventory: the infrastructure used for the
manufacturing of the seeder, the direct emissions
The use phase of this cycle was not calculated precisely. The inventory takes into account the
diesel fuel consumption and the amount of agricultural machinery and of the shed, which has to
be attributed to the planter. It is not mentioned how big the planter is, thus some uncertainties
might arise there. Thus, the amount of emissions to the air from combustion and the emission to
the soil from tyre abrasion during the work process might not be precise. Additionally, the
following activities where considered part of the work process: preliminary work at the farm, like
attaching the adequate machine to the tractor; transfer to field (with an assumed distance of 1 km);
field work (for a parcel of land of 1 ha surface); transfer to farm and concluding work, like
uncoupling the machine. The overlapping during the field work is also considered, however, the

36
planting material, maize, is not taken into account. Not included in the study are dust other than
from combustion and noise. It would have perhaps been easier to conduct the study on a drought
animal, as this might be the most likely scenario in the small-scale farms of Rwanda. Finally, data
on waste disposal are also estimated based on Western Europe’s waste disposal of similar
machinery. The one in the Ecoinvent database is however considered larger in size than our seeder,
thus adding more uncertainty in the study.
6.2. Socio-cultural considerations
From a social perspective, several criteria are important to consider while designing the seeder.
Most importantly, it is crucial for it to be user-friendly and require little maintenance, all while
delivering efficient results that will help in the increase of productivity and yields. In fact, the
average household family size in the SSA region is said to be five to six members (FAO, 2006).
he same family members might have differing work potentials and some members might devote
some effort to off-farm work. The mechanized seeder will therefore help reduce labour hours
requirements for small-scale farmers, allowing them to have more leisure time, and therefore
increasing their quality of life, or even have more free time to work elsewhere around the farm or
on entirely separate activities. This will also reduce the power required for seeding by making the
process of seeding more efficient. Additionally, women who generally do not have much physical
capability to offer more than mechanical assistance will be able to play a bigger role on farms.
This will also promote less injuries while conducting the laborious activity of cutting residues,
prepping the row and opening them to prepare for the seeding operation. Thus, the farming
effectiveness will lead to an increase in yields and directly contribute to a better lifestyle for the
farmer’s family and their lifestyle. A case study around 17 countries in Africa showed that farmers
shifting from hand-hoes and other manual farm equipment to mechanized tools experienced a
doubling in their area of cultivation (FAO, 2006). This proves that the adoption of mechanized
tools on small-scale farms can lead to the expansion of the area of the land cultivated. Finally, the
implementation of the mechanical seeder will contribute to the improvement of skills and teach
farmers how to utilize technology on the farm and potentially raise labour wages. However, for
this to work, it is crucial to educate the farmers on self-run farms and operational functioning of

37
the seeder by implementing various educational programs and training in order to ease the
transition for them.
Concerns that this project might raise are related to the lack of well-paid opportunities in rural
areas, associated with low education levels, which might affect the income of workers that work
on farms that do not belong to their families.
6.3. Risk Matrix
The risk assessment of a project constitutes an important step during the design of a product
since it quantifies and defines the inherent risk of the system by considering the category of
probability against the category of consequence severity. Risk factors can be evaluated at ranks
from one to three, where one represents the least likely and least dangerous risk, and three
represents the most likely and dangerous. To ensure that all risks are equally assessed, and that
appropriate measures are taken into consideration for the full functionality of the seeder, the
following risk factor matrix was generated with an appropriate framework delineating risk
contributors and mitigation procedures.
Table 2. Risk Factor Matrix
Risk Factor Risk Rank Risk Contributor Mitigation Procedure
Unsafe machine
operation
Heavy duty equipment
(safety using the
machine)
3 Incorrect use of
controls
Ensure personnel are
provided with, and
read, operation manual
for equipment
Provide training
Smoke inhalation 1 Exhaust Do not loiter around
exhaust
On-site storage risks 2 Weather conditions Ensure equipment is
stored in a weather
resistant enclosure
Manufacturing Risks
(safety, tools,
equipment, etc)
1
Abide by all standard
WHMIS rules to ensure
worker safety in the
plant
Warehouse Risks
(safety, weight,
dangers)
1
Abide by all standard
WHMIS rules to ensure
worker safety in the
warehouse

38
Transportation Risks 2 Standard dangers
related to loading and
unloading
Ensure that packaging
is safe, as well as
experience freight
handlers are used
Excessive noise 1 Lawn mower sound Ensure machine is well
attached
Cutting, shearing injury 3 Sharp edges, disks Keep hands, feet and
clothing away from
driven parts
Hazardous Materials 2 Gasoline, oil,
lubrication
Ensure all hazardous
materials are correctly
labelled with bright and
internationally accepted
labelling standards.
Engine safety 3 Moving parts and
combustion engine
Power factor
Ensure instructions for
engine upkeep,
lubrication and
treatments is provided
Maintenance
Requirements
2 Farmers not having the
required
workforce/knowledge
to do so themselves
Replacing engine oil,
gas, cleaning - must be
done to be safe, this is
big risks if info is not
clear to developing
countries
Entanglement, drawing
in, trapping
3 Rotating shafts, moving
chains, belts
Safety guards, decal
Object striking the
operator, enabling the
seeder to function
properly
2 Material discharge, soil
residues
Installation of a furrow
opener on the seeder
The four main risks to be considered in the seeder system are the engine safety, the unsafe use
of the machine and the entanglement, drawing in, as well as cutting and searing injuries. Firstly,
there is a considerable risk for the machine operators to use the controls incorrectly, leading to
unsafe use of the machine. These circumstances result from the unfamiliarity that farmers may
have towards mechanized machinery on small-scale farms because they are not commonly used.
This risk will be mitigated by implementing training programs for users before the operation of
the machine, as well as ensuring that only farmers who know how to employ the seeder do so.
Further risks posed to machine operators involves injuries such as cutting or shearing, as well as
entanglement and drawings. To reduce the likelihood of this risk, the user must keep their hands,

39
feet and clothing away from moving parts. Finally, engine safety is yet another risk that can be
alleviated by ensuring that instructions for engine upkeep, lubrication and treatments are provided.
6.4. Financial analysis
A financial analysis will be conducted to compare the different economic considerations in
Canada as well as Rwanda. This will help the design team decide where to manufacture its
seeder.
6.4.1. Economic considerations in Canada
Ensuring the economic viability of the mechanized seeder implemented in sub-Saharan
African small-scale farmers is vital to the success of the project. The following financial analysis
is proposed. This analysis includes a breakdown of all applicable, and quantifiable economic
attributes of the design and is divided into three major economic subsections: Investments and
Costs (1.1), Cost-Benefit Breakdown (1.2), and Cost-Benefit Result (1.3).
The following monetary dollar values include applicable taxes and are in Canadian Dollars (CAD). Values
which were converted from United States Dollars (USD) were converted at a rate of 1.00 CAD = 0.75 USD (TSX).
6.4.1.1. Investments and costs
Table 3, as seen below, contains the cost of each component used in the manufacturing of
one unit. Each cost is final, including any additional fees that are associated with the component;
this includes any delivery or handling charges. As of April 2020, the total stakeholder investment
for the mechanized seeder is $1395.08.
Table 3. Cost breakdown in Canada (Source: Shoup Manufacturing, 2020).

40
*The price for labour was calculated assuming a minimum wage of $24.98 per hour, and estimating that the assembly
of the parts will take a total of 12 hours. The minimum wage is the standard salary paid in Canada.
**This varies based on purchaser location. $60 is the estimate for international shipping for a company, from Canada
to Africa, using standard USPS shipping channels.
***The price for all purposes will be treated as the SUBTOTAL amount, $1181.49, as HST does not apply to all
company expenses for manufacturing of goods. The HST amount is paid to the vendors, and later claimed and
reimbursed.
Note: The total price of building the prototype increased by $99.41 from the price presented in the
previous report as the initial design was altered and some components of the seeder were replaced.
This decrease is however not noticeable since labour costs to build the machine were added in this
report, explaining the increase in price.
6.4.1.1.1. Depreciation analysis
Agricultural Machinery Dep. Government Standard; South Africa = 40% in year 1, and 20% of
the current value per year for the following three years [declining balance]
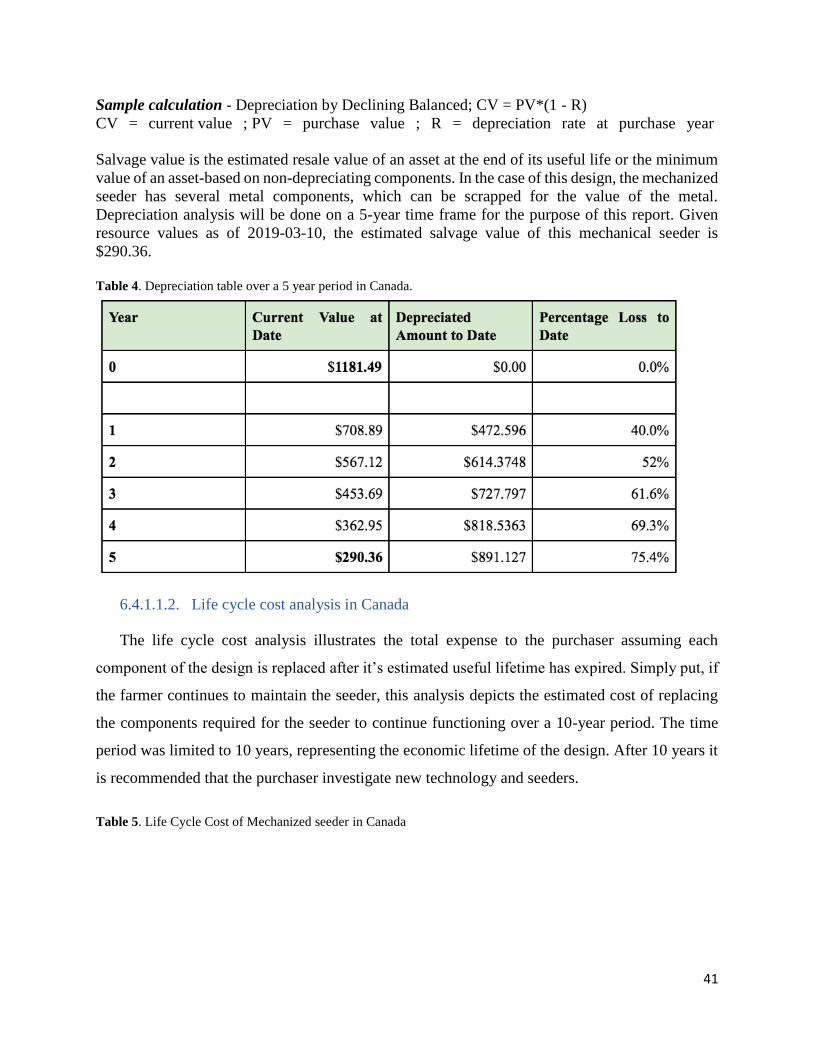
41
Sample calculation - Depreciation by Declining Balanced; CV = PV*(1 - R)
CV = current value ; PV = purchase value ; R = depreciation rate at purchase year
Salvage value is the estimated resale value of an asset at the end of its useful life or the minimum
value of an asset-based on non-depreciating components. In the case of this design, the mechanized
seeder has several metal components, which can be scrapped for the value of the metal.
Depreciation analysis will be done on a 5-year time frame for the purpose of this report. Given
resource values as of 2019-03-10, the estimated salvage value of this mechanical seeder is
$290.36. Table 4. Depreciation table over a 5 year period in Canada.
6.4.1.1.2. Life cycle cost analysis in Canada
The life cycle cost analysis illustrates the total expense to the purchaser assuming each
component of the design is replaced after it’s estimated useful lifetime has expired. Simply put, if
the farmer continues to maintain the seeder, this analysis depicts the estimated cost of replacing
the components required for the seeder to continue functioning over a 10-year period. The time
period was limited to 10 years, representing the economic lifetime of the design. After 10 years it
is recommended that the purchaser investigate new technology and seeders.
Table 5. Life Cycle Cost of Mechanized seeder in Canada

42
From the table above, it is concluded that to maintain the seeder for 10 years it will cost the
purchaser $362.73. Including the purchase price, this design has a total 10-year-cost of $1544.22
CAD.
6.4.1.2. Cost benefit breakdown in Canada
Farm power is vitally important to small farms assets. It improves labour productivity and has
the benefit of allowing family labour to be engaged in other income-earning tasks, whether
agricultural or not. A shortage of power in a farm constrains the increases in agricultural
productivity and may result in the stagnation of the farm’s family income, with a danger of sliding
towards poverty and hunger. However, for mechanization to be successfully implemented in small-
scale farms, it must contribute to an improvement in profitability and generate adequate returns in
order to justify the investments. Since small-scale farms usually do not hire employees, they
save labour costs. Precision farming, however, does save the farmers time, as the labour required
to conduct seeding operation of maize manually is 80 hours per hectare and 400 hours per hectare
to prepare the land before placing the seeds (van Hemst, 1986).
43
Sample calculation - Assuming a farmer produces $400 per month
($400/𝑚𝑜𝑛𝑡ℎ) × (80 + 400 ℎ𝑜𝑢𝑟𝑠/ℎ𝑒𝑐𝑡𝑎𝑟𝑒) × (1 𝑚𝑜𝑛𝑡ℎ / 730 ℎ𝑜𝑢𝑟𝑠 )
AMOUNT SAVED IN TIME VALUE = $263.01 per hectare
The amount saved in time value, calculated above, does not only save the farmer time
and labour for the seeding operation, but also saves them time in terms of land preparation and
opening of the furrow, as well as a seed covering.
Assuming that a small-scale farm of 0.47 hectares produces corn twice per year, with a
price of corn at $160 per metric ton; 10.9 metric tons per hectare of corn is produced. This comes
up to $1636.39 USD per year or $2177.22 CAD, which represents the farmer’s income before
costs, ie., not including seed price, materials, and equipment.
6.4.1.3. Cost benefit results
In this section, the Net Present Value (NPV), the Payback Period (PP) and the Internal Rate of
Return (ROI) are calculated and briefly analyzed to ensure the fiscal validity of the project. All
calculations seen below are based on a farm of one hectare in area. The NPV, the payback period,
and the return on investment would decrease proportionately with any increase in farm area as the
equipment investment would remain the same, however, labour and time savings would increase.
Additionally, the calculations were done over a 5-year period, assuming a cost of capital of 4%
which represents the current cost of capital of the Royal Bank of Canada business lawn. The fuel
price was neglected due to minimal fuel usage and variable prices especially in the African region,
however if they were, they are expected to be around $50 per year.
𝑵𝑷𝑽 = (𝐵0 − 𝐶0/ (1 + 𝑖)^0 ) + ( 𝐵1 − 𝐶1/ (1 + 𝑖)^ 1 )+. . . +( 𝐵𝑛 − 𝐶𝑛 /(1 + 𝑖) ^𝑛 )
𝑵𝑷𝑽 = $110.25 (>>0, thus this project is deemed very lucrative over a 10-year period)
𝑷𝒂𝒚𝒃𝒂𝒄𝒌 𝑷𝒆𝒓𝒊𝒐𝒅 = (𝐶𝑜𝑠𝑡 – 𝑠𝑎𝑙𝑣𝑎𝑔𝑒 𝑣𝑎𝑙𝑢𝑒) / (𝑠𝑎𝑣𝑖𝑛𝑔𝑠 𝑝𝑒𝑟 𝑦𝑒𝑎𝑟)
𝑷𝒂𝒚𝒃𝒂𝒄𝒌 𝒑𝒆𝒓𝒊𝒐𝒅 = (1181.49 – 290.36) / 263.01 = 3.4 𝒚𝒆𝒂𝒓𝒔 (This indicates that all costs will
be recovered in 3.4 years)
𝑰𝑹𝑹 = 7.042% (normally anything above the cost of capital, 4% in this case, is deemed
acceptable. This IIR is very high, once again confirming the fiscal success of this design.)
This is a strong return on investment for the purchaser of the product as it is significantly above
the cost of capital.

44
6.4.2. Economic considerations in Rwanda
6.4.2.1. Investments and costs
No data for the costs of each component used in the manufacturing of one unit in Rwanda was
available online. The design team first reverted to contacting Mr. Charles Bucago from the
Ministry of Agriculture in Rwanda. Despite several attempts, no answer was given. The team then
tried to look at other markets such as the Indian Agricultural Market and estimate the prices for
each part in Rwandan franc (FRw). A few challenges were faced while conducting this method;
parts such as the seed meter and its seed delivery tube, as well as the residue cutter were not found.
The prices had to be estimated comparing it to the Canadian prices. Overall, the total cost,
including delivery and handling charges were summed to 299545.13 FRw, or $451.63 CAD. This
total cost is final and includes delivery or handling charges, as of April 2020.
Table 6. Cost breakdown in Rwanda (Source: IndiaMART, 2020).

45
The design team was however still not pleased by the price that was calculated and reverted
to another approach. Generally, the price of materials does not fluctuate around the world. It is the
price of labour that makes a difference in the manufacturing of a product. This pushes companies
to manufacture their goods in developing countries.
In fact, it costs $1181.49 CAD to build the small-scale agricultural seeder prototype in Canada.
This includes the labour job involved in building the parts as well. The minimum wage for this
work in Canada is $24.98 per hour, whereas the minimum wage in Rwanda for the same amount
of work is $3 per hour, which shows that labour costs are 83% higher in Canada than in Rwanda.
Following this logic, the price for building the spare parts as well as assembling them in Rwanda
will be around $200.85.
6.4.2.1.1. Depreciation analysis
Agricultural Machinery Dep. Government Standard; South Africa = 40% in year 1, and 20% of
the current value per year for the following three years [declining balance]
Sample calculation - Depreciation by Declining Balanced; CV = PV*(1 - R)
CV = current value ; PV = purchase value ; R = depreciation rate at purchase year
Salvage value is the estimated resale value of an asset at the end of its useful life or the minimum
value of an asset-based on non-depreciating components. In the case of this design, the mechanized
seeder has several metal components, which can be scrapped for the value of the metal.
Depreciation analysis will be done on a 5-year time frame for the purpose of this report. Given
resource values as of 2019-03-10, the estimated salvage value of this mechanical seeder
is $49.3608. Table 7. Depreciation table over a 5 year period in Rwanda.

46
The salvage value is low in this case. However, since its initial price is low compared to the
products found in the market, farmers would be more encouraged to buy this product than other
ones. Additionally, when this prototype is commercialized, its manufacturing price will decrease
drastically which will make its price on the market lower.
6.4.2.1.2. Life cycle cost analysis in Rwanda
The life cycle cost analysis illustrates the total expense to the purchaser assuming each
component of the design is replaced after it’s estimated useful lifetime has expired. Simply put, if
the farmer continues to maintain the seeder, this analysis depicts the estimated cost of replacing
the components required for the seeder to continue functioning over a 10-year period. The time
period was limited to 10 years, representing the economic lifetime of the design. After 10 years it
is recommended that the purchaser investigate new technology and seeders.
Table 8. Life Cycle Cost of Mechanized seeder in Rwanda.

47
From the table above, it is concluded that to maintain the seeder for 10 years it will cost the
purchaser $268.27 CAD. Including the purchase price, this design has a total 10-year-cost of
$469.12 CAD, which is way lower than the 10-year-cost of the prototype built in Canada with
$1544.22 CAD.
6.4.2.2. Cost benefit breakdown in Rwanda
The Cost-Benefit breakdown is the same for this prototype as the one presented above.
6.4.2.3. Cost benefit results
In this section, the Net Present Value (NPV), the Payback Period (PP) and the Internal Rate of
Return (ROI) are calculated and briefly analyzed to ensure the fiscal validity of the project. All
calculations seen below are based on a farm of one hectare in area. The NPV, the payback period,
and the return on investment would decrease proportionately with any increase in farm area as the
equipment investment would remain the same, however, labour and time savings would increase.

48
Additionally, the calculations were done over a 10-year period, assuming a cost of capital of 4%
which represents the current cost of capital of the Royal Bank of Canada business lawn. The fuel
price was neglected due to minimal fuel usage and variable prices especially in the African region,
however if they were, they are expected to be around $50 per year.
𝑵𝑷𝑽 = ( 𝐵0 − 𝐶0/ (1 + 𝑖)^0 ) + ( 𝐵1 − 𝐶1/ (1 + 𝑖)^ 1 )+. . . +( 𝐵𝑛 − 𝐶𝑛 /(1 + 𝑖) ^𝑛 )
𝑵𝑷𝑽 = $778.46 (>> 0)
𝑷𝒂𝒚𝒃𝒂𝒄𝒌 𝑷𝒆𝒓𝒊𝒐𝒅 = (𝐶𝑜𝑠𝑡 – 𝑠𝑎𝑙𝑣𝑎𝑔𝑒 𝑣𝑎𝑙𝑢𝑒) / (𝑠𝑎𝑣𝑖𝑛𝑔𝑠 𝑝𝑒𝑟 𝑦𝑒𝑎𝑟)
𝑷𝒂𝒚𝒃𝒂𝒄𝒌 𝒑𝒆𝒓𝒊𝒐𝒅 = (200.85 – 35.66) / 263.01 = 0.63 years (This indicates that all costs will be
recovered in 0.63 years)
𝑰𝑹𝑹 = 128%
The NPV for the prototype produced in Rwanda is bigger than the NPV of the prototype used in
Canada, thus production should take place in Rwanda.
7. Conclusion
This report introduces a new developed mechanized seeder; an efficient upgrade in current
technology used in Sub-Saharan Africa that should be adapted by smallholder farmers. Soil
mechanics, agronomic requirements for crop establishment, seeder functional and operational
requirements, field efficiency, climatic data, and many other factors were taken into consideration
while designing the initial seeder. The Gaspardo seeder was disassembled to more closely fit the
preliminary design. The seeder was modelled in SOLIDWORKS, mechanical analysis was
conducted and verified in ANSYS to determine restrictions to any new seed meter that may be
attached. It was determined that the biggest environmental footprint was in the manufacturing
process. Additionally, it is most economical to produce it in Rwanda. For future work, it is
recommended to determine mechanical stresses on other components of the seeder, such as the
furrow opener, test the seeder in soil, modifying the design as necessary, and simulate soil machine
interaction using specialized software. Overall, although the project was not seen to completion
due to the COVID-19 outbreak, it was a great learning experience for the team.

49
8. Acknowledgements
Dr. G.S. Vijaya Raghavan
James McGill Professor, Department of Bioresource Engineering
Dr. Abdolhamid Akbarzadeh
Assistant Professor; Associate Member, Department of Mechanical Engineering
Mr. Marc Samoisette
Chief Agronomy Technician, McGill Macdonald Campus Farm
Mr. Scott Manktelow
Laboratory Superintendent, Department of Bioresource Engineering
Mr. Eko Leksono
Graduate student, Department of Bioresource Engineering
Mr. Vincent Durocher
Part Manager at Agritex, Montreal
Prof. Alexandre Courchesne
Research Associate, Polytechnique University

50
9. References
ABAQUS. (n.d.). Discrete element method. Retrieved from https://abaqus-
docs.mit.edu/2017/English/SIMACAEANLRefMap/simaanl-c-demanalysis.htm
Agrosope Reckenholz-Tanikon Research Station (ART). (2007). Life Cycle Inventories of
Agricultural Production Systems. Retrieved from
https://db.ecoinvent.org/reports/15_Agriculture.pdf
Anderson, K.W. (1953). New horizons in farm machinery development. Agr. Engin., 33(12). 765.
ASC. (2019). Agri-supply has farm supplies, tractor implements, and mower parts. Retrieved
November 29, 2019 from
https://www.agrisupply.com/?fbclid=IwAR2q1zlxZFEQ6LVf2tatENOCIc9_DWNEnLijHaa
hepHxnBHUDE-Tlx4maCE
Budynas, R.G., Nisbett, J.K. (2011). Shigley’s mechanical engineering design. New York: The
McGraw-Hill Companies, Inc.
CCMA Knowledge Base. (2013 Sept). How do I manage the impact of compaction? Retrieved
November 29, 2019 from
https://www.ccmaknowledgebase.vic.gov.au/brown_book/01_Compaction.htm
Coates, E.W. (2002). Agricultural Machinery Management. Retrieved from
https://cals.arizona.edu/crops/equipment/agmachinerymgt.html.
Condra, C., Buschermohle, M., Hart, W., Smith, A., Taylor, R., Porter, W., & Barnes, E. (2017).
Influence of planter width, planting speed, and Perimeter-to-Area Ratio on field efficiency for
row crop planters. In 2017 ASABE Annual International Meeting (p. 1). American Society of
Agricultural and Biological Engineers.
Deckler, H. C. (1991 Oct 21). US Patent No. US5058766A. Retrieved from
https://patents.google.com/patent/US5058766A/en
DEM Solutions Ltd. (2020). Home: EDEM Software. Retrieved from
https://www.edemsimulation.com/software/
Dragos, M., Gheorghe, V., Gigel, P., & Eugen, M. (2016). Performances evaluation of direct
seeder for grasslands. In proceedings of the international scientific conference. Latvia
University of Agriculture.

51
Earthway.com (n.d.). 1001-B Precision garden seeder. Retrieved November 29, 2019 from
https://www.earthway.com/shop/1001-b-precision-garden-seeder/
Engineering Toolbox. (n.d.). Stress, strain and Young’s modulus. Retrieved November 29, 2019
from https://www.engineeringtoolbox.com/stress-strain-d_950.html
FAOSTAT. (2011). http://faostat.fao.org.
Fechete-Tutunaru, L. V., Gaspar, F., & Gyorgy, Z. (2019).. Paper presented at the E3S Web of
Conferences.
Food and Agriculture Organization (FAO). (2003). World agriculture: towards 2015/2030.
Retrieved November 29, 2019 from http://www.fao.org/3/a-y4252e.pdf
Fortune of Africa Rwanda (n.d.). Maize. Retrieved November 29, 2019 from
https://fortuneofafrica.com/rwanda/maize/?fbclid=IwAR2_htEahttcjOt7abBC4DBU2Vc_S_
7SDoVoT6oJJK1JuoytjGADCIkRGpE
Garner, E. B. et al. (2015 Oct 29). US Patent No. US20150305231A1. Retrieved from
https://patents.google.com/patent/US20150305231
Gill, W. R., & Berg, G. E. V. (1967). Soil dynamics in tillage and traction: Agricultural Research
Service, US Department of Agriculture.
Horne, R., Grant, T., & Verghese, K. (2009). Life cycle assessment: Principles, practice, and
prospects. Retrieved from
https://ebookcentral.proquest.com/lib/mcgill/reader.action?docID=474357
Hunt, D. (2008). Farm power and machinery management. Waveland Press.
IndiaMART. (2020). Farming Tools, Equipment & Machines: Seeding Machine. Retrieved from
https://dir.indiamart.com/impcat/seed-sowing-machine.html
Johnny’s Seeds. (2019). Quick-guide to precision seeders. Retrieved November 29, 2019 from
https://www.johnnyseeds.com/growers-library/tools-supplies/quick-guide-choosing-small-
scale-seeder.html
Kabirigi, M., Ngetich, F., Mwetu, K., Rushemuka, P. & Wasige, J., Vicky, M. & Nabahungu, N.
(2017). Implications of tillage practices, management of soil surface and fertilizer application
on sustainable dryland agriculture: A case study of Eastern Rwanda. African Journal of
Agricultural Research. 12. 2524-2532.

52
Knoema (n.d.). Rwanda – maize production quantity. Retrieved November 29, 2019 from
https://knoema.com/atlas/Rwanda/topics/Agriculture/Crops-Production-Quantity-
tonnes/Maize-production
Lindbo, D. (2019). Soil types. Retrieved November 29, 2019 from https://www.soils.org/discover-
soils/soil-basics/soil-types/
Luce, G.A. (2016 Apr 6). Optimum corn planting depth. Retrieved November 29, 2019 from
https://ipm.missouri.edu/IPCM/2016/4/Optimum_Corn_Planting_Depth-
Dont_Plant_Your_Corn_Too_Shallow/
Mhlanga, B., Chauhan, B. S., & Thierfelder, C. (2016). Weed management in maize using crop
Murray, J., Tullberg, J.N., & Basnet, B. (2006). Planters and their Components: Types, attributes,
functional requirements, classification and description.
NEPAD. (2003 July). Comprehensive Africa Agriculture Development Programme. Retrieved
November 29, 2019 from http://www.fao.org/nr/water/aquastat/sirte2008/NEPAD-
CAADP%202003.pdf
Nzeyimana, I., Hartemink, A., & Geissen, V. (2014). GIS-Based Multi-Criteria Analysis for
Arabica Coffee Expansion in Rwanda. PLoS ONE. 9(10): e107449.
Oduma, O. (2018). Effect of soil physical properties on performance of agricultural field
machinery in south Eastern Nigeria. Agricultural Engineering International: CIGR Journal,
20(1), 25-31.
Raghavan, G. S. V., Alvo, P., McKyes, E. (1990). Soil compaction in agriculture: a view toward
managing the problem. In Advances in soil science (pp. 1-36). Springer, New York, NY.
Raghavan, G.S.V., Alvo, P., & McKyes, E. (1990). Soil compaction in agriculture: a view toward
managing the problem. Advances in Soil Science.
Sahu, M. & Verma, A. (2016 May). Evaluation of inclined plate metering mechanism for direct
seeding rate. International Journal of Engineering Research and Technology, 5(05).
Schafer, R., & Johnson, C. (1990). Soil dynamics and cropping systems. Soil and Tillage Research,
16(1-2), 143–152.
Sedara, A. (2019). A Review of Soil Dynamics in Traction Studies. Journal of Engineering
Research and Reports, 1-13.
Shoup Manufacturing. (2020). Planter Parts. Retrieved from https://www.shoupparts.com/search-
results/?term=%20Residue%20cutter%20&page=1
https://knoema.com/atlas/Rwanda/topics/Agriculture/Crops-Production-Quantity-tonnes/Maize-production

53
Sims, B. G. & Kienzle, J. (2006). Farm power and mechanization for small farms in sub-Saharan
Africa. Agricultural and Food Engineering Technical Report.
Sinha, S. (2018 July). Development of inclined plate seed metering mechanism for system of
chickpea intensification. Retrieved November 29, 2019 from
https://pdfs.semanticscholar.org/4ff1/de551a9b7e1398e324acd15cb8207f6518bf.pdf
Skoufias, E. et al. (2013 December). Crop intensification program (CIP). Retrieved November 29,
2019 from https://www.securenutrition.org/resources/crop-intensification-program-cip
Smith, H.P. (1948). Farm machinery and equipment. McGraw-Hill Book Company.
Talbot, J. (2017). Risk, Success and Leadership: What’s the right with risk matrices? Retrieved
November 29, 2019 from https://www.juliantalbot.com/post/2018/07/31/whats-right-with-
risk-matrices
Thoni L,. Seitler E. & Matthaei D. (2007) Ammoniak-Immissionsmessungen in der Schweiz 2000
bis 2006. Retrieved from http://www.bafu.admin.ch/luft/00649/01960/index.html?lang=de.
Umutoni, J. (2013 September). Improving firm-farm relationship in maize production in Rwanda.
Retrieved November 29, 2019 from https://edepot.wur.nl/279044
Uwitonze, P. (2016). Morphology, physico-chemical properties and classification of the soils
developed on volcanic parent materials of Northern Province of Rwanda (Doctoral
dissertation, Sokoine University of Agriculture).
Van Heemst, H. D. J. (1986). Crop calendar, workability and labour requirements. In H. van
Keulen, & J. Wolf (Eds.), Modelling of agricultural production: weather, soils and crops (pp.
251-262). (Simulation monographs). Wageningen: Pudoc. https://edepot.wur.nl/172074
Walters, R. D. (2013). Soil draft and traction. Technical note 21. USA: Department of Soil
Science, North Carolina State University.

54
Appendices
Appendix A – Pugh charts from BREE 490 preliminary design
Table 1. Pugh chart for residue cutting device.
RESIDUE
CUTTING
DEVICE
Plain
Disc
Coulter
Notched
Disc
Coulter
Bubble
Disc
Coulter
Ripple
Disc
Coulter
Wavee Disc
Coulter
Turbo
Disc
Coulter
Criteria
Weight
Cut residue
and displace
sideways
3 0 1 0 1 0 0
Penetrate
hard soil;
mild
disturbance
2 1 1 0 1 0 0
Minimal
seedbed
disturbance
1 0 0 -1 0 0 0
TOTAL 2 5 (good
for high
residue
and hard
soils)
-1 5 0 0
Table 2. Pugh chart for furrow opening device.
FURROW
OPENER
Concave
Disc
Bioblade Disc
Coulter
Powered Tine Type Runner
Type
Criteria Weight (Not good
for clay)
Minimal
seedbed
disturbance
2 0 1 0 0 0 0
Maintain
uniform
depth
2 1 1 1 0 -1 -1

55
Minimal
compaction
of furrow
walls
2 0 0 0 1 1 -1
Soil flow in
furrow after
not before
seed
placement
1 1 0 1 0 0 0
Adjustability
1 0 0 0 0 -1 0
Conducive to
seed delivery
2 1 1 1 1 0 1
Minimal
vertical force
2 -1 -1 0 0 0 0
Durability
2 0 0 -1 0 1 -1
Low cost 2 0 -1 0 -1 0
TOTAL 3 1 3 2 1 -3
Table 3. Pugh chart for seed covering device.
SEED
COVERING
Chain Concave
Disc
Finger Knife Paddle Tine Disc
Coulte
r
Finger
Wheel
Type
Criteria Weight
Regulate
depth of soil
cover
1 0 0 0 0 0 0 0 0
Relevel
seedbed
1 1 1 1 1 1 1 1 1
Minimal
disturbance
to seed or
seedbed
2 0 0 0 0 0 -1 0 0
Adjustability
2 1 1 0 1 1 0 1 1
Hard soil,
high residue
2 0 1 -1 -1 -1 -1 1 1
Simplicity 2 1 0 0 1 1 1 0 0
TOTAL 5 5 -1 3 3 0 5 5

56
Appendix B – SOLIDWORKS models of Gaspardo seeder
(Link to animated exploded view: https://mcgill-my.sharepoint.com/:v:/g/personal/sreedurga_cherukumalli_mail_mcgill_ca/EUpEt6WkBBVDrEnpXO2CCkUBaVdjcl5IuJplGGTS7ib_1A?e=WHkMX7)
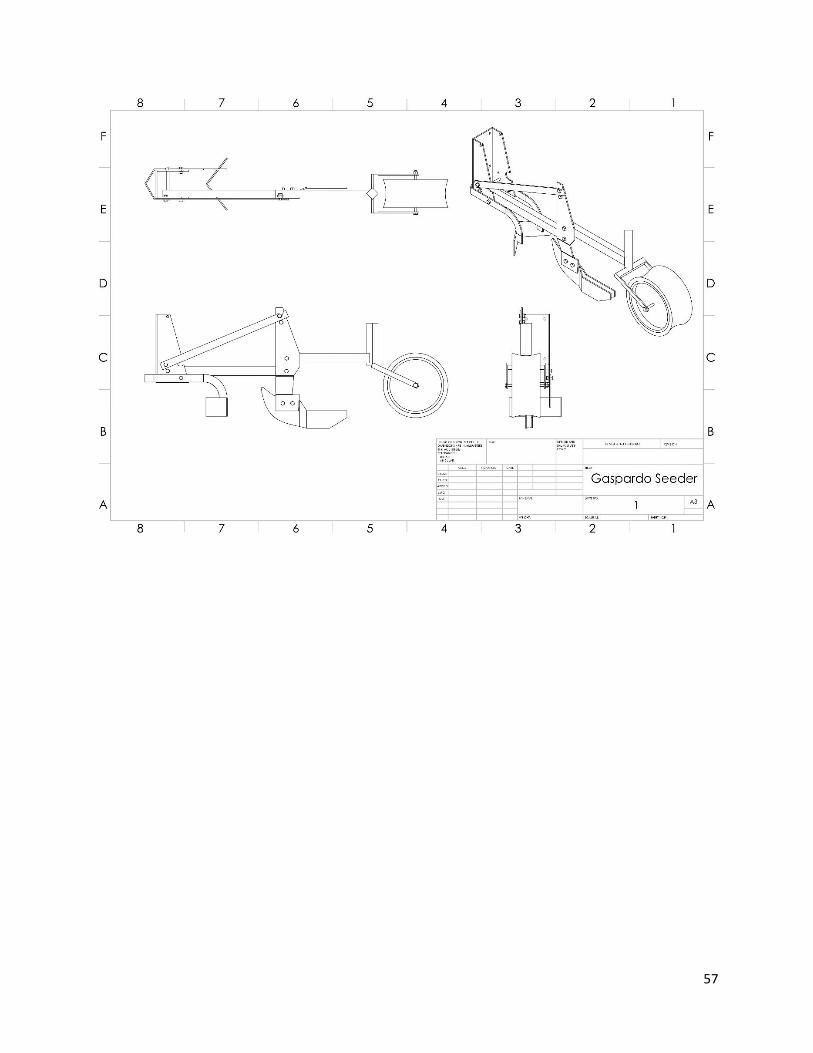
57

58

59

60

61

62
Appendix C – Mechanical analysis calculations
Mechanical analysis was conducted to determine the load that could be carried by the
beam holding the seed meter. It was assumed that the beam was only subject to bending stress,
shear stress was considered negligible. It was assumed to be simply supported with an
intermediate load (Fig. 1).
Figure 1. Shear, moments, and deflection of a simply supported beam subject to intermediate load. (Source:
Budynas & Nisbett, 2011).
Based on Figure 1 definitions of the seed meter beam:
𝑎 = 6 𝑖𝑛𝑐ℎ𝑒𝑠 = 0.1524 𝑚
𝑏 = 14 𝑖𝑛𝑐ℎ𝑒𝑠 = 0.3556 𝑚
𝑙 = 20 𝑖𝑛𝑐ℎ𝑒𝑠 = 0.508 𝑚
The cross-section properties are as follows:

63
where
𝐵 = 1.5 𝑖𝑛𝑐ℎ𝑒𝑠 = 0.0381 𝑚
𝐻 = 2 𝑖𝑛𝑐ℎ𝑒𝑠 = 0.0508 𝑚
𝑏 = 1 𝑖𝑛𝑐ℎ = 0.0254 𝑚
ℎ = 1.5 𝑖𝑛𝑐ℎ𝑒𝑠 = 0.0381 𝑚
Thus the moment of inertia is:
𝐼𝑥 =𝐵𝐻3
12−
𝑏ℎ3
12
𝐼𝑥 =(0.0381)(0.0508)3
12−
(0.0254)(0.0381)3
12
𝑰𝒙 = 𝟐. 𝟗𝟗𝟐 × 𝟏𝟎−𝟕𝒎𝟒
And distance to neutral axis:
𝑐 =1
2𝐻
𝑐 =1
2(0.0508)

64
𝒄 = 𝟎. 𝟎𝟐𝟓𝟒
Material properties are assumed based on ASTM A36 steel: 𝝈𝐦𝐚𝐱 = 𝟐𝟓𝟎 𝑴𝑷𝒂
Using the equation for maximum bending stress:
𝜎max = −𝑀𝑐
𝐼
where M is defined from Figure 1:
𝑀 =𝐹𝑏𝑥
𝑙
𝜎max = −𝑀(0.0254)
2.992 × 10⁻⁷
250 𝑀𝑃𝑎 = (84902.6) (𝐹(0.3556)(0.1524)
0.508)
𝑭 = 𝟐𝟕𝟔𝟎𝟏. 𝟕𝟏 𝑵

65
Appendix D – ANSYS simulation results

66

67
Appendix E – Soil calculations
Wheel slippage (Source: Walter, 2013)
𝑤ℎ𝑒𝑒𝑙 𝑠𝑙𝑖𝑝𝑝𝑎𝑔𝑒 % =(𝑁𝑢𝑚𝑏𝑒𝑟 𝑜𝑓 𝑡𝑢𝑟𝑛𝑠 𝑙𝑜𝑎𝑑𝑒𝑑 − 𝑁𝑢𝑚𝑏𝑒𝑟 𝑜𝑓 𝑡𝑢𝑟𝑛𝑠 𝑢𝑛𝑙𝑜𝑎𝑑𝑒𝑑) ∗ 100
𝑛𝑢𝑚𝑏𝑒𝑟 𝑜𝑓 𝑡𝑢𝑟𝑛𝑠 𝑢𝑛𝑙𝑜𝑎𝑑𝑒𝑑
Assuming the following:
Number of wheel revolutions loaded = 10
Number of wheel revolutions unloaded = 9
𝑤ℎ𝑒𝑒𝑙 𝑠𝑙𝑖𝑝𝑝𝑎𝑔𝑒 =(10 − 9) ∗ 100
9= 11%
Tractor performance can be calculated by summing wheel performances. Maximum TE is
obtained with slip ranges of (Coates, 2002):
4-8% for concrete;
8-10% for firm soil;
11-13% for tilled soil;
14-16% for soft soils and sands.
Assuming during planting time, the soil will be tilled. The slippage obtained above is in the
range of 11-13% for tilled soil.
Field efficiency (Source: Condra et al., 2017)
speed of row crop planter = 6.5km/h = 1.805m/s
row spacing = 0.508m
number of rows = 2 (farmers are able to add more on the machine)
Turning, adjusting the planter, adding seeds and other losses account for 10 %
The average width of cut to be 0.15m less than the machine working width
Area covered = 1ha = 10000m^2

68
𝐹𝑖𝑒𝑙𝑑 𝑒𝑓𝑓𝑖𝑐𝑖𝑒𝑛𝑐𝑦 (%) =𝐸𝑓𝑓𝑒𝑐𝑡𝑖𝑣𝑒 𝑓𝑖𝑒𝑙𝑑 𝑐𝑎𝑝𝑎𝑐𝑖𝑡𝑦(𝐸𝐹𝐶)
𝑇ℎ𝑒𝑜𝑟𝑒𝑡𝑖𝑐𝑎𝑙 𝑓𝑖𝑒𝑙𝑑 𝑐𝑎𝑝𝑎𝑐𝑖𝑡𝑦(𝑇𝐹𝐶) ∗ 100
𝑇𝐹𝐶(ℎ𝑎/ℎ) =𝑡𝑟𝑎𝑣𝑒𝑙 𝑠𝑝𝑒𝑒𝑑 (
𝑘𝑚ℎ𝑟
) ∗ 𝑚𝑎𝑐ℎ𝑖𝑛𝑒 𝑤𝑜𝑟𝑘𝑖𝑛𝑔 𝑤𝑖𝑑𝑡ℎ (𝑚)
10
𝑚𝑎𝑐ℎ𝑖𝑛𝑒 𝑤𝑜𝑟𝑘𝑖𝑛𝑔 𝑤𝑖𝑑𝑡ℎ (𝑚) = 𝑟𝑜𝑤 𝑠𝑝𝑎𝑐𝑖𝑛𝑔 ∗ 𝑛𝑢𝑚𝑏𝑒𝑟 𝑜𝑓 𝑟𝑜𝑤𝑠
𝑚𝑎𝑐ℎ𝑖𝑛𝑒 𝑤𝑜𝑟𝑘𝑖𝑛𝑔 𝑤𝑖𝑑𝑡ℎ (𝑚) = 0.508𝑚 ∗ 2 = 1.016𝑚
𝑇𝐹𝐶 =6.5 ∗ 1.016
10= 0.66
ℎ𝑎
ℎ
𝐸𝑓𝑓𝑒𝑐𝑡𝑖𝑣𝑒 𝑤𝑖𝑑𝑡ℎ 𝑜𝑓 𝑐𝑜𝑚𝑏𝑖𝑛𝑒(𝑚) = 1.016 𝑚 − 0.15𝑚 = 0.866𝑚
𝑇𝑖𝑚𝑒 𝑡𝑎𝑘𝑒𝑛 𝑡𝑜 𝑐𝑜𝑣𝑒𝑟 1ℎ𝑎 (𝑠) =𝐴𝑟𝑒𝑎 𝑐𝑜𝑣𝑒𝑟𝑒𝑑
𝑛𝑒𝑤 𝑤𝑖𝑑𝑡ℎ ∗ 𝑠𝑝𝑒𝑒𝑑
𝑇𝑖𝑚𝑒 𝑡𝑎𝑘𝑒𝑛 𝑡𝑜 𝑐𝑜𝑣𝑒𝑟 1ℎ𝑎 (𝑠) =10000
0.866 ∗ 1.805= 6395.45𝑠
𝑇𝑖𝑚𝑒 𝑙𝑜𝑠𝑡 = 10% ∗ 𝑡𝑖𝑚𝑒 𝑡𝑎𝑘𝑒𝑛 𝑡𝑜 𝑐𝑜𝑣𝑒𝑟 1ℎ𝑎 = 12.5% ∗ 6395.45 = 767.45𝑠
𝑇𝑜𝑡𝑎𝑙 𝑡𝑖𝑚𝑒 (ℎ) =𝑡𝑖𝑚𝑒 𝑙𝑜𝑠𝑡 + 𝑡𝑖𝑚𝑒 𝑡𝑎𝑘𝑒𝑛 𝑡𝑜 𝑐𝑜𝑣𝑒𝑟 1ℎ𝑎
3600= 1.99ℎ
𝐸𝐹𝐶 (ℎ𝑎/ℎ) =𝐴𝑐𝑡𝑢𝑎𝑙 𝑎𝑟𝑒𝑎 𝑐𝑜𝑣𝑒𝑟𝑒𝑑
𝑡𝑜𝑡𝑎𝑙 𝑡𝑖𝑚𝑒
𝐸𝑓𝑓𝑒𝑐𝑡𝑖𝑣𝑒 𝑓𝑖𝑒𝑙𝑑 𝑐𝑎𝑝𝑎𝑐𝑖𝑡𝑦 (ℎ𝑎
ℎ) =
1ℎ𝑎
1.99ℎ= 0.502ℎ𝑎/ℎ
𝐹𝑖𝑒𝑙𝑑 𝑒𝑓𝑓𝑒𝑐𝑖𝑒𝑛𝑐𝑦 (ℎ𝑎
ℎ) =
0.502
0.66∗ 100 = 76%
Draft power ((Raghavan, Alvo & McKyes, 1990))
𝐷𝐼 = 𝐹𝑖 (𝐴 + 𝐵𝑣 + 𝐶𝑣2)𝑤𝑑

69
𝑃𝑑𝑏 =𝐷𝐼 𝑣
3.6
DI = implement draft (N)
Pdb= drawbar power, kW (However, tractors are rated by brake power or net flywheel power
rather than drawback power)
From the table
Fi = dimensionless texture adjusted factor = 1.0.
i = 1 for fine, 2 for medium, 3 for coarse textured soils (medium for this paper). F for medium=
1.0
A = 500, B=0.0, and C=0.0 for row planter for seeding only.
d = tillage depth, cm (1.0 is used for seeders)
w = rows for seeder
v=travel speed = 6.5km/h
𝐷𝐼 = 1.0 (500 + 0.0 ∗ 6.5 + 0.0 ∗ 6.5^2) 2 ∗ 1 = 500𝑁
𝑃𝑑𝑏 =500 ∗ 6.5
3.6= 0.903𝑘𝑊
Assuming the soil ahead of the disk and under the tractor is tilled, the ratio between drawbar and
flywheel power is 0.73.
𝐸𝑞𝑢𝑖𝑣𝑎𝑙𝑒𝑛𝑡 𝑝𝑜𝑤𝑒𝑟 =0.903
0.73= 1.24 𝑘𝑊

70
Appendix F – Preliminary GANTT Chart
[not followed exactly as shown]