Breast Tax : Social Oppression of Dalit Women - JND Meerut
254
-
Upload
khangminh22 -
Category
Documents
-
view
2 -
download
0
Transcript of Breast Tax : Social Oppression of Dalit Women - JND Meerut


Chief Editor
Dharam Vir
Founder
Padma Shri S. S. Shashi
Volume 26, Number 3 (July-September), 2017
RESEARCH FOUNDATION INTERNATIONAL (INDIA)Affiliated to United Nations Organization (UNO)
(An Autonomous, Registered (1972), Recognized Charitable Organizationof Social Scientists, Authors, Journalists and Social Activists)
<Visit us at : https://www.jndmeerut.org>e-mail : < [email protected]>
Contemporary Social Sciences
Approved by University Grants Commission (UGC)Index Copernicus ICV : 62.45; General Impact Factor : 2.495
Global Impact Factor : 0.765; NAAS Rating : 2.88; InfoBase Index : 3.64
Double-blind Reviewed, Indexed & Refereed Quarterly International Journal

Editorial BoardFOUNDER
Padma Shri S. S. Shashi, Executive Chairman, Research Foundation International (India)
and Former Director General, Publications Division, Government of India, ‘Anusandhan’,
B-4/245, Safdarjung Enclave, New Delhi–110 029, India.
CHIEF EDITOR
Dharam Vir, Former Head, Department of Post-graduate Studies and Research in
Sociology, Nanakchand Anglo Sanskrit College, CCS University, Meerut–250 004, India.
ASSOCIATE EDITORS
Sanjeev Mahajan, Department of Post-graduate Studies and Research in Sociology,
Nanakchand Anglo Sanskrit College, Ch. Charan Singh University, Meerut–250 004,
India.
Richa Singh, Secretary (Academics), Social Science Division, Research Foundation
International (India), Delhi–110 029, India.
MANAGING EDITOR
Kamlesh Mahajan, Former Head, Department of Sociology, Ismail National Mahila
Post-graduate College, Ch. Charan Singh University, Meerut–250 004, India.
BOOK REVIEW EDITOR
S. K. Gupta, Professor of Sociology (Retired), Panjab University, Chandigarh–160 014,
India.
CONSULTING EDITORS
Dr. A. K. Singh (Assistant Coordinator, IGNOU Centre, Rohini, Delhi); Prof. B. K. Nagla
(M. D. University, Rohtak); Prof. Bhoumik Deshmukh (University of Pune, Pune); Prof.
D. P. Singh (NIILM-CMS, Noida, India); Prof. Ho Chin Siong (Department of Urban and
Regional Planning, Universiti Teknologi Malaysia); Prof. I. S. Chauhan (Former
Vice-Chancellor, Barakatulla University, Bhopal); Dr. László Vasa, (Faculty of Economics
and Social Sciences, Szent István University, Hungary); Dr. Mamta Singh (Academic
Counsellor, IGNOU Centre, Rohini, Delhi); Prof. Neelam Grewal (Dean Postgraduate
Studies, Punjab Agricultural University, Ludhiana); Dr. R. W. Sherman, (Adjunct
Associate Professor, Silberman School of Social Work, New York); Prof. S. S. Sharma (CCS
University, Meerut); Prof. S. K. Gupta (Panjab University, Chandigarh); Prof. Satya
Prakash (Department of Law, N. A. S. College, Meerut); Prof. Wang Xiaoyi (Director,
Rural and Industrial Sociology, Institute of Sociology, Chinese Academic of Social
Sciences, Beijing, China).
ISSN 0302-9298
World Copyrights of articles published in CSS are controlled by Contemporary Social
Sciences, 1972. No part of this publication may be reproduced in any form without written
permission of the Editor.

Contents
1. Khagi Caste Reservation and Emerging Patterns of Leadership
Tejpal Singh 1
2. Globalization and Indian English Fiction
Rahul Singhal 9
3. Breast Tax : Social Oppression of Dalit Women
Vichitra Gupta 17
4. Empowerment of Women through Higher Education of IGNOU
Amit Chaturvedi and Bhanu Pratap Singh 27
5. Desirability and Feasibility of Holding Simultaneous Elections in India
Triranjan Raj 41
6. Social Area Analysis and Case Study of Virugambakkam Ward in Chennai
District, Tamil Nadu (Using Statistical Techniques)
Dayalan, N. 59
7. Right to Education Act : A Catalyst to Development
Soumen Saha and R. P. Juyal 77
8. Active and Reflective Learning Styles among Adolescents and their
Siblings and its Relation to their Academic Achievements
Supriya Yadav and Mukta Garg 89
9. Prevailing Market Trends in the Upper Garments for Young Women
Neha Sood and Harminder Kaur Saini 95
10. Social Networking Sites and Adolescents
Pirshant Kumar and Deepika Verma 103
11. Implementation of Governance Reforms in Punjab : Delivering Services
with Citizen Centric Approach
Meenakshi Madaan 111
12. Ethnicity and Land Ownership in Nepal
Tika Ram Gautam 123
13. Women, Education and Stereotyping : An Analysis on Participation of
Women in Higher Education
Manik Sharma 137
14. Social Media : An Emerging Tool of Teaching and Learning
Pirshant Kumar 149
15. Infrastructure of Powerloom Shawl Weaving Units in Ludhiana
Omika Sharma and Vandana Gondotra 155

Contents (Continued)
16. Child Sexual Abuse and the POCSO Act
Geetika Garg 161
17. Elementary Educational Status of Girl Child in Rural India : A Sociological
Analysis of Uttar Pradesh
Mamta Sagar 173
18. Culture and Displacement : Two Case Studies
Rajni Bala 183
19. Communication and Development
Manoj Kumar Srivastava 191
20. Critical Theory and Social Movement Analysis : Theoretical Insights into
New Social Movements
Yumlembam Khogen Singh 199
21. Role of National Movement of Twentieth Century in the Elevation of
Women’s Education : A Review Article
Seema Chaudhary 207
22. Inter-Gender Drudgery in Paddy Cultivation
Anshu and S. K. Varma 213
23. Telecom Infrastructure Development : Study of Rural India
Faiza Nafees 219
24. GST in India : Beneficial or not ?
Rekha Garg 225
25. The Realities of Aging in India
Renu Agarwal 233
26. Who Accesses to Media in Taiwan? A Study on Public Access Channels in
Cable Television Systems
Ping-Hung Chen and Yu-Yi Chen 241

1
Khagi Caste Reservation and
Emerging Patterns of Leadership
Tejpal Singh*
Leadership plays an important role in shaping the socio-economic and political structure of any society. Emergence and development of leadership is the result of social interaction among themembers of the community. The term “caste” is used to designate each unit n the hierarchicallyarranged organic systems of closed groups to be found on the Indian subcontinent. Reservation isa mean to increase representation of hitherto under-represented caste groups and thereby improvediversity on campus. The findings are the benefits of reservation all the three level of panchayat the crowds got crowded before the male literacy rate was 5% & female was nil but after the interest ineducation male literacy became 25% & female increase 15% from Zero. The working so he awarethe people after the reservation they aware about the politics & competition. The independence ofKhagi Caste leadership is trying to near about the education & always try to stop the social &economic loss of Khagi Caste. Leadership is committed to make the inter college for making theatmosphere in villages. Leadership is trying to make the social equilibrium to aware about thewomen. The respect and Khagi people and Khagi leadership acceptance will increase by other caste. The drunkenness, dowry and child marriage stops.
[Keywords : Leadership, Varna system, Caste, OBC, Reservation, Constitution,
Emerging pattern, Child marriage]
1. Introduction of the Problem
Leadership is the exercise of power or influence in social collectivities, such as
groups, organizations, communities or nations. This power may be addressed to
CONTEMPORARY SOCIAL SCIENCES, Vol. 26, No. 3 (July-September), 2017
* Research Scholar, Department of Sociology, CCS University Campus, Meerut, Uttar Pradesh(India) E-mail: <[email protected]>

any or all the three very general and related functions establishing the goals,
purpose or objectives or the collectivity, creating the structures through which the
purposes of the collectivity are fulfilled; and maintaining or enhancing these
structures, sociological studies have emphasized the last function. This emphasis
has implied on the interest in the role of leadership in maintaining the integrity and
viability of the collectively against threats, both internal and external in maintaining
collective orders and unity (Sills, 1968). Some social scientists understands
leadership as a necessary social function within groups and institution, while others
interpret in terms of individual characteristics that seed the drive for power and
facilitate success or failure in exercise. Leadership plays an important role in
shaping the socio- economic and political structure of any society. Emergence and
development of leadership is the result of social interaction among the members of
the community. Establishment of leadership is the leadership pattern is fully
determined by the individuals powers and influence over the society. In any
developing society, where the process of modernization of political structure is
going on at a rapid pace, the study of the leadership pattern appears to be changing
from the traditional oriented system to the modern institutional system.
The term “caste” is used to designate each unit n the hierarchically arrangedorganic systems of closed groups to be found on the Indian subcontinent. Besidesthis, it has been applied to the classical division of Hindu society and to systems ofranked and closed populations found outside India. The Indian caste systempresents an extraordinarily complex social phenomenon. The great size and spatialextension of the population concerned and the close interlocking of religious andsecular features have produce a luxuriance of local variation form which it isdifficult to draw consistent features and give them their precise emphasis. Socialscientists have been interested in the caste system as a type of social stratification.But for a long time their knowledge rested on the largely descriptive accounts ofwriters interested in providing general ethnographic, on the Hindu literary classes. It is only in recent years that detailed studies of local caste hierarchies have beenmade. Hence, the relation of the Indian caste system to other systems ofstratification and social grouping has by no means been agreed upon, and it isdebatable whether castes exist outside India and its immediate neighbors.
Reservation is a mean to increase representation of hitherto under-represented caste groups and thereby improve diversity on campus. Reservation is a form of affirmative action designed to improve the well being of backward andunder-represented communities defined primarily by their ‘caste’ it’s aphenomenon that commenced with the coming into force of the Indian constitution however, lately preferential treatment on regional basis has either beennon-statutorily introduced in the educational institutes or is being advocated inboth jobs and lowly professions like auto-rickshaw-drivers.
The spirit of equality pervades the provisions of the constitution of India, asthe main aim of the founders of the constitution was to create an egalitarian society
2 Tejpal Singh

Khagi Caste Reservation and Emerging Patterns of Leadership 3
wherein social, economic and political justice prevailed and equality to status andopportunity are made available to all. However, owing to historical and traditionalreasons, certain classes of Indian citizens are under severe social and economicdisabilities, so that they cannot effectively enjoy either equality of status or ofopportunity. Therefore the constitution accords to these weaker sections of societyprotective discrimination in various articles, including Article 1594). This clauseempowers the state, not withstanding anything to the contrary in Article 15(1) and29(2), to make special reservation for the advancement of any socially andeducationally backward classes of citizens or for Scheduled Castes and ScheduledTribes.
2. Introduction of Khagi Caste
People from Khagi Caste live from Dehradun to Kannauj on the north side ofGanga. Chhote lal Sharma wrote in the book jaati anveshan that in the year 1901,the Indian census, they were named as Khagi because it goes to farmer ofRuhelkhand. At some time it used to be a king himself. Today, there is onlyfarming. It is famous in Bareilly that these people are the descendants of theSagarwanshi king Bhagirtha. Karag and Khadag in the linage of Sagar, LodhiKhem singh verma , in a Lodhi Kshatriya vrahat Itihas writes that the people ofKhagi community and Lodhi also Live in Tarai. These people were skillfull inrunning the sword, so called khadagwanshi. Remember this is the same area where there was a grim conflict with the Parshuram of Chandravanshi Kshatriyas. Todaythis community is more known than Khadagvanshi but by the name of Khagi.
After Khadag they referred as Khagi & after this reflection they called asKhagi. Khagi is variant of Lodhi’s which is now by a different name. Some peoplesay that they are the ancestor of Maharana Pratap. They believe that betweenAkbar & Maharana Pratap Haldighati had happened and Maharana Pratap wasdefeated in the war. Then Maharana Pratap went along with his companions andwent to the hills of Arawali to eat all this. But it is not because Maharana Pratap was born in 1542 and in Akbar’s 1542, and the battle of Haldighati in 1563. After thiswar had been almost 422 years. The people of Khagi caste were known by the nameKhagi thus Khagi people are not apart of Maharana Pratap. After the completeresearch, it is known that the people of Khagi caste lived in Ajmer and Chittorgarh,Rajasthan and there was a war in the Mughals foreign rules. In which manywarriors were killed. Some rugged terrain on the bank of the Ganga settled down.
Came & started living & khagi people live in the Dense forest. When the othercaste people ask them that what is your caste then they answered “We areKhakhin” The Pronunciation of the work Khakin transform to Khagi. Khagi people are not belongs to Rajput Surely but they have some similarities like Rajput.Because this society does not have the living standard like that Rajput. But theyseems that they have worked as Soldier for Rajput according their loyalty &magnificence when this caste goes anywhere then they got he respect in respect oftheir respectable nature the people of this caste have the guts to keep mostly spears.

Their loyalty is like soldiers Khagi caste lives for help other people mostly this caste lives in all over India in small community but they lives on the river bank mostly.This is the troops strike of sipesalar that known as a Khagi caste. Sometimes welistened that wherever they not work there they “Khagan Jaya Ya Baghin Jaya” themother title of Khagi caste compare like Baghin.
There is Lack of education in Khagi caste. In Lodhi Kshatriya Great historyKhagi in said to be a sword those live in the bank of ganges river on the north sideonly this appears to be that in the form of soldier. These people had put their feet on the banks of river ganga and since then these people became native here. Thesepeople are not found on the south bank of river Ganga.They inhabit a large number on the north bank of the river gangas. This is not by the rulers and princes, becausethese people spent their lives in Bravery without slavery.
The Kalyan Singh Government put the Khagi caste into the OBC from general the main work of Khagi caste is farming & animal husbandry. They live in the bankof ganges river at north side Tarai area. The literacy rate of male & female is 25%and 10% respectively. The Government participation in negligible . They use tochild marriage near about 13-14 years. When someone ask them about the childmarriage then they reply “The family of girls mostly pressure to the society tomarry immediately” Then the boys family sacrifice for it doing dowry practice ismarried on the condition of giving bike. Sometimes the boy’s age is less than that ofa girl so that she can handle the farming. Mainly the marriage depends on the landare men are non-working whenever the woman use to wear kilt & finish all thework in same.
14 years old Jagat Singh has marriage in upcoming September. When heasked then he said if other are doing so then why could not I. What can we do aftereducate? Let you not see that a graduate going to work in farms many people is likethat there is not a single graduate. Mostly youth of Khagi caste seemsmalnourished being the competition of Khagi leaders makes them selfless so theleadership got Disappointment by Khagi peoples. Mostly Khagi caste does notknow that they are under the reservation benefit the elderly people think that nowa day They are starting to called them Rajput & suddenly they put in lower caste(OBC) as they thought. Which is not fair the society. The people belongs to thiscaste does not have the food & drink with the SC/ST caste. Keeping less their logicfor the boys illiteracy is that the boy will be dumb then who will work in fields.Hawker Ashish Kumar tells there is the purchasing the news papers near about 370 in 22 villages. The simplicity of the Khagi is that they kept their money in the roofburns along with the roofs. Then Khagi started placing their money to Lalaa’s,Lalaa’s charge the Interest for keeping the money. When they had need of themoney then Lalaa tells them I am giving the money on interest & your money issafe in Bank for future & they take the money on interest from the same personwherever they have put their money. Means the money of Khagi, Lala use theirmoney from them to take the double interest and become rich. Now the Khagipeople have started to understand this sense of society and politics.
4 Tejpal Singh

Khagi Caste Reservation and Emerging Patterns of Leadership 5
3. Case Studies of Five Khagi leaders
3.1 Budhsen Khagi (70)
Matric Pass, born in a Simthala village, the landlord of the agriculture landnear about & Heatare & the father of 7 children. In addition to agriculture theworked as a assistant of a lawyer. In nomination for the Bahjoi, legislative assembly seat then the office asked to Budhshen Khagi who was the proposes for Takchand,“Which cast Khagi belongs to” he answered “who the administration does notknow” the Buddhshen promise that if I can not identify my cast then I will leave the politics forever and I will think I am not unable to politics.
In 1995 he elected for the Jila Panchayat member in the same year he get achance to meet the national president of BSP Miss Mayawati & discussed about the Khagi caste to include in OBC caste from General cast & also discus to identify thesociety in country. After so many struggle the Kalyan Singh government selectedthis caste for OBC cast in Amroha district keeping in view, the majority of Khagicaste. Mayawati gave him ticket from Sambhal loksabha in 1998 where in theopposition was Mulayam Singh Yadav for SP & third was D.P. Yadav then he fightthe election and got 1300000 vote and ranked third position then the behaviour ofKhagi caste mention that they stamped 15000 vote as double stamp because theywere thinking that the vote were be doubled.
In the same election the Delhi media came for cover the report & questionedto Budhsen “were you in fear in the opposition to Mulayam Singh & D.P. Yadav”he replied neither Mulayam nor D.P. Yadav is nothing the peoples of the assemblyare everything. After that election Khagi caste come in light & sometimes they were able to get the space in newspaper. The major effect of election was that the Khagicaste courage & courage which made possible by people interest & lone after thatKhagi start to join the politics their activism grow in the political parties. Politicallyorphan caste start to meet the leaders. In 1999 mid-term election were held in which BSP choose him for the candidate from Sambhal Lokshabha then he got 138000 vote in favor and he again lost the election.
In 2004 he contested from Gunnaur Vidhansabha By-Election and now theopposition was Mulayam Singh Yadav once again. In 2007 BSP come ingovernment then CM Mayawati make him the minister of status for electroniccorporation, U.P. chairperson, After the minister Khagi caste grow more politicallyeconomically consciousness According to demand Khagi caste comes to moreinterested in politics & they consider the pulse of politics the started self decision intheir own interest & development.
Receiving the benefits of reservation all the three level of panchayat thecrowds got crowded before the male literacy rate was 5% & female was nil but afterthe interest in education male literacy became 25% & female increase 15% fromZero. Women have begun the wear sophisticated modern clothes and leave wearthe kilt-old tradition begin to break.“khagi hata bhala, ya Data bhala”, proverb hasstarted to weaken he wrote Nirbheek Khagi (1998), “Chhoti si bhool” (2012) &

“Soch” (2014) etc. books in present he is trying to include the Khagi caste in OBC incentral government.
3.2 Kailash Kumar Khagi (30)
M. Com, L.L.B. Degree holder Kailash Kumar is belong to Inkonda villageand he have 10 Beegha agriculture land in addition. He is a lawyer by profession.By forming the Khagi Yuva Samiti, he is being aware for education & reservationunder the banner of Yuva Samiti. He wrote a letter to U.P. President about theproblems of Khagi caste at thus the President said that I am meeting a first personin the last 67 years after the Independence and today I come to know that there is acast name Khagi in UP. The copy of memorandum has been sent to the Sc/Stcommission of India. At this the centre government act to a report. Often happensthat the caste Ridiculed by the officers after listen the Khagi caste. The surveyingwork of Khagi caste is pending due to the political approach. He tries to meet thePresident of India by writing the letter 6 times but the logic was that there is no time for meeting not possible. He is working to aware the youth and prepare the youthto work in caste because Khagi will know about the reservation & fight to get it. Hemain drawback of this caste is that they thing that the education is unnecessary sohe is working to get in touch the society to education. He is making the peopleaware to leave the Indigenous liquor. Baroque of money in theatres. He is workingso he aware the people after the reservation they aware about the politics &competition.
3.3 Subhash Singh (32)
10th pass Subhash Singh is the head of Shahpur Kalan. He grow theagriculture of 35 bighas land. His grand father has been a village Head fo 25 yearsin three Election the villagers selected him without any election. In order to pursuethe heritage of grandfather. He contested the Election of the Gram Pradhan. Thevillagers use the 2150 votes from 2800 votes & he got 439 vote & win the Election.OBC cast reserved this seat there were many other OBC candidates in hisopposition but the unity of Khagi caste & political awareness won the main point of this victory. Shahpur Khurd village is also the part of the gram panchayat. There isnot any government employee in Shahpur Khurd other than one only a graduateEmployment service. Not any person did not success to get the government job.The ladies of the village wears only kilt. Men play card in lane & street corner orkeep sleeping. Women work so hard and their is mischief like child marriage. Thehead of village see this situation as a challenge. For the independence of KhagiSociety He is trying to near about the education & He always try to stop the social & Economically loss of Khagi Caste.
3.4 Than Singh (60)
8th pass Than Singh belongs to Nawabpura Khurd village. He is the owner of12 bigha agriculture land in addition he is working as a security guard in Hasanpur Kotwali as 22 years long. For the help of villagers & for the police help he join this
6 Tejpal Singh

Khagi Caste Reservation and Emerging Patterns of Leadership 7
job. When any person are captured by police action then he tries to free that personby urge to police officers. By doing this he is succeeded in winning the confidenceof the villagers & villagers defeat the afraid of police. He elected as the deligate ofThe Kisan Sehkari Chini Mills Limited, Gajraula Hasanpur, Kalakhera for threeyears. The work to pass the low quality cane of Khagi caste make the member slip,first to weight and the arrangement of fertilizers & seeds and also to pay theamount of cant timely for villagers was his priority. The present castism tradition is their main aim because somewhere the Khagi caste not participate with the Sc/Stcaste. This is the result of the awareness of Khagi caste that He is able to force onpublic representative for their work. He is committed to make the inter college formaking the atmosphere in villages. He is trying to make the social Equilibrium toaware about the Women.
3.5 Gangasaran Advocate (64)
BA, LL. B passed, Gangasaran adv. Was born at village chakanwala Aitmali.In the addition of agriculture he in a advocate also by profession. He thank thatthere is no any way to social service other then politics. So he decide to be apolitician. He worked as a gram pradhan his 24 years in chakanvala village and five years as a block pramukh in Gangeshwari block and five years his wife was blockpramukh from same block named Hardei and he elected for the secretary of UttarPradesh rural development Pvt. Ltd. Bank. And he contested the Vidhansabhaelection from the Hasanpur Vidhansabha in 2012 and 2017, he faced to loses boththe times. In the starting time of politics the Khagi caste was so backward on everysocial aspect. They faced the exploitation by other castes. They were exploited andbeaten by them. They were betrayed in legal charge and the Lala society use themfor their benefits so the gangasaran start to join politics to secure the society fromthis type of illegal torture and work for their development the Khagi caste. It was inmajority but their politician became other caste. Thus the result education andsocial vigilance of Khagi caste that the first time, the Mahendra Singhkhadagvanshi is elected MLA for UP Vidhansabha.
Court’s Lowsit did not come in court. He try to resolve all the case in villagethrough the panchayat of any case come in court, then the help people throughadvocacy the society find out the political leadership after reservation. Looked bynon Khagi ended after the leadership. Education is promoted , awareness hasincreased .
Now the Khagi caste will raise their issues in vidhansabha, this is the way ofhope. Khagi caste choose the Gangasaran for Khagi Vikas Samiti as a state secretary and he tries to fight that the Khagi caste. After that the respect and Khagi peopleand Khagi leadership acceptance will increase by other caste. The drunkenness,dowry and child marriage stops.
4. Findings
Findings of this study are summarized as under :

1. The benefits of reservation all the three level of panchayat the crowds gotcrowded before the male literacy rate was 5% & female was nil, but after theinterest in education male literacy became 25% & female increase 15% fromZero.
2. Leadership made aware the people after the reservation about the politicsand competition.
3. The independence of Khagi Caste, leadership is trying to near about theeducation and always try to stop the social and economic loss of Khagi Caste.
4. Leadership is committed to make the inter college for making the atmosphere in villages for education. Leadership is also trying to make the socialequilibrium to aware the women.
5. With the respect of Khagi people and Khagi leadership, acceptance willincrease by other castes. The drunkenness, dowry and child marriage willend.
References
1. Behura, N. K. and Panigarhi, N., “Tribe Caste and Kinship in Orissa : A Retrospectiveand Prospective Look”, The Eastern Anthropologist, 59 (2), 2006, 207-220.
2. Beteille, Andre, Changing Patterns of Stratification in a Tanjore Village Caste, Class andPower : Changing Patterns of Stratification in a Tanjore Village, New Delhi : OxfordUniversity Press, 1996, 1, 3, 225.
3. Dipankar Gupta, “Caste and Politics : Identity over System”, The Annual Review ofAnthropology, 2005, 409-427.
4. Fukunga, M., “Society Caste and Factional Politics : Conflict and Continuity in RuralIndia”, 1982 (Accessed from Internet).
5. http://www.friendsofsouthasia.org/cast/reservations/faq.html#10
6. http://www.east-indians.com/obc fag.html
7. Khagi, Buddhsen, Nirbheek Khagi, 1998, 40-56.
8. Khan, Shoeb, Reservation Policy : Social Justice (An Empirical Study of ScheduledCaste in three Districts of Uttar Pradesh with Special reference to Dr. B. R. Ambedkar), Aligarh : Department of Law, AMU Aligarh, 2000.
9. Mukhopadhyay, Amal Kumar, Political Sociology, Calcutta : K.P. Bagchi, 1977.
10. Narain, Gopal Krishna, Changing Behaviour Pattern of Rural Students in an UrbanSetting (A Survey of Students studying in affiliated Colleges of Aligarh), 1973, 228-236.
11. Pai, Sudha, “New Social and Political Movement of Dalits : A Study of Meerut District”,Contributions of Indian Sociology, 34(2), 2000, 189-220.
12. Ritzer, George, The Blackwell Encyclopedia of Sociology, 6, 2007, 2564-2567, 2584,229-231.
13. S. K. Jangir, “Impact of reservation Policy on Employment and Education”, Americaninternational Journal of Research in Humanities, Arts and Social Sciences, 3(1),June-August, 2013, 126-128.
14. Sills, David L., International Encyclopedia of social Science, 1968, 9, 91-113, 244-247,473, 477. ê
8 Tejpal Singh
Article Received on July 14, 2017; Accepted on August 28, 2017

2
Globalization and Indian
English Fiction
Rahul Singhal*
Globalization has transformed and reformed the world via touching almost each and everyaspect associated with a nation state, be it economics, culture, education, lifestyle and attitude ofpeople. Globalization supported via technological revolution has created a newer and smallerworld resulting in redefining of the boundaries and the actual meaning of the word ‘Life’. Todayglobalization theorist talks about different phases of globalization. Early periods of conquest andvoyages are considered phases in the long narrative of globalization. Most commentators howeverconsider revolution in Information Technology as a major trigger for the forces of globalization.Consequently early 90s and the period after 2000 have been marked by significant changes in theworld. Not only have national boundaries blurred, we also have the phenomenon of culturalboundaries breaking down. Globalization has opened new discourses of culture and identity.Globalization has greatly influenced the publishing industry. It has opened avenues for newwriters. It has given strength to the work of old writers and books are now reaching to a biggerreadership. Old books are being republished. The definition of classic has changed. And thanks tothe forces of globalization Indian English Fiction is witnessing a surge. Probably more novelshave been written, published and marketed in India than ever before. If globalization hasreinvigorated publishing industry, it has dictated the choice of subjects, the notion of identity andthe forms of literature. This study or paper aims to take up the impact of globalization on fictionwritten after 2000 in India. It aims to discuss the phenomenon and its impact on publishingindustry.
[Keywords : Globalization, Indian English fiction, Capitalism,
Commodification, Commercialization, Author, Publishing industry]
CONTEMPORARY SOCIAL SCIENCES, Vol. 26, No. 3 (July-September), 2017
* Research Scholar, Department of English, Aligarh Muslim University, Aligarh, Uttar Pradesh(India) E-mail: <[email protected]>

Living in 21st century is not as easy as it’s perceived. There are many theories,
concepts, processes, mechanisms and phenomenon’s working around, like,
modernism, deconstruction, postmodernism, psychoanalysis, and globalization
and they change the very essence of living. But out of these given examples we
have one particular concept or process which draws our attention and enthusiasm
towards it and that’s globalization. In simple words, globalization means
unification or integration of the with the world economy through trade, capital
and technology flows. It means reduction of trade barriers so as to permit free flow
of goods across the world and creation of environment allowing free flow of
technology, labour and capital among different countries of the world.
Globalization as a term can be defined and restricted by definition like
statements for example, according to Roland Robertson, ‘Globalization as a
concept refers both to compression of the world and the intensification of
consciousness of the world as a whole’.1 Similarly, David Held’s definition defines
‘Globalization as a process (or set of process) which embodies a transformation in
their spatial organization of social relations and transactions assessed in terms of
their extensity, intensity, velocity and impact generating transcontinental or
interregional flows and networks of activity, interaction and the exercise of
power’2, but as a process globalization can’t be tamed as it ‘seems to possess an
autonomous momentum, an uncontrollable currency, which no amount of careful
systematization and analysis can cover’.3 Therefore, the present study or paper will
flesh out the aspects of globalization rather than trying to fit it with different ways
of conceptualizing and demonstrating.
The first aspect of globalization is its ability to implode the sovereignty of a
nation state. There is a constant ‘push and pull’4 between tendencies towards
centralization of one state on one hand and the sovereignty of particular states on
another. ‘Thus, concerted action between countries in some respect diminishes the
individual sovereignty of the nations involved, yet by combining their powers in
other ways, it increases their influence within the state system’.5
The second aspect of the globalization is the global capitalistic economic
mechanisms, that is, the spread of capitalism or crony capitalism. The dominant
powers in the world economy are capitalist state and their business and
transnational corporations have global activities and have immense power to
influence political policies in their home bases and elsewhere. By exercising their
powers and by forcing nation states to create policies favoring them, they, in a way
lead to the compression of world market resulting in the beginning of the
specialized regional, societal, ethical, class, and gender markets. Put otherwise,
beginning of micro - marketing, for example, it would not be wrong to say that, we
now have all the perfumes of Arabia at our disposal, which can wash off any bad
scent from our hands. These changes do not take place in vacuum or by themselves;
they bring with themselves a whole lot of other changes as well, like, separating
10 Rahul Singhal

Globalization and Indian English Fiction 11
workers from control of means of production by commodifying labour power and
like industrialization of war, and of the world military order. Nation states have
military alliances between themselves and states involved in alliances accept their
limitations over their opportunities to forge independent military strategies
externally. In a sense we have developed vast, massive destructive modern
weaponry resulting in no ‘Third World’ only a ‘First World’6 with respect of
weaponry.
The third aspect of the globalization is the vast industrial development across
the globe and this has happened because of the expansion of the global division
and interdependence of labor. This has resulted in ‘worldwide distribution of
production and de-industrialization of some regions in the developed countries
and the emergence of the ‘Newly Industrializing Countries’ in the Third World’.7
The fourth aspect of the globalization include the global diffusion of
technologies in every sphere of life social, personal, economical, cultural, and
political. This has resulted in creation of ‘One World’ in negative sense that
changes (harmful) happening at one place will have impact all over the world.
The fifth aspect of the globalization is globalization of culture. In the words of
Roland Robertson, globalization of culture ‘is a twofold process involving the
inter-penetration of the universalization of particularism and particularization of
the universalism’.8 What Robertson meant is that, that a particular quality or a
strand of culture is crystallized universally in an individual, individuals, society,
societies, nation, and nations and an universal strand is crystallizes particularly in
an individual, individuals, society, societies, nation, and nations9 and he calls this
process of ‘crystallization as the elemental form of global life’.10
On the other hand Arjun Appadurai11 calls the tension between cultural
homogenization and cultural heterogenization as the central problem of today’s
global interaction. According to him, ‘One man’s imagined community is another
man’s political prison’12, that is, the central feature of global culture today is ‘the
politics of the mutual effort of sameness and difference to cannibalize one another
and thereby proclaim their successful hijacking of the twin enlightenment ideas of
the triumphantly universal and the resiliently particular’.13
Here we are having both sides of the coin of global cultural process. On one
side we are already having assimilation of different cultural forms and process and
on the other side we have stiff resistance in Althussarian terms, as if history has
ended. But what is important here is, that culture in 21st century is not a fixed entity
it is in continuous state of flux, that is prefixing the word ‘multi’ with ‘culture’
making it ‘Multiculturalism’. Today we are having music of all sorts from Jazz,
Rock to Afro - American and Afro - Hispanic in our ears; we are having different -
different food styles, cuisines, and culinary habits. We are now having London
Dairy trolleys, selling ice lollies. Another example is a food supermarket; you have
America right above the shelf over your head, Gulf in front of you, Europe down
below, and Africa sold out. Similarly, we have money becoming more and more
volatile; 1000 rupees in your pocket can shrink to the value of 500 rupees or rise to
the value of 1500 rupees. The same changes exist in fiction writing as well. We
witness distracted and wandering characters, entering and exiting the worlds
without a clear sense of place, time and space. We have characters witnessing
identity crisis, split personalities, and fluidic identities, not able to associate and fix
themselves with a particular space resulting in psychosis and neurosis.
Turning towards literature and literary studies; Indian English Fiction being
part of it; we find that globalization affects literature in two ways. Firstly, it affects
literature from within and secondly, it affects literature from outside.
After carefully examining as to how Indian English Fiction is affected by
globalization internally, we find thematization of globalization in Indian English
Novels, that is, globalization and its strands like culture, identity and others are
used as themes or sub-themes in Indian English Novels. For example, we have
novels like ‘The White Tiger’14 by Arvind Adiga which depicts crony capitalism
inherent in Indian society; secondly, it depicts how a particular stratum of society
is hardly influenced by globalization. The wilderness, and the hollowness is still
there creating a huge gulf and dividing society into sets of people, one who
are ‘Hollow Man’ (T. S. Eliot, 1925) and have Prufrockian mechanized sensibility,
and other, who are completely immersed in the ‘Heart of Darkness’ (Joseph
Conrad, 1899).
We have other novels too like ‘Miss New India’ (2011) by Bharti Mukherjee,
‘Call Me Dan’ (2010) by Amish Trivedi, ‘One Night at the Call Centre’ (2008) by
Chetan Bhagat. All these examples deal with the call centre life; either their
protagonist are picked up from there or the whole novel is set up at a call centre.
Another visible change in Indian English Fiction writing is that we have novels
based in urban scapes like ‘Neti, Neti, Not This, Not This’ (2009) by Anjum Hasan
and like ‘The Last Man in Tower’ (2011) by Arvind Adiga; the novel by ‘Hasan’ is
based in Bangalore and the other one is based in Mumbai. Both the novels deal with
the city life, capitalism and youth and depict how urban society has changed under
the influence of globalization. Similarly, we have novels depicting homosexual
relationships and novels based upon the sexual minorities in India. We have short
forms like MSM which means men who have sex with men and WSW which means
women who have sex with women. In this category, we have examples like
‘Boyfriend’ (2003) by R. Raj Rao and ‘Saraswati Park’ (2010) by Anjali Joseph. Both
the novels depict male sexuality and portray the ethos of homosexual protagonists.
Similarly, we have quite a significant development in the category of Historical,
and Graphic Indian novels. Here we have examples like ‘The Harrapa Files’ (2011)
which is a graphic novel by Sarnath Banerjee explores the challenges of post
liberalized India, that relate in particular to class, economic prosperity and
12 Rahul Singhal

Globalization and Indian English Fiction 13
governance. Another example is ‘Kashmir Pending’ (2007) by the same author
which is a graphic and historical novel. It takes up the historical issue of Kashmir
and represents the status of Kashmir via the use if graphics. It represents Kashmir
in a state of limbo, as the title suggests : ‘pending’.
Globalization affecting Indian English Fiction externally, deals with the
production and distribution of literature, that is, as to how Indian English Fiction is
published and consumed. Here globalization works in two ways; one is that it
helps in production and distribution of literature. As Suman Gupta mentions :
‘the effects of technological enhancement of information and communication
networks, the drivers of globalization forces, are not merely represented
within literature; they also comprehensively act upon literature. Reckoning
with globalization changes the very way in which literature is thought about,
disseminated and consumed, and even constituted.’15
Because of globalization we have e-books which are available globally and
e-book reading applications like Kindle, and Flipkart e- book reader which not only
help in saving money but also time as the Director of Author and Publishing
Relations, Amazon, Jon P Fine, remarks ‘we’re building a system where I will be
able to stand in a checkout line at the supermarket and read a book on my
BlackBerry’.16 Another worthy point worth mentioning is that we can now order
books online and the retailer sitting in America will fulfill our requirement within
a very short span of time. Secondly, globalization has enabled self publishing
which was not possible five or six years ago, as earlier it carried with itself a stigma
that people who couldn’t get published anywhere would go and publish
themselves. But now times have changed, you have internet access everywhere,
more and more internet users, so you can just go and self publish (Blogs, Websites
and Social media platforms) your work at a very low cost as compared with
traditional publishing. Suman Gupta in the same vein reminds us of the changing
reading patterns because of the technological advancements and internet
publishing, she says :
‘The internet novel allows for more varieties of reading experiences,
following different chains of connections and associations, and, importantly,
without being constantly predicated on (departing from or adhering to) the
normatively linear disposition of the physical book. By simple clicks of a
button on hyper-referenced words or phrases, within any text or menu or
image in the novel, the reader can construct different progressions of reading
without being constantly reminded of departing from a physicallymaintained norm - the reader can, so to speak, construct different
progressions naturally and effortlessly. These different progressions are not
randomly or arbitrarily constructed; they are implicit in the logic of
computer-mediated reading’.17

Another way, in which globalization works in externally affecting literature
is that, it has lead to the deep rooted commercialization of literature, and has made
fiction writing a profit churning exercise. We now have fiction being written just
for the sake for instant consumption, whose life span is too short to even imagine,
for example, in the year 2010 Penguin India launched a book series titled ‘Metro
Reads’, and the idea behind ‘Metro Reads’ was to create easy to read, lightweight
books that can be read while commuting or travelling around a city. The series was
tag lined ‘Fun, feisty, fast reads’ and ‘For the reader on the go!’.18 The series
included books like, ‘Love over coffee’ (2010), ‘No Deadline for Love’ (2011),
‘Losing My Virginity and other Dumb Ideas’ (2011), ‘Where Girls Dare’ (2010),
‘Love on the Rocks’ (2011) and many others. Similarly, we have narratives like
Chick lit and Crick lit (Term by E. Dawson Varughese) as the name suggests Crick
lit composes of fiction writing regarding cricket, so as to tap the wide fan base of
cricket lovers, examples include novels like, ‘The Premier Murder League’ (2010)
by Geeta Sunder, and ‘The Zoya factor’ (2008) by Anuja Chauhan; on the other
hand Chick lit is the fiction writing ‘mainly written for women, with a female
protagonist who, in various ways, faces challenges, questions, and changes in
contemporary Indian society’19, examples include novels like, ‘Almost Single’
(2007) by Advaita Kala, and ‘Battle for Bittora’ (2010), by Anuja Chauhan. The
economic logic of these developments is the profit driven rationale - ‘this drive for
the profit has changed practices across the book industry - in the manner in which
editors and the agents work’.20 We now have, as Suman Gupta rightly points out,
‘tacit market censorship’, where, ‘certain sorts of texts simply do not have the
opportunity to surface for the gauging of informed readerships; certain sorts of
texts are pre-framed in a manner that makes them unavoidably visible before they
are read in any meaningful fashion; and certain sorts are pushed on readers in so
concerted and predetermined a fashion (by their pricing, design, publicity) that
their readers are circumscribed in advance’.21
Thus, literature, literary authors, and literary readers all become industrial
products, and commodities manufactured and created by multinational and
national publishing houses. Another valid point that needs to be mentioned here is
the problem of dying authorship and authors. It is not same as the ‘death of author’
a famous declaration by Roland Barthes in 1968. Rather this sort of death of the
author as Suman Gupta explains :
‘has to do with a social condition where authors and their texts and audiences
are dissociated from each other, where authors find themselves dissociated
from their works, where authors are mis-recognized or simply not
recognized in their works, where authorial aspirations simply cannot be
realized through their works because literature is itself dissociated from the
world. The slippages between authors and literature and world, from this
14 Rahul Singhal

Globalization and Indian English Fiction 15
perspective, derive from the contemporary Zeitgeist - late twentieth and early
twenty first century social - cultural ethos’.22
This happens because as Suman Gupta says :
‘an author’s vocation is in competition with other kinds of producers and
products which are more successful. Those other kinds of producers and
products, media producers and their primarily audio - visual products,
simply reconstitute the social sense of the world, and mould consumer
expectations, in a way that authors and their literary products are unable to
work against or alongside - which defeats and ultimately co - opts these
authors and their works, and effectively kills them’.23
After reviewing different aspects of globalization we come to the conclusion
that globalization involves the institutionalization of both the ‘universalization of
particularism and the particularization of universalism’. Though Globalization
with the help of capitalism as a phallic symbol has interpenetrated our lives, but
still, we should not look globalization in Althusserian terms as we have both,
‘Good Globalization’ sans capitalism and ‘Bad Globalization’ with capitalism.
References
1. Roland Robertson, Globalization : Social Theory and Global Culture, London : Sage
Publication, 1992, 8.
2. David Held, Anthony Mcgrew, David Glodblatt and Jonathan Perraton, Global
Transformations : Politics, Economics and Culture, Cambridge : Polity, 1999, 16.
3. Suman Gupta, Globalization and Literature, Cambridge : Polity, 2009 , 5.
4. Liam Connell and Nicky Marsh, Literature and Globalization : A Reader, New York :
Routledge, 2011, 19.
5. Ibid.
6. Ibid., 20.
7. Ibid.
8. Ibid., 23.
9. Roland Robertson, Globalization : Social Theory and Global Culture, London : Sage
Publication, 1992, 97.
10. Ibid., pg. 25.
11. Arjun Appadurai, Modernity at Large : Cultural Dimensions of Globalization, Volume
1 of Public Worlds, Minneapolis : University of Minnesota Press, 1996, 31.
12. Liam Connell and Nicky Marsh, Literature and Globalization : A Reader, New York :
Routledge, 2011, 29.
13. Ibid., 36.
14. Arvind Adiga, The White Tiger, New Delhi : HarperCollins Publishers India, 2008.
15. Suman Gupta, Globalization and Literature, Cambridge : Polity, 2009 , 53.
16. Manjula Narayan, “Bring to Ebook”, Hindustan Times, February 22, 2014.

17. Ibid., 54.
18. E. Dawson Varughese, Media of Reading New India : Post Millennial Indian Fiction in
English, London : Bloomsbury Academic, 2013, 25.
19. Ibid., 41.
20. Suman Gupta, Globalization and Literature, Cambridge: Polity, 2009 , 161.
21. Ibid.
22. Ibid., 154.
23. Ibid. ê
16 Rahul Singhal
Article Received on July 30, 2017; Accepted on September 09, 2017

3
Breast Tax : Social Oppression of
Dalit Women
Vichitra Gupta*
In India, we find diversities on the basis of caste, culture, creed, religion and gender. Thedalits and the women have been the suppressed class since long. The women were the suppressedgender and dalits, a suppressed caste. And when it comes to dalit women, they are the mostsuppressed ones, who had to suffer the worst. Apart from facing suppression from their malecounterparts, they had to face sexual exploitation at the hands of upper caste men. In South India,the condition of dalit women had been so disgraceful and humiliating that in the southernmostpart of Travancore, the Avarna Nadar women had to fight for even covering their bodies. The King and the Brahmins were expanding their wealth by imposing strange kind of taxes such as the taxon trading in pepper and spices, tax on men growing moustaches, on wearing jewellery orcovering breasts. There were more than a hundred extortionist taxes levied by the Royal regime on poor communities. The heinous and humiliating taxes were targeted against the former Buddhistpopulations that were treated as Avarnas. The Royal Proclamation of 1829 barred Nadar womenfrom covering their upper body and if any women ever dared to cover her breasts, the Maharajaregime collected the ‘Breast Tax’. This tax had been one of the 120 extortionist taxes levied by theRoyal regime on poor communities. Christian missionaries and the social reformers such asNarayan Guru, Periyar Ramaswamy and Ayyan Kali encouraged dalit women to defy theundignified bare breast rule. Later on, under pressure from British government, the Christianconverts of Nadar women were allowed to cover their upper bosoms but the upper caste men couldnot tolerate it and they kept on humiliating the women covering their breasts. They used to tearapart their upper garment through a knife connected to a long wooden rod so as to avoid the touchof a dalit. Sometimes they used to hang such women from the tree upside down. The nadir womeninstead of bowing down to royal authorities kept on protesting. A dalit woman named Nangeli
CONTEMPORARY SOCIAL SCIENCES, Vol. 26, No. 3 (July-September), 2017
* Associate Professor, Department of Political Science, Motilal Nehru College (Eve.), University ofDelhi, Delhi (India) E-mail: <[email protected]>

protested against the ‘Breast Tax’ by chopping off her breasts and throwing off the same at the taxcollector. Nangeli’s sacrifice intensified the stir and the famous Channar revolt swept SouthIndia. Finally under pressure, Maharaja of Travancore had to make a Royal Proclamation in 1859permitting all the women to cover their upper bosoms. The obnoxious rule of Breast Tax was overand the women could gain the right to dress up with dignity after a long struggle and sacrifice.This history of women’s struggle and sacrifice came to light recently when CBSE struck off thechapter on it from the syllabus.
[Keywords : Breast Tax, Sudras, Social discrimination, Channar Revolt,
Nangeli]
1. Introduction
In Kerala, the caste system was quite different from the four Varna systemprevailing in Northern India. Apart from the priestly class and a few princes fromruling class, everybody else was treated as Sudras. The class of Vaishya, the tradershad been completely missing therein. During initial stage of history, no castesystem was prevalent in Kerala. During ancient times, the categorization amongstpeople was done on the basis of their profession such as Valayar (fishermen), Panar (singer), Kadambar (agriculturist), Uzhavar(workers), Vanikars (traders). Brahmin migration happened in Kerala during 3rd and 4th Century B.C. But they became adominant class only by 8th century A.D. Buddhism was much practiced religion inKerala by that time. By the second half of 8th century, Brahmins became morepowerful over there. They destroyed Buddhist temples and started practicingHinduism. Those who followed Hinduism and became their protector, wererecognized by them as Kshatriyas or the Upper castes among Sudras. Aryaninvaders in the area needed protection and hence they recruited the local people.These persons though were given Kshatriya functions but status was only ofSudras . Though the Brahmin influence did exist in Kerala since 1st Century A.D.but there was a large influx of them during 8th Century A.D. in the area. TheBrahmins acted as priest or counsellers or the ministers to the princes. The localpopulation had been practicing Buddhism but Brahmins took over Buddhisttemples for their own use and started propagating their beliefs. By destroying ortaking over Buddhist temples, Brahmins became the largest land owning group inthe region and they started asserting themselves in the matter of religion, politics,society and economy. These Brahmins were called Namboodiris and apart fromNamboodiris, everybody else was given the status of Sudra. They propagated thetheory that the caste system established by Namboodiris was in accordance withthe wishes of Parsuram, the avtar of Lord Vishnu and hence they have been givenpowers by God. Namboodiri Brahmins were at the top of caste hierarchy. TheNamboodiri Brahmins practiced untouchability and that too was in a differentmanner towards different types of castes. A Nair was allowed to approach but nottouch a Namboodiri Brahmin, an Ezhava had to remain thirty-six paces off and thePulyan needed to be ninety-six steps away from them. Amongst the lower casteseven, untouchability was practiced. An Ezhava had to remain twelve steps far off
18 Vichitra Gupta

Breast Tax : Social Oppression of Dalit Women 19
from a Nair and a Pulayan sixty-six steps away and the Parayans to stay fartheraway. The Pulayans and Parayans, the lowest of the castes could dine with eachother but not touch. Such ritual pollution was being practiced in every part ofKerala.
Nairs as such were the second in caste hierarchy but still they were treated as
Sudras. They held large feudal estates and some of them even participated in the
ruling of Kerala. There were around 64 classifications in Nair society. The three
major groups were Illam, Swaroopan and Padamanglam. The first group being the
servants in Brahmin house, second were the servants in Kshatriya homes and the
third used to serve in the temples. The Nairs were basically located in Travancore,
the district that now constitutes of Kanyakumari. The three groups of Nairs are
further split into various classes based on their profession and status in society
such as Shroobacure (Vassals of Chiefs), Shacoular (oil mangers), Vellakathura
(washermen), Yadacherry (cowherds), Odatu Nair (boatmen) and so on. But all the
above castemen would serve only the Brahmins or the King. The higher order of
Nairs starts from Maudumby Prudhookanmar. Nairs were also a martial class and
thereby would seem to be more like Kshatriyas. Still, the higher order of Nairs were
treated as Sudras. Nowhere in the rest of India, Sudras had been the martial class.
Some of the Nair families were aristocratic even who owned large feudal estates
and tracts of land and enjoyed high positions in the King’s Court. In the Paliam
family of Kochi, one of the oldest male of the family, named Paliath Achan served
as the Prime Minister to the King of Kochi.
In 16th century there was the influx of Nadars migration after the Raja of
Travancore invaded Tirunelveli. Most of the Nadars have been Palmyra climbers.
Some of the Nadars of Travancore were the subtenants to Nair landlords and they
also had direct control over lands of the Nairs. Hence the Nadars of Travancore
enjoyed special privileges and considered themselves superior to climbers. In
Tirunelveli the caste system was not as rigid as in Travancore. The climbers of
Travancore suffered severe social discrimination. The aristocratic Nadars on the
other hand called themselves Nadans and were a step superior to Nadars. Due to
the low status accorded to Nadar climbers in the society, a large number of themhad embraced Christianity so as to elevate themselves. But even the conversion to
Christianity could not improve their status much. Over the time, some of the
Nadars became commercially skilled and became traders due to new opportunities
of trade and commerce introduced by the British rule. Due to the gain of wealth,
these Nadars started adopting the customs of the North Indian Kshatriyas so as to
improve their status. They adopted the process of Sanskritisation and tried to
dissociate themselves from Nadar Palmyra climbers. They too adopted the title
Nadans but the Vellalar and Maravar castes who were ranked above the Nadars
resented against the upward mobility of Nadars that led to Sivakasi riots of 1899.
Though the Sanskritisation movement failed, it made the community strong to
protest against the discrimination so as to secure their rights, privileges and

dignity. It ultimately led to the formation of Nadar Mahajan Sangha that tried to
unite the community by encouraging intermarriage within five major Nadar
sub-castes.
Ezhavas, the agricultural labourer community shared the common heritagewith the Nairs as there has been a similarity in the customs of these two. Ezhavashad been a martial class too that had served the Kings. It was believed that both thecommunities might have the common parentage and that they had broughtcoconut palms from Sri Lanka. Some of the Ezhavas were involved in ship makingand weaving. Due to shortage of labour during World War I, Ezhavas wereattracted to industries in urban areas. Some of the persons from Ezhavacommunity had vast knowledge of medicinal plants and herbs and they acted asphysicians. The status that was accorded to Ezhavas by the Nambudiri Brahminswas that of Avarna (the untouchable) that means belonging to lower rank amongstSudras. Thiyyas, another related community of Ezhavas claim themselves to be inhigher rank than Ezhavas. They claimed to be the offsprings of ChirrakalMannanar Raja, the son of a lady from Chirrakal Royal family. But they weretreated as equal to Ezhavas. Thiyya community has objected from time to time forbeing treated like Ezhavas. In February 2013, Thiyya Mahasangh objected sharplyfor being treated as equivalent to Ezhavas.
The caste system of Kerala, thereby had been quite complex, absence ofChaturvarnya and the presence of many subcastes and different ranks within thesame caste group and different social status and privileges being accordedaccording to their ranks. The Nairs were allowed to enter the temple with certainrestrictions. They were allowed to touch the offerings or ring the bell but they werenot supposed to touch the priest and had to move away at the time when the priestused to enter with the worship materials still they considered themselvesprivileged as they could at least enter the temple that was denied to others.Similarly the other privileges were accessible to people according to their rankingsof caste groups.
2. Social Discrimination against Sudra Women
The condition of women of different caste groups and sub groups amongstSudras was very bad. The women had to submit to Brahmins to satisfy theirdesires. If a Brahmin came to a Nair house, he could mate with any woman of theirhouse and it was regarded as a blessing upon the family. The Travancore king haddeclared that if any Nair woman did not submit to the wishes of Brahmin men, shewould be considered to be leading an unholy life and could be punished for that.Even the houses were built with specifications that a staircase from the outercompound would lead directly to the second floor where the women of the housewould reside. The sambandhkars did not have to enter into the house first rathercould go straight away to the second floor through the staircase. Due to such anindignied custom, it was difficult to establish the identity of father of any child.
20 Vichitra Gupta

Breast Tax : Social Oppression of Dalit Women 21
That’s why matriarchal system was followed since in that society maternity was afact and paternity a fiction. Various social reformers raised their voice against thisdisgraceful custom.
3. Breast Tax
In 19th century, the rigid caste hierarchy in Kerala imposed strict code ofmannerism enforced by the state. The lower class women were barred fromcovering their breasts. Not just males but even females had to bare their chestbefore the high caste people as a gesture of respect. While the upper caste womenused to keep their upper body covered, the Nadar climber and the Ezhava womenwere not allowed to cover their bosom anytime anywhere. Nair women had toremain half naked before the Brahmins. If the Dalit women ever tried to cover theirbreasts, they had to pay the breast tax called ‘Mulakaram’. It was one of the 120extortionist taxes levied by the Royal regime on poor people. In Travancore,Cochin and Malabar, no woman could cover their upper body in front of theBrahmins. In 1819, Rani of Travancore proclaimed that the Nadar women shall nothave any right to wear the upper garment though their counterparts, thearistocratic Nadan women were allowed to cover their bosom. The upper castewomen belonging to Namboodiri Brahmins, Nairs and Kshatriya women thoughwere allowed to cover their bosom but the Kshatriya and Nair women had to laytheir upper body bare in front of Brahmins. During the public appearances of theKing, women of all castes except Brahmins, were supposed to stand half naked toshower flowers upon them. Not just in the path of His carnival but also on thebalconies, the women had to be half naked to welcome the King.
4. Impact of Social Reform Movements
The social reformers kept on mobilizing people against the humiliatingpractices. Vaikunta Swamy propagated that men should wear head turban andwomen should wear the upper cloth. He raised the slogan ‘One caste, one religion,one God, one language, one world for humanity.’ He tried to establish socialequality and civic rights amongst people of different caste and creeds. Heinstigated Nadar and Ezhava women to overturn this practice. Narayan Guru andPeriyar Ramaswamy were also the strong defenders and supporters of Nadarwomen’s revolt. Narayan Guru tried to break the citadels of orthodoxy by buildingand resurrecting temples without the priests’ involvement. Periyar Ramaswamyorganized the self-respect movement in Tamil Nadu in 1925 that had a deep impact on the Channar revolt in Kerala. His famous quote on self-respect has been, “Weare fit to think of self-respect only when the notion of ‘superior’ and ‘inferior’ casteis banished from our land” . Periyar declared that the nationalist movement led byGandhi and Nehru does not cover the individual’s self-respect. Neither theliberation from British rule nor the revival of Hindu religion could ensureindividual self-respect rather its only through the eradication of social evils and the

end of Brahminical order that we can gain the self-respect for all. Self-respectmovement had core, deeply feminist values. Periyar tried to segregate genderrelationships from Brahminical patriarchy and asserted women’s rights over theirphysical, sexual and reproductive choices. He organized self-respect marriageswhere no priests would perform Hindu marriage ceremonies. Periyar believed that if Brahminical practices of performing rituals and practices are checked then theirdomination under the guise of which they exploit the women shall be over. In freeIndia, Tamil Nadu became the first and only state to legalize Hindu marriages thatwere organized without the rituals conducted by the Brahmins. The ideas ofSelf-respect movement attracted several women such as former prostitutes, former devdaasis, wage labourers etc to throw off their bondages and raise voice againstthe exploitation. Women were given the right to choose their partners as well asdivorce them and remarry. Widowhood was not penalized through religiousbeliefs. Women were even allowed access to contraception and permanent birthcontrol measures. The Shree Narayan movement spread all over Kerala to makeKerala into an ideal land where everybody could live with virtues of fraternity, free from all caste discriminations. The impact of social reform movements led theNamboodiris and Nairs to think over reforming their own social practices. Another social reformer Ayyan Kali, drawing inspiration from Narayan Guru, focusedhimself to defy the social conventions that were applied to lower castes. He notonly led the untouchables to ride on a bullock cart on roads that was prohibited forthem, he opposed the traditional customs that prohibited the female members ofSudra community from covering their upper body. The social reformers such asNarayan Guru, Periyar Ramaswamy and Ayyan Kali encouraged Dalit women todefy the indignified bare breast rule. The Shree Narayan movement spread all overKerala to make Kerala into an ideal land where everybody could live with virtuesof fraternity, free from all caste discriminations. The impact of social reformmovements led the Namboodiris and Nairs to think over reforming their ownsocial practices. Another social reformer Ayyan Kali, drawing inspiration fromNarayan Guru, focused himself to defy the social conventions that were applied tolower castes. He not only led the untouchables to ride on a bullock cart on roadsthat was prohibited for them, he opposed the traditional customs that prohibitedthe female members of Sudra community from covering their upper body.
5. Fight of the Women to protect their Modesty
By the beginning of 19th century, several workers ventured from Kerala to Sri
Lanka and due to the arrival of British East India Company, many started
migrating to urban areas in search of better jobs. The aristocratic Nairs or Nadans
also started trading and gaining wealth. With their increased interaction with
people from outside and due to the advent of Christianity, they became aware of
their social rights and how to live their life with dignity. Many lower caste people
started converting to Christianity so that their women folk are allowed to cover
22 Vichitra Gupta

Breast Tax : Social Oppression of Dalit Women 23
their modesty. In 1813, Colonel John Munro, issued an order that granted the
Christian converted women the right to wear upper garment. But his order was
withdrawn very soon as the members of Raja’s Council known as pindakars
objected it stating that it could lead to widespread pollution in the state by
obliterating caste differences.
The Nadar and Ezhava women had to fight a long battle to be able to cover
their modesty. The famous Channar revolt known as Maru Marakkal Samavan
took place whereby the dalit women resorted to violence to get the right to dress up
appropriately. From 1813-1859, women of Kerala struggled hard against the
inhuman, discriminatory rule. The first one to openly challenge the cruel and nasty
social order was Vaikunta Swamy who called the Maharaja as Neechan (the
evil-doer) and he propagated that the East India Company is the Ven Neechan
(white evil-doer). Maharaja was fearful of his growing influence so Vaikunta
Swamy was arrested and was tortured. This led to large scale public protests due to
which Maharaja had to release him. The Nadar also known as Channar,
worshipped Vaikunta Swamy as the incarnation of Lord Vishnu. Although the
Nadar women who converted to Christianity were allowed to cover their upper
body but the upper caste men could not tolerate it. They used to humiliate those
women in public by tearing apart the upper garment of the women with the help of
a knife connected to a long wooden rod so as to avoid their touch. Despite that
Nadar women continued to keep their upper body covered so as to revolt against
this inhuman law. The upper caste rank groups of Nair defenders of Hindu
orthodoxy too were against this movement and in order to defend the breast taxrule, they also used to tear up the upper garment of the women. The Nadan family
of Agastheewaram, instead of supporting the cause of lower ranks Nair
counterparts, supported this inhuman rule by saying that only their women had
the right to cover their upper body.
The upper cloth controversy continued. Defying the protests of Nadar
women, under the pressure of upper caste men, the Maharaja issued a Royal
Proclamation in 1829 that no Nadar or Ezhava or any other lower caste woman
shall cover her body in public and anybody who dares to do that shall have to pay
the tax for it. Though earlier Christian converted women were allowed to wear a
Kuppayam, a Syrian Christian type jacket but Nadar women were not satisfied. By
the Royal Proclamation of 1829, all the women including Christian converts were
not allowed to wear the upper cloth. This led to further outbreak of revolts. The
Nadar women, instead of bowing down to royal authorities kept on protesting. A
Dalit woman named Nangeli protested against the breast tax by chopping off her
breasts and throwing off the same at the tax collector saying, “I don’t need it, give it
to your Maharaja.” Nangeli died due to excessive bleeding. Her husband mounted
the funeral pyre of his wife Nangeli and ended his life by jumping into it. Nangeli’s
sacrifice intensified the stir and finally under the pressure of protests and public
unrest, the very next day, Maharaja of Travancore had to make a Royal

Proclamation in 1859 permitting all women to cover their upper body. The rule of
Breast Tax ended and the women won the right to dress up with dignity after a long
struggle and sacrifice. By sacrificing her life, Nangeli opened the doors of freedom
of the women.
This history of women’s struggle and sacrifice came to light recently whenCBSE struck off the chapter on it from the syllabus through its circular in December 2016 to all 19, 000 affiliated schools It was ordered by CBSE that the section ‘Caste,conflict and dress change’- a chapter that included the Channar revolt be omittedfrom the curriculum with effect from 2017 . Ten years back NCERT had includedNadar community’s struggle in the social science textbook prescribed for class IXfor 15 state boards and the CBSE. But a section of Nadars objected to it as it wasdenigrating their community and they wanted to expunge the memory of heroicstruggle of the Nadars to live with dignity. In 2012, Jayalalitha, the then ChiefMinister of Tamil Nadu had written to PM Manmohan Singh to remove theobjectionable reference from the syllabus. CBSE’s decision may also be in force dueto the efforts of RSS to suppress the history of caste conflict so as to suit Hindutvaideology. Public Interest Litigation has been filed in Madras High Court by theAdvocates Forum for Social Justice calling the textbook’s analysis as degrading.Controversy has erupted in political and social circles due to erasing off the dalitwomen struggle. Sh. Somnath Bharti, MLA, Delhi government, while addressingstudents at an event condemned the barbarious and inhuman law of ‘breast tax’.He applauded the struggle of the women and the sacrifice of Nangeli who chose todie but not succumb to any pressure and her sacrifice led to the withdrawl of thisoppressive law. Sh. Somnath encouraged women to gain high education so as tostrengthen themselves to fight against any discrimination and suppression. Healso stated that the chapter on these struggles should be reinstated in CBSE booksso as to inspire women to always stand up against any repression of any sort.
CBSE might have erased the chapter from the books but the communities that
have suffered social discrimination shall never be able to forget it. Edmund Burke
has rightly said, “Those who don’t know history are doomed to repeat it”.
Nangeli’s fading memory has been recalled and kept alive by T. Murali in a series
of paintings. T. Murali who has illustrated the horrific story of Nangeli in his
paintings, says, “We may not be able to teach students about Nangeli’s sacrifice in
textbooks yet, but my book Amana uses paintings to bring her story to life.”
Santosh R., an assistant professor in the Department of Humanities and Social
Sciences at IIT Madras called it a dangerous act of CBSE to remove important
historical events from the syllabi due to the pressure tactics of political parties such
as DMK or AIDMK. Maybe these organizations want to depict only the glorious
past of their communities. But denying an opportunity to students to learn
objective history of gender and caste is also a great injustice. J. Devika, a historian at
Tiruvananthpuram Centre for Development Studies is of the view that Nadar
women’s revolt is important to be studied because it is more of an issue of caste
24 Vichitra Gupta

Breast Tax : Social Oppression of Dalit Women 25
differences rather than feminine modesty. Writing off this chapter from the
syllabus is equivalent to an attempt to erase the history of barbaric rules against
poor dalits and the anti-caste struggle, a struggle of the women to live and dress up
with dignity. Some people are of the view that Hindu Nadars do not want to
discuss their aboriginal past because they are now heading towards upward
mobility and do not want that such an undignified rule of ‘breast tax’ be discussed.
The Nadar community is actually divided over the issue. Some of them believe
that, “Denying the access to this piece of history will make a community that is
already under-represented even more invisible”. Amritharaj Stephen, a
documentary photographer and editorial coordinator at Tamil Nadu said, “We are
hiding our own history for ourselves because of false pride. Why was our history
not told to us? Why there are so many Christians in Kanyakumari. Is it due to the
Nadar women’s struggle and conversion to Christianity? Why and how countless
women were manhandled and molested?” These are all questions, the answers to
which could be obtained only when we study the history of caste struggles. The
struggle of women to dress up like their Savarna counterparts, is a great struggle
against British and local caste authorities. So the Breast Cloth Rebellion needs to be
studied and analyzed in historical context. Female liberation struggle has led to the
creation of such an advanced state of Kerala where we find 100% literacy rate and
the women today are more educated than their male counterparts. Caste rigidity is
no longer significant and the people there are now conscious about the ideals of
equality, fraternity and justice.
Footnotes
1. Pullapilly, Cyriac, “The Izhavas of Kerala”, The Journal of Asian and African Studies, XI,
1976, 26-30.
2. Gopalakrishnan, M. D., Periyar : Father of the Tamil Race, Madras : Emerald Publishers,
1991, 64.
3. Periyar, E. V. R., Why were women enslaved?, Chennai : The Periyar Self-respect
Propaganda Institution, 2001 (ISBN 979-8190357936).
4. Veeramani, K. and Raju, R. S., Periyar on Women’s Rights, Madras : Emerald Publishers,
1994.
5. George, Glynis R., “Pineapples and Oranges, Brahmins and Shudras : Periyar Feminists
and Narratives of Gender and Regional Identity in South India”, Anthropologica, 45(2),
2003, 265-81.
6. Ibid, Note 5.
7. “CBSE says Nadar Women’s Historic Struggle to cover their Breasts objectionable,” The
News Minute, December 20, 2016 (Retrieved on December 21, 2016).
References
1. Claus, P. J., Oral Traditions, Royal Cults and Materials for a Reconsideration of the Caste
System in South India, Journal of Indian Folkloristics, 1(1), 1978, 25.

2. Reghu, K.. “A New Look at the Sree Narayana Movement”, Journal of Kerala Studies,
32, 2005, 145.
3. Peter, D, and Peter, I., History Kanyakumari District Liberation of the Oppressed a
Continuous Struggle : Socio-Economic and Political Liberation Struggle in the Extreme
South of India, Nagercoil : Kanyakumari Institute of Development Studies, 2009.
4. Rajan, K. M., Nationalism From Below : The Suppressed Class Uprising In Tamil Nadu,
Golden Research Thoughts, 3, 2013, 1-8.
5. Rayan, S., “Outside the Gate, Sharing the Insult”, Felix Wilfred (ed.), Leave the Temple :
Indian Paths to Human Liberation, Maryknoll, N.Y.; Orbis Books, 1992, 125-45.
6. Houtart, F. and Lemercinier, G., “Socio-Religious Movements in Kerala : A Reaction to
the Capitalist Mode of Production : Part One”, Social Scientist, 1978, 3-34.
7. Manmathan, M. R., “Temple as the Site of Struggle : Social Reform, Religious Symbols
and the Politics of Nationalism in Kerala”, Advances in Historical Studies, 2(02), 2013,
57.
8. Kurien, P., “Colonialism and Ethnogenesis : A study of Kerala, India”, Theory and
Society, 23(3), 1994, 385-417.
9. Chandramohan, P., “Popular Culture and Socio-Religious Reform : Narayana Guru and
the Ezhavas of Travancore”, Studies in History, 3(1), 1987, 57-74.
10. Fuller, C. J., “Kerala Christians and the Caste System”, Man, 11(1), 1976, 53-70.
11. Deshpande, A., “Does caste still define disparity? A look at inequality in Kerala, India”,
The American Economic Review, 90(2), 2000, 322-325.
12. Mencher, J. P., “The caste system upside down, or the not-so-mysterious East”, Current
Anthropology, 15(4), 1974, 469-493.
13. Namboodiripad, E. M. S., Kerala : Yesterday, Today and Tomorrow, Calcutta : National
Book Agency, 1967.
14. Mosse, D., “South Indian Christians, purity/impurity, and the caste system : Death
ritual in a Tamil Roman Catholic community”, Journal of the Royal Anthropological
Institute, 1996, 461-483.
15. Moffatt, M., “Untouchables and the Caste System : A Tamil Case study”, Contributions
to Indian sociology, 9(1), 1975, 111-122.
16. Miller, E. J., “An Analysis of the Hindu Caste System in Its Interactions with the Total
Social Structure of North Kerala”, Dilip Menon (ed.), Caste Nationalism and
Communism in south India: Malabar, 1900-1948,New Delhi : Foundation Books, 1994.
17. Devika, J., “Egalitarian developmentalism, communist mobilization, and the question of
caste in Kerala state, India”, The Journal of Asian Studies, 69(03), 2010, 799-820. ê
26 Vichitra Gupta
Article Received on June 14, 2017; Accepted on August 08, 2017

4
Empowerment of Women through
Higher Education of IGNOU
Amit Chaturvedi* and Bhanu Pratap Singh**
The Government of India gives opportunity to all to get good and qualitative education asEducation is an effective and successful tool for development of any country and as it is thefundamental right provided under Article 21 ‘A’ of Indian Constitution. The success of anycountry wholly depends on the education opportunities given to the women society. At the time ofindependence literacy rate of women’s was low but government of India has done many efforts forthe upliftment of women’s education. After many efforts, it is seen that women, particularly inrural and backward areas, are deprived of education. In rural areas, no proper facilities and schools are available. Due to the ignorance about health and nutrition; they could not pay much attentionto their children who are the future of any country. Since inception the IGNOU is progressing interm of enrollment, support services mechanisms with wide network of 67 Regional Centres (RC)and 3,000 it’s Learner Support Centres (Study Centres) in all over India. The women educationespecially Muslim women’s higher education if big challenge to the government as well as society.IGNOU through its Regional Centres is reaching to unreached by giving opportunities to educate them and are attracting good numbers of people (male/female) and fulfilling their educational;needs including of those hailing from Muslim society and other minorities, irrespective of theircaste, and creed. In the light of the above this paper will try to assess the scenario of the women’shigher education and role of IGNOU to fulfil the need of Muslim women’s education.
[Keywords : Empowerment of women, Higher education, IGNOU, Regional
centres, Support services mechanisms]
CONTEMPORARY SOCIAL SCIENCES, Vol. 26, No. 3 (July-September), 2017
* Regional Director, IGNOU Regional Centre, Bhopal, Madhya Pradesh (India) E-mail:<[email protected]>
** Assistant Regional Director, IGNOU Regional Centre, Aligarh/Noida, Uttar Pradesh (India)E-mail: <[email protected]>

1. Introduction
Kothari Commission (1964-66) which is known as authentic policy for
education upliftment of Indian society marked a historic moment in policy
discourse on women’s education by emphasizing the education of women is of
even greater importance that of men. The Commission was in opinion that the
development of our human resources, the improving of homes and shaping the
character of children during the year of infancy is based on women education. At
the time of independence literacy rate of women’s education was low but
government of India has done many efforts for the upliftment of women’s
education. After many efforts, it is seen that women, particularly in rural and
backward areas, are deprived even from Primary education. In the present
scenario even after 68 years of independence of the country, specially the rural
areas, there is no proper facility of schooling even at Primary and Secondary level
of Education. They live in darkness. Low literacy leads them to the ignorance of the
importance of health and nutrition. Due to the ignorance about health and
nutrition, they could not pay much attention to their children who are the future of
any country. Shanthi, K. (1998) in her study discussed about the General, Political,
Legal, Social, Economic and Cultural empowerment of women. Shanthi is in
opinion that the reservation for women starting from Panchayats to Parliament,
role of education in social empowerment of women, employment as an important
tool for empowerment, role of governmental and non-governmental organizations
in women development, need for conscientization of men and women on the
importance of women development and women empowerment have been
highlighted.3 Verma,Y.S.(2009) critically examined the Women’s higher education
in India, its reality and look for solutions. Verma find out that the Girls have less
access to quality education. Even in the professional courses, the number of girls is
less as compared to boys. The girls from backward communities face severe
discrimination. Despite reservation quota, they never get opportunity to enter a
college, whatever is the course of study. Latest data show that about one in 17
Muslim girls, one in 10 Hindu girls, one in eight Sikh girls and one in six Christian
girls, avail higher education. Scheduled Caste/Scheduled Tribe and Other
Backward Class girls have poorer access to higher education than higher-caste
girls. Less than one in every 20 Scheduled Caste girls accesses higher education,
compared with one in every five for girls from the higher castes. The imbalances in
the access to higher education among Muslim, SC, ST and OBCs girls also warrant
serious concern.4 Rani, G. S. (2010) highlighted the international and national
initiatives to promote women’s education in India. Rani observed that the
education is often neglected in societies struggling to meet the many needs of their
people. Recently education has received greater priority as Planners and Policy
makers finally recognized it as a key factor in determining the pace of
development. Creating educational opportunities for girls and women is strongly
28 Amit Chaturvedi and Bhanu Pratap Singh

Empowerment of Women through Higher Education of IGNOU 29
emphasized in the work of the UN. CEDEW suggests ‘Encouraging Co-education’
as one way of eliminating the stereotyping of women. Education, being the most
powerful instrument for empowering women assumes special priority in the
recent plans and programmes of National and International action. Concerted
efforts are also made to bring more women into the purview of education. In spite
of these many provisions, still there is a wide gap between male and female literacy
levels in India. Keeping this in view Rani has suggested the programme of action
for future has to be formulated so as to reduce the gender gap as well as illiteracy
rate among girls and women.2
2. Role of Indira Gandhi National Open University (IGNOU)
Education is an effective and successful tool for the development of any
country. In view of this fact, the Government of India gives an opportunity to all to
provide high quality and equity education to all segment of the society, as it is the
fundamental right to get education provided under Article 21 ‘A’ of Indian
Constitution. The former Prime Minister, Smt. Indira Gandhi rightly, stated (that):
“Education is a liberating force, and in our age it is also a democratizing force,
cutting across the barriers of caste and class, smoothing out inequalities imposed
by birth and other circumstances.”1
It is well known to the society that IGNOU was established by an Act of
Parliament in 1985 to achieve the following objectives :
8 Democratizing higher education by taking it to the doorsteps of the learners.
8 Providing access to high quality education to all those who seek it
irrespective of age, region, religion and gender
8 Offering need-based academic programmes by giving professional and
vocational orientation to the courses.
8 Promoting and developing distance education in India.
8 Setting and maintaining standards in distance education in the country as an
apex body.
Keeping the objectives on top, since inception the university is progressing in
term of admission, support services mechanisms with wide network of 67 Regional
Centres and 3,000 it’s Learner Support Centres (Study Centres) in all over India.
IGNOU has certain unique features such as: International jurisdiction, Flexible
admission rules, Individualized study: flexibility in terms of place, pace and
duration of study, Use of latest information and communication technologies,
Nationwide student support services network, Cost-effective programmes
,Modular approach to programmes, Resource sharing, collaboration and
networking with conventional Universities, Open Universities and other,
Institutions/ Organizations socially and academically relevant programmes based
on students need analysis, Convergence of open & conventional education

systems. IGNOU has emerged as the largest Open University in the World and
recognized as Centre of Excellence in Distance Education by the Commonwealth of
Learning (1993) and Award of Excellence for Distance Education Materials by
Commonwealth of Learning (1999).
IGNOU Regional Centre, Aligarh was established in January, 2008 to cater
and educate the population of 14 district of Western Uttar Pradesh through Open
and Distance Learning. As the women education especially Muslim women’s
higher education is big challenge to the Uttar Pradesh government as well as the
society. Since inception of IGNOU Regional Centre, Aligarh is reaching to unreach
by giving ample opportunities to educate the people of all segment of Society.
3. Objectives of the Study
The main objectives of the study are :
1. To study the share of women students admission in total admission at
IGNOU Regional Centre, Aligarh and Bhopal.
2. To study the share of Muslim women students admissions in total admission
at IGNOU Regional Centre, Aligarh and Bhopal.
3. To study the Share of Muslim Women admission in total women admission
of IGNOU Regional Centre, Aligarh and Bhopal.
4. To study the Correlation between total admission and women students
admissions at IGNOU Regional Centre, Aligarh and Bhopal.
5. To study the Correlation between total admission and Muslim women
students admissions at IGNOU Regional Centre, Aligarh and Bhopal.
6. To study the Correlation between total women admission and Muslim
women students admissions at IGNOU Regional Centre, Aligarh and Bhopal.
7. To study the Correlation between total women admission and Muslim
women students admissions at IGNOU Regional Centre, Aligarh and Bhopal.
8. To study the Correlation between total women admission and Muslim
women students admissions at IGNOU Regional Centre, Aligarh and Bhopal.
4. Research Design
4.1 Type of the Study
This study is a descriptive study based on the primary data available at the
admission section of IGNOU Regional Centre Aligarh and Regional Centre Bhopal.
4.2 Statistical Technique Uses
Data has been collected from the primary source, which is available at the
admission section of IGNOU Regional Centre Aligarh & Bhopal and analyzed with
help of Percentage, Sum and Histo-Diagram and statistically by using correlation.
30 Amit Chaturvedi and Bhanu Pratap Singh

Empowerment of Women through Higher Education of IGNOU 31
4.3 Delimitation of the Study
The Study will be delimited to the students admissions under Regional
Centre Aligarh and Regional Centre Bhopal from year 2012 to 2016 only.
5. Analysis and Interpretation of Data
Analysis of the data means studying and interpretation the tabulated
material in order to determine the research outcomes. The process of interpretation
is essentially one of stating what the result show? What is the answer of original
problem? That is all limitation the data must enter into and become a part of
interpretation of the results. As per research objectives the data collected from
admission section and analyzed the data in 11 following tables.
Objective 1 : To study the share of women student admissions in total
admission at IGNOU Regional Centre, Aligarh and Bhopal.
In the following table, the figures of total admission and total Women
admission with corresponding percentage share of IGNOU Regional Centre,
Aligarh and Bhopal is shown from year 2012 to 2016. The total admission has been
calculated 23678 and total women admission is 9014 at RC Aligarh and the total
admission has been calculated 34562 and total women admission is 14275 at RC
Bhopal.
Table-1 : Share of Women admission in total admission of IGNOU Regional Centres,Aligarh and Bhopal
Year CR f
o n
oissim
dA l
ato
Thr
agil
A
noissi
md
a n
em
ow l
ato
T
CR
nihr
agil
A
ne
mo
w fo
eg
atn
ecre
Pn
em
ow l
atot
ni n
oissim
da
C
R fo
noissi
md
ahr
agil
A
CR f
o n
oissim
dA l
ato
Tl
ap
oh
B
noissi
md
a n
em
ow l
ato
T
CR
nil
ap
oh
B
ne
mo
w fo
eg
atn
ecre
Pl
atot
ni n
oissim
da
C
R fo
noissi
md
a n
em
ow
la
po
hB
2012 3324 1202 36.16 7679 3535 46.03
2013 4343 1600 36.84 6454 2683 41.57
2014 5582 2367 42.40 7132 2878 40.35
2015 5621 2131 37.91 7474 2994 40.06
2016 4808 1714 35.65 5823 2185 37.52
Total 23678 9014 37.79% oftotal
admission
34562 14275 41.11% oftotal
admission
Source : Admission data of IGNOU Regional Centre, Aligarh and Bhopal.

The share of women admission in total admission from year 2012 to 2016 may
also be represented histo-graphically as under :
Fig-1
As per admission data of IGNOU Regional Centre Aligarh and Bhopal, theHisto-diagram based on admission data, the investigators have tried to examinethe share of women admission in the total admission of IGNOU Regional Centre,Aligarh and Bhopal from year 2012 to 2016. Table no. 1 shows that the womenadmission share in the total admission of RC Aligarh is approx 37.79% means morethan 1/3 share of women admission in the total admission from year 2012 to 2016.
As far as RC Bhopal is concerned the women admission share in the totaladmission is approx 41.11% means near to 1/2 share of women admission in thetotal admission from year 2012 to 2016. The investigators are in opinions that it is aphenomenal and significant growth of women students through ODL system ofIGNOU.
Average women admission in average total admission of IGNOU RegionalCentres, Aligarh and Bhopal are shown in Table-2 in next page. It is evident that the share of women admission in total admission from year 2012 to 2016 may also berepresented.
Objective 2 : To study the share of Muslim women student admissions intotal admission at IGNOU Regional Centre, Aligarh and Bhopal.
In table-2, the figures of total admission and Muslim women admission withcorresponding percentage share of IGNOU Regional Centre Aligarh and Bhopal isshown from year 2012 to 2016.
The total admission has been calculated 23678 and total Muslim womenadmission is 2048 at RC Aligarh and the total admission has been calculated 34562and total Muslim women admission is 1834 at RC Bhopal.
32 Amit Chaturvedi and Bhanu Pratap Singh

Empowerment of Women through Higher Education of IGNOU 33
Table-2 : Average Women admission in average total admission of IGNOU RegionalCentres, Aligarh and Bhopal
The Total District in IGNOU Regional Centre, Aligarh are 14 and under
Regional Centre, Bhopal are 32 Districts.
Year TotalAdmission of
RC Aligarh
Total womenadmission inRC Aligarh
TotalAdmission of
RC Bhopal
Total womenadmission inRC Bhopal
Total admissionFrom 2012 to 2016
23678 9014 34562 14275
Average Admissionper District
23678/14 =1691 9014/14 =644 34562/32 =1080 14275/32 =446
Source : Admission data of IGNOU Regional Centre, Aligarh and Bhopal
Fig-2
Share of Muslim women admission in total admission of IGNOU Regional
Centres, Aligarh and Bhopal are shown in table-3 on next page.
As per admission data of IGNOU Regional Centre, Aligarh and pie diagram
based on admission data, the investigators examined the share of Muslim women
admission in the total admission of IGNOU Regional Centre, Aligarh and Bhopal
from year 2012 to 2016. Table no. 3 shows that the women admission share in the
total admission is approx 08.57% from year 2012 to 2016 at RC Aligarh and at RC
Bhopal women admission share in the total admission is approx 05.32% from year
2012 to 2016.
Although the percentage of Muslim women admission is low but as far as
whole Uttar Pradesh and Madhya Pradesh state is concerned, the percentage of
Muslim women admission in total admission is quite good. The investigators are in
opinions that because of more awareness and motivation of parents for enrollment
in higher education among the minorities’ people, the share of Muslim women
admission in total admission may significantly increase.

Table-3 : Share of Muslim Women admission in total admission of IGNOU RegionalCentres, Aligarh and Bhopal
Year
CR f
o n
oissim
da l
ato
Thr
agil
A
ni n
oissim
da
ne
mo
w mils
uM
C
Rhr
agil
A
n
em
ow
milsu
M fo
eg
atn
ecre
Pn
oissim
da l
atot
ni n
oissim
da
C
R fo
hra
gilA
CR f
o n
oissim
da l
ato
Tl
ap
oh
B
ni n
oissim
da
ne
mo
w mils
uM
C
Rl
ap
oh
B
n
em
ow
milsu
M fo
eg
atn
ecre
Pn
oissim
da l
atot
ni n
oissim
da
C
R fo
la
po
hB
2012 3324 270 8.12 7679 371 4.83
2013 4343 330 7.6 6454 336 5.21
2014 5582 486 8.71 7132 386 5.41
2015 5621 533 9.48 7474 416 5.57
2016 4808 429 8.92 5823 325 5.58
Total 23678 2048 (08.57% of total
admission)
8.57 %Muslimwomen
admissionof total
admission
34562 1834(05.32% of
totaladmission)
5.32 %Muslimwomen
admissionof total
admission
Source : Admission data of IGNOU Regional Centre, Aligarh and Bhopal
The result of total admission and total Muslim women admission from year
2012 to 2016 may also be represented as under:
Fig-3
34 Amit Chaturvedi and Bhanu Pratap Singh

Empowerment of Women through Higher Education of IGNOU 35
Table-4 : Average Muslim Women admission in average total admission of IGNOURegional Centres, Aligarh and Bhopal
The Total District in IGNOU Regional Centre, Aligarh are 14 and under
Regional Centre,Bhopal are 32 Districts
Year AverageAdmission perDistrict of RC
Aligarh
Average Muslim women
admission perDistrict in RC
Aligarh
AverageAdmissionper District
of RCBhopal
AverageMuslim women admission perDistrict in RC
Bhopal
Total admissionFrom 2012 to2016
23678 2048 (08.57% oftotal admission)
34562 1834 (05.32% oftotal admission)
AverageAdmission perDistrict
23678/14 =1691 2048/14 =146 34562/32=1080
1834/32 =57
Source : Admission data of IGNOU Regional Centre, Aligarh and Bhopal
The share of Muslim women admission in total admission from year 2012 to
2016 may also be represented histo-graphically as under :
Fig-4
Objective 3 : To study the share of Muslim women student admissions in
total women admission at IGNOU Regional Centre, Aligarh.
In table-5 on next page, the figures of total Women admission and Muslim
women admission of IGNOU Regional Centre, Aligarh is shown from year 2012 to
2016, the total women admission is 12382 and women admission is 2800.

Table-5 : Share of Muslim Women admission in total women admission of IGNOURegional Centres, Aligarh and Bhopal
Year noissi
md
a n
em
ow l
ato
T
CR f
ohr
agil
A
ne
mo
W mils
uM
CR
ni n
oissim
dA
hra
gilA
milsu
M fo
eg
atn
ecre
Pni
noissi
md
a n
em
ow
noissi
md
a n
em
ow l
atot
C
R fo
hra
gilA
noissi
md
a n
em
ow l
ato
T
CR f
ol
ap
oh
B
ne
mo
W mils
uM
C
R ni
noissi
md
Al
ap
oh
B
milsu
M fo
eg
atn
ecre
Pni
noissi
md
a n
em
ow
noissi
md
a n
em
ow l
atot
C
R fo
la
po
hB
2012 1202 270 22.46 3535 371 10.50
2013 1600 330 20.63 2683 336 12.52
2014 2367 486 20.53 2878 386 13.41
2015 2131 533 25.01 2994 416 13.89
2016 1714 429 25.03 2185 325 14.87
Total 9014 2048(22.73% of
totalWomen
admission)
22.73%Muslimwomen
admissionof totalWomen
admission
14275 1834(13.04% of
totalWomen
admission)
13.04
Source : Admission data of IGNOU Regional Centre, Aligarh and Bhopal
The result of total women admission and total Muslim women admission
from year 2012 to 2016 may also be represented pie-graphically as under:
Fig-5
36 Amit Chaturvedi and Bhanu Pratap Singh

Empowerment of Women through Higher Education of IGNOU 37
As per admission data of IGNOU Regional Centre, Aligarh and pie diagrambased on admission data, the investigators examined the share of Muslim womenadmission in the women admission of IGNOU Regional Centre, Aligarh from year2012 to 2016. Table no. 3 shows that the women admission share in the totaladmission is approx 22.61% from year 2012 to 2016, which is a good share ofMuslim women admission in total admission. The investigators are in opinionsthat although the share of Muslim women admission is 08.36, which is low but asfar as share of Muslim women admission in total women admission is quite good.
The Total District in IGNOU Regional Centre, Aligarh are 14 and underRegional Centre, Bhopal are 32 Districts.
Table-6 : Average Muslim Women admission in average Women admission of IGNOURegional Centres, Aligarh and Bhopal
Year ne
mo
W e
gar
ev
Ar
ep
noissi
md
AC
R fo tcirtsi
Dhr
agil
A
milsu
M e
gar
ev
A
noissi
md
a n
em
ow
CR
ni tcirtsiD r
ep
hra
gilA
ne
mo
W e
gar
ev
Ar
ep
noissi
md
AC
R fo tcirtsi
Dl
ap
oh
B
milsu
M e
gar
ev
A
noissi
md
a n
em
ow
CR
ni tcirtsiD r
ep
la
po
hB
Total admissionFrom 2012 to 2016
9014 2048 (22.73% oftotal Womenadmission)
14275 1834(13.04% of total Women
admission)
Average Admissionper District
9014/14 =644 2048/14 =146 14275/32 =446 1834/32 =57
Source : Admission data of IGNOU Regional Centre, Aligarh and Bhopal
Objective 4 : To study the Correlation between total admissions at IGNOURegional Centres, Aligarh and Bhopal.
Table-7 : Correlation between total admission at IGNOU Regional Centre, Aligarh andRegional Centre, Bhopal
Year Total Admission of RCAligarh
Total Admission of RCBhopal
Correlation
2012 3324 7679 0.10 (Negative)
2013 4343 6454
2014 5582 7132
2015 5621 7474
2016 4808 5823
Source: Admission data of IGNOU Regional Centre, Aligarh
As per above data analysis of admission data of IGNOU Regional Centre,Aligarh from year 2012 to 2016 in respect of Total admission and Muslimadmission, the correlation is observed 0.96. The correlation 0.96 between Totaladmission and Muslim admission is very positive and very strong, which shows

that the women admission is gaining equal growth as well as total admission ofRegional Centre, Aligarh.
Objective 5 : To study the Correlation between women student admissions at
IGNOU Regional Centre, Aligarh and Bhopal.
Table-8 : Correlation between women student admissions at IGNOU Regional Centre,Aligarh and Regional Centre, Bhopal
Year Total women admissionof RC Aligarh
Total women admissionof RC Bhopal
Correlation
2012 1202 3535 0.29 (Negative)
2013 1600 2683
2014 2367 2878
2015 2131 2994
2016 1714 2185
As per above data analysis of admission data of IGNOU Regional Centre,
Aligarh from year 2012 to 2016 in respect of Total admission and Muslim
admission, the correlation is observed 0.96. The correlation 0.96 between Total
admission and Muslim admission is very positive and very strong, which shows
that the women admission is gaining equal growth as well as total admission of
Regional Centre, Aligarh.
Objective 6 : To study the Correlation between Muslim women student
admissions at IGNOU Regional Centre, Aligarh and Bhopal.
Table-9 : Correlation between Muslim women student admissions at IGNOURegional Centre, Aligarh and Bhopal
Year Muslim WomenAdmission at RC Aligarh
Muslim womenAdmission at RC Bhopal
Correlation
2012 270 371 0.53 (Positive)
2013 330 336
2014 486 386
2015 533 416
2016 429 325
Source : Admission data of IGNOU Regional Centre, Aligarh
As per above data analysis of admission data of IGNOU Regional Centre,
Aligarh from year 2012 to 2016 in respect of Total admission and Muslim
admission, the correlation is observed 0.92. The correlation 0.92 between Total
admission and Muslim admission is very positive and very strong, which shows
that although share of Muslim women admission in total admission is very low but
as far as comparison with women admission, the Muslim women admission is
gaining equal growth as well as total admission of Regional Centre, Aligarh.
38 Amit Chaturvedi and Bhanu Pratap Singh

Empowerment of Women through Higher Education of IGNOU 39
Objective 7 : To study the Correlation between total admission and Muslim
women admissions at IGNOU Regional Centre, Aligarh and Bhopal.
Table-10 : Correlation between total admission and Muslim women students’ admissionsat IGNOU Regional Centre, Aligarh
Year Total admission at RCAligarh and Bhopal
Total admission ofMuslim women at RC
Aligarh and Bhopal
Correlation
2012 11003 641 0.90 (Positive)
2013 10797 666
2014 12714 872
2015 13095 949
2016 10631 754
Source : Admission data of IGNOU Regional Centre,Aligarh
As per above data analysis of admission data of IGNOU Regional Centre,
Aligarh from year 2012 to 2016 in respect of Total admission and Muslim
admission, the correlation is observed 0.92. The correlation 0.92 between Total
admission and Muslim admission is very positive and very strong, which shows
that although share of Muslim women admission in total admission is very low but
as far as comparison with women admission, the Muslim women admission is
gaining equal growth as well as total admission of Regional Centre, Aligarh.
Objective 8 : To study the Correlation between women admission and
Muslim women admissions at IGNOU Regional Centre, Aligarh and Bhopal.
Table-11 : Correlation between women admission and Muslim women
students’ admissions at IGNOU Regional Centre, Aligarh
Year women admission ofRC Aligarh and
Bhopal
No. of Muslim women Admission of RC
Aligarh and Bhopal
Correlation
2012 4737 641 0.61 (Positive)
2013 4283 666
2014 5245 872
2015 5125 949
2016 3899 754
Source : Admission data of IGNOU Regional Centre,Aligarh
As per above data analysis of admission data of IGNOU Regional Centre,
Aligarh from year 2012 to 2016 in respect of Total admission and Muslim
admission, the correlation is observed 0.96. The correlation 0.96 between Total
admission and Muslim admission is very positive and very strong, which shows
that the women admission is gaining equal growth as well as total admission of
Regional Centre, Aligarh.

6. Conclusion and Recommendations
Through this painstaking Research Survey the Investigator has come to theconclusion that IGNOU is fulfilling the purpose of their establishment. In the above tables and graphs of the admission figure of total admission, share of womenadmission, total Muslim admission and share of Muslim women’s admission isclear the picture of awareness of women for higher education.
The IGNOU Study Centres are attracting good numbers of people (male/female) and fulfilling their educational needs including of those hailing fromMuslim society and other minorities, irrespective of their caste, and creed. Theadmission of learners is drastically increasing session to session. Thus, weconclude that the IGNOU is playing a vital role in fulfilling the dreams of Society toprovide quality education at the doorsteps of the learners by developing itsdistance education system.
Recent initiative of Government of India “Beti Bachoo,Beti Padhao” is verysignificant step for the development of the women education in the country. It hasbeen seen, if one women gets educated in the society, she facilitate to educate thegeneration to generation.
Further, the government has to take a lead role for strengthening basicinfrastructure, providing adequate financial support and improvising regulatoryframework for women’s education. The public expenditure on education hasincreased during preceding years, but the percentage share of GDP spent on higher education has come down. Further, expenditure on higher education as percentage of total expenditure on education has remained static during preceding years.There is no reason why government should act miserly when it is the issue ofinvesting in higher education. Moreover, in the recent years the government hasalready collected huge amount on account of educational cess.
References
1. Cover page, IGNOU Common Prospectus, New Delhi-68 : IGNOU Maidan Garhi.
2. Rani, G. S., “Women’s Education in India-An Analysis”, Asia-Pacific Journal of Social
Sciences, 11(1), 2010, 106-124
3. Shanthi, K. (ed.), Empowerment of Women, Chennai : Anmol Publications Pvt. Ltd.,
1998.
4. Verma,Y. S. (2009). Retrieved from http://dx.doi.org/10.2139/ssrn.1486230
5. Singh,Bhanu (), “Democratization of Higher Education for minorities through IGNOU”,
Education Development, New Delhi : APH Publication, 2011, 213-222. ISBN
978-812-313-1318-3
6. Chaturvedi, Amit and Singh,Bhanu, “Empowerment of Women’s through Higher
Education of IGNOU: With reference to IGNOU Regional Centre, Aligarh”, Gyan Bhav
(Journal of Teacher Education), Biannual And Bilingual International Journal, Aligarh,
2014, ISSN-2319-8419 ê
40 Amit Chaturvedi and Bhanu Pratap Singh
Article Received on July 22, 2017; Accepted on August 18, 2017

5
Desirability and Feasibility of Holding
Simultaneous Elections in India
Triranjan Raj*
A central promise of democracy is to deliver good governance by holding politiciansaccountable for their performance in office. Elections allow candidates to build reputations forperforming well and weed out candidates that cannot be deterred from performing poorly by thethreat of removal from office. When successful, this process gradually strengthens voters’ beliefthat elections can deliver political accountability and leads to the consolidation of democracy.Competitive elections create a relationship of formal accountability between policy makers andcitizens-electoral rewards and punishments can be handed out on Election Day. Ideally, thisformal accountability leads to better governance. The principal mechanisms of politicalaccountability in a democratic state attempt to control the risks associated with the rule ofpoliticians over citizens. Regular elections provide an important accountability mechanism byallowing citizens to decide whether or not to extend a government’s tenure. In India every fiveyears there are elections for central and state governments. Now we see that there is every threemonths election in any part of the country. Country is always in election mode. Honorable PMModi and central government wants the simultaneously elections in centre and states to save thecountry from election mode. There are two issues involved in the debate on holding simultaneouselections one is that of desirability and the other is the issue of feasibility. On the first issue thereseems to be a broader consensus that it is desirable to have simultaneous elections as it is afinancially prudent idea, will ensure governance, will relieve armed forces etc. the main issue onwhich certain doubts are being raised by experts is that of feasibility of holding simultaneouselection. In this article we will try to figure out how far is it feasible to have simultaneous electionsin India.
CONTEMPORARY SOCIAL SCIENCES, Vol. 26, No. 3 (July-September), 2017
* Assistant Professor, Department of Political Science, Ram Lal Anand College, New Delhi (India)E-mail: <[email protected]>

[Keywords : Simultaneous elections, Accountability, Good governance,
Legitimacy, Communalism, Fundamentalism, Feasibility, Desirability]
1. Introduction
A central promise of democracy is to deliver good governance by holding
politicians accountable for their performance in office. Elections allow candidates
to build reputations for performing well and weed out candidates that cannot be
deterred from performing poorly by the threat of removal from office. When
successful, this process gradually strengthens voters’ belief that elections can
deliver political accountability and leads to the consolidation of democracy.
Competitive elections create a relationship of formal accountability between policy
makers and citizens-electoral rewards and punishments can be handed out on
Election Day. Ideally, this formal accountability leads to better governance. The
principal mechanisms of political accountability in a democratic state attempt to
control the risks associated with the rule of politicians over citizens. Regular
elections provide an important accountability mechanism by allowing citizens to
decide whether or not to extend a government’s tenure. In India every five years
there are elections for central and state governments. Now we see that there is
every three months election in any part of the country. Country is always inelection mode. Honorable PM Modi and central government wants the
simultaneously elections in centre and states to save the country from election
mode. There are two issues involved in the debate on holding simultaneous
elections one is that of desirability and the other is the issue of feasibility. On the
first issue there seems to be a broader consensus that it is desirable to have
simultaneous elections as it is a financially prudent idea, will ensure governance,
will relieve armed forces etc. the main issue on which certain doubts are being
raised by experts is that of feasibility of holding simultaneous election. In this
article we will try to figure out how far is it feasible to have simultaneous elections
in India.
A democratic state is one in which political power is based on the will of
people, and in which all citizens have the opportunity to participate in political life.
Democratic legitimacy depends upon the will of people to their being governed by
those in power. It is impossible to conceive of a democratic state which does not
seek to ascertain that will through free and fair elections. India has the distinction
of being the largest democracy of the world. Elections are the most important and
integral part of politics in a democratic system of governance. While politics is the
art and practice of dealing with political power, election is a process of
legitimization of such power. Democracy can indeed function only upon this faiththat elections are free and fair and not rigged and manipulated, that they are
effective instruments of ascertaining popular will both in reality and in form and
are not mere rituals calculated to generate illusion of difference to mass opinion, it
cannot survive without free and fair elections.1 The requirement of electoral
42 Triranjan Raj

Desirability and Feasibility of Holding Simultaneous Elections in India 43
legitimacy is contained in the universal declaration of Human Rights. The purpose
of elections is to ensure that the will of the people is the basis of the authority of
government.
India is the largest democracy in the world. Elections are constantly held
across the country. There is some election or the other every year. The election
system is the pillar of Indian democracy. The system consists of various levels of
elections to the Lok Sabha, State Legislative Assemblies, and Panchayati Raj
Institutions. Elections are conducted at various levels of the federal structure in
India. There is the nation-wide election for Lok Sabha that consists of 545
members. At the State level, there is an election for the State Legislative Assembly.
Members of this body are also elected directly by the people of the constituencies in
the same manner as that of the Lok Sabha. At the grass-roots level, there are
elections for local bodies like the three-tiered Panchayati Raj system in rural areas
and municipal governments in urban areas.
The 73rd and 74th constitutional amendments were passed by Parliament in
1992 to provide a constitutionally mandated status for local bodies. As a result, by
enactment of each State government, the three-tiered Panchayati Raj System,
consisting of the zilla parishad at the district level, the panchayat samiti at the block
level, and the gram panchayat at the village level, was regularized for rural areas.
The five-year term was prescribed to be the term of office, and the election at the
end of the term was to be conducted strictly under the State Election Commission.
The reservation for socially weaker sections of people was also prescribed for SCs,
STs, and women. The devolution of financial resources from the State government
to the Panchayati Raj bodies was also prescribed. On the basis of the 74th
constitutional amendment, municipal bodies were similarly regularized. With the
full establishment of the Panchayati Raj system and municipal bodies based on the
constitution, the competitive election system was extended to the grass-roots level.
One level of election is related to other level of election.2 As a whole, this constitutes
a network of election politics in contemporary India, and is the basic framework of
India’s democratic regime.
India held simultaneous polls every five years to the Lok Sabha and 20 odd
state assemblies till 1967, the year of the fourth general elections. First General
Elections to House of People (Lok Sabha) and all State Legislative Assemblies were
held simultaneously in 1951-52. That practice continued in three subsequent
General Elections held in the years - 1957, 1962 and 1967. However, due to the
premature dissolution of some Legislative Assemblies in 1968 and 1969 , the cycle
got disrupted. In 1970, the Lok Sabha was itself dissolved prematurely and fresh
elections were held in 1971. Thus, The First, Second and Third Lok Sabha enjoyed
full five year terms. The term of the Fifth Lok Sabha was extended till 1977 under
Article 352. After that, the Eighth, Tenth, Fourteenth and Fifteenth Lok Sabha could
complete their full five year terms. The Sixth, Seventh, Ninth, Eleventh, Twelfth

and Thirteenth Lok Sabha was dissolved prematurely. As a result of premature
dissolutions and extension of terms of both the Lok Sabha and various State
Legislative Assemblies, for the last forty eight years there have been separate
elections to Lok Sabha and States Legislative Assemblies and the cycle of
simultaneous elections has been disturbed. The need for simultaneous election to
Lok Sabha and Legislative Assemblies has been felt by the electorate as elections
have become big budget affair and expensive and in most of the cases expenditures
by the candidates are exceeding the ceiling fixed by the ECI.3 These massive
exercises are not only costly but human resource intensive. These issues have given
rise to debates on whether it would be prudent to hold simultaneous general and
assembly elections. The BJP’s LK Advani raised this issue in 1995 and said that
political parties should come together to “restore the synchronicity of Lok Sabha
and all assembly elections” because their de-linking has “not been good either for
the health of democracy or that of the administration.”4
The Law Commission of India headed by Hon’ble Justice B. P. Jeevan Reddy
in its One Hundred Seventieth Report on Reform of Electoral Laws (1999) has
suggested simultaneous elections to Lok Sabha and State Legislative Assemblies
for the sake of stability in governance. A majority of political parties have
welcomed a proposed electoral reform to hold simultaneous elections to the Lok
Sabha and state assemblies and to ensure their full term. The Election Commission
of India has mooted the proposal so that people have the right to elect a
government within a stipulated period.5 Short lived Lok Sabhas and assemblies are
not good news for an average legislator who spent a lot of money, energy and time
to get elected. Such legislators yearn for a stable five year term that ensures time
and scope to work for their constituencies.
2. Rationale of Simultaneous Elections
Simultaneous elections ideally implies that elections to all the tiers of
constitutional institutions should take place simultaneously in a synchronized and
coordinated fashion which means that a voter casts his/her vote for electing
members of all tiers of the government on a single day. The constitution of India
provides for determining composition of key constitutional institutions such as the
office of president, vice-president, both houses of parliament, legislatures of
various states etc through free and fair elections. Elections to Lok Sabha and state
Legislative Assemblies are conducted through direct voting by eligible voters
through universal adult suffrage whereas for institutions like president of India,
vice-president, Rajya Sabha is conducted through indirect voting by an electoral
college as per constitutional and statutory provisions. Article 324 of the
constitution mandates the Election Commission of India to supervise, direct and
control elections to the office of president, vice-president, both houses of
parliament, and state legislature. After 73rd and 74th constitutional amendment
44 Triranjan Raj

Desirability and Feasibility of Holding Simultaneous Elections in India 45
Election Commission of India was further mandated to conduct elections for the
third tier of government in both rural and urban areas. Now as per the definition of
simultaneous elections stated above a voter has to cast his/her vote for different
tiers of government on a single day and at the same time but over here this does not
mean that under it voting across the country for all the three tiers of government
has to take place on a single day. The Election commission of India can also conduct
elections to these tiers in a phased manner as per the existing practice.6
3. Justifications for holding Simultaneous Elections
3.1 Improve Governance
Frequent election heavily impact Governance due to imposition of Model
Code of Conduct. The Model Code of Conduct (MCC) is a set of norms that lays
down several do’s and do not’s that political parties, contesting candidates, parties
in power have to strictly abide by during the process of elections. The MCC has
been evolved with the consensus of political parties who have agreed to abide by
its principles and to respect and observe it in its letter and spirit. The Model Code
is enforced from the date of announcement of election schedule by the Election
Commission and is operational till the process of elections is completed. During
general elections to Lok Sabha, the code is applicable throughout the country.
During general elections to the Legislative Assembly, the code is applicable in
the entire State. Effectively, except the routine administrative activities, other
development programs, welfare schemes, capital projects etc. remain largely
suspended till the time the model code is applicable and in the area it is in
operation.7 The former CEC H.S Bhrama in 2015 while speaking on
the disadvantages in the present system: With 29 states and 07 Union Territories,
at any point of time some part of the country is gearing up for an election. This
forces political parties to be in election mode perpetually. Plus, once an election
is declared, the model code of conduct restricts the free functioning of
governments in a poll bound state, disrupting ‘socioeconomic’ life.8 Problems due
to imposition of the above code have been articulated by the Parliamentary
Standing committee in its 79th report.9 The Committee states “…The imposition
of Model Code of Conduct (MCC) puts on hold the entire development
programme and activities of the Union and State Governments in the poll bound
State. It even affects the normal governance. Frequent elections lead to imposition
of MCC over prolonged periods of time. This often leads to policy paralysis and
governance deficit.”10
3.2 Fiscal Prudence
Elections lead to huge expenditures by various stakeholders. The arguments
that are made in favour of simultaneous elections maintain that the cost of
administering paraphernalia such as logistical expenses incurred by the

government and the para-military forces that provide official security etc is very
high and by introducing simultaneous elections it would reduce the cost
drastically.11 Every year, the Government of India and/or respective State
Governments bear expenditures on account of conduct, control and supervision of
elections. Besides the Government, candidates contesting elections and political
parties also incur huge expenditures. The candidates normally incur expenditures
on account of various necessary aspects such as travel to constituencies, general
publicity, organizing outreach events for electorates etc. while the political parties
incur expenditures to run the party’s electoral machinery during elections,
campaigning by star leaders and so on. Candidates and political parties in their bid
to win elections end up spending significantly more than the prescribed
expenditure limits. The urge to spend more than prescribed limits to win elections,
is consequently blamed as one of the key drivers for corruption and black-money
in the country.12 In one of the recent conferences organized by Association for
Democratic Reforms (ADR), Dr. S. Y. Quraishi, former Chief Election
Commissioner, remarked “….elections have become the root cause of corruption
in the country.” He further mentioned that “….after winning elections, the
politician-bureaucrat nexus indulges in “recovering the investment” and that is
where corruption begins.”13
As elections happen frequently in some State Assembly or the other, political
parties particularly worry about need to keep inflow of funds and contributions
continued. This whole cycle is consequently blamed as one of the key drivers for
corruption and black-money in the country. Hence, from the perspective of
candidates and political parties, simultaneous elections could open up possibilities
to address the above systemic problems that impact the overall fabric of Indian
economy and polity adversely. Simultaneous elections would help the exchequer
curtail election expenditures in a significant manner. Hence, from the perspective
of the Government, simultaneous elections would clearly help save precious tax
payers money. This is critical as efficiency in election expenditures would
contribute to enhanced fiscal space - both for State and the Union Government that
could be deployed for other national development priorities without comprising
the democratic structure of the country.14
3.3 Will strengthen Internal Security of the Country
The Election Commission of India takes help of a significant number of
polling officials as well as armed forces to ensure smooth, peaceful and impartial
polls. For providing the required security arrangements, the Election Commission
generally involves Central Armed Police Forces (CAPF). As the demand for CAPF
is typically higher than the supply, police forces such as State Armed Police, Home
Guards, District Police etc. are often deployed as well to complement security
arrangements. The role of such security forces starts much before polling and ends
46 Triranjan Raj

Desirability and Feasibility of Holding Simultaneous Elections in India 47
only after the counting of votes and declaration of results effectively covering the
entire duration of the elections While the deployment of polling officials is still for a
smaller duration (typically few days before and after the day of voting and few
days before and after the day of counting), the deployment of security forces
(particularly the CAPF) is normally throughout the elections and they remain
mobile from one place to another. Considering that about 2-5 State Assemblies go
to polls every 6 month period as stated previously, this situation leads to a lock-in
of CAPF and state police forces for prolonged periods of time. Such a situation is
clearly unwarranted as it takes away a portion of such armed police force which
could otherwise be better deployed for other internal security purposes - the basic
responsibilities for which these forces were developed for. So if polls are conducted
simultaneous then these forces will be available for greater period of time and will
ultimately improve internal security of the country.15
3.4 Reduce Disruption in Normal Public Life caused by Frequent Elections
The Parliamentary Standing committee on Personnel, Public grievances, Law
and justice noted that frequent elections lead to disruption of normal public life
and impact the functioning of essential services. Holding of political rallies
disrupts road traffic and also leads to noise pollution. On this issue the Committee
suggested that if simultaneous elections are held, this period of disruption would
be limited to a certain pre-determined period of time.16
3.5 Reduce Communal and Caste Overtones
Frequent elections perpetuate caste, religion and communal issues across the
country: former Chief Election Commissioner Dr. S. Y. Quarishi believes that
elections are polarizing events and if the country is perpetually remains in election
mode, there is no respite from these evils. He believes that holding simultaneous
elections would certainly bring certain amount of respite in this issue.17 Religion
and caste are critical features of Indian polity as on these issues only different
political parties want to earn political dividends. Although there is hardly
any instance in India of a political party being totally identified with any particular
caste group, yet there are cases of certain castes lending strong support
to particular political parties. Thus while political parties struggle among
themselves, to win different caste groups in their favour by making offers to them,
caste groups to try to pressurize parties to choose its members for candidature
in elections In many political parties, in place of ideological polarization there
occur the determination of policies and programmes as well as the nomination
of electoral candidates and the extension of support to them on caste
consideration.18
The emergence of regional parties and the withering away of national
outlook and spirit set off another crisis. Candidates come to be selected not in terms

to accomplishments, ability and merit but on the appendages of caste, creed and
community. Ultimately caste becomes the deciding factor on selection. Caste based
politics is eroding the unity principle in the name of regional autonomy. Similarly,
the politics of communalism and religious fundamentalism in the post
independence period has led to a number of separate movements in various states
and regions of the country. Communal polarization, rather multi-polarization, has
posed a threat to the Indian political ethos of pluralism, parliamentarianism and
federalism. Despite the adoption of the principle of Secularism as a constitutional
creed, which ironically allows communal parties to compete, the trend towards
communalism and fundamentalism in Indian politics have been growing day by
day. 19 It has been generally observed that during elections there is sharp rise in
communal and caste overtones. Hence simultaneous elections will definitely help
in curtailing the use of caste and communal overtones by political class for
securing petty political gains.
4. Recommendations made by Parliamentary Standing Committee
for holding Simultaneous Elections
The Standing Committee on Personnel, Public Grievances, Law and Justice
(Chairperson: Dr. E. M. Sudarsana Natchiappan) submitted its report on
the “Feasibility of Holding Simultaneous Elections to House of People (Lok Sabha)
and State Legislative Assemblies” on December 17, 2015. The Committee noted
that the holding of simultaneous elections to Lok Sabha and state assemblies would
reduce :
(i) the massive expenditure that is currently incurred for the conduct of
separate elections;
(ii) the policy paralysis that results from the imposition of the Model Code of
Conduct during election time; and
(iii) impact on delivery of essential services and
(iv) burden on crucial manpower that is deployed during election time.20
4.1 Anti Defection Law and President’s Power to Proclaim Emergency
The Committee observed that the introduction of the Anti Defection Act, 1985
has prevented political defection in the ruling party. This has had a direct bearing
on the term of the legislature. The Committee also noted that in 1994, the Supreme
Court interpreted Article 356 of the Constitution, in relation to the exercise of the
President’s power to proclaim a state of emergency in a state. The Supreme Court
had held that the President can put the legislative assembly of a state in suspended
animation but cannot dissolve it without concurrence of Parliament. Further, the
validity of the proclamation of the President’s rule may be examined by the
48 Triranjan Raj
Desirability and Feasibility of Holding Simultaneous Elections in India 49
judiciary. The Committee stated that this has strengthened the federal structure of
the country by striking a constitutional balance between the central and state
governments.21
4.2 Recommendations of the Law Commission
The Committee referred to the recommendations of the Law Commission of
India, which had suggested that elections of legislative assemblies whose term
ends six months after the general elections to Lok Sabha can be clubbed together.
However, the results of such elections can be declared at the end of the assembly
tenure.22
4.3 Conditions for holding Early Elections
The Committee noted that the Representation of People Act, 1951 permits the
Election Commission to notify general elections six months prior to the end of the
terms of Lok Sabha and state assemblies. The Committee recommended that in
order to hold early elections to Lok Sabha and state legislative assemblies, one of
two conditions must be met :
(i) a motion for an early general election must be agreed to by at least
two-thirds of all members of the House; or
(ii) a no confidence motion must be passed by the House, and with no
alternative government being confirmed within 14 days of passing a confidence
motion.23
4.4 Holding of Elections in Two Phases
The Committee recommended that elections could be held in two phases. It
stated that elections to some Legislative Assemblies could be held during the
midterm of Lok Sabha. Elections to the remaining legislative assemblies could be
held with the end of Lok Sabha’s term.24
4.5 Schedule of Next Cycle of Elections
The Committee suggested that the proposed first phase of assembly elections
could be held in November, 2016. Elections to all state assemblies whose terms end
within six months to one year before or after the appointed election date can be
clubbed together. Similarly, the second phase of elections can be held in 2019 with
the General Elections to Lok Sabha.25
4.6 Schedule of Bye-elections
The Committee also recommended that bye-elections to all seats that become
vacant during a year may be conducted together during a pre-determined time
period.26

5. Critical Evaluation of Issues involved in holding Simultaneous
Elections
The first justification given for simultaneous elections is that it will reduce the
massive expenditure incurred for the conduct elections every year. No one can
deny that a huge amount is spent in conducting elections by the candidate, the
political party and the government. Though there is a defined legal limit on how
much money a candidate is supposed to spend but there is no such limit for the
political party. It’s generally seen that the candidate exceeds this limit in order to
allure and attract voters. So the major issue over here is of compliance of norms.
There is hardly any doubt that the fewer number of elections, the lesser would be
the expenses. But then, elections are the lifeblood of democracy. Sometimes Lok
Sabha and assembly elections happen to coincide then in such a scenario it is a
natural process but if it is imposed only to reduce the number of elections and cut
costs, it is highly undesirable because it privileges monetary concerns over
democratic principles. One should not reduce democratic procedures to such a
level by saying that it’s too expensive and time consuming. The kind of system
which we have developed over a period of time has within it required mechanism
of checks and balances. So holding different elections at different times is one of the
ways through which checks can be placed in the system. If we really want to reduce
expenditure and avoid over spending in elections then there need to be a stringent
cap which need to be placed on political parties and candidates.27
Second argument given in support of simultaneous election is that frequent
elections leads to imposition of Model Code of Conduct (MCC) in Poll bound states
which severely impact the growth and governance of the state. The imposition of
MCC puts on hold the entire development programme and activities of the union
and state government in the poll bound states. It often affects the normal
governance of the state and often leads to policy paralysis. While this is true that
MCC prevents the government from initiating new projects and ultimately slows
down development work but in order to overcome this problem certain changes
can be made in MCC so as to allow the government to initiate projects and
programmes till a reasonable period instead of the existing scenario where the code
comes into force the day elections are announced. One should not forget that there
is a provision in the MCC that the government can consult the election commission
about policy decisions and if decisions are not likely to have any implications for
the election outcome then election commission can permit the government to take
those decisions. Also, in the normal course, the code should apply only to the state
where assembly election is supposed to be held. There is no logical reason why
governance in the rest of the country and at the centre, should come to a standstill,
unless the so called policy decisions are intended to be taken to influence the
electoral outcome in the state where election are to be held. So it is not the holding
50 Triranjan Raj
Desirability and Feasibility of Holding Simultaneous Elections in India 51
of elections that stops governance but the intension of those who are supposed to
govern.28
Thirdly the argument or the slogan of ‘one country one election’ is misleading
for justifying simultaneous elections in India as it is a country whose constitution
gives recognition to 29 states which have their constitutional status of their own in
matter of election and government formation. ‘One country’ does have ‘one
election’ that is national general election but the very idea of having simultaneous
national, state and panchayat election will heavily undermine the federal character
of our state and will be a step toward a unitary state. Simultaneous elections of state
and central legislature will have a negative impact in the sense that once voted to
power the central government can ignore issues pertaining to state development.
Holding elections at different intervals actually strengthen federal design. Since
elections are always around the corner the central government has to address the
issues confronting states as they also have to go to the polls. In order to win
elections in different states they have to take into account the issues confronted
before different states.29 Like just before J and K Election 2015 when the state was
about to go to poll and faced flood crisis, the PM personally went there and
announced rehabilitation package for the state. Similarly PM went to Bihar before
Bihar elections and announced development package for the state. So sometimes
states elections forces the central government to takes cognizance of their demands
and issues.
Another justification given for holding simultaneous elections is that we as a
country started with simultaneous elections where both state and state assemblies’
elections were conducted simultaneously till 1967 and it was only after this election
cycle broke down and we started having different elections at different time. So
when we had this system during the initial years then why can’t we have it now?
It’s true that for the first four general elections everything was done
simultaneously but that was a time when we had just started our journey toward
democracy and regional parties were not able to emerge as a significant force in the
states so simultaneous elections during that time just happened and didn’t
happened because of a constitutional design. Later as the politics in the country has
grown we saw the emergence of different regional parties which led to such
developments where election cycles were broken.30
Another justification given for simultaneous elections is that it will hugely
benefit the economy and it will be financial prudent for the state to go ahead with
the idea of simultaneous elections. This whole idea of financial prudence is grossly
flawed in a living democracy. In democracy gazing the mood of nation is more
important than calculating the cost we are supposed to pay by conducting elections
in order to sustain democracy. It is only through elections one can gauze the mood
of the nation. The government can conduct any number of surveys to show the
success of government policies and programs and the acceptability of these

policies and programs by the citizens but the true success of government
performance can only be ascertained through elections. So it is only a very small
price which the taxpayer citizens have to bear in order to sustain democracy. It only
through frequent elections fresh mandate is given to government policies and
programs.
In our constitutional scheme of things there are inbuilt provisions of checks
and balances like Rajya Sabha places a check on the functioning of Lok Sabha. Now
if proposal of simultaneous elections is accepted in principle then it will severely
compromise our system of checks and balance which has developed over a period
of time. We all know that Rajya Sabha places a check on the functioning of Lok
Sabha. The composition of Rajya Sabha change every two years due to different
states elections happening at different intervals. Now if state and central elections
are supposed to be held simultaneously then the voter has to cast his/her vote on
the same day. In such a scenario the obvious choice of voter will be to vote for the
same party both at the state and central level due to which the composition of Lok
Sabha and Rajya Sabha will be same as the same party will be in majority in both
the houses of parliament. In such a situation the checks which Rajya Sabha used to
place on the functioning of Lok Sabha will go away. So by going in for
simultaneous elections we can hugely compromise inbuilt system of check and
balance.
Under the Indian Constitution, an elected government at the Centre and the
States may be defeated in the lower house on budget proposals and may be voted
out of power. There is also provision for “no confidence” motion against elected
governments both in the Lok Sabha and Assemblies which, if passed, will mean
fresh elections known as “mid-term election”. It is a democratic instrument which
will be affected if the concerned State or the country has to wait for the fixed date of
election. In the case of Proclamation of Emergency for breakdown of law and order
or constitutional functioning in any State leading to President’s rule, fixed election
date would mean a totally undemocratic situation. The concerned State will have
to wait for the next election date and submit to Central rule in the interval. The
practical consequences of these two situations are many and go against the spirit of
democracy and the representative system. Importantly, multiparty system has
taken deep roots in India. State level and regional parties immensely concerned
with local problems are as much national and patriotic as the national parties. Even
some national parties lack a federal structure which is necessary for simultaneous
elections to take up issues of predominantly local interest.31
The debate on simultaneous state and central election erupted under the
background that one party gained thumping majority but one has to see things in
totality. It is just a matter of chance that one party has gained majority in the
centre. In case there is re-emergence of coalition era where no political party gets
an absolute majority then in such a situation this very same idea will have serious
52 Triranjan Raj

Desirability and Feasibility of Holding Simultaneous Elections in India 53
implications. Supposing the power in the centre or state is destabilized due to
certain actions or inaction on the part of ruling dispensation which are not
acceptable to coalition partners then in such a situation no party will have the
numbers to continue in office so under such circumstances how will the rest of the
term will be carried out. On this issue there were certain recommendation which
were made by the parliamentary standing committee. First recommendation
made by the committee is that there should be confidence motion immediately
after no confidence motion. The basic logic given for this alternative is that in case
of general or state elections where no political party gets a clear cut majority and
where there is no pre-poll alliance, different political parties with different
ideologies sit together, chalk out there agenda of alliance and form a government
on the mutually acceptable terms and condition. Now when such an exercise can
be carried out in this scenario then why can’t they forge such alliance under the
scheme of things advocated under simultaneous elections? It is true that alliance
are being forged between different political parties in order to avoid reelections
but the alliances then formed are voluntary in nature and is based on mutually
acceptable common agenda. In case the ruling dispensation moves away from the
common agenda or refuses to follow common agenda, the alliance breaks and
reelections are ordered. But under the scheme of things advocated under
simultaneous election there is no option for reelection and different political
parties have no other option but to forge an alliance even though they are not able
to work out common minimum agenda of governance. This very step in itself goes
again the very nature of representative form of democracy.
The constitutional scheme of things which India is having right now is of
such a nature that it would be very difficult to synchronize national and state
elections. As per the provisions of the constitution the tenure of the parliament
and state legislature can be curtailed if the party in power losses required number
in the parliament or state legislature. So in some situation you have to dissolve the
house because you don’t have the number and on certain occasions the ruling
party wants to dissolve the house early and recommends having reelections. So
under present constitutional scheme of things it is very difficult to synchronize
national and state elections. In order to synchronize state and national election
there are few changes which need to be made in the constitution. A conjoint
reading of Articles 83(2) and 172(1) of Constitution makes it clear that tenure of
Lok Sabha and State Legislative Assemblies cannot be extended beyond five years
except in the case of proclamation of emergency. In case simultaneous elections
were to be conducted either the tenure of Lok Sabha or some of the State
Legislative Assemblies has to be extended beyond five years which is not
permissible under aforesaid Articles of the Constitution. Now if you want
simultaneous elections then you will have to amend these provisions which are
part of basic structure of the constitution.32 The parliament according to

Keshvanand Bharti judgment does not have the power to amend the basic
structure of the constitution. So even if these articles are amended by the
parliament there is a possibility that it can be struck down by the judiciary as it
happened in the case of National Judicial Appointment Commission.
People have also politically matured to some extent to be able to distinguish
the issues in national and State elections. There are also instances when they have
voted for different parties/alliances for Parliament and legislature.33 The argument
for reform suggests that Indian voters are discerning enough to know the
difference between local issues visa-a-visa national issues however the truth of the
matter is that many voters cannot discern the difference either due to lack of
education or due to less awareness to be able to differentiate between issues,
political parties they vote for and their manifesto. Even the data analyzed by a
think tank on voting pattern since 1999 reflects that there is a 77 percent chance that
the Indian voter will vote for the same party for both the State and Centre when
elections are held simultaneously. This trend of choosing the same party has gone
from 68 percent in 1999 to 77 percent in 2004 to 76 percent in 2009 and 86 percent in
2014.34
Holding Simultaneous elections can also create confusion in the mind of the
voters. As per the existing practice where elections are taking place at different
intervals, it is easy for the voter to decide which party to vote for and on what issues
but if the same voter is supposed to vote for all tiers of government on the same day
then he will be in a state of confusion. It would be very difficult for him to decide
which party to vote for and in this state of confusion he will in all probability votes
for the same party even though the issues of governance are different at all tiers of
government. So under simultaneous elections there are greater chances of one
party gaining maximum seat at all tiers of government. At one level this idea has an
advantage of greater coordination among all levels of government as at all the
levels there will be only one political party in power due to which there won’t be
any hurdles in the formulation and effective implementation of policies. It is not so
that this proposition only comes with benefits as under simultaneous elections the
present system of checks and balance will get hugely compromised. By giving
fixed tenures to state and central governments, one would have a situation where
the government has the power without accountability and the inability to seek
change if the government doesn’t perform as per expectation. 35 If there is only one
single party at all the levels of government and the people don’t even have the
chance of changing them before the completion of their defined term of five years
then there emerges greater chances of misuse of power. Under the present system
the voter through frequent elections places a check on the functioning of
government. Even if a clear mandate is give to one single party in national election
then also that party cannot misuse there authority because in case there is any
abuse of power by the ruling dispensation, then they have to face the electorate in
54 Triranjan Raj

Desirability and Feasibility of Holding Simultaneous Elections in India 55
different state and municipal elections. So under frequent elections there are very
less chances of power being misused as the ruling dispensation know that they are
supposed to face the electorate in different election and the people are going to vote
on the basis of the type of governance being provided by them. So frequent election
help in gauzing the current mood of the nation and though this ruling party in
power can also judge the mood of the nation on the policies and programs pursued
by them.
Simultaneous elections will also have a negative impact on the interaction
between the political parties and voters. It has been generally observed that it is
only during elections there is direct interaction between the political parties and
voters and it is only during elections public opinion counts. One’s the elections are
over and the mandate has been given to them to rule, the ruling political party cites
the clear mandate given to them by the people as a shield to take all decision even
though the decisions taken by them are not part of their manifesto. What powers
people have in a democratic system when the incumbent government gets
indulged in corrupt practices? In case both the elections to state and centre are held
simultaneously the ruling dispensation will get a free hand to carry on with
whatever they are doing. Every ruling party knows the art of managing elections.
All the political parties are aware of the fact that people memories are very short
and they tend to forget the corruption issues. So in such a situation the ruling
dispensation will use it to their advantage. If elections to state assemblies are held
at different stages then the ruling party at the centre cannot brush the corruption
issues under the carpet because these corruption issues will become election issues
in the states. So in such a scenario the ruling party is under enormous pressure to
ensure high standards in the government functioning as they very well know that
it will have an impact on the coming state elections. Just imagine a scenario where
both the elections are held simultaneously, now in this situation can you expect a
change in the stand of government policy under public pressure. The answer to this
is no as they know that the situation in centre and state cannot to altered at this
stage as there are no elections coming. So these issues will become real elections
issues only at the end of five year term not before that but with different state
election, round the corner the government will be made to function in responsive
way as these very issues can become elections issues in state assembly. So
democracy demands regular responsiveness and accountabilty of politicians
towards citizens.
On the issue whether it is desirable to have simultaneous elections or not one
can easily say with certainty that it is highly desirable to have simultaneous
elections as if is financially prudent, reduce expense, help the country get rid of
black money, reduce caste and communal overtones, improve governance, will
help strengthening the internal security of the country and will ensure full term so
that nation can progress in a stable environment. But on the issue whether it is

feasible or not there are certain apprehensions as there are lot of steps which the
ruling dispensation will have to take before accepting it in principle. Firstly in
order to have simultaneous elections the constitution needs to be amended as
under constitution the tenure of the Lok Sabha and State Legislative Assemblies
cannot be extended beyond five years. On this there are certain doubts whether
the constitution can be really be amended for this as one has to see this issue in the
background of Keshavanand Bharti judgment which says that constitution cannot
be amended if it tantamount to bring about a change in the basic structure of the
constitution. So legally speaking one has to check whether these amendments will
come under the ambit of basic structure of the constitution or not.
Secondly, consensus needs to be generated among different political parties
as the biggest loser in simultaneous elections will be the regional parties. Now if
simultaneous elections are accepted in principle then can regional parties even
hope and afford to compete with national parties. Thirdly, before accepting
simultaneous elections the ruling dispensation has to convince the regional
players that it will have no impact on the federal structure which is envisaged in
our constitution. In parliamentary system the government remains till the
pleasure of the people so under it the people have the right to bring down
government. With simultaneous elections the government required term of five
years can be ensured and through it the problem of instability can be tackled
effectively. But along with this one also need to ensure that the inbuilt system of
checks and balances along with the system of accountability is not compromised.
References
1. Singh, Bimal Prasad, “Electoral reforms in India: Issues and Challenges”, International
Journal of Humanities and Social Science Inventions, 2, 31st March 2013, 01-05.
2. Kondo, Norio, “Election Studies in India”, Discussion Paper No. 98, Institute of
Developing Economies, 02-06.
3. 79th Report of the Parliamentary Standing Committee on Personnel, Public Grievance,
Law and Justice, December 2015. http://164.100.47.5/newcommittee/reports/English
Committees/Committee%20on%20Personnel,%20PublicGrievances,%20Law%20and%
20Justice/79.pdf
4. Hindustan Times, “Simultaneous General and Assembly Elections is not a Workable
Idea”, New Delhi, 20th March, 2015. http://www.hindustantimes.com/comment/
simultaneous-general-and-assembly-elections-is-not-a-workable-idea/story-uSrMzAe
BV0y0VRhZFcFmoJ.html
5. Debroy, Bibek and Kishore Desai, Analysis of Simultaneous Elections : The “What”,
“Why” and “How”, A Discussion Paper, NITI Aayog. http://www.niti.gov.in/
writereaddata/files/document_publication/Note%20on%20Simultaneous%20Electio
ns.pdf
6. Ibid.
7. Ibid.
56 Triranjan Raj

Desirability and Feasibility of Holding Simultaneous Elections in India 57
8. Hindustan Times, “Simultaneous General and Assembly Elections is not a Workable
Idea”, Op. Cit.
9. Debroy, Bibek and Kishore Desai, Analysis of Simultaneous Elections : The “What”,
“Why” and “How”, A Discussion Paper, NITI Aayog. http://www.niti.gov.in/
writereaddata/files/document_publication/Note%20on%20Simultaneous%20Electio
ns.pdf
10. Ibid.
11. Chaturvedi, Priyanka, “Simultaneous Elections: Idea Good, but is it Practical?”, India
Matters, Observer Research Foundation, 08 August 2016. http://www.orfonline.org/
expert-speaks/simultaneous-elections-idea-good-but-is-it-practical/
12. Debroy, Bibek and Kishore Desai, Analysis of Simultaneous Elections : The “What”,
“Why” and “How”, A Discussion Paper, NITI Aayog. http://www.niti.gov.in/
writereaddata/files/document_publication/Note%20on%20Simultaneous%20Electio
ns.pdf
13. Ibid.
14. Ibid.
15. Ibid.
16. 79th Report of the Parliamentary Standing Committee on Personnel, Public Grievance,
Law and Justice, December 2015. http://164.100.47.5/newcommittee/reports/English
Committees/Committee%20on%20Personnel,%20PublicGrievances,%20Law%20and%
20Justice/79.pdf
17. Debroy, Bibek and Kishore Desai, Analysis of Simultaneous Elections : The “What”,
“Why” and “How”, A Discussion Paper, NITI Aayog. http://www.niti.gov.in/
writereaddata/files/document_publication/Note%20on%20Simultaneous%20Electio
ns.pdf
18. Singh,Bimal Prasad, “Electoral reforms in India : Issues and Challenges” , International
Journal of Humanities and Social Science Inventions, 2, 31st March 2013, 01-05.
19. Ibid.
20. PRS Legislative Research, Standing Committee Report Summary, Feasibility of holding
Simultaneous Elections to Lok Sabha and State Legislative Assemblies, Institute for
Policy Research Studies, 4 January , 2016. http://www.prsindia.org/administrator/
uploads/general/1451885664_SCR%20Summary-%20feasibility%20of%20holding%20
simultaneous%20central%20and%20state%20elections.pdf
21. Ibid.
22. Ibid.
23. Ibid.
24. Ibid.
25. Ibid.
26. Ibid.
27. The Hindu, “The Case Against Simultaneous Polls”, The Hindu, September 27, 2016.
http://www.thehindu.com/opinion/lead/The-case-against-simultaneous-polls /artic
le15000825.ece

28. Ibid.
29. Ibid.
30. S. Saraswathi, “Simultaneous Elections : Remedy Worse Than Disease”, 14 July, 2015.
http://www.infa.in/index.php?potion=com_content&itemid=40
31. Ibid.
32. 79th Report of the Parliamentary Standing Committee on Personnel, Public Grievance,
Law and Justice, December 2015, Op. Cit.
33. S. Saraswathi, “Simultaneous Elections : Remedy Worse Than Disease”, Op. Cit.
34. Chaturvedi, Priyanka, “Simultaneous Elections : Idea Good, but is it Practical?”, India
Matters, Observer Research Foundation, Op. Cit.
35. Ibid. ê
58 Triranjan Raj
Article Received on July 16, 2017; Accepted on September 08, 2017

6
Social Area Analysis and Case Studyof Virugambakkam Ward in Chennai
District, Tamil Nadu (Using StatisticalTechniques)
Dayalan, N.*
The social area analysis is the most essential part of the urban development. The importantreason behind that I choose this topic is because Virugambakkam ward is the most developed wardin a short time of period the reason behinds the area is located in the center part of (parrys) wherethe whole sale market is located. Now it is found in Koyambedu Market from 1996. From 2002 the bus terminus which is located in Parry’s has been changed to Koyambedu (CMBT). For these tworeasons, the people are coming here for their employment and for business development. TheVirugampakkam ward at Chennai lies between 13"04' N latitude, and longitude 80"18' east. Thestudy area has a stretch of seacoast at about 12 kms along the Bay of Bengal. The climaticcondition is experience hot climate which could be classified as tropical maritime monsoon type.The Database has been collected from the primary and secondary data base. The methodology isstatistical methods find out relationship between social economic, family and ethnic status in thestudy area. This social area analysis is given a good decision about the people and development ofstudy area.
[Keywords : Social, Family, Virugambakkam, Ethnic, SPSS, Labour, Urban]
1. Introduction
The social area analysis is a part of urban geography, the study of urban area
such as people’s living standards, Ethnic background and Lifestyle. Although too
CONTEMPORARY SOCIAL SCIENCES, Vol. 26, No. 3 (July-September), 2017
* Guest Lecturer, Department of Geography, Periyar E. V. R College (Autonomous), Triuchirappalli -620023, Tamil Nadu (India) E-mail: <[email protected]>

simplistic to be fully satisfactory, these classical models of city structure receive
some confirmation from arrangement with in urban areas of income levels,
population, age structure, ethnicity, housing stock characteristics, and the like.
These indicate recurring patterns of the cities of developed countries (Husian. M).
The potential of social area analysis the identification and description of areas according to their social characteristics for planning and policy related research.The development of social area analysis is briefly described, from its roots inpre-war urban sociology into its modern form as a research method based onmultivariate statistical techniques, notably principal components analysis andcluster analysis. A number of applications of this method in mainly Britishplanning experience are then described, and the main strengths and weaknesses ofsocial area analysis are considered in terms of the problems of interpreting theresults, its accessibility for potential users and the utility of the method for typicalplanning research problems. (T. S. Brindley and J. W. Raine, 1970)
Analysis of a city defines to social areas and urban areas which contain people of similar living standards, ethnic background, and life-style. Three constructshave been used to differentiate urban areas. First is social rank. The second factor isurbanization, which weakens the importance of the family unit as it increases. Thethird is segregation which sees a redistribution of population as it proceeds. Thesevariables are then combined to form categories for residential areas, such as lowsocial rank, high urbanization, and high segregation (E. Shevky and W. Bell, 1955).
We will make use of three factors for the study of social differentiation andsocial stratification within social areas using 1960 census tracts as the source ofdata. These three factors are social rank, urbanization, and segregation. When wespeak of social area, we are referring to those census tracts which are significantlysimilar in their social structure. They may not give concrete entities as to whatsocial trends may develop, or that are developing, but they will provide areasonable measurement whereby a better understanding of the social conditionsof a city can be obtained. If the social area analysis approach can give the sociologist a deeper insight into the social structure and/or conditions of the city, it isjustifiable, No, it will not give all the answers; however, neither will any otherapproach give complete answers and some may even give less than the social areaanalysis approach. The more refined the delineation of social areas the moreeffectively they can be used as a basis for comparative studies, either of areaswithin a particular city or between different cities. There is no reason why atypology so based could not be utilized with specific changes in the measureableindexes--for the study of cities with the city as the unit of analysis, for the study ofregions, or even for the study of countries. (Don L. Byler, 1969)
2. Group-based Social Status Segregate
The more complex cities are economically and socially, it appears, thestronger is the tendency for city residents to segregate themselves into groups-based on socio-economic status, social family status and socio-ethnic status.
60 Dayalan, N.

Social Area Analysis and Case Study of Virugambakkam Ward in Chennai District 61
In a large metropolitan region with its more diversified population, thisterritorial behavior may be a defense against the unknown or the unwanted. Intraditional societies, these groups are the families, and tribes. In modern societiespeople cluster according to income or occupation and language or race.
Many of these grouping are fostered by size and the value of the availablehousing, land developers, especially in cities, produce homes of similar quality inspecific areas of course, as time elapses, there is a change in the condition andquality of that housing and new gropes may replace old groups. In any case,neighbor hoods of similar social characteristics evolve.
3. Study Area
Chennai is the capital of Tamilnadu. The Virugampakkam ward at Chennailies between 13"04' N latitude, and longitude 80"18' east. The study area has astretch of seacoast at about 12 kms along the Bay of Bengal. The Coovum runsthrough the heart of the city and enters into sea. The climatic condition isexperience hot climate which could be classified as tropical maritime monsoontype. As the study area is in the tropic, the temperature is naturally high but it iscounter-balanced to a considerable extent due to the proximity of sea. Monsoonperiod is between June and December and February. The study area is getting themaximum rainfall during the month of November being the North East Monsoonperiod. The total population is 72144 persons male is 36618 and female is 35526percent in the study area. This ward located Chennai Mofussil Bus Terminus(CMBT), it is providing outstation transport services. It is second biggest busterminus in Asia. The Koyembedu area hup of the vegetable and fruits market inthe Chennai city and Chennai Metro Rail Limited head office located in the studyarea. This area was developed in past 15 years. Before 15 year it is agricultural landwhere paddy is cultivated.
Fig.-1
4. Method and Materials
4.1 Data Base and Methodology
Database has been collected from the primary and secondary data base. ThePrimary data is collected from 100 samples by stratified sampling technique in

questionnaires method. The Secondary data is collected from maps in censusdepartment, Chennai-90 and Chennai corporation Zonal office in Chennai-29. Themethodology is statistical methods using the SPSS software find out the simplepercentage, correlation and simple factor analysis.
4.2 Aim and Objective
The aim of the present study is “Social Area Analysis case study ofVirugambakkam ward in Chennai (using statistical techniques)”. The majorobjective is a find out the socio-economic, socio-family and socio-ethnic status inVirugambakkam ward at Chennai.
5. Results and Discussion
5.1 Socio-economic Status
The social status of an individual or a family is determined by income,education, occupation, home value or type, though it may be measured differentlyin different cultures. The high income, a college education, a professional ormanagerial position, and high home value constitute high status. There are manylevels of status and people tend to filter out into neighborhood where most of theheads of households are of similar rank. In most cities, people of similar socialstatus are grouped in sectors whose points are in the innermost urban residentialareas.
Table-1 : Sex of the Respondent
Sex Male Female
Responses (Percentage) 61% 39%
In the above Table shows that sex of the responses about 61% of therespondents are belong to male group whereas the remaining 39% of therespondents are female.
Table-2 : Age Group
Age Group < 30 30-40 40-50 50-60 > 60
Responses (Percentage) 23% 24% 27% 24% 2%
From the above table it show that the age between 40-50 is 27 percent asresponses, whereas the age between 30-40 and 50-60 age group 24 percentresponses
Table-3 : Educational Qualification
Educationalqualification
Illiteracy Primary Level
SecondaryLevel
HigherSecondary
UnderGraduate
PostGraduate
Responses(Percentage)
3 19 21 21 16 20
62 Dayalan, N.

Social Area Analysis and Case Study of Virugambakkam Ward in Chennai District 63
From the above table it shows the number of literates in a study area. The 21
percentage of people were qualified in the Higher secondary and secondary level.
According to the post graduate people living in this area are 20 percentage and 19
percentage of people has primary level education. Remaining, 3 percentages of
people are illiterate in this study area.
Table-4 : Number of Rooms in Each house
Number ofrooms
1 2 3 4 5 6 7 >8
Responses(Percentage)
2 13 12 22 9 31 7 4
This table shows the number of room in a house and it is converted into a
percentage as per study. In a house 6 room are there, hence the percent is 31 percent as people responded. In a house 4 rooms are there, hence the percent is 22 percent
responses. In a house 2 rooms were there the percent is 13 percentage responses, in
a houses 3 rooms were there, the percent is 12 percentage , in a house 5 rooms were
there 9 percent, the percent is 7 percent in a house, 8 room were there, hence the
percent of is 4 percent. In a house, a single rooms 2 percentage of responded
Table-5 : House Occupied Area
Area square feet
< 600 700 800 900 1000 1200 >1500
ResponsesSampling inPercentage
11 2 23 3 31 28 2
This table shows that area square feet of the house in percentage as people.
The 1000 sq. feet of houses 31 percent, 1200 sq. feet of houses 28 percentages, 800 sq.
feet of houses 23 percentages, 600 sq. feet of houses 3 percentages and 700 and 1500
sq. feet is 2 percentages.
Table-6 : House Wall Type
Wall type Mud Birds Cement
Responses Samplingin Percentage
1 10 89
In the above table it shows the percentage wall type of house in percentages.
The cement houses are 89 percentages, the bird’s houses 10 percentages and the
mud houses 1 percentage in the study area.
Table-7 : House Roof Type
Roof type Hatched Tail Terrors Multi storage
Responses (Percentage) 10 0 10 80

From the above the table it shows the percentage of roof type of houses. The
multistoried type building is 80 percent, the hatched and terrors type of houses is
10 percentage of study area.
Table-8 : House Floor Type
Floor type Mud Cement Tail Marble
Responses (Percentage) 10 45 7 38
In the above table it shows the percentage floor type in houses. The Cement
type is 45 percentages, Marble floor type is 38 percentages, mud is 10 percentages
and 7 percentages is tails floor in the study area.
Table-9 : Types of Houses
Types Owner ship Rent Lessee
Responses (Percentage) 72 25 3
In the above table it shows the percentage of types of houses. The ownership
houses is 72 percentages and the rent houses is 25 percentages and the lease type of
houses is 3 percentages in the study area.
Table-10 : House Rent
House Rent Own House <1000 2000-3000 3000- 4000 >4000
Responses(Percentage)
75 0 12 3 10
From the above tables it shows the rent of house in percentages is own houses
is 75 percentages, 2000 to 3000 is 12 percentages, the house rent between above
4000 is 10 percentages, the house rent between 3000 to 4000 is 3 percentages in the
study area.
Table-11 : Water Facility
Water facility Inside Outside
Responses (Percentage) 80 20
The above data gives the information about the water facilities available in
the study area. The water facility inside the house is 80 percentages and the facilityoutside the houses is 20 percentages.
Table 12 : Facilities
Facility Electricity Refrigerator Television Twowheelers
Fourwheelers
Responses(Percentage)
Available 100 56 98 87 41
Un-available
0 44 2 13 59
64 Dayalan, N.

Social Area Analysis and Case Study of Virugambakkam Ward in Chennai District 65
It the above table it percentage of facility available in the study area. The
electricity facility is 100 percentages houses available; the refrigerator facility is 27
percentages houses available, 73 percentage houses not available. The television
facility 98 percent houses in available 2% of houses not available, two wheelers 87
percentages houses available, the four wheelers 41 percentage people is available
in the study area.
Table-13 : Male labour force structure
Type of labour force tn
em
nre
vo
G
eta
virP
ru
ob
aL
d
na l
ani
gra
Ml
acin
hce
T
la
noiss
efor
Pl
acin
hcet
dn
a
seci
vres s
ela
Sn
oita
ercer
dn
a
tro
psn
arT
Responses(Percentage)
23 4 34 2 23 10 4
From the above table it shows the male labour forces percentages in the study
area. This area is 34 percentage of people labours, Government and Technical
Professional Workers is 23 percentage, 10 percentages is Sales Services and
Recreation Workers, 4 percentages is Private and Transport Workers, 2
percentages is Marginal and Technical Workers in the study area.
Table-14 : Female labour force structure
labour force efiw
esu
oH
tn
em
nre
vo
G
eta
virP
lair
eg
an
aM
laci
nhc
et d
na
lacir
elC
d
na tr
ops
nar
Tr
otaci
nu
mm
oc
dn
a sel
aS
dn
a seci
vres
noit
aerc
er
ne
mstfar
Cr
eht
o d
na
seiti
vitca
Responses(Percentage)
50 1 2 40 7 0 0 0
This table shows the female labour forces and it is converted into a percentage
as per study. The 50 percentages of female house wife, managerial and technical
forces 40 percentages responses, clerical and technical force 7 percentages , private
workers in 2 percentages, 1 percentages in government workers in the responses.
Table-15 : Monthly Income
Income level <6000 6000-12000 12000-18000 >24000
Responses (Percentage) 4 25 20 51
From the above table it shows the monthly income percentage in the study
area. The monthly income above 24000 is 51 percentages, 6000-12000 in 25
percentages, 12000 to 18000 in 20 percentages, below 6000 in 4 percentages of
responses in the study area.

5.2 Socio-family Status
Family status indicators include population age variables, house ownership
and age characteristics, family size and marital status and other life cycle. Theseexhibit a concentric zonal or ring pattern with older, smaller renter households
located near the city center and owner occupied newer larger family households
near the outer fringe.
Table-16 : Place of Birth
Birth place Chennai Outer Chennai
Responses (Percentage) 55% 45%
In the above table it percentage of birth place in Chennai 55 percentage and
other than Chennai 45 percentage in the study area.
Table-17 : Marital Status of the Respondent
Married status Single Married Dives
Responses (Percentage) 3 97 0
From the above table it shows the married people in this study area are 97
percentage and unmarried people are 3 percentages in the study area.
Table-18 : Age of Male at Married
Male Married Age <18 18-25 25-35 >35-
Responses (Percentage) 0% 23% 73% 4%
From the above table, it shows that married age of male were 25 to 35 age is 73
percentages, the married age between 18 to 25 is 23 percentages. The married age of
male above 35 is only 4 percentages in the study area.
Table-19 : Age of Female at Married
Female married age <20 20-25 25-35 >35-
Responses (Percentage) 32% 54% 14% 0%
From the above table it shows the married age of the female in the study area.
The female marriage 20-25 is 54 percentage, below 20 age female is 32 percentages,
married age between 25 to 35 is 14 percentages in the study area.
Table-20 : Household Size
House hold size Single Grouped
Responses (Percentage) 63 27
In the above table it shows the percentage families which are single are 63
percentage and the joint families are 27 percentages in the study area..
66 Dayalan, N.

Social Area Analysis and Case Study of Virugambakkam Ward in Chennai District 67
5.3 Socio-ethnic Status
For some groups, ethnicity is a more important determinant of residential
location than is social or family status. Areas of homogenous ethnic identificationappear in the social geography of cities as separate clusters of nuclei, reminiscent of
the multi-nuclei concept of urban structure. For some ethnic groups, cultural
segregation is both sought and rigorously defended even in the face of pressures
for neighborhood change exerted by potential competitors for housing space.
Certain ethnic or racial groups, however including blacks, have had segregation in
nuclear communities forced on them.
Table-21 : Ethnic Status
Language Tamil Telugu Malayalam
Responses (Percentage) 83 15 2
From the table shows the language of the people spoken in study area. 83
percentages of people speak Tamil, 15 percent of people speak Telugu and
Malayalam speaks in 2 percentages in the study area.
Table-22 : Religion
Religion Hindu Muslim Christen
Responses (Percentage) 83 1 16
From the table shows the religion of people in the study area. The Hindu
religion is 83 percentages, Christian religion 16 percentages and Muslim religion is
1 percentages in the study area.
Table-23 : Community
Community Scheduledcaste
MostBackward
Class
Back wardClass
Others
Responses (Percentage) 17 34 48 1
In the table shows the community of the people in the study area. The
backward class people 48 percentages, most backward class people 34 percentages, scheduled caste is 17 percentages, others caste is 1 percentage in the study area.
Table-24 : Caste
Caste Responses(Percentage)
Caste Responses(Percentage)
Chettiyar 3 Nadar 2
Christian adi dravidar 4 Naidu 1
Christian mudaliyar 4 Navither 4

Christian navither 2 Nayakar 20
Christian nayakar 4 Pillai 3
Davar 4 Vaishnavas 6
Idayar 3 Vaniyar 2
Malayalis 1 Yadavas 8
Mudaliyar 19 Nadar 2
Muslim labia 1
From the table it shows the caste of people in percentage in the study area.
The Nayakar caste is 20 percentages, the people of caste Mudaliyar 19 percentages,
Yadavas is 8 percentages, Vaishnavas is 6 percentage in the study area. The
Christian Adi- Dravidar, Christian mudaliyar, Davar and Navither caste people
living the 4 percentages. The chatiyar, Christian navither, nadir, vaniyar, caste
people is 2 percentage, the Malayalam, muslim labia, naidu caste people 1
percentage in the study area.
Table-25 : Distance from Central Business District
Distance 7km 9km 10km 12km
Responses (Percentage) 7 32 26 40
From the table show the percentage of distance from the people house to
central business district following kilometers in the study area. The people house
in 9 km distances 32 percentages, 10 km. is 26 percentages, 13km. is 21 percentages,
7 km. is 7 percentages in the study area.
Table-26 : Distance from the Other Places
Distance Responses (Percentage)
Workplace
Edu.Centre
Healthcenters
Market Bus stand Out of cityRailway Station
< 0.5 28 0 2 56 54 0
1 10 16 4 23 25 0
2 6 19 19 17 14 0
3 10 35 69 4 4 0
4 12 20 5 0 0 0
> 5 34 10 1 0 0 100
The shows the table distance from the other place in the study area. Distance
from the 0.5 kilometer house to working places 28 percentage people, 34
68 Dayalan, N.

Social Area Analysis and Case Study of Virugambakkam Ward in Chennai District 69
percentages people working place distance in above 5 kilometer, 4 kilometer
working in 12 percentages of people. The distance from home to education center 3
kilometer distance is 35 percentages, 20 percent in 4 kilometer in the study area.
The health centers 3 kilometer distance from the 69 percentage people. The market
located on the 0.5 kilometer distance in 56 percentages of people house. The bus
stand 54 percentage people located on the 0.5 kilometer. The railway station
located on above 4 kilometer, 100 percentage in the study area.
5.4 Analysis based on Statistical Techniques
Table-27 : Descriptive Statistics for Social Status of the Population
Social Status of the Population Mean Std. Deviation Analysis N
No. of Rooms, 4.6400 1.7438 100
Area 967.0000 210.8449 100
Wall Type 2.7800 .6754 100
Roof Type 3.6000 .9211 100
Floor Type 2.7300 1.0811 100
Type of House 1.3100 .5260 100
House Rent .6300 1.1251 100
Bahroom 1.0000 .0000 100
Toilet 1.0000 .0000 100
Water 1.2000 .4020 100
With Electricity 1.0000 .0000 100
With Refrigerator .7500 .4794 100
With Television 1.0000 .2010 100
With Two Wheeler .8700 .3380 100
With Four Wheeler .4100 .4943 100
Male labour force Structure 3.4400 1.8109 100
Female labour force structure 2.0900 2.1886 100
Monthly Income 3.1800 .9469 100
Distance to CSB 10.5100 2.0913 100
Working place distance 4.1200 3.5019 100
Religion 1.3300 .7393 100
Community 2.3300 .7661 100
Distance from the work place 3.7000 2.1010 100

Distance from the Educationalcentre
3.8900 1.1968 100
Distance from the health centre 3.7400 .7470 100
Distance from the market 1.6900 .8955 100
Distance from the bus stand 1.7100 .8910 100
Distance from the railway station 6.0000 .0000 100
The descriptive statistical analysis states that virugambakkam ward havefully electrified. All the houses have electricity, television, bathroom and toilet
facility, floor type, wall type, roof type and rental value of the houses are different
in nature. It shows from the standard Deviation value that study area work force
also not balanced male and female discrimination also found more. Numbers of
males are bread winner. Distances from the school, working places also vary from
the person to person.
Table-28 : Factor Analysis
xe
S
pu
orG
eg
A
ecal
P htri
B
sut
atS l
atira
M
eg
airra
M fo
eg
A
eg
A d
eirra
Mefi
W/d
na
bsu
H
noi
gile
R
ytin
um
mo
C
la
noit
acu
dE
noit
acifila
uQ
ezis
dlo
h es
uo
H
Correlator Sex 1.000 –.101 .142 .141 .063 .145 .031 .057 –.060 .086
Age Group –.101 1.000 –.407 .243 .167 .163 .165 .217 .332 .084
Birth Place .142 –.407 1.000 –.194 –.335 –.227 –.242 –.102 –.334 –.060
Martial Status .141 .243 –.194 1.000 .131 .173 .079 .153 .065 .106
Age of Marriage .063 .167 –.335 .131 1.000 .461 –.272 .119 .609 .368
Married AgeHusband/Wife
.145 .163 –.227 .173 .461 1.000 –.049 .062 .542 .037
Religion .031 .165 –.242 .079 –.272 00.49 1.000 .109 –.203 –.172
Community .057 .217 –.102 .153 .119 .062 .109 1.000 .195 –.039
EducationalQualification
–.060 .332 –.34 .065 .609 .542 –203 .195 1.000 .212
House hold size .086 .084 –.060 .106 .368 .037 –.172 –.039 .212 1.000
Sig. (1-tale sex .159 .079 0.81 .266 .076 .378 .286 .277 .196
Age Group .159 .000 .007 .049 .052 .050 .015 .000 .202
Birth Place 0.79 .000 .026 .000 .012 .008 .157 .000 .275
70 Dayalan, N.

Social Area Analysis and Case Study of Virugambakkam Ward in Chennai District 71
Martial Status .081 .007 .026 .097 .042 .218 .064 .260 .147
Age of Marriage .266 .049 .000 .097 .000 .003 .119 .000 .000
Married AgeHusband/Wife
0.76 .052 .012 .042 .000 .315 .271 .000 .356
Religion .378 .050 .008 .218 .003 .315 .140 .022 .044
Community .286 .015 .157 .064 .119 .271 .140 .026 .348
EducationalQualification
.277 .000 .000 .260 .000 .000 .022 .026 .017
House hold size .196 .202 .275 .147 .000 .356 .044 .348 .017
From the factor analysis, education qualification and age of marriage are
highly related.
Table-29 : Communities
Initial Extraction
Sex 1.000 .791
Age Group 1.000 .608
Birth Place 1.000 .705
Marital Status 1.000 .571
Age of Marriage 1.000 .743
Married Age Husband/Wife 1.000 .800
Religion 1.000 .694
Community 1.000 .926
Education Qualification 1.000 .789
House and size 1.000 .804
Table-30 : Total Variance Explained
tn
en
op
mo
C
Initial Eigenvalues Extraction Sums ofSquared Lodings
Rotation sums ofSquared Loadings
lat
oT
ecn
aira
V fo
%
% e
vital
um
uC
lat
oT
ecn
aira
V fo
%
% e
vital
um
uC
lat
oT
ecn
aira
V fo
%
% e
vital
um
uC
1. 2.697 26.974 26.974 2.697 26.974 26.974 2.201 22.015 22.015
2. 1.597 15.975 42.949 1.597 15.975 42.949 1.697 16.973 38.988

3. 1.210 12.100 55.049 1.210 12.100 55.049 1.263 12.633 51.621
4. 1.002 10.019 65.068 1.002 10.019 65.068 1.199 11.995 63.616
5. .923 9.232 74.300 .923 9.232 74.300 1.068 10.685 74.300
6. .779 7.787 82.087
7. .617 6.166 88.253
8. .535 5.345 93.599
9. .329 3.291 96.890
10. .311 3.110 100.00
Note : Compounds Came 1.sex, 2. sex, 3. age group, 4. Married status 5.
birth place, 6. Age of married, 7. married age, 8. Religion, 9. Community, 10.
Education qualification
Fig. 2
From the scree plot figure y axis components (eigenvalue) above 1.0 is
significant factors (sex, age group, Married status and birth place). The below 0.999
values is insignificant. (Age of married, married age, Religion, Community,
Education qualification)
Table-31 : Factor Analysis
Correlation Matrix
dlo
h es
uo
He
zis
aer
A
fo
ep
yT
esu
oH
tn
eR
esu
oH
htiW
rot
are
girfe
R
ow
T hti
Wr
ele
eh
W
ru
oF
htiW
rel
ee
hW
ylht
no
Me
moc
nI
House hold size 1.000 .146 –.265 –.274 .265 .233 .257 .243
Area .146 1.000 –.016 –.073 –.142 .024 .034 .065
72 Dayalan, N.

Social Area Analysis and Case Study of Virugambakkam Ward in Chennai District 73
Type of House –265 –.016 1.000 .742 –.130 –.169 –.261 –.357
House Rent –.274 –.073 .742 1.000 –.173 –.234 –.360 –.373
With Refrigerator .265 –.142 –.130 –.173 1.000 .483 .437 .634
With two Wheeler .233 .024 –.169 –.234 .483 1.000 .322 .516
With Four Wheeler .257 0.034 –.261 –.360 .437 .322 1.000 .682
Monthly Income .243 .065 –.357 –.373 .634 .516 .682 1.000
Table-32 : Communalities
Initial Extraction
House hold size 1.000 .402
Area 1.000 .876
Type of House 1.000 .867
House Rent 1.000 .849
With Refrigerator 1.000 .738
With Two Wheeler 1.000 .528
With Four Wheeler 1.000 .571
Monthly Income 1.000 .782
Table 33 : Total Variance Explained
Component Initial Eigenvalues Extraction Sums of SquaredLodings
Total % ofVariance
Cumulative %
Total % ofVariance
Cumulative %
1. 3.175 39.690 39.690 3.175 39.690 39.690
2. 1.383 17.293 56.983 1.383 17.293 56.983
3. 1.055 13.189 70.172 1.055 13.189 70.172
4. .797 9.959 80.131
5. .675 8.438 88.569
6. .440 5.501 94.070
7. .280 3.496 97.567
8. .195 2.433 100.000

Fig. 3
From the scree plot figure y axis components (eigenvalue) above 1.0 is
significant factors (house hold size, house occupied area, type of house). The below
0.999 values is insignificant. ( refrigerator, two wheeler, four wheeler and Monthly
income).
Table-34 : Component Matrixa
Component
1 2 3
House hold size .493 –.175 .358
Area .949 –.325 .876
Type of House –.603 .643 .299
House Rent –.660 .604 .220
With Refrigerator .681 .519 –.680
With Two Wheeler .633 .338 .116
With Four Wheeler .738 .159 .439
Monthly Income .849 .244 .437
Component Name : 1. House hold size, 2. Area, 3 Type of house
The subtraction value (below 0) components is insignificant matrix, the
addition value (above 0) components significant matrix. The house hold size and
type of house, house occupied Area and house hold size, house size and type ofhouse, type of house and house area, house rent and size of area, house rent and
74 Dayalan, N.

Social Area Analysis and Case Study of Virugambakkam Ward in Chennai District 75
type of house, the refrigerator and house hold size, two wheeler and house hold
size, four wheeler and house hold size, monthly income and house hold size, the
refrigerator and house area, two wheeler and house area, four wheeler and house
area, monthly income and house area, the refrigerator and type of house, two
wheeler and type of house, four wheeler and type of house, monthly income and
type of house these all the significant component matrix in the responses from
study area. Other component matrix is in significant matrix component analysis.
6. Conclusion
The social area analysis is important tools for city planners to understand a
city’s socio-spatial attributes. This present study deals with factors such as socio
economic status, socio-family status and socio ethnic status which are
interdependent on each other. This study uses the statistical technique tool to
prove the variable relationship. The above said factors proves that educational
qualification and age of marriage are highly related to each other. When the house
hold size and house occupied area increases, the two wheelers, four wheelers,
refrigerator i.e., house hold items also increases. So this study concludes that socio
economic status is directly proportional to socio-family status and socio ethnic
status which gives a very good combination in social area analysis variable
relationship. According to this study, when compared to other areas, the land
values will be very high in future in this study area. Now, this area is found as a
residential site, this change to a commercial site in future. This area may become
highly developed area in future.
References
1. Amos H. Hawley and Otis Dudley Duncan, “Social Area Analysis : A Critical
Appraisal”, Land Economics, S3, 1957, 3S7-344.
2. Carl-Gunnar Janson, “Factorial social ecology: an attempt at summary and evaluation”,
Annual Review of Sociology, 6, 1980, 433-456.
3. Corinna Heye and Heiri Leuthold, “Theory-based Social Area Analysis : An Approach
considering the Conditions of a Post-Industrial Society”, 14th European Colloquium on
Theoretical and Quantitative Geography, September 9-13, 2005.
4. Don L. Byler, B, A, Social Area Analysis And Transportation Patterns : Dallas, Texas, A
Thesis Submitted To North Texas State University, May 1960.
5. John Baldwin, Social Area Analysis And Studies of Delinquency, New York : John Wiley.
1974.
6. Seth E. Spielman, Jean-Claude, “Social Area Analysis, Data Mining and GIS”,
Computers, Environment and Urban Systems, 32, 2008, 110-122
7. Shevky, Eshref and Wendell Bell, Social Area Analysis : Theory, Illustrative
Application, and Computational Procedures, Stanford, California : Stanford University
Press, 1955.

8. T. S. Brindley and J. W. Raine, “Social Area Analysis and Planning Research”, Urban
Studies, 16(3), October 1, 1979, 273-289.
9. Majid Husian, Human Geography, Jaipur : Rawat Publication, Third Edition- 2002.
10. Mandal R. B., Urban Geography : : A Text Book, New Delhi : Concept Publishing
Company, 1999.
11. Northam. M. Ray, Urban Geography, New York and Canada : John Wiley & Sons, Inc.,
1975.
12. WWW.Wikipedia.com
13. WWW.Answer.com
14. WWW.tn.gov.com ê
76 Dayalan, N.
Article Received on July 26, 2017; Accepted on September 01, 2017

7
Right to Education Act : A Catalyst
to Development
Soumen Saha* and R. P. Juyal**
The right to education has been recognized as a human right in a number of internationalconventions, including the International Covenant on Economic, Social and Cultural Rightswhich recognizes a right to free, compulsory primary education for all. With this perspective thepaper investigates catalyst power of education as human rights in the development of individual,social, country and the world as a whole. The paper analyzes the commitment of world community to ensure education to each and every child of 6-14 years and reviews the complexity in theprocess. The paper also discusses the RTE Act and its implications - challenges and concern. Inconclusion the paper suggests the immediate task before the policy planner is to endeavour toimprove quality and reduce persisting inequalities in the elementary education system.
[Keywords : Right to education, Universalization of education, Elementary
education]
1. Introduction
The development of any economy is not only the figures of gross nationalproduct or per capita income but also is a process of broadening the sphere ofhuman choices and entailments. It will create the system to ensure delivery of basicentailments. Thus development is not only the material abundance alone butessentially a process of creating capabilities in the people of the country to
CONTEMPORARY SOCIAL SCIENCES, Vol. 26, No. 3 (July-September), 2017
* Research Scholar, Department of Economics, Mewar University, Chittorgarh, Rajasthan (India)E-mail: <[email protected]>
** Research Supervisor & Associate Professor, Department of Economics, N. A. S. Post-graduateCollege, C. C. S. University, Meerut, Uttar Pradesh (India) E-mail: <[email protected]>

participate in the growth process.1 The history of economic growth realizes the fact that the benefits of growth, if left to it, trickle down very slowly. Therefore to makegrowth process inclusive and participatory, sustained efforts are needed to createsystems to ensure various entitlements to large number of people, whom, themarket bypasses.2
2. Education : A Catalyst to Human Rights and Development
The average GDP growth rate of world economy between in the golden age of
capitalism (1951 to 1973) has been around 4.8 percent. During this period the
OECD countries registered high growth rates, which later slowed down. However,
in the later period, from late seventies till the recession of 2008-10, referred a
Washington Consensus era, the world economy grew at an annual rate of 3.2
percent,3
GDP growth of World Economy (annual %)
Source : World Bank national accounts data, and OECD National Accounts data files.
Despite these significant growth rates, certain indicators reflecting the
condition of world children and the persisting regional disparities between and
within nation do not augur well.
Globally, more than 796 million people in the world cannot read and write.4
About 67 million children do not have access to primary school education and
another 72 million miss out on secondary school education.5 The cost of illiteracy to
the global economy is estimated at USD $1.2 trillion.6
In total, 121 million children and adolescents are currently out of primary and
lower secondary school worldwide - a number that has remained essentiallyconstant since 2007. 78 million of these children live in GPE countries.
A disproportionate number of out-of-school children live in countries that are
characterized by instability and conflict and/or extreme poverty. Conflict-affected
countries have only 20% of the world’s primary-school-age children but 50% of the
world’s out-of-school children, and 55 million out-of-school children live in
78 Soumen Saha and R. P. Juyal

Right to Education Act : A Catalyst to Development 79
sub-Saharan Africa. Many of the countries with the highest numbers of
out-of-school children still do not receive adequate external financing to meet their
needs.
About 263 million children and youth are out of school, according to new data from the UNESCO Institute for Statistics (UIS).7 This is equivalent to a quarter ofthe population of Europe. The total includes 61 million children of primary schoolage, 60 million of lower secondary school age, and includes the first ever estimateof those of upper secondary school age at 142 million.8
Within and across countries, what progress has been achieved has not beenequitable : the children who face the most severe barriers to education, such asthose associated with gender, poverty, displacement, nomadism, disability, and/or ethnicity, are still left behind. Many of these children do not get a chance to go toschool because their families rely on them for labour, for example, or because thewalk to school is too long and/or too dangerous.
The world average of infant mortality (between 2005 to 2010) was as high as49 per thousand live birth, with wide ranging regional disparities. For instance infant mortality rate is almost ten time higher (about 95) in Sub-Saharan Africacompared to that of North America and Western Europe (5) and in South Asia it isfive time more (about 53 per thousand live birth) compared to western Europe andAmerica.9 There are plethora of evidences that conclusively establish thateducation, specially elementary education, is crucial in the process of capability creation, developing responsive citizenry and fostering growth. Therefore,elementary education, in contemporary discourses, is viewed as important and unique human right, for its intrinsic value and its qualities to develop reinforcing relationship between various human rights and enabling people to raise voice to resists all forms of exploitation .
3. International Commitments to Universalization of Elementary
Education
Education is globally recognized as a fundamental human right. Educatedpeople can develop the skills, capacity and confidence to secure other rights as ahuman being. Thus the right to education is essential through which other rightscan be claimed and protected. It is therefore considered as the bed-rock of allsocio-economic development of the nation. Education has been recognized as basic human right since the adaptation of the Universal Declaration of Human Rights in1948 by UNO. The Article 26 of the UDHR states that “everyone has the right toeducation.” With this commitment several countries have reaffirmed this right and have supported entitlement to free, compulsory and universal elementaryeducation for all children, irrespective of caste, creed, colour, gender, religion andall other social stratifications across the globe.
Till the industrial revolution, education was privilege of elites. Withindustrial revolution, the growing demand of workforce became catalyst of
“expansion of basic (elementary) education in industrialized countries in the latter half of the ninetieth century. Public funding of education came with theexpectation of economic growth and economic return at the national level,”10 Indeveloping nations, no such economic transformation was in vogue. In thesecountries educational development became a serious public policy concern onlyafter liquidation of colonialism in the second half of twentieth century.Chronologically, back in 1833, Factory Act of United Kingdom (UK), made itmandatory to the factory owners that child worker get regular education either inthe school of the factory or elsewhere and by 1880 UK made general educationcompulsory. However, Prussia (part of present Germany) is the pioneer to launchprogramme for Universalization of Elementary Education and by 1871 it madeelementary education free and compulsory. In the western hemisphere, in USA theState of Massachusetts long back in 1852 made elementary education compulsoryand till 1918 every state of USA had provision of compulsory and free education,11
In Japan the period of Meiji Restoration (1868 to 1912), great social, political andeconomic changes took place and in this process elementary education was alsomade compulsory. Gradually many more countries joined this club of nations. And before the end of 19th century Canada, Australia, Italy, New Zealand , France , and Japan made elementary education compulsory.12 The movement for compulsoryand free elementary education further got momentum and internationalreorganization in 1920, when International Labour Organization rallied behind thedemand. Eventually the right to education was recognized as human right in theUniversal Declaration of Human Rights in 1948 by United Nations Organization(UNO). The Article 26 of the United Nation (UNO) declaration of Human Rights(1948) states that ‘elementary’ education shall be free and compulsory, and that thehigher levels will be equally available to all on the basis of merit. Theses concernfor educational development has no parallel in the history of human civilization.
In the latter half of the Twentieth Century the world community under theaegis United Nations Scientific and Cultural Conference (UNESCO) - made threedecisive moves to achieve the objective of Universalization of elementaryeducation (UEE). In Sixties in the regional conferences of Asia (1960), Africa (1961)Latin America & Caribbean (1962) and Arab States (1966) resolved to achieveuniversal elementary education (UEE) by 1980. Though these regions madesubstantial progress but none could achieve the objective of UEE. The urgency toachieve universal elementary education again got reflected in United NationsConvention on the Child Right in 1989. The second important move in ninetieswith the (first) World Conference on Education for All, held at Jomtien, Thailand,5-9 March 1990. The conference looked at elementary education, as a human rightand equally important a pre-requisite for sustainable development of societies,whether rich or poor. Third important mile stone that reflects the commitment ofworld community to ensure Education for All became apparent in Second WorldConference on Education for All, Dakar, Senegal, 26-28 April 2000. Underlining the urgency to achieve education for all this conference resolved that “Education is a
80 Soumen Saha and R. P. Juyal

Right to Education Act : A Catalyst to Development 81
fundamental human right. It is the key to sustainable development and peace andstability within and among countries, and thus an indispensable means foreffective participation in the societies and economies of the twenty-first century,which are affected by rapid globalization.”
Over 45 years, from 1960 to 2005 the progress in primary education, judgingfrom the gross enrolment ratio appears remarkable and it has given many lesson topolicy planners. As the world average of Gross enrolment ratio at primary level has increased from 72 percent to 106 percent. What is more important the regionswhich were lagging behind - like Sub-Saharan Africa and South and West Asia andArab states have made considerable progress. The enrolment ratio in Sub- Saharan Africa and South and West Asia climbed up from 40 percent in each region to 100percent and 110 percent respectively. A gain of 60 percentage point in enrolment inSub-Saharan Africa and 70 percentage point in South and West Asia. The Arabstates has also increased primary gross enrolment ratio from 60 percent to 100percent. The Central Asian Countries and the poor countries of East Asia andPacific, Latin America and Caribbean gross enrolment ratio at primary levelcrossed hundred percent.13 However at upper primary level, which is referred asLower Secondary level in United Nation Organization’s and other internationalagencies documents, the picture is not that better.
Even enrolment, as reflected by the data of Gross Enrolment Ratio, is notimproving with rate of improvement in Primary education. The data reveal theGER at Upper primary level in Sub-Saharan Africa was 41.2 percent in 2005 andSouth and West Asia was just 65.2 percent. In Arab states the Upper Primary GERwas 85 percent. The matter of concern is the rate of growth of enrolment at upperprimary level For instance the net enrolment ratio, (which is much better indicatorof age specific progress of enrolment ), in Sub-Saharan Africa in primary levelbetween 2000 to 2005 increased by 13 percentage point ( from 58.6 percent to 71.6percent) compared to it the GER at upper primary level in this region, in theaforesaid period increased only by 7.8 percentage point( from33.4 percent to 41.2percent). In Arab state also the increase in primary NER increased by little morethan 10 percentage point (from 82.5 to 92.9) where as the Upper Primary GERincreased by only little less than 6 percentage point( from 78.4 to 86.5 percent ). InSouth and West Asia region the NER at primarily level increased by 6 .4 percentagepoint (from 79.5 to 85.9 percent) and the increase in GER at Upper Primary level isclose it i.e. 7 percentage point (from 58.2 to 65.2 percent). This growth of enrolmentat Upper Primary level is hardly suffice to ensure that all children in 6-14 agegroups will be in school 2015. The experience of last decade also bring in focusthat even relatively higher-income countries such as the Philippines and Turkey may also lag behind in the development of elementary education largely becauseof deeply entrenched national inequalities.14 Internal strife and other conflicts also seriously undermine the growth of elementary education.
The gender parity in enrolment, defined as enrolment of girls divided byenrolment of boys, In 2005 the world average of gender parity at primary level

reached to 0.97. What is impressive in this regard is that it ranges between 0.94 inSouth West Asia, to more than unity in North America and Western Europe, LatinAmerica and Caribbean. Central and East Asia and Pacific is at the threshold ofachieving gender parity, as in rich nation of these regions the gender parity indexis unity and poor countries it is very close to unity (0.98). In Arab States andSub-Saharan Africa it is about 0.96 and 0.95 respectively. However, only about two-thirds of developing countries achieved gender parity at the primary schoollevel by 2005,15 which is nowhere close to the Millennium Development GoalTarget of abolishing gender disparity in elementary education preferably by 2005and in all level of education no later than 2015.16
4. The Complex Web of Social systems and Elementary Education
Universalization of Elementary Education is a complex social-economicprocess and experience has revealed that legal guarantee of education is animportant instrument but no way an assurance of UEE. The study of John Caldwellpertaining to the process of universalization of elementary education inindustrialized countries during 19th century revealed that economic and socialpressures played great role in achieving UEE and “legislation in many countrieswas the end point of the movement over several decades to bring all children in toschool.” Caldwell concludes that legal provisions, in most of the cases, areformalized when public awareness rises to level that legal bindings or not, people endeavour to educate children and stretch their means to maximum possibleextent.17
Researches has found that “inequalities associated with economic status arefar greater than those associated with gender, orphan - hood, or rural residence,and that within-country educational gap associated with economic status can betruly enormous - as large as or larger than differences across countries.”18 Povertydrives both boys and girls into employment, because either parent cannot affordcost of education or family earnings need to supplement. This factor could result inrelatively low enrolment of girls case specially in the communities which hasstrong tradition of placing more responsibility on girls to look after household.19
There is another disturbing trends though confined to Equatorial Guinea, Liberiaand Togo, where improving gender parity is not result of increasing enrolment ofgirls but because of decline in enrolment of boys,20 These trends have their genesisin poverty and social values and are an important lesson to all those communitiesincluding India, in which the tradition of gender based division of labour is quitestrong and poverty compel adolescent boys to join workforce. Thus it argued that there is poverty trap, something like, an ‘S’ curve as analyzed by Abhijit Banjerjeeand Esther Duflo. The capacity of poor to invest in education and health and othercapabilities developing activities is low hence in every subsequent stage poor earnless than they were earning before.21
However, there is another side of the coin, as experiences and studies acrosscountries has shown the making (supplying) provision of schooling do make
82 Soumen Saha and R. P. Juyal

Right to Education Act : A Catalyst to Development 83
difference. For example the Mexican conditional cash transfer programme -Progresa has been a great success22 launched in 1997. Not only this even Mayor ofNew York City in 2007 launched a similar progrmme with the active assistance ofvoluntary organizations like the Rockefeller Foundation, Robin Hood Foundation,Starr Foundation etc, to eradicate poverty in New York . The experience show that,complex web of socio-economic forces, to which poverty is one attribute, keepschildren out of school and responsible for poor quality of education. Themodernization programme of madarasa (Islamic schools) in Bangladesh is anexcellent example of it . The experience proves that with adequate incentives, these religious schools could play a useful role to spread modern education amongMuslim girls .The transformation with adequate incentives have been to the extentthat some of them are employing female teachers and enrolment of girls in someMadarasa is close to 50 percent of the total enrolment.23 The financial and materialincentives to children do have role in increasing the demand for education. Thegenderize facilities and appointment of female teachers indeed helps to bring girlsto school but the most formidable obstacles are rooted in cultural barriers whichcould hardly be tackled by the top down approach.
5. Right to Education : Challenges and Concern
As mentioned earlier the pledge of UEE, despite insistence from severalquarters, for about four decades, was a pious intention and it is only after SupremeCourt of India proclaimed in 1992 that the state’s failure to provide education for all children was tantamount to denial of the fundamental right to life as enshrined inArticle 21 of the Constitution. In a judgment the court observed “the effect ofholding that right to education is implicit in the right to life is that the state cannotdeprive the citizens of his right to education except in accordance with theprocedure prescribed bylaw”. The court ordered that the state must provide freeand compulsory education to every child of 14 years of age . Almost after a decadein 2002 the 86th Amendment Constitutional Amendment made elementaryeducation a fundamental right of every child of 6-14 years. This amendment madefollowing three specific provisions in the Constitution of India, “The State shallprovide free and compulsory education to all children of the age of six to fourteenyears in such manner as the State may, by law, determine.” This clause wasinserted in as Article 21A in Part III (Fundamental Rights), The original Article 45which promised that the state shall endeavor to provide free and compulsoryeducation to until the age of fifteen was replaced by the clause which states “theState shall endeavor to provide early childhood care and education for all childrenuntil they complete the age of six years”. A new clause was added in Article 51A(Fundamental Duties) which makes the parent or guardian responsible to provideopportunities for education to their children. The clause reads “who is a parent orguardian to provide opportunities for education to his child or, as the case may be,ward between the age of six and fourteen years.”24 Government took seven longyears to make Right to Education, judiciable. Eventually in the budget session of

Parliament in 2008, it introduced the Right to Education (RTE) Bill which finallytook the shape of RTE Act 2009 and came in enforce from 1st April, 2010. RTE Act -2009 in no uncertain terms has made it responsibility of state to ensure that no childis denied education for any reason may be financial, distance or physical challenge. It is the responsibility of government to take care of these issues and provideschooling facility to children in neighbourhood.
The implementation of Right to Education Act is a legal obligation on thestate to enroll each and every child of 6-14 years in neighborhood school by March2013.The total number of children to be enrolled in school by this time, it isestimated will be around 80 millions. The schooling system as per the RTEprovision has to make an estimated provision of around one million teachers tofulfill the obligation of pupil teacher ratio and it is to be ensured that all the teachers requited are academically and professionally competent, as per the norms, byMarch 2015. The other implication in this regard is what the state will do with themultiple type of teachers - the para teachers and the regular teacher. It is matter tobe seen that how state government forms the single cadre for teachers. The otherissues like provision of teaching learning equipments etc are also important.
The basic issue implementing in the RTE letter in spirit it to activate the stategovernments which has to share the major responsibility. The central government,Ministry of Human Resource Development is trying hard to persuade stategovernment to own the act and implement it, but the attempts have yielded littlesuccess As a matter of fact the implementation of the act lacks luster. Only 13 of the35 states and Union territories have either rules accompanying the act or notifiedthe authorities accountable for implementation of the various provisions of the act.Only 6 states - Sikkim, Arunachal Pradesh, Manipur, Orissa, Rajasthan AndhraPradesh, West Bengal, Bihar, Uttarakhand have notified that rules. Keeping the financial burden for the implementation of the Right to Education make it clearthat keeping the precarious financial position of the states in view it seems that the state can do little to implement the act. There is lot of ambiguity about thefinancial responsibility of implementing the provisions of the act. One the onehand the Act states that the states and centre will have concurrent responsibilityand the states will get predetermined percentage of expenditure as grants-in-aidfrom the Central Government based on recommendations of the FinanceCommission on assessment of additional resource requirements. But on the otherhand the section 7.5 of the act unequivocally states that “Notwithstandinganything .... The state government shall be responsible to provide funds forimplementation of the provisions of the Act”. The sharing pattern of financialburden between the centre and the states is crucial issue. The financial burden ofSSA, as Government of India suggests presently shared between centre and state in the ratio of 55 : 45 which central government at the end of the 11th plan intendsreduce to 50 : 50. But many states, not only North Eastern and other economicallybackward but others may also not find this new ratio comfortable. The other issuethat has been learned during DPEP and SSA is of the creating a mechanism of
84 Soumen Saha and R. P. Juyal

Right to Education Act : A Catalyst to Development 85
timely and efficient utilization of the resource and most of the states have poorrecord in this regards. This is also apparent from fact that very little state hasenacted state legislation to implement RTE. Several alternatives like increasingpublic private partnership, setting aside a proportion of disinvestment proceed todevelop school infrastructure, seeking loans from external agencies, raising fundsfrom capital market through the proposed National Education FinanceCorporation are being weighed but all these require political will on the part ofgovernment.
The act has undoubtedly set the time limit of three year from thecommencement of the act to establish a neighborhood school but has not definedthe area limits of neighbourhood and left it to Government to decide later . Thiscreated an ambiguity and the act compounds it further by giving a lot of leverage toprivate schools. The provision that private school will admit 25 percent childrenbelonging to weaker and disadvantageous sections and government will reimburse the cost of education of these children has been received with less enthusiasm, andmore resistance. Generally private schools putting tough resistance to the act andhave challenged its constitutional validity in Supreme Court. Some schools haveevolved methods to defeat the provisions of the act. They are arranging separateafternoon classes for poor children. Explanations for this are, of course, apparentlylogical, like shortage of space, rooms, difference in the level of learning ability ofchildren and so on. These arguments are actually smokescreen, to defeat the spiritof the provision. Even if the reasons cited above are genuine, to implement theprovision in this manner, fails to serve purpose, the very spirit i.e. inclusiveness.This behavior of school raises the doubts that they are unable to bear the idea ofmixing the children of poor and elite, for fear of losing their elite status.25 On theseand other grounds the RTE act have been subject, to severe attack that the actinstead of reducing inequality will accentuate them further .As the idea of commonschool, as visualized in the First Education Commission of India26 and is in practicein many developing and developed countries irrespective of type of politicalsystem and ideology, it seems is destined to remain dream as elusive as ever Education is lucrative business for most of the private schools, and large number ofthem are got land either free at very subsides rates from the government. The act will be further benefit these institutions by the largess of government- coming inthe form of assured market (enrolment) of at least 25 percent of their total potential.How long government will continue to reimburse the cost of education of thesechildren has also not been specified. Thus this provision is a lucrative business toprivate schools which are proliferating and their promise of quality education isattracting even poor household. This provision of RTE provides a secure market toprivate school. This indicates that, since common schooling system is not, on theagenda of government, therefore RTE may be become an instrument of reinforcingthe existing inequalities in which children get education as per the ability of theirparents to afford the cost. Critics are of the opinion that the RTE is guided by thebasic premises of market economy which intents to shrink the space of government

activities in any sphere that has economic implication. The RTE can be transformedinto an instrument of shifting public funds to corporate houses, NGOs, andreligious bodies through Public private partnership, school voucher, refinancedloans, cash transfers and tax exemptions, and above all absolving the state from itsresponsibilities to ensure UEE.27 The very definition of school, as adopted in the Act has been questioned by many, as the Act itself recognized four categories of schools, which with varying quality in every aspect - provisions infrastructure, teachers andteaching learning practices etc. The act see no conflict, this provision has with otherfundamental rights like Article 14 (equality before law), Article 15 (prohibiting thestate from discriminating) and Article 16 (social justice).28 The RTE has little to offer one these issue and apprehensions are there that RTE may not be helpful inachieving the long held objective of National Education Policy “removal of disparities and to equalize educational opportunities by attending to the specificneeds of those who have been denied equality.”
The RTE seems to be lenient to private schools in infixing accountability,while the act clearly specifies that all government funded schools will be under themanagement of School committee but there is no mention of such provisions incase of private schools. Though School management committee is no way aguarantee of quality of education and adherence to the norms of RTE, but keepingprivate schools out of the purview even this scanty provision of community
6. The Quality Imperatives : The Way Ahead
Among the several lessons that India need to learn first and foremost is thateducation may prove to be a ticket of vertical mobility, only if it builds capabilitiesfor which, inter -alia, the availability and quality of teachers and infrastructure arethe critical factors. The Education Guarantee Centres and Alterative EducationCentre and the para teachers are the easy solution to overcome, the shortage ofschools and teachers. The “free education”, of poor quality is no way an incentiveto enroll children in schools. Even poor households, with the burning desire toprovide quality education to children, stretch themselves to limits, to enroll theirchildren in private schools, which are of varying free structure to accommodatedifferent sections of society. Whether these expectations are fulfilled or belied is analtogether different matter but the RET, has precisely done nothing to address thiscrisis of credibility of Government schools. It is a fact, as Weiner Myron29, mentions no country in the world has been able to eliminate child labour without acompulsory education policy but it is also true that legal provisions has its limits .The past experiences from state amply demonstrate that the namely Kerala,Himachal Pradesh and Manipur, in the past did not have a compulsory educationpolicy but had the highest enrolment rates as well as the lowest dropout rates.These states also had lower incidence of child labour. On the other hand, Bihar,Rajasthan and Uttar Pradesh which already had policy of free and compulsoryelementary education have low enrollment rate and high incidence of child labour.The contemporary debate on elementary education in India is ranging on two
86 Soumen Saha and R. P. Juyal

Right to Education Act : A Catalyst to Development 87
issues. One section insists that there is need to improve government schoolingsystem and to buttress their argument cite the case of LJ, SK, DPEP and SSA, which has brought the country at the threshold of UEE. The other section argues thatprivate sector can deliver and help to achieve UEE at relatively less cost and theycite example of schools run by some NGOs. Advocate of this approach argue thatlike any other markets in education too, increasing competition will reduces pricesand improves quality. However education is a complex issue, which involves notonly cognitive skills but also values and attitudes. Education, as matter of fact, isboth private as well as public goods. Thus providing education is a complexprocess - which has to balance individual expectations as well social and nationalneeds. The other important issue is investment on education has a long gestationperiod. The return on education is realized gradually over a long period of time.These characteristics of education- specially of elementary education which hasmore social instrumental value compared to private in the context of the society inwhich large number of people are poor by any international standard, make a verystrong case to reform government schooling system and there is urgent need thatprivate sector becomes more and inclusive and the government schools improvetheir efficacy - in terms of quality of learning.
Thus the urgent task before the nation is to eradicate the multifariousinequalities, in which, keeping the fact in to consideration that private schools areunaffordable to large number of households, state has a crucial role, the privatesector at the best can only supplement the efforts that too only, if it sensitive tosocial inclusion.
References
1. Haq, M. U., Reflection on Human Development, New Delhi: Oxford, 1999, 23..
2. Stigliz, J., Globalization and its Discontent, New York : Allen Lane, 2002, 84.
3. Robert, S., Keynes : The Return of the Master, London : Allen Lane, 2009, 116,126.
4. UNESCO, The Hidden Crisis : Armed Conflict and Education, UNESCO Publishing,
2011.
5. Brown, G., Education for All : Beating Poverty, Unlocking Prosperity, UNESCO, 2011.
6. World Literacy Foundation, The Economic & Social Cost of Illiteracy - A Snapshot of
Illiteracy in a Global Context, 2015, Final Report, Melbourne : World Literacy
Foundation, October 2015.
7. UNESCO, Out-of-School Children and Youth, UNESCO : Institute for Statistics (UIS),
2016.
8. UNESCO. (2016, 7 15). http://uis.unesco.org. Retrieved 1 11, 2017, from http:// uis.
unesco.org/en/news/263-million-children-and-youth-are-out-school,15/07/2016).
9. UNESCO, Education for All Global Monitoring Report 2010 : Reaching the
Marginalized, Paris : United Nations Educational Scientific and Cultural Organization,
2010, 15, table 3A) .
10. Dickson, R. J., Hughes, B. B. and Ifran, M. T., Advancing Global Education : Pattern of
Potential Human Progress, Boulder, USA : Paradigm Publisher, 2010, 11).

11. Ibid.,11.
12. Clemens, M. A. (2004). The Long Walk to School : International Education Goals in
Historical Perspective. Retrieved February 3, 2011, from http://ideas.repec.org/p/
wpa/wuwpdc/0403007.
13. Dickson, R. J., Hughes, B. B. and Ifran, M. T., Advancing Global Education : Pattern of
Potential Human Progress, Boulder, USA : Paradigm Publisher, 2010, 26-27.
14. UNESCO, Education for All Global Monitoring Report 2010 : Reaching the
Marginalized, Oxford : UNESCO /Oxford University Press, 2010.
15. The World Bank, Global Monitoring Report - 2010 The MDGs after the Crisis,
Washington D.C. : International Bank of Reconstruction and Development/ The World
Bank, 2010, 160.
16. UNO, (2000). United Nations Millennium Declaration. Retrieved from http://www.
un.org/millennium/declaration.
17. Caldwell, J., “Mass Education as a Determinant of the Timing of the Fertility Decline”,
Population and Development Review, 6 (2), 1980, 233.
18. Filmer, D., “Inequalities in Education: Effects of Gender, Poverty ,Orphanhood, and
Disability”, M. Tembon, & L. Fort (eds.), Girls Education in the 21st Century Gender
Equality, Empowerment and Economic Growth, Washington D.C : International Bank
for Recosntruction & Development /World Bank, 2008, 96-97.
19. Al-Mekhlafy, T. A., “Strategies for Gender Equality in Basic and Secondary Education :
A Comprehensive and Integrated Approach in Republic of Yemen”, M. Tembon and L.
Fort (eds.), Ibid, 271-275.
20. UNESCO, Education for All Global Monitoring Report 2010 : Reaching the
Marginalized. Oxford : UNESCO /Oxford University Press,2010, 65.
21. Banerjee, A. and Duflo, E., Poor Economics Rethinking Poverty and the Ways to End it,
Noida : Random House, 2011, 11-12.
22. Schultz, P., “Subsidies for the Poor : Evaluating the Mexican Progresa Poverty
Program”, Journal of Development Economics, 74 (1), 2004, 199-205.
23. Chaudhury, N. and Chaudhury, N., “Holy Alliances : Public Subsidies, Islamic High
Schools, and Female Schooling in Bangladesh”, M. Tembon, & L. Fort (eds.), Ibid, 2008 .
24. Government of India, Constitution of India (As Modified up to 1st December, 2007),
Ministry of Law and Justice, 2007, 11, 23, 25.
25. Kumar, K., “Why RTE Remains a Moral Dream”, The Hindu, May 21, 2011.
26. Kothari, D. S., Education for National Development, New Delhi : Government of India,
Ministry of Education, 1968,10.5, 10.9.
27. Sadgopal, A., “Neo liberal Act”, Front Line, 28, 14 July, 2011, 5-9.
28. Ibid.
29. Weiner, M., The Child and the State in India : Child Labor and Education Policy in
Comparative Perspective, Princeton : Princeton : Princeton University Press, 1991. ê
88 Soumen Saha and R. P. Juyal
Article Received on July 12, 2017; Accepted on August 21, 2017

8
Active and Reflective Learning Styles
among Adolescents and their Siblings
and its Relation to their Academic
Achievements
Supriya Yadav* and Mukta Garg**
The learning style is the manner in which a learner perceives, interacts with and respondsto the learning environment. Components of learning styles are the cognitive, affective andphysiological elements, all of which may be strongly influenced by a person’s culturalbackground. The objective of the present study was to find out the active and reflective learningstyles among the adolescents and their siblings and its relation to their academic achievement. The study was conducted on a sample of 120 (60 adolescents and their 60 siblings) adolescents. Theseadolescents were selected randomly from 4 colleges of Kanpur city. A questionnaire developed byBarbara A Soloman was used to collect the data. The data was analyzed through frequency,percentage, mean, and chi- square. The finding revealed that in some areas there was a significantdifference between learning style of adolescents and their siblings. And it was also found that theacademic achievement of active learner was better than reflective learner.
[Keywords : Active learning style, Reflective learning style, Adolescents,
Siblings, Academic achievements]
CONTEMPORARY SOCIAL SCIENCES, Vol. 26, No. 3 (July-September), 2017
* M. Sc. Student, Department of Human Development and Family Studies, College of C.S.A.U.A&TKanpur, Uttar Pradesh (India)
** Assistant Professor Department of Human Development and Family Studies, College of C.S.A.U.A&T Kanpur, Uttar Pradesh (India) E-mail: <[email protected]>

1. Introduction
In order to achieve the ultimate goal of student learning it is important to usea combination of teaching methods and to make the classroom environment asstimulating and interactive as possible. Learning is a key process in humanbehavior. The individual is constantly interacting with and influenced by theenvironment. When we think about learning, it might be easy to fall into the trap ofonly considering formal education that takes place during childhood and earlyadulthood, but learning is actually an ongoing process that takes place throughoutall of life. Learning is defined as “any relatively permanent change in behavior thatoccurs as a result of practice and experience.”
What activities are learned by the individual refer to types of learning. Forexample, habits, skills, facts, etc. There are different types of learning
All involves either physical activities or mental activities. They may be simple or complex in nature involving various muscles, bones, etc. So also the mentalactivities may be very simple involving one or two activities of mind or complexwhich involve higher mental activities.
One of the oldest and most widely used approaches to learning styles is theProposed by Rita and Kenneth Dunn (1978, 1992a, 1992b, and Dunn, 1986).Through their work in schools, they observed distinct differences in the waysstudents responded to instructional materials. Some liked to learn alone, whileothers preferred learning in groups or from a teacher. Out of this preliminary work, they identified five key dimensions on which student learning styles differed: 1)environmental, 2) emotional support, 3) sociological composition, 4) physiological, and 5) psychological elements. In general students use different strategies whenattacking learning problems. Some attack them globally, looking at the big picture,while others prefer to address individual elements of a problem separately. In asimilar way, some students jump into problems, figuring things out as they goalong, while others are more reflective, planning before beginning.“Activelearning is anything that involves students in doing things and thinking about thethings and doing” (Bonwell & Eison, 1991). Active learning is a process wherebystudents engage in activities, such as reading, writing, discussion or problemssolving that promote analysis, synthesis and evolution of class content. Activelearning as an approach to instruction in which students engage the material theystudy through reading, writing, talking, listing . Active learning stands in contrastto “standard” modes of instruction in which teachers do most of the talking andstudents are passive.
Reflection was a necessary precursor to action. In other words, John Deweyadvocated that students need to think and mull over what they read and encounter, and after doing this, they can apply that knowledge better. Reflective learninginvolves students thinking about what they have read, done, or learned, relatingthe lesson at hand to their own lives and making meaning out of the material. It’s
90 Supriya Yadav and Mukta Garg

Active and Reflective Learning Styles among Adolescents and their Siblings 91
more than just memorizing some facts, formulas, or dates. ‘It is not sufficientsimply to have an experience in order to learn. Without reflecting upon thisexperience it may quickly be forgotten, or its learning potential lost. It is from thefeelings and thoughts emerging from this reflection that generalizations orconcepts can be generated. And it is generalizations that allow new situations to betackled effectively’ (Gibbs, 1988). Reflective learning skills are often called upon as part of a practice-based assignment, project or work-placement. The present studywas taken to find out the learning styles among the students and their siblings andalso to find out the effect of learning style on academic achievement.
2. Research Methodology
This study was conducted on 120 respondents; firstly four schools were
randomly selected from the Kanlyanpur area of Kanpur city then the list of the
adolescents of those who were having the siblings was prepared. 60 respondents
were selected randomly from the above list, after this their siblings were
approached, most of them were studying in the same school, those who were not in
the same school/college were approached personally. Researcher prepared a
Questionnaire in which about 10 questions were related to general information
regarding learning styles and for assessing the different dimensions of learning
styles among the adolescents and their siblings a questionnaire prepared by
Barbara A. Soloman was used to collect the information. Question no 11.15.19,23,27,31,35.39,43,47,57 were related to active and reflective learning style of the
adolescents. All question had two options “A” and “B” option “A” for active learner
and option “B” for reflective learners. After collecting the information data was
tabulated and analyzed through frequency, percentage, mean, and chi-square (x2).
3. Presentation of Data and Discussion
The following table gives distribution of the respondents and their siblings
according to their learning styles active/reflective :
Table-1 : Distribution of the respondents and their siblings according to theirlearning styles Active /Reflective
.o
N .Q
noits
eu
Q
noit
pO
Adolescencen1= (60)
Siblings n2=(60)
Total (N=120)
x2
N % N % N %
11 I understand somethingbetter after I
A 50 83.3 17 28.3 67 55.8 36.800**
B 10 16.6 43 71.6 53 44.16
15 I am learning somethingnew, it helps me to
A 40 66.6 12 20 52 43.3 26.606**
B 20 33.3 48 80 68 56.6

19 In a study group workingon difficult material, I ammore likely to
A 38 63.3 38 63.3 76 63.3 5.236
B 22 36.6 22 36.6 44 36.6
23 In classes I have taken A 15 25 35 63.3 50 41.6 13.714**
B 45 75 25 41.6 70 58.3
27 I start homeworkproblems, I am morelikely to
A 44 73.3 43 71.6 87 72.5 0.0007
B 16 26.6 17 28.3 33 27.5
31 I prefer to study A 38 63.3 45 75 83 69.1 1.915
B 22 36.6 15 3.33 37 30.8
35 I would rather first A 46 76.6 21 35 67 55.8 61.194**
B 16 23.3 39 65 55 45.8
39 I more easily remember A 14 46.6 45 75 59 49.1 0.0172
B 46 53.3 15 25 61 50.8
43 I have to work on a groupproject , I first want to
A 13 21.6 16 26.6 29 24.1 0.00227
B 47 78.3 44 73.3 91 75.8
47 I am more likely to beconsidered
A 42 70 7 11.6 49 40.83 4.225
B 18 30 53 88.3 71 59.16
53The idea of doinghomework in group withone grade for the entiregroup
A 32 53.3 8 13.3 40 33.3 21.60**
B 28 46.6 52 86.6 80 66.6
“I understand something better” the most of the adolescents were in
the favour that they understand better when they try it out, whereas the siblings of
adolescents were in the favour they understand better when they thinking itthrough the percentage values were (83.3%) and (71.6%) respectively. The
observed value of x2 (36.800**) was significant at 1% of level significance. In the
question 15 “I am learning something new it helps me to learn” the maximum
number of adolescents were in the favour when they talk about it (66.6%) where as
the siblings were in the favour when they think about it (80%) and The observed x2
values was (26.06**) significant at 1% level of significance here the difference in the
learning styles was found. The most of the adolescents and their siblings were in
the favour that “they jump and contribute ideas when they study group working
on difficult materials” the percentage was 63.3%. Both the adolescents (73.3%) and
their siblings (71.6%) answered “when they starts problems, they were likely to try
to understand the full problem first rather than start working the solution
immediately” The observed x2 values was (1.915) non-significant. In the question “I
92 Supriya Yadav and Mukta Garg

Active and Reflective Learning Styles among Adolescents and their Siblings 93
would rather first” the most of the adolescents were in the favour of “try things
out” (76.6%) whereas the siblings were in the favour “think about how I am going
to do it” (65%) and The observed x2 values was (61.194**) significant at 1% level of
significance. “I more easily remember” most of the adolescents replied that they
easily remember things “when they something thought a lot about it” (53.3%)
whereas siblings responded when “Something I have done”. The observed x2
value was (0.0172). Maximum number of the adolescents and their siblings were in
the favour of “they work on the group project they first want to brain storm
individually and then come together as a group to compare ideas” and the
percentage were (78.3%) and (73.3%) respectively. The observed x2 values was(0.00227) non-significant.
In the question “I am more likely to be considered” most of the adolescentswere “outgoing” (70%) whereas the siblings were “reserved” (83.3%). Theobserved x2 value was found to be non- significant (4.225).According to “the idea of doing homework in group one grade for the entire group” adolescents answered“appeals to me” (53.3%) whereas siblings answered “Does not appeal to me”(86.6%) and The observed x2 values was (21.60) significant at 1% level of significance.
The following table gives correlation coefficient between academicachievement and learning style (active/reflective) of respondents :
Table-2 : Correlation coefficient between academic achievement and learning style(Active/ reflective) of respondents
Dimension Academic Achievements/ Correlation coefficient
Active (A) 0.6877*
Reflective (B) 0.6292*
Correlation coefficient between the Active learner and their academicachievements (0.6877*) And Reflective learner and their academic achievement(0.62992*) was found significant at 5% level of significance.
3. Conclusion
In some places significant difference and in some places non significantdifferences was found between the learning style of adolescents and their siblings.So it can be conclude that no single style was preferred by the students, Most of thestudents were balanced on active and reflective style. The findings of the study arein support of Neel, J. A. Grindem, and C. B. (2010) study. Academic achievement ofthe Active learners was found better in comparison reflective learner supportstudy Rezaei-Moghaddam, K. Rostami, S.(2016). The result of this study will helpthe teachers to develop appropriate learning approaches to reach the all types oflearners in a balanced manner through modification of the teaching methodseducational outcome of the student can be improved Panambur, S. Nambiar, V.Heming, T. ( 2014) and Ranganath, T. S. Priya, K. J. ( 2015).

Reference
1. Barba Martin, J. J., “Differences between the cooperative learning and the practice style
in rural school. Comparison of two studies of case in a didactic unit of acrosport in the
second cycle of primary education”, [Spanish], RETOS - Neuvas Tendencias en
Educacion Fisica, Deporte y Recreacion, 18, 2010, 14-18.
2. Neel, J. A. Grindem, C. B., “Learning-style profiles of 150 veterinary medical students”,
Journal of Veterinary Medical Education, 37(4), 2010, 347-352.
3. Panambur, S. Nambiar, V. Heming, T., “Learning style preferences of preclinical
medical students in Oman”, Oman Medical Journal, 29(6), 2014, 461-463.
4. Ranganath, T. S. and Priya, K., J., “Assessment of learning style preferences of medical
undergraduate students: a cross-sectional study”, International Journal of Medicine
and Public Health, 5(2), 2015, 196-199.
5. Rezaei-Moghaddam and K. Rostami, S., “Attribution style, locus of control and
academic achievement in College of Agriculture, Shiraz University”, [Persian], Iranian
Agricultural Extension and Education Journal, 6(2), 2011. 115-130.
6. Salehi, E., Hedjazi, Y., Hosseini, S. M., and Ebrahimi, M. S., “The effect of personality
types on the learning styles of agricultural students : A case study in Iran”, The Online
Journal of New Horizons in Education, 4(2), 2014, 126-135.
7. VAK Test. (June 15, 2015) Discover your Preferred Learning Style. Retrieved: http://.
pdf.brainboxx.co.uk /a3 aspects/PhD/VAK questionnaire. ê
94 Supriya Yadav and Mukta Garg
Article Received on July 17, 2017; Accepted on August 29, 2017

9
Prevailing Market Trends in the Upper
Garments for Young Women
Neha Sood* and Harminder Kaur Saini**
For this study a total of 40 apparel stores were selected purposively and surveyed to gettheir information regarding existing market trends with respect to fabric, types, colours,constructional features and accessories/ surface embellishments used in upper garments foryoung women. An interview schedule was used for conducting the market survey. The dataregarding prevailing marketing trends in upper garments shows that classic tops, shirts andt-shirts were present in all the apparel stores. Upper garments in cotton fibres were found in allthe apparel stores. Garments in cotton and cotton blend fabrics both in knitted and woven fabricstructure in plain without design and printed fabrics were available in all the apparel stores. Allcolours were available in the market for upper garments, whereas black and white coloured uppergarments in single and double colour combination were also available in all the stores. Buttons,belts and zipper each were used in most of the upper garments available in all the apparel stores.
[Keywords : Draping technique, upper garments, embellishments, respondents,
design, most preferred]
1. Introduction
Clothing plays an important role in organizing our social status in present
time of fashion and style. It is very important to wear fashionable and stylish
clothes. There is wide variety of costumes available in the market that one can try
CONTEMPORARY SOCIAL SCIENCES, Vol. 26, No. 3 (July-September), 2017
* M. Sc. Student, Department of Apparel and Textile Science, College of Home Science, PunjabAgricultural University, Ludhiana, Punjab (India) E-mail: <[email protected]>
** Professor, Department of Apparel and Textile Science, College of Home Science, PunjabAgricultural University, Ludhiana, Punjab (India) E-mail: <[email protected]>
different styles. It solely depends upon the choice and taste of the person that what
kind of clothes he or she prefers to wear. Depending upon the different factors like
age, body structure, profession, region and social status, different people wear
clothes of different kinds. Clothing is important for different age groups. Everyone
wants to look attractive and impressive. Young girls prefer to wear slim fit and
highly stylish dresses that make them look stunning. One would never manage to
have a charming and appealing personality without proper outfit (Marshal, 2009).
Clothing, a basic need of human beings, provides the most eloquent
imposition on a person and serves as a means of social identification. According to
Solomon (1986), it affects the perception and thinking of both the viewer and
wearer. Selection of clothing is dependent on the manner in which it fits on one’s
body. According to Workman (1991), concept of good fit varies with the individual
but everyone has an option about what feels and looks good and right for her or
him. Apparel made of finest fabric cannot look good if it fits poorly. A proper fit can
give a feeling of physical comfort. Being well dressed for the occasion is an
advantage physically, psychologically and socially and also it gives a feeling of
self-confidence.
Women’s from early civilizations used draped garment in the Indian
subcontinent. The present style of draping the saris used by Indian women was
developed in 19th century under colonialism. In that era, style of draping emerged
in number of ways to state women’s status in caste hierarchy. A large number of
Indian men started wearing, cut and sewn garments, influenced by northern
Indian or European styles. Since 1980s, Indian working women are also
continuously doing the same. However, most Indian women continue to wear
draped garments which are not stitched or cut to fit, but wrapped around the body,
by using simple pleats or held in place with belt or sash according to the taste and
needs of the individual wearer. Draping can be trim and practical, flowing and
elegant or anything in between (Anonymous, 2010).
2. Objectives
1. To explore the market trends in upper garments for young women.
2. To study the preferences of the respondents for developing designs of upper
garments.
3. Methodology
A total of 40 apparel stores (retail), selling different types of upper garments
for women of different socio-economic and age groups were selected purposively
and surveyed by the researcher. An interview schedule was used to collect the data
regarding existing trends with respect to fabric types, colours, constructional
features and accessories/embellishments used in the upper garments of young
women was collected using an interview schedule.
96 Neha Sood and Harminder Kaur Saini

Prevailing Market Trends in the Upper Garments for Young Women 97
4. Results and Discussion
According to the data contained in the following table, the results of market
survey revealed that classic tops, shirts and t-shirts were present in all the apparel
stores. Tank tops, kurtis, ruffled tops, crop tops, tunics and capes were available inthe majority (more than 80%) of the apparel stores. Peasant tops and blouson each
were seen in 60 per cent whereas kaftans were available only in 45.00 per cent of the
apparel stores.
Table -1 : Upper garments available in the market (n=40)
Types of upper garments Frequency (%)
Classic tops 40 (100.00)
Crop tops 34 (85.00)
Tank tops 38 (95.00)
Ruffled top 32 (80.00)
Peasant tops 24 (60.00)
Button ups 30 (75.00)
T-shirts 40 (100.00)
Shirts 40 (100.00)
Kurtis 36 (90.00)
Tunics 34 (85.00)
Kaftan 18 (45.00)
Blouson 24 (60.00)
Gowns 32 (80.00)
Capes 30 (75.00)
Shrugs 28 (70.00)
f-frequency, Figures in parentheses indicates percentages
Table-2 : Availability of fibres used for upper garments (n=40)
Fibres Frequency (%)
Cotton 40 (100.00)
Linen 20 (50.00)
Wool 8 (20.00)
Rayon 14 (35.00)
Silk 14 (35.00)
Polyester 12 (30.00)
f-frequency, Figures in parentheses indicates percentages

The data in table-2 indicated that the upper garments in cotton fibres were
found in all the apparel stores followed by garments in linen fibre, which were
available in 50.00 per cent of the apparel stores. Upper garments in rayon and silk
fibres each were seen in 35 per cent of the apparel stores. Garments made from
wool fibre were available only in 20 per cent of apparel stores.
Table-3 : Availability of fabrics used for upper garments (n=40)
Fabrics Frequency (%)
Cotton 40 (100.00)
Linen 20 (50.00)
Silk 10 (25.00)
Polyester 8 (20.00)
Rayon 14 (35.00)
Georgette 16 (40.00)
Taffeta 16 (40.00)
Chiffon 20 (50.00)
Wool blend 20 (50.00)
Cotton blend 40 (100.00)
f-frequency, Figures in parentheses indicates percentages
Fig.-1: Fabric designs available in upper garments
The data in table above indicated that the upper garments in cotton and
cotton blend fabrics were found in all the apparel stores followed by garments in
linen and wool blended fabrics each, which were available in 50per cent of the
apparel stores. Garments in georgette and taffeta each were seen in 40 per cent of
the apparel stores. Upper garments in polyester were available only in 20 per cent
of the apparel stores.
98 Neha Sood and Harminder Kaur Saini

Prevailing Market Trends in the Upper Garments for Young Women 99
It was found that both knitted and woven fabric structure in upper garments
were available in all the apparel stores as shown in table 4. Similar results were also
reported by Kaur (2013).
Table-4 : Fabric structure available in upper garments
Available fabric structure Frequency (%)
Woven 40 (100)
Knitted 40 (100)
Regarding the market trends in fabric design, it was found that upper
garments in both plain without design and printed fabrics were available in all the
apparel stores followed by garments with structural design in single colour which
were found in 85 per cent of the apparel stores followed by structural design more
than one colour were seen in 50 per cent of the apparel stores. Both structural and
printed designs were found only in 45 per cent of the stores as shown in Fig.-1.
Table-5 : Colours available in upper garments (n=40)
Colours available Frequency (%)
Black 40 (100.00)
White 40 (100.00)
Grey 30 (75.00)
Red 36 (90.00)
Blue 32 (80.00)
Orange 26 (65.00)
Mauve 26 (65.00)
Pink 38 (95.00)
Maroon 34 (85.00)
Green 34 (85.00)
Brown 30 (75.00)
Cream 32 (80.00)
Yellow 32 (80.00)
f-frequency, Figures in parentheses indicates percentages
Table-5 indicates different types of colours available in the market for upper
garments. Black and white coloured upper garments were available in all the
apparel stores followed by pink and red colour garments which were present in 95
and 90 per cent of the stores, respectively. Garments in maroon and green colour
each, were found in 85 per cent of the stores followed by brown colour which were
seen in 75 per cent of the apparel stores while, orange and mauve colour dresses
each were available in 65 per cent of the stores, respectively.

Regarding the availability of the colour combination for upper garments in
the market, it was observed that single colour and double colour garments were
there in all the stores. Multi coloured upper garments were available only in 75 per
cent of the apparel stores as shown in fig.-2.
Fig-2 : Colour combinations available in the upper garments
The information regarding different constructional features available in
various upper garments was also studied. The data in table 6 revealed that upper
garments with pleats and ruffles were seen in 100 and 95 per cent of the apparel
stores, respectively. Whereas gathers and darts each were seen in 90 per cent of the
stores. Garments with flounces, tucks and peplums were seen in more than 80 per
cent of the stores. Upper garments with pockets were only present in 75 per cent of
the apparel stores. Varsha (2014) also founds that pleats were seen in all the apparel stores
Table-6 : Constructional features available in the market for upper garments (n=40)
Constructional features Frequency (%)
Pleats 40 (100.00)
Tucks 32 (80.00)
Ruffles 38 (95.00)
Yokes 18 (45.00)
Gathers 36 (90.00)
Flounces 34 (85.00)
Darts 36 (90.00)
Pockets 30 (75.00)
Peplums 32 (80.00)
f-Frequency, Figures in parentheses indicates percentages
100 Neha Sood and Harminder Kaur Saini

Prevailing Market Trends in the Upper Garments for Young Women 101
Table-7 shows that upper garments with buttons, belts and zipper each were
available in all the apparel stores. Whereas upper garments with buckles and
broaches were available in 80 per cent of the apparel stores. Mirror disc in upper
garments were available in 25 per cent of the apparel stores. Laces were mainly
used in upper garments as an embellishment and such types of garments were
available in 90 per cent of the apparel stores followed by the garments with beads
and ribbon as embellishment which was available in 80 per cent of the apparel
stores. Upper garments with braids were available only in 15 per cent of the
apparel stores.
Table-7 : Accessories/surface embellishments available in the upper garments
(n=40)
Accessories /surface embellishments Frequency (%)
Mirror discs 10 (25.00)
Buttons 40 (100.00)
Belts 40 (100.00)
Zipper 40 (100.00)
Buckle 32 (80.00)
Broaches 32 (80.00)
Laces 36 (90.00)
Braids 9 (15.00)
Beads 32 (80.00)
Binding 12 (30.00)
Ribbons 32 (80.00)
f-Frequency, Figures in parentheses indicates percentages
5. Conclusion
The data regarding prevailing marketing trends in upper garments shows
that classic tops, shirts and t-shirts were present in all the apparel stores. Uppergarments in cotton fibres were found in all the apparel stores. Garments in cotton
and cotton blend fabrics and in both knitted and woven fabric structure were
available in all the apparel stores. Regarding the market trends in fabric design, it
was found that upper garments in both plain without design and printed fabrics
were available in all the apparel stores. All colours were available in the market for
upper garments, whereas black and white coloured upper garments were available
in all the apparel stores. Regarding the availability of the colour combination for
upper garments in the market, it was observed that single colour and double colour
garments were there in all the stores. Upper garments with pleats were seen in all
the apparel stores, whereas upper garments with buttons, belts and zipper each
were available in all the apparel stores.

References
1. Anonymous (2010) Retrieved from http://www.my-lyceum.net on 29/1/2016.
2. Kaur, R., Developing designs of lower garments for college going girls through draping
technique, M. Sc. thesis, Punjab Agricultural University, Ludhiana, India, 2013.
3. Marshal, J ., (2009) Clothing- enhance your looks, retrieved from www.articlealley.com
on 31/12/2016
4. Solomon, M. R., “Dress for effect”, Psychol Today, 20(4), 1986, 20-22.
5. Varsha, Designing western dresses for college going girls using different silhouettes,
M. Sc. thesis, Punjab Agricultural University, Ludhiana, India, 2014.
6. Workman, J., “Achieving good fit in clothing : What’s New”, Home Econ, 24, 1991, 34ê
102 Neha Sood and Harminder Kaur Saini
Article Received on July 07, 2017; Accepted on August 30, 2017

10
Social Networking Sites and
Adolescents
Pirshant Kumar* and Deepika Verma**
Social Networking Site is a platform to build social networks or social relations amongpeople who share interests, activities, backgrounds or real-life connections. A Social NetworkingSite consists of a representation of each user, his or her social links, and a variety of additionalservices. Adolescents are the most active users of these sites. They are found flocking around thesesites with one medium or the other. The features and facilities provided by these sites areattracting more and more young people towards them. In fact, adolescents are among the mostprolific users of social network sites (SNS). Emerging studies find that youth spend a considerable portion of their daily life interacting through social media.The present article aims to know theusage pattern of Social Networking Sites by the adolescents. Studies which are carried out earlierhave reviewed the pros and cons of the use of Social Networking Sites by adolescents. Some of these studies are discussed in this article.
[Keywords : Adolescents, Social networking sites, New media, Communication]
1. Introduction
Effective communication is an important life skill that enables us to better
understand and connect with the people around us. It allows us to build respect
and trust, resolve differences and foster environments where problem solving,
caring, affection and creative ideas can thrive. Everybody in the society lives as a
CONTEMPORARY SOCIAL SCIENCES, Vol. 26, No. 3 (July-September), 2017
* Research Guide, Faculty of Mass & Media Communication, Mewar University, Chittorgarh,Rajasthan (India) E-mail: <[email protected]>
** Research Scholar, Faculty of Mass & Media Communication, Mewar University, Chittorgarh,Rajasthan (India)
community and man is a social animal says Aristotle. After a child takes birth the
process of communication starts in his life and continues throughout the life-cycle.
Since prehistoric times, significant changes in communication technologies have
evolved with shifts in political and economic systems, and by extension, systems of
power. Communication can range from very subtle process of exchange, to full
conversation and mass communication. Human civilization which started
communication with cave painting has now reached to a computer-mediated
communication. Earlier, our communication was limited to our family, friends,
relatives, colleagues and neighbours. We used to share our day to day happenings,
happiness and sorrow in a limited social circle. Slowly and gradually when moreand more people got educated and started shifting to different places in search of
employment their communication and contact with each other attained a
paradigm shifts from personal communication. People started using different
means of communication to get in touch with their near and dear ones. They used
mediums like letters, telephones, e-mails to be in touch. Due to all these inventions,
the world shrunk into a global village. The invention of technology has indeed
made a great impact on society and especially on the younger generation. Internet
has become an important part and parcel of adolescents and they use it in
developing their skills, chatting, surfing etc. Computer became an incredible tool
in the world of communication. Today, our friendship circle has widened across
the globe and we don’t hesitate sharing and exchanging of ideas and feelings with
anyone. The boundaries of caste, sex, colour and creed no more matters. Internet
has indeed made the world a small place and living life easier. The manner in
which written text appears on the computer screen has some similarities with
newspaper, magazines and books. The rapid progress of technology has made it
possible to access the internet from anywhere through plenty of means.
The most effective role of shrinking world goes to Social Networking Sites.
The users of these sites are increasing day by day. The rapid change in the field of
communication took place by the use of Social Networking Sites as a platform ofcommunication. Social Networking Sites have been instrumental in shrinking the
world more than other technological developments. Social Networking Sites like
Facebook, Google+, LinkedIn, Youtube etc are becoming more and more popular
and has become an important part of everyday life for an increasing number of
people. The features and facilities provided by these sites are attracting more and
more young people towards them. According to Mcmillan and Morrison (2008)
Modem, broadband, wireless and satellite, a synchronous email, instant
messaging, and convergence through multimedia, students have grown up
socialized into a world shaped by the Internet and brandish native and latent
intuitions and understandings of internet technology unknown to previous
generations.
The arrival of New Media has changed the entire spectrum of socio-
technological possibilities for communication. It is yet too early to predict how far
104 Pirshant Kumar and Deepika Verma

Social Networking Sites and Adolescents 105
and fast the process of change will occur. The trend of old media was
‘de-massification’ as the proliferation of channels and platforms but the new media
replaced it with innumerable small and more ‘specialized’ audiences. The new
media and the Internet in particular have made the idea of the ‘personal
newspaper’ (the so called Daily-me), in which content is assembled according to
the individual taste and interest. The new media is in fact a disparate set of
communication technologies that share certain features apart from being new,
made possible by digitalization and being widely available for personal use as
communication devices. New media is generally greeted with intense interest,
positive and even euphoric expectations and predictions, and a general overestimation of their significance (Rossler, 2011).
2. Social Networking Sites
A Social Networking Site is a dedicated website or other application whichenables users to communicate with each other by posting information, comments,message, images etc. It is a platform to build social networks or social relationsamong people who share interests, activities, backgrounds or real-life connections.A Social Networking Site consists of a representation of each user, his or her sociallinks, and a variety of additional services. Social networks are web-based andprovide means for users to interact over the Internet, such as e-mail, and instantmessaging. These are varied and they incorporate new information andcommunication tools such as mobile connectivity, photo/video sharing andblogging. Online community services are sometimes considered as a socialnetwork service, though in a broader sense, social network service usually meansan individual-centred service whereas online community services are group-centred. Social networking sites allow users to share ideas, pictures, posts,activities, events, interests with people in their network. Internet and digitalcommunication technology have created an enormous opportunity for people ofall ages including student community to contribute and accumulate information.With increasing Internet penetration and concomitant rise in new/digital mediause, the use of social media and more precisely, the Social Networking Sites (SNSs)has increased substantially.
3. Social Networking Sites and Adolescents
There are many features that attract the youth towards the Social Networking Sites. Chief among them are instant messaging, profile setting/building, photosharing, propagating some social, political or cultural cause etc. SNSs havedramatically taken off globally since 2006 and have empowered hundreds ofmillions of users to share content among online communities and create an Internet society. It has been found that nearly two-thirds of all active Internet users havespent time managing a social networking profile and 71.1% have visited friends’social network pages (Universal McCann, 2009). Internet and digital

communication technology have created an enormous opportunity for people ofall ages including student community to contribute and accumulate information.People are getting connected to each other through emails, chat rooms, socialmedia platforms like Facebook, Twitter, Blogs etc. Internet and digitalcommunication technology have also made it possible for users to avail onlinebanking, shopping as well as e-library facilities. In US and Europe, college students avail the internet and digital communication technology to the maximum toacquire and share information (Rotszein, 2003). In India, the popularity of thismedium among the college students has largely been restricted to connecting withfriends, relatives and searching for higher education institutions.
SNSs offer adolescents new opportunities as well as new challenges to
express to the world who one is. In one-on-one communications within SNSs (e.g.,
“Facebook messages”), adolescents can express their likes and dislikes as well as
their worldviews and get immediate feedback. With SNSs, adolescents express
their views and the recipients of this information include both known as well as
unknown targets. Although there has been variability over time in the specific
format of SNS profiles, adolescents have the option of choosing what self-
identifying information to provide. Thus, with the advent of these SNSs, most
adolescents will widely share, with varying degrees of accuracy, honesty, and
openness, information that previously would have been private or reserved for
select individuals. Key questions include whether adolescents accurately portray
their identities online, and whether use of SNSs might impact adolescents’ identity
development.
As per Internet and Mobile Association of India (IAMAI) report released in
November 2015, while Internet in India took more than a decade to move from 10
million to 100 million and 3 years from 100 to 200 million, it took only a year to
move from 300 to 400 million users. Currently, India has the third largest internet
users’ base in the word but it is estimated that very soon India will overtake the US
as the second largest Internet users’ base in the world. Further, 32% of the users are
college going students followed by 26% young men. With the present
government’s priority agenda to connect every village in India with the Internet
facilities in the next 5 years, a communication network expansion and its use is
expected to witness a quantum leap.
4. Literature Review
This literature review examines how SNSs intersect with and impact
adolescents’ social and identity development. There also are several important
topics in the SNS literature that deserve brief mention because of their relevance for
adolescent development but are outside of the scope of this paper. Specifically,
these topics include cyberbullying, the Internet and parent-child relationships,
Internet addiction, and the impact of SNSs on sleep and academic performance.
106 Pirshant Kumar and Deepika Verma

Social Networking Sites and Adolescents 107
The majority of adolescents today have Internet access, with some youth
reporting up to 10 hours of media use per day. A popular online activity for
adolescents is creating and maintaining personal profiles on SNSs. SNSs are Web
sites that allow users to share information about themselves and their lives with
large groups of people. Members are able to create a profile with demographic
information as well as interests and hobbies, upload pictures and videos, join
groups about topics they are interested in, post comments (called status updates)
about recent events, communicate with friends via e-mail or instant messages, and
link their profiles with others in a process referred to as friending. For adolescents,
SNSs are an important medium for self-expression, communication with friends,and peer feedback. One study reported that 73% of teens between ages 12 and 17
owned an SNS profile, whereas another study found that 22% of teenagers log onto
their favorite SNSs more than 10 times per day. Even younger children are
participating in SNS activities; one study found that 20% of youth ages 8 to 10 used
an SNS daily.
There are many studies around the world which reflect the social and cultural
dimensions of SNS use by the youth. Asilo et al (2010) in their research titled “The
Influence of Social Networking Sites on the Interpersonal Relationships of
Rogationist College Students” explores how today the importance of Social
Networking Sites is increasing. Many SNS developers like Facebook, MySpace,
Twitter and others are competing to give the best features in terms of socialization,
interaction, privacy and even entertainment. The main objective of this study was
to determine the effects of SNS to the interpersonal relationships. It focused on
analyzing the level of interpersonal relationships. The study found that people
developed virtual interpersonal relationships through SNS.
Valkenburg, Peter and Schouten (2006) tried to investigate the impact of
Social Networking Sites on adolescents’ self-esteem and well-being. The survey
was conducted amongst a group of 10-19 years old who had an online profile on a
Dutch Social Networking Site. The study found that the frequency with which
adolescents used the site had an indirect effect on their social self-esteem andwell-being. Positive feedback on the profiles enhanced adolescents’ social
self-esteem and wellbeing, whereas negative feedback decreased their self esteem
and well-being. A study into the use of Social Networking Sites, in particular
Facebook was conducted by Charnigo and Barnett-Ellis (2007). They surveyed a
number of librarians, some of whom were in favour of Facebook being used in
libraries to promote services and events, while majority of librarians were not in
favour of Facebook having a presence in libraries. This study may be an indication
that the use of Social Networking Sites decreases as age increases. These studies
seem to indicate that younger people are more likely to utilize SNS’s than older
people, although no literature could be found to support this proposition. What is
evident from the literature is that young people tend to use SNSs to interact with
their peers, as well as to meet new people.
In a study on Social Networking Sites, Preeti Mahajan (2009) tried to look at
impacts of SNS on Indian society, through linguistic and cultural perspectives. The
article titled “Use of social networking in a linguistically and culturally rich India”
describes some of the top Indian SNSs and pinpoints some instances where people
have used such sites to raise their voice against the bad elements harming popular
culture. The study says that Indians are using the power of social networking sites
like Facebook to combat a rising vigilantism against activities which certain groups
feel are not in keeping with the spirit of Indian culture. Study says that social
networking sites enable us to stay connected despite the hindrances of distance and
time. That is why their popularity and utilization has increased manifold and willcontinue to increase in future. However, every coin has two sides and same is true
of social networking as well. Some people make good and worthy use of it while
others misuse it. Hence, its impact on the country’s social and cultural values is
debatable as some Indians find it a threat while others feel that this is not the case.
Sonia Livingstone (1998) in her article titled “Taking risky opportunities in
youthful content creation: teenagers’ use of social networking sites for intimacy,
privacy and self expression” places the SNSs in the contemporary virtual
environment of the web.
Livingstone concludes that teenagers are playing and experimenting with
their identities within social networks and for them “self actualization increasingly
includes a careful negotiation between the opportunities (for identity, intimacy,
sociability) and risks (regarding privacy, misunderstanding and abuse) afforded
by internet-mediated communication” and thus the strategies of representing the
self vary considerably. She added that the young relished the opportunities to play
and display, continuously recreating a highly-decorated, stylistically-elaborate
identity, wherein older teenagers expressed a notion of identity lived through
authentic relationships with others. In yet another study, Michele Ybarra and
Kimberly Mitchell (2004) attempted to look at the places online where youth are
most likely to experience sexual solicitation and harassment. The researchersfound that among 1600 children and adolescents surveyed nationally, 4% reported
experiencing an unwanted sexual solicitation and 9% reported being harassed
while on a social networking site. However, solicitations were reported 59% more
often in instant messaging, and 19% more often in chat rooms than social
networking sites. More surprising, harassments were reported 96% more often in
instant messaging than in social networking sites.
Lenhart and Madden (2007) in their study, “Social Networking Websites and
Teens”, said that in the past five years, social networking has rocketed from a niche
activity into a phenomenon that engages tens of millions of Internet users. The
study proposes that online social networking profiles posted by adolescents
contain intimate, candid, and observable self-disclosure and peer interaction that
can be analyzed creating an overall picture of adolescent behaviour, highlighting
specific areas needing additional research, and addressing implications for
108 Pirshant Kumar and Deepika Verma

Social Networking Sites and Adolescents 109
parental monitoring and intervention. Lehnhart and Madden state that fifty-five
percent of teenagers use and create online social networking profiles. They opine
that with more than half of teenage internet users interacting online, the concept of
blogging is a salient research topic investigating what adolescents are blogging
about, how they are socially interacting, and what potential effects this phenomena
may have on other dimensions of their lives. Subrahmanyam and Lin (2007) in their
study suggest that youth spending on data services represents almost 50 percent of
all mobile spending in most mature markets. Not only are youth the early adopters
of most new technologies, they are also among the more sophisticated users of it as
well. In fact, Livingstone and Bober (2004) have coined the term ‘reversesocialization’ to characterize the shifting nature of socialization that occurs in many
families, as teenage children are often more knowledgeable than their parent about
these technologies. The research also finds that among adolescents,
communication is the most important use of the Internet and the popular
communication applications include e-mail, instant messaging (private,
one-on-one, text based conversations), chat rooms (communication systems that
allow text based conversation among multiple users), and the newest craze social
networking sites including blogs.
5. Conclusion
Technology has left nobody untouched but adolescents are the early adopters
of technology. They use SNS for education as well as entertainment purpose.
Although there are many pros and cons of using SNS but if used in a proper and
limited way fruitful results can be attained. The positive role of SNS is providing a
better platform for discussion to be in touch with friends and relatives far away
from us, to share educational topics etc. The negative effects of using such sites are
when used excessively they can be source of killing time. Online friendship with
unknown people and sharing personal details with them can be a cause of danger
for adolescents. Thus, if the users are not aware of the security features then
friendship with unknown people led them in trouble. However, every coin has two
sides so the reason of SNS usage as well as the usage pattern totally depends upon
the user.
References
1. Asilo, John Manuel C.Manlapig, Justine Angeli P.Rementilla, Jerremiah Josh R(2010).
The Influence of Social Networking Sites on the Interpersonal Relationships of
Rogationist College Students. Available at: http://www.scribd.com/doc/27327211/
The-Influence-of-Social-Networking-Sitesto-Interpersonal - Relationships-of-the-Stud
ents-of-Rogationist-College-High- School-Department-S-Y-2009-2010#scribd
2. Charnigo L. and Barnett-Ellis P., “Checking Out Facebook.com : The Impact of a Digital
Trend on Academic Libraries”, Information Technology and Libraries, 26(1), 2007,
23-33.

3. Castells M., Ardevol M. F., Quiu J. L. and Sey A., Mobile Communication and Society : A
Global Perspective, Cambridge MA. : MIT Press, 2007, 7.
4. IAMAI Press Release - 17 November, 2015. India To Cross 400 Million Internet Users By
Dec’15. Available at: http://www.iamai.in/media/details/4486
5. Lenhart A. and Madden M., Social Networking Websites and Teens, Washington, D.C.:
Pew Internet and American Life Project, 2007.
6. Livingstone Sonia, “Relationships between Media and Audiences”, Liebes, T. and
Curran, J. (eds.), Media, Ritual and Identity, London, New York : Routledge, 1998.
7. Livingstone, S. and Bober, M. (2004). UK Children Go Online: Surveying the experiences
of young people and their parents. Available on: http:// www.york.ac.uk/res/e- 621
society/projects/1/UKCGOsurveyreport.pdf.
8. Mahajan P. (2009). Use of social networking in a linguistically and culturally rich India.
Available at: http://www.sciencedirect.com/science/article/pii/S1057231709000290
9. Rotszein, B. (2003). Problem Internet use and locus of control among college students:
preliminary findings. Available at: http://www.brianrotsztein.com/downloads/
internetresearch.pdf
10. Subrahmanyam K. and Lin G., “Adolescents on the Net : Internet Use and Well-Being”,
Adolescence, 42(168): 2007, 659- 677
11. Universal McCann (2009) Power to the People- Social Media Tracker Wave 4. Available
at: http://universal-mccann.bitecp.com/wave4/Wave4.pdf (accessed on 15 March
2013).
12. Valkenburg P. M., Peter J. and Schouten A.P., “Friend Networking Sites and Their
Relationship to Adolescent’s Well-Being and Social Self-Esteem”, Cyber Psychology &
Behavior, 9(5), 2006, 584-590. ê
110 Pirshant Kumar and Deepika Verma
Article Received on June 30, 2017; Accepted on August 30, 2017

11
Implementation of Governance
Reforms in Punjab : Delivering
Services with Citizen Centric
Approach
Meenakshi Madaan*
The idea of that quality governance reforms contribute to improved human well-being andsustained development has gained widespread recognition during the recent past. It is also widelyacknowledged that governance reforms can be immensely useful in raising the efficiency ofgovernment functioning and improving public service delivery. Several governance reformsprojects are being run across the country by various agencies both public and private sector.However, in spite of such efforts, there remain areas of concerns affecting the performance ofgovernance reforms in the service delivery. Among others, prominent areas are : lack of citizencentric approach in identifying citizen’s requirements, portal design, process design, IT systemarchitecture, inadequate capacity, lack of responsive machinery and work culture. For achievingoptimal benefits of governance reforms, a citizen-centric approach to service delivery is essential.This approach will enable governments to achieve essential efficiency gains and improve servicedelivery levels, raise citizen satisfaction with government services, and enhance quality of life. Inthis paper an attempt has been made to provide framework for citizen-centric governance and ananalysis has been made regarding the implementation of citizen related components of ongoinggovernance reform measures in Punjab. The study based on the field visits conducted in twodistricts, interactions with officials (relating to selected departments) and citizens, reveals a
CONTEMPORARY SOCIAL SCIENCES, Vol. 26, No. 3 (July-September), 2017
* Department of Public Administration, Panjab University, Chandigarh, UT (India) E-mail:<[email protected]>

number of positive impacts but a few shortcomings too for which a few suggestions have beenmade.
[Keywords : Citizen Centric, Governance reforms]
1. Introduction
In the current globalized scenario, we are witnessing an increased concern
towards the matter of ‘governance’. The issue of governance and administration
has become the focus of attention in recognition of the fact that good governance is
necessary for ensuring success of development schemes, bringing improvements
in the quality life for citizens, eradicating poverty and for realization of the goals of
equity and equality enshrined in our Constitution. With rapid and fundamental
changes taking place in the political, economic and technological fields, the need
for major reforms in our system of governance have assumed greater urgency.1
Therefore it is also pertinent that the managerial orientation which is making way
into the domain of Public Administration with thrust on economy, efficiency and
effectiveness is also emphasizing the pursuance of governance for development by
the government. This is a global phenomenon, an approach to development is now
acquiring a new holistic orientation, integrating economic aspects, political
elements and social process.2 The human dimension to development based on
accountability, responsiveness, decentralization and empowerment is gaining
importance. It is being increasingly realized that governance for development has
to orient towards building and strengthening human capacities and capabilities
and creating a conducive environment that fosters individual dignity, equality and
achieving sustainable human development. This calls for unfolding various issues
of concern in governance and devising suitable strategies for human governance.3
Over a period of time a large number of processes and instrumentalities have
been brought into existence by the political and administrative system for
performing its regulatory and developmental roles perfectly with every change in
the society, the state has been coming forth with relevant mechanisms, doing
justice to its basic obligations. The society with its dynamism and constant efforts
towards attaining betterment and excellence in life style has been undergoing
considerable changes. During the last century, the focus on technological
innovations has brought forth a lot many developments in number of areas. The
post modern society is also witnessing a considerable increase in the rate of literacy
and awareness among a sizeable number of populace. Consequently there is a
substantive rise in the expectation level of the citizens. The state has to adhere to the
rights of the people, provide suitable living environment, maintain micro
economic conditions, maintain the public health standards and provide safety,
security to all, besides mobilizing and utilizing resources for essential public
service to be provided, and above all maintaining law and order, security and
social harmony. The government is supposed to undertake its role obligations in a
112 Meenakshi Madaan

Implementation of Governance Reforms in Punjab 113
way which not only satisfies the citizens but also puts the political system on the
developmental path, in keeping pace with the changes taking place in the
contemporary society. It is being felt that good governance is good government.
2. Need for Reorientation of Governance System in Punjab
A stark reality is that Punjab, State has not been in a position to sustain the
tempo of its development process from last two decades. Where does the fault lie?
One could single out the ‘lack of good governance’ as the real malefactor. A
populist political culture, not-so-efficient, bureaucracy, sagging work culture, lack
of necessary respect for law, and above all, systemic corruption are among the
parameters describing such situation. The malady may be nationwide but there is
no reason why a progressive state like Punjab should have fallen in line.
How to rectify the situation? How to reinvent the government? What does
good governance involve? In the final analysis, it stands for conduct of the affairs of
the state in such a manner that it enhances the creditability of those who are at the
helm of affairs at each level; is cost and time-effective in responding to the needs
and aspirations of the people; and has civil society as its cherished goal. In addition,
it has to promote economy, ensure equity, enhance ecology and provide security to
the general masses.
The state should consider some of the important observation in context to the
above stated situation that Firstly, the concept of governance is not understood
properly in developing countries, where it is equated with the idea of ‘Control’.4
Governance is a process by which ‘a society solves its problems and meets its needs
by using government as an instrument’. With government at the core, it also
encompasses the role of the private sector, non-government organizations and
individual households, and thereby involves people in its functioning in a variety
of ways. This contemporary liberal meaning of governance must be made a part of
popular understanding. Secondly, the mindset of the personnel in the conduct of
governance is also to be transformed. They must not project themselves as
providers and benefactors, as they have been doing so far. They have to be in the
service of the people and for that they have to take some new lessons. The most
important learning would be that ‘good governance’ is driven by some grand
mission rather than by rigid rules and regulations. It decentralizes any activity
requiring management and pre-empts problems before these arise; and empowers
citizens in terms of control over their affairs and treats them as patrons by offering
choices between a variety of services’. Finally, the people at large must realize that
‘good governance’ is their right, rather than a gift from the state.5 Therefore the
Punjab government has felt the need of populace and made efforts to bring
revolutionary change in the governance reforms process by initiating various
reforms in different departments and make administration more citizens friendly.

3. Citizen Centric Approach in Service Delivery
As it has been already discussed that India is a democratic republic and the
philosophy of justice, equality, liberty and fraternity are enshrined in her
Constitution. It has an elaborate legal framework and institutional structures
underpinned by the Constitution which articulate the vision of a welfare state and
by implication provide for creation of a citizen centric governance structure.
Consequently citizen centric governance with the aim of ensuring citizens welfare
and citizens satisfaction, is critical for any government, which aims to provide
good governance.6 One of the ways of ensuring citizen centric government is by
actively engaging them in framing policies that influence them. However, since
independence public participation in policy making has been minimal.
Government has taken initiatives which were process and procedure centric and
generally a top down approach was used in policy making. In addition, the
country, given its vast size, federal structure of governance with over 2.4 lakhs
local governance institutions and large population coupled with its other
complexities viz multi-cultural, multi-ethnic, multi religious and multi-lingual
society, did not make itself amenable to large scale public participation in policy
making. Efforts have been made at several levels including the creation of
Panchayati Raj institutions, seeking civil society inputs in implementation of large
projects, legislation of RTI Act etc. But it was very difficult to consult all
stakeholders in any project.7
In early 1990s, two changes swept across the world that were on good
governance with increasing non government participation in delivery of public
services and Information Communication Technologies which has potential to
connect everyone in real time. The concept of e-Government or e-Governance has
born through the amalgamation of these two. e-Governance marked a paradigm
shift in the process of governance citizen centricity instead of process centricity and
large scale public participation through use of ICTs.
India also did not remain untouched the changes which were sweeping
across the world. Several e-Governance projects across the country were
implemented that focused on improving public service delivery, bringing greater
transparency in government processes and ensuring more effective accountability.
The National e-Governance Plan (NeGP), based on the learning from these projects
was approved in May 2006 and comprises of 31 Mission Mode Projects (MMPs)
and 8 Components with a vision to “Make all Government services accessible to the
common man in his locality.” The cornerstones of NeGP are citizen centricity,
identification of services, centralized planning, decentralized implementation and
Public Private Partnership (PPP).
As far as e -governance projects are getting implemented, an increasing need
has been felt for wider and deeper participation of all stakeholders especially
114 Meenakshi Madaan

Implementation of Governance Reforms in Punjab 115
public at large to ensure effective citizen centric approach should be maintained in
all projects. To enable and support this goal, a Citizen Engagement Framework for
e-Governance Projects has been developed for all government agencies.8 Therefore
it is quite significant to assess the citizen’s perception regarding governance
reforms.
4. An Assessment of Research Paper
In the research paper, both primary and secondary method of data collection
is used. Information is collected from 300 citizen respondents drawn from Muktsar
and Mohali district of Punjab. Interview method was used to collect the data from
the citizen respondents with respect to the services they were availing from the
department of Transport and department of Food and Civil Supply and Consumer
Affairs.
In order to strengthen and facilitate the assessment based upon primary , the
secondary data was collected from books, academic journals, case studies,
newspapers, magazines, government reports, recommendation of ARC I and ARC
II and recommendations of Punjab Governance Reforms Commission.
Primary data is based on few parameters. The first parameter is readiness
among officials regarding implementation of reforms. The second parameter is
regarding level of competency among officials in implementing governance
reforms. The third parameter is availability of time for delivery of services. The
fourth parameter is feedback mechanism and the last parameter is grievance
redressal mechanism. All these parameters are integral to analyses the extent of
implementation of governance reforms in Punjab and their impact on citizens.
4.1 Readiness among Officials regarding Implementation of Reforms
During the last 10-15 years, governments from all over the world have tried to
take advantage of Information Technology (IT) in general and the Internet in
particular to improve governmental administration and communication with their
citizens. IT offers the opportunity for the government to better deliver its
information and services and to interact with all its citizens, businesses, and other
government partners in a more effective manner.9 E-government offers the
potential to bring citizens closer to their governments, and regardless of the type of
political system in the country, the public benefits from interactive features that
facilitate communication between citizens and governments.10 Adoption of
e-government has increased in most countries but at the same time the rate of
adoption or readiness varies from country to country.
The survey revealed that 93.33 percent of citizen respondents felt that there
was a need for governance reforms in different government departments whereas
6.67 percent of the citizens did not respond in this regard. The study also showed
that 40 percent of the citizen respondents were of view that employees in different

departments were moderately willing towards new reforms, whereas 33.3 3
percent were fully willing and 6.67 percent of employees were lowly willing. The
average weightage score (3.99) also indicates that majority of officials were willing
towards new reforms. As far as seriousness of officials is concerned 40 percent of
the citizen respondents felt that employees in different departments were
moderately serious towards reforms ,However 26.67 percent of the citizens were of
opinion that they were fully serious, while 20 percent were of the opinion that they
were somewhat serious and 13.33 percent were of opinion that they were lowly
serious. The average weightage score (3.79) also indicates that majority of officials
were serious towards reforms.
The sub parameter positive attitude tested for the study clearly depicts that
76.67percent of the citizen respondents were of opinion that employees were
having positive attitude towards reforms, whereas16.67 percent of the citizens
responded negatively and 6.67 percent were did not respond in this regard. It has
been also found during the survey that around 3/4th of (75 percent) of citizen
respondents were of the opinion that employees were ready to share extra burden
,whereas 13.33 percent of citizens were of opinion that they were not ready to
share extra burden and 11.67 percent of the citizens did not respond in this regard.
4.2 Level of Competency among Officials
Human assets are one of the most important resource available to any
organization and employee competence and commitment largely determine the
objectives that an organization can set for itself and to its success in achieving them.
Competent employees are the main resource of any organization in acquiring a
competitive advantage. Land, buildings or materials do not yield organizations
productivity, rather, it is ‘people capital’ that runs a business and produces value
from existing resources point out that an organization’s best source of competitive
advantage lies with its employees. Strategies, business models, products and
services can all be copied by competitors, but talented and competent employees
represent a sustainable source of differentiation. The demand for effective and
competent employees continuously increases in both public and private
organizations because a dynamic global marketplace and increasing foreign
competition has compelled organizations to become more effective and flexible in
response to the rapidly changing environment.11
The assessment of level competency among officials to implement
governance reforms was undertaken on these parameters , strength of manpower,
capability of employees, awareness and expertise in use of Information
Technology and level of proficiency. The study clearly depicts that 53.33percent of
citizen respondents were fairly satisfied with the strength of manpower, while
16.67 percent were highly satisfied, However 26.67 percent of the citizens were
neutral and 3.33 percent of the citizens were dissatisfied. The average weightage
116 Meenakshi Madaan

Implementation of Governance Reforms in Punjab 117
score indicates (3.83) that majority of the citizens were satisfied with the strength of
manpower.
The study also revealed that 40 percent of the citizen respondents were of the
opinion that the employees were moderately capable ,whereas 26.67 percent of the
citizens were of opinion that they were fully capable, while 20 percent of the
citizens were of opinion that they were somewhat capable and 13.33 percent of the
citizens were of the opinion that they were lowly capable. The average weightage
score (3.79) also indicates that majority of employee were capable.
As far as their awareness and expertise in using information is concerned
53.33 percent of the citizen respondents were of the opinion that they were
moderately aware and expert in use of information technology, while 16.67 percent
were of the opinion that the officials were fully aware and expert, However 26.67
percent of the citizens were of opinion that the officials were somewhat aware and
expert and 3.33 percent of the citizens were of view that the officials were not at all
aware and expert. The average weightage score (3.83) indicates that the majority of
officials were aware and expert in use of Information Technology.
As far as proficiency of officials are concerned 46.67 percent of the citizen
respondents were of the opinion that the officials were moderately proficient
,whereas 40 percent of the citizens were of opinion that the officials were fully
proficient while10 percent of citizens were of opinion that they were somewhat
proficient and 3.33percent of the citizens were of the opinion that they were lowly
proficient. The average weightage score (4.23) indicate that majority of officials
were proficient
4.3 Availability of Time for delivery of Services
The government shall endeavor and encourage all the departments and
authorities of the government to enter by mutual understanding to deliver their
respective citizen related services in a stipulated time period as part of governance
reforms. Timing for availing services by any service user is a very important
determinant in the overall customer satisfaction regarding the quality of service.
How much time a service provider takes for providing services. Are the service
users satisfied with the timing for availing services through governance reforms
initiative? The assessment of time availability/stipulated time for services was
undertaken on following parameters i.e. Provision of stipulated time for service,
Availability of services in stipulated time.
The survey clearly depicts that 76.67 percent of the citizen respondents were
of the opinion that there was a provision of stipulated time for availing services,
whereas 18.33 percent of the citizens did not respond in this regard and 5 percent of
citizens responded negatively. In addition to this 75 percent of citizen respondents
were of the opinion that they get the services in stipulated time, whereas 13.33

percent of the citizen did not responded in this regard and 11.67 percent of the
citizens responded negatively.
4.4 Feedback Mechanism
Administrator have substantial control over the conditions under which
organizational personnel perform. They control the resources; they coordinate
personnel activities. Their decisions go far toward determining the organization’s
success in reaching its professed objectives.12 Despite this responsibility,
administrators are continually faced with the necessity of performing their roles
without adequate information about the consequences of their decisions regarding
the organization’s procedures and programs of activities. Particularly in those
organizations dealing with relatively intangible products and goals, the feedback
mechanism is essential to rational decision making process.13 The assessment of
citizen perception regarding Feedback mechanism in different departments was
undertaken on following parameters i.e. provision of feedback mechanism in
department, media of feedback, nature and content of feedback implementation of
feedback.
The survey showed that 78.33 percent of citizen respondents were agreed that
there was provision of feedback mechanism, whereas 8.33 percent of the citizens
were agreed that there was no such provision of feedback mechanism and 13.33
percent of the citizens did not respond in this regard. In addition to this 56.67
percent of the citizen respondents share their feedback through Personal visit/
Telephone, whereas 40 percent of the citizens share their feedback through emails
and 3.33 percent of the citizens through letters. It has been also come to light during
the survey that the majority of 60 percent of the citizen respondents gave their
feedback regarding procedural changes, whereas 33.3 percent gave feedback
regarding stipulated time. delivery and 6.67 percent regarding behavior of the
official.
As far as implementation of feedback is concerned 75 percent of citizen
respondents were of the opinion that the feedback given by them was being
implemented by officials, whereas 8.33 percent of the citizens were responded
negatively and 16.67 percent of the citizens did not respond in this regard .
4.5 Grievance Redressal Mechanism
Grievance has been defined as indignation or resentment arising out of a
feeling of being wronged. IS 15700 : 2005 defines ‘grievance’ as an expression of
dissatisfaction made to an organization related to its products, services and/or
processes, where a response or resolution is explicitly or implicitly expected.14 A
grievance is thus any sort of dissatisfaction, which needs to be redressed. It can be
real or imaginary, legitimate or ridiculous, rated or unvoiced, written or oral; it
must however, find expression in some form or the other.15 Grievance redressal
mechanism is part and parcel of the machinery of any administration. No
118 Meenakshi Madaan

Implementation of Governance Reforms in Punjab 119
administration can claim to be accountable, responsive and user-friendly unless it
has established an efficient and effective grievance redressal mechanism. In fact,
the grievance redressal mechanism of an organization is the gauge to measure its
efficiency and effectiveness as it provides important opinion on the working of the
administration. The assessment of citizens perception regarding grievance
redressal mechanism was undertaken on following parameters i.e. awareness
about grievance redressal mechanism, nature of grievance, grievance redressed.
The survey showed that 70 percent of the citizen respondents were of the
opinion that they were aware about the provision of grievance redressal
mechanism, whereas 6.67 percent of the citizens responded negatively and 23.33
percent of the citizens did not respond in this regard. The survey also depicts that
majority of 63.33 percent of citizen respondents were having grievance related to
procedural clarifications, whereas 16.67 percent of the citizens were having
grievance related to timely delivery of services and 20 percent of the citizens
related to behaviour of officials.
In spite of so many grievances related to various issues, 75 percent of the
citizen respondents were of the opinion that their grievances were redressed
,whereas 11.67 percent were of the citizens did not respond in this regard and 8.33
percent of the citizens said that their grievances were not redressed.
6. Concluding Observations
In theory and practice of the process of innovations in public administration
is considered as ongoing process and ongoing transformation. As an ongoing
process, the public administration innovation includes decentralizing of public
administration, simplifying of procedures, improvement in service delivery and
improvement in human resource developments. Therefore, the innovation process
includes mechanism that will ensure public sector transparency and
accountability.
Due to globalization process and technological innovation, citizens in many
countries began seeking more advanced public services from their governments. A
strong accountability between citizens and the government is a crucial prerequisite
for public administration innovation that is achieved through the use of variety of
political, economical, legal and administrative instruments designed to prevent
corruption and ensure that public officials are responsible and accessible to the
citizens they serve.
The revolution of ICT also influences the citizen’s relation with the
government through improvement of service delivery in one hand and
communication on the other hand. The intention to improve the relationship
between government and citizens is a key element in the present scenario. By
building confidence in government and providing better public policies, the
government’s legitimacy gets enhanced.

Therefore, political leaders and administrators try to bring measurable and
verifiable improvements in the quality of services and governance, by imple-
menting unique ideas and distinctively new approaches to enhance the role of
citizens, seek their involvement and participation in policy-making and program
implementation, facilitate and foster democratic processes and functioning,
synergize geographical, social and cultural conditions obtaining locally, create
productive assets of lasting nature, and institute imaginative public private
partnerships for more efficient and effective realization of public purpose aims and
objectives.
The above giving analysis of implementation of governance reforms, citizens
perception and their satisfaction highlights that participation of citizens in
governance is one of the important characteristic of good governance. Due to this
deliberative nature of citizen participation, more voices are involved in the
decision-making process. This leads to more informed, rational decisions due to
the variety of ideas and point of views that are exchanged in the process. This also
leads to a decision that is more publicly oriented as compared to a decision that
may be taken with the one sided knowledge of an individual’s self-interest.
However during the research different citizen’s perception came to light towards
governance reforms such as citizen’s awareness level, perception towards
readiness, competency, feedback mechanism grievance redressal mechanism and
some other related aspects.
As far as the awareness level of citizens is concerned, their perception was
quite different from officials of these concerned departments. Most of them were
not aware about the uniqueness of Punjab Governance Reforms Commission and
its recommendation, but on the other hand they were content with the changes,
they felt during availing services in different departments which made their life
easy and now they need not to grease the palm of officials for their administrative
work.
Discussions with citizens revealed that they felt a great need of reforms in
different departments because they wanted to get rid off from old administrative
work culture, However their perception regarding willingness of officials towards
reforms, seriousness, willingness towards new procedural changes was quite
moderate.
It has been found during the survey that the citizens indicated their
satisfaction regarding strength of manpower available in different departments for
carrying out reforms process, However they were quite capable in their core areas
and were well versed in using information technology for delivery of different
services.
Interactions with citizens perceived that officials were well aware about the
new procedures for providing different services, Moreover there was a provision
of display boards indicating various procedure to be followed for availing services
120 Meenakshi Madaan

Implementation of Governance Reforms in Punjab 121
and their cost .Citizens were of the view that they have seen a change in bribe
culture, Now a middle man can also avail the services in a hassle free manner,
without paying bribe to officials.
The assessment of citizens perception regarding stipulated timely delivery
revealed that there was a provision of stipulated delivery in both departments in
correspondence to all the services and most of them were getting their services in
stipulated time which is mentioned on the form.
The assessment of citizens perception regarding feedback mechanism
perceived that there was a provision of feedback mechanism in both the
departments and citizens generally share their feedback by meeting the concerned
official in respective department.
Good governance is an essential ingredient for socio-economic development
of the country. It implies utmost concern for people’s welfare, wherein the
government and its bureaucracy follow policies and discharge their duties with
deep sense of commitment, respecting the rule of law in a manner which is
transparent, ensuring human rights, dignity, probity and public accountability
However discussions with citizens revealed that they had seen a drastic change in
the departments, Officials have become accountable to general masses. Moreover
with the introduction of Right to Service Act, citizens were entitled with the right to
timely delivery of services. The citizens are now treated as a valued customers by
the providers of public services.
Establishing a right based approach in Public service delivery not only
empowers citizens to demand services, but offers an opportunity to enable
government officials with a legal and technical framework for providing these
services efficiently. The move to make service provision legally binding on the
government displays a political will to make citizens active agents within
administrative processes rather than mere recipients of services.
References
1. M. Veerapa. Moily ,“Transforming Our System of Governance”, A Symposium on
Restructuring the Indian Civil Services, 2009 http://www.india-seminar.com/2009/
594/594_m_veerappa_moily.htm, accessed online on 15th August 2017.
2. Pardeep Sahni and Uma Medury, Governance for Development : Issues and Strategies,
New Delhi : Prentice Hall of India Private Limited, 2003.
3. Kulmani Padhi , “Strategies on Good Governance : A Case Study of Kerala , Karnataka
and Orissa”, 2005 accessed online 20th August 2017, http://odisha.gov.in/ emagazine/
Orissareview/may2005/engpdf/strategies_in_good_governance_ACSOKKAO.pdf
4. Gopal Krishan and Surya Kant, “Administrative Space”, J. S. Grewal and Indu Banga
(eds), Punjab in Prosperity and Violence, New Delhi : K. K. Publishers, 1998, 1-22.
5. David Osborne and Ted Gaebler, Reinventing Government : How the Entrepreneurial
Spirit Transforming the Public Sector, New. York : Addison Wesley Publishers 1992.

6. Government of India, Citizen Centric Administration - The Heart of Governance,
Twelfth Report, Second Administrative Reforms Commission, Department of
Administrative Reforms and Public Grievances, New Delhi : Ministry of Personnel,
Public Grievances and Pensions, 2009,
7. Government of India, Framework for Citizen Engagement in E-Governance, New Delhi :
Department of Electronics and Information Technology, 2012 (accessed online on 15th
August 2017).
8. Ibid.
9. H. Chen, “Digital Government: Technologies and Practices” , Decision Support
Systems, 34, 2002, 223-227.
10. D. M. West, “Report on Global E-Government”, Center for Public Policy, 2006 Brown
University, Rhode Island,http://www.insidepolitics.org/egovt06int.pdf (accessed on
line on 23rd August 2017).
11. J. Gould-Williams ,“The Importance of Human Resource Practices and Workplace Trust
in Achieving Superior Performance : A Study of Public-Sector Organizations”,
International Journal of Human Resource Management, 14(1), 2003, 28-54 (accessed
online on 18th August 2017).
12. W. Keith Warner and A. Eugene Havens , “Goal Displacement and the Intangibility of
Organizational Goals”, 1996 Paper presented at the Annual meeting of the American
Sociological Association, Minami Beach, Florida.
13. Frank D. Alexander, “A Critique of Evaluation”, Journal of Cooperative Extension,
Winter 1965.
14. Government of India, Guidelines for Implementing SEVOTTAM, New Delhi :
Department of Administrative Reforms and Public Grievances, Ministry of Personnel,
Public Grievances and Pensions, 2011.
15. http://www.meseb.gov.in/pfc/Vol%20-%205%20-%20Rev-2%20%20GRIEVANCE%
20REDRESSAL.pdf accessed online on 20th August 2017. ê
122 Meenakshi Madaan
Article Received on July 11, 2017; Accepted on September 10, 2017

12
Ethnicity and Land Ownership
in Nepal
Tika Ram Gautam*
Land has always been regarded as one of the important productive resources as well as
household assets in the history of Nepal. It has remained as an important socio-political issue in
the history of political-economy of Nepal. The issue of land was mainly discussed in terms of land
reform policies emphasizing on the redistribution of land in order to promote equality among
households and to manage land scientifically. The issue was further intensified and poverty and
exclusion among ethnic groups have also been discussed in relation to land. This paper, therefore,
attempts to examine the distribution of agricultural land among the ethnic groups in order to
analyze whether the distribution or access to agricultural land follows a particular ethnic line. It
explored facts, on the access to agricultural land among ethnic groups of Nepal, based on NLSS-3
(2010) data set with some statistical techniques such as mean, coefficient of variation, t-test and
F-test, which show that there is unequal access to agricultural land in terms of its size across
ethnic groups indicating both inter and intra-ethnic variation. However, observed mean
difference of landholding size among all ethnic groups does not significantly differ from the
national average except Madhesi. Importantly, Madhesis and Tarai janajati own significantly
larger size of agricultural land. However, there unequal access to agricultural land among ethnic
groups which neither follows a particular ethnic line nor inter ethnic inequality only, rather the
distribution reflects both inter and intra-ethnic inequality even after the long run politics of land
reform in Nepal.
[Keywords : Ethnicity, Land ownership, Inequality, Ethnic groups]
CONTEMPORARY SOCIAL SCIENCES, Vol. 26, No. 3 (July-September), 2017
* Associate Professor of Sociology, Central Department of Sociology, Tribhuvan University,Kathmandu (Nepal) E-mail: <[email protected]>

1. Ethnicity
The word ethnicity comes from the ancient Greek ethnos, which seems tohave referred to a range of situations in which a collectivity of humans lived andacted together, and which is typically translated today as ‘people’ or ‘nation’.Recently ethnicity has been taken as a matter of ‘peoplehood’ (Richard, 2008 : 10).
Wimmer (2008) defines ethnicity as “a subjectively felt sense of belongingbased on the belief in shared culture and common ancestry and this belief refers tocultural practices perceived as “typical” for the community, to myths of a commonhistorical origin, or to phenotypical similarities”. Therefore ethnicity represents the common sense of belongingness perceived in terms of identical physical featuresor cultural practices.
However, there could be other basis of uniting people in the common sense of belongingness such as territory or region. Territory or region has become one of the important bases of uniting people living in a certain region of Nepal in a commonsense of belongingness, such as Madhesi and Pahadiya, which is more territorialrather physical or cultural. One can easily find many such cases of ethnicityconstructed through territorial feeling here in Nepal as well at global level. Forexample, concepts like Baglunge or Parbate or Kaskeli or Syanjali or Jhapali and soon does not represent district as territorial boundary, but some sort of sense ofbelongingness with the district of Nepal. and galkote or bihunkote in terms ofcertain territory within district (Baglung), in the history of different communities of Nepal. Therefore, the concept of ethnicity should be understood in terms of itshistorical context.
In fact, Wimmer’s (2008) explanation clearly shows two lines of arguments on ethnicity. They are primordialism vs. instrumrntalism, essentialism vs.situationalism and perennialist vs. modernist standing on two binary oppositionpoles. One pole, constructivists see ethnicity in the form of instrumentalist-circumstantialist-interest centric-as individual’s need interest. Another pole,essentialists see it as primordialist-perennialist-identity centric-as collectiveidentity feeling. Therefore, there are different lines of explaining ethnicity and it isnecessary to analyze the concept of ethnicity critically from theoretical as well asempirical perspectives.
Mishra (2012 : 2) critically analyzes the concept of ethnicity from bothprimordialist and essentialist perspectives and stands himself in the historical,substantivist and constructivist line. According to him primordialists highlightethnicity as rigid, permanent, ascribed, unchangeable identity of a particular ethnic group or community, whereas instrumentalists examine ethnicity as fluid,temporary, achieved, changeable identity of any group or community. Ethnicity, in this sense, is not a permanent identity associated with people of a particular groupor community that remains unchanged forever; rather it is fluid, changeable, andconstructed at particular historical context, under particular conditions. With
124 Tika Ram Gautam

Ethnicity and Land Ownership in Nepal 125
examples of pahari and parbatiya, Gellner writes that ethnic feelings develop invery specific contexts of opposition and competition (1997 : 9). As defined byChhetri (2012), ethnicity is constructed and negotiated, and therefore fluid.
2. Objective, Data Set and Methodology
This paper discusses on the concept and perspective on ethnicity andexamines the distribution of landownership across the broader ethnic groups ofNepal. Specifically it analyzes the size of landholding including its types in termsof distribution among major ethnic groups of Nepal.
NLSS data set, used in this paper, has been chosen due to a number ofreasons. First, I agree with Rusley (1994:336) because he says, “I see no reason tocollect new data in the field if there are documentary resources already availablethat address some of your research questions. Be on the lookout for archivalmaterials; government reports, newspaper archives, personal diaries or photocollections, industrial data, medical records, school records, wills, deeds, records of court cases, tax rolls, and land-holding records”. Second, Central Bureau ofStatistics (CBS) is authentic Nepal’s government bureau of statistics and WorldBank (WB) is an authentic international organization carrying out different surveys including NLSS time to time in Nepal as well as in other countries in the world.Third, NLSS has an adequate sample size and it can be representative to thepopulation of Nepal. Fourth, it is a national scale survey and covers almost 72districts of Nepal. Fifth, it has adequate sample across ethnic categories. Sixth, itfollows scientific survey methods, mobilizes its own trained office staffs andprovides necessary training to them which upgrades quality of survey to obtainhigh quality data. Therefore, NLSS is regarded as high quality survey and dataobtained from this survey has been using by various research institutions as well as individual researchers.
3. Landownership and Agriculture
Ownership of agricultural land, in the present socio-economic set up, isperceived mainly in two ways. Firstly, it is an important source of generation oflivelihood. In Nepalese context every two in three employed persons are engagedin agriculture sector (CBS, 2008). Secondly, land is regarded as an indicator ofbetter socio-economic status as it is one of the important productive assets on thebasis of which people recognize and rank each other in a status hierarchy in society. Dhakal (2011:1) writes that the land ownership pattern still determines theeconomic prosperity, social status and the political power of any individual orfamily. Thus landownership provides both social and economic status to bothindividual and household.
Households with agricultural land could have chances of producing different things at a time required for their livelihood. They yield cereal crops, vegetables,fruits and also cash crops like ginger in their own land. They can survive with these

all agricultural products even if they do not have any access to any kinds of marketgoods as subsistence agriculture. Some other households yield crops, vegetables,fruits and cash crops, as commercial products and sell them in the market for profitpurpose. However, all households with agricultural land might not be able tosuffice their livelihood support due to small quantity of production. In such a casethey take out loan from institution or individual ensuring their land as collateral tosatisfy their wants.
Here it would be better to quote Sen’s idea on land to understand why land isimportant for human being. He says, “Landlessness is similar to an instrumentaldeprivation. A family without land in a peasant society may be deeplyhandicapped. Of course, given the age-old value system in peasant societies,landlessness can also have importance in a world that values a family’s specialrelationship with its land; to be without land may seem like being without a limb ofone’s own. But whether or not a family attaches direct value to its relation with itsown land, landlessness can also help to generate economic and social deprivations.Indeed the alienation of land has been-appropriately enough-a much discussedproblem in the development literature” (quoted from Adhikari, 2010 : 93-94).
Agriculture as an economic activity is, a source of growth for nationaleconomy, food security, foreign exchange as well as provider of investmentopportunities for agro-based industries and rural non-farm economy. As source oflivelihood, it provides jobs to a majority of the people, especially the small holders,landless and the poor (Farooq, 2012). Agriculture has well established record as aninstrument for poverty reduction (World Bank, 2007) although it can alsosometimes increase poverty, e.g. when agriculture sector remains traditional andsubsistence. Although agriculture sector is still supposed to be traditional in Nepalit has been making notable contribution. As mentioned by Karkee (2008: 27)agriculture sector is contributing 33 percent share of GDP, 49 percent share ofhousehold income, 66 percent of proportion of labour force and 79 percent ofproportion of Nepal’s households. However, distribution of main sector ofemployment indicates that the share of agriculture sector, both in wage inagriculture, has decreased from 53 percent in 1995 to 35 percent in 2010 and self inagriculture has also decreased from 71 percent in 1995/96 to 53.6 percent in2010/11. Also the share of non-agriculture sector in wage employment hasincreased from 47 percent in 1995/96 to 65 percent in 2010/11 (NLSS I & III). Thesefigures clearly show that people are continuously shifting from agriculture sectorto non-agricultural sector for wage and employment purposes. One of the reasonsis this sector has higher wage rate than in agricultural sector. The average dailywage in cash/kind received by wage earners in agricultural sector andnon-agricultural sector is 168 (109 in cash and 68 in kind) and 223 (181 in cash and72 in kind) respectively (NLSS III). Daily wage rate in non-agricultural sector isquite higher (55 rupees) compared to agricultural sector.
The proportion of wage earners in non-agricultural sector is 65 percent in2010 which was 63 percent in 2003 which is not significant change. Among
126 Tika Ram Gautam

Ethnicity and Land Ownership in Nepal 127
non-agriculture industries, concentration of wage earners remains inmanufacturing, construction and personal services. Similarly, a household is saidto be operating a non-farm enterprise if any member of that household reports tobe ‘self-employed’ in a non-agricultural activity. Between 1995/96 and 2010/11,the proportion of households operating non-farm enterprises has increased from24 to 35 percent. Self employment in non-farm enterprises has also been increasing. During the last 15 years, the proportion of manufacturing enterprises has increased from 30 to 35 percent, services enterprise from 14 to 17 percent. Similarly,proportion of households receiving remittance has significantly increased from 23percent in 1995/96 to 56 percent in 2010/11. However, the share of remittances inhousehold income among recipients has increased only slightly from about 27percent to about 31 percent during the same period (NLSS III). Millions of youthsare heading for overseas seeking employment opportunity in search ofemployment opportunities outside the country. Statistics for the last three yearsshows that on average, 250,000 people leaving the country annually foremployment, and the number is on rise (Economic Survey, 2010/11). Thepercentage of households having at least one such employee (absentee) outside thecountry is 33. There is also internal mobility within country as well. The percentageof households having at least one absentee is 28 and 53 percent households have atleast one absentee living currently within or outside the country (NLSS III). This isone of the evidences that employment is shifting from farm activities to non-farmactivities day by day. Despite this large scale flow of youths from various parts ofthe country to overseas employment as well as within country employment there is importance of agriculture and agricultural land in Nepal.
Land reform has remained always an important agenda of government aswell as of political parties in Nepal. However, there is charge against governmentof Nepal throughout the history. As mentioned by Dhakal (2011) “the politicalprocess, which, throughout the history favored a certain class of people, and poorly performed state led land reform initiatives resulted into the unequal, very muchskewed land distribution among the land dependent households,institutionalizing the inequalities among the citizens. Therefore, Nepali societyhistorically was a fragmented economically very much differentiated, sociallyhierarchical, and politically divided. The land is probably the most important assetin the rural agrarian economy.”
However, land ownership as the distribution productive assets has neitherbecome agenda explaining inequality and ethnicity nor it has been discussed interms of federalization or restructuring of Nepal. Also it is an important dimensionto explain inequality and ethnicity. This paper examines the distribution oflandholding pattern between and within ethnic groups (Dalits-Hill Dalit and Tarai Dalit, Madhesi, Newars, Janajatis-Hill/Mountain Janajati and Tarai Janajati,Chhetri , Brahman, Muslim and Others and other Dalit ) at empirical level. It seeksto explore and analyze distribution of land across ethnic groups in Nepal based ona fundamental question, what is the pattern of the distribution of agricultural land,its size and type between and within ethnicities?

In order to empirically explain inequality in terms of ethnicity, inter-ethnicand within-ethnic group analysis is a fundamental one. Between or interethnicanalysis of ownership pattern locates the position, to some extent hierarchicalorder-high, middle, low, of various ethnic groups indicating interethnic variationacross the range of one (or more) variable(s). It shows empirical inequalitiesbetween ethnic groups in terms of land ownership. Similarly, within-ethnicvariation shows inequality within each ethnic group. Such analysis contributes toexplain important current issue of inequality between and within ethnic groups ofNepal in terms of access to livelihood resources, such as ownership of land.Number of agricultural plots of land, landholding size by type and mode ofirrigation are key dimensions of landownership which should be dealt in detailseparately.
Differentiating characteristic within and between ethnic groups could bedifferent across time and space. However, fundamental things could be whatfundamental sources do people have or not for their livelihoods. Thereforeexploring inequalities within and between ethnic groups in terms of access toresources such as ownership of land is fundamental to all kinds of ethnic debates,politics and development in Nepal.
4. Agricultural Landholding by Ethnicity
Agricultural households are broadly grouped into two categories. They arehouseholds owning agricultural land and households not owning agriculturalland. It does not matter whether the household operates the owned land itself ornot. Households with land are those cultivating (during an agricultural year) atleast 0.26 ropanis of land (1458 sq. ft. or 8 dhur) in the Tarai districts or at least 0.25ropanis (1369 sq. ft. or 4 aana) in the mountain and hill districts (NLSS, 2011:6). This 0.26 ropani barrier was followed in the analysis of landholding because data set has been prepared on this set barrier. Also there was no any alternative way torestructure or rearrange the data in different way. Based on given conditions theproportion of households which own agricultural land is shown in Table-1.
Table-1 : Proportion of Households Owning Agricultural Land (N=4265)
Ethnic groups Number ofHHs
Proportion ofagricultural
landowning HHs
Std. Err. ofproportion
Test ofsignificance of
proportion
N P(N)(95% CI)
t
Chhetri 1158 .85 (920)(.82-.87)
0.01 -46.61**
Brahman 967 .78(680)(.74-.81)
0.02 -35.19**
H/M Janajati 1415 .82(1075)(.78-.84)
0.02 -41.00**
128 Tika Ram Gautam

Ethnicity and Land Ownership in Nepal 129
Tarai Janajati 326 .79(253)(.72-.85)
0.03 -21.63**
Madhesi 549 .75(393)(.69-.80)
0.03 -25.92**
Dalit 754 .74(547)(.69-.77)
0.02 -33.07**
Newar 569 .58(262)(.50-.65)
0.04 -18.99**
Other 250 .53(135)(.52-.68)
0.03 -24.00**
Nepal 5988 .77(4265)(.75-.78)
0.01 Referencea
Note : HHs = households; N = number of households in sample; P = proportion of
households owning agricultural land; CI = confidence interval; t = the sample value of
t-test statistic.
a Proportion value of Nepal has been taken as reference.
*p < .05, two tailed; **p < .01, two tailed; t = 1.96 at .05 level of significance and 2.58 at .01
level of significance; F = 1.75 at .05 level of significance and 2.18 at .01 level of
significance.
As shown in table-1, proportion of households with agricultural land ishighest among Chhetri 85 followed by Hill/Mountain Janajatis (.82) which ishigher than national proportion (.77). The third largest proportion is among TaraiJanajati (.79). The important thing to be mentioned here is that the proportion ofBrahmans’ households which own agricultural land is .78 that is in par of nationalproportion. The Newar have the lowest proportion of households who ownagricultural land. However, 87 percent of Newars in rural areas do ownagricultural land. The low proportion of Newar households owning agriculturalland is due to their employment in non-agriculture sector and in the urban areas.The proportion of households among Tarai Dalit is the lowest among all ethnicgroups because about 67 percent households of Tarai Dalit in rural areas and onlyabout 32 percent households of them in urban areas have agricultural land.
However, the test of significance of proportion shows that none of the ethnicgroups has significantly higher proportion of households owning agricultural land with reference to national proportion. Also it shows that Chhetri and H/M Janajatihave significantly lower proportion of households owning agricultural land.Interestingly, the proportion of households owning agricultural land amongChhetri and H/M Janajati is higher by 8 and 5 percentage points respectively. Buttest of significance difference in proportion shows that the proportion ofhouseholds owning agricultural land within these groups is also significantlylower compared to national proportion. Therefore owning agricultural land has norelationship with ethnicity.
Owning agricultural land is one thing. Number of plots owned isanother thing that holds important meaning. People who do not buy or achieve

parcel of land from other person time to time could not have a number of plots.Owning more number of plots does not only indicate both household as well asindividual activeness and mobility but also potentiality of generating livelihood ina much easier way. More parcels of land means larger size of agricultural land andmuch more agricultural products normally. Distribution of agricultural plots andsize is presented in Table-2.
Table-2 : Mean of Farm Plots (land) and Farm Size Owned by Ethnicity
(N=4265)
sp
uor
g cin
htE
fo
noitr
op
orP
sH
H
fo r
eb
mu
N st
olp
ni e
zis d
na
Li
na
por
.rrE .
dtS
ecn
aira
V
tset
na
eM
)tset-t(
tset
ecn
aira
V)ts
et-F(
P(N) WM WM(95% CI)
s2 t F
Chhetri .85(920) 3.47 12.86(11.91-13.81)
0.48 147.98 -8.65** 0.38
Brahman .78(680) 3.14 14.32(12.82-15.81)
0.76 306.44 -1.16 0.78
H/MJanajati
.82(1075) 3.07 12.90(11.63-14.16)
0.64 236.11 -4.77** 0.60
TaraiJanajati
.79(253) 3.01 14.00(11.53-16.47)
1.26 322.24 4.01** 0.82
Madhesi .75(393) 4.15 19.39(15.43-23.35)
2.02 1381.20 13.01** 3.51**
Dalit .74(547) 2.46 7.68(6.39-8.96)
0.66 232.19 -9.74** 0.59
Newar .58(262) 2.88 10.50(7.45-13.56)
1.55 718.20 2.31* 1.83*
Other .60(135) 3.32 13.62(10.85-16.38)
.30 244.97 4.57** 0.62*
Nepal .77(4265) 3.19 13.09(12.37-13.82)
0.37 393.21 Referenca Referenceb
Note : Ropani is an unit of land; 13.31 ropani = 1 bigha, 1.5 bigha = 1 hectare = 19.965
ropani;
HHs = households; P = proportion of households owning agricultural land; N = number
of households in sample; WM = weighted mean (estimate of population); CI =
confidence interval; s2 = sample variance; t = the sample value of t-test statistic; F =
Fisher’s F ratio; test of significance and variance test is of mean size of agricultural land
owned by ethnic groups.
130 Tika Ram Gautam

Ethnicity and Land Ownership in Nepal 131
a Mean value of Nepal has been taken as reference; b Variance of Nepal has been taken as
reference value.
*p < .05, two tailed; **p < .01, two tailed; t = 1.96 at .05 level of significance and 2.58 at .01
level of significance; F = 1.75 at .05 level of significance and 2.18 at .01 level of
significance.
In terms of number of agricultural plots owned by households of ethnicgroups Madhesi own the largest number (4.15) of plots in average among all and itis higher than the national average. Whereas Brahman, H/M Janajati and TaraiJanajati occupy second highest position in owning agricultural plots which is in par to national average (3.19). Number of agricultural plots owned by Dalit and Newaris low compared to national average. As in the case of agricultural parcels, averagesize of landholding is also largest among Madhesi. They own 19.39 ropani ofagricultural land in average which is significantly higher than national average.Mean test of significance also shows this noticeable difference. Agricultural landowned by Tarai Janajati is also significantly higher than national average.Important point is that Chhetri and Dalit including H/M Janajati own significantlylower size of agricultural land. Therefore inequality between Madhesi, on the onehand, and Chhetri and Dalit, on ther other, is the largest among all. However,variation is not significant among all groups except Madhesi. This distributionland pattern shows that owning larger size of land or not has no relationship withethnic categories.
5. Landholding Size by Ethnicity
Households owning agricultural land, in fact, can produce a number ofthings in terms of food crops, vegetables, fruits and cash crops required for theirlivelihood. Quantity and quality of products from agricultural land operated byhousehold determine the living standard of people. However, quantity and quality of products depend on the size and type of land operated.
Observing the average agricultural landholding size across ethnicities inNepal important things to notice at the present context of ethnic debate is withingroup variation. Within group variation explained in terms of standard deviationwas found the highest among Newar (32.74), Madhesi (41.28) followed by TaraiJanajatis (17.47), H/M janajatis (15.16) and Brahmans (17.21). It clearly shows thataccess to ownership of agricultural land widely varies across ethnic group as wellas within-ethnic group and indicates that there is unequal distribution of resourcessuch as land among people which does not simply follow inter-ethnic line alonebut within-ethnic line as well.
6. Conclusion
Land still remains one of the important sources of livelihood of people inNepal. Having agricultural land and not having agricultural land holds importantmeaning here. People regard land as one of the important means of livelihood and

also ultimate source of livelihood when they met some kind of crisis in otherjobs/activities they engaged at any time in future. Importance of land in Nepaltherefore still remains high at social, economic as well as in political sphere.
Land, as an important source of livelihood, always becomes a matter ofpolitics and development. As a matter of politics distribution pattern and as amatter of development professional and commercial agricultural system becomeimportant issues. In the current debate of ethnicity distribution pattern ofagricultural land among ethnic groups of Nepal is certainly a central issue.Therefore microlevel analysis of distribution pattern of land across ethnic groupsof Nepal, as done here in this paper, has been helpful in deriving some importantconclusions. First, distribution of agricultural land in terms of its size differs acrossethnic groups. However, observed mean difference of landholding size of all ethnic groups does not significantly differ from the national average except in the case ofMadhesi. In most of the cases Madhesis as well as Tarai janajati own significantlylarger size of agricultural land. Second, the distribution pattern of agricultural land does not only vary between ethnic groups but also within ethnic groups. There isalso significant variance in the ownership pattern of land within ethnic group. Thus, observing the overall distribution of landholding pattern the distributionpattern does not follow a particular ethnic line creating a significant difference.More importantly, there is significant variation in the ownership of landholdingpattern within ethnic group compared to national figure.
Notes
Categorization of castes/ethnicity
1. Hill Dalits—Kami (Kami, Sonar, Lohar, Od,Chunura, Parki, Tamata), Sarki (Mijar,
Charmakar, Bhool), Damai (Pariyar, Suchikar, Nagarchi, Dholi, Hudke), Gaine, and
Badi, (Source : UNDP, 2008).
2. Tarai Dalit—Chamar/Harijan/Ram, Musahar, Dusadh/Paswan/Pasi, Tatma, Khatbe,
Dhobi(Rajak), Bantar (sardar), chidimar, dom, Mustor/Halkor, Kuswadiya/
Patharkatta, Kakahiya, Kalar @, Khatik, Kori, Pasi, and Sarvanga/Sarbariya (Source :
UNDP, 2008)..
3. Madhesi—Yadav, Teli, Koiri/Kuswaha, Kurmi, Sonar, Baniya, Kalwar, Thakur/
Hazam, Kanu, Sudhi, Kumhar, Haluwai, Badhai, Barai, Bhediyar/Gaderi, Kewat,
Mallah, Lohar, Nuniya, Kahar, Lodha, Rajbhar, Bing/Binde, Dhuniya, Kamar, Mali,
Worai+12 New-Rajdhobi, Saini, Amaat, Kewrat, Barnamale, Jogiya, Beldar, Kalabaj, Bot,
Turuha, and Chanai {Madhesi Brahman/Chhetri-Nurang, Rajput and Kayastha
(Bhumihar)} (Source : Bennet and Parajuli, 2012).
4. Hill Mountain Janajati—Magar, Chhantyal, Rai, Sherpa, Bhujel/Gharti, akha, Thakali,
Limbu, Lepcha/Rong, Bhote, Bhansi/Sauka, Jirel, Yholmo, Walung, Gurung, Dura,
Tamang, Kumal, Sunuwar, Majhi, Danuwar, Thami/Thangmi, Darai, Bote, Baramu,
Pahari, Hayu, Kusunda, Chepang, Raji, and Raute (Source : Bennet and Parajuli, 2012).
5. Tarai Janajati—Tharu, Jhangar/Dhangar, Dhanuk, Rajbansi, Gangai, Santhal/Satar,
Dhimal, Tajpuriya, Meche, Koche, Kisan, Munda, Kushadiya/Patharkata, Unidentified,
and Adibasi/Janajati (Source : Bennet and Parajuli, 2012).
132 Tika Ram Gautam

Ethnicity and Land Ownership in Nepal 133
6. Chhetris—Chhetri, Thakuri and Sanyasi (Source : Bennet and Parajuli, 2012).
7. Muslim—Madhesi Muslim and Hill Muslim (Source : Bennet and Parajuli, 2012).
8. Other Castes—Marwari, Jain, Bangali, Punjabi/Sikh, and Unidentified others (Source :
Bennet and Parajuli, 2012).
References
1. Abe, Kiyoshi, “Social Exclusion and Inclusion in Japan: Policy Challenge for a more
Inclusive Civil Society”, Contributions to Nepalese Studies, 35(1), 2010, 17-38.“”
2. Bandopadhyay, Suraj and Donald Von Eschen, “Agricultural Failure: Caste, Class and
Power in Rural West Bengal”, Dipankar Gupta (ed.), Social Stratification, India: Oxford
University Press, 2003..
3. Bennet Lynn and Dilip Parajuli, Making Smaller Social Groups Visible and Providing a
Baseline for Tracking Results on Social Inclusion : The Nepal Multidimensional
Exclusion Index, Draft for Comments, 2012.
4. Beteille, Andre, The Idea of Natural Inequality and other Essays, India : Oxford India
Paperbacks : Oxford University Press, 1993.
5. Beteille, Andre, Inequality among Men, Oxford and London : Basil Blackwell, 1977.
6. Bhattachan K. B., “People/Community Centered Approaches in Nepal”, Bhattachan,
K.B . and Chaitanya Mishra (eds.), Developmental Practices in Nepal, Kathmandu :
Central Department of Sociology/Anthropology, T.U., 1997.
7. Bhattachan, K. B. & Kailash N. Pyakuryal, “The Issues of National Integration in Nepal :
An Ethnoregional Approach”, Occasional Papers in Sociology & Anthropology, 5,
Kathmandu: Central Department of Sociology/Anthropology, TU., 1996.
8. Blau, Peter, Inequality and Heterogeneity : A Primitive Theory of Social Structure, New
York : The Free Press, 1977.
9. CBS, Nepal Living Standards Survey 2010/11, Statistical Report Volume One and Two,
Kathmandu : Central Bureau of Statistics, National Planning Commission Secretariat,
Government of Nepal, 2011.
10. Chhetri, Ram Bahadur, “Some Thoughts on the Bases for Federalization in Nepal:
Ethnicity, Natural Resources, or . . . ?”, Chaitanya Mishra and Om Gurung (eds.),
Ethnicity and Federalisation in Nepal, Kathmandu : Central Department of
Sociology/Anthropology, Tribhuvan University, 2012.
11. DFID & WB, Unequal Citizens : Gender, Caste and Ethnic Exclusion in Nepal,
Kathmandu : DFID and WB, 2006.
12. Dhakal, Suresh, Land Tenure and Agrarian Reforms in Nepal : A Study Report,
Kathmandu : Community Self Reliance Centre (CSRC), 2011.
13. Dreze, Jean and Amartya Sen, Hunger and Public Action (Seventh Impression). Delhi :
Oxford University Press, 1999.
14. Dumont, Louis, Homo Hierarchicus : The Caste System and its Implications, Delhi :
Oxford University Press, 1988.
15. Gellner, David. N., “Ethnicity and Nationalism in the World’s Only Hindu State”, David
N. Gellner, Joanna Pfaff-Czarnecka & John Whelpton (eds.), Nationalism and Ethnicity
in a Hindu Kingdom : The Politics of Culture in Contemporary Nepal, India : Harwood
Academic Publishers, 1997, 3-33.

16 Georgieva, Sphia V., Enrique Vasquez, Gover Barja, Femando Garcia Serrano and
Ramiro Larrea Flores, “Establishing Social Equity : Bolivia, Ecuador, and Peru” Building
Equality and Opportunity through Social Guarantees : New Approaches to Public
Policy and the Realization of Rights, 2009, 143-174.
17. Giddens, Anthony, Sociology, 5th Edition. UK : Polity Press, 2006.
18. Gradus, Hahuda, “The Role of Politics in Regional Inequality: The Israeli Case” Annals
of the Association of American Geographers, 73(3), Sep., 1983, 388-403. America : Taylor
& Francis, Ltd. on behalf of the Association of American Geographers Stable. Accessed:
28/06/2011 12:38 on www.Jstor.Org.
19. Gupta, Dipankar, “Hierarchy and Difference : An Introduction”, Dipankar Gupta (ed.),
Social Stratification, New Delhi : Oxford University Press, 2003.
20. Gurung Ganesh Man & Vishnu Bhandari, “National Integration in Nepal” Occasional
Papers in Sociology and Anthropology, Vol. 3, Kathmandu : Central Department of
Sociology, TU., 1993.
21. Gurung, Om, “Evolution of Indigeneity, Identity and Autonomy in Nepal”, Chaitanya
Mishra and Om Gurung (eds.), Ethnicity and Federalisation in Nepal, Kathmandu :
Central Department of Sociology/Anthropology, Tribhuvan University, 2012.
22. Hachhethu, Krishna et al., “Nepal : State and Ethnicity”, Kristian Stokke and Mohan
Das Manandhar (eds.), State and Society; Social Exclusion and Inclusion in Nepal,
Kathmandu : Mandala Book Point, 2010, 63-89.
23. Hachhethu, Krishna, “Democracy and Nationalism Interface between State and
Ethnicity in Nepal”, Contributions to Nepalese Studies,30(2), Kathmandu: CNAS, TU.
2003, 217-252.
24. Hangen, Susan I., The Rise of Ethnic Politics in Nepal, London and New York :
Routledge, 2010.
25. Hein, Jeremy, “The Impact of Social Welfare Programs on the Formation of Indochinese
Refugee Associations” Sociological Forum, 12(2), Jun., 1997, 279-295. Springer.
Accessed: 28/07/2011 at 08:35 on www. Jstor.Org.
26. Jenkins, Richard, Rethinking Ethnicity, Second Edition. India : SAGE Publications, 2008.
27. Karkee, Madhab, Nepal Economic Growth Assessment Agriculture, A Report Submitted
to USAID Nepal, 2008.
28. Karl Marx, “German Ideology : Part I”, Robert C. Tucker (ed.), The Marx-Engels Reader,
Second Edition. USA : W.W. Nortion & Company, Inc., 1978.
29. Karl Marx, “Wage Labour and Capital”, Robert C. Tucker (ed.), The Marx-Engels
Reader, USA : W.W. Nortion & Company, Inc., 1978.
30. Kerbo, H. R., Social Stratification and Inequality : Class Conflict in Historical,
Comparative and Global Perspective, New Delhi : McGraw Hill Companies, Inc., 2000.
31. Kharel, Sambriddhi. 2008. “The Complexity of Dalit Identity and Resistance in
Kathmandu”, Social Sciences in a Multicultural World, Proceedings of the
International Conference, 11-13 Dec. 2006, Kathmandu : SASON & NCCR, Nepal, 81-96.
32. Kievelitz, Uwe, “Ethnicity and Nationalism in the Nepali Context: A Perspective from
Europe”, Occasional Papers in Sociology & Anthropology, Vol. 5, Kathmandu : Central
Department of Sociology/Anthropology, TU., 1996.
134 Tika Ram Gautam

Ethnicity and Land Ownership in Nepal 135
33. Lawoti, Mahendra, “Introduction: Ethnicity, Exclusion and Democracy in Nepal”
Mahendra Lawoti and Arju Guneratne (eds.), Ethnicity, Inequality and Politics in
Nepal, Kathmandu : Himal Books, 2010, 1-17.
34. Lenski, Gerhard and Patrick Nolan, “Trajectories of Development : A Test of
Ecological-Evolutionary Theory”, Social Forces, 63, 1984, 1-23.
35. Liu, Ben-chieh, “Variations in the Social Quality of Life Indicators in Medium
Metropolitan Areas”, American Journal of Economics and Sociology, 37(3), July, 1978,
241-260. Accessed on 28/06/2011 at 11:37.
36. Mishra, Chaitanya, Essays on the Sociology of Nepal, Kathmandu : Fine Prints,
Anamnagar, 2007, 1-34 & 81-146.
37. Mishra, Chaitanya, “Ethnic Upsurge in Nepal : Implications for Federalization”,
Chaitanya Mishra and Om Gurung (eds.), Ethnicity and Federalisation in Nepal,
Kathmandu : Central Department of Sociology/Anthropology, Tribhuvan University,
2012.
38. Mishra, Chaitanya, “Ethnicism or New Rightist Upsurge”, Nepal Magazine, Year 12,
Vol. 21, 2012a, 22-25.
39. Nepal South Asia Centre, Nepal Human Development Report 1998, Kathmandu : Nepal
South Asia Centre, 1999.
40. Oxford Dictionary, DK Illustrated Oxford Dictionary, New Delhi : Dorling Kindersley
Limited and Oxford University Press, 2011.
41. Oommen, T. K., “Evolving Inclusive Societies through Constitutions: The Case of
Nepal”, Contributions to Nepalese Studies, 37(1), 2010, Kathmandu: CNAS, TU.
42. Amartya Sen and Jean Dreze,The Amartya Sen and Jean Dreze Omnibus, Delhi : Oxford
University Press, 1995. .
43. Pandey, Devendra Raj, Looking at Development and Donors : Essays from Nepal,
Kathmandu : Martin Chautari, 2011.
44. Pfaff-Czarnecka, “Joanna, Vestiges and Visions : Cultural Change in the Process of
Nation-Building in Nepal” David N. Gellner, Joanna Pfaff-Czarnecka, John Whelpton
(eds.), Nationalism and Ethnicity in Nepal, Kathmandu : Vajra Books Publications,
1997.
45. Riaz, Ali and Subho Basu, Paradise Lost? State Failure in Nepal, New Delhi : Adarsh
Books, 2010.
46. Rogers, Clint, “Explaining Disparate Economic Success in Highland Nepal:
Opportunity, Cooperation, and Entrepreneurship in Manang”, Contributions to
Nepalese Studies, 31(1), 2004, Kathmandu: CNAS, TU.
47. Sharma, Prayag Raj, “Nation Building, Multi-Ethnicity, and the Hindu State”, David N.
Gellner et al. (eds.), Nationalism and Ethnicity in a Hindu Kingdom : The Politics of
Culture in Contemporary Nepal, Amsterdam : Harwood Academic Publishers, 1997,
471-494.
48. Sharma, Prayag Raj, The State and Society in Nepal : Historical Foundations and
Contemporary Trends, Kathmandu : Himal Books, 2006.
49. Sharma, Prayag Raj, “Nation-Building, Multi-Ethnicity and the Hindu State”, David N.
Gellner, Joanna Pfaff-Czarnecka, John Whelpton (eds.), Nationalism and Ethnicity in
Nepal, Kathmandu : Vajra Books Publications, 1997.

50. Shrestha, N. R. & Bhattarai K., Historical Dictionary of Nepal, New Delhi : Vision
Books, 2004.
51. Strasser, Hermann, The Normative Structure of Sociology : Conservative and
Emancipatory Themes in Social Thought, London : Routledge & Kegan Paul, 1976.
52. Tamang, Mukta. S., “Identity and Capability: Constitutional Quest for Future Nepal”, A
Paper Presented on a Symposium on Ethnicity and Federalization, (Unpublished
Paper). Organized by Central Department of Sociology/Anthropology, T.U., Kirtipur,
2011.
53. Tumin, Melvin M., Social Stratification : The Forms and Functions of Inequality,
Second Edition, Delhi : Prentice Hall of India, 1999.
54. UNDP, Nepal Human Development Report 2009 : State Transformation and Human
Development, Kathmandu : UNDP, Nepal, 2009.
55. UNDP, The Dalits of Nepal and a New Constitution : A Rescue on the Situation of
Dalits in Nepal, their Demands and the Implications for a new Constitution, Compiled
by United Nations Development Programme, Kathmandu : UNDP, 2008.
56. Veblen, Thorstein, 1998. “The Beginnings of Ownership”, American Journal of
Sociology, 4(3), Nov. 1898, 352-365. Chicago : Chicago University Press. Accessed:
27/06/2011 23:44 on Jstor.Org.
57. Whelpton, John, David N. Gellner, and Joanna Pfaff-Czarnecka, “New Nepal, New
Ethnicities : Changes Since the Mid 1990s”, David N. Gellner, Joanna Pfaff-Czarnecka,
John Whelpton (eds.), Nationalism and Ethnicity in Nepal, Kathmandu : Vajra Books
Publications, 1997.
58. Whelpton, John, “Political Identity in Nepal : State, Nation, and Community”, David N.
Gellner, Joanna Pfaff-Czarnecka, John Whelpton (eds.), Nationalism and Ethnicity in
Nepal, Kathmandu : Vajra Books Publications, 1997, 39-78.
59. Wimmer, Andreas, “The Making and Unmaking of Ethnic Boundaries : A Multilevel
Process Theory”, American Journal of Sociology, 113(4), 2008, 970-1022. USA : The
University of Chicago. ê
136 Tika Ram Gautam
Article Received on July 27, 2017; Accepted on September 11, 2017

13
Women, Education and Stereotyping :
An Analysis on Participation of
Women in Higher Education
Manik Sharma*
In India the formal education system dates back to Gurukuls and Missionaries. DuringBritish time the emphasis on education served their own requirements to control and enhance theregime. The issue of promoting women’s education was intermeshed with the movement for socialreforms during the struggle for independence. After independence Article 45 was laid down by the framers of constitution for free and compulsory education to all up to the age of fourteen. Manyother plans and programmes were taken in the context to education as well as for skilldevelopment to all. In particular, 11th five year plan detailed a road map for skill development inIndia that favoured the formation of skill development mission both at state and national level. Inspite of various plans and programmes however, the educational system is often found toperpetuate gender inequalities in terms of access, participation and attainment. The participationof the females in relation to education has increased over a period of time but the vision of equalityis still unattained. Education of women still follows the stereotypical construction as care takerand teacher.
[Keywords : Higher education, Stereotyping, Gender inequality, Literacy rate,
Sex ratio]
1. Introduction
Two important developments in relation to minimising gender differences at
the world level as well Indian level took place recognising the fact that
CONTEMPORARY SOCIAL SCIENCES, Vol. 26, No. 3 (July-September), 2017
* Research Scholar, Department of Public Policy and Public Administration, Central University ofJammu, J &K (Indial) E-mail: <[email protected]>

development impacts men and women differently owing to the established social
structure of the society. First one was that the leaders of the world gathered at the
United Nations on September 2015 to commit to a new set of global development
goals and targets, the sustainable development goals (SDGs). Among others, the
preamble to this document declares a vision of a ‘world in which every woman and
girl enjoys full gender equality and all legal, social and economic barriers to their
empowerment have been removed’. This is the latest of a long list of such global
visions and commitments to gender equality and justice. Education, which is a
fundamental human right, according to Article 26 of the Universal Declaration of
Human Rights (Universal Declaration) and is regulated in Articles 13 and 14 of theCovenant of Economic, Social and Cultural Rights (ESC) and is also protected by
the Convention on the Rights of the Child (RC). When looking at the three
documents together, they agree on the following points: education cannot be
discriminatory, it shall be free and of equal quality for all people, and should
promote and respect the identity of the communities where it takes place.1
Secondly, in India, to minimize the gender differences in 2004-05, theMinistry of Women and Child Development adopted “Budgeting for GenderEquity” as a Mission Statement. The rationale for gender budgeting arises fromrecognition of the fact that national budgets impacts men and women differentlythrough the pattern of resource allocation and priority and accorded to competingsectors. Women constitute 48% of India’s population, but they lag behind men onmany social indicators like education, health, economic opportunities, etc. Hence,they warrant special attention due to their vulnerability and lack of access toresources. The way government budgets allocate resources has the potential totransform gender inequalities. Gender budgeting is not an accounting exercise butan ongoing process to ensure that benefits of development reach women as muchas men.2 If we see the education as a whole in relation to women in India it is foundthat historically education for women is meant to enhance their status in the familyand society but not taken as a mission for the holistic societal change. Women werenever considered as the agents to bring change in the society as a whole.
The Recently announced decision by the Indian Institute of Technology (IITs)to improve the intake of girls the 20% seats are to be reserved for the girls is anappreciable attempt to acknowledge the gender difference. The IITs have decidedto introduce a supernumerary (Supernumerary means the quota will be staggeredover three years-14 percent additional seats in 2018, 17 percent in 2019 and 20percent in 2020) quota for girls from 2018 to improve the gender composition oftheir classrooms. The move is aimed at improving the poor enrolment of girls inIITs. In 2014 8.8% girls were admitted: the figure went up to 9% in 2015 butdropped to 8% in 2016.3
The education system is considered as the symbol of improvement of anysociety creates stereotypes and reflects the imprints of the patriarchal society.Stereotypes are the generalizations which are expected from a particular biological
138 Manik Sharma

Women, Education and Stereotyping 139
sex in the society. Talcott Parsons has explained women’s role in the family as an‘expressive’ and men as ‘instrumental role’ as the bread winner. In contrast Engelssaw female subordination as a result of the emergence of private property, inparticular the private ownership of the forces of production.4
The present paper is divided into two sections. First part deals with a precise
history of women education in India. Second part comprises indicators of the
gender inequality as sex ratio, Literacy rate and educational attainment by women
for India in general and J&K in particular. In particular concern to higher education
the data of higher education as enrolment in higher education and post wise
number of males and females in higher education for India and J&K both are taken.
Moreover the enrolment of males and females of disadvantaged sections
particularly- scheduled castes, scheduled tribes and other backward class is taken
for analysis.
2. A Precise Sketch of Women Education in India from its Inception
One of the social functions of education is to provide women equal
opportunities as compared to their men counterparts so as to involve them
effectively in societal building. However, the educational system is often found to
perpetuate gender in- equalities in terms of access, participation and attainment.5
In India the formal education system dates back to Gurukuls and
Missionaries. During British time the emphasis on education served their own
requirements to control and enhance their regime. The question of women’s
education arose with the social reform movements during the struggle for
independence. It was a general agreement among the social reformers that the
women are oppressed because the Indian woman is shackled with social customs
and traditions (such as child marriage, sati, purdah (physical seclusion) and lack of
education. Jyotiba Phule, Ishvarchandra Vidyasagar and few other progressive
reformers perceived the said oppression of women as a traditional instrument for
maintaining social inequality and the dominance of high castes in Indian society.6
There was considerable debate among the social reformers with different
ideological orientations regarding women’s education. The segment of Cultural
revivalists perceived women as the custodians of the tradition and the family.
Women’s education was seen essentially as a means of strengthening traditional
Indian culture and values to resist westernization. The liberal social reformers
advocated limited education for girls to make them enlightened companions for
the emergent class of westernized men from upper castes and efficient mothers for
the next generation. Thus, education for women was promoted to improve their
traditional roles within the patriarchal family. Social reformers neither envisaged
women’s education as a means to equip them for playing a wider role in society nor
emphasized the liberating potential of education to question the patriarchal
oppression. Hence, the social reform movement opened up access to schooling for

girls and women from the upper castes but the differences in access to the kinds
and levels of knowledge remained throughout the colonial period.7
Karuna Chanana advocates that the issue of promoting women’s educationwas intermeshed with the movement for social reforms during the struggle forindependence.8 While improvement in the position of women was conceived asan important element of social reform, those who espoused the cause of women didnot really envisage radical changes in women’s roles. Rather, the changesor modifications were sought to be achieved within the existing societal framework. Moreover, the underlying assumptions defining gender roles were not questioned.
Like social reformers, Gandhi perceived women as the oppressed group andopposed social customs (early marriage, dowry, purdah, etc.) that subordinatedthem. He envisaged a significant role for women in Indian society and advocatedgender equality in legal, educational, social, and political spheres. AlthoughGandhi favoured female education for all sections of society, he too advocatedwomen’s education to improve their traditional roles as wives and mothers in thepatriarchal family.9
Indian Women’s Association (1917), and the All-India Women’s Conference(1927) - known as the Akhil Hind Mahila Parishad - were established to mobilizewomen for advancing their status through education, social reform and politics.Given the elitist nature of the early women’s movement, it hardly paid anyattention to the question of female education among lower castes and Muslims.Communist movement with class struggle as its main agenda pave limitedattention to women education though it has organized few female workers. Thefirst All-India Women’s Conference in 1927 emphasized the need for legal rights todeal with obstacles in promoting education for women and condemned thepractice of early marriage as it interfered with women’s education. However,education for women was perceived essentially as strengthening their roles withinthe dominant ideological framework of social reformers and nationalists.10
At independence, India inherited a legacy of large-scale illiteracy and lack ofproper provision for education. At the first post-independence census of 1951, only 9 per cent of women and 27 per cent of men were literate. It was resolved by theframers of the constitution that the new Indian state would endeavour to providefree and compulsory education to all children up to age of 14 by 1960.11
Post independence liberal state, committed to the constitutional principle ofequality of women, rejected the colonial educational policy of differentiatedcurricula between men and women. Nevertheless, the basic assumption regardingthe primary roles of women as housewives and mothers remained in theeducational policy until the late 1970s. The comprehensive report of the Committee on the Status of Women in India, Towards Equality, highlighted that instead ofchanging social values and attitudes regarding women’s roles, the educationalsystem had contributed to strengthening and perpetuating traditional ideas ofwomen’s subordination through the “curricula, the classification of subjects on thebasis of sex and the unwritten code of conduct enforced on their pupils.”12
140 Manik Sharma

Women, Education and Stereotyping 141
The National Policy on Education (1986) reflects the liberal view ofpromoting women’s education for equality. It specifically emphasized thenecessity of reorienting education to promote women’s equality, and envisionededucation playing a positive interventionist role in the empowerment of women.The policy recommended revision of textbooks to eliminate gender bias andstereotyping and the training of teachers towards greater gender sensitivity. TheNPE 1986 was a radical policy intervention in that it placed gender equalitythrough education as a social and political commitment of the state; and it hascontinued to guide advocacy efforts for women’s education.
The National Policy on Education (NPE), formulated in 1986 and revised in1992, has provided a separate and protected space for women’s empowermentthrough the Mahila Samakhya Programme, an educational programme aimed atpromoting women’s education for equality. However, such space within the statehas remained limited and not extended to the larger system of education. Underthe social safety net approach, the focus of educational policy has shifted fromhigher education to basic education (elementary education). Such a policy is,however, likely to restrict women’s access to higher education and constrain thespace given to women’s studies in higher education.13
It is found that women, in general, have been historically excluded frommainstream knowledge production. It was through the establishment of women’sstudies research centres and women’s studies cells in the university system thatwomen’s studies have become an integral part of the institutionalized system ofhigher learning.
But even today after six seven decades of planning and nation buildingprocess this goal remains unfulfilled. After attaining independence despite rapidexpansion of educational opportunities, women have lagged behind men ineducation. Women as human resource are not in tune with their male counterparts. Human resource comprised the people that constitute the labour force of anorganization, Business Company or an economy. For the development of itshuman resource educational institutions particularly the higher educationinstitutions are committed to train the brain, provides skills and opens a new world of opportunities and possibilities to the developing nation.
For the justification of the fact that women as human resource are justpursuing their traditional stereotypical roles, the data of higher education is taken.For the support of the argument the enrolment of women in higher education, postwise number of women in higher education are analyzed by taking the secondarydata from the All India Survey on Higher Education (2014-15). It is also attemptedto find out that women as a section are at disadvantage when the data is taken fromthe disadvantaged section.
3. Indicators of the Gender Inequality for India and J & K
To begin with, if we imagine the world without girls or particularly if we seethe universities filled with the boys, it would be in sharp contrast to the policies

framed and executed in post independence period. Education is presumed to bethe arena of upward mobility. In the intellectual discourse, ‘education’ iscontinuing to be viewed as a reliable means to promote changes in attitudes. It isthe common agenda of right wing as well as the left wing that education promoteschanges in attitudes and values. In particular concern to gender equality educationis to be analyzed as how much it has pushed the societal attitudes. Policy makershave stressed the education as the means to acquire the equality in the society. Butthe concern of the paper is to analyze the extent of involvement of womenin education. For this purpose sex ratio, literacy rate, enrolment and employmentare taken as the bases for justification. If we put a glance at the nationaldata regarding the sex ratio and literacy rate the picture regarding the inequalitybecomes clear to us.
Table-1 : Sex Ratio
Place 2001 2011
Total Rural Urban Total Rural Urban
India 933 946 900 943 949 929
J & K 892 918 819 889 908 840
Source : Census of India 2011.
Table-2 : Child Sex Ratio
Place 2001 2011
Total Rural Urban Total Rural Urban
India 927 934 906 919 923 905
J & K 941 957 873 865 865 850
Source : Census of India 2011.
In comparison to census report 2001 the sex ratio for rural India is better thanthe urban one and same is the case with J&K.14 The sex ratio for J&K for rural and
urban both is lower than the national average. But the child sex ratio of J&K is more
than the national average.
In a study done by Rebeca A. Echávarri and R. Ezcurra, it is found that access
to prenatal sex-detection technologies in areas of the world enables a person to
control family sex-composition by practicing sex-selective abortions.15
Accordingly, the spread of these technologies might help to explain why atypically
high numbers of male births (relative to the number of female births) have become
habitual in various countries. When there is no access to prenatal sex-detection
technology, preferring boys over girls leads parents to focus on an ideal number of
sons. That is, regardless of the number of daughters in the family, fertility is
completed as soon as the couple has their ideal number of sons. For the aggregate
demographic outcomes, this behaviour causes inflated fertility ratios, although it
does not give rise to female disadvantage at birth. By contrast, controlling family
142 Manik Sharma

Women, Education and Stereotyping 143
sex-composition through selective abortions decreases the relative number of
female births. Therefore, female disadvantage in natality is more likely to arise in
those areas of the world that combine the existence of a system of values that give
priority to sons over daughters and the availability of prenatal sex-detection
technologies.
Like the data of sex ratio literacy rate among females is behind the male
literacy rate.
Table-3 : Literacy Rate
Place Persons Males Females
India 74.0 82.1 65.5
J & K 68.7 78.3 58.0
Source : Census of India, 2011.
It is found that greater emphasis is placed on the literacy of the women as
education is seen as the base for progress and modernization of the nation. But the
literacy rate for females is lower than the male counterparts. Even today the
females are not preferred equally as males for education.
Karuna Chanana has stressed that in spite of the emphasis on gender equality
the traditional paradigm continues to influence views on education.16 Women’s
presence in higher education and in employment has no doubt become noticeable
but their new role remains an extension of the traditional role in a majority of cases.
Further, the very institutions that are supposed to promote modernization have
been utilized to reinforce the traditional dichotomy of gender roles thereby
eliminating scope for a radical change in the definition of women’s role in society.
If we talk about the participation of women in higher education meant for
skill development the comparison between men and women education sketches a
skewed picture.
Table-4 : Percent Enrolment at Ph.D,M.Phil, and Post Graduate level for India and J&K
Place Ph.D, M.Phil Post Graduate
Male Female Male Female Male Female
India 58.95 41.05 41.09 58.91 46.42 53.58
J & K 53.56 46.44 46.44 53.56 48.75 51.25
Source : All India Survey on Higher Education 2015-2016, MHRD.
In the context of higher education the male and female ratio for six different
programmes is shown in the table-4 and 5. On all India level in post graduate and
M.Phil programme the females’ outnumbered males. But in PhD programme in
India as well in J&K there is a considerable decline.
Dogra and Jayaraj, in their study finds out that for the past 25 years, 25-30% of
Ph.D students in India have been females.17 However this does not translate to

women actually pursuing research or holding faculty positions. Out of 500 Shanti
Swarup Bhatnagar Prize for Science and Technology only 16 have been women.
Even here there is an imbalance in the disciplines that they have been awarded in
Mathematics-2, Physics-0, Engineering-2, Chemistry-3, Earth Science-1, Biology+
Medical-8.
Table-5 : Percent Enrolment at Undergraduate, Post Graduate Diploma and Diploma
Place Under Graduate PG Diploma Diploma
Male Female Male Female Male Female
India 53.28 46.72 53.75 46.25 70.35 29.65
J & K 47.81 52.19 57.17 42.83 74.10 25.90
Source : All India Survey on Higher Education 2015-2016, MHRD.
Professional education is a higher educational programmes that are designed
for learners to acquire the knowledge, skills and competencies specific for a
particular occupation or grade or class of occupations or trades.
It is found that the courses which are skill based and professional are notpreferred by females. In the diploma and post graduate diploma courses the males
mark higher than the females as males are perceived as the main bread winner and
manager of the family. It is the simultaneous effect of the less enrolment of the
females in the higher education that leads to less number in employment in higher
education. Women are not still being regarded as equal to men in legitimately
regarding pursuit of career as the main goal in life. They are regarded as
supplementary earners.
Table-6 : Percent Enrolment in Polytechnics
Place Polytechnics Nursing Teaching
Male Female Male Female Male Female
India 82.77 17.23 13.43 86.57 37.08 62.92
J&K 80.43 19.57 50.30 49.70 34.46 65.54
Source : All India Survey on Higher Education 2015-2016, MHRD.
Moreover it is found that in the traditional roles of females like nursing and
teaching females are in maximum numbers. In 2015 the number of females In India
in profession of nursing were 86.57% against 13.43% males, of total 229848
persons.18 Similarly in teacher training there are 62.92% females and 37.08% malesof the total 217556 persons.
Exhaustive lists of Fields of Education are listed in Indian Standard
Classification of Education (InSCED) published by the Ministry, which are
categorized on the basis of academic and professional orientation. Management
wise distribution of enrolment into academic and professional education at Post
Graduate and Under Graduate levels are shown in the statement below.
144 Manik Sharma

Women, Education and Stereotyping 145
Table-7 : Enrolment at Undergraduate and Post Graduate level for Managementat all India Level
Level Academic Professional
Male Female Male Female
Undergraduate 49.73 50.27 61.79 38.21
Post Graduate 40.96 59.04 55.25 44.75
Source : All India Survey on Higher Education 2015-2016, MHRD.
Talking in terms of employment, the university teachers categorised as
Professors, Associate Professors, and Assistant Professors sketches the societal
inequalities prevalent in Indian Society.
Table 8 : Post wise percentage of male and female teachers
Place Professor orEquivalent
Reader or AssociateProfessor
Lecturer/AssistantProfessor
Male Female Male Female Male Female
India 74.15 25.85 65.17 34.83 60.70 39.30
J&K 73.04 26.96 62.59 37.41 55.90 44.10
Source : All India Survey on Higher Education 2015-2016, MHRD.
The figure shows that in case of J&K there are 44.10% female and 55.90% maleAssistant Professors. The difference rises as we move higher. In case of AssociateProfessor in India there are only 34.83% females against 65.17% male associateprofessors. The difference is more in case of professors where there are only 25.85% females as compared to 75.15% male professors.
Also in the recent result of Joint Entrance Examination (Advanced) declaredfor 2016, out of 36566 candidates there were only 12.4% female candidate who have qualified the exam.19 However in rural areas, female labour force participationamong women aged 15 years and above has fallen from 49% in 2005 to 36% in 2012.More than half of the decline is due to the scarcity of suitable jobs a the local level.20
The gender difference also worsens in other discriminate categories asScheduled Castes, Scheduled Tribes and Other Backward Classes. As we see theenrolment of Scheduled castes, Scheduled Tribes and Other Backward Categoriesit is found that scheduled caste enrolment percentage for males is less than thefemales in J&K but the data as per whole India females are less for all categories.
Table-9 : Percent Enrolment in various social categories
Place All Categories Scheduled Castes Scheduled Tribes Other BackwardClasses
Male Female Male Female Male Female Male Female
India 55.91 44.09 54.17 45.83 53.79 46.21 53.44 46.56
J&K 48.87 51.13 44.91 55.09 54.77 45.23 56.58 43.42
Source : All India Survey on Higher Education 2015-2016, MHRD.

Table-10 : Percentage of teachers among various social categories
Place All Categories Scheduled Castes Scheduled Tribes Other BackwardClasses
Male Female Male Female Male Female Male Female
India 60.90 39.10 65.66 34.34 61.76 38.24 61.57 38.43
J&K 60.68 39.32 73.08 26.92 62.90 37.10 65.56 34.44
Source : All India Survey on Higher Education 2015-2016, MHRD.
Among the teaching positions for all categories female lag behind males. Inall categories the female teachers’ percentage in higher education lies between26-40% approx.
In relation to dalits and their participation in higher education JosephBenjamin explained that for years together education has been trying its level bestto uplift the weaker section of society.21 The main objective of Indian Educationsystem had been to provide education equal access to all. Discriminatingprotection in the form of reservation has been accorded to Scheduled Castes /Scheduled Tribe and the other Backward Classes irrespective of gender divide.More than sixty years of independence, sixty years of implementation ofreservation in the field of education and more than 50 years of establishment ofUniversity Grants Commissions, still the dalits in India have not satisfactory access of higher education. They still lag behind in the field of higher education. We doneed to improve the quality in higher education but at same time we need toimprove the lot of disadvantaged groups of Indian society. Many educationalcommissions had been set-up by the Central government yet not sufficient dent has been made on this intractable problem.
Thus Education should be inculcated to disadvantaged section with specialefforts to pull them in comparison to the general categories. Special efforts arerequired which tackles with the inequalities prevalent in the Indian society.
In other fields also the picture regarding the gender difference reflects thesame view. A study done by Rosalind Gill on the participation of women in mediareflects the same picture.22 The condition of women in developed countriesindirectly derives the same for developing ones. In some industries (e.g. computergames), women are barely present at all-averaging 5% across the differentcomponent fields (online, multimedia, etc.). In others, the issue is one ofoccupational segregations. In the film industry, for example, women dominate inwardrobe and make-up yet constitute only a small minority (average 15%) in keycreative roles such as directors, screenwriters, and cinematographers. Intelevision, women’s representation is better, but primarily at more junior levels.Overall, women working in the media and cultural industries are significantlybetter qualified than their male counterparts, with a greater proportion beinggraduates and an even more significant difference in the numbers of women,compared with men, with higher degrees. Moreover, women are significantlymore likely to have undertaken industry-specific training. Nevertheless, they earn
146 Manik Sharma

Women, Education and Stereotyping 147
on average of 15% less than their male colleagues and are much less likely to bepromoted or to make it into senior position.23
In a recent study done in U.S.A on the theme Gender and Patenting it isfound that women receive only 7.5% patents and men receives 82.5% patents andremaining 5.5% are the commercialized patents. The most important factorcontributing to this patent gender gap is men’s over representation in patentintensive fields such as electrical and mechanical engineering.
Talking about women participation in technology specific industries it isfound that Google - a search giant claims that less than one percent of girls studyComputer Science in U.S. According to Google, girls start out with a love forScience and Technology up until middle school (74%), before losing it somewherealong the way. By college only 0.3% girls actually plan to study Computer Science.It is surprising that if America is struggling with the problem of underrepresentation of women in technology, it can be easily assumed that India has todo a lot of work to let the women participate in the field of Technology.24
4. Conclusion
With independence, the goals of nation building engulf education to their fold.Men and women were seen as the equal partners of development, and education isregarded as an instrument to change the traditional role of women. Women’seducation gathered momentum after independence but still there exists a gap in theopportunities provided for women’s education vis-a-vis men’s education. Theexpansion of women’s education under the new dispensation has, however,changed the notions of the society towards women education but their education isaccepted with their traditional roles. Women education which was started withminimum at the eve of independence has covered a long distance but yet needs sternefforts. The general notion attached with the women education is that it is a mean toenable them to play their domestic roles better. But it is not taken as the criteria toradically redefine women’s role in society. They are not still being regarded as equalto men in legitimately regarding pursuit of career as the main goal in life.
It is not enough to only formulate policies to reduce male-female disparitiesbut strategies have to be evolved to reduce the gender gaps so that educationalfacilities are fully utilized to change the society as well as to strengthen the nationaldevelopment. It is required to evaluate the education a whole process as itreinforces the traditional gender ideology and fail to generate change. It cannot betaken as granted that education universally promotes institutional and valuechanges which are desired by policy makers. It should be evaluated to assess howfar it is received by all the sections of the society.
References
1, Pino M. Yancovic, “Parents defense of Their Children’s Right to Education: Resistance
Experiences Against Public School Closings in Chile”, Education, Citizenship and
Social Justice, 10(3), 2015, 254- 265. doi: 10.1177/1746197915607279.

2. Ministry of women and child development (2014-15). Annual Report 2014-15. Retrievedfrom http://wcd.nic.in/annual-report
3. “To improve the Intake of Girls, IITs to bring in 20% quota”, Indian Express, April 16,2017.
4. M. Haralmbos and R.M Heald, Sociology : Themes and Perspectives, New Delhi : OUP,2011.
5. M. D. Usha Devi, “Research Perspective for Understanding Women’s Education”,Economic and Political Weekly. 27(24/25), 1992, 1279-1282. http://www.jstor.org/stable/4398516
6. Ila Patel, “The Contemporary Women’s Movement and Women’s Education in India”,Springer. 44, No. 2/3(1998): 155-175. http://www.jstor.org/stable/3445176
7. Ibid.
8. Karuna Chanana, “The Dialectics Of Tradition And Modernity And Women’sEducation in India”, Sociological Bulletin, 39(1/2),1990,. http://www.jstor.org/stable/23634527
9. Ila Patel, “The Contemporary Women’s Movement and Women’s Education in India”,Springer, 44(2/3), 1998, 155-175. http://www.jstor.org/stable/3445176
10. Ibid.
11. Geeta. G. Kingdon, “The progress of school education in India”, Oxford Review ofEconomic Policy, 23(2), 2007.. http://www.jstor.org/stable/23606611
12. Ila Patel, “The Contemporary Women’s Movement and Women’s Education in India”,Springer, 44(2/3), 1998, 155-175. http://www.jstor.org/stable/3445176
13. Ibid.
14. Census of India (2001). http://www.censusindia.gov.in/
15. Rebeca A. Echávarri and R. Ezcurra, “Education and Gender bias in the Sex ratio atBirth: Evidence from India”, Demography. 47(1), 2010, 249-246.
16. Karuna Chanana, “The Dialectics Of Tradition And Modernity And Women’sEducation in India”, Sociological Bulletin, 39(1/2), 1990,.http://www.jstor.org/stable/ 23634527
17. A.Dogra and N. Jayaraj, “The She in Science: The Life and Work of Indian FemaleScientists”, Economic and Political Weekly, 15, No. 22 (2016) http://www.epw.in//web-exclusives.
18. Ministry of Human Resource and Development, “All India Survey on Higher Education2015-2016”, (2016). Retrieved from mhrd.gov.in/sites/upload_files/mhrd/files/statistics/ PilotReport_1.pdf
19. “Jaipur boy tops IIT-JEE”, The Tribune, June 12, 2016, 1.
20. “Since 2005 fewer jobs for women in India”, Indian Express, July 27, 2016.
21. Joseph Benjamin, “Dalit and Higher Education in India”, The Indian Journal of PoliticalScience, 69(3), 2008. http://www.jstor.org/stable/41856451
22. Rosalind Gill, “Unspeakable Inequalities: Post Feminism, Entrepreneurial Subjectivity,and the Repudiation of Sexism among Cultural Workers”, Social Politics, 21(4), 2014.http://sp.oxfordjournals.org/
23. Ibid.
24. Jayesh Shinde, “Conquering Challenges”, Digit, 12 (2015). ê
148 Manik Sharma
Article Received on July 11, 2017; Accepted on September 14, 2017

14
Social Media : An Emerging Tool of
Teaching and Learning
Pirshant Kumar*
Social Media Tools are an integral and important part of society. Social Media is all aboutnetworking, sharing and generating knowledge and all these features are of great value in thecontext of higher education. Indian universities are also not behind and most of the Universities areengaged to make their campus Wi-Fi. Universities have well developed social media strategies anduse a suite of social media tools for various purposes including internal and externalcommunications, recruitment, sharing research findings and highlighting student initiatives.Social Media tools have an important place inside the classroom and they can help improve learningenvironments and increase students’ engagement. This study is conducted in C.C.S. UniversityCampus, Meerut, India where campus is recently made wi-fi for students and faculty use. Thestudy explores whether Social Networking Tools are used by students and faculty for educationaldiscussions. Since India is still a developing country this study will help us to find out whetherSocial Media Tools are effectively used by students and teachers similarly as in developed countries.To explore these facts a study is conducted on 100 students of C.C.S. University Campus, Meerut,India. They were asked to fill a questionnaire which was designed to know the role of Social MediaTools for teaching and learning purpose. After analysis the study states that Social Media tools areeffectively used by the teachers and the students for teaching and learning process.
[Keywords : Social media tools, Higher education, Privacy, Engagement,
Technology]
1. Introduction
From Facebook to Twitter and blogs, social media tools are an integral andimportant part of society, and these tools are here to stay. Social media is about
CONTEMPORARY SOCIAL SCIENCES, Vol. 26, No. 3 (July-September), 2017
* Lecturer, Department of Journalism & Mass Communication, C.C.S. University, Meerut, UttarPradesh (Indial) E-mail: <[email protected]>

collaborating, networking, sharing and generating knowledge and content, and all
of these features are of great value in the context of higher education. Today’s
Universities have well-developed social media strategies, and use a suite of social
media tools for various purposes including internal and external communications,
recruitment, sharing research findings, and highlighting exciting student
initiatives.
Social media tools and technology are also making their way into theclassroom, although the 2013 Pearson Report (Seama & Tinti-Kane, 2013) indicatesthat its use in teaching lags behind other uses, and that “faculty are much morewilling to embrace social media in their personal lives than they are to use it forprofessional or teaching purposes”. However, active proponents are quick to relate how these tools increase student engagement and have a positive influence onteaching and learning. Yan (2008) says that all these Social Networking Sites createand give opportunities for students to share, collaborate, showcase and growtogether. At the Rhone Island School of Design for example, e-portfolio basedonline learning communities give teachers and students the ability to personalizeand share their content. In the United Kingdom, at a school in Haslemere, Surrey,sixth graders are using a social network to post book reviews and critique eachother’s writing (McLean, 2006).
Social Media Tools have an important place inside the classroom, and they can help improve learning environments and increase student engagement. Theirinclusion in education has reveled positive impact on students. Many studies wereconducted earlier on this topic and they suggest that the use of Social NetworkingSites by students bring positive changes in their results. Eleanor Yang Su, (2011)quotes in his articles that Professor Christine Greenhow has found that studentsbuild important bonds when they connect with school friends on SocialNetworking Sites. “When students feel connected and have a strong sense ofbelonging to the education community, they do better in the educationalinstitutions”, said Greenhow, an education professor. “They persist in education athigher rates and achieve at higher rates. It’s pretty promising that engaging in Social Networking Sites could help them to develop and deepen their bonds over time.”Greenhow acknowledges there are potential pitfalls, but says it’s short sighted toignore the positive aspects. She has studied adolescent Internet habits since 2007,and found that high school students are boosting their creativity and technical skillsthrough the sites. The main benefit of using Social Networking Sites in the field ofeducation is that the discussion is not limited within the boundaries of a classroom.Students are free to get and share their ideas on a broad level. Educational projectdeveloped by Ligorio & Van der Meijden (2007) state that Social Networking Sitesalso allow users to exchange information and ideas not only within the boundariesof a classroom, but across schools, districts, states and the world.
Madge et al., (2009) in their research on SNS say that Facebook is one of theSocial Networking Sites that has become so popular among college students. Therehave been many studies about using Facebook as a learning tool. “Most students
150 Pirshant Kumar

Social Media : An Emerging Tool of Teaching and Learning 151
joined Facebook because Facebook was associated with university-leveleducation”. Facebook is mainly used to keep up with social aspects of college lifeand it is a part of most students’ daily routine. However, this statement iscontradicted by the study conducted by Seaman & Tinti-Kane (2013) whichconcludes that Blogs and Wikis are the tools most commonly used in classrooms,followed by Podcasts, Linkedin, Facebook and Twitter. Some studies say thatFacebook is preferred more by females than by males. Kolek and Saunders (2008)have found that Facebook is preferred by women and therefore, women are likelyto be more receptive to use in education. Other research by Sussman & Tyson,(2000) indicates that women are generally more active than men in onlinecommunities where information is shared and topics are discussed.
Despite the generally positive impressions about social media use inhigher education, it’s important to recognize that not every context is appropriatefor using these tools, not everyone should use them, and they should not be usedcarelessly. Schroeder et al. (2010) provide a good overview of the strengths andweaknesses of social media in higher education, and they report importantconcerns related to increased workload, quality of interactions, data ownershipand assessment, among others. These concerns are mirrored by the Pearsonsurvey: the majority of faculty are concerned about their own privacy, as well as the privacy of their students, and 60% of those surveyed felt that “others outside ofclass should not be able to view class-related content” (Seaman & Tinti-Kane,2013). Therefore, using social media tools in the classroom requires carefulattention to these issues, and Universities certainly need to develop guidelines forthe use of social media tools in the classroom. In addition, instructors must besavvy with social media technologies, etiquette, and ‘terms of use’ beforeintroducing them into the classroom context.
This study is conducted in C.C.S. University Campus, Meerut, India wherecampus is recently made wi-fi for students and faculty use. The study exploreswhether Social Networking Tools are used by students and faculty for educationaldiscussions. Since India is still a developing country this study will help us to findout whether Social Media Tools are effectively used by students and teachers as indeveloped countries.
2. Methods
The study is made over 90 randomly selected students and 10 teachers ofC.C.S. University Campus, Meerut, India. Among these 100 respondents there are54 males and 46 females. These students were further divided as 60 Post Graduate,20 M.Phil. and 10 Ph.D. Students. These selected students were asked to fill aclose-ended questionnaire.
3. Presentation of Data and Discussion
Data collected for this paper are presented and discussed in tables-1 to 7.

Table-1 : Do you use Social Media
Response Frequency Percent
Yes 95 95.0
No 5 5.0
Total 100 100.0
Social Media is very popular among respondents. 95% of the respondentsagree that they use Social media.
Table-2 : Do you use Social Media to search topics related to your Course
Response Frequency Percent
Yes 90 90.0
No 10 10.0
Total 100 100.0
Social media is used by 90% respondents to search the topics related to theirsyllabus. This shows that Social media is widely used as learning tool.
Table-3 : Do you find new content related to your subject on Social Media
Response Frequency Percent
Yes 91 91.0
No 9 9.0
Total 100 100.0
Social media is used to find new content related to the subject. Students andteacher learn many new things related to the syllabus on Social media. 91%respondents agree that they gain wider knowledge of their subject with the help ofSocial media.
Table-4 : If you find any new information related to your subject do you share it withyour classmates/students/colleagues
Response Frequency Percent
Yes 90 90.0
No 10 10.0
Total 100 100.0
Social media is platform gain information and share ideas. 90% respondentsagree that when they gain anything new from Social media they share that contentwith their friends and class-mates. This increase their participation in onlineconversation and online community.
Table-5 : Social Media creates a better environment for teaching and learning
Response Frequency Percent
Yes 89 89.0
No 11 11.0
Total 100 100.0
152 Pirshant Kumar

Social Media : An Emerging Tool of Teaching and Learning 153
Social media creates a better environment of teaching and learning is
accepted by 89% of our respondents.
Table-6 : Do you think Social Media increase your engagement in
teaching and learning process
Response Frequency Percent
Yes 87 87.0
No 13 13.0
Total 100 100.0
Social media is considered as an aid in teaching and learning process. An
overwhelming majority of respondents do agree that Social media increase your
engagement in teaching and learning process
Table-7 : Are you concerned about your privacy while using Social Media
Response Frequency Percent
Yes 70 70.0
No 30 30.0
Total 100 100.0
Privacy is always a matter of great concern. 70% respondents agree that they
are conscious of their privacy while using Social media.
3. Conclusion
The average duration of using Social Media by our 100 respondents is 2.25
hours. It is also to be mentioned here that minimum usage of Social Media is 30
minutes and maximum usage is 5.5 hours. The average use of Social Media by PGstudents is 2.3 hours, M.Phil. Students is 2.6 hours ,Ph.D. students is 1.8 hour and
teachers is 1.7 hour. We also asked two open ended questions from our
respondents which were what are the benefits of using Social Media as tool of
teaching and learning and another was the disadvantage of using social Media as a
tool of teaching and learning.
The main finding of the research was Social Media is helpful in finding new
content related to subject. Students and teachers learn many new things related to
subject on Social Media. Social media is a platform to gain information and share
ideas. 90% respondents agree that when they learn anything new from Social
media they share the same content with their friend and classmates. This increases
their participation in online conversation and online community. Social media
create a better environment for teaching and learning. Privacy is always a matter of
great concern. 70& of the respondents agree that they are conscious of their privacy
while using Social media. To conclude it could be said that the present study
supports various studies conducted earlier on the use of Social media in the field of
education and it can be effectively used in the field of education.
References
1. Ellison, N. B., Charles Steinfield & Cliff Lampe, “The Benefits of Facebook ‘Friends’:
Social Capital and College Students’ Use of Online Social Network Sites”, Journal of
Computer-Mediated Communication, 12, 2007, 1143-1168.
2. Foon Hew, K., “Students’ and teachers’ use of Facebook”, Computers in Human
Behaviour, 27, 2011, 662-676.
3. Francis, L. J., “Happiness is a thing called stable extraversion, A further examination of
the relationship between the Oxford Happiness Inventory and Eysenck’s dimensional
model of personality and gender”, Personality and Individual Differences, 26, 1999,
5-11.
4. Gennaro, C. D. & Dutton, W. H., “Reconfiguring friendships: Social relationships and
the Internet”, Information, Communication & Society, 10, 2007, 591-618.
5. Gill, T., “Space-oriented children’s policy : creating child-friendly communities to
improve children’s well-being”, Children and Society, 22, 2008, 136-142.
6. Golder, S., Wilkinson, D. & Huberman, B., “Rhythms of social interaction: messaging
within a massive online network”, C. Steinfield, B. T. Pentland, M. Ackerman, and
Contractor (eds.), Communities and Technologies : Proceedings of the Third
International Conference on Communities and Technologies, London : Springer, 2006,
41-66.
7. Griffin, M. A., Neal, A. & Neale, M., “The contribution of task performance and
contextual performance to effectiveness: Investigating the role of situational
constraints”, Applied Psychology: An International Review, 49, 2000, 516-532
8. Grint, Keith & Steve Woolgar, “Configuring the User : Inventing New Technologies”,
Keith Grint and Steve Woolgar (eds.), The Machine at Work : Technology, Work, and
Organization, Cambridge, UK : Polity Press, 1997, 65-94.
9. Gross, R. & Acquisti, A., Information Revelation and Privacy in Online Social
Networks, Workshop on Privacy in the Electronic Society, Alexandria, VA, 2005, ACM
Press.
10. Guo, C. Q., Whim, J. P. & Otondo, R., “Social network services in China : An integrated
model of centrality, trust, and technology acceptance”, Journal of Global Information
Technology Management, 13(2), 2010, 76-99.
11. Hargittai, Eszter, “Whose Space? Differences Among Users and Non-Users of Social
Network Sites”, Journal of Computer-Mediated Communication, 13,2008, 276-297.
12. Haridakis, P. M. & Whitmore, E. H., “Understanding electronic media audiences:The
pioneering research of Alan M. Rubin”, Journal of Broadcasting and Electronic Media,
50(4), 2006, 766 - 774.
13. Haythornthwaite, C., “ Social network analysis: an approach and technique for the study
of information exchange”, Library & information science research, 18 (4), 1996, 323-342.
14. Hew, K., (2010). “Students’ and teachers’ use of Facebook”, Computers in Human
Behaviour, 27 (2011) 662-676, http://portal.acm.org/citation.cfm?id= 1937203.1937626 .
(Accessed on October 4, 2010). ê
154 Pirshant Kumar
Article Received on June 20, 2017; Accepted on August 29, 2017

15
Infrastructure of Powerloom Shawl
Weaving Units in Ludhiana
Omika Sharma* and Vandana Gondotra**
The present investigation was carried out in Ludhiana city. An interview schedule wasformulated to collect the required information from the powerloom shawl weaving unitsregarding the infrastructure of the units. Data were collected with the help of pre structuredinterview schedule from 60 randomly selected powerloom shawl weaving units. The results of thestudy revealed that 38.33 percent units were established 10 to 20 years back and 85.00 percent ofunits were in small scale category while 15.00 percent of the units were in the medium scalecategory .About 33 percent units had made fixed capital investment of `40 lakhs to 60 lakhs toestablish the unit, 41.67 percent had done working capital investment between `20 lakhs to 40lakhs. Majority of the units, i.e. 75.00 percent invested capital on their own while 50.00 percenttook loan from banks. The maximum percentage of units, i.e. 46.15 percent borrowed fundsbetween `40 lakhs to 60 lakhs to start the unit, 51.67 percent had installed capacity of 10 to 30power looms, 60.00 percent possessed semi computerized looms to prepare shawls.
[Keywords : Shawls, Powerloom, Investment, Funds, Testing, Finishing]
1. Introduction
Shawl is the traditional woollen product which holds universal fame. Shawlsare used to complement a costume, to keep the body warm and for symbolicreasons (Anonymous, 2015). Every turn of the century, increased the preferenceand demand for shawls. With the development of technology, a revolutionary
CONTEMPORARY SOCIAL SCIENCES, Vol. 26, No. 3 (July-September), 2017
* M. Sc. Student, Department of Apparel and Textile Science, College of Home Science, PunjabAgricultural University, Ludhiana, Punjab (India) E-mail: <[email protected]>
** Associate Professor, Department of Apparel and Textile Science, College of Home Science, PAU,Ludhiana, Punjab (India) E-mail: <[email protected]>

change came in the manufacturing process of shawls. Present day, shawls likeJamawars take their birth in spinning and dyeing mills and further grow up in thehands of powerlooms and jacquards in the weaving mills and later on pass through various finishing processes to shape them into the form with gorgeous looks anddeftness of touch (Mehta, 1970). These days stoles are also in great demand atnational as well as international market level, which are being made in variety ofcolours and designs. With the advancement of technology and introduction of newyarns, designer shawls and stoles are becoming popular in medium quality to highrange and finer quality for all age groups. Shawl industry of Ludhiana is mainlywool-oriented, but for the past few decades, it has also earned a name for itsproducts of synthetic fibres as well as blends (Chawla, 1984).
2. Research Methodology
The present study was conducted on sixty powerloom shawl units inLudhiana city. An interview schedule was formulated to collect the requiredinformation from the powerloom shawl weaving units regarding theinfrastructure of the units. Data were collected with the help of pre structuredinterview schedule from 60 randomly selected powerloom shawl weaving units.The data were collected personally by administering the schedule to theowners/mangers of the powerloom weaving units. Data collected through theinterview schedule were tabulated in the desired form. The desired data was thengrouped into tables and analyzed using statistical tools like frequency, mean,percentage etc.
3. Findings and Discussion
The results obtained from the present investigation as well as relevantdiscussion have been summarized below :
Regarding the socio economic profile of respondents it was found thatmajority of the respondents, i.e. 36.67 percent belonged to the age of 40 to 50 years,they were graduates (31.67 %), had business family background (23.33 %) andearned between ̀ 50,000 to 1,00,000 per month (36.67 %). The maximum percentageof the units, i.e. 38.33 percent were established 10 to 20 years back and 85.00percent of units were in small scale category while 15.00 percent of the units werein the medium scale category.
Table-1 : Factors for choosing location of unit n=60
Location of unit Mean scores Ranks
Availability of labour 4.40 I
Transport facility 1.21 V
Power supply 2.26 IV
Land in industrial area 4.00 II
Clustering 3.21 III
*multiple responses
156 Omika Sharma and Vandana Gondotra

Infrastructure of Powerloom Shawl Weaving Units in Ludhiana 157
The most preferred factor for choosing location of unit was availability of
labour (weighted mean score 4.40), followed by land in industrial area (weighted
mean score 4.00), clustering (weighted mean score 3.21), power supply (weighted
mean score 2.26) and transport facility (weighted mean score 1.21).
Table-2 : Distribution of units according to their fixed capital n=60
Fixed capital (` lakhs) f %
Up to 20 lakhs 9 15.00
20 lakhs to 40 lakhs 13 21.67
40 lakhs to 60 lakhs 20 33.33
60 lakhs to 80 lakhs 12 20.00
80 lakhs to 1 Crore 6 10.00
It is seen from the table 2 that the maximum percentage of the units, i.e. 33.33
percent had done fixed capital investment of `40 lakhs to 60 lakhs to establish the
unit, 21.67 percent had invested ̀ 20 lakhs to 40 lakhs, 20.00 percent had invested ̀ 60
lakhs to 80 lakhs, 15.00 percent had made investment of ̀ 20 lakhs but 10.00 percent
of the units had invested fixed capital of `80 lakhs to 1 Crore. Fixed capital was
invested on purchase of building and machinery.
Table-3 : Distribution of units according to their working capital n=60
Working capital (` lakhs) f %
Up to 20 lakhs 10 16.67
20 lakhs to 40 lakhs 25 41.67
40 lakhs to 60 lakhs 9 15.00
60 lakhs to 80 lakhs 11 18.33
80 lakhs to 1 Crore 5 8.33
n=60
Fig.-1 : Distribution of respondents according to their sources of capital

It can seen from the table 3 that the maximum percentage of the units, i.e.
41.67 percent had done working capital investment between `20 lakhs to 40 lakhs
followed by 18.33 percent had invested `60 lakhs to 80 lakhs, 16.67 percent had
invested less than `20 lakhs while 15.00 percent had invested `40 lakhs to 60 lakh
and only 8.33 percent of the units had invested working capital between `80 lakhs
to 1 Crore. Working capital was invested on raw material, workers, transport,
electricity etc.
Majority of the units, i.e. 75.00 percent invested capital on their own while
50.00 percent took loan from banks and 23.08 percent units borrowed funds from
their friends and only 11.67 percent units borrowed capital from their family
members.
n=60
Fig.-2 : Distribution of respondents according to amount of borrowed funds
Fig.2 indicates that the maximum percentage of units, i.e. 46.15 percent
borrowed funds between ` 40 lakhs to 60 lakhs followed by 30.76 percentrespondents borrowed between ` 10 lakhs to 40 lakhs and 23.07 percent
respondents borrowed between `80 lakhs to 1 Crore to start the unit.
Table-4 : Distribution of units according to their no. of power looms n=60
Number of power looms f %
10-30 30 50.00
30-60 13 21.67
60-90 8 13.33
90-120 9 15.00
158 Omika Sharma and Vandana Gondotra

Infrastructure of Powerloom Shawl Weaving Units in Ludhiana 159
It is evident from table 4 that maximum percentage of units, i.e. 51.67 percent
had installed capacity of 10 to 30 power looms followed by 25.00 percent of the
units had 30 to 60 power looms, whereas 13.33 percent units had installed capacity
of between 60 to 90 power looms and only 10.00 percent of the units had 90 to 120
power looms.
Table-5 : Distribution of units according to type of power looms possessed n=60
Type of power looms f %
Electrically driven 10 16.67
Semi computerized 36 60.00
Fully computerized 21 35.00
*multiple response
The data in table-5 shows that the majority of units, i.e. 60.00 percent
possessed semi computerized looms followed by 35.00 percent possessed fully
computerized looms and only 16.67 percent possessed electrically driven looms to
prepare shawl and 80.00 percent were getting finishing of shawls done from the
outside within, whereas only 20.00 percent of the units were finishing shawls
within their units.
n=60
Fig.-3 : Distribution of units according to type of finishes given to shawls
It is seen from the fig 3 that all the units were finishing their shawls by
ironing, 80.00 percent were finishing their shawls by softening and 63.33 percent
were finishing their shawls by blowing. Majority of the units, i.e. 51.66 percent had
no facility for such tests and only 48.33 percent units had facility for testing the
shawls.

n=60
Fig.-4 : Distribution of units according to type of testing conducted on the shawls
Majority of the units, i.e. 86.21 percent tested shawls for tensile strength,while shrinkage test were conducted by 72.41 percent units and test for colourfastness to washing were performed by 55.17 percent of units.
4. Conclusion
It is concluded that Ludhiana shawl weaving units have good infrastructurefacilities as results indicate that maximum percentage of units, i.e. 51.67 percenthad installed capacity of 10 to 30 power looms followed by 25.00 percent of theunits had 30 to 60 power looms, whereas 13.33 percent units had installed capacityof between 60 to 90 power looms and only 10.00 percent of the units had 90 to 120power looms. Majority of units, i.e. 60.00 percent possessed semi computerizedlooms followed by 35.00 percent possessed fully computerized looms and only16.67 percent possessed electrically driven looms to prepare shawl. In view of themiraculous expansion of shawl weaving industry and with the production ofvariety of designs there is tremendous scope for growth of this industry in thecoming years. Data reveals that annual production of shawl is quite high in volume and shawls are being exported to other countries also. Thus the future ofpowerloom shawl industry of Ludhiana is expected to be very bright with themodernization of shawl industry.
References
1. Anonymous (2015) Definition of Shawl. Retrieved from https://en.wikipedia.
org/wiki/shawl 15-2-2016.
2. Chawla, K., “Hosiery Industry in Doldrums”, The Tribune, 1984, 9.
3. Mehta, J., Master Pieces of Indian Textiles, Bombay : D.B. Taraporevala Sons and Co.
Pvt. Ltd., 1970, 13. ê
160 Omika Sharma and Vandana Gondotra
Article Received on July 04, 2017; Accepted on September 10, 2017

16
Child Sexual Abuse and the
POCSO Act
Geetika Garg*
India is the home to 430 million children which is approximately includes one in every fivechildren below the age of 18 years, in the world.1 They face staggering challenges from the day they are born such as Malnutrition, illiteracy, trafficking, forced labor, drug abuse, sexual abusepornography etc. The paper particularly deals with the problem of child sexual abuse in India andthe role played by the POCSO Act. It has been suggested that the state must not waste timeexploring alternatives when the answers exist in a law made by Parliament for these specialoffences against children, the most vulnerable section of the society.
[Keywords : Child sexual abuse, Sexual assault, POCSO Act, Judicial approach,
Children’s Court]
1. Child Sexual Abuse
Child sexual abuse includes physical or psychological maltreatment of a child
usually by a person who is in a position of trust and confidence in relation to the
child. The person uses the child for sexual stimulation or for sexual gratification.
National study undertaken by the Ministry of Women and child development2
defined ‘sexual assault’ as making the child fondle with his/her private parts or
making the child exhibit private body parts and being photographed in the nude.3
However, the report did not exhibit the true reality because most of the cases go
unreported because of the stigma attached to it in our society. A study conducted
CONTEMPORARY SOCIAL SCIENCES, Vol. 26, No. 3 (July-September), 2017
* Assistant Professor, Department of Law, N. A. S. (Post-graduate) College, Meerut, Uttar Pradesh(Indial) E-mail: <[email protected]>
by the UNICEF after the 2012 Delhi gang rape revealed that one in every three rape
cases, the victim is a child and these incidences are increasing at an alarming rate.4
Approximately 7200 children including infants are raped every year which is an
issue of serious concern.5
Sexual offences before 2012 were covered only under different sections of
IPC. The IPC does not provide for all types of sexual offences against children and,
more importantly, does not distinguish between adult and child victims.
Various sections of the IPC dealing with sexual offences were also applied to
the cases of child sexual abuse resulting in serious miscarriage of justice as the
provisions were not reasonably sufficient for their application to cases of child
sexual abuse. Section 354 IPC punishes a person for outraging the modesty of a
woman by use of criminal force but if we apply this section to case of say sexual
assault of an infant the serious problem which would arise is what modesty does a
child of 2 years have. The application of provisions dealing with adults created
numerous problems when applied to cases of child sexual abuse. Therefore, to
solve these problems parliament enacted a special legislation POCSO Act in May
2012.
2. Crime Rate as per National Crime Records Bureau
According to the National Crime Records Bureau’s Crime in India 2015
report6, the total reported cases across India under two sections of the POCSO Act
(of penetrative sexual assault) are 8,800. Of these, 8,341 are cases where the
offenders were known to the victims. And 929 were immediate family members -
grandfather, father, brother or close family member. In such cases, right from
reporting the crime to rehabilitation during and after the trial, survivors often find
the critical support from families missing.
3. UN Convention and Constitutional Provisions
Several cases of child abuse have all over the world have caused grave
concern to the humanity. Article 34 of the Convention of Rights of the Child (20
November 1989) ordains the Member States to protect the child from all forms of
sexual exploitation and sexual abuse. For these purposes, State Parties are required
to take all appropriate national, bilateral and multilateral measures to prevent :
1. The inducement or coercion of a child to engage in any unlawful sexual
activity;
2. The exploitative use of children in prostitution or other unlawful sexual
practices;
3. The exploitative use of children in pornographic performances and materials.
162 Geetika Garg

Child Sexual Abuse and the POCSO Act 163
Articles 39(f) of the Constitution of India, one of the Directive Principles of
State Policy requires the State to direct its policy towards securing that the
childhood and youth are protected against exploitation and against moral and
material abandonment.
There is thus a great need for making strict provisions relating to child sexual
abuse or assault.
4. Law Commission Report
The Law Commission in its 172nd Law Commission report has reviewed
complete law dealing with sexual offences after the case of Sakshi v. UOI.7
The Law Commission recommended8 changing the focus from rape to ‘sexual
assault’, the definition of which goes beyond penile penetration to include
penetration by any part of the body and objects, taking into account cunnilingus
and fellatio.
The report recommended the deletion of Section 155(4) of the Indian
Evidence Act, which would prevent a victim of rape from being cross-examined
about her ‘general immoral character’ and sexual history. It suggested graded
sentences, with higher punishment for rape committed by the relatives and
persons in ‘trust or authority’, public servants, and superintendents, management
and staff of hospitals. It introduced a new Section 376(E), which would include
sexual harassment at the workplace.
The commission recommended shifting the burden of proof of consent to the
accused. It suggested specific provisions that would deal with the medical
examination of the victim as well as the accused by a registered medical
practitioner. It said that girls who are victims of rape should be questioned only by
a female police officer, in the absence of whom a qualified woman from a
recognized social organization should do the questioning.
The commission suggested that the law relating to sexual assault be made
gender neutral, that is, men and women can be charged with the rape of men,
women and children. This meant that for the first time the sexual assault of minor
boys was made prosecutable under the law. It asked for Section 377 of the IPC to be
dropped, thus decriminalizing sodomy.
However, the recommendations did not take into account marital rape. It
raised the age of consent of the wife from 15 to 16 years, after which the woman is
not protected from rape by the husband. It also continues to provide a window for
Judges to reduce the sentence in case of convictions below the minimum sentence
specified, as suggested by the commission which states : “Any number of
situations may arise, which the Commission cannot foresee that may necessitate
the awarding of a lesser punishment.”

5. The Protection of Children from Sexual Offences Act (POCSO
Act) 2012
The Protection of Children from Sexual Offences Act (POCSO Act) 20129 was
formulated in order to effectively protect children from sexual abuse and sexual
exploitation of children. The Protection of Children from Sexual Offences Act, 2012
received the President’s assent on 19th June 2012 and was notified in the Gazette of
India on 20th June, 2012. It becomes enforceable from 14 November 2012.
The Protection of Children from Sexual Offences (POCSO) Act 2012 is
applicable to the whole of India except the state of Jammu and Kashmir. For the
first time, a special law has been passed to address the issue of sexual offences
against children.
The POCSO Act defines a child as any person below eighteen years of age. It
defines different forms of sexual abuse, including penetrative and non-penetrative
assault, as well as sexual harassment and pornography.
It deems a sexual assault to be “aggravated” under certain circumstances,
such as when the abused child is mentally ill or when the abuse is committed by a
person in a position of trust or authority like a family member, police officer,
teacher, or doctor. The Act also casts the police in the role of child protectors during
the investigative process. Thus, the police personnel who are receiving a report of
sexual abuse of a child are given the responsibility of making urgent arrangements
for the care and protection of the child, such as obtaining emergency medical
treatment for the child and placing the child in a shelter home, and bringing the
matter in front of the CWC, should the need arise.
Punishments for Offences covered in the Act are :
8 Penetrative Sexual Assault (Section 3) - Not less than seven years which may
extend to imprisonment for life, and fine (Section 4)
8 Aggravated Penetrative Sexual Assault (Section 5) - Not less than ten years
which may extend to imprisonment for life, and fine (Section 6)
8 Sexual Assault (Section 7) - Not less than three years which may extend to five
years, and fine (Section 8)
8 Aggravated Sexual Assault (Section 9) - Not less than five years which may
extend to seven years, and fine (Section 10)
8 Sexual Harassment of the Child (Section 11) - Three years and fine (Section
12)
8 Use of Child for Pornographic Purposes (Section 13) - Five years and fine and
in the event of subsequent conviction, seven years and fine (Section 14 (1))
8 The Act further makes provisions for avoiding the re-victimization of the
child at the hands of the judicial system.
164 Geetika Garg

Child Sexual Abuse and the POCSO Act 165
The Act provides for the establishment of Special Courts for trial of offences
under the Act, keeping the best interest of the child as of paramount importance at
every stage of the judicial process. The Act incorporates child friendly procedures
for reporting, recording of evidence, investigation and trial of offences. These
include :
8 Recording the statement of the child at the residence of the child or at the
place of his choice, preferably by a woman police officer not below the rank of
sub-inspector
8 The police officer recording the statement must not be in the uniform.
8 No child to be detained in the police station in the night for any reason.
8 The statement of the child to be recorded as spoken by the child
8 Assistance of an interpreter or translator or an expert as per the need of the
child
8 Assistance of special educator or any person familiar with the manner of
communication of the child in case child is disabled
8 Medical examination of the child to be conducted in the presence of the
parent of the child or any other person in whom the child has trust or
confidence.
8 In case the victim is a girl child, the medical examination shall be conducted
by a woman doctor.
8 Frequent breaks for the child during trial
8 Child not to be called repeatedly to testify
8 No aggressive questioning or character assassination of the child
8 In-camera trial of cases
8 Wherever possible Magistrate or Police Officer shall ensure that the
statement of the child to be recorded by Audio video electronic means.
8 Police officer must ensure that victim is not come in contact with the accused
during investigation.
The Act also provides for mandatory reporting of sexual offences. This casts a
legal duty upon a person who has knowledge that a child has been sexually abused
to report the offence; if he fails to do so, he may be punished with six months’
imprisonment and/ or a fine.
The Act recognizes that the intent to commit an offence, even when
unsuccessful for whatever reason, needs to be penalized. The attempt to commit an
offence under the Act has been made liable for punishment for up to half the
punishment prescribed for the commission of the offence. The Act also provides for
punishment for abetment of the offence, which is the same as for the commission of
the offence. This would cover trafficking of children for sexual purposes.

For the more heinous offences of Penetrative Sexual Assault, Aggravated
Penetrative Sexual Assault, Sexual Assault and Aggravated Sexual Assault, the
burden of proof is shifted on the accused. This provision has been made keeping in
view the greater vulnerability and innocence of children. At the same time, to
prevent misuse of the law, punishment has been provided for making false
complaint or proving false information with malicious intent. Such punishment
has been kept relatively light (six months) to encourage reporting. If false
complaint is made against a child, punishment is higher (one year).
The media has been barred from disclosing the identity of the child without
the permission of the Special Court. The punishment for breaching this provision
by media may be from six months to one year. For speedy trial, the Act provides for
the evidence of the child to be recorded within a period of 30 days. Also, the Special
Court is to complete the trial within a period of one year, as far as possible.
To provide for relief and rehabilitation of the child, as soon as the complaint is
made to the Special Juvenile Police Unit (SJPU) or local police, these will make
immediate arrangements to give the child, care and protection such as admitting
the child into shelter home or to the nearest hospital within twenty-four hours of
the report. The SJPU or the local police are also required to report the matter to the
Child Welfare Committee within 24 hours of recording the complaint, for long
term rehabilitation of the child.
The Act under section 43, casts a duty on the Central and State Governments
to spread awareness through media including the television, radio and the print
media at regular intervals to make the general public, children as well as their
parents and guardians aware of the provisions of this Act. The National
Commission for the Protection of Child Rights (NCPCR) and State Commissions
for the Protection of Child Rights (SCPCRs) have been made the designated
authority to monitor the implementation of the Act.
POCSO Act provides for relief and rehabilitation as soon as the complaint is
made to the Special Juvenile Police Unit or the local police, who are required to
make immediate arrangements for care and protection. The intent to commit an
offence, as defined under POCSO, is also punishable, besides abetment of sexual
abuse against a child.
Special emphasis has been placed on ensuring the speedy disposal of trials in
special children’s courts as well as following of special procedures to keep the
accused away from the child at the time of testifying.
Despite POCSO Act enjoining the Central and State governments to take
measures for giving wide publicity through the media : television, radio and print
and imparting periodic training to all stakeholders on the matters relating to
166 Geetika Garg

Child Sexual Abuse and the POCSO Act 167
implementation of POCSO’s provisions, the Act is relatively unknown.
Shockingly, in the most recent rape case, the Delhi Police included the Act’s
provisions in the FIR reportedly after two days of its filing on April 15, 2013. In the
Apna Ghar Rohtak shelter home case of May 2012, where over 100 inmates were
allegedly subjected to sexual abuse, the POCSO provisions have reportedly still not
been invoked against the accused. The passing of the salutary law is more than
significant for a variety of reasons. It defines exclusively the crime of sexual
offences against children and fulfils the mandatory obligations of India as a
signatory to the United Nations Convention on the Rights of The Child, acceded to
on December 11, 1992. For monitoring and implementation of the provisions of
POCSO, the Act enjoins that the National Commission and State Commissions for
Protection of Child Rights constituted under the Commissions for Protection of
Child Rights Act, 2005, shall ensure the effective implementation of the provisions
of POCSO. The Supreme Court had, in a hard-hitting directive issued on February
7, 2013, ordered all States to ensure that the regulatory and monitoring bodies are
constituted and made functional. However, till date, such Commissions are either
only partially-functional or effectively non-functional.10
6. POCSO Act and Judicial Approach
Acting upon a petition by the National Commission for Protection of Child
Rights (NCPCR), the High Court, in a path-breaking judgment rendered on April
9, 2013, directed Punjab, Haryana and Chandigarh to ensure that State
Commissions for Protection of Child Rights become fully functional, are headed by
a person who has been a Judge of the High Court, and that chairpersons and
members are appointed through a transparent selection process.
The High Court further directed mandatory registration of all children’s
homes, constitution and notification of children’s courts and appointment of
special public prosecutors besides ordering the setting up of a proper panel to
select members of various committees to be set up for child welfare.
Orissa High Court in a recent order in the case of Rajesh Mund @ bulu v. State
of Orissa,11 20th April,2016, held that if the Trial Court is of the opinion that the
police officer while recording the statement of the child victim had deliberately
flouted the provisions prescribed under Protection of Children from Sexual
Offences Act, 2012 (POCSO), in appropriate cases the Court can recommend for
initiation of departmental proceeding against such erring police Officer.
In another landmark judgment, the High Court of Calcutta on 8th March,
2017, in the case of Bijoy @ Guddu Das v. State of West Bengal12, issued additional
directives to conduct investigation and trial under the Prevention of Children from
Sexual Offences (POCSO) Act, 2012.
The court was hearing an appeal against a judgment passed in July 2016,
wherein the appellant was convicted for sexually assaulting an 11-year-old girl.
The appellant now contended that the complainant had failed to prove her case
beyond reasonable doubt. The court, however, upheld the trial court judgment and
noted that any minor deviation in the evidence of the witnesses, as to which part of
the anatomy of the victim was touched, would not bring the act of the accused
outside the purview of the offence of sexual assault under Section 7 of the POCSO
Act. It went on to award a compensation of Rs. 75,000 to the victim, to be paid to her
parents by the state Legal Services Authority. It also modified the sentence
awarded to the accused, awarding h im rigorous imprisonment for three years, in
view of the fact that he was aged 19 years then, and did not have any criminal
antecedent.
The court further noted, with “utmost displeasure”, that the identity of the
victim had been disclosed in the judgement.
“The aforesaid legislative mandate as interpreted by judicial
pronouncements create a humanizing impact on the adversarial trial processes in
child sex abuse cases and make it imperative that the privacy and other basic
human rights of the child victim are scrupulously protected so as to achieve the
goal of access to justice to the most vulnerable section of society, namely, children
subjected to sexual abuse, in the truest sense”, Justice Joymalya Bagchi thereby
observed, while issuing the following directives :
8 Registration of FIR : The police officer or the special juvenile police unit, on
receiving a compliant as to commission or likelihood of commission of
offence under the Act, shall register the same in terms of Section 19 of the Act.
A copy of the same shall be furnished free of cost to the child or his parents.
The child may also be referred to the district Legal Services Authority for
necessary legal aid/representation under section 40 of the Act. Failure to
register an FIR for offences punishable under Sections 4, 6, 7, 10 & 12 of the
POCSO Act shall attract penal liability under Section 166-B of the Indian
Penal Code.
8 Immediate medical aid/examination : On registration of the FIR, the police
officer shall immediately send the child for medical aid, and/or medical
examination under Section 27 of the Act. The Officer shall also ensure that the
victim’s statement is recorded under Section 25 of the Act. Further, if the
officer or the unit is of the opinion that the child falls within the definition of
“child in need care and protection” as defined under Section 2(d) of the
Juvenile Justice (Care and Protection of Children) Act, 2000, the child shall be
sent to the jurisdictional child welfare committee for providing care,
protection, treatment and rehabilitation, in accordance with law.
168 Geetika Garg

Child Sexual Abuse and the POCSO Act 169
8 Compliance of abovementioned directions : The special court, on being
reported about the FIR, shall make due enquiries from the investigating
agency as to compliance of the abovementioned requirements, and shall pass
necessary orders.
8 Non-disclosure of victim’s identity : The officer-in-charge of the police
station and the investigating officer, including the special juvenile police unit,
shall ensure that the identity of the victim is not disclosed in the course of
investigation, particularly at the time of recording statement of the victim
under Section 24 of the Act, his/her examination before Magistrate under
Section 25 of the Act, forwarding of the child for emergency medical aid
under Section 19(5) and/or medical examination under Section 27 of the Act.
Further, the recording of statement under Section 24 shall be done, as far as
practicable, at the residence or a place of choice of the victim or that of his/her
parents/custodian, as the case may be. Moreover, the victim’s identity shall
not be disclosed in the media, except with the express permission of the
special court, in the interest of justice. Any person, including a police officer,
disclosing the identity of the victim, shall be prosecuted under Section 23(4)
of the Act. Furthermore, the victim’s identity, particularly his name,
parentage, address or any other particulars that may reveal such identity
shall not be disclosed in the judgment delivered by the special court, unless
such disclosure of identity is in the interest of the child.
8 In-camera trial : The trial shall be held in camera, in terms of Section 37 of the
Act, and evidence of the victim shall be promptly recorded. Further, the
procedure of screening the victim from the accused persons, as provided
under Section 36 of the Act shall be followed. The evidence of the victim shall
be recorded by the court in a child-friendly atmosphere in the presence of the
parents, guardian or any other person in whom the child has trust and
confidence. Aggressive questioning shall not be permitted. In appropriate
cases, the defence may be directed to submit its questions for cross-
examination to the court, which shall then put such questions to the victim, in
a language which is comprehendible to him.
8 Evidence by video-conferencing : In case the victim is unable to attend the
court to record evidence, his evidence may be recorded by way of video
conferencing.
8 Compensation/rehabilitation : The special court shall direct payment of
interim compensation to the child, on an application made in this regard, or
suo motu. It shall, for this purpose, make enquiry as to the immediate needs
of the child for relief or rehabilitation, and give an opportunity of hearing to
the state and other affected parties.

Further, just and reasonable compensation may be awarded at the
culmination of the trial, even when the accused is not convicted, or when the
accused has not been traced, or has absconded.
8 Expeditious trial : The special court shall take all measures to conclude the
trial as expeditiously as possible, preferably within a year from taking
cognisance of the offence, and without granting unreasonable adjournment
to the parties in terms of Section 35(2) of the Act.
Hence, the entire machinery for monitoring child rights has been galvanized.
It has also been ordered that the National Commissions and State Commissions
shall start implementing POCSO’s provisions while discharging their functions
and that modules/training programmes be initiated in the Chandigarh Judicial
Academy to sensitise all stakeholders on child rights and deal with cases in
Children’s Court. It is now for the State governments to implement this beneficial
mandate and create an effective machinery to check heinous crimes of gross sexual
abuse against children.
In a latest case of Gaurav Kumar Bansal v.UOI13 on 7th April 2017, Chief
Justice of India J S Khehar’s bench directed high court chief justices of 12 states and
two Union territories to take suo motu action and appoint special public
prosecutors to deal with cases of crime against children. The court also directed the
high courts to create child friendly atmosphere for the victims under the Protection
of Children from Sexual Offenses (POCSO) Act.
7. Conclusion and Suggestions
The Justice Verma Committee Report, in one of its conclusions on child sexual
abuse, holds that “there is an urgent need to audit the performance of all
institutions of governance and law and order”14
We need to consolidate our efforts and focus our energies on the existing laws
rather than looking to amend more laws and making still further newer laws, alien
to our culture, society, habits, lifestyles and harsh realities of the common man.
Insofar as the child sexual abuse is concerned, POCSO is a wholesome law in itself.
The government must create the machinery to implement it and educate its officers
besides all stakeholders on what it contains and what it aims to achieve.
Periodical review must be conducted in order to check the effectiveness and
implementation of the POCSO Act. As the police have a crucial role to play in
combating child sexual abuse because they are the first point of contact for anyone
initiating the criminal case, the sensitivities required for this role are recognized in
the POCSO Act and so it is desired that they are strongly adhered to. Prioritize
execution of various child protection schemes and ensure that states rightly utilize
170 Geetika Garg

Child Sexual Abuse and the POCSO Act 171
the funds allocated to them to create effective child welfare facilities. There is a
need to create greater awareness of the POCSO Act amongst adults, parents,
teachers and people in positions of authority through various means like media,
conferences, etc. The members of the judicial institution can richly contribute
towards strengthening the implementation of this legislation and ensuring the
operation of an efficient, fair and child sensitive justice mechanism. The states must
consent to reserve sufficient numbers for child help lines across the country and to
take efforts to implement the same to ensure that the child’s safety and security is of
prime importance. In order to teach online safety in schools we need the
involvement of teachers and parents and make sure they deliver their promise and
help the children learn about the risks which they may encounter online and in case
they face any problems how to tackle them.
The state must not waste time exploring alternatives when the answers exist
in a law made by Parliament for these special offences against children, the most
vulnerable section of the society.
It can be said that as one cannot think of any need in the childhood as strong
as the need for the protection of father in the same way the benefits of the POCSO
Act would trickle down to the children only if this act is implemented in its true
sense and spirit by all the agencies and institutions.
One of the luckiest things that can happen to someone in life is, to have a
happy childhood and this act is the first milestone for it.
References
1. The Planning Commission, Government of India, “Report of the Working Group on
Child Rights for the 12th Five Year Plan (2012-2017),” http://planningcommission.nic.
in/aboutus/committee/wrkgrp12/wcd/wgrep_child.pdf (Last accessed October 7,
2015), p. 8
2. Ministry of Women and Child Development, Government of India, “National Study on
Child Abuse: India 2007,” 2007, http://wcd.nic.in/childabuse.pdf (Last accessed
October 7, 2015) p. 1
3. Ibid.
4. UNICEF, “UN in India condemns the gang rape of a student in New Delhi”,December
31, 2012, http://www.unicef.org/media/media_67097.html (Last accessed October 7,
2015).
5. Ibid.
6. http://indianexpress.com/article/india/posco-cases-victims-battle-abandonment-pre
ssure-to-retract-charges-sexual-abuse-minors-4763031/
7. Sakshi v. UOI AIR 2004 SC 3566
8. http://www.frontline.in/static/html/fl2023/stories/20031121003109700.htm

9. .http://indiacode.nic.in/amendmentacts2012/The%20Protection%20of%20Children%
20From%20Sexual%20Offences%20Act.pdf
10. http://www.thehindu.com/opinion/op-ed/strong-provisions-weak-implementation
/article5470778.ece
11. http://www.livelaw.in/trial-court-can-recommend-action-police-officers-flouting-pro
visions-pocso-act-orissa-hc/-
12. http://www.livelaw.in/pocso-victims-identity-wont-disclosed-anyone-including-poli
ce-judges-calcutta-hc-issues-guidelines/
13. http://www.livelaw.in/appoint-special-prosecutors-pocso-cases-sc-hcs/
14. http://www.thehindu.com/todays-paper/tp-opinion/strong-provisions-weak-imple
mentation /article5472108.ece ê
172 Geetika Garg
Article Received on July 01, 2017; Accepted on September 16, 2017

17
Elementary Educational Status of Girl
Child in Rural India : A Sociological
Analysis of Uttar Pradesh
Mamta Sagar*
The present study is conducted on the gender stratification and status of girls inelementary education in Uttar Pradesh. This paper is an effort to capture the emerging picturewith respect to girl’s education in India. This paper focuses on the dropout rates of rural India aswell as over all rates of our country. It is widely acknowledged that a significant proportion ofchildren, especially those from under privileged backgrounds and girls either drop out ofelementary school or even if they attend school, learn very little. Thus, the process of makingschool more attractive to groups which have so far been indifferent, if not hostile is not alwayseasy. When such efforts have to contend with institutions and individuals who are not themselvesconvinced of the need to integrate children from varying backgrounds the problems are magnified.
[Keywords : Elementary education, Primary education, Gender inequality,
Female education, Educational inequality, Government welfare schemes]
1. Introduction
Education in today’s world undoubtedly the most powerful tool to ignite the
young minds and guide the young generation. At a time when our society is fast
evolving, it is sound education that builds the young generation with knowledge.
For a society, Development and Education go hand in hand, no society can makeprogress and transform itself without investing in education to its citizen. The base
CONTEMPORARY SOCIAL SCIENCES, Vol. 26, No. 3 (July-September), 2017
* Associate Professor, Department of Sociology, S.M.P.G.G Post-graduate College, Meerut (India)E-mail: <[email protected]>

for which is laid with elementary education. The Indian parliament enacted the
Right of Children to free and compulsory Education Bill, 2009 to provide education
to all children between 6-14 years of age. The bill also reserves one fourth of seats in
private schools to weaker section of the society.
India, being the land of villages, rural education should be so formulated thatit would adapt to the needs of creation of new and higher type of rural society asenvisaged in the constitution. For broad-based sustainable economic development, elementary education (read, write and solve simple arithmetic problems, such asaddition and subtraction of numbers) is critical for any country. In India, theproblem of elementary education is so endemic according to the data given by thecensus of India 2001, that only 60 percent of rural people (71 percent males and 47percent females) are literates. To overcome this situation and to just provide theprimary or elementary education, India requires seven million teachers and thattoo, if one were to have a 1-50 teacher to student ratio. These teachers are mostlyrequired in rural areas, where there is a dearth of qualified teachers.
At the time of independence, India’s primary education was characterized bythe historical inequities. Though Article 45 of the Directive Principles of StatePolicy was committed to ensuring free and compulsory education for all, this didnot significantly translate into action. Unfortunately, school enrolments andchildren’s participation remained dismally low for decades after independence.However the picture of elementary education in rural India began to changerapidly due to new thrusts given by the government’s New National Policy ofEducation (1986) and the Program of Action (1992), which aimed at improvingaccess to schools, reducing the number of dropouts and improving learningachievements for all children between 6-14 years of age.
A focus on girls education was put in place since 1986 National Policy onEducation and 1992 Program of Action, followed by the SSA program launched in2001, National Curriculum Frame work in 2005 and the National CurriculumFramework for Teacher Education in 2010. These policies were complemented byother schemes such as National Program for the Education of Girls at theElementary level, Kasturba Gandhi Balika Vidyalaya scheme, both ensuringinclusion and quality education for girls availability of open learning resourcesresidential schooling, coaching facilities, scholarships, textbooks uniform andtransport including bicycles. The right of children to free and CompulsoryEducation (Known as RTE) Act, 2010 charted a new roadmap for gender equalityin education in India.
Despite of all these efforts, surprisingly, a large number of girls still remainoutside the education system. According to Karin Hulshof, UNICEF Indiarepresentative, out of 81 % girls joining school at the primary level around 50%dropout at the secondary level because of factors such as child marriage child laboretc. The Sarva Shiksha Abhiyan (SSA) and Right to Education (RTE) Act are toolsthat can empower the girl child.
174 Mamta Sagar

Elementary Educational Status of Girl Child in Rural India 175
The Right of Children to free and Compulsory Education (RTE) Act, 2009
ensures that every child has a right to full time elementary education of satisfactory
quality in a formal school. Compulsory education casts an obligation on the
appropriate government and local authorities to provide and ensure admission,
attendance and completion of elementary education by all children in the 6-14 age
group. A specified pupil-teacher ratio has to be maintained for each school. There
should be no physical punishment or mental harassment Education should also be
value oriented.
According to National Vision, The United Nations Children’s Fund(UNICEF)
and ministry for human resources development (MHRD) drafted a National
Vision for Girl’s Education in India-Roadmap to 2015 with an aim to building a
comprehensive approach towards girl’s education.
The Vision Document provides a framework for action for girl’s education in
India. The plan of action for the next one year is the Shiksha Ka Haq Abhiyan which
will be the cornerstone for the implementation of RTE. The government will
engage with the community, media, states and other stake holders to create an
environment and mechanism to ensure implementation at every level for girls
education.
It is recommended to implement strong legislation outlawing child labor,
gender based violence and harassment of girls provide residential facilities,
transport and other incentives to attract qualified female teachers to particularly
rural and remote schools. Address safety issues of girls gender - friendly
classrooms and separate toilets.
2. Status of Elementary Education in Uttar Pradesh
Uttar Pradesh is the most populous state in India with total population of
19,95,81,477. It is also one of the biggest States in India, with over a lakh inhabited
villages. The total number of schools imparting elementary education in Uttar
Pradesh (As per DISE 2011) is 2,21,653 with a large percentage 69.78 percentage of
it being government schools.
The table given below highlights the Status of elementary education in Uttar
Pradesh is detail :
Table-1 : Status of Elementary Education in Uttar Pradesh, DISE 2011-12
Indicators Uttar Pradesh India
Number of schools imparting elementary educationcovered by DISE
221653 1412178
Percentage of government share to total schools 69.78% 76.36%
Percentage of private Share to total Schools 29.65% 21.20%
School in Rural Areas 89.18% 85.99%

A glance at the total enrollment in primary and upper primary schools in
Uttar Pradesh for the year 2011-12 is given below :
Table-2 : Enrollment in Primary and Upper Primary Schools in Uttar Pradeshand India for the year 2011-12
Level Uttar Pradesh India
Class I-V 26188803 137099984
Class VI-VII 9215942 61955154
3. Analytical Overview of Primary Schools Education
In Uttar Pradesh approximately 70% of primary schools have more than 150
students and include head masters /teacher. A primary schools has an average of
37 students in each classroom and has an average of 4.4 classrooms per school.
Majority of districts in Uttar Pradesh have student classroom ratio is more than 30
students per classrooms.
The teachers in the all schools (including the primary school) in the state,
approximately 1 out of every 10 school is a single teacher school. If any school has
more than 2 teachers, one out of them will be a female teacher in 78% of schools.
In every class approximately 51% of the student are boys and 41% are girls.
The student- teacher ratio in a primary school is one teacher for every 46 students.
A primary school has an average of 3.7 teachers per school. 60% of government
primary schools have more than 30 students per teacher. All schools in 68 out of 75
districts in Uttar Pradesh have more than 30 students per teacher.
The following table provides school report card of Uttar Pradesh :
Table-3 : School Report Card of Uttar Pradesh
S. No Description
1 Uttar Pradesh has the highest number of schools (2,43,014 schools)
2 Uttar Pradesh has the highest Pupil-Teacher Ratio at Primary level (39)
3 Uttar Pradesh has the highest number of Contractual -Teachers (1,68,219 teachers )
4 Uttar Pradesh has the highest Muslim enrolment at Elementary level (48,95,711)
5 Uttar Pradesh has the highest number of Government and Aided schools (1,69,857schools)
6 Uttar Pradesh has the highest number of Single- Teacher schools (22,223 schools)
7 Uttar Pradesh has the highest number of teachers (10,09,333 teachers)
8 Uttar Pradesh has the highest Pupil -Teacher Ratio at Upper Primary Level (33)
9 Uttar Pradesh has the highest enrolment at Primary level (2,58,06,929)
10 Uttar Pradesh has the highest enrolment at Upper Primary level (1,10,31,791)
176 Mamta Sagar

Elementary Educational Status of Girl Child in Rural India 177
11 Nagar Shaitra, Lucknow block of Lucknow district (State U.P ) has the highest SCenrolment at Elementary level (2,62,971)
12 Bijnor district (State Uttar Pradesh) has more girls than boys at the Elementary level(29,002)
13 Lucknow of U.P has the highest enrolment at Upper Primary level (1,92,577)
14 Uttar Pradesh has the highest SC enrolment at Elementary level (1,03,77,032)
4. Government Schemes to Uplift the Education of Girls in India
There are many schemes for the uplift the education of girls in India. Thefollowing two need special mention :
4.1 Kasturba Gandhi Balika Vidyalaya
This scheme was introduced by the Government of India in August 2004,then integrated in the Sarva Shiksha Abhiyan program, to provide educationalfacilities for girls belonging to Scheduled Castes ,Scheduled Tribes, otherBackward Classes, minority communities and families below the poverty line inEducationally Backward Blocks.
Gender disparities still persist in rural areas and among disadvantagedCommunities. Looking at enrollment trends there remain significant gap in theenrolment of girls at the elementary level as compared to boys, especially at theupper primary levels. The objective of KGBV is to ensure that quality education isfeasible and accessible to the girls of disadvantaged groups of society by settling up residential schools with boarding facilities at elementary level.
4.2 Sarva Shiksha Abhiyan
The scheme of Sarva Shiksha Abhiyan is a national flagship program and isbeing implemented in all districts of India . The aim of this scheme is to provideuseful and relevant elementary education for all children in the age group of 6-14by 2010. This scheme was launched in 2001. 50,000 + students are studying at 399centers at different locations .
5. Problems of Rural Education
Schools of rural India are facing many challenges. some of these challengesare as follows :
5.1 Inadequate Infrastructure
Only 60 percent of schools have play grounds, 16 percent have libraries, 60percent have electricity, 26 percent have computers, only a few schools havepermanent buildings. Most of the schools that have a building are government-owned. Nearly one-third of rural households do not have a secondary schoolwithin 5 km vicinity.

Educational infrastructure need to be improved through public private
partnership and involvement of the corporate sector and NGOs.
5.2 School Drop-outs
There is high incidence of school drop-outs. Data relating to 2013-14 show
19.8 percent students drop-out before completing V standard, 36.3 percent before
VIII standard, 47.4 percent before X standard.
The slow learners of the class are afraid of heavy syllabus and too many
books. The average student feels it cumbersome. The southern and western states
of India do much better in arresting drop-out-rates (less than 2 present) compared
to the eastern, Northern and North Eastern states (drop-out-rates ranging from 8 to
10 percent)
A number of other factors contribute to school drop-outs. These include child
marriage, inability to cope with studies, taking up odd jobs and absence of
adequate infrastructure in schools.
The poor rural girls, if not all constitute a major junk of disadvantaged groups
that are excluded from the schooling process, especially because they enter late into
school and dropout earlier. The major educational problem faced by girls from
rural area is that although they may be enrolled at the beginning of the year, they
do not always remain in school. It is estimated that 45 percent of girls dropout of
school between grades 1 and 5 (The World Bank, 1997). Girls are often taken out of
school to share the family responsibilities. The date collected by World Bank 1997
shows the proportion of girls attending school decreases with age. In 1992-93 only
55 percent of girls aged 11-14 were attending school compared with 61 percent of
the younger age group.
5.3 Priority to Son’s Education Compared to Daughter’s Education
Negative parental attitudes towards educating daughters can also be a
barrier to a girl’s education. Parents may see the education of daughters a waste of
money as daughter will eventually live with their husbands families and the
parents will not benefit directly from their education. In addition, daughters with
higher levels of education will likely have higher dowry expenses, as they will
want a comparably educated husband.
5.4 Lack of Adequate Number of Female Teacher
Lack of female teachers is another potential barrier to girl’s education Girls
are more likely to attend school and have higher academic achievements, if they
have female teachers. Currently, women account for only 29 percent of teachers at
the primary level (MHRD, 1993) The proportion of teachers, who are female is even
lower at the university level, i.e. 22 percent(CSO 1992). These proportions reflect
the historic paucity of women with the educational qualifications to be teachers.
178 Mamta Sagar

Elementary Educational Status of Girl Child in Rural India 179
In India, the status of the girl child has been a subject of much discussion,
controversy and debate. There are some overwhelming cultural and economic
reasons why female children are not receiving the same medical, emotional and
educational attention as their male counterparts.
By 1991, 39 percent of women and 64 percent of men were literate (RGCC
1993) thus, there has been a large increase in the proportion of women, who are
literate in just 20 years. Despite the improvements in literacy, there continues to be
a large gap between the literacy levels of men and women in India.
6. Educational Statistics at a Glance
The Gross Enrolment Ratio (GER) for a class-group is the ratio of the number
of persons in the class group to the number of persons in the corresponding official
age-group. Thrust on providing primary education has yielded result with theGER presently exceeding hundred. The progress is visible across the social
categories and gender with GER for SC, ST and girls shooting above hundred.
Trend in gross enrolment ratio (GER) among ST student at Elementary level.
The GER for all persons in elementary education increased from 81.60% in
2000-01 to 96.90% (Provisional figure) in 2014-15. At this level, the GER for boys
and girls increase by 4.5 (from 90.30% to 94.80%) and 26.40 (from 74.40% to 99.20%)
percentage point respectively during the stipulated period.
Education is the single most important factor to ensure gender equality and
empowerment .The Gender Parity Index (GPI) is the ratio of the number of female
students enrolled at primary secondary and tertiary levels of education to the
corresponding number of male student in each level. Thus GPI (based on GER)
which is free from the effects of the population structure of the appropriate age
group provides picture of gender equality in education. During 2005-06 to 2014-15,
substantial progress has been achieved toward gender parity in education as
revealed by GPI in the following figure.

Trend in Gender Parity Index (GPI)
At present in elementary and secondary education, the enrollment is
favorable to female as the corresponding GPI has crossed the limit -1.
With improvement in the number of schools, facilities in schools andenrollment the annual dropout rate at elementary level has come down by 1.28
percentage point (from 56.20% in 2011-12 to 4.34% in 2013-14) for all category
students. At this level the dropout rate for boys and girls decreased by 1.36 (from
5.89 to 4.53%) and 1.2% (from 5.34 to 4.14%) percentage point respectively during
this period.
Dropout Rates(%) from 2011-12 to 2013-14 at primary level.
However, even as we contemplate with satisfaction the above remarkable
achievements, we need to turn our attention to improving quality education in
schools, especially in rural area. To assess area wise learning outcome in four
subject viz. English, Mathematics, Science and Social science, it has been observed
that in all subjects, urban students outperform rural students by large margin.
180 Mamta Sagar

Elementary Educational Status of Girl Child in Rural India 181
Mean Achievement score of students at National Level
School attendance rates (percent) by age group and household monthly per
capital expenditure class for rural India are shown in the following table :
Table-4 : School Attendance rates (percent) by age group and household monthly percapital expenditure Class for Rural India
Household per CapitaIncome
10-14 Age Group
Male Female
Less than 120 54.60 31.00
120-140 58.60 36.60
165-190 65.40 43.20
190-210 72.60 50.60
210-235 75.60 53.30
235-265 80.5 57.20
265-300 82.30 64.80
300-355 84.00 67.80
355-455 85.70 72.90
455-560 90.30 73.70
More than 560 90.60 78.50
7. Recommendation
Education opens the door for development. An all out effort should be made
for the universalization of elementary education through both formal and
non-formal streams. Weaker sections of the society including women can be
empowered through this route. It would also enable them to fight injustice and
exploitation and promote both social and psychic mobility.

8. Conclusion
It has been universally accepted that education institution should play a more
active role in bringing about greater equality amongst individuals. A commitment
to equal education for all is based on the assumption that everyone is alike. Theenrollment of girls in comparison to boys in schools is very low in India. Even those
who go to schools are seldom able to complete their primary education . Girls are
the major drop-outs in schools due to certain socio-economic reasons. They are
required to learn household jobs and help in the care of younger siblings. It is
essential to have a minimum of four to five years of schooling. This is to ensure that
the recipient of this schooling does not lapse back into illiteracy. The function of
schooling is different for different class and section of people. Amongst the poorer
section such as in rural area the rate of drop outs from school is very high, this is
because very little immediate reward is perceived by them in remaining in school.
References
1. Basu, D. D., Introduction to the Constitution of India, Nagpur : LexisNexis
Butterworths Wadhwa Group, 2013, 117-119
2. Durkhem, E., Education and Sociology, New York : Free Press, 1956.
3. Government of India, National Policy on Education, New Delhi : Ministry of Human
Resource Development, Department of Education, 1986.
4. Isaach ,Aditi, Action for Girl’s Education”, New Delhi, The Times of India, Dec. 2012 .
5. Ratna M Sudarshan 2000 “Educational Status of Girls and Women : The Emerging
Scenario”, Rekha Wazir (ed.), The Gender Gap in Basic Education : NGOs as Change
Agents, New Delhi : Sage Publication,, 2000.
6. Sinha, H. K., Challenges in Rural Development, New Delhi : Discovery Publishing
House, 1998 :
7. Thakkar, Usha and Desai Neera, Women in India Society, India : National Book Trust,
2001. ê
182 Mamta Sagar
Article Received on June 14, 2017; Accepted on September 01, 2017

18
Culture and Displacement :
Two Case Studies
Rajni Bala*
Displacement often leads to wider social implications which are not (and cannot be)included in Compensatory provisions. Specifically Cultural, Social and Environmental capital,which a community build with historical living, geographically identified and very important forsocial living, are not compensated. However compensatory provision tries to convert complexcommunity relationships in monetary terms but get distorted in the process of resettlement. Thepresent paper seeks to explain all these problems in context of an under construction multipurpose dam known as Ujh hydroelectric power project situated in district Kathua in Jammu & Kashmir.Developmental projects have not taken care of these intangible social processes and factors. Itseems like Policy makers are least concerned to these factors.
[Keywords : Displacement, Culture, Cultural capital, Development]
1. Introduction
Human beings are different from the animal world as they form societies andsociety develop culture which is inherited as well as constructed as the way ofliving of a particular society. It is acquired by a person as an individual as well as asocial being. If the growth of the culture of a particular society is traced it would bedifficult to attach the origin of all its cultural traits. The evolutionary theory,diffusion theory and acculturation theories tried to explain the growth of theculture in a particular society. E. B, Tylor, belonging to evolutionary school gave aprofound definition of culture in his major work Primitive Culture as “culture is
CONTEMPORARY SOCIAL SCIENCES, Vol. 26, No. 3 (July-September), 2017
* Assistant Professor, Government Degree College, R. S Pura, Higher Education Department, J&K(India) E-mail: <[email protected]>

that complex whole which includes knowledge, belief, art, morals, law, custom,and any other capabilities and habits acquired by man as a member of society.”1
Ogburn and Nimkoff divides culture into two parts namely material andnon-material.2 Material culture consists of concrete and tangible objects like tools,implements, furniture, automobiles, books, buildings, dams etc. These concreteand tangible objects are man-made. It is concerned with the external, mechanicaland utilitarian objects. It includes technical and material objects like, a printingpress, a telephone, a television tractor etc. It is also referred to as civilization.Non-material culture consists of intangible and abstract objects. It includescustoms, tradition, habits, manners, attitude, beliefs, language, literature, art, law,religion etc. It is something internal and reflects the inward nature of man.
Durkheim has explained the concept of social facts as the things which areexternal and coercive to the individual. He mentioned two types of social facts-material social facts and non material social facts.3 Material social facts are directlyobservable like family, legal institutions, industrial economy etc. whereas nonmaterial social facts refers to such things as morality or collective conscience,knowledge systems, religious beliefs, ideas, beliefs, ideals, values etc. Culture isexplained as a material as well as a non material social fact. Culture is thepossession of a community learned over generations. It is capital in real sense for acommunity.
This context is brilliantly put by Pierre Bourdieu in his essay “the forms ofcapital”. He has explained three forms of capital viz- Economic capital, Culturalcapital and Social Capital. All these forms can be partially or fully convertible tomoney or economic capital. According to him :
“economic capital, which is immediately and directly convertible into moneyand may be institutionalized in the form of property rights; as culturalcapital, which is convertible, in certain conditions, into economic capital andmay be institutionalized in the form of educational qualifications; and associal capital, made up of social obligations (“connections”), which isconvertible, in certain conditions, into economic capital and may beinstitutionalized in the form of a title of nobility.”4
Further explaining Cultural capital he gave three forms, i) the embodied state,which, according to him, is in the form of long-lasting dispositions of the mind andbody; ii) objectified state, which is in the form pictures, books, instruments etc. andin iii) Institutionalized state which is “a form of objectification which must be setapart because it confers entirely original properties on the cultural capital which it is presumed to guarantee”, i.e. It is the institutional recognition in the form ofacademic credentials or qualifications held by an individual. The ‘embodied state’of cultural capital can be consciously acquired and passively inherited from familyover time through the process of socialization. However, this state of capital cannotbe transmitted instantaneously. It must be acquired over time. Pierre Bourdieu alsoinfers that cultural capital is the best- hidden form of heredity transmission and alsoit is the only form which is less censored.
184 Rajni Bala

Culture and Displacement : Two Case Studies 185
2. Culture and Displacement
If a community experience dislocation from one place to another there is aprobable disruption of culture already carried by the members of that community.The material culture can be carried in a new setting to some extent but the nonmaterial culture which forms the actual heritage of the society disconnected anddistorted. As Dipankar Gupta, explains in this concern that cultures have alwaysexpressed space and with it power.5 To be able to live culture space is essential.There is always an option of carrying cultures in minds, but that would be in termsof artifacts but not in ways where an individual interacts with others on a routinebasis. He further explains that with the change of space, the artifacts also lose theircultural moorings and metaphorical connotations and their original culturalmeanings. But in a new location the communities tries to construct a vicariousspace where their original culture/condition can be replicated. But thecommunities’ do not get the space in which their original culture is manifested.6
Therefore this paper seeks to examine the issue of the culture anddisplacement in which the non-material or intangible cultural componentsgenerally received less attention. It also tries to highlight the significance of cultureto a particular community as well as changes to cultural traits in new settings. Twocase studies of hydro electric projects, which are situated in J&K are undertaken for this analysis. It is tried to emphasize on the cultural aspect of displacement which is relatively ignored in the policy framework.
3. Vision for Post-independent Development Projects : Ignorance
to Socio-cultural Aspects
In independent India, national development has been largely equated witheconomic growth. It was envisioned that large centralized industries, irrigationand hydro electric projects will be symbols of such development, which throughthe process of industrialization promised to set India on the path of modernizationand development. Immediately after independence, a series of large projects wereplanned and built for the progress of the nation. Large dams promised to solve theproblem of hunger and starvation by providing irrigation and boosting foodproduction, controlling floods and providing much needed electricity forindustrial development. It was this grand promise that prompted Pandit Nehru,our first Prime Minister, to call dams ‘secular temples of modern India’. Thepositive and constructive notion attached with the construction of thedevelopment projects was par excellence as the then politicians and bureaucratsignored the ethno elements from the developmental process. Moreoverenvironmental and social costs of such large dams were thought to be an inevitableprice that the society had to pay for such development. Socio-ecological andcultural costs of large dams were grossly underestimated and largely ignored.
One can see these reflections in the speeches of political leaders andbureaucrats while convincing people for the establishment of these developmental

projects. Jawaharlal Nehru, while laying the foundation stone for India’s firstmajor river valley project, the Hirakud dam in Orissa in 1948 said, “If you have tosuffer , you should do so in the interest of the country.”7 Morarji Desai, who laterbecame the Prime Minister, quoted his ideology of development in the followingwords- “We will request you to move from your houses after the dam comes up. Ifyou move, it will be good; otherwise we shall release the waters and drown youall.”8 An official of NHDC to the displaced when they were demanding a place tocremate one of their deceased family members in Harsud town, MP said, “Youexpect us to provide for you when you die. Next you will even expect us to beresponsible for more of you when you breed.”9 The evacuation and uprootment ofthe communities were diluted in the name of the sacrifice or national good. TheLand Acquisition Act (1894) which was amended in 1984 was the act of the Britishera which has not defined the ‘Public Purpose’ of the evacuation of the land. Itgives few and very nominal right to the citizens to challenge acquisition.
4. Cultural Capital Loss : Two Case Studies on Loss of Intangible
Factors
4.1 Ranjit Sagar Dam
Ranjit Sagar Dam is a 150MW earth core cum gravel shell dam on the riverRavi. River Ravi is an eastern river of the Indus water treaty upon which the IndianUnion has the riparian rights. Three states were directly affected by theconstruction of the dam- J&K, Punjab and Himachal Pradesh. A total of 10,518hectare of land and 63 villages (2 villages fully submerged and 61 partlysubmerged) falling in three states viz. Punjab, Himachal Pradesh and J&K havebeen submerged due to the construction of the Ranjit Sagar Dam. According to theStatus Report of Ranjit Sagar Dam (2000) a total of 3868 families have been affectedbut according to the local people it is estimated that more than 40-50 thousandpeople have been affected. According to a study conducted by Rajni Bala theoustees of Ranjit Sagar Dam have experienced various Socio-cultural,Environmental, Economic, religious and Psychological impacts after displacementto new setting.10
During her study she observed various changes in the socio-cultural andreligious practices.
1. Changes in Socio-cultural Practices : it was found that due to scatteredsettlement to different places after displacement, according to their ownchoice because cash compensation was provided to the oustees andprovisions of community settlement were not available, the village culture ofcooperation and brotherhood was dismantled. Before displacement formarriage and other gathering people use to come for help four or five daysprior to the ceremony but after displacement, relatives used to come only onthe day of ceremony. One of the major reasons for this change was that thecommunity was dispersed after displacement and the choice to settle in new
186 Rajni Bala

Culture and Displacement : Two Case Studies 187
setting was largely decided by the head of the family. Moreover there was noprovision in rehabilitation and resettlement process for collective settlementof whole community. Earlier the ceremonies, gatherings were the concern ofthe whole community but disruption to the community life hindered it.Family structure which was earlier predominantly joint, virtually convertedto nuclear families as compensatory provisions were planned on the basis ofnuclear family. The dietary habits were also changed in this process. Earlieroustees used to take their diet with milk products and the produce ofagricultural land which they own like cereals, green vegetables, millets,pulses etc but after displacement most of the people become dependent onmarket for daily consumption.
2. Change in Religious Practices : After displacement oustees were distanced
from their local deities and worship practices. The celebration of feast for a
particular deity, village deity was found absent in new setting owing tonon-availability of basic material base on which beliefs were based. Before
displacement people were dependent on agricultural economy located in
rural setting. Various ceremonies and rituals were directly linked to their
economy. After every crop harvesting time (mainly Kharif and Rabbi Crops)
people used to offer small amount of crop yield to local deity (also called as
‘Kharka’) and arrange gatherings for deity. But now most of the oustees have
lost their agricultural land and these practices have remained only in
symbolic forms.
3. Psychological Impacts : The psychological impact of displacement and
resettlement varies from person to person based on caste, class, gender, age
etc. Traditional community elders’ role and value system of the rural setup,
cultural norms or laws of social and ecological prudence get devalued with
disruption of existing structure. The Community elders found it difficult to
cope up with the conditions emerged after displacement. Moreover, the loss
of the agricultural economy, livestock, neighborhood, community bonds,
natural environment, ancestral property, lively relationship with the
surroundings etc. traumatized the displaced people. It is also difficult for
womenfolk to get adjusted to the changed conditions. Changed neighbor-
hood has weakened the support structures for women as they have to adjust
themselves to the already established colonies. They experienced derogatoryremarks from their new neighborhood instead of the support expected by
them. In addition to it the job provisions for one member of the household was
provided to the male members. In terms of class it is found that the people who
had more land to their possession got a good amount of compensation but
who were already in a poor conditions gained little to improve their
conditions. For poor displacement caused further impoverishment.
The intervening presence of government in their private sphere,
compensatory provisions and repercussions of rehabilitation phase made their

difficulties apparently more severe. To minimize the psychological impacts on
displaced population coping mechanism from any external agency were missing.
The conditions of the oustees were not studied by any governmental agency after
their rehabilitation.
In addition to these impacts there were number of losses and impacts notrealized at a specified time. Various life sustaining factors enjoyed at one time givenostalgic affect at the other time. The oustees of Ranjit Sagar Dam have talkedabout the loss of one type of living not repaired with the monetary terms quantified by government. Because the community life lived for centuries cannot becompensated with monetary terms.
4.2 Ujh Multipurpose Project
The Ujh Multi-purpose project is going to be constructed in district Kathua ofJammu and Kashmir. This project is on River Ujh which is one of the main tributary of river Ravi. The source of Ujh river is located in the Kailash mountains at anelevation of 4300m close to Bhaderwah mountains of Jammu division. Ujh riverafter flowing 100km stretch in Jammu division joins Ravi at Nainkot in Pakistan.The river Ujh is joined by other four tributaries Sutarkhad, Dunarikhad, Bhini andTalyan at a place called Panchthirthi, the name derived from the confluence of thethese five streams. The proposed dam site is in the village Barbari in Tehsil Billawar of District Kathua about 1.6km downstream of Panchthirthi. The project has thepower generation capacity of 186MW+26 MW. The irrigation benefits will beextended to command area 31380 hectares. Other than these Drinking waterbenefits, flood protection and other indirect benefits like pisciculture, tourism etccould be developed.11
The Detailed Project Report recommends that due to the construction ofproject out of 12 villages two villages would be fully submerged and 10 partiallysubmerged. The estimated displacement would be 2235 families or 11495 people.The Scheduled caste population includes 3867 persons and 427 Scheduled tribepersons.12 Common Property Resources, Worship Places, Agricultural land, forests,pasture land, water resources, roads, traditional routes, schools, landscapes, biodiverse areas, medicinal plants, environmentally significant resources and manymore tangible and intangible substances would be lost due to the submergence ofestimated 41 sq. km of the stretch of the land. The rehabilitation and resettlementplan is based on the National Rehabilitation and Resettlement Policy 2007.
During field work conducted in July 2016 it was found that the affectedpopulation resisted the construction of Ujh Multipurpose project. Many times theyorganized protests and sought their memorandum before the authorities forreducing height of the project. Questions were raised by one of thenon-governmental organization namely Village Social Welfare and DevelopmentCommittee working in this area from last 38 years that the concerned authorities ofthe project surveyed and visited the place but never involved the affectedpopulation. According to government records there are 2235 families which are
188 Rajni Bala

Culture and Displacement : Two Case Studies 189
going to be displaced owing to the construction of the dam but the people who liveon the forest land and cultivate the forests, dependent on the common propertyresources or work as labourers shall not be given compensation for displacement.If the people who are dependent on the forests, common property resources orworking as the labourers are taken into account the count will be more than 4000families and about 25-30 thousand persons. They also want that resettlement of theaffected population to be done on the village basis. They have realized the loss ofthe community life after displacement so they demand to be settled to anotherplace but along with their village population.
It is found that the project affected persons are apprehending various lossesdue to displacement from the present setting. They are considering two settingsafter displacement- Rural and Urban. Rural Setting would have its own effectswhile urban setting would change their present living conditions.
The Project Affected Persons (PAPs) of Ujh Multipurpose Project havecompared themselves with the PAPs of Ranjit Sagar Dam which affected threestates- J&K, Punjab and Himachal. The part of J&k which was affected by theconstruction of Ranjit Sagar Dam fall in the same district Kathua in which the UjhMultipurpose project is proposed. The geographical location is almost similar. ThePAPs of Ujh multi-purpose project are predicting the post impacts of rehabilitationand resettlement as similar to that of Ranjit Sagar Dam. The PAPs of Ranjit SagarDam displaced from the submerged area of J&K have been resettled according totheir own choice to Basohli, Kathua and Billawar Tehsils of District Kathua. Thepeople who have been resettled to Basohli and Billawar (Rural) i.e to the upper side of the reservoir having same geographical conditions, facing various problemslike- the road distance connecting the region increased, the road connectivityworsened as the road surrounds the reservoir from one side and the hilly terrainfrom the other side, the probability of water borne diseases increased, the wild lifewhich is disturbed due to the submergence of the forest land moves upwardstowards the area which is not submerged, the poor transportation facilities andother linked problems with transportation etc.
Other than these, the PAPs who have been resettled to Kathua (Urban) areafaced following problems :
PAPs of Ranjit Sagar Dam who displaced to Kathua area moved to the urbanplaces. They have their own issues. They have not resumed their earlier way ofliving. Agricultural land, livestock, natural vegetation, natural environment werelost to a great extent. They faced the problem of acceptance by the hostcommunities and were, charged much for the purchase of the land for houseconstruction. Ceremonial performances linked with the water bodies and localdeities vanished, common property resources were lost, building material whichwas before displacement available with the local area like thatch, timber, mud etcbut after displacement replaced by the material available with the market likecement, bricks, sand etc. Medicinal plants which were used as traditional medicinefor various diseases were lost. They are also facing the pollution problem because

industrial area is much closer to residential area where they have shifted afterdisplacement.
These are the problems to which the PAPs of Ujh Multi-purpose are wellaware of. So in the transition stage of actual displacement and preparation fordisplacement, they are in a dilemma, because they are left with the option ofdisplacing to the upper side of the reservoir or move downwards from the projectside i.e. towards Kathua area. The affected population has reported during the field work that the authorities concerned to the project visited the area many times butthey are not consulted so far. The resistance to the project manifested to lowerdown the height of dam but not as total rejection of the project. Developmentalprojects are legitimized as the symbols of development irrespective of pervasiveand irreparable loss to displaced people.
5. Conclusion
The disruption and loss of cultural capital generated and transmitted bycommunity and individuals from generations obstructed due to displacement.Culture- the way of life of any community- is never compensated and not thoughtto valued as well as compensated. Monetary provisions are unlikely to address and resume the socio-cultural fabric of life necessary for any community to sustain.
References
1. V. S Upadhayay and Gaya Pandey, History of Anthropological Thought, New Delhi :Concept, 1997, 37.
2. Sunil, “Difference between material and non-material culture”, http://www.preservearticles.com/201105056308/differences-between-material-and-non-material-culture.html
3. Emile Durkheim, “___”, http://people.uncw.edu/ricej/theory/ durkheim1.htm
4. Pierre Bourdieu, “Forms of capital”, http://home.iitk.ac.in/~amman/soc748/bourdieu_forms_of_capital.pdf, 1986
5. Dipankar Gupta, “The metaphors of culture: Multiculturalism as a way of everydaylife”, Sociological Bulletin, 64(2), May-August, 2015, 133-151
6. Ibid.
7. Arundhati Roy, “The greater common good”, (1999). http://www.narmada. org/gcg/gcg.html
8. Arundhati Roy, “The And what a story it is”, http://guide2net.net/tcpip/columns/roy/cc03.html
9. Eva Pfostl (ed.), Human Rights and Asian Values, New Delhi : Routledge, 2007, 140.
10. Rajni Bala, Development and Displacement : A study of Ranjit Sagar Dam, Ph. D. Thesis, University of Jammu, 2009.
11. Government of India, Ujh Multipurpose Project-Detailed Project Report,, Jammu :Monitoring and Appraisal Directorate Chenab division, , 2013.
12. Ibid. ê
190 Rajni Bala
Article Received on July 01, 2017; Accepted on September 10, 2017

19
Communication and Development
Manoj Kumar Srivastava*
Communication is the basis of all social relations. The process of communication is so
intimately connected with the overall fabric of a social system that it is difficult to comprehend
social life without communication system. That is the reason why communication is said to be the
basis of all social processes, whether in a tribal society, a peasant society or a modern society. Being
an essential process of a social life, which is both interactive and purposeful, it has helped in
binding people and bringing them together. It increases their susceptibility to suggestions and
initiation and guides them in taking appropriate actions. In a developing society like ours where a
planned process of modernizations is being pushed through, the significance of communication
cannot be over emphasized. There are two basic types of communication processes: face-to-face
communication and mass communication. Mass communication refers to “all the impersonal
means of communication by which visual and /or auditory messages are transmitted directly to
audiences. Included among the mass media are television, radio, motion pictures, newspapers,
magazines, books and bill-boards” (Gerbner, 1976). Mass Media of communication are a gift of
the technological revolution. They command the benefit of an increased output, greater
accessibility and wider reach. They are very crucial for nation building and national development
in any developing society.
[Keywords : Communication, Development, Mass Media, DSC]
Communication is the basis of all social relations. The process of
communication is so intimately connected with the overall fabric of a social system
that it is difficult to comprehend social life without communication system. That is
the reason why communication is said to be the basis of all social processes,
CONTEMPORARY SOCIAL SCIENCES, Vol. 26, No. 3 (July-September), 2017
* Coordinator, Department of Journalism and Mass Communication, Chaudhary Charan SinghUniversity, Meerut, Uttar Pradesh (India) E-mail: <[email protected]>

whether in a tribal society, a peasant society or a modern society. Being an essential
process of a social life, which is both interactive and purposeful, it has helped in
binding people and bringing them together. It increases their susceptibility to
suggestions and initiation and guides them in taking appropriate actions. In a
developing society like ours where a planned process of modernizations is being
pushed through, the significance of communication cannot be over emphasized.
There are two basic types of communication processes : face-to-face
communication and mass communication. Mass communication refers to “all the
impersonal means of communication by which visual and /or auditory messages
are transmitted directly to audiences. Included among the mass media are
television, radio, motion pictures, newspapers, magazines, books and bill-boards”
(Gerbner, 1976).
Mass Media of communication are a gift of the technological revolution. They
command the benefit of an increased output, greater accessibility and wider reach.
They are very crucial for nation building and national development in any
developing society.
The concept of modernization refers to the “fundamental proposition that
people in traditional societies should adopt the characteristics of modern societies
in order to modernize their social, political and economic institutions”
(Foster-Carter, 1985 : 13) This theory saw the problems of the Third World as
emanating from lack of information and the practice of traditional cultural
practices that hindered development. The remedy of these problems was
communication. The modernization paradigm dominated intellectual thinking
from around 1945 to 1965 (Servaes, 1995 : 40), and communication played a crucial
role within it. Daniel Learner (1958) and Wilber Schramm (1964) were influential in
this regard because their works stressed the role of communication in development
(Servaes, 2002 : 15-16) they theorized that communication was the transmission of
information from the Western world to the Third World. They had a strong belief
that if traditional societies were exposed to the mass media, they would also be
exposed to modern western attitudes which would make them change (Servaes,
2002 : 15-16).
Learner (1958) introduced an evolutionary modernization theory by
presenting different stages that had to articulate the process of modernization and
the sequence in which those stages had to occur. Development, according to
Learner (1958), starts with a nucleus of mobile, change-accepting personalities
followed by interaction of urbanization, literacy, industrialization, higher per
capita income and political participation. The major driving force behind these
personalities is empathy, a psychological attribute that capacitates individuals to
adjust easily to or emulate modern environments and to be future oriented and
rational. In this process “the media stimulate, in direct and indirect ways, mobility
and economic development; they are motivators and movers for change and
192 Manoj Kumar Srivastava

Communication and Development 193
modernization” (Servaes, 2002 : 25). The media were thus viewed as agents of
modernization in the sense that once urbanization occurred, literacy rates would
rise. Consequently, industrial development would accelerate, resulting in the
growth of the mass media which would spread literacy (Melkote and Steeves, 2001
: 116).
Wilbur Schramm (1964) supported the idea of introducing empathy in
traditional cultures but used a more sympathetic approach. According to Wilbur
Schramm “the modern mass media supplement and complement as mobility
multipliers, the oral channels of traditional society”. He believed that the mass
media could speed up and ease the long slow transformation that was necessary
for economic growth and mobilization of human resources. At the micro level,
media could play an educational role in preparing individuals for development by
creating a climate change. At the macro level, leaders could use media in a
top-down communication to disseminate development information (Melkote, 1991
: 85-86). In the 1950s and 1960s, scholars did not only enthusiastically accept the
role of the mass media (radio, newspapers, cinemas, television) in modernization
but also ventured into research activity to demonstrate the correlation between
exposure to the mass media and modernity (Melkote, 1991 : 88).
Evert Rogers (1962, 1983) developed the diffusion of innovations theory as
another communication model of modernization. “Modernization here is
conceived as a process of diffusion where individuals move from a traditional way
of life to a different, more technically developed and more rapidly changing way of
life” (Servaes, 1995 : 39). In this model of innovation, which a new idea or practice,
is communicated through certain media, over time, among members of a social
group with the aim of changing their way of thinking or doing things. The model
sees development as a type of social change in which new ideas are introduced into
a social system to improve agriculture, health, education and politics. To put it in
Rogers own words, development communication is a “process by which an idea is
transferred from a source to a receiver with the intent to change his behavior.
Usually the source wants to alter the receiver’s knowledge of some idea, create or
change his attitude towards the idea, or persuade him to adopt the idea as part of
his regular behavior” (Rogers, 1962). This model worked in the premise that new
ideas diffuse over time, according to individuals stages. He distinguished five
different stages in the diffusion process through which an individual goes in the
adoption of innovations: awareness, interest, evaluation, trial adoption or
rejection. The role of mass media manifests in the first stage which is awareness
where the traditional society is exposed to the new ideas or innovations.
The mass media in the modernization paradigm are regarded as having
magical powers to multiply the benefits of development in poor nations. It is
assumed that the mass media can change peasant’s mind-set and introduce them to
a modern way of life (Melkote, 1991 : 87). The communication models employed by

the modernization paradigm were media centered and aimed at improving
literacy levels of traditional societies in an attempt to persuade them to break away
from their traditional barriers. Communication was linear or an unidirectional
process, flowing from the source, through the media, to the passive recipients. The
growth and presentation of the mass media in traditional society, therefore, was
indicative of modernization. More radios and increased reading of newspapers
were regarded as positive makers of modern attitudes (Learner, 1958). Another
weakness of the modernization paradigm is the lack of correlation between
penetration of the mass media and increase in literacy levels. Without proper
formal education, literacy levels cannot improve even if the media are there to
disseminate information. If literacy levels are poor, it is difficult for people to
understand the message or information made available to people through the mass
media.
The modernization paradigm has been severely criticized for not allowing
people’s participation at the grassroots. Problems are identified and solutions
offered at top levels of government and development agencies. Then a top-down
flow of information occurs from government or development agencies to the local
communities because it is considered that grassroots participation is slow,
inefficient and that people at the grassroots do not know what is good for them. In
recent years, however, many scholars have recommended “people who are objects
of policy need to involve in the definition, design and execution of the
development process” (Melkote, 1991 : 191). When local communities are not
involved in the decision-making processes, development projects tend not to be
successful. Although the modernization paradigm continues to dominate in
development projects in spite of many new challenges facing development projects
(Dyll, 2002), the 1970’s saw a shift in the conceptualization of development to allow
the participation of local communities. This shift is generally referred in as
development as empowerment paradigm. Melkote and Steeves (2001 : 366) argue
that “a major foal of development as empowerment is to move the locus of control
form outsiders to the individuals and groups directly affected. Empowerment is
the mechanism by which individuals, organizations and communities gain control
and mastery over social and economic conditions, over political processes and over
their own stories”. Rogers (1976 : 133) testifies to this assertion when he defines
development as “a wide participatory process of social change in society, intended
to bring about both social and material advancement (including greater equality,
freedom and other valued qualities) for the majority of the people through their
gaining greater control over the environment.”
The model of Development Support Communication (DSC) arose as a bridge
between modernization theory and dependency theory (Melkote, 1991). DSC relies
heavily on the role of the media in development and values grassroots
participation because it regards the local groups as the beneficiaries of
194 Manoj Kumar Srivastava

Communication and Development 195
development projects. The theory legitimizes outside agencies as harbingers of real
social change and promotes local messaging for easy adoption of donor-funded
projects by local communities. DSC wants to ensure that beneficiary communities
have access to material, informational, cultural and psychological resources;
leadership, life and communication skills; local empowerment and critical
awareness (Melkote and Steeves, 2001 : 252). In essence, DSC displays key
components of the participatory model of communication provided by Figueroa et
al (2002) which can be summarized as follows :
8 Community owns the process and content of communication.
8 Communication gives a voice to previously unheard community members
8 Communities become their own agents.
8 The communication process is characterized by debate and negotiation on
issues that affect community.
8 Emphasis is placed on outcomes that go beyond individual behaviour to
widely recognized social needs.
Although these key components look flowery and democratic, real
participatory communication in DSC paradigm has been frequently
misunderstood and overlooked because of the unwillingness of experts to give up
control over the process, and due to the inability of development support workers
to appreciate and operationalize true participatory approaches at the grassroots.
The lack of grassroots participation in DSC was blamed for the failure of most
development projects. It was therefore imperative for participatory theorists to
redefine development communication. One such definition is that communication
is “the systematic utilization of communication channels and techniques to
increase people’s participation in development and to inform, motivate and train
rural population mainly at grassroots” (Waisbord, 2000 : 17), hence another
development paradigm has been defined as “need oriented, endogenous,
self-reliant, ecologically sound and based on participatory democracy and
structural transformations” (Servaes, 1966 : 32).
Another development theory focuses on community access and participation
in development projects. It sees access as “the use of media for public service”
(Servaes, 1996 : 79), and participation as a process of empowering the people to
participate in identifying the problem or designing a development programme
(Melkote, 1991 : 237). Here individuals are active in development programmes and
processes; they contribute ideas, take initiatives, articulate their needs and
problems and assert their autonomy. Thus, participation requires a higher level of
people’s involvement in the communication system especially the media. People
have to be involved in the production process, management and planning of the
communication system. “In this case, the public exercises the power of decision
making within communication enterprises and is also fully involved in the

formulation of communication policies and plans” (Servaes, 1996 : 79). However,
drawing examples from the working relationships between developed and
underdeveloped countries, although people are involved in the formulation of
policies the donors still have a right to say no considering their position as the
sponsors of the programmes.
Servaes (1996) discusses the notion of participatory communication at length.
He stresses the importance of communication at all levels, international, national,
local and individual, and points out that this participation does not only mean
“inclusive of but largely emanating from the traditional receivers” (Servaes, 1996 :
75). Participatory communication is, thus, a reciprocal process involving the
marginalized groups who are trying to renegotiate their situation with the
development agents. In other words, participatory communication gives the local
community a right to freely share or exchange information and to reach a
consensus on what they want to do or to be done. Freire (1983 :76) cautions that
“this is not the privilege of some few men (and women), but the right of all people
to individually and collectively speak their word.” When applied to development
projects , participation is seen as very important in any decision making process in
order for various stakeholders to share information, knowledge, trust and
commitment in development projects (Servaes, 1966 : 75). According to Xavier
Institute (1980 : 11), “development efforts should be anchored on faith in the
people’s capacity to discern what is best to be done as they seek their liberation and
how to participate actively in the task of transforming society. The people are
intelligent and have centuries of experience. Draw out their strength. Listen to
them.” Thus participatory Communication advocates the decentralization of
media systems and the dissolution of the status quo because it involves a more
equitable sharing of both, political and economic power, which often decreases the
advantage of groups in power.
Role of communication in agriculture has been the concern of many studies.
Murthy (1969), Singh (1970), Gaikwad (1972) and many others have studied factors
affecting the communication behavior of the farmers. It has been shown in these
types of studies that social and demographic factors like age, caste, education,
socio-economic status and land owned affect the communication behaviour of
farmers. It has also been shown that local influentials and leaders are more exposed
to newspapers, radio and television. Impact of interpersonal communication for
getting information has been revealed by many scholars (Singh, 1970; Verma, 1970;
Mathai, 1971; Gaikwad, 1972; Mohapatra, 1974) village level workers, family
members, friends, upper caste educated persons and kins played a vital role in
such communication as adoption and diffusion of certain agricultural technology
and innovations. Shah and Bhatnagar found interpersonal sources of
communication as more significant than mass media. Among mass media, the
radio and documentary films were found significant to some extent.
196 Manoj Kumar Srivastava

Communication and Development 197
The media in India has been highlighting the conservation and
environmental issues over the years. The media has frequently focused attention
on various aspects of environmental degradation and articulated the fears and
anxieties of the people. According to V. S. Gupta (1989 : 42), it has been
spearheading a debate on broad issues of public policy regarding environment and
development. The media has also highlighted some remarkable initiatives taken by
the people in conserving precious heritage of the country. He has emphasized that
the need of the hour is a continuing dialogue between the media practitioners,
policy makers and grass root agencies so that environmental protection measures
really get translated into concrete result.
Acharya (1987) has emphasized that communication planning has not got an
adequate theoretical backing in India. The expansion of TV network as a result has
been haphazard, leaving a wide gap between the hardware and software needs
and their coordinated use. That television has tremendous potential for
development and education, is above dispute and it has the potential of becoming a
sensitive mass medium that is people oriented, problem oriented and development
oriented. He argues that this potential can not be achieved without a sound
television policy based on an integrated communication and information
perspective with a futuristic view.
Raghavan (1980) has tried to show as to what extent mass media reached the
masses in India based on the surveys of formal, informal and traditional processes
of social education. He has shown that the mass media has limited effectiveness in
reaching rural areas because of social and physical variables as well as their own
organization. Messages transmitted through Government films tended to be
understood differently in culturally diverse areas.
Jaspal Singh (1990) has gauged the impact of television on society. He has
argued that television as such is not an agent of development communication. It
depends on how it is used by those who control it, and how much is its credibility
with users.
The mass media considered here trying to explain environmental awareness
are newspapers, radio and television because these are the most widely and
frequently used modern mass media.
We can say that the relevance of media in almost all spheres of human
endeavor cannot be overemphasized, more so in the area of development. It is
necessity for good governance, responsible leadership goes hand in hand with the
need for active role of strong and equally disciplined communication media
towards enlightening, mobilizing and sensitizing the public in this concern. Sogolo
G. (1995) says in this s reference “The role of information in National Development
is no longer a matter of dispute. And as we have argued, information is useful if
only it is properly disseminated.”

References
1. Agarwal Birbala and Gupta V. S., Hand Book of Journalism and Mass Communication,
New Delhi : Concept Publishing Company, 2001.
2. Joshi, P. C., Communication and National Development, Anamika Publishers &
Distributors (P) Ltd., 2002.
3. Kumar, J. Keval, Mass Communication in India, Mumbai : Jaico Publishing House, 2013.
4. McQuail Denis, Towards a Sociological Communication (Themes & Issues in Modern
Society), London : Collier-Macmillan, 1969.
5. Tiwari, I. P., “Sadharikaran : Indian Communication Theory”, Indian and Foreign
Review, June 1, 1980, 13-14. ê
198 Manoj Kumar Srivastava
Article Received on June 04, 2017; Accepted on September 11, 2017

20
Critical Theory and Social Movement
Analysis : Theoretical Insights into
New Social Movements
Yumlembam Khogen Singh*
The primary aim of the present paper is to link the emancipatory project of the ‘critical
theory’ with the concept of ‘social movements’ and to gain insights into the comprehensive
understanding of contemporary ‘new social movements’. Present paper uses available literature
on the theme and some seminal works of pioneering critical theorists to come up with practical
insights. Present paper first presents the general contributions of the ‘Critical Theorists and
Frankfurt School’ and then delves into the works of the pioneering critical theorists like Max
Horkhiemer, Theodor W. Adorno, Herbert Marcuse, and Jurgen Habermas. Then, this paper
attempts to sketch a critical theory of social movements out of the seminal works of these
pioneering critical theorists and moves on to examine the sociological contributions of critical
theory to the study of social movements. After analyzing how ‘critical theory’ can be a useful
paradigm for social movements analysis with special reference to contemporary new social
movements, this paper construes that critical theory played a crucial role in re-conceptualization
of social movements as an emancipatory and self-actualization project and it inspired emergence
of new social movements. Critical theory can supply methodological and theoretical pluralism to
social movement analysis that can be of crucial use in the analysis of new social movements where
agency and structure are in constant interaction producing new cultural patterns of society.
[Keywords : Critical theory, Frankfurt School, New social movements, Max
Horkhiemer, Theodor W. Adorno, Herbert Marcuse, Jurgen Habermas]
CONTEMPORARY SOCIAL SCIENCES, Vol. 26, No. 3 (July-September), 2017
* Department of Sociology, Manipur University (A Central University), Canchipur-Imphal-795003,Manipur (India) E-mail: <[email protected]>

1. Introduction
‘Critical Theory’ has a narrow as well as a broad meaning in the philosophyand history of the social sciences. In the narrow sense, ‘Critical Theory’ designatesseveral generations of German philosophers and social theorists in the WesternEuropean Marxist tradition known as the Frankfurt School (Bohman, 2010). Innarrow sense, it is that theory which seeks to liberate human from thecircumstances that enslaves them, i.e. human emancipation. Max Horkheimer(1982) gave such a narrow definition of critical theory. However, in the broadersense ‘Critical Theory’ means many ‘critical theories’ that emerged in connectionwith the many social movements identifying varied dimensions of the dominationof human beings in modern societies which aim to explain and transform all thecircumstances that enslave human beings (Bohman, 2010). However, despite suchvariant understanding of ‘critical theory’, it provides the descriptive andnormative bases for social inquiry aimed at decreasing domination and increasingfreedom in all their forms. Hence, ‘Critical theory’ refers to a series of approachesfor intellectual inquiry that first emerged with the end of the 18th centuryEuropean Enlightenment when people began to lose hope in the intellectualconfidence that bourgeois society would succeed in realizing Enlightenmentideals, i.e. attainment of liberty, justice, prosperity, and contentment for all of itscitizens. Presenting the broader sense of the term ‘critical theory’, Bohaman (2010)maintained that it is beyond the Frankfurt School that begins with Horkheimer and Adorno stretching up to Marcuse and Habermas, but any philosophical approachwith similar practical aims could be called a ‘critical theory’, including feminism,critical race theory, and some forms of post-colonial criticism. However, themeaning of ‘Critical Theory’ for the present paper is only to the “Frankfurt School”and its pioneering theorists. It is because ‘critical theory’ originated as an approachout of the critical dialogue and discourses among some scholars on the ideals andpracticality of capitalism and Marxism in the early 1920s in Frankfurt School,Germany. In this backdrop, the present paper makes an attempt to apply thephilosophical and theoretical contributions of critical theorists in making sense ofthe contemporary ‘new social movements’.
2. Objectives and Methodology
The primary aim of the present paper is to link the emancipatory project ofthe ‘critical theory’ with the concept of ‘social movements’ and to gain insights intothe comprehensive understanding of contemporary ‘new social movements’.Present paper uses available literature on the theme and some seminal works ofpioneering critical theorists to come up with practical insights. First, the presentpaper presents general contributions of the ‘Critical Theorists and FrankfurtSchool’, and then delves into the works of the pioneering critical theorists like MaxHorkhiemer, Theodor W. Adorno, Herbert Marcuse, and Jurgen Habermas. Then,the present paper attempts to sketch a critical theory of social movements out of the
200 Yumlembam Khogen Singh

Critical Theory and Social Movement Analysis 201
work of these pioneering critical theorists and moves on to examine thesociological contributions of critical theory to the study of social movements byanalyzing how ‘critical theory’ can be a useful paradigm for social movementsanalysis with special reference to new social movements.
3. Critical Theorists and Frankfurt School : Major Contributions
Critical theory is also known as Frankfurt School in sociology and criticaltheory has become synonymous with Frankfurt School (Doshi, 2009). FrankfurtSchool refers to the work of the members of the Institute for Social Researchestablished in Frankfurt, Germany in 1923 as the first Marxist-oriented researchcenter affiliated with a major German university. Max Horkheimer became theDirector of the Institute for Social Research in 1930, gathering around himself many talented theorists like Herbert Marcuse, Theodor W. Adorno etc. UnderHorkheimer, the institute sought to develop an interdisciplinary social theory thatcould serve as an instrument of social transformation. The work of this era was asynthesis of philosophy and social theory, combining sociology, psychology,cultural studies, and political economy, among other disciplines within a sharedtheoretical framework of Marxism. At the very beginning, this approach wassimply called as ‘materialistic theory’. Critical theory began by inquiring into whatprevents the realization of Enlightenment ideal as a code for the quasi-Marxisttheory of society developed by a group of interdisciplinary social theorists.However, later it was given the code name ‘Critical Theory’, though it was notidentical with the orthodox Marxism (Doshi, ibid.). From its beginning, theFrankfurt School rejected orthodox Marxism and other closed or deterministicphilosophical systems in favor of radical, open-ended, unfinished philosophicalcritiques of various forms of cultural, political, and ideological domination intwentieth century societies. Besides Horkheimer and Adorno, leading figures ofthe Frankfurt School before the War included Friedrich Pollock, Herbert Marcuse,Walter Benjamin, Leo Lowenthal, Erich Fromm, Otto Kirchheimer, and FranzNeumann. Although differing widely in their specific interests, methods, sources,and publications, the intellectuals of the Frankfurt School were committed to thedevelopment of a “critical theory” of society that examined its own assumptionsand biases in an ongoing process of self-reflection and did not claim neutralityindependent of its social origins and purposes. Scholars of the Institute for SocialResearch in Frankfurt like Horkheimer, Adorno, Marcuse, and others reached theconclusion that the traditional Marxist focus on a revolutionary working class hadbeen cooled down so there was need for reformulation of the labour class. In 1933,Nazis came to power in Germany and dismissed Horkheimer and other Jewishfaculties of the institute. Most of the scholars of the Frankfurt School left Germanyfor New York, Geneva, France, Great Britain, and United States etc. Returning toGermany at the height of the Cold War in 1950, Adorno and Horkheimer tried torebuild the institute and devoted themselves to educating a new generation ofGerman students. Their commitment to Marxism, a function of their belief in the

1920s and 1930s that only revolutionary change could prevent the triumph offascism, weakened under the changed conditions of the postwar era. Their work,increasingly preoccupied with the protection and extension of individual freedom,reflected their growing skepticism about any positive alternative to inexorabletrend toward scientific-technological rationalization in the advanced industrialsocieties and consequent loss of personal autonomy. According to Doshi (2009),such political constraints especially the oppression done by the Nazis on the Jewsled to the disintegration of the Frankfurt School.
4. Major Contributions of the Frankfurt School and Characteristics
of Critical Theory
According to George Ritzer (2007), the major contributions of critical theorycan be found in the areas of subjectivity, dialectics, knowledge and human interest.Frankfurt School has made a strong effort to reorient Marxian theory in a subjective direction (say by Marcuse, Habermas etc.). Frankfurt school’s concern ofrationality, cultural industry, and knowledge industry can well be taken as itsshifting interest to ideology. Again, Frankfurt school’s focus on the social totality,an interest in dialectics is one of the major contributions of this school to theanalysis of the social world. They refused to be utopian but focus on criticizing andchanging contemporary society with an orientation to thinking about future.Efforts towards unification between theory and practice become one of the goals ofcritical theorists (say Horkheimer). In the realm of knowledge and human interest,J. Habermas differentiated among three knowledge systems and theircorresponding interests. Such interest in the relationship between knowledge andhuman interest can be taken as an example of Critical theory’s broader dialecticalconcern with the relationship between subjective and objective factors.
According to some contemporary social thinkers (Ritzer, 2007; Doshi, 2009)primary characteristics of ‘Critical Theory’ lie in their critiques of social andintellectual life. Despite diverse interests, intellectuals of the critical school had‘emancipation’ of man (read human beings) as the central theme of analysis. Critical theory is marked by their criticism of Marxian Theory/Economic Determinism.Critical theory’s starting point is critique of Marxian theories. They not onlycriticized the economic determinist Marxian theory but tried to balance by sayingthat attention should be given to the cultural realm also. Another defining feature of ‘critical theory’ is its critique of Positivism. Positivism is opposed by critical schoolspecially its stand of a single scientific method for all fields of study. The criticaltheorists prefer to focus on human activity as well as on the ways in which suchactivity affects larger social structures. As a continuation of Marxian tradition,critical school criticizes modern capitalist society and it varied components. Criticaltheorists are of the apprehension that there will be domination of cultural ratherthan economic elements in the modern society; therefore seek to focus on thecultural repression of the individual in modern society. They are not happy with the irrationality of the modern world at the label of rationality. As Ritzer (2007) argued,
202 Yumlembam Khogen Singh

Critical Theory and Social Movement Analysis 203
‘critical theory’ is very critical about the ‘cultural industry’, the rationalized,bureaucratized structures (e.g. television networks) that control modern cultureand stand against the stress on consumerism culture. Critical theory has its ownway of dealing with issues pertaining to newer knowledge formations. Accordingto Critical theorists autonomous structures in our ‘Knowledge Industries’, i.e.entities concerned with knowledge production for example Universities andresearch institutes, extend themselves beyond their original mandate and they have become oppressive structures interested in expanding their influence throughoutthe society (Ritzer, ibid.).
5. Pioneering Critical Theorists and their Contributions
Some of the select pioneering critical theorists are Max Horkhiemer, TheodorW. Adorno, Herbert Marcuse, and Jurgen Habermas. It will be worthwhile to lookinto the work and ideas of these pioneering theorists of the ‘critical school’ andderived some insights into their critical perspectives toward industrial society andcorresponding social structures and processes.
5.1 Max Horkheimer (1895-1973)
Max Horkheimer was born in 1895 in Sttutgart, Germany and got his doctoratefrom University of Frankfurt in 1922 by working on Immanuel Kant. He became theDirector of the Institute of the Social Research in 1930. Max Horkheimer emerges asthe Frankfurt School’s dominant figure. Horkheimer as the Director of the Institutefor Social Research during early 1930s and exile period in the United States tightlycontrolled the publications and discussions of the Institute. Horkheimer played astrong administrative role in Frankfurt University in late 1940s, but a less active rolein the development of critical theory, a position that devolved on Adorno and laterHabermas (Wiggershaus, 1994). One of the major contributions of Horkhiemer is hisdedication at developing a trans-disciplinary social theory of the present agegrounded in empirical studies of political economy, and wanting to engage in morephilosophically-oriented theoretical work i.e. his idea that theoretical and empiricalresearch should mutually inspire and penetrate each other (Doshi, 2009;Wiggershaus, 1994). Horkhiemer in his joint work with Adorno, ‘The Dialectics ofEnlightenment (1979)’ dared to show the pessimistic side of the enlightenment andtook the opportunity to criticize enlightenment (Doshi 2009) and it becomes one ofthe noteworthy contributions of the Frankfurt School to social science. Horkhiemerbelieved that enlightenment had “self-destructive tendencies”, i.e. specific social,cultural and conceptual forms realized in modern Europe contained its ownpossibility of a reversal (Bohaman, 2010). He brought together psychology andsociology that posed a great change to social philosophy. For example, his workamong German workers applied sociological methods of social research andpsychoanalytic theory to find out the relationship between social development andpsychic structure among German workers and employers. Thus, he initiated criticalsociology’s belief that theory and practice should not be separated.

5.2 Theodor W. Adorno (1903-1969)
Th. W. Adorno was a contemporary and a close associate of Horkhiemer.Both worked together in some books. Adorno was one of the most importantphilosophers and social critics in Germany after World War II, a seminal socialphilosopher and a leading member of the first generation of Critical Theory. Bornon September 11, 1903 as Theodor Ludwig Wiesengrund, Adorno lived inFrankfurt. Adorno left Germany in the Spring of 1934. After returning to Frankfurtin 1949 he took up a position in the Philosophy Department and Adorno quicklyestablished himself as a leading German intellectual and a central figure in theInstitute of Social Research (Zuidervaart, 2011). Adorno was a critique oftechnology as he believed that man’s technical progress enable him to control thenatural world but the same technology has enslaved him (Doshi, 2009). Adorno’scultural studies show that a similar logic prevails in television, film, and therecording industries. In “The Culture Industry”, a chapter in Dialectic ofEnlightenment (1944), Adorno argues that the culture industry involves a changein the commodity character of art, such that art’s commodity character isdeliberately acknowledged and art “abjures its autonomy” (Zuidervaart, 2011).
5.3 Herbert Marcuse (1898-1979)
H. Marcuse studied philosophy at Berlin and Freiburg and became a part ofthe Institute for Social Research in Germany, and then went to the United States in1934. While associating with the Institute for Social Research, Marcuse achievedgreatest fame in 1960s as a guru of the new social movements in the United Statesand Western Europe of that time. Marcuse was sympathetic to the new socialmovements like student, anti-war, feminist, civil rights, gay rights movements andconsidered them as ways to change but he himself was pessimistic about suchchange. In his seminal work ‘One Dimensional Man’ (1964), Marcuse held that“technological rationality” distorted and reduced experience to an impoverishedremnant (Ritzer, 2007). Marcuse (1991) gave his own interpretation of moderncapitalist society and defined it as ‘one dimensional’ society consisting of enslavedconsumers and mass culture audiences.
5.4 Jurgen Habermas (1929- )
J. Habermas succeeded to Horkheimer’s Chair in Philosophy and Sociology atthe University of Frankfurt in 1964 and served as the Director of Research at the MaxPlanck Institute in Starnberg from 1972 to 1981, then returned to University ofFrankfurt. He developed a theory of ‘communicative action’ that seeks a rationalgrounding of freedom in argumentative discourse in an ideal speech situation freefrom domination. As he recognizes that many of Karl Marx’s ideas have becomeobsolete, he moves towards Max Weber as a source of alternative idea. Habermas’sfocus was to transform the negative critique of original critical theory into a positiveprogramme for emancipator practice (Doshi, 2009). While criticizing Marxism’srelevance to the modern capitalist societies, Habermas rejects the oppression-exploited theory of Karl Marx and argues that it has been replaced by psychological
204 Yumlembam Khogen Singh

Critical Theory and Social Movement Analysis 205
and ethnic deprivation. He asserted that labour of modern capitalist society is nownot forced to go for revolution (Doshi, 2009). Habermas’s main criticism of Marxismis that Karl Marx’s class struggle and ideology have become irrelevant. In his theoryof communicative action and domination theory, Habermas (1984) suggested thatwe need to construct ‘ideal speech community’ so that we can have undistortedcommunication leading to emancipation of humankind.
6. Critical Theory and Sociology of Social Movements
As compared to other critical theorists, Max Horkheimer seems to have lessinspired the social movement scholars. However, Max Horkheimer’s views on‘positive social change’ suggest towards social movements as a rational attempt toimprove society by combating ‘problems of irrationality’ associated with capitalism and his assertion that problems face by common masses are ‘social coordinationproblems’ hints towards the re-organizational capacity of social movements tobring a desired social order. According to Kellner (1989), Theodor Adorno’s worksand his presentation of society as a whole that needs to be transformed are stilluseful to describe and analyze contemporary conservative movements in theUnited States and their changing characteristics over the time. When DouglasKellner (2005) studied the global justice movement, he testified the continuedrelevance of Marcuse’s revolutionary concept of the ‘Great Refusal’ (Marcuse, 1991) in the analysis of social movements. According to Kellner (2005 : 6), Marcuse’spolitical and activist version of critical theory in particular is very significant forunderstanding the strategy and socio-political horizons of contemporary struggles(social movements). Agger (1991: 110) pointed out, Habermas’s communicationtheory attempted to shift from the paradigm of consciousness to the paradigm ofcommunication and it enabled the development of workable strategies of‘social-movement formation’. In the words of Agger (1991 : 125) the “new socialmovements” theory of J. Habermas ‘offers theoretical insights to scholars of socialmovements who otherwise lack a larger theoretical perspective that explains wherethese movements come from and what sort of structural impact they might have….Unlike most sociological students of social movements, Habermas locates points ofresistance against systemic domination that give his overall critical social theory acertain practical intent’. Thus, Habermas’s (1981) “new social movements” theoryintroduced consideration of the aspects of ‘domination’ that was typically ignoredby Marxism. This addition of the crucial angle of ‘domination’ in social movementanalysis has served as a substantive contribution to sociology in general andsociology of social movements in particular.
7. Concluding Remarks
After a thorough analysis of the Alter-globalization and Occupy movements,Masquelier (2013 : 1) demonstrated that ‘first-generation critical theory cancontinue to play a significant role in conceptualizing contemporary forms ofresistance by capturing the social malaise engendered by neoliberal capitalism andby informing the practice of resistance in contemporary capitalist societies’.

Similarly, critical theory will be of immense help in the analysis of LGBTmovement as protection of individual freedom and corresponding mobilizationsare well addressed by critical theory. Critical theorists’ shifting interest to ideologyalso goes in parallel with the ever-increasing ‘identitarian’ movements in theworld. With its focus on newer knowledge formations and social totality, criticaltheory can offer a theoretical tool to examine the new context of emergence andsuccess of the densely networked and complex protests movements like the‘Occupy movement’. Given all these, this paper construes that critical theoryplayed a crucial role in re-conceptualization of social movements as anemancipatory and self-actualization project and it inspired emergence of newsocial movements in 1960s and 1970s. Critical theory can supply methodologicaland theoretical pluralism to social movement analysis that can be of crucial use inthe analysis of new social movements where agency and structure are in constantinteraction producing new cultural patterns of society. All these make us to rethink ‘critical theory’ as a theoretical model to explore and comprehend theemancipatory politics of contemporary new social movements.
References
1. Ben Agger, “Critical Theory, Poststructuralism, Postmodernism : Their SociologicalRelevance”, Annual Review of Sociology, 17, 1991, 105-131.“”
2. Charles Masquelier, “Critical theory and contemporary social movements:Conceptualizing resistance in the neoliberal age”, European Journal of Social Theory,16(4), 2013.
3. Douglas Kellner, “Introduction” in Douglas Kellner (ed.), Collected Papers of HerbertMarcuse, Vol. 3, The New Left and the 1960s, London : Routledge, 2005.
4. Douglas Kellner, Critical Theory, Marxism and Modernity, Oxford, Polity Press, 1989.
5. George Ritzer, Modern Sociological Theory, London : McGraw-Hill, 2007.
6. Herbert Marcuse, One Dimensional Man : Studies in Ideology of Advanced IndustrialSociety, Boston : Beacon, 1991 (originally published in 1964).
7. J. Hanbermas, The Theory of Communicative Action, Vol.1, Boston : Beacon Press, 1984(originally published in 1981).
8. J. Habermas, “New Social Movements”, Telos, 49, 1981, 33-37.
9. James Bohman, “Critical Theory”, Edward N. Zalta (ed.), The Stanford Encyclopedia ofPhilosophy, 2010. Available online at http://plato.stanford.edu/archives/ spr2010/entries/critical-theory. (Accessed on 2/05/2011).
10. Lambert Zuidervaart, “Theodor W. Adorno”, Edward N. Zalta (ed.), The StanfordEncyclopedia of Philosophy, 2011. Available online at <http://plato.stanford.edu/archives/sum2011/entries/adorno/>. (Accessed on 11/5/2011).
11. M. Horkheimer, Critical Theory, New York : Seabury Press, 1982.
12. Rolf Wiggershaus, The Frankfurt School : Its History, Theories, and PoliticalSignificance, London : The MIT Press, 1994.
13. S. L. Doshi, Modernity, Postmodernity and Neo-Sociological Theories, Jaipur , RawatPublications, 2009. ê
206 Yumlembam Khogen Singh
Article Received on July 24, 2017; Accepted on September 16, 2017

21
Role of National Movement of
Twentieth Century in the Elevation of
Women’s Education : A Review Article
Seema Chaudhary*
Education is one of the most vigorous instrument for the women’s empowerment. In
nineteenth century it appears as if the neglect of education of women, which was coupled with so
many social evils brought about a tremendous degradation in the status of women, though the
wave of social reformers led to a very significant legislative, social and educational changes for
women. But the immense political, social and educational awakening among Indian women is
observed during National Movement of twentieth century especially in the years of 1920s. With
the appeal of Mahatma Gandhi to join his Satyagraha, women came out of their homes at first time
in a large number. National Movement of twentieth century played a vital role in the emergence of
women’s empowerment as well as expansion of women’s education. The ground prepared by the
nineteenth century social reformers and leaders, the great impact of National Movement of
twentieth century, Mahatma Gandhi’s untiring work for women’s emancipation and the efforts of
women’s organizations which were also motivated by national movement to a great extent;
education became a mission and led an organized movement for women’s education in India.
[Keywords : Women’s empowerment, women’s organizations,
Subjection, Awakening, Endurance, Satyagraha, Prejudices, Semi-paralysis,
Emancipation]
CONTEMPORARY SOCIAL SCIENCES, Vol. 26, No. 3 (July-September), 2017
* Assistant Professor, Department of History, J. V. Jain (Post-graduate) College Saharanpur, UttarPradesh (India) E-mail: <[email protected]>

1. Introduction
It is widely recognized that of the several areas for women’s upliftment,
education is one of the most important instrument, but there were strong and
deeply rooted prejudices against women’s education which was regarded as
unnecessary and dangerous. It is well known that in Upnishadic period there were
great Brahmavadins, who were lifelong students of philosophy, but there was a
vast gulf between the status of the women in the early Vedic period and that in the
nineteenth century. As Neera Desai expressed this stage of women, Ideologically
woman was considered a completely inferior species, inferior to the male, having
no significance, no personality; socially she was kept in a state of utter subjection,
denied any right, suppressed and oppressed; she was further branded as basically
lacking the ethical fibre.1
Thus it appears as if the neglect of the education of women, which was
coupled with child marriage, polygamy, purdah, sati brought about a tremendous
degradation in the status of women in the 19th century. In his report on State of
Education in Bengal (1836), on the fear shared by Hindus and Muslims alike;
William Adam stated that ‘It was feared that education would undermine the
feminine qualities in women and bring disgrace on their families.2
The Christian missionaries, whatever their motives were the first to focus on
the condition and education of women. In his famous Education Dispatch of 1854,
Sir Charles Wood said : “The importance of female education in India cannot be
over rated…….”3 Dalhousie greeted it as “the beginning of a great revolution in
Indian habits.”4 Though the wave of social reformers in the 19th century initiated by
Rammohan Roy and followed by Ishwarchandra Vidya Sagar, Keshab Chandra
Sen, Swami Dayanand and others led to very significant legislative, social and
educational changes for women.5 Thus undoubtedly female education was
flowered by these native great personalities who were committed to the
architecture of a new reformed society, which would pay women the respect and
freedom they deserve.
2. Role of Indian National Movement in the Elevation of Women’s
Education
We find immense political, social, and educational awakening among Indian
women in the twentieth century, especially in the years of 1920s. Mahatma Gandhi
and Indian National Movement led to the great rise in the status of Indian women
in the twentieth century before independence.
The year 1917 is of great consequence in the history of upliftment of Indian
women, when an enlightened British woman, Annie Besant launched the Home
Rule agitation. In the same year she was elected the president of the Calcutta
208 Seema Chaudhary

Role of National Movement of Twentieth Century in the Elevation of Women’s Education 209
Session of the Indian National Congress. In her presidential address she said, “The
strength of Home Rule Movement was rendered tenfold greater by the adhesion to
it of a large number of women who brought to its helping the uncalculating
heroism, the endurance, the self sacrifice of the feminine nature. Our league’s best
recruits and recruiters are among the women of India.”6
After the Jallianwalabagh massacre in 1919, nearly 200 women attended the
Congress session of Nagpur. This was a striking evidence of the political
awakening and empowerment of Indian Women. With the launching of the
first Non-Cooperation Movement (1920-21) by Mahatma Gandhi and his appeal
to join his Satyagraha, women came out of their homes in a large numbers. This
was an important intervention marking the beginning of the end of women’s
obscurity and at the same time great emergence of women’s education and
organizations.
The Indian National Congress organized an All India Ladies Conference at its
annual meeting held in Ahmedabad in 1921-22. Women from all over India
belonged to literate or illiterate, rural or urban families were thus brought out of
the four walls of their homes. This reduced further the prejudices against women’s
education. Education of women came to be a public issue, opposition to it
notwithstanding.7 The slogan, “Educating a girl means educating a family” has
become the slogan of nationalists by this time.
By the 1920, however the women’s education debate become a sharper, more
politicized issue, because of the expanding base of Nationalist Movement,
Mahatma Gandhi’s views on women’s right to equality and women’s massive
response to the freedom struggle.
Mahatma Gandhi wrote in ‘Harijan’ about the illiteracy among women who
participated enthusiastically in National Movement - “Man has converted woman
into a domestic druge and an instrument of his pleasure, instead of regarding her
as his helpmate and better half ! The result is a semi-paralysis of our society.
Woman has rightly been called the mother of the race. We owe it to her and to
ourselves to undo the great wrong that we have done her.”8 Mahatma Gandhi
expressed his views on ‘Women and English Education’, “There is none on the
earth able to prevent you (Women) from studying the literature of the whole world
if you all fond of literary taste. But when causes of education have been framed
with the needs of society in view, you cannot supply the requirements of the few
who have cultivated a literary taste.”9 Indian women belonged to common families
of both rural and urban areas were motivated by these views and approach of
Mahatma Gandhi about women’s emancipation and education As a result, women
actively participated in the National Movement of twentieth century led by
Mahatma Gandhi. On the other hand this active participation of Indian women in
freedom struggle enlarged their political and social awareness - awareness about
their rights.

The Indian National Congress, in recognition of the role of women in the
freedom struggle, passed a resolution at the Karachi Congress in 1931. The
resolution declared that “all citizens are equal before the law irrespective of
religion, caste, creed or sex in regard to public employment, office, power or
honour.”10
The National Planning Committee appointed by the Congress in 1937 also
declared in its resolution that in a planned society women’s position will be equal
to men. Thus Indian National Congress and Nationalist leaders declared several
times that women’s education was essential for national development.
Due to the impact of National Movement and women’s participation in the
movement, their interest and involvement in political, educational and social
issues; women’s association had started being established all over India in the late
nineteenth and early twentieth century. They shared the goal of bringing women
together to discuss women’s issues which were defined as education.
The establishment of women’s university (1916), the federation of university
women (1920), the national council of women (1925) and the All India Women’s
Conference (1927) were significant development from an educational as well as
historical perspective.11
Three major national organizations emerged after the First World War : The
Women’s Indian Association (WIA) The National Council of Women (NCW) and
the All India Women’s Conference (AIWC). The WIA started by Annie Besant,
Margaret cousins and Dorothy Jinarajadasa, in 1917, in Madras, was primarily for
asking for votes for women in the new constitution to be introduced by the
Montagu Chelmsford reforms. The main objective of AIWC was the promotion of
women’s education.12
In January 1927 the All India Women’s Education Conference held its first
meeting in Poona. It was attended by a large number of social reformers,
professional educationists, women associated with the National Movement and
the wealthy and titled. In this conference numerous resolutions were passed
outlining the best type of education for women.
The first All India Women’s Education Conference condemned early
marriage as it interfered with girls’ education. However the women’s education
was still essentially perceived as strengthening their roles within the dominant
ideological framework of social reform and nationalism. The concept of education
as a prerequisite for women’s equality was the first demand of the AIWC.13 In 1932
AIWC set up the Lady Irwin College at New Delhi to give advanced education in
Home Science for women.14 Though undoubtedly National Movement of
twentieth century played a notable role in the emergence of women
empowerment. The nationalists supported forcefully the necessity of the
expansion of women’s education.
210 Seema Chaudhary

Role of National Movement of Twentieth Century in the Elevation of Women’s Education 211
Owing to the factors like impact of National Movement from the beginning of
twentieth century till the independence, women’s participation in these
movements and the efforts of women’s organizations which were also greatly
influenced by the Indian National Movement for our rights and freedom; the
prejudices against women’s education started lessening. There were 23,517
educational institutions for girls in 1921-22. By 1947, the number had increased to
28,196.15
3. Conclusion
Thus the close association of Indian women with the National Movement of
20th century enabled them to bring about the radical changes in their status with the
least rebuff from men. The ground prepared by the nineteenth century leaders,
beginning of twentieth century with the vast social and political awakening and the
untiring work of Mahatma Gandhi led to the emancipation of women and helped
them to take their rightful place in the society. There is no doubt that he brought
women out of their homes into the public amphitheater in the years of 1920s. As a
result of the impact of the National Movement of twentieth century, Mahatma
Gandhi’s appeal to women to join his Satyagraha, his efforts for women’s
education, women’s participation in the freedom struggle in a large number and
the efforts of women’s organization; women’s education was expanded to a great
extent and became a mission and led an organized movement for women’s
education.
References
1. Neera Desai, Women in Modern India, Bombay : Vora and Company, 1957.
2. W. Adam’s Second Report on State of Education in Bengal, Rajshahi, 1836, Reprinted in
Joseph Dibona (ed.), One Teacher One School, Delhi : Biblia Impex Pvt. Ltd. 1983, 91.
3. J. A. Richey, Selections from Educational Records, Pt. II, 1849-1919, Calcutta : Bureau of
Education, Government of India, 1922, 388.
4. Ibid, 62.
5. B. Kuppuswami, Social Change in India, Delhi : Konark Publishers Pvt. Ltd., 2004, 317.
6. Quoted - B. Kuppuswami, Ibid, 323-324
7. Bharati Ray (ed.), Women of India : Colonial and Post Colonial Periods (Vol. IX Part-3,
History of Science, Philosophy and Culture in Indian Civilization, New Delhi : SAGE
Publications, 2005, 194
8. Mahatma Gandhi, Harijan, 18 February, 1934.
9. Speeches and Writings of Mahatma Gandhi, 20-02-1918, 426-427.
10. Bharati Ray (ed.), Women of India : Colonial and Post Colonial Periods (Vol. IX Part-3,
History of Science, Philosophy and Culture in Indian Civilization, SAGE Publications,
New Delhi, 2005, 194.
11. Hartog Committee Report, 1929, 182-183.

12. Aparna Basu and Bharati Ray, Women’s Struggle : History of All India Women’s
Conference, 1927-1990, Delhi : Manohar Publishers, 1990.
13. Bharati Ray (ed.), Women of India : Colonial and Post Colonial Periods (Vol. IX Part-3,
History of Science, Philosophy and Culture in Indian Civilization, New Delhi : SAGE
Publications, 2005, 195.
14. B. Kuppuswamy, Social Change in India, Delhi : Konark Publishers Pvt. Ltd.,2004, 329.
15. Bharati Ray (ed.), Women of India : Colonial and Post Colonial Periods (Vol. IX Part-3,
History of Science, Philosophy and Culture in Indian Civilization, New Delhi : SAGE
Publications, 2005, 195. ê
212 Seema Chaudhary
Article Received on July 14, 2017; Accepted on September 14, 2017

22
Inter-Gender Drudgery in Paddy
Cultivation
Anshu* and S. K. Varma**
The study was conducted in Kurukshetra district of Haryana state with the objective ofanalysing the inter-gender drudgery in paddy cultivation. Women play a significant and crucialrole in agricultural development and allied fields. It has been observed that more than 75 percentwomen are involved in activities like winnowing, weeding, threshing and cleaning of field farmoperations. The physical strain of female farmers seems to be too high because of heavy work tasksof various activities done by them in agriculture. Sample of 120 households of varioussocio-economic status involved in paddy cultivation operations was taken. The results althoughappear to lend support that most drudgery ridden tasks are assigned to women because of the maledominated social order. The total drudgery taken up by women was almost equal to men.
[Keywords : Women, Man, Involvement, Paddy, Operation, Drudgery]
1. Introduction
In developing countries, women play a significant and crucial role inagricultural development and allied fields. It is most unfortunate that the role ofwomen in agriculture has not yet been highlighted in India. They still remain asinvisible workers. It has been observed that more than 75 percent women areinvolved in activities like winnowing, weeding, grading, threshing and cleaning offield farm operations. The physical strain of female farmers seems to be too high
CONTEMPORARY SOCIAL SCIENCES, Vol. 26, No. 3 (July-September), 2017
* Student, Department of Extension Education and Communication Management, CCS HaryanaAgricultural University, Hisar, Haryana (India) E-mail: <[email protected]>
** Professor, Department of Extension Education and Communication Management, CCS HaryanaAgricultural University, Hisar-125004, Haryana (India)

because of heavy work tasks of various activities done by them in agriculture andallied field (Singh and Vinay, 2013).
According to 2011 census, India’s total population is 121 crore, there are total62.37 crore males and 58.64 crore females in India and in Haryana malespopulation is around 1.35 crore and female population is 1.18 crore. According tothe census, 56.7 percent of the main workers labour force employed in theagriculture and allied activities which reflect the predominance of agriculture inthe matter of employment opportunity. In spite of having a significant place in theeconomy, this sector is facing various problems. As large as 30.58 percent of thetotal workforce engaged in agriculture are female work force are contributing amajor proportion to the farm production as well as household income.
2. Methodology
The study was conducted in Kurukshetra district of Haryana state with theobjective of analysing the inter-gender drudgery in paddy cultivation. Two blocksfrom Kurukshetra district were randomly selected i.e. Thanesar and Ladwa block.Two villages from each block were selected randomly and 30 households fromeach village were selected randomly thus making a total sample of 120 householdsfrom different socio-economic categories. To assess drudgery, out of 30 households 8 households were selected randomly from each village. A semi projectivetechnique was developed for data collection. The instrument consisted of eightpictures, depicting eight important agriculture operations in paddy cultivation,each one of them serve as a stimulus to give expression to the subjectiveexperiences of the respondent. In order to arrive at quantitative measures of thedrudgery perceived by the respondent in eight selected culture practices,Thurstone's law of comparative judgment was used.
3. Results and Discussion
3.1 Socio-economic Profile of Respondents
More than half of the respondent (60.8%) were of middle age group, illiterate(66.7%), belonged to lower caste (40.8%), having low family education status(76.7%) and with negligible social participation. Most of the respondents (72.5%)had joint family, medium family size (40.0%), owned mixed type house (66.7%),cultivator (41.7%) as their main occupation. Less than half of the respondents(40.0%) were landless, having 1-2 milch animals (36.7%) with medium materialpossession (68.3%).
3.2 Comparative Drudgery of Farm Men and Women for different Paddy
Cultivation Operations
Some tentative generalizations derived from past studies and writing of thesubject was made. They were : a) Women’s involvement in crop cultivationoperations by and large is a source of drudgery and the drudgery ridden paddycultivation operations are assigned to women only because of male dominated
214 Anshu and S. K. Varma
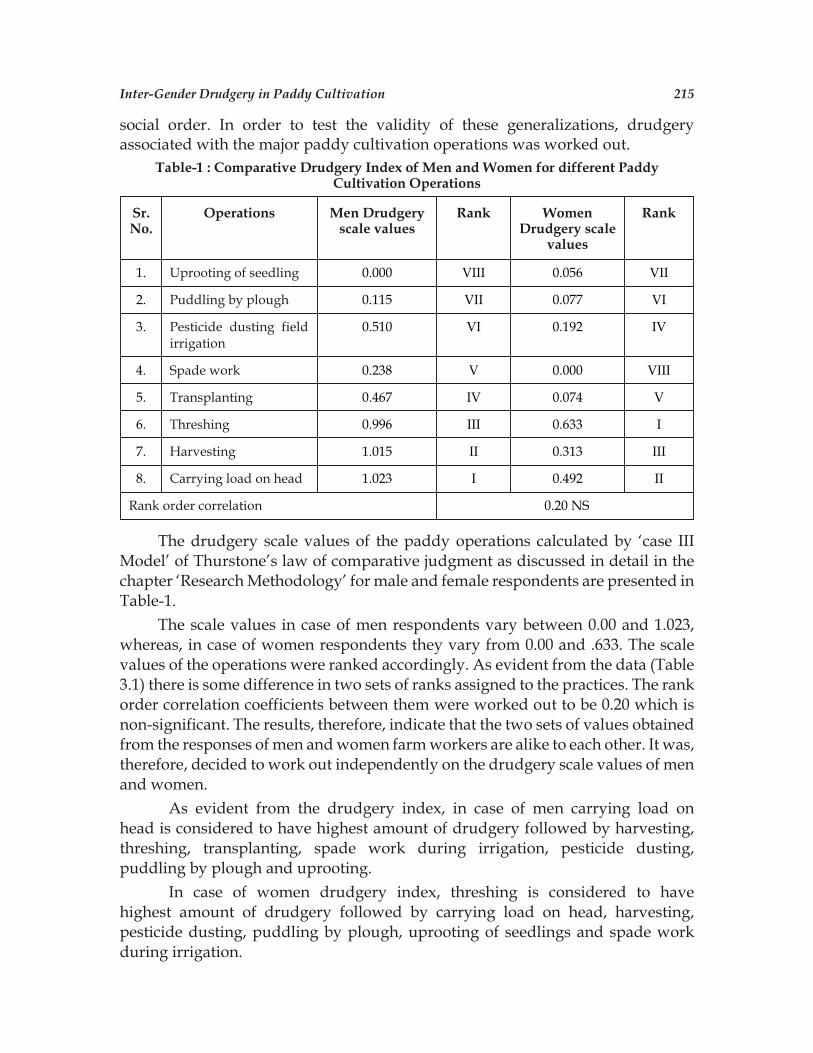
Inter-Gender Drudgery in Paddy Cultivation 215
social order. In order to test the validity of these generalizations, drudgeryassociated with the major paddy cultivation operations was worked out.
Table-1 : Comparative Drudgery Index of Men and Women for different PaddyCultivation Operations
Sr.No.
Operations Men Drudgeryscale values
Rank WomenDrudgery scale
values
Rank
1. Uprooting of seedling 0.000 VIII 0.056 VII
2. Puddling by plough 0.115 VII 0.077 VI
3. Pesticide dusting fieldirrigation
0.510 VI 0.192 IV
4. Spade work 0.238 V 0.000 VIII
5. Transplanting 0.467 IV 0.074 V
6. Threshing 0.996 III 0.633 I
7. Harvesting 1.015 II 0.313 III
8. Carrying load on head 1.023 I 0.492 II
Rank order correlation 0.20 NS
The drudgery scale values of the paddy operations calculated by ‘case III
Model’ of Thurstone’s law of comparative judgment as discussed in detail in the
chapter ‘Research Methodology’ for male and female respondents are presented in
Table-1.
The scale values in case of men respondents vary between 0.00 and 1.023,
whereas, in case of women respondents they vary from 0.00 and .633. The scale
values of the operations were ranked accordingly. As evident from the data (Table
3.1) there is some difference in two sets of ranks assigned to the practices. The rank
order correlation coefficients between them were worked out to be 0.20 which isnon-significant. The results, therefore, indicate that the two sets of values obtained
from the responses of men and women farm workers are alike to each other. It was,
therefore, decided to work out independently on the drudgery scale values of men
and women.
As evident from the drudgery index, in case of men carrying load on
head is considered to have highest amount of drudgery followed by harvesting,
threshing, transplanting, spade work during irrigation, pesticide dusting,
puddling by plough and uprooting.
In case of women drudgery index, threshing is considered to have
highest amount of drudgery followed by carrying load on head, harvesting,
pesticide dusting, puddling by plough, uprooting of seedlings and spade work
during irrigation.

The Table-2 reveals the pooled drudgery index of men and women in
different paddy cultivation operations. It was decided to pool the data to work out
unified values of eight practices on the drudgery scale.
Table-2 : Pooled Drudgery Index of Men and Women for differentPaddy Cultivation Operations
Sr. No. Operations Pooled data Rank
1. Uprooting of seedling 0.051 VI
2. Puddling by plough 0.073 VII
3. Pesticide dusting 0.279 IV
4. Spade work during field irrigation 0.000 VIII
5. Transplanting 0.190 V
6. Threshing 0.741 I
7. Harvesting 0.608 III
8. Carrying load on head 0.715 II
The scale value of pooled data varies from 0.00 and 0.741. In case of pooled
data threshing is considered to have higher amount of drudgery followed by
carrying load on head, harvesting, pesticide dusting, transplanting, uprooting of
seedling, puddling by plough and spade work during field irrigation.
3.3 Relationship between Independent Variables and Drudgery undertaken by
Women and Men in Paddy Cultivation Operations
The data revealed that in case of women respondent age, caste and size of
family found to be significantly but negatively correlated with drudgery in paddy
cultivation this might be due to the fact that respondents of younger age group,
belonging to lower caste, having large family were working as agricultural labourson others farms used to undertake higher drudgery load in paddy cultivation
operations. The data further reveal that one variable viz., milch animal was found
to be positively significant at 5% level of significance.
Table-3 : Relationship between Independent Variables and Drudgery undertaken byWomen in Paddy Cultivation Operations
Sr. No. Independents variables ‘r’ value
1. Age -0.27*
2 Caste -0.28*
3 Education -0.16
4. Family education 0.01
5. Social participation 0.15
6. Size of family -0.36*
7. Type of family 0.25
216 Anshu and S. K. Varma

Inter-Gender Drudgery in Paddy Cultivation 217
8. Type of house -0.03
9. Land holding 0.05
10. Milch animal 0.46*
11. Occupation 0.11
12. Material possession 0.19
* Significant at 0.05 level of significance
The data brings to light that in case of men respondent’s four variables viz.,
age, family education, type of house and occupation was found to be negatively
but significantly correlated which might be due to the fact that respondents
belonging to lower caste was working as agricultural labours on others farms used
to undertake higher drudgery load for paddy cultivation operations.
Table-4 : Relationship between Independent Variables and Drudgery undertakenby Men in Paddy Cultivation
Sr. No. Independents variables ‘r’ value
1. Age -0.28*
2 Caste -0.15
3 Education -0.08
4. Family education -0.25*
5. Social participation 0.08
6. Size of family 0.11
7. Type of family 0.08
8. Type of house -0.36*
9. Land holding -0.16
10. Milch animal 0.16
11. Occupation -0.29*
12. Material possession 0.06
* Significant at 0.05 level of significance
4. Conclusion
Drudgery is generally conceived as physical and mental strain, fatigue,
monotony and hardship experienced by women. While all of these results show
decline in living and working conditions affecting men and women alike, the plight
of the poor and the weak in this regard is alarming as they continue to be
constrained by illiteracy, malnutrition and employment.
Finding of the socio personal profile of the respondents revealed that most of
the respondents belonged to middle age group, were illiterate, having medium

sized joint family, belonging to lower caste, had negligible social participation and
had mixed type of house. Majority of the respondents had low family education
status.
As evident from the drudgery index, in case of men carrying load on head is
considered to have highest amount of drudgery followed by harvesting, threshing,
transplanting, spade work during irrigation, pesticide dusting, puddling by
plough and uprooting. In case of women drudgery index, threshing is considered
to have highest amount of drudgery followed by carrying load on head,
harvesting, pesticide dusting, puddling by plough, uprooting of seedlings and
spade work during.
References
1. Amin, H., Ali. T., Ahmad, M. and Zafar, M. I., “Participation Level of Rural Women inAgricultural Activities”, Pak. J. Agri. Sci., 46(4), 2009, 294-301.
2. Anonymous 2009.Gender Issues for Technological Empowerment of Women inAgriculture, DARE/ICAR ANNUAL REPORT 2008-2009. http://www.icar.org.in/files/reports/icar-dare-annual-reports/2008-09/16.Gender%20Issues.pdf
3. Badiger, C., Hasalkar, S. and Huilgol, S., “Drudgery of Farm Women in Agriculture andAnimal Husbandry Operations”, Karnataka J. Agric. Sci., 17(4), 2004, 787-790.
4. Borah, R. and Kalita, M., “Identifying Drudgery Prone Home Activities in Rural Areas of Upper Brahmaputra Valley Zone of Assam”, Stud Home Com Sci., 5(3), 2011, 165-168.
5. Census of India 2011, Government of India
6. Dawn. 2004. Rural Women at Work. The Daily Dawn, Islamabad, Pakistan. http://www. pjlss.edu.pk/pdf_files/2009_2/8.pdf
7. FAO 2010. Statistical Database of the Food and Agricultural Organization of the UnitedNations. http://faostat.fao.org/site/339/default.aspx page567
8. FAO (FAOSTAT) 2012. “Food Balance Sheets > Commodity Balances > Crops PrimaryEquivalent”. Retrieved August 17, 2012.
9. Gita. Feasibility of Fruit Plant Nursery as an Enterprise for Rural Women, M. Sc. Thesis,CCS Haryana Agricultural University, Hisar, 2010.
10. Mrunalini, A. and Snehalatha, C. H., “Drudgery Experiences of Gender in CropProduction Activities”, J Agri Sci., 1(1), 2010, 49-51.
11. Ojha, P. and Kwatra, S., “An Ergonomic Study on Human Drudgery andMusculoskeletal Disorders by Rice Transplanting”, Stud Home Com Sci., 6(1), 2012,15-20.
12. Singh, D. and Vinay, D., “Gender Participation in Indian Agriculture: An ErgonomicEvaluation of Occupational Hazard of Farm and Allied Activities. International Journalof Agriculture”, Environment & Biotechnology, 6(1), 2013, 157-168.
13. Singh, S. and Sharma, A. K., “Gender Issues for Drudgery Reduction and SustainableSmall Holder Farming in Rice Production System”, Journal of Hill Agriculture, 3(2),2012, 99-102.
14. World Bank Group 2011.What We Know About Women in the Economy Today. http://weconnectinternational.org/en/buying-for-impact# ê
218 Anshu and S. K. Varma
Article Received on July 04, 2017; Accepted on September 06, 2017
23
Telecom Infrastructure Development :
Study of Rural India
Faiza Nafees*
India has witnessed a rapid growth of telecommunication sector since last decade. Theprovision of telecom facilities in rural areas brings significant change in the socio-economiccondition of this region. The government of India has taken many initiatives to improvesocio-economic infrastructure in rural areas, it includes water supply, electricity, sanitation andinformation and telecommunication technology. Telecom policies issued from time to time by thegovernment of India plays a positive role in rural telephony. This paper is an attempt to cover theinfrastructure development in rural India and analyze the growth in rural telecom afterimplementation of telecom policies. This study is based on the secondary source of data that havebeen collected through the reports of Department of telecommunication, annual reports of TRAIand various statistical organizations.
[Keywords : Rural telecom, Infrastructure development, Growth, Telecom
policy]
1. Introduction
Telecommunications, as a means of sharing information, is not simply a
connection between people, but a link in the chain of the development process
itself.1 India has witnessed a rapid growth of telecommunication sector in the last
decades. Unfortunately, this development has not been shared equitably by all.
Some sections of the society have been left out and some areas, like rural, tribal and
CONTEMPORARY SOCIAL SCIENCES, Vol. 26, No. 3 (July-September), 2017
* ICSSR Doctoral Fellow, Department of Political Science, Aligarh Muslim University, Aligarh, UttarPradesh (India) E-mail: <[email protected]>

remote areas, could not keep pace with urban areas in development. If vast sections
of society and areas are left out, it breeds unrest and is not conducive to a
sustainable development of the country. Rural telecom infrastructure is not only a
component of rural development but also an important factor to improve rural
economy and quality of life. The government of India designed infrastructural
arrangements exclusively for the betterment of rural life such as includes attention
to roads, irrigation, housing, water supply, electricity, sanitation, natural resources
development and Information and Communication Technology (I.C.T.).
Concerted efforts towards building rural infrastructure can bridge the rural-urban
development gap by accelerating the growth of rural economy.
2. Objective of the Paper
The objective of the present paper is an attempt to cover the infrastructure
development in rural India and analyze the growth in rural telecom after
implementation of telecom policies.
3. Methodology
The present paper is based on secondary data collected from various reports
of the department of telecommunication government of India, TRAI, various
statistical organization and published literature. The data has been analyzed by
simple method and present in the form of charts and tables.
4. Rural Telecommunication
Indian telecom sector have more than 150 years history. The development of
the sector can be understood in two stages :
8 Before liberalization period
8 Post Liberalization (till 1999)
In the first stage the Indian telecom sector faced more domination of
government. After the announcement of various government policies from 1991, it
is opened for the private players and became one of the most liberalized markets in
the world. The New Telecom Policy, 1999 (NTP-99) has played an important role in
the growth of this industry. In new telecom policy 99 various steps taken by the
government to improve the rural telecommunication in India. These are the
important decision taken by the government to improve the condition of rural
telecommunication.
5. National Telecom Policy, 1999 (NTP 1999)
In 1999, the government of India announced the new telecom policy.
Universal service was one of the main objectives of NTP99. The policy outlined
following specific universal service targets2 :
220 Faiza Nafees

Telecom Infrastructure Development : Study of Rural India 221
1. Provide voice and low-speed data service to the balance 2.9 lakh uncovered
villages in the country by the year 2002.
2. Achieve Internet access to all district headquarters by the year 2000.
3. Achieve telephone on demand in urban and rural areas by 2002.
In addition NTP 1999 also set the following targets :
1. Make available telephone on demand by the year 2002 and sustain it
thereafter so as to achieve an all India teledensity of 7 per cent by the year
2005 and 15 per cent by the year 2010.
2. Encourage development of telecom in rural areas through suitable tariff
structure and by making rural communication mandatory for all fixed service
providers.
3. Increase rural teledensity from the current level of 0.4 to 4 by the year 2010
and provide reliable transmission media in all rural areas.
4. Achieve telecom coverage of all villages in the country and provide reliable
media to all exchanges by the year 2002.
The NTP 99 and the consequent creation of the Universal Service Obligations
Fund led to the development of a policy and regulatory framework for managing
Rural Telecom Services (RTS). The targets set by NTP 1999 and the achievements
till March 2004 show that there is an excellent progress in all areas except rural
connectivity.
6. Universal Service Obligation Fund (USOF)
To give impetus to the rural telephony, the Government in June 2002, had
established Universal Service Obligation Fund (USOF) by an Act of Parliament.
Subsequently, the scope of USOF was widened to provide subsidy support for
enabling access to all types of telegraph services including mobile services,
broadband connectivity, and the creation of infrastructures like optical fiber in
rural and remote areas. Therefore, various schemes have been launched by USOF
for provision of telecom services in rural and remote areas of the country.3
7. National Telecom Policy, 2012 (NTP 2012)
The government of India announced National Telecom Policy -2012
(NTP-2012) in 2012. Several steps were taken by the government of India to
improve rural telecom penetration. The main objectives of NTP-201204 :
1. Planning to increase rural teledensity from the current level of around 35
percent to 60 percent by the year 2017 and 100 percent by the year 2020.
2. Planning to provide high-speed and high-quality broadband access to all
villages panchayats through an optical fiber by the year 2014 and
progressively to all villages and habitations by 2020.

3. Simplify the licensing framework to further extend converged high-quality
Services across the nation including rural and remote areas. This will not
cover content regulation.
4. Encourage development of mobile phones based on open platform
standards.
8. Projects to Increase Telecom Penetration In Rural Areas
In India, many broadband or internet project has been launched for the
promotion of rural telecom. These are implemented by the various state
government, corporate house or NGOs. Some projects are :
8 ITC e-Chaupal.
8 N-Logue.
8 MS Swaminathan center in Pondicherry.
8 Akshaya in Kerala.
8 Gyaandoot in MP with a focus on e-Governance.
8 Bhoomi in Karnataka.
8 E-Seva in Godavari District of AP.
8 Warana in Maharashtra by NIC.
8 Aksh Broadband.
8 Jagriti in Punjab.
In these projects, the connectivity to rural areas is through satellite,
microwave link, copper, fiber, depending on what is available already or has been
specially installed for this purpose.5
9. Growth in Rural Telecommunications
India has witnessed a number of telecommunication revolutions during last
decades. The telecom policies, effective regulatory system considered as the main
factor of the growth in the telecom industry in India. Tele-density, which denotes
the number of telephones per 100 populations, is an indicator of telecom
penetration in the country.6 The growth of rural Teledensity is remarkable as it has
risen to 48.04% as on march 2015 from 1.7% in 2004.7 In fact, today rural teledensity
is growing faster as urban teledensity. Teledensity shows the positive relationship
with the level of development.
Table-1 : Growth In Rural Teledensity
Year Rural Teledensity
2007 5.89
2008 9.46
222 Faiza Nafees

Telecom Infrastructure Development : Study of Rural India 223
2009 15.11
2010 24.31
2011 33.83
2012 39.26
2013 41.05
2014 44.01
2015 48.04
Sources : TRAI annual reports.
Fig.-1 : Growth In Rural Teledensity
India had the second largest network with 1036.57 million telephone
connections at march 2016. In March 2016 there were 434.23 million rural
connections (most of which are wireless) while the rural connections at march 2011
were 282.29 million.8 mobile telephony and private players played very important
role in the growth of telephone connection.
Table-2 : Growth in rural telephone connections (in millions)
Year Number of Rural Telephones (in million)
2011 282.29
2012 330.83
2013 349.21
2014 377.78
2015 416.08
2016 434.23
Sources : Department of Telecommunication, GOI.

Fig.-2 : Number of Rural Telephones (in million)
10. Conclusion
The growth of rural telephony denotes the infrastructure development in
India. The low growth in rural teledensity indicates the lack of provided resources
non availability of technology. It is not an easy task to provide all resources in
limited time because India has difficult geographical terrain. On the other side,
Policies issued by government from time to time improve the telecom
infrastructure in rural India.
References
1. Kurukshetra, January 2011.
2. New Telecom Policy 1999, available at http://www.dot.gov.in/sites/default/files/
NTP-1999-final.pdf.
3. GOI, Annual Report, Department of Telecommunication, GOI, 2012-13.
4. National Telecom policy 2012, available at http://www.dot.gov.in/sites/default/
files/NTP-2012-final.pdf.
5. TRAI, “Growth of Telecom Services in Rural India”, Consultation Paper, Telecom
Regulatory Authority of India, New Delhi, 2004.
6. GOI, Annual Report, Department of Telecommunication, GOI 2015-16.
7. Ibid.
8. Ibid. ê
224 Faiza Nafees
Article Received on July 12, 2017; Accepted on September 06, 2017

24
GST in India : Beneficial or not ?
Rekha Garg*
The good and service tax (GST) is a uniform indirect tax levied on goods and services across a country. The GST bill will roll out from July 1 2017. GST, as an umbrella tax, will replacecentral taxes such as Central excise duty, science tax, additional duties of excise & customs,special additional duty of customs and cesses and surcharge on supply of goods and services, itwell also replace state taxes like VAT, Central Sales Tax, Purchase Tax, Entry Tax,Entertainment tax, taxes in advertisement lotteries, betting and gambling and state cesses andceases surcharges. The GST is a good and simple Tax, which well end harassment of traders andsmall businesses while integrating India into one market with one tax rate. It is transparent andfair system that prevents black money and corruption and promotes a new governance culture.From Gangnagar to Etanagar from Leh to Lakshadeep-one nation, one tax one-market.
[Keywords : GST, Consumers, Rate structure, Indian economy]
1. What is GST and how well Consumers benefit from it?
GST is the abbreviated form of goods & services Tax. The main expectation
from this system is to abolish all indirect taxes and only GST would be levied. As
the name suggests the GST will be levied both on Goods and services.
GST was first introduced during 2007-08 budget session. On 17th Dec 2014,
the current union cabinet ministry approved the proposal for introduction GST
constitutional amendment Bill. On 19th of Dec 2014, the bill was presented on GST
in Loksabha. The Bill will be tabled and taken up for discussion during the coming
Budget session. The current central Govt. is very determined to implement GST
CONTEMPORARY SOCIAL SCIENCES, Vol. 26, No. 3 (July-September), 2017
* Assistant Professor, Faculty of Commerce, N. A. S. (Post-graduate) College, Meerut-250001, Uttar Pradesh (India) E-mail: <[email protected]>

constitutional amendment bill. GST is a tax that we need to pay on supply of goods
and services. Any person, who is providing or supplying goods and services, is
liable to charge GST.
2. How is GST Applied?
GST is a consumption based tax/levy. It is based on “Destinational
Principle”. GST is applied on goods and services at the place where final/actual
consumption happens.
GST is collected on value added goods and services at each stage of sale or
purchase in the supply chain. GST paid on the procurement of goods and services
can be set off against that payable on the supply of goods and services. The
manufacturer or wholesales or retailer will pay the applicable GST rate but will
claim back through tax credit mechanism. But being the last person in the supply
chain, the end consumer has to bear this tax and so, in many respects, GST is like a
last point retail tax. GST is going to be collected at point of sale.
Applicability & Mechanism of GST
The GST is an indirect tax which means that the tax is passed on till the last
stage wherein it is the customer of the goods and services who bears the tax. This is
the case even today for all indirect taxes but the difference under GST is that with
streamlining of the multiple taxes the final cost of the customer will come out to be
lower on the elimination of double charging in the system.
Let us understand the above supply chain of GST with an example. GST
supply chain example (Assuming GST rate @ 8%) :
226 Rekha Garg
Manufacturer
Manufacturer
Claims back
GST
Wholesaler
Wholesaler
Claims back
GST
Retailer
Retailer
Claims back
GST
Consumer
Consumer
Pays
GST
GST
Rate levied on

GST in India : Beneficial or not ? 227
Supply of Goods GST Flow Input CostsEx- GST
SalesPrice
GSTCollected
A weaver sells a fabric to atailor for Rs 108 per meter.
The weaver pays GSTof Rs. 8
Rs. 0 Rs. 100 Rs. 8
The tailor sells a ready-made completed shirt to a retailerfor Rs. 270.
The tailor pays GST of Rs 12 (after input taxclaim weaver claimstax credit for Rs. 8)
Rs. 100 Rs. 250 Rs. 12
The retailer sells theready-made shirt in hisshowroom for Rs 540.
The retailer pays GSTof Rs 20. (after inputtax claim tailor claimtax credit for Rs. 12)
Rs. 200 Rs. 500 Rs. 20
You purchase the shirt for Rs 540.
No Tax credit claim.You pay entire GSTRs 40@8%.
NA NA Total Rs.40
The Current tax structure does not allow a business person to take tax credits.
There are lot of chances that double taxation takes place at every at every step of
supply chain. This may set to change with the implementation of GST.
Indian Government is opting for Dual system GST. This system will have
two components which will be known as :
1. Central Goods and service Tax (CGST).
2. State Goods and service Tax (SGST).
The current taxes like excise duties, services tax, custom duty etc will be
merged under CGST. The taxes like sales tax, entertainment tax, VAT and other
state taxes will be included in SGST.
3. How is GST Levied?
GST will be levied on the place of consumption of Goods mid services. It can
be levied on :
1. Intra- state supply and consumption of goods and services.
2. Inter- state movement of Goods.
3. Import of Goods & services.
Indirect taxes Excise dutyService Tax, Customduties Central sales Tax
GSTCGST
Goods services Produced& Consumed in same rateCGST+ SGST rate levied
Goods/Services Produced & consumed in different states (Inter State)
States sales taxentertainment tax stateVAT professional Tax
SGST Integrated GST
Goods and services exported GST notapplicable
Goods & Services imported CGST rate + SGSTrate levied

4. Benefits of GST Bill Implementation
1. The tax structure will be made clean and simple.
2. The entire Indian market will be a certified market which may translate into
lower business costs. It can facilitate seamless movement of goods across
states and reduce the transaction costs of businesses.
3. It is good for export oriented business because it is not applied for goods/
services which are exported out of India.
4. In the long run the lower tax burden could translate into lower prices on
goods for consumers.
5. The suppliers, manufacturers, wholesalers and retailers are able to recover
GST incurred on input costs as tax credits. This reduce the cost of doing
business thus enabling fairer prices for consumers.
6. It can bring more transparency and better compliance.
7. Number of departments (tax departments) will reduce which inturn maylead to loss corruption. \
8. More business entities will come under the tax system, thus widening the tax
base. This may lead to better and more tax revenue collections.
9. Companies which are under unorganized sector will come under tax regime.
5. Challenges for Implementing Goods & Service Tax System
1. The bill is tabled and passed in the parliament.
2. To implement the bill there has to be a lot of changes at administration level,
information technology integration has to happen sound IT Infrastructureis needed the state governments has to be compensated for the loss of
revenue.Challenges,
3. GST being a consumption based tax, states with higher consumption of goods
and services will have better revenues. So the cooperation from state
government would be one of the key factors for the successful
implementation of GST. Since GST replaces many cascading taxes the
common man may benefit after implementing it.
4. France was the first country to introduce this system in 1954.
5. Nearly 140 countries are following this tax system.
6. GST could be the next bigger tax reform in India.
6. GST Rate Structure
The GST council has lifted the veil from GST rates across goods and services.
The GST slabs are pegged at 0%, 5%, 12%, 18% & 28%. According to the latest news
from the GST council, the tax structure for common use goods are as under :
228 Rekha Garg

GST in India : Beneficial or not ? 229
GST Rate Structure
Tax Rates Products
5% Edible oil, sugar, spices, tea, coffee (except instant) coal (instead of current11.69 %) mishti/mithai(Indian sweets ) life saving drugs
12% Computers, processed food
18% Hair oil , tooth paste and soaps (currently at 28% ) capital goods and industrialintermediaries (big boost to local industries)
28% Small cars ( + 1% or 3% cess) consumer durables such as AC and fridge luxuryand six items like BMWs, cigrettes and aerated drinks (+15% cess) High endmotor cycles (+15% cess) are not included here.
In addition to the above a few other items were mention in the council’s ratelist, these items and the applicable rates on them are as follows:-
Sugar tea, coffee and edible oil will fall under the 5% percent slab, whilecereals, milk will be part of the exempt list under GST. This is to ensure that basicgoods are available at affordable prices. However instant food has been keptoutside this bracket so no relief for maggie lovers!
The council has set the sate for capital goods and industrial inter mediateitems at 18% This will positively impact domestic manufactures as seamless inputcredit will be available for all capital goods. Indeed it is time for “Make in India” .
8 Coal to be taxed at 5 percent against current 11.69%. This prove beneficial forthe power sector and heavy industries which rely on coal supply. This willalso help curb inflation. Expect a good run for coal India tomorrow.
8 Tooth paste, hair oil, oil and soaps will all be taxed at 18 percent. Most of thecosmetics and Fast Moving Consumer Goods (FMCG) brands should get thebenefit of this tax reduction. After all fair and lovely might seem fairer in itspricing from now on.
8 The “mithai” from the neighboring sweet shop might lose some of its flavoras Indian sweets will now be taxable at 5%. If you have a sweet tooth, thiscould hurt your pocket, a wee bit in the coming days.
8 For restaurants serving alcohol the tax bracket will be 18 percent
8 Education, health are going to be exempted trom GST
8 Services on Non -AC restaurants will be 12 perent
7. Gst Exemption List-For Services
The GST council approved five broad GST rate categories for services likegoods at 0%, 5%, 12%, 18%, and 28%,
8. GST Benefits and Impacts on Indian Economy
Amidst economic crisis across the grove, India has posed a beacon of hope
with ambitious growth targets supported by a bunch of strategic undertaking such

as the Make In India and Digital India campaigns. The Goods and Services Tax
(GST) is another such undertaking that is expected to provide the much needed
simulant for economic growth in India by transforming the existing box of indirect
taxation or towards the free flow of goods and services. GST is also expected to
eliminate the cascading effect of taxes. India is projected to play an important role
in the world economy in the years to come. The expectation of GST being
introduced is high not only within the country but also with in neighboring
countries and developed economics of the world.
Benefits of GST to the India economy are as follows :
1. Removal of bundles indirect taxes such as VAT, CST, Service Tax, CAD, SAD,
and Excise
2. Less tax- compliance to a simplified tax policy compared to current tax
structure.
3. Removal of cascading effect of taxes ie removes tax on tax.
4. Reduction of manufacturing costs due to lower burden of taxes on the
manufacturing sector. Hence prices of consumer goods will be likely to come
down.
5. Lower the burden on the common man i.e public well have to shed less
money to buy the same product that were costly earlier-
6. Increased demand will lead to increase supply. Hence this well ultimately
leads to rise in the production of goods
7. Control of black money circulation as the system normally followed by
traders and shopkeepers will be put to a mandatory check.
8. Boost to India Economy in the longrun.
GST is likely to impact the Indian economy in the following way :
8 Reduces the tax burden on producers and fosters growth through more
production. The current taxation structure, pumped with myriad tax clauses,
prevents manufactures from producing to their optimum capacity and
retards growth. GST will take care of this problem by providing tax credit on
the manufactures.
8 Different tax barriers, such as check posts and toll plazas leads to wastage of
unpreserved items being transported. This penalty transforms in to major
costs due to higher needs of buffer stock and warehousing costs. A single
taxation system will eliminate this road block.
8 There will be more transparency in the system as the customers will know
exactly how much taxes they are being exactly and on what base.
8 GST will add to the government revenues by extending the tax base.
8 GST will provide credit for the taxes paid by producers in the goods or
services chain. This is expected to encourage producers to buy raw material
230 Rekha Garg

GST in India : Beneficial or not ? 231
from different registered dealers and is hoped to being in more vendors and
suppliers under the purview of taxation. GST will remove the custom duties
applicable on exports. The nations competitiveness in foreign market will
increase on account of lower costs of transaction.
9. Facts to Know about Filing Income Tare Return
There are following ten facts to know about filing income tare return thisyear :
1. Form 16 : Form 16 is required for filing income tare return (ITR).
2. A tax audit is done the due date is 30th September 2017 : Filing before the due date is important if we want to carry forward any loss incurred by us duringthe year.
3. Mandatory return filing : It is mandatory to file income tax return if yourtaxable income before any deduction exceeds Rs. 250000. The limit are 3 Lakhand 5 Lakh for senior citizen respectively. Filing of ITR has been mademandatory if one has long term capital gains from sale of shares or mutualfunds of more them Rs. 2.5 Lakh in a year.
4. Change in law w.r.t revised return : Till last year a revised return could befiled only if the original return was filed within the due date. Starting fromthis year, a return can be revised even if filed after due date i.e. even if abelated return is filed.
5. Linking of Aadhar card with PAN Card : Based on Supreme Court rulingand the rules announced during budget 2017, it is now mandatory to linkyour Aadhar card with your PAN if you own both PAN and Aadhar. Aninterim relief has been provided by the S.C only to those who may have thePAN but not Aadhar. However your Aadhar number or Aadhar enrolmentID number will now be mandatory required for filing income tax returns aswell as applications for PAN Form July 1 this year.
6. Dividend Tax : There has been a new rule regarding dividends. “Any personwho receives dividend above Rs 10 Lakh has to pay an additional income Taxof 10% (on amount in excess of Rs 10 Lakh)”. Dividend here includesdividend on equity share or mutual fund units.
7, Return filing mandatory even if TDS deducted : There is an misconceptionthat a return has to filed only when any tax is due. Return filing is nowmandatory irrespective of TDS deducted on your income if your incomeexceeds Rs 2.5Lakhs.
8. TDS and form 26 AS : Form 26 AS is a tax credit statement that containsdetails of all TDS deducted against your income. It is a good practice to checkthe TDS figure in form 26 AS before filing the income tax return.
9. Saving Bank Interest Income : Interest earned on savings bank accountbalance should be declared in the income tax return. Also a deduction of Rs.

10000 is available u/s 80 TTA for income from interest. This means thatsaving interest income up to Rs 10000 is indirectly exempt in the form of adeduction. This income can be calculated from the bank statement. Thisinterest is usually paid quarterly or half yearly.
10. Schedule AL : A statement of Assets and liabilities has to be provided by
every assesses whose income is more than Rs 50 Lakh. This statement also
includes the cost of acquisition of movable properties held such as jewellery,
vehicle or cash.
It is now possible to E- verify your income tax return instead of sending ITR-
V by post. This makes the verification process easier. This is an important step thai
is required to complete the process of online income tax return filing.
10. Conclusion
The introduction of the goods and services tax will be a very sate worthy step
in the field of indirect tax reform in India. By merging a large numbers of Central
and state taxes into a single ease GST is expected to significantly ease double
taxation and make taxation overall easy for the industries. For terms of reduction in
the overall tax burden on goods and services Introduction of GST will also make
Indian products competitive in the domestic and international markets. Last butnot the least the GST, because of its transparent character well be easier to
administer. Once Implemented the proposed taxation system holds great promise
in terms of sustaining growth for the Indian economy. GST is India’s most
ambitious tax reform since independence and subsumes over a dozen central and
state taxes that were levied on goods and service earlier. Bringing the Country
under a uniform tax regime GST is expected to add 2 percent to India GDP (Gross
Domestic Product). ê
232 Rekha Garg
Article Received on July 11, 2017; Accepted on September 07, 2017

25
The Realities of Aging in India
Renu Agarwal*
A man’s life is normally divided into five stages namely: infancy, childhood,
adolescence, adulthood and old age. In each of these stages an individual’s finds
himself in different situations and faces different problems. Old age is viewed as an
unavoidable, undesirable and problem ridden phase of life. In old age physical
strength deteriorates, mental stability diminishes; money power becomes bleak
coupled with negligence from the younger generation. The aim of the present
paper is an attempt to clarify concept of aging, problems of the aged and areas to
concern to aging population. It has been stressed that family life is very necessary
for the older persons and for parents to lead a life of security, care and dignity.
[Keywords : Aging, Problems, Security, Care and Dignity]
1. Introduction
The world’s population is ageing and virtually every country in the world is
experiencing growth in the number and proportion of older persons in their
population. Population ageing—the increasing share of older persons in the
population—is poised to become one of the most significant social transformationsof the twenty-first century. According to data from World Population Prospects:
the 2015 Revision (United Nations, 2015), the number of older persons—those aged
60 years or over—has increased substantially in recent years in most countries and
regions, and that growth is projected to accelerate in the coming decades. Between
CONTEMPORARY SOCIAL SCIENCES, Vol. 26, No. 3 (July-September), 2017
* Associate Professor and Head, Department of Sociology, D. A. V. (Post-graduate) College,Bulandshahr, Uttar Pradesh (India) E-mail: <[email protected]>

2015 and 2030, the number of people in the world aged 60 years or over is projected
to grow by 56 per cent, from 901 million to 1.4 billion, and by 2050, the global
population of older persons is projected to more than double its size in 2015,
reaching nearly 2.1 billion.
The reasons for substantial increase in the population of older persons are the
control of prenatal and infant mortality, a decline in birth rates, improvement in
nutrition, basic health care and the control of many infectious diseases in many
regions of the world in twentieth century. This combination of factors resulted in
an increasing number and proportion of persons surviving into the advanced
stages of life. Growth in the numbers and proportions of older persons can be
expected to have far reaching economic, social and political implications. In many
countries the number of older persons is growing faster than the number of people
in the traditional working ages, leading many governments to consider increasing
the statutory ages at retirement in an effort to prolong the labour force participation
of older persons and improve the financial sustainability of pension systems.
2. Conceptual Framework of Aging
Aging is a biological process and socio-cultural concept too. Hence, position
and treatment of the aged vary from culture to culture and aging has been viewed
differently by different people. Whereas to some it means power, authority,
wisdom, and respect, others consider it as a forced retirement leading to a state of
dependency, loss of charm and of physical strength. To most, aging implies
physiological and psycho-social changes that are reflected in their reduced income,
lesser activities, and consequential loss of status, both in the family and in the
society.
The scientific study of human aging is a vast and complex subject. It reaches
into the biological and medical sciences, as well as the social and behavioural
sciences. The concept of age has different meanings. Chronological age is one
measure of age. It is calendar age. Social Aging refers to the social habits and roles
of the individual, relative to his group or society. Biological age refers to the present
position of the individual, relative to his potential life span. The biological age of an
individual is closely related to chronological age, but the two are not identical since
they are derived from different sets of measurements. Biological aging may begin
long before the individual reaches the chronological age of 60 years.
Aging has three broad dimensions and each one is associated with another.
These are :
2.1 Physiological Aging
It is also called as physical aging and is defined on the basis of the anatomical
and physiological changes that take place in the life of an individual with the
passage of time. Charles Becker2 (1959) views aging “as those changes occurring in
234 Renu Agarwal

The Realities of Aging in India 235
an individual as a result of the passage of time.’’ In the early years, ‘growth’
predominates and in the later years ‘decline’ predominates.
2.2 Psychological Aging
Psychological aging is a process by which a person loses its mental ability.
Most often psychological pressure or disturbances bring young people to look
aged and it is reflected in body as an unnatural process.
2.3 Social and Cultural Aging
Social and cultural aging are inter-related concepts, but they differ from one
another on the basis of their emphasis. Social aging emphasizes the changes in
behavioural pattern and the role and status of individuals in the family. In the
Indian context for example, the marriage of the eldest son and the arrival of the
daughter-in-law in the household could bring about significant changes in the role
and status of the mothers-in-law who may start considering themselves as old. The
parameters of social aging also vary in different societies. The cultural approach,
on the other hand, gives importance to the role of an individual during his life span.
Aging is regarded as the cultural progression of an individual through different
stages of life. Social and cultural aging are the process by which a person acquires
the superior knowledge and takes up responsible roles depending upon its age
status in the society. Age related roles, privileges and expectations are defined by
the society.
3. Problems of the Aged
India is now facing a number of social problems including that of the aged in
the tradition-bound as well as in the modern societies. In both of this type of
society, their problems are increasing at an alarming rate coinciding with the pace
of population growth, and hence, struggle for existence is becoming very acute.
The traditional Indian social system has been changing very fast because of the
steadily engulfing forces of modernization, industrialization, urbanization and
other such processes.
There is a ample evidence of the high esteem in which older people are held in
developing countries. Trends towards increasing industrialization and
urbanization and the greater mobility of the labour force indicate, however, that
the traditional concept of the role of the elderly in the family is undergoing major
change. World-wide, the over-all responsibility of the family to provide the
traditional care and support needs of the aging is diminishing.
After independence, the process of modernization took its high momentum,
scope of white-collar jobs increased, mobility of people went up and women were
empowered. All these factors with other similar ones centered a drastic impact on
the aged.

The fact of consumerism and individualistic attitude of the younger
generation has necessitated them to drift away from their villages to gain more
comfort and achieving future goals in urban areas. In such a situation the poor and
helpless aged parents are left behind alone in villages, where they feel socially
helpless and economically unsecured and thereby they are compelled to lead a life
of uncertainty and tribulation. Aged people do not like to stay long or permanently
with their children because of the following reasons :
1. Their attraction towards their own villages;
2. Shortage of room/space in the residential quarters of their sons;
3. Lack of contemporary friends;
4. Lack space of spending time;
5. Ill-treatment of daughter-in-law;
6. High cost of living in cities and the aged parents do not like to be a burden on
son;
7. In many cases when the aged persons are earning and contributing their
income, they are well behaved and respected by their family members,
particularly sons and daughter-in-law. If they do not earn, daughter-in-law
becomes very harsh and in that case the status of the aged is reduced to a
subordinate stage. In some cases, they are considered as non-living objects
and hence their social existence becomes immaterial;
8. Dissimilar thinking, ideological clash and development of conflicting
situation between generations;
9. Suffering from aged-based diseases, lack of treatment and nursing facility by
the household members;
10. Those who reside with their married sons and grandchildren, most often do
not get food as per their own choice or interest even if they earn and
contribute their earning to the family. In families where grandchildren are
there, the aged are to share the available food, particularly milk with them.
Hence, in those families they remain underfed.
The aged in Indian society face various problems which are conditional to
different situations and also are age and culture-based. Rapid population growth,
lack of education and modern public health care services, denudation of life
supporting resources, urbanization and liberalization have all contributed to the
weakening of traditional corporate culture values. Thus, individualism is on rise.
As a result, in several cases, neglect and suffering of the aged is a matter of concern.
It is expressed that the civil society must develop strategies so as to ameliorate the
plight and tribulations of the aged. Many scholars have highlighed the problems of
the aged. Mention may be made os scholars like Dandekar,3 Gokhala, S. et al,4
Behura and Mohanty5 and Sharma6.
236 Renu Agarwal

The Realities of Aging in India 237
Old age is viewed as an unavoidable, undesirable and problem ridden phase
of life. Ther are many problems of the aged in Indian society. They are generally
classified into five major categories : physiological, psychological, social,
emotional and financial. As regards the physiological problems, it is worth
mentioning that old age is a period of physical decline as one does begin to slow
down physically. infectious, intoxications, gluttony, inadequate rest, emotional
stress, overwork, endocrine disorders and environmental conditions like heat and
cold are some of the common secondary causes of physical decline.
Psychological problems of the aged are well known. Mental disorders are
very much associated with old age. Older people are susceptible to psychotic
depressions. It has been observed that these two disorders account for
approximately 80% of the psychotic disorders among older people in the civilized
societies.
Social problems are related to older people suffering social losses greatly with
age. Their social life is narrowed down by loss of work associated, death of
relatives, friends and spouse and weak health which restricts their participation in
social activities. The home becomes the centre of their social life which gets
confined to the interpersonal relationship with the family members. Due to loss of
most of the social roles they once performed, they are likely to be lonely and
isolated severe chromic health problem enable them to become socially isolated
which results in loneliness and depression.
Decline in mental ability makes them dependent. They no longer have trust in
their own ability or judgements but still they want to tighten their grip over the
younger ones. They want to get involved in all family matters and business issues.
Due to generation gap, the youngsters do not pay attention to their suggestion and
advice. Instead of developing a sympathetic attitude towards the old, they start
asserting their rights and power. This may create a feeling of deprivation of their
dignity and importance leading to emotional problems and insecurity.
Financial insecurity is an important problem among the aged. Old age is a
period of physical deterioration and social alienation in some cases, loss of spouse,
friends, Job, property and physical appearance. In old age physical strength
deteriorates, mental stability diminishes, financial power becomes bleak and eye
sight suffers a setback. It is a period of disappointment, dejection, disease,
repentance and loneliness.
4. Areas to Concern to Aging Population
The aged have manifold problems both in rural and urban societies. In
several instances they are treated as unwanted persons and parasites. Society has
responsibilities towards the aged. To sensitize and aware society regarding aged
special attention should be paid to :

4.1 Health and Nutrition
Generally nutritional levels are very low and proper health and medicalfacilities are not readily available/accessible to aged. Hence they suffer from manycomplication and contagious diseases. Health and health allied services should bedeveloped to the fullest extent possible in the community. These services shouldinclude a broad range of ambulatory services such as, day-care centres, out patientclinics, day hospitals, medical and nursing care and domestic services. Emergencyservices should be always available. Institutional care should always beappropriate to the needs of the elderly. Health screening and counselling should be offered through geriatric clinics, neighbourhood health centres or community siteswhere older person congregate.
The promotion of health, the prevention of disease and the maintaining offunctional capacities among elderly should be actively pursued. Adequate,appropriate and sufficient nutrition, particularly the adequate intake of protein,minerals and vitamins is essential to the well-being of the elderly. Special supportmust be given to home care services, by providing them with sufficient medical,paramedical, nursing and technical facilities of the required standard to limit theneed for hospitalization.
4.2 Housing and Environment
Adequate living accommodation and agreeable physical surroundings arenecessary for the well-being of all people, and it is generally accepted that housinghas a great influence on the quality of life of any age group in any country. Suitablehousing is even more important to the elderly, whose abodes are the centre ofvirtually all their activities. Adaptations to the home, the provision of practicaldomestic aids to daily living and appropriately designed household equipmentcan make it easier for those elderly people whose mobility is restricted or who areotherwise disabled to continue to live in their own homes. Special attention shouldbe paid to environmental problems. In addition to the physical, it has psychological and social significance.
4.3 Family
As the family is recognized as a fundamental unit of society, efforts should be made to support, protect and strengthen it in agreement with each society’s systemof cultural values and in responding to the needs of its aging members.Government should promote social policies encouraging the maintenance offamily solidarity among generations, with all members of the family participating.The role and contribution of the non-government organizations in strengtheningthe family as a unit should also be stressed at all levels.
Government and non-governmental bodies should be encouraged toestablish social services to support the whole family when there are elderly peopleat home and to implement measures especially for low income families who wishto keep elderly people at home.
238 Renu Agarwal

The Realities of Aging in India 239
4.4 Education
The scientific and technological revolutions of the 20th century have led to aknowledge and information ‘explosion’. The continuing and expanding nature ofthese revolutions has given rise to accelerated social change. In many of the world’ssocieties, the elderly still serve as the transmitters of information, knowledge,tradition and spiritual values. This important tradition should not be lost.
Educational programme featuring the elderly as the teachers andtransmitters of knowledge, culture and spiritual values should be developed. Themass media should be used as a means of promoting the participation of the agedin social, cultural and educational activities within the community, conversely, theaged or their representatives should be involved in formulating and designingthese activities. There is also a need to educate the general public with regard to theaging process. Such education must start at an early age in order that aging shouldbe fully understood as a natural process.
4.5 Social Welfare
In traditional societies, old people have always enjoyed a privileged positionbased on respect, consideration, status and authority. But this is starting to be upset under the influence of modern trends and that privileged position is now beingquestioned. It is therefore time to policies that would avoid some problemsconcerning the elderly faced by some developed countries.
In Hindu India, there are two types of traditional system of land-transferfrom parental to filial generations. These are Dayabhag and Mithakshara.According to Dayabhag system, father is the sole authority of all the landedproperties he has with him, and in that case he enjoys the absolute right andfreedom to dispose of his land in any manner to anybody depending upon his ownchoice and interest. But Mithakshara is the system that goes almost against theethic of Dayabhag.
In societies where the Dayabhag system is prevalent the aged parents arerespected, honoured and their authority in family is highly acknowledged withdue respect. So, this traditional system seems to be an outweigh as a system ofsocial insurance for leading life smoothly during old age. As a result, this systemneeds to be legalized in places where the system of Mithakshara is prevalent. Thiswould be effectively done only by the active intervention of the governmentthrough proper modification of existing land rules of inheritance of landedproperties.
4.6 Income Security
Where there is more poverty, there is more discrimination but if, in that casethe aged are earning they enjoy a superior status than others. Government shouldtake appropriate action to ensure to all older persons an appropriate minimumincome and should develop their economies to benefit all the population.

Many developed countries have achieved universal coverage throughgeneralized social security schemes. For the developing countries, where many ifnot the majority of persons live at subsistence levels, income security is an issue ofconcern for all age groups. In several of these countries, the social securityprogrammes launched tend to offer limited coverage; in the rural areas, where inmany cases most of the population lives, there is little or no coverage. Furthermore, particular attention should be paid in social security and social programmes, to thecircumstances of the elderly women whose income is generally lower than meansand whose employment has often been broken up by maternity and familyresponsibilities. In the long term, policies should be directed towards providingsocial insurance for women in their own right.
5. Conclusion
Aging is a biological process and socio-cultural concept too. Hence, positionand treatment of the aged vary from culture to culture. With the growing numberof aged in our country in the background of fast paces of changes all around anddisintegration of joint family system, it is highly essential to plan appropriatestrategy for providing shelter and minimum facilities for the aged to lead adesirably graceful life.
The aged have manifold problems both in rural and urban societies. Inseveral instances they are treated as unwanted persons and parasites. A personafter losing her/his vim, vigour and vitality in the old-age becomes utterly helpless and is forced to depend on others. Society has responsibilities towards the agedand although they are in the decline, they constitute the senior generations in thesociety and are treated as the source of wisdom. They are out available assets.
As we all know that ‘God help those who help themselves’ that’s why agedshould keep their spirit positive, by that their physical condition well alwaysremain healthy. They should not be completely dependent on their children,because in such a fast life, though willing, they are not able to take as much care asthe aged need.
References
1. United Nations, World Population Ageing 2015, New York : UN Department of
Economic and Social Affairs, Population Division, 2015.
2. Becker, Charles S., “Physical Functioning of Older Persons”, Towards better
understanding of the Aging, New York : Council on Social Work Education, 1959.
3. Dandekar, Kumidini, The elderly in India, New Delhi : Sage publications, 1996.
4. Gokhala, S. et al, Ageing in India, New Delhi: Somaiya Publications Pvt, Ltd., 1999.
5. Behura, N. K. and R. P. Mohanty, Aged in Changing Social System : Their Problems,
New Delhi : Discovery Publishing House, 2005.
6. Sharma, K. L., Dimensions of Ageing, New Delhi : Rawat Publications, 2009. ê
240 Renu Agarwal
Article Received on June 20, 2017; Accepted on September 11, 2017

26
Who Accesses to Media in Taiwan? A
Study on Public Access Channels in
Cable Television Systems
Ping-Hung Chen* and Yu-Yi Chen**
This study1 analyzes the contents and sources of 35 public access channels belonging to 63cable television systems in Taiwan to investigate who accesses to public access channels in cabletelevision. In addition, the study explores what their opinions and suggestions about practicingrights of access to media on television. The study found that 164 groups and individuals whoaccess to public access channels in cable television systems. Among those, the number of civilassociations ranks the top, equaling to approximately one third of total amount, followed by localgovernment agencies, 24 percent, and cable television system operators, 20 percent. Notsurprisingly, individuals ranked the bottom and had the fewest amount, 5.5 percent, of accessingto public access channels.
[Keywords : Media, Public access theory, Cable television systems, Social
liberalism theory, Audience]
1. Background and Significance of the Study
The development of public access theory in the U.S. stems from the social
liberalism theory of John Stuart Mill when speaking from its philosophy root; it is
based on the freedom of expression guaranteed in the first amendment of the
constitution when speaking from its political basis. If seen from its law origin,
CONTEMPORARY SOCIAL SCIENCES, Vol. 26, No. 3 (July-September), 2017
* Professor, Graduate Institute of Mass Communication, National Taiwan Normal University,Hoping East Rd., Taipei 106, Taiwan (Taiwan) E-mail: <[email protected]>
** Associate Professor, Department of Journalism, Ming Chuan University, Deming Road, GuishanDistrict, Taoyuan City, 333 (Taiwan) E-mail: <[email protected]>

moreover, it is the requirements of the Federal Communications Commission and
the Supreme Court to guarantee the localism and viewing rights and interests of
audience (Fuller, 1994 : 4). Therefore, the Cable Communications Policy Act of 1984
requires that, as community media, cable television systems should provide public
access channels to community audience. This is regarded as one of the main
basements for local governments to ratify the application of the cable TV system
and to implement the right of access to the media.
The Legislative Yuan of Taiwan passed the Cable Television Act in 1993, and
since then, the right of access to the media is definitely settled in the law. The 23rd
article of the Act states clearly that any application for licenses of cable TV systems
must offer over one of tenth of the channels for “public interest, art and literatureand social education purposes.” The regulation fully embodies that as the local
media in the democratic society, it is important for the cable TV system to
implement the residents’ concept about media access. However, on the one hand,
the responsible institution had not enforced the operators of cable TV system to
carry out the law; on the other hand, the operators were complaining that it was not
possible to have enough content for broadcasting, even one channel was a
problem. The right of access to the media became an unenforceable law. Therefore,
the Legislative Yuan amended relative regulation of public access to the media in
the Cable TV Act to make it more practicable. According to the new 25th article, the
Franchise Review Committee of cable television systems should permit the
application if the dealer provides special channels for free for the government
agencies, schools, organizations and local people to broadcast public interest, art
and literature and social education programs. Though the number of public
channels is obviously reduced, the regulation is more practicable. More or less it
puts into practice the public access to media.
But the meaning of public access channels is still abstract and strange to
whether the audience or the cable TV operators. For example, the satisfaction
survey on the cable TV subscribers in both National Communications Commission
and local one like Taipei City Government show that only few of the subscribersknow about public access channels. Coupled with the unthoughtful and
ambiguous definition of the regulation, and lack of other relative rules to achieve a
formal operation, it is now doubtful that whether the cable TV system is willing to
plan and carry out relative regulations on public access channels. For example, the
result made by the National Communications Committee in 2010 on the
nation-wide TV audience shows that only less than two-tenths of the audience
knows about public access channels. The number of the public who know little
about or have a few experience in contacting public access channels takes up only
less than 27.5% even when take into consideration those who have no idea of the
name of the channels but actually have ever watched the Channel Three. In other
words, over seven-tenths of the public completely have no idea on the existence of
the public channels, and there is only 0.5% of the public who actually get access to
242 Ping-Hung Chen and Yu-Yi Chen

Who Accesses to Media in Taiwan? 243
or apply for the public access channels (National Communications Commission,
2010).
The public’s insufficient knowledge about the public access channels further
influences their rights to use them. This research aims at finding out who are using
public access channels of the cable TV system. Besides, the research will also try to
know about the users’ experience and suggestion on public channels access, with a
hope to draw a graph of general situation of recent media access and main users
who get the access to the public access channels.
2. Literature Review
Scholars point out that the concept of access may origin from the ideological
trend of idea free market, and it is also the basic guarantee for expression freedom
and ideographical expression freedom. American grand justice Blackstone thinks
that the modern society could not become a sufficient public forum if only depends
on speech of soap box type. This goal must be achieved through media spreading
(Botein, 1998: 416; Su, 2000 : 2-2-2).
Shi, Cheng, & Liu (1999 : 47) define the access to media as a requirement for
the communication media to provide media for specific person, to spread specific
content or provide specific person with priority to spread specific content. The
media access right that based on public access concept is put forward by American
scholar Barron in 1967. He stressed that it is an active expression freedom right that
is different from former one and it is a right authorized by the First Amendment of
American constitution. Based on the concept of opinion freedom market,
providing free access employment through media, this is the resource for the
constitution to protect the expression freedom (Su, 2000 :2-2-8). Hung (2006 : 4-8)
divides media access right into the following types according to the connotation of
the access right : ownership access, content access and popularized service. The
public access channel set by the cable TV system is channel access, and public
access channel is the object of this research.
Generally speaking, public access channel is jointly operated by local cable
TV system operators, schools of various levels in the community, non-profit
organizations or local governments. Usually the community non-profit
organizations take responsible for designing the public access; schools of all levels
prepare and make education programs that will meet the demand of the
community in education access channels; the government will do by itself or
entrust other departments to program the education access channels (Olson, 2000).
Take the United States as an example, some cable TV system of smaller scale plan
only one public channel for the community residence, while a bigger one will
program various public channels according to the need (Fuller, 1994). Though
there is express term in Taiwan to set public access channels, practice in the whole
society is limited. On the one hand, it is because the media consciousness and

attainment of the public must be rooted, on the other hand, it is because the cable
TV system operators are unwilling to expand when considering the benefits
(Tseng, 2003 :11).
In terms of comprehensive discussion, the regulations to set public access
channels system in the cable TV law is making sure the character and specialty of
cable TV as a public forum (Chung, 1993 : 420). As for the existence of public
channels in the cable TV system, scholars even regard it as one of the greatest
contribution that the cable spread technology offers to human being (Meyerson,
1981/1982 : 12). Therefore, cable TV system should set up public access channels to
practice the media access right, because in the development process of the
democratic society, opinions of all kinds should be fully expressed and discussed
through media. But for a long time, the main mass media extremely limit the
diverse presence of speech and opinion. In a democratic society, the TV should be
open to the community public by complementing the public access channel
system, and enable the public to fully express their opinions thus to establish and
popularize the public participation mechanism in a democratic society (Engleman,
1996; King & Mele, 1999; Linder, 1999).
3. Research Design and Procedures
Based on the analysis above, this research will employ the following methods
to answer the questions raised in the research, that is, who are using the public
access channels? What are their opinions?
This research knows about the experience and opinions of the people who
apply for public access channels in all cable system by mailing questionnaires to
the operators. It is common in Taiwan for public access channels to jointly operate
or edit and broadcast the programs, and sometimes the programs broadcasted in
several system programs are identical. There are 30 public access channels
operated by a single cable TV operator, and 11 jointly operated one in Taiwan,
among which 6 operators don’t have complete program list and application
material. So the research actually analyzes 35 system operators.
In addition, when reviewing the users’ material, the researcher finds that
many non-governmental organizations have cancelled registration so it is
impossible to contact them, or the applicant of the organization have left and
unable to answer the questionnaire. Some contact information is wrong. So after
taking out these samples, the matrix for the research is 164, and the total number of
recovered samples is 102, with a successful rate of 62.20%.
4. Research Findings
The research finds that in the contactable public access channel applicants,
the 56 civil associations, 34.15%, rank the first, followed by 39 local government
agencies, 23.78%, and about 33 system TV channels, 20.12%. Then are channels
244 Ping-Hung Chen and Yu-Yi Chen

Who Accesses to Media in Taiwan? 245
operator with a number of 6, 3.66%, and 4 central government agency, 2.44%.
Individuals rank the bottom with a number of 9, 5.49%. This result shows that the
source of the public access channels is mainly commanded by system operators,
government and civil associations, while individuals take up a fewer proportion,
which against the wish for the public to use the public access channels.
In the 107 respondents, 76% of them agree it to be convenient while 16% of
them have a different opinion on the convenience of the application procedure for
public access channels.
In the research, 71% of the respondents are satisfied with the broadcasting
time frame, while 12% of them are not. It should be mentioned that the diversity of
the satisfaction is caused by the different policies in accepting assigned
broadcasting time frame in different systems.
This research makes in inquiry on the respondents about overall satisfaction
with the public access channels. 81% of the respondents tends to agree it to be
satisfactory or feel better about it, and only 6.9% of them feel unsatisfactory with it.
This conclusion is worth attention.
A comprehensive result of the research shows that over 60% of the users of
the access are satisfied with the convenience of the application procedure,
broadcasting time frame, the quality of the programs and the overall performance.
Only 20% of them are satisfied with the channels. It is obvious that users commonly
have a positive view on overall service of the public access channels.
Then, this research inquiries the operators whether they have trouble in
providing videos to the public access channels. 72.7% of the respondents hasn’t
come across any troubles, while 27.3% of them have. When it comes to the detailed
troubles they have met, over 60% of them think they can not choose the
broadcasting time frame freely; the 33.3% of them are told that their video footage
is too long; 30.6% of them come across the problem that the materials used in their
videos may involve in law issues like copyright. And these three questions may be
the most common ones that the users of access come across. Besides, over 60% of
the respondents complains that they can not choose broadcasting time freely. As a
platform to get together non-profit organizations, if the public access channels fail
to enable the public to choose broadcasting time frame freely, it may cause the
non-profit organizations unable to effectively make an overall plan in advance, and
it may also influence the interaction between the users of the access and the
audience, thus lower the enthusiasm of the public to take part in the group of using
public access channels. On this occasion, the operators should pay attention to the
hope of the public.
On asking the operators about what should be enhanced of the system
operators in operating the public access channels, 54% of them think the operators
should intensify persuasion in the concept of public access channels to the public,
followed by the answer that the operators should allow the public who applies

earlier to choose the broadcasting time. And 46.0% of the respondents hopes it
would be available to apply through the internet.
Finally, the research assumes that the respondents have video available for
broadcasting, and ask them whether they are willing to apply for the public access
channels. 94.2% of them are willing and only 5.8% are not. The reasons for their
rejection to use public access channels are that they think no one knows about
public access channels and there is no need to do it (38.9%); it may violate
intellectual property rights (33.3%).
5. Concluding Remarks
This research aims at knowing about the users’ profile of public access
channel and their opinions since the public access channel is a public sphere. But
the result shows that users of cable TV public access channels in Taiwan are
extremely single and concentrated, in which system operator, government and
non-profit organization make up most of them, and individual users take up only
5.5%.
According to the investigation on the experience of the users of access, over
60% of the users speak highly of and are satisfied with the public access channels,
and the only one point they feel unsatisfied with is the impossibility in choosing
broadcasting time frame. As a platform to get together non-profit organizations, if
the public access channels fail to enable the public to choose broadcasting time
frame freely, it may cause the non-profit organizations unable to effectively make
an overall plan in advance, and it may also influence the interaction between the
users of the access and the audience, thus lower the enthusiasm of the public to take
part in the group of using public channels. The related operators and
administrators should formulate some solutions to solve the problem. As for the
public’s opinion on the policy of public access channels, it is widely believed by the
interviewees that it severely lacks publicity. As a result, the most urgent point is to
strengthen the public’s understanding of the function of public channels and
increase its exposure and popularity.
Generally speaking, there are few cases of public access channels of cable
television employed by individual in Taiwan. The current situation is not able to
manifest the spirit of stressing the employment of public access channels by
individual, and also is not conform to the wish to promote a diversified culture.
The result also tells a fact that the public in Taiwan lack consciousness in media
access, which leads to the single situation of overall access users. This research
advises that in order to solve the problem, the most urgent affair is to actively
encourage the community residence and civil association express their opinion and
influence local public affairs through public access channels so as to cultivate their
ability to take part in the media. Making the public take delight in access is the best
way to solve the dilemma of public access channels.
246 Ping-Hung Chen and Yu-Yi Chen

Who Accesses to Media in Taiwan? 247
Acknowledgement
The Ministry of Science and Technology (MOST) of Taiwan provided
funding for this research project (NSC99-2410-H-003-064-MY3).
References
1. Botein, M., Regulation of the electronic mass media : Law and policy for radio,
television, cable and the new video technologies (3rd ed.). St. Paul, MN : West Group,
1998.
2. Chung, W. W., “Cable Television”, Cheng, R. C., et al. (eds.), Deconstruction on radio
and television media: Constructing a new order of radio and television, Taipei : Cheng
Association, 2000, 411-439.
3. Engleman, R., Public radio and television in America : A political history, Thousand
Oaks, CA : SAGE Publications, 1996.
4. Fuller, L. K. (1994). Community television in the United States: A sourcebook on public,
educational, and governmental access. Westport, CN: Greenwood Press.
5. Hung C. L., From access media to access internet : Research on access rights policies in
digital era, Taipei : National Science Council, 2006.
6. King, D. L. & Mele, C., “Making public access television : Community participation,
media literary and the public sphere”, Journal of Broadcasting and Electronic Media,
43(4), 1999, 603-623.
7. Linder, L. R., Public access television : America’s electronic soapbox, Westport, CN :
Praeger Publishers, Inc., 1999.
8. Meyerson, M. J., “The First Amendment and the cable television operator : An
unprotective shield against public access requirements”, COMM/ENT : A Journal of
Communications and Entertainment Law, 4(1), 1981/1982, 1-66.
9. National Communications Commission, Survey on public access channels in cable
television systems, Taipei : National Communications Commission, 2010.
10. Olson, B., (2000). The history of public access channel. Retrieved on November 10, 2009,
from http://www.troytv.net/zhistory.html.
11. Shi, S. H, Cheng R. C., & Liu, J. Y., Research on the categorization of mass media
regulations, Taipei : National Science Council, 1999.
12. Su, H., “Citizen vs. Consumer--Universal Service and Media Access”, Series Seminar on
Communication and Law (Eight), Review and Prospect on the Communication Law in
Millennium, the Second Topic : the Trans-century Development Trend of
Communication Law in Our Country, Taipei : National Cheng-chi University, 2000,
2-2-1~2-2-42.
13. Tseng, G. F., “Communication Rights in Broadband Competition Era : on the Popularity
Service, Access Rights and Digital Gap Policies in Taiwan”, Proceedings of the First
International Academy Seminar in Digital Communication, Chiayi : Chung Cheng
University, 2003, 1-20. ê
Article Received on July 24, 2017; Accepted on September 12, 2017

Place of Publication : Delhi, India
Periodicity : Quarterly (English)
Printer’s Name : Priyanka Mahajan
Saksham Computers
Nationality : Indian
Address : D-59, Shastri Nagar
Meerut-250 004 (INDIA)
Editor’s Name : Dr. Dharam Vir
Nationality : Indian
Address : D-59, Shastri Nagar
Meerut-250 004 (INDIA)
: Dr. S. S. Shashi
B-4/245, Safdarjung Enclave
New Delhi-110 029
: Dr. Dharam Vir
D-59, Shastri Nagar
Meerut-250 004 (INDIA)
I, Dr. Dharam Vir, hereby declare that the particulars given above are true tothe best of my knowledge and belief.
Dharam Vir
Form 4 (See Rule 8)
Names and addresses of
the individuals who own
the journal and of the
partners or share-holders
holdings more than one per
cent of the total capital