Prahalad's market approach impacting brand loyalty in base of ...
Upload
khangminh22Category
view
1download
0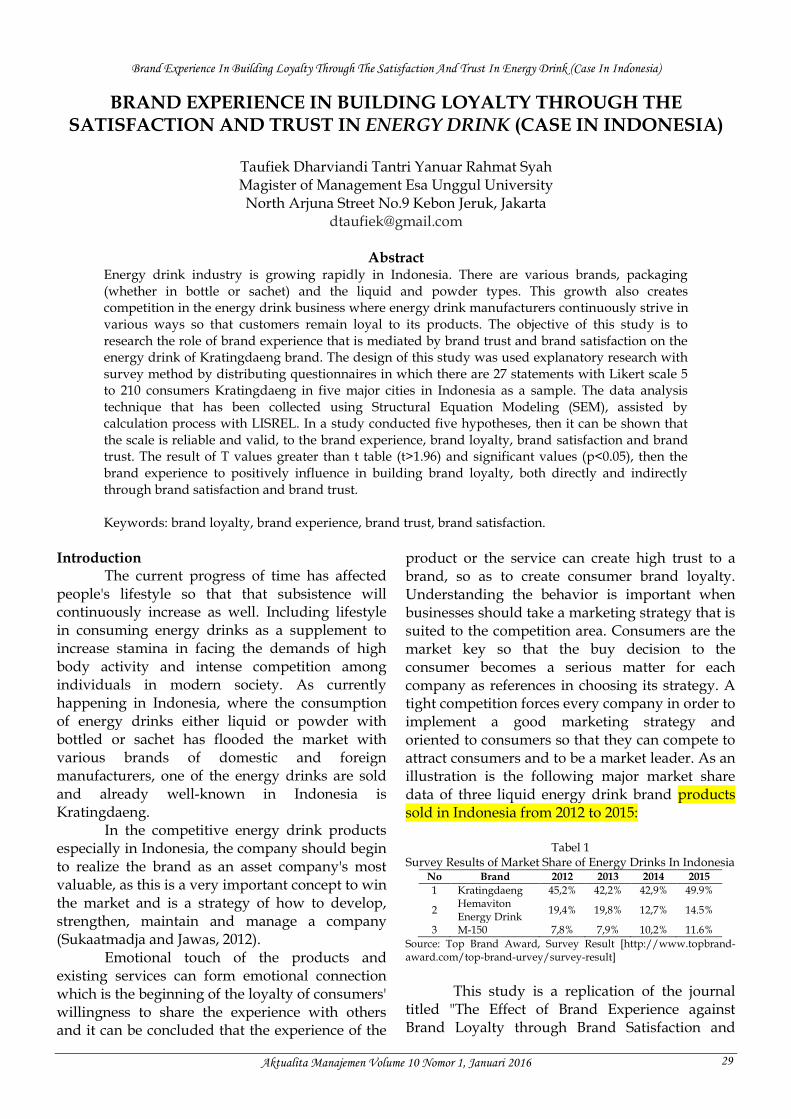
Brand Experience In Building Loyalty Through The Satisfaction And Trust In Energy Drink (Case In Indonesia)
Aktualita Manajemen Volume 10 Nomor 1, Januari 2016 29
BRAND EXPERIENCE IN BUILDING LOYALTY THROUGH THE SATISFACTION AND TRUST IN ENERGY DRINK (CASE IN INDONESIA)
Taufiek Dharviandi Tantri Yanuar Rahmat Syah Magister of Management Esa Unggul University North Arjuna Street No.9 Kebon Jeruk, Jakarta
Abstract Energy drink industry is growing rapidly in Indonesia. There are various brands, packaging (whether in bottle or sachet) and the liquid and powder types. This growth also creates competition in the energy drink business where energy drink manufacturers continuously strive in various ways so that customers remain loyal to its products. The objective of this study is to research the role of brand experience that is mediated by brand trust and brand satisfaction on the energy drink of Kratingdaeng brand. The design of this study was used explanatory research with survey method by distributing questionnaires in which there are 27 statements with Likert scale 5 to 210 consumers Kratingdaeng in five major cities in Indonesia as a sample. The data analysis technique that has been collected using Structural Equation Modeling (SEM), assisted by calculation process with LISREL. In a study conducted five hypotheses, then it can be shown that the scale is reliable and valid, to the brand experience, brand loyalty, brand satisfaction and brand trust. The result of T values greater than t table (t>1.96) and significant values (p<0.05), then the brand experience to positively influence in building brand loyalty, both directly and indirectly through brand satisfaction and brand trust. Keywords: brand loyalty, brand experience, brand trust, brand satisfaction.
Introduction
The current progress of time has affected people's lifestyle so that that subsistence will continuously increase as well. Including lifestyle in consuming energy drinks as a supplement to increase stamina in facing the demands of high body activity and intense competition among individuals in modern society. As currently happening in Indonesia, where the consumption of energy drinks either liquid or powder with bottled or sachet has flooded the market with various brands of domestic and foreign manufacturers, one of the energy drinks are sold and already well-known in Indonesia is Kratingdaeng.
In the competitive energy drink products especially in Indonesia, the company should begin to realize the brand as an asset company's most valuable, as this is a very important concept to win the market and is a strategy of how to develop, strengthen, maintain and manage a company (Sukaatmadja and Jawas, 2012).
Emotional touch of the products and existing services can form emotional connection which is the beginning of the loyalty of consumers' willingness to share the experience with others and it can be concluded that the experience of the
product or the service can create high trust to a brand, so as to create consumer brand loyalty. Understanding the behavior is important when businesses should take a marketing strategy that is suited to the competition area. Consumers are the market key so that the buy decision to the consumer becomes a serious matter for each company as references in choosing its strategy. A tight competition forces every company in order to implement a good marketing strategy and oriented to consumers so that they can compete to attract consumers and to be a market leader. As an illustration is the following major market share data of three liquid energy drink brand products sold in Indonesia from 2012 to 2015:
Tabel 1
Survey Results of Market Share of Energy Drinks In Indonesia No Brand 2012 2013 2014 2015
1 Kratingdaeng 45,2% 42,2% 42,9% 49.9%
2 Hemaviton Energy Drink
19,4% 19,8% 12,7% 14.5%
3 M-150 7,8% 7,9% 10,2% 11.6%
Source: Top Brand Award, Survey Result [http://www.topbrand-award.com/top-brand-urvey/survey-result]
This study is a replication of the journal titled "The Effect of Brand Experience against Brand Loyalty through Brand Satisfaction and

Brand Experience In Building Loyalty Through The Satisfaction And Trust In Energy Drink (Case In Indonesia)
Aktualita Manajemen Volume 10 Nomor 1, Januari 2016 30
Brand Trust Harley Davidson in Surabaya". While in this study, the author tries to explain the influence of the brand experience in building brand loyalty through brand satisfaction and brand trust of the Kratingdaeng brand in Indonesia. Objectives, Benefits and Scope of the Study
To know the influence of brand experience to brand loyalty through brand satisfaction and trust in Kratingdaeng energy drink. This will have an impact that if Kratingdaeng can increase the value of its brand experience then the satisfaction and trust in Kratingdaeng brand can be generated so that prospective customers or consumers of Kratingdaeng can be loyal to the Kratingdaeng brand. Limitations of this study is only the Kratingdaeng brand in five major cities in Indonesia, namely Jakarta, Bandung, Surabaya, Semarang and Medan. Brand
Kotler (2005), brand is a name, term, sign, symbol, design, or a combination of these things, which are intended to identify the goods or services of a person or group of sellers and to differentiate it from competitors' products. Brand is actually a seller's promise to consistently deliver features, benefits and certain services to provide quality assurance. However, the brand is more than just a symbol. The use of consistent brand, a symbol, or logo makes the brand instantly recognizable by consumers so that everything related to it can be kept in mind. Riana (2008) of a brand can contain three things, (1). Explaining what the company sells. (2). Explaining what is run by the company. (3). Explaining the profile of the company itself.
Brand Experience
Brand experience is defined as sensations, feelings, awareness and consumer responses generated by the brand, associated to the stimuli generated by the brand design, brand identity, marketing communications, people and the environment marketed brands (Brakus, Schmitt and Zarantonello, 2009). Brakus (2009), there are four dimensions of brand experience: (1). Sensory, creating an experience through sight, sound, touch, smell and taste. (2). Affection, feeling approach by affecting moods, feelings and emotions. (3). Behavior, creating a physical experience, behavior, lifestyle. (4). Intellectual,
creating an experience that encourages consumers involved in thinking carefully about the existence of a brand.
Brand Satisfaction
Brand satisfaction means customer satisfaction in a brand they use. The increasing of customer satisfaction is needed in the highly increased market competition. Kotler and Keller (2008) define satisfaction as someone’s happy or upset feeling that is a result of comparing the performance (outcome) of a product that is perceived to one’s expectations. The level of customer satisfaction depends on the performance that made/received from products or services as well as customer standards used (Assauri, 2012). Customers’ satisfaction to the brand is a customer’s response on the quality of the actual product and the desired expectation of previous customers after the customers consume (Caruana, 2002). Brand satisfaction is measured using five indicators (Hess, 1995): (1). I am satisfied with the brand and its performance. (2). If I could do it again, I would buy a brand different from that brand. (3). My choice to get this brand has been a wise one. (4). I feel bad about my decision to get this brand. (5). I am not happy with what I did with this brand.
Brand Trust
Lau and Lee (1999), there are three factors that affect trust in the brand, namely (1) the brand itself, (2) .The manufacturer's brand and (3) consumers. Brand trust represents recognition that the brand value can be created and developed by regulating some aspects that exceed customer satisfaction with the functional performance and product-attributes (Aaker, 1996). According to Delgado et. al. (2003) and Hess (1995) that there are five indicators in brand trust: (1). [brand] brand name would make any effort to satisfy me. (2). [brand] brand name guarantees satisfaction. (3). [brand] is a brand name that never disappoints me. (4). [brand] will do whatever it takes to make me happy. (5). [brand] is genuinely committed to my satisfaction.
Brand Loyalty
Brand loyalty is the consistently consumer preferences to make a purchase on the same brand in a specific product or a specific service categories. Brand loyalty is a strong commitment to subscribe or purchase the brand consistently in

Brand Experience In Building Loyalty Through The Satisfaction And Trust In Energy Drink (Case In Indonesia)
Aktualita Manajemen Volume 10 Nomor 1, Januari 2016 31
the future (Schiffman and Kanuk, 2008). According to Aaker (1991) brand loyalty is defined as a measure of the customer relationship to a brand. This measure is able to give an idea of the possibilities for a customer to switch to another product especially in a brand that he found a change, either in relation to the price or other attributes. Five indicators of brand loyalty (You and Donthu, 2001) are: (1). In the future, I will be loyal to this brand. (2). I will buy this brand again. (3). This brand will be my first choice in the future. (4). I will not buy other brands if this brand is available at the store. (5). I will recommend this brand to others. Research method Research Framework.
This research is a conceptual model to explain the relationship of the variables in the study. The model used in this study is a model of causality or relationships influence. To test the hypothesis proposed in this study, the analysis technique used is SEM (Structural Equation Model). This research was conducted to determine how brand experience influence directly to Kratingdaeng’s customer loyalty. How brand experience that mediated satisfaction on consumer brand loyalty of Kratingdaeng’s product. Then, how much brand experience that mediated brand trust influence Kratingdaeng brand loyalty. Based on the above description, it is obtained the following framework:
Figure 1. Research Framework
Hypothesis: Relationship between Brand Experience, Brand Satisfaction and Brand Trust.
Brand experience is a strong predictor of actual purchasing behavior, which in turn is a better predictor for satisfaction. Brand experience has behavioral effects that affect customers’ satisfaction and loyalty directly and indirectly through the brand personality (Brakus, 2009).
Positive brand experience will produce cognitive and emotional state which is also leading to a positive psychological satisfaction to the brand (Kim, 2005).
The relationship between brand experience and the brand trust, Hong (2004) explained if consumers are to have a bad experience with a brand, consumers are reluctant to buy and believe in the brand and vice versa. Consequently, the following hypothesis is proposed: H1: Brand Experience effects positively on consumers’ brand satisfaction in Kratingdaeng energy drink brand. H2: Brand Experience effects positively on consumers’ brand trust on Kratingdaeng energy drink brand. The relationship between Brand Satisfaction with Brand Trust and Brand Loyalty.
Chinomona, Mahlangu and Pooe (2013) suggested that brand satisfaction has strong influence on brand trust. Ismail, Boye and Muth (2012) proved that brand satisfaction has high correlation in forming strong relationships between consumers and brands, which affect the consumers’ loyalty behavior to the brand. With the recognition of the previous discussion, the following hypotheses are proposed: H3: brand Satisfaction affects positively to brand Loyalty on Kratingdaeng energy drink brand. H4: brand trust affects positively to consumers Brand Loyalty on Kratingdaeng energy drink brand. Relationships Between Brand Experience and Brand Loyalty.
Brakus (2009), the brand experience is defined as sensations, feelings, cognition and consumer responses generated by the brand, associated stimuli generated by the brand design, brand identity, marketing communications, people and environment of the brand marketed. Aaker (2009), brand loyalty is defines as a measure of the customer relationship to a brand. This measure is able to give an idea of the possibilities for a customer to switch to another product especially in a brand that he found a change, either in relation to the price or other attributes. Along with these findings, this study tested the following hypotheses: H5: Brand Experience affects positively to consumers’ Brand Loyalty on Kratingdaeng energy drink brand.
H1
H3
H4
H5
H2
Brand
Satisfaction H1
Brand
Experience
Brand Trust
Brand
Loyalty

Brand Experience In Building Loyalty Through The Satisfaction And Trust In Energy Drink (Case In Indonesia)
Aktualita Manajemen Volume 10 Nomor 1, Januari 2016 32
Research Design
Sugiyono (2010) states that explanatory research is research that is intended to explain the position of the variables studied and the relationship between one variable with another. While the characteristics in this study are replication which are modified, so that the results of hypothesis testing should be supported by previous studies, which are repeated with other conditions or less the same (Sugiyono , 2010).
The variables in this study are: (a). Independent variables are the Brand Experience (X), (b). Intervening variables consist of Satisfaction Brand (M1) and Brand Trust (M2) and (c). Dependent Variable (Y) is the Brand Loyalty. To analyze and determine significant levels and the relationship between variables used analysis method of Structural Equation Model (SEM) which assisted the calculation process with LISREL. Operational Definition.
The operational definition of each variable has been modified by the authors to facilitate the respondents in understanding the statements and decide the answer or choice. Operationalization of Brand Experience. Indicators of brand experience (Brakus, 2009): Sensory: 1. Brand of Kratingdaeng gives a strong
impression in my eyes. 2. Brand of Kratingdaeng interesting when seen. 3. Brand of Kratingdaeng has no appeal for me. Affective: 1. Brand of Kratingdaeng raises deep feelings for
me. 2. I do not have a bond strong feelings against
Kratingdaeng. 3. I do not have a bond strong feelings against
Kratingdaeng. Behavioral: 1. When using Kratingdaeng I feel have the
energy to do the activity / activities. 2. Kratingdaeng makes me feel fitter. 3. Kratingdaeng does not aim to increase my
stamina. Intellectual:
1. I consider many things when it will consume Kratingdaeng.
2. I did not think twice when it will consume Kratingdaeng.
3. Kratingdaeng makes me smarter. Operationalization of Brand Satisfaction
Brand satisfaction is measured using five indicators (Hess, 1995): 1. I am satisfied with the performance of
Kratingdaeng. 2. If I will consume energy drinks again, I would
buy another brand apart from Kratingdaeng. 3. Drink Kratingdaeng is a wise choice. 4. At the time of recovery requires stamina, drink
Kratingdaeng is not the right decision. 5. I was not happy after drinking Kratingdaeng. Operationalization of Brand Trust
Delgado et. al. (2003) and Hess (1995) that there are five indicators in brand trust: 1. Kratingdaeng always be able to meet the needs
of my stamina. 2. After drinking Kratingdaeng certainly stamina
will increase. 3. Kratingdaeng has never let me down. 4. Ingredient of Kratingdaeng made me love the
products. 5. Ingredient of Kratingdaeng can meet the needs
of my stamina. Operationalization of Brand Loyalty
Five indicators of brand loyalty (You and Donthu, 2001) are: 1. At the next opportunity, I will continue to use
Kratingdaeng. 2. I will buy Kratingdaeng again. 3. Kratingdaeng will always be my first choice. 4. I will not buy another brand if Kratingdaeng is
available in stores. 5. I would recommend Kratingdaeng to others. Data Collection Techniques and Sampling
In this study, the writer use two research techniques, namely: literature study and questionnaire. The questionnaire in this study was designed by using a Likert scale, with five alternative answers where this scale ask respondents to indicate the level of agreement or disagreement with each statement relating to a objects. The total of all indicators as many as 27 indicators used as statements in the questionnaire submitted to 210 the consumer brand of energy
Brand Experience In Building Loyalty Through The Satisfaction And Trust In Energy Drink (Case In Indonesia)
Aktualita Manajemen Volume 10 Nomor 1, Januari 2016 33
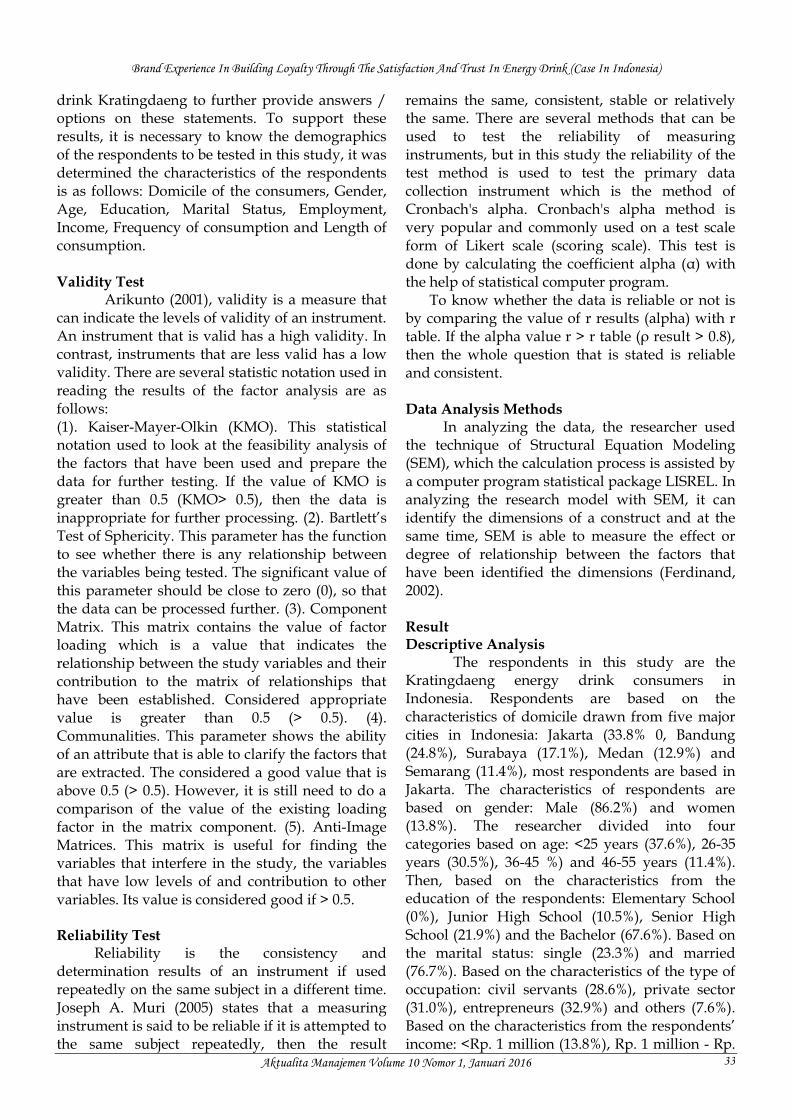
drink Kratingdaeng to further provide answers / options on these statements. To support these results, it is necessary to know the demographics of the respondents to be tested in this study, it was determined the characteristics of the respondents is as follows: Domicile of the consumers, Gender, Age, Education, Marital Status, Employment, Income, Frequency of consumption and Length of consumption. Validity Test
Arikunto (2001), validity is a measure that can indicate the levels of validity of an instrument. An instrument that is valid has a high validity. In contrast, instruments that are less valid has a low validity. There are several statistic notation used in reading the results of the factor analysis are as follows: (1). Kaiser-Mayer-Olkin (KMO). This statistical notation used to look at the feasibility analysis of the factors that have been used and prepare the data for further testing. If the value of KMO is greater than 0.5 (KMO> 0.5), then the data is inappropriate for further processing. (2). Bartlett’s Test of Sphericity. This parameter has the function to see whether there is any relationship between the variables being tested. The significant value of this parameter should be close to zero (0), so that the data can be processed further. (3). Component Matrix. This matrix contains the value of factor loading which is a value that indicates the relationship between the study variables and their contribution to the matrix of relationships that have been established. Considered appropriate value is greater than 0.5 (> 0.5). (4). Communalities. This parameter shows the ability of an attribute that is able to clarify the factors that are extracted. The considered a good value that is above 0.5 (> 0.5). However, it is still need to do a comparison of the value of the existing loading factor in the matrix component. (5). Anti-Image Matrices. This matrix is useful for finding the variables that interfere in the study, the variables that have low levels of and contribution to other variables. Its value is considered good if > 0.5. Reliability Test
Reliability is the consistency and determination results of an instrument if used repeatedly on the same subject in a different time. Joseph A. Muri (2005) states that a measuring instrument is said to be reliable if it is attempted to the same subject repeatedly, then the result
remains the same, consistent, stable or relatively the same. There are several methods that can be used to test the reliability of measuring instruments, but in this study the reliability of the test method is used to test the primary data collection instrument which is the method of Cronbach's alpha. Cronbach's alpha method is very popular and commonly used on a test scale form of Likert scale (scoring scale). This test is done by calculating the coefficient alpha (α) with the help of statistical computer program.
To know whether the data is reliable or not is by comparing the value of r results (alpha) with r table. If the alpha value r > r table (ρ result > 0.8), then the whole question that is stated is reliable and consistent. Data Analysis Methods
In analyzing the data, the researcher used the technique of Structural Equation Modeling (SEM), which the calculation process is assisted by a computer program statistical package LISREL. In analyzing the research model with SEM, it can identify the dimensions of a construct and at the same time, SEM is able to measure the effect or degree of relationship between the factors that have been identified the dimensions (Ferdinand, 2002). Result Descriptive Analysis
The respondents in this study are the Kratingdaeng energy drink consumers in Indonesia. Respondents are based on the characteristics of domicile drawn from five major cities in Indonesia: Jakarta (33.8% 0, Bandung (24.8%), Surabaya (17.1%), Medan (12.9%) and Semarang (11.4%), most respondents are based in Jakarta. The characteristics of respondents are based on gender: Male (86.2%) and women (13.8%). The researcher divided into four categories based on age: <25 years (37.6%), 26-35 years (30.5%), 36-45 %) and 46-55 years (11.4%). Then, based on the characteristics from the education of the respondents: Elementary School (0%), Junior High School (10.5%), Senior High School (21.9%) and the Bachelor (67.6%). Based on the marital status: single (23.3%) and married (76.7%). Based on the characteristics of the type of occupation: civil servants (28.6%), private sector (31.0%), entrepreneurs (32.9%) and others (7.6%). Based on the characteristics from the respondents’ income: <Rp. 1 million (13.8%), Rp. 1 million - Rp.

Brand Experience In Building Loyalty Through The Satisfaction And Trust In Energy Drink (Case In Indonesia)
Aktualita Manajemen Volume 10 Nomor 1, Januari 2016 34
3 million (26.2%), Rp. 3 million - Rp. 5 million (29.0%) and >Rp. 5 Million (31.0%). Based on the characteristics of frequency of consumption: 1 bottle a week (12.9%), 2 bottles a week (19.0%), 3 bottles a week (28.6%) and more than 3 bottles a week (39.5%). Based on the characteristics of the length of consuming: less than a year (25.7%), 1 year - 3 years (32.9%) and more than 3 years (41.4%). Respondent’s Response
To examine the difference in the response of respondents in each of the characteristics of the respondents in this study used Variant analysis (analysis of variance, ANOVA) intended to determine whether there are differences in the average based on a certain criteria. The goal of Anova is to compare more than two averages.
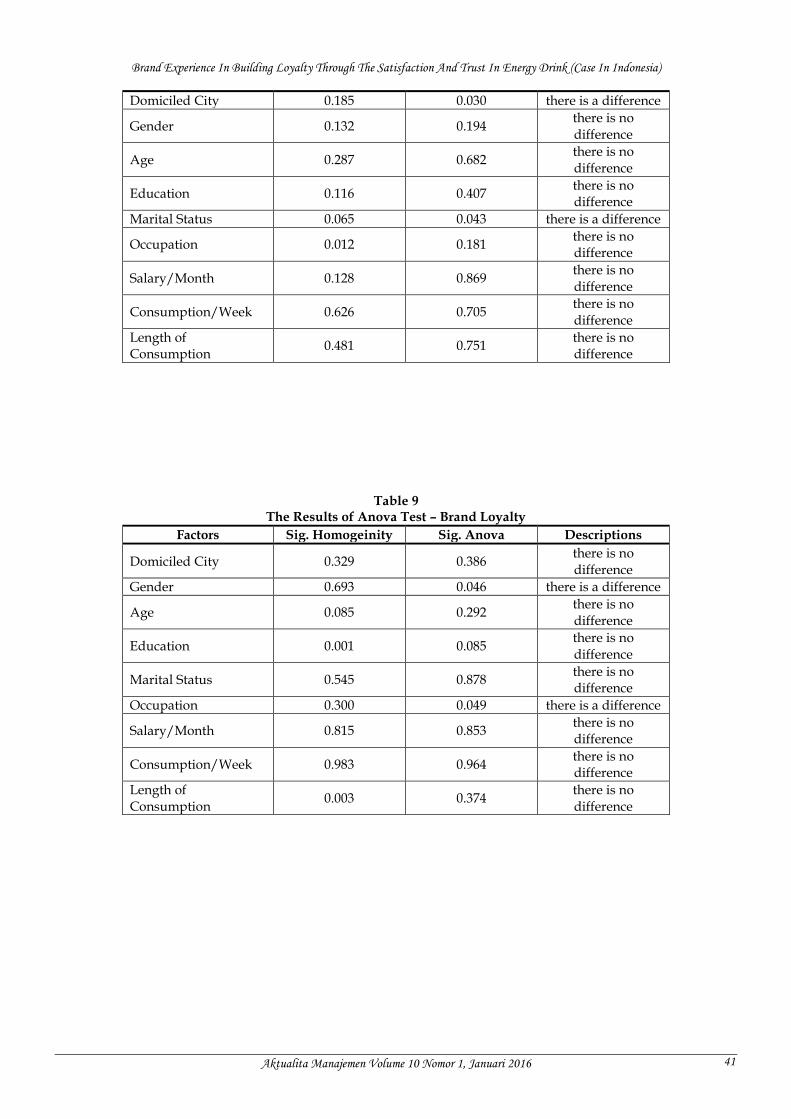
Based on the results of ANOVA test on Brand Trust variables (appendix: Table 8), the result is that the value Sig. Homogeinity with standard values Sig. Anova, there is a difference in the "Domiciled City" and "Marital Status", thus, it can be analyzed further: (a). Domiciled City. To see if there is a difference of five groups Brand Trust in the domiciled town, from the table obtained Sig. ANOVA / P value (P - value) = 0,030. With significance level α = 0.05, then Ho is rejected, thus, the conclusion is at least there are two different groups of domiciled city based on the average of Brand Trust and most likely between Semarang and Medan there are differences in the average brand trust which is significant. (b). Marital status. To see if there is any difference in brand trust of both the marital status
groups from the table obtained Sig. ANOVA / P value (P - value) = 0.043. With significance level α = 0.05, then Ho is rejected, thus, the conclusion is that at least there are two groups of marital status are significantly different based on the average the brand trust and the status of married to single, there are differences in the average brand trust which is significant.
Based on the results of ANOVA test on the variables (appendix: Table 9), the result showed that the value of Sig. Homogeinity with standard
values Sig. Anova, there are differences in the "Gender" and "Occupation" only, which can be analyzed further: (a). Gender. To see whether there is any difference in brand loyalty of both groups of gender and from the table obtained Sig. ANOVA / P value (P-value) = 0.046. With significance level α = 0.05, then Ho is rejected, it can conclude that at least there are two groups are significantly different based on the average of brand loyalty. In addition, there is a significant difference on average brand loyalty among men and women. (b). Occupation. To see if there is any difference in brand loyalty of the four groups of the occupation and from the table obtained Sig. ANOVA / P value (P-value) = 0.049. With significance level α = 0.05, then Ho is rejected, thus, the conclusion is that at least there are two groups of occupation which are significantly different based on the average of brand loyalty and most likely, there are significantly differences in the average of brand loyalty between private and other occupation.
Validity Test and Reliability Data Table 2
The Results of the Measurement of Validity and Reliability SEM Model
Latent Variables
Indicators Standardized Loading
Factor Error
T Values
Construct Reliabilit
y (CR)
Variance Extract
(VE)
Brand Experience (Sensory)
BE01 0.75 0.44 30.76
0.924 0.505
BE02 0.68 0.54 27.92 BE03 0.76 0.42 30.41
Brand Experience (Affection)
BE04 0.75 0.43 30.75 BE05 0.78 0.39 30.89 BE06 0.66 0.56 27.00
Brand Experience (Manner)
BE07 0.64 0.59 25.98 BE08 0.67 0.55 27.61 BE09 0.68 0.54 28.06
Brand Experience (Intellectual)
BE10 0.67 0.55 27.26 BE11 0.82 0.33 33.13 BE12 0.63 0.60 25.57
Brand Satisfaction BS01 0.70 0.51 0.00
0.844 0.520 BS02 0.82 0.32 15.96 BS03 0.71 0.49 14.96

Brand Experience In Building Loyalty Through The Satisfaction And Trust In Energy Drink (Case In Indonesia)
Aktualita Manajemen Volume 10 Nomor 1, Januari 2016 35
Latent Variables
Indicators Standardized Loading
Factor Error
T Values
Construct Reliabilit
y (CR)
Variance Extract
(VE)
BS04 0.67 0.55 13.80 BS05 0.69 0.52 13.98
Brand Trust
BS01 0.85 0.00 0.00
0.839 0.518 BS02 0.55 0.70 8.47 BS03 0.73 0.47 7.78 BS04 0.73 0.40 7.62 BS05 0.57 0.68 5.92
Brand Loyalty
BS01 0.77 0.40 0.00
0.844 0.522 BS02 0.73 0.47 16.86 BS03 0.80 0.36 17.25 BS04 0.63 0.60 15.63 BS05 0.67 0.56 15.90
Based on the table above, it can be concluded that all indicators have a loading value that is greater than 0.5 and t is greater than t table (1.96).
That is no single indicator that is dropped and all indicators are valid to measure latent variables.
The Results of Structural Model Evaluation Table 3
The Results of Structural Model Evaluation
Hypothesis Path
Coefficient T Value Descriptions
H1 Brand experience has an influence on Brand Satisfaction
0.87 37.27 Accepted
H2 Brand experience has an influence on Brand Trust
0.21 10.49 Accepted
H3 Brand satisfaction has an influence on Brand Loyalty
0.46 2.59 Accepted
H4 Brand trust has an influence on Brand Loyalty
0.06 2.07 Accepted
H5 Brand experience has an influence on Brand Loyalty
0.49 4.29 Accepted
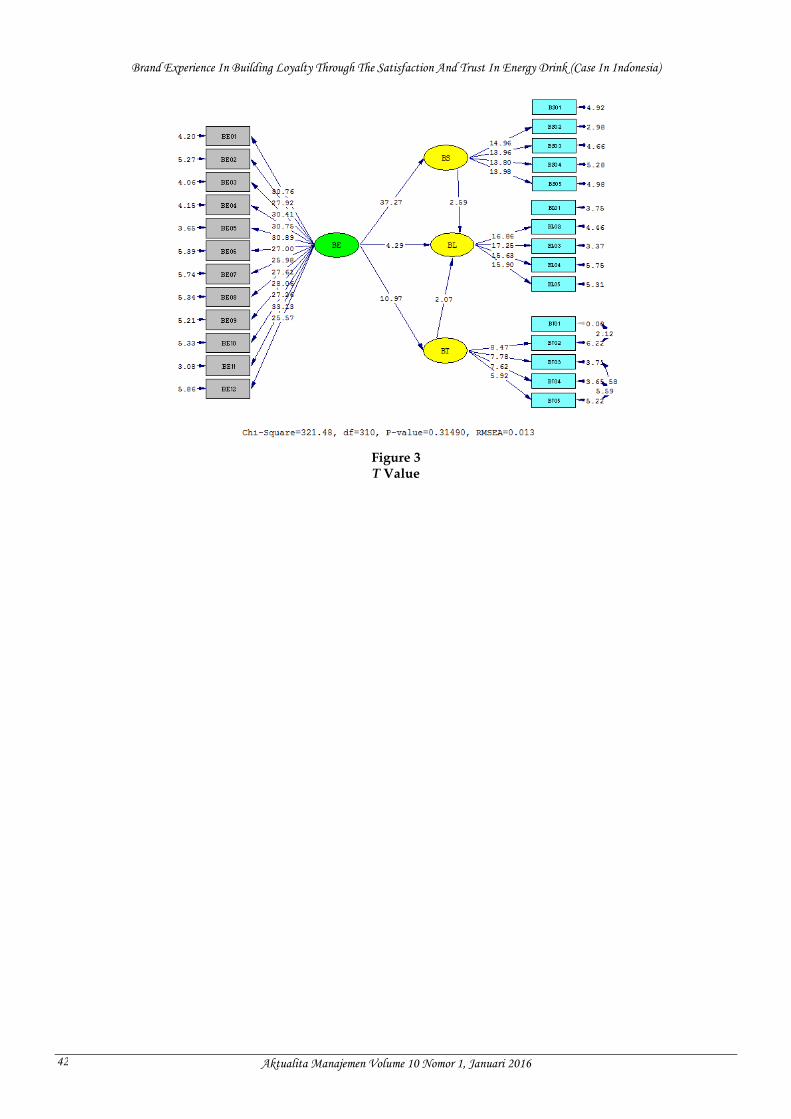
Figure 2 Test Results T Value between Variables
Hypothesis 1. Path coefficient is 0.87 and t value is 37.27, the value is greater than of path coefficient (0.05) and t table (1.96). The conclusion that can be drawn from the first hypothesis is statistically
proven that the brand experience has a positive influence on brand satisfaction (Accepted).
Hypothesis 2. Path coefficient and t value is 0.21 and 10.49, the value is greater than of path coefficient (0.05) and t table (1.96). The conclusion that can be drawn from the second hypothesis is statistically proven that the brand experience has a positive influence on brand trust (Accepted).
Hypothesis 3. Path coefficient and t value is 0.46 and t value 2.59, the value is greater than of path coefficient (0.05) and t table (1.96). The conclusion that can be drawn from the third hypothesis is proven statistically that brand satisfaction has a positive influence on brand loyalty (Accepted).
Hypothesis 4. Path coefficient and t value is 0.06 and 2.07, the value is greater than of path coefficient (0.05) and t table (1.96). The conclusion that can be drawn from the fourth hypothesis is
H1
2.59
2.07
4.29
10.49
Brand
Satisfaction 37.27
Brand
Experience
Brand
Loyalty
Brand Trust

Brand Experience In Building Loyalty Through The Satisfaction And Trust In Energy Drink (Case In Indonesia)
Aktualita Manajemen Volume 10 Nomor 1, Januari 2016 36
statistically proven that brand trust has a positive influence on brand loyalty (Accepted).
Hypothesis 5. Path coefficient and t value is 0.49 and 4.29, the value is greater than of path coefficient (0.05) and t table (1.96). The conclusion that can be drawn from the fifth hypothesis is statistically proven that the brand experience has a positive influence on brand loyalty (Accepted). Structural Equation Model (SEM) Influence of Brand Experience against Brand Loyalty through Brand Satisfaction.
Based on Figure 2, the results of the t test between brand experience against brand satisfaction of 37.27 and brand satisfaction to brand loyalty at 2.59. This proves that the variable brand experience against brand loyalty through brand satisfaction is positive effect. This means that the better the brand experience created by Kratingdaeng through the brand satisfaction such as experience the satisfaction of quality products that provide properties that exceed consumer expectations, the better the level of brand loyalty for consumers Kratingdaeng. The study of the effect of the relationship between variables is consistent with that put forward Ismail, Boye and Muth (2012) that the satisfaction of the brand has a high correlation in forming strong relationships between consumers and brands, which affect the behavior of consumer loyalty to the brand. Positive brand experience will produce cognitive and emotional state is also leading to a positive psychological satisfaction to the brand (Kim, 2005). Brand experience has behavioral effects, that affect customer satisfaction and loyalty directly and indirectly through the brand personality (Brakus, 2009).
The results are consistent with research conducted by Kusuma (2014) which states that the experience the brand has a significant influence on brand satisfaction and brand satisfaction has a significant impact on brand loyalty. These results are also consistent with studies conducted by Marist, Yuliati and Najib (2014). Influence of Brand Experience against Brand Loyalty through Brand Trust.
Based on Figure 2, the results of the t test between brand experience against brand trust by 10.49 and brand trust on the brand loyalty at 2.07. This proves that the variable brand experience against brand loyalty through brand trust is positive effect. This means that the better the
brand experience created by Kratingdaeng through brand trust because abortion is safe for the body and processing of products that are in accordance to international standards, the more increase brand loyalty for consumers Kratingdaeng. The study of the effect of the relationship between these variables according to the proposed Ha (2004) that the relationships formed between the consumer and the brand depends on the perception of consumers trust the brand after the experience with the brand. Consumers who enjoy the affective experience of the brand will feel that the brands can trust. Lee and Kang (20120 argued also that when the perceived feeling of affective by the consumer to the brand increases, it makes connections between consumers and brands become stronger so that they will become more and more trust in the brand. Satisfaction brands have a strong influence on brand trust. The high degree of brand satisfaction associated with high levels of brand trust. Brand satisfaction has a positive relationship with brand loyalty. Customers are more satisfied then it will obviously have a high loyalty to the brand (Chinomona, Mahlangu and Pooe, 2013).
The results are consistent with research conducted by Kusuma (2014) stating brand experience has a significant impact on brand trust and brand trust has a significant impact on brand loyalty. These results are also consistent with studies conducted by Marist, Yuliati and Najib (2014). Influence of Brand Experience against Brand Loyalty.
Based on Figure 2, the results of the t test between brand experience against brand loyalty at 4.29. This proves that the variable brand experience against brand loyalty is positive effect. This means that the better the brand experience created by Kratingdaeng through a variety of marketing communications and the sensations of the efficacy of the product, the better the Kratingdaeng brand loyalty for consumers. The study of the effect of the relationship between these variables according to the proposed Brakus (2009) that the brand experience is defined as sensations, feelings, cognition and consumer responses generated by the brand, associated stimuli generated by the brand design, brand identity, marketing communications, people and brand environment is marketed. Brand loyalty is the consumer preferences consistently to make a

Brand Experience In Building Loyalty Through The Satisfaction And Trust In Energy Drink (Case In Indonesia)
Aktualita Manajemen Volume 10 Nomor 1, Januari 2016 37
purchase on the same brand in a specific product or a specific service categories. Brand loyalty is a strong commitment to subscribe or purchase a brand consistently in the future (Schiffman and Kanuk, 2008).
The results are consistent with research conducted by Kusuma (2014) stating brand experience has a significant impact on brand loyalty. These results are also consistent with studies conducted by Marist, Yuliati and Najib (2014).
Goodness of Fit Model Criteria
Tabel 8. The Results of Exogenous Construct Confirmatory Factor Model Test
Goodness-of-Fit Cutt-off-
Value Hasil Keterangan
Chi-square / df 1.037 ≤ 3 Good Fit
RMR (Root Mean Square Residual) 0.065 ≤ 0.1 Good Fit
RMSEA (Root Mean Square Error of Approximation)
0.013 ≤ 0.08 Good Fit
GFI (Goodness of Fit) 0.980 ≥ 0.9 Good Fit
AGFI (Adjusted Goodness of Fit Index) 0.980 ≥ 0.9 Good Fit
CFI (Comparative Fit Index) 1.000 ≥ 0.9 Good Fit
NFI (Normed Fit Index) 1.000 ≥ 0.9 Good Fit
NNFI (Non-Normed Fit Index) 1.030 ≥ 0.9 Good Fit
IFI (Incremental Fit Index) 1.020 ≥ 0.9 Good Fit
RFI (Relative Fit Index) 1.000 ≥ 0.9 Good Fit
Based on the results obtained in the confirmatory factor analysis on exogenous construct may indicate that the model is feasible tested at the stage of full model, it is characterized by the value of the calculation results meet the criteria of decent models. Managerial Implications
Related to the results of hypothesis testing there are some managerial implications that can be done by Kratingdaeng to maintain and enhance the brand experience, brand trust and brand satisfaction for the creation of brand loyalty repurchase. First, based on the results of the first hypothesis can be seen that Kratingdaeng gives experience to consumers to ensure their trust. So that consumers can have a good taste experience, Kratingdaeng should be able to ensure the quality of products to be purchased by consumers. Furthermore, Kratingdaeng should be sure to maintain the good name of the brand. By having brands that have a good name or reputation, it will be able to gain the trust of consumers on Kratingdaeng. To maintain the good name and reputation, Kratingdaeng should be able to maintain and ensure that the quality of a given product is the best. Kratingdaeng can do the quality control consistently and regularly. Second, in addition to maintaining the quality of the product, Kratingdaeng can provide new
innovation or value. Kratingdaeng can use materials that are safer for the body and environment-friendly. By using safe materials for the body and environment-friendly can give a sense of trust that the products offered by Kratingdaeng is safe to drink and good for the environment. Third, customer satisfaction with Kratingdaeng needs to be considered and maintained. From the results of hypothesis testing also stated that satisfaction can lead to sustained commitment and affective commitment. Therefore, it is important for the company to maintain the satisfaction of the customer. Consumer satisfaction occurs when Kratingdaeng can meet the expectations of consumers. To meet these expectations, Kratingdaeng must be able to know the expectations of consumers to Kratingdaeng. Furthermore, Kratingdaeng should prepare a training for employees. This can be useful so that employees can provide assistance and good service to consumers. Employees who have received training will be more competent in dealing with consumers. In addition, training can also add knowledge about the products offered and taught how to deal with a good consumer. Thus, if any complaints, criticisms, or suggestions, employees can handle it. Consumers will be satisfied if the employee can provide good service. Conclusions
Brand Experience In Building Loyalty Through The Satisfaction And Trust In Energy Drink (Case In Indonesia)
Aktualita Manajemen Volume 10 Nomor 1, Januari 2016 38
This study is aimed to determine and obtain the data empirically about the effect of brand experience in building Brand Loyalty through Brand Satisfaction and Brand Trust of Kratingdaeng energy drink in 5 major cities in Indonesia. Based on data obtained and the analysis that has been done, it can be concluded as follows: (1). Conclusion on the first hypothesis is statistically proven that the experience of the brand has a positive impact on consumer satisfaction on Kratingdaeng energy drink. Therefore, to improve customer satisfaction, Kratingdaeng is expected continuously to provide a good experience for consumers. (2). Conclusion on the second hypothesis is proven statistically that brand satisfaction has a positive influence on brand trust. This shows that the satisfaction of a good brand can enhance consumer trust in the Kratingdaeng, energy drink. (3). Conclusion on the third hypothesis is that statistically proven the satisfaction of the brand has a positive effect on brand loyalty, it demonstrates the importance of the role of brand satisfaction to increase brand loyalty, thereby increasing the profitability of the energy drink Kratingdaeng. (4). Conclusion on the fourth hypothesis is proven statistically that brand trust has a positive effect on brand loyalty. The belief that a good brand will have an impact on brand loyalty and will contribute to the profitability of the energy drink Kratingdaeng will increase customer loyalty. (5). Conclusion on the fifth hypothesis that can be taken from the fifth hypothesis is statistically proven that the experience the brand has a positive effect on brand loyalty. Consumers who have good experience will remain loyal to consume the energy drink Kratingdaeng in the future. Limitations
This study has been conducted and implemented in accordance with scientific procedures, however, it still has its limitations: collecting data using questionnaires in which the answers given by the respondents that perhaps not showing the real situation. Moreover, the study was conducted in a relatively short time, thus, it cannot represent all the consumers who consume energy drinks, Kratingdaeng, where this study only took the respondents from five major cities in Indonesia, while there are dozens of cities in Indonesia can be taken as respondents. Suggestions
The company can maintain and enhance the brand experience, because the variable of brand experience directly influence the more significant in influencing brand loyalty if mediated through brand trust and satisfaction of the brand, the company should be more efforts to build satisfaction mere and trust the brand to consumers so that brand loyalty will be increased.
For further research, given the independent variable in this study is very important in influencing brand loyalty, are expected to further research to develop this research by considering other variables which are other variables beyond the variables that are included in this study as well as increasing the number of samples and expanding area of research.
References Aaker, D.A. (1996). Building Strong Brand, Free
Press, New York, NY, pp.35-71. Aaker, D.A. (1991). Managing Brand Equity:
Capitalizing on The Value of A Brand Name. Alih bahasa: Aris Ananda. 1997. Jakarta. Penerbit Mitra Utama, pp. 39-40.
Yusuf, A.M. (2005). Metodologi Penelitian (Dasar-
Dasar Penyelidikan Ilmiah). Padang: UNP Press.
Arikunto, S. (2001). Prosedur Penelitian: Suatu
Pendekatan Praktek. Jakarta: Rineka Cipta. Assauri, S. (2012). Strategi Marketing: Sustaining
Lifetime Customer Value. Rajawali. Jakarta. Brakus, J. J., Schmitt, B. H. & Zarantonello, L.
(2009). Brand experience: What is it? How is it measured? Does it affect loyalty? Jounal of Marketing, (73), pp.52-68.
Caruana, A. (2002), Service Loyalty: The Effect of
Service Quality and The Mediating Role of Customer Satisfaction, European Journal of Marketing, Vol.36 No.7/8, pp.811-955.
Delgado-Ballester, E., Munuera-Aleman, J.L. &
Yagüe-Guillén, M.J. (2003). Development and Validation af a Brand Trust Scale, International Journal of Market Research, Vol. 45 No.1, pp. 35-54
Ferdinand, A. (2002). Structural Equation Modelling
Dalam Penelitian Manajemen Aplikasi Model –
Brand Experience In Building Loyalty Through The Satisfaction And Trust In Energy Drink (Case In Indonesia)
Aktualita Manajemen Volume 10 Nomor 1, Januari 2016 39
Model Rumit Dalam Penelitian untuk Tesis Magister dan Disertasi Doktor. Semarang: BP UNDIP, pp. 7-48.
Hess, J.S. (1995). Construction and Assessment of a
Scale to Measure Consumer Trust, in Barbara B. Stern and George M. Zinkhan (eds.), Enhancing Knowledge Development in Marketing, AMA Educators’ Proceedings, Chicago: American Marketing Association, pp. 20–26.
Kotler, P. (2005). Manajemen Pemasaran.
Terjemahan. Jilid I Edisi Millenium. Jakarta. Prenhalindo, pp. 460.
Lau, G. & Lee, S. (1999). Consumers’ Trust in a
Brand and The Link to Brand Loyalty, Journal of Market-Focused Management, Vol. 4, pp. 341–370.
Malhotra, N.K. (2005).
Riset Pemasaran Edisi Keempat Jilid 2. Terjemahan Soleh Rusyadi Maryam. Jakarta: PT. Indeks, pp. 89.
Oliver, R.L. (1980). A Cognitive Model of the Antecedents and Consequences of Satisfaction Decisions, Journal of Marketing Research, 17 (November), pp. 460–469.
Kotler, P. & Keller, K.L. (2008). Manajemen Pemasaran. Edisi ke-12 Jilid 1. Indonesia: PT. Indeks. Jakarta.
Riana, G. (2008). Pengaruh Trust in A Brand
Terhadap Brand Loyalty Pada Konsumen Air Minum Aqua di Kota Denpasar. Buletin Studi Ekonomi. 13 (2), pp. 184-202.
Schiffman, L. & Kanuk, L.L. (2008). Consumer
Behavior (edisi tujuh) Perilaku Konsumen. Jakarta: PT.Indeks.
Sukaatmadja, I.P.G. & Jawas, A. (2012). Analisis
Ekuitas Merek Produk Waterbased Finising Izykote (Kasus di Kabupaten Gianyar). Jurnal Manajemen, Strategi Bisnis, dan Kewirausahaan. 6 (2), pp. 150-159
Sugiyono.2010). Metode penelitian Kuantitatif Kualit
atif dan R&D. Bandung: Alfabeta, pp. 30-137.
Tjiptono, F. (1997). Strategi Pemasaran. Yogyakarta:
Andi Offset. You, X. & Donthu, N. (2001). Developing and
Validating a Multidimensional Consumer-Based Brand Equity Scale. Journal of Business Research, 52 (April), pp. 1–14.
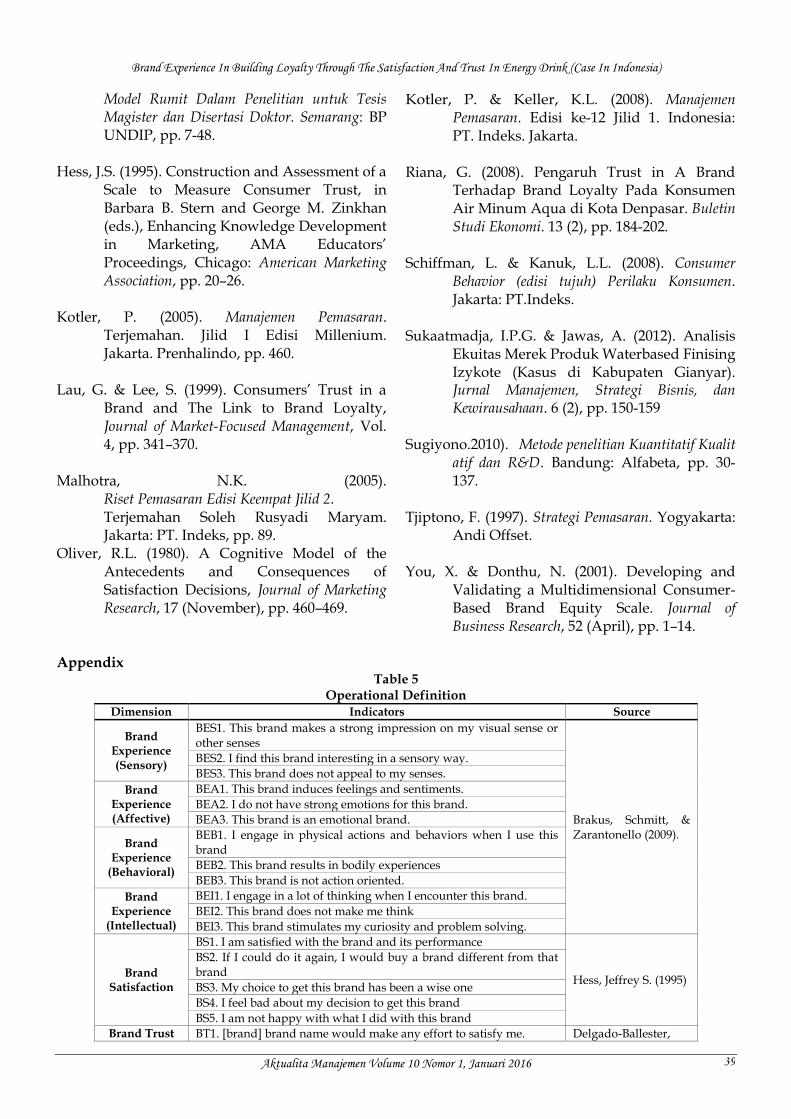
Appendix
Table 5 Operational Definition
Dimension Indicators Source
Brand Experience (Sensory)
BES1. This brand makes a strong impression on my visual sense or other senses
Brakus, Schmitt, & Zarantonello (2009).
BES2. I find this brand interesting in a sensory way. BES3. This brand does not appeal to my senses.
Brand Experience (Affective)
BEA1. This brand induces feelings and sentiments. BEA2. I do not have strong emotions for this brand. BEA3. This brand is an emotional brand.
Brand Experience
(Behavioral)
BEB1. I engage in physical actions and behaviors when I use this brand BEB2. This brand results in bodily experiences BEB3. This brand is not action oriented.
Brand Experience
(Intellectual)
BEI1. I engage in a lot of thinking when I encounter this brand. BEI2. This brand does not make me think BEI3. This brand stimulates my curiosity and problem solving.
Brand Satisfaction
BS1. I am satisfied with the brand and its performance
Hess, Jeffrey S. (1995)
BS2. If I could do it again, I would buy a brand different from that brand BS3. My choice to get this brand has been a wise one BS4. I feel bad about my decision to get this brand BS5. I am not happy with what I did with this brand
Brand Trust BT1. [brand] brand name would make any effort to satisfy me. Delgado-Ballester,
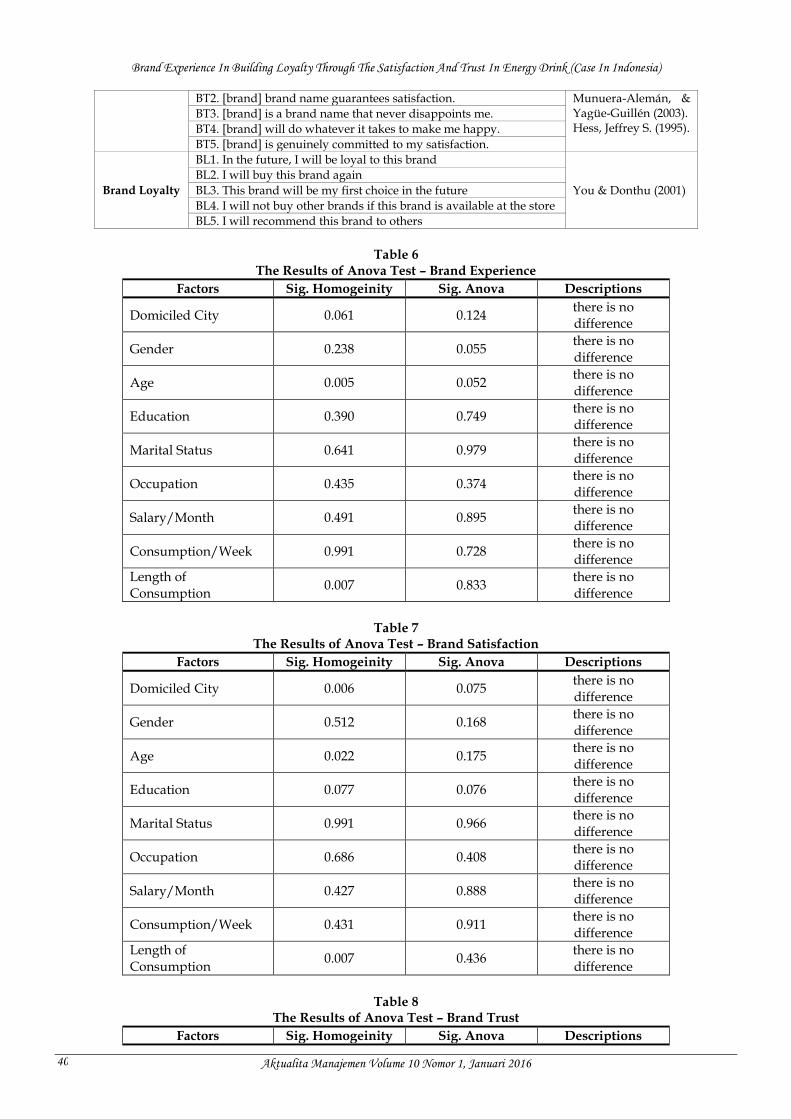
Brand Experience In Building Loyalty Through The Satisfaction And Trust In Energy Drink (Case In Indonesia)
Aktualita Manajemen Volume 10 Nomor 1, Januari 2016 40
BT2. [brand] brand name guarantees satisfaction. Munuera-Alemán, & Yagüe-Guillén (2003). Hess, Jeffrey S. (1995).
BT3. [brand] is a brand name that never disappoints me. BT4. [brand] will do whatever it takes to make me happy. BT5. [brand] is genuinely committed to my satisfaction.
Brand Loyalty
BL1. In the future, I will be loyal to this brand
You & Donthu (2001) BL2. I will buy this brand again BL3. This brand will be my first choice in the future BL4. I will not buy other brands if this brand is available at the store BL5. I will recommend this brand to others
Table 6
The Results of Anova Test – Brand Experience
Factors Sig. Homogeinity Sig. Anova Descriptions
Domiciled City 0.061 0.124 there is no difference
Gender 0.238 0.055 there is no difference
Age 0.005 0.052 there is no difference
Education 0.390 0.749 there is no difference
Marital Status 0.641 0.979 there is no difference
Occupation 0.435 0.374 there is no difference
Salary/Month 0.491 0.895 there is no difference
Consumption/Week 0.991 0.728 there is no difference
Length of Consumption
0.007 0.833 there is no difference
Table 7
The Results of Anova Test – Brand Satisfaction
Factors Sig. Homogeinity Sig. Anova Descriptions
Domiciled City 0.006 0.075 there is no difference
Gender 0.512 0.168 there is no difference
Age 0.022 0.175 there is no difference
Education 0.077 0.076 there is no difference
Marital Status 0.991 0.966 there is no difference
Occupation 0.686 0.408 there is no difference
Salary/Month 0.427 0.888 there is no difference
Consumption/Week 0.431 0.911 there is no difference
Length of Consumption
0.007 0.436 there is no difference
Table 8
The Results of Anova Test – Brand Trust
Factors Sig. Homogeinity Sig. Anova Descriptions
Brand Experience In Building Loyalty Through The Satisfaction And Trust In Energy Drink (Case In Indonesia)
Aktualita Manajemen Volume 10 Nomor 1, Januari 2016 41
Domiciled City 0.185 0.030 there is a difference
Gender 0.132 0.194 there is no difference
Age 0.287 0.682 there is no difference
Education 0.116 0.407 there is no difference
Marital Status 0.065 0.043 there is a difference
Occupation 0.012 0.181 there is no difference
Salary/Month 0.128 0.869 there is no difference
Consumption/Week 0.626 0.705 there is no difference
Length of Consumption
0.481 0.751 there is no difference
Table 9 The Results of Anova Test – Brand Loyalty
Factors Sig. Homogeinity Sig. Anova Descriptions
Domiciled City 0.329 0.386 there is no difference
Gender 0.693 0.046 there is a difference
Age 0.085 0.292 there is no difference
Education 0.001 0.085 there is no difference
Marital Status 0.545 0.878 there is no difference
Occupation 0.300 0.049 there is a difference
Salary/Month 0.815 0.853 there is no difference
Consumption/Week 0.983 0.964 there is no difference
Length of Consumption
0.003 0.374 there is no difference
Brand Experience In Building Loyalty Through The Satisfaction And Trust In Energy Drink (Case In Indonesia)
Aktualita Manajemen Volume 10 Nomor 1, Januari 2016 42
Figure 3 T Value
Copyright © 2022 FDOKUMEN