Brain development parameters and intelligence in Chilean high school graduates
19
Brain development parameters and intelligence in Chilean high school graduates Daniza M. Ivanovic a, * , Boris P. Leiva a , Carmen G. Castro a , Manuel G. Olivares a , Joan Manuel M. Jansana a , Vero ´nica G. Castro a , Atilio Aldo F. Almagia ` b , Triana D. Toro b , Marı ´a Soledad C. Urrutia c , Patricio T. Miller d , Enrique O. Bosch d , Cristia ´n G. Larraı ´n d , Herna ´n T. Pe ´rez a a Public Nutrition Area, Institute of Nutrition and Food Technology (INTA), University of Chile, Santiago, Chile, Avda. Macul 5540 (Entrada El Lı ´bano 5524), Santiago, Chile b Laboratory of Physical Anthropology and Human Anatomy, Institute of Biology, Catholic University of Valparaı ´so, Avda Brasil 2959, Valparaı ´so, Chile c Pan American Sanitary Bureau, Regional Office of the World Health Organization, Pan American Health Organization (PAHO), Washington, DC, USA d Department of Magnetic Resonance Imaging Service, German Clinic of Santiago, Avda. Vitacura 5951, Santiago, Chile Received 26 November 2003; received in revised form 7 July 2004; accepted 8 July 2004 Abstract The hypothesis that independently of sex, brain volume (BV) and head circumference (HC) are positively and significantly associated with intellectual quotient (IQ) was examined in a sample of 96 high school graduates of high [Wechsler Intelligence Scale for Adults—Revised (WAIS-R)N120] and low IQ (WAIS-Rb100) (1:1), from high and low socioeconomic stratum (SES), and of both sexes (1:1) from the Chile’s metropolitan region. Brain development was assessed by magnetic resonance imaging (MRI) and anthropometric measurements were made applying standardized procedures. Results showed that, in general, no significant differences were observed between absolute and adjusted brain parameters by body size. Differences in BV and HC can be more properly attributed to differences in IQ and not to SES both in males and females. Independently of sex, BV was the only 0160-2896/$ - see front matter D 2004 Elsevier Inc. All rights reserved. doi:10.1016/j.intell.2004.07.001 * Corresponding author. P.O. Box 138-11. Tel.: +56 2 678 1459; fax: +56 2 221 4030. E-mail addresses: [email protected], [email protected] (D.M. Ivanovic). URL: www.inta.cl. Intelligence 32 (2004) 461 – 479
Transcript of Brain development parameters and intelligence in Chilean high school graduates

Intelligence 32 (2004) 461–479
Brain development parameters and intelligence in Chilean
high school graduates
Daniza M. Ivanovica,*, Boris P. Leivaa, Carmen G. Castroa, Manuel G. Olivaresa,
Joan Manuel M. Jansanaa, Veronica G. Castroa, Atilio Aldo F. Almagiab,
Triana D. Torob, Marıa Soledad C. Urrutiac, Patricio T. Millerd,
Enrique O. Boschd, Cristian G. Larraınd, Hernan T. Pereza
aPublic Nutrition Area, Institute of Nutrition and Food Technology (INTA), University of Chile, Santiago, Chile,
Avda. Macul 5540 (Entrada El Lıbano 5524), Santiago, ChilebLaboratory of Physical Anthropology and Human Anatomy, Institute of Biology, Catholic University of Valparaıso,
Avda Brasil 2959, Valparaıso, ChilecPan American Sanitary Bureau, Regional Office of the World Health Organization,
Pan American Health Organization (PAHO), Washington, DC, USAdDepartment of Magnetic Resonance Imaging Service, German Clinic of Santiago, Avda. Vitacura 5951, Santiago, Chile
Received 26 November 2003; received in revised form 7 July 2004; accepted 8 July 2004
Abstract
The hypothesis that independently of sex, brain volume (BV) and head circumference (HC) are positively and
significantly associated with intellectual quotient (IQ) was examined in a sample of 96 high school graduates of
high [Wechsler Intelligence Scale for Adults—Revised (WAIS-R)N120] and low IQ (WAIS-Rb100) (1:1), from
high and low socioeconomic stratum (SES), and of both sexes (1:1) from the Chile’s metropolitan region. Brain
development was assessed by magnetic resonance imaging (MRI) and anthropometric measurements were made
applying standardized procedures. Results showed that, in general, no significant differences were observed
between absolute and adjusted brain parameters by body size. Differences in BV and HC can be more properly
attributed to differences in IQ and not to SES both in males and females. Independently of sex, BV was the only
0160-2896/$ -
doi:10.1016/j.i
* Correspo
E-mail add
URL: www
see front matter D 2004 Elsevier Inc. All rights reserved.
ntell.2004.07.001
nding author. P.O. Box 138-11. Tel.: +56 2 678 1459; fax: +56 2 221 4030.
resses: [email protected], [email protected] (D.M. Ivanovic).
.inta.cl.

D.M. Ivanovic et al. / Intelligence 32 (2004) 461–479462
brain parameter that contributed to explain IQ variance. These findings confirm the hypothesis that independently
of sex, BV and HC are positively and significantly associated with IQ.
D 2004 Elsevier Inc. All rights reserved.
Keywords: Intelligence; Education; Brain; Head; Corpus callosum; Magnetic resonance imaging; Image processing
1. Introduction
In the last years, using in vivo magnetic resonance imaging (MRI), several studies have been carried
out to understand the variability of human brain structure sizes during development as well as their
interrelationship with intelligence (Gignac, Vernon, & Wickett, 2002; Ivanovic, Almagia et al., 2000;
Ivanovic et al., 2002; Ivanovic, Leiva et al., 2000; Ivanovic, Forno, Castro, & Ivanovic, 2000; Lange,
Giedd, Castellanos, Vaituzis, & Rapoport, 1997; Nopoulos, Flaum, O’Leary, & Andreasen, 2000;
Vernon, Wickett, Bazana, & Stelmack, 2000; Wickett, Vernon, & Lee, 1994; Wickett, Vernon, & Lee,
2000).
A significant gender effect on intracranial volume has been described, male brains being larger
compared to females, and these differences are more evident in the cortex. Although the functional
significance of these differences is unclear, it is possible to postulate that this may represent the
differential effects of gonadal hormones during brain growth and development (Goldstein et al., 2001;
Lephart et al., 2001; Nopoulos et al., 2000).
Brain development during childhood and adolescence is characterized by both progressive
myelination and regressive pruning processes. Males have more prominent age-related gray matter
decreases and white matter volume and corpus callosal area increases compared with females. These
results suggest that there are age-related sex differences in brain maturational processes (De Bellis et al.,
2001).
Several authors have demonstrated a positive and significant association between brain size (or head
circumference) and intelligence concluding that the differences in human brain size are relevant in
explaining differences in intelligence. Related to this, genetic and environmental factors such as the
birthing process itself, nutrition at an early age, stress, and stimulation have also been involved in these
interrelationships (Andreasen et al., 1993; Botting, Powls, Cooke, & Marlow, 1998; Desch, Anderson, &
Snow, 1990; Diamond & Hopson, 1998; Eliot, 1999; Fisch, Bilek, Horrobin, & Chang, 1976; Gibson,
2002; Hack & Breslau, 1986; Hack et al., 1991; Ivanovic, Almagia et al., 2000; Ivanovic et al., 2002;
Ivanovic, Leiva et al., 2000; Ivanovic et al., 2003, in press; Ivanovic, Forno et al., 2000; Jensen &
Johnson, 1994; Johnson, 1991; MacLullich et al., 2002; Nelson & Deutschberger, 1970; Ounsted, Moar,
& Scott, 1988; Reiss, Abrams, Singer, Ross, & Denckla, 1996; Reynolds, Johnston, Dodge, DeKosky, &
Ganguli, 1999; Rushton, 2000; Rushton & Ankney, 1996, 2000; Strauss & Dietz, 1998; Susanne, 1979;
Van Valen, 1974; Vernon et al., 2000; Wickett et al., 2000; Willerman, Schultz, Rutledge, & Bigler,
1991). Studies carried out in monozygotic and dizygotic twins underline the impact of genetic factors on
both brain development and intellectual functions (Biondi et al., 1998; McGue & Bouchard, 1998; Mohr,
Knauth, Weisbrod, Stippich, & Sartor, 2001). However, this is controversial because some studies a few
of them in twins, have reported either significant or nonsignificant associations between these variables
(Anderson, 1999; Pennington et al., 2000; Schoenemann, Budinger, Sarich, & Wang, 2000; Teasdale &

D.M. Ivanovic et al. / Intelligence 32 (2004) 461–479 463
Pakkenberg, 1988; Tramo et al., 1998; Yeo, Turkheimer, Raz, & Bigler, 1987). Even more, animals
possess some of the attributes we label as dintelligentT in humans. dInsightT and dreasoningT have been
demonstrated in chimpanzees, monkeys, raccoons, rats, mice, elephants, ravens, and pigeons. In the rat,
the animal species best characterized psychologically and neuroanatomically, reasoning ability
correlates with other cognitive capacities and brain size (Anderson, 2000; Cozzi, Spagnoli, & Bruno,
2001).
The objectives of this study were to describe some brain development parameters in Chilean high
school graduates of both sexes from high and low socioeconomic stratum (SES) and to confirm the
hypothesis that independently of sex and SES, brain volume (BV) and head circumference (HC) are
positively and significantly associated with intellectual quotient (IQ).
2. Materials and methods
2.1. Subjects
The sample of 96 right-handed high school graduate students (mean age 18.0F0.9 years) born at
term was chosen from among 1817 school-age children, the total high school graduate population who
attended public and private schools in the richest and the poorest counties of the Chile’s metropolitan
region applying the UNICEF classification (United Nations International Children’s Fund, 1994).
School-age children selected in the sample had no history of alcoholism or antecedents or symptoms of
brain damage, intrapartum fetal asphyxia, hyperbilirubinemia, epilepsy, or heart disease and their
mother had no history of smoking, alcoholism, and drug intake before and during pregnancy. IQ
[Wechsler Intelligence Scale for Adults—Revised (WAIS-R)], SES, and sex were considered for
sample selection. Two groups of high school graduates were formed and compared: Group 1, high IQ
(z120 WAIS-R); and Group 2, low IQ (b100 WAIS-R). The total IQ of the school-age children from
Group 1 (125.4F5.5; n=47) was significantly higher than in those from Group 2 (91.4F6.8; n=49)
(Student’s t test=26.934; df=94; Pb.0001) and this was observed for verbal and nonverbal IQ (Ivanovic
et al., 2002). The same proportion of school-age children according to SES (high and low) (1:1) and
sex (1:1) were included in each IQ group (Ivanovic et al., 2002). This study was approved by the
Committee on Ethics in Studies in Humans of the Institute of Nutrition and Food Technology (INTA),
University of Chile. The subjects’ consent was obtained according to the norms for Human
Experimentation, Code of Ethics of the World Medical Association (Declaration of Helsinki) (The
World Medical Association, 1964).
2.2. Intellectual quotient
IQ (total, verbal, and nonverbal) was assessed in children by means of the WAIS-R adapted for
Chilean population and was carried out at the school (Hermosilla, 1986; Wechsler, 1981). WAIS-R
consists of a set of six verbal and five nonverbal subtests that are individually administered requiring
about 1.5 h and yield an age-corrected estimate of IQ. To avoid examiner bias, the WAIS-R was
administered separately to each child in quiet rooms by a team of educational psychologists specially
trained in this type of study. Before each item, the psychologist provided a clear explanation to each
child in order to clarify the problem to be solved.

D.M. Ivanovic et al. / Intelligence 32 (2004) 461–479464
2.3. Socioeconomic stratum
SES was determined with the Graffar-modified method adapted for Chilean urban population that
considers items such as schooling, job held by the head of the household, and characteristics of the
house (building materials, ownership status, water supply, sewerage, and ownership of durable goods)
(Alvarez, Muzzo, & Ivanovic, 1985). This scale classifies a population into six socioeconomic strata:
1=high; 2=medium–high; 3=medium; 4=medium–low; 5=low; and 6=extreme poverty. In the present
study, only high (1+2) (20.8% and 29.2% of the sample, respectively) and low (4+5) (45.8% and
4.2% of the sample, respectively) SESs were considered because they represent the extremes of SES
conditions. None of the school-age children belonged to the extreme poverty category.
2.4. Brain development study
Brain development was evaluated at the German Clinic of Santiago by MRI according to standardized
techniques (Willerman et al., 1991). Using the lowest margin of the cerebellum in a midsagittal view to
align the first axial (horizontal) MRI slice, 18 mixed-weighted images (spin-echo pulse sequence with a
TR of 2000 ms and a TE of 30 ms) were obtained from a Signa MRI General Electric unit with a field
strength of 1.5 T. All images were 5 mm thick and separated by 2.5 mm. Each image was 256�256
pixels with 256 levels of gray. The MRI tape was read into a VAS computed and the image analyzed
after removing identifying information. A trained specialist without foreknowledge of IQ or sex carried
out analyses. For each slice, a Roberts gradient traced the boundary of the scalp by outlining large-
intensity differences between adjacent pixels. All gray scale intensity values of b96 within this boundary
were converted to zero. This deleted the skull, most of the meninges, and the interhemispheric fissure;
other brain membranes were deleted manually with a cursor. The computer then counted all pixels with
nonzero gray scale values for brain size in each slice, their summed value serving as the index for overall
brain size. Cortex thickness data, BV, absolute and adjusted for effects of sex and body size (weight and
height), anteroposterior (APD) and biparietal diameters (BD), corpus callosum (CC) length absolute and
adjusted for effects of BV and sex, thickness of genu (CCGT), body (CCBT), and splenium (CCST),
absolute and adjusted for effect of CC length and sex (Frodl et al., 2001; Matano & Nakano, 1998), the
presence of neuronal migration disorders, qualitative and quantitative evaluation of white matter,
hippocampal volume, cortical and basal subarachnoid space, and ventricular system size were measured.
From the measurements of each subject in the different slices, the one whose diameter was the greatest
was used as representative to assess APD and BD. Thus, APD was measured in the axial slice in the
medial line from the frontal to the occipital bones under a standard protocol to assure standardized
measurements for all subjects. In the same slice, BD was obtained by means of a reading perpendicular to
APD. Brain parameters were adjusted using ANCOVA (Guilford & Fruchter 1984), despite the fact that
some authors had pointed out that, at present, there is no meaningful basis for the comparison of brain
sizes within and between racial groups and sexes; the control for body size across racial groups (and
sexes) is rendered difficult because bodies do not just differ only in height and weight (Peters et al., 1998).
2.5. Anthropometric measurements
The measurements of weight (W), height (H), and HC were made at school applying standardized
procedures, and all the instruments were verified before measuring each subject (Gibson, 1990). W was
D.M. Ivanovic et al. / Intelligence 32 (2004) 461–479 465
measured in a platform beam balance with an accuracy of 100 g. H was determined with a vertical rod
with a measuring scale of 2 m high and with an accuracy of 0.5 cm. When measuring height, the subject
stood straight looking ahead with the Frankfurt plane horizontal and shoulders blades, buttocks, and
heels almost together touching measurement board, arms at sides, legs straight, knees together, and feet
flat (Gibson, 1990). Weight-for-age Z score (Z-W) and height-for-age Z score (Z-H) were not considered
since most of the sample was older than 18 years and the WHO tables (World Health Organization,
1980) cannot be applied. HC was measured with a narrow (less than 1 cm wide), flexible, nonstretch
tape made of fiber glass and with an accuracy of 0.1 cm. The head was steadied and the greatest HC
measured by placing the tape firmly round the frontal area just above the supraorbital ridges, passing it
round the head at the same level on each side and laying it over the maximum occipital prominence at
the back. HC was compared with the tables of Ivanovic, Olivares, Castro, and Ivanovic (1995), Nellhaus
(1968), Roche, Mukherjee, Guo, and Moore (1987), and Tanner (1984) and also was expressed as Z
score (Z-HC). Z-HC values are the same when applying the different tables because the correlation
coefficient between these patterns was .98 (Ivanovic et al., 1995). Despite of this, Z-HC values shown in
this study were those obtained comparing with the tables of Roche et al. (1987). HC absolute values
were adjusted for sex and body size (weight and height) through ANCOVA (Guilford & Fruchter, 1984).
2.6. Statistical analysis
Data were analyzed by means of ANCOVA (PROC GLM), ANOVA (PROC ANOVA), paired or
unpaired Student’s t test for comparison of means, correlation (PROC CORR), and multiple regression
(PROC GLM ERROR TYPE III) using the Statistical Analysis System (SAS) package (Guilford &
Fruchter 1984; SAS, Institute, 1990).
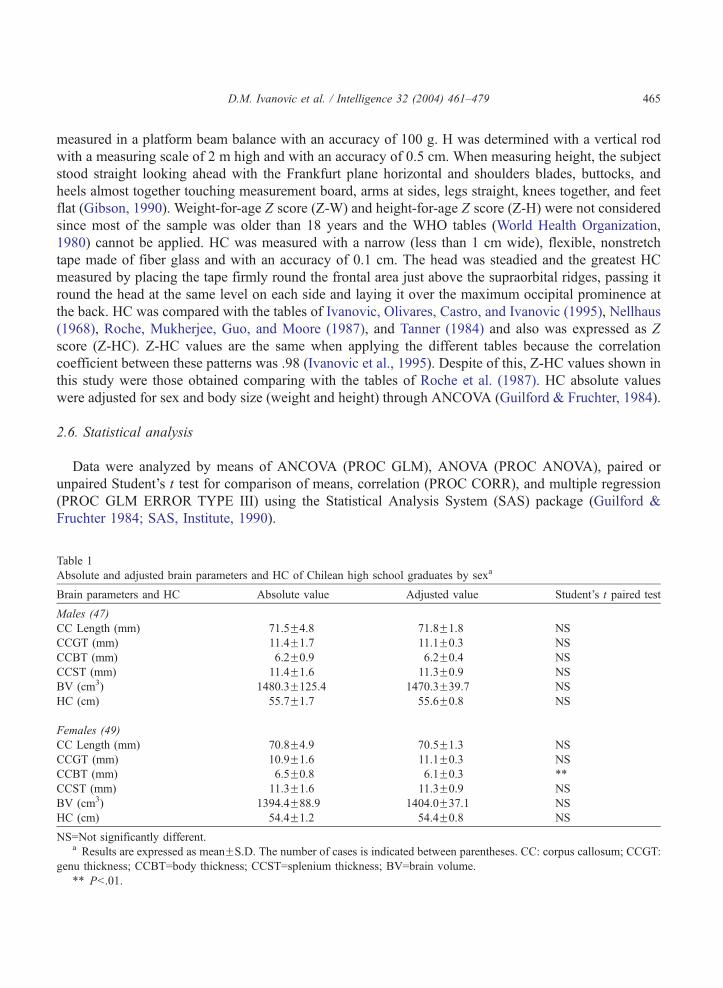
Table 1
Absolute and adjusted brain parameters and HC of Chilean high school graduates by sexa
Brain parameters and HC Absolute value Adjusted value Student’s t paired test
Males (47)
CC Length (mm) 71.5F4.8 71.8F1.8 NS
CCGT (mm) 11.4F1.7 11.1F0.3 NS
CCBT (mm) 6.2F0.9 6.2F0.4 NS
CCST (mm) 11.4F1.6 11.3F0.9 NS
BV (cm3) 1480.3F125.4 1470.3F39.7 NS
HC (cm) 55.7F1.7 55.6F0.8 NS
Females (49)
CC Length (mm) 70.8F4.9 70.5F1.3 NS
CCGT (mm) 10.9F1.6 11.1F0.3 NS
CCBT (mm) 6.5F0.8 6.1F0.3 **
CCST (mm) 11.3F1.6 11.3F0.9 NS
BV (cm3) 1394.4F88.9 1404.0F37.1 NS
HC (cm) 54.4F1.2 54.4F0.8 NS
NS=Not significantly different.a Results are expressed as meanFS.D. The number of cases is indicated between parentheses. CC: corpus callosum; CCGT:
genu thickness; CCBT=body thickness; CCST=splenium thickness; BV=brain volume.
** Pb.01.

D.M. Ivanovic et al. / Intelligence 32 (2004) 461–479466
3. Results
After adjustment for the effects of sex, body height, and body weight, adjusted values for BVand HC
did not differ significantly from absolute values both males and females, as is indicated in Table 1. The
adjustment by ANCOVA, for effects of sex and BV, revealed that adjusted CC length values did not
differ significantly from absolute values in both sexes. As regards to CCGT, CCBT, and CCST for
effects of sex and CC length showed that only in females, absolute CCBT was significantly higher than
adjusted CCBT (Pb.01). As there were practically no significant differences between absolute and
adjusted values for brain parameters, only absolute values are shown in this study.
Table 2 describes the absolute brain parameters, anthropometric measurements, IQ, and age by sex.
Males had absolute BV (Pb.001), BD (Pb.05), APD (Pb.05), absolute HC (Pb.0001), body W
(Pb.0001), and body H (Pb.0001) significantly higher compared with the females. Total, verbal, and
nonverbal IQ and age did not differ significantly by sex.
The absolute brain parameters, anthropometric measurements, IQ, and age by sex and SES are shown
in Table 3. With the exception of absolute CCBT that was significantly higher in males of the high SES
compared with their peers of the low SES (Pb.01), absolute CC parameters did not differ significantly
Table 2
Absolute brain parameters, anthropometric measurements, IQ, and age of Chilean high school graduates by sexa
Males (47) Females (49) Student’s t test
Absolute brain parameters
CC Length (mm) 71.5F4.8 70.8F4.9 0.746, NS
CCGT (mm) 11.4F1.7 10.9F1.6 1.318, NS
CCBT (mm) 6.2F0.9 6.5F0.8 1.580, NS
CCST (mm) 11.4F1.6 11.3F1.6 0.109, NS
BV (cm3) 1480.3F125.4 1394.4F88.9 3.886***
BD (mm) 132.4F6.6 129.6F6.2 2.133*
APD (mm) 164.6F6.6 161.8F5.6 2.267*
Absolute anthropometric measurements
HC (cm) 55.7F1.7 54.4F1.2 4.061****
Z-HC �0.12F1.32 �0.32F0.94 0.872, NS
Body W (k) 65.2F8.7 56.9F8.7 4.649****
Body H (cm) 170.9F6.3 159.4F6.1 9.156****
IQ
Total 108.0F18.8 108.1F17.7 0.039, NS
Verbal 108.0F19.5 107.6F18.0 0.085, NS
Nonverbal 107.0F16.3 107.9F16.7 0.260, NS
Age (years) 18.0F0.9 18.0F0.8 0.246, NS
NS=Not significantly different.a Results are expressed as meanFS.D. The number of cases is indicated between parentheses. CC=corpus callosum;
CCGT=genu thickness; CCBT=body thickness; CCST=splenium thickness; BV=brain volume; BD=biparietal diameter;
APD=anteroposterior diameter; HC=head circumference; Z-HC=head circumference for age Z score. W=weight; H=height.
* Pb.05.
*** Pb.001.
**** Pb.0001.

Table 3
Absolute brain parameters, anthropometric measurements, IQ, and age of Chilean high school graduates by sex and SESa
Males (47) Student’s t test Females (49) Student’s t test
High SES (24) Low SES (23) High SES (24) Low SES (25)
Absolute brain parameters
CC Length (mm) 72.2F4.7 70.8F4.8 0.990, NS 70.2F4.7 71.3F5.1 0.769, NS
CCGT (mm) 11.5F1.3 11.2F2.0 0.566, NS 10.6F1.5 11.2F1.6 1.462, NS
CCBT (mm) 6.5F0.7 5.8F0.9 2.926** 6.5F0.8 6.4F0.9 0.254, NS
CCST (mm) 11.7F1.4 11.0 F1.6 1.585, NS 11.3F1.8 11.3F1.4 0.029, NS
BV (cm3) 1486.2F116.6 1474.0F136.3 0.328, NS 1407.7F93.9 1381.6F83.7 1.027, NS
BD (mm) 130.9F5.6 134.1F7.3 1.659, NS 127.4F4.9 131.8F6.7 2.656*
APD (mm) 165.5F6.4 163.7F6.9 0.882, NS 162.3F6.3 161.2F5.1 0.694, NS
Absolute anthropometric measurements
HC (cm) 55.8F1.6 55.5F1.8 0.658, NS 54.8F1.2 54.1F1.2 2.074*
Z-HC �0.01F1.24 �0.23F1.41 0.564, NS �0.08F0.97 �0.56F0.87 1.829 (t)
Body W (k) 66.6F9.5 63.7F7.8 1.155, NS 56.8F6.1 57.1F10.8 0.140, NS
Body H (cm) 173.3F5.8 168.5F5.9 2.851** 160.8F6.5 158.0F5.4 1.646, NS
IQ
Total 111.3F16.1 104.5F21.1 1.235, NS 110.4F16.2 105.9F19.1 0.890, NS
Verbal 111.6F17.0 104.2F21.6 1.303, NS 109.5F16.3 105.8F19.7 0.710, NS
Nonverbal 109.5F14.0 104.4F18.3 1.061, NS 110.4F16.2 105.5F17.1 1.020, NS
Age (years) 18.0F0.9 18.0F0.9 0.206, NS 17.9F0.6 18.0F0.9 0.576, NS
t=Tendency (PN.05 and b.10) (Pb.074); NS=not significantly different.a Results are expressed as meanFS.D. The number of cases is indicated between parentheses. CC=corpus callosum;
CCGT=genu thickness; CCBT=body thickness; CCST=splenium thickness; BV=brain volume; BD=biparietal diameter;
APD=anteroposterior diameter; HC=head circumference; Z-HC=head circumference for age Z score; W=weight; H=height.
* Pb.05.
** Pb.01.
D.M. Ivanovic et al. / Intelligence 32 (2004) 461–479 467
by SES in both sexes. Independently of SES, absolute BVand APD did not differ significantly by SES in
both males and females, but BD values were significantly higher in females of the low SES compared
with those from the high SES (Pb.05). In both sexes, cortical thickness in the frontal, parietal, temporal,
and occipital lobules was near 4 mm, without significant differences when compared by sex and SES. As
regards to anthropometric measurements, males HC and Z-HC values did not differ significantly by SES
but in females, HC values were slight but significantly higher in those from the high SES than their peers
of the low SES (Pb.05). However, when expressed as Z-HC, differences were not significant in both
sexes. H values were significantly higher in males of the high SES than their peers of the low SES
(Pb.01); no significant differences were observed in the females. Total, verbal, and nonverbal IQ and
age did not differ significantly when analyzed by sex and SES.
Table 4 shows the absolute brain parameters, anthropometric measurements, IQ, and age by sex and
total IQ group. Independently of sex, school-age children with high total IQ exhibited an absolute BV
significantly higher than those of the low total IQ group. This means that males with high total IQ had an
absolute BV that was 133 cm3 greater than their peers of the low SES (Pb.0001), while in the females
this difference was 47.9 cm3 (Pb.05). Males with high total IQ presented an APD significantly higher
than their peers of the low total IQ group (Pb.01), and in the females only a tendency was observed

Table 4
Absolute brain parameters, anthropometric measurements, IQ, and age of Chilean high school graduates by sex and total IQ
groupa
Males (47) Student’s t test Females (49) Student’s t test
High total IQ
(23)
Low total IQ
(24)
High total IQ
(24)
Low total IQ
(25)
Absolute brain parameters
CC length (mm) 72.3F4.6 70.7F5.0 1.149, NS 71.6F5.6 69.9F4.0 1.226, NS
CCGT (mm) 11.7F1.9 11.0F1.5 1.323, NS 10.8F1.7 11.0F1.5 0.540, NS
CCBT (mm) 6.3F0.8 6.0F1.0 1.174, NS 6.4F0.8 6.5F0.9 0.439, NS
CCST (mm) 11.7F1.7 11.1F1.3 1.256, NS 11.2F1.8 11.5F1.4 0.679, NS
BV (cm3) 1548.2F86.7 1415.2F123.4 4.289**** 1418.8F92.4 1370.9F80.3 2.022*
BD (mm) 132.9F6.8 132.0F6.6 0.446, NS 129.4F6.1 129.8F6.6 0.211, NS
APD (mm) 167.2F5.6 162.1F6.6 2.824** 163.2F6.2 160.4F4.6 1.792 (t)
Absolute anthropometric measurements
HC (cm) 56.5F1.4 54.8F1.6 3.917*** 54.8F1.2 54.0F1.2 2.208*
Z-HC 0.57F1.06 �0.78F1.22 4.053*** �0.01F0.84 �0.63F0.95 2.418*
Body W (k) 66.3F6.4 64.2F10.5 0.832, NS 56.4F6.1 57.4F10.8 0.390, NS
Body H (cm) 171.4F4.6 170.5F7.6 0.524, NS 161.2F4.9 157.6F6.7 2.175*
IQ
Total 125.7F5.7 91.0F7.6 17.884**** 125.0F5.4 91.9F6.1 20.090****
Verbal 126.5F5.9 90.2F7.6 18.273**** 124.6F5.6 91.4F7.5 17.656****
Nonverbal 121.5F7.5 93.2F8.2 12.325**** 122.3F9.7 94.1F7.7 11.200****
Age (years) 17.6F0.4 18.4F1.1 3.388** 17.6F0.4 18.4F0.9 3.720***
t=tendency (PN.05b.10 years) (Pb.081); NS=not significantly different.a Results are expressed as meanFS.D. The number of cases is indicated between parentheses. CC=corpus callosum;
CCGT=genu thickness; CCBT=body thickness; CCST=splenium thickness; BV=brain volume; BD=biparietal diameter;
APD=anteroposterior diameter; HC=head circumference; Z-HC=head circumference for age Z score. W=weight; H=height.
* Pb.05.
** Pb.01.
*** Pb.01.
**** Pb.0001.
D.M. Ivanovic et al. / Intelligence 32 (2004) 461–479468
(Pb.081). In both sexes, cortex thickness in the frontal, parietal, temporal, and occipital lobules was near
4 mm without significant differences when compared by sex and total IQ group. In the low SES, two
males who had low total IQs had abnormal amounts of white matter, five school-age children (four males
and one female) had abnormal basal subarachnoid spaces and ventricular system size, and one case had
slight, nonspecific diffuse brain atrophy. Despite the fact that these abnormalities affected mainly males,
no association was found both SES and total IQ. Independently of sex, school-age children with total
high IQ registered an absolute HC and Z-HC values significantly higher compared with their peers with
low total IQ. Males with high total IQ presented an absolute HC 1.7 cm greater than the low total IQ
group (Pb.001) while in females this difference was 0.8 cm (Pb.05). When expressing as Z-HC, males
with high total IQ had values 1.35 S.D. greater than the low total IQ group (Pb.001), and in females this
difference was 0.62 S.D. (Pb.05). According to body H, only females with high total IQ had values
significantly higher compared with the low total IQ group (Pb.05); in males, no significant difference
was observed. Significant differences in total, verbal, and nonverbal IQ between total IQ groups are

D.M. Ivanovic et al. / Intelligence 32 (2004) 461–479 469
observed in both males and females (Pb.0001). School-age children with low total IQ were significantly
older than their peers from the high total IQ group both in males (Pb.01) and in females (Pb.001). This
can be explained since the repetition rate was significantly higher in school-age children with low total
IQ group (0.67F0.72 years; n=49) compared with those of the high total IQ group (0.07F0.25 years;
n=47) (Student’s t test=5.441; df=94; Pb.0001), and this was observed both in males (Pb.01) and in
females (Pb.0001).
Figs. 1 and 2 are examples of T1-weighted midsagittal MRIs of the brains of males and females with
high (left) and low (right) IQs, respectively. In the T1-weighted midsagittal MRI, it is evident that the
brain size of school-age children is greater when IQ is higher compared with those with low IQ. Despite
the significant differences in brain size, midsagittal MRI projections did not show greater changes in the
CC length, cerebral convolutions, and basal subarachnoid space as indicated in Table 4.
Table 5 summarizes the Pearson correlation coefficients between total, verbal and nonverbal IQ, brain
parameters, HC, age, and SES by sex. A positive and significant correlation was observed between total,
verbal, and nonverbal IQ with absolute BV, HC, and APD in both males and females, although in
females, only a tendency was observed between verbal IQ and APD. Total IQ–BV correlation was .551
(Pb.0001) in males and .370 (Pb.01) in females, and total IQ–HC correlation was .499 (Pb.001) and
.397 (Pb.01) in males and females, respectively. In males, a positive and significant low correlation was
observed between total, verbal, and nonverbal IQ with CCBT and nonverbal IQ correlated also with
CCST. In both sexes, absolute BV positively and significantly correlated with HC, BD, and APD. A high
correlation was observed between absolute HC and BV (r=.867, Pb.0001; and r=.720, Pb.0001, for
males and females, respectively) and between adjusted values (r=.978, Pb.0001; and r=.969, Pb.0001,
for males and females, respectively). In males, absolute BV positively and significantly correlated also
with CC length while only a tendency was observed in females.
Fig. 1. Example of T1-weighted midsagittal MRI showing the brain of males with high IQ (left; total IQ=134, HC=57.4 cm, Z-
HC=1.64, absolute BV=1592.53 cm3, and age=17 years 8 months) and low IQ (right; total IQ=80, HC=50.8 cm, Z-HC=�2.88,
absolute BV=1119.53 cm3, and age=19 years). IQ=intellectual quotient; HC=head circumference; Z-HC=head circumference
for age Z score; BV=brain volume.

Fig. 2. Example of T1-weighted midsagittal MRI showing the brain of females with high IQ (left; total IQ=136, HC=57.0 cm,
Z-HC=2.39, absolute BV=1574.29 cm3, and age=17 years 1 month) and low IQ (right; total IQ=88, HC=51.6 cm, Z-
HC=�2.34, absolute BV=1322.74 cm3, and age=18 years 7 months). IQ=intellectual quotient; HC=head circumference; Z-
HC=head circumference for age Z score; BV=brain volume.
D.M. Ivanovic et al. / Intelligence 32 (2004) 461–479470
Multiple regression analysis between BV (dependent variable) and CC, CCGT, CCBT, CCST, BD,
and APD (independent variables) (Table 6) revealed that APD and BD were the brain parameters with
the greatest explanatory power for children’s BV variance both in males (r2=.650) and in females
(r2=.519). In both sexes, APD accounts for a significant proportion of the variance in BV, 87.2% and
76.7% in males and females, respectively. BD accounted for a significant but lower proportion of the
variance, greater in females (23.3%) than in males (12.8%).
Table 7 shows the multiple regression analysis between IQ (dependent variable) and BV, CC, APD,
and sex (independent variables). Independently of sex, BV was the only brain parameter that contributed
to explain total IQ (r2=.248), verbal IQ (r2=.227), and nonverbal IQ variances (r2=.237).
4. Discussion
The results of this study show that in this sample of Chilean high school graduates, absolute and
adjusted values for brain parameters did not differ significantly both males and females, with the only
exception of CCBT in females. This means that the effects of sex and body size (height and weight) for
both BV and HC were not significant. Similar results were observed for absolute CC length adjusted for
sex and BV and for effects of sex and CC length for absolute CCGT and CCST.
In our study, when we evaluated sexual dimorphism in brain structures absolute BV, BD, APD, and
the anthropometric measurements such as absolute HC, body W and body H were significantly higher in
males than in females. With the exception of H in males and BD and HC but not Z-HC in females, no
significant differences were observed related to SES. MRI has been used to evaluate sex differences in

Table 5
Pearson correlation coefficients between IQ, absolute brain parameters, Z-HC, age, and SESa
IQ VIQ N-VIQ BV HC CC CCGT CCBT CCST BD APD AGE SES
Males (47)
IQ –
VIQ .986**** –
N-VIQ .963**** .906**** –
BV .551**** .552**** .515*** –
HC .499*** .522*** .425** .867**** –
CC .157, NS .177, NS .124, NS .421** .440** –
CCGT .209, NS .205, NS .207, NS .215, NS .202, NS .061, NS –
CCBT .322* .291* .352* .136, NS .015, NS .013, NS .394** –
CCST .261 (t) .203, NS .343* .127, NS .179, NS .450** .106, NS .447** –
BD �.058, NS �.041, NS �.090, NS .413** .320* .126, NS .175, NS �.004, NS .025, NS –
APD .470*** .486*** .411** .745**** .658**** .575**** .289* .125, NS .062, NS .179, NS –
AGE �.446** �.478*** �.375**** �.361**** �.337* �.118, NS �.210, NS �.066, NS .152, NS .270 (t) �.387**** –
SES .182, NS .192, NS .157, NS .049, NS .097, NS .146, NS .084, NS .402**** .231, NS .241, NS .131, NS .031, NS –
Females (49)
IQ –
VIQ .968**** –
N-VIQ .930**** .812**** –
BV .370** .331* .383** –
HC .397** .383** .364* .720**** –
CC .175, NS .113, NS .244 (t) .270 (t) .270 (t) –
CCGT �.015, NS �.045, NS .019, NS .148, NS .141, NS .272 (t) –
CCBT �.016, NS �.037, NS .002, NS .146, NS .086, NS .375** .238, NS –
CCST �.042, NS �.037, NS �.058, NS .050, NS .210, NS .584**** .338* .596**** –
BD �.034, NS �.017, NS �.075, NS .385** .224, NS �.147, NS .249 (t) .036, NS �.123, NS –
APD .334* .249 (t) .423** .622**** .605**** .610**** .243 (t) .259 (t) .306* .069, NS –
AGE �.553**** �.591**** �.421** �.191, NS �.222, NS .054, NS .215, NS .200, NS .097, NS .023, NS �.043, NS –
SES .128, NS .103, NS .147, NS .149, NS .272(t) .111, NS .208, NS .037, NS .004, NS �.359* .101, NS .153, NS –
t=tendency (PN.05b.10 years).a The number of cases is indicated between parentheses. IQ=total intellectual quotient; VIQ=verbal intellectual quotient; N-VIQ=nonverbal intellectual
quotient; BV=brain volume; HC=head circumference; CC=corpus callosum length; CCGT=genu thickness; CCBT=body thickness; CCST=splenium thickness;
BD=biparietal diameter; APD=anteroposterior diameter; SES=socioeconomic strata.
* Pb.05.
** Pb.01.
*** Pb.001.
**** Pb.0001.
D.M
.Iva
novic
etal./Intellig
ence
32(2004)461–479
471

Table 6
Multiple regression analysis table (Statistical Analysis System: PROC GLM Error type III) between school-age children’s BV
(dependent variable) and most relevant brain parameters (independent variables) by sexa
Parameter Estimate T for HO:
parameter = 0
PrN[T] Standard error
of estimate
Partial r2 Percentage of the
explained variance
Males
Intercept �1504.425909 �4.23 0.0001 355.8123257 – –
CC �2.734262 �0.72 0.4730 3.7743326 – –
CCGT �5.299503 �0.67 0.5081 7.9352897 – –
CCBT 2.592629 0.15 0.8785 16.8479638 – –
CCST 9.581160 0.90 0.3710 10.5885857 – –
BD 5.652066 3.11 0.0035 1.8187651 .083 12.8
APD 14.377398 5.85 0.0001 2.4558151 .567 87.2
Model r2=.650; root MSE (standard deviation of the dependent variable)=79.498565; model F value=12.40; Pb.0001
Females
Intercept �774.2356894 �2.35 0.0236 329.5865560
CC �0.1639400 �0.06 0.9561 2.9636962
CCGT �3.7165585 �0.55 0.5850 6.7528346
CCBT 5.4907364 0.37 0.7098 14.6560267
CCST �5.8922408 �0.67 0.5062 8.7884390
BD 4.8369945 2.92 0.0056 1.6571488 .121 23.3
APD 10.0453106 4.61 0.0001 2.1813053 .398 76.7
Model r2=.519; root MSE (standard deviation of the dependent variable)=65.885013; model F value=7.55; Pb.0001
a CC=corpus callosum; CCGT=genu thickness; CCBT=body thickness; CCST=splenium thickness; BD=biparietal
diameter; APD=anteroposterior diameter.
D.M. Ivanovic et al. / Intelligence 32 (2004) 461–479472
brain morphology and a significant gender effect on BV, males being larger than females (Blatter et al.,
1995; Nopoulos et al., 2000; Raz et al., 1997; Skullerud, 1985). In brain MRI of healthy children and
adolescents, males had a 9% larger cerebral volume than females (Giedd et al., 1999; Giedd, Castellanos,
Rajapakse, Vaituzis, & Rapoport, 1997). Our findings are comparable since males had an absolute BV
approximately 6% larger than females.
Along the same lines, males in our study had absolute HCs significantly higher (2.3%) than females,
and this difference is in agreement with our previous results and with those of other authors (Ivanovic et
al., 1995; Nellhaus, 1968; Roche et al. 1987; Tanner, 1984; Weaver & Cristian, 1980). However, when
expressed as Z-HC according to sex and age, differences by sex were not significant. Recent findings
pointed out that male newborns had significantly larger head/chest proportions, suggesting that they may
have a greater metabolic demand related to brain size (Nagy, Loveland, Orvos, & Molnar, 2001).
In this study, with the exception of CCBT, males showed higher absolute values for CC length,
CCGT, and CCST compared with the females, but differences were not significant. Our results are in
agreement with those of Pozzilli et al. (1994), who did not find significant differences related to sex in
absolute CC area or the callosal subregions. Significant Sex�Age interactions were seen for CC area,
specifically, males had more prominent age-related CC area increases compared with females (DeBellis
et al., 2001).
During the morphologic development of the CC during childhood and adolescence, the character-
ization of the normal developmental pattern of the CC is hindered by the enormous variability of its size
(Giedd et al., 1999). Other investigators had informed that in the adult age range (22–71 years), men had

Table 7
Multiple regression analysis table (statistical analysis system: PROC GLM error type III) between school-age children’s IQ
(dependent variable) and most relevant brain parameters and sex (independent variables)a
Parameter Estimate T for HO: parameter=0 PrN[T] Standard error
of estimate
Total IQ
Intercept �58.36111844 �1.27 0.2072 45.93705359
Sex
Males �6.12249571 �1.69 0.0954 3.63319307
Females 0.00000000 – – –
BV 0.05933763 2.76 0.0071 0.02153680
CC �0.35544460 �0.82 0.4131 0.43231088
CCBT 1.99888701 1.01 0.3166 1.98500980
APD 0.59325661 1.35 0.1800 0.43905797
Model r2=.248; root MSE (standard deviation of the dependent variable)=16.170; model F value=5.92; Pb.0001
Verbal IQ
Intercept �47.88759811 �1.00 0.3203 47.91645981
Sex
Males �5.84917872 �1.54 0.1262 3.78974567
Females 0.00000000 – – –
BV 0.06307471 2.81 0.0061 0.02246482
CC �0.37440675 �0.83 0.4086 0.45093896
CCBT 1.61525190 0.78 0.4374 2.07054295
APD 0.51690249 1.13 0.2620 0.45797677
Model r2=.227; root MSE (standard deviation of the dependent variable)=16.867; model F value=5.30; Pb.0003
Nonverbal IQ
Intercept �50.82673967 �1.21 0.2276 41.83564886
Sex
Males �5.81887998 �1.76 0.0820 3.30881016
Females 0.00000000 – – –
BV 0.04612230 2.35 0.0209 0.01961393
CC �0.25505446 �0.65 0.5188 0.39371281
CCBT 2.09599848 1.16 0.2493 1.80778188
APD 0.61141342 1.53 0.1298 0.39985749
Model r2=.237; root MSE (standard deviation of the dependent variable)=14.726; model F value=5.60; Pb.0002
a BV=brain volume; CC=corpus callosum; CCBT=body thickness; APD=anteroposterior diameter.
D.M. Ivanovic et al. / Intelligence 32 (2004) 461–479 473
larger brains and CC than women, such as in our study (Matano & Nakano, 1998; Sullivan,
Rosenbloom, Desmond, & Pfefferbaum, 2001). On the other hand, the size of the CC and the body of the
CC consistently decrease in size with age, and the cross-sectional areas of the genu, splenium, and CC,
overall, do not vary significantly with respect to sex such as in our study (Hopper, Patel, Cann, Wilcox,
& Schaeffer, 1994). With the exception of the absolute CCBT that was significantly lower in males from
the low SES, CC parameters did not differ by SES. A recent cross-sectional study of pregnant women
demonstrated that female fetuses had statistically significantly thicker CC than males for each gestational
age. However, the length and width of the CC during gestation did not differ significantly between the
sexes suggesting sex dimorphism of human CC and raising the possibility that prenatal sex hormones
may play later a role in determining callosal development (Achiron, Lipitz, & Achiron, 2001).

D.M. Ivanovic et al. / Intelligence 32 (2004) 461–479474
Studies carried out in animals provided controversial evidence about sexual dimorphism of brain
structures. The whole BV and the size of the entire CC of young adult female rhesus monkeys are
approximately 20% smaller than those of young adult males and the area of the splenium of the CC is
larger in female monkeys (Franklin et al., 2000). Other findings in dogs showed that the anterior half, the
posterior half, the posterior fifth, and the total CC were significantly greater in absolute area in males
than in females (Aydinlgoglu et al., 2000). However, another study performed in rats, rabbits, cats, dogs,
horses, cows, and humans revealed no sex differences in callosal size in any of the species (Olivares,
Michalland, & Aboitiz, 2000).
The high correlation observed in the present study between HC and BV both absolute and adjusted
values is in agreement with findings from other authors and confirms that HC is the anthropometric
indicator both brain development and nutritional background (Bartholomeusz, Courchesne, & Karns,
2002; Vernon et al., 2000). As it turns out, the assumption that external head size can serve as a proxy for
BV is not unreasonable (Vernon et al., 2000), correlations between the two being approximately .60 in
adults (Hoadley, 1929; Tan et al., 1999; Wickett et al., 1994, 2000) and above .90 in infants and children
(Bray, Shields, Wolcott, & Madsen, 1969; Dobbing & Sands, 1978; Lemons, Schreiner, & Gresham,
1981). Our previous results demonstrated that BV accounted for 78.1% of HC variance (Ivanovic et al.,
in press) but in the present study APD was the brain parameter that explained most part of BV variance
and this is in agreement with the findings of other investigators (Willerman et al., 1991).
In our study, school-age children with high IQ had a significantly higher BV and HC, despite the fact
that these were younger than those with low IQ. School-age children of both IQ groups belonged to the
same grade; however, low total IQ group presented school delay due to a significantly higher repetition
rate compared with their peers with high total IQ. We described previously that in this sample,
independently of SES, high school graduates with similar IQ had similar nutritional brain development
and educational parameters and this was observed for both sexes. Maternal IQ, BV, and severe
undernutrition during the first year of life were the independent variables with the greatest explanatory
power for child IQ variance (r2=.707) without interaction with age, sex, or SES. Child IQ (Pb.0001) was
the only independent variable that explained scholastic achievement variance (r2=.848) and Academic
Aptitude Test (the baccalaureate examination for university admission of national covering in Chile)
variance (r2=.876) without interaction with age, sex, or SES, and this was observed both males and
females (Ivanovic, Almagia et al., 2000; Ivanovic et al., 2002).
As already stated, several authors have found a positive and significant association between BVor HC
and intelligence, and these findings are in agreement with our results since BV is the only brain
parameter that contributed to explain IQ variance; in this respect, genetic and environmental factors had
been involved in these interrelationships (Andreasen et al. 1993; Biondi et al., 1998; Botting et al. 1998;
Desch et al. 1990; Diamond & Hopson, 1998; Eliot, 1999; Fisch et al. 1976; Gibson, 2002; Gignac et al.
2002; Hack & Breslau, 1986; Hack et al. 1991; Ivanovic, Almagia et al., 2000; Ivanovic et al., 2002;
Ivanovic, Leiva et al., 2000; Ivanovic, Forno et al., 2000; Jensen & Johnson, 1994; Johnson, 1991;
McGue & Bouchard, 1998; MacLullich et al. 2002; Mohr et al. 2001; Nelson & Deutschberger, 1970;
Ounsted et al. 1988; Reiss et al. 1996; Reynolds et al., 1999; Rushton, 2000; Rushton & Ankney, 1996,
2000; Strauss & Dietz, 1998; Susanne, 1979; Van Valen, 1974; Vernon et al., 2000; Wickett et al., 2000;
Willerman et al., 1991). However, some studies, many of them in twins, have reported significant and
nonsignificant associations between these variables (Anderson, 1999; Pennington et al., 2000;
Schoenemann et al., 2000; Teasdale & Pakkenberg, 1988; Tramo et al., 1998; Yeo et al., 1987). Jensen
and Sinha (1993) predicted that there is no question that BV and IQ are significantly and positively

D.M. Ivanovic et al. / Intelligence 32 (2004) 461–479 475
correlated, with the best estimate being a correlation of approximately .40. However, males of the present
study showed a correlation above .50. BV and HC were highly correlated and so a similar correlation
was observed between BV and IQ and HC and IQ, total, verbal, and nonverbal. IQ also correlated with
APD probably because this is the most relevant brain parameter correlated with BV and that explains
most part of BV variance. The correlation between BVand IQ does not appear limited to adults, and this
should come as no surprise because 92% of adult brain weight is achieved by age 6 (Ho, Roessmann,
Straumfjord, & Monroe, 1980).
In this study no significant correlations were found between SES with IQ, BV, and HC since children
were paired by IQ in each socioeconomic strata and in both sexes. In consequence, the present study
reveals that differences in BV and HC can be more properly attributed to differences in IQ and not to
SES. This means that independently of SES, high school graduates with similar IQ have similar brain
development parameters both in males and in females. Many factors contribute to the size of the brain,
and at least one of them, the number of neurons, is the most obvious factor affecting the overall size and
directly related to intelligence. In fact, Pakkenberg and Gundersen (1997) have shown that larger brains
have more neurons, and it is possible that this increase in neuronal number benefits both cognitive
capacity and complexity through a greater number of synaptic connections (Wickett et al., 2000).
In summary, the results of the present study confirm our hypothesis that independently of sex, BVand
HC are positively and significantly associated with IQ. However, these interrelationships do not have a
direct cause–effect relationship since complex interactions are established during the lifetime of the
individuals. Some authors have underlined that there will no doubt be many exciting attempts over the
next several years to determine what it is about a larger brain that is beneficial to cognitive processing.
Attention will turn to what it is about intelligence that is predicted by BV since this aspect has been
almost completely ignored in the literature (Wickett et al., 2000). Thus, further research is needed to
provide new evidence to this complex interactions.
Acknowledgements
Authors are very gratefully to the Ministry of Education of Chile for all the facilities given to carry out
this research; to Dr. Oscar Brunser MD for helpful comments and suggestions; to Ms. Nora Dıaz and Ms.
Barbara Leyton for their statistical assistance; to Messrs. Ivan Soza, Ricardo Castillo, and Claudio
Canete for the operation of the MRI equipment at the German Clinic of Santiago, Chile; and to Mr.
Leopoldo Salgado for photographic work. Supported in part by Grant 1961032 from the National Fund
for Scientific and Technologic Development (FONDECYT), Grant 024/1997 from the University of
Chile, Postgradest Department, and Grant SOC 01/13-2 from the Research and Development
Department (DID), University of Chile.
References
Achiron, R., Lipitz, S., & Achiron, A. (2001). Sex-related differences in the development of the human fetal corpus callosum: In
utero ultrasonographic study. Prenatal Diagnosis, 21, 116–120.
Alvarez, M. L., Muzzo, S., & Ivanovic, D. (1985). Escala para medicion del nivel socioeconomico en el area de la salud.
Revista Medica de Chile, 113, 243–249.

D.M. Ivanovic et al. / Intelligence 32 (2004) 461–479476
Anderson, B. (1999). Brain size, head size, and intelligence quotient in monozygotic twins. Neurology, 53, 239.
Anderson, B. (2000). The g factor in non-human animals. Novartis Foundation Symposium, 233, 79–90 (discussion 90–95).
Andreasen, N. C., Flaum, M., Swayze, V., O’Leary, D. S., Alliger, R., Cohen, G., et al. (1993). Intelligence and brain structure
in normal individuals. American Journal of Psychiatry, 150, 130–134.
Aydinlgoglu, A., Arslan, K., Cetin Ragbetli, M., Riza Erdogan, A., Keles, P., & Diyarbakirli, S. (2000). Sex differences in dog
corpus callosum. European Journal of Morphology, 38, 63–67.
Bartholomeusz, H. H., Courchesne, E., & Karns, C. M. (2002). Relationship between head circumference and brain volume in
healthy normal toddlers, children, and adults. Neuropediatrics, 33, 239–241.
Biondi, A., Nogueira, H., Dormont, D., Duyme, M., Hasboun, D., Zouaoui, A., et al. (1998). Are the brains of monozygotic
twins similar? A three-dimensional MR study. American Journal of Neuroradiology, 19, 1361–1367 (Comment in:
American Journal of Neuroradiology, 19, 1185–1186).
Blatter, D. D., Bigler, E. D., Gale, S. D., Johnson, S. C., Anderson, C. V., Burnett, B. M., et al. (1995). Quantitative volumetric
analysis of brain MR: Normative database spanning 5 decades of life. American Journal of Neuroradiology, 16, 241–251.
Botting, N., Powls, A., Cooke, R. W., & Marlow, N. (1998). Cognitive and educational outcome of very low-birth weight
children in early adolescence. Developmental Medicine and Child Neurology, 40, 652–660.
Bray, P. F., Shields, W. D., Wolcott, G. J., & Madsen, J. A. (1969). Occipitofrontal head circumference—An accurate measure
of intracranial volume. Journal of Pediatrics, 75, 303–305.
Cozzi, B., Spagnoli, S., & Bruno, L. (2001). An overview of the central nervous system of the elephant through a critical
appraisal of the literature published in the XIX and XX centuries. Brain Research Bulletin, 54, 219–227.
De Bellis, M. D., Keshavan, M. S., Beers, S. R., Hall, J., Frustaci, K., Masalehdan, A., et al. (2001). Sex differences in brain
maturation during childhood and adolescence. Cerebral Cortex, 11, 552–557.
Desch, L. W., Anderson, S. K., & Snow, J. H. (1990). Relationship of head circumference to measures of school performance.
Clinical Pediatrics, 29, 389–392.
Diamond, M., & Hopson, J. (1998). Magic trees of the mind: How to nurture your child’s intelligence, creativity, and healthy
emotions from birth through adolescence. New York7 Plume/Penguin Books.
Dobbing, J., & Sands, J. (1978). Head circumference, biparietal diameter and brain growth in fetal and postnatal life. Early
Human Development, 2, 81–87.
Eliot, L. (1999). What’s going on in there?: How the brain and mind develop in the first five years of life. New York7 Bantam
Books.
Fisch, R. O., Bilek, M. K., Horrobin, J. M., & Chang, P. N. (1976). Children with superior intelligence at 7 years of age: A
prospective study of the influence of perinatal, medical and socioeconomic factors. American Journal of Diseases of
Children, 130, 481–487.
Franklin, M. S., Kraemer, G. W., Shelton, S. E., Baker, E., Kalin, N. H., & Uno, H. (2000). Gender differences in brain volume
and size of corpus callosum and amygdala of rhesus monkey measured from MRI images. Brain Research, 852, 263–267.
Frodl, T., Meisenzahl, E. M., Muller, D., Greiner, J., Juckel, G., Leinsinger, G., et al. (2001). Corpus callosum and P300 in
schizophrenia. Schizophrenia Research, 49, 107–119.
Gibson, K. R. (2002). Evolution of human intelligence: The roles of brain size and mental construction. Brain, Behavior and
Evolution, 59, 10–20.
Gibson, R. (1990). Principles of nutritional assessment (pp. 163–186). New York7 Oxford University Press.
Giedd, J. N., Blumenthal, J., Jeffries, N. O., Castellanos, F. X., Liu, H., Zijdenbos, A., et al. (1999). Brain development during
childhood and adolescence: A longitudinal MRI study. Nature Neuroscience, 2, 861–863.
Giedd, J. N., Blumenthal, J., Jeffries, N. O., Rajapakse, J. C., Vaituzis, A. C., Liu, H., et al. (1999). Development of the human
corpus callosum during childhood and adolescence: A longitudinal MRI study. Progress in Neuro-Psychopharmacology &
Biological Psychiatry, 23, 571–588.
Giedd, J. N., Castellanos, F. X., Rajapakse, J. C., Vaituzis, A. C., & Rapoport, J. L. (1997). Sexual dimorphism of the
developing human brain. Progress in Neuro-Psychopharmacology & Biological Psychiatry, 21, 1185–1201.
Gignac, G., Vernon, P. A., & Wickett, J. C. (2002). Factors influencing the relationship between brain size and intelligence. In
H. Nyborg (Ed.), The scientific study of general intelligence: Tribute to Arthur R. Jensen (pp. 93–106). Oxford, UK7
Elsevier.
Goldstein, J. M., Seidman, L. J., Horton, N. J., Makris, N., Kennedy, D. N., Caviness Jr., V. S., et al. (2001). Normal
sexual dimorphism of the adult human brain assessed by in vivo magnetic resonance imaging. Cerebral Cortex, 11,
490–497.

D.M. Ivanovic et al. / Intelligence 32 (2004) 461–479 477
Guilford, J. P., & Fruchter, B. (1984). Estadıstica aplicada a la psicologıa y a la educacion. Mexico7 McGraw Hill.
Hack, M., & Breslau, N. (1986). Very low birth weight infants: Effects of brain growth during infancy on intelligence quotient
at 3 years of age. Pediatrics, 77, 196–202.
Hack, M., Breslau, N., Weissman, B., Aram, D., Klein, N., & Borawski, E. (1991). Effect of very low birth weight and
subnormal head size on cognitive abilities at school age. New England Journal of Medicine, 325, 231–237.
Hermosilla, M. (1986). La escala de inteligencia de Wechsler para adultos (WAIS). Santiago7 Pontificia Universidad Catolica de
Chile, Escuela de Psicologıa.
Ho, K. C., Roessmann, U., Straumfjord, J. V., & Monroe, G. (1980). Analysis of brain weight: I. Adult brain weight in relation
to sex, race, and age. Archives of Pathology and Laboratory Medicine, 104, 635–645.
Hoadley, M. F. (1929). On measurement of the internal diameters of the skull in relation: I. To the prediction of its capacity; II.
To the bpre-eminenceQ of the left hemisphere. Biometrika, 21, 85–123.
Hopper, K. D., Patel, S., Cann, T. S., Wilcox, T., & Schaeffer, J. M. (1994). The relationship of age, gender, handedness, and
sidedness to the size of the corpus callosum. Academic Radiology, 1, 243–248.
Ivanovic, D., Almagia, A., Toro, T., Castro, C., Perez, H., Urrutia, M. S., et al. (2000). Impacto del estado nutricional en el
desarrollo cerebral, inteligencia y rendimiento escolar, en el marco de un enfoque multifactorial. La Educacion
(Organizacion de los Estados Americanos, OEA), 44((134–135) I–II), 3–35.
Ivanovic, D., Leiva, B., Perez, H., Almagia, A., Toro, T., Urrutia, M. S., et al. (2002). Nutritional status, brain development and
scholastic achievement of Chilean high school graduates from high and low intellectual quotient and socio-economic status.
British Journal of Nutrition, 87, 81–92.
Ivanovic, D., Leiva, B., Perez, H., Inzunza, N., Almagia, A., Toro, T., et al. (2000). Long-term effects of severe
undernutrition during the first year of life on brain development and learning in Chilean high school graduates. Nutrition,
16, 1056–1063.
Ivanovic, D., Leiva, B., Perez, H., Olivares, M., Dıaz, N., Urrutia, M. S., et al. (2003). Head size and intelligence, learning,
nutritional status and brain development. Neuropsychologia (In press).
Ivanovic, D., Olivares, M., Castro, C., & Ivanovic, R. (1995). Circunferencia craneana de escolares chilenos de 5 a 18 anos.
Region Metropolitana de Chile. 1986–1987, 1992. Revista Medica de Chile, 123, 587–599.
Ivanovic, R., Forno, H., Castro, C. G., & Ivanovic, D. (2000). Intellectual ability and nutritional status assessed through
anthropometric measurements of Chilean school-age children from different socioeconomic status. Ecology of Food and
Nutrition, 39, 35–59.
Jensen, A., & Johnson, F. (1994). Race and sex differences in head size and IQ. Intelligence, 18, 309–333.
Jensen, A. R., & Sinha, S. N. (1993). Physical correlates of human intelligence. In P. A. Vernon (Ed.), Biological approaches to
the study of human intelligence (pp. 139–242). Norwood, NJ7 Ablex.
Johnson, F. W. (1991). Biological factors and psychometric intelligence: A review. Genetic, Social, and General Psychology
Monographs, 117, 313–357.
Lange, N., Giedd, J. N., Castellanos, F. X., Vaituzis, A. C., & Rapoport, J. L. (1997). Variability of human brain structure size:
Ages 4–20 years. Psychiatry Research, 74, 1–12.
Lemons, J. A., Schreiner, R. L., & Gresham, E. L. (1981). Relationship of brain weight to head circumference in early infancy.
Human Biology, 53, 351–354.
Lephart, E. D., Call, S. B., Rhees, R. W., Jacobson, N. A., Weber, K. S., & Bledsoe, J. (2001). Neuroendocrine regulation of
sexually dimorphic brain structure and associated sexual behavior in male rats is genetically controlled. Biology of
Reproduction, 64, 571–578.
MacLullich, A. M., Ferguson, K. J., Deary, I. J., Seckl, J. R., Starr, J. M., & Wardlaw, J. M. (2002). Intracranial capacity and
brain volumes are associated with cognition in healthy elderly men. Neurology, 59, 169–174.
Matano, S., & Nakano, Y. (1998). Size comparison of the male and female human corpus callosum from autopsy samples.
Zeitschrift fur Morphologie und Anthropologie, 82, 67–73.
McGue, M., & Bouchard Jr., T. J. (1998). Genetic and environmental influences on human behavioral differences. Annual
Review of Neuroscience, 21, 1–24.
Mohr, A., Knauth, M., Weisbrod, M., Stippich, C., & Sartor, K. (2001). Similarity of the brains of twins. RoFo. Fortschritte auf
dem Gebiete der Rontgenstrahlen und der neuen bildgebenden Verfahren, 173, 515–521.
Nagy, E., Loveland, K. A., Orvos, H., & Molnar, P. (2001). Gender-related physiologic differences in human neonates and the
greater vulnerability of males to developmental brain disorders. Journal of Gender-Specific Medicine, 4, 41–49.
Nellhaus, G. (1968). Head circumference from birth to eighteen years. Pediatrics, 41, 106–114.

D.M. Ivanovic et al. / Intelligence 32 (2004) 461–479478
Nelson, K. B., & Deutschberger, J. (1970). Head size at one year as a predictor of four-year IQ. Developmental Medicine and
Child Neurology, 12, 487–495.
Nopoulos, P., Flaum, M., O’Leary, D., & Andreasen, N. C. (2000). Sexual dimorphism in the human brain: Evaluation of tissue
volume, tissue composition and surface anatomy using magnetic resonance imaging. Psychiatry Research, 98, 1–13.
Olivares, R., Michalland, S., & Aboitiz, F. (2000). Cross-species and intraspecies morphometric analysis of the corpus
callosum. Brain, Behavior and Evolution, 55, 37–43.
Ounsted, M., Moar, V. A., & Scott, A. (1988). Head circumference and developmental ability at the age of seven years. Acta
Paediatrica Scandinavica, 77, 374–379.
Pakkenberg, B., & Gundersen, H. J. G. (1997). Neocortical neuron number in humans: Effect of sex and age. Journal of
Comparative Neurology, 384, 312–320.
Pennington, B. F., Filipek, P. A., Lefly, D., Chhabildas, N., Kennedy, D. N., & Simon, J. H. (2000). A twin MRI study of size
variations in human brain. Journal of Cognitive Neuroscience, 12, 223–232.
Peters, M., Jancke, L., Staiger, J. F., Schlaug, G., Huang, Y., & Stenmetz, H. (1998). Unsolved problems in comparing brain
sizes in homo sapiens. Brain and Cognition, 37, 254–285.
Pozzilli, C., Bastianello, S., Bozzao, A., Pierallini, A., Giubilei, F., & Argentino, C. (1994). No differences in corpus callosum
size by sex and aging. A quantitative study using magnetic resonance imaging. Journal of Neuroimaging, 4, 218–221.
Raz, N., Gunning, F. M., Head, D., Dupuis, J. H., McQuain, J., Briggs, S. D., et al. (1997). Selective aging of the human
cerebral cortex observed in vivo: Differential vulnerability of the prefrontal gray matter. Cerebral Cortex, 7, 268–282.
Reiss, A. l., Abrams, M. T., Singer, H. S., Ross, J. L., & Denckla, M. B. (1996). Brain development, gender and IQ in children.
A volumetric imaging study. Brain, 119, 1763–1774.
Reynolds, M. D., Johnston, J. M., Dodge, H. H., DeKosky, S. T., & Ganguli, M. (1999). Small head size is related to low Mini-
Mental State Examination scores in a community sample of nondemented older adults. Neurology, 53, 228–229.
Roche, A. F., Mukherjee, D., Guo, S., & Moore, W. (1987). Head circumference reference data: Birth to 18 years. Pediatrics,
79, 706–712.
Rushton, J. P. (2000). Race, evolution, and behavior: A life-history perspective (2nd special abridged ed.). Port Huron, MI7
Charles Darwin Research Institute.
Rushton, J. P., & Ankney, C. D. (1996). Brain size and cognitive ability: Correlations with age, sex, social class, and race.
Psychonomic Bulletin and Review, 3, 21–36.
Rushton, J. P., & Ankney, C. D. (2000). Size matters: A review and new analyses of racial differences in cranial capacity and
intelligence that refute Kamin and Omari. Personality and Individual Differences, 29, 591–620.
SAS (1990). Statistical Analysis System (Version 6) [Computer software]. SAS Institute, Cary, NC: Author.
Schoenemann, P. T., Budinger, T., Sarich, V., & Wang, W. (2000). Brain size does not predict general cognitive ability within
families. Proceedings of the National Academy of Sciences of the United States of America, 97, 4932–4937.
Skullerud, K. (1985). Variations in the size of the human brain. Influence of age, sex, body length, body mass
index, alcoholism, Alzheimer changes, and cerebral atherosclerosis. Acta Neurologica Scandinavica. Supplementum,
102, 1–94.
Strauss, R. S., & Dietz, W. H. (1998). Growth and development of term children born with low birth weight: Effects of genetic
and environmental factors. Journal of Pediatrics, 133, 67–72.
Sullivan, E. V., Rosenbloom, M. J., Desmond, J. E., & Pfefferbaum, A. (2001). Sex differences in corpus callosum size:
Relationship to age and intracranial size. Neurobiology of Aging, 22, 603–611.
Susanne, C. (1979). On the relationship between psychometric and anthropometric traits. American Journal of Physical
Anthropology, 51, 421–424.
Tan, U., Tan, M., Polat, P., Ceylan, Y., Suma, S., & Okur, A. (1999). Magnetic resonance imaging brain size/IQ relations in
Turkish university students. Intelligence, 27, 83–92.
Tanner, J. M. (1984). Physical growth and development. In J. O. Forfar, & G. C. Arneil (Eds.), Texbook of pediatrics
(pp. 278–330). Edinburgh7 Churchill Livingstone.
Teasdale, T. W., & Pakkenberg, B. (1988). The association between intelligence level and brain volume measures: A negative
finding. Scandinavian Journal of Psychology, 29, 123–125.
The World Medical Association (1964). Human experimentation. Code of Ethics of the World Medical Association (Declaration
of Helsinki). British Medical Journal, 2, 177.
Tramo, M. J., Loftus, W. C., Stukel, T. A., Green, R. L., Weaver, J. B., & Gazzaniga, M. S. (1998). Brain size, head size, and
intelligence in monozygotic twins. Neurology, 50, 1246–1252.
D.M. Ivanovic et al. / Intelligence 32 (2004) 461–479 479
United Nations International Children’s Fund (1994). A proposal to classify Chilean districts by infancy situation. Santiago7
UNICEF.
Van Valen, L. (1974). Brain size and intelligence in man. American Journal of Physical Anthropology, 40, 417–424.
Vernon, P. A., Wickett, J. C., Bazana, P. G., & Stelmack, R. M. (2000). The neuropsychology and psychophysiology of human
intelligence. In R. J. Sternberg (Ed.), Handbook of intelligence (2nd ed.). New York7 Cambridge.
Weaver, D. D., & Cristian, J. C. (1980). Familial variation of head size and adjustment for parental head circumference. Journal
of Pediatrics, 96, 990–994.
Wechsler, D. (1981). Manual for the Wechsler adult intelligence scale—revised. San Antonio, TX7 Psychological.
Wickett, J. C., Vernon, P. A., & Lee, D. H. (1994). In vivo brain size, head perimeter, and intelligence in a sample of healthy
adult females. Personality and Individual Differences, 16, 831–838.
Wickett, J. C., Vernon, P. A., & Lee, D. H. (2000). Relationships between factors of intelligence and brain volume. Personality
and Individual Differences, 29, 1095–1122.
Willerman, L., Schultz, R., Rutledge, J. N., & Bigler, D. E. (1991). In vivo brain size and intelligence. Intelligence, 15, 223–228.
World Health Organization (1980). Measurement of the nutritional impact of supplementation food programs to vulnerable
groups. FAP/79.1. Geneva7 WHO.
Yeo, R. A., Turkheimer, E., Raz, N., & Bigler, E. D. (1987). Volumetric asymmetries of the human brain: Intellectual correlates.
Brain and Cognition, 6, 15–23.