
SOCIOLOGY OF LABOUR AND SOCIAL STRATIFICATION IN NORTH EAST INDIA
Upload
independentCategory
view
0download
0
Cytometry Part B (Clinical Cytometry) 78B:154–168 (2010)
Bone Marrow Cells from MyelodysplasticSyndromes Show Altered ImmunophenotypicProfiles That May Contribute to the Diagnosisand Prognostic Stratification of the Disease:
a Pilot Study on A Series of 56 Patients
Sergio Matarraz,1 Antonio Lopez,1 Susana Barrena,1 Carlos Fernandez,1
Evan Jensen,1 Juan Flores-Montero,1 Ana Rasillo,1 Jose Marıa Sayagues,1
Maria Luz Sanchez,1 Paloma Barcena,1 Jesus Marıa Hernandez-Rivas,2
Carlos Salvador,3 Nuria Fernandez-Mosteirın,3 Manuel Giralt,3 Luis Perdiguer,4
Paula Laranjeira,5 Artur Paiva,5 and Alberto Orfao1*1Centro de Investigacion del Cancer (Instituto de Biologıa Molecular y Celular del Cancer; CSIC-USAL),
Servicio General de Citometrıa and Departamento de Medicina, Universidad de Salamanca, Salamanca, Spain2Servicio de Hematologıa, Hospital Universitario de Salamanca, Salamanca, Spain
3Servicio de Hematologia. Hospital Miguel Servet, Zaragoza, Spain4Servicio de Hematologia, Hospital de Alcaniz, Teruel, Spain
5Unidade de Citometria, Centro de Histocompatibilidade do Centro-Coimbra, Coimbra, Portugal
A heterogeneous spectrum of immunophenotypic abnormalities have been reported in myelodysplasticsyndromes (MDS). However, most studies are restricted to the analysis of CD341 cells and/or othermajor subsets of CD342 cells, frequently not exploring the diagnostic and prognostic impact ofimmunophenotyping.
Methods: We propose for the first time an immunophenotypic score (IS) based on the altered distribu-tion and immunophenotypic features of maturing/mature compartments of bone marrow (BM) hematopoi-etic cells in 56 patients with MDS that could contribute to a refined diagnosis and prognostic evaluationof the disease.
Results: Although MDS-associated phenotypes were detected in reactive BM, the overall immunopheno-typic profile of BM cells allowed an efficient discrimination between MDS and both normal and reactiveBM, once the number and degree of severity of the abnormalities detected per patient were simultane-ously considered in the proposed IS. Interestingly, increasingly higher IS were found among patients withMDS showing adverse prognostic factors and in low- versus high-grade cases. The most informative prog-nostic factors included the number of CD341 cells, presence of aberrant CD342/CD1171 precursors,decreased mature neutrophils and CD342 erythroid precursors, and increased numbers of CD362/lo ery-throid precursors; in addition, the IS was an independent prognostic factor for overall survival.
Conclusions: Assessment of immunophenotypic abnormalities of maturing/mature BM cells allows anefficient discrimination between MDS and both normal and reactive BM, once the number and degree ofseverity of the abnormalities detected are simultaneously scored. Interestingly, progressively higher ISwere found among patients with MDS with adverse prognostic features and shorter overall survival.VC 2010 Clinical Cytometry Society
Key terms: myelodysplastic syndromes; immunophenotypic score; survival
Grant sponsor: Instituto de Salud Carlos III, Ministerio de Sanidad yConsumo, Madrid, Spain; Grant number: RTICC RD06/0020/0035; Grantsponsor: Ministerio de Sanidad Consumo; Grant number: CP05/003 (toJ.M.S.); Grant sponsor: Fundacao para a Ciencia e a Tecnologia (FCT),Portugal; Grant sponsor: SFRH/BD/32097/2006 (to P.L.).
*Correspondence to: Alberto Orfao, Servicio General de Citometrıa.Centro de Investigacion del Cancer, Campus Miguel de Unamuno,37007-Salamanca, Spain. E-mail: [email protected].
Received 14 July 2009; Revision 27 January 2010; Accepted 28January 2010
Published online 2 March 2010 in Wiley InterScience (www.interscience.wiley.com).DOI: 10.1002/cyto.b.20513
VC 2010 Clinical Cytometry Society
How to cite this article: Matarraz S, Lopez A, Barrena S, Fernandez C, Jensen E, Flores-Montero J, Rasillo A,Sayagues JM, Sanchez ML, Barcena P, Hernandez-Rivas JM, Salvador C, Fernandez-Mosteirın N, Giralt M, PerdiguerL, Laranjeira P, Paiva A, Orfao A. Bone marrow cells from myelodysplastic syndromes show altered immunophe-notypic profiles that may contribute to the diagnosis and prognostic stratification of the disease: a pilot studyon a series of 56 patients. Cytometry Part B 2010; 78B: 154–168.
Currently, diagnosis of myelodysplastic syndromes(MDS) mainly relies on morphologic features of bonemarrow (BM) precursors and maturing myeloid, ery-throid and megakaryocytic cells, once other potentialreasons for cytopenias and/or dysplasia have been ruledout (1–3). In addition to cytomorphology and histopa-thology, cytogenetic findings are also widely recognizedas being particularly valuable for (1) the diagnosis ofMDS; (2) the identification of specific subgroups of thedisease (e.g., 5q� syndrome) (3,4); and (3) prognosticstratification of patients at low versus high risk of devel-oping acute leukemia and/or dying (2,5–9).
In recent years, an increasingly high number of stud-ies has accumulated, which show occurrence of multi-ple and variable phenotypic abnormalities in MDS thatcould potentially contribute to the diagnosis and prog-nostic evaluation of the disease (10–15). Most frequentlyreported abnormalities include: increased numbers ofmyeloblasts, decreased granularity of maturing myeloidcells (11–13), asynchronous expression of maturation-associated markers, inappropriate expression of lymph-oid-related antigens (e.g., CD7), and either lack ordecreased reactivity for myeloid-associated antigens(e.g., CD13 and CD33), among other alterations (13). Inparallel, a number of reagent combinations have beenproposed that generate unique immunophenotypic pat-terns of antigen expression for both maturing neutro-phils and erythroid precursors, which are frequentlyaltered in MDS (13,16–20). However, detailed analysis ofthese studies shows that they have typically focused onthe study of BM CD34þ hematopoietic progenitor cells(HPC) (21–25) and/or a few major compartments ofmaturing neutrophil, monocytic and to lower extent,also erythroid and megakaryocytic cells (19–26). In addi-tion, although in few of these reports immunopheno-typic scores (IS) have been built according to thenumber of abnormalities identified and their nature(13,19,23), such scores are frequently based on rela-tively subjective criteria (13) and/or the analysis of arestricted number of BM cell populations (15,23,27).Finally, in these studies, deviation from normal is typi-cally established on the basis of the immunophenotypicfeatures of normal plus reactive BM samples frompatients suffering from different disease conditions thatcould potentially have a variable and heterogeneouseffect on the immunophenotypic patterns of BM precur-sors and maturing myeloid cells. In contrast, no compre-hensive study has been reported so far in which a
scoring system based on objective immunophenotypiccriteria is used to rank the progressively altered patternsof antigen expression observed in BM compartments ofmaturing lymphoid and myeloid cells committed intoboth major and minor hematopoietic cell lineages inMDS and in reactive BM samples, taking only normaladult BM as the reference.
In this pilot study, we provide a comprehensive analy-sis of the distribution and immunophenotypic patternsof different maturation-associated compartments ofimmature-, neutrophil-, monocytic-, erythroid-, mast cell-,plasmacytoid dendritic cell (pDC)-, basophil-, and B-lymphoid-committed hematopoietic BM cells in a rela-tively limited series of 56 consecutive patients with MDSinvestigated at diagnosis, compared with a group of 20normal adult BM samples. In addition, a third group of20 reactive BM samples corresponding to cases present-ing with cytopenias associated with non-clonal hemato-poiesis in which differential diagnosis with MDS wasrequired was also studied in parallel. On the basis of thenumber and severity of the alterations detected withrespect to normal BM, an objective IS was built thatallows clear-cut discrimination between MDS and bothnormal and reactive BM samples. Of note, the IS pro-gressively increased from low- to high-grade MDS andemerged as an independent prognostic factor for overallsurvival.
MATERIALS AND METHODS
Patients, Controls and Samples
A total of 56 untreated patients (35 men and 21women) with a mean age of 69 years (range, 31–85years), newly diagnosed with MDS, were studied.According to the World Health Organization (WHO) cri-teria (3,28), patients were classified as follows: RA, 9cases; RCMD, 10; RAEB-1, 10; RAEB-2, 13; myelodysplas-tic/myeloproliferative disorder (MD/MPD), 11 and; 5q�
syndrome, 3 cases. Following the International Prognos-tic Scoring System (IPSS) (6), 13 cases were classified aslow risk (LOW-R) MDS, 24 as intermediate-1 (INT-1-R),11 as intermediate-2 (INT-2-R), and four cases as highrisk (HIGH-R) MDS; in the remaining four patients, ei-ther metaphases could not be obtained from cultures orcytogenetic data was not available. In every patient, anEDTA-anticoagulated BM sample was obtained at diagno-sis for further multiparameter flow cytometry immuno-phenotypic studies. At the moment of closing this study,
PHENOTYPE IN MDS AND SURVIVAL 155
Cytometry Part B: Clinical Cytometry
17 patients had died and 39 remained alive with a me-dian overall survival of 15 months for the whole series.
In parallel, 40 freshly obtained, EDTA-anticoagulatednormal (n ¼ 20) and reactive (n ¼ 20) BM samplesfrom an identical number of individuals (median age, 64years; range, 46–79 years) were collected at the Univer-sity Hospital of Salamanca (Spain). Normal BM sampleswere obtained from healthy donors and individualsundergoing orthopedic surgery, whereas reactive sam-ples corresponded to patients with carential and megalo-blastic anemias and other toxic (e.g., drug-inducedcytopenias) or reactive cytopenias (e.g., idiopathicthrombopenia purpura) and infection-associated leuko-penias. None of the reactive samples showed clonalhematopoiesis, based on the absence of MDS-associatedcytogenetic abnormalities—e.g., trisomy 8, �7/7q�, �5/5q�, del(20q) or—Y- as assessed by fluorescence in situhybridization (FISH) and/or a non-clonal pattern of inac-tivation of chromosome X- negative human androgen re-ceptor assay (HUMARA) test—in FACS-purified maturingneutrophils, monocytic cells, nucleated red blood cells(NRBC), CD34þ HPC, and mature lymphocytes. All BMsamples were obtained after informed consent was givenby each individual according to the recommendations ofthe local Ethics Committee and studied within the first18 hours after they were obtained. In case they wereshipped from another center, they were packed at roomtemperature isolated from external temperature.
Immunophenotypic Studies and Flow Cytometric Score
Whole BM samples (2 � 106 cells in 100 lL/test)were stained for cell surface markers using a stain-lyse-and-then-wash direct immunofluorescence technique,previously described in detail (29,30). In addition, intra-cellular—nuclear (n) and cytoplasmic (Cy)—stainingswere performed after cell fixation and permeabilization,using the Fix and Perm reagent kit (Invitrogen, Carlsbad,CA). The following combinations of monoclonal antibod-ies (MAb) in four color stainings—fluorescein isothiocya-nate (FITC)/phycoerythrin (PE)/peridinin chlorophyllprotein (PerCPCy5.5)/allophycocyanin (APC)—were sys-tematically used: HLA-DR/CD117/CD45/CD34; HLA-DR/CD123/CD45/CD34; CD11b/CD13/CD45/CD34; CD61/CD33/CD45/CD34; nTdT/CyMPO/CD45/CD34; CD15/CD16/CD45/CD34; CD19/CyCD79a/CD45/CD34; CD65/7.1/CD45/CD34; CD36/CD64/CD45/CD34-CD14, IREM-2/CD14/CD45/CD34, CD2/CD56/CD45/CD34, CD71/CD235a/CD45/CD34, and CyCD3/CD7/CD45/CD34. Thespecificity and source of each reagent have been previ-ously described in detail (25).
Immediately after staining, sample aliquots were meas-ured in a FACSCalibur flow cytometer (Becton DickinsonBiosciences (BDB), San Jose, CA) using the CellQUESTsoftware program (BDB) for a total of 3 � 104 eventscorresponding to the whole BM cellularity, per samplealiquot. For data analysis, the INFINICYTTM softwareprogram (Cytognos SL, Salamanca, Spain) was used. Inbrief, total CD34þ BM precursors were identified andcounted according to their light scatter characteristics—
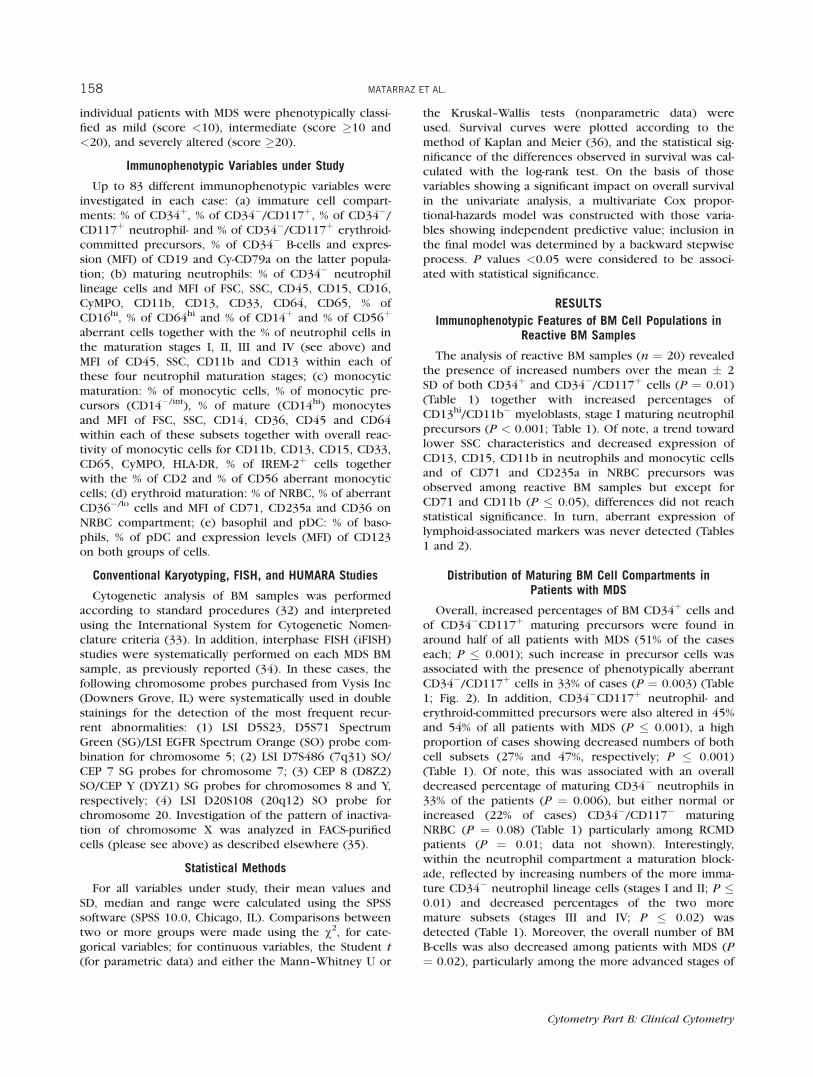
forward light scatter (FSC) and sideward light scatter(SSC)—their positivity for CD34 and dim CD45 expres-sion following the ISHAGE guidelines (31), as describedin detail elsewhere (25) (Figs. 1A and 1B). In addition,CD117þ/CD34� precursors were identified in a SSC ver-sus CD117 bivariate dot plot histogram after excludingCD34þ HPC, as exemplified in Figure 1C. AmongCD117þ/CD34� precursors, the following subsets wereidentified (Fig. 1D): (a) neutrophil-committed precursors(CD45lo/SSClo/int); (b) erythroid-committed precursors(CD45�/SSCvery-lo); and (c) maturing CD34� mast cellswere identified as those CD45þ events being CD117hi
with heterogeneous HLA-DR expression (HLA-DR� to þ;Fig. 1E); finally, in MDS cases, accumulation of abnormalCD117þ/CD34�/CD45lo/SSClo cells was also frequentlydetected. In addition to CD34þ and/or CD117þ cells, thefollowing subsets of CD34�/CD117� hematopoietic BMcells were identified: (a) neutrophil- (CD45lo/SSCint/hi), (b)erythroid- (CD45�/SSCvery-lo), (c) monocytic- (CD36�/hi/CD64hi/CD45int/hi/CD14low/hi), (d) B-cell- (CD45lo/SSCvery-lo/CD19þ/CyCD79aþ), (e) plasmacytoid dendritic cell- (pDC)(HLA-DRhi/CD123hi/CD45int), and (f) basophil-maturingcells (HLA-DR�/CD123hi/CD45int) (Fig. 1). The specificimmunophenotypic characteristics of mature lympho-cytes were taken as a standard to define the relativeposition of the different compartments of BM precur-sors in a CD45 versus SSC dot plot and to establish cut-off levels for defining the lower expression of myeloid-associated antigens.
Among CD34� neutrophil lineage cells, four differentstages of increasing maturation were defined on the ba-sis of the reactivity for the CD11b and CD13 antigens(Fig. 1G): stage I, CD13hi/CD11b� myeloblasts; stage II,CD13lo/int/CD11b� promyelocytes; stage III, CD13lo/int/CD11bþ myelocytes and metamyelocytes and; stage IV,CD13hi/CD11bþ bands and mature neutrophils. In turn,mature monocytes were identified as those cells display-ing a CD36hi, CD64hi, CD45int/hi, CD14hi immunopheno-type, whereas their CD34� precursors were defined asbeing CD36�/lo/CD64hi/CD45int/CD14lo/int (Fig. 1H).
MDS and reactive BM samples were prospectively ana-lyzed blinded to any clinical or diagnostic data. For eachantigen, results were expressed as percentage of positivecells for a given marker and/or their mean fluorescenceintensity (MFI; arbitrary relative linear units, scaled from0 to 104) within each cell subset identified. The pres-ence of aberrant phenotypes and/or other maturation-associated abnormalities were defined for each BM cellpopulation based on numerical and phenotypic devia-tions greater than the mean � 2 standard deviations(SD) from the normal BM profiles. Accordingly, for eachindividual immunophenotypic variable analyzed (n ¼83) in each BM sample, a score of 0, 0.5, 1, or 2 wasgiven when the value obtained was within the mean �2 SD, between the mean � 2 SD and the mean � 3 SD,between the mean � 3 SD and the mean � 4 SD, andover the mean � 4 SD of the values found for that pa-rameter among the normal BM samples analyzed, respec-tively. On the basis of the overall score reached,
156 MATARRAZ ET AL.
Cytometry Part B: Clinical Cytometry
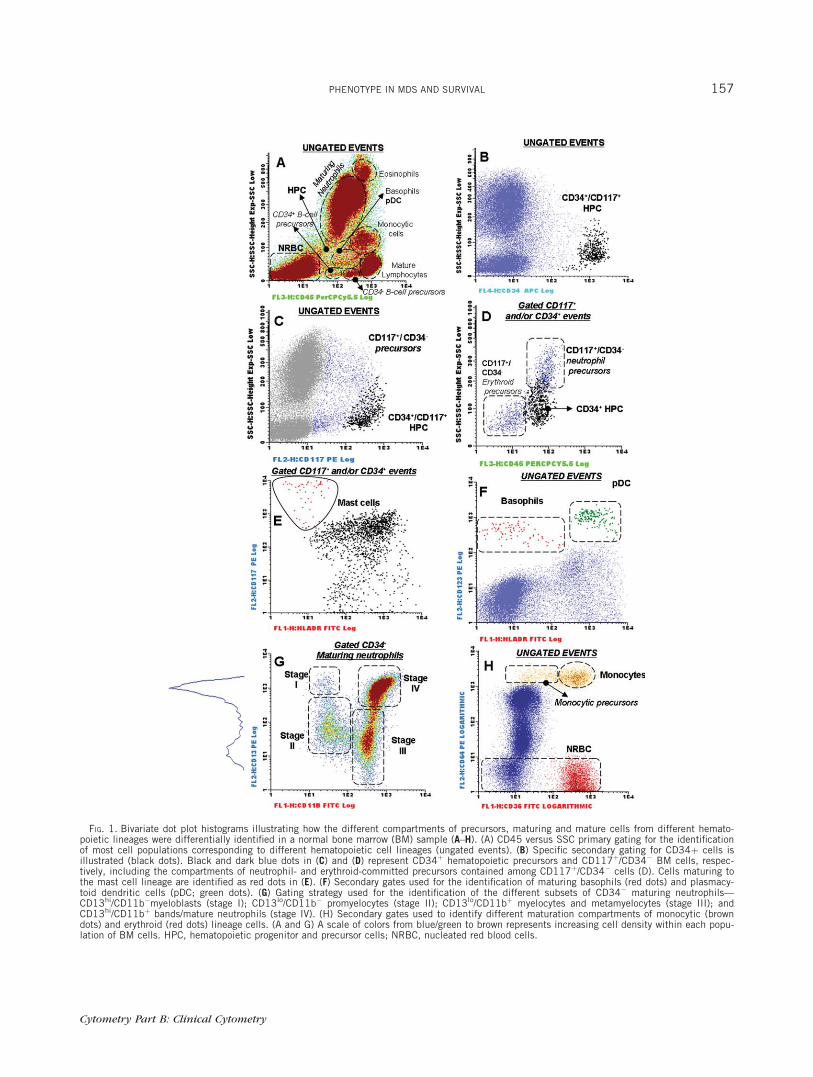
FIG. 1. Bivariate dot plot histograms illustrating how the different compartments of precursors, maturing and mature cells from different hemato-poietic lineages were differentially identified in a normal bone marrow (BM) sample (A–H). (A) CD45 versus SSC primary gating for the identificationof most cell populations corresponding to different hematopoietic cell lineages (ungated events). (B) Specific secondary gating for CD34þ cells isillustrated (black dots). Black and dark blue dots in (C) and (D) represent CD34þ hematopoietic precursors and CD117þ/CD34� BM cells, respec-tively, including the compartments of neutrophil- and erythroid-committed precursors contained among CD117þ/CD34� cells (D). Cells maturing tothe mast cell lineage are identified as red dots in (E). (F) Secondary gates used for the identification of maturing basophils (red dots) and plasmacy-toid dendritic cells (pDC; green dots). (G) Gating strategy used for the identification of the different subsets of CD34� maturing neutrophils—CD13hi/CD11b�myeloblasts (stage I); CD13lo/CD11b� promyelocytes (stage II); CD13lo/CD11bþ myelocytes and metamyelocytes (stage III); andCD13hi/CD11bþ bands/mature neutrophils (stage IV). (H) Secondary gates used to identify different maturation compartments of monocytic (browndots) and erythroid (red dots) lineage cells. (A and G) A scale of colors from blue/green to brown represents increasing cell density within each popu-lation of BM cells. HPC, hematopoietic progenitor and precursor cells; NRBC, nucleated red blood cells.
PHENOTYPE IN MDS AND SURVIVAL 157
Cytometry Part B: Clinical Cytometry
individual patients with MDS were phenotypically classi-fied as mild (score <10), intermediate (score �10 and<20), and severely altered (score �20).
Immunophenotypic Variables under Study
Up to 83 different immunophenotypic variables wereinvestigated in each case: (a) immature cell compart-ments: % of CD34þ, % of CD34�/CD117þ, % of CD34�/CD117þ neutrophil- and % of CD34�/CD117þ erythroid-committed precursors, % of CD34� B-cells and expres-sion (MFI) of CD19 and Cy-CD79a on the latter popula-tion; (b) maturing neutrophils: % of CD34� neutrophillineage cells and MFI of FSC, SSC, CD45, CD15, CD16,CyMPO, CD11b, CD13, CD33, CD64, CD65, % ofCD16hi, % of CD64hi and % of CD14þ and % of CD56þ
aberrant cells together with the % of neutrophil cells inthe maturation stages I, II, III and IV (see above) andMFI of CD45, SSC, CD11b and CD13 within each ofthese four neutrophil maturation stages; (c) monocyticmaturation: % of monocytic cells, % of monocytic pre-cursors (CD14�/int), % of mature (CD14hi) monocytesand MFI of FSC, SSC, CD14, CD36, CD45 and CD64within each of these subsets together with overall reac-tivity of monocytic cells for CD11b, CD13, CD15, CD33,CD65, CyMPO, HLA-DR, % of IREM-2þ cells togetherwith the % of CD2 and % of CD56 aberrant monocyticcells; (d) erythroid maturation: % of NRBC, % of aberrantCD36�/lo cells and MFI of CD71, CD235a and CD36 onNRBC compartment; (e) basophil and pDC: % of baso-phils, % of pDC and expression levels (MFI) of CD123on both groups of cells.
Conventional Karyotyping, FISH, and HUMARA Studies
Cytogenetic analysis of BM samples was performedaccording to standard procedures (32) and interpretedusing the International System for Cytogenetic Nomen-clature criteria (33). In addition, interphase FISH (iFISH)studies were systematically performed on each MDS BMsample, as previously reported (34). In these cases, thefollowing chromosome probes purchased from Vysis Inc(Downers Grove, IL) were systematically used in doublestainings for the detection of the most frequent recur-rent abnormalities: (1) LSI D5S23, D5S71 SpectrumGreen (SG)/LSI EGFR Spectrum Orange (SO) probe com-bination for chromosome 5; (2) LSI D7S486 (7q31) SO/CEP 7 SG probes for chromosome 7; (3) CEP 8 (D8Z2)SO/CEP Y (DYZ1) SG probes for chromosomes 8 and Y,respectively; (4) LSI D20S108 (20q12) SO probe forchromosome 20. Investigation of the pattern of inactiva-tion of chromosome X was analyzed in FACS-purifiedcells (please see above) as described elsewhere (35).
Statistical Methods
For all variables under study, their mean values andSD, median and range were calculated using the SPSSsoftware (SPSS 10.0, Chicago, IL). Comparisons betweentwo or more groups were made using the v2, for cate-gorical variables; for continuous variables, the Student t
(for parametric data) and either the Mann–Whitney U or
the Kruskal–Wallis tests (nonparametric data) wereused. Survival curves were plotted according to themethod of Kaplan and Meier (36), and the statistical sig-nificance of the differences observed in survival was cal-culated with the log-rank test. On the basis of thosevariables showing a significant impact on overall survivalin the univariate analysis, a multivariate Cox propor-tional-hazards model was constructed with those varia-bles showing independent predictive value; inclusion inthe final model was determined by a backward stepwiseprocess. P values <0.05 were considered to be associ-ated with statistical significance.
RESULTS
Immunophenotypic Features of BM Cell Populations inReactive BM Samples
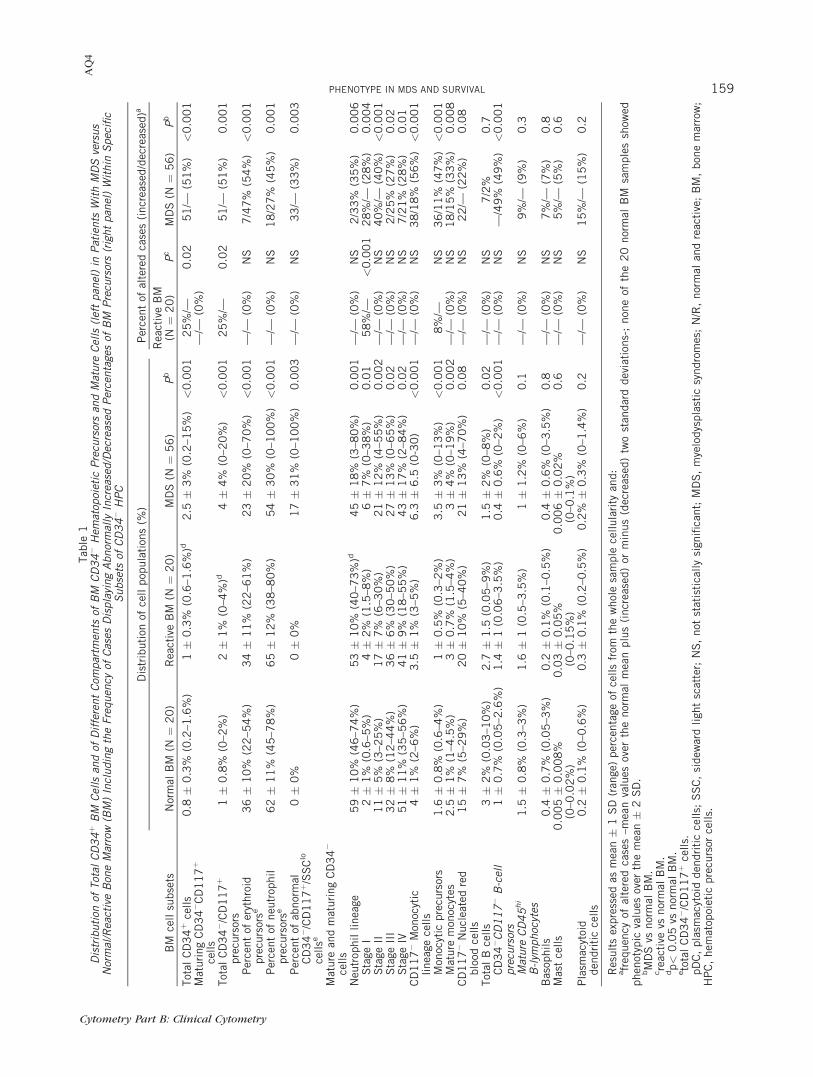
The analysis of reactive BM samples (n ¼ 20) revealedthe presence of increased numbers over the mean � 2SD of both CD34þ and CD34�/CD117þ cells (P ¼ 0.01)(Table 1) together with increased percentages ofCD13hi/CD11b� myeloblasts, stage I maturing neutrophilprecursors (P < 0.001; Table 1). Of note, a trend towardlower SSC characteristics and decreased expression ofCD13, CD15, CD11b in neutrophils and monocytic cellsand of CD71 and CD235a in NRBC precursors wasobserved among reactive BM samples but except forCD71 and CD11b (P � 0.05), differences did not reachstatistical significance. In turn, aberrant expression oflymphoid-associated markers was never detected (Tables1 and 2).
Distribution of Maturing BM Cell Compartments inPatients with MDS
Overall, increased percentages of BM CD34þ cells andof CD34�CD117þ maturing precursors were found inaround half of all patients with MDS (51% of the caseseach; P � 0.001); such increase in precursor cells wasassociated with the presence of phenotypically aberrantCD34�/CD117þ cells in 33% of cases (P ¼ 0.003) (Table1; Fig. 2). In addition, CD34�CD117þ neutrophil- anderythroid-committed precursors were also altered in 45%and 54% of all patients with MDS (P � 0.001), a highproportion of cases showing decreased numbers of bothcell subsets (27% and 47%, respectively; P � 0.001)(Table 1). Of note, this was associated with an overalldecreased percentage of maturing CD34� neutrophils in33% of the patients (P ¼ 0.006), but either normal orincreased (22% of cases) CD34�/CD117� maturingNRBC (P ¼ 0.08) (Table 1) particularly among RCMDpatients (P ¼ 0.01; data not shown). Interestingly,within the neutrophil compartment a maturation block-ade, reflected by increasing numbers of the more imma-ture CD34� neutrophil lineage cells (stages I and II; P �0.01) and decreased percentages of the two moremature subsets (stages III and IV; P � 0.02) wasdetected (Table 1). Moreover, the overall number of BMB-cells was also decreased among patients with MDS (P¼ 0.02), particularly among the more advanced stages of
158 MATARRAZ ET AL.
Cytometry Part B: Clinical Cytometry
Tab
le1
Distribution
ofTotal
CD34þBM
Cells
andof
DifferentCom
partm
ents
ofBM
CD34�Hem
atop
oietic
Precu
rsorsan
dMature
Cells
(leftpan
el)in
Patients
WithMDSversus
Normal/ReactiveBon
eMarrow(BM)IncludingtheFrequen
cyof
Cases
DisplayingAbnormally
Increased/Decreased
Percentagesof
BM
Precu
rsors(rightpan
el)Within
Specific
Subsets
ofCD34�HPC
BM
cell
subse
ts
Dis
trib
uti
onof
cell
pop
ula
tion
s(%
)P
erce
nt
ofal
tere
dca
ses
(incr
ease
d/d
ecre
ased
)a
Nor
mal
BM
(N¼
20
)R
eact
ive
BM
(N¼
20
)M
DS
(N¼
56
)P
bR
eact
ive
BM
(N¼
20
)P
cM
DS
(N¼
56
)P
b
Tot
alC
D3
4þ
cells
0.8
�0
.3%
(0.2
–1.6
%)
1�
0.3
%(0
.6–1
.6%
)d2
.5�
3%
(0.2
–15
%)
<0
.00
12
5%
/—0
.02
51
/—(5
1%
)<
0.0
01
Mat
uri
ng
CD
34�C
D1
17þ
cells
—/—
(0%
)
Tot
alC
D3
4�/C
D1
17þ
pre
curs
ors
1�
0.8
%(0
–2%
)2�
1%
(0–4
%)d
4�
4%
(0–2
0%
)<
0.0
01
25
%/—
0.0
25
1/—
(51
%)
0.0
01
Per
cent
ofer
ythro
idpre
curs
orse
36�
10
%(2
2–5
4%
)3
4�
11
%(2
2–6
1%
)2
3�
20
%(0
–70
%)
<0
.00
1—
/—(0
%)
NS
7/4
7%
(54
%)
<0
.00
1
Per
cent
ofneu
trop
hil
pre
curs
orse
62�
11
%(4
5–7
8%
)6
5�
12
%(3
8–8
0%
)5
4�
30
%(0
–10
0%
)<
0.0
01
—/—
(0%
)N
S1
8/2
7%
(45
%)
0.0
01
Per
cent
ofab
nor
mal
CD
34�/C
D1
17þ/S
SC
lo
cellse
0�
0%
0�
0%
17�
31
%(0
–10
0%
)0
.00
3—
/—(0
%)
NS
33
/—(3
3%
)0
.00
3
Mat
ure
and
mat
uri
ng
CD
34�
cells
Neu
trop
hil
linea
ge5
9�
10
%(4
6–7
4%
)5
3�
10
%(4
0–7
3%
)d4
5�
18
%(3
–80
%)
0.0
01
—/—
(0%
)N
S2
/33
%(3
5%
)0
.00
6S
tage
I2�
1%
(0.6
–5%
)4�
2%
(1.5
–8%
)6�
7%
(0–3
8%
)0
.01
58
%/—
<0
.00
12
8%
/—(2
8%
)0
.00
4S
tage
II1
1�
5%
(3–2
5%
)1
7�
7%
(6–3
0%
)2
1�
12
%(4
–55
%)
0.0
02
—/—
(0%
)N
S4
0%
/—(4
0%
)<
0.0
01
Sta
geII
I3
2�
8%
(12
–44
%)
36�
6%
(30
–50
%)
27�
13
%(0
–65
%)
0.0
2—
/—(0
%)
NS
2/2
5%
(27
%)
0.0
2S
tage
IV5
1�
11
%(3
5–5
6%
)4
1�
9%
(18
–55
%)
43�
17
%(2
–84
%)
0.0
2—
/—(0
%)
NS
7/2
1%
(28
%)
0.0
1C
D1
17�
Mon
ocyt
iclinea
gece
lls
4�
1%
(2–6
%)
3.5
�1
%(3
–5%
)6
.3�
6.5
(0-3
0)
<0
.00
1—
/—(0
%)
NS
38
/18
%(5
6%
)<
0.0
01
Mon
ocyt
icpre
curs
ors
1.6
�0
.8%
(0.6
–4%
)1�
0.5
%(0
.3–2
%)
3.5
�3
%(0
–13
%)
<0
.00
18
%/—
NS
36
/11
%(4
7%
)<
0.0
01
Mat
ure
mon
ocyt
es2
.5�
1%
(1–4
.5%
)3�
0.7
%(1
.5–4
%)
3�
4%
(0–1
9%
)0
.00
2—
/—(0
%)
NS
18
/15
%(3
3%
)0
.00
8C
D1
17�
Nucl
eate
dre
dblo
odce
lls
15�
7%
(5–2
9%
)2
0�
10
%(5
–40
%)
21�
13
%(4
–70
%)
0.0
8—
/—(0
%)
NS
22
/—(2
2%
)0
.08
Tot
alB
cells
3�
2%
(0.0
3–1
0%
)2
.7�
1.5
(0.0
5–9
%)
1.5
�2
%(0
–8%
)0
.02
—/—
(0%
)N
S7
/2%
0.7
CD
34�CD117�B-cell
precu
rsors
1�
0.7
%(0
.05
–2.6
%)
1.4
�1
(0.0
6–3
.5%
)0
.4�
0.6
%(0
–2%
)<
0.0
01
—/—
(0%
)N
S—
/49
%(4
9%
)<
0.0
01
Mature
CD45hi
B-lym
phocytes
1.5
�0
.8%
(0.3
–3%
)1
.6�
1(0
.5–3
.5%
)1�
1.2
%(0
–6%
)0
.1—
/—(0
%)
NS
9%
/—(9
%)
0.3
Bas
ophils
0.4
�0
.7%
(0.0
5–3
%)
0.2
�0
.1%
(0.1
–0.5
%)
0.4
�0
.6%
(0–3
.5%
)0
.8—
/—(0
%)
NS
7%
/—(7
%)
0.8
Mas
tce
lls
0.0
05�
0.0
08
%(0
–0.0
2%
)0
.03�
0.0
5%
(0–0
.15
%)
0.0
06�
0.0
2%
(0–0
.1%
)0
.6—
/—(0
%)
NS
5%
/—(5
%)
0.6
Pla
smac
ytoi
dden
dri
tic
cells
0.2
�0
.1%
(0–0
.6%
)0
.3�
0.1
%(0
.2–0
.5%
)0
.2%
�0
.3%
(0–1
.4%
)0
.2—
/—(0
%)
NS
15
%/—
(15
%)
0.2
Res
ult
sex
pre
ssed
asm
ean�
1S
D(r
ange
)per
centa
geof
cells
from
the
whol
esa
mple
cellula
rity
and:
afr
equen
cyof
alte
red
case
s–m
ean
valu
esov
erth
enor
mal
mea
nplu
s(i
ncr
ease
d)
orm
inus
(dec
reas
ed)
two
stan
dar
ddev
iati
ons-
;non
eof
the
20
nor
mal
BM
sam
ple
ssh
owed
phen
otyp
icva
lues
over
the
mea
n�
2S
D.
bM
DS
vsnor
mal
BM
.cre
acti
vevs
nor
mal
BM
.dp<
0.0
5vs
nor
mal
BM
.eto
tal
CD
34�/C
D1
17þ
cells.
pD
C,
pla
smac
ytoi
dden
dri
tic
cells;
SS
C,
sidew
ard
ligh
tsc
atte
r;N
S,
not
stat
isti
cally
sign
ifica
nt;
MD
S,
mye
lodys
pla
stic
syndro
mes
;N
/R,
nor
mal
and
reac
tive
;B
M,
bon
em
arro
w;
HP
C,
hem
atop
oiet
icpre
curs
orce
lls.
AQ4
Cytometry Part B: Clinical Cytometry
PHENOTYPE IN MDS AND SURVIVAL 159
Tab
le2
Phen
otypic
Characteristicsof
DifferentCom
partm
ents
ofCD34�Hem
atop
oietic
Precu
rsorsan
dMature
Cells
(leftpan
el)in
Patients
WithMDSversusNormal
andReactive
BM
IncludingtheFrequen
cyof
Cases
DisplayingAbnormally
Increased/Decreased
Expressionof
Individual
Antigens(rightpan
el)
Cel
lpop
ula
tion
san
dal
tere
dphen
otyp
icm
arke
rs
Imm
unop
hen
otyp
icch
arac
teri
stic
sP
erce
nt
ofal
tere
dca
ses
(incr
ease
d/d
ecre
ased
)a
Nor
mal
BM
(N¼
20
)R
eact
ive
BM
(N¼
20
)M
DS
(N¼
56
)P
bN
orm
alB
M(N
¼2
0)
Rea
ctiv
eB
M(N
¼2
0)
MD
S(N
¼5
6)
Pb
Mat
uri
ng
neu
trop
hils
FS
CM
I4
62�
80
(35
0–6
00
)4
50�
45
(40
0–5
00
)4
25�
11
0(1
90
–80
0)
0.0
2—
/—(0
%)
—/—
(0%
)—
/20
%(2
0%
)0
.03
SS
CM
I5
32�
10
0(2
70
–70
0)
29
5�
11
2(2
00
–60
0)
29
0�
14
0(1
10
–75
0)
<0
.00
1—
/-(0
%)
—/8
%—
/43
%(4
3%
)<
0.0
01
CD
45
MFI
16
5�
60
(70
–27
0)
14
4�
80
(50
–33
0)
20
0�
13
0(3
0–6
50
)0
.01
—/—
(0%
)—
/—(0
%)
21
%/2
%(2
3%
)0
.04
CD
11
bM
FI
45
0�
16
0(1
00
–72
0)
30
0�
15
0(9
0–5
50
)c3
30�
20
0(4
6–8
80
)0
.02
—/—
(0%
)—
/—(0
%)
4%
/2%
(6%
)0
.5C
D1
3M
FI
50
0�
23
0(2
50
–11
00
)4
00�
19
0(6
3–6
25
)3
70�
31
0(1
5–2
00
0)
0.0
05
—/—
(0%
)8
%/—
13
%/2
%(1
5%
)0
.7C
D3
3M
FI
16
0�
11
0(5
0–6
00
)1
10�
50
(30
–18
0)
13
5�
98
(25
–48
0)
0.0
2—
/—(0
%)
—/—
(0%
)7
%/1
3%
(20
%)
0.0
7C
D1
5M
FI
48
00�
20
00
(70
0–8
20
0)
38
00�
25
00
(95
0–8
40
0)
30
00�
20
00
(25
0–8
90
0)
0.0
06
—/—
(0%
)—
/—(0
%)
—/4
1%
(41
%)
0.0
06
CD
64
MFI
20
0�
60
(80
–30
0)
20
0�
90
(80
–40
0)
22
0�
20
0(1
0–1
00
0)
0.0
1—
/—(0
%)
16
%/—
18
%/1
4%
(32
%)
0.0
3C
D6
5M
FI
80
0�
40
0(1
80
–20
00
)7
50�
74
0(8
0–2
10
0)
46
5�
40
0(2
0–2
00
0)
0.0
05
—/—
(0%
)—
/16
%4
%/4
3%
(47
%)
0.0
6C
yMP
OM
FI
74
0�
44
0(2
00
–18
00
)6
30�
62
0(7
0–2
00
0)
72
0�
10
00
(26
–58
00
)0
.06
—/—
(0%
)—
/—(0
%)
9%
/39
%(4
8%
)0
.09
Per
cent
ofC
D1
6hice
lls
60�
10
%(5
0–8
8%
)5
0�
16
%(2
0–7
0%
)4
4�
22
%(1
–94
%)
0.0
08
—/—
(0%
)8
%/—
4%
/39
%(4
3%
)0
.00
8P
erce
nt
ofC
D6
4hice
lls
50�
10
%(2
0–6
5%
)5
5�
10
%(3
6–7
7%
)4
5�
30
%(0
–10
0%
)0
.00
7—
/—(0
%)
8%
/—1
4%
/27
%(4
1%
)0
.01
Per
cent
ofab
erra
nt
CD
56þ
cells
0�
0%
0�
0%
6�
10
%(0
–44
%)
0.0
01
—/—
(0%
)—
/—(0
%)
43
%/—
(43
%)
0.0
01
Per
cent
ofab
erra
nt
CD
14þ
cells
0�
0%
0�
0%
15�
23
%(0
–10
0%
)0
.00
1—
/—(0
%)
—/—
(0%
)4
1%
/—(4
1%
)0
.00
1
Mon
ocyt
iclinea
ge—
/—(0
%)
FS
CM
I3
80�
50
(29
0–4
60
)3
40�
80
(28
0–4
60
)3
60�
90
(22
0–6
00
)<
0.0
01
—/—
(0%
)—
/—(0
%)
—/2
0%
(20
%)
0.0
1S
SC
MI
30
0�
98
(10
0–5
00
)1
51�
82
(10
0–3
80
)1
50�
70
(60
–44
0)
<0
.00
1—
/—(0
%)
—/—
(0%
)—
/30
%(3
0%
)<
0.0
01
CD
11
bM
FI
45
0�
20
0(6
0–8
50
)3
00�
19
0(6
4–6
50
)c3
70�
27
0(3
5–1
30
0)
0.0
6—
/—(0
%)
—/—
(0%
)5
%/2
5%
(30
%)
0.5
CD
13
MFI
10
00�
60
0(1
90
–26
00
)8
00�
50
0(8
0–1
60
0)
78
0�
67
0(4
2–3
30
0)
0.0
3—
/—(0
%)
—/—
(0%
)5
%/3
4%
(39
%)
0.0
6C
D1
4M
FI
85
0�
45
0(3
00
–22
00
)7
50�
25
0(3
70
–11
0)
70
0�
54
0(1
00
–33
00
)0
.02
—/—
(0%
)—
/—(0
%)
—/2
0%
(20
%)
0.0
2C
D3
6M
FI
85
0�
17
0(5
00
–11
50
)6
40�
30
0(3
40
–13
00
)7
00�
30
0(9
0–1
30
0)
0.0
02
—/—
(0%
)—
/—(0
%)
10
%/2
1%
(31
%)
0.0
08
CD
64
MFI
14
00�
50
0(5
40
–25
00
)1
34
0�
40
0(5
00
–18
00
)1
20
0�
80
0(7
4–4
00
0)
0.0
09
—/—
(0%
)—
/—(0
%)
7%
/16
%(2
3%
)0
.03
Per
cent
ofIR
EM
-2þ
cells
60�
10
%(4
0–8
0%
)5
4�
8%
(50
–70
%)
50�
23
%(0
–10
0%
)0
.02
—/—
(0%
)—
/—(0
%)
4%
/18
%(2
2%
)0
.05
Per
cent
ofab
erra
nt
CD
56þ
cells
0�
0%
0�
0%
30�
34
%(0
–80
0%
)<
0.0
01
—/—
(0%
)—
/—(0
%)
48
%/—
(48
%)
<0
.00
1
Per
cent
ofab
erra
nt
CD
2þ
cells
0�
0%
0�
0%
35�
50
%(0
–10
0%
)0
.00
2—
/—(0
%)
—/—
(0%
)3
2%
/—(3
2%
)0
.00
2
Ery
thro
idlinea
ge—
/—(0
%)
CD
36
MFI
76
0�
16
0(5
40
–11
00
)6
70�
90
(50
0–8
00
)6
00�
33
0(1
50
–15
00
)<
0.0
01
—/—
(0%
)—
/—(0
%)
10
%/3
0%
(40
%)
0.0
01
Per
cent
ofab
erra
nt
CD
36
—/lo
cells
0�
0%
0�
0%
19�
20
%(0
–10
0%
)<
0.0
01
—/—
(0%
)—
/—(0
%)
71
%/—
(71
%)
<0
.00
1
CD
71
MFI
80
0�
34
0(2
60
–14
00
)4
25�
75
(34
0–5
60
)c5
20�
36
0(2
0–1
40
0)
0.0
05
—/—
(0%
)—
/—(0
%)
5%
/2%
(7%
)0
.8C
D2
35
aM
FI
11
00�
67
0(1
40
–26
00
)6
70�
18
0(5
00
–11
00
)8
00�
62
0(2
5–2
50
0)
0.0
5—
/—(0
%)
—/—
(0%
)7
%/—
(7%
)0
.6B
-cel
llinea
geC
y-C
D7
9a
MFI
onC
D3
4�
pre
curs
ors
21
0�
90
(10
0–4
40
)2
10�
16
0(9
–52
5)
18
0�
14
0(5
–62
0)
0.0
3—
/—(0
%)
—/—
(0%
)—
/19
(19
%)
0.0
3
Res
ult
sex
pre
ssed
asm
ean�
one
stan
dar
ddev
iati
on(a
nd
range
bet
wee
nbra
cket
s)or
as:
aper
centa
geof
alte
red
case
sw
ith
incr
ease
d/d
ecre
ased
(tot
alal
tere
d)
valu
es.
No
case
was
det
ecte
dsh
owin
gab
nor
mal
MFI
valu
esfo
rC
D1
6on
neu
trop
hils,
for
CD
45
,C
D1
5,
Cy-
MP
O,
HLA
-DR
,C
D6
5an
dC
D3
3on
mon
ocyt
icce
lls
and
for
CD
19
,cy
CD
3,
CD
12
3,
CD
61
and
7.1
mar
kers
for
any
ofth
eB
Mce
llco
mpar
tmen
tsan
alyz
ed.
MFI,
mea
nfluor
es-
cence
inte
nsi
ty(a
rbit
rary
fluor
esce
nce
unit
ssc
aled
from
0to
10
4);
MI,
mea
nin
tensi
ty(a
rbit
rary
unit
ssc
aled
from
0to
10
23
);B
M,
bon
em
arro
w;
MD
S,
mye
lodys
pla
stic
syndro
me.
bM
DS
vsnor
mal
BM
.cP<
0.0
5vs
nor
mal
BM
.
160 MATARRAZ ET AL.
Cytometry Part B: Clinical Cytometry
the disease—INT-1, INT-2 and patients with HIGH MDS(P ¼ 0.01; data not shown). This was associated withdecreased numbers of CD34� B-cell precursors detectedin around half of all patients with MDS (49%; P < 0.001)(Table 1). Notably, maturing CD34�/CD117� monocyticBM cells were frequently altered (56%), 38% of all MDScases showing increased numbers of these cells associ-ated with an abnormally high monocytic precursor/mature monocyte ratio, particularly among RAEB-2 andINT-2-R patients (P � 0.001) (Table 1; Fig. 3).
In contrast, no significant differences were detectedas regards the distribution of mature B-lymphocytes,basophil-, mast cell-, and pDC-lineage cells in MDS ver-sus normal BM (Table 1).
Immunophenotypic Features of BM Cell Populations inPatients with MDS
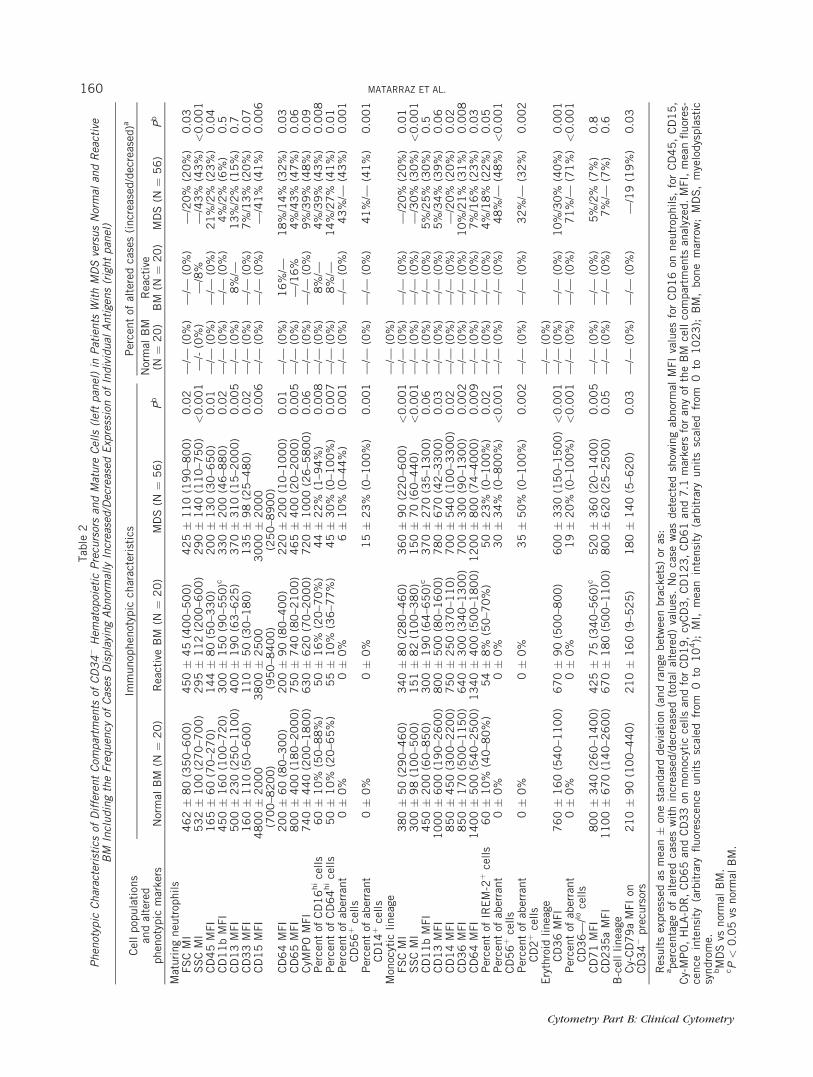
In addition to the numerical abnormalities describedabove, multiple phenotypic changes were detected inthe different compartments of maturing BM cells inpatients with MDS (Table 2). Accordingly, maturing neu-trophils showed decreased light scatter characteristics inaround half of all MDS patients (SSC: 43%, P < 0.001and; FSC: 20%, P ¼ 0.03). Of note, the most relevantphenotypic alterations detected in this cell compart-ment—maturing neutrophils—included abnormally lowreactivity for CD15, CD65, and CyMPO observed inbetween 39% and 43% of all patients with MDS (P �0.09), together with decreased numbers of CD16hi
maturing neutrophils (39% of all patients with MDS; P ¼0.008) (Table 2). In turn, increased numbers of maturing
neutrophils aberrantly expressing CD56 (43%) and/orCD14 (41%) were also frequently detected in patientswith MDS (P ¼ 0.001), whereas increased levels of
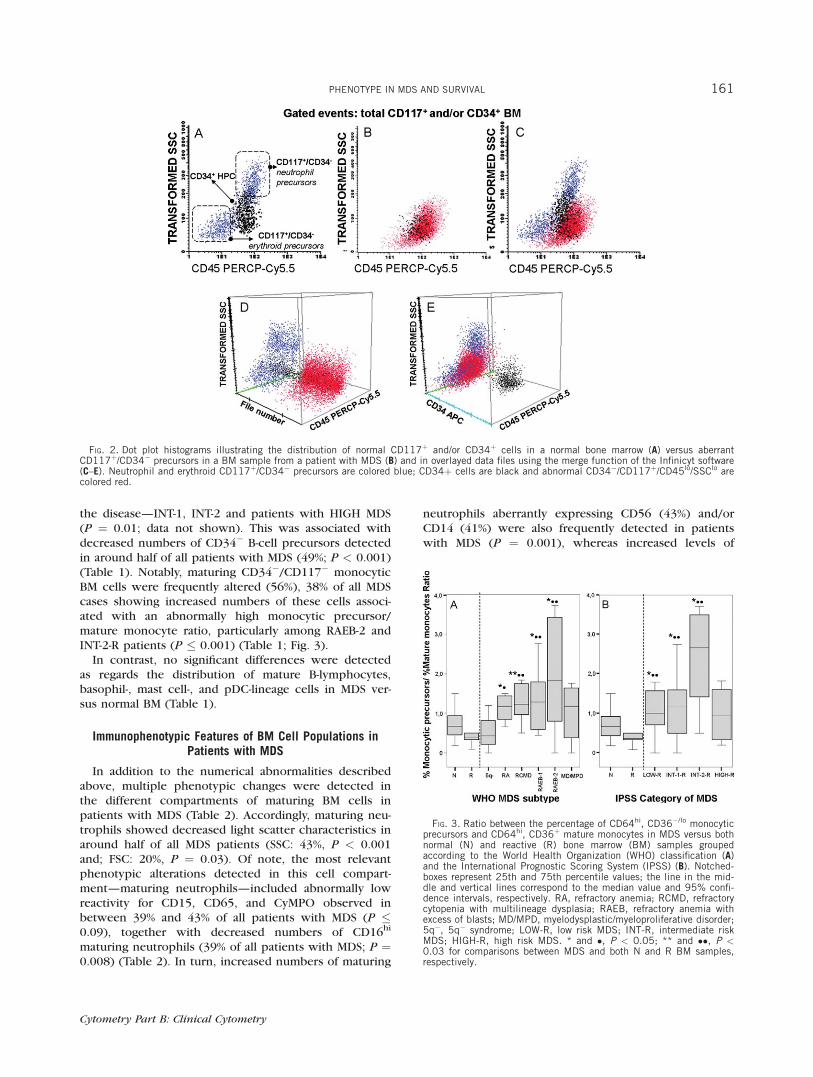
FIG. 2. Dot plot histograms illustrating the distribution of normal CD117þ and/or CD34þ cells in a normal bone marrow (A) versus aberrantCD117þ/CD34� precursors in a BM sample from a patient with MDS (B) and in overlayed data files using the merge function of the Infinicyt software(C–E). Neutrophil and erythroid CD117þ/CD34� precursors are colored blue; CD34þ cells are black and abnormal CD34�/CD117þ/CD45lo/SSClo arecolored red.
FIG. 3. Ratio between the percentage of CD64hi, CD36�/lo monocyticprecursors and CD64hi, CD36þ mature monocytes in MDS versus bothnormal (N) and reactive (R) bone marrow (BM) samples groupedaccording to the World Health Organization (WHO) classification (A)and the International Prognostic Scoring System (IPSS) (B). Notched-boxes represent 25th and 75th percentile values; the line in the mid-dle and vertical lines correspond to the median value and 95% confi-dence intervals, respectively. RA, refractory anemia; RCMD, refractorycytopenia with multilineage dysplasia; RAEB, refractory anemia withexcess of blasts; MD/MPD, myelodysplastic/myeloproliferative disorder;5q�, 5q� syndrome; LOW-R, low risk MDS; INT-R, intermediate riskMDS; HIGH-R, high risk MDS. * and �, P < 0.05; ** and ��, P <0.03 for comparisons between MDS and both N and R BM samples,respectively.
PHENOTYPE IN MDS AND SURVIVAL 161
Cytometry Part B: Clinical Cytometry
Tab
le3
Enumerationof
Immunop
hen
otypic
Alterationsan
dFlowCytom
etry
Immunop
hen
otypic
Scoresin
Normal/Rea
ctive(N
/R)Bon
eMarrow(BM)versusMDSPatients
Grouped
Accordingto
theWorld
HealthOrgan
ization(W
HO)Classification
andtheInternational
Progn
osticScoringSystem
(IPSS)
BM
cell
com
par
tmen
t(N
o.phen
otyp
icpar
amet
ers
anal
yzed
per
BM
sam
ple
)
WH
Osu
bty
pe
IPS
Sca
tego
ry
Inte
rmed
iate
risk
Nor
mal
BM
(N¼
20
)
Rea
ctiv
eB
M(N
¼2
0)
5q�
(N¼
3)
RA
(N¼
9)
RC
MD
(N¼
10
)R
AE
B-1
(N¼
10
)R
AE
B-2
(N¼
13
)M
D/M
PD
(N¼
11
)Tot
alM
DS
(N¼
56
)Low
risk
(N¼
14
)IN
T-1
(N¼
23
)IN
T-2
(N¼
11
)H
IGH
risk
(N¼
4)
Imm
ature
cell
com
par
tmen
ts(n
¼7
)
0�
00
.09�
0.3
(0–1
)1
.6�
1.5
(0–3
)1
.8�
1.2
(0–4
)1
.5�
1(0
–4)
3.6
�1
.5(1
–6)
5�
1(4
–7)
3�
1(1
–4)
3�
2(0
–7)
1.7
�1
.4(0
–4)
2.5
�1
.5(0
–5)
5�
1(3
–7)
4.5
�1
(3–5
)
Neu
trop
hil
mat
ura
tion
(n¼
36
)0�
00
.6�
1.4
(0–4
)9�
0.6
(9–1
0)
6�
3.5
(3–2
)7�
5(2
–19
)8
.5�
5(2
–16
)1
3�
4(5
–18
)9�
4(4
–15
)9�
5(0
–19
)7�
3(0
–12
)9�
5(2
–19
)1
2�
4(5
–18
)1
2�
4(8
–17
)M
onoc
ytic
mat
ura
tion
(n¼
31
)0�
00
.09�
0.2
(0–1
)5�
2(4
–7)
3�
2(0
–7)
3.3
�1
(2–6
)5�
3(2
–11
)5
.5�
2(2
–9)
6�
1(3
–8)
5�
2(0
–11
)4�
2(0
–7)
5�
2.5
(2–1
1)
5�
2(2
–8)
7�
3(2
–9)
Ery
thro
idm
atura
tion
(n¼
5)
0�
00�
02
.6�
2.3
(0–4
)1
.3�
1(0
–3)
2�
1.5
(0–5
)2�
1(0
–4)
3.5
�1
(1–5
)2�
1(0
–4)
2�
1(0
–5)
2�
1.5
(0–4
)2
.3�
1(0
–5)
3�
1(1
–5)
3�
0.5
(2–3
)B
asop
hil,
MC
and
pD
Cm
atura
tion
(n¼
4)
0�
00�
01
.6�
1.5
(0–3
)0
.2�
0.4
(0–1
)0
.2�
0.4
(0–1
)1�
0.9
(0–3
)0
.7�
0.7
(0–2
)1
.4�
1(0
–3)
0.7
�0
.9(0
–3)
0.7
�0
.9(0
–3)
1�
1(0
–3)
0.5
�0
.5(0
–1)
0.7
�1
(0–2
)
Tot
al (n¼
83
)0�
00
.5�
1.1
(0–3
)2
0�
0.3
(17
–23
)1
2�
5(3
–20
)1
4.5
�6
(8–2
0)
20�
7(1
0–3
0)
28�
4(2
3–3
4)
20�
6(1
3–3
0)
20�
7.5
(3–3
4)
15�
6.5
(3–2
7)
20�
7(1
0–3
2)
26�
4(1
8–3
3)
26
.5�
5(2
3–3
4)
SC
OR
Ea
0to
1.5
10
0%
10
0%
——
——
——
0—
——
—2
to9
.5—
——
7(7
8%
)5
(50
%)
3(3
0%
)—
1(9
%)
12
%7
(50
%)
6(2
6%
)—
—
�1
0—
—3
(10
0%
)2
(22
%)
5(5
0%
)7
(70
%)
13
(10
0%
)1
0(9
1%
)3
9%
7(5
0%
)1
7(7
0%
)1
1(1
00
%)
4(1
00
%)
Ove
rall
scor
e0�
00
.6�
0.6
(0–1
.5)
16�
1(1
5–1
7.5
)8�
4(2
.5–1
5)
10�
5(5
–20
)1
6�
6(8
–25
)2
6�
5(1
8–4
0)
17�
5(1
0–2
4)
16�
8(2
.5–4
0)
11�
6(2
.5–2
3)
16�
7(5
.5–3
3)
23�
3.5
(16
–28
)2
8.5
�8
(24
–40
)
Res
ult
sex
pre
ssed
asm
ean�
1S
Dan
dra
nge
bet
wee
nbra
cket
sor
as:
anum
ber
ofca
ses
and
per
centa
gebet
wee
nbra
cket
s.A
scor
eof
0.5
,1
or2
was
give
nw
hen
the
valu
eob
tain
edfo
rea
chof
the
par
amet
ers
inth
eupper
pan
elw
asbet
wee
nth
em
ean�
2S
Dan
dth
em
ean�
3S
D,
itw
asbet
wee
nth
em
ean�
3S
Dan
dth
em
ean�
4S
Dan
dov
erth
em
ean�
4S
Dof
the
valu
esfo
und
for
that
par
amet
eram
ong
all
nor
mal
BM
sam
ple
san
alyz
ed,
resp
ecti
vely
.M
ean
and
SD
valu
esw
ere
calc
ula
ted
usi
ng
SP
SS
soft
war
e(S
PS
S1
0.0
,C
hic
ago,
IL).
n,
num
ber
ofpar
amet
ers
anal
yzed
per
indiv
idual
incl
udin
g:a)
imm
ature
cell
com
par
tmen
ts(%
ofto
tal
CD
34þ,
ofto
tal
CD
34�/C
D1
17þ,
ofC
D3
4�/C
D1
17þ
neu
trop
hil-
and
eryt
hro
id-c
omm
itte
dpre
curs
ors,
%of
CD
34�
Bce
lls
and
expre
ssio
nof
CD
19
and
Cy-
CD
79
a),
b)
neu
trop
hil
mat
ura
tion
(%of
tota
lneu
trop
hil
linea
gece
lls
and
expre
ssio
nof
FS
C,
SS
C,
CD
45
,C
D1
5,
CD
16
,C
yMP
O,
CD
11
b,
CD
13
,C
D3
3,
CD
64
,C
D6
5,
%of
CD
16
hi ,
CD
64
hian
dof
CD
14þ
and
CD
56þ
aber
rant
cells,
%of
neu
trop
hil
mat
ura
tion
stag
esI–
IVan
dex
pre
ssio
nof
CD
45
,S
SC
,C
D1
1b
and
CD
13
),c)
mon
ocyt
icm
atura
-ti
on(%
ofto
tal
mon
ocyt
iclinea
gece
lls,
mon
obla
sts,
mat
ure
mon
ocyt
esan
dex
pre
ssio
nof
FS
C,
SS
C,
CD
14
,C
D3
6,
CD
45
and
CD
64
,to
tal
mon
ocyt
icC
D1
1b,
CD
13
,C
D1
5,
CD
33
,C
D6
5,
CyM
PO
,H
LA
-DR
,%
ofIR
EM
-2þ
cells
and
aber
rant
expre
ssio
nof
CD
2an
dC
D5
6),
d)
eryt
hro
idm
atura
tion
(%re
dblo
odce
lls,
expre
ssio
nof
CD
71
,C
D2
35
a,C
D3
6an
d%
ofab
erra
nt
CD
36�
/lo
cells)
and,
e)bas
ophil,
MC
and
pD
Cm
atura
tion
(%of
cells
and
expre
ssio
nof
CD
12
3).
162 MATARRAZ ET AL.
Cytometry Part B: Clinical Cytometry
CD45 were found in 21% of the cases (P ¼ 0.04) (Table2). Overall reactivity for CD11b and CD13 was alsofound to be decreased among patients with MDS (P �0.02) (Table 2).
Regarding BM monocytic lineage cells, the most fre-quently altered phenotypes consisted of decreased SSC(P < 0.001) and decreased reactivity for CD13, CD14,CD36, and CD64 detected in between 16% and 34% ofall MDS cases (P � 0.06); in addition, abnormally lowpercentages of mature monocytes (as reflected by alower proportion of IREM-2þ cells) were identified in18% of the cases (P ¼ 0.05) (Table 2). In addition,monocytic lineage cells from patients with MDS also dis-played aberrant expression of the CD56 and/or CD2lymphoid-associated antigens in 48% and 32% of thecases, respectively (P � 0.01; Table 2). NRBC also exhib-ited altered phenotypic profiles, which mainly consistedof decreased reactivity for CD36 found in up to 71% ofall MDS patients (P < 0.001) and for CD71 and CD235a(P � 0.05) (Table 2). Of note, abnormally low levels ofCyCD79a among CD34� B-cell precursors were found in19% of all patients with MDS (P ¼ 0.03; Table 2).
IS and its Relationship with the IPSS and WHO Subtypesof MDS and other Disease Features
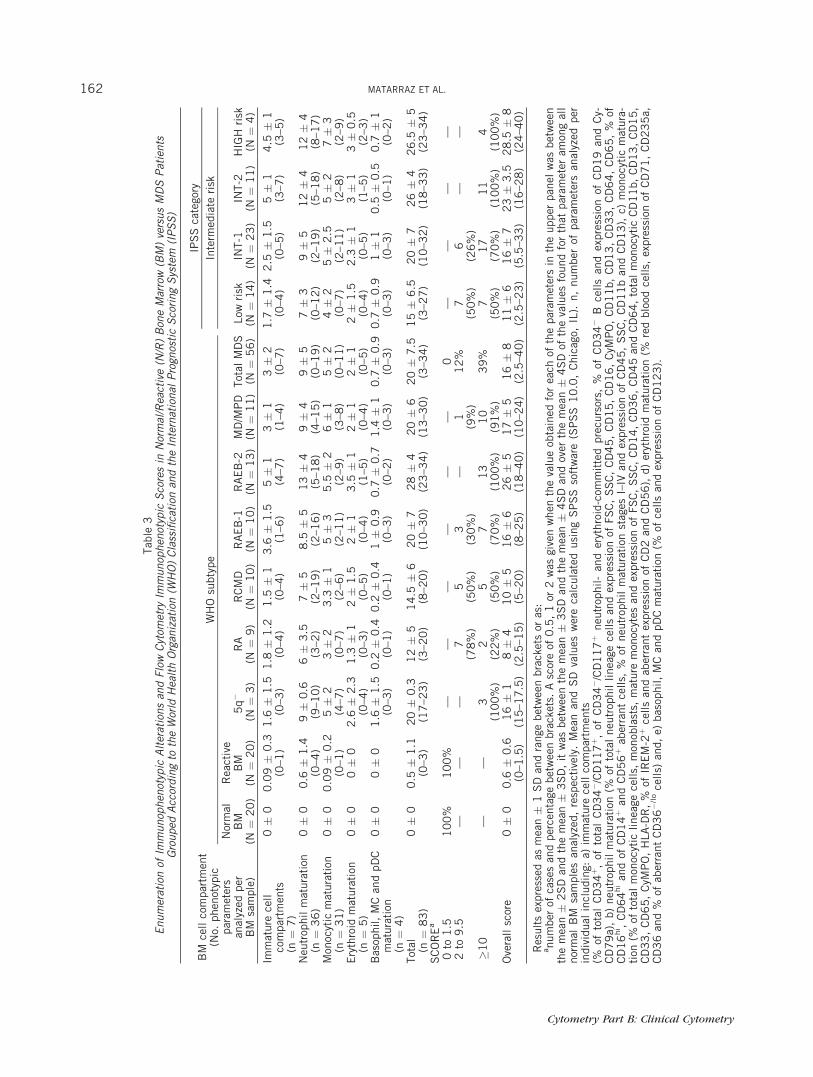
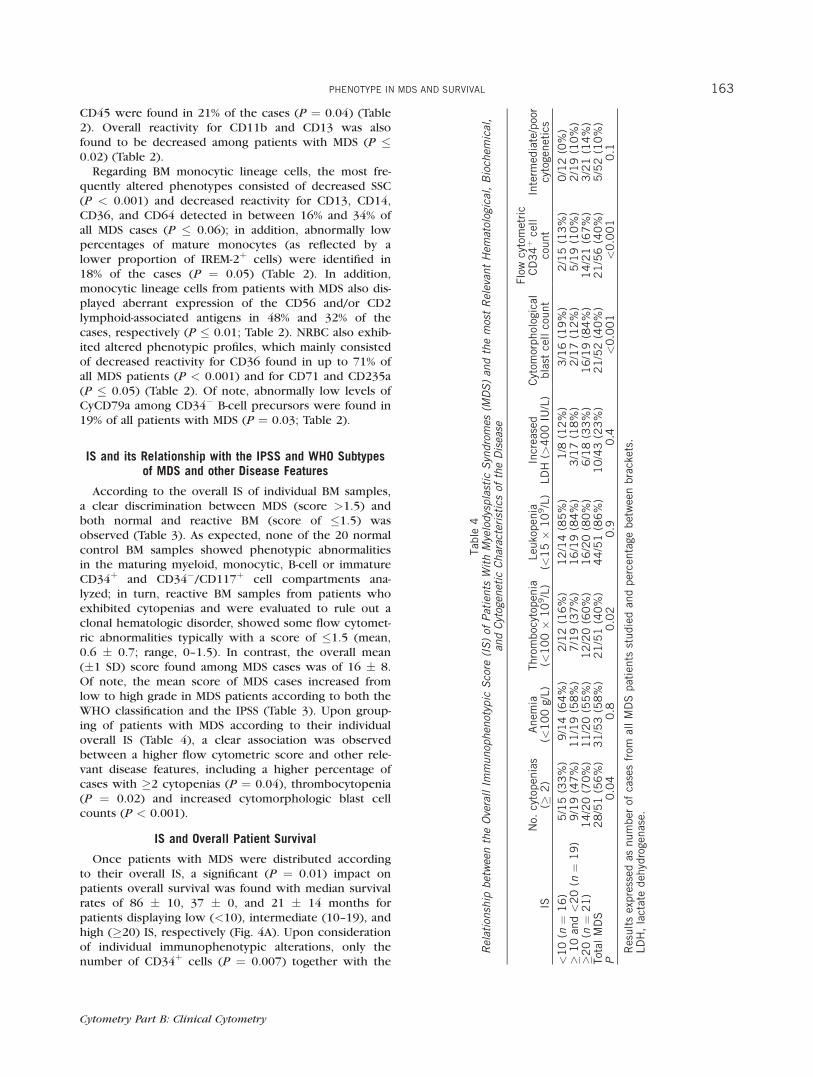
According to the overall IS of individual BM samples,a clear discrimination between MDS (score >1.5) andboth normal and reactive BM (score of �1.5) wasobserved (Table 3). As expected, none of the 20 normalcontrol BM samples showed phenotypic abnormalitiesin the maturing myeloid, monocytic, B-cell or immatureCD34þ and CD34�/CD117þ cell compartments ana-lyzed; in turn, reactive BM samples from patients whoexhibited cytopenias and were evaluated to rule out aclonal hematologic disorder, showed some flow cytomet-ric abnormalities typically with a score of �1.5 (mean,0.6 � 0.7; range, 0–1.5). In contrast, the overall mean(�1 SD) score found among MDS cases was of 16 � 8.Of note, the mean score of MDS cases increased fromlow to high grade in MDS patients according to both theWHO classification and the IPSS (Table 3). Upon group-ing of patients with MDS according to their individualoverall IS (Table 4), a clear association was observedbetween a higher flow cytometric score and other rele-vant disease features, including a higher percentage ofcases with �2 cytopenias (P ¼ 0.04), thrombocytopenia(P ¼ 0.02) and increased cytomorphologic blast cellcounts (P < 0.001).
IS and Overall Patient Survival
Once patients with MDS were distributed accordingto their overall IS, a significant (P ¼ 0.01) impact onpatients overall survival was found with median survivalrates of 86 � 10, 37 � 0, and 21 � 14 months forpatients displaying low (<10), intermediate (10–19), andhigh (�20) IS, respectively (Fig. 4A). Upon considerationof individual immunophenotypic alterations, only thenumber of CD34þ cells (P ¼ 0.007) together with the
Tab
le4
Relationship
betweentheOverallIm
munop
hen
otypic
Score
(IS)of
Patients
WithMyelodysplastic
Syndromes
(MDS)an
dthemostRelevan
tHem
atological,Bioch
emical,
andCytogen
etic
Characteristicsof
theDisease
ISN
o.cy
topen
ias
(�2
)A
nem
ia(<
10
0g/
L)
Thro
mboc
ytop
enia
(<1
00�
10
9/L
)Leu
kopen
ia(<
15�
10
9/L
)In
crea
sed
LD
H(>
40
0IU
/L)
Cyt
omor
phol
ogic
albla
stce
llco
unt
Flo
wcy
tom
etri
cC
D3
4þ
cell
count
Inte
rmed
iate
/poo
rcy
toge
net
ics
<1
0(n
¼1
6)
5/1
5(3
3%
)9
/14
(64
%)
2/1
2(1
6%
)1
2/1
4(8
5%
)1
/8(1
2%
)3
/16
(19
%)
2/1
5(1
3%
)0
/12
(0%
)�
10
and<
20
(n¼
19
)9
/19
(47
%)
11
/19
(58
%)
7/1
9(3
7%
)1
6/1
9(8
4%
)3
/17
(18
%)
2/1
7(1
2%
)5
/19
(10
%)
2/1
9(1
0%
)�
20
(n¼
21
)1
4/2
0(7
0%
)1
1/2
0(5
5%
)1
2/2
0(6
0%
)1
6/2
0(8
0%
)6
/18
(33
%)
16
/19
(84
%)
14
/21
(67
%)
3/2
1(1
4%
)Tot
alM
DS
28
/51
(56
%)
31
/53
(58
%)
21
/51
(40
%)
44
/51
(86
%)
10
/43
(23
%)
21
/52
(40
%)
21
/56
(40
%)
5/5
2(1
0%
)P
0.0
40
.80
.02
0.9
0.4
<0
.00
1<
0.0
01
0.1
Res
ult
sex
pre
ssed
asnum
ber
ofca
ses
from
all
MD
Spat
ients
studie
dan
dper
centa
gebet
wee
nbra
cket
s.LD
H,
lact
ate
deh
ydro
genas
e.
PHENOTYPE IN MDS AND SURVIVAL 163
Cytometry Part B: Clinical Cytometry
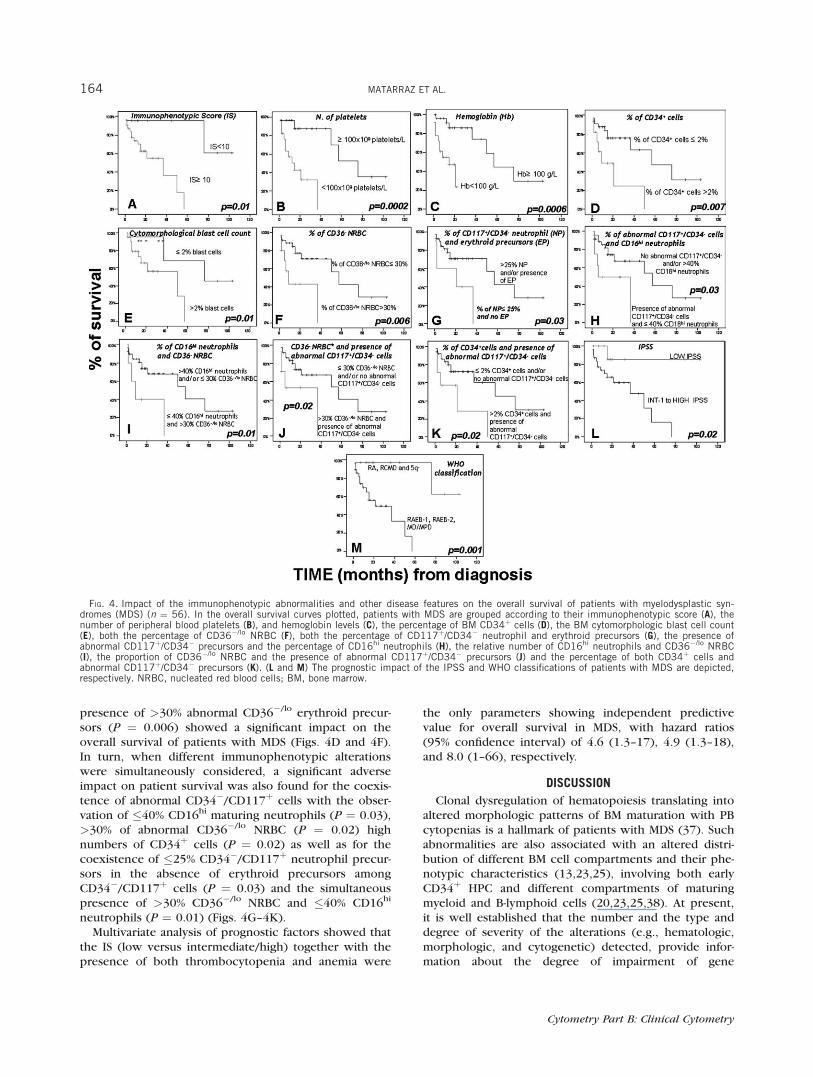
presence of >30% abnormal CD36�/lo erythroid precur-sors (P ¼ 0.006) showed a significant impact on theoverall survival of patients with MDS (Figs. 4D and 4F).In turn, when different immunophenotypic alterationswere simultaneously considered, a significant adverseimpact on patient survival was also found for the coexis-tence of abnormal CD34�/CD117þ cells with the obser-vation of �40% CD16hi maturing neutrophils (P ¼ 0.03),>30% of abnormal CD36�/lo NRBC (P ¼ 0.02) highnumbers of CD34þ cells (P ¼ 0.02) as well as for thecoexistence of �25% CD34�/CD117þ neutrophil precur-sors in the absence of erythroid precursors amongCD34�/CD117þ cells (P ¼ 0.03) and the simultaneouspresence of >30% CD36�/lo NRBC and �40% CD16hi
neutrophils (P ¼ 0.01) (Figs. 4G–4K).Multivariate analysis of prognostic factors showed that
the IS (low versus intermediate/high) together with thepresence of both thrombocytopenia and anemia were
the only parameters showing independent predictivevalue for overall survival in MDS, with hazard ratios(95% confidence interval) of 4.6 (1.3–17), 4.9 (1.3–18),and 8.0 (1–66), respectively.
DISCUSSION
Clonal dysregulation of hematopoiesis translating intoaltered morphologic patterns of BM maturation with PBcytopenias is a hallmark of patients with MDS (37). Suchabnormalities are also associated with an altered distri-bution of different BM cell compartments and their phe-notypic characteristics (13,23,25), involving both earlyCD34þ HPC and different compartments of maturingmyeloid and B-lymphoid cells (20,23,25,38). At present,it is well established that the number and the type anddegree of severity of the alterations (e.g., hematologic,morphologic, and cytogenetic) detected, provide infor-mation about the degree of impairment of gene
FIG. 4. Impact of the immunophenotypic abnormalities and other disease features on the overall survival of patients with myelodysplastic syn-dromes (MDS) (n ¼ 56). In the overall survival curves plotted, patients with MDS are grouped according to their immunophenotypic score (A), thenumber of peripheral blood platelets (B), and hemoglobin levels (C), the percentage of BM CD34þ cells (D), the BM cytomorphologic blast cell count(E), both the percentage of CD36�/lo NRBC (F), both the percentage of CD117þ/CD34� neutrophil and erythroid precursors (G), the presence ofabnormal CD117þ/CD34� precursors and the percentage of CD16hi neutrophils (H), the relative number of CD16hi neutrophils and CD36�/lo NRBC(I), the proportion of CD36�/lo NRBC and the presence of abnormal CD117þ/CD34� precursors (J) and the percentage of both CD34þ cells andabnormal CD117þ/CD34� precursors (K). (L and M) The prognostic impact of the IPSS and WHO classifications of patients with MDS are depicted,respectively. NRBC, nucleated red blood cells; BM, bone marrow.
164 MATARRAZ ET AL.
Cytometry Part B: Clinical Cytometry
expression and deviation from normal, with a clearimpact on patient outcome; in turn, the exact value ofimmunophenotyping remains to be more preciselyestablished (13,20,23,25,38,39).
To the best of our knowledge, this is the first reportin which numerical abnormalities and aberrant immuno-phenotypic features present in different compartmentsof both major and minor subsets of maturing/matureneutrophil, erythroid, monocytic, mast cell, pDC, baso-phil and B-lymphoid BM cells, are simultaneouslyassessed in MDS versus both normal and reactive (cyto-penic) BM, where each abnormality is scored accordingto its degree of deviation from normal BM patterns. Innormal BM, all parameters analyzed showed a distribu-tion close to normal; thus, the use of the mean plus twoSD as the cut-off for normal reference ranges for allimmunophenotypic variables is statistically robustenough for reproducibility. Objective calculation of suchdeviation based on individual parameters may improvethe evaluation of the degree of severity of the pheno-typic changes observed in patients with MDS, whileexpert-based interpretation of the patterns of expressionof multiple antigens—relationship between two or moreantigens—although equally informative, might be moresubjective and equivocal (40). Because of this, in thepresent study we attempt to reduce complex immuno-phenotypic profiles into objective numbers that reflectthe distribution of specific cell compartments in the BMand their phenotypic features, evaluated in terms of MFIlevels detected for individual markers. Overall, ourresults confirm and extend on previous observations,which indicate that based on the number and severity ofthe immunophenotypic abnormalities detected, MDScould be clearly discriminated from both normal and re-active BM; as expected (16,38,41), a highly heterogene-ous spectrum of immunophenotypic abnormalities andmaturational blockades within different compartmentsof maturing myeloid and B-lymphoid cells was observedamong patients with MDS. Of note, several of the phe-notypic alterations identified in MDS (e.g., increasednumbers of CD34þ HPC and CD11b�/CD13hi neutrophilprecursors), were also detected in BM cells frompatients suffering from non-clonal cytopenias and dis-ease conditions other than MDS, in line with previousobservations (13,16,20); however, in such cases, anoverall lower number of milder alterations was detected,typically leading to lower IS (�1.5). Overall, theseresults are in line with those previously reported in theliterature in which the analysis of BM cells was re-stricted to CD34þ cells and/or the major compartmentsof both neutrophil and monocytic precursors (13,16),suggesting that immunophenotyping could improve thediagnostic efficiency of other conventional diagnosticcriteria (38). In line with previous studies (40), ourresults confirm that MDS recurrently show an alteredgranularity (SSC) for maturing neutrophils (11) andmonocytic cells (13), together with abnormal expressionof CD45 (18), CD64 (16), CD56 (13), CD11b/CD13 (20)and asynchronous shift to the left (18) among maturing
neutrophils as well as altered expression of CD13 (16),CD36, CD2 and CD56 on monocytic cells(13,16,19,20,39).
Interestingly, our results also showed a progressiveincrease in the number and severity of the immunophe-notypic abnormalities detected -as reflected by anincreasing IS-, from low to high grade MDS. Amongother parameters, those appearing to be increasinglyaltered among high vs low grade patients included thenumber of CD34þ HPC and CD34�/CD117þ precursorsdisplaying an aberrant phenotype; in contrast, the num-ber of CD34�/CD117þ precursor cells showing matura-tion commitment towards the neutrophil and/orerythroid lineages, progressively decreased. Such pro-gressive expansion of immature CD34þ and CD34�/CD117þ aberrant cells was also associated withdecreased percentages of CD34� B-cell precursors andboth CD34� maturing neutrophils and monocytes,which appeared to be blocked at intermediate stages ofmaturation. In contrast, increased numbers of NRBCwere detected only among low-risk MDS (RCMD and5q� syndrome; P ¼ 0.01), whereas mature B-lympho-cytes, basophils, mast cells and pDC remained at normallevels. Altogether, these findings are in agreement withthose previously reported on MDS by others and ourown group, based on both morphologic (15) and immu-nophenotypic (40) analyses regarding the phenotypicprofiles of different major compartments of BM cells andCD34þ HPC. Interestingly, in these studies an increasein the more immature compartment of CD34þ HPC isassociated with decreased numbers of CD34þ B-, neutro-phil-, pDC-, basophil- and erythroid-lineage precursorcells, except for low-grade MDS cases, where a shifttowards production of CD34þ neutrophil and erythroidlineage cells (both essential for patient survival), wasdetected at the expense of B-cell and pDC precursors.
Of note, among low-grade MDS, very similar profilesand IS were found in RA versus RCMD, suggesting theexistence of multilineage involvement in both patientgroups. In line with this, previous studies have alsoshown occurrence of inappropriate expression oflymphoid-associated markers among immature myeloidprecursors at similar frequencies, in RA and RCMDpatients (20). Altogether, these results suggest thatoccurrence of phenotypic aberrancies among maturingmyelomonocytic cells, might not always translate intoclearly altered morphologic features and that, the use ofimmunophenotyping in addition to cytomorphology,may contribute to a more robust discrimination betweenRCMD and pure RA with unilineage dysplasia, as alsopointed out by other groups (20,40).
Despite the fact that increasingly pronounced matura-tional defects are detected among the earliest compart-ments of CD34þ BM precursors from high- vs low- gradeMDS (25), these might also involve the CD34� compart-ments of maturing neutrophil and monocytic cells(13,16). In line with this, CD34� maturing neutrophilsfrom most patients with MDS showed a trend to retainan abnormally immature, altered phenotype.
PHENOTYPE IN MDS AND SURVIVAL 165
Cytometry Part B: Clinical Cytometry
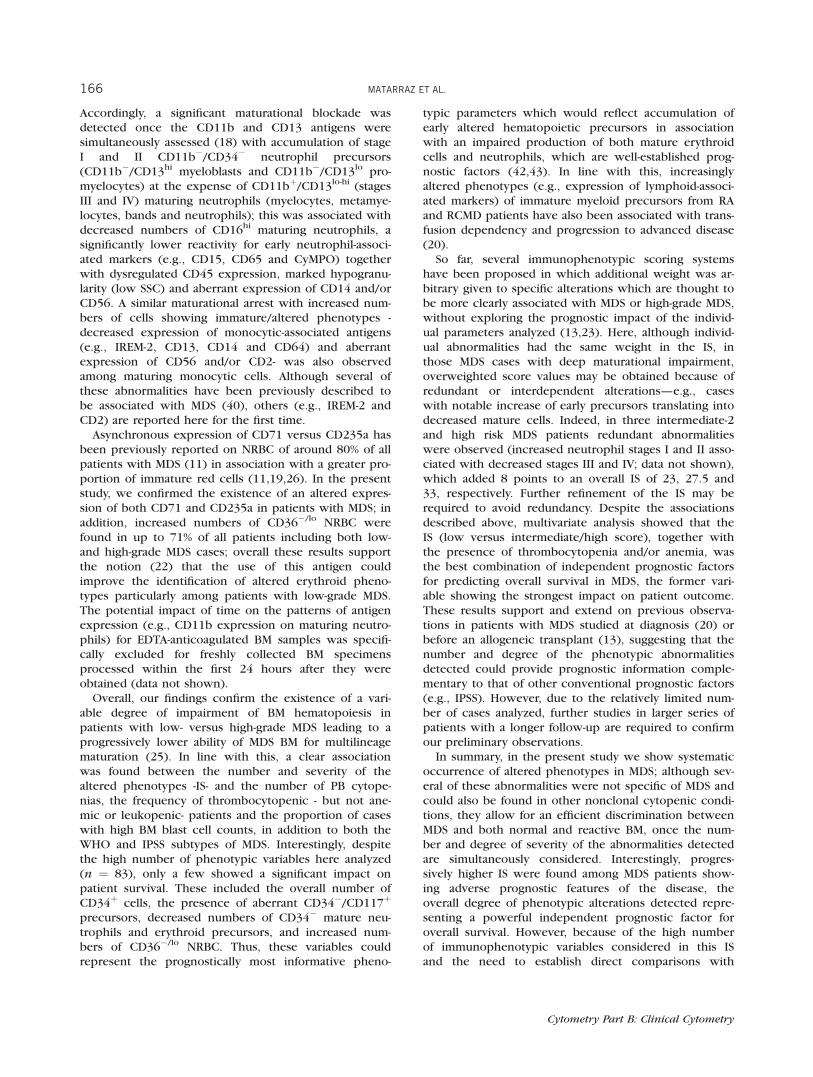
Accordingly, a significant maturational blockade wasdetected once the CD11b and CD13 antigens weresimultaneously assessed (18) with accumulation of stageI and II CD11b�/CD34� neutrophil precursors(CD11b�/CD13hi myeloblasts and CD11b�/CD13lo pro-myelocytes) at the expense of CD11bþ/CD13lo-hi (stagesIII and IV) maturing neutrophils (myelocytes, metamye-locytes, bands and neutrophils); this was associated withdecreased numbers of CD16hi maturing neutrophils, asignificantly lower reactivity for early neutrophil-associ-ated markers (e.g., CD15, CD65 and CyMPO) togetherwith dysregulated CD45 expression, marked hypogranu-larity (low SSC) and aberrant expression of CD14 and/orCD56. A similar maturational arrest with increased num-bers of cells showing immature/altered phenotypes -decreased expression of monocytic-associated antigens(e.g., IREM-2, CD13, CD14 and CD64) and aberrantexpression of CD56 and/or CD2- was also observedamong maturing monocytic cells. Although several ofthese abnormalities have been previously described tobe associated with MDS (40), others (e.g., IREM-2 andCD2) are reported here for the first time.
Asynchronous expression of CD71 versus CD235a hasbeen previously reported on NRBC of around 80% of allpatients with MDS (11) in association with a greater pro-portion of immature red cells (11,19,26). In the presentstudy, we confirmed the existence of an altered expres-sion of both CD71 and CD235a in patients with MDS; inaddition, increased numbers of CD36�/lo NRBC werefound in up to 71% of all patients including both low-and high-grade MDS cases; overall these results supportthe notion (22) that the use of this antigen couldimprove the identification of altered erythroid pheno-types particularly among patients with low-grade MDS.The potential impact of time on the patterns of antigenexpression (e.g., CD11b expression on maturing neutro-phils) for EDTA-anticoagulated BM samples was specifi-cally excluded for freshly collected BM specimensprocessed within the first 24 hours after they wereobtained (data not shown).
Overall, our findings confirm the existence of a vari-able degree of impairment of BM hematopoiesis inpatients with low- versus high-grade MDS leading to aprogressively lower ability of MDS BM for multilineagematuration (25). In line with this, a clear associationwas found between the number and severity of thealtered phenotypes -IS- and the number of PB cytope-nias, the frequency of thrombocytopenic - but not ane-mic or leukopenic- patients and the proportion of caseswith high BM blast cell counts, in addition to both theWHO and IPSS subtypes of MDS. Interestingly, despitethe high number of phenotypic variables here analyzed(n ¼ 83), only a few showed a significant impact onpatient survival. These included the overall number ofCD34þ cells, the presence of aberrant CD34�/CD117þ
precursors, decreased numbers of CD34� mature neu-trophils and erythroid precursors, and increased num-bers of CD36�/lo NRBC. Thus, these variables couldrepresent the prognostically most informative pheno-
typic parameters which would reflect accumulation ofearly altered hematopoietic precursors in associationwith an impaired production of both mature erythroidcells and neutrophils, which are well-established prog-nostic factors (42,43). In line with this, increasinglyaltered phenotypes (e.g., expression of lymphoid-associ-ated markers) of immature myeloid precursors from RAand RCMD patients have also been associated with trans-fusion dependency and progression to advanced disease(20).
So far, several immunophenotypic scoring systemshave been proposed in which additional weight was ar-bitrary given to specific alterations which are thought tobe more clearly associated with MDS or high-grade MDS,without exploring the prognostic impact of the individ-ual parameters analyzed (13,23). Here, although individ-ual abnormalities had the same weight in the IS, inthose MDS cases with deep maturational impairment,overweighted score values may be obtained because ofredundant or interdependent alterations—e.g., caseswith notable increase of early precursors translating intodecreased mature cells. Indeed, in three intermediate-2and high risk MDS patients redundant abnormalitieswere observed (increased neutrophil stages I and II asso-ciated with decreased stages III and IV; data not shown),which added 8 points to an overall IS of 23, 27.5 and33, respectively. Further refinement of the IS may berequired to avoid redundancy. Despite the associationsdescribed above, multivariate analysis showed that theIS (low versus intermediate/high score), together withthe presence of thrombocytopenia and/or anemia, wasthe best combination of independent prognostic factorsfor predicting overall survival in MDS, the former vari-able showing the strongest impact on patient outcome.These results support and extend on previous observa-tions in patients with MDS studied at diagnosis (20) orbefore an allogeneic transplant (13), suggesting that thenumber and degree of the phenotypic abnormalitiesdetected could provide prognostic information comple-mentary to that of other conventional prognostic factors(e.g., IPSS). However, due to the relatively limited num-ber of cases analyzed, further studies in larger series ofpatients with a longer follow-up are required to confirmour preliminary observations.
In summary, in the present study we show systematicoccurrence of altered phenotypes in MDS; although sev-eral of these abnormalities were not specific of MDS andcould also be found in other nonclonal cytopenic condi-tions, they allow for an efficient discrimination betweenMDS and both normal and reactive BM, once the num-ber and degree of severity of the abnormalities detectedare simultaneously considered. Interestingly, progres-sively higher IS were found among MDS patients show-ing adverse prognostic features of the disease, theoverall degree of phenotypic alterations detected repre-senting a powerful independent prognostic factor foroverall survival. However, because of the high numberof immunophenotypic variables considered in this ISand the need to establish direct comparisons with
166 MATARRAZ ET AL.
Cytometry Part B: Clinical Cytometry
normal BM to assign individual scores, the introductionof new analytical tools such as those proposed by theEuroFlow group (44,45) is urgently required for its rou-tine application in diagnosis and prognostic stratificationof patients with MDS. In addition, further multicentricstudies in larger series of patients with long follow-upare required to confirm our observations.
LITERATURE CITED
1. Ogata K. Myelodysplastic syndromes: recent progress in diagnosisand understanding of their pathophysiology. J Nippon Med Sch2006;73:300–307.
2. Bennett JM, Catovsky D, Daniel MT, Flandrin G, Galton DA, Gral-nick HR, Sultan C. Proposals for the classification of the myelodys-plastic syndromes. Br J Haematol 1982;51:189–199.
3. Vardiman JW, Harris NL, Brunning RD. The World Health Organiza-tion (WHO) classification of the myeloid neoplasms. Blood 2002;100:2292–2302.
4. Mathew P, Tefferi A, Dewald GW, Goldberg SL, Su J, Hoagland HC,Noel P. The 5q-syndrome: a single-institution study of 43 consecu-tive patients. Blood 1993;81:1040–1045.
5. Germing U, Hildebrandt B, Pfeilstocker M, Nosslinger T, Valent P,Fonatsch C, Lubbert M, Haase D, Steidl C, Krieger O, Stauder R, Gia-gounidis AA, Strupp C, Kundgen A, Mueller T, Haas R, GattermannN, Aul C. Refinement of the international prognostic scoring system(IPSS) by including LDH as an additional prognostic variable toimprove risk assessment in patients with primary myelodysplasticsyndromes (MDS). Leukemia 2005;19:2223–2231.
6. Greenberg P, Cox C, LeBeau MM, Fenaux P, Morel P, Sanz G, SanzM, Vallespi T, Hamblin T, Oscier D, Ohyashiki K, Toyama K, Aul C,Mufti G, Bennett J. International scoring system for evaluating prog-nosis in myelodysplastic syndromes. Blood 1997;89:2079–2088.
7. Kouides PA, Bennett JM. Morphology and classification of the mye-lodysplastic syndromes and their pathologic variants. Semin Hema-tol 1996;33:95–110.
8. Giagounidis AA, Germing U, Haase S, Hildebrandt B, SchlegelbergerB, Schoch C, Wilkens L, Heinsch M, Willems H, Aivado M, Aul C.Clinical, morphological, cytogenetic, and prognostic features ofpatients with myelodysplastic syndromes and del(5q) includingband q31. Leukemia 2004;18:113–119.
9. JaffeES HN, Stein H, Vardiman JW, editors. World Health Organiza-tion. Classification of Tumours: Pathology and Genetics of Tumoursof Hematopoietic and Lymphoid Tissues. IARC Press: Lyon 2001.
10. Xu D, Schultz C, Akker Y, Cannizzaro L, Ramesh KH, Du J, RatechH. Evidence for expression of early myeloid antigens in mature,non-blast myeloid cells in myelodysplasia. Am J Hematol 2003;74:9–16.
11. Stetler-Stevenson M, Arthur DC, Jabbour N, Xie XY, Molldrem J, Bar-rett AJ, Venzon D, Rick ME. Diagnostic utility of flow cytometricimmunophenotyping in myelodysplastic syndrome. Blood 2001;98:979–987.
12. Kussick SJ, Wood BL. Using 4-color flow cytometry to identifyabnormal myeloid populations. Arch Pathol Lab Med 2003;127:1140–1147.
13. Wells DA, Benesch M, Loken MR, Vallejo C, Myerson D, LeisenringWM, Deeg HJ. Myeloid and monocytic dyspoiesis as determined byflow cytometric scoring in myelodysplastic syndrome correlateswith the IPSS and with outcome after hematopoietic stem celltransplantation. Blood 2003;102:394–403.
14. Wood BL. Flow cytometric diagnosis of myelodysplasia and myelo-proliferative disorders. J Biol Regul Homeost Agents 2004;18:141–145.
15. Kussick SJ, Fromm JR, Rossini A, Li Y, Chang A, Norwood TH,Wood BL. Four-color flow cytometry shows strong concordancewith bone marrow morphology and cytogenetics in the evaluationfor myelodysplasia. Am J Clin Pathol 2005;124:170–181.
16. Stachurski D, Smith BR, Pozdnyakova O, Andersen M, Xiao Z, RazaA, Woda BA, Wang SA. Flow cytometric analysis of myelomonocyticcells by a pattern recognition approach is sensitive and specific indiagnosing myelodysplastic syndrome and related marrow diseases:Emphasis on a global evaluation and recognition of diagnostic pit-falls. Leuk Res 2008;32:215–224.
17. Elghetany MT. Surface marker abnormalities in myelodysplastic syn-dromes. Haematologica 1998;83:1104–1115.
18. Loken MR, van de Loosdrecht A, Ogata K, Orfao A, Wells DA. Flowcytometry in myelodysplastic syndromes: Report from a workingconference. Leuk Res 2008;32:5–17.
19. Malcovati L, Della Porta MG, Lunghi M, Pascutto C, Vanelli L, Trava-glino E, Maffioli M, Bernasconi P, Lazzarino M, Invernizzi R, CazzolaM. Flow cytometry evaluation of erythroid and myeloid dysplasia inpatients with myelodysplastic syndrome. Leukemia 2005;19:776–783.
20. van de Loosdrecht AA, Westers TM, Westra AH, Drager AM, van derVelden VH, Ossenkoppele GJ. Identification of distinct prognosticsubgroups in low- and intermediate-1-risk myelodysplastic syn-dromes by flow cytometry. Blood 2008;111:1067–1077.
21. Ogata K, Nakamura K, Yokose N, Tamura H, Tachibana M, Tanigu-chi O, Iwakiri R, Hayashi T, Sakamaki H, Murai Y, Tohyama K,Tomoyasu S, Nonaka Y, Mori M, Dan K, Yoshida Y. Clinical signifi-cance of phenotypic features of blasts in patients with myelodys-plastic syndrome. Blood 2002;100:3887–3896.
22. Maynadie M, Picard F, Husson B, Chatelain B, Cornet Y, Le Roux G,Campos L, Dromelet A, Lepelley P, Jouault H, Imbert M, RosenwadjM, Verge V, Bissieres P, Raphael M, Bene MC, Feuillard J; Grouped’Etude Immunologique des Leucemies (GEIL). Immunophenotypicclustering of myelodysplastic syndromes. Blood 2002;100:2349–2356.
23. Ogata K, Kishikawa Y, Satoh C, Tamura H, Dan K, Hayashi A. Diag-nostic application of flow cytometric characteristics of CD34þ cellsin low-grade myelodysplastic syndromes. Blood 2006;108:1037–1044.
24. Monreal MB, Pardo ML, Pavlovsky MA, Fernandez I, Corrado CS,Giere I, Sapia S, Pavlovsky S. Increased immature hematopoieticprogenitor cells CD34þ/CD38dim in myelodysplasia. Cytometry BClin Cytom 2006;70B:63–70.
25. Matarraz S, Lopez A, Barrena S, Fernandez C, Jensen E, Flores J, Bar-cena P, Rasillo A, Sayagues JM, Sanchez ML, Hernandez-Campo P,Hernandez Rivas JM, Salvador C, Fernandez-Mosteirın N, Giralt M,Perdiguer L, Orfao A. The immunophenotype of different immature,myeloid and B-cell lineage-committed CD34þ hematopoietic cellsallows discrimination between normal/reactive and myelodysplasticsyndrome precursors. Leukemia 2008;22:1175–1183.
26. Della Porta MG, Malcovati L, Invernizzi R, Travaglino E, Pascutto C,Maffioli M, Gallı A, Boggi S, Pietra D, Vanelli L, Marseglia C, Levi S,Arosio P, Lazzarino M, Cazzola M. Flow cytometry evaluation of ery-throid dysplasia in patients with myelodysplastic syndrome. Leuke-mia 2006;20:549–555.
27. Mufti GJ. Pathobiology, classification, and diagnosis of myelodysplas-tic syndrome. Best Pract Res Clin Haematol 2004;17:543–557.
28. Jaffe ES, Harris NL, Diebold J, Muller-Hermelink HK. World HealthOrganization classification of neoplastic diseases of the hematopoi-etic and lymphoid tissues. A progress report. Am J Clin Pathol1999;111:S8–S12.
29. Almeida J, Bueno C, Alguero MC, Sanchez ML, Canizo MC, Fernan-dez ME, Vaquero JM, Laso FJ, Escribano L, San Miguel JF, Orfao A.Extensive characterization of the immunophenotype and pattern ofcytokine production by distinct subpopulations of normal humanperipheral blood MHC IIþ/lineage- cells. Clin Exp Immunol 1999;118:392–401.
30. Kappelmayer J, Gratama JW, Karaszi E, Menendez P, Ciudad J, RivasR, Orfao A. Flow cytometric detection of intracellular myeloperoxi-dase CD3 and CD79a. Interaction between monoclonal antibodyclones, fluorochromes and sample preparation protocols. J Immu-nol Meth 2000;242:53–65.
31. Sutherland DR, Anderson L, Keeney M, Nayar R, Chin-Yee I. TheISHAGE guidelines for CD34þ cell determination by flow cytome-try. International Society of Hematotherapy and Graft Engineering. JHematother 1996;5:213–226.
32. Alimena G, Billstrom R, Casalone R, Gallo E, Mitelman F, Pasquali F.Cytogenetic pattern in leukemic cells of patients with constitu-tional chromosome anomalies. Cancer Genet Cytogenet 1985;16:207–218.
33. Mitelman F, editor. Neoplasia. In: ISCN. An international system forhuman cytogenetic nomenclature. Basel, Switzerland: Karger; 1995.p 78.
34. Ketterling RP, Wyatt WA, VanWier SA, Law M, Hodnefield JM, Han-son CA, Dewald GW. Primary myelodysplastic syndrome with nor-mal cytogenetics: Utility of ‘FISH panel testing’ and M-FISH. LeukRes 2002;26:235–240.
35. Teodosio C, Garcia-Montero A, Jara Acevedo M, Sanchez Munoz L,Alvarez-Twose Ivan, Nunez R, Schwarrtz LB, Walls AF, Escribano L,Orfao A. Mast cells from different molecular and prognostic sub-types of systemic mastocytosis display distinct immunophenotypes.J Allergy Clin Immunol 2010; in press [Epub ahead of print].
36. Fonatsch C, Gudat H, Lengfelder E, Wandt H, Silling-Engelhardt G,Ludwig WD, Thiel E, Freund M, Bodenstein H, Schwieder G. Corre-lation of cytogenetic findings with clinical features in 18 patientswith inv(3)(q21q26) or t(3;3)(q21;q26). Leukemia 1994;8:1318–1326.
PHENOTYPE IN MDS AND SURVIVAL 167
Cytometry Part B: Clinical Cytometry
37. Loken M, Wells DA. Normal antigen expression in hematopoiesis:basis for interpreting leukemia phenotypes. In: Stewart CNJ, editor.Immunophenotyping. New York: Wiley; 2000. p 133–160.
38. Valent P, Horny HP, Bennett JM, Fonatsch C, Germing U, Greenberg P,Haferlach T, Haase D, Kolb HJ, Krieger O, Loken M, van de LoosdrechtA, Ogata K, Orfao A, Pfeilstocker M, Ruter B, Sperr WR, Stauder R,Wells DA. Definitions and standards in the diagnosis and treatment ofthe myelodysplastic syndromes: Consensus statements and reportfrom a working conference. Leuk Res 2007;31:727–736.
39. Benesch M, Deeg HJ, Wells D, Loken M. Flow cytometry for diagno-sis and assessment of prognosis in patients with myelodysplasticsyndromes. Hematology 2004;9:171–177.
40. van de Loosdrecht AA, Alhan C, Bene MC, Della Porta MG, DragerAM, Feuillard J, Font P, Germing U, Haase D, Homburg CH, IrelandR, Jansen JH, Kern W, Malcovati L, Te Marvelde JG, Mufti GJ, OgataK, Orfao A, Ossenkoppele GJ, Porwit A, Preijers FW, Richards SJ,Schuurhuis GJ, Subira D, Valent P, van der Velden VH, Vyas P, WestraAH, de Witte TM, Wells DA, Loken MR, Westers TM. Standardizationof flow cytometry in myelodysplastic syndromes: Report from thefirst European LeukemiaNet working conference on flow cytometryin myelodysplastic syndromes. Haematologica 2009;94:1124–1134.
41. Maftoun-Banankhah S, Maleki A, Karandikar NJ, Arbini AA, Fuda FS,Wang HY, Chen W. Multiparameter flow cytometric analysis reveals
low percentage of bone marrow hematogones in myelodysplasticsyndromes. Am J Clin Pathol 2008;129:300–308.
42. Verburgh E, Achten R, Louw VJ, Brusselmans C, Delforge M, Boo-gaerts M, Hagemeijer A, Vandenberghe P, Verhoef G. A new diseasecategorization of low-grade myelodysplastic syndromes based onthe expression of cytopenia and dysplasia in one versus more thanone lineage improves on the WHO classification. Leukemia 2007;21:668–677.
43. Malcovati L, Germing U, Kuendgen A, Della Porta MG, Pascutto C,Invernizzi R, Giagounidis A, Hildebrandt B, Bernasconi P, Knipp S,Strupp C, Lazzarino M, Aul C, Cazzola M. Time-dependent prognosticscoring system for predicting survival and leukemic evolution in mye-lodysplastic syndromes. J Clin Oncol 2007;25:3503–3510.
44. Pedreira CE, Costa ES, Barrena S, Lecrevisse Q, Almeida J, van Don-gen JJ, Orfao A; EuroFlow Consortium. Generation of flow cytome-try data files with a potentially infinite number of dimensions.Cytometry Part A 2008;73A:834–846.
45. Pedreira CE, Costa ES, Almeida J, Fernandez C, Quijano S, Flores J,Barrena S, Lecrevisse Q, Van Dongen JJ, Orfao A; EuroFlow Consor-tium. A probabilistic approach for the evaluation of minimal resid-ual disease by multiparameter flow cytometry in leukemic B-cellchronic lymphoproliferative disorders. Cytometry Part A 2008;73A:1141–1150.
168 MATARRAZ ET AL.
Cytometry Part B: Clinical Cytometry
Copyright © 2022 FDOKUMEN