Boater Waste Education Campaign GLO Contract # 16-056 ...
88
2 | BWEC Final Report Boater Waste Education Campaign GLO Contract # 16-056-000-9100 FINAL REPORT Submitted: March 31, 2017 Prepared by: 1100 Hercules Avenue, Suite 200 Houston, TX 77058 281-332-3381 www.galvbay.org Prepared for: A report funded by a Texas Coastal Management Program grant approved by the Texas Land Commissioner pursuant to National Oceanic and Atmospheric Administration award No. NA15NOS4190162.
-
Upload
khangminh22 -
Category
Documents
-
view
1 -
download
0
Transcript of Boater Waste Education Campaign GLO Contract # 16-056 ...
2 | B W E C F i n a l R e p o r t
Boater Waste Education Campaign
GLO Contract # 16-056-000-9100
FINAL REPORT
Submitted: March 31, 2017
Prepared by:
1100 Hercules Avenue, Suite 200
Houston, TX 77058
281-332-3381
www.galvbay.org
Prepared for:
A report funded by a Texas Coastal Management Program grant approved by the Texas Land
Commissioner pursuant to National Oceanic and Atmospheric Administration award No.
NA15NOS4190162.
3 | B W E C F i n a l R e p o r t
Contents
Project Description ____________________________________________________________ 5
Task I - Maintain Active Stakeholder Groups and Marketing/Outreach Materials _________ 6
1.1 BWEC Workgroup ____________________________________________________________ 6
1.2 Technical Advisory Committee _________________________________________________ 7
1.3 Marketing/Outreach Materials _________________________________________________ 8
Task 2. Develop Outreach Schedule and Distribution Plan ___________________________ 12
2.1 Print Media, Education Booths, and Presentations ________________________________ 12
2.2 Marina Partnerships _________________________________________________________ 16
Task 3. Boat Sewage Discharge Reporting and Enforcement _________________________ 17
3.1 Galveston Bay Action Network (GBAN) __________________________________________ 17
3.2 Enforcement-Related Meetings/Presentations ___________________________________ 18
3.3 Enforcement Efforts Carried Out _______________________________________________ 19
Task 4. Facilitate Volunteer Programs ___________________________________________ 20
4.1 GBF Dockwalkers ___________________________________________________________ 20
4.2 GBF Water Monitoring Team __________________________________________________ 22
4.3 Water Quality Internships ____________________________________________________ 28
Task 5. Track Behavior Change and Resulting Environmental Improvements ____________ 29
5.1 Galveston Bay Action Network (GBAN) __________________________________________ 29
5.2 GBF Dockwalkers ___________________________________________________________ 30
5.3 GBF Water Monitoring Team (WMT) ___________________________________________ 33
5.4 Pump-Out Facilities _________________________________________________________ 36
Conclusions and Lessons Learned _______________________________________________ 37
Appendix I: Performance Indicators and Outreach __________________________________ 38
Appendix II: Dockwalker Program _______________________________________________ 43
Appendix III: Water Monitoring Team ___________________________________________ 70
Appendix IV: Pump-out Stations ________________________________________________ 86
4 | B W E C F i n a l R e p o r t
List of Tables Table 1. Boater Waste Education Campaign Workgroup ______________________________________ 7
Table 2. Workgroup meeting schedule ____________________________________________________ 7
Table 3. Technical Advisory Committee membership ________________________________________ 8
Table 4. Marinas contacted about the BWEC ______________________________________________ 13
Table 5. Yacht brokers and other boating businesses that received BWEC materials _______________ 13
Table 6. Distribution schedule of education booths and presentations ___________________________ 14
Table 7. Media outlets and impressions for outreach distribution ______________________________ 15
Table 8. Cycle 20 marina participation ___________________________________________________ 16
Table 9. Enforcement-related meetings and presentations ____________________________________ 18
Table 10. Entities that can enforce or influence enforcement practices and are in communication with
BWEC ____________________________________________________________________________ 20
Table 11. Dockwalker volunteers and survey plan __________________________________________ 21
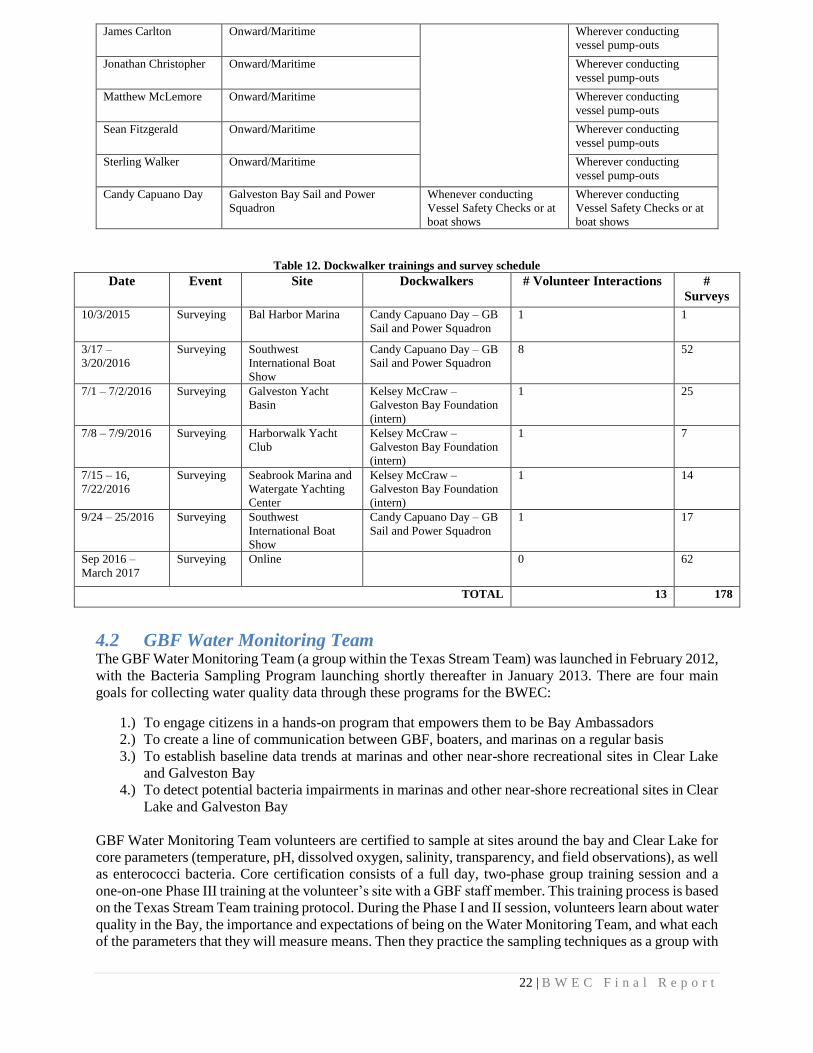
Table 12. Dockwalker trainings and survey schedule ________________________________________ 22
Table 13. GBF Water Monitoring Team active monitor data __________________________________ 23
Table 14. Current GBF Water Monitoring Team volunteers, sites and monitoring schedule _________ 23
Table 15. New WMT volunteers completing final phase of training ____________________________ 25
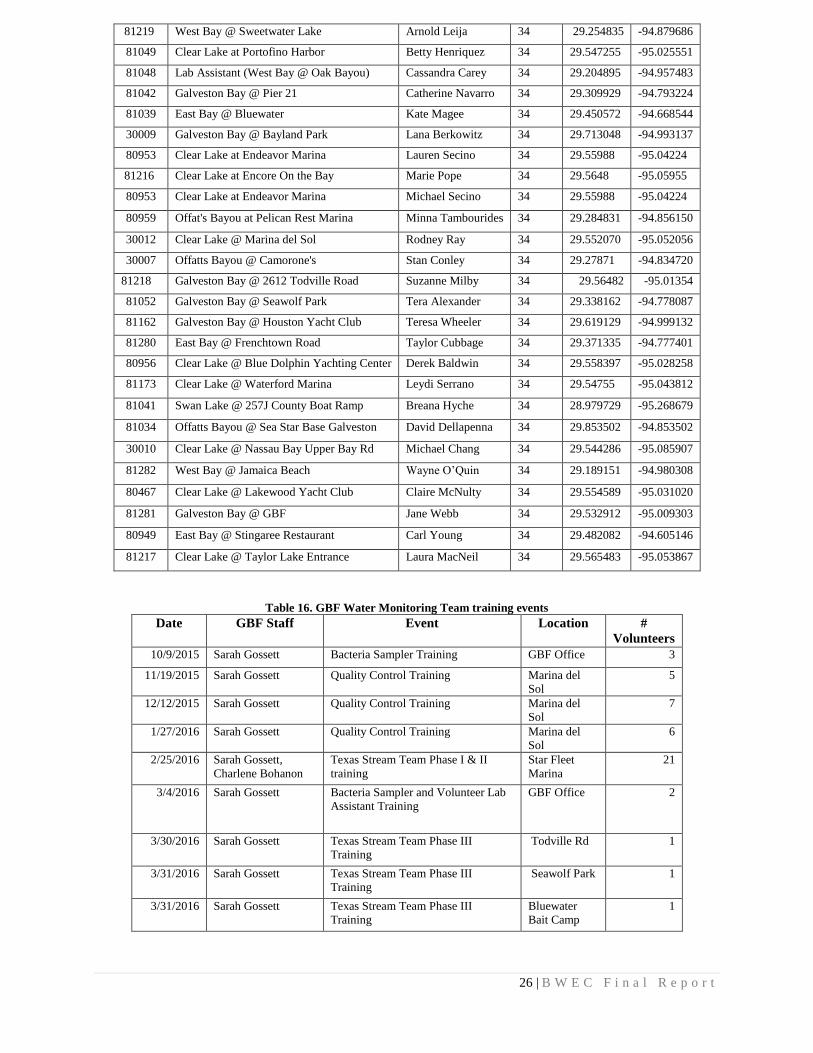
Table 16. GBF Water Monitoring Team training events _____________________________________ 26
Table A1. Performance Indicators for Cycle 20 ____________________________________________ 39
Table A2. Proportional number of Dockwalker surveys needed and collected per date, per strata______45
Table A3: Water Monitoring Action Plan Blueprint_________________________________________ 79
Table A4: List of pump-out services provided for recreational vessels in the Galveston Bay and Clear
Lake areas during Cycle 20____________________________________________________________ 87
List of Figures
Figure 1. Pump Don't Dump (left) and Dockwalker (right) giveaway items for local boaters __________ 8
Figure 2. Redesigned GBAN logo _______________________________________________________ 9
Figure 3. Redesigned Pump Don't Dump logo ______________________________________________ 9
Figure 4. Redesigned Dockwalker logo __________________________________________________ 10
Figure 5. Image of GBAN cards used as campaign giveaways in Cycle 20 _______________________ 10
Figure 6. Two separate social media campaign graphics for Pump Don't Dump during Cycle 20 _____ 11
Figure 7. Four separate social media campaign graphics for GBAN during Cycle 20 _______________ 11
Figure 8. Screenshots of home page (left), main menu (middle), and map of past reports (right) for the
GBAN mobile app developed during Cycle 20 ____________________________________________ 18
Figure 9. Boater knowledge of consequences for discharging sewage into Galveston Bay ___________ 31
Figure 10. Boater knowledge of pump-out facilities located around Clear Lake and Galveston Bay ___ 31
Figure 11. Occurrence of toilet usage while onboard ________________________________________ 32
Figure 12. Types of marine toilets found onboard participants' boats ___________________________ 32
Figure 13. Locations/facilities boaters most often use to discharge their sewage __________________ 33
Figure 14. Photos from GBF's most recent Phase I and II Water Monitoring Training ______________ 34
Figure 15. GBF's Volunteer Lab Assistant receiving a bacteria sample from a volunteer monitor _____ 34
Figure 16. Photos from the field of GBF's Water Monitoring Team collecting field data ____________ 35
Figure 17. GBF's Volunteer Lab Assistant processing and analyzing a bacteria sample _____________ 35
Figure 18. GBF's first Water Monitoring Team Social Gathering at Topwater Grill in San Leon ______ 36
Figure A1. Pump Don’t Dump article in Changing Currents Magazine__________________________ 40
Figure A2. Screenshot of GOMA newsletter article published in Cycle 20_______________________ 42
Figure A3. Cycle 20 Dockwalker survey_________________________________________________ 44
5 | B W E C F i n a l R e p o r t
Project Description
Approximately 50% of Galveston Bay oyster waters are impaired for bacteria, based on the Texas
Commission on Environmental Quality’s Six Total Maximum Daily Loads for Bacteria in Waters of the
Upper Gulf Coast. The primary sources addressed in the Implementation Plan include insufficient
treatment by wastewater treatment facilities and septic systems, sanitary sewer overflows, boat sewage
dumping, and stormwater runoff. These impairments result in negative impacts to environmental and
public health, as well as the economy.
Water and sediments are often degraded in and around marinas from boat sewage and the introduction of
dockside wastes and other non-point sources. The combination of poor circulation and discharge from
boaters and boat maintenance operations can create serious localized water quality and potential public
health concerns (Jeong et al., 2005). The presence of fecal indicator bacteria in the bay indicates that
pathogenic bacteria, which can cause human illnesses (i.e. gastrointestinal, skin, eye, and ear issues), are
likely present. Additionally, increased nutrients from fecal waste can lead to algal blooms, depressed
dissolved oxygen levels, and subsequent fish kills, particularly in marinas where flushing is often
decreased due to the marina design.
The purpose of the Boater Waste Education Campaign (BWEC) is to decrease the incidences of illegal
discharge of boater sewage waste in the Galveston Bay Estuary, particularly Clear Lake since it has the
third highest concentration of privately owned marinas in the United States. Communication of the
potential environmental and public health risks associated with boater waste has improved over the last
few years, largely through initiatives like the Boater Waste Education Campaign; however, the Houston-
Galveston region lacks the appropriate local data to effectively measure any reduction in illegal discharge
of boater waste that may be a result of the BWEC. This, combined with a lack of enforcement of the
existing No Discharge Zone in Clear Lake, means that behavior change through outreach alone is difficult
and improvements can be difficult to track. GBF has continued to work toward overcoming these barriers
to success in CMP Cycle 20.
Throughout the BWEC, GBF communicated the campaign message directly to boaters and marinas. This
was achieved by contacting marinas, boating organizations, and boating events to arrange presentations
and/or exhibits where boaters were exposed to the campaign message, in addition to distributing
education packets to new tenants through our marina partners. The campaign emphasizes 1) the negative
environmental and public health impacts caused by vessel sewage, 2) where boaters can properly dispose
of their waste and report illegal dumping, 3.) the existing laws and fines associated with illegal boat
discharges, 4.) the collection of behavioral data from local recreational boaters regarding vessel discharge,
and 5.) the benefits of and the legal process for designating Galveston Bay a federal No Discharge Zone
(NDZ). As part of the initiative, boaters and marinas have been encouraged to join the Clean Texas
Marina and Clean Boater Programs. Marinas have also been encouraged to seek funding through the
Clean Vessel Act Program to construct, renovate, or replace pump-out stations.
Outreach programs have proved to be effective in the past, but there is a need for a strong campaign in the
Clear Lake area to reach new boaters and reawaken awareness of the issue. GBF has directed the
development and distribution of the message with the input of a workgroup comprised of stakeholders
representing 14 different boating and environmental groups, as well as members of the recreational
6 | B W E C F i n a l R e p o r t
boating community. Funding from the Texas Coastal Management Program has played a key role in the
distribution of the BWEC messages by covering costs associated with marketing, advertisement,
outreach, illegal discharge reporting, marina partnerships, and volunteer water monitoring. The BWEC
has been well received in the Clear Lake/Galveston Bay community and GBF plans to continue carrying
out and enhancing this project indefinitely.
Task I - Maintain Active Stakeholder Groups and
Marketing/Outreach Materials
1.1 BWEC Workgroup A campaign workgroup continued to guide BWEC activities, and consisted of representatives from the
Galveston Bay Estuary Program, Clean Marina Program, Clear Lake Marina Association, Texas Parks
and Wildlife, and other relevant, bay-area groups. The workgroup was originally formed under a
Galveston Bay Estuary Program grant beginning in 2007. The committee members were solicited in the
fall of 2007; the original invitation sent to bay area entities predated the beginning of this grant cycle. The
workgroup was formed to develop and execute the campaign. The current workgroup consists of several
original members, but GBF continually recruits new members in order to keep the BWEC ideas fresh.
Participation in the workgroup is open to any interested parties. Table 1 includes a list of the participating
individuals during this grant cycle. The meeting schedule is included in Table 2. In addition to the
scheduled meetings hosted by GBF, when possible GBF staff attended Clear Lake Marina Association,
Gulf Coast Yacht Broker Association, Texas Mariners Cruising Association, Houston Safe Boating
Council, and Marina Association of Texas meetings and conferences in order to stay in communication
with these and many other local and state representatives in the boating community. These meetings are
key to many successes in the BWEC because GBF has built a good reputation in that community.
The workgroup members contributed to the project in different ways. The Clear Lake Marina Association
provides the business perspective to BWEC efforts and acts as an effective means to disseminate
information and build networks in the local boating community. Unfortunately, the group has been very
busy as of late and has not been able to meet as regularly as they previously have, though GBF continues
to meet with associated members when possible. The Clean Texas Marina Program offers technical
information and a statewide perspective of the boating industry. Both of these organizations are
associated with the Marina Association of Texas and aid in getting the BWEC efforts publicized state-
wide. Redfish Island Marine and Maritime Sanitation are the two mobile pump-out companies currently
in operation in Clear Lake and Galveston Bay. They provide in-kind donations for marina outreach
events, as well as technical information on pump-out equipment. Additionally, Maritime Sanitation has
been a long-time partner in donating pump-out services for the annual Redfish Raft Up event and
assistance to marinas interested in applying for Clean Vessel Act grants to install pump-out facilities.
Texas Parks and Wildlife Department, Texas Commission on Environmental Quality, and Galveston Bay
Estuary Program assist the workgroup with questions relating to environmental regulations, access to
data, and aid in the workgroup’s efforts to get Galveston Bay designated as a No Discharge Zone. Several
members of the workgroup are solely recreational boaters, though others remain heavily involved in the
boating industry. Their knowledge and experience in the community is invaluable to the BWEC efforts.
The most valuable result of continuing this workgroup has been the fact that GBF has a group of
committed stakeholders from the boating industry that are always available to discuss, criticize, and
improve ideas and to give feedback on BWEC efforts. During this funding cycle, organizational
representation at the workgroup meetings was about 63%. In addition, 100% of the organizations were
7 | B W E C F i n a l R e p o r t
directly involved in assisting with campaign tasks, such as assembling and distributing education packets,
connecting GBF to audiences for giving presentations, implementing the campaign at their marina,
providing technical assistance for the Water Monitoring Team, etc. The performance indicators used
during this funding cycle were approved by the workgroup, and can be viewed in Appendix I. The
measured results corresponding to these indicators are addressed throughout this final report in the
appropriate sections.
Table 1. Boater Waste Education Campaign Workgroup
Last First Organization
Paige Helen Marina Bay Harbor
Fannin Paul Public
Hollin Dewayne Clean Texas Marina Program
Hall Lynda Lakewood Yacht Club
Marshall Lisa Galveston Bay Estuary Program
Tuma Scott City of League City
Johnston Steven Houston-Galveston Area Council
Broach Linda TCEQ, Surface WQ Monitoring
Demers Jennifer Maritime Sanitation
Wright Jean Clean Rivers Program
FitzSimmons-Evans Lori Galveston County Health District
Derrick Cassandra TCEQ - Clean Water Certification
Program
Guillen George University of Houston Clear Lake –
Environmental Institute of Houston
Kropf Philip Texas Mariners Cruising Association
Schultz Ron Galveston County Health District
Carrier Mary TPWD Boater Safety Education
Table 2. Workgroup meeting schedule
CMP Cycle Date Location Time Attendance
19/20 November 17, 2015 GBF Conference
Room
9:30 AM 7
20 May 4, 2016 GBF Conference
Room
9:30 AM 13
20 August 16, 2016 GBF Conference
Room
1:00 PM 9
20/21 November 7, 2016 GBF Conference
Room
1:00 PM 5
20/21 February 23, 2016 Freeman Branch
Library
2:30 PM 9
1.2 Technical Advisory Committee GBF maintained communication with members of the Technical Advisory Committee (TAC) (Table 3)
which consists of academic and environmental professionals from local universities, TCEQ and the
workgroup chair. The TAC makes recommendations to GBF on strategies for collecting key data to
quantify the potential impact of boat sewage on bacteria levels in the bay. They gave advice and
comments on the data collected by the Water Monitoring Team, the Dockwalker Team, and the
background research being conducted for the No Discharge Zone application. To date, communication
amongst workgroup members and GBF has been via phone/email/individual meetings.
8 | B W E C F i n a l R e p o r t
Table 3. Technical Advisory Committee membership
Last First Organization
Feiveson Alan NASA Statistician
Glenn Stephanie Houston Advanced Research Center
Hall Lynda Lakewood Yacht Club/Clear Lake
Marina Association
Henderson Andrew University of Texas School of Public
Health
Lane Helen GBF Board Member/Retired NASA
Chemist
Paige Helen Marina Bay Harbor/Clear Lake Marina
Association
1.3 Marketing/Outreach Materials Marketing and outreach materials were maintained or newly developed, as needed, for all of the various
programs within the BWEC including Pump Don’t Dump, GBAN, the GBF Water Monitoring Team, the
Water Quality Outreach Internship, and the Dockwalker Program.
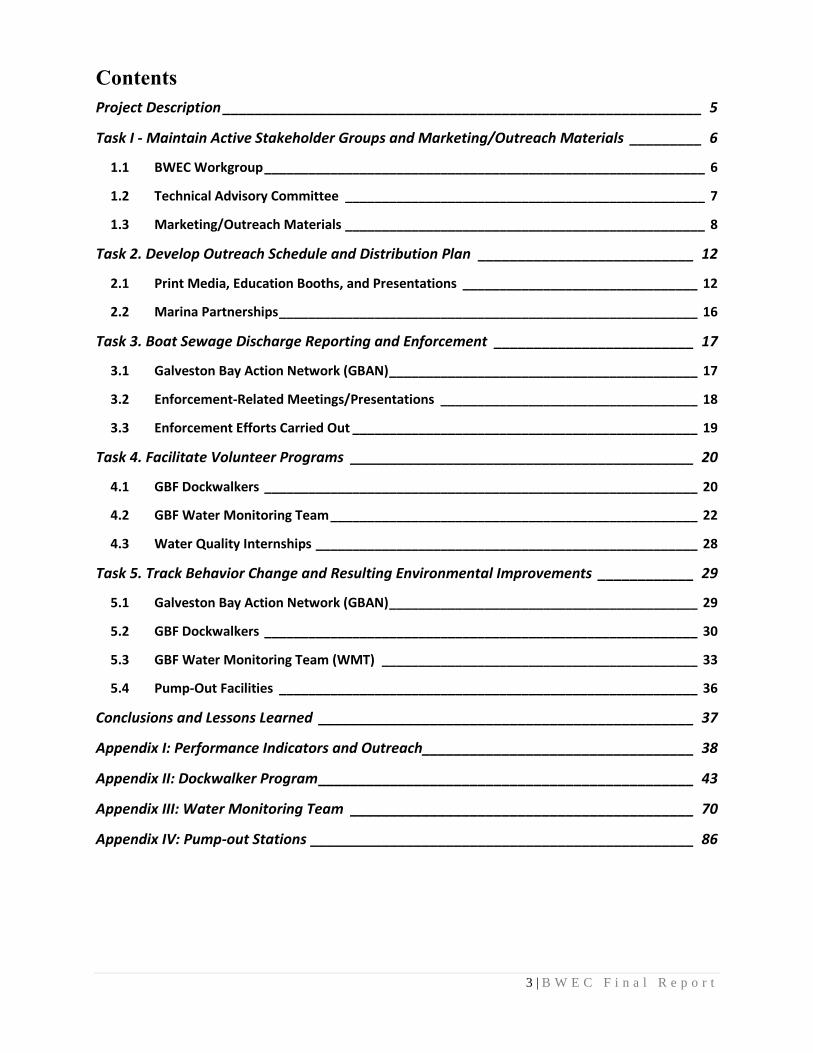
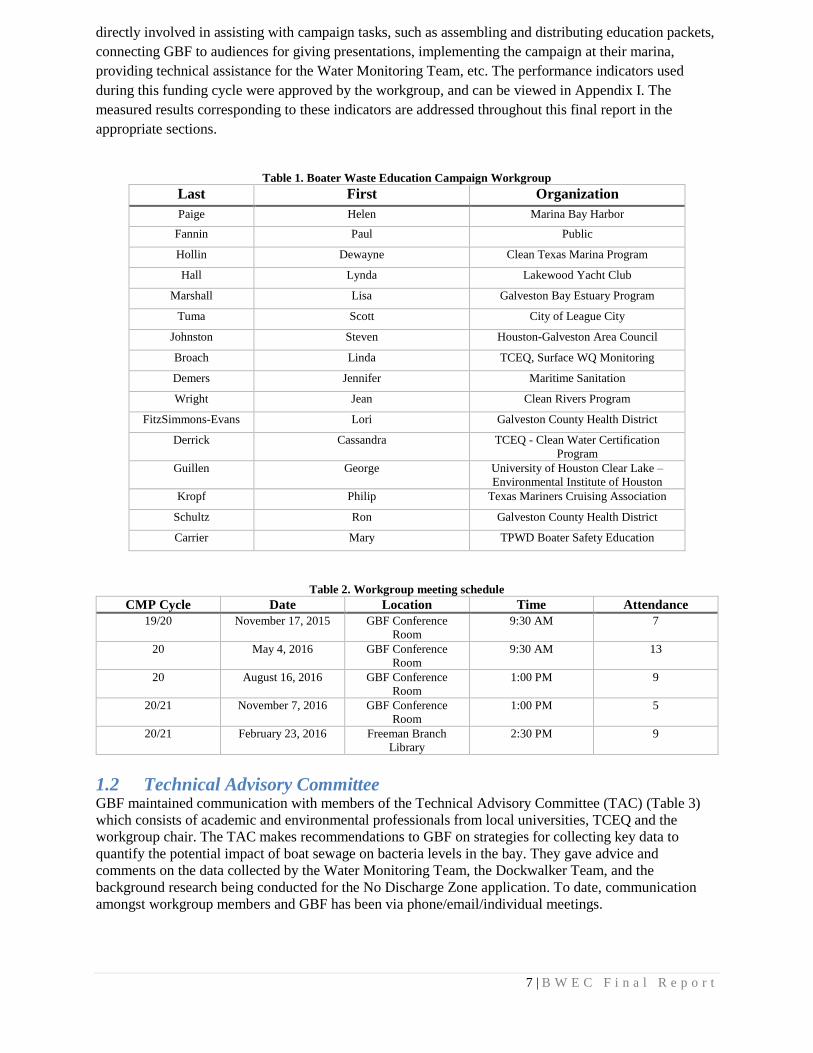
GBF continued to distribute the Pump Don’t Dump education packets and campaign giveaways that were
redesigned during Cycle 19. Items included Pump-Out Guide postcards, GBAN plastic cards, Pump
Don’t Dump koozies, and floating key chains (Figure 1), in addition to the Clean Texas Boater pledge
cards, the Scoop on Poop materials, and Clean Boater Tip Cards donated by the Marina Association of
Texas (MAT). GBF also distributed Dockwalker bags to each individual who completed the Dockwalker
survey in person. These bags include an absorbent pillow for oily bilge, safety whistle, handy zip-tie, a
holding tank dye tablet, and many of the aforementioned outreach materials for Pump Don’t Dump.
The overarching goal was to use these items to direct boaters to the campaign website and pump-out map,
and to provide boaters with tools that empower them to improve water quality through their actions.
These materials act as a conversation starter so we can more easily share the campaign message and help
create ambassadors that will help spread the message as well. Campaign messaging was continually
analyzed and simplified throughout this grant cycle. Figure 1 shows the campaign handout method that
was used most frequently during outreach events.
Figure 1. Pump Don't Dump (left) and Dockwalker (right) giveaway items for local boaters
9 | B W E C F i n a l R e p o r t
In addition, GBF wrote Facebook posts, newsletter articles, and press releases to advertise BWEC
campaign messages, as well as to share our campaign work with GBF followers and supporters through
print and digital media. GBF distributed messaging for Pump Don’t Dump and GBAN calls-to-action in
the Marina Association of Texas’ Changing Currents magazine (Appendix I) as well as two articles in the
Galveston County Daily News. These publications reached our target boating audience with intentional
messaging. GBF also distributed an article featuring our Water Monitoring Program in the Gulf of
Mexico Alliance’s November 2016 newsletter (Appendix I) and in the Gulf Coast Mariner Magazine’s
June 2016 Issue, which can be seen at http://www.gulfcoastmariner.com/galveston-bay-bacteria-storms/.
GBF will continue to look for opportunities to publish similar articles as we develop them. PowerPoint
presentations and hands-on activities were developed for various audiences such as the Houston Safe
Boating Council’s W.A.D.E. summer program, GBF’s Bay Day event, the Southwest International Boat
Show, and the Texas Mariners Cruising Association. Furthermore, during this grant cycle GBF continued
communication with the Marina Association of Texas (MAT) in which the adoption of the Pump Don’t
Dump Campaign as the state-wide boater waste education program was discussed. MAT is very excited
about this possibility moving forward, and the Texas Parks and Wildlife Department is fully supportive of
state-wide implementation of Pump Don’t Dump. As of the end of Cycle 20, MAT is simply waiting on
the necessary funding to formally adopt the Pump Don’t Dump Campaign as a state-wide program.
Dialogue regarding this recent development will continue into the future, as the regional Pump Don’t
Dump Campaign’s role in the state-wide program is determined. GBF is very optimistic about this
progression.
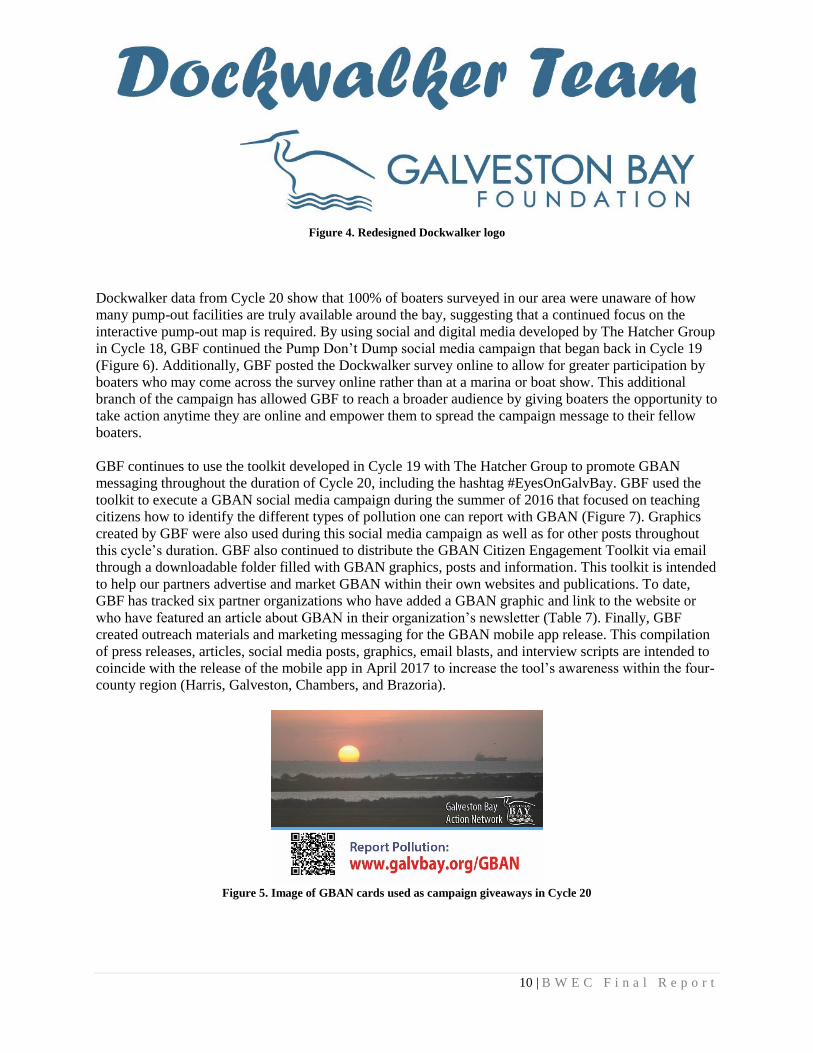
One major enhancement carried out during this cycle was that GBF redesigned the logos for our GBAN,
Dockwalkers, and Pump Don’t Dump programs to remain consistent with the new GBF logo (Figures 2 –
4). These new logos were rolled out in September 1, 2016, and are meant to be sleeker while retaining the
original feel of the earlier logos.
Figure 2. Redesigned GBAN logo
Figure 3. Redesigned Pump Don't Dump logo
10 | B W E C F i n a l R e p o r t
Figure 4. Redesigned Dockwalker logo
Dockwalker data from Cycle 20 show that 100% of boaters surveyed in our area were unaware of how
many pump-out facilities are truly available around the bay, suggesting that a continued focus on the
interactive pump-out map is required. By using social and digital media developed by The Hatcher Group
in Cycle 18, GBF continued the Pump Don’t Dump social media campaign that began back in Cycle 19
(Figure 6). Additionally, GBF posted the Dockwalker survey online to allow for greater participation by
boaters who may come across the survey online rather than at a marina or boat show. This additional
branch of the campaign has allowed GBF to reach a broader audience by giving boaters the opportunity to
take action anytime they are online and empower them to spread the campaign message to their fellow
boaters.
GBF continues to use the toolkit developed in Cycle 19 with The Hatcher Group to promote GBAN
messaging throughout the duration of Cycle 20, including the hashtag #EyesOnGalvBay. GBF used the
toolkit to execute a GBAN social media campaign during the summer of 2016 that focused on teaching
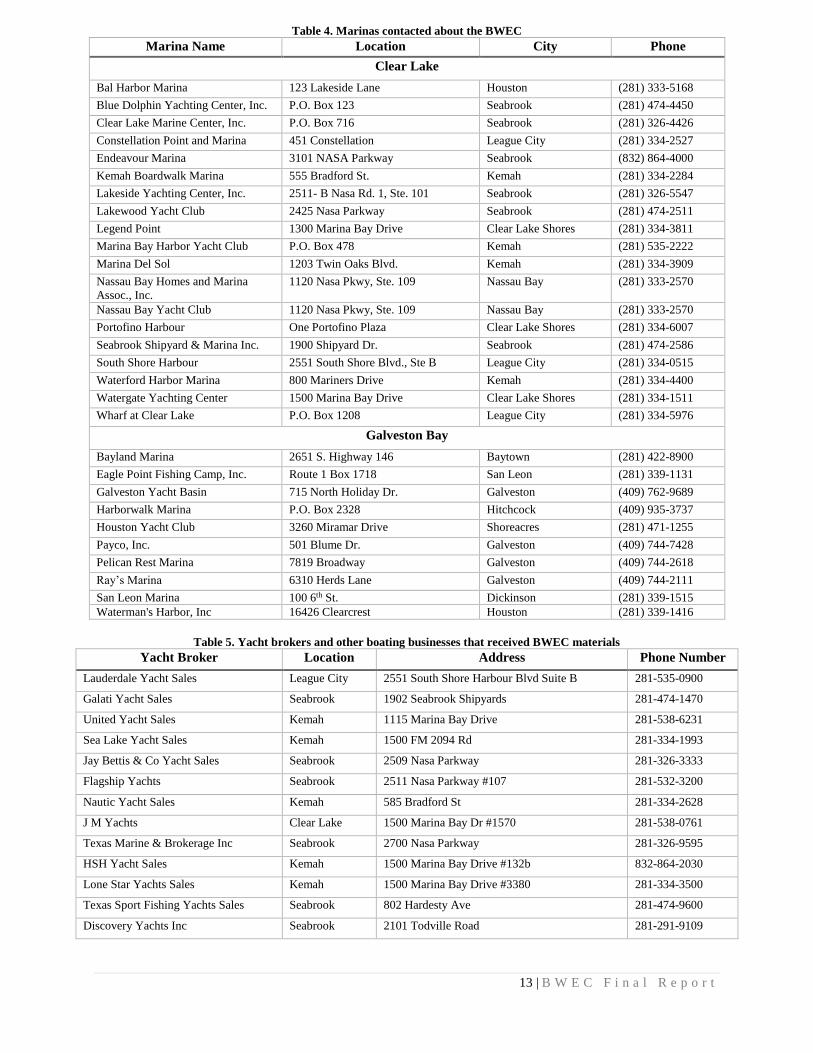
citizens how to identify the different types of pollution one can report with GBAN (Figure 7). Graphics
created by GBF were also used during this social media campaign as well as for other posts throughout
this cycle’s duration. GBF also continued to distribute the GBAN Citizen Engagement Toolkit via email
through a downloadable folder filled with GBAN graphics, posts and information. This toolkit is intended
to help our partners advertise and market GBAN within their own websites and publications. To date,
GBF has tracked six partner organizations who have added a GBAN graphic and link to the website or
who have featured an article about GBAN in their organization’s newsletter (Table 7). Finally, GBF
created outreach materials and marketing messaging for the GBAN mobile app release. This compilation
of press releases, articles, social media posts, graphics, email blasts, and interview scripts are intended to
coincide with the release of the mobile app in April 2017 to increase the tool’s awareness within the four-
county region (Harris, Galveston, Chambers, and Brazoria).
Figure 5. Image of GBAN cards used as campaign giveaways in Cycle 20
11 | B W E C F i n a l R e p o r t
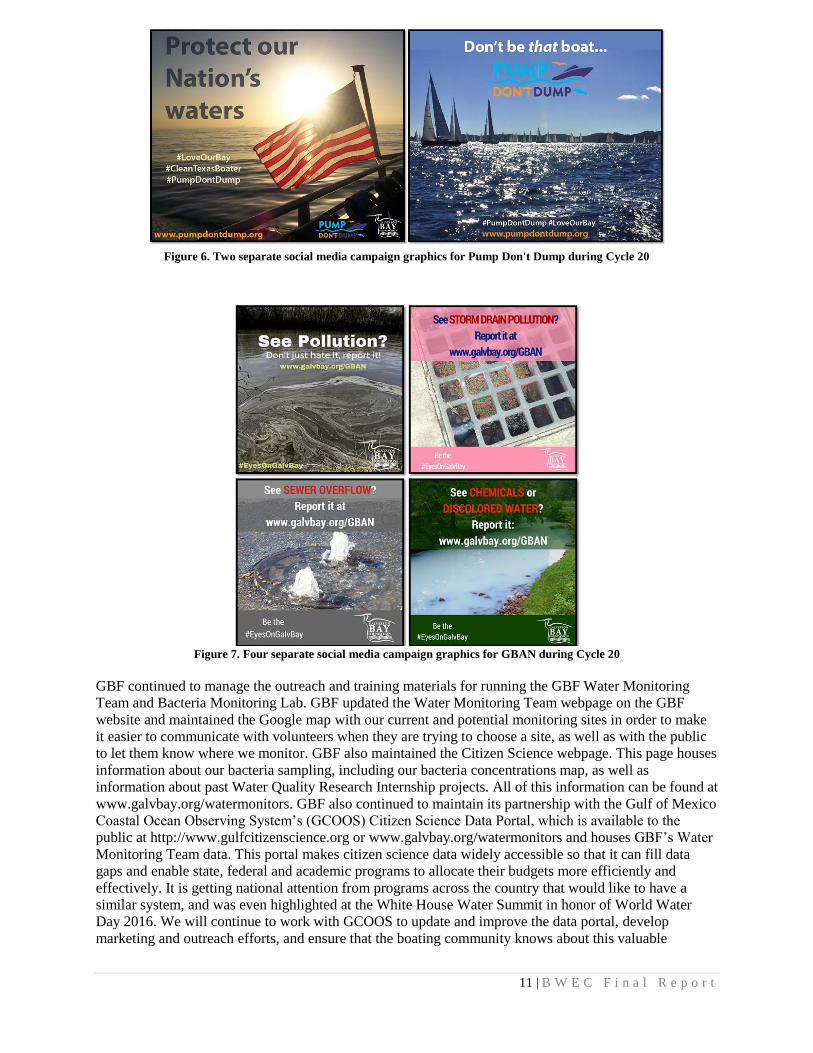
Figure 6. Two separate social media campaign graphics for Pump Don't Dump during Cycle 20
Figure 7. Four separate social media campaign graphics for GBAN during Cycle 20
GBF continued to manage the outreach and training materials for running the GBF Water Monitoring
Team and Bacteria Monitoring Lab. GBF updated the Water Monitoring Team webpage on the GBF
website and maintained the Google map with our current and potential monitoring sites in order to make
it easier to communicate with volunteers when they are trying to choose a site, as well as with the public
to let them know where we monitor. GBF also maintained the Citizen Science webpage. This page houses
information about our bacteria sampling, including our bacteria concentrations map, as well as
information about past Water Quality Research Internship projects. All of this information can be found at
www.galvbay.org/watermonitors. GBF also continued to maintain its partnership with the Gulf of Mexico
Coastal Ocean Observing System’s (GCOOS) Citizen Science Data Portal, which is available to the
public at http://www.gulfcitizenscience.org or www.galvbay.org/watermonitors and houses GBF’s Water
Monitoring Team data. This portal makes citizen science data widely accessible so that it can fill data
gaps and enable state, federal and academic programs to allocate their budgets more efficiently and
effectively. It is getting national attention from programs across the country that would like to have a
similar system, and was even highlighted at the White House Water Summit in honor of World Water
Day 2016. We will continue to work with GCOOS to update and improve the data portal, develop
marketing and outreach efforts, and ensure that the boating community knows about this valuable

12 | B W E C F i n a l R e p o r t
resource for accessing local water quality data. GBF also put together a video overview of our Water
Monitoring Team, which can be viewed at https://www.youtube.com/watch?v=HCTPehsnh_U and on
GBF’s website at http://www.galvbay.org/how-we-protect-the-bay/in-our-communities/water-monitoring-
team/.
Task 2. Develop Outreach Schedule and Distribution Plan
During this project period, outreach was carried out through print media, education booths, presentations,
and through several BWEC volunteer programs including the Galveston Bay Action Network,
Dockwalkers, GBF Water Monitoring Team, and Water Quality Policy and Outreach Internship. Efforts
towards BWEC outreach and distribution are outlined below for print media, booths, and presentations,
while details on the reach of BWEC volunteer programs are found under Task 3. Total impressions achieved
through the BWEC will be discussed under Task 5. However, it should be noted that these impression
counts are simply the best estimate available to GBF as of March 31, 2017. These numbers are most likely
generally understated, as there are some instances where it is incredibly difficult to track any sort of
impression outcome. However, in some instances impression counts from individual campaigns may be
overstated. There were a few situations where no direct impression count could be determined, so GBF
estimated the campaign’s potential reach by multiplying the website’s daily page views by the total number
of days during which the campaign remained active. Going forward, GBF would like to determine either a
better method for tracking digital outreach campaigns or a more effective tracking method for
distinguishing between simple impressions and behavior change or actions resulting from an outreach
campaign. However, for this report, GBF will largely evaluate the success of an outreach campaign by the
number of impressions, or people reached, as a result of the campaign.
2.1 Print Media, Education Booths, and Presentations GBF contacted marinas and popular boating events to schedule outreach presentations and booth displays,
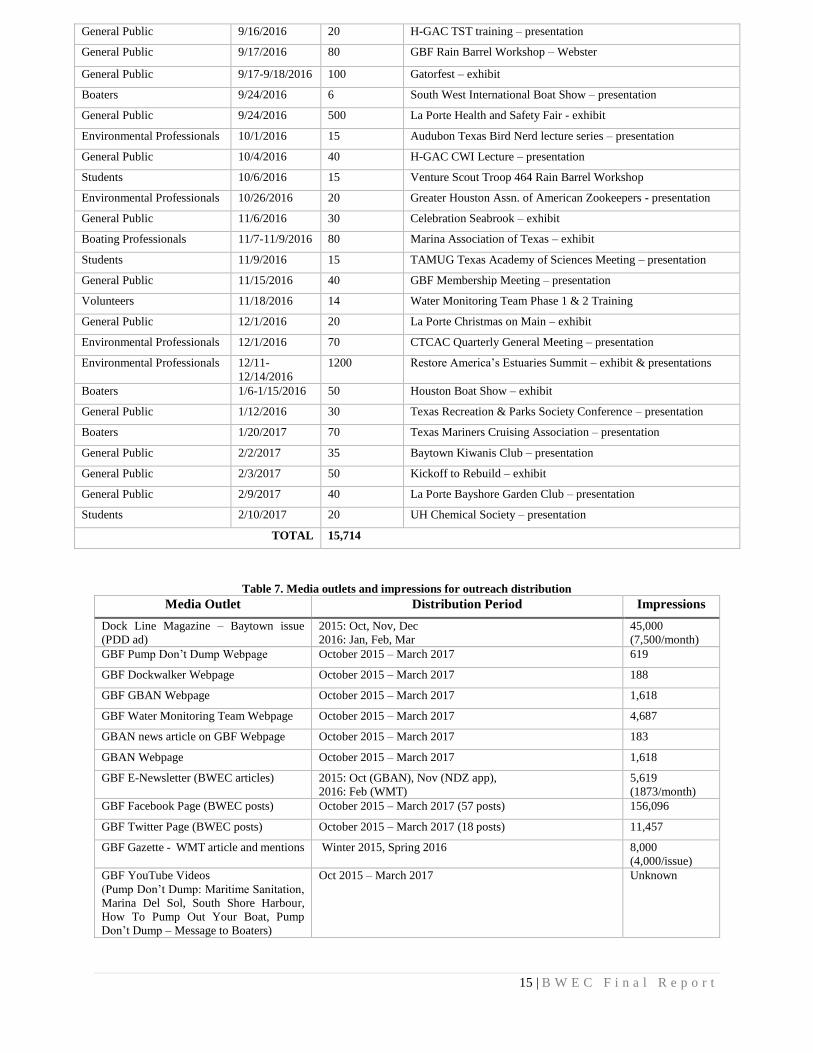
and to offer printed materials for inclusion in tenant packets and event goodie bags. Table 4 shows the list
of marinas that were contacted during this grant cycle and Table 5 shows the yacht brokers and other
boating-related businesses that were contacted.
Workgroup members and campaign partners frequently help with directly promoting the BWEC through
donating banner space at events, inviting us to speak or host education booths, and even distributing
campaign materials at their booths. GBF staff and volunteers have hosted many educational exhibits
throughout the project area to ensure one-on-one interaction with boaters. In addition, during this grant
cycle GBF hosted an exhibit at the Marina Association of Texas’ annual conference, the Houston Boat
Show, the Restore America’s Estuaries conference, and the Southwest International Boat Show to highlight
BWEC efforts that have been successful and potential ways that GBF and these organizations can
coordinate this effort moving forward. GBF is very pleased that many of our suggestions are being taken
into consideration and that MAT is even planning on adopting Pump Don’t Dump as the statewide boater
education program and supplementing our printing budget for outreach materials with some of their TPWD
grant funds, helping us to be able to reach even more boaters around Clear Lake and Galveston Bay.
In addition to these outreach booths, several group presentations were made throughout the BWEC project
period. GBF continues to have quality interactions with the boating community through these group
presentations, since it facilitates better discussions and the opportunity to disseminate more detailed
information than can be done with a passive booth audience. Please see Table 6 for a schedule of both types
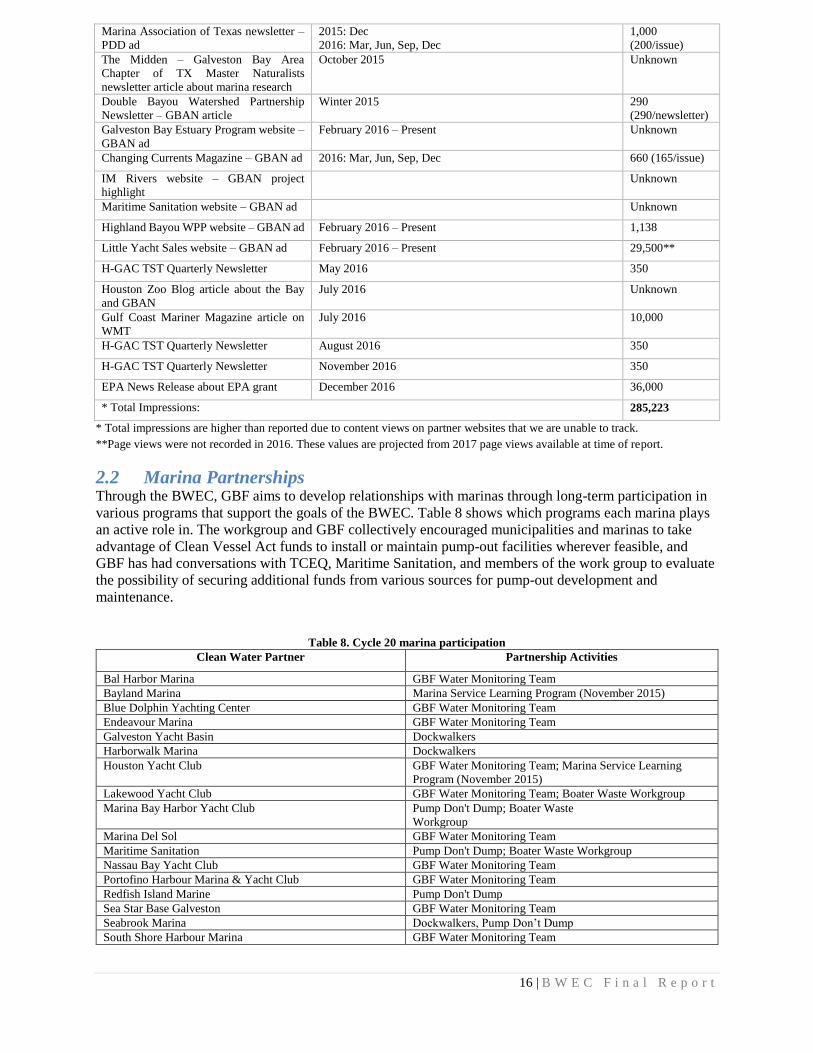
of education events carried out during this grant cycle. Through these activities, GBF reached over 15,000
people at 53 live events.
In terms of advertising, GBF has promoted the campaign through magazines, websites, social media, and
local print and online news sources (an extensive press release list is managed by GBF’s Marketing
Coordinator). All advertising and article space utilized during this grant cycle was donated because of the
publications’ support for the BWEC. Numbers of impressions for the various BWEC advertisements, posts,
and articles GBF could track are found in Table 7. Through print and digital media, GBF was able to reach
over 285,000 people with various BWEC messaging through 29 different media outlets.
13 | B W E C F i n a l R e p o r t
Table 4. Marinas contacted about the BWEC
Marina Name Location City Phone
Clear Lake
Bal Harbor Marina 123 Lakeside Lane Houston (281) 333-5168
Blue Dolphin Yachting Center, Inc. P.O. Box 123 Seabrook (281) 474-4450
Clear Lake Marine Center, Inc. P.O. Box 716 Seabrook (281) 326-4426
Constellation Point and Marina 451 Constellation League City (281) 334-2527
Endeavour Marina 3101 NASA Parkway Seabrook (832) 864-4000
Kemah Boardwalk Marina 555 Bradford St. Kemah (281) 334-2284
Lakeside Yachting Center, Inc. 2511- B Nasa Rd. 1, Ste. 101 Seabrook (281) 326-5547
Lakewood Yacht Club 2425 Nasa Parkway Seabrook (281) 474-2511
Legend Point 1300 Marina Bay Drive Clear Lake Shores (281) 334-3811
Marina Bay Harbor Yacht Club P.O. Box 478 Kemah (281) 535-2222
Marina Del Sol 1203 Twin Oaks Blvd. Kemah (281) 334-3909
Nassau Bay Homes and Marina
Assoc., Inc.
1120 Nasa Pkwy, Ste. 109 Nassau Bay (281) 333-2570
Nassau Bay Yacht Club 1120 Nasa Pkwy, Ste. 109 Nassau Bay (281) 333-2570
Portofino Harbour One Portofino Plaza Clear Lake Shores (281) 334-6007
Seabrook Shipyard & Marina Inc. 1900 Shipyard Dr. Seabrook (281) 474-2586
South Shore Harbour 2551 South Shore Blvd., Ste B League City (281) 334-0515
Waterford Harbor Marina 800 Mariners Drive Kemah (281) 334-4400
Watergate Yachting Center 1500 Marina Bay Drive Clear Lake Shores (281) 334-1511
Wharf at Clear Lake P.O. Box 1208 League City (281) 334-5976
Galveston Bay
Bayland Marina 2651 S. Highway 146 Baytown (281) 422-8900
Eagle Point Fishing Camp, Inc. Route 1 Box 1718 San Leon (281) 339-1131
Galveston Yacht Basin 715 North Holiday Dr. Galveston (409) 762-9689
Harborwalk Marina P.O. Box 2328 Hitchcock (409) 935-3737
Houston Yacht Club 3260 Miramar Drive Shoreacres (281) 471-1255
Payco, Inc. 501 Blume Dr. Galveston (409) 744-7428
Pelican Rest Marina 7819 Broadway Galveston (409) 744-2618
Ray’s Marina 6310 Herds Lane Galveston (409) 744-2111
San Leon Marina 100 6th St. Dickinson (281) 339-1515
Waterman's Harbor, Inc 16426 Clearcrest Houston (281) 339-1416
Table 5. Yacht brokers and other boating businesses that received BWEC materials
Yacht Broker Location Address Phone Number
Lauderdale Yacht Sales League City 2551 South Shore Harbour Blvd Suite B 281-535-0900
Galati Yacht Sales Seabrook 1902 Seabrook Shipyards 281-474-1470
United Yacht Sales Kemah 1115 Marina Bay Drive 281-538-6231
Sea Lake Yacht Sales Kemah 1500 FM 2094 Rd 281-334-1993
Jay Bettis & Co Yacht Sales Seabrook 2509 Nasa Parkway 281-326-3333
Flagship Yachts Seabrook 2511 Nasa Parkway #107 281-532-3200
Nautic Yacht Sales Kemah 585 Bradford St 281-334-2628
J M Yachts Clear Lake 1500 Marina Bay Dr #1570 281-538-0761
Texas Marine & Brokerage Inc Seabrook 2700 Nasa Parkway 281-326-9595
HSH Yacht Sales Kemah 1500 Marina Bay Drive #132b 832-864-2030
Lone Star Yachts Sales Kemah 1500 Marina Bay Drive #3380 281-334-3500
Texas Sport Fishing Yachts Sales Seabrook 802 Hardesty Ave 281-474-9600
Discovery Yachts Inc Seabrook 2101 Todville Road 281-291-9109

14 | B W E C F i n a l R e p o r t
Texas Coast Yachts Kemah 1500 Marina Bay Drive Suite 122-A 281-957-9046
Gibson Weaver Yacht Sales Seabrook 2511B Nasa Parkway 281-326-1574
Kent Little @ Little Yacht Sales Kemah Waterford Harbor, 800 Mariners Drive 713-817-7216
Southern Cross Yacht Sales Kemah 585 Bradford Ave 281-334-7411
Seawinds International Inc Kemah 703 Bay Ave 281-334-5296
Marine Max Inc. Seabrook 3001 Nasa Parkway 281-326-4224
Maritime Sanitation Clear Lake
Shores
1500 Marina Bay Drive 281-334-5978
Redfish Island Marine Clear Lake
Shores
1500 Marina Bay Drive, Suite 112 832-282-8202
Kevin E. Severance Insurance Agency League City 3027 Marina Bay Drive, Suite 309 281-333-3100
Ron Hoover RV and Marine La Marque 1903 Gulf Frwy 409-935-7101
Table 6. Distribution schedule of education booths and presentations
Audience Date Impressions Description
General public 10/3/2015 400 La Porte Sip and Stroll - exhibit
General public 10/10/2015 500 El Jardin BayFest - exhibit
General Public 10/24/2015 20 GBF Rain Barrel Workshop – La Porte
General Public 11/7/2015 25 GBF Rain Barrel Workshop – Nassau Bay
Environmental Professionals 1/13/2016 25 Galveston Bay Estuary Program State of the Bay Symposium
College Students 3/2/2016 16 Lee College Environmental Science class – presentation
General Public 3/5/2016 22 GBF Rain Barrel Workshop - Baytown
Boaters 3/18-3/19/2016 15 Southwest International Boat Show – presentation
Boaters 3/17-20/2016 10,000 Southwest International Boat Show partner distribution
General Public 3/26/2016 200 Bayou Greenways Day - exhibit
General Public 4/3/2016 20 Water Warriors Brownies Troop – presentation
General Public 4/9/2016 32 GBF Rain Barrel Workshop – Galveston
General Public 4/16/2016 250 Earth Day Houston - exhibit
General Public 4/23-4/24/2016 770 Earth Day Texas - exhibit
General Public 5/21/2016 72 GBF Rain Barrel Workshop – Houston Zoo
General Public 6/8/2016 50 World Oceans Day Festival - exhibit
Boaters 6/8/2016 15 Houston Sail & Power Squadron – presentation
General Public 6/10/2016 75 Cool Nights at the Zoo - exhibit
General Public 6/11/2016 47 GBF Rain Barrel Workshop - Bolivar
General Public 6/25/2016 57 GBF Rain Barrel Workshop - Seabrook
General Public 6/29/2016 50 GBF Open House
Boaters 7/13/2016 40 WADE/Houston Safe Boating Council - exhibit
General Public 7/16/2016 78 GBF Rain Barrel Workshop – Pasadena
General Public 7/16/2016 20 Houston Zoo Beach Clean Up – exhibit
Children 7/22/2016 18 City of La Porte Summer Camp – presentation
General Public 7/22/2016 200 Under the Sea Booth at Houston Zoo Cool Nights
General Public 7/30/2016 50 Houston Zoo Beach Bash – exhibit
General Public 8/6/2016 62 GBF Rain Barrel Workshop - Friendswood
General Public 8/11/2016 15 Galveston Surfrider – presentation
15 | B W E C F i n a l R e p o r t
General Public 9/16/2016 20 H-GAC TST training – presentation
General Public 9/17/2016 80 GBF Rain Barrel Workshop – Webster
General Public 9/17-9/18/2016 100 Gatorfest – exhibit
Boaters 9/24/2016 6 South West International Boat Show – presentation
General Public 9/24/2016 500 La Porte Health and Safety Fair - exhibit
Environmental Professionals 10/1/2016 15 Audubon Texas Bird Nerd lecture series – presentation
General Public 10/4/2016 40 H-GAC CWI Lecture – presentation
Students 10/6/2016 15 Venture Scout Troop 464 Rain Barrel Workshop
Environmental Professionals 10/26/2016 20 Greater Houston Assn. of American Zookeepers - presentation
General Public 11/6/2016 30 Celebration Seabrook – exhibit
Boating Professionals 11/7-11/9/2016 80 Marina Association of Texas – exhibit
Students 11/9/2016 15 TAMUG Texas Academy of Sciences Meeting – presentation
General Public 11/15/2016 40 GBF Membership Meeting – presentation
Volunteers 11/18/2016 14 Water Monitoring Team Phase 1 & 2 Training
General Public 12/1/2016 20 La Porte Christmas on Main – exhibit
Environmental Professionals 12/1/2016 70 CTCAC Quarterly General Meeting – presentation
Environmental Professionals 12/11-
12/14/2016
1200 Restore America’s Estuaries Summit – exhibit & presentations
Boaters 1/6-1/15/2016 50 Houston Boat Show – exhibit
General Public 1/12/2016 30 Texas Recreation & Parks Society Conference – presentation
Boaters 1/20/2017 70 Texas Mariners Cruising Association – presentation
General Public 2/2/2017 35 Baytown Kiwanis Club – presentation
General Public 2/3/2017 50 Kickoff to Rebuild – exhibit
General Public 2/9/2017 40 La Porte Bayshore Garden Club – presentation
Students 2/10/2017 20 UH Chemical Society – presentation
TOTAL 15,714
Table 7. Media outlets and impressions for outreach distribution
Media Outlet Distribution Period Impressions
Dock Line Magazine – Baytown issue
(PDD ad)
2015: Oct, Nov, Dec
2016: Jan, Feb, Mar
45,000
(7,500/month)
GBF Pump Don’t Dump Webpage October 2015 – March 2017 619
GBF Dockwalker Webpage October 2015 – March 2017 188
GBF GBAN Webpage October 2015 – March 2017 1,618
GBF Water Monitoring Team Webpage October 2015 – March 2017 4,687
GBAN news article on GBF Webpage October 2015 – March 2017 183
GBAN Webpage October 2015 – March 2017 1,618
GBF E-Newsletter (BWEC articles) 2015: Oct (GBAN), Nov (NDZ app),
2016: Feb (WMT)
5,619
(1873/month)
GBF Facebook Page (BWEC posts) October 2015 – March 2017 (57 posts) 156,096
GBF Twitter Page (BWEC posts) October 2015 – March 2017 (18 posts) 11,457
GBF Gazette - WMT article and mentions Winter 2015, Spring 2016 8,000
(4,000/issue)
GBF YouTube Videos
(Pump Don’t Dump: Maritime Sanitation,
Marina Del Sol, South Shore Harbour,
How To Pump Out Your Boat, Pump
Don’t Dump – Message to Boaters)
Oct 2015 – March 2017 Unknown
16 | B W E C F i n a l R e p o r t
Marina Association of Texas newsletter –
PDD ad
2015: Dec
2016: Mar, Jun, Sep, Dec
1,000
(200/issue)
The Midden – Galveston Bay Area
Chapter of TX Master Naturalists
newsletter article about marina research
October 2015 Unknown
Double Bayou Watershed Partnership
Newsletter – GBAN article
Winter 2015 290
(290/newsletter)
Galveston Bay Estuary Program website –
GBAN ad
February 2016 – Present Unknown
Changing Currents Magazine – GBAN ad 2016: Mar, Jun, Sep, Dec 660 (165/issue)
IM Rivers website – GBAN project
highlight
Unknown
Maritime Sanitation website – GBAN ad Unknown
Highland Bayou WPP website – GBAN ad February 2016 – Present 1,138
Little Yacht Sales website – GBAN ad February 2016 – Present 29,500**
H-GAC TST Quarterly Newsletter May 2016 350
Houston Zoo Blog article about the Bay
and GBAN
July 2016 Unknown
Gulf Coast Mariner Magazine article on
WMT
July 2016 10,000
H-GAC TST Quarterly Newsletter August 2016 350
H-GAC TST Quarterly Newsletter November 2016 350
EPA News Release about EPA grant December 2016 36,000
* Total Impressions: 285,223
* Total impressions are higher than reported due to content views on partner websites that we are unable to track.
**Page views were not recorded in 2016. These values are projected from 2017 page views available at time of report.
2.2 Marina Partnerships Through the BWEC, GBF aims to develop relationships with marinas through long-term participation in
various programs that support the goals of the BWEC. Table 8 shows which programs each marina plays
an active role in. The workgroup and GBF collectively encouraged municipalities and marinas to take
advantage of Clean Vessel Act funds to install or maintain pump-out facilities wherever feasible, and
GBF has had conversations with TCEQ, Maritime Sanitation, and members of the work group to evaluate
the possibility of securing additional funds from various sources for pump-out development and
maintenance.
Table 8. Cycle 20 marina participation
Clean Water Partner Partnership Activities
Bal Harbor Marina GBF Water Monitoring Team
Bayland Marina Marina Service Learning Program (November 2015)
Blue Dolphin Yachting Center GBF Water Monitoring Team
Endeavour Marina GBF Water Monitoring Team
Galveston Yacht Basin Dockwalkers
Harborwalk Marina Dockwalkers
Houston Yacht Club GBF Water Monitoring Team; Marina Service Learning
Program (November 2015)
Lakewood Yacht Club GBF Water Monitoring Team; Boater Waste Workgroup
Marina Bay Harbor Yacht Club Pump Don't Dump; Boater Waste
Workgroup
Marina Del Sol GBF Water Monitoring Team
Maritime Sanitation Pump Don't Dump; Boater Waste Workgroup
Nassau Bay Yacht Club GBF Water Monitoring Team
Portofino Harbour Marina & Yacht Club GBF Water Monitoring Team
Redfish Island Marine Pump Don't Dump
Sea Star Base Galveston GBF Water Monitoring Team
Seabrook Marina Dockwalkers, Pump Don’t Dump
South Shore Harbour Marina GBF Water Monitoring Team
17 | B W E C F i n a l R e p o r t
Star Fleet Yachts GBF Water Monitoring Team (training site)
Texas Corinthian Yacht Club GBF Water Monitoring Team
Topwater Grill GBF Water Monitoring Team
Waterford Harbor Yacht Club & Marina GBF Water Monitoring Team; Dockwalkers
Watergate Yachting Center Pump Don't Dump; GBF Water Monitoring Team;
Dockwalkers
Task 3. Boat Sewage Discharge Reporting and Enforcement
3.1 Galveston Bay Action Network (GBAN) GBAN aims to educate citizens on how and where to report boat sewage discharges and other common
water pollution incidents. The BWEC workgroup’s theory is that more citizens reporting illegal
discharges will more effectively open the eyes of marina owners, boaters, and enforcement agencies to
the reality of the boater waste issue than would GBF and workgroup members receiving the reports via
word of mouth and sending them informally to the enforcement agencies. Having a central location for
citizens to submit reports also makes it easier on them and provides regulatory agencies with quicker
reporting of pollution events. The site was developed in Cycle 18 (www.galvbay.org/GBAN), allowing
citizens to fill out a simple form with critical details of the pollution incident such as location, type of
pollution, photos of the pollution, and follow-up contact information. The report is automatically emailed
to the appropriate authority based on the type of pollution and municipality reflected in the report. On the
back-end, regulatory agencies at the state, county, and city levels are tied into the app to receive reports
and have generally been very excited about the technology. Our ultimate goal with GBAN is to keep our
water fishable and swimmable through the transparent exchange of information. We hope that this results
in safer and more attractive marinas in Galveston Bay and Clear Lake.
The major focus for this task during Cycle 20 included working with the GBAN developer, Vertices,
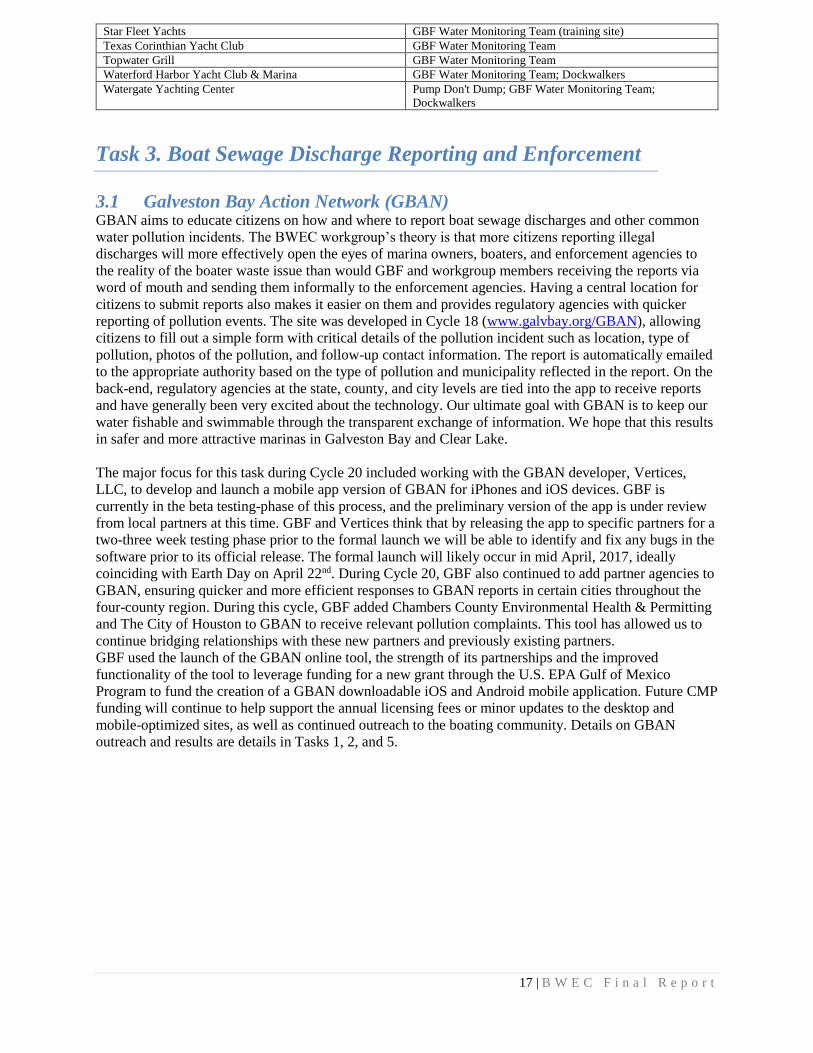
LLC, to develop and launch a mobile app version of GBAN for iPhones and iOS devices. GBF is
currently in the beta testing-phase of this process, and the preliminary version of the app is under review
from local partners at this time. GBF and Vertices think that by releasing the app to specific partners for a
two-three week testing phase prior to the formal launch we will be able to identify and fix any bugs in the
software prior to its official release. The formal launch will likely occur in mid April, 2017, ideally
coinciding with Earth Day on April 22nd. During Cycle 20, GBF also continued to add partner agencies to
GBAN, ensuring quicker and more efficient responses to GBAN reports in certain cities throughout the
four-county region. During this cycle, GBF added Chambers County Environmental Health & Permitting
and The City of Houston to GBAN to receive relevant pollution complaints. This tool has allowed us to
continue bridging relationships with these new partners and previously existing partners.
GBF used the launch of the GBAN online tool, the strength of its partnerships and the improved
functionality of the tool to leverage funding for a new grant through the U.S. EPA Gulf of Mexico
Program to fund the creation of a GBAN downloadable iOS and Android mobile application. Future CMP
funding will continue to help support the annual licensing fees or minor updates to the desktop and
mobile-optimized sites, as well as continued outreach to the boating community. Details on GBAN
outreach and results are details in Tasks 1, 2, and 5.
18 | B W E C F i n a l R e p o r t
Figure 8. Screenshots of home page (left), main menu (middle), and map of past reports (right) for the GBAN mobile app
developed during Cycle 20
3.2 Enforcement-Related Meetings/Presentations GBF continued to disseminate information related to illegal discharge enforcement in the surrounding
community through a variety of speaking engagements and individual meetings with members of the
recreational boating community, seafood industry, commercial boating community, enforcement
agencies, and community leaders. This information, along with the extensive research carried out with our
interns in 2015, now make up some standard content that we included in all presentations for the boating
community. The presentations that we delivered during this grant cycle that incorporated enforcement-
related information are listed in Table 9. The information in these presentations has opened up great
dialogue with the recreational boating community and will continue to provide GBF the opportunity to
gain stakeholder support for a federal No Discharge Zone in Galveston Bay. Throughout Cycle 20, it
became apparent that in order to realistically pursue an NDZ designation for Galveston Bay, GBF will
need to gain additional support from commercial boating groups and the shipping industry throughout the
Houston region. Therefore, GBF will focus NDZ efforts in future cycles on strengthening relationships
with the commercial boating community and continuing to work with leaders in this industry on a NDZ
designation.
Table 9. Enforcement-related meetings and presentations
Audience Date Impressions Description
Environmental Professionals 1/13/2016 25 Galveston Bay Estuary Program State of the Bay Symposium
College Students 3/2/2016 16 Lee College Environmental Science class – presentation
Boaters 3/18-3/19 15 Southwest International Boat Show – seminar presentation
Boaters 6/8/2016 45 Houston Sail & Power Squadron General Meeting –
presentation
Surfers & Galveston Island
Community
8/11/2016 15 Galveston Surfriders General Meeting – presentation
Natural Science-minded
community members
10/1/2016 15 Audubon Texas Bird Nerd Lecture Series – presentation
Yacht Brokers 10/19/2016 1 NDZ discussion with President Gulf Coast Yacht Brokers
Association

19 | B W E C F i n a l R e p o r t
Houston Zoo Employees 10/26/2017 20 Greater Houst5on Chapter of American Association of Zoo
Keepers lunch and learn – presentation
Oil Spill Response
Professionals
12/1/2016 70 Central Texas Coastal Area Committee quarterly meeting –
presentation
Seafood Professionals Ongoing 6 NDZ discussion with President of Louisiana Foods, owner of
Crazy Alan’s Swamp Shack, owner of Tommy’s Restaurant
and Oyster Bar, Director of Biology at Landry’s Restaurants,
owner of Captain Benny’s Seafood, and owner of Jeri’s
Seafood
Conservation Professionals Ongoing 2 NDZ discussion with presidents of Gulf of Mexico Reef Fish
Shareholders’ Alliance and Coastal Conservation Association
of Texas-Galveston
Marina Managers Ongoing 24 NDZ discussion with Lakewood Yacht Club, Marina Bay
Harbor Yacht Club, Seabrook Marina, South Shore Harbor
Marina, Nassau Bay Home and Marina Association,
Galveston Yacht Basin, and Harborwalk Yacht Club
Commercial Fishers Ongoing 2 NDZ discussions with owner of Hillman’s Oysters and owner
of Captain Ron’s Shrimp
Industrial Shippers Ongoing 1 NDZ discussions with Environmental Affairs Director at Port
of Houston Authority
Total 257
3.3 Enforcement Efforts Carried Out During this grant cycle, GBF focused efforts on collecting data regarding the potential designation of
Galveston Bay as a Federal No Discharge Zone. Specifically, we attempted to strengthen the draft
application created during Cycle 19 by ensuring our numbers of pump-out facilities, recreational boaters,
and estimates of MSDs by type were accurate. However, it became clear that we had little knowledge on
how an NDZ designation would impact the enormous commercial industry present in the Bay, and so our
focus quickly shifted towards collecting more information on this sector as it relates to waste management
and vessel sewage. GBF scheduled and carried out numerous meetings with members of the seafood
distribution, restaurant, commercial fishing, enforcement, and tourism industry to discuss the NDZ
initiative and to open up a dialogue with these individuals to better address any questions or concerns they
may have. A list of these meetings and their outcomes can be found in Table 10. These discussions were
generally very positive, with the majority of stakeholders indicating that they would likely support this
type of initiative. However, nearly every stakeholder also mentioned that it may be difficult to get all Bay
users onboard, and that an NDZ designation will likely take quite some time and may present unintended
consequences against low-income members of the commercial boating industry.
Therefore, GBF will continue these discussions with a broader range of stakeholders, and attempt to
address any potential concerns as they arise. GBF also drafted a white paper on NDZ implementation
throughout the country to answer various questions that city officials, commercial boaters, and
recreational vessel owners may have about an NDZ. This document is currently going through a round of
revisions and is not meant for mass distribution. During this cycle, GBF also reached out to individuals
who worked on NDZ designations in Massachusetts, California, Washington State, Maryland, and
Virginia to gather more information on how these states incorporate commercial vessels into their
designations and what obstacles they faced throughout the process. GBF is still currently working with
commercial groups to determine the best path forward regarding the NDZ, and to collect additional data
on boating activity in the Bay that would strengthen any potentially submitted designation application.
Throughout this cycle, GBF kept TCEQ and the EPA updated on the status of the NDZ draft application.
GBF was able to identify contacts at both agencies who would receive the designation once submitted,
though both contacts are generally unfamiliar with the designation process and will most likely be
learning as they go.
Throughout this cycle, GBF continued to network with the entities listed in Table 10 that either can
directly enforce illegal dumping of boat sewage or that can influence policy in some way. We will
continue to keep these lines of communication open as we move forward with advocating for increased
enforcement.
20 | B W E C F i n a l R e p o r t
Table 10. Entities that can enforce or influence enforcement practices and are in communication with BWEC
Last First Organization
Bower Justin Houston Galveston Area Council
Brooks Chris Food and Drug Administration (Shellfish Specialist) – Dallas Region
Capuzzi Nicholas U.S. Coast Guard
Carol Karen Brazoria County Environmental Health
Carrier Mary Texas Parks and Wildlife – Boater Education
Easley Gregg Texas Commission on Environmental Quality
FitzSimmons-Evans Lori Galveston County Health Department
Galindo David Texas Commission on Environmental Quality
Hall Lynda Lakewood Yacht Club/Clear Lake Marina Association/MAT
Hockersmith Kyle City of Galveston
Johnston Steve Houston Galveston Area Council
Laird Kim Texas Commission on Environmental Quality
Mitchell Steven Texas Parks and Wildlife Department: Kills and Spills
Morris Chip Texas Commission on Environmental Quality
Paige Helen Marina Bay Harbor/Marina Association of Texas
Pollock Greg General Land Office
Sibley Nancy Harris County Pollution Control
Tunze Rex Chambers County Environmental Health
Wheeler Jennifer Harris County Pollution Control
Wiles Kirk Texas Department of State Health Services
Wright Jean Houston Galveston Area Council
Task 4. Facilitate Volunteer Programs
Volunteer programs can be a very cost effective way to increase the visibility of a campaign and spread
your message further. When the BWEC began in 2007, the only volunteer components were the BWEC
Workgroup and occasional volunteers to assist with education booths and assembling outreach materials.
There are now five additional volunteer programs: Galveston Bay Action Network, Dockwalkers, GBF
Water Monitoring Team (2,442), Volunteer Water Quality Internships (160 hours), and Marina Service
Learning Days, three of which were launched just last cycle. BWEC volunteer programs generated a total
of over 2,600 volunteer hours during this funding cycle and engaged more than 60 volunteers through four
volunteer programs, citizen pollution reporters on GBAN, and the Boater Waste Workgroup. Each of the
volunteer programs is described below.
4.1 GBF Dockwalkers Dockwalkers is a volunteer program for boaters to educate other boaters on environmentally sound practices
through positive “pier” pressure, to provide them with physical tools to keep the bay fishable and
swimmable, and to collect local statistics to aid in environmental planning. GBF’s program is based off a
very successful similar program in California, but has been modified to focus on the immediate water
quality needs of the Galveston Bay area. GBF trains volunteers, particularly from boating organizations or
companies, to take quality controlled surveys. The survey contains questions that helps GBF obtain data to
improve the Pump Don’t Dump campaign, provide marinas with data on pump-out usage and functionality,
and collect statistics to be considered in the process of applying for a Galveston Bay No Discharge Zone.
21 | B W E C F i n a l R e p o r t
Dockwalkers ask boaters to take a few minutes to fill out the educational survey (Appendix II) and the
boaters receive a Clean Boater Kit (BWEC education materials, Pump Don’t Dump zip tie for discharge
valve, dye tablet, and bilge oil absorbent pad) (Figure 1) in exchange for their participation. Dockwalkers
are also trained to submit water pollution reports through GBAN. Details on the survey sampling design
can be reviewed in the Dockwalker Plan found in Appendix II.
Table 11 shows the Dockwalker volunteers and survey plan, while Table 12 shows the Dockwalker training
and survey schedule. GBF’s Summer 2016 Water Quality Outreach Intern surveyed local boaters and
compiled the results and lessons learned. This information was used to tweak and improve the program and
we have since determined that the Dockwalker Program is most effectively employed when GBF staff,
interns and a small number of highly engaged volunteers are utilized. We will no longer, therefore, try to
recruit and maintain a large volunteer team. This also helps GBF ensure that the data collected is high
quality. GBF has posted the survey on its website to increase its reach within the boating community, and
has also received applications for a summer intern to assist with this program during the summer of 2017.
Up-to-date results since the program’s establishment are summarized under Task 5.
Table 11. Dockwalker volunteers and survey plan
Name Organization Survey Schedule Target Locations
Sarah Gossett Galveston Bay Foundation (staff) As needed GBF random sampling plan
Nate Johnson Galveston Bay Foundation (staff) As needed GBF random sampling plan
Kaitlin Grable Galveston Bay Foundation (staff) As needed GBF random sampling plan
Raymond Underwood Galveston Bay Sail and Power
Squadron
Spring 2016 at the
Southwest International
Boat Show – volunteer
under Candy Day
2016 SWIBS
Robert Stevenson Galveston Bay Sail and Power
Squadron
Spring 2016 at the
Southwest International
Boat Show – volunteer
under Candy Day
2016 SWIBS
Linton Arbaugh Galveston Bay Sail and Power
Squadron
Spring 2016 at the
Southwest International
Boat Show – volunteer
under Candy Day
2016 SWIBS
James Stanley Galveston Bay Sail and Power
Squadron
Spring 2016 at the
Southwest International
Boat Show – volunteer
under Candy Day
2016 SWIBS
Mary Carrier Galveston Bay Sail and Power
Squadron
Spring 2016 at the
Southwest International
Boat Show – volunteer
under Candy Day
2016 SWIBS
Susan Morawski Galveston Bay Sail and Power
Squadron
Spring 2016 at the
Southwest International
Boat Show – volunteer
under Candy Day
2016 SWIBS
John Morawski Galveston Bay Sail and Power
Squadron
Spring 2016 at the
Southwest International
Boat Show – volunteer
under Candy Day
2016 SWIBS
Kelsey McCraw Galveston Bay Foundation (intern) Summer 2016 (inactive) GBF random sampling plan
Amber Faubion Individual (former Marina Del Sol
marina manager)
inactive Marina Del Sol
Bill Haddock Houston Sail and Power Squadron 10/month during boating
season
Wherever conducting
Vessel Safety Checks
Caitlyn Suttle Onward/Maritime
inactive
Wherever conducting
vessel pump-outs
Chris Machol Onward/Maritime Wherever conducting
vessel pump-outs
22 | B W E C F i n a l R e p o r t
James Carlton Onward/Maritime Wherever conducting
vessel pump-outs
Jonathan Christopher Onward/Maritime Wherever conducting
vessel pump-outs
Matthew McLemore Onward/Maritime Wherever conducting
vessel pump-outs
Sean Fitzgerald Onward/Maritime Wherever conducting
vessel pump-outs
Sterling Walker Onward/Maritime Wherever conducting
vessel pump-outs
Candy Capuano Day Galveston Bay Sail and Power
Squadron
Whenever conducting
Vessel Safety Checks or at
boat shows
Wherever conducting
Vessel Safety Checks or at
boat shows
Table 12. Dockwalker trainings and survey schedule
Date Event Site Dockwalkers # Volunteer Interactions #
Surveys
10/3/2015 Surveying Bal Harbor Marina Candy Capuano Day – GB
Sail and Power Squadron
1 1
3/17 –
3/20/2016
Surveying Southwest
International Boat
Show
Candy Capuano Day – GB
Sail and Power Squadron
8 52
7/1 – 7/2/2016 Surveying Galveston Yacht
Basin
Kelsey McCraw –
Galveston Bay Foundation
(intern)
1 25
7/8 – 7/9/2016 Surveying Harborwalk Yacht
Club
Kelsey McCraw –
Galveston Bay Foundation
(intern)
1 7
7/15 – 16,
7/22/2016
Surveying Seabrook Marina and
Watergate Yachting
Center
Kelsey McCraw –
Galveston Bay Foundation
(intern)
1 14
9/24 – 25/2016 Surveying Southwest
International Boat
Show
Candy Capuano Day – GB
Sail and Power Squadron
1 17
Sep 2016 –
March 2017
Surveying Online 0 62
TOTAL 13 178
4.2 GBF Water Monitoring Team The GBF Water Monitoring Team (a group within the Texas Stream Team) was launched in February 2012,
with the Bacteria Sampling Program launching shortly thereafter in January 2013. There are four main
goals for collecting water quality data through these programs for the BWEC:
1.) To engage citizens in a hands-on program that empowers them to be Bay Ambassadors
2.) To create a line of communication between GBF, boaters, and marinas on a regular basis
3.) To establish baseline data trends at marinas and other near-shore recreational sites in Clear Lake
and Galveston Bay
4.) To detect potential bacteria impairments in marinas and other near-shore recreational sites in Clear
Lake and Galveston Bay
GBF Water Monitoring Team volunteers are certified to sample at sites around the bay and Clear Lake for
core parameters (temperature, pH, dissolved oxygen, salinity, transparency, and field observations), as well
as enterococci bacteria. Core certification consists of a full day, two-phase group training session and a
one-on-one Phase III training at the volunteer’s site with a GBF staff member. This training process is based
on the Texas Stream Team training protocol. During the Phase I and II session, volunteers learn about water
quality in the Bay, the importance and expectations of being on the Water Monitoring Team, and what each
of the parameters that they will measure means. Then they practice the sampling techniques as a group with
23 | B W E C F i n a l R e p o r t
tap water samples, going through each procedure step-by-step as GBF staff demonstrate the proper
techniques and observe their techniques for quality control (Figure 14). Finally, they learn how to properly
take a bucket grab sample and record field observations, and then work with a partner to complete the core
techniques on a field sample. GBF staff members observe and compare their results to an advanced monitor
for quality control. During Phase III each volunteer is encouraged to use their field guide to demonstrate
the entire sampling process from beginning to end with the GBF staff member observing and not giving
any input (Figure 16). They receive feedback at the end on any improvements needed and GBF staff
determines if they meet the quality control checks to become a certified Water Monitoring Team volunteer.
They commit to sampling their site(s) on at least a monthly basis. GBF's team is part of the Texas Stream
Team because of its partnership with the Houston Galveston Area Council’s region. However, GBF also
has its own Volunteer Bacteria Sampling Program. The monitoring team currently has 56 volunteers
sampling from 58 locations, 23 of whom have advanced certification to collect bacteria samples. A full map
of monitoring locations can be accessed at http://www.galvbay.org/watermonitors. The entire monitoring
program is conducted under an EPA-approved Quality Assurance Project Plan and Quality Management
Plan.
The WMT has allowed GBF to develop a strong relationship with the local chapter of Master Naturalists,
who are also interested in preserving, protecting, and enhancing Galveston Bay. Implementation of the
WMT has allowed GBF to better connect with many marina and waterfront restaurant owners around
Galveston Bay to provide sampling sites and promote clean water (Figure 18). GBF continues to make
improvements to the management and processes within the WMT, including the creation and maintenance
of a Water Monitoring Action Plan, to outline desired measurable results from monitoring (Appendix III).
This document is a working document, and will continue to be evaluated and revised in the coming years.
GBF plans to continue training new volunteers to fill in some of the gaps around the Galveston Bay coastline
and marinas that are not yet monitored, as well as to refill sites if volunteers decide to stop monitoring.
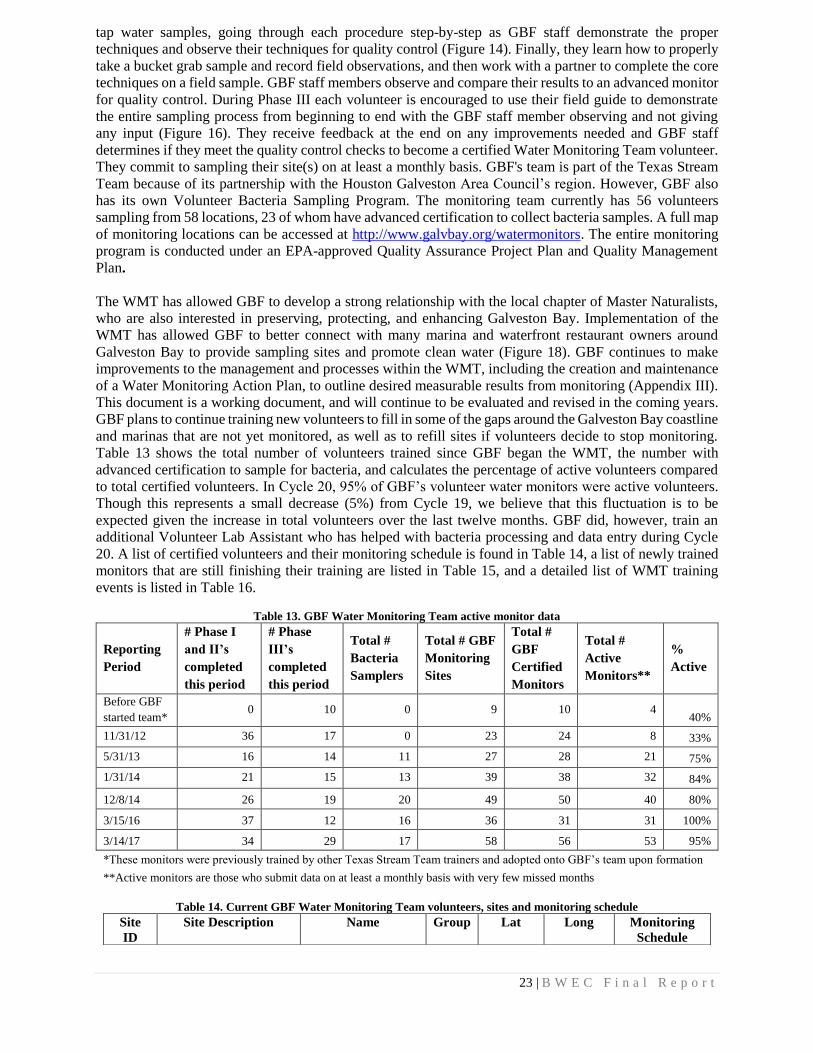
Table 13 shows the total number of volunteers trained since GBF began the WMT, the number with
advanced certification to sample for bacteria, and calculates the percentage of active volunteers compared
to total certified volunteers. In Cycle 20, 95% of GBF’s volunteer water monitors were active volunteers.
Though this represents a small decrease (5%) from Cycle 19, we believe that this fluctuation is to be
expected given the increase in total volunteers over the last twelve months. GBF did, however, train an
additional Volunteer Lab Assistant who has helped with bacteria processing and data entry during Cycle
20. A list of certified volunteers and their monitoring schedule is found in Table 14, a list of newly trained
monitors that are still finishing their training are listed in Table 15, and a detailed list of WMT training
events is listed in Table 16.
Table 13. GBF Water Monitoring Team active monitor data
Reporting
Period
# Phase I
and II’s
completed
this period
# Phase
III’s
completed
this period
Total #
Bacteria
Samplers
Total # GBF
Monitoring
Sites
Total #
GBF
Certified
Monitors
Total #
Active
Monitors**
%
Active
Before GBF
started team* 0 10 0 9 10 4
40%
11/31/12 36 17 0 23 24 8 33%
5/31/13 16 14 11 27 28 21 75%
1/31/14 21 15 13 39 38 32 84%
12/8/14 26 19 20 49 50 40 80%
3/15/16 37 12 16 36 31 31 100%
3/14/17 34 29 17 58 56 53 95%
*These monitors were previously trained by other Texas Stream Team trainers and adopted onto GBF’s team upon formation
**Active monitors are those who submit data on at least a monthly basis with very few missed months
Table 14. Current GBF Water Monitoring Team volunteers, sites and monitoring schedule
Site
ID
Site Description Name Group Lat Long Monitoring
Schedule
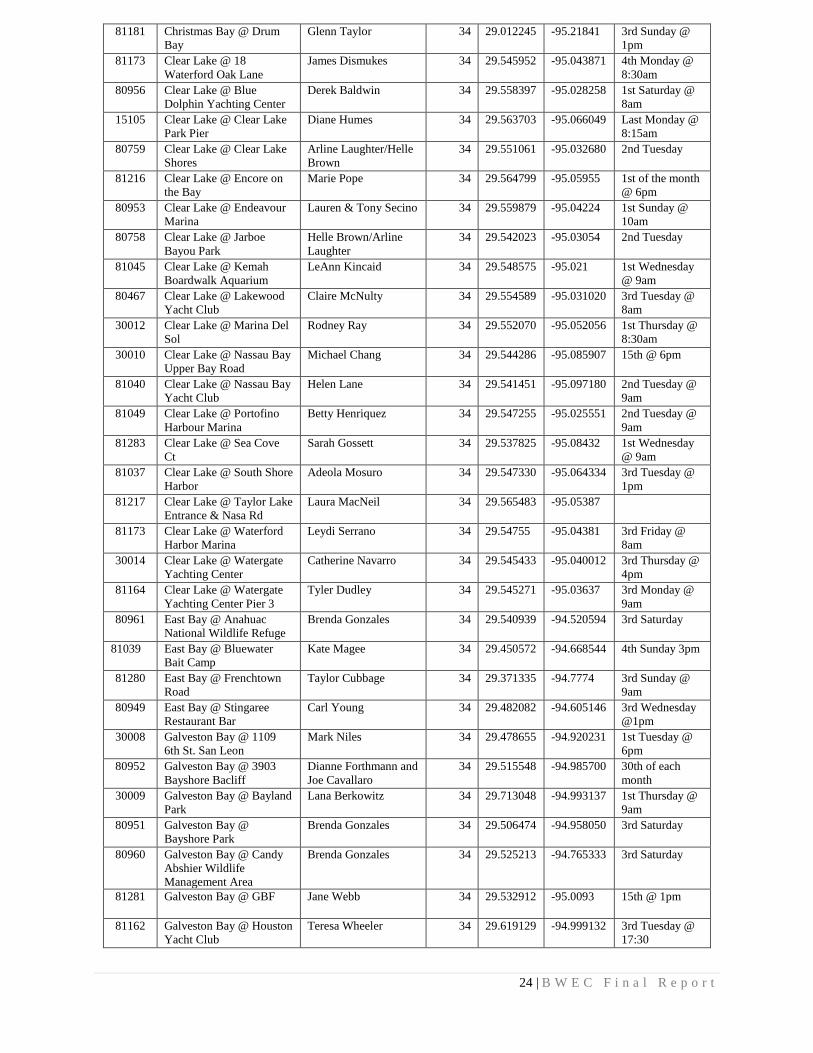
24 | B W E C F i n a l R e p o r t
81181 Christmas Bay @ Drum
Bay
Glenn Taylor 34 29.012245 -95.21841 3rd Sunday @
1pm
81173 Clear Lake @ 18
Waterford Oak Lane
James Dismukes 34 29.545952 -95.043871 4th Monday @
8:30am
80956 Clear Lake @ Blue
Dolphin Yachting Center
Derek Baldwin 34 29.558397 -95.028258 1st Saturday @
8am
15105 Clear Lake @ Clear Lake
Park Pier
Diane Humes 34 29.563703 -95.066049 Last Monday @
8:15am
80759 Clear Lake @ Clear Lake
Shores
Arline Laughter/Helle
Brown
34 29.551061 -95.032680 2nd Tuesday
81216 Clear Lake @ Encore on
the Bay
Marie Pope 34 29.564799 -95.05955 1st of the month
@ 6pm
80953 Clear Lake @ Endeavour
Marina
Lauren & Tony Secino 34 29.559879 -95.04224 1st Sunday @
10am
80758 Clear Lake @ Jarboe
Bayou Park
Helle Brown/Arline
Laughter
34 29.542023 -95.03054 2nd Tuesday
81045 Clear Lake @ Kemah
Boardwalk Aquarium
LeAnn Kincaid 34 29.548575 -95.021 1st Wednesday
@ 9am
80467 Clear Lake @ Lakewood
Yacht Club
Claire McNulty 34 29.554589 -95.031020 3rd Tuesday @
8am
30012 Clear Lake @ Marina Del
Sol
Rodney Ray 34 29.552070 -95.052056 1st Thursday @
8:30am
30010 Clear Lake @ Nassau Bay
Upper Bay Road
Michael Chang 34 29.544286 -95.085907 15th @ 6pm
81040 Clear Lake @ Nassau Bay
Yacht Club
Helen Lane 34 29.541451 -95.097180 2nd Tuesday @
9am
81049 Clear Lake @ Portofino
Harbour Marina
Betty Henriquez 34 29.547255 -95.025551 2nd Tuesday @
9am
81283 Clear Lake @ Sea Cove
Ct
Sarah Gossett 34 29.537825 -95.08432 1st Wednesday
@ 9am
81037 Clear Lake @ South Shore
Harbor
Adeola Mosuro 34 29.547330 -95.064334 3rd Tuesday @
1pm
81217 Clear Lake @ Taylor Lake
Entrance & Nasa Rd
Laura MacNeil 34 29.565483 -95.05387
81173 Clear Lake @ Waterford
Harbor Marina
Leydi Serrano 34 29.54755 -95.04381 3rd Friday @
8am
30014 Clear Lake @ Watergate
Yachting Center
Catherine Navarro 34 29.545433 -95.040012 3rd Thursday @
4pm
81164 Clear Lake @ Watergate
Yachting Center Pier 3
Tyler Dudley 34 29.545271 -95.03637 3rd Monday @
9am
80961 East Bay @ Anahuac
National Wildlife Refuge
Brenda Gonzales 34 29.540939 -94.520594 3rd Saturday
81039 East Bay @ Bluewater
Bait Camp
Kate Magee 34 29.450572 -94.668544 4th Sunday 3pm
81280 East Bay @ Frenchtown
Road
Taylor Cubbage 34 29.371335 -94.7774 3rd Sunday @
9am
80949 East Bay @ Stingaree
Restaurant Bar
Carl Young 34 29.482082 -94.605146 3rd Wednesday
@1pm
30008 Galveston Bay @ 1109
6th St. San Leon
Mark Niles 34 29.478655 -94.920231 1st Tuesday @
6pm
80952 Galveston Bay @ 3903
Bayshore Bacliff
Dianne Forthmann and
Joe Cavallaro
34 29.515548 -94.985700 30th of each
month
30009 Galveston Bay @ Bayland
Park
Lana Berkowitz 34 29.713048 -94.993137 1st Thursday @
9am
80951 Galveston Bay @
Bayshore Park
Brenda Gonzales 34 29.506474 -94.958050 3rd Saturday
80960 Galveston Bay @ Candy
Abshier Wildlife
Management Area
Brenda Gonzales 34 29.525213 -94.765333 3rd Saturday
81281 Galveston Bay @ GBF Jane Webb 34 29.532912 -95.0093 15th @ 1pm
81162 Galveston Bay @ Houston
Yacht Club
Teresa Wheeler 34 29.619129 -94.999132 3rd Tuesday @
17:30
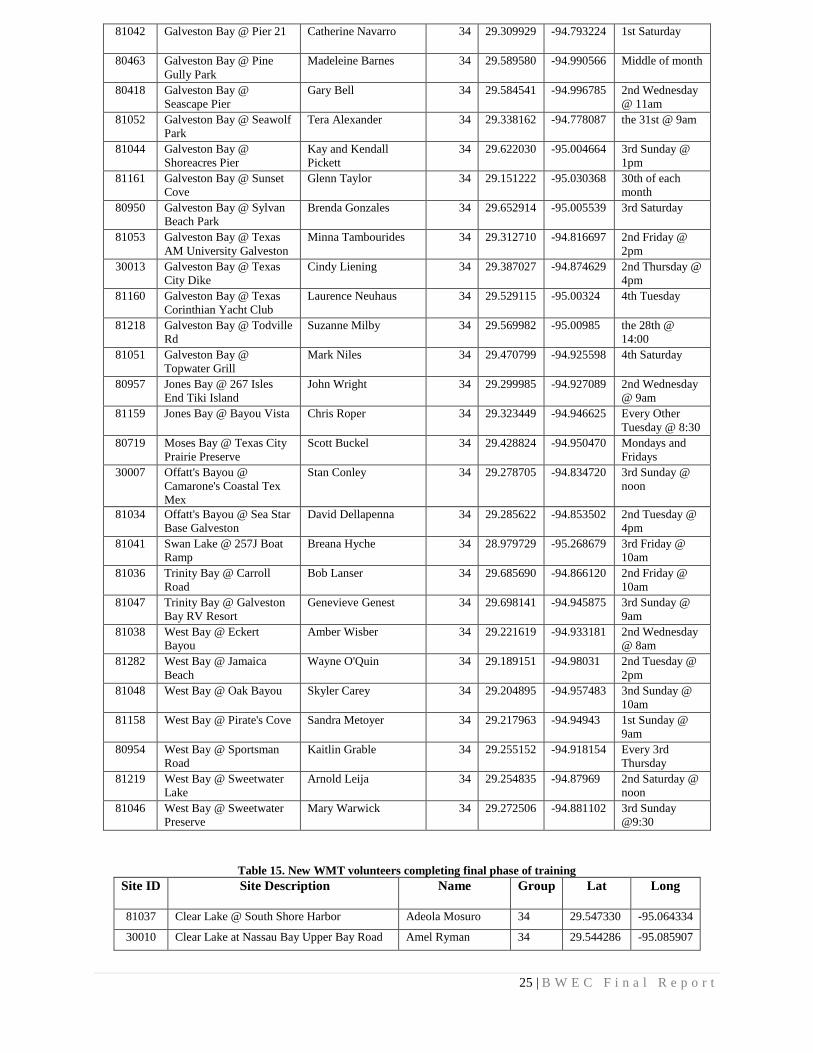
25 | B W E C F i n a l R e p o r t
81042 Galveston Bay @ Pier 21 Catherine Navarro 34 29.309929 -94.793224 1st Saturday
80463 Galveston Bay @ Pine
Gully Park
Madeleine Barnes 34 29.589580 -94.990566 Middle of month
80418 Galveston Bay @
Seascape Pier
Gary Bell 34 29.584541 -94.996785 2nd Wednesday
@ 11am
81052 Galveston Bay @ Seawolf
Park
Tera Alexander 34 29.338162 -94.778087 the 31st @ 9am
81044 Galveston Bay @
Shoreacres Pier
Kay and Kendall
Pickett
34 29.622030 -95.004664 3rd Sunday @
1pm
81161 Galveston Bay @ Sunset
Cove
Glenn Taylor 34 29.151222 -95.030368 30th of each
month
80950 Galveston Bay @ Sylvan
Beach Park
Brenda Gonzales 34 29.652914 -95.005539 3rd Saturday
81053 Galveston Bay @ Texas
AM University Galveston
Minna Tambourides 34 29.312710 -94.816697 2nd Friday @
2pm
30013 Galveston Bay @ Texas
City Dike
Cindy Liening 34 29.387027 -94.874629 2nd Thursday @
4pm
81160 Galveston Bay @ Texas
Corinthian Yacht Club
Laurence Neuhaus 34 29.529115 -95.00324 4th Tuesday
81218 Galveston Bay @ Todville
Rd
Suzanne Milby 34 29.569982 -95.00985 the 28th @
14:00
81051 Galveston Bay @
Topwater Grill
Mark Niles 34 29.470799 -94.925598 4th Saturday
80957 Jones Bay @ 267 Isles
End Tiki Island
John Wright 34 29.299985 -94.927089 2nd Wednesday
@ 9am
81159 Jones Bay @ Bayou Vista Chris Roper 34 29.323449 -94.946625 Every Other
Tuesday @ 8:30
80719 Moses Bay @ Texas City
Prairie Preserve
Scott Buckel 34 29.428824 -94.950470 Mondays and
Fridays
30007 Offatt's Bayou @
Camarone's Coastal Tex
Mex
Stan Conley 34 29.278705 -94.834720 3rd Sunday @
noon
81034 Offatt's Bayou @ Sea Star
Base Galveston
David Dellapenna 34 29.285622 -94.853502 2nd Tuesday @
4pm
81041 Swan Lake @ 257J Boat
Ramp
Breana Hyche 34 28.979729 -95.268679 3rd Friday @
10am
81036 Trinity Bay @ Carroll
Road
Bob Lanser 34 29.685690 -94.866120 2nd Friday @
10am
81047 Trinity Bay @ Galveston
Bay RV Resort
Genevieve Genest 34 29.698141 -94.945875 3rd Sunday @
9am
81038 West Bay @ Eckert
Bayou
Amber Wisber 34 29.221619 -94.933181 2nd Wednesday
@ 8am
81282 West Bay @ Jamaica
Beach
Wayne O'Quin 34 29.189151 -94.98031 2nd Tuesday @
2pm
81048 West Bay @ Oak Bayou Skyler Carey 34 29.204895 -94.957483 3nd Sunday @
10am
81158 West Bay @ Pirate's Cove Sandra Metoyer 34 29.217963 -94.94943 1st Sunday @
9am
80954 West Bay @ Sportsman
Road
Kaitlin Grable 34 29.255152 -94.918154 Every 3rd
Thursday
81219 West Bay @ Sweetwater
Lake
Arnold Leija 34 29.254835 -94.87969 2nd Saturday @
noon
81046 West Bay @ Sweetwater
Preserve
Mary Warwick 34 29.272506 -94.881102 3rd Sunday
@9:30
Table 15. New WMT volunteers completing final phase of training
Site ID Site Description Name Group Lat Long
81037 Clear Lake @ South Shore Harbor Adeola Mosuro 34 29.547330 -95.064334
30010 Clear Lake at Nassau Bay Upper Bay Road Amel Ryman 34 29.544286 -95.085907
26 | B W E C F i n a l R e p o r t
81219 West Bay @ Sweetwater Lake Arnold Leija 34 29.254835 -94.879686
81049 Clear Lake at Portofino Harbor Betty Henriquez 34 29.547255 -95.025551
81048 Lab Assistant (West Bay @ Oak Bayou) Cassandra Carey 34 29.204895 -94.957483
81042 Galveston Bay @ Pier 21 Catherine Navarro 34 29.309929 -94.793224
81039 East Bay @ Bluewater Kate Magee 34 29.450572 -94.668544
30009 Galveston Bay @ Bayland Park Lana Berkowitz 34 29.713048 -94.993137
80953 Clear Lake at Endeavor Marina Lauren Secino 34 29.55988 -95.04224
81216 Clear Lake at Encore On the Bay Marie Pope 34 29.5648 -95.05955
80953 Clear Lake at Endeavor Marina Michael Secino 34 29.55988 -95.04224
80959 Offat's Bayou at Pelican Rest Marina Minna Tambourides 34 29.284831 -94.856150
30012 Clear Lake @ Marina del Sol Rodney Ray 34 29.552070 -95.052056
30007 Offatts Bayou @ Camorone's Stan Conley 34 29.27871 -94.834720
81218 Galveston Bay @ 2612 Todville Road Suzanne Milby 34 29.56482 -95.01354
81052 Galveston Bay @ Seawolf Park Tera Alexander 34 29.338162 -94.778087
81162 Galveston Bay @ Houston Yacht Club Teresa Wheeler 34 29.619129 -94.999132
81280 East Bay @ Frenchtown Road Taylor Cubbage 34 29.371335 -94.777401
80956 Clear Lake @ Blue Dolphin Yachting Center Derek Baldwin 34 29.558397 -95.028258
81173 Clear Lake @ Waterford Marina Leydi Serrano 34 29.54755 -95.043812
81041 Swan Lake @ 257J County Boat Ramp Breana Hyche 34 28.979729 -95.268679
81034 Offatts Bayou @ Sea Star Base Galveston David Dellapenna 34 29.853502 -94.853502
30010 Clear Lake @ Nassau Bay Upper Bay Rd Michael Chang 34 29.544286 -95.085907
81282 West Bay @ Jamaica Beach Wayne O’Quin 34 29.189151 -94.980308
80467 Clear Lake @ Lakewood Yacht Club Claire McNulty 34 29.554589 -95.031020
81281 Galveston Bay @ GBF Jane Webb 34 29.532912 -95.009303
80949 East Bay @ Stingaree Restaurant Carl Young 34 29.482082 -94.605146
81217 Clear Lake @ Taylor Lake Entrance Laura MacNeil 34 29.565483 -95.053867
Table 16. GBF Water Monitoring Team training events
Date GBF Staff Event Location #
Volunteers
10/9/2015 Sarah Gossett Bacteria Sampler Training GBF Office 3
11/19/2015 Sarah Gossett Quality Control Training Marina del
Sol
5
12/12/2015 Sarah Gossett Quality Control Training Marina del
Sol
7
1/27/2016 Sarah Gossett Quality Control Training Marina del
Sol
6
2/25/2016 Sarah Gossett,
Charlene Bohanon
Texas Stream Team Phase I & II
training
Star Fleet
Marina
21
3/4/2016 Sarah Gossett Bacteria Sampler and Volunteer Lab
Assistant Training
GBF Office 2
3/30/2016 Sarah Gossett Texas Stream Team Phase III
Training
Todville Rd 1
3/31/2016 Sarah Gossett Texas Stream Team Phase III
Training
Seawolf Park 1
3/31/2016 Sarah Gossett Texas Stream Team Phase III
Training
Bluewater
Bait Camp
1
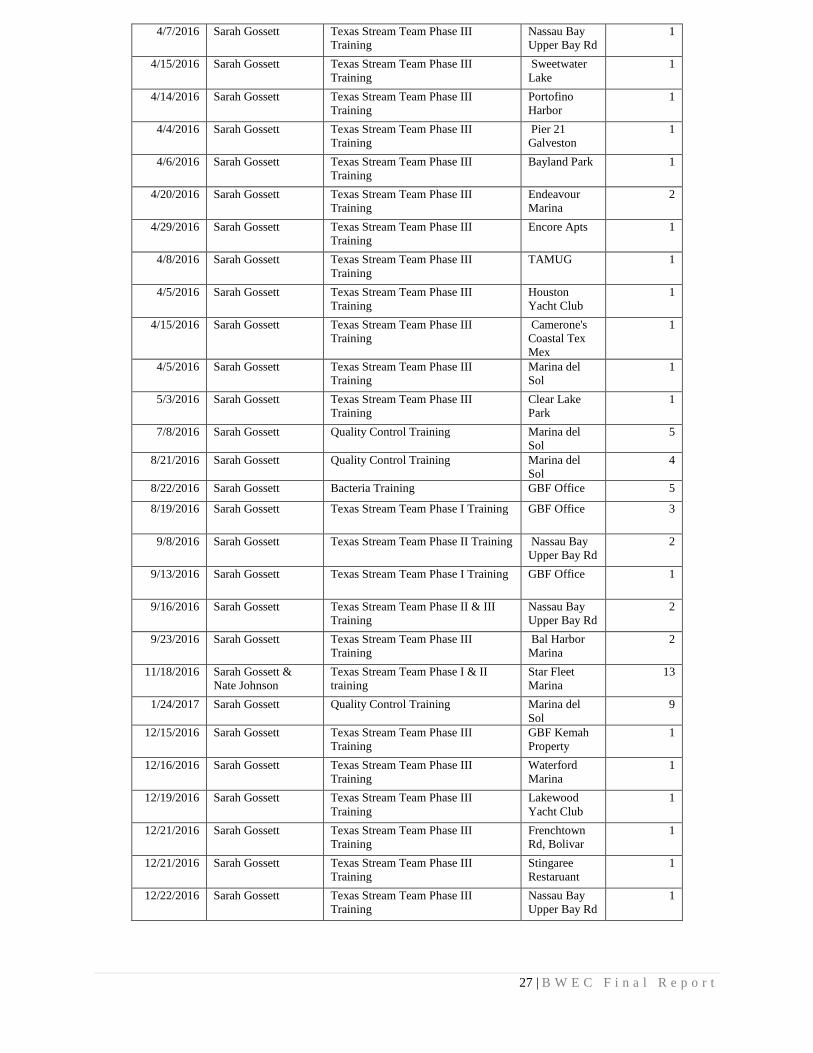
27 | B W E C F i n a l R e p o r t
4/7/2016 Sarah Gossett Texas Stream Team Phase III
Training
Nassau Bay
Upper Bay Rd
1
4/15/2016 Sarah Gossett Texas Stream Team Phase III
Training
Sweetwater
Lake
1
4/14/2016 Sarah Gossett Texas Stream Team Phase III
Training
Portofino
Harbor
1
4/4/2016 Sarah Gossett Texas Stream Team Phase III
Training
Pier 21
Galveston
1
4/6/2016 Sarah Gossett Texas Stream Team Phase III
Training
Bayland Park 1
4/20/2016 Sarah Gossett Texas Stream Team Phase III
Training
Endeavour
Marina
2
4/29/2016 Sarah Gossett Texas Stream Team Phase III
Training
Encore Apts 1
4/8/2016 Sarah Gossett Texas Stream Team Phase III
Training
TAMUG 1
4/5/2016 Sarah Gossett Texas Stream Team Phase III
Training
Houston
Yacht Club
1
4/15/2016 Sarah Gossett Texas Stream Team Phase III
Training
Camerone's
Coastal Tex
Mex
1
4/5/2016 Sarah Gossett Texas Stream Team Phase III
Training
Marina del
Sol
1
5/3/2016 Sarah Gossett Texas Stream Team Phase III
Training
Clear Lake
Park
1
7/8/2016 Sarah Gossett Quality Control Training Marina del
Sol
5
8/21/2016 Sarah Gossett Quality Control Training Marina del
Sol
4
8/22/2016 Sarah Gossett Bacteria Training GBF Office 5
8/19/2016 Sarah Gossett Texas Stream Team Phase I Training GBF Office 3
9/8/2016 Sarah Gossett Texas Stream Team Phase II Training Nassau Bay
Upper Bay Rd
2
9/13/2016 Sarah Gossett Texas Stream Team Phase I Training GBF Office 1
9/16/2016 Sarah Gossett Texas Stream Team Phase II & III
Training
Nassau Bay
Upper Bay Rd
2
9/23/2016 Sarah Gossett Texas Stream Team Phase III
Training
Bal Harbor
Marina
2
11/18/2016 Sarah Gossett &
Nate Johnson
Texas Stream Team Phase I & II
training
Star Fleet
Marina
13
1/24/2017 Sarah Gossett Quality Control Training Marina del
Sol
9
12/15/2016 Sarah Gossett Texas Stream Team Phase III
Training
GBF Kemah
Property
1
12/16/2016 Sarah Gossett Texas Stream Team Phase III
Training
Waterford
Marina
1
12/19/2016 Sarah Gossett Texas Stream Team Phase III
Training
Lakewood
Yacht Club
1
12/21/2016 Sarah Gossett Texas Stream Team Phase III
Training
Frenchtown
Rd, Bolivar
1
12/21/2016 Sarah Gossett Texas Stream Team Phase III
Training
Stingaree
Restaruant
1
12/22/2016 Sarah Gossett Texas Stream Team Phase III
Training
Nassau Bay
Upper Bay Rd
1

28 | B W E C F i n a l R e p o r t
1/4/2017 Sarah Gossett Texas Stream Team Phase III
Training
257J Boat
Ramp, Swan
Lake
1
1/5/2017 Sarah Gossett Texas Stream Team Phase III
Training
Blue Dolphin
Marina
1
1/10/2017 Sarah Gossett Texas Stream Team Phase III
Training
Sea Star Base
Galveston
1
1/10/2017 Sarah Gossett Texas Stream Team Phase III
Training
Jamaica
Beach
1
1/18/2017 Sarah Gossett Texas Stream Team Phase III
Training
Stingaree
Restaruant
1
Total 117
In Cycle 19, GBF participated in a webinar series titled Monitoring That Guarantees Measurable Results,
hosted by River Network. This five-part series facilitated the creation of a comprehensive monitoring plan
that will guide GBF water monitoring efforts to measurable results. The creation of this plan outlines the
strengths and limitations of the WMT data through a series of desired outcomes. For each desired outcome,
the monitoring plan lays out monitoring questions, targeted decision makers, information needed and
further required action to accomplish the outcome. The Action Plan created as a result of this webinar series
is included in Appendix III. This has driven the work of the Water Quality Volunteer Coordinator as well
as the actions of the Water Monitoring Team throughout Cycle 20. GBF has also decided to host a summer
intern in 2017 to examine water quality throughout the Bay, specifically within marinas, to carry out some
of the steps outlined in the Action Plan. GBF understands that this Action Plan is a working document that
will continue to evolve with the Water Monitoring Team, though GBF has already seen the benefits of this
plan in action as staff are better able to communicate the need and purpose of our team to both volunteers
and the community as a whole. The Action Plan outlines an estimated timeline for when each component
will be completed and these enhancements to the Water Monitoring Team will continue to be carried out
during Cycle 21. Finally, GBF submitted an application to the National Academy of Sciences for their Gulf
Research Program’s Capacity Building Grant Program to engage local stakeholders in water quality issues
surrounding Galveston Bay. If funded, this would greatly enhance GBF’s ability to maintain and expand
our Water Monitoring Team.
4.3 Water Quality Internships During this grant cycle, GBF hosted one Water Quality Outreach Intern (WQOI) in the summer of 2016.
These internships allow students to conduct background research related to social marketing for
environmental causes and to conduct Dockwalker surveys and outreach in marinas. These interns have
proved to be the most efficient way to collect quality survey data for the Dockwalker program, so this will
be GBF’s primary focus for future summer WQOI. The results of the 2016 WQOI’s work is referenced in
Task 5 with the Dockwalker data discussion, and the full report developed by the WQOI can be found in
Appendix II. This individual also assisted with social media marketing and outreach initiatives for the
Pump Don’t Dump, GBAN, and Dockwalker Programs. GBF’s Water Quality Research Internship
(WQRI) was started in 2013 because there was very little existing water quality data for marinas in the
Galveston Bay area. To our knowledge, the only study conducted took place over 20 years ago (Guillen et
al., 1993). That study was conducted over a three-month period, looking at various water quality
parameters in comparison to flow rates, in order to make recommendations for marina designs.
WQRIs provide university students the opportunity to develop and execute a short-term water quality
research project from start to finish, including planning, design, sampling, and data analysis components.
This program was started in order to provide the many university students in the Clear Lake/Galveston
Bay area an opportunity to participate in a hands-on, professional internship experience. Students are
introduced to the Upper Gulf Coast Oyster Water TMDL Implementation Plan and the BWEC, certified
to sample under GBF's QAPP, and carry out a project to help answer research questions related to the
BWEC. This internship program helps provide the BWEC Workgroup and Clean Vessel Committee with
focused data to help guide campaign activities, as well as track potential improvements in marina water
29 | B W E C F i n a l R e p o r t
quality over time in a more focused way than is possible with monthly ambient monitoring at just one site
per marina. The Boater Waste Impact Studies that were completed as a result of this internship program
are referenced under Task 5. After three successful years of conducting marina research through the
WQRIs, GBF made the tough decision to cut this part of the BWEC because of how resource intensive it
is in both supplies and staff time. However, GBF recently decided to begin this program again in the
summer of 2017 during Cycle 21, and is currently accepting applications for the position.
GBF did, however, host a student volunteer/intern during the fall of 2016 from a local high school. This
student monitored four different sites that were at the time inactive, and drafted a detailed summary report
at the end of her internship for class credit (report can be provded upon request). This internship was very
helpful, as it allowed GBF to continue monitoring a few inactive sites while providing valuable training
and research experience for an incredibly determined high school student hoping to pursue a career in
aquatic science.
Task 5. Track Behavior Change and Resulting
Environmental Improvements
GBF is continuously looking for ways to improve our tracking methods in order to better demonstrate
behavior change and environmental improvements resulting from the BWEC. Due to the nonpoint source,
transient nature of boater waste pollution, it can be difficult to attribute changes in water quality specifically
to this one source. This is compounded by the fact that water quality data in marinas are lacking. During
this funding cycle, GBF continued to carry out several volunteer programs that began in Cycle 17, which
will help increase the amount of water quality data and supporting data that can be collected in marinas.
The following sections will detail results for Cycle 20 and will address opportunities for improvement in
future cycles.
5.1 Galveston Bay Action Network (GBAN) GBAN serves as a tool to help the public report all types of pollution they see more easily. In the past,
people would often see pollution but have no idea who to call to report this pollution. To help with this,
GBF created a table of various contacts to call, based on the type of pollution and location. However, this
list was long, complex, and difficult to use leading to pollution often going unreported, and ultimately
with no response from authorities. Through GBAN, citizens are now able to easily report any pollution
they see, making them more likely to report it in the first place. Additionally, GBAN sends the reports to
the proper authority automatically, expediting the response time from the responding agency. In the past,
many pollution reports were sent to TCEQ, who would then have to determine who the report needed to
be sent to, increasing the amount of time before the proper authority would receive the report.
GBF launched the official GBAN website in December of 2014. During this cycle, the webpage has
received 1,618 page views. GBF launched three GBAN social media campaigns this cycle, one in October
of 2015, one in June 2016, and one in July 2016. Combined these campaigns received a reach of 88,288
on Facebook and Twitter, with 3,247 Facebook Likes/Comments/Shares and 1,930 post clicks. Previously
there had been no direct GBAN presence on GBF’s Facebook page. Since October 2015, GBAN has
received 46 reports. The most popular types of pollution reports were Oil/Sheen and Trash/Debris. GBF
looks forward to continuing its marketing campaign, including the creation of a more focused marketing
plan to increase usage of this pollution reporting tool.
In an effort to increase of the use of GBAN by the boater audience, GBAN has created new cards for
distribution that specifically target the boating community (Figure 5) and have increased GBAN
messaging within the Pump Don’t Dump campaign materials. During Cycle 20, GBF focused mainly on
distributing GBAN and Pump Don’t Dump materials at presentations and boothing exhibits. GBF
distributed the GBAN Citizen Engagement Toolkit to partner marinas and other boating groups to
increase marketing efforts for GBAN within the boating community specifically. To date, six
organizations have used this toolkit to market GBAN on their website: Maritime Sanitation, The Double
30 | B W E C F i n a l R e p o r t
Bayou Watershed Protection Partnership, The Galveston Bay Estuary Program, The Texas Coastal
Watershed Program, IM Rivers, and Little Yacht Sales (Table 7).
During Cycle 20, GBF also began the process of creating a mobile app for GBAN to increase its ease of
use and expand its appeal within the Houston-Galveston region. GBF contracted the development work to
Vertices LLC, and from August 2016 to March 2017, GBF and Vertices worked on developing the mobile
app for Android and iOS devices. GBF began beta testing for the app in March of 2017, and anticipates a
formal launch in mid April, 2017. GBF will also internally coordinate a marketing campaign that coincides
with the launch of the GBAN app. We believe that creating a downloadable, smartphone-optimized version
of GBAN will ultimately make it more appealing to the diverse audience GBF is trying to reach, and make
it easier for users to identify and report pollution in their local communities to the proper authorities.
5.2 GBF Dockwalkers To date, GBF has trained a total of 21 volunteers, and 357 surveys have been conducted since the inception
of this program. These data represent approximately 1.5% of the boating population with boats > 25 feet
and covers numerous diverse marinas. In order for the data to be statistically significant, GBF calculated
that we must reach 370 surveys. This is GBF’s goal, though we will continue surveying past this in order
to track how boater education and behavior changes over time. Figures 9 – 13 summarize a few key findings
from Cycle 20’s Dockwalker data. The data in Figures 9 and 10 inform us that we needed to take a new
approach to our Pump Don’t Dump messaging and distribution since so many people were unaware of how
many pump-out stations there really are around the Bay and the consequences for not securing the y-
valve/main discharge valve. As a result of these findings, GBF will shift marketing campaigns in the future
to focus on educating boaters that there are indeed more than 20 pump-out facilities throughout the Bay.
The results in Figure 17 are not surprising considering the ongoing lack of enforcement by state and federal
entities. However, GBF will continue to try to drive improvements in enforcement by educating boaters on
where to report illegal dumping with the hope that authorities will take notice of this issue. The data in
Figure 18, along with other data collected on the survey, will assist GBF in calculating the waste production
on the average boat on Galveston Bay and multiply that by the total number of registered boats to get a
basic idea of the amount of waste that boaters produce per year. More importantly, it gives the boating
community a great visual to show that a large proportion of boaters in our area do, in fact, use their onboard
sewage facilities. Though this method of waste calculation may suffice for GBF’s purposes, GBF will also
continue to work with academic institutions to address questions of relative bacteria contributions by
boaters within Galveston Bay compared to bacteria contributions as a whole in the Bay.
Figures 12 and 13 will help us determine how many boats will be impacted by a No Discharge Zone by
determining the percentage of boats already in compliance with an NDZ. Figure 12 represents a potentially
positive finding from our survey, as it shows that roughly 95.25% of boaters surveyed would already
comply with an established NDZ. Only 4.75% of boaters around Galveston Bay, based on our findings,
would have to actively make a change onboard their vessel to become compliant with the designation.
Ultimately, that means that a very small percentage of the recreational boating population would be required
to install a holding tank. However, as mentioned earlier in this report, these data do not account for the
commercial boating industry within the Bay. Our Dockwalker data also show that, of boaters surveyed with
boats over 25 ft., 100% agree that bacteria from sewage is harmful to the Bay. Based on these and future
results, GBF will be able to tailor campaign messaging and strategies to improve knowledge and behavior
change, determine priority areas for new pump-out facilities and share valuable market information with
mobile pump-out companies. Much of the work accomplished in 2016 for the Dockwalker Program was
performed by GBF’s Water Quality Outreach Intern from June – August 2016.
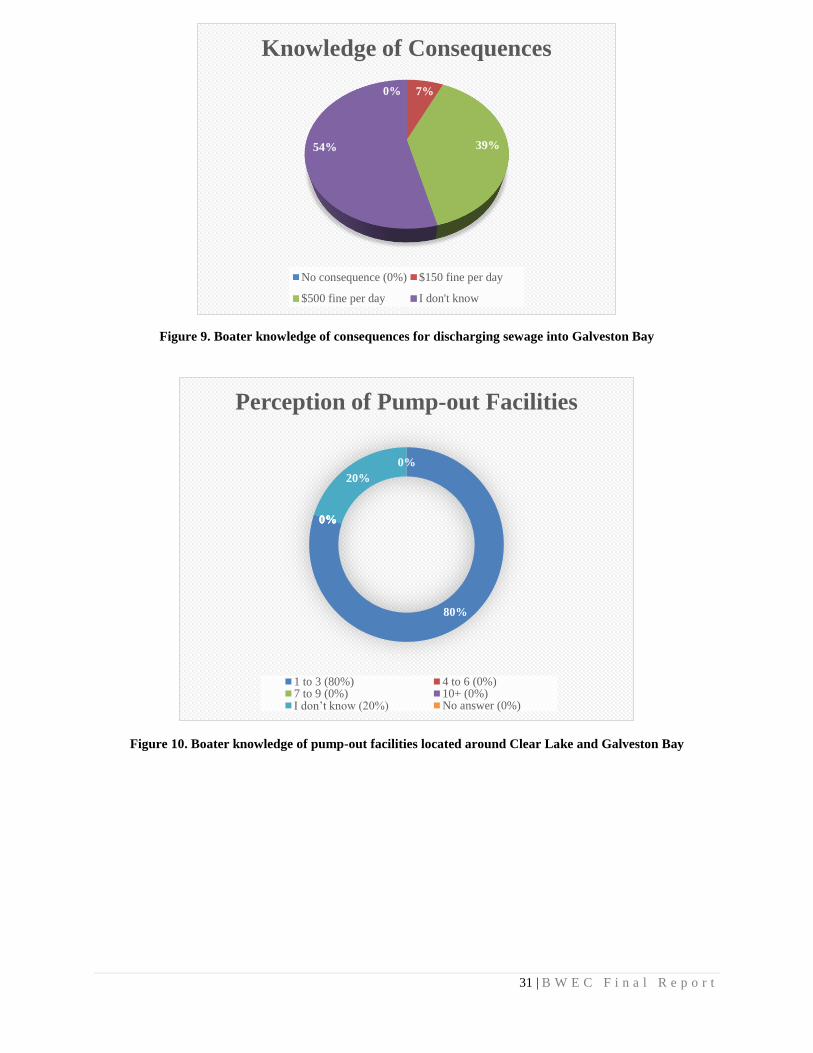
31 | B W E C F i n a l R e p o r t
Figure 9. Boater knowledge of consequences for discharging sewage into Galveston Bay
Figure 10. Boater knowledge of pump-out facilities located around Clear Lake and Galveston Bay
0% 7%
39%54%
Knowledge of Consequences
No consequence (0%) $150 fine per day
$500 fine per day I don't know
80%
0%0%0%
20%
0%
Perception of Pump-out Facilities
1 to 3 (80%) 4 to 6 (0%)7 to 9 (0%) 10+ (0%)I don’t know (20%) No answer (0%)
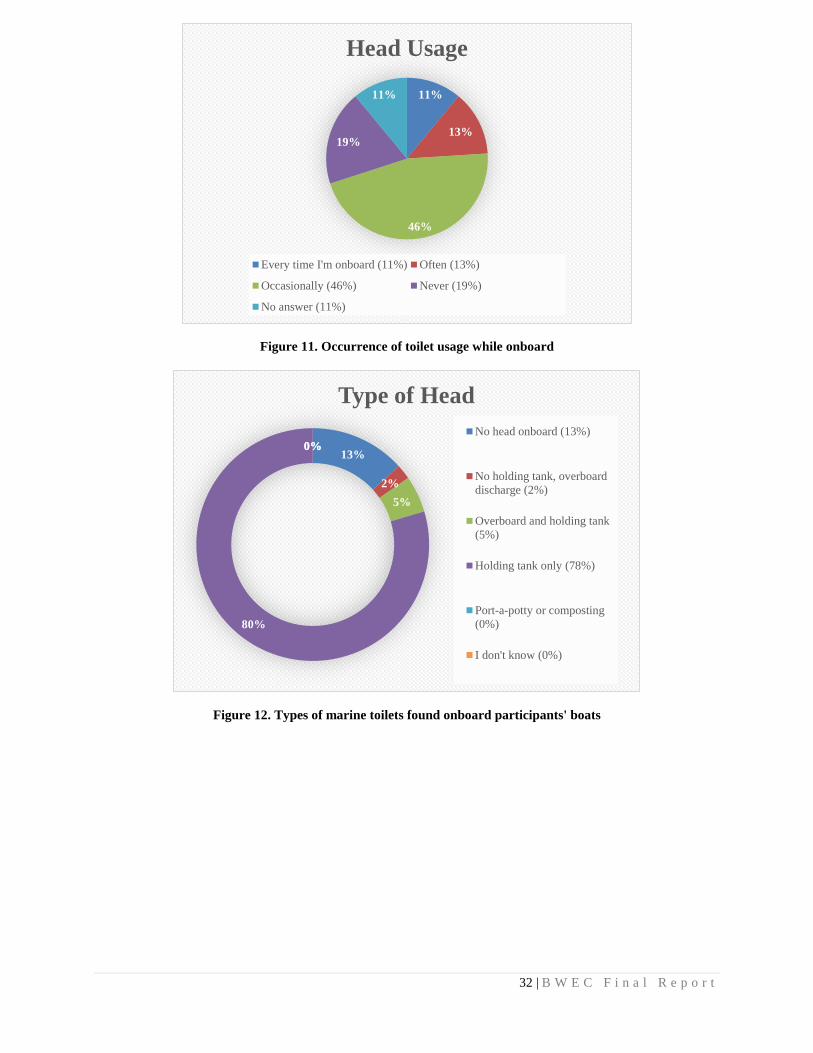
32 | B W E C F i n a l R e p o r t
Figure 11. Occurrence of toilet usage while onboard
Figure 12. Types of marine toilets found onboard participants' boats
11%
13%
46%
19%
11%
Head Usage
Every time I'm onboard (11%) Often (13%)
Occasionally (46%) Never (19%)
No answer (11%)
13%
2%
5%
80%
0%0%
Type of Head
No head onboard (13%)
No holding tank, overboard
discharge (2%)
Overboard and holding tank
(5%)
Holding tank only (78%)
Port-a-potty or composting
(0%)
I don't know (0%)
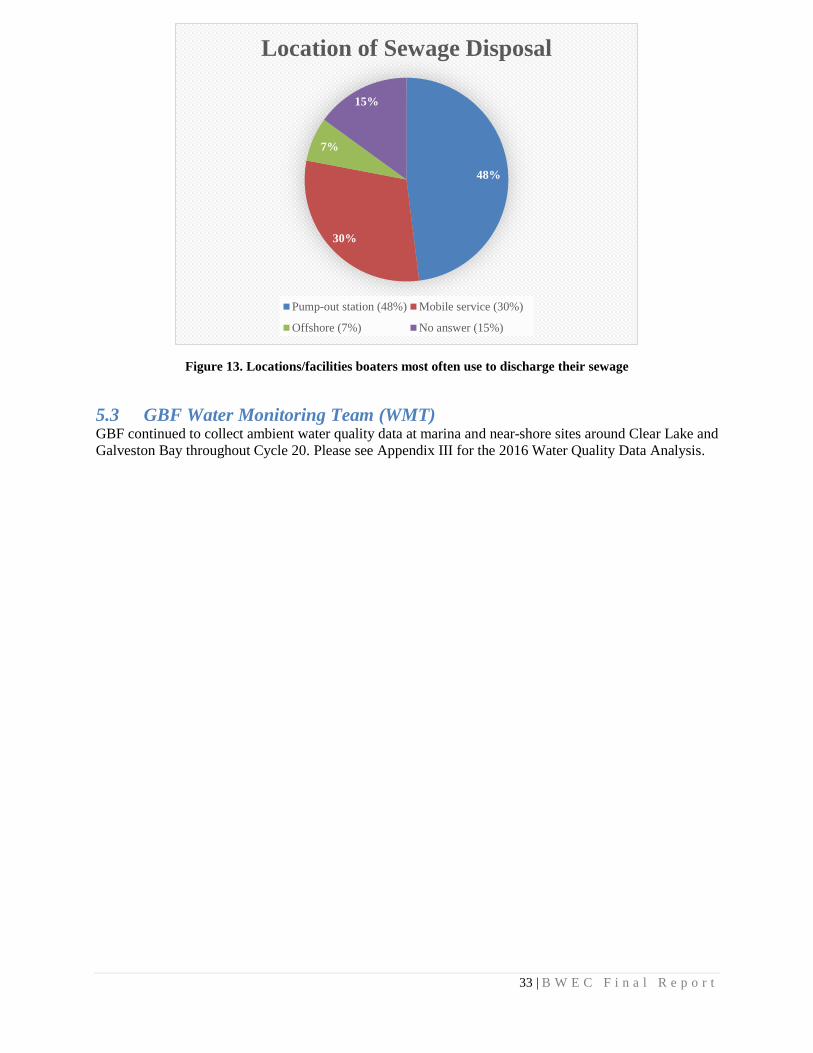
33 | B W E C F i n a l R e p o r t
Figure 13. Locations/facilities boaters most often use to discharge their sewage
5.3 GBF Water Monitoring Team (WMT) GBF continued to collect ambient water quality data at marina and near-shore sites around Clear Lake and
Galveston Bay throughout Cycle 20. Please see Appendix III for the 2016 Water Quality Data Analysis.
48%
30%
7%
15%
Location of Sewage Disposal
Pump-out station (48%) Mobile service (30%)
Offshore (7%) No answer (15%)
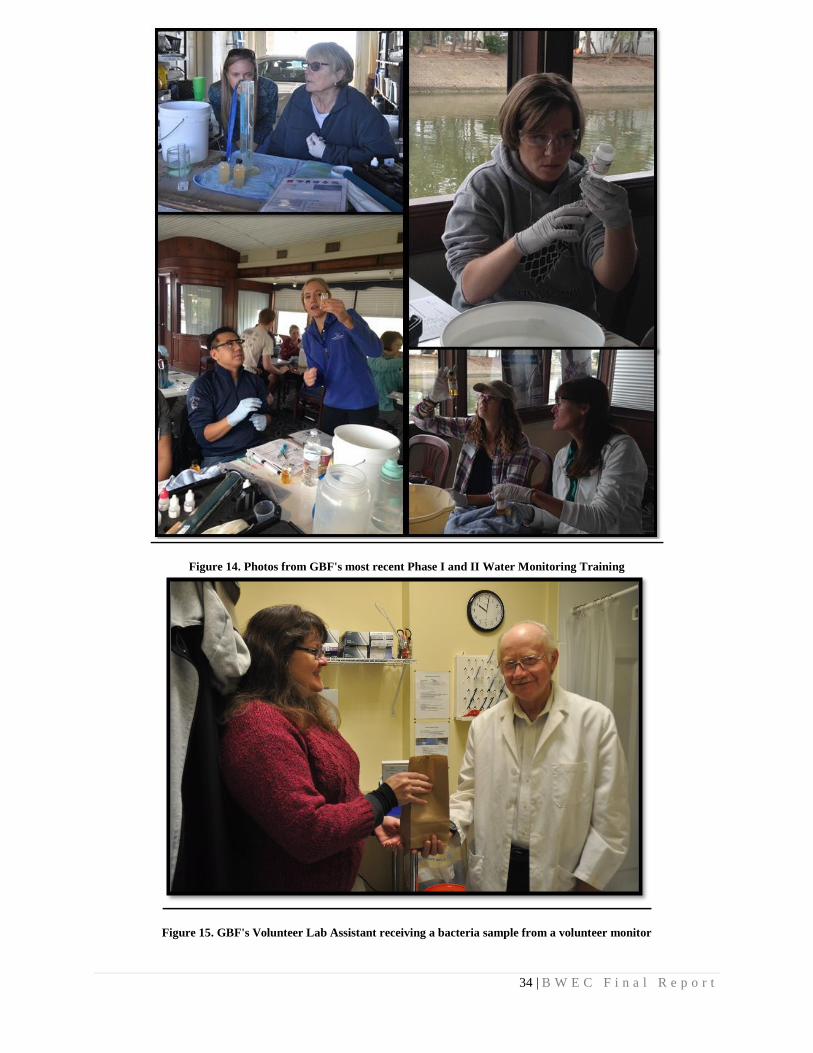
34 | B W E C F i n a l R e p o r t
Figure 14. Photos from GBF's most recent Phase I and II Water Monitoring Training
Figure 15. GBF's Volunteer Lab Assistant receiving a bacteria sample from a volunteer monitor

35 | B W E C F i n a l R e p o r t
Figure 16. Photos from the field of GBF's Water Monitoring Team collecting field data
Figure 17. GBF's Volunteer Lab Assistant processing and analyzing a bacteria sample
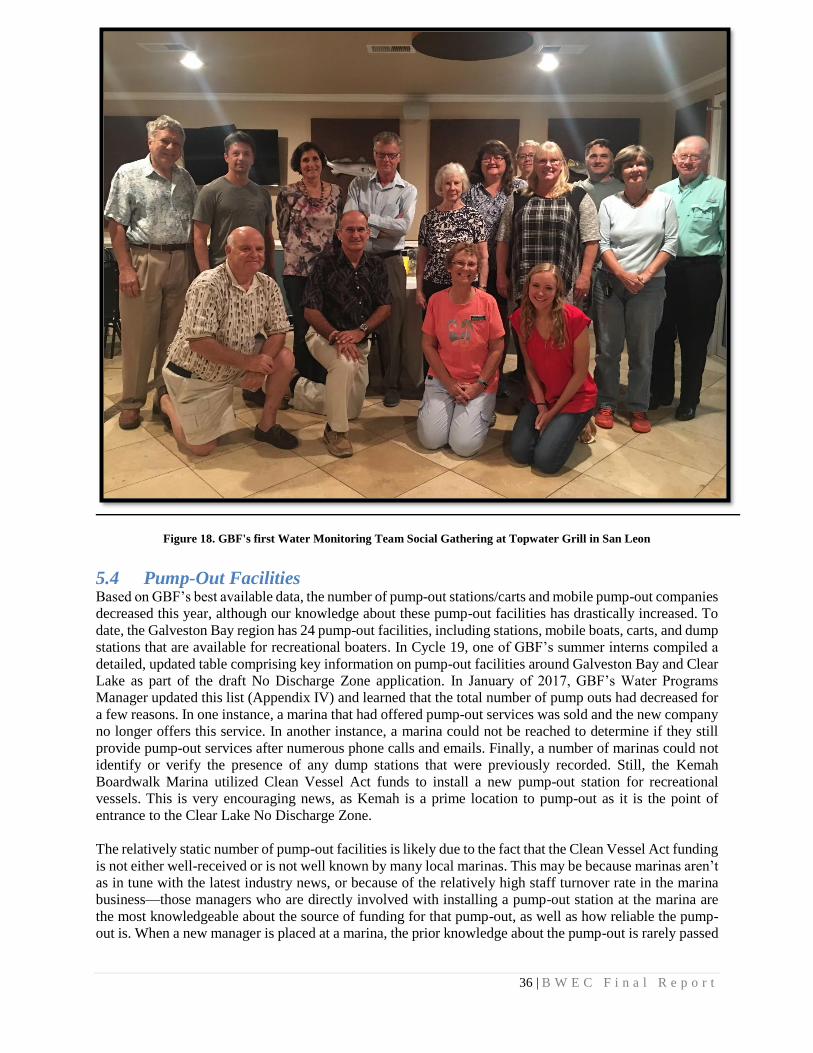
36 | B W E C F i n a l R e p o r t
Figure 18. GBF's first Water Monitoring Team Social Gathering at Topwater Grill in San Leon
5.4 Pump-Out Facilities Based on GBF’s best available data, the number of pump-out stations/carts and mobile pump-out companies
decreased this year, although our knowledge about these pump-out facilities has drastically increased. To
date, the Galveston Bay region has 24 pump-out facilities, including stations, mobile boats, carts, and dump
stations that are available for recreational boaters. In Cycle 19, one of GBF’s summer interns compiled a
detailed, updated table comprising key information on pump-out facilities around Galveston Bay and Clear
Lake as part of the draft No Discharge Zone application. In January of 2017, GBF’s Water Programs
Manager updated this list (Appendix IV) and learned that the total number of pump outs had decreased for
a few reasons. In one instance, a marina that had offered pump-out services was sold and the new company
no longer offers this service. In another instance, a marina could not be reached to determine if they still
provide pump-out services after numerous phone calls and emails. Finally, a number of marinas could not
identify or verify the presence of any dump stations that were previously recorded. Still, the Kemah
Boardwalk Marina utilized Clean Vessel Act funds to install a new pump-out station for recreational
vessels. This is very encouraging news, as Kemah is a prime location to pump-out as it is the point of
entrance to the Clear Lake No Discharge Zone.
The relatively static number of pump-out facilities is likely due to the fact that the Clean Vessel Act funding
is not either well-received or is not well known by many local marinas. This may be because marinas aren’t
as in tune with the latest industry news, or because of the relatively high staff turnover rate in the marina
business—those managers who are directly involved with installing a pump-out station at the marina are
the most knowledgeable about the source of funding for that pump-out, as well as how reliable the pump-
out is. When a new manager is placed at a marina, the prior knowledge about the pump-out is rarely passed
37 | B W E C F i n a l R e p o r t
on. This lack of knowledge provides an opportunity for further education of marina managers through GBF
partnerships. GBF is currently working with members of state agencies and the Boater Waste Workgroup
to better communicate the availability and purpose of these funds, and to potentially secure additional
funding for pump-out stations if needed. A former TPWD employee is now working as a consultant for the
Marina Association of Texas (MAT), of which GBF’s Water Programs Manager is a board member, so we
are hopeful to see many enhancements to the use of these grant funds statewide. MAT is currently working
with TPWD to offer MAT members the opportunity to recoup annual funds spent on maintaining and
operating their pump-out facilities in hopes of encouraging more marinas to install new facilities by
lessening their financial burden even further. GBF will continue to advocate for this with MAT and promote
the program in the Clear Lake and Galveston Bay area.
Conclusions and Lessons Learned
The Boater Waste Education Campaign saw many rewarding enhancements during this funding cycle. Our
continued partnership with the Marina Association of Texas and the work of our summer intern helped give
much needed data and support regarding the potential No Discharge Zone application for Galveston Bay.
GBF began discussing the NDZ initiative with specific members of the recreational and commercial boating
community in order to open up a dialogue on this important issue, and many of these conversations were
quite promising. GBF compiled a draft white paper on NDZ implementation and enforcement throughout
the country to aid NDZ discussion. Volunteer programs including the Dockwalker Program and GBAN
have grown and will continue to grow while providing the campaign with additional data on illicit
discharges in the Galveston Bay region. GBF and Vertices were able to develop a GBAN mobile app that
is currently undergoing beta testing. And finally, teen and elementary-aged boaters were engaged in the
campaign through hands-on activities at the WADE camp with the Houston Safe Boating Council.
To summarize our major findings, 63% of the organizations on the BWEC workgroup attended meetings
and 100% directly contributed to campaign activities by distributing Pump Don’t Dump campaign materials
and helping us build relationships with and gain access to marinas for various volunteer programs. Through
education booths, presentations, and workshops, the BWEC reached over 15,000 people at 53 live events.
Through print and digital media outlets, GBF was able to reach over 285,000 people with the Boater Waste
Education Campaign messaging through 29 media outlets. The GBAN pollution reporting tool was
marketed through a social media campaign developed by The Hatcher Group, as well as through outreach
booths and presentations, receiving 1,618 page views and 46 pollution reports during this cycle.
Additionally, the mobile GBAN app was developed and was launched for beta testing during this cycle.
The GBF Water Monitoring Team remained strong at 57 certified volunteer monitors at 58 sites around
Clear Lake and Galveston Bay, and 24 of them have their advanced certification to sample for bacteria.
However, much of this increase occurred in just a few months. From October 2016 to March 2017, GBF’s
Water Monitoring Team went from 36 active monitors to 57 active monitors. GBF will be offering an
additional training in April for new monitors, and estimates an additional 5-10 volunteers will be added to
the Monitoring Team as a result of this training. GBF’s two Volunteer Lab Assistants helped us run the lab
by analyzing hundreds of bacteria samples (Figures 15 and 17). GBF collected approximately 125
completed dockwalker surveys, compared to 58 in 2014 and 174 in 2015.
Overall, GBF and the workgroup are pleased with the advances that have been made to the campaign. The
information collected during this cycle will assist us as we continue to strive for reductions in bacteria
contributions from recreational and commercial vessels in Galveston Bay. GBF recognizes that the BWEC
is a complex balance of education and advocacy efforts and we look forward to continuing work on this
project. Thank you to the Coastal Management Program and NOAA for your ongoing support of this
important environmental, economic, and public health issue.
38 | B W E C F i n a l R e p o r t
Appendix I: Performance
Indicators and Outreach
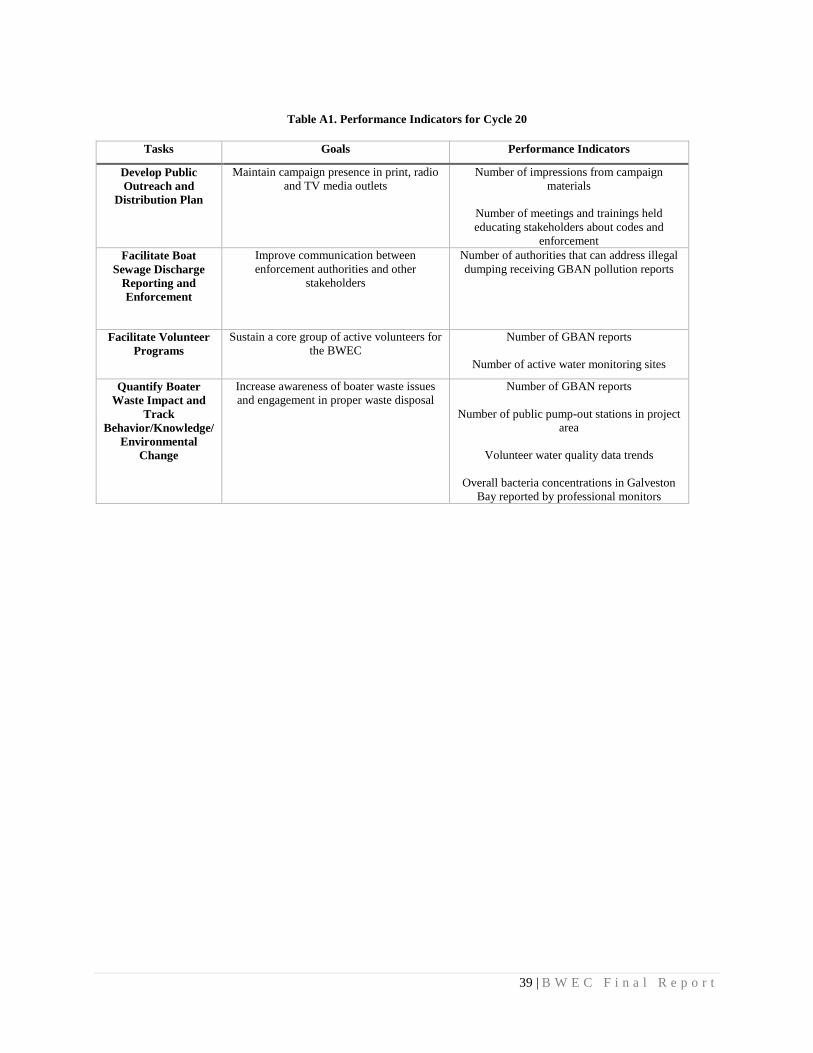
39 | B W E C F i n a l R e p o r t
Table A1. Performance Indicators for Cycle 20
Tasks Goals Performance Indicators
Develop Public
Outreach and
Distribution Plan
Maintain campaign presence in print, radio
and TV media outlets
Number of impressions from campaign
materials
Number of meetings and trainings held
educating stakeholders about codes and
enforcement
Facilitate Boat
Sewage Discharge
Reporting and
Enforcement
Improve communication between
enforcement authorities and other
stakeholders
Number of authorities that can address illegal
dumping receiving GBAN pollution reports
Facilitate Volunteer
Programs
Sustain a core group of active volunteers for
the BWEC
Number of GBAN reports
Number of active water monitoring sites
Quantify Boater
Waste Impact and
Track
Behavior/Knowledge/
Environmental
Change
Increase awareness of boater waste issues
and engagement in proper waste disposal
Number of GBAN reports
Number of public pump-out stations in project
area
Volunteer water quality data trends
Overall bacteria concentrations in Galveston
Bay reported by professional monitors
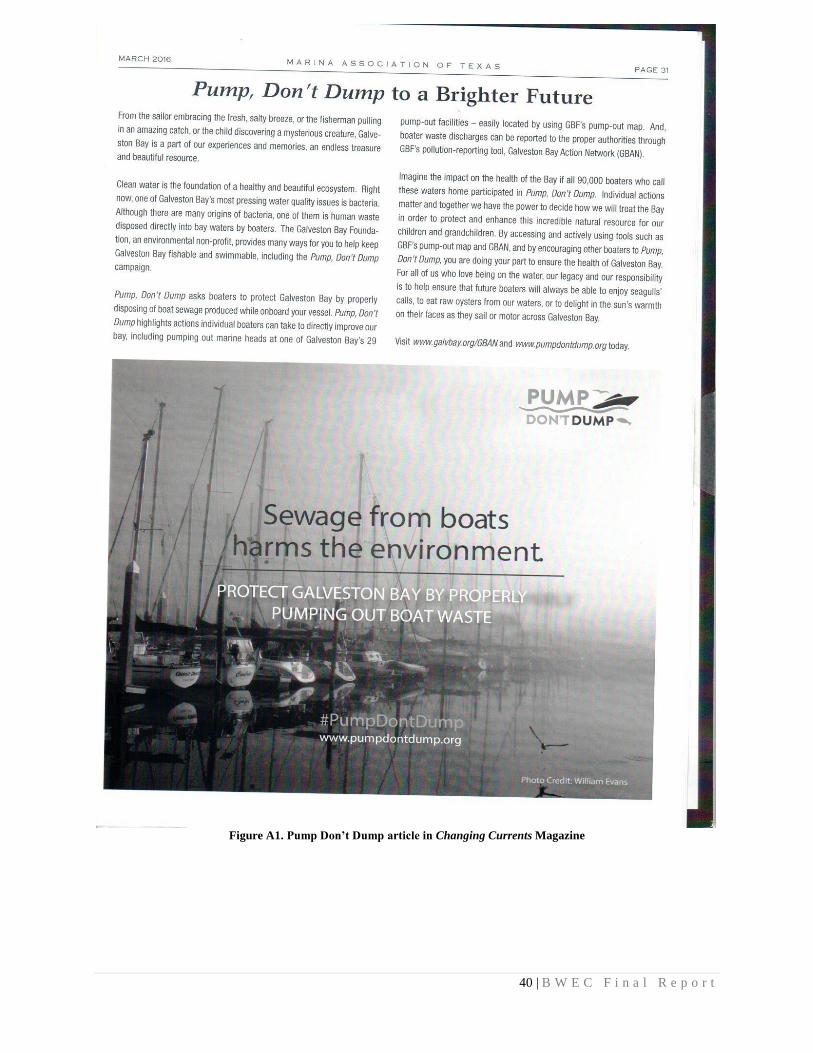
40 | B W E C F i n a l R e p o r t
Figure A1. Pump Don’t Dump article in Changing Currents Magazine
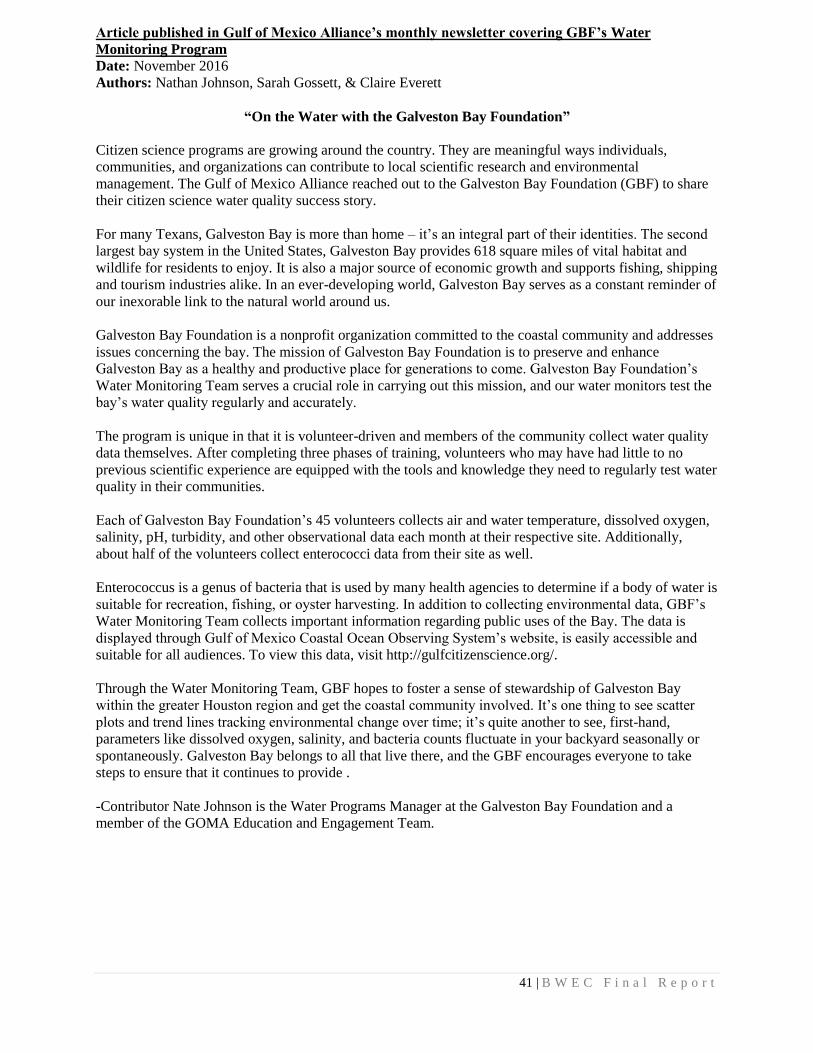
41 | B W E C F i n a l R e p o r t
Article published in Gulf of Mexico Alliance’s monthly newsletter covering GBF’s Water
Monitoring Program
Date: November 2016
Authors: Nathan Johnson, Sarah Gossett, & Claire Everett
“On the Water with the Galveston Bay Foundation”
Citizen science programs are growing around the country. They are meaningful ways individuals,
communities, and organizations can contribute to local scientific research and environmental
management. The Gulf of Mexico Alliance reached out to the Galveston Bay Foundation (GBF) to share
their citizen science water quality success story.
For many Texans, Galveston Bay is more than home – it’s an integral part of their identities. The second
largest bay system in the United States, Galveston Bay provides 618 square miles of vital habitat and
wildlife for residents to enjoy. It is also a major source of economic growth and supports fishing, shipping
and tourism industries alike. In an ever-developing world, Galveston Bay serves as a constant reminder of
our inexorable link to the natural world around us.
Galveston Bay Foundation is a nonprofit organization committed to the coastal community and addresses
issues concerning the bay. The mission of Galveston Bay Foundation is to preserve and enhance
Galveston Bay as a healthy and productive place for generations to come. Galveston Bay Foundation’s
Water Monitoring Team serves a crucial role in carrying out this mission, and our water monitors test the
bay’s water quality regularly and accurately.
The program is unique in that it is volunteer-driven and members of the community collect water quality
data themselves. After completing three phases of training, volunteers who may have had little to no
previous scientific experience are equipped with the tools and knowledge they need to regularly test water
quality in their communities.
Each of Galveston Bay Foundation’s 45 volunteers collects air and water temperature, dissolved oxygen,
salinity, pH, turbidity, and other observational data each month at their respective site. Additionally,
about half of the volunteers collect enterococci data from their site as well.
Enterococcus is a genus of bacteria that is used by many health agencies to determine if a body of water is
suitable for recreation, fishing, or oyster harvesting. In addition to collecting environmental data, GBF’s
Water Monitoring Team collects important information regarding public uses of the Bay. The data is
displayed through Gulf of Mexico Coastal Ocean Observing System’s website, is easily accessible and
suitable for all audiences. To view this data, visit http://gulfcitizenscience.org/.
Through the Water Monitoring Team, GBF hopes to foster a sense of stewardship of Galveston Bay
within the greater Houston region and get the coastal community involved. It’s one thing to see scatter
plots and trend lines tracking environmental change over time; it’s quite another to see, first-hand,
parameters like dissolved oxygen, salinity, and bacteria counts fluctuate in your backyard seasonally or
spontaneously. Galveston Bay belongs to all that live there, and the GBF encourages everyone to take
steps to ensure that it continues to provide .
-Contributor Nate Johnson is the Water Programs Manager at the Galveston Bay Foundation and a
member of the GOMA Education and Engagement Team.
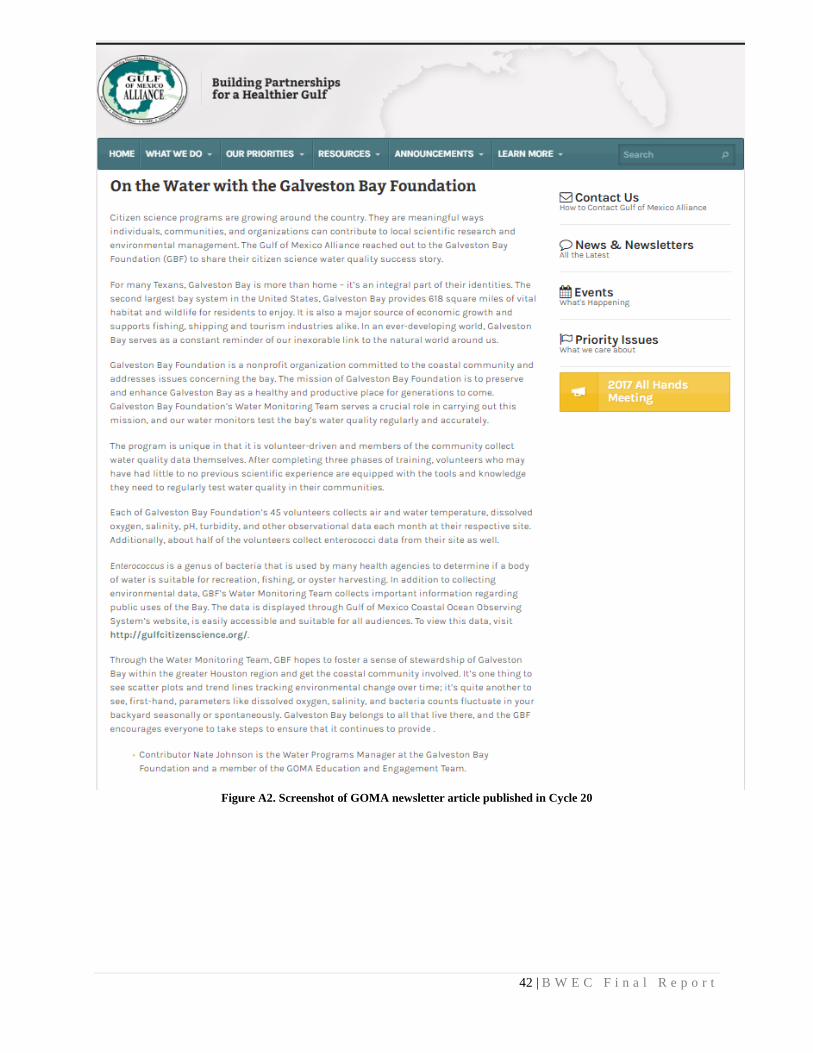
42 | B W E C F i n a l R e p o r t
Figure A2. Screenshot of GOMA newsletter article published in Cycle 20
43 | B W E C F i n a l R e p o r t
Appendix II: Dockwalker
Program

44 | B W E C F i n a l R e p o r t
Figure A3. Cycle 20 Dockwalker survey
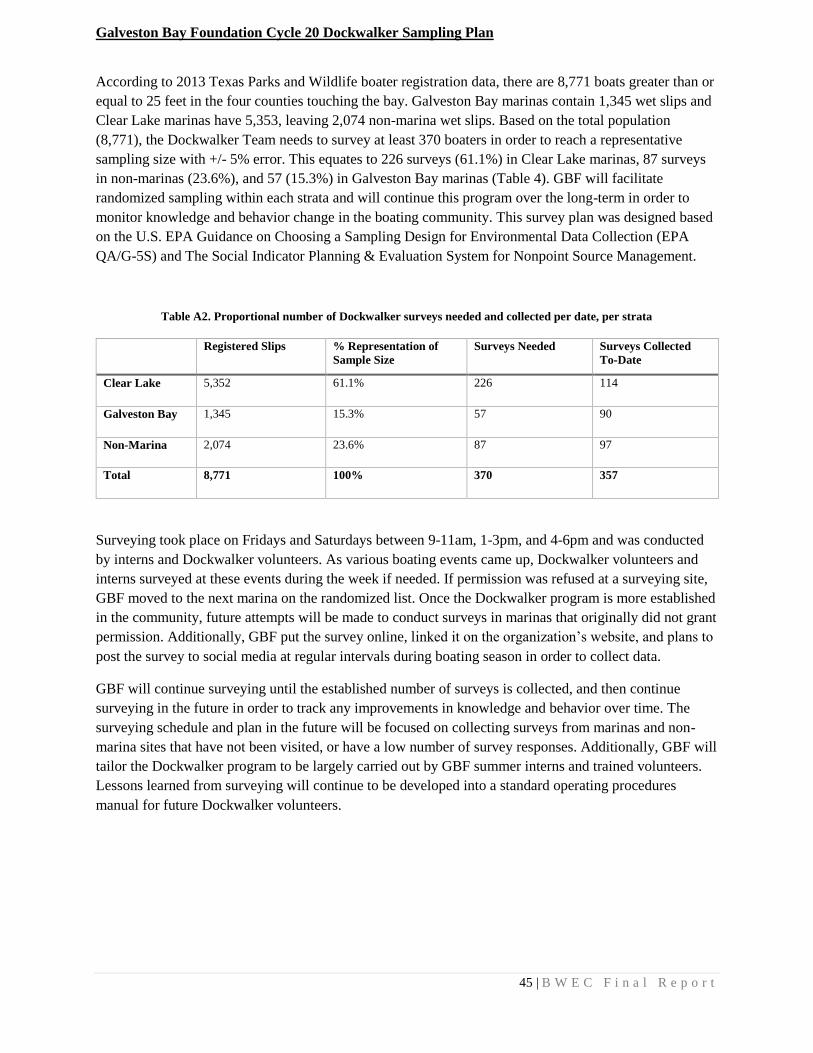
45 | B W E C F i n a l R e p o r t
Galveston Bay Foundation Cycle 20 Dockwalker Sampling Plan
According to 2013 Texas Parks and Wildlife boater registration data, there are 8,771 boats greater than or
equal to 25 feet in the four counties touching the bay. Galveston Bay marinas contain 1,345 wet slips and
Clear Lake marinas have 5,353, leaving 2,074 non-marina wet slips. Based on the total population
(8,771), the Dockwalker Team needs to survey at least 370 boaters in order to reach a representative
sampling size with +/- 5% error. This equates to 226 surveys (61.1%) in Clear Lake marinas, 87 surveys
in non-marinas (23.6%), and 57 (15.3%) in Galveston Bay marinas (Table 4). GBF will facilitate
randomized sampling within each strata and will continue this program over the long-term in order to
monitor knowledge and behavior change in the boating community. This survey plan was designed based
on the U.S. EPA Guidance on Choosing a Sampling Design for Environmental Data Collection (EPA
QA/G-5S) and The Social Indicator Planning & Evaluation System for Nonpoint Source Management.
Table A2. Proportional number of Dockwalker surveys needed and collected per date, per strata
Registered Slips % Representation of
Sample Size
Surveys Needed Surveys Collected
To-Date
Clear Lake 5,352 61.1% 226 114
Galveston Bay 1,345 15.3% 57 90
Non-Marina 2,074 23.6% 87 97
Total 8,771 100% 370 357
Surveying took place on Fridays and Saturdays between 9-11am, 1-3pm, and 4-6pm and was conducted
by interns and Dockwalker volunteers. As various boating events came up, Dockwalker volunteers and
interns surveyed at these events during the week if needed. If permission was refused at a surveying site,
GBF moved to the next marina on the randomized list. Once the Dockwalker program is more established
in the community, future attempts will be made to conduct surveys in marinas that originally did not grant
permission. Additionally, GBF put the survey online, linked it on the organization’s website, and plans to
post the survey to social media at regular intervals during boating season in order to collect data.
GBF will continue surveying until the established number of surveys is collected, and then continue
surveying in the future in order to track any improvements in knowledge and behavior over time. The
surveying schedule and plan in the future will be focused on collecting surveys from marinas and non-
marina sites that have not been visited, or have a low number of survey responses. Additionally, GBF will
tailor the Dockwalker program to be largely carried out by GBF summer interns and trained volunteers.
Lessons learned from surveying will continue to be developed into a standard operating procedures
manual for future Dockwalker volunteers.
46 | B W E C F i n a l R e p o r t
Galveston Bay Foundation Cycle 20 Water Quality Outreach Internship Final Report
Table of Contents
I. Introduction
Dockwalking Process
2016 Dockwalker Survey
2016 Clean Marina Survey
II. Galveston Yacht Basin
Preliminary Data Analysis
Graphs of Data Results
III. Harborwalk Yacht Club
Preliminary Data Analysis
Graphs of Data Results
IV. Watergate Yachting Center & Seabrook Marina
Preliminary Data Analysis
Graphs of Data Results
V. Summer 2016
Preliminary Data Analysis
Graphs of Data Results
V1. Summer 2014 Comparison
Preliminary Data Analysis
Graphs of Data Results
V11. Further Suggestions & Thank You
Introduction
47 | B W E C F i n a l R e p o r t
Galveston Bay Foundation’s main objective is to “Preserve, protect and enhance Galveston Bay
as a beautiful and productive resource for now and for generations to come.” There are countless ways the
bay benefits those who live in it and around it whether it is recreational, the fishing industry,
transportation, or other environmental factors. There are multiple characteristics of the bay that needs to
be protected and enhanced, to not just help the life that surrounds it, but to keep its resources available in
order to protect the industry and economy around it.
Water is what makes the bay, a bay. The water is the one of the main sources of life. When the
bay is not “healthy” due to pollution or any other source that alters its natural state, there is butterfly
effect of problems that can occur and be detrimental to the life in and around the bay. One of the teams at
Galveston Bay Foundation is the Water Programs Team. This team runs multiple programs that are all
focused on helping improve the water quality of Galveston Bay.
The Dockwalker Program is aimed at stopping illegal discharging of boater waste, which is a
main source of pollution in Galveston Bay. Through data collection from surveys taken at local marinas,
public outreach and education in the boating community, this program helps GBF have a sense of what
problems need to be addressed and if there has been any improvement. Dockwalkers are usually interns or
volunteers who survey local boaters about their boating habitats and knowledge, while promoting correct
pump-out methods to help protect the bay. The Dockwalker Program has been an on-going project for
about two years. Four marinas were visited in summer 2016. The data analyses from the surveys taken are
shown in the following pages, along with a comparison to the data from summer 2014.
Dockwalking Process
Before engaging boaters at local marinas, the volunteer or intern checks in with a marina manager
at the main office at the marina. Dockwalkers will have a Clean Boater Kit to give to those who
participated in taking a survey.
These kits include:
• Reusable trash bag- way to store trash and prevent trash from getting into the bay
• Oil pillow- to collect excess oily bilge from the boat to stop oil and chemicals flowing
into the bay
• Dye tab- to see if their boat is discharging sewage into the bay
• Zip tie- to close off their Y-valve to prevent the dumping boater waste
• Whistle and/or floating Pump Don’t Dump key chain
• GBF brochures and handouts
The Dockwalker had a clipboard with the 2016 Dockwalker surveys, a tote, pens and the Clean
Boater Kits while surveying the local boaters.
Galveston Yacht Basin Preliminary Data Analysis
There were 25 surveys taken at the Galveston Yacht Basin during July 1st at 3-5pm and July 2th
10am-12pm. This marina had the most activity especially with a large amount of individuals that use their
boats to make a living.
There was a wide variety of boats and types of boaters at GYB. How the bay benefited the
boaters differentiated greatly. 64% stated they used their boat mainly for either recreational or business
fishing. 25% of the boaters that claimed that Galveston Bay mostly benefited them by fishing for a living.
48 | B W E C F i n a l R e p o r t
The other 36% of the 25 surveyed use their boat for other purposes such as boating/cruising, sailing, and
other recreational activities.
The average number of years that individuals have been boating was around 28 years, with the
range between 1 to 55 years. 56 % had 30 years of boating experience or more, 16% had 10 years of
boating experience or more and 28% had less than 10 years of experience. With the total of 72% that have
been boating for more than 10 years shows that many boaters at Galveston Yacht Basin are highly
familiar and experienced with boating.
The average amount of days out of the month that people were on their boat was 15 days. This
number is high due to several were liveaboards, worked in the fishing industry or made some other
profession off their boat. The range of the time spent on their boat was 1 day per month to year around.
72% of the boaters spent 10 days or more a month on their boat. This shows that the boaters have more of
an insight of what happens in the marina.
The average number of people on board for each boat was 4. The range was between 1 to 8
people.
There are 6 zip codes in Galveston, 77550, 77551, 77552, 77553, 77554, 77555. 68% of the
boaters lived in one of the Galveston zip codes. The other 32% were mostly from either the Houston area
or Southeast Texas area.
After a few general questions about the boater, they were asked if they would personally swim in
the marina or eat the fish from the marina. The results showed that the preference was almost evenly
divided among the boaters with 48% stating they would eat fish they caught in the marina or swim in the
marina and 52% stating they would not.
Those who did fish, 88% fished offshore with half of the 88% also fished in West Bay (Galveston
Island) or East Bay (Bolivar). The other 12% solely fished near West or East bay.
Out of the 25 that were surveyed, 68% had a fishing boat, 16% had a motor yacht, 12% had a
sailboat and 4% had either a house boat or crew boat. The large amount of fishing boats in this marina
shows that many fish either for recreation or for a living. The amount of motor yachts and sailboats shows
that several boaters are either liveaboards or use their boats for recreational purposes such as
boating/cruising or sailing.
Overall there was an even amount of boats that were made in the late 60s to the 2000s. 36% of
the boats were made in the 2000s, 20% in the 1990s, 28% in the 1980s and 16% were made between late
1960s to early 70s.
The average size of the boats surveyed was 37 feet.
The average cruising speed was 25 knots. The average speed is high due to the large amount of
fishing boats surveyed compared to the amount of slower boats like sailboats.
Boaters were asked about what pump-out stations or mobile pump-out stations they were aware
of in the Galveston Bay area. 72% said they knew around 1 to 3 pump-out stations or services and 28%
did not know. Also no one knew more than 3 pump-out services in the area.
When asked what the consequences were for boaters in Texas who do not secure their discharge
valve, do not have a Clean Water Certification sticker for their marine sanitation device, or dump boater
waste in the bay 52% did not know the fine or that it was illegal. 44% guessed that the fine was up to
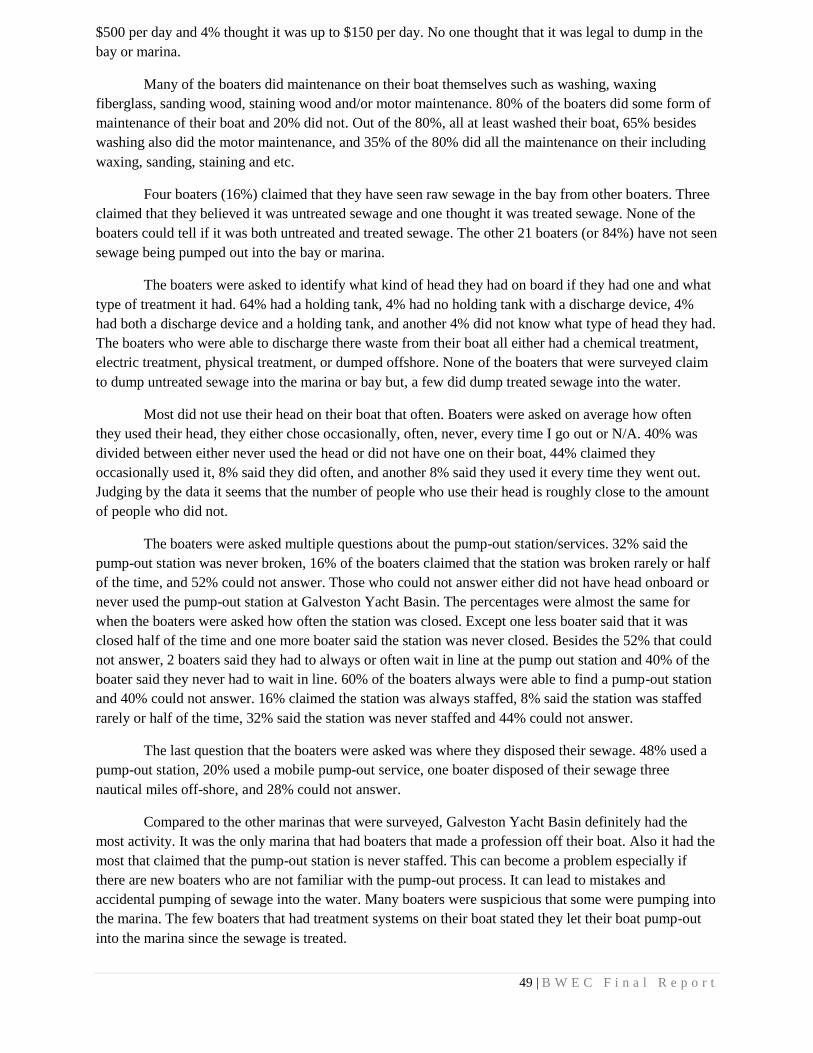
49 | B W E C F i n a l R e p o r t
$500 per day and 4% thought it was up to $150 per day. No one thought that it was legal to dump in the
bay or marina.
Many of the boaters did maintenance on their boat themselves such as washing, waxing
fiberglass, sanding wood, staining wood and/or motor maintenance. 80% of the boaters did some form of
maintenance of their boat and 20% did not. Out of the 80%, all at least washed their boat, 65% besides
washing also did the motor maintenance, and 35% of the 80% did all the maintenance on their including
waxing, sanding, staining and etc.
Four boaters (16%) claimed that they have seen raw sewage in the bay from other boaters. Three
claimed that they believed it was untreated sewage and one thought it was treated sewage. None of the
boaters could tell if it was both untreated and treated sewage. The other 21 boaters (or 84%) have not seen
sewage being pumped out into the bay or marina.
The boaters were asked to identify what kind of head they had on board if they had one and what
type of treatment it had. 64% had a holding tank, 4% had no holding tank with a discharge device, 4%
had both a discharge device and a holding tank, and another 4% did not know what type of head they had.
The boaters who were able to discharge there waste from their boat all either had a chemical treatment,
electric treatment, physical treatment, or dumped offshore. None of the boaters that were surveyed claim
to dump untreated sewage into the marina or bay but, a few did dump treated sewage into the water.
Most did not use their head on their boat that often. Boaters were asked on average how often
they used their head, they either chose occasionally, often, never, every time I go out or N/A. 40% was
divided between either never used the head or did not have one on their boat, 44% claimed they
occasionally used it, 8% said they did often, and another 8% said they used it every time they went out.
Judging by the data it seems that the number of people who use their head is roughly close to the amount
of people who did not.
The boaters were asked multiple questions about the pump-out station/services. 32% said the
pump-out station was never broken, 16% of the boaters claimed that the station was broken rarely or half
of the time, and 52% could not answer. Those who could not answer either did not have head onboard or
never used the pump-out station at Galveston Yacht Basin. The percentages were almost the same for
when the boaters were asked how often the station was closed. Except one less boater said that it was
closed half of the time and one more boater said the station was never closed. Besides the 52% that could
not answer, 2 boaters said they had to always or often wait in line at the pump out station and 40% of the
boater said they never had to wait in line. 60% of the boaters always were able to find a pump-out station
and 40% could not answer. 16% claimed the station was always staffed, 8% said the station was staffed
rarely or half of the time, 32% said the station was never staffed and 44% could not answer.
The last question that the boaters were asked was where they disposed their sewage. 48% used a
pump-out station, 20% used a mobile pump-out service, one boater disposed of their sewage three
nautical miles off-shore, and 28% could not answer.
Compared to the other marinas that were surveyed, Galveston Yacht Basin definitely had the
most activity. It was the only marina that had boaters that made a profession off their boat. Also it had the
most that claimed that the pump-out station is never staffed. This can become a problem especially if
there are new boaters who are not familiar with the pump-out process. It can lead to mistakes and
accidental pumping of sewage into the water. Many boaters were suspicious that some were pumping into
the marina. The few boaters that had treatment systems on their boat stated they let their boat pump-out
into the marina since the sewage is treated.
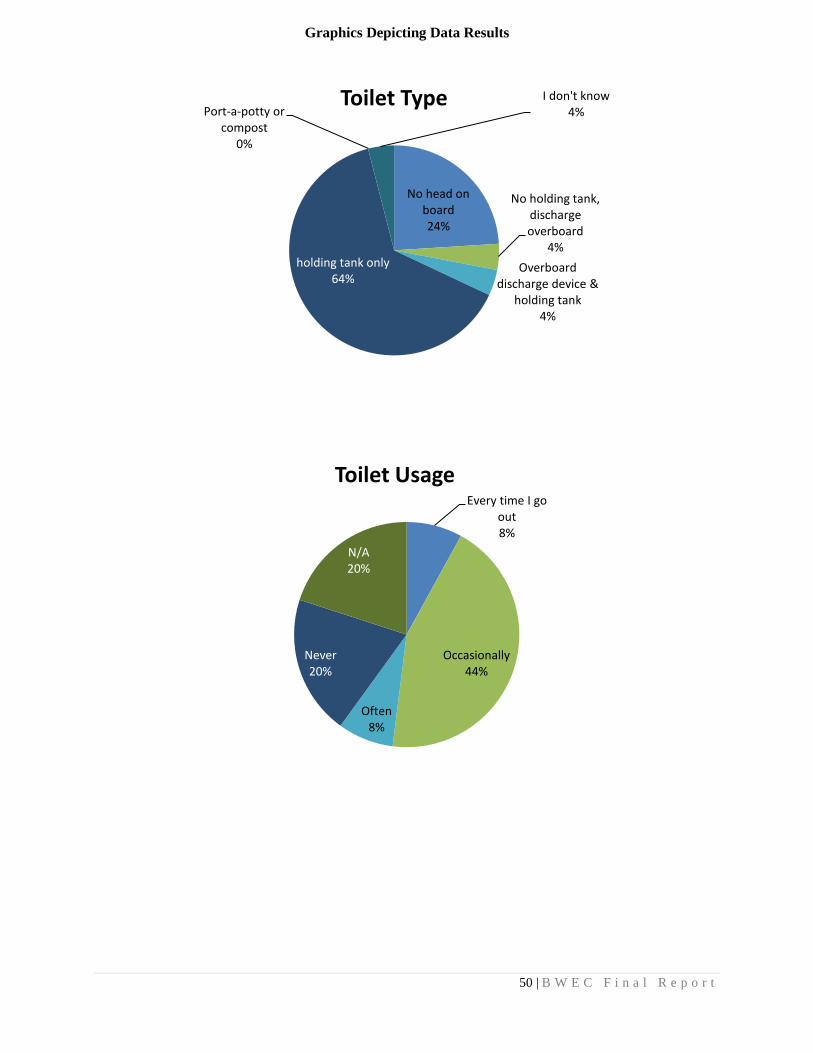
50 | B W E C F i n a l R e p o r t
Graphics Depicting Data Results
Every time I go out8%
Occasionally44%
Often 8%
Never20%
N/A20%
Toilet Usage
No head on board24%
No holding tank, discharge overboard
4%
Overboard discharge device &
holding tank4%
holding tank only64%
Port-a-potty or compost
0%
I don't know 4%
Toilet Type
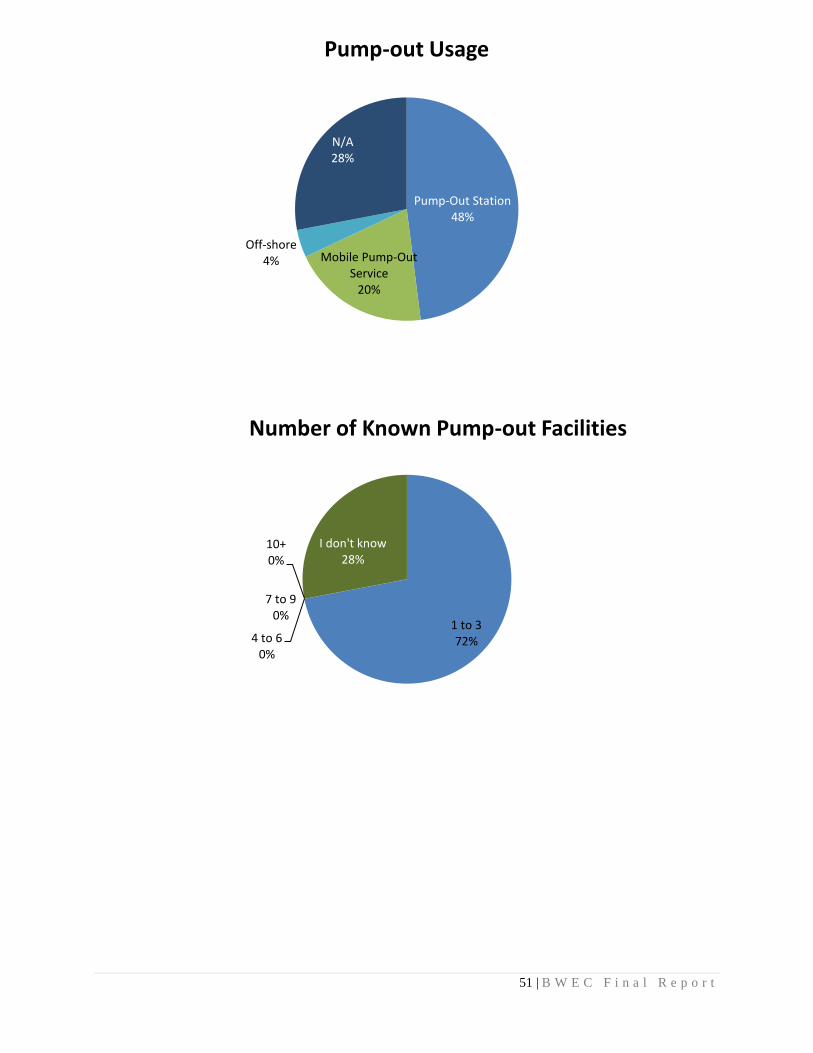
51 | B W E C F i n a l R e p o r t
Pump-Out Station48%
Mobile Pump-Out Service
20%
Off-shore4%
N/A28%
Pump-out Usage
1 to 3 72%4 to 6
0%
7 to 90%
10+0%
I don't know 28%
Number of Known Pump-out Facilities

52 | B W E C F i n a l R e p o r t
Nothing, it is discouraged but not againist the
law0%
Fine up to $150 per day
4%
Fine up to $500 per day
44%
I don't know52%
Consequences for Texas Boaters
Treated sewage4% Untreated
sewage12%
Treated & Untreated
sewage0%
No84%
Discharged Sewage
53 | B W E C F i n a l R e p o r t
Harborwalk Yacht Club Preliminary Data Analysis
The second marina that surveys were taken at was at the Harborwalk Yacht Club on July 8th 3-
5pm and July 9th 10am-12pm. This marina was much smaller and had little to no activity. Seven surveys
were taken.
All the boaters used their boat mainly for cruising or sailing. 43% of the boaters claimed that
besides boating another way the bay benefited them was fishing. None of the boaters surveyed made a
living off their boat.
The average number of years an individual has been boating was around 18 years, with the range
of between 2 to 40 years. Four boaters had 15 or more years of experience and the other 3 boaters had less
than 10 years of experience. Most of the boaters were very experienced.
The average number of days per month the owners were on their boats was 17 days. Three out of
the seven boaters were liveaboards and the remaining boaters were on their boat 16 days or less a month.
The range of day was between 3 days a month to living year around on their boat.
After asking for each of the boaters zip codes, it showed that most of them were from different
areas of Texas. 29% of the boaters were from Hitchcock which is where the yacht club is located, 42%
were from areas outside of Houston and the remaining 29% were either from outside the Dallas-Fort
Worth area or San Antonio.
When asked if they would eat the fish caught from the marina or would swim in the marina 29%
said no and 71% said they would.
Overall the boaters preferred to fish in different locations, 42% usually fished off shore, 29%
fished in Lower Galveston Bay area, 14% or one boater fished in West Bay and another boater did not
fish.
57% of the boats that belonged to those who were surveyed were motor yachts, 14% were fishing
boats, and 29% were sailboats. Even though there was a smaller amount of sailboat owners that were
surveyed compared to the motor yacht owners, at least half of the boats in the marina were sailboats.
The range of the year that the boats were made was between 1987 and 2008. 71% of the boats
were made in either the late 1980s or in the 1990s and 29% of the boats were made in the 2000s.
The average size of a boat was around 43 feet.
The average speed of the boats surveyed was 14 knots.
All the boaters that took the survey except for one knew at least 1 to 3 pump-out stations/
services. The one boater who did not claimed that they pumped-out their boat 3-nautical miles off-shore.
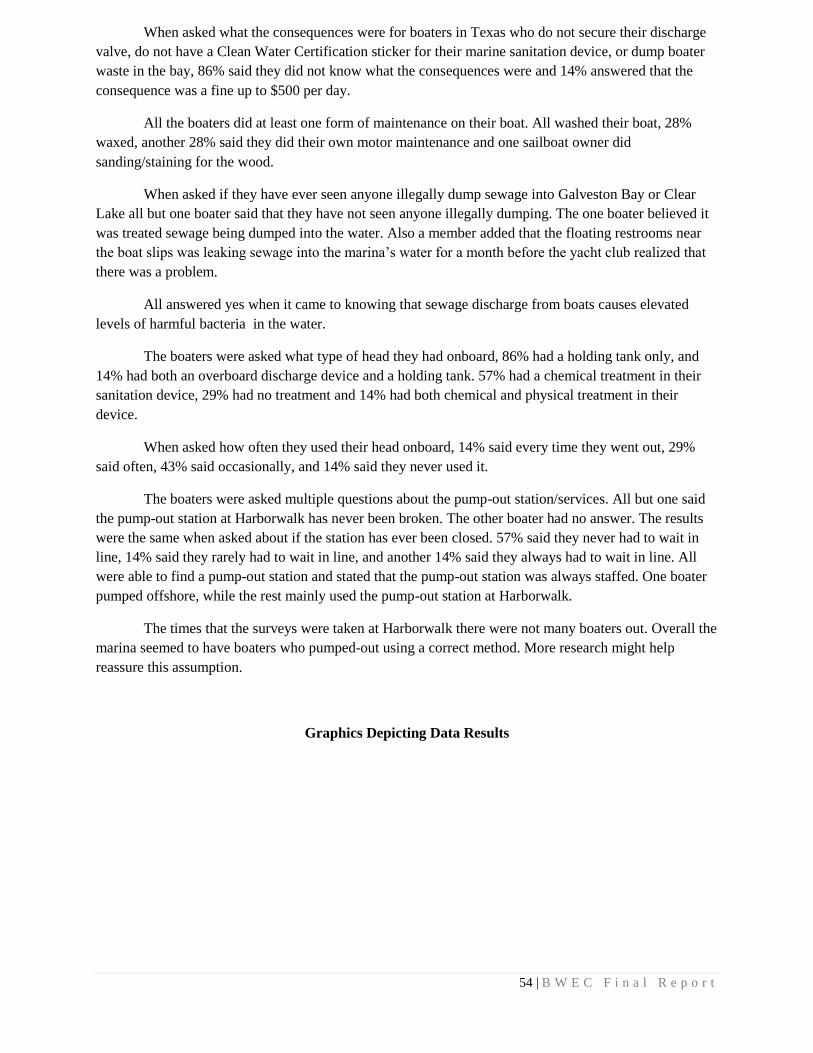
54 | B W E C F i n a l R e p o r t
When asked what the consequences were for boaters in Texas who do not secure their discharge
valve, do not have a Clean Water Certification sticker for their marine sanitation device, or dump boater
waste in the bay, 86% said they did not know what the consequences were and 14% answered that the
consequence was a fine up to $500 per day.
All the boaters did at least one form of maintenance on their boat. All washed their boat, 28%
waxed, another 28% said they did their own motor maintenance and one sailboat owner did
sanding/staining for the wood.
When asked if they have ever seen anyone illegally dump sewage into Galveston Bay or Clear
Lake all but one boater said that they have not seen anyone illegally dumping. The one boater believed it
was treated sewage being dumped into the water. Also a member added that the floating restrooms near
the boat slips was leaking sewage into the marina’s water for a month before the yacht club realized that
there was a problem.
All answered yes when it came to knowing that sewage discharge from boats causes elevated
levels of harmful bacteria in the water.
The boaters were asked what type of head they had onboard, 86% had a holding tank only, and
14% had both an overboard discharge device and a holding tank. 57% had a chemical treatment in their
sanitation device, 29% had no treatment and 14% had both chemical and physical treatment in their
device.
When asked how often they used their head onboard, 14% said every time they went out, 29%
said often, 43% said occasionally, and 14% said they never used it.
The boaters were asked multiple questions about the pump-out station/services. All but one said
the pump-out station at Harborwalk has never been broken. The other boater had no answer. The results
were the same when asked about if the station has ever been closed. 57% said they never had to wait in
line, 14% said they rarely had to wait in line, and another 14% said they always had to wait in line. All
were able to find a pump-out station and stated that the pump-out station was always staffed. One boater
pumped offshore, while the rest mainly used the pump-out station at Harborwalk.
The times that the surveys were taken at Harborwalk there were not many boaters out. Overall the
marina seemed to have boaters who pumped-out using a correct method. More research might help
reassure this assumption.
Graphics Depicting Data Results
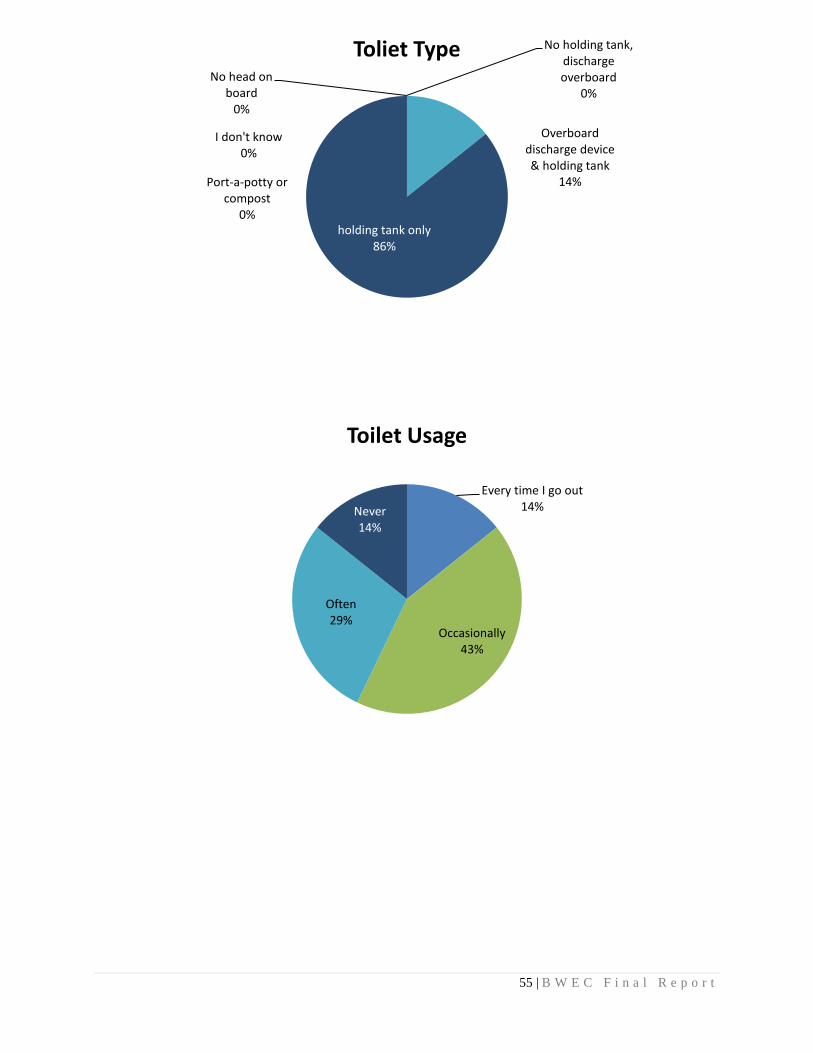
55 | B W E C F i n a l R e p o r t
No head on board
0%
No holding tank, discharge overboard
0%
Overboard discharge device & holding tank
14%
holding tank only86%
Port-a-potty or compost
0%
I don't know 0%
Toliet Type
Every time I go out14%
Occasionally43%
Often 29%
Never14%
Toilet Usage
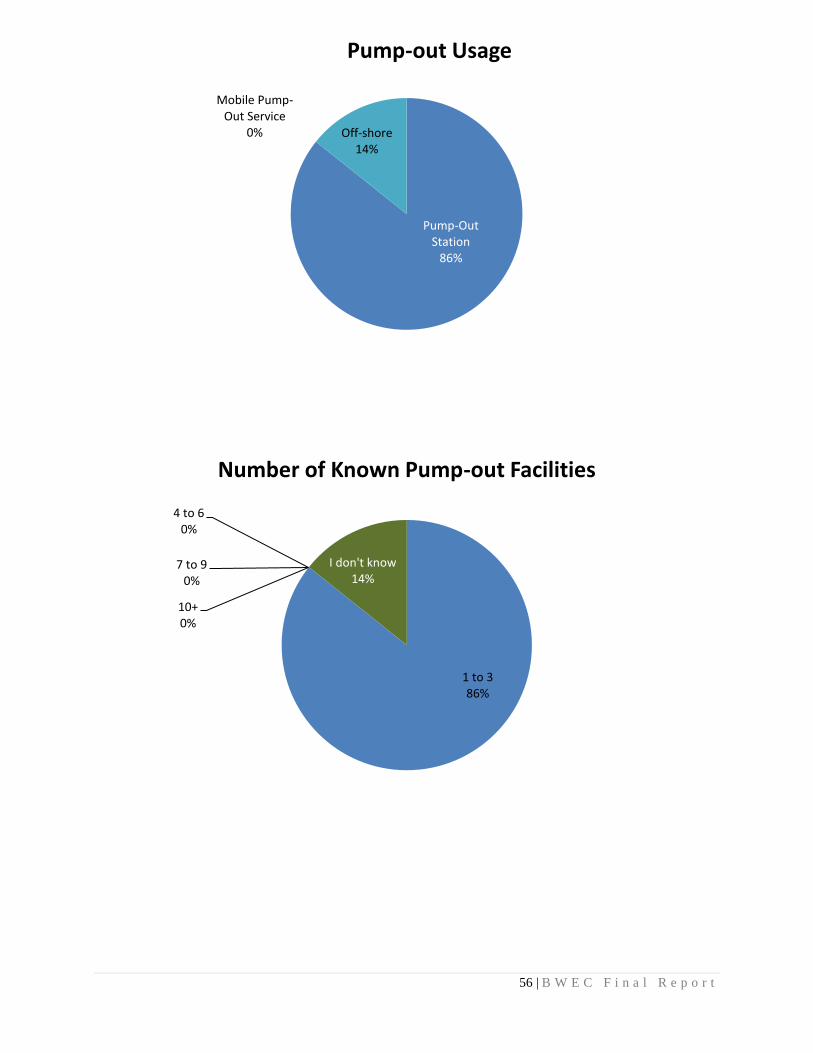
56 | B W E C F i n a l R e p o r t
Pump-Out Station
86%
Mobile Pump-Out Service
0% Off-shore14%
Pump-out Usage
1 to 3 86%
4 to 60%
7 to 90%
10+0%
I don't know 14%
Number of Known Pump-out Facilities
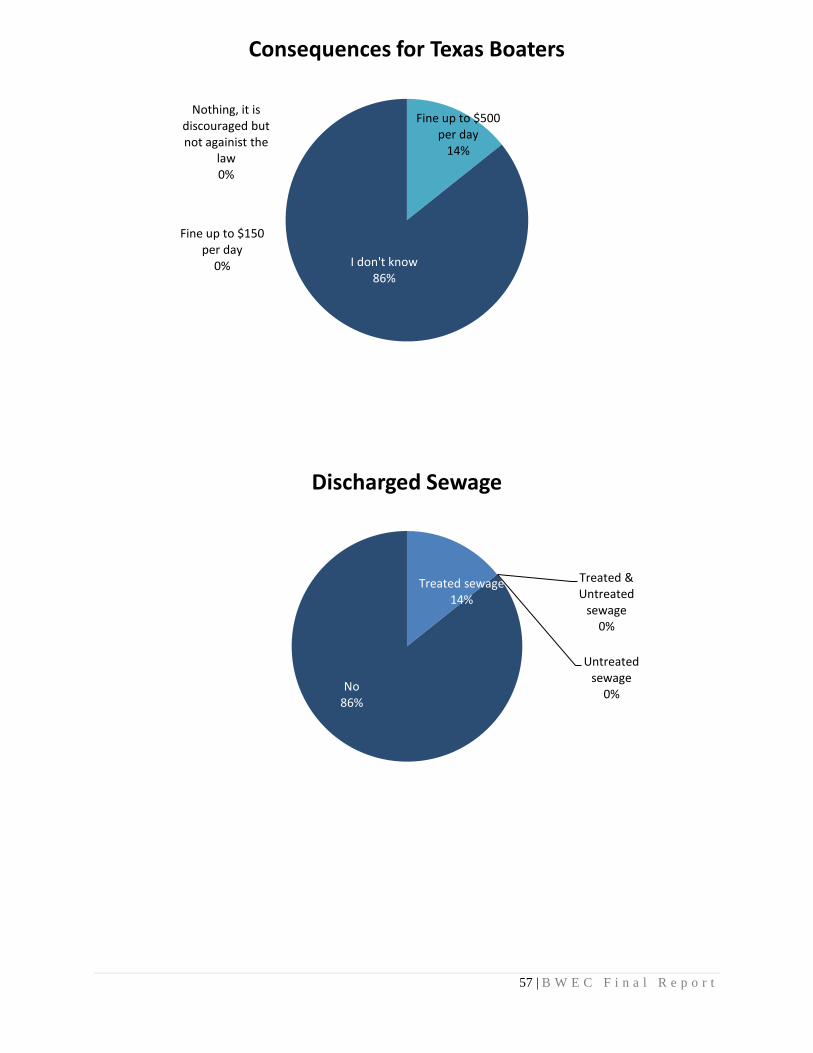
57 | B W E C F i n a l R e p o r t
Nothing, it is discouraged but not againist the
law0%
Fine up to $150 per day
0%
Fine up to $500 per day
14%
I don't know86%
Consequences for Texas Boaters
Treated sewage14%
Untreated sewage
0%
Treated & Untreated
sewage0%
No86%
Discharged Sewage
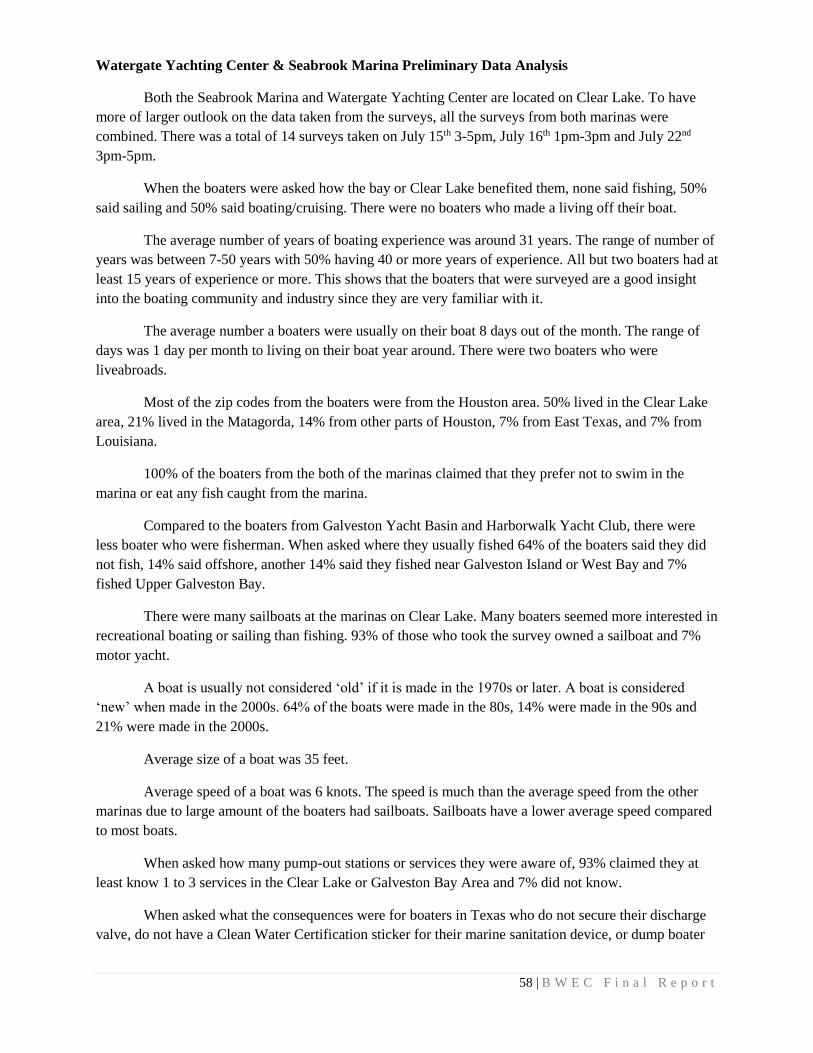
58 | B W E C F i n a l R e p o r t
Watergate Yachting Center & Seabrook Marina Preliminary Data Analysis
Both the Seabrook Marina and Watergate Yachting Center are located on Clear Lake. To have
more of larger outlook on the data taken from the surveys, all the surveys from both marinas were
combined. There was a total of 14 surveys taken on July 15th 3-5pm, July 16th 1pm-3pm and July 22nd
3pm-5pm.
When the boaters were asked how the bay or Clear Lake benefited them, none said fishing, 50%
said sailing and 50% said boating/cruising. There were no boaters who made a living off their boat.
The average number of years of boating experience was around 31 years. The range of number of
years was between 7-50 years with 50% having 40 or more years of experience. All but two boaters had at
least 15 years of experience or more. This shows that the boaters that were surveyed are a good insight
into the boating community and industry since they are very familiar with it.
The average number a boaters were usually on their boat 8 days out of the month. The range of
days was 1 day per month to living on their boat year around. There were two boaters who were
liveabroads.
Most of the zip codes from the boaters were from the Houston area. 50% lived in the Clear Lake
area, 21% lived in the Matagorda, 14% from other parts of Houston, 7% from East Texas, and 7% from
Louisiana.
100% of the boaters from the both of the marinas claimed that they prefer not to swim in the
marina or eat any fish caught from the marina.
Compared to the boaters from Galveston Yacht Basin and Harborwalk Yacht Club, there were
less boater who were fisherman. When asked where they usually fished 64% of the boaters said they did
not fish, 14% said offshore, another 14% said they fished near Galveston Island or West Bay and 7%
fished Upper Galveston Bay.
There were many sailboats at the marinas on Clear Lake. Many boaters seemed more interested in
recreational boating or sailing than fishing. 93% of those who took the survey owned a sailboat and 7%
motor yacht.
A boat is usually not considered ‘old’ if it is made in the 1970s or later. A boat is considered
‘new’ when made in the 2000s. 64% of the boats were made in the 80s, 14% were made in the 90s and
21% were made in the 2000s.
Average size of a boat was 35 feet.
Average speed of a boat was 6 knots. The speed is much than the average speed from the other
marinas due to large amount of the boaters had sailboats. Sailboats have a lower average speed compared
to most boats.
When asked how many pump-out stations or services they were aware of, 93% claimed they at
least know 1 to 3 services in the Clear Lake or Galveston Bay Area and 7% did not know.
When asked what the consequences were for boaters in Texas who do not secure their discharge
valve, do not have a Clean Water Certification sticker for their marine sanitation device, or dump boater
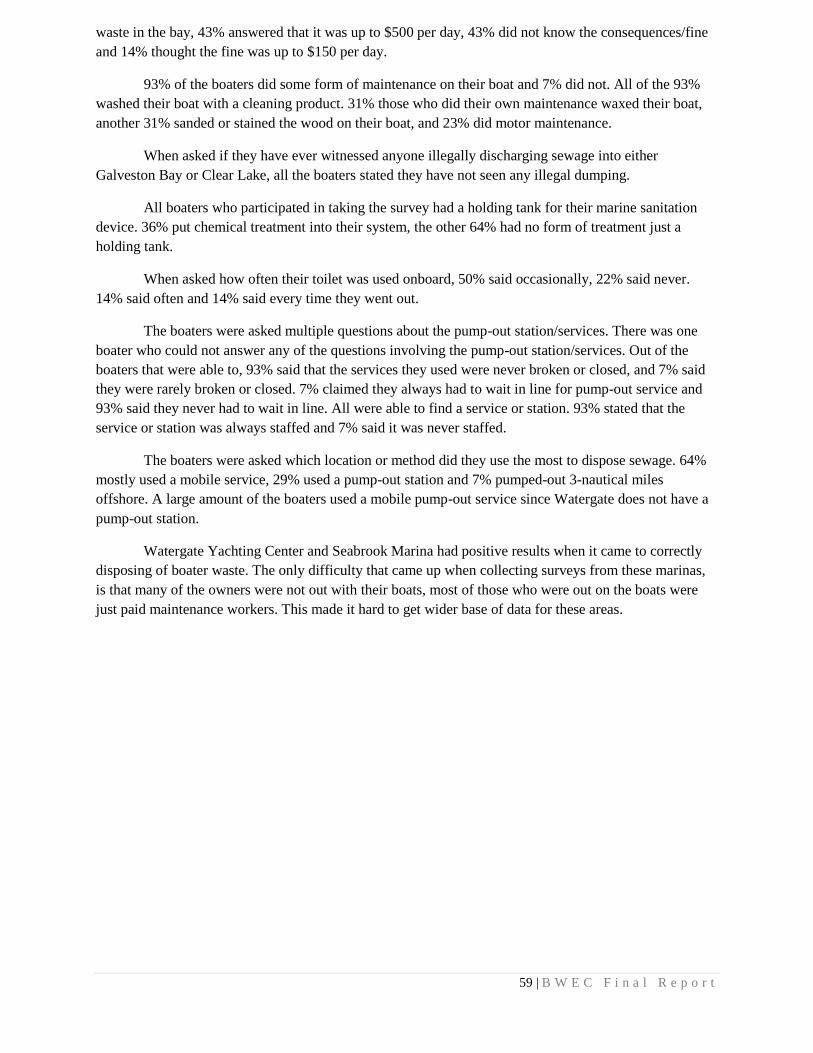
59 | B W E C F i n a l R e p o r t
waste in the bay, 43% answered that it was up to $500 per day, 43% did not know the consequences/fine
and 14% thought the fine was up to $150 per day.
93% of the boaters did some form of maintenance on their boat and 7% did not. All of the 93%
washed their boat with a cleaning product. 31% those who did their own maintenance waxed their boat,
another 31% sanded or stained the wood on their boat, and 23% did motor maintenance.
When asked if they have ever witnessed anyone illegally discharging sewage into either
Galveston Bay or Clear Lake, all the boaters stated they have not seen any illegal dumping.
All boaters who participated in taking the survey had a holding tank for their marine sanitation
device. 36% put chemical treatment into their system, the other 64% had no form of treatment just a
holding tank.
When asked how often their toilet was used onboard, 50% said occasionally, 22% said never.
14% said often and 14% said every time they went out.
The boaters were asked multiple questions about the pump-out station/services. There was one
boater who could not answer any of the questions involving the pump-out station/services. Out of the
boaters that were able to, 93% said that the services they used were never broken or closed, and 7% said
they were rarely broken or closed. 7% claimed they always had to wait in line for pump-out service and
93% said they never had to wait in line. All were able to find a service or station. 93% stated that the
service or station was always staffed and 7% said it was never staffed.
The boaters were asked which location or method did they use the most to dispose sewage. 64%
mostly used a mobile service, 29% used a pump-out station and 7% pumped-out 3-nautical miles
offshore. A large amount of the boaters used a mobile pump-out service since Watergate does not have a
pump-out station.
Watergate Yachting Center and Seabrook Marina had positive results when it came to correctly
disposing of boater waste. The only difficulty that came up when collecting surveys from these marinas,
is that many of the owners were not out with their boats, most of those who were out on the boats were
just paid maintenance workers. This made it hard to get wider base of data for these areas.
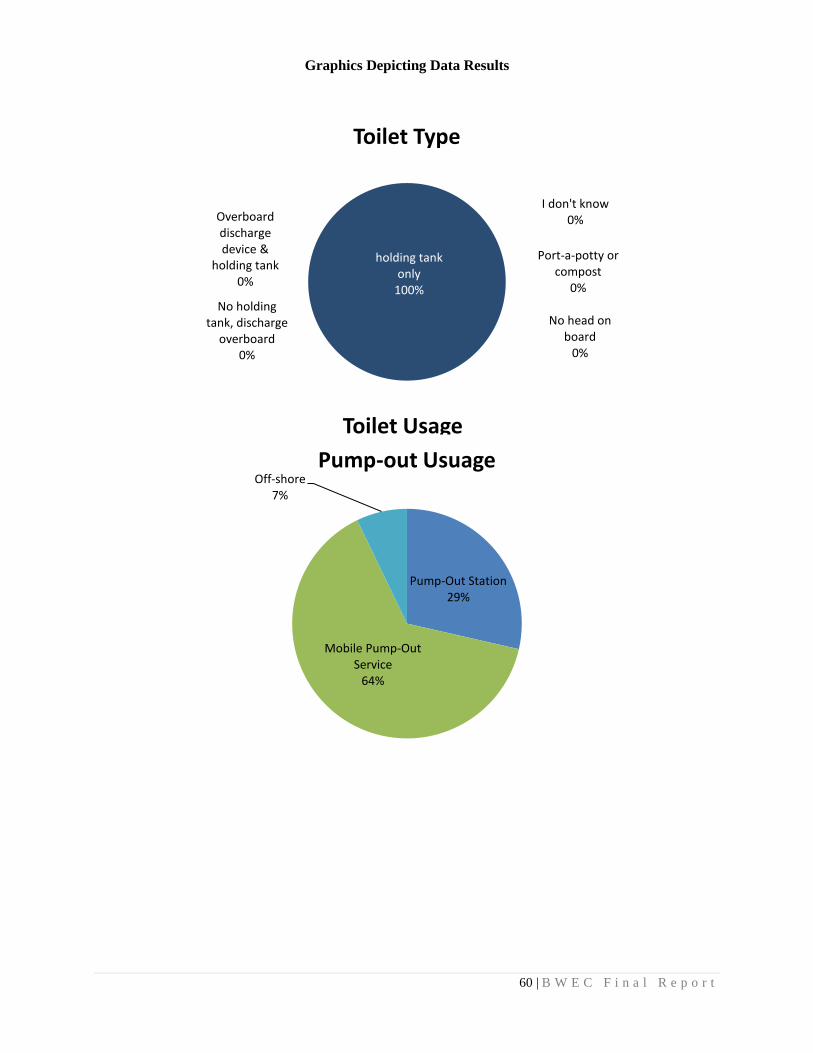
60 | B W E C F i n a l R e p o r t
Graphics Depicting Data Results
No head on board
0%
No holding tank, discharge
overboard0%
Overboard discharge device &
holding tank0%
holding tank only
100%
Port-a-potty or compost
0%
I don't know 0%
Toilet Type
Every time I go out14%
Occasionally50%
Often 14%
Never22%
Toilet Usage
Pump-Out Station29%
Mobile Pump-Out Service
64%
Off-shore7%
Pump-out Usuage

61 | B W E C F i n a l R e p o r t
Nothing, it is discouraged but not againist the
law0%
Fine up to $150 per day
14%
Fine up to $500 per day
43%
I don't know43%
Consequences for Texas Boaters
1 to 3 93%
4 to 60%
7 to 90%
10+0%
I don't know 7%
Number of Known Pump-out Facilities
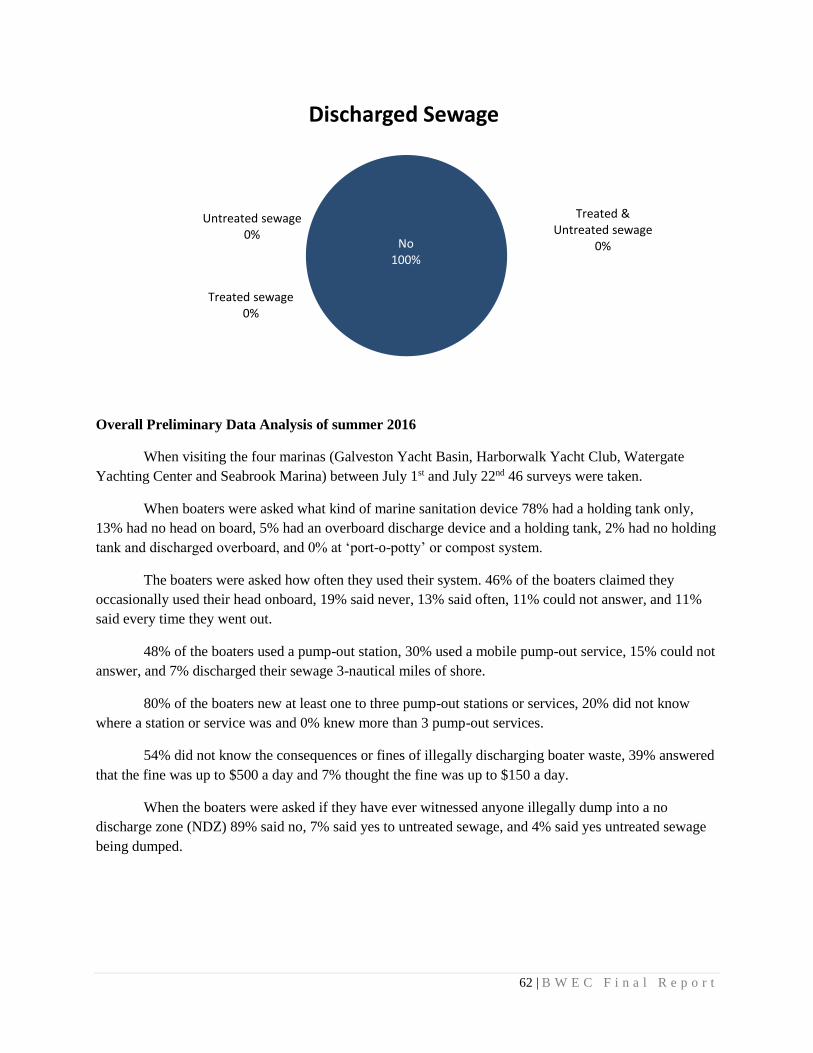
62 | B W E C F i n a l R e p o r t
Overall Preliminary Data Analysis of summer 2016
When visiting the four marinas (Galveston Yacht Basin, Harborwalk Yacht Club, Watergate
Yachting Center and Seabrook Marina) between July 1st and July 22nd 46 surveys were taken.
When boaters were asked what kind of marine sanitation device 78% had a holding tank only,
13% had no head on board, 5% had an overboard discharge device and a holding tank, 2% had no holding
tank and discharged overboard, and 0% at ‘port-o-potty’ or compost system.
The boaters were asked how often they used their system. 46% of the boaters claimed they
occasionally used their head onboard, 19% said never, 13% said often, 11% could not answer, and 11%
said every time they went out.
48% of the boaters used a pump-out station, 30% used a mobile pump-out service, 15% could not
answer, and 7% discharged their sewage 3-nautical miles of shore.
80% of the boaters new at least one to three pump-out stations or services, 20% did not know
where a station or service was and 0% knew more than 3 pump-out services.
54% did not know the consequences or fines of illegally discharging boater waste, 39% answered
that the fine was up to $500 a day and 7% thought the fine was up to $150 a day.
When the boaters were asked if they have ever witnessed anyone illegally dump into a no
discharge zone (NDZ) 89% said no, 7% said yes to untreated sewage, and 4% said yes untreated sewage
being dumped.
Treated sewage0%
Untreated sewage0%
Treated & Untreated sewage
0%No100%
Discharged Sewage
63 | B W E C F i n a l R e p o r t
No head on board13%
No holding tank, discharge overboard
2%
Overboard discharge device & holding tank
5%
holding tank only78%
Port-a-potty or compost
0%
I don't know 2%
Toilet Type
Every time I go out11%
Occasionally46%
Often 13%
Never19%
N/A11%
Toilet Usage
64 | B W E C F i n a l R e p o r t
Pump-Out Station48%
Mobile Pump-Out Service
30%
Off-shore7%
N/A15%
Pump-out Usage
1 to 3 80%
4 to 60%
7 to 90%
10+0%
I don't know 20%
Number of Known Pump-out Facilities
65 | B W E C F i n a l R e p o r t
Comparison with Preliminary Data Analysis from summer 2014
To see if there has been any changes in the boating industry, when it comes to boater waste,
boater’s knowledge, and other concerns about illegal discharging, data from surveys taken in summer
2014 is compared to the recent summer 2016 data.
In order to get a more accurate comparison and representation from the overall data percentages
from 2014 and 2016, Harborwalk Yacht Club, Galveston Yacht Basin and Watergate Yachting Center
Nothing, it is discouraged but not againist the
law0%
Fine up to $150 per day7%
Fine up to $500 per day
39%
I don't know54%
Consequences for Texas Boaters
Treated sewage4%
Untreated sewage7%
Treated & Untreated sewage
0%
No89%
Discharged Sewage
66 | B W E C F i n a l R e p o r t
data taken in 2014 was calculated together and compared to the marinas surveyed in summer 2016.
Seabrook Marina was not included in the 2014 data because no surveys were taken at this location.
In 2014 51% of the boaters had a holding tank only as their marine sanitation system, 23% had a
port-a-potty/compost system, 10% had no head on board, 6% had an overboard discharge with a holding
tank, another 6% had an overboard discharge without a holding tank, and 4% did not know what marine
sanitation device they had. In 2016 the amount of those who had holding tanks only jumped from 51% to
78%, both discharge overboard systems with or without a holding tank and reduced the same out. There
were no boaters who owned boat with a port-a-potty/compost system in 2016. The amount who did not
know what system they had abroad also dropped from 4% in 2014 to 2% 2014.
Most of the boaters in 2014 occasionally used their head on their boat (37%). 33% claimed they
used it every time they went out, 12% said they never used their head onboard, and 18% could not
answer. Those who used it occasionally grew to 46% in 2016, the boaters who used it every time they
went out/often decreased by 20% from 2014 to 2016, 19% said they never used it and 11% could not
answer.
When it came to how many pump-out stations or services the boaters were aware of in 2014, 55%
knew at least one to three services, 35% did not know any, 8% knew four to six, 2% or one boater knew
more than 10, and 0% knew seven to nine pump-out facilities or services. In 2016 the amount of boaters
who knew at least 1 to three pump-out services grew to 80% and those who did not know of any services
reduced by 15%.
The boaters were asked what the consequences were for not discharging correctly. In 2014 61%
did not know, 27% answered that could be fine that is up to $500 a day, 10% believed it was a fine up to
$150 a day, and 2% believed there was no consequence just that it was discouraged. There was a positive
shift in awareness of consequences from 2014 to 2016. 0% thought that there was no consequence for
illegal discharging, the amount of those who did not know reduced from 61% to 54%, the boaters that
answered that the fine was up $500 a day grew by 12%, for $150 a day it was reduced by 3%, and 0%
believed that there are no consequences or fines.
Finally the boaters were asked if they have ever seen another boater illegally pumping into the
Clear lake Area, or the Galveston Bay Area. In 2014 78% said no, 8% said yes to treated sewage being
dumped, another 8% said yes to untreated sewage and 6% said yes to both treated and untreated sewage.
These percentages improved from 2014 to 2016. 89% said no to witnessing illegal pumping, 7% said yes
to seeing untreated sewage, 4% said yes to treated sewage and no boaters reported that they have seen
illegal pumping of both treated and untreated sewage.
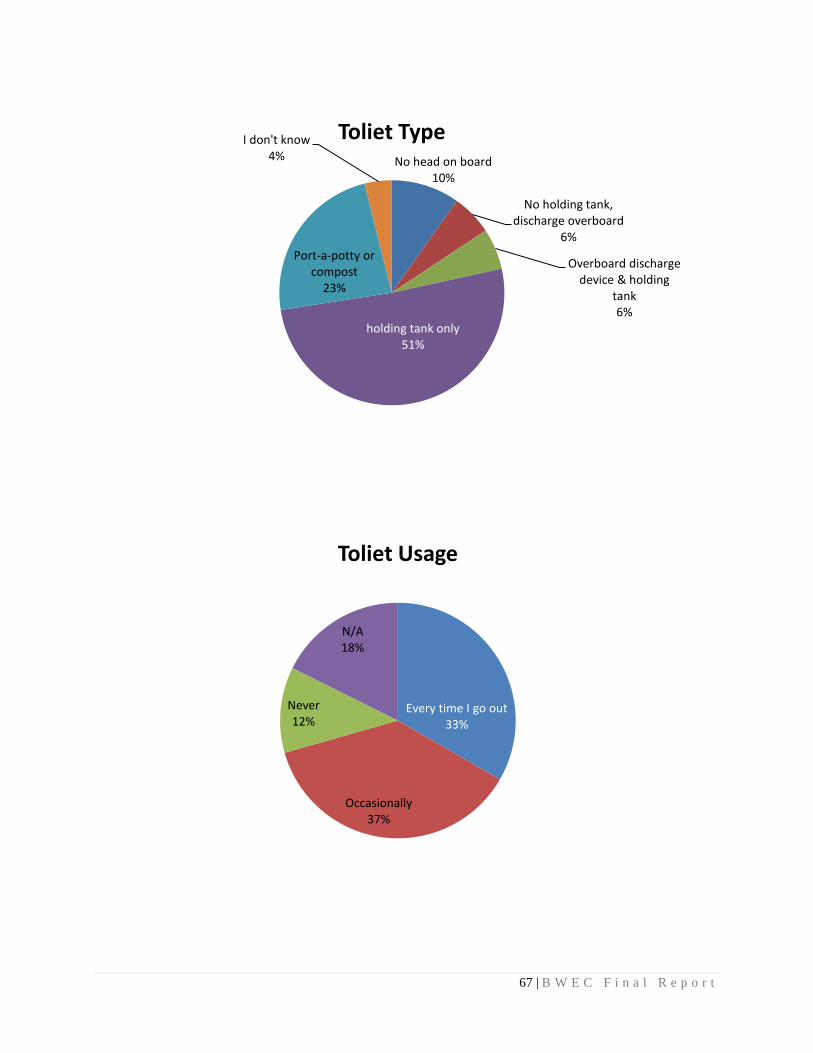
67 | B W E C F i n a l R e p o r t
No head on board10%
No holding tank, discharge overboard
6%
Overboard discharge device & holding
tank6%
holding tank only51%
Port-a-potty or compost
23%
I don't know 4%
Toliet Type
Every time I go out33%
Occasionally37%
Never12%
N/A18%
Toliet Usage
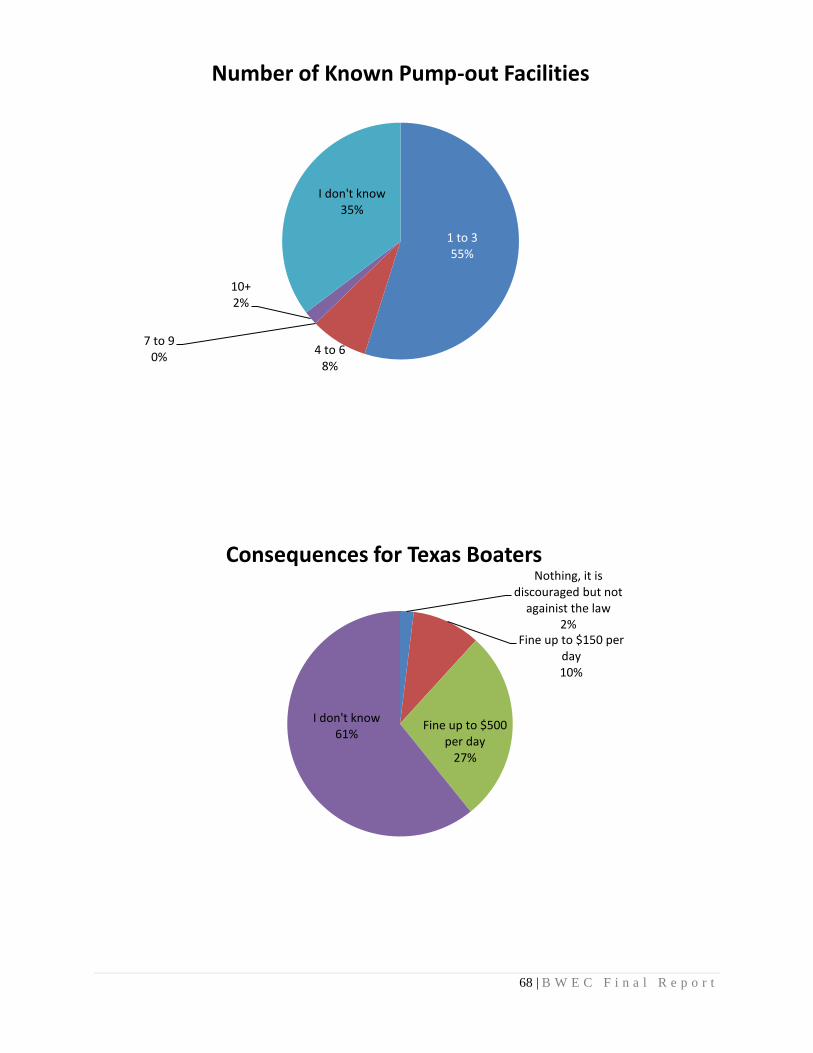
68 | B W E C F i n a l R e p o r t
1 to 3 55%
4 to 68%
7 to 90%
10+2%
I don't know 35%
Number of Known Pump-out Facilities
Nothing, it is discouraged but not
againist the law2%
Fine up to $150 per day10%
Fine up to $500 per day
27%
I don't know61%
Consequences for Texas Boaters
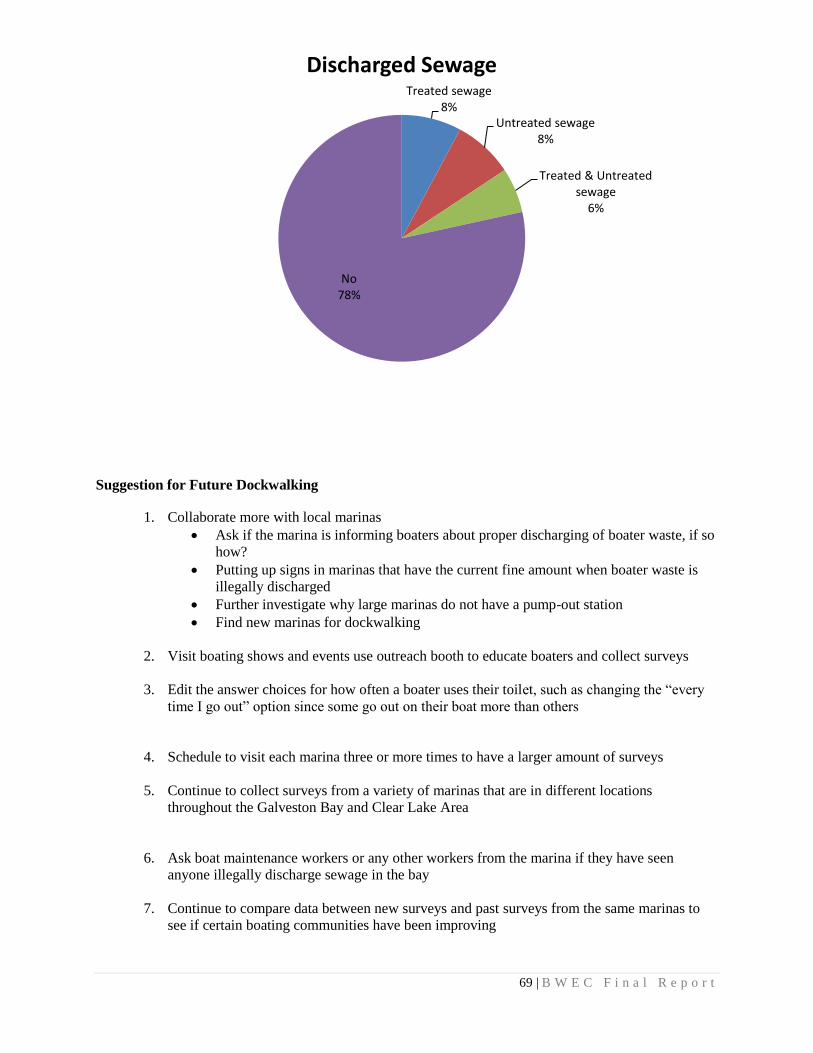
69 | B W E C F i n a l R e p o r t
Suggestion for Future Dockwalking
1. Collaborate more with local marinas
• Ask if the marina is informing boaters about proper discharging of boater waste, if so
how?
• Putting up signs in marinas that have the current fine amount when boater waste is
illegally discharged
• Further investigate why large marinas do not have a pump-out station
• Find new marinas for dockwalking
2. Visit boating shows and events use outreach booth to educate boaters and collect surveys
3. Edit the answer choices for how often a boater uses their toilet, such as changing the “every
time I go out” option since some go out on their boat more than others
4. Schedule to visit each marina three or more times to have a larger amount of surveys
5. Continue to collect surveys from a variety of marinas that are in different locations
throughout the Galveston Bay and Clear Lake Area
6. Ask boat maintenance workers or any other workers from the marina if they have seen
anyone illegally discharge sewage in the bay
7. Continue to compare data between new surveys and past surveys from the same marinas to
see if certain boating communities have been improving
Treated sewage8%
Untreated sewage8%
Treated & Untreated sewage
6%
No78%
Discharged Sewage
70 | B W E C F i n a l R e p o r t
Appendix III: Water Monitoring
Team

71 | B W E C F i n a l R e p o r t
How Clean Is My Water?
2016 Water Quality Year-In-Review, Water Monitoring Team
________________________________________________________________________
In 2016, GBF’s Water Quality Monitoring Team collected and analyzed 444 water samples from
51 sites around Galveston Bay. These samples were collected by 47 different volunteer monitors
who sampled for air and water temperature, dissolved oxygen, pH, salinity, water transparency
and depth, as well as general field observations. For more information about this program, visit
www.galvbay.org/watermonitors.
Figure 19. 2016 Water Monitoring Locations. Each blue dot represents a sampling location during 2016.
This document summarizes our findings for each parameter based on the Team’s 2016 data.
To view 2016 Water Quality summaries for each individual site, please click on each site on our
sampling map*, linked here or accessed from our webpage (www.galvbay.org/watermonitors).
This data can be viewed and downloaded from the Citizen Science Data Portal, accessed through
a button on our webpage (listed above).
*Sites on map without 2016 data summary are new as of 2017
Air Temperature: average of 24.0°C in 2016
This is HIGHER than in previous years
72 | B W E C F i n a l R e p o r t
2014 average: 22.4°C, 2015 average: 23.1°C
How does Water Temperature Impact Water Quality?
Air temperature impacts water quality by influencing weather processes and water temperatures.
According to the Data…
GBF’s Water Monitoring Team has observed a slight increase in the air temperature from year to year,
with 2016’s temperature the highest yet.
Water Temperature: average of 22.8°C in 2016
This is HIGHER than in previous years
2014 average: 21.9°C, 2015 average: 22.8°C
How does Water Temperature Impact Water Quality?
Water temperature can impact biological factors, including hibernation, reproduction, and migration..
Water temperature also impacts water chemistry. It can alter the rate of reactions and how much
dissolved oxygen the water can hold; cold water can hold more oxygen than warm water.
According to the Data…
GBF’s Water Monitoring Team has observed a slight increase in the average water temperature from
year to year, with 2016’s temperature the highest recorded.
Dissolved Oxygen: average of 6.3 mg/L in 2016
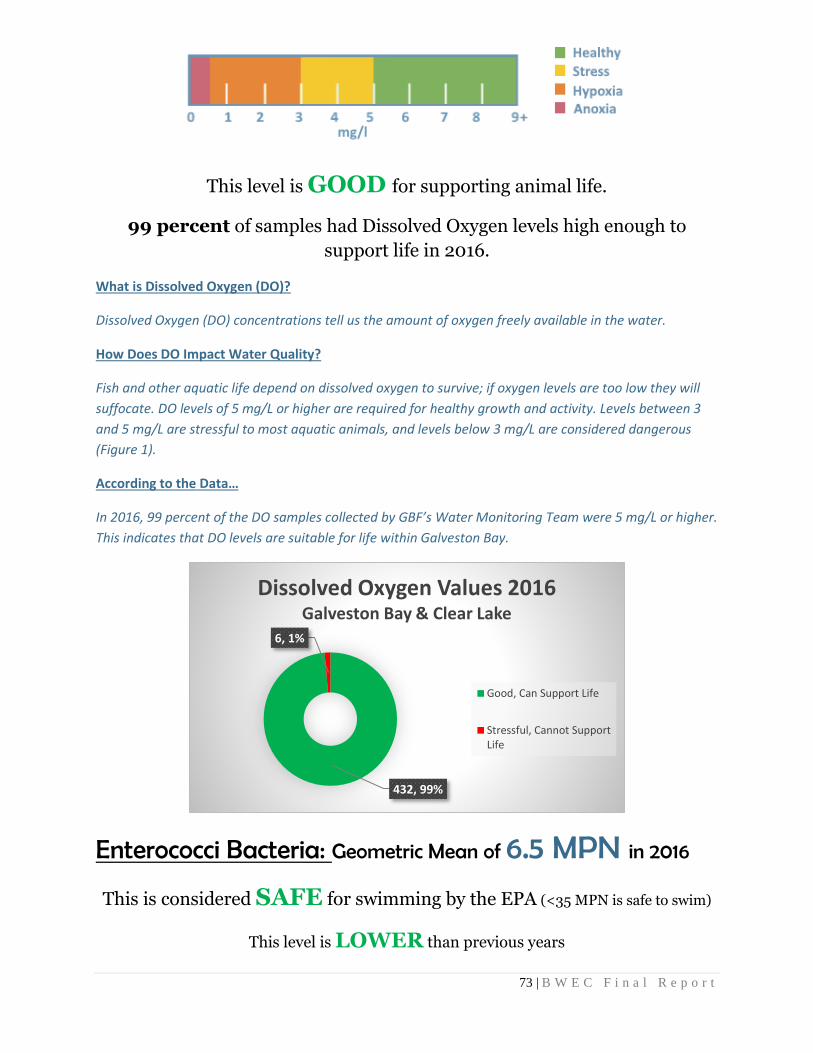
73 | B W E C F i n a l R e p o r t
This level is GOOD for supporting animal life.
99 percent of samples had Dissolved Oxygen levels high enough to
support life in 2016.
What is Dissolved Oxygen (DO)?
Dissolved Oxygen (DO) concentrations tell us the amount of oxygen freely available in the water.
How Does DO Impact Water Quality?
Fish and other aquatic life depend on dissolved oxygen to survive; if oxygen levels are too low they will
suffocate. DO levels of 5 mg/L or higher are required for healthy growth and activity. Levels between 3
and 5 mg/L are stressful to most aquatic animals, and levels below 3 mg/L are considered dangerous
(Figure 1).
According to the Data…
In 2016, 99 percent of the DO samples collected by GBF’s Water Monitoring Team were 5 mg/L or higher.
This indicates that DO levels are suitable for life within Galveston Bay.
Enterococci Bacteria: Geometric Mean of 6.5 MPN in 2016
This is considered SAFE for swimming by the EPA (<35 MPN is safe to swim)
This level is LOWER than previous years
432, 99%
6, 1%
Dissolved Oxygen Values 2016Galveston Bay & Clear Lake
Good, Can Support Life
Stressful, Cannot SupportLife
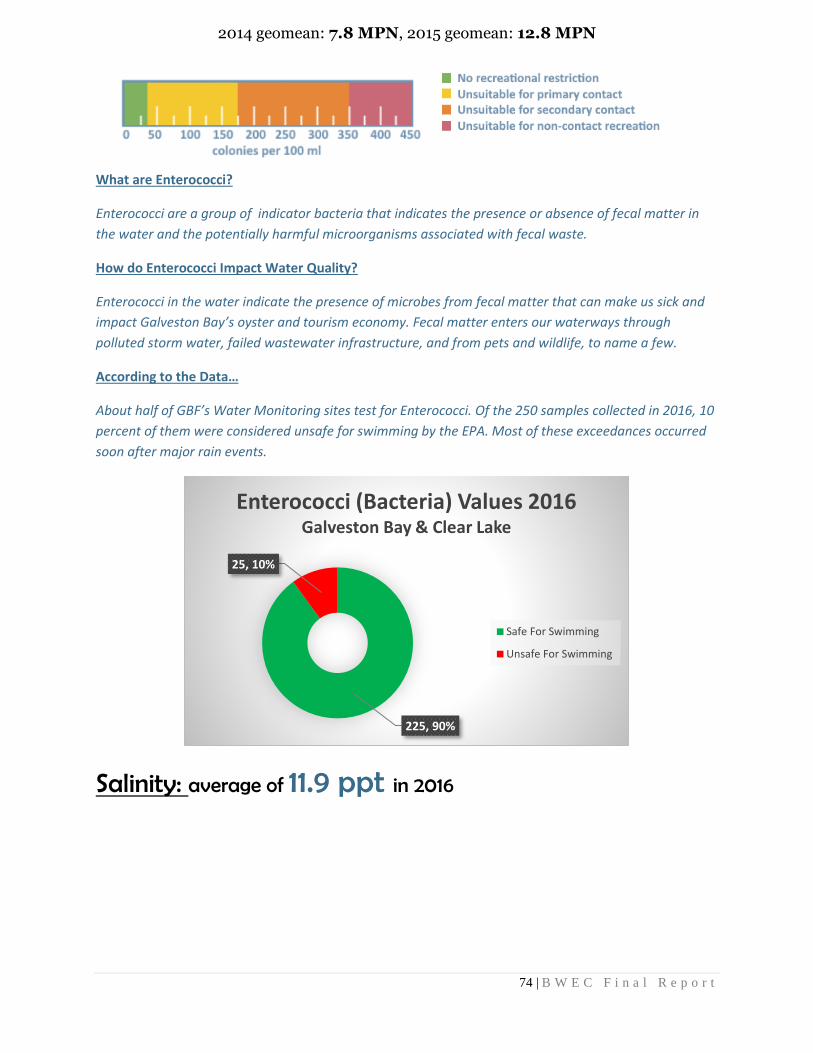
74 | B W E C F i n a l R e p o r t
2014 geomean: 7.8 MPN, 2015 geomean: 12.8 MPN
What are Enterococci?
Enterococci are a group of indicator bacteria that indicates the presence or absence of fecal matter in
the water and the potentially harmful microorganisms associated with fecal waste.
How do Enterococci Impact Water Quality?
Enterococci in the water indicate the presence of microbes from fecal matter that can make us sick and
impact Galveston Bay’s oyster and tourism economy. Fecal matter enters our waterways through
polluted storm water, failed wastewater infrastructure, and from pets and wildlife, to name a few.
According to the Data…
About half of GBF’s Water Monitoring sites test for Enterococci. Of the 250 samples collected in 2016, 10
percent of them were considered unsafe for swimming by the EPA. Most of these exceedances occurred
soon after major rain events.
Salinity: average of 11.9 ppt in 2016
225, 90%
25, 10%
Enterococci (Bacteria) Values 2016Galveston Bay & Clear Lake
Safe For Swimming
Unsafe For Swimming
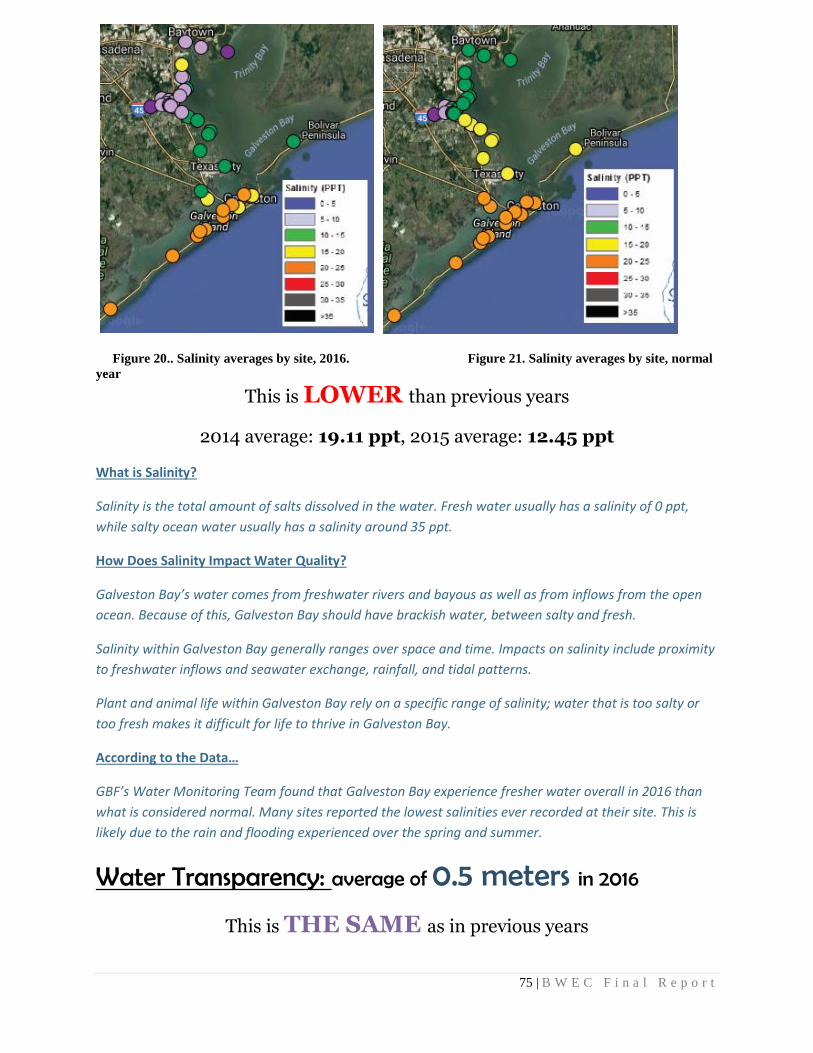
75 | B W E C F i n a l R e p o r t
Figure 20.. Salinity averages by site, 2016. Figure 21. Salinity averages by site, normal
year
This is LOWER than previous years
2014 average: 19.11 ppt, 2015 average: 12.45 ppt
What is Salinity?
Salinity is the total amount of salts dissolved in the water. Fresh water usually has a salinity of 0 ppt,
while salty ocean water usually has a salinity around 35 ppt.
How Does Salinity Impact Water Quality?
Galveston Bay’s water comes from freshwater rivers and bayous as well as from inflows from the open
ocean. Because of this, Galveston Bay should have brackish water, between salty and fresh.
Salinity within Galveston Bay generally ranges over space and time. Impacts on salinity include proximity
to freshwater inflows and seawater exchange, rainfall, and tidal patterns.
Plant and animal life within Galveston Bay rely on a specific range of salinity; water that is too salty or
too fresh makes it difficult for life to thrive in Galveston Bay.
According to the Data…
GBF’s Water Monitoring Team found that Galveston Bay experience fresher water overall in 2016 than
what is considered normal. Many sites reported the lowest salinities ever recorded at their site. This is
likely due to the rain and flooding experienced over the spring and summer.
Water Transparency: average of 0.5 meters in 2016
This is THE SAME as in previous years
76 | B W E C F i n a l R e p o r t
2014 average: 0.55m, 2015 average: 0.46m
What is Water Transparency?
Water transparency, or turbidity, measures how much solid matter is suspended in the water. It directly
measures how these suspended solids decrease light passing through the water. The higher the
transparency, the farther down the light passes and the clearer the water appears.
How Does Water Transparency Impact Water Quality?
Turbid waters can prevent plants from getting enough sunlight to grow, and settling sediment can bury
or suffocate plants and animals living on the bottom of the Bay.
Galveston Bay’s turbid waters are due to:
- sediments from the Bay Bottom mixing in the water column
- erosion of the surrounding land
- vegetation (ie. plankton, algae) growing in the water column.
Galveston Bay and the surrounding land has very small sediment particles, so sediment often floats in
the water for a long time before settling to the bottom. This, coupled with a shallow and windy bay
system, naturally leads to relatively turbid water in Galveston Bay. However, increased erosion due to
development and storm water runoff can increase the amount of particles in the water column, causing
the water to be more turbid (or less clear).
According to the Data…
In 2016, the average transparency measured by GBF’s Water Monitoring Team was 0.5 meters, very
similar to transparency measured in prior years.
pH: average of 7.9 in 2016
77 | B W E C F i n a l R e p o r t
This is IDEAL to support life
This is THE SAME as in previous years
2014 average: 8.1, 2015 average: 7.9
What is pH?
pH is a measurement of how acidic the water is. A pH with a measurement of 7 is considered neutral.
Anything less than 7 is acidic, anything greater than 7 is basic. The scale is logarithmic, so every one-unit
change equals a ten-fold increase or decrease in acidity.
How Does pH Impact Water Quality?
pH impacts the life and growth rates of aquatic life, how chemicals and pollutants dissolve or react in
water, and whether or not these pollutants can be absorbed by animals in the water. A range of 6.5 to 8
is considered ideal for most life. A pH less than 5 or greater than 9 is considered dangerous or deadly.
According to the Data…
pH has been relatively stable in Galveston Bay over the years, and is considered within a healthy and
normal range.
Acknowledgements
Thank you to all 44 volunteer water quality monitors for dedicating their time and effort to
collecting this data. A special ‘thank you’ to GBF’s two volunteer lab assistants, Dave and
327, 74%
112, 25%
2, 1%
pH Values, 2016 Galveston Bay & Clear Lake
Ideal for Growth
Suitable for Growth
Cannot Support Life
78 | B W E C F i n a l R e p o r t
Casandra, for spending countless hours in our lab processing and analyzing enterococci
samples.
Additionally, thank you to Lindsey Fuchs, a student from Clear Horizons High School, for
assembling the bar graphs featured in this publication that show ideal ranges for dissolved
oxygen, enterococci, and pH. Lindsey also conducted water quality testing on a weekly basis
throughout her Fall 2016 semester.
THIS PROJECT IS FUNDED IN PART BY A TEXAS COASTAL MANAGEMENT PROGRAM GRANT APPROVED BY THE
TEXAS LAND COMMISSIONER PURSUANT TO NATIONAL OCEANIC AND ATMOSPHERIC ADMINISTRATION AWARD
NO. NA15NOS4190162.
79 | B W E C F i n a l R e p o r t
Table A3: Water Monitoring Action Plan Blueprint
Assessment
Type: BI
Outcome: Citizens and
stakeholders choose to
reduce polluted runoff
entering Galveston Bay
Reason: B. To exemplify and communicate
the impact of human threats on water quality
in order to design strategies and encourage
public to reduce those threats
User: I. Landowners,
households, recreational
water users
Monitoring question: 1 of 2: How do human events and activities impact Galveston Bay?
Will be answered by: incorporation of data into GBF presentations that outlines how water quality varies with: nearby
runoff and development, boater waste and activity. Answering A2: how does monitoring data improve Water Programs? (add
question to RBW survey, Cease the Grease?)
Id #
Decision
Maker
Decision Made
(outcomes):
Info Needed Information
Product
(outputs)
Action Plan Steps
A1 GBF Water
Quality
Outreach
Coordinator
and other
Social
Marketing
campaign
organizers
Decision makers
use data to
exemplify
whether or not
humans are
impacting the
Bay and will
decide to present
and report results
so that the public
better
understands how
their actions
impact their
surrounding
environment.
-Monitoring locations along a
gradient of human use/impact.
-Water quality data, including:
turbidity, DO, salinity, water
color and odor, fecal indicator
bacteria, bird count and guano
coverage
-Method to quantify
development/human use
-Comparison of water data
between various levels of human
use
-Data collected at regular
intervals around the bay, at
equal(ish) number of sites for
each use level, for at least 1 year.
- WMT volunteers provide
validity and analysis of data
GBF water
team uses
information to
create relevant
presentations
for different
audiences.
Find development
data or method for
quantifying human
activity
- Define role of
WMT Site
Analysis
Volunteer
A2 Residents
and users of
lower
Galveston
Bay
watershed
Residents and
users of the Bay
make more
informed,
everyday
decisions to
decrease amount
of polluted
runoff entering
the Bay and
improve quality
of life. Decisions
include
conserving
water, reducing
runoff, cleaning
up after pets,
properly
disposing of
FOG and
decreasing use of
pollutants on
yards.
- Water quality data, including:
turbidity, DO, salinity, water
color and odor, fecal indicator
bacteria
-Method to quantify
development/human use
-Analyzed data on how human
activity impacts Galveston Bay’s
water quality are
available/presented
-Information on actions they can
take to decrease their impact on
Galveston Bay
- WMT volunteers provide
validity and analysis of data
Use WMT data
when creating
campaigns and
deliverables
through
messaging of
data. (GBF
data used to
show improve
in WQ from
campaign
actions). How
to incorporate
language into
campaigns.
Identify
communities to
focus on.
Within ID’d
communities,
determine contacts
and how they want
to see/receive
presentation of
data/interpretations
- Define role of
WMT Site
Analysis
Volunteer
A3 Galveston
Bay
Foundation
Report Card
Coordinator
and HARC
Include GBF
WMT data in
GB Report Card
to share data and
interpretations
with broader
audience than
GBF water team
- WMT data in usable form,
similar to other data used in
Report Card
incorporates
Water
Monitoring
data in Report
Card
Contact HARC
about using data,
determine data
needs and format
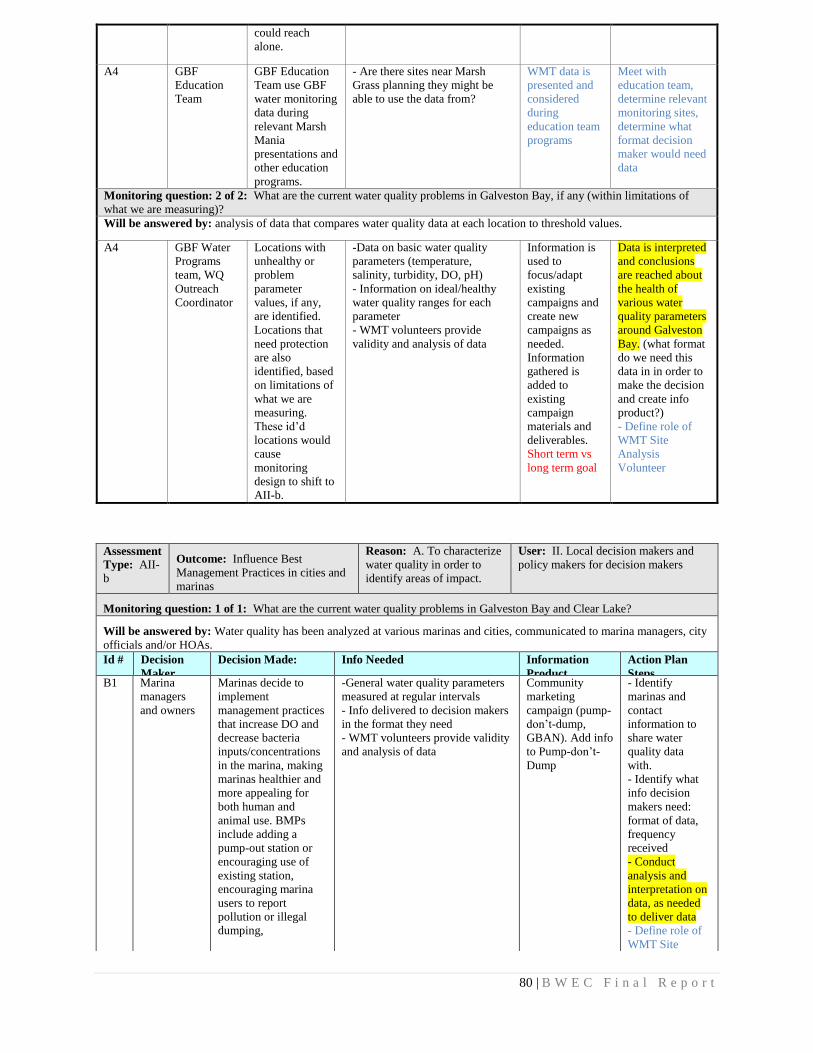
80 | B W E C F i n a l R e p o r t
could reach
alone.
A4 GBF
Education
Team
GBF Education
Team use GBF
water monitoring
data during
relevant Marsh
Mania
presentations and
other education
programs.
- Are there sites near Marsh
Grass planning they might be
able to use the data from?
WMT data is
presented and
considered
during
education team
programs
Meet with
education team,
determine relevant
monitoring sites,
determine what
format decision
maker would need
data
Monitoring question: 2 of 2: What are the current water quality problems in Galveston Bay, if any (within limitations of
what we are measuring)?
Will be answered by: analysis of data that compares water quality data at each location to threshold values.
A4 GBF Water
Programs
team, WQ
Outreach
Coordinator
Locations with
unhealthy or
problem
parameter
values, if any,
are identified.
Locations that
need protection
are also
identified, based
on limitations of
what we are
measuring.
These id’d
locations would
cause
monitoring
design to shift to
AII-b.
-Data on basic water quality
parameters (temperature,
salinity, turbidity, DO, pH)
- Information on ideal/healthy
water quality ranges for each
parameter
- WMT volunteers provide
validity and analysis of data
Information is
used to
focus/adapt
existing
campaigns and
create new
campaigns as
needed.
Information
gathered is
added to
existing
campaign
materials and
deliverables.
Short term vs
long term goal
Data is interpreted
and conclusions
are reached about
the health of
various water
quality parameters
around Galveston
Bay. (what format
do we need this
data in in order to
make the decision
and create info
product?)
- Define role of
WMT Site
Analysis
Volunteer
Assessment
Type: AII-
b
Outcome: Influence Best
Management Practices in cities and
marinas
Reason: A. To characterize
water quality in order to
identify areas of impact.
User: II. Local decision makers and
policy makers for decision makers
Monitoring question: 1 of 1: What are the current water quality problems in Galveston Bay and Clear Lake?
Will be answered by: Water quality has been analyzed at various marinas and cities, communicated to marina managers, city
officials and/or HOAs.
Id # Decision
Maker
Decision Made: Info Needed Information
Product
Action Plan
Steps B1 Marina
managers
and owners
Marinas decide to
implement
management practices
that increase DO and
decrease bacteria
inputs/concentrations
in the marina, making
marinas healthier and
more appealing for
both human and
animal use. BMPs
include adding a
pump-out station or
encouraging use of
existing station,
encouraging marina
users to report
pollution or illegal
dumping,
-General water quality parameters
measured at regular intervals
- Info delivered to decision makers
in the format they need
- WMT volunteers provide validity
and analysis of data
Community
marketing
campaign (pump-
don’t-dump,
GBAN). Add info
to Pump-don’t-
Dump
- Identify
marinas and
contact
information to
share water
quality data
with.
- Identify what
info decision
makers need:
format of data,
frequency
received
- Conduct
analysis and
interpretation on
data, as needed
to deliver data
- Define role of
WMT Site
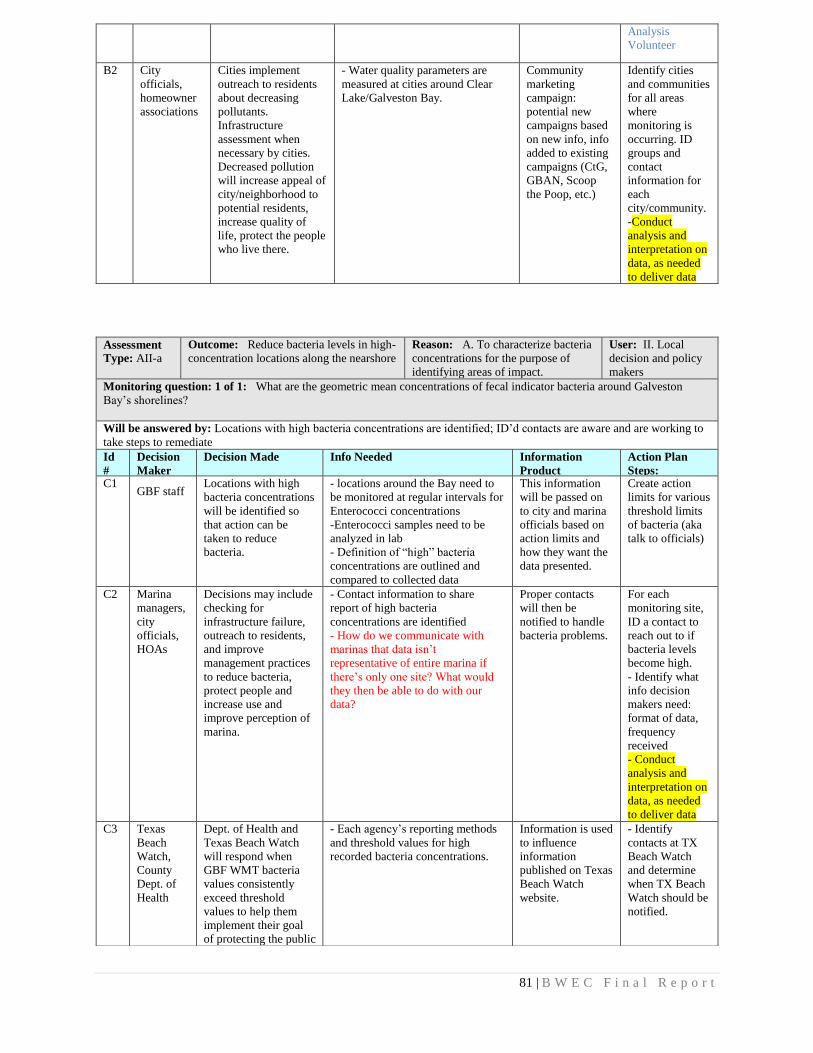
81 | B W E C F i n a l R e p o r t
Analysis
Volunteer
B2 City
officials,
homeowner
associations
Cities implement
outreach to residents
about decreasing
pollutants.
Infrastructure
assessment when
necessary by cities.
Decreased pollution
will increase appeal of
city/neighborhood to
potential residents,
increase quality of
life, protect the people
who live there.
- Water quality parameters are
measured at cities around Clear
Lake/Galveston Bay.
Community
marketing
campaign:
potential new
campaigns based
on new info, info
added to existing
campaigns (CtG,
GBAN, Scoop
the Poop, etc.)
Identify cities
and communities
for all areas
where
monitoring is
occurring. ID
groups and
contact
information for
each
city/community.
-Conduct
analysis and
interpretation on
data, as needed
to deliver data
Assessment
Type: AII-a
Outcome: Reduce bacteria levels in high-
concentration locations along the nearshore
Reason: A. To characterize bacteria
concentrations for the purpose of
identifying areas of impact.
User: II. Local
decision and policy
makers
Monitoring question: 1 of 1: What are the geometric mean concentrations of fecal indicator bacteria around Galveston
Bay’s shorelines?
Will be answered by: Locations with high bacteria concentrations are identified; ID’d contacts are aware and are working to
take steps to remediate
Id
#
Decision
Maker
Decision Made Info Needed Information
Product
Action Plan
Steps: C1
GBF staff Locations with high
bacteria concentrations
will be identified so
that action can be
taken to reduce
bacteria.
- locations around the Bay need to
be monitored at regular intervals for
Enterococci concentrations
-Enterococci samples need to be
analyzed in lab
- Definition of “high” bacteria
concentrations are outlined and
compared to collected data
This information
will be passed on
to city and marina
officials based on
action limits and
how they want the
data presented.
Create action
limits for various
threshold limits
of bacteria (aka
talk to officials)
C2 Marina
managers,
city
officials,
HOAs
Decisions may include
checking for
infrastructure failure,
outreach to residents,
and improve
management practices
to reduce bacteria,
protect people and
increase use and
improve perception of
marina.
- Contact information to share
report of high bacteria
concentrations are identified
- How do we communicate with
marinas that data isn’t
representative of entire marina if
there’s only one site? What would
they then be able to do with our
data?
Proper contacts
will then be
notified to handle
bacteria problems.
For each
monitoring site,
ID a contact to
reach out to if
bacteria levels
become high.
- Identify what
info decision
makers need:
format of data,
frequency
received
- Conduct
analysis and
interpretation on
data, as needed
to deliver data
C3 Texas
Beach
Watch,
County
Dept. of
Health
Dept. of Health and
Texas Beach Watch
will respond when
GBF WMT bacteria
values consistently
exceed threshold
values to help them
implement their goal
of protecting the public
- Each agency’s reporting methods
and threshold values for high
recorded bacteria concentrations.
Information is used
to influence
information
published on Texas
Beach Watch
website.
- Identify
contacts at TX
Beach Watch
and determine
when TX Beach
Watch should be
notified.

82 | B W E C F i n a l R e p o r t
from harmful
pathogens in water.
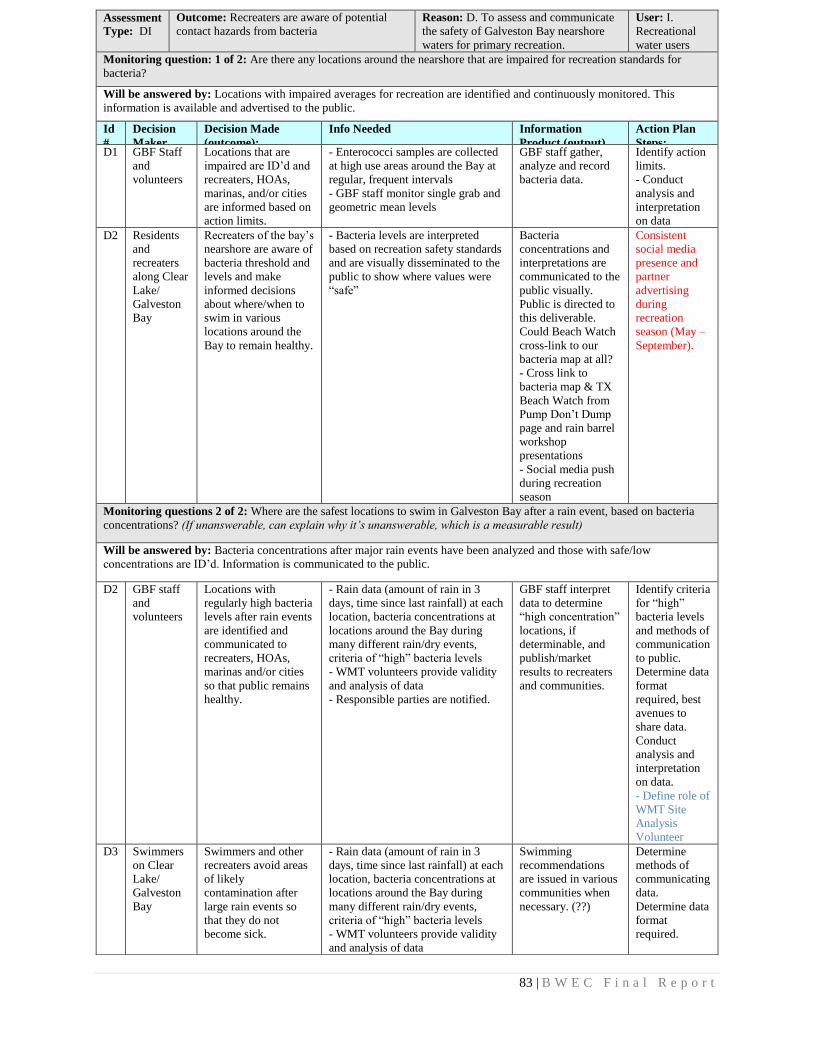
83 | B W E C F i n a l R e p o r t
Assessment
Type: DI
Outcome: Recreaters are aware of potential
contact hazards from bacteria
Reason: D. To assess and communicate
the safety of Galveston Bay nearshore
waters for primary recreation.
User: I.
Recreational
water users
Monitoring question: 1 of 2: Are there any locations around the nearshore that are impaired for recreation standards for
bacteria?
Will be answered by: Locations with impaired averages for recreation are identified and continuously monitored. This
information is available and advertised to the public.
Id
#
Decision
Maker
Decision Made
(outcome):
Info Needed Information
Product (output)
Action Plan
Steps: D1 GBF Staff
and
volunteers
Locations that are
impaired are ID’d and
recreaters, HOAs,
marinas, and/or cities
are informed based on
action limits.
- Enterococci samples are collected
at high use areas around the Bay at
regular, frequent intervals
- GBF staff monitor single grab and
geometric mean levels
GBF staff gather,
analyze and record
bacteria data.
Identify action
limits.
- Conduct
analysis and
interpretation
on data
D2 Residents
and
recreaters
along Clear
Lake/
Galveston
Bay
Recreaters of the bay’s
nearshore are aware of
bacteria threshold and
levels and make
informed decisions
about where/when to
swim in various
locations around the
Bay to remain healthy.
- Bacteria levels are interpreted
based on recreation safety standards
and are visually disseminated to the
public to show where values were
“safe”
Bacteria
concentrations and
interpretations are
communicated to the
public visually.
Public is directed to
this deliverable.
Could Beach Watch
cross-link to our
bacteria map at all?
- Cross link to
bacteria map & TX
Beach Watch from
Pump Don’t Dump
page and rain barrel
workshop
presentations
- Social media push
during recreation
season
Consistent
social media
presence and
partner
advertising
during
recreation
season (May –
September).
Monitoring questions 2 of 2: Where are the safest locations to swim in Galveston Bay after a rain event, based on bacteria
concentrations? (If unanswerable, can explain why it’s unanswerable, which is a measurable result)
Will be answered by: Bacteria concentrations after major rain events have been analyzed and those with safe/low
concentrations are ID’d. Information is communicated to the public.
D2 GBF staff
and
volunteers
Locations with
regularly high bacteria
levels after rain events
are identified and
communicated to
recreaters, HOAs,
marinas and/or cities
so that public remains
healthy.
- Rain data (amount of rain in 3
days, time since last rainfall) at each
location, bacteria concentrations at
locations around the Bay during
many different rain/dry events,
criteria of “high” bacteria levels
- WMT volunteers provide validity
and analysis of data
- Responsible parties are notified.
GBF staff interpret
data to determine
“high concentration”
locations, if
determinable, and
publish/market
results to recreaters
and communities.
Identify criteria
for “high”
bacteria levels
and methods of
communication
to public.
Determine data
format
required, best
avenues to
share data.
Conduct
analysis and
interpretation
on data.
- Define role of
WMT Site
Analysis
Volunteer
D3 Swimmers
on Clear
Lake/
Galveston
Bay
Swimmers and other
recreaters avoid areas
of likely
contamination after
large rain events so
that they do not
become sick.
- Rain data (amount of rain in 3
days, time since last rainfall) at each
location, bacteria concentrations at
locations around the Bay during
many different rain/dry events,
criteria of “high” bacteria levels
- WMT volunteers provide validity
and analysis of data
Swimming
recommendations
are issued in various
communities when
necessary. (??)
Determine
methods of
communicating
data.
Determine data
format
required.
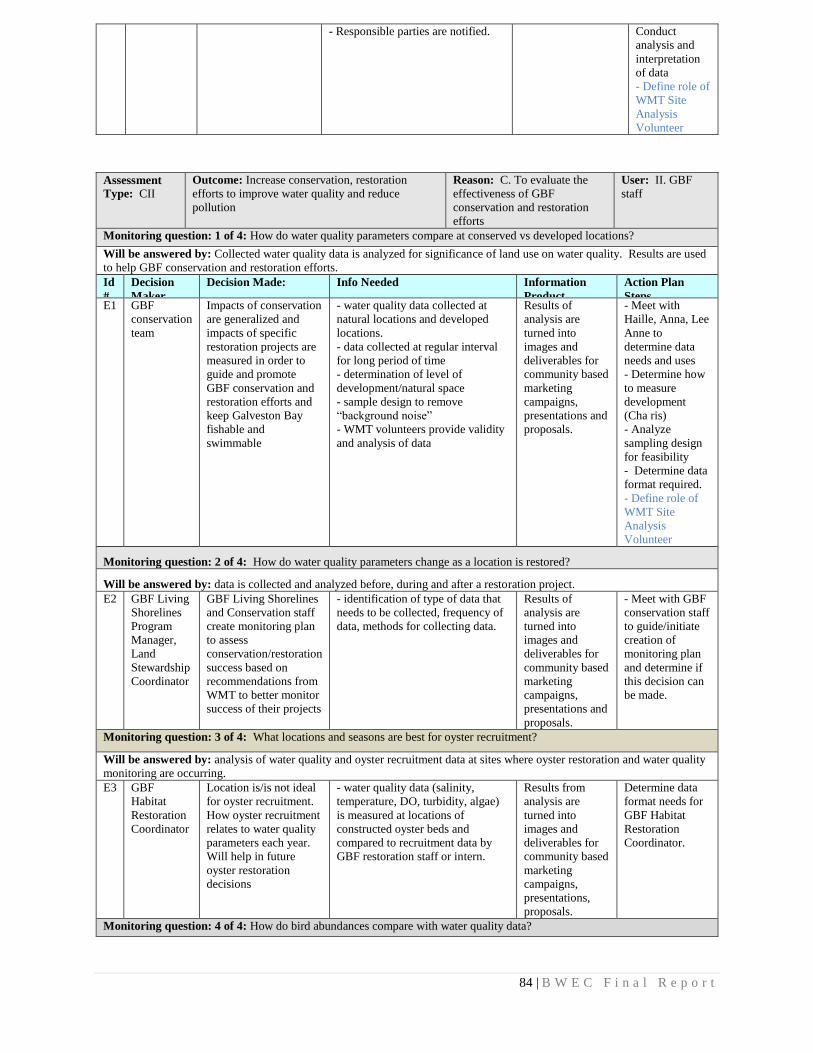
84 | B W E C F i n a l R e p o r t
- Responsible parties are notified. Conduct
analysis and
interpretation
of data
- Define role of
WMT Site
Analysis
Volunteer
Assessment
Type: CII
Outcome: Increase conservation, restoration
efforts to improve water quality and reduce
pollution
Reason: C. To evaluate the
effectiveness of GBF
conservation and restoration
efforts
User: II. GBF
staff
Monitoring question: 1 of 4: How do water quality parameters compare at conserved vs developed locations?
Will be answered by: Collected water quality data is analyzed for significance of land use on water quality. Results are used
to help GBF conservation and restoration efforts.
Id
#
Decision
Maker
Decision Made: Info Needed Information
Product
Action Plan
Steps E1 GBF
conservation
team
Impacts of conservation
are generalized and
impacts of specific
restoration projects are
measured in order to
guide and promote
GBF conservation and
restoration efforts and
keep Galveston Bay
fishable and
swimmable
- water quality data collected at
natural locations and developed
locations.
- data collected at regular interval
for long period of time
- determination of level of
development/natural space
- sample design to remove
“background noise”
- WMT volunteers provide validity
and analysis of data
Results of
analysis are
turned into
images and
deliverables for
community based
marketing
campaigns,
presentations and
proposals.
- Meet with
Haille, Anna, Lee
Anne to
determine data
needs and uses
- Determine how
to measure
development
(Cha ris)
- Analyze
sampling design
for feasibility
- Determine data
format required.
- Define role of
WMT Site
Analysis
Volunteer
Monitoring question: 2 of 4: How do water quality parameters change as a location is restored?
Will be answered by: data is collected and analyzed before, during and after a restoration project.
E2 GBF Living
Shorelines
Program
Manager,
Land
Stewardship
Coordinator
GBF Living Shorelines
and Conservation staff
create monitoring plan
to assess
conservation/restoration
success based on
recommendations from
WMT to better monitor
success of their projects
- identification of type of data that
needs to be collected, frequency of
data, methods for collecting data.
Results of
analysis are
turned into
images and
deliverables for
community based
marketing
campaigns,
presentations and
proposals.
- Meet with GBF
conservation staff
to guide/initiate
creation of
monitoring plan
and determine if
this decision can
be made.
Monitoring question: 3 of 4: What locations and seasons are best for oyster recruitment?
Will be answered by: analysis of water quality and oyster recruitment data at sites where oyster restoration and water quality
monitoring are occurring.
E3 GBF
Habitat
Restoration
Coordinator
Location is/is not ideal
for oyster recruitment.
How oyster recruitment
relates to water quality
parameters each year.
Will help in future
oyster restoration
decisions
- water quality data (salinity,
temperature, DO, turbidity, algae)
is measured at locations of
constructed oyster beds and
compared to recruitment data by
GBF restoration staff or intern.
Results from
analysis are
turned into
images and
deliverables for
community based
marketing
campaigns,
presentations,
proposals.
Determine data
format needs for
GBF Habitat
Restoration
Coordinator.
Monitoring question: 4 of 4: How do bird abundances compare with water quality data?
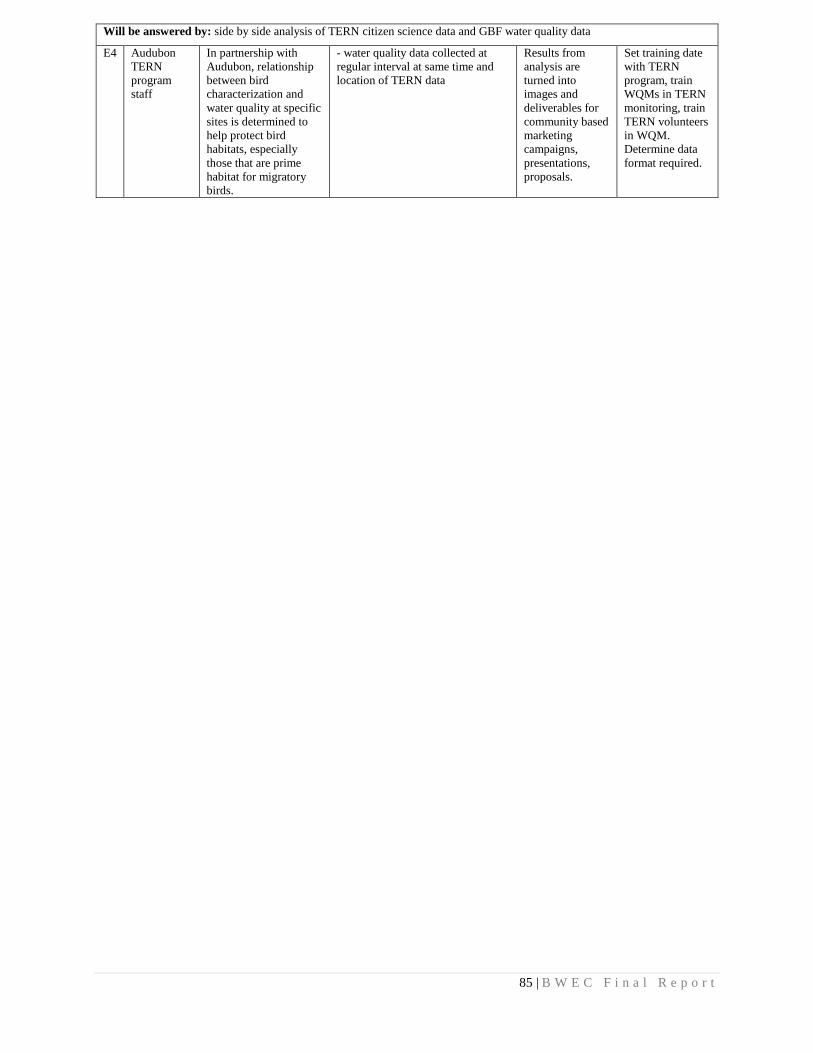
85 | B W E C F i n a l R e p o r t
Will be answered by: side by side analysis of TERN citizen science data and GBF water quality data
E4 Audubon
TERN
program
staff
In partnership with
Audubon, relationship
between bird
characterization and
water quality at specific
sites is determined to
help protect bird
habitats, especially
those that are prime
habitat for migratory
birds.
- water quality data collected at
regular interval at same time and
location of TERN data
Results from
analysis are
turned into
images and
deliverables for
community based
marketing
campaigns,
presentations,
proposals.
Set training date
with TERN
program, train
WQMs in TERN
monitoring, train
TERN volunteers
in WQM.
Determine data
format required.
86 | B W E C F i n a l R e p o r t
Appendix IV: Pump-out Stations
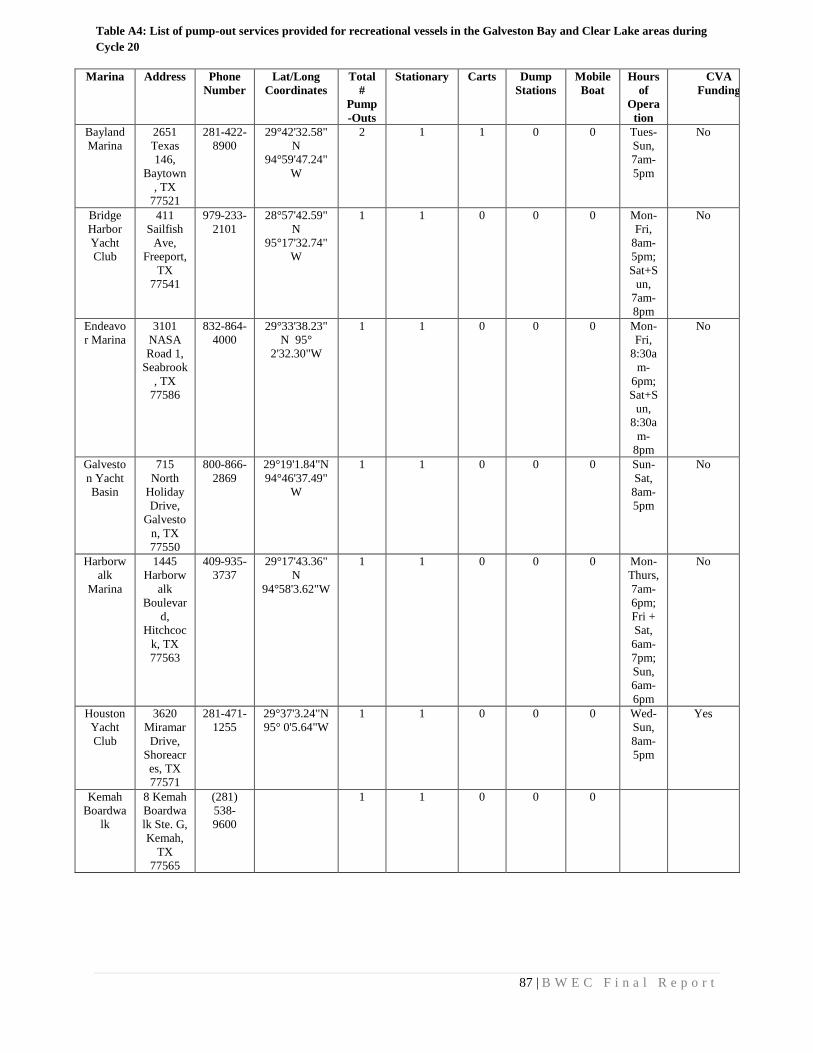
87 | B W E C F i n a l R e p o r t
Table A4: List of pump-out services provided for recreational vessels in the Galveston Bay and Clear Lake areas during
Cycle 20
Marina Address Phone
Number
Lat/Long
Coordinates
Total
#
Pump
-Outs
Stationary Carts Dump
Stations
Mobile
Boat
Hours
of
Opera
tion
CVA
Funding
Bayland
Marina
2651
Texas
146,
Baytown
, TX
77521
281-422-
8900
29°42'32.58"
N
94°59'47.24"
W
2 1 1 0 0 Tues-
Sun,
7am-
5pm
No
Bridge
Harbor
Yacht
Club
411
Sailfish
Ave,
Freeport,
TX
77541
979-233-
2101
28°57'42.59"
N
95°17'32.74"
W
1 1 0 0 0 Mon-
Fri,
8am-
5pm;
Sat+S
un,
7am-
8pm
No
Endeavo
r Marina
3101
NASA
Road 1,
Seabrook
, TX
77586
832-864-
4000
29°33'38.23"
N 95°
2'32.30"W
1 1 0 0 0 Mon-
Fri,
8:30a
m-
6pm;
Sat+S
un,
8:30a
m-
8pm
No
Galvesto
n Yacht
Basin
715
North
Holiday
Drive,
Galvesto
n, TX
77550
800-866-
2869
29°19'1.84"N
94°46'37.49"
W
1 1 0 0 0 Sun-
Sat,
8am-
5pm
No
Harborw
alk
Marina
1445
Harborw
alk
Boulevar
d,
Hitchcoc
k, TX
77563
409-935-
3737
29°17'43.36"
N
94°58'3.62"W
1 1 0 0 0 Mon-
Thurs,
7am-
6pm;
Fri +
Sat,
6am-
7pm;
Sun,
6am-
6pm
No
Houston
Yacht
Club
3620
Miramar
Drive,
Shoreacr
es, TX
77571
281-471-
1255
29°37'3.24"N
95° 0'5.64"W
1 1 0 0 0 Wed-
Sun,
8am-
5pm
Yes
Kemah
Boardwa
lk
8 Kemah
Boardwa
lk Ste. G,
Kemah,
TX
77565
(281)
538-
9600
1 1 0 0 0
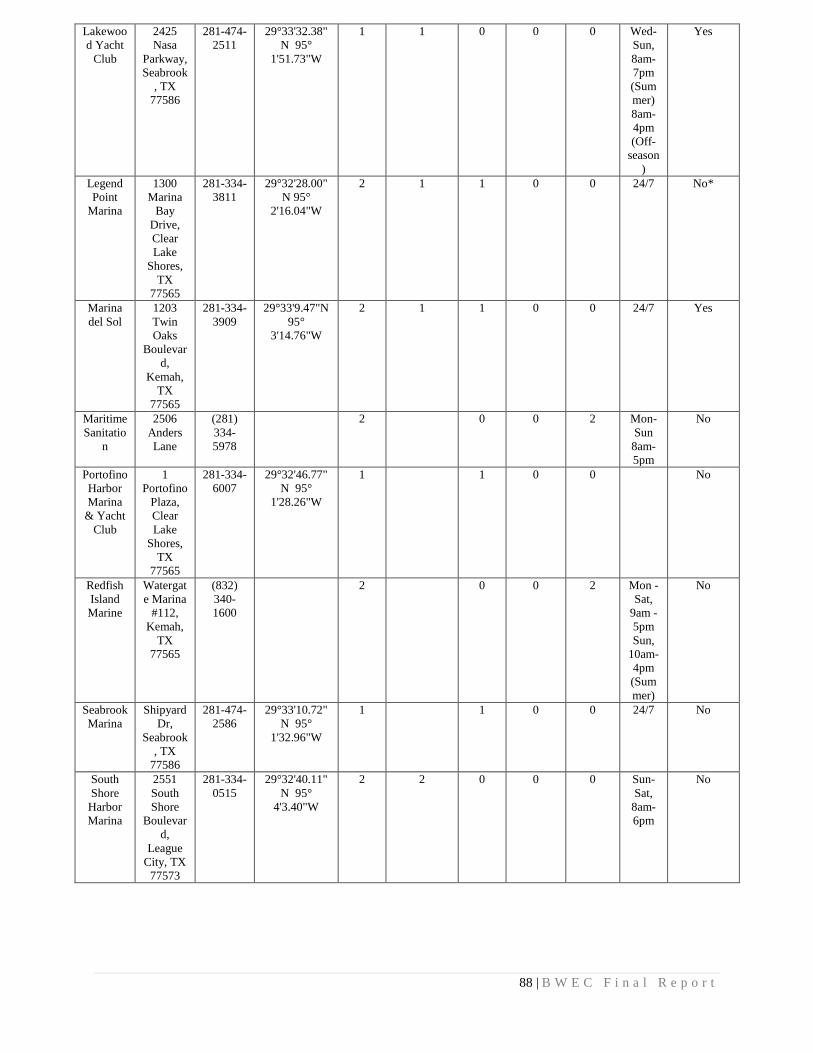
88 | B W E C F i n a l R e p o r t
Lakewoo
d Yacht
Club
2425
Nasa
Parkway,
Seabrook
, TX
77586
281-474-
2511
29°33'32.38"
N 95°
1'51.73"W
1 1 0 0 0 Wed-
Sun,
8am-
7pm
(Sum
mer)
8am-
4pm
(Off-
season
)
Yes
Legend
Point
Marina
1300
Marina
Bay
Drive,
Clear
Lake
Shores,
TX
77565
281-334-
3811
29°32'28.00"
N 95°
2'16.04"W
2 1 1 0 0 24/7 No*
Marina
del Sol
1203
Twin
Oaks
Boulevar
d,
Kemah,
TX
77565
281-334-
3909
29°33'9.47"N
95°
3'14.76"W
2 1 1 0 0 24/7 Yes
Maritime
Sanitatio
n
2506
Anders
Lane
(281)
334-
5978
2
0 0 2 Mon-
Sun
8am-
5pm
No
Portofino
Harbor
Marina
& Yacht
Club
1
Portofino
Plaza,
Clear
Lake
Shores,
TX
77565
281-334-
6007
29°32'46.77"
N 95°
1'28.26"W
1
1 0 0
No
Redfish
Island
Marine
Watergat
e Marina
#112,
Kemah,
TX
77565
(832)
340-
1600
2
0 0 2 Mon -
Sat,
9am -
5pm
Sun,
10am-
4pm
(Sum
mer)
No
Seabrook
Marina
Shipyard
Dr,
Seabrook
, TX
77586
281-474-
2586
29°33'10.72"
N 95°
1'32.96"W
1
1 0 0 24/7 No
South
Shore
Harbor
Marina
2551
South
Shore
Boulevar
d,
League
City, TX
77573
281-334-
0515
29°32'40.11"
N 95°
4'3.40"W
2 2 0 0 0 Sun-
Sat,
8am-
6pm
No
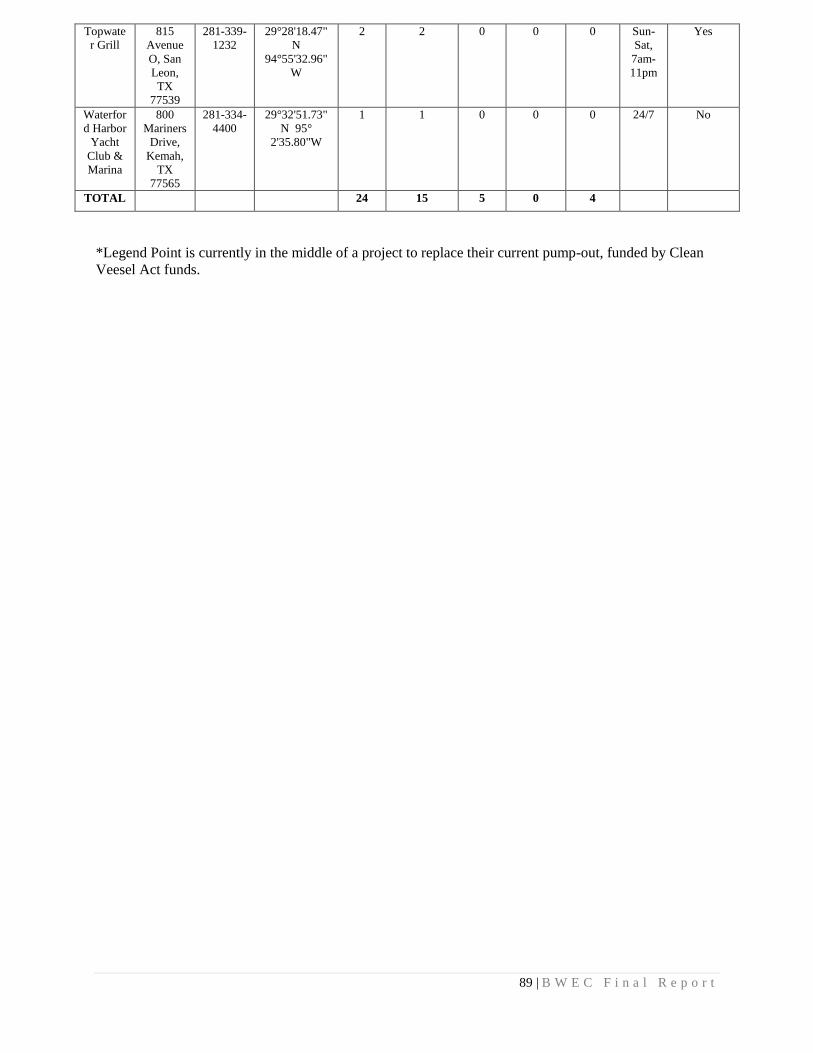
89 | B W E C F i n a l R e p o r t
Topwate
r Grill
815
Avenue
O, San
Leon,
TX
77539
281-339-
1232
29°28'18.47"
N
94°55'32.96"
W
2 2 0 0 0 Sun-
Sat,
7am-
11pm
Yes
Waterfor
d Harbor
Yacht
Club &
Marina
800
Mariners
Drive,
Kemah,
TX
77565
281-334-
4400
29°32'51.73"
N 95°
2'35.80"W
1 1 0 0 0 24/7 No
TOTAL
24 15 5 0 4
*Legend Point is currently in the middle of a project to replace their current pump-out, funded by Clean
Veesel Act funds.