Bio-inspired feature selection to select informative image features for determining water content of...
15
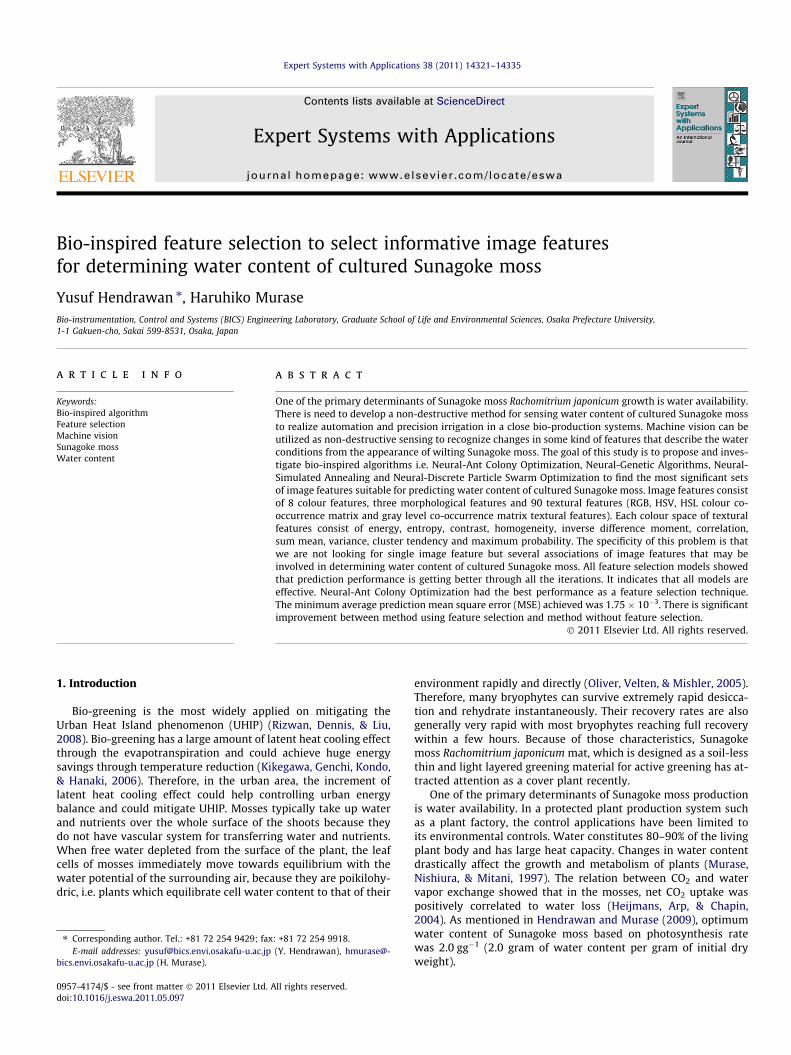
Bio-inspired feature selection to select informative image features for determining water content of cultured Sunagoke moss Yusuf Hendrawan ⇑ , Haruhiko Murase Bio-instrumentation, Control and Systems (BICS) Engineering Laboratory, Graduate School of Life and Environmental Sciences, Osaka Prefecture University, 1-1 Gakuen-cho, Sakai 599-8531, Osaka, Japan article info Keywords: Bio-inspired algorithm Feature selection Machine vision Sunagoke moss Water content abstract One of the primary determinants of Sunagoke moss Rachomitrium japonicum growth is water availability. There is need to develop a non-destructive method for sensing water content of cultured Sunagoke moss to realize automation and precision irrigation in a close bio-production systems. Machine vision can be utilized as non-destructive sensing to recognize changes in some kind of features that describe the water conditions from the appearance of wilting Sunagoke moss. The goal of this study is to propose and inves- tigate bio-inspired algorithms i.e. Neural-Ant Colony Optimization, Neural-Genetic Algorithms, Neural- Simulated Annealing and Neural-Discrete Particle Swarm Optimization to find the most significant sets of image features suitable for predicting water content of cultured Sunagoke moss. Image features consist of 8 colour features, three morphological features and 90 textural features (RGB, HSV, HSL colour co- occurrence matrix and gray level co-occurrence matrix textural features). Each colour space of textural features consist of energy, entropy, contrast, homogeneity, inverse difference moment, correlation, sum mean, variance, cluster tendency and maximum probability. The specificity of this problem is that we are not looking for single image feature but several associations of image features that may be involved in determining water content of cultured Sunagoke moss. All feature selection models showed that prediction performance is getting better through all the iterations. It indicates that all models are effective. Neural-Ant Colony Optimization had the best performance as a feature selection technique. The minimum average prediction mean square error (MSE) achieved was 1.75 10 3 . There is significant improvement between method using feature selection and method without feature selection. Ó 2011 Elsevier Ltd. All rights reserved. 1. Introduction Bio-greening is the most widely applied on mitigating the Urban Heat Island phenomenon (UHIP) (Rizwan, Dennis, & Liu, 2008). Bio-greening has a large amount of latent heat cooling effect through the evapotranspiration and could achieve huge energy savings through temperature reduction (Kikegawa, Genchi, Kondo, & Hanaki, 2006). Therefore, in the urban area, the increment of latent heat cooling effect could help controlling urban energy balance and could mitigate UHIP. Mosses typically take up water and nutrients over the whole surface of the shoots because they do not have vascular system for transferring water and nutrients. When free water depleted from the surface of the plant, the leaf cells of mosses immediately move towards equilibrium with the water potential of the surrounding air, because they are poikilohy- dric, i.e. plants which equilibrate cell water content to that of their environment rapidly and directly (Oliver, Velten, & Mishler, 2005). Therefore, many bryophytes can survive extremely rapid desicca- tion and rehydrate instantaneously. Their recovery rates are also generally very rapid with most bryophytes reaching full recovery within a few hours. Because of those characteristics, Sunagoke moss Rachomitrium japonicum mat, which is designed as a soil-less thin and light layered greening material for active greening has at- tracted attention as a cover plant recently. One of the primary determinants of Sunagoke moss production is water availability. In a protected plant production system such as a plant factory, the control applications have been limited to its environmental controls. Water constitutes 80–90% of the living plant body and has large heat capacity. Changes in water content drastically affect the growth and metabolism of plants (Murase, Nishiura, & Mitani, 1997). The relation between CO 2 and water vapor exchange showed that in the mosses, net CO 2 uptake was positively correlated to water loss (Heijmans, Arp, & Chapin, 2004). As mentioned in Hendrawan and Murase (2009), optimum water content of Sunagoke moss based on photosynthesis rate was 2.0 gg 1 (2.0 gram of water content per gram of initial dry weight). 0957-4174/$ - see front matter Ó 2011 Elsevier Ltd. All rights reserved. doi:10.1016/j.eswa.2011.05.097 ⇑ Corresponding author. Tel.: +81 72 254 9429; fax: +81 72 254 9918. E-mail addresses: [email protected] (Y. Hendrawan), hmurase@- bics.envi.osakafu-u.ac.jp (H. Murase). Expert Systems with Applications 38 (2011) 14321–14335 Contents lists available at ScienceDirect Expert Systems with Applications journal homepage: www.elsevier.com/locate/eswa
-
Upload
ubrawijaya -
Category
Documents
-
view
0 -
download
0
Transcript of Bio-inspired feature selection to select informative image features for determining water content of...
Expert Systems with Applications 38 (2011) 14321–14335
Contents lists available at ScienceDirect
Expert Systems with Applications
journal homepage: www.elsevier .com/locate /eswa
Bio-inspired feature selection to select informative image featuresfor determining water content of cultured Sunagoke moss
Yusuf Hendrawan ⇑, Haruhiko MuraseBio-instrumentation, Control and Systems (BICS) Engineering Laboratory, Graduate School of Life and Environmental Sciences, Osaka Prefecture University,1-1 Gakuen-cho, Sakai 599-8531, Osaka, Japan
a r t i c l e i n f o
Keywords:Bio-inspired algorithmFeature selectionMachine visionSunagoke mossWater content
0957-4174/$ - see front matter � 2011 Elsevier Ltd. Adoi:10.1016/j.eswa.2011.05.097
⇑ Corresponding author. Tel.: +81 72 254 9429; faxE-mail addresses: [email protected]
bics.envi.osakafu-u.ac.jp (H. Murase).
a b s t r a c t
One of the primary determinants of Sunagoke moss Rachomitrium japonicum growth is water availability.There is need to develop a non-destructive method for sensing water content of cultured Sunagoke mossto realize automation and precision irrigation in a close bio-production systems. Machine vision can beutilized as non-destructive sensing to recognize changes in some kind of features that describe the waterconditions from the appearance of wilting Sunagoke moss. The goal of this study is to propose and inves-tigate bio-inspired algorithms i.e. Neural-Ant Colony Optimization, Neural-Genetic Algorithms, Neural-Simulated Annealing and Neural-Discrete Particle Swarm Optimization to find the most significant setsof image features suitable for predicting water content of cultured Sunagoke moss. Image features consistof 8 colour features, three morphological features and 90 textural features (RGB, HSV, HSL colour co-occurrence matrix and gray level co-occurrence matrix textural features). Each colour space of texturalfeatures consist of energy, entropy, contrast, homogeneity, inverse difference moment, correlation,sum mean, variance, cluster tendency and maximum probability. The specificity of this problem is thatwe are not looking for single image feature but several associations of image features that may beinvolved in determining water content of cultured Sunagoke moss. All feature selection models showedthat prediction performance is getting better through all the iterations. It indicates that all models areeffective. Neural-Ant Colony Optimization had the best performance as a feature selection technique.The minimum average prediction mean square error (MSE) achieved was 1.75 � 10�3. There is significantimprovement between method using feature selection and method without feature selection.
� 2011 Elsevier Ltd. All rights reserved.
1. Introduction
Bio-greening is the most widely applied on mitigating theUrban Heat Island phenomenon (UHIP) (Rizwan, Dennis, & Liu,2008). Bio-greening has a large amount of latent heat cooling effectthrough the evapotranspiration and could achieve huge energysavings through temperature reduction (Kikegawa, Genchi, Kondo,& Hanaki, 2006). Therefore, in the urban area, the increment oflatent heat cooling effect could help controlling urban energybalance and could mitigate UHIP. Mosses typically take up waterand nutrients over the whole surface of the shoots because theydo not have vascular system for transferring water and nutrients.When free water depleted from the surface of the plant, the leafcells of mosses immediately move towards equilibrium with thewater potential of the surrounding air, because they are poikilohy-dric, i.e. plants which equilibrate cell water content to that of their
ll rights reserved.
: +81 72 254 9918.(Y. Hendrawan), hmurase@-
environment rapidly and directly (Oliver, Velten, & Mishler, 2005).Therefore, many bryophytes can survive extremely rapid desicca-tion and rehydrate instantaneously. Their recovery rates are alsogenerally very rapid with most bryophytes reaching full recoverywithin a few hours. Because of those characteristics, Sunagokemoss Rachomitrium japonicum mat, which is designed as a soil-lessthin and light layered greening material for active greening has at-tracted attention as a cover plant recently.
One of the primary determinants of Sunagoke moss productionis water availability. In a protected plant production system suchas a plant factory, the control applications have been limited toits environmental controls. Water constitutes 80–90% of the livingplant body and has large heat capacity. Changes in water contentdrastically affect the growth and metabolism of plants (Murase,Nishiura, & Mitani, 1997). The relation between CO2 and watervapor exchange showed that in the mosses, net CO2 uptake waspositively correlated to water loss (Heijmans, Arp, & Chapin,2004). As mentioned in Hendrawan and Murase (2009), optimumwater content of Sunagoke moss based on photosynthesis ratewas 2.0 gg�1 (2.0 gram of water content per gram of initial dryweight).
14322 Y. Hendrawan, H. Murase / Expert Systems with Applications 38 (2011) 14321–14335
There are many methods for sensing water condition inSunagoke moss. The direct measurement of canopy parameters isconsidered to be relatively inefficient, destructive to the plantsand cannot always provide accurate results at the large scaleproduction of Sunagoke moss in plant factory. Even a slight contactof foreign material with the plant tissue disturbs physiologicalactivity of the plant (Murase et al., 1997). It may be possible torecognize changes in some kind of features that describe the waterconditions from the appearance of wilting Sunagoke moss by ma-chine vision. Many studies have reported use combination of col-our, morphology and textural features to detect stress in plant(Ahmad & Reid, 1996; Escos, Alados, Pugnaire, Pigdefabregas, &Emlen, 2000; Leemans, Magein, & Destain, 2002; Foucher, Revollon,Vigouroux, & Chasseriaux, 2004). Many researchers combinedvarious external features (morphological, colour and textural) forpattern recognition (Chen, Xun, Li, & Zhang, 2010). Colour features(CFs), morphological features (MFs) and textural features (TFs) areall able to represent some information about image. However, nostudy has reported conclusively about selecting the best combina-tion of external features for improving the performance of patternrecognition. This study reports an attempt to select the bestcombination of image features (colour, morphology and texturalfeatures) for predicting water content of Sunagoke moss. Non-linear relationships between image features and water contentcan be identified by Back-Propagation Neural Network (BPNN).BPNN theory, generally accepted as a useful tool for the recognitionof various patterns (Cybenko, 1989).
Feature subset selection entails choosing the feature subset thatmaximizes the prediction accuracy. Feature selection (FS) tech-niques identify and remove as much irrelevant and redundant fea-tures as possible. Features which do not appear relevant singlymay become highly relevant when taken with others (Gheyas &Smith, 2010). Verma and Zhang (2007) observed how Neural-Genetic Algorithms (N-GAs) could select relevant image featuresfor classifying microcalcification patterns in digital mammograms.It showed that N-GAs is able to find an appropriate feature subset,which also produces a high classification rate. Hendrawan andMurase (2009) observed that wrapper method using N-GAs meth-od has better performance than statistical approaches or filtertechniques (Chi-Squared, Mutual Information, Correlation-basedFeatures Selection and Linear Regression) for selecting relevant im-age features. Wrapper methods in FS can broadly be classified intotwo categories based on search strategy: greedy and stochastic.Greedy wrapper methods can easily be trapped into local minima(Somol, Pudil, Novovicova, & Paclik, 1999). Stochastic wrappermethods such as Simulated Annealing (Lin, Tseng, Chou, & Chen,2008), Ant Colony Optimization (Karthik & Sivagaminathan,2007), Genetic Algorithms (Siedlecki & Sklansky, 1989), ParticleSwarm Optimization (Wang, Yang, Teng, Xia, & Jensen, 2007) areat the forefront of research in FS (Gheyas & Smith, 2010). FS tech-niques have become an apparent need in many bioinformaticsapplications (Handels, Rob, Kreusch, Wolff, & Poppl, 1999; Saeys,Inza, & Larranaga, 2007; Utku, 2000).
1.1. Goal and objectives
This study is part of on-going research aimed at developing ma-chine vision-based precision irrigation system in a closed bio-pro-duction system for cultured Sunagoke moss as shown in Fig. 1 torealize automation and stabilize the water content at optimumcondition (2.0 gg�1). The goal of this study is to propose and inves-tigate bio-inspired algorithms i.e. Neural-Ant Colony Optimization(N-ACO), Neural-Genetic Algorithms (N-GAs), Neural-SimulatedAnnealing (N-SA) and Neural-Discrete Particle Swarm Optimiza-tion (N-DPSO) to find the most significant sets of image featuressuitable for sensing water content of cultured Sunagoke moss.
2. Materials and methods
2.1. Materials and equipments
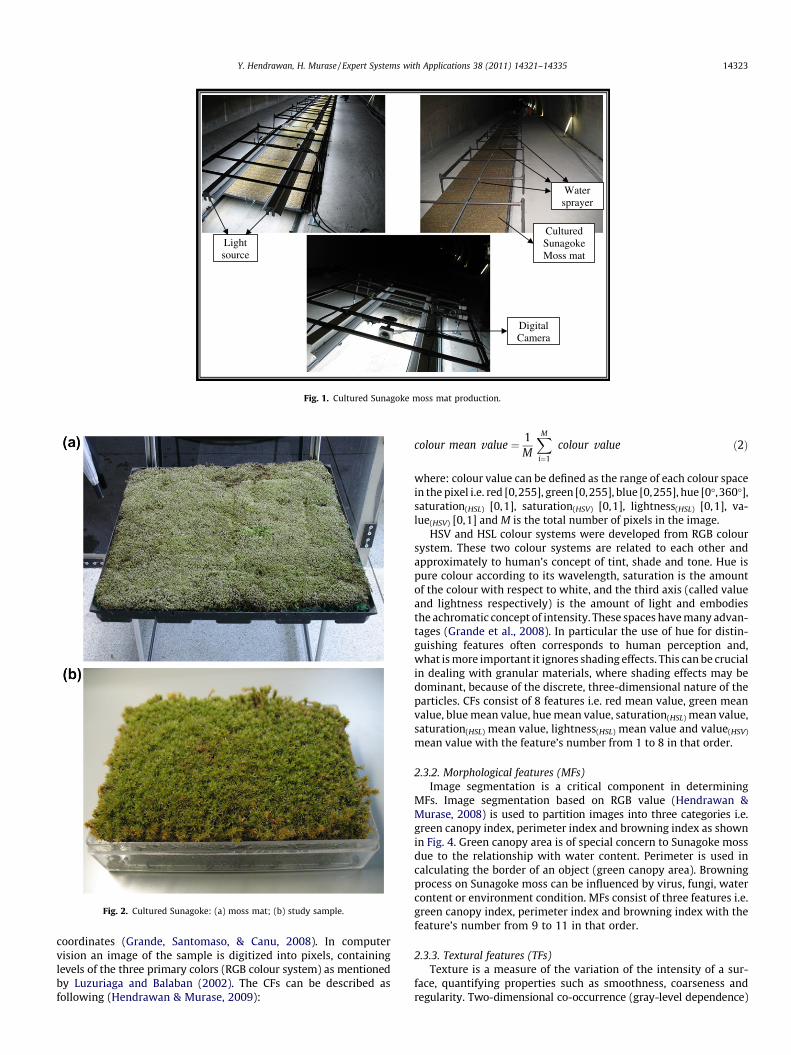
Study samples were made from living cultured Sunagoke mossmat R. japonicum (500 mm x 500 mm, M-300, VARORE Co., Japan)as shown in Fig. 2(a). The samples are made of living cultured Sun-agoke moss growing in polyvinyl (PVC) netting and anchored inglass wool media. Ten samples of cultured Sunagoke mossFig. 2(b), placed in a 110 mm � 80 mm � 25 mm glass vessel wereused in this study. Distilled water was given to the samples in theamount of 4.0 gg�1. Water content was defined as the averageamount of water available for each sample in each day of dataacquisition in grams per gram of its initial dry weight. Water con-tent was determined as:
Water Content ¼ tw� dwdw
ð1Þ
where: tw is the total weight (g) and dw is initial dry weight (g) ofSunagoke moss. Dry weight of moss was determined by drying it inthe growth chamber (Biotron NK 350, Japan) with the optimumenvironment parameters (Hendrawan & Murase, 2008): air temper-ature = 15�C, RH = 80%, the CO2 gas = 400 ppm, light intensity = 30kflux, light duration = 12 h until the weight of moss was stabilizedwithout any further decrement. The average initial dry weight ofa sample was ±12.5 g. Each sample was soaked with 4.0 gg�1 ofwater content and let to dry until it reached the initial dry weight(0 gg�1).
2.2. Model study
The experimental design aiming at the water content predictionof Sunagoke moss is presented in Fig. 3. The first process is imageacquisition, in which the moss images were captured using digitalcamera (Nikon Coolpix SQ, Japan) placed at 330 mm perpendicularto the sample surface. The image size was 1024 � 768 pixels. Imag-ing was done under controlled and well distributed light condi-tions. Light was provided by two 22 W lamps (EFD25N/22,National Corporation, Japan). Light intensity over the moss surfacewas at 100 lmol m�2 s�1 PPF (Photometer, Li6400, USA) duringimage acquisition. A total of 640 image data were acquired. All of640 image data obtained at image acquisition were driven to trans-formation process to convert images from red–green–blue (RGB)colour system to hue-saturation-value (HSV), hue-saturation-lightness (HSL) and gray level colour systems. The next step isconstructing co-occurrence matrix for each colour system i.e. GrayLevel Co-occurrence Matrix (GLCM), red Colour Co-occurrence Matrix(red-CCM), green-CCM, blue-CCM, hue-CCM, saturation(HSV)-CCM,saturation(HSL)-CCM, value(HSV)-CCM and lightness(HSL)-CCM.Haralick equations for texture analysis were used to calculateTFs. Feature extraction process extracted three groups of imagefeatures (CFs, MFs and TFs) with the total 101 features extracted,which means there are (2101–1) possibilities of feature subset com-bination. Four alternative bio-inspired algorithms (N-ACO, N-GAs,N-SA and N-DPSO) were developed for FS based on the neural net-work pattern recognition. The full feature sets or their reduced ver-sions obtained after proper feature selection in the FS process werefed to a BPNN for predicting water content. Comparison study wasconducted to analyze the performance of each FS technique.
2.3. Methods
2.3.1. Colour features (CFs)Colour provides powerful information for object recognition.
Colors can be always described as vectors belonging to a three-dimensional space, where each colour can be defined by three
Light source
Cultured Sunagoke Moss mat
Water sprayer
Digital Camera
Fig. 1. Cultured Sunagoke moss mat production.
Fig. 2. Cultured Sunagoke: (a) moss mat; (b) study sample.
Y. Hendrawan, H. Murase / Expert Systems with Applications 38 (2011) 14321–14335 14323
coordinates (Grande, Santomaso, & Canu, 2008). In computervision an image of the sample is digitized into pixels, containinglevels of the three primary colors (RGB colour system) as mentionedby Luzuriaga and Balaban (2002). The CFs can be described asfollowing (Hendrawan & Murase, 2009):
colour mean value ¼ 1M
XM
i¼1
colour value ð2Þ
where: colour value can be defined as the range of each colour spacein the pixel i.e. red [0,255], green [0,255], blue [0,255], hue [0�,360�],saturation(HSL) [0,1], saturation(HSV) [0,1], lightness(HSL) [0,1], va-lue(HSV) [0,1] and M is the total number of pixels in the image.
HSV and HSL colour systems were developed from RGB coloursystem. These two colour systems are related to each other andapproximately to human’s concept of tint, shade and tone. Hue ispure colour according to its wavelength, saturation is the amountof the colour with respect to white, and the third axis (called valueand lightness respectively) is the amount of light and embodiesthe achromatic concept of intensity. These spaces have many advan-tages (Grande et al., 2008). In particular the use of hue for distin-guishing features often corresponds to human perception and,what is more important it ignores shading effects. This can be crucialin dealing with granular materials, where shading effects may bedominant, because of the discrete, three-dimensional nature of theparticles. CFs consist of 8 features i.e. red mean value, green meanvalue, blue mean value, hue mean value, saturation(HSL) mean value,saturation(HSL) mean value, lightness(HSL) mean value and value(HSV)
mean value with the feature’s number from 1 to 8 in that order.
2.3.2. Morphological features (MFs)Image segmentation is a critical component in determining
MFs. Image segmentation based on RGB value (Hendrawan &Murase, 2008) is used to partition images into three categories i.e.green canopy index, perimeter index and browning index as shownin Fig. 4. Green canopy area is of special concern to Sunagoke mossdue to the relationship with water content. Perimeter is used incalculating the border of an object (green canopy area). Browningprocess on Sunagoke moss can be influenced by virus, fungi, watercontent or environment condition. MFs consist of three features i.e.green canopy index, perimeter index and browning index with thefeature’s number from 9 to 11 in that order.
2.3.3. Textural features (TFs)Texture is a measure of the variation of the intensity of a sur-
face, quantifying properties such as smoothness, coarseness andregularity. Two-dimensional co-occurrence (gray-level dependence)

Image Acquisition
RGB Extraction
GLCM RGB-CCM HSV-CCM HSL-CCM
Feature Selection
ACO SA
Feature Subset
BPNN
Water content
GAs
BPNN BPNN
Feature Subset Feature Subset
Grey HSV HSL
Conversion
Co-occurrence Matrix
TFs
DPSO
BPNN
Feature Subset
RGB
CFs MFs
Prediction rate
Fig. 3. Bio-inspired feature selection techniques for predicting Sunagoke moss water content.
Background pixel = 0
Object pixel (x,y) = 1
Perimeter pixel
pixel (x,y+1)
pixel (x-1,y)
pixel (x,y-1)
pixel (x+1,y)
If pixel (x,y-1) OR pixel (x+1,y) OR pixel (x,y+1) OR pixel(x-1,y) = 0 Then Perimeter = 1
Browning pixel If R < threshold(R) AND G < threshold(G) AND B < threshold(B) Then Browning = 1
Fig. 4. Morphological features (MFs).
14324 Y. Hendrawan, H. Murase / Expert Systems with Applications 38 (2011) 14321–14335
matrices are generally used in texture analysis because they areable to capture the spatial dependence of gray-level values withinan image (Haralick & Shanmugam, 1973). The textural analysiscan be considered as one of applicable techniques for extractingimage features (Haralick & Shanmugam, 1973; Murase, Honami,& Nishiura, 1994). GLCM texture analysis method is the mostcommonly used method of texture analysis. Colour textureanalysis using CCM method is based on the hypothesis that useof colour features in the visible spectrum provides additionalimage characteristics over the traditional gray-level representa-tion. The co-occurrence matrix of an Nx x Ny image, containingpixels with gray levels (0,1, . . . ,G � 1) is a two-dimensional matrix
P(k,l), where each element of the matrix represents the probability ofjoint occurrence of intensity levels k and l at a certain distanced and an angle h. The GLCM, HSV-CCM and HSL-CCM textureanalysis method consists of: (1) transformation of images fromRGB colour space to HSV and HSL colour space; (2) generationof Spatial Gray-level Dependence Matrices (SGDMs); and (3)determination of Haralick TFs. The range of RGB CCM, HSVCCM, HSL CCM and GLCM within a given image determines thedimensions of a two-dimensional co-occurrence matrix. In eachof RGB CCM, HSV CCM, HSL CCM and GLCM have 256 gray-levels,which would make the co-occurrence matrix 256 � 256. HaralickTFs are as follows:

Y. Hendrawan, H. Murase / Expert Systems with Applications 38 (2011) 14321–14335 14325
Energy ¼XM
i
XN
j
P2½i; j� ð3Þ
Entropy ¼ �XM
i
XN
j
P½i; j� log P½i; j� ð4Þ
Contrast ¼XM
i
XN
j
ði� jÞ2P½i; j� ð5Þ
Homogeneity ¼XM
i
XN
j
P½i; j�1þ ji� jj ð6Þ
Inverse Difference Moment ¼XM
i
XN
j
P½i; j�ji� jjk
i – j ð7Þ
Correlation ¼XM
i
XN
j
ði� lÞðj� lÞP½i; j�r2 ð8Þ
Sum Mean ¼ 12
XM
i
XN
j
ðiP½i; j� þ jP½i; j�Þ ð9Þ
Variance ¼ 12
XM
i
XN
j
ðði� lÞ2P½i; j� þ ðj� lÞ2P½i; j�Þ ð10Þ
Cluster Tendency ¼XM
i
XN
j
ðiþ j� 2lÞkP½i; j� ð11Þ
Maximum Probability ¼ MaxM;Ni;j P½i; j� ð12Þ
where: P(i, j) is the (i, j)th element of a normalized co-occurrencematrix, and l and r are the mean and standard deviation of the pix-el element given by the following relationships:
P½i; j� ¼ Nði; jÞM
ð13Þ
l ¼XM
i
iXN
j
P½i; j� ð14Þ
r ¼XM
i
ði� lÞ2XN
j
P½i; j� ð15Þ
where: N(i, j) is the number counts in the image with pixel intensityi followed by pixel intensity j at one pixel displacement to the left,and M is the total number of pixels.
Based on trial and error observation in various combination ofangle (h = 0,h = 45,h = 90,h = 135) and distance (d = 1,d = 2,d = 3),it showed that using angle (h = 0) and distance (d = 1) performedbetter than the other combination of h and d to identify water con-tent. Therefore, in this study, TFs were extracted at distance (d = 1)and angle (h = 0). Based on Eqs. (3)–(12), a total of 90 TFs were ex-tracted i.e. 10 TFs each for red-CCM, green-CCM, blue-CCM, GLCM,hue-CCM, saturation(HSL)-CCM, saturation(HSV)-CCM, lightness(HSL)-CCM and value(HSV)-CCM with the feature’s number from 12 to101 in that order.
2.3.4. BPNN for predictionPrediction is common task in many fields. Artificial Neural
Networks (ANNs) have been shown to be successful as predictivetools in a variety of ways such as predicting the level of some eventoutcome (Patterson, 1996). In general, ANNs are good at learningperceptive type of tasks such as the recognition of complexpatterns. Comparative studies made by researchers suggest thatANNs compare favourably with conventional statistical patternrecognition methods. Cybenko (1989) showed that a three-layerBPNN with one hidden layer allowed any continuous function tobe successfully identified. Learning rate and momentum werechosen at 0.6 and 0.8, respectively through trial and error. Thenumber of neurons in the input layer was determined by the
number of input features. Five models of hidden nodes architecturewere developed i.e. 10, 15, 20, 25 and 30 hidden nodes. The outputlayer consisted of single neuron. The output was water contentcorresponding to the input features. The training, validation andtesting performance criterion for the prediction was Mean SquareError (MSE) given by Eq. 16.
MSE ¼ 1Nn
XNn
i¼1
ðSi � StiÞ2 ð16Þ
where Nn is number of input feature vectors, Si is the water contentpredicted by BPNN model, and Sti is the target water content deter-mined by Eq. 1.
The 640 samples data of Sunagoke moss were randomized anddivided into three parts consist of 320 data as training-set, 160data as validation-set and 160 data as testing-set. The best numberof hidden nodes was determined by the validation-set MSE. Thebest hidden nodes will be used to determine testing-set MSE. Theprocedure of training, validation and testing included: (1) dividedata into training, validation and testing-set; (2) select certain hid-den nodes model; (3) train selected hidden nodes model using thetraining-set; (4) evaluate selected hidden nodes model using thevalidation-set; (5) repeat steps 2 through 4 using different hiddennodes model; (6) select the best hidden nodes model; and (7) as-sess this final model using the testing-set.
2.3.5. N-ACOAnt Colony Optimization (ACO) was initially proposed by Colorni,
Dorigo and Maniezzo (Dorigo & Stutzle, 2004). ACO was inspired bythe foraging behavior of real ants. The main underlying idea was thatof parallelizing search over several constructive computationalthreads, all based on a dynamic memory structure incorporatinginformation on the effectiveness of previously obtained results andin which the behavior of each single agent is inspired by the behaviorof real ants. The steps of N-ACO are as follows:
1. Set the initial parameters i.e. the number of ant population(a1,a2,a3, . . .ana) in which na = 70; global iterations = 500; heu-ristic (giw) which is defined as the inverse of the validation-set MSE between two features (i,w) as the input of BPNN;intensity of pheromone trail level (s = 100); the best selectedants (k = 8); pheromone constant (a = 1); heuristic constant(b = 1) and evaporation rate of pheromone q[0,1].
2. Generating ants for solution generation. At the first iteration,assign any ant randomly to one feature and visiting features,each ant builds solutions completely. For the next iterations,each ant movement for finding the trail path is based on thepheromone and heuristic probability. For ant a, the probabilitypiw of moving from state i to state w depends on the combina-tion of two values i.e. the heuristic g of the move and the pher-omone trail level s of the move. Probabilities are computed asfollows: piw is equal to 0 for all moves which are infeasible,otherwise it is computed by means of the following formula,where a and b is a user-defined parameter (0 < a < 1;0 < b < 1). Parameter a and b control the relative importanceof the trail and the attractiveness, respectively.
paiw ¼
saiwxgb
iwPa2alloweda
saiwxgb
iw
� � ð17Þ
If an ant is not able to decrease the validation-set MSE in tensuccessive steps, it will finish its work and exit. Each ant consistof feature-subset with selected features as ant paths (e.g. a1:0,1,1,0,0,0,0,1,0,0,1,0, . . .m), where m is the number of totalfeatures which equals to 101 features. Each ant in the populationrepresents a candidate solution to the feature subset selection
14326 Y. Hendrawan, H. Murase / Expert Systems with Applications 38 (2011) 14321–14335
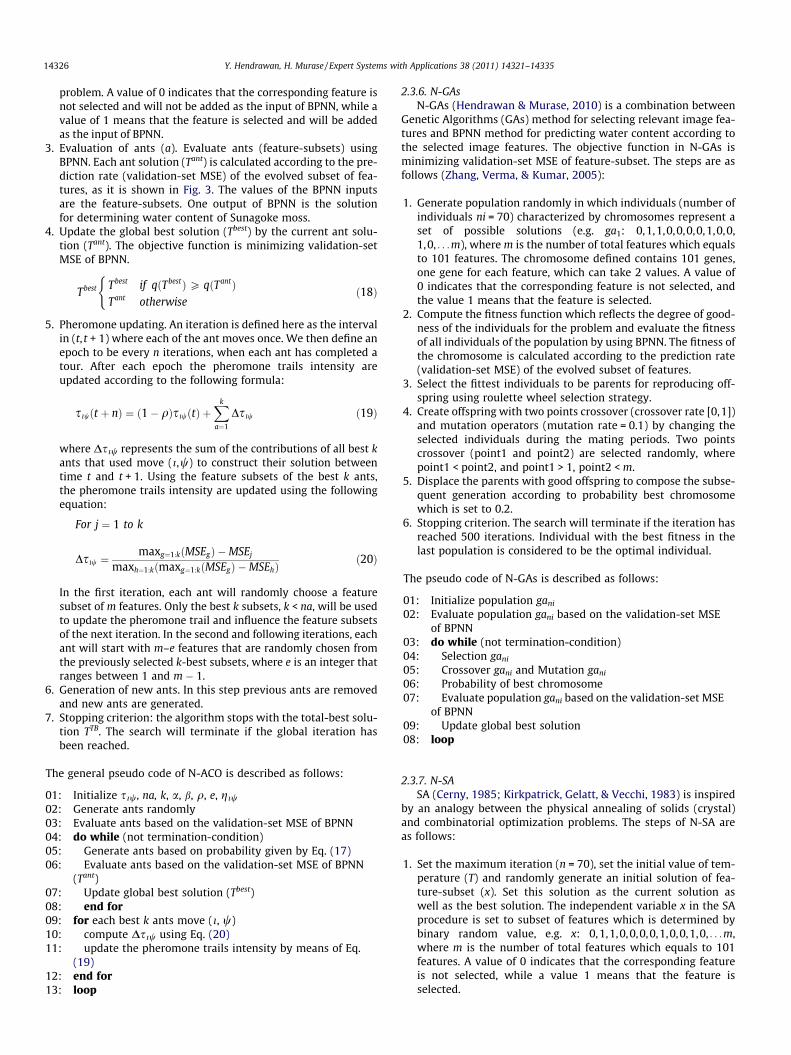
problem. A value of 0 indicates that the corresponding feature isnot selected and will not be added as the input of BPNN, while avalue of 1 means that the feature is selected and will be addedas the input of BPNN.
3. Evaluation of ants (a). Evaluate ants (feature-subsets) usingBPNN. Each ant solution (Tant) is calculated according to the pre-diction rate (validation-set MSE) of the evolved subset of fea-tures, as it is shown in Fig. 3. The values of the BPNN inputsare the feature-subsets. One output of BPNN is the solutionfor determining water content of Sunagoke moss.
4. Update the global best solution (Tbest) by the current ant solu-tion (Tant). The objective function is minimizing validation-setMSE of BPNN.
000000
00011
11
Tbest Tbest if qðTbestÞP qðTantÞTant otherwise
(ð18Þ
5. Pheromone updating. An iteration is defined here as the intervalin (t, t + 1) where each of the ant moves once. We then define anepoch to be every n iterations, when each ant has completed atour. After each epoch the pheromone trails intensity areupdated according to the following formula:
00
00000
0
siwðt þ nÞ ¼ ð1� qÞsiwðtÞ þXk
a¼1
Dsiw ð19Þ
where Dsiw represents the sum of the contributions of all best kants that used move (i,w) to construct their solution betweentime t and t + 1. Using the feature subsets of the best k ants,the pheromone trails intensity are updated using the followingequation:
For j ¼ 1 to k
Dsiw ¼maxg¼1:kðMSEgÞ �MSEj
maxh¼1:kðmaxg¼1:kðMSEgÞ �MSEhÞð20Þ
In the first iteration, each ant will randomly choose a featuresubset of m features. Only the best k subsets, k < na, will be usedto update the pheromone trail and influence the feature subsetsof the next iteration. In the second and following iterations, eachant will start with m–e features that are randomly chosen fromthe previously selected k-best subsets, where e is an integer thatranges between 1 and m � 1.
6. Generation of new ants. In this step previous ants are removedand new ants are generated.
7. Stopping criterion: the algorithm stops with the total-best solu-tion TTB. The search will terminate if the global iteration hasbeen reached.
The general pseudo code of N-ACO is described as follows:
1:
Initialize siw, na, k, a, b, q, e, giw2:
Generate ants randomly 3: Evaluate ants based on the validation-set MSE of BPNN 4: do while (not termination-condition) 5: Generate ants based on probability given by Eq. (17) 6: Evaluate ants based on the validation-set MSE of BPNN(Tant)
7: Update global best solution (Tbest) 8: end for 9: for each best k ants move (i, w) 0: compute Dsiw using Eq. (20) 1: update the pheromone trails intensity by means of Eq.(19)
2: end for 3: loop2.3.6. N-GAsN-GAs (Hendrawan & Murase, 2010) is a combination between
Genetic Algorithms (GAs) method for selecting relevant image fea-tures and BPNN method for predicting water content according tothe selected image features. The objective function in N-GAs isminimizing validation-set MSE of feature-subset. The steps are asfollows (Zhang, Verma, & Kumar, 2005):
1. Generate population randomly in which individuals (number ofindividuals ni = 70) characterized by chromosomes represent aset of possible solutions (e.g. ga1: 0,1,1,0,0,0,0,1,0,0,1,0, . . .m), where m is the number of total features which equalsto 101 features. The chromosome defined contains 101 genes,one gene for each feature, which can take 2 values. A value of0 indicates that the corresponding feature is not selected, andthe value 1 means that the feature is selected.
2. Compute the fitness function which reflects the degree of good-ness of the individuals for the problem and evaluate the fitnessof all individuals of the population by using BPNN. The fitness ofthe chromosome is calculated according to the prediction rate(validation-set MSE) of the evolved subset of features.
3. Select the fittest individuals to be parents for reproducing off-spring using roulette wheel selection strategy.
4. Create offspring with two points crossover (crossover rate [0,1])and mutation operators (mutation rate = 0.1) by changing theselected individuals during the mating periods. Two pointscrossover (point1 and point2) are selected randomly, wherepoint1 < point2, and point1 > 1, point2 < m.
5. Displace the parents with good offspring to compose the subse-quent generation according to probability best chromosomewhich is set to 0.2.
6. Stopping criterion. The search will terminate if the iteration hasreached 500 iterations. Individual with the best fitness in thelast population is considered to be the optimal individual.
The pseudo code of N-GAs is described as follows:
1:
Initialize population gani2:
Evaluate population gani based on the validation-set MSEof BPNN3:
do while (not termination-condition) 4: Selection gani5:
Crossover gani and Mutation gani6:
Probability of best chromosome 7: Evaluate population gani based on the validation-set MSEof BPNN
9: Update global best solution 8: loop 02.3.7. N-SASA (Cerny, 1985; Kirkpatrick, Gelatt, & Vecchi, 1983) is inspired
by an analogy between the physical annealing of solids (crystal)and combinatorial optimization problems. The steps of N-SA areas follows:
1. Set the maximum iteration (n = 70), set the initial value of tem-perature (T) and randomly generate an initial solution of fea-ture-subset (x). Set this solution as the current solution aswell as the best solution. The independent variable x in the SAprocedure is set to subset of features which is determined bybinary random value, e.g. x: 0,1,1,0,0,0,0,1,0,0,1,0, . . .m,where m is the number of total features which equals to 101features. A value of 0 indicates that the corresponding featureis not selected, while a value 1 means that the feature isselected.
Y. Hendrawan, H. Murase / Expert Systems with Applications 38 (2011) 14321–14335 14327
2. Evaluate fitness (Fx). Feature-subset (x) is evaluated accordingto the prediction rate using BPNN of the evolved subset of fea-tures and the fitness function (Fx) is defined as the validation-set MSE of BPNN.
3. Generate another feature-subset (x0). x0, that is, another inde-pendent variable in the neighbouring region of x, representsan alterable subset of features.
4. Evaluate fitness (Fx0). If x0 improves on x, it is accepted; if x0 isworse than x, then x0 is accepted with a probability whichdepends on the difference in objective function value Fx–Fx0,and on a parameter T, called temperature. T is lowered (as is alsodone in the physical annealing process) during the run of thealgorithm, reducing in this way the probability of accepting solu-tions worse than the current one. The probability paccept to accepta solution x0 is often defined according to the Metropolis distribu-tion (Metropolis, Rosenbluth, Rosenbluth, Teller, & Teller, 1953):
000
0000
00111111111
pacceptðx; x0; TÞ ¼1; if Fx0 < Fx
exp Fx�Fx0
T
� �; otherwise
(ð21Þ
5. Update Fx0, global minimum and memorize x0. The objectivefunction is minimizing validation-set MSE of BPNN. If Fx0 islower than global minimum then set Fx0 as global minimum andsave x0 as the best features-subset.
6. Update temperature. The decrement function for decreasing thevalue of T is given by T = T � (a ⁄ T), where a is anneal factorwhich can be defined as a constant smaller than but close to1. Typical values lie between 0.8 and 0.99. Based on trial anderror, we determined the best anneal factor is 0.9.
7. Stopping criterion. The search will terminate if the global itera-tion has reached 500 iterations or the current solution does notchange for more than 300 iterations.
The pseudo code for N-SA is described as follows:
1:
initialize temperature T 2: generate subset of features x randomly 3: evaluate fitness Fx based on the validation-set MSE ofBPNN
4: do while (not termination-condition) 5: for i = 1 to n 6: generate another subset of features x07:
evaluate fitness Fx0 based on the validation-set MSE ofBPNN8:
if(Fx0 < Fx) then 9: replace x with x00:
else 1: if (random[0,1] < exp((�1 ⁄ (Fx–Fx0))/T) then0
2: replace x with x00
3: end if 4: end if0
5: if (Fx0 < global_minimum) then0
6: update global_minimum with Fx0, and memorize x00
7: end if0
8: end for0
9: replace T with (T � (T ⁄ a)) 0: loop 21
2.3.8. N-DPSOPan, Tasgetiren, and Laing (2007) have presented a Discrete Par-
ticle Swarm Optimization (DPSO) algorithm to tackle the binary/discrete spaces, the steps of N-DPSO are as follows:
1. Generate a population of particles, pson ¼ pson1; pson
2; . . . ; psonnp
h iwhere np is the number of particles (np = 70) and n is globaliteration which equals to 500. Each particle defines a
features-subset as binary vector with dimension 101. Each par-ticle in the swarm population has the following attributes: acurrent position represented as pson
i ¼ psoni1; pson
i2; . . . ; psonim
� �e.g. pson
1 ¼ 0;1;1; 0;0;0;0;1;0;0;1;0; . . . m, where m is thenumber of total features which equals to 101 features; a currentpersonal best position represented as pn
i ¼ pni1; p
ni2; . . . ; pn
im
� �; and
a current global best position represented as gni ¼
gni1; g
ni2; . . . ; gn
im
� �.
2. Evaluate particles of population. Each particle ðpsoni Þ is evalu-
ated according to the prediction rate (validation-set MSE) usingBPNN of the evolved subset of features.
3. Find personal best position. The personal best position of eachparticle is updated using:
pni ¼
pn�1i if f pson
i
� �P f pn�1
i
� �pson
i if f psoni
� �< f pn�1
i
� �(
ð22Þ
4. Find global best position. Feature-subset (pson) is evaluatedaccording to the prediction rate using BPNN of the evolved sub-set of features and the fitness function (pson) is defined as thevalidation-set MSE of BPNN. The objective function is minimiz-ing validation-set MSE of BPNN. The global best position isupdated using:
gn ¼arg minpk
if pn
i
� �if minf pn
i
� �< f ðgn�1Þ
gn�1 else
(ð23Þ
5. Update particles of population.
psoni ¼ c2 � CR c1 � CR w� Fq pson�1
i
� �;pn�1
i
� �; gn�1� �
ð24Þ
The update particles of population consist of three components:The first component is an
i ¼ w� Fq pson�1i
� �, which represents the
velocity of the particle. Fq represents the mutation operator withthe mutation strength of q and the mutation probability of w(w = 0.5). The second component is bn
i ¼ c1 � CR ani ;p
n�1i
� �, which
is the cognition part of the particle representing the privatethinking of the particle itself. CR represents the crossover opera-tor between an
i and pn�1i with the probability of c1[0,1]. The third
component is psoni ¼ c2 � CR bn
i ; gn
� �, which is the social part of
the particle representing the collaboration among particles. CRrepresents the crossover operator between bn
i and gn with theprobability of c2[0,1]. Here crossover is performed by two pointscrossover. Two points crossover (point1 and point2) are selectedrandomly, where point1 < point2, and point1 > 1, point2 < m.
6. Stopping criterion. The search will terminate if the global itera-tion n has been reached
A general framework of N-DPSO is as follows:
1:
Generate a population of particles 2: Evaluate particles of population based on the validation-set MSE of BPNN
3: do while (a stop criterion is not satisfied) 4: Find personal best 5: Find global best 6: Update particles of population 7: Evaluate particles of population based on the validation-set MSE of BPNN
8: loop 03. Results and discussion
3.1. Water content of Sunagoke moss and image features
Fig. 5 shows the changes in Sunagoke moss appearancebased on water content. The environmental set point

Fig. 5. Changes in Sunagoke moss appearance due to water content: (a) soak (water content > 3.0 gg�1); (b) wet (water content = 2.0–3.0 gg�1); (c) semi dry (watercontent = 1.0–2.0 gg�1); (d) dry (water content < 1.0 gg�1).
14328 Y. Hendrawan, H. Murase / Expert Systems with Applications 38 (2011) 14321–14335
(temperature = 15 �C and RH = 80%) of growth chamber has stimu-lated the fast changing water content of moss from soak to wet,and slow changing from semi-dry to dry. The optimum environ-mental condition is set to prevent the quality degradation due tothe drying condition of moss water content. Drying process inSunagoke moss was affected by evapotranspiration process.Hendrawan and Murase (2009) mentioned that evapotranspirationwas much higher when the moss layer is wet. The evapotranspira-tion process is composed of evaporation and transpiration. Watercontent has a linear correlation with evapotranspiration. It meansthat as water content increases, the evapotranspiration rate alsoincreases.
Visible light photography has been effective in determining thepercentage of maximal net CO2 uptake (Graham, Hamilton, Mishler,Rundel, & Hansen, 2006). Photosynthesis has correlation with water
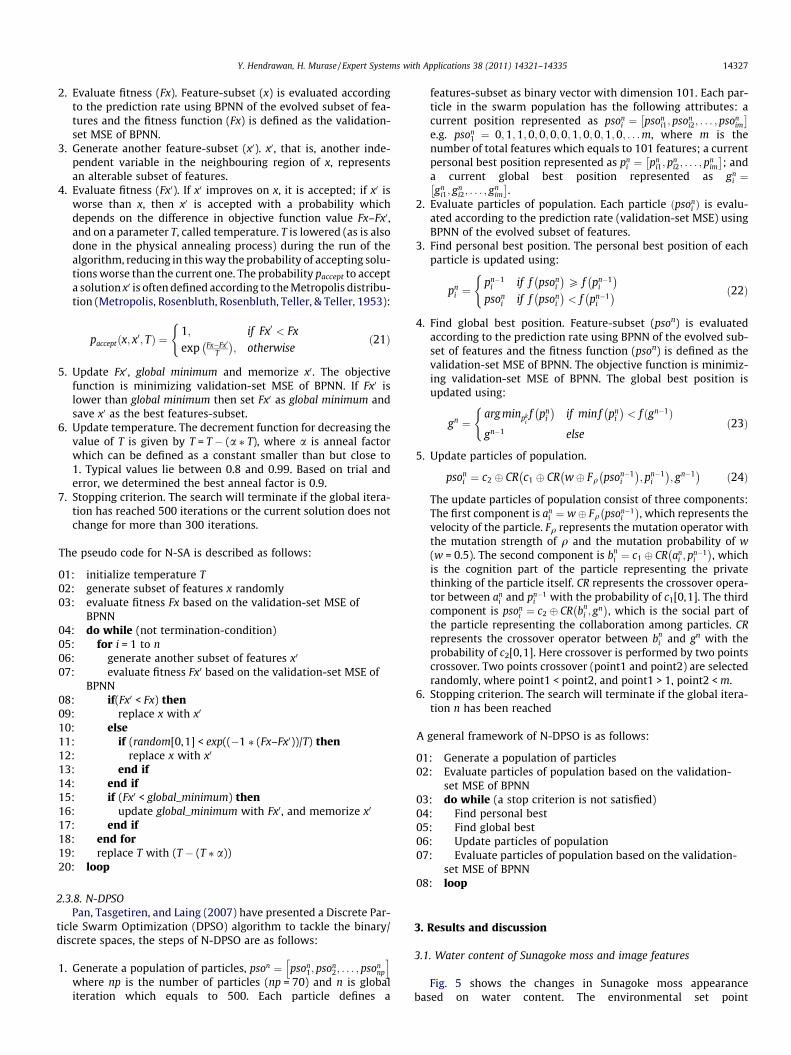
existence. If Sunagoke moss does not have enough water or it has toomuch water, then photosynthesis process can not be optimum. Theoptimal water content based on photosynthesis rate was between2.0 and 3.0 gg�1 (Hendrawan & Murase, 2009). Fig. 6 shows the rela-tionships of Sunagoke moss water content and some image featuresi.e. CFs, MFs and TFs. In dry condition, CFs such as saturation(HSV)
mean value and value(HSV) mean value were low, they increasedgradually until water condition between 2.0–2.5 gg�1, but abovewater content of 2.5 gg�1 they were decreasing and went fairly sta-ble after the water condition had reached 2.75 gg�1. Fig. 6(b) showsthe relationships of Sunagoke moss water content and MFs. It showsthat water content affects to the browning process of Sunagokemoss. Condition in which moss does not get enough water or it con-tains too much water, the browning process increase and raises thebrowning index value. In dry condition, browning index was high, it
(a)
(b)
(c)
Fig. 6. Sunagoke moss water content and image features (a) CFs: saturation(HSV)
mean value and value(HSV) mean value; (b) MFs: browning area index and greencanopy area index; (c) TFs: saturation(HSV)-CCM energy and saturation(HSV)-CCMmaximum probability.
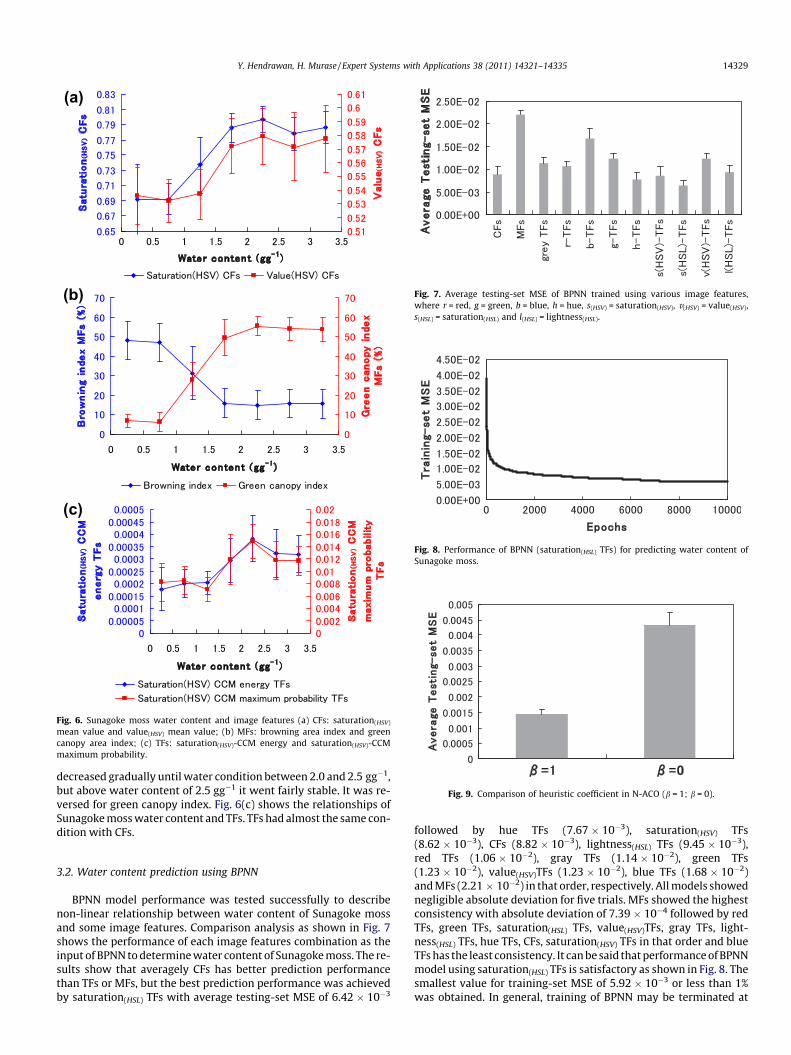
Fig. 7. Average testing-set MSE of BPNN trained using various image features,where r = red, g = green, b = blue, h = hue, s(HSV) = saturation(HSV), v(HSV) = value(HSV),s(HSL) = saturation(HSL) and l(HSL) = lightness(HSL).
Fig. 8. Performance of BPNN (saturation(HSL) TFs) for predicting water content ofSunagoke moss.
Fig. 9. Comparison of heuristic coefficient in N-ACO (b = 1; b = 0).
Y. Hendrawan, H. Murase / Expert Systems with Applications 38 (2011) 14321–14335 14329
decreased gradually until water condition between 2.0 and 2.5 gg�1,but above water content of 2.5 gg�1 it went fairly stable. It was re-versed for green canopy index. Fig. 6(c) shows the relationships ofSunagoke moss water content and TFs. TFs had almost the same con-dition with CFs.
3.2. Water content prediction using BPNN
BPNN model performance was tested successfully to describenon-linear relationship between water content of Sunagoke mossand some image features. Comparison analysis as shown in Fig. 7shows the performance of each image features combination as theinput of BPNN to determine water content of Sunagoke moss. The re-sults show that averagely CFs has better prediction performancethan TFs or MFs, but the best prediction performance was achievedby saturation(HSL) TFs with average testing-set MSE of 6.42 � 10�3
followed by hue TFs (7.67 � 10�3), saturation(HSV) TFs(8.62 � 10�3), CFs (8.82 � 10�3), lightness(HSL) TFs (9.45 � 10�3),red TFs (1.06 � 10�2), gray TFs (1.14 � 10�2), green TFs(1.23 � 10�2), value(HSV)TFs (1.23 � 10�2), blue TFs (1.68 � 10�2)and MFs (2.21 � 10�2) in that order, respectively. All models showednegligible absolute deviation for five trials. MFs showed the highestconsistency with absolute deviation of 7.39 � 10�4 followed by redTFs, green TFs, saturation(HSL) TFs, value(HSV)TFs, gray TFs, light-ness(HSL) TFs, hue TFs, CFs, saturation(HSV) TFs in that order and blueTFs has the least consistency. It can be said that performance of BPNNmodel using saturation(HSL) TFs is satisfactory as shown in Fig. 8. Thesmallest value for training-set MSE of 5.92 � 10�3 or less than 1%was obtained. In general, training of BPNN may be terminated at
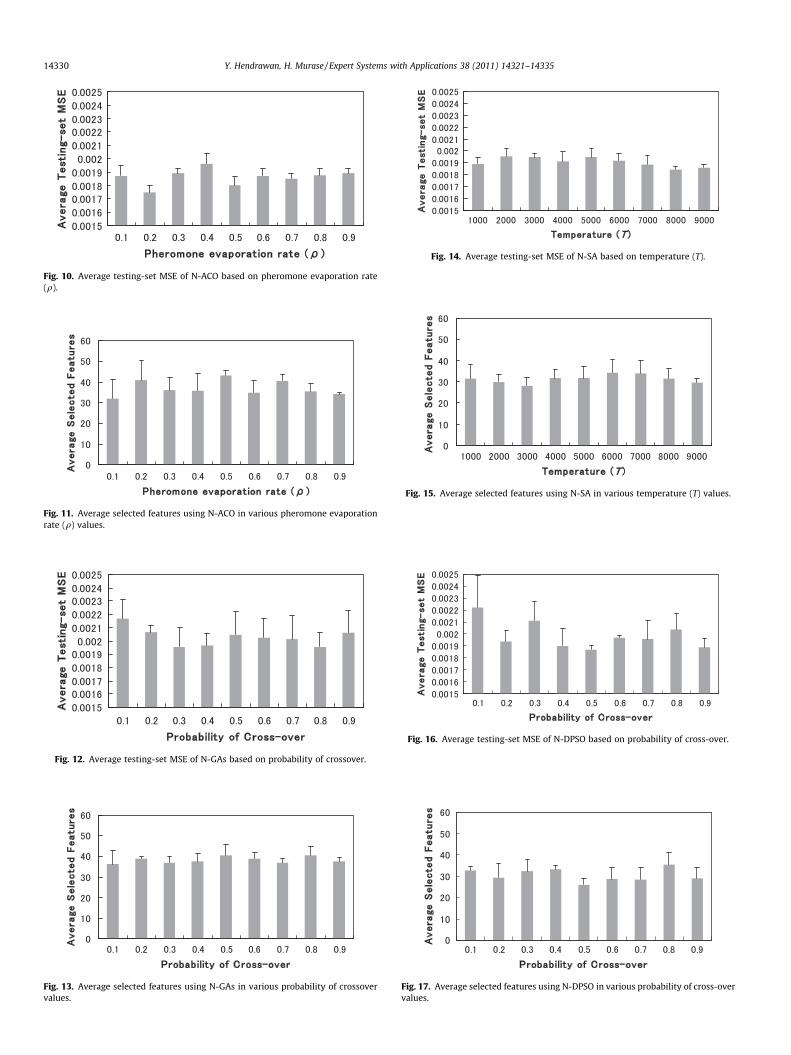
Fig. 10. Average testing-set MSE of N-ACO based on pheromone evaporation rate(q).
Fig. 11. Average selected features using N-ACO in various pheromone evaporationrate (q) values.
Fig. 12. Average testing-set MSE of N-GAs based on probability of crossover.
Fig. 13. Average selected features using N-GAs in various probability of crossovervalues.
Fig. 14. Average testing-set MSE of N-SA based on temperature (T).
Fig. 15. Average selected features using N-SA in various temperature (T) values.
Fig. 16. Average testing-set MSE of N-DPSO based on probability of cross-over.
Fig. 17. Average selected features using N-DPSO in various probability of cross-overvalues.
14330 Y. Hendrawan, H. Murase / Expert Systems with Applications 38 (2011) 14321–14335
(a)
(b)
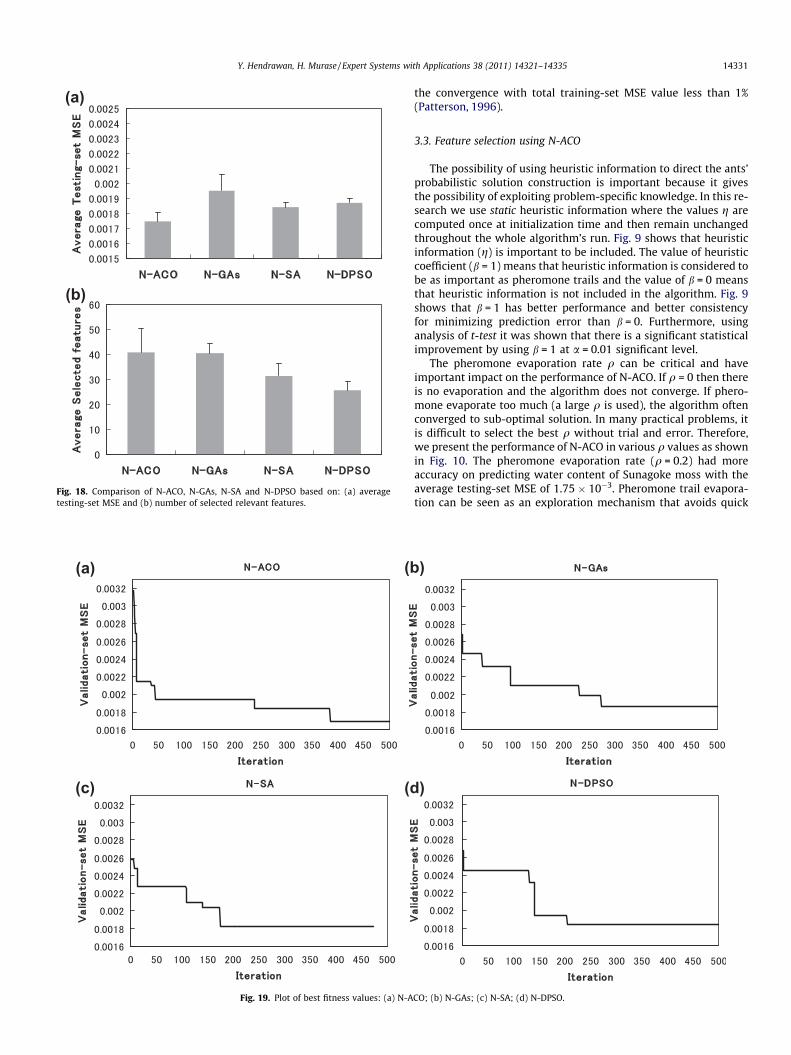
Fig. 18. Comparison of N-ACO, N-GAs, N-SA and N-DPSO based on: (a) averagetesting-set MSE and (b) number of selected relevant features.
(a)
(c) (d
(b
Fig. 19. Plot of best fitness values: (a) N-A
Y. Hendrawan, H. Murase / Expert Systems with Applications 38 (2011) 14321–14335 14331
the convergence with total training-set MSE value less than 1%(Patterson, 1996).
3.3. Feature selection using N-ACO
The possibility of using heuristic information to direct the ants’probabilistic solution construction is important because it givesthe possibility of exploiting problem-specific knowledge. In this re-search we use static heuristic information where the values g arecomputed once at initialization time and then remain unchangedthroughout the whole algorithm’s run. Fig. 9 shows that heuristicinformation (g) is important to be included. The value of heuristiccoefficient (b = 1) means that heuristic information is considered tobe as important as pheromone trails and the value of b = 0 meansthat heuristic information is not included in the algorithm. Fig. 9shows that b = 1 has better performance and better consistencyfor minimizing prediction error than b = 0. Furthermore, usinganalysis of t-test it was shown that there is a significant statisticalimprovement by using b = 1 at a = 0.01 significant level.
The pheromone evaporation rate q can be critical and haveimportant impact on the performance of N-ACO. If q = 0 then thereis no evaporation and the algorithm does not converge. If phero-mone evaporate too much (a large q is used), the algorithm oftenconverged to sub-optimal solution. In many practical problems, itis difficult to select the best q without trial and error. Therefore,we present the performance of N-ACO in various q values as shownin Fig. 10. The pheromone evaporation rate (q = 0.2) had moreaccuracy on predicting water content of Sunagoke moss with theaverage testing-set MSE of 1.75 � 10�3. Pheromone trail evapora-tion can be seen as an exploration mechanism that avoids quick
)
)
CO; (b) N-GAs; (c) N-SA; (d) N-DPSO.

14332 Y. Hendrawan, H. Murase / Expert Systems with Applications 38 (2011) 14321–14335
convergence of all the ants towards a suboptimal path. An evapo-ration mechanism allows a continuous improvement of the learnedproblem structure. Evaporation decrease the pheromone trailswith exponential speed. N-ACO was also able to reduce irrelevantfeatures with the average selected features approximately 41 fea-tures as shown in Fig. 11.
3.4. Feature selection using N-GAs
Fig. 12 describes the performance of N-GAs as FS. Various re-sults were achieved using various probabilities of crossover values.The probability of crossover at 0.8 had more accuracy on predictingwater content of Sunagoke moss with the average testing-set MSEof 1.95 � 10�3. N-GAs was also able to reduce irrelevant featureswith the average selected features approximately 41 features asshown in Fig. 13.
3.5. Feature selection using N-SA
Fig. 14 describes the performance of N-SA in various T values.T = 8000 had more accuracy and higher consistency in predictionwith the average testing-set MSE of 1.84 � 10�3. There wereapproximately 32 relevant features selected using N-SA based onthe lowest average testing-set MSE as shown in Fig. 15.
3.6. Feature selection using N-DPSO
Fig. 16 describes the performance of N-DPSO as FS in variousprobabilities of crossover values. The probability of crossover at0.5 had more accuracy on predicting water content of Sunagokemoss with the average testing-set MSE of 1.87 � 10�3. N-DPSOwas also able to reduce irrelevant features with the average se-lected features approximately 26 features as shown in Fig. 17.
(a)
(c) (d
(b
Fig. 20. Performance of BPNN: (a) using 39 features obtained from N-ACO; (b) using 40 fefeatures obtained from N-DPSO.
Fig. 18 shows the performance of four FS algorithms. Experimentalresults show competitive performance among all FS methods. Itshows the superiority of N-ACO, since it achieved better predictionperformance as the objective of this research. From Fig. 18(a), thebest prediction performance based on average testing-set MSE isachieved with N-ACO followed by N-SA, N-DPSO and N-GAs in thatorder, respectively. Furthermore, using analysis of t-test it wasshown that there is a significant statistical difference between N-ACO and other methods at a = 0.05 significant level. However, asshown in Fig. 18(b), N-DPSO was able to reduce more irrelevantfeatures than the others. N-ACO and N-GAs had almost the sameperformance on reducing irrelevant features.
The best fitness plots of the iteration of each FS method are dis-played in Fig. 19 to highlight the search process in each FS method.The best N-ACO’s fitness function converged with the lowestvalidation-set MSE of 1.69 � 10�3 when using 39 features combi-nation (feature-subset: 0001110010 0101111000 11100010000000010001 1010101110 1100001001 1001100010 00000010100000101011 00010011010). The best N-GAs’ fitness function con-verged with the lowest validation-set MSE of 1.86 � 10�3 whenusing 40 features combination (feature-subset: 00011000101000111101 1000000000 1100101001 1000100111 00011001001010000010 1011010100 0101010000 11101110000). The bestN-SA’s fitness function converged with the lowest validation-setMSE of 1.82 � 10�3 when using 30 features combination (fea-ture-subset: 0000100010 1000000000 1000000000 11011110100000000110 1000010010 0001011100 1110101000 100100010000000100001). The best N-DPSO’s fitness function converged withthe lowest validation-set MSE of 1.84 � 10�3 when using 30 fea-tures combination (feature-subset: 1010011010 01110101100001110101 1011000101 0000000001 0000000000 00111001000000000000 0000101000 00000101000). From Fig. 19, we cansee that validation-set MSE changed and it is getting better
)
)
atures obtained from N-GAs; (c) using 30 features obtained from N-SA; (d) using 30
(a)
(b)
(c)
(d)
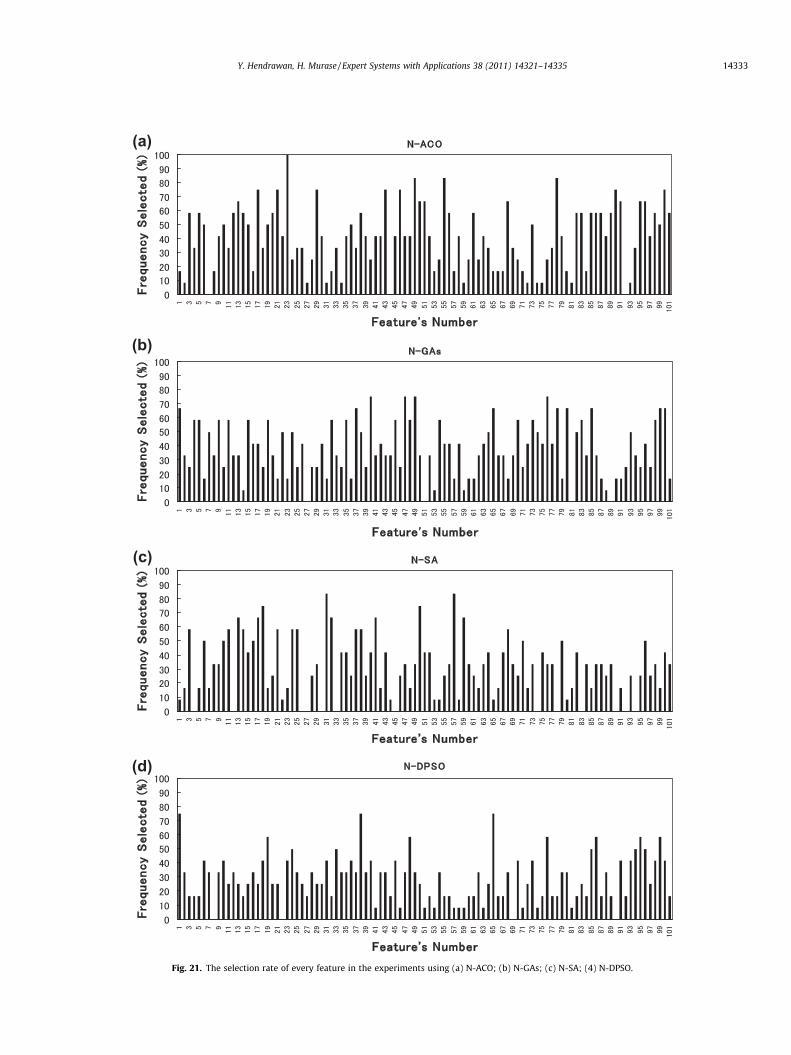
Fig. 21. The selection rate of every feature in the experiments using (a) N-ACO; (b) N-GAs; (c) N-SA; (4) N-DPSO.
Y. Hendrawan, H. Murase / Expert Systems with Applications 38 (2011) 14321–14335 14333
14334 Y. Hendrawan, H. Murase / Expert Systems with Applications 38 (2011) 14321–14335
through all the iterations. It indicates that N-ACO, N-GAs, N-SA andN-DPSO are effective. In all the iterations, the validation-set MSE ofall FS methods changed most in the first few iterations. It meansthat iteration size 500 is appropriate for all FS methods. From theresults, we can see that, compared with other methods, N-ACO isquicker in locating the optimal solution at the first 50 iterations.N-ACO has the ability to converge quickly. It has strong searchcapability in the problem space and can efficiently find optimumfeature-subset.
It can be said that performance of BPNN models using (1) 39 fea-tures obtained from N-ACO; (2) 40 features obtained from N-GAs;(3) 30 features obtained from N-SA; and (4) 30 features obtainedfrom N-DPSO are satisfactory as shown in Fig. 20. The smallest va-lue for training-set MSE of all BPNN models (N-ACO = 1.20 � 10�3;N-GAs = 6.92 � 10�4; N-SA = 1.13 � 10�3; N-DPSO = 1.26 � 10�3)are less than 1%. The BPNN performance shows that training-setMSE is getting better through all the epochs. This indicates thatthe BPNN used for learning algorithm is effective.
Fig. 21 shows the selection rate of every feature in the experi-ments using N-ACO, N-GAs, N-SA and N-DPSO in 12 iterations.Ten features are considered to be the most significant featuresfor predicting water content of Sunagoke moss. The ten highest rel-evant features obtained by N-ACO based on the selection rate areas follows: green TFs (entropy) with 100% frequency selected fol-lowed by hue TFs (homogeneity), saturation(HSV) TFs (sum mean)and gray TFs (variance) with 83.3% frequency selected and grayTFs (entropy), gray TFs (inverse difference moment), red TFs (cor-relation), green TFs (variance), lightness(HSL) TFs (cluster tendency),value(HSV) TFs (cluster tendency) with 75% frequency selected.
3.7. Significance of image feature selection for moss production
In future work, the BPNN model using relevant image featureswhich was developed in this paper could be used to predict watercontent of Sunagoke moss accurately using non-destructive sens-ing (machine vision). With the minimum error of water contentprediction, this model can be applied for automation and precisionirrigation in moss production. The whole part of the moss can getoptimum water content (2.0–3.0 gg�1) to obtain optimum growthconditions. Precision irrigation can make the moss production fas-ter with high quality product. The automated vision based irriga-tion system has the advantage over conventional irrigationmethod for being objective, fast, non-destructive and precise.
4. Conclusion
In conclusion, neural network model was able to correlate non-linear relationships between image features and water content ofSunagoke moss. The best prediction performance as individual fea-ture-subset model without feature selection (FS) method wasreached by saturation(HSL) Textural Features (TFs) with averagetesting-set MSE of 6.42 � 10�3. Saturation(HSL) TFs was stronglyrecommended as individual feature-subset to be used for predict-ing water content using Back-Propagation Neural Network (BPNN).However, the use of combination of some relevant image featuresfor predicting water content shows better performance than indi-vidual feature-subset such as saturation(HSL) TFs. The use of FeatureSelection (FS) techniques has successfully selected relevant fea-ture-subset to improve prediction performance. To show the utilityof FS method we compare four proposed algorithms i.e. Neural-AntColony Optimization (N-ACO), Neural-Genetic Algorithms (N-GAs),Neural-Simulated Annealing (N-SA) and Neural-Discrete ParticleSwarm Optimization (N-DPSO). The achieved prediction rate andfeature sets are promising. N-ACO has the best performance forpredicting Sunagoke moss water content with the lowest average
testing-set MSE of 1.75 � 10�3. Using analysis of t-test it wasshown that there is a significant statistical difference between N-ACO and other methods at a = 0.05 significant level and also thereis a significant statistical improvement between method using FSand method without FS at a = 0.01 significant level. N-ACO haspowerful exploration ability. Several characteristics make N-ACOa unique approach: it is a constructive, population-based metaheu-ristic which exploits an indirect form of memory of previousperformance. This combination of characteristics is not found inN-GAs, N-SA or in N-DPSO. In future work, BPNN model using rel-evant image features can be applied for automation and precisionirrigation in moss production.
References
Ahmad, I. S., & Reid, J. F. (1996). Evaluation of colour representations for maizeimages. Journal of Agricultural Engineering Research, 63, 185–196.
Cerny, V. (1985). Thermodynamical approach to the travelling salesman problem: Anefficient simulation algorithm. Journal of Optimisation Theory and Applications, 45,41–51.
Chen, X., Xun, Y., Li, W., & Zhang, J. (2010). Combining discriminant analysis andneural networks for corn variety identification. Computer and Electronics inAgriculture, 71S, S48–S53.
Cybenko, G. (1989). Approximation by superpositions of a sigmoidal function.Mathematics of Control, Signals, and Systems, 2, 303–314.
Dorigo, M., & Stutzle, T. (2004). Ant colony optimization. A Bradford book. The UnitedStates of America: The MIT Press.
Escos, J., Alados, C. L., Pugnaire, F. I., Pigdefabregas, J., & Emlen, J. (2000). Stressresistance strategy in an arid land shrub: Interactions between developmentalinstability and fractal dimension. Journal of Arid Environments, 45, 325–336.
Foucher, P., Revollon, P., Vigouroux, B., & Chasseriaux, G. (2004). Morphologicalimage analysis for the detection of water stress in potted forsythia. BiosystemsEngineering, 89(2), 131–138.
Gheyas, I. A., & Smith, L. S. (2010). Feature subset selection in large dimensionalitydomains. Pattern Recognition, 43, 5–13.
Graham, E. A., Hamilton, M. P., Mishler, B. D., Rundel, P. W., & Hansen, M. H. (2006).Use of a network digital camera to estimate net CO2 uptake of desiccation-tolerant moss. International Journal of Plant Sciences, 167(4), 751–758.
Grande, F. D., Santomaso, A., & Canu, P. (2008). Improving local compositionmeasurements of binary mixtures by image analysis. Powder Technology, 187(3),205–213.
Handels, H., Rob, T., Kreusch, J., Wolff, H. H., & Poppl, S. J. (1999). Feature selectionfor optimized skin tumour recognition using genetic algorithms. ArtificialIntelligence in Medicine, 16, 283–297.
Haralick, R. M., Shanmugam, K., & Dinstein I. (1973). Textural features for imageclassification. IEEE Transactions Systems Man and Cybernetics, 3(6), 610–621.
Heijmans, M. M. P. D., Arp, W. J., & Chapin, F. S. III, (2004). Carbon dioxide and watervapour exchange from understory species in boreal forest. Agricultural andForest Meteorology, 123, 135–147.
Hendrawan, Y., & Murase, H. (2008). Intelligent irrigation control using colour,morphological and textural features in Sunagoke moss. In An ASABE annualinternational meeting, Providence, USA, June 29–July 2 paper number: 083858.
Hendrawan, Y., & Murase, H. (2009). Precision irrigation for Sunagoke mossproduction using intelligent image analysis. Environmental Control in Biology,47(1), 21–36.
Hendrawan, Y., & Murase, H. (2010). Neural-Genetic Algorithm as feature selectiontechnique for determining Sunagoke moss water content. Engineering inAgriculture, Environment and Food (EAEF); Asia Agricultural and BiologicalEngineering Association (AABEA) Journal, 3(1), 25–31.
Karthik, R., & Sivagaminathan, R. (2007). A hybrid approach for feature subsetselection using neural network and ant colony optimization. Expert System withApplications, 33(1), 49–60.
Kikegawa, Y., Genchi, Y., Kondo, H., & Hanaki, K. (2006). Impacts of city-block-scalecountermeasures against urban heat-island phenomena upon a building’senergy-consumption for air-conditioning. Applied Energy, 83, 649–668.
Kirkpatrick, S., Gelatt, C. D., Jr., & Vecchi, M. P. (1983). Optimization by simulatedannealing. Science, 220, 671–680.
Leemans, V., Magein, H., & Destain, M. F. (2002). On-line fruit grading according totheir external quality using machine vision. Biosystems Engineering, 83(4),397–404.
Lin, S. W., Tseng, T. Y., Chou, S. Y., & Chen, S. C. (2008). A simulated-annealing-based approach for simultaneous parameter optimization and featureselection of back-propagation networks. Expert Systems with Applications, 34,1491–1499.
Luzuriaga, D. A., & Balaban, M. O. (2002). Colour machine vision system: analternative for colour measurement. In Proceedings of the world congress ofcomputers in agriculture and natural resources, Iguacu Falls, Brazil, March 13–15(pp. 93–100).
Metropolis, N., Rosenbluth, A., Rosenbluth, M., Teller, A., & Teller, E. (1953). Equationof state calculations by fast computing machines. Journal of Chemical Physics, 21,1087–1092.

Y. Hendrawan, H. Murase / Expert Systems with Applications 38 (2011) 14321–14335 14335
Murase, H., Honami, N., & Nishiura, Y. (1994). Image information feedback usingtextural features for plant growth control. In Proceedings of the first Asian controlconference, Tokyo, 27–30 July (Vol. 3, pp. 17–20).
Murase, H., Nishiura, Y., & Mitani, K. (1997). Environmental control strategies basedon plant responses using intelligent machine vision technique. Computers andElectronics in Agriculture, 18, 137–148.
Oliver, M. J., Velten, J., & Mishler, B. D. (2005). Desiccation tolerance in Bryophytes:A reflection of the primitive strategy for plant survival in dehydrating habitats.Integrative & Comparative Biology, 45, 788–799.
Pan, Q. K., Tasgetiren, M. F., & Laing, Y. C. (2007). A discrete particle swarmoptimization algorithm for the no-wait flowshop scheduling problem withmakespan and total flowtime criteria. Computers and Operations Research, 35(9),2807–2839.
Patterson, D. W. (1996). Artificial neural networks: Theory and applications.Singapore: Simon & Schuster (Asia) Pte Ltd..
Rizwan, A. M., Dennis, L. Y. C., & Liu, C. (2008). A review on the generation,determination and mitigation of urban heat island. Journal of EnvironmentalSciences, 20, 120–128.
Saeys, Y., Inza, I., & Larranaga, P. (2007). A review of feature selection techniques inbioinformatics. Bioinformatics, 23(19), 2507–2517.
Siedlecki, W., & Sklansky, J. (1989). A note on genetic algorithms for large scalefeature selection. Pattern Recognition Letters, 10(5), 335–347.
Somol, P., Pudil, P., Novovicova, J., & Paclik, P. (1999). Adaptive floating searchmethods in feature selection. Pattern Recognition Letters, 20(11–13), 1157–1163.
Utku, H. (2000). Application of the feature selection method to discriminatedigitized wheat varieties. Journal of Food Engineering, 46, 211–216.
Verma, B., & Zhang, P. (2007). A novel neural-genetic algorithm to find the mostsignificant combination of features in digital mammograms. Applied SoftComputing, 7, 612–625.
Wang, X., Yang, J., Teng, X., Xia, W., & Jensen, R. (2007). Feature selection based onrough sets and particle swarm optimization. Pattern Recognition Letters, 28(4),459–471.
Zhang, P., Verma, B., & Kumar, K. (2005). Neural vs statistical classifier inconjunction with genetic algorithm based feature selection. PatternRecognition Letters, 26, 909–919.