
Binz Testimony Final (00212904).DOCX - Vote Solar
295
KEOUGH + SWEENEY, LTD. ATTORNEYS AND COUNSELORS AT LAW 41 MENDON AVENUE PAWTUCKET, RHODE ISLAND 02861 TELEPHONE (401) 724-3600 FACSIMILE (401) 724-9909 www.keoughsweeney.com RAYNHAM OFFICE: 90 NEW STATE HIGHWAY RAYNHAM, MA 02109 TEL. (508) 822-2813 FAX (508) 822-2832 JOSEPH A. KEOUGH JR.* JEROME V. SWEENEY III* SEAN P. KEOUGH* JEROME V. SWEENEY II OF COUNSEL *ADMITTED TO PRACTICE IN RHODE ISLAND & MASSACHUSETTS BOSTON OFFICE: 171 MILK STREET SUITE 30 BOSTON, MA 02109 TEL. (617) 574-0054 FAX (617) 451-1914 April 25, 2018 Ms. Luly Massaro, Clerk Rhode Island Public Utilities Commission 89 Jefferson Boulevard Warwick, RI 02888 Re: Docket No. 4780 - The Narragansett Electric Co. D/B/A National Grid’s Proposed Power Sector Transformation (PST) Vision And Implementation Plan Dear Ms. Massaro: Enclosed please find an original and nine copies of the following document: 1. Direct Testimony of Ronald J. Binz on behalf of the Northeast Clean Energy Council and the Conservation Law Foundation (Exhibit NECEC-CLF-2). Please note that an electronic copy of this document has been provided to the service list. Thank you for your attention to this matter. Sincerely, Joseph A. Keough, Jr. JAK/kf Enclosures cc: Docket 4780 Service List (via electronic mail)
-
Upload
khangminh22 -
Category
Documents
-
view
2 -
download
0
Transcript of Binz Testimony Final (00212904).DOCX - Vote Solar

KEOUGH + SWEENEY, LTD. ATTORNEYS AND COUNSELORS AT LAW
41 MENDON AVENUE PAWTUCKET, RHODE ISLAND 02861
TELEPHONE (401) 724-3600 FACSIMILE (401) 724-9909
www.keoughsweeney.com
RAYNHAM OFFICE: 90 NEW STATE HIGHWAY
RAYNHAM, MA 02109 TEL. (508) 822-2813 FAX (508) 822-2832
JOSEPH A. KEOUGH JR.* JEROME V. SWEENEY III*
SEAN P. KEOUGH*
JEROME V. SWEENEY II
OF COUNSEL
*ADMITTED TO PRACTICE IN RHODE ISLAND & MASSACHUSETTS
BOSTON OFFICE: 171 MILK STREET
SUITE 30 BOSTON, MA 02109 TEL. (617) 574-0054 FAX (617) 451-1914
April 25, 2018
Ms. Luly Massaro, Clerk Rhode Island Public Utilities Commission 89 Jefferson Boulevard Warwick, RI 02888 Re: Docket No. 4780 - The Narragansett Electric Co. D/B/A National Grid’s Proposed Power Sector Transformation (PST) Vision And Implementation Plan Dear Ms. Massaro: Enclosed please find an original and nine copies of the following document:
1. Direct Testimony of Ronald J. Binz on behalf of the Northeast Clean Energy Council and the Conservation Law Foundation (Exhibit NECEC-CLF-2).
Please note that an electronic copy of this document has been provided to the service list.
Thank you for your attention to this matter. Sincerely, Joseph A. Keough, Jr. JAK/kf Enclosures cc: Docket 4780 Service List (via electronic mail)
JKeough
New Stamp

STATE OF RHODE ISLAND
IN RE: NATIONAL GRID APPLICATION TO CHANGE ELECTRIC AND GAS DISTRIBUTION REVENUE REQUIREMENTS AND ASSOCIATED RATES
DOCKET NO. 4780
TESTIMONY OF RONALD J. BINZ
ON BEHALF OF
NORTHEAST CLEAN ENERGY COUNCIL (NECEC)
AND
CONSERVATION LAW FOUNDATION (CLF)
Filed: April 25, 2018
Docket No. 4780 Exhibit NECEC-CLF-2
Direct Testimony of Ronald J. Binz April 25, 2018
Table of Contents
I. Introduction ..................................................................................................... 1 II. Purpose of the Testimony and Summary of Recommendations ............................. 3 III. Performance-Based Regulation Generally........................................................... 7
Elements of an Effective PBR Regime .......................................................... 17 IV. The National Grid Proposal ............................................................................. 20
Capital Cost Incentives ............................................................................... 23 Performance Incentive Mechanisms (PIMs) .................................................. 27 Recovery of PST-Related Costs ................................................................... 38
V. Conclusions and Recommendations ................................................................. 41

Docket No. 4780 Exhibit NECEC-CLF-2
Direct Testimony of Ronald J. Binz April 25, 2018
I. INTRODUCTION 1
Q. PLEASE STATE YOUR NAME AND ADDRESS. 2
A. My name is Ronald J. Binz. My business address is 333 Eudora Street, Denver, 3
Colorado 80220. 4
Q. ON WHOSE BEHALF ARE YOU SUBMITTING TESTIMONY? 5
A. I am submitting testimony on behalf of the Northeast Clean Energy Council 6
(NECEC) and Conservation Law Foundation. 7
NECEC is a clean energy business, policy and innovation organization. Its 8
mission is to create a world-class clean energy hub in the Northeast delivering 9
global impact with economic, energy and environmental solutions. NECEC is the 10
only organization in the Northeast that covers all the clean energy market 11
segments, representing the business perspectives of investors and clean energy 12
companies across every stage of development. Its members span the broad 13
spectrum of the clean energy industry, including energy efficiency, demand 14
response, wind, solar, combined heat and power, energy storage, fuel cells, and 15
advanced and “smart” technologies. Many of its members are doing business and 16
investing in Rhode Island, and many are interested in doing so in the future. 17
Conservation Law Foundation (CLF) is New England’s leading 18
environmental advocacy organization. Since 1966, CLF has worked to 19
protect New England’s people, natural resources and communities. CLF is a 20
nonprofit, member-supported organization with offices throughout New England. 21
The Rhode Island CLF office is located at 235 Promenade Street, Suite 560, 22
1

Docket No. 4780 Exhibit NECEC-CLF-2
Direct Testimony of Ronald J. Binz April 25, 2018
Providence, RI 02908. Thanks to CLF’s effective advocacy – in courtrooms, in 1
statehouses, and in boardrooms – today Boston Harbor is the pride of the city, 2
Georges Bank is free from oil and gas rigs, Lake Champlain’s polluted waters are 3
getting cleaner, and New England’s remaining obsolete coal plants are on the 4
verge of shutting down for good. As part of a 50-year legacy, CLF was a party in 5
the landmark case in which the U.S. Supreme Court ruled that the U.S. 6
Environmental Protection Agency has an obligation under the Clean Air Act to 7
consider regulating tailpipe emissions that contribute to global warming, 8
Massachusetts v. E.P.A., 127 S. Ct. 1438 (2007). 9
Q. WHAT IS YOUR OCCUPATION? 10
A. I am a consulting regulatory policy analyst, specializing in energy and 11
telecommunications issues. My practice is called Public Policy Consulting. 12
Q. PLEASE DESCRIBE YOUR EXPERIENCE AND QUALIFICATIONS. 13
A. For more than forty years I have served in a variety of roles as an expert in energy 14
policy and regulation, including as a regulator, consumer advocate, expert 15
witness, an advisor, researcher and consultant. From 2007 to 2011, I was the 16
Chairman of the Colorado Public Utilities Commission (“PUC”). During this 17
period, energy policy, led by the Governor and Legislature, moved forward 18
toward the “New Energy Economy” in Colorado, expanding the use of clean 19
energy resources, and ramping up the energy efficiency actions of the regulated 20
electric and gas utilities. 21
2

Docket No. 4780 Exhibit NECEC-CLF-2
Direct Testimony of Ronald J. Binz April 25, 2018
In June 2013, I was nominated by President Obama to become the 1
Chairman of the Federal Energy Regulatory Commission (“FERC”). After a 2
confirmation hearing before a U.S. Senate Committee, I requested that the 3
President withdraw my name from further consideration due to the opposition of 4
the coal industry and certain conservative political groups. 5
Since 1977, I have participated in more than 150 regulatory proceedings 6
before FERC, the Federal Communications Commission (“FCC”), state and 7
federal district courts, the Eighth Circuit Court of Appeals, the Tenth Circuit 8
Court of Appeals, the D.C. Circuit Courts of Appeal, the U.S. Supreme Court, and 9
state regulatory commissions in California, Colorado, Georgia, Hawaii, Idaho, 10
Maine, Massachusetts, Missouri, New York, North Dakota, South Dakota, Texas, 11
Utah, Wyoming and the District of Columbia. 12
Prior to my service on the Colorado PUC, from 1984 to 1995, I was the 13
Consumer Counsel for Colorado, representing the interests of residential, small 14
business and agricultural utility consumers before the Colorado PUC, federal 15
regulatory agencies, and the courts. 16
My curriculum vitae is attached as Attachment A. 17
II. PURPOSE OF THE TESTIMONY AND SUMMARY
OF RECOMMENDATIONS
Q. WHAT IS YOUR ASSIGNMENT IN THIS CASE? 18
A. I was retained by Vote Solar to provide my expert opinion for NECEC and CLF 19
on certain regulatory proposals made in this case by Narragansett Electric 20
3
Docket No. 4780 Exhibit NECEC-CLF-2
Direct Testimony of Ronald J. Binz April 25, 2018
Company d/b/a National Grid (“National Grid” or “Company”) before the Rhode 1
Island Public Utilities Commission (“PUC” or “Commission”). Specifically, I 2
was asked to examine the Company’s proposed Performance Incentive 3
Mechanisms (PIMs) and the surrounding regulatory approach advocated by 4
National Grid for its proposed investments in the Power Sector Transformation 5
(PST). 6
Q. WHAT IS THE INTEREST OF NECEC AND CLF IN HOW THESE REGULATORY 7
ISSUES ARE DECIDED? 8
A. NECEC and CLF believe that Rhode Island must move toward a revised 9
regulatory regime that will align the incentives provided to National Grid with 10
customer and public policy objectives. Regulation should enable the Company to 11
transform itself into a utility that can thrive in a world of advancing technology, 12
increasing deployment of distributed energy resources and changing customer 13
expectations. This is consistent with the recommendations of the Power Sector 14
Transformation Phase One Report (“PST Report). 1 In sum, regulation should 15
create a marketplace for products and services that can be provided by clean 16
energy companies, utilities and partnerships between them. 17
Given the preparation of the PST Report and the Commission’s decision 18
in Docket No. 4600, the time is ripe for the entire energy community in Rhode 19
1“Rhode Island Power Sector Transformation, Phase One Report to Governor Gina M. Raimondo”. November 2017.
4

Docket No. 4780 Exhibit NECEC-CLF-2
Direct Testimony of Ronald J. Binz April 25, 2018
Island – regulators, utilities, clean energy companies and consumers – to move 1
forward on implementing a shared vision of the power sector in this state. 2
Any major filing of an electric utility is an opportunity to refine and 3
realize policy direction: the instant case is an especially propitious opportunity. 4
NECEC and CLF wish to assist the Commission in moving forward on Rhode 5
Island’s power sector transformation. 6
Q. PLEASE SUMMARIZE YOUR FINDINGS AND RECOMMENDATIONS CONCERNING 7
NATIONAL GRID’S PROPOSALS. 8
A. In summary, I find and recommend the following: 9
• Achieving the full vision announced in the PST Report will require fundamental 10
changes to the way the Commission regulates electric utilities. Rate base rate-of-11
return regulation, as currently practiced, needs to evolve to a regulatory system 12
that offers National Grid desirable incentives to achieve agreed goals and 13
provides the flexibility for the Company to transform itself to meet the challenges 14
of an evolving electric power sector. 15
• It is important that the Commission use the opportunity of this case to begin the 16
reform of regulation for National Grid. The Commission should establish a 17
process that will lead to the goal of performance-based “revenue-cap” regulation 18
for National Grid. 19
• The proposal of National Grid to incorporate performance measures into its 20
regulation is a modest step in the right direction. Most of the Performance 21
Incentive Mechanisms (PIMs) proposed by National Grid will be helpful, but their 22
5

Docket No. 4780 Exhibit NECEC-CLF-2
Direct Testimony of Ronald J. Binz April 25, 2018
application can be improved. More important, the PIMs should be incorporated 1
into a more fundamental reform of regulation, such as a revenue-cap regime or a 2
multiyear plan framework as recommended and outlined by the Division of Public 3
Utilities and Carriers (“DPUC”) in its testimony in Docket No. 4770.2 4
• My testimony contains specific recommendations about the structure of some of 5
the proposed PIMs, including the level of reward associated with performance on 6
each PIM. 7
• The Commission should not create a new “cost tracker” for PST-related costs. If 8
a multi-year rate plan is adopted, these costs will be included in the multi-year 9
revenue cap trajectory. If the Commission allows National Grid to proceed with a 10
one-year rate plan, the Company should be required to file rate cases to reflect 11
increased PST-related costs. 12
• Finally, I recommend certain procedural steps the Commission should employ to 13
accelerate the move toward a more appropriate regulatory structure. The 14
Commission should either 1) require National Grid to negotiate a multi-year rate 15
plan in this case or 2) grant only interim rate relief, during which period the 16
parties are directed to negotiate a comprehensive revenue cap or multi-year rate 17
plan consistent with Commission directives. 18
19
2 See Attachment B, Direct Testimony of Tim Woolf On Behalf of The Division of Public Utilities and Carriers, Rhode Island Public Utilities Commission Docket No. 4770.
6

Docket No. 4780 Exhibit NECEC-CLF-2
Direct Testimony of Ronald J. Binz April 25, 2018
III. PERFORMANCE-BASED REGULATION GENERALLY 1
Q. WHAT IS INCENTIVE REGULATION? 2
A. In common use, “incentive regulation” usually means a regulatory scheme that 3
incorporates explicit incentives to induce utilities to undertake certain behavior. It 4
is usually contrasted with “traditional” utility regulation. But this common use 5
can be incomplete and misleading. 6
I agree with the opinion, first expressed by Commissioner Peter Bradford, 7
the former utility regulator in Maine and New York, that “all regulation is 8
incentive regulation.” By this he meant that any method of regulation provides 9
incentives (some explicit, some not) that affect the behavior of utilities. There is 10
no “neutral” or “incentive-free” style of regulation. 11
To see that even “traditional” regulation is a type of incentive regulation, 12
consider two examples. Under traditional rate base, rate-of-return regulation, a 13
utility’s operating income (profit) is determined as the product of rate base 14
investment and the utility’s cost of capital. This use of investment to determine 15
profit can produce the well-known “Averch-Johnson Effect” in which utilities 16
invest “too much” capital, compared to its investment in labor. The reasoning 17
here is straightforward: when earnings are tied to return on rate base and expenses 18
are compensated “at cost”, it is more profitable for the utility to address a 19
challenge (e.g., reliability) with more capital investment, compared with more 20
employees, distributed generation, or demand response. 21
7

Docket No. 4780 Exhibit NECEC-CLF-2
Direct Testimony of Ronald J. Binz April 25, 2018
Second, under the traditional regulatory bargain, utilities had an incentive 1
– called “regulatory lag” – to become more efficient. If a utility had to wait until 2
its next rate case to raise prices, there was a short-term incentive to “tighten its 3
belt” to keep earnings at desired levels. This incentive has largely disappeared as 4
utilities have succeeded in winning regulatory approval of numerous “adjustment 5
clauses” that pass cost increases through in customer rates as the cost increases 6
are experienced.3 Today many utilities approach regulation as simply an exercise 7
in dollar-for-dollar “cost recovery” as expeditiously as possible. 8
With this background, we see that the task of regulation today is not to 9
decide whether to offer incentives, but instead to determine which incentives to 10
offer. Sometimes regulatory reform can mean replacing one incentive with 11
another incentive. In particular, there are ways to modify regulation to blunt 12
utilities’ “capital bias,” to restore incentives toward efficiency, and to add 13
incentives for innovation. 14
Q. WHAT IS MEANT BY “PERFORMANCE-BASED REGULATION?” 15
A. For many years, U.S. electric utility rate making has been based on the traditional 16
implementation “rate-of-return, cost-of-service” methodology. In this scheme, a 17
utility’s rates are set to collect the cost of providing service, which is estimated to 18
3 Over the past two decades, utilities have campaigned against “regulatory lag,” mischaracterizing its purpose and effect. To be clear, the debate is not about the speed with which regulators make decisions: regulators should always act expeditiously on matters brought to them. It is a separate question entirely whether regulation should be configured to instantly pass through increases in costs incurred by utilities without the lag inherent in filing a rate case in which the entire financial picture is examined. Regulatory lag mimics the effects of a competitive market place in which competing companies are not free unilaterally to pass on cost increases as they occur.
8

Docket No. 4780 Exhibit NECEC-CLF-2
Direct Testimony of Ronald J. Binz April 25, 2018
be expenses plus depreciation plus taxes plus a return on the regulated rate base. 1
Typically, a utility’s performance played no direct or integrated role in rate-2
setting. Regulators would enforce standards of service quality and customer 3
satisfaction on a separate track, sometimes levying penalties for inadequate 4
performance and, occasionally, bonuses for exceptional performance. 5
This traditional regulatory scheme is now being reassessed to consider 6
systems in which revenues are based, partially and directly, on the utility’s 7
performance on a set of desired outcomes. These outcomes include the familiar 8
measures of reliability, safety and customer satisfaction, but also new desired 9
outcomes such as environmental performance, energy efficiency program 10
delivery, customer engagement, quality of interconnection service, carbon 11
reduction, etc. The longer list of performance categories reflects the new 12
complexity and changing nature of the utility business. 13
These various new regulatory schemes are grouped under the term 14
“performance-based regulation” or “PBR.” The PBR schemes can vary from 15
simply grafting a few performance measures onto a standard cost-of-service 16
model, to more complex systems such as the UK regulator has adopted. 17
Importantly, PBR can be used in conjunction with cost-of-service regulation or 18
with other systems of determining fair compensation, such as “revenue-cap” 19
regulation, which I will discuss later. 20
9

Docket No. 4780 Exhibit NECEC-CLF-2
Direct Testimony of Ronald J. Binz April 25, 2018
Q. WHAT IS YOUR VIEW OF PERFORMANCE-BASED REGULATION? 1
A. I support the nascent move in the United States toward performance-based 2
regulation in the power sector. The electric power sector has obviously changed 3
significantly in recent years with new technologies, DERs, increased 4
environmental demands and the promise of more choices for customers. Each of 5
these developments challenges the prevailing utility business model and has set 6
utilities on a course to invent a new business model. 7
For multiple reasons, traditional cost of service regulation no longer 8
provides clear incentives to the regulated utilities that are well aligned with 9
customer interests. At the same time, advances in regulation, some of which 10
originated in the telecommunication industry, now offer improved incentives and 11
provide utilities more flexibility to reshape their business models in response to 12
the significant changes in the electric power sector. As a former regulator, I am 13
convinced that the move toward performance-based regulation is in the best 14
interests of consumers. 15
Q. WHAT INFORMS YOUR GENERAL SUPPORT FOR PERFORMANCE-BASED 16
REGULATION? 17
A. Since leaving the Colorado PUC in 2011, much of my work has focused on the 18
related topics of “the new utility business model” and “a new regulatory model” 19
that can enable utilities to respond successfully to the technological and structural 20
changes in the sector. These structural changes include the increased prevalence 21
and cost effectiveness of DERs, the need to reduce carbon emissions and the need 22
10
Docket No. 4780 Exhibit NECEC-CLF-2
Direct Testimony of Ronald J. Binz April 25, 2018
to mitigate upward rate pressure due to replacement of aging grid infrastructure in 1
the upcoming decades. 2
As part of that work, I led a 15-month project, Utilities 2020, which 3
brought together regulators and industry leaders to develop and promote thinking 4
about these topics. The findings of the Utilities 2020 project support the 5
implementation of properly designed performance-based regulation in place of 6
traditional cost-of-service regulation.4 7
Q. PLEASE DESCRIBE THE UTILITIES 2020 PROJECT. 8
A. Utilities 2020 was a “research and action project” established to explore the 9
connected issues of evolving utility business models and changes to state utility 10
regulation needed to enable them. One of the main research tools employed by 11
Utilities 2020 was interviews of utility CEOs and leading state regulators, along 12
with numerous other leading thinkers in the field. In addition, Utilities 2020 13
hosted a dialogue in October 2012 with twelve state regulators from across the 14
country, senior executives from eight utilities, as well as consumer advocates and 15
other experts in energy and regulation. Finally, in December 2012, Utilities 2020 16
principals hosted a meeting in Boston of seven established and seasoned leaders 17
in energy policy and regulation to discuss the potential new utility 18
business/regulatory models. 19
4 “Utilities 2020 Report: Key Findings.” Available at: www.rbinz.com/U2020PublicReport.pdf
11

Docket No. 4780 Exhibit NECEC-CLF-2
Direct Testimony of Ronald J. Binz April 25, 2018
Q. WOULD YOU HIGHLIGHT SOME OF THE FINDINGS OF UTILITIES 2020? 1
A. In general, the Utilities 2020 findings highlighted the need for reform that creates 2
certainty and improves the business-as-usual regulatory processes for both 3
utilities and regulators. Among other topics, nearly all the CEOs we interviewed 4
believed that, under current practice, regulation does not provide utilities with 5
meaningful incentives to improve internal efficiencies. We heard that “if we save 6
a buck, they take it away from us in the next rate case,” and that “our best 7
outcome is that we recover the cost of a measure; there’s no upside.” They agreed 8
that higher firm efficiencies are possible and that these could function somewhat 9
to offset the higher costs expected over the next two decades. Most regulators we 10
spoke with expressed a primary concern that the challenges facing utilities, 11
particularly the coming high level of new investment, will translate into higher 12
customer rates. 13
Q. WHAT WERE THE RECOMMENDATIONS OF THE UTILITIES 2020 PROJECT? 14
A. The primary finding was that reform of the utility business model depended on 15
changes in the regulatory model. The project identified three potential models of 16
regulation that could be adapted for use in state regulation. One of the potential 17
regulatory models highlighted in Utilities 2020 was “revenue cap” regulation. An 18
instance of this type of regulation is the mechanism used in the United Kingdom 19
called “RIIO,” which stands for “Revenue set to deliver strong Incentives, 20
12
Docket No. 4780 Exhibit NECEC-CLF-2
Direct Testimony of Ronald J. Binz April 25, 2018
Innovation and Outputs.”5 The other two main models discussed by Utilities 1
2020 were the “Iowa Model,” and the “Grand Bargain.” 2
Q. CAN YOU DESCRIBE THE RIIO REGULATORY MODEL? 3
A. In the UK, RIIO builds on the price cap regime used for the past 20 years for 4
energy companies (called “Retail Price Index minus X,” or “RPI-X”), adding a 5
system of rewards and penalties tied to performance on desired outcomes (or 6
“outputs”) to be achieved by regulated companies. By its own terms, this UK 7
model seeks “value for money.”6 New rewards and penalties provide an incentive 8
system to encourage operational efficiencies, funding for innovation and 9
opportunities for utilities to involve third parties in energy delivery. RIIO also 10
decouples earnings from sales. 11
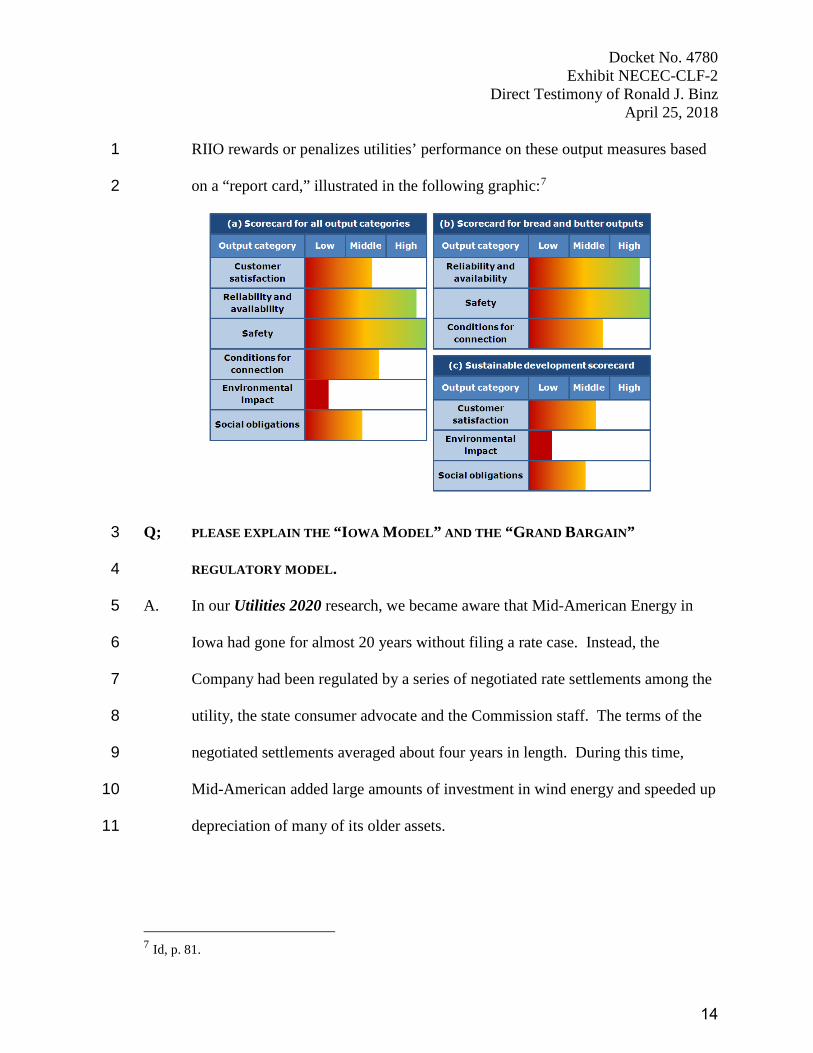
Under RIIO, utilities are graded for their following performance on six 12
output measures: 13
• Customer satisfaction, 14
• Reliability and availability, 15
• Safe network services, 16
• Connection terms, 17
• Environmental impact, and 18
• Social obligations. 19
5 There are other variations on the meaning of the acronym. 6 “Handbook for implementing the RIIO model”, Office of Gas and Electric Markets (Ofgem), 2010. London. P. 1. Available at www.ofgem.gov.uk.
13
Docket No. 4780 Exhibit NECEC-CLF-2
Direct Testimony of Ronald J. Binz April 25, 2018
RIIO rewards or penalizes utilities’ performance on these output measures based 1
on a “report card,” illustrated in the following graphic:7 2
Q; PLEASE EXPLAIN THE “IOWA MODEL” AND THE “GRAND BARGAIN” 3
REGULATORY MODEL. 4
A. In our Utilities 2020 research, we became aware that Mid-American Energy in 5
Iowa had gone for almost 20 years without filing a rate case. Instead, the 6
Company had been regulated by a series of negotiated rate settlements among the 7
utility, the state consumer advocate and the Commission staff. The terms of the 8
negotiated settlements averaged about four years in length. During this time, 9
Mid-American added large amounts of investment in wind energy and speeded up 10
depreciation of many of its older assets. 11
7 Id, p. 81.
14
Docket No. 4780 Exhibit NECEC-CLF-2
Direct Testimony of Ronald J. Binz April 25, 2018
From all reports, the state of Iowa achieved many of its goals – improved 1
service quality, rate stability and reduced carbon emissions – through this unusual 2
collaborative ratemaking regime. The utility reported that the multi-year 3
character of the rate settlements allowed it to make rational investment decisions 4
benefitting the company, independent power producers and consumers. The 5
practice in Iowa stood out as an innovative way of aligning interests – utility, 6
consumer, environmental, business – while providing a clearer set of economic 7
incentives to the utility.8 8
“The Grand Bargain” is not so much a model for economic regulation as a 9
process for developing an improved regulatory outcome. In this scheme, the 10
regulator would dispatch a collaborative process to negotiate a multi-year set of 11
prices and desired outcomes. The regulator would accept or reject the negotiated 12
result. At the front end, the regulator would provide boundaries that 13
(preliminarily) determined what outcomes would be acceptable. 14
The negotiating parties would not be bound to any particular method for 15
arriving at a multi-year schedule of rates: the Grand Bargain could be opaque with 16
respect to how the rates were determined and what tradeoffs were involved in the 17
settlement. Finally, the parties in the collaborative process would understand that 18
the Commission was predisposed to accept a settlement agreed to by all parties; 19
8 “Utilities 2020 Report: Key Findings.” Available at: www.rbinz.com/U2020PublicReport.pdf
15
Docket No. 4780 Exhibit NECEC-CLF-2
Direct Testimony of Ronald J. Binz April 25, 2018
however, the Commission would be prepared to enter a decision if consensus was 1
not reached. 2
Q. HOW MIGHT THE UK’S EXPERIENCE WITH RIIO AND THE ELEMENTS OF THE 3
OTHER MODELS APPLY IN RHODE ISLAND? 4
A. There are many opinions about RIIO, but most observers agree that RIIO has 5
succeeded in shifting the focus of UK regulation toward “outcome-based” 6
regulation, while inducing greater efficiency and innovation in the regulated 7
companies. I agree with many observers that the entire RIIO package may be too 8
unwieldy to apply in all its details in the U.S. That said, RIIO is a good example 9
of the features that might advisedly accompany a new regulatory model for U.S. 10
electricity regulation. In our research, we concluded that features such as 11
revenue-cap regulation, decoupling and measuring “outputs” could be applied in 12
U.S. regulation with salutary effect. 13
The experience in Iowa is instructive because it shows that standard US 14
utility regulation can be modified in a straightforward manner to dampen the 15
undesirable effects discussed earlier. Mid-American Energy showed how a long-16
term regulatory agreement could fundamentally affect its investment behavior. 17
Finally, the Grand Bargain points the way to how commissions can procedurally 18
set in motion a fundamental change in regulatory results. As discussed below, all 19
three models could have a place in the Commission’s decision in the National 20
Grid application in this case. 21
16

Docket No. 4780 Exhibit NECEC-CLF-2
Direct Testimony of Ronald J. Binz April 25, 2018
Elements of an Effective PBR Regime 1
Q. BASED ON YOUR RESEARCH AND EXPERIENCE, WHAT ARE THE ELEMENTS OF AN 2
EFFECTIVE PBR REGIME? 3
A. Based on the work I did for Utilities 2020 and reflecting on the RIIO model, I 4
suggest that a successful PBR regime should have the following five features: 5
1. Growth in allowed base revenues is tied to an external measure, and not 6
related directly to investment choices; 7
2. Utility performance meaningfully affects allowed revenues (up and down); 8
3. The mechanism is in place for a period that is sufficiently long to allow the 9
utility time to prove out the economics of its investment and expense 10
decisions; 11
4. The link between total sales and earnings is decoupled; and 12
5. The ratemaking regime ties utility revenues to the achievement of certain 13
outcomes or “outputs.” 14
Finally, it is also critical that the new regulatory system be seen to be fair so that it 15
can be sustained for an extended period. The persistence of a PBR regime is 16
essential for the utility to be able to make long-term changes in its behavior. 17
Q. PLEASE SUMMARIZE YOUR OPINION ABOUT THE STRUCTURE OF A REGULATORY 18
REGIME THAT SHOULD BE THE GOAL OF RHODE ISLAND POLICY MAKERS. 19
A. Putting together the parts discussed above, I recommend that Rhode Island’s 20
regulation of the electric power sector move toward Performance-Based 21
Regulation based on Revenue-Cap Model. 22
17
Docket No. 4780 Exhibit NECEC-CLF-2
Direct Testimony of Ronald J. Binz April 25, 2018
Q. AT A THEORETIC LEVEL, ARE THERE ANY DOWNSIDES TO USING REVENUE-CAP 1
REGULATION? 2
A. When a utility is under a longer-term regime, it can increase earnings by spending 3
less. It is literally true that “a penny saved is a penny earned.” The most 4
frequently voiced concern about revenue-cap regulation is the possibility that a 5
utility will under-invest in safety and the reliability of the grid. An inducement to 6
efficiency is desirable if the utility also maintains the quality of electricity 7
delivery, especially its safety and reliability. 8
The prescription for avoiding this undesired outcome is two-part: 1) an 9
incentive structure that counters such unintended consequences, and 2) dedicated 10
enforcement of safety and quality standards. 11
Q. HOW DOES A PROPERLY DESIGNED PBR LIMIT THE “CAPITAL BIAS” THAT CAN 12
ACCOMPANY COST OF SERVICE REGULATION? 13
A. Because traditional regulation measures utility rate base to determine allowed 14
revenues and earnings, there is an inherent bias towards capital intensive solutions 15
to grid issues. Stated another way, utilities do not earn a “return” on expenses in 16
the same way they do with rate base capital investment. This bias is not alleviated 17
by adopting revenue decoupling, and it is not mitigated by the addition of PIMs to 18
traditional rate base, rate of return regulation. Putting “expense-like” solutions on 19
an equal footing with “capital-like” solutions requires a fundamental change in 20
the way utilities are compensated. 21
18

Docket No. 4780 Exhibit NECEC-CLF-2
Direct Testimony of Ronald J. Binz April 25, 2018
A PBR regime using the “revenue-cap” compensation model addresses 1
this bias by paying a utility for the delivery of an outcome without reference to 2
whether the outcome was achieved by any particular mix of capital and expenses. 3
As a result, a PBR regime using a revenue cap compensation structure will focus 4
on total expenses – “totex” – instead of capital expenses (capex) and operating 5
expenses (opex) separately. This puts lower-cost “non-wires alternatives” on 6
more nearly the same footing as utility capital investment. By selecting the 7
lower-cost solution instead of the capital-intensive solution, a utility regulated 8
under a revenue cap will increase earnings. 9
Q. IN DOCKET NO. 4770, THE DIVISION ADVOCATES THE USE OF A MULTI-YEAR 10
RATE PLAN AS A PREFERRED APPROACH TO REGULATING NATIONAL GRID. 11
WHAT IS YOUR RESPONSE TO THE DIVISION’S APPROACH? 12
A. Depending on its details, the effects of a multi-year rate plan can be similar to the 13
“revenue-cap” approach discussed above. At a minimum, adopting a multi-year 14
rate plan would represent progress toward the ultimate goal of an appropriate 15
regulatory regime. Comparing such a plan to the characteristics I listed above, we 16
see that those criteria could be met: a multi-year plan is, by definition, in effect 17
for an extended period of time; it can tie earnings significantly to performance; 18
year-to-year changes in maximum allowed revenues are set without reference to 19
actual expense or investment levels, typically in a negotiation; revenues are 20
decoupled from sales; finally, there is a focus on outcomes of the utility’s efforts 21
during the control period, not on the choices of capex or opex. 22
19

Docket No. 4780 Exhibit NECEC-CLF-2
Direct Testimony of Ronald J. Binz April 25, 2018
In sum, a multi-year rate plan could combine elements of the three models 1
discussed previously: the outcome focus and revenue control of RIIO-style 2
regulation; the multi-year characteristic of the “Iowa model;” and the use, at the 3
front end, of a broad negotiation of the outcomes and revenue levels. 4
A multi-year rate plan will be less successful if it applies for a relatively 5
short period; if it clings to rate base in setting the annual price changes; or if it 6
omits or minimizes the revenue importance of performance measures. 7
IV. THE NATIONAL GRID PROPOSAL
Q. PLEASE DESCRIBE NATIONAL GRID’S PBR PROPOSAL IN THIS CASE. 8
A. National Grid is proposing a two-faceted incentive regulation proposal. First, the 9
Company proposes mechanisms designed to improve the Company’s management 10
of capital investment projects in its Infrastructure, Safety and Reliability (“ISR”) 11
Plan and in its expansion of the distribution grid. Second, the Company proposes 12
eight specific “Performance Incentive Mechanisms” or “PIMs” that address 13
performance in three general areas: (1) system efficiency; (2) DERs; and (3) 14
network support services. 15
Importantly, National Grid is not proposing any far-reaching changes to its 16
regulation, even though it acknowledges in testimony the central role that PBR 17
will play in the state’s Power Sector Transformation: 18
A shift toward performance-based regulation is foundational to the 19 power sector transformation envisioned by the state. This chapter 20 proposes first steps in what is likely to be a longer process of 21
20

Docket No. 4780 Exhibit NECEC-CLF-2
Direct Testimony of Ronald J. Binz April 25, 2018
evolution that uncovers new opportunities to incent both overall 1 efficiencies and system cost reductions, while also driving 2 exceptional utility performance in areas of importance. By 3 rewarding utilities based on performance, regulation can better 4 mirror the outcomes of competitive markets, where firms earn 5 higher returns if they innovate and provide products and services 6 that create more value for customers. (Emphasis supplied.)9 7 In addition, the Company’s rate filing in Docket No. 4770 is a traditional 8
cost-of-service rate case, even though the Company acknowledges in testimony: 9
Although today’s regulatory framework supports cost-recovery 10 and earnings on investment deemed prudent by regulators, it is not 11 sufficient to drive innovative utility performance in delivering these 12 new objectives. To best encourage utilities to innovate and to align 13 their financial interests with broader policy goals and customer 14 outcomes that expand beyond core performance obligations, new 15 compensation mechanisms are needed. (Emphasis supplied.)10 16 17
The relatively conservative proposal by National Grid in Docket No. 4780 18
“toward performance-based regulation” represents a missed opportunity: National 19
Grid’s timid PBR proposal, limited to adding PIMs to traditional regulation, 20
would be in place until 2022. Further reforms would have to wait until then. 21
Similarly, the traditional rate case filed in Docket No. 4770 makes no progress 22
toward a “new compensation mechanism[s].” It is up to the other parties to offer 23
options and up to the Commission to move forward on regulatory reform. 24
9RIPUC Docket No. 4770. Testimony and Schedules of Power Sector Transformation Panel. Book 1 of 3. November 27, 2017. Bates page 162. 10 RIPUC Docket No. 4780. Testimony of Power Sector Transformation Panel. January 12, 2018. Page 83 of 102.
21

Docket No. 4780 Exhibit NECEC-CLF-2
Direct Testimony of Ronald J. Binz April 25, 2018
Q. WHAT IS YOUR OVERALL ASSESSMENT OF THE COMPANY’S INCENTIVE 1
PROPOSAL RELATED TO CAPITAL INVESTMENT? 2
A. I am unconvinced that the “Complex Capital Projects Capital Cost Incentive” is 3
necessary or even helpful. The incentive applies only to “major projects” and 4
doesn’t address the baseline capital investments made in the grid. Because it is 5
structured as a one-way adder to the return on rate base, it likely reinforces the 6
capital bias of any utility regulated this way. Finally, this structure exposes 7
National Grid only to an “opportunity cost” of a foregone bonus of up to $2.5 8
million; the down-side risk is zero. 9
The “Construction Costs per Mile Productivity Incentive” has not yet been 10
fleshed out by the Company. However, its purpose is to offer National Grid an 11
opportunity for extra earnings when it can reduce the per-mile cost of distribution 12
plant. Again, this mechanism appears to reinforce a commitment to capital 13
construction of distribution facilities and does not incentivize the Company to 14
explore non-wires opportunities. Not only will the Company add to rate base with 15
distribution investment, it might earn a bonus for doing so. At the same time, 16
non-wires alternatives do not add to rate base and do not present an opportunity 17
for extra earnings. 18
In sum, true regulatory reform in Rhode Island must tackle issues around 19
capital investment in a much more fundamental way. In my opinion, the approach 20
to capital cost recovery proposed by National Grid might actually slow a move 21
toward a more appropriate regulatory structure. 22
22

Docket No. 4780 Exhibit NECEC-CLF-2
Direct Testimony of Ronald J. Binz April 25, 2018
Q. WHAT IS YOUR OVERALL ASSESSMENT OF THE COMPANY’S PROPOSAL TO ADD 1
PIMS TO ITS REGULATION? 2
A. The PIMs will probably be helpful, but they are quite small and unlikely to have a 3
major effect. Even if the Company scores the maximum on all the PIMs, this 4
structure would add only 75 basis points to the Company’s ROE. There is very 5
little at risk (only opportunity costs since the PIMs are positive-only) to the 6
Company for poor performance on the PIMs. As a result, these PIMs cannot 7
possibly be expected to engender transformational change within the utility. 8
Capital Cost Incentives 9
Q. PLEASE ELABORATE ON YOUR COMMENTS ABOUT THE CAPITAL COST 10
INCENTIVES. 11
A. As discussed at length above, traditional regulation provides a complex set of 12
incentives, some of which will hinder the transformation of the power sector. 13
These counterproductive incentives must be eliminated through regulatory 14
reform. The PST Report does a good job of describing the biases provided by 15
cost of service regulation based on rate base. Four of the Report’s 16
recommendations provide a roadmap for the needed changes. 17
1.1 Create a multi-year rate plan and budget with a revenue cap to incent 18 cost savings. The utility should submit a multi-year rate plan with a 19 revenue cap that incents cost saving and shares those savings with 20 ratepayers. This will better align the utility’s financial incentives with 21 economic efficiency and sound investments in capital and non-capital 22 expenditures, and ultimately pass reduced costs on to customers 23 . 24
23

Docket No. 4780 Exhibit NECEC-CLF-2
Direct Testimony of Ronald J. Binz April 25, 2018
1.2 Shift to a pay for performance model by developing performance 1 incentive mechanisms for system efficiency, distributed energy resources, 2 and customer and network support. The utility’s earnings growth will shift 3 away from being based on the amount of capital it invests and towards a 4 reflection of its performance. Incentives will encourage prudent 5 investments in system efficiency, increasing distributed energy resources, 6 network support services, and customer engagement. 7 1.5 Assess the existing split-treatment of capital and operating expenses. 8 The Division should convene a collaborative of stakeholders to consider 9 opportunities for a total expenditure approach for future implementation 10 to remove capital bias of the regulatory framework that currently drives 11 cost increases. 12 4.2 Establish outcome-based metrics. Beneficial electrification proposals 13 should include tracking of outcome-based metrics that are relevant to 14 consumers and public policy objectives.11 15
The terms “revenue cap” and “capital bias” used in the Report’s 16
recommendations point to the fundamental changes needed to move National 17
Grid’s regulation to the place it needs to be. By proposing these two capital 18
investment incentives, National Grid is making no progress towards the Report’s 19
recommendations. 20
If, instead, National Grid were regulated under a revenue cap for an 21
extended period of time, all of the Company’s capital investment would be under 22
the ultimate incentive to be efficient. As explained earlier, revenue cap regulation 23
will create genuine competition between capital and non-capital solutions. 24
11 “Rhode Island Power Sector Transformation, Phase One Report to Governor Gina M. Raimondo”. November 2017. 10-12. http://www.ripuc.org/utilityinfo/electric/PST%20Report_Nov_8.pdf
24
Docket No. 4780 Exhibit NECEC-CLF-2
Direct Testimony of Ronald J. Binz April 25, 2018
Further, the Company will have an incentive to be efficient in deploying capital 1
investment: doing so will improve earnings in the short run and there will be no 2
upside to inflating rate base with higher than needed capital costs. 3
Q. IS NATIONAL GRID FAMILIAR WITH REVENUE-CAP REGULATION? 4
A. Yes. National Grid is a transmission provider in the UK. All “wires” companies, 5
-- both distribution and transmission companies – are regulated under the RIIO 6
regime. 7
Q. ARE THERE ANY EXAMPLES OF “REVENUE CAP” REGULATION USED IN THE 8
NORTHEAST? 9
A. Price-cap regulation was used extensively in telecommunications regulation in the 10
Northeast beginning in the late 1980s. Notably, Vermont and New York were 11
national leaders in moving away from cost-based regulation and toward price-12
based regulation. The “regulatory bargain” in those years began to evolve 13
towards a focus on the desired outputs (quality, technological innovation, and 14
interconnection parity) with much less emphasis on cost inputs. 15
The first steps toward revenue-cap regulation for electricity and natural 16
gas in the Northeast included “decoupling” revenues from unit sales, adopted by 17
many states. In recent years, there has been a move toward multi-year rate plans, 18
which, as discussed above, can be a close relative to “revenue-cap” regulation. 19
Most recently, the Massachusetts DPU approved a revenue-cap plan for 20
Eversource in 2017. The plan allows annual revenue changes based on an 21
external index, not on the costs or investment levels of Eversource. The annual 22
25

Docket No. 4780 Exhibit NECEC-CLF-2
Direct Testimony of Ronald J. Binz April 25, 2018
revenues are “capped” by a factor of CPI-X, where CPI is the Consumer Price 1
Index and X is the so-called productivity offset. 2
Q. DO YOU SUPPORT THE MASSACHUSETTS DPU’S DECISION? 3
A. While I strongly support PBR frameworks based on revenues caps, I do not 4
support the MA DPU decision. As I testified in that case, the Eversource proposal 5
relies on an incorrect X-factor that will produce revenues that are significantly too 6
high. This will over-compensate Eversource and might create consumer or 7
legislative resistance to revenue-cap regulation, giving incentive regulation a “bad 8
name.” Further, the Eversource proposal did not include performance incentive 9
measures and lacked the focus on “outputs” that a proper PBR regime should 10
contain. 11
Q. WHAT LESSONS SHOULD RHODE ISLAND REGULATORS TAKE FROM THE 12
MASSACHUSETTS DPU’S DECISION? 13
A. While the outcome of the Eversource case in Massachusetts is disappointing, the 14
PUC should move forward toward a beneficial change in electricity regulation in 15
Rhode Island. The Commission can achieve a superior result by combining the 16
benefits of revenue-cap regulation with a traditional focus on customer protection. 17
Performance-based regulation, employing a revenue-cap approach, implemented 18
correctly will result in superior outcomes for both customers and utility providers. 19
There is no reason that incentive regulation should result in prices that are not 20
fair. The PUC should ensure that, as it moves forward toward PBR, it advances 21
customer interests at the same rate as utility benefits. 22
26
Docket No. 4780 Exhibit NECEC-CLF-2
Direct Testimony of Ronald J. Binz April 25, 2018
Performance Incentive Mechanisms (PIMs) 1
Q. PLEASE ELABORATE ON YOUR COMMENTS ABOUT THE COMPANY’S PROPOSAL 2
FOR PERFORMANCE INCENTIVE MECHANISMS (PIMS). 3
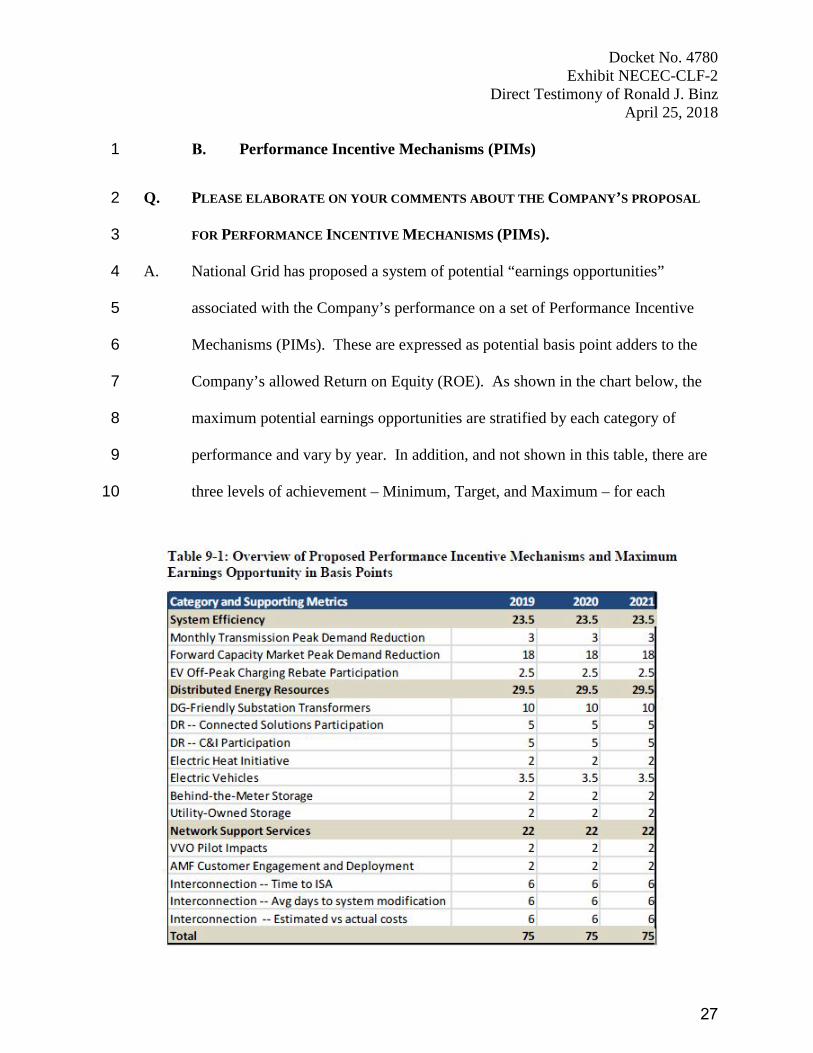
A. National Grid has proposed a system of potential “earnings opportunities” 4
associated with the Company’s performance on a set of Performance Incentive 5
Mechanisms (PIMs). These are expressed as potential basis point adders to the 6
Company’s allowed Return on Equity (ROE). As shown in the chart below, the 7
maximum potential earnings opportunities are stratified by each category of 8
performance and vary by year. In addition, and not shown in this table, there are 9
three levels of achievement – Minimum, Target, and Maximum – for each 10
27

Docket No. 4780 Exhibit NECEC-CLF-2
Direct Testimony of Ronald J. Binz April 25, 2018
performance category. In each annual determination, the Company’s 1
performance on each PIM is rated, and the appropriate ROE adder is calculated. 2
Q. WHAT ARE YOUR OBSERVATIONS ABOUT THIS PROPOSAL? 3
A. Without reference to any of the specific PIMs, I would first note that the potential 4
maximum rewards for performance are very small. A change of 1 basis point on 5
ROE equates to approximately $37,400 in operating income. This means that, if 6
the Company performed at the Maximum level in all categories, after-tax earnings 7
would increase by only about $2.8 million. At lower levels of performance, the 8
potential rewards are even smaller. The following table shows the full detail from 9
"Revenue Opportunities" Associated with Performance on PIMsStated as Basis Points on ROE
Category and Supporting Metrics Min Target Max
System Efficiency 9.0 16.3 23.5 Monthly Transmission Peak Demand Reduction 1.0 1.8 2.5
Forward Capacity Market Peak Demand Reduction 6.0 12.0 18.0 EV Off‐Peak Charging Rebate Participation 2.0 2.5 3.0
Distributed Energy Resources 5.3 16.8 29.5 DG‐Friendly Substation Transformers 1.0 6.0 10.0
DR‐‐Connected Solutions Participation 1.0 3.0 5.0 DR‐‐C&I Participation 1.0 3.0 5.0
Electric Heat Initiative 0.7 0.8 2.0 Electric Vehicles 1.0 2.0 3.5
Behind‐the‐Meter Storage 0.3 1.0 2.0 Utility‐Owned Storage 0.3 1.0 2.0
Network Support Services 10.0 16.0 22.0 VVO Pilot Impacts 2.0 2.0 2.0
AMF Customer Engagement and Deployment 2.0 2.0 2.0 Interconnection‐‐Time to ISA 2.0 4.0 6.0
Interconnection‐‐Avg days to system modification 2.0 4.0 6.0 Interconnection‐‐Estimated vs actual costs 2.0 4.0 6.0
Total 24.3 49.1 75.0
28

Docket No. 4780 Exhibit NECEC-CLF-2
Direct Testimony of Ronald J. Binz April 25, 2018
the Company’s testimony of the proposed earnings opportunities at “Target” and 1
“Minimum” performance levels in addition to the Maximum performance levels. 2
For additional context, I have prepared a table that states the potential 3
awards in absolute dollar terms. 4
To see why these absolute dollar amounts are too small, consider the 5
parameters for the Electric Heat Initiative. Here the “upside” reward for 6
Maximum Performance in the Electric Heat Initiative is only $75,000, while the 7
award for Minimum Performance in the Electric Heat Initiative is $25,000. It is 8
not reasonable to believe that the difference – $50,000 – is large enough on its 9
"Revenue Opportunities" Associated with Performance on PIMsStated as Income Dollars
Category and Supporting Metrics Min Target Max
System Efficiency 336,798 608,108 879,417 Monthly Transmission Peak Demand Reduction 37,422 65,489 93,555
Forward Capacity Market Peak Demand Reduction 224,532 449,064 673,596 EV Off‐Peak Charging Rebate Participation 74,844 93,555 112,266
Distributed Energy Resources 199,459 629,812 1,103,949 DG‐Friendly Substation Transformers 37,422 224,532 374,220
DR‐‐Connected Solutions Participation 37,422 112,266 187,110 DR‐‐C&I Participation 37,422 112,266 187,110
Electric Heat Initiative 25,073 31,060 74,844 Electric Vehicles 37,422 74,844 130,977
Behind‐the‐Meter Storage 12,349 37,422 74,844 Utility‐Owned Storage 12,349 37,422 74,844
Network Support Services 374,220 598,752 823,284 VVO Pilot Impacts 74,844 74,844 74,844
AMF Customer Engagement and Deployment 74,844 74,844 74,844 Interconnection‐‐Time to ISA 74,844 149,688 224,532
Interconnection‐‐Avg days to system modification 74,844 149,688 224,532 Interconnection‐‐Estimated vs actual costs 74,844 149,688 224,532
Total 910,477 1,836,672 2,806,650
29

Docket No. 4780 Exhibit NECEC-CLF-2
Direct Testimony of Ronald J. Binz April 25, 2018
own to motivate the program managers to move from Minimum to Maximum 1
performance. Similarly, the amount in play for other important initiatives is very 2
modest, considering the benefits. 3
My second observation about this scheme is that it is reward-only: there is 4
no penalty for poor performance. The Company has not given meaning to 5
“Minimum,” “Target” and “Maximum” for all the performance areas. However, 6
one must assume that “Minimum” performance is acceptable since there is a 7
positive “earnings opportunity” for Minimum performance in each of the 8
categories. Outside of Lake Woebegone, it is very counter-intuitive to reward 9
“Minimum” performance with a bonus ROE. Further, what happens if 10
performance in a category is “Abysmal?” Assumedly, there would be no reward, 11
but neither would there be a penalty. 12
My third observation is that the National Grid proposal ties potential 13
rewards to the size of the rate base (ROE basis points times rate base). There is 14
no compelling reason to define PIMs this way, and the concept is not consistent 15
with moving utility compensation away from investment levels. Instead, the 16
value at stake with a PIM can be stated simply in dollar terms. Below I 17
demonstrate how this can be accomplished in a flexible model. 18
Q. WHAT ARE YOUR RECOMMENDATIONS FOR REDESIGNING THE PIMS? 19
A. In view of the previous discussion, I recommend that the Commission adopt a 20
scoring matrix with the following four changes to the National Grid proposal: 21
• Increase the dollar amount at stake. 22
30
Docket No. 4780 Exhibit NECEC-CLF-2
Direct Testimony of Ronald J. Binz April 25, 2018
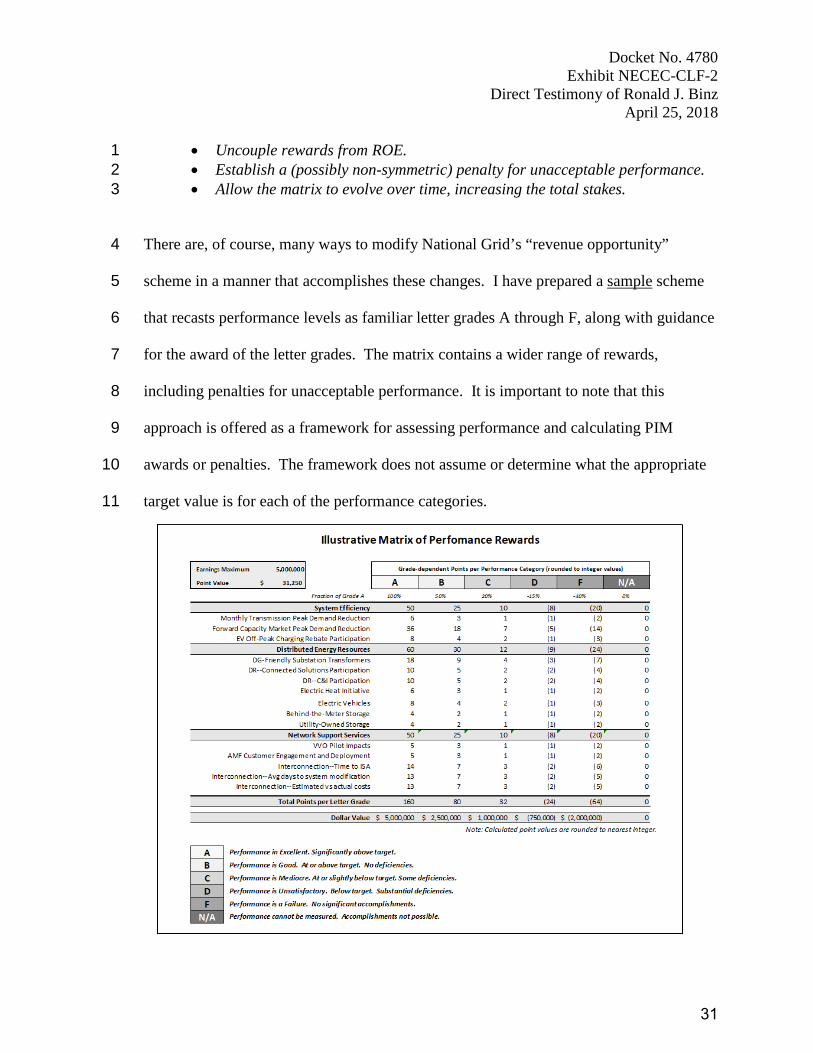
• Uncouple rewards from ROE. 1 • Establish a (possibly non-symmetric) penalty for unacceptable performance. 2 • Allow the matrix to evolve over time, increasing the total stakes. 3
There are, of course, many ways to modify National Grid’s “revenue opportunity” 4
scheme in a manner that accomplishes these changes. I have prepared a sample scheme 5
that recasts performance levels as familiar letter grades A through F, along with guidance 6
for the award of the letter grades. The matrix contains a wider range of rewards, 7
including penalties for unacceptable performance. It is important to note that this 8
approach is offered as a framework for assessing performance and calculating PIM 9
awards or penalties. The framework does not assume or determine what the appropriate 10
target value is for each of the performance categories. 11
31

Docket No. 4780 Exhibit NECEC-CLF-2
Direct Testimony of Ronald J. Binz April 25, 2018
I stress that this sample scheme is only illustrative; it is flexible and can be 1
adjusted as to the total dollar amount at issue and the relative number of points 2
assigned to each performance category. The sample matrix can be evolved over 3
time without reference to ROE, capital structure, or the size of rate base. Instead, 4
the awards are stated in points that are translated into dollar amounts. This has 5
the effect of making the structure more flexible and moving away from awards 6
that vary with the size of the rate base. Finally, in using this matrix, the 7
Commission can specify the maximum amount available as the total award. 8
In this illustrative matrix, the total upside amount (“Straight A’s”) is set at 9
$5,000,000. The impact of this higher total and revised relative values of the 10
letter grades produces some improved results. Going back to the example of the 11
Electric Heat Initiative12, the maximum award grows from $75,000 to about 12
$188,000. More importantly, the spread between letter grade C (Mediocre) and 13
letter grade A (Excellent) in the Electric Heat Initiative is now $150,000, much 14
larger than the $50,000 spread in the National Grid proposal discussed earlier. I 15
believe this significant difference is much more likely to spur performance past 16
Mediocre toward Excellent. 17
Another significant difference between this example matrix and the 18
National Grid proposal is the inclusion of negative point values. Under the 19
structure proposed here, National Grid would be penalized for “Unsatisfactory” 20
12 By using the Electric Heat Initiative in this example, NECEC and CLF are not taking a position on the merits of the initiative.
32
Docket No. 4780 Exhibit NECEC-CLF-2
Direct Testimony of Ronald J. Binz April 25, 2018
performance or “Failure” in a category. The scheme is asymmetric: the potential 1
rewards are significantly larger than the potential penalties. 2
Q. HOW SHOULD THE “REVENUE OPPORTUNITIES” PRESENTED BY PIMS RELATE 3
TO THE TOTAL COMPENSATION TO NATIONAL GRID? 4
A. The purpose of PIMs (and incentive regulation generally) is to increase the “value 5
for money” paid by customers to the utility. PIMs should offer utilities the 6
opportunity for increased earnings, but only if their performance rises above a 7
baseline performance that would occur in absence of the PIMs. 8
To be fair to customers, the Commission must adjust the total allowed 9
non-PIM earnings level so that the sum of non-PIM earnings plus PIM earnings 10
for average performance equals the target revenue. Referring to the example 11
matrix shown above, a letter grade between B and C – essentially C+ -- would 12
equate to “average” performance. In this example, a C+ grade would yield $1.75 13
million, or about 47 basis points on ROE under the capital structure in this case. 14
Thus, the Commission should set the total non-PIM earnings $1.75 million 15
below the indicated full cost of service, permitting the utility to recover this 16
deficit through “average” performance, while having the opportunity to earn 17
bonus earnings for superior performance. One direct way to do this is to reduce 18
the awarded ROE by 47 basis points, with additional earnings available to the 19
utility, depending on how it performs. If the Company has a “C+” performance, 20
the utility’s earnings will be back to the original target. If it achieves a better 21
grade, total allowed earnings will be correspondingly higher. 22
33
Docket No. 4780 Exhibit NECEC-CLF-2
Direct Testimony of Ronald J. Binz April 25, 2018
Q. PLEASE COMMENT ON THE APPROACH TO PIMS TAKEN BY THE DIVISION IN ITS 1
TESTIMONY IN DOCKET NO. 4770. 2
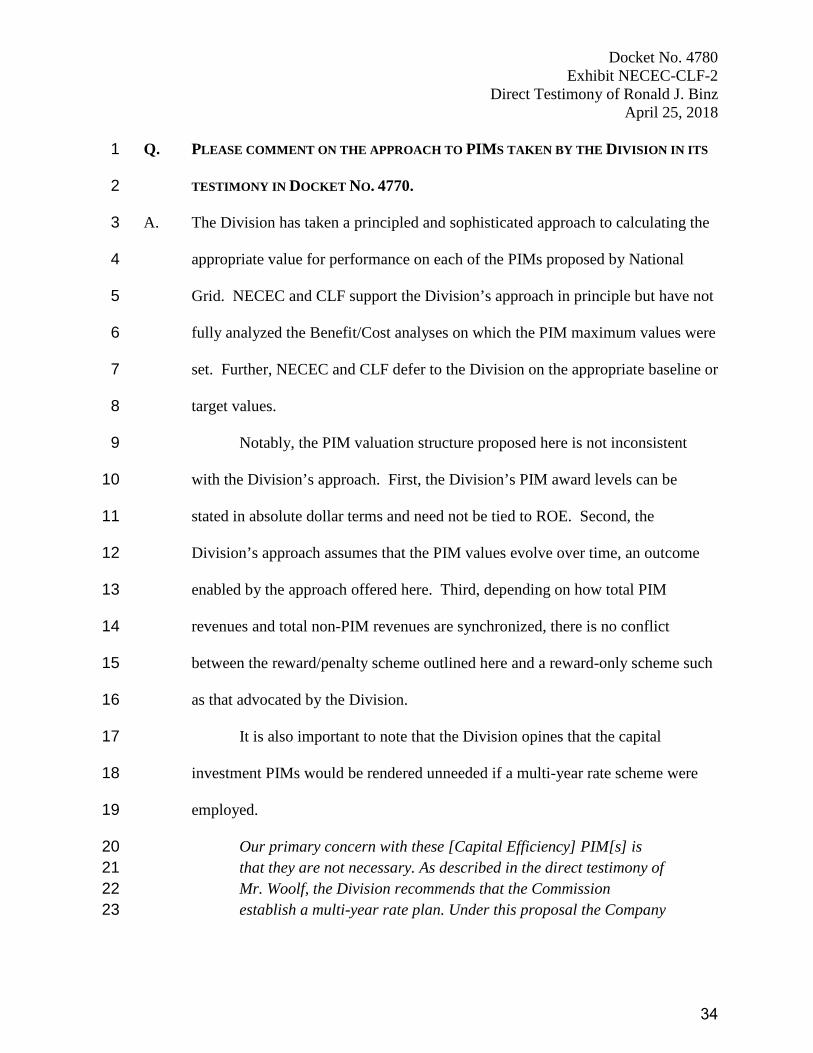
A. The Division has taken a principled and sophisticated approach to calculating the 3
appropriate value for performance on each of the PIMs proposed by National 4
Grid. NECEC and CLF support the Division’s approach in principle but have not 5
fully analyzed the Benefit/Cost analyses on which the PIM maximum values were 6
set. Further, NECEC and CLF defer to the Division on the appropriate baseline or 7
target values. 8
Notably, the PIM valuation structure proposed here is not inconsistent 9
with the Division’s approach. First, the Division’s PIM award levels can be 10
stated in absolute dollar terms and need not be tied to ROE. Second, the 11
Division’s approach assumes that the PIM values evolve over time, an outcome 12
enabled by the approach offered here. Third, depending on how total PIM 13
revenues and total non-PIM revenues are synchronized, there is no conflict 14
between the reward/penalty scheme outlined here and a reward-only scheme such 15
as that advocated by the Division. 16
It is also important to note that the Division opines that the capital 17
investment PIMs would be rendered unneeded if a multi-year rate scheme were 18
employed. 19
Our primary concern with these [Capital Efficiency] PIM[s] is 20 that they are not necessary. As described in the direct testimony of 21 Mr. Woolf, the Division recommends that the Commission 22 establish a multi-year rate plan. Under this proposal the Company 23
34

Docket No. 4780 Exhibit NECEC-CLF-2
Direct Testimony of Ronald J. Binz April 25, 2018
would automatically have a financial incentive to reduce capital 1 costs and improve productivity between rate cases.13 2 NECEC and CLF agree with this analysis along with the additional 3
observation that a revenue-cap regulatory regime and a multi-year rate plan 4
produce similar incentives for efficiency. 5
Q. DO YOU HAVE ANY COMMENTS ON THE SPECIFIC PIMS PROPOSED BY NATIONAL 6
GRID? 7
A. Yes. I have comments on the PIMs that relate to interconnection 8
and the PIMs that relate to electrical storage. 9
Several PIMs relate to National Grid’s relationship with third parties that 10
are interconnecting with National Grid. As gatekeeper to the grid, the distribution 11
utility’s performance on these PIMs is critical to the success of an entire industry 12
of companies that provide DERs to customers and to the utility. The distribution 13
company should properly be rewarded for superior performance in this area and 14
several PIMs attempt to measure the Company’s performance in this role. 15
As noted earlier, the UK regulator includes performance on 16
interconnection and customer satisfaction as two of the central “outputs” for the 17
distribution and transmission companies it regulates. In conducting its evaluation 18
of performance, the UK regulator employs surveys of stakeholders and customers 19
13 See Attachment C, RIPUC Docket No. 4770. Direct Testimony of Tim Woolf and Melissa Whited, On Behalf of the Division of Public Utilities and Carriers. page 63.
35

Docket No. 4780 Exhibit NECEC-CLF-2
Direct Testimony of Ronald J. Binz April 25, 2018
of the regulated companies, including National Grid. Plc, the transmission 1
provider. 2
National Grid, Plc. has been active in the design and structure of the 3
surveys of stakeholders and customers, the results of which are used to determine 4
the Company’s compensation. Consider the following excerpted quotes about the 5
use of a customer survey, taken from a document from the regulator, Ofgem: 6
2.46. NGET has material experience of operating a customer 7 survey and has been able to provide sufficient evidence to set the 8 parameters for this element of the survey in the licence condition, 9 (due to be published shortly). This reflects a baseline score based 10 on NGET's recent overall performance but also supported by 11 similar surveys in other sectors. 12
* * * 2.48. We also agree with NGET's proposal to increase the 13 proportion of the incentive driven by the stakeholder survey over 14 the control [period] with the aspiration of it having equal 15 representation towards the end of the price control period when we 16 will understand the results from this new element more fully.14 17 Further, the survey results are very influential in the determination of the 18
companies’ compensation.15 19
NECEC and CLF recommend that the Commission direct National Grid in 20
this case to develop customer and stakeholder surveys that can be used to measure 21
the performance of National Grid on its interconnection responsibilities. NECEC 22
14 “RIIO-T1: Final Proposals for National Grid Electricity Transmission and National Grid Gas”. Ofgem. December 17, 2012. 15 Performance on the “Customer Satisfaction” measure can affect revenues by plus or minus 1.0 percent. Performance on “Interconnection” can affect total revenues by plus or minus 0.5 percent.
36

Docket No. 4780 Exhibit NECEC-CLF-2
Direct Testimony of Ronald J. Binz April 25, 2018
and CLF believe that a survey of interconnection customers, used in combination 1
with numerical performance measures, will present a fuller picture of 2
performance on the interconnection-related PIMs. 3
Q. WHAT ARE YOUR COMMENTS ON THE STORAGE-RELATED PIMS? 4
A. Two of the proposed PIMs relate to electrical storage: 1) Utility-Owned Storage 5
and 2) Behind the Meter Storage. Performance on each of these PIMs is 6
measured by the number of MW installed: 7
(6) Behind the Meter Storage: measured by the annual MW growth 8 in energy storage installed at customer locations behind a meter 9 used to register electric load; and 10 (7) Company-Owned Storage: measured by the installed MW of 11 Company-owned in energy storage, inclusive of the ESS Program 12 above, used to support peak load reduction and verified using 13 interval metering. 14
Once again, National Grid’s performance in this area will be crucial to the 15
development of third-party companies that offer storage on both sides of the 16
meter. NECEC and CLF believe that the Company should be measured not 17
simply based on MWs installed, but also on the Company’s level of engagement 18
with third-party providers of storage services. Indicia of performance here should 19
begin with a measure of the degree of engagement with third parties. These could 20
include the extent to which the Company engages with third-party storage 21
providers; technical sessions to assist providers in understanding specifications 22
for storage on both sides of the meter; surveys of storage providers measuring 23
37

Docket No. 4780 Exhibit NECEC-CLF-2
Direct Testimony of Ronald J. Binz April 25, 2018
their satisfaction with the performance of the Company; and finally, the number 1
of third-parties responding to RFPs for storage services and the number of MW of 2
storage installed by or in partnership with third parties. 3
Recovery of PST-Related Costs
Q. HOW DOES NATIONAL GRID PROPOSE TO RECOVER THE COSTS OF THE PST 4
PROPOSAL? 5
A. National Grid proposes to create a new cost recovery mechanism – the PST 6
Factor – that would “recover” the added investment from PST projects. 7
Q. WHAT ARE YOUR CONCERNS ABOUT THE USE OF THE PROPOSED PST COST 8
RECOVERY MECHANISM? 9
A. I agree with the analysis of the issue contained in the testimony of Tim Woolf on 10
behalf of the Division. Using a “cost tracker” as National Grid proposes damages 11
the planning and regulatory process. In testimony in Docket No. 4770, Mr. Woolf 12
explained that the National Grid proposal “exacerbates the already fractured 13
process for planning, reviewing, and approving utility investments.” 14
If the National Grid proposal is approved, investments in electricity 15
delivery will be split between normal rate cases, ISR filings and PST trackers. 16
These three mechanisms will proceed on different time schedules, will consider 17
overlapping and intersecting sets of capital investments, and will be difficult to 18
oversee in a coordinated manner. 19
38

Docket No. 4780 Exhibit NECEC-CLF-2
Direct Testimony of Ronald J. Binz April 25, 2018
It would be much preferred for all three capital programs to be regulated 1
under a single scheme, preferably in a multi-year revenue control period. That 2
means that the PST costs (capex and opex) would come into rates as long as they 3
are tracking with a plan approved at the front end of a multi-year period. In its 4
testimony, the Division has described how that can occur. NECEC and CLF urge 5
the Commission to reject National Grid’s cost recovery and approve a process in 6
line with the Division’s position on this issue. 7
If the Commission declines to adopt a multi-year, revenue cap style of 8
regulation, the Company should be required to file periodic rate cases, as needed, 9
in which the PST costs come into rates. This is a second choice for NECEC and 10
CLF. 11
Finally, if the Commission declines to adopt either a multi-year rate 12
regime or the requirement that the PST investments enter rates in a rate case, 13
preferring to approve a “cost tracker,” it should require the Company to 14
incorporate the PST investments into the cost recovery process for Infrastructure, 15
Safety and Reliability (ISR) costs, the cost recovery process for System 16
Reliability Procurement (SRP) costs, or another existing cost recovery process, as 17
appropriate – NECEC’s and CLF’s least preferred option. 18
Q. DO YOU HAVE A RECOMMENDATION FOR THE COMMISSION WITH REGARD TO 19
PROCEDURAL STEPS? 20
A. Yes. Earlier in testimony, I described the “Grand Bargain” approach to reforming 21
regulation in which the Commission sets the boundaries for a comprehensive 22
39

Docket No. 4780 Exhibit NECEC-CLF-2
Direct Testimony of Ronald J. Binz April 25, 2018
multi-year agreement and dispatches the parties to hammer out a proposal that is 1
then considered by the Commission. Due to its complexity, an effective multi-2
year rate regime – like the Division’s proposal or a more structured revenue cap 3
regime – will almost certainly require the use of such a negotiated outcome. 4
National Grid has filed a traditional rate case with a one-year revenue 5
target and a modest set of PIMs. This filing cannot easily be molded into a multi-6
year incentive regulation agreement within the limitations of the adjudicatory 7
process under which this docket will proceed. I agree with the Division in its 8
testimony in Docket No. 4470: 9
But the Division believes the only practical way that an effective 10 multi-year rate plan can emerge from this rate case is through a 11 negotiated settlement. 12
* * * The best result would be a negotiated solution that involves the 13 Company working with the Division and others to address the 14 many complexities. The Division believes this is possible, even 15 with some of the shortcomings present in the Company’s current 16 filings. It could be an important first step toward a future 17 ratemaking process.16 18 19
Of course, NECEC and CLF are willing to engage in a negotiation in this 20
case if the Commission wishes to proceed in that manner. 21
16 See Attachment B, RIPUC Docket No. 4770. Direct Testimony of Tim Woolf, On Behalf of the Division of Public Utilities and Carriers. page 43.
40
Docket No. 4780 Exhibit NECEC-CLF-2
Direct Testimony of Ronald J. Binz April 25, 2018
Q. WHAT IF THE COMMISSION DOES NOT REQUIRE PARTIES TO NEGOTIATE A 1
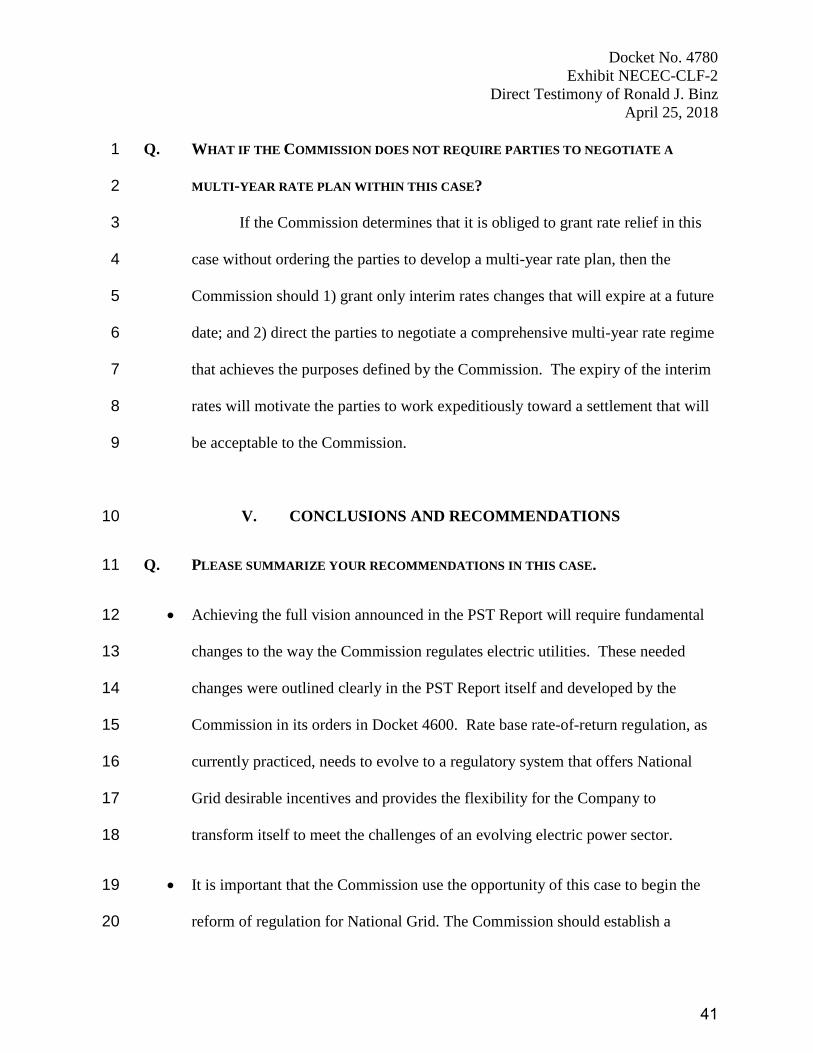
MULTI-YEAR RATE PLAN WITHIN THIS CASE? 2
If the Commission determines that it is obliged to grant rate relief in this 3
case without ordering the parties to develop a multi-year rate plan, then the 4
Commission should 1) grant only interim rates changes that will expire at a future 5
date; and 2) direct the parties to negotiate a comprehensive multi-year rate regime 6
that achieves the purposes defined by the Commission. The expiry of the interim 7
rates will motivate the parties to work expeditiously toward a settlement that will 8
be acceptable to the Commission. 9
V. CONCLUSIONS AND RECOMMENDATIONS 10
Q. PLEASE SUMMARIZE YOUR RECOMMENDATIONS IN THIS CASE. 11
• Achieving the full vision announced in the PST Report will require fundamental 12
changes to the way the Commission regulates electric utilities. These needed 13
changes were outlined clearly in the PST Report itself and developed by the 14
Commission in its orders in Docket 4600. Rate base rate-of-return regulation, as 15
currently practiced, needs to evolve to a regulatory system that offers National 16
Grid desirable incentives and provides the flexibility for the Company to 17
transform itself to meet the challenges of an evolving electric power sector. 18
• It is important that the Commission use the opportunity of this case to begin the 19
reform of regulation for National Grid. The Commission should establish a 20
41

Docket No. 4780 Exhibit NECEC-CLF-2
Direct Testimony of Ronald J. Binz April 25, 2018
process that will lead to performance-based “revenue-cap” regulation for National 1
Grid. A significant step toward this goal would be to approve a multi-year rate 2
plan for National Grid such as that recommended by the Division. Otherwise, the 3
combination of National Grid’s rate case filing and its PST filing will lock in 4
place a regulatory structure that is being reconsidered (or at least examined) in 5
many state regulatory jurisdictions. 6
• The proposal of National Grid to incorporate performance measures into its 7
regulation is a modest step in the right direction. Most of the PIMs proposed by 8
National Grid will be helpful, but their application can be improved. More 9
important, the PIMs should be incorporated into a more fundamental reform of 10
regulation, such as a revenue-cap regime or a multiyear plan framework as 11
recommended and outlined by the Division of Public Utilities and Carriers 12
(“DPUC”) in its testimony in Docket No. 4770.17 13
• My testimony contains specific recommendations about the structure of some of 14
the proposed PIMs, including the level of reward associated with performance on 15
each PIM. 16
• The Commission should not create a new “cost tracker” for PST-related costs. If 17
a multi-year rate plan is adopted, these costs will be included in the multi-year 18
revenue cap trajectory. If the Commission allows National Grid to proceed with a 19
17 See Attachment B, Direct Testimony of Tim Woolf On Behalf of The Division of Public Utilities and Carriers, Rhode Island Public Utilities Commission Docket No. 4770.
42

Docket No. 4780 Exhibit NECEC-CLF-2
Direct Testimony of Ronald J. Binz April 25, 2018
one-year rate plan, the Company should be required to file rate cases to reflect 1
increased PST-related costs. 2
• Finally, I recommend certain procedural steps the Commission should employ to 3
accelerate the move toward a more appropriate regulatory structure. The 4
Commission should either 1) require National Grid to negotiate a multi-year rate 5
plan in this case or 2) grant only interim rate relief, during which period the 6
parties are directed to negotiate a comprehensive revenue cap or multi-year rate 7
plan consistent with Commission directives. 8
Q. DOES THIS CONCLUDE YOUR TESTIMONY AT THIS TIME? 9
A. Yes. 10
43


Ronald J. Binz Public Policy Consulting
333 Eudora Street Denver, Colorado 80220
720-425-3335 • [email protected]
2011-present Principal, Public Policy Consulting Following my four-year term on the Colorado Public Utilities Commission, I resumed my consulting practice in energy policy and regulation. My focus is on climate, clean tech, regulatory reform, utility business models, integrated resource planning and smart grid. Current and recent clients include Millennium Challenge Corporation, National Renewable Energy Laboratory, Vote Solar, Hewlett Foundation, the U.S. Department of Energy, Climate Policy Intiative, Steffes Corporation, Posigen, Sunshare, LLC, Vivint Solar, Tendril Networks, Dow Solar, Lawrence Berkeley National Laboratory, Ceres, the Energy Regulatory Commission of Mexico, , Environmental Defense Fund, Earthjustice, Blue Planet Foundation, the Future of Privacy Forum, American Efficient, and Conservation Colorado, among others. International Engagements In recent years, I have had assignments in energy policy and regulation in several foreign countries, including Jordan, Malawi, Mexico, Nepal, Sierra Leone, and Tanzania. The activities include developing policy and regulatory roadmaps (Mexico, Nepal), reviewing and drafting legislation (Nepal, Tanzania), advising on electric market structure (Nepal, Malawi) hosting a technical conference (Mexico), designing regulatory agencies (Malawi, Sierra Leone, Nepal, Mexico), advising on natural gas regulation (Tanzania) and developing Smart Grid policy (Mexico). 2013 Nominee, Federal Energy Regulatory Commission I was nominated by President Obama on June 27, 2013 to serve on the Federal Energy Regulatory Commission and, upon confirmation, to be designated as Chairman. My nomination was vigorously opposed by the coal industry and certain conservative political groups. Following a confirmation hearing, it appeared unlikely that my nomination would be reported favorably by the Senate Energy and Natural Resources Committee. I therefore asked that my name be withdrawn from further consideration. 2011-2013 Senior Policy Advisor, Center for the New Energy Economy The Center for the New Energy Economy (CNEE) at Colorado State University is headed by former Colorado Governor Bill Ritter, Jr. The Center provides policy makers, governors,
Employment History
44
planners and other decision makers with a road map to accelerate the nationwide development of a New Energy Economy. 2007-2011 Chairman, Colorado Public Utilities Commission I was appointed by Governor Bill Ritter, Jr. in January 2007. As Chairman, I helped implement the Governor’s and Legislature’s vision of Colorado’s New Energy Economy, implementing the state’s 30% Renewable Energy Portfolio Standard, fulfilling the Commission’s role in the Governor’s Climate Action Plan, streamlining telecommunications regulation, promoting broadband telecommunications investment and improving the operation of the Commission. Here are some major accomplishments during my term on the Commission: - Implementing the Clean Air-Clean Jobs Act (2010). Following passage of this new law in
2010, the Commission worked under a very compressed time schedule to examine proposals by XcelEnergy and Black Hills Energy to reduce pollutants from their coal fired generation plants. The contentious Xcel proceeding involves thirty-four legal parties, testimony from sixty-one witnesses and the consideration of more than a dozen contending compliance plans. The case required the close cooperation between the Commission and the Colorado Department of Public Health and Environment, the first such collaboration.
- Implementing dozens of new energy, transportation and telecommunications laws. In each legislative session during the term of Governor Ritter, the general assembly passed numerous sweeping utility-related laws. Many of these new laws required the Commission to adopt rules, compile reports, or conduct hearings. Rarely in Colorado history has there been this much activity required of the Commission.
- Modifying and approving the electric resource plan of XcelEnergy (2009). After
extensive hearings, the Commission approved a plan that includes large amounts of new wind capacity, the early closure of two coal power plants to reduce carbon and other emissions, the acquisition of 200-600 megawatts of solar thermal capacity, and substantial amounts of new energy efficiency savings. The target portfolio would reduce CO2 emissions per megawatt-hour by 22% from current levels over eight years. The Commission decision required competitive acquisition for new resources.
- Adopting new, aggressive energy efficiency requirements (2008) for Colorado gas and electric utilities. The Commission’s requirements for electric utilities go well beyond the statutory minimum levels enacted in 2007. The Commission’s policies also provided for rapid cost recovery of energy efficiency spending and bonus incentives for superior performance for the utilities.
- Rewriting the Commission’s electric resource planning rules (2007) to require full
consideration of future costs for carbon emissions, new clean energy resources and environmental and economic externalities. Retained and refined the requirements for competitive acquisition of new resources.
- Improving communications with stakeholders. I successfully sought legislation to modify the Commission’s enabling statute, allowing the use of a “permit-but-disclose”
45

communications process like the one employed successfully by the Federal Communications Commission and the FERC. The result has been much greater exposure of the Commissioners and staff (outside the hearing process) to the thinking of consumers, utilities, environmental advocates, large customers, advocates for new technologies, etc.
- Organizing meetings of Western state regulators on regional transmission issues. We discussed coordination in our efforts to add transmission capacity, especially to renewable energy zones. In future meetings we will discuss a goal of eliminating “pancaked” transmission pricing in the intermountain west.
- Conducting hearings in eight towns around the state on a “road trip” to collect consumer
opinions about energy rates, distributed generation, the future of the energy sectors, and support for moving toward a more environmentally-sensitive utility industry.
- Reorganizing the PUC’s staff to create a Research and Emerging Issues section. As chairman, I worked to improve deployment of the agency’s modest staff so that the Commissioners could stay apprised of new technology and policy alternatives and be able to investigate and implement new regulatory approaches.
- Reaching out to consumers and interest groups. I frequently spoke at meetings of consumer organizations, environmental groups, business and professional associations, legal seminars, etc. The two-way-street communications improves my understanding and conveys to the public the immense challenges we face in energy policy with climate change.
1995-2006 President, Public Policy Consulting Consultant, specializing in energy and telecommunications regulatory policy issues. Assignments include strategic counsel to clients and research and testimony before regulatory and legislative bodies. In addition, I produced several research reports about the impact on rates of adding significant amounts of wind and solar capacity to utility systems. These reports are listed below. I had a wide range of clients, including: consumer advocate offices, rural electric utilities, senior citizen advocacy groups, environmental groups, industrial electric users, homebuilders, building managers, telecommunications resellers, incumbent local exchange companies, low-income advocacy organizations, and municipal utilities. I testified as an expert witness before regulatory commissions in twelve states. 1996-2003 President and Policy Director, Competition Policy Institute Competition Policy Institute was an independent non-profit organization that advocated for state and federal policies to bring competition to energy and telecommunications markets in ways that benefit consumers. Duties included: determining the organization’s policy position on a wide range of telecommunications and energy issues; conducted research, produced policy papers, presented testimony in regulatory and legislative forums, hosted educational symposia for state regulators and state legislators.
46

1984-1995 Director, Colorado Office of Consumer Counsel Director of Colorado's first state-funded utility consumer advocate office. By statute, the OCC represents residential, small business and agricultural utility consumers before state and federal regulatory agencies. The office was a party to more than two hundred legal cases before the Colorado Public Utilities Commission, the Federal Communications Commission, the Federal Energy Regulatory Commission and the courts. Managed a staff of eleven, including attorneys, economists, and rate analysts who conduct economic, financial and engineering research in public utility matters. Testified as an expert witness on subjects of utility rates and regulation. Negotiated rate settlement agreements with utility companies. Regularly testified before the Colorado general assembly and spoke to professional business and consumer organizations on utility rate matters. Consulted with advisory board of consumer leaders from around the state. Held leadership roles in National Association of State Utility Consumer Advocates. Member of high-level advisory boards to Federal Communications Commission (Network Reliability Council and North American Numbering Council) and Environmental Protection Agency (Acid Rain Advisory Council). Frequent witness before congressional committees and invited speaker before national industry and regulatory forums. 1977-1984 Consulting Utility Rate Analyst Represented clients in public utility rate cases and testified as an expert witness in utility cases before regulatory commissions in Utah, Wyoming, Colorado and South Dakota. Clients included state and local governments, low income advocacy groups, irrigation farmers and consumer groups. Testimony spanned topics of telephone rate design, electric cost-of-service studies, avoided cost valuation of nuclear generation, electric rate design for irrigation customers and municipal water rate design. 1975-1984 Instructor in Mathematics Taught mathematics at the University of Colorado, Denver and Boulder campuses. Nominated three times for outstanding part-time faculty member. 1971-1974 Manager, Blue Cross and Blue Shield Managed major medical claims processing department. Responsibilities included budgets, hiring, training, managing supervisors, and coordinating with medical peer review committee.
1994-2011 Managing Partner, Trail Ridge Winery Managing Partner and Secretary/Treasurer of Trail Ridge Winery. Trail Ridge Winery was
Other Business Interests
47

located in Loveland, Colorado, and produced a variety of award-winning wines from Colorado-grown grapes.
M.A. (Mathematics) 1977. University of Colorado. Course requirements met for Ph.D. Graduate courses toward M.A. in Economics 1981-1984. University of Colorado. Twenty-seven hours including Economics of Regulated Industries, Natural Resource Economics, Econometrics. B.A. with Honors (Philosophy) 1971. St. Louis University.
Professional Associations and Activities
Selected Current and Recent: Board of Directors, Nikola Power Board of Directors, Smart Electric Power Alliance (SEPA) Board of Directors, Southwest Energy Efficiency Project Board of Directors, Western Resource Advocates Board of Directors, GRID Alternatives Colorado Brookings Institution, Non-resident Senior Fellow, 2013-2014 Harvard Electric Policy Group, John F. Kennedy School, Harvard University 1994-present Advisory Council to the Board of the Electric Power Research Institute (EPRI) 2008-2011 Keystone Energy Board 2009-2012 Aspen Institute for Humanistic Studies, Communications and Society Programs 1986-present Selected Past: National Association of Regulatory Utility Commissioners Member, Energy Resources and Environment Committee 2007-2011 Member, International Relations Committee 2007-2011
Chair, NARUC Task Force on Climate Policy 2010-2011 President, Western Conference of Public Service Commissioners, 2010-2011
Education
48

Acid Rain Advisory Council to the Environmental Protection Agency, circa 1991 American Association for the Advancement of Science American Vintners Association (now WineAmerica), Executive Committee, Membership Chair Colorado Common Cause, Board Member Colorado Energy Assistance Foundation, Board Member, Past President Colorado Legislative Task Force on Information Policy, Gubernatorial Appointee 2000-2001 Colorado Public Interest Research Foundation, Board Member Colorado Telecommunications Working Group, Gubernatorial Appointee Colorado Wine Industry Development Board, Chairman Council on Economic Regulation, Past Fellow Denver Mayor's Council on Telecommunications Policy Exchange Carriers Standards Association Network Reliability Steering Committee Legislative Commission on Low-Income Energy Assistance, Past President National Association of State Utility Consumer Advocates
President 1991-1992, Vice-President 1990, Treasurer 1987-1989 Chair, Telecommunications Committee 1992-1995
Network Reliability Council to the Federal Communications Commission New Mexico State University Public Utilities Program, Faculty and Advisory Council North American Numbering Council to Federal Communications Commission, Co-Chair Outreach Committee, Western States Coordinating Council Regional Planning Committee Total Compensation Advisory Council to the State of Colorado Department of Personnel Who's Who in Denver Business
From 1977 to 2018, Mr. Binz participated in more than 150 regulatory proceedings before the Federal Communications Commission, the Federal Energy Regulatory Commission, State and Federal District Courts, the 8th Circuit, 10th Circuit and D.C. Circuit Courts of Appeal, the U.S. Supreme Court and state regulatory commissions in Arizona, California, Colorado, Georgia, Hawaii, Idaho, Massachusetts, Maine, Missouri, New York, North Dakota, South Dakota, Texas, Utah, and Wyoming. He has filed testimony in approximately sixty proceedings before these bodies. His testimony and comments have addressed a wide variety of technical and policy issues in telecommunications, electricity, natural gas and water regulation. Before the Public Utility Commission of Hawaii. In the Matter of the Application of HAWAIIAN ELECTRIC COMPANY, INC. For Approval of General Rate Case and Revised Rate Schedules and Rules. Docket No. 2016-0328. Topic: Proposal for Incentive Based Regulation. Before the Massachusetts Department of Public Utilities. Petition of NSTAR Electric Company
Selected Regulatory Testimony
49
and Western Massachusetts Electric Company each d/b/a Eversource Energy for Approval of an Increase in Base Distribution Rates for Electric Service Pursuant to G.L. c. 164, § 94 and 220 C.M.R. § 5.00. April 2017. Topic: Proposal for Incentive Based Regulation. Before the Public Utility Commission of Hawaii. In the Matter of the Application of HAWAIIAN ELECTRIC COMPANY, INC., HAWAI'I ELECTRIC LIGHT COMPANY, INC., MAUI ELECTRIC COMPANY, LIMITED, and NEXTERA ENERGY, INC., For Approval of the Proposed Change of Control and Related Matters. “Testimony of Ronald J. Binz.” January 2016. Topic: Conditions to be attached to merger approval. Before the Public Service Commission of New York. Proceeding on Motion of the Commission in Regard to Reforming the Energy Vision. Case 14-M-0101. “Statement of Ronald J. Binz on Behalf of Earthjustice In Reply to Parties’ Initial Comments on the Staff Straw Proposal” October 2014. Topic: Regulatory approach in the Commission’s REV proposal. Before the Public Service Utility Commission of Hawaii. Instituting an Investigation to Reexamine the Existing Decoupling Mechanisms for Hawaiian Electric Company, Inc., Hawaii Electric Light Company, Inc., and Maui Electric Company, Limited. Docket No. 2013-0141. “Declaration of Ronald J. Binz.” September 2014. Topic: Proposal for Incentive Regulation of HECO. Before the Public Utilities Commission of California. Order Instituting Rulemaking to Enhance the Role of Demand Response in Meeting the State’s Resource Planning Needs and Operational Requirements. Rulemaking 13-09-011. Comments and oral testimony of Ronald J. Binz before the Administrative Law Judge. August 2014. Before the Public Service Commission of Wyoming. In The Matter of Rocky Mountain Power’s Confidential Contract Filing Docket No. 20000-379-EK-10 of a Purchase Power Agreement between PacifiCorp and Pioneer Wind Park I. Binz Affidavit on behalf of Northern Laramie Range Alliance. Record No. 12618 (August 2011) Before the West Virginia Public Service Commission. In The Matter Of the Petition of Verizon West Virginia, Inc. To Cease Rate Regulation of Certain Workably Competitive Telecommunications Services. Case No. 06-0481-T-PacifiCorp (June 2006) Before the Utah Public Service Commission. In The Matter Of The Division’s Annual Review and Evaluation of Electric Lifeline Program, HELP Rate Design Testimony. Docket No. 04-035-21 (September 2005) Before the Colorado Public Utilities Commission. Testimony on behalf of YMCA of the Rockies. In re: YMCA of the Rockies, Complainant v. Xcel Energy (d/b/a Public Service Company of Colorado, Respondent. Rebuttal Testimony. Docket No. 05F-167G. (September 2005) Before the Colorado Public Utilities Commission. Testimony on behalf of YMCA of the Rockies. In re: YMCA of the Rockies, Complainant v. Xcel Energy (d/b/a Public Service Company of Colorado, Respondent. Direct Testimony. Docket No. 05F-167G. (June 2005)
50

Before the Michigan Public Service Commission. Testimony on behalf of the Michigan Attorney General. In The Matter Of SBC Michigan’s Request For Classification Of Business Local Exchange Service As Competitive Pursuant To Section 208 Of The Michigan Telecommunications Act. Case No. U-14323. (March 2005) Before the Colorado Public Utilities Commission. Testimony on behalf of the Colorado Office of Consumer Counsel. In the Matter of the Combined Application of Qwest Corporation for Reclassification and Deregulation of Certain Part 2 Products and Services and Deregulation of Certain Part 3 Products and Services. Docket No. 04A-411T. (February 2005) Before the Utah Public Service Commission. In The Matter Of the Application of PacifiCorp for Approval of Its Proposed Electric Rate Schedules and Electric Service Regulation. Rate Design Testimony. Docket No. 04-035-42. (January 2005) Before the Utah Public Service Commission. In The Matter Of the Application of PacifiCorp for Approval of Its Proposed Electric Rate Schedules and Electric Service Regulation. Revenue Requirements Testimony. Docket No. 04-035-42. (December 2004) Before the Colorado Public Utilities Commission. Testimony on behalf of the Building Owners and Managers Association of Metropolitan Denver (BOMA) in the Matter of The Investigation And Suspension Of Tariff Sheets Filed By Public Service Company Of Colorado With Advice Letter No. 1411—Electric Docket No. 04S-164E (October 2004) Before the Colorado Public Utilities Commission. Testimony on behalf of Colorado Energy Consumers in the Matter of The Application of Public Service Company of Colorado for Approval of its 2003 Least-Cost Resource Plan. Docket No. 04A-214E (filed: September 2004) Before the Colorado Public Utilities Commission. Testimony on behalf of Colorado Energy Consumers in the Matter of the Application of Public Service Company of Colorado For An Order Authorizing It To Implement A Purchased Capacity Cost Adjustment Rider In Its PUC No. 7 – Electric Tariff. Docket No. 03A-436E. (filed: March 2004) Before the Wyoming Public Service Commission. Testimony on behalf of Wyoming Industrial Energy Consumers (WIEC) and AARP In the Matter of the Application of PacifiCorp for Approval of a Power Cost Adjustment Mechanism. Docket No. 20000- ET-03-205 (filed: January 2004). Before the Colorado Public Utilities Commission. Testimony on behalf of the Colorado Office of Consumer Counsel Regarding The Unbundling Obligations Of Incumbent Local Exchange Carriers Pursuant To The Triennial Review Order – Initial Commission Review. Docket No. 03I-478T. (January 2004) Before the Wyoming Public Service Commission. Testimony on behalf of AARP in the matter of The Application Of PacifiCorp For A Retail Electric Utility Rate Increase Of $41.8 Million Per Year Docket No. 20000-ER-03-198 (January 2004).
51
Before the Wyoming Public Service Commission. Public hearings testimony on behalf of AARP in the matter of an application by Kinder Morgan to modify the provider selection process in its Choice Gas Program. (December 2003). Before the Public Service Commission of North Dakota. Testimony on behalf of AARP in the matter of In the Matter of the Notice of Montana-Dakota Utilities Co. for an Electric Rate Change. Case No. PU-399-03-296. (October 2003) Before the Colorado Public Utilities Commission. Testimony in the matter of Public Service Company of Colorado’s Advice Letter No. 598 – Natural Gas Extension Policy. Docket No. 02S-574G. (March 2003) Before the Colorado Public Utilities Commission. Testimony in the remand hearings in the formal complaint case of the Homebuilders Association of Metropolitan Denver against Public Service Company. Docket 01F-071G. (January 2003) Before the Wyoming Public Service Commission. Testimony on behalf of AARP in the matter of an application by PacifiCorp to increase rates, recover excess net power costs, and recover purchase power costs related to the Hunter Unit 1 outage. Docket No. 20000-ER-02-184. Testimony Concerning A Proposed General Rate Increase And Surcharge For Previous Power Costs. (November 2002). Before the Wyoming Public Service Commission. Testimony on behalf of AARP in the matter of an application by PacifiCorp to increase rates, recover excess net power costs, and recover purchase power costs related to the Hunter Unit 1 outage. Docket No. 20000-ER-02-184. Testimony Concerning Hunter Unit 1 Issues. (November 2002). Before the Colorado Public Utilities Commission. Comments on behalf of the Colorado Energy Assistance Foundation. Docket No. 02R-196G. In the Matter of the Proposed Repeal and Reenactment of the Rules Regulating Gas Utilities. (November 2002) Before the Colorado Public Utilities Commission. Testimony on behalf of Colorado Energy Assistance Foundation and Catholic Charities of the Archdiocese of Denver. Docket No. 02A-158E. In the Matter of the Application of Public Service Company of Colorado for an Order to Revise its Incentive Cost Adjustment. (April 2002) Before the Idaho Public Utilities Commission. Testimony on behalf of Astaris, in the matter of Case No. IPC-E-01-43 concerning the buy-back rates under an electric load reduction program. (January 2002) Before the Colorado Public Utilities Commission. Testimony in matter of the investigation of Advice Letters 579 and 581 of Xcel Energy on behalf of Homebuilders Association of Denver. Dockets 01S-365G and 01S-404G. (January 2002) Before the Colorado Public Utilities Commission. Testimony in the formal complaint case of the Homebuilders Association of Metropolitan Denver against Public Service Company. Docket 01F-071G. (August 2001)
52

Before the Colorado Public Utilities Commission. Testimony in the matter of the investigation and suspension of Advice Letter No. 566 of Xcel Energy on behalf of the Homebuilders Association of Metropolitan Denver. Docket No. 00S-422G. (November 2000) Before the American Arbitration Association. In the Matter of Univance Telecommunications, Inc. v. Venture Group Enterprises, Inc. Arbitration No. 77 Y 147 00099 00 (November 2000) Testimony of Ronald Binz at FCC Public Forum on SBC/Ameritech merger (May 1999) Docket No. 97-106-TC -- Testimony of Ron Binz before New Mexico State Corporation Commission on Investigation Concerning USWest's Compliance with Section 271(c) of the Telecommunications Act (July 1998) Before the Colorado Public Utilities Commission. Testimony Concerning the Investigation of Telephone Numbering Policies. (March 1998) Docket No. 6717-U Testimony before the Georgia Public Service Commission Concerning the Service Provider Selection Plan of Atlanta Gas Company. (January 1997) Case 96-C-0603 and Case 96-C-0599--Testimony of Ronald J. Binz on behalf of CPI before the New York State Public Service Commission concerning the Bell Atlantic/NYNEX Merger (November 1996) Docket No. 96-388 - Direct Testimony of Ronald J. Binz, CPI, On Behalf of the Office of the Public Advocate (October 1996) State of Maine, Public Utilities Commission Joint Petition of New England Telephone and Telegraph Company and NYNEX Corporation for Approval of the Proposed Merger of a Wholly-Owned Subsidiary of Bell Atlantic Corporation into NYNEX Corporation. Application No. 96-04-038 - Direct Testimony of Ronald J. Binz, CPI, On Behalf of Intervener, Utility Consumers Action Network (September 1996) Before the Public Utilities Commission of the State of California In the Matter of the Joint Application of Pacific Telesis Group (Telesis) and SBC Communications (SBC) for SBC to Control Pacific Bell (U 1001 C), Which Will Occur Indirectly as a Result of Telesis' Merger With a Wholly Owned Subsidiary of SBC, SBC Communications (NV) Inc. Presentation to Federal-State Joint Board on Universal Service (April 12, 1996) Testimony before the Texas Public Utility Commission on the Integrated Resource Planning Rule (March, 1996)
Mr. Binz has appeared sixteen times before U.S. House and Senate Committees. In addition, he
Congressional Testimony
53

has testified numerous times before state legislatures in several states. Here is a list of his U.S. Congressional testimony and statements: United States Senate Energy and Natural Resources Committee, 2013. Statement in support of my nomination to the Federal Energy Regulatory Commission. United States House of Representatives Commerce Committee, Energy Subcommittee, 2008. Testimony concerned a proposal to adopt a federal renewable energy standard. United States House of Representatives Judiciary Committee, November 1999. Testimony concerning H.R. 2533, The Fairness in Telecommunications License Transfer Act of 1999. United States Senate Judiciary Committee; Antritrust, Business Rights and Competition Subcommittee, April 1999. Testimony concerning S.467, The Antitrust Merger Review Act. United States Senate Commerce Committee, Telecommunications Subcommittee, May 1998. Testimony in oversight hearings concerning the performance of the Common Carrier Bureau of the Federal Communications Commission. United States Senate Judiciary Committee, Washington, D.C., September 1996. Presented testimony on behalf of the Competition Policy Institute on the competitive impact of proposed mergers of Regional Bell Operating Companies. United States House of Representatives Subcommittee on Telecommunications and Finance of the Committee on Commerce, May 1995. Testimony presenting NASUCA’s position on H.R. 1555 by Representative Fields. United States Senate Subcommittee on Antitrust, Washington, D.C., September 1994. Testimony presenting NASUCA's position on S. 1822 by Senator Hollings. United States House of Representatives Subcommittee on Telecommunications and Finance of the House Energy and Commerce Committee, Washington, D.C., February 1994. Presented testimony on H.R. 3636. United States House of Representatives Subcommittee on Economics and Commercial Law, Washington, D.C., October 1992. Supplemental testimony presenting NASUCA's position on legislation concerning the Modified Final Judgment introduced by Representative Brooks. United States House of Representatives Subcommittee on Telecommunications and Finance, Washington, D.C., October 1991. Testimony on RBOC entry into telecommunications manufacturing and information services. United States House of Representatives Subcommittee on Economics and Commercial Law, Washington, D.C., August 1991. Testimony presenting NASUCA's position on possible federal legislation concerning the Modified Final Judgment.
54

United States Senate Subcommittee on Energy Regulation and Conservation, Denver, Colorado, April 1991. Testimony presenting NASUCA's position on federal legislation concerning regulation of the natural gas industry, introduced by Senator Wirth. United States Senate Communications Subcommittee, Washington, D.C., February 1991. Testimony on behalf of NASUCA concerning S.173, telecommunications legislation introduced by Senator Ernest Hollings. United States Senate Communications Subcommittee, Washington, D.C., July 1990. Testimony on behalf of NASUCA concerning S.2800, telecommunications legislation introduced by Senator Conrad Burns. United States House of Representatives Subcommittee on Telecommunications and Finance, July 1988. Testimony on the FCC Price Cap proposal.
55

Reports and Articles
Title Publisher Date
Considerations for the Governance of a Western Regional System Operator
Public Policy Consulting
March 2016
Practicing Risk Aware Electricity Regulation: 2014 Update Ceres November 2014
Priorities after FERC Overture EnergyBiz Magazine Jan-Feb 2014
Risk-Aware Planning and a New Model for the Utility-Regulator Relationship ElectricityPolicy.com July 2012
Practicing Risk Aware Electricity Regulation: What Every State Regulator Needs to Know
Ceres April 2012
Conquering Consumer Resistance: Time to cross the bridge to time-of-use rates EnergyBiz Magazine March-April 2012
Cap and Innovate: An alternative approach to climate regulation. Public Utilities Fortnightly June 2010
Wind on the Public Service Company of Colorado System: Cost Comparison to Natural Gas
Interwest Energy Alliance (with Jane Pater) August 2006
The Impact of the Renewable Energy Standard in Amendment 37 on Electric Rates in Colorado
Public Policy Consulting September 2004
The Impact a Renewable Energy Portfolio Standard On Retail Electric Rates In Colorado
Public Policy Consulting February 2004
Qwest, Consumers and Long Distance Entry: A Discussion Paper Public Policy Consulting October 2001
Addressing Market Power: The next step in electric restructuring Competition Policy Institute June 1998
Navigating a Course to Competition: A consumer perspective on electric restructuring
Competition Policy Institute August 1997
56

Before the Rhode Island Public Utilities Commission
Proceeding on the Narragansett Electric ) Company d/b/a National Grid Proposed ) Docket No. 4770 Tariff Changes )
Direct Testimony of Tim Woolf
On Behalf of The Division of Public Utilities and Carriers
April 6, 2018
57

Table of Contents
1. INTRODUCTION AND QUALIFICATIONS ........................................................................ 1
2. OVERVIEW OF THE CASE ................................................................................................... 4
3. POLICY OBJECTIVES AND VISION ................................................................................. 10
4. REGULATORY REVIEW AND COST RECOVERY ......................................................... 19
5. MULTI-YEAR RATE PLANS ............................................................................................... 33
6. RATEMAKING RECOMMENDATION FOR THIS DOCKET IF THERE IS NO MULTI-YEAR RATE PLAN ............................................................................................................... 43
58
Direct Testimony of Tim Woolf Page 1
1. INTRODUCTION AND QUALIFICATIONS 1
Q. Please state your name, title, and employer. 2
A. Mr. Woolf: My name is Tim Woolf. I am the Vice President at Synapse Energy 3
Economics, located at 485 Massachusetts Avenue, Cambridge, MA 02139. 4
Q. Please describe Synapse Energy Economics. 5
A. Synapse Energy Economics is a research and consulting firm specializing in electricity 6
and gas industry regulation, planning, and analysis. Our work covers a range of issues, 7
including economic and technical assessments of demand-side and supply-side energy 8
resources; energy efficiency policies and programs; integrated resource planning; 9
electricity market modeling and assessment; renewable resource technologies and 10
policies; and climate change strategies. Synapse works for a wide range of clients, 11
including state attorneys general, offices of consumer advocates, trade associations, 12
public utility commissions, environmental advocates, the U.S. Environmental Protection 13
Agency, U.S. Department of Energy, U.S. Department of Justice, the Federal Trade 14
Commission, and the National Association of Regulatory Utility Commissioners. 15
Synapse has over 25 professional staff with extensive experience in the electricity 16
industry. 17
Q. Please summarize your professional and educational experience. 18
A. Mr. Woolf: Before joining Synapse Energy Economics, I was a commissioner at the 19
Massachusetts Department of Public Utilities (DPU) from 2007 through 2011. In that 20
capacity, I was responsible for overseeing a substantial expansion of clean energy 21
policies, including significantly increased ratepayer-funded energy efficiency programs; 22
59

Direct Testimony of Tim Woolf Page 2
an update of the DPU energy efficiency guidelines; the implementation of decoupled 1
rates for electric and gas companies; the promulgation of net metering regulations; review 2
and approval of smart grid pilot programs; and review and approval of long-term 3
contracts for renewable power. I was also responsible for overseeing a variety of other 4
dockets before the Commission, including several electric and gas utility rate cases. 5
Prior to being a commissioner at the Massachusetts DPU, I was employed as the Vice 6
President at Synapse Energy Economics; a Manager at Tellus Institute; the Research 7
Director at the Association for the Conservation of Energy; a Staff Economist at the 8
Massachusetts Department of Public Utilities; and a Policy Analyst at the Massachusetts 9
Executive Office of Energy Resources. 10
I hold a Masters in Business Administration from Boston University, a Diploma in 11
Economics from the London School of Economics, a BS in Mechanical Engineering and 12
a BA in English from Tufts University. My resume is attached as Exhibit TW/MW-1. 13
Q. Have you any additional professional experience that is directly relevant to this case 14
or your testimony in it? 15
A. Yes. In 2012 and 2013 I was one of the co-facilitators of the Massachusetts Grid 16
Modernization Collaborative sponsored by the Massachusetts Department of Public 17
Utilities. In 2016 and 2017 I was one of the co-facilitators of the New Hampshire Grid 18
Modernization Working Group sponsored by the New Hampshire Public Utilities 19
Commission. In addition, in 2017 I served as a consultant expert witness to Advanced 20
Energy Economy in its intervention in National Grid’s rate case before the New York 21
Public Service Commission. Finally, I am the author of several academic and policy 22
60

Direct Testimony of Tim Woolf Page 3
articles related to performance-based ratemaking. A list of my publications related to 1
power sector transformation is provided in my resume. 2
Q. On whose behalf are you testifying in this case? 3
A. I am testifying on behalf of the Division of Public Utilities and Carriers (the Division). 4
Q. Have you previously testified before the Rhode Island Public Utilities Commission? 5
A. Yes. I have testified before the Rhode Island Public Utilities Commission (the 6
Commission) on behalf of the Division in National Grid’s (the Company’s) Energy 7
Efficiency and System Reliability Plans. For the last decade I have represented the 8
Division in meetings with the Energy Efficiency Collaborative and have helped to 9
structure the energy efficiency and system reliability and procurement performance 10
incentive mechanisms. In addition, I participated on behalf of the Division in the Docket 11
4600 Working Group, and I assisted the Division with the Rhode Island Power Sector 12
Transformation report recently submitted to Governor Raimondo. I also recently testified 13
before the Commission on behalf of the Division in Docket 4783 on National Grid’s 14
proposed AMF pilot. 15
Q. What is the purpose of your testimony? 16
A. The purpose of my testimony is to present an overview of the Division’s case, to identify 17
policy objectives that shape a long-term vision for continuing the transformation of 18
Rhode Island’s power sector, and to outline a rate plan proposal that offers the Company 19
and ratepayers key protections during a period of rapid changes to the technologies and 20
services of the electric distribution utility. 21
61

Direct Testimony of Tim Woolf Page 4
2. OVERVIEW OF THE CASE 1
Q. Does the Division agree that the Company is entitled to the rate relief being 2
requested in this case? 3
A. No. The Division does not agree with the rate request made by the Company in this case, 4
even after its original request was lowered on March 2, 1018. 5
Q. Please provide a brief summary of how and why the Company’s request for rate 6
relief changed after the initial filing. 7
A. The Company’s original filing, prior to the change in the federal tax laws, requested a 8
total combined increase of approximately $71.6 million – $41.3 million for the electric 9
distribution business and $31 million for the gas distribution business. After the 10
corporate tax rate was reduced to 21%, the Company revised its revenue requirement to 11
reduce the combined total request by approximately $19.3 million. The Division, early 12
on in this case, also found an error made by the Company in the calculation of deferred 13
taxes of approximately $6.7 million. On March 2, the Company then filed with the 14
Commission a new revenue requirement reducing its request for a rate increase to take 15
into account the change in tax rate and the deferred tax error. As a result, the Company’s 16
revised request was reduced to approximately $45.6 million – $27.2 million for electric 17
and $18.4 million for the gas business. 18
Q. Does the Division agree that the Company is entitled to rate increases in the 19
amounts reflected in its adjusted request? 20
A. No. The Division has done a thorough review of the Company’s case, issuing hundreds 21
of data requests probing the justification put forth by the Company for its rate request. 22
62
Direct Testimony of Tim Woolf Page 5
To date, as reflected in the Division’s calculation of the revenue requirement for the rate 1
year, the Division believes the Company’s adjusted request should be substantially 2
reduced even further. Specifically, after making numerous adjustments, the Division is 3
recommending a reduction in the rate request, as reflected in its March 2 revenue 4
requirement, by a combined total of $34.5 million – lowering the request on the electric 5
side by approximately $18.5 million and the request on the gas side by approximately 6
$16 million. As a result, the Division believes the Company at this time should not be 7
allowed to increase its electric and gas distribution rates by more than $8.9 million for the 8
electric business and $2.4 million for the gas business – or by no more than combined 9
total of $11.3 million, representing a cut in the combined rate request of 75% from the 10
revised filing on March 2, 2018. 11
Q. What is the Company requesting for its allowed return on equity? 12
A. The Company is requesting a return on equity of 10.1% for both the electric and gas 13
businesses. 14
Q. Does the Division agree with this request? 15
A. No. The Division believes this request is excessive and, instead, recommends a return 16
on equity of 8.5% for the electric business and 9% for the gas business. The Division’s 17
calculation of the revenue requirement reflects these reduced returns. 18
Q. Please describe very briefly other matters and issues the Division is addressing in 19
this case, other than the revenue requirement. 20
A. In addition to addressing the request for a distribution rate increase, the Division believes 21
it is extremely important for the Commission in this rate case to take the first significant 22
63

Direct Testimony of Tim Woolf Page 6
steps to address the changing landscape of the electric distribution business. As I will 1
explain more fully in this testimony, there is a need to modernize the grid and make it 2
ready for significant change. The Company needs to be implementing new initiatives as 3
an integral part of its distribution business, not as stand-alone projects. For reasons I will 4
explain in depth, the Division is recommending that many of the initiatives being 5
proposed under the umbrella of “Power Sector Transformation” in Docket 4780 need to 6
be addressed in this overall rate case, including the means through which the Company 7
recovers its costs. For that reason, the Division is recommending the Commission take 8
important steps to align the electric business with the related ratemaking process for the 9
future by addressing some of the foundational matters in an integral way in this case and 10
establishing a roadmap for future planning at the same time. 11
Q. Please list some of the more significant ratemaking issues the Division is 12
recommending the Commission address. 13
A. There are many. Broadly speaking, however, these are some of the key points: 14
Establishing a ratemaking framework that utilizes multi-year rate plans as the 15
means for integral long-term planning, 16
Addressing the Company’s requests for cost recovery for its grid modernization 17
and Power Sector Transformation projects through base distribution rates, rather 18
than a fully reconciling rate mechanism such as the “PST Tracker” proposed by 19
the Company for its grid modernization and related activities, 20
64
Direct Testimony of Tim Woolf Page 7
Creating a capital efficiency mechanism that integrates capital planning under the 1
ISR with multi-year rate plans, including an incentive mechanism that encourages 2
cost control discipline, 3
Establishing a new set of performance-based incentive mechanisms (PIMs) that 4
send clear financial signals to the Company to accomplish targeted goals that 5
lower peak electricity usage, lower greenhouse gas emissions, stabilize costs, and 6
meet other important long-term objectives relating to the integration of distributed 7
energy resources, and 8
Recognizing the need to have PIMs established at the same time as the 9
Company’s return on equity is set in the rate case, and adjusting the Company’s 10
earnings sharing mechanism to take these related components into account to 11
encourage efficient business practices while at the same time protecting 12
ratepayers from excessive utility earnings. 13
Q. What are some of the initiatives the Division is recommending move forward now? 14
A. One of the most important initiatives is for the Company to move forward with a study 15
that provides the pathway leading to the potential deployment of Advanced Metering 16
Infrastructure (AMI). This should take place in conjunction with parallel activities taking 17
place in New York with the Company’s affiliate, and Rhode Island’s fair share of the 18
costs amortized and included in base distribution rates. In addition, the Division is 19
recommending the Company commence immediately the proposed enhancements to the 20
GIS system in conjunction with New York and the costs included in base distribution 21
rates. The Division also is recommending that the Company move forward with the 22
System Data Portal, and the adjusted costs included in base distribution rates. The 23
65
Direct Testimony of Tim Woolf Page 8
Division also believes it is critical that a directive be given to the Company to perform a 1
comprehensive Grid Modernization study and produce a plan that is filed with the 2
Commission around the same time that the AMI Study is produced and filed. The 3
Company also should commence the steps necessary to implement a new DSCADA 4
system, the costs of which would eventually be recovered in base distribution rates. 5
Finally, the Commission should direct the Company to file a multi-year rate plan no later 6
than early 2020, to set new rates three years after the rates from this rate case go into 7
effect. With these steps, the foundation for the future operation of the distribution 8
business, aligned with integrated planning and ratemaking, will be established. 9
For the reasons that will be described in my testimony, the Division believes the 10
negotiation of a multi-year rate plan in this case would be very desirable. However, even 11
if that cannot be achieved, there are important steps the Commission can take in this case, 12
and principles that can be established, that directionally set multi-year rate planning as an 13
important long-range planning and ratemaking tool for the future. 14
Q. Please identify the Division’s witnesses, and the matters each of them will address in 15
this rate case. 16
A. The Division’s case is comprised of ten witnesses on the following subjects: 17
(1) Overview and Policy Vision – Tim Woolf: This my testimony here, which presents a 18
policy vision for how this rate case fits into the ongoing transformation of the electric 19
power sector and how the structure of a multi-year rate plan, rather than the Company’s 20
proposed tracker mechanism, is best suited to protect Rhode Island ratepayers during a 21
period of technology change; 22
66

Direct Testimony of Tim Woolf Page 9
(2) Revenue Requirement – Michael Ballaban and David Effron: The Division’s 1
adjustments to the Company’s proposed revenue requirement for the rate year is provided 2
by Michael Ballaban and David Effron; 3
(3) Review of Gas Business Enablement – Tina Bennett: Ms. Bennett addresses the 4
Company’s transformative gas business initiative; 5
(4) Reviewing Foundational Electric Distribution Initiatives – Greg Booth: Mr. Greg 6
Booth’s testimony provides an evaluation of the foundational distribution initiatives that 7
need to be addressed in this rate case, that were also included in the Company’s original 8
PST filing that was transferred to Docket 4780; 9
(5) Return on Equity – Matt Kahal: The Division’s recommendation for a return on 10
equity for the Company’s electric and gas distribution businesses is addressed by Mr. 11
Matt Kahal; 12
(6) Benefit/Cost Ratios, PIMS, and Earnings Sharing – Tim Woolf and Melissa Whited: 13
I join in a panel with Melissa Whited to address the benefit cost analysis used for 14
evaluating new transformative projects. We also propose a series of new performance-15
based mechanisms that are designed to work in tandem with the Company’s return on 16
equity and earnings sharing mechanism; 17
(7) Depreciation – Roxie McCullar: The Company’s depreciation study is evaluated by 18
Ms. Roxie McCullar; 19
(8) Income Eligible Discount A-60 Rates – Roger Colton: The Division’s 20
recommendation for an enhanced low income discount is addressed by Mr. Roger Colton; 21
67

Direct Testimony of Tim Woolf Page 10
(9) Electric Rate Design – John Athas: The Company’s allocated cost of service study 1
and rate design for electric rates is evaluated by Mr. John Athas; and 2
(10) Gas Rate Design – Bruce Oliver: The Company’s allocated cost of service study 3
and rate design for gas rates is evaluated by Mr. Bruce Oliver. 4
3. POLICY OBJECTIVES AND VISION 5
Q. Please summarize what is under consideration in Docket 4770. 6
A. This docket, 4770, includes a proposal from Narragansett Electric Company for new rates 7
to recover costs for the operating and capital expenses related to their basic function as a 8
distribution company. In its filing, the Company seeks to enumerate and recover costs 9
related to its core function. 10
Q. Please describe how trends in the electric distribution industry affect issues under 11
consideration in this docket. 12
A. Since the Company’s last general rate case in 2012 there are at least two major trends that 13
have affected the functions of electric distribution utilities in all regions of the United 14
States: first, the decline in costs for a renewable energy resources, including distributed 15
photovoltaic, grid scale photovoltaic, onshore and offshore wind turbines and other 16
distributed energy resources; and second, the decline in cost and increase in capability of 17
a range of control technologies including sensors, communications, and software 18
applications to provide near-real time remote visibility and automated control of the 19
electric distribution system. 20
68

Direct Testimony of Tim Woolf Page 11
Q. How do these two trends relate to a distribution utility, such as Narragansett 1
Electric Company? 2
A. These technology developments have changed the expectations among regulators and 3
some customers of the kind of services the distribution utility may provide and the ways 4
in which it can provide value to ratepayers. In Rhode Island, as in states across the United 5
States, electric distribution utilities are now expected to integrate renewable energy 6
resources and use information from customers and the distribution system to maintain 7
reliability and manage system costs. That expectation is evidenced in Docket 4600 8
Stakeholder Report.1 In particular, the report from stakeholders as well as the Guidance 9
Document issued by the Commission identifies a series of attributes for the future electric 10
system. 11
Q. Please describe recent legislative developments in Rhode Island that provide 12
context for review of the Company’s proposals in Docket 4770 and other dockets. 13
A. As the Commission is well aware, over the past fifteen years, Rhode Island has enacted 14
energy policies that seek to increase fuel diversity, reduce costs, and promote clean 15
energy. These measures include the 2006 Least-Cost Procurement Statute, which required 16
the distribution utility to procure a range of cost-effective demand-side resources; the 17
Long-Term Contracting Standard for Renewable Energy and the Renewable Energy 18
Growth Program, which authorized the use of ratepayer funds to support and compensate 19
the distribution utility for procurement of renewable energy resources; and the 2014 20
1 Report of Stakeholders in Docket 4600 to Rhode Island Public Utilities Commission.
69

Direct Testimony of Tim Woolf Page 12
Resilient Rhode Island Act, which set economy-wide greenhouse gas emissions reduction 1
targets to guide policy and regulatory decision-making. 2
Q. Please describe recent regulatory developments in Rhode Island that provide a 3
context for review of the Company’s proposal. 4
A. Building upon the legislative mandate of R.I. Gen. Laws § 39-26.6, the Commission 5
convened stakeholders in Docket 4600 to inform an investigation into the changing 6
electric distribution system. Together, stakeholders submitted to this Commission a report 7
with goals to guide development of the future electric distribution system and the outlines 8
of a Framework to guide cost-benefit analyses. Together, these regulatory and legislative 9
changes represent over a decade of transformation of Rhode Island’s power sector, as 10
described in the November 2017 report Power Sector Transformation. 11
Q. How do these statutes and regulatory developments affect evaluation of the electric 12
distribution utility? 13
A. Taken as a whole, Rhode Island’s recent statutory changes present clear policy priorities: 14
least-cost procurement, greenhouse gas emissions reduction, incorporation of clean 15
energy, and resource diversification. Each of these priorities implicates a critical role for 16
the electric distribution grid — through the need to manage an increasingly flexible set of 17
demand resources; the need to electrify the thermal and transportation sectors; and the 18
need to integrate growing numbers of diverse distributed energy resources (DER). 19
70

Direct Testimony of Tim Woolf Page 13
Q. In what way does this industry, legislative and regulatory context shape the 1
Division’s testimony in this Docket? 2
A. The utility has looked to existing legislative and regulatory direction to identify functions 3
that are a part of the distribution utility’s core business and which, therefore, necessarily 4
fall within a review of the distribution utility’s application for revised rates in this docket. 5
This includes certain matters that are currently included in Docket 4780. In particular, the 6
Division will include testimony related to the Company’s rate of return that includes a 7
proposal for revenue derived from performance incentive mechanisms. It is not in the 8
interest of ratepayers to consider the underlying rate of return separately from a suite of 9
proposed performance incentive mechanisms. Similarly, the Division will present 10
testimony addressing the proposed advanced metering functionality study as it pertains to 11
metering which is a core distribution business. Finally, the Division will present 12
testimony related to a series of “grid modernization” proposals as they should not be 13
considered separately from the distribution utility’s core business. In contrast, there are 14
other matters which the Division recognizes as significant components of transformation 15
of Rhode Island’s power sector that can be addressed either in this case or in Docket 16
4780. 17
Q. What is Power Sector Transformation and what is the Division’s vision for how it 18
should play out in Rhode Island? 19
A. As the Commission is well aware, Power Sector Transformation (PST) refers to a 20
significant initiative to transform the electric distribution business that is regulated by the 21
Commission in Rhode Island. The policy initiative is comprehensively set forth in a 22
report to Governor Raimondo that has been posted through the Commission and 23
71

Direct Testimony of Tim Woolf Page 14
Division’s website. It is entitled, Rhode Island Power Sector Transformation - Phase 1
One Report to Governor Gina M. Raimondo - November 2017 (PST Report). Rather than 2
attaching the entire document to the testimony as an exhibit for a record that is already 3
swimming in paper and PDF files, this is the link to the report: 4
http://www.ripuc.org/utilityinfo/electric/PST%20Report_Nov_8.pdf 5
Instead of paraphrasing the reasons for Power Sector Transformation, we quote the first 6
paragraph of the Executive Summary here: 7
“The demands on Rhode Island’s electric distribution system are rapidly 8 evolving, driven by consumer choice, technological advancement and 9
transformative information. The state’s electric utility and regulatory framework 10 were developed in an era in which demand for electricity consistently increased, 11 technology changed incrementally, customers exerted little control over their 12 electricity demand, electricity flowed one-way from the utility to customers, and 13 the risks of climate change were unknown. Today, none of those factors is true: 14
demand for electricity has plateaued; many customers generate their own power; 15 electricity flows to and from customers; technologies are being introduced at 16 rapid pace; and the need to mitigate and adapt to climate change is real. In these 17 new circumstances, the traditional regulatory framework will not continue to 18 serve the public interest. It will continue to push consumer prices upward without 19
a corresponding increase in value for customers. This report presents 20
recommendations to transform the power sector for these new circumstances and 21 help control long term costs for consumers.”2 22
Q. What are the goals of Power Sector Transformation? 23
A. The Power Sector Transformation initiative is ambitious. Consistent with Docket 4600, it 24
has three overarching goals that are addressed in the PST Report: (1) control the long-25
2 PST Report, p. 7..
72

Direct Testimony of Tim Woolf Page 15
term costs of the electric system; (2) give customers more energy choices and 1
information; and (3) build a flexible grid to integrate more clean energy generation. 2
Q. What are the general categories of actions that are recommended for action to 3
accomplish the goals? 4
A. The general categories of actions are summarized on pages 9 through 12 of the PST 5
Report. They are (1) modernize the utility business model; (2) build a connected 6
distribution grid; (3) leverage distribution system information to increase system 7
efficiency; and (4) advance electrification that is beneficial to system efficiency and 8
greenhouse gas emission reductions. The PST Report also summarizes on those pages 9
numerous underlying actions. When reviewing the underlying actions, it is very clear 10
that they are relevant to this rate case. For example, modernizing the utility business 11
model includes such actions as creating multi-year rate plans, implementing 12
performance-based ratemaking mechanisms, and addressing the issues associated with 13
the tendency of utilities to favor rate base growth over other alternatives, among others. 14
These are matters appropriate for consideration in the rate case. Similarly, the goal of 15
building a connected distribution grid includes initiatives such as deploying advanced 16
meters and focusing on capabilities to avoid technological obsolescence. The goal of 17
leveraging distribution system information to increase efficiency also identifies the need 18
to better align and integrate all the disjointed planning and cost recovery processes. This 19
cannot be accomplished very effectively outside of the rate case. Finally, there are actions 20
needed to address rate design, an area of ratemaking which occurs almost exclusively 21
through rate cases. 22
73

Direct Testimony of Tim Woolf Page 16
Q. Is there an overarching principle implicit in advancing PST that is important to the 1
Division? 2
A. Yes. In order for the utility business model to be truly transformed, new ways of 3
managing and operating the distribution business as contemplated under Power Sector 4
Transformation must become embedded within the business. PST should not be 5
addressed, managed, and planned as if it is a special activity arising outside of the 6
overarching management of the electric distribution system. It needs to be fully 7
integrated into the core of the distribution business. 8
Q. What is the timeframe contemplated for accomplishing all of the PST goals? 9
A. The PST Report recognizes the degree of its own ambition when it states on page 12: 10
“Transforming the power sector will not occur overnight.” It is important to recognize 11
because we are only at the beginning of a transformational process. It likely will take 12
between three to six years to complete the transformation. But it will take even longer if 13
we do not start in this rate case. It also could become problematic if the only means for 14
the Company recovering the costs of the PST initiatives is a regulatory default to cost 15
trackers. For reasons we will explain further, the Division believes it is extremely 16
important that most, if not all, of the costs of the PST initiatives be recovered through 17
base distribution rates as the initiatives unfold. Moreover, integration of grid 18
modernization into the everyday business of the distribution utility will be slow in 19
coming if it is not addressed in an integrated manner from a ratemaking perspective. This 20
rate case is the critical first step in accomplishing the mission in a timely manner. 21
74
Direct Testimony of Tim Woolf Page 17
Q. Didn’t the Commission separate the Power Sector Transformation initiatives from 1
the rate case by establishing a companion Docket 4780? 2
A. Procedurally, there was a split. However, it has always been recognized that there is an 3
unavoidable overlap between what is taking place to address the going-forward costs of 4
the distribution business in the rate case with many of the initiatives that were proposed 5
by the Company in its initial PST proposal which actually was filed with its general rate 6
case. Even the Company recognized this in its response to Division Data Request 34-3, 7
stating: 8
“As a fundamental concept, Power Sector Transformation is arising as a focal 9 point because of the need to make investments in the distribution system to meet 10 changing requirements for electric service. Therefore, Power Sector 11 Transformation is not an initiative that is unconnected to the provision of electric 12 distribution service. Certain initiatives identified within Power Sector 13
Transformation as necessary to enable modernization will directly, inevitably, 14 and purposely be important to the provision of electric service over the next three 15
years and beyond.” 16
In fact, all the data requests and responses also have been filed in Docket 4780 have been 17
filed in Docket 4770 as well. While it is appropriate for stakeholder engagement to 18
continue in order to address the long-term vision of Power Sector Transformation, it is 19
nevertheless essential to address some of the foundational initiatives in this rate case that 20
will set base distribution rates for the Company to recover its costs of doing business for 21
the rate year that spans from September 2018 through August 2019. While the single rate 22
year establishes base rates for the distribution business using only a single year of 23
projected costs, those rates will remain unchanged until the filing of the next rate case. 24
For that reason, foundational PST planning should be integrated with and into the 25
75
Direct Testimony of Tim Woolf Page 18
revenue requirement of the rate case in order to open the pathway to achieve the long-1
term goals of Power Sector Transformation that were detailed in the PST Report. 2
Q. Which features of the Power Sector Transformation program reflected in the PST 3
Report does the Division believe will be important to address in this rate case? 4
A. There are at least four. They relate to performance-based incentives (PIMs), multi-year 5
rate plans, certain foundational initiatives that need to commence now, and the AMI 6
study needed to fully evaluate an AMI deployment. 7
Q. What does the Division see as important about the PIMs? 8
A. The Division believes performance-based incentive mechanisms should be a part of the 9
outcome of this case. In order to transform the utility business model, more of the 10
Company’s profit potential should be put at risk and reward. To do this effectively, 11
earnings sharing and other parameters should be established around the allowed return 12
when the return on equity is being set in the rate case. The Division is proposing not only 13
a new set of PIMs, but also an earnings-sharing mechanism that takes into account the 14
financial rewards arising out of other pre-existing incentives such as the energy efficiency 15
program. A more detailed description of the Division’s proposal and reasoning is 16
provided in the panel testimony sponsored by Melissa Whited and me elsewhere. 17
Q. What about multi-year rate plans? 18
The Division believes it is desirable for a multi-year rate plan to be negotiated for 19
approval in this rate case. But even if one is not forthcoming, the Commission’s order 20
should set the stage for the next rate case filing to be a multi-year plan. I will provide a 21
deeper explanation of this in Section 5 of the testimony. 22
76

Direct Testimony of Tim Woolf Page 19
Q. What about the specific initiatives? 1
There are a number of the initiatives set forth in the Company’s PST filing that the 2
Division strongly believes should commence during the rate year and the costs included 3
in the rate year revenue requirement in this case or in subsequent years of a multi-year 4
plan. The most prominent initiatives relate to implementing the foundational GIS 5
Enhancements during the rate year, expanding the System Data Portal project beyond the 6
funding provided under the SRP, and commencing the DSCADA project sooner rather 7
than later. We also will address this further in Section 5 of the testimony. 8
Q. What is the Division proposing regarding AMI? 9
Regarding AMI, the Division strongly believes the Commission should direct the 10
Company to commence the AMI study as soon as possible and Rhode Island’s fair share 11
of the cost be included in the rate year revenue requirement as determined by Division 12
witness Michael Ballaban. This too will be addressed in Section 5 of the testimony. 13
4. REGULATORY REVIEW AND COST RECOVERY 14
Q. Which proposals pending before the Commission in Docket 4780 are relevant to the 15
rate case and recovery of the costs of the distribution business? 16
A. For reasons that we will explain, many of the proposals contained in the Company’s 17
original PST filing relate to the distribution business in a very fundamental and 18
foundational way. As we already have mentioned, the Company also included a cost 19
recovery mechanism that absolutely should be addressed in the context of this rate case. 20
Further, the Division believes that some of the initiatives described by the Company as 21
PST are not even properly categorized as Grid Modernization and should be a part of the 22
77

Direct Testimony of Tim Woolf Page 20
distribution business that is reviewed in the context of the rate case on an integrated basis 1
and the costs included in base distribution rates. In addition, the Division believes that 2
the core Grid Modernization initiatives should become a part of the rate case review 3
going forward. Unless the Commission addresses these issues in this docket, the 4
opportunity would be lost to establish the right planning and cost recovery rules to 5
effectively advance and change the way the distribution company conducts its business to 6
take into account the fast-changing world of the electric utility industry and effectively 7
meet the ambitious goals of Power Sector Transformation. 8
Q. Please summarize what the Company is asking the Commission to approve in 9
Docket 4780, with regard to its power sector transformation initiatives. 10
A. In Docket 4780, the Company is asking the Commission to approve the following:3 11
Approval of its proposed Power Sector Transformation Provisions. This includes 12
(a) the methodology for calculating PST Factors and Reconciliation Factors; 13
(b) the methodology for recovering PST performance incentives; and (c) the 14
process for submitting annual PST Plans for review and approval by the 15
Commission. 16
Approval of $2 million for incremental costs for AMF design work in FY2019, 17
Approval of a GIS Data Enhancement Project under a multi-jurisdictional 18
scenario in light of the New York PSC’s recent approval of the Company’s 19
affiliate’s new rate plan in New York.4 20
3 Direct testimony of the National Grid Power Sector Transformation Panel, RIPUC Docket No. 4780, pp. 3-4. 4 See the response to Division Data Request 32-23 in this Docket 4770.
78

Direct Testimony of Tim Woolf Page 21
Approval of new PST performance incentive mechanisms. 1
Findings regarding whether each proposed category of PST Plan investment is 2
consistent with Rhode Island law, the Commission’s Docket 4600 Guidance 3
Document, and state regulatory policy, and whether such investments are 4
appropriate for reimbursement as part of Power Sector Transformation. 5
Findings regarding whether the proposed Power Sector Transformation incentive 6
mechanism is consistent with Rhode Island law, the Commission’s Docket 4600 7
Guidance Document, and state regulatory policy 8
Q. Please describe the changes that National Grid is recommending to the regulatory 9
framework as it relates to the power sector transformation proposals. 10
A. National Grid is proposing that the Commission treat new PST-related investments 11
differently from traditional, i.e., conventional, distribution system investments. The 12
Company originally proposed the PST program in this docket. The Commission then 13
asked the Company to refile in a separate docket 4780. But regardless of the procedural 14
technicalities, the Company’s proposal separates important distribution business activities 15
from the rest of its integrated utility operations, moving away from an integrated long-16
term approach to running the distribution business to a stream of separate and siloed 17
activities, the costs of which are recovered through a largely riskless rate recovery 18
mechanism. 19
Q. How would cost recovery be altered by the Company’s PST proposal? 20
Each rate case would set base distribution rates using a future, one-year test year, and 21
those base rates would remain in place until the Company decides to file a new rate case. 22
79

Direct Testimony of Tim Woolf Page 22
In addition, the Infrastructure, Safety, and Reliability (ISR) process would continue to be 1
used to recover the costs of relevant, conventional capital investments. The Company 2
would file an ISR Plan each year for review and approval by the Commission for the next 3
year’s investments. 4
PST investments which may or may not be eligible for review under the ISR 5
would be addressed on a multi-year basis with annual cost recovery filings.5 The 6
Company would file with the Commission an annual PST Plan that includes several 7
years’ worth of investments to reflect longer-term PST planning priorities, separately 8
from the rest of its distribution business. The Commission would approve (a) the overall 9
category of PST investments; (b) the proposed multi-year PST initiatives within each 10
category; and (c) the actual PST investments for the forthcoming year for each of those 11
initiatives. 12
PST investments would also be subject to a different cost recovery mechanism 13
than applies to the base distribution business. National Grid proposes to establish a set of 14
PST Factors to recover the forecasted capital costs and operations and maintenance 15
(O&M) expenses for the forthcoming PST Plan Year. The Company would also establish 16
a set of PST Reconciliation Factors to recover or credit any under- or over-recovery of 17
the actual PST investments relative to the planned PST investments.6 For purposes of the 18
testimony, we refer to this mechanism as the proposed “PST Tracker.” 19
During the annual review under the PST Tracker, the Commission would review 20
historical PST investments to make sure the costs actually incurred were reasonable and 21
5 Direct testimony of the PST Panel, p. 11, line 29. 6 Schedule PST-1, Chapter 10, p. 186.
80
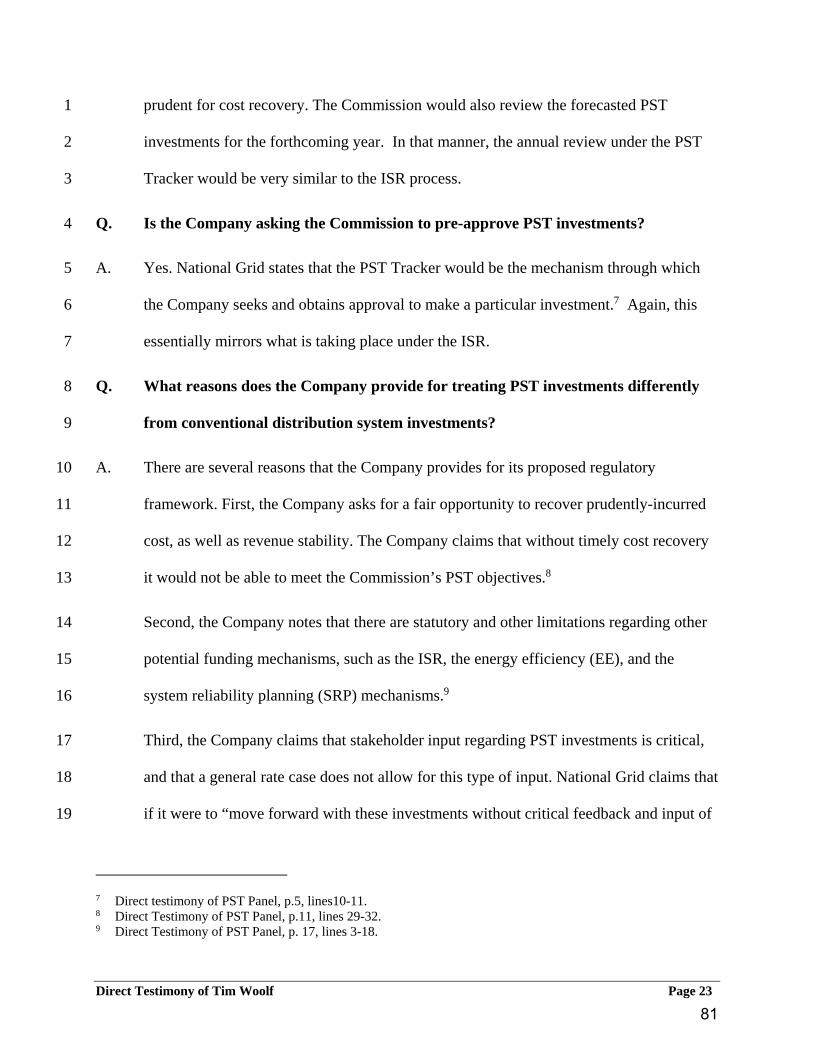
Direct Testimony of Tim Woolf Page 23
prudent for cost recovery. The Commission would also review the forecasted PST 1
investments for the forthcoming year. In that manner, the annual review under the PST 2
Tracker would be very similar to the ISR process. 3
Q. Is the Company asking the Commission to pre-approve PST investments? 4
A. Yes. National Grid states that the PST Tracker would be the mechanism through which 5
the Company seeks and obtains approval to make a particular investment.7 Again, this 6
essentially mirrors what is taking place under the ISR. 7
Q. What reasons does the Company provide for treating PST investments differently 8
from conventional distribution system investments? 9
A. There are several reasons that the Company provides for its proposed regulatory 10
framework. First, the Company asks for a fair opportunity to recover prudently-incurred 11
cost, as well as revenue stability. The Company claims that without timely cost recovery 12
it would not be able to meet the Commission’s PST objectives.8 13
Second, the Company notes that there are statutory and other limitations regarding other 14
potential funding mechanisms, such as the ISR, the energy efficiency (EE), and the 15
system reliability planning (SRP) mechanisms.9 16
Third, the Company claims that stakeholder input regarding PST investments is critical, 17
and that a general rate case does not allow for this type of input. National Grid claims that 18
if it were to “move forward with these investments without critical feedback and input of 19
7 Direct testimony of PST Panel, p.5, lines10-11. 8 Direct Testimony of PST Panel, p.11, lines 29-32. 9 Direct Testimony of PST Panel, p. 17, lines 3-18.
81
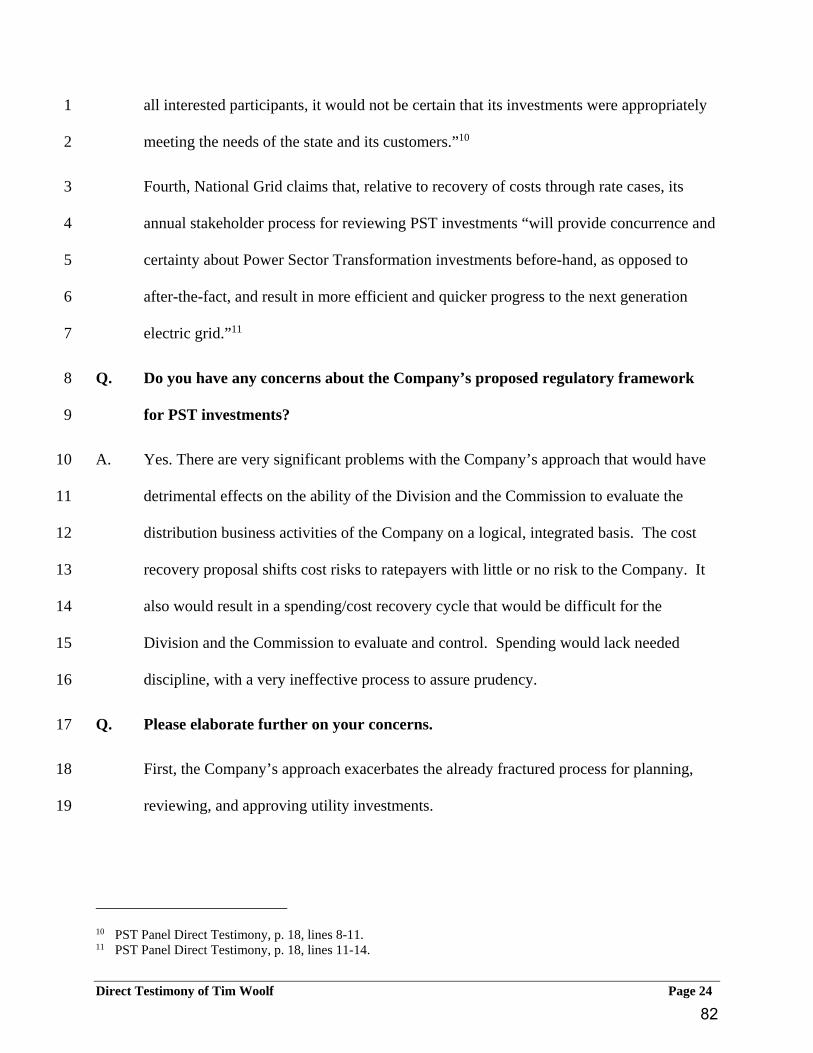
Direct Testimony of Tim Woolf Page 24
all interested participants, it would not be certain that its investments were appropriately 1
meeting the needs of the state and its customers.”10 2
Fourth, National Grid claims that, relative to recovery of costs through rate cases, its 3
annual stakeholder process for reviewing PST investments “will provide concurrence and 4
certainty about Power Sector Transformation investments before-hand, as opposed to 5
after-the-fact, and result in more efficient and quicker progress to the next generation 6
electric grid.”11 7
Q. Do you have any concerns about the Company’s proposed regulatory framework 8
for PST investments? 9
A. Yes. There are very significant problems with the Company’s approach that would have 10
detrimental effects on the ability of the Division and the Commission to evaluate the 11
distribution business activities of the Company on a logical, integrated basis. The cost 12
recovery proposal shifts cost risks to ratepayers with little or no risk to the Company. It 13
also would result in a spending/cost recovery cycle that would be difficult for the 14
Division and the Commission to evaluate and control. Spending would lack needed 15
discipline, with a very ineffective process to assure prudency. 16
Q. Please elaborate further on your concerns. 17
First, the Company’s approach exacerbates the already fractured process for planning, 18
reviewing, and approving utility investments. 19
10 PST Panel Direct Testimony, p. 18, lines 8-11. 11 PST Panel Direct Testimony, p. 18, lines 11-14.
82
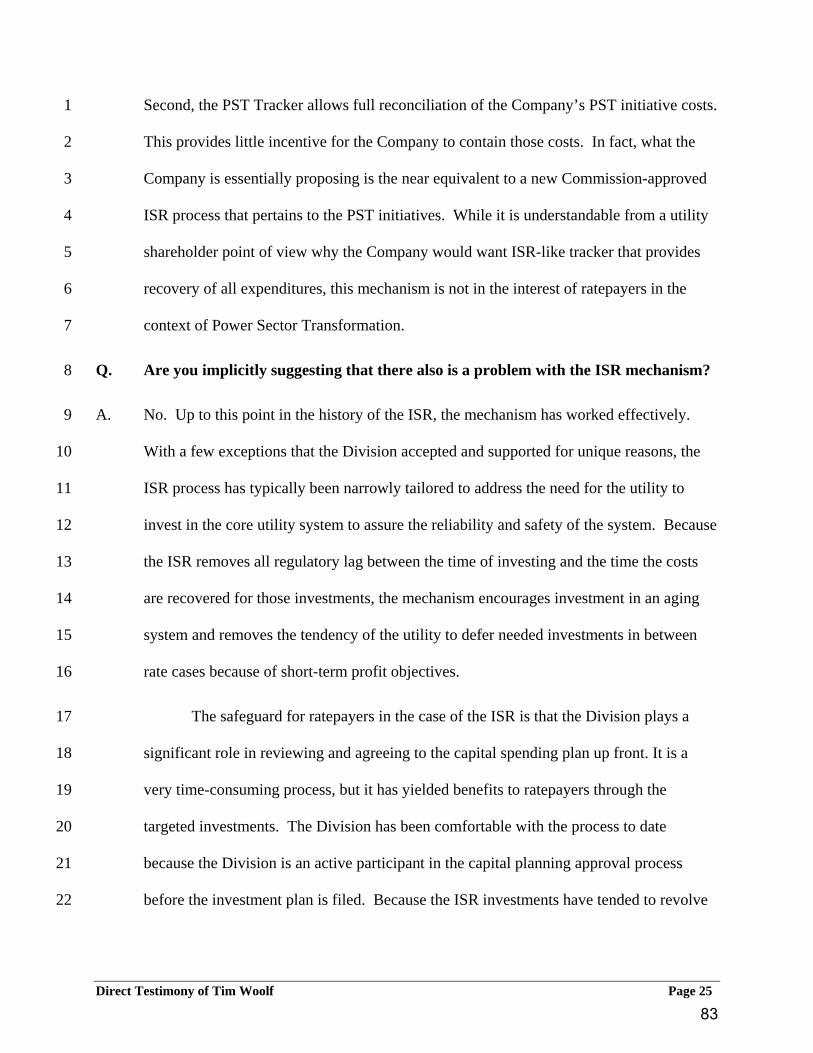
Direct Testimony of Tim Woolf Page 25
Second, the PST Tracker allows full reconciliation of the Company’s PST initiative costs. 1
This provides little incentive for the Company to contain those costs. In fact, what the 2
Company is essentially proposing is the near equivalent to a new Commission-approved 3
ISR process that pertains to the PST initiatives. While it is understandable from a utility 4
shareholder point of view why the Company would want ISR-like tracker that provides 5
recovery of all expenditures, this mechanism is not in the interest of ratepayers in the 6
context of Power Sector Transformation. 7
Q. Are you implicitly suggesting that there also is a problem with the ISR mechanism? 8
A. No. Up to this point in the history of the ISR, the mechanism has worked effectively. 9
With a few exceptions that the Division accepted and supported for unique reasons, the 10
ISR process has typically been narrowly tailored to address the need for the utility to 11
invest in the core utility system to assure the reliability and safety of the system. Because 12
the ISR removes all regulatory lag between the time of investing and the time the costs 13
are recovered for those investments, the mechanism encourages investment in an aging 14
system and removes the tendency of the utility to defer needed investments in between 15
rate cases because of short-term profit objectives. 16
The safeguard for ratepayers in the case of the ISR is that the Division plays a 17
significant role in reviewing and agreeing to the capital spending plan up front. It is a 18
very time-consuming process, but it has yielded benefits to ratepayers through the 19
targeted investments. The Division has been comfortable with the process to date 20
because the Division is an active participant in the capital planning approval process 21
before the investment plan is filed. Because the ISR investments have tended to revolve 22
83

Direct Testimony of Tim Woolf Page 26
around asset management of the traditional components of the distribution system, the 1
program has been manageable and workable. 2
Q. Given recent success with the ISR, what is the problem with creating a similar 3
mechanism through the PST Tracker? 4
Having acknowledged recent success of the ISR, however, it is still very important to 5
point out that there are limits. To the extent the scope of a fully reconciling cost recovery 6
mechanism expands to more and more business activities, the benefits begin to be 7
outweighed by the detriments. First and foremost, a process that allows recovery of 8
controllable costs through a tracker causes a shift of thinking in the utility. We believe it 9
can cause the utility to pay much less attention to cost control, to the detriment of 10
ratepayers who are ultimately paying for the whole program. The risks to the utility’s 11
shareholders are substantially reduced. As a consequence, the utility may develop the 12
tendency to make investments even when there may be other alternatives because the risk 13
of cost recovery being denied are minimal and the process allows a smooth path to 14
growth in the rate base, an outcome which is not always in the ratepayers’ best interest. 15
Q. Isn’t there a safeguard built into the process that allows after-the-fact review of the 16
project expenditures? 17
A. Theoretically, yes. But the reality is that the utility is in the driver’s seat. In Rhode 18
Island, the Division is simply not staffed or funded to do a deep dive review of every 19
project to assure that all the ratepayer dollars were prudently spent. For that reason, only 20
in cases where the negligent management of a project is readily apparent does the after-21
the-fact review provide a practical means of recourse. When the scope of the projects is 22
narrow and straightforward, like the typical projects that are reviewed in the ISR, the 23
84

Direct Testimony of Tim Woolf Page 27
process is manageable. But once the scope expands to projects that are highly complex, 1
with very sophisticated IT and other systems involved, the protections to ratepayers 2
become more theoretical than real. Trying to perform a post hoc review of project 3
management and expenditure planning on complex systems projects is extremely 4
challenging, especially for a jurisdiction like Rhode Island where personnel resources are 5
constrained. 6
Q. Are you suggesting the Commission try to alter the ISR? 7
A. No. The ISR is a statutory mechanism. Because it is statutory, it limits the 8
Commission’s authority to alter it. The Division still believes that the ISR continues to 9
provide benefits in a process that has worked effectively. We are only using the ISR as 10
an example to illustrate the risks to ratepayers if a similar mechanism is adopted for parts 11
of the distribution business that do not fall neatly into the eligibility categories for the 12
ISR. That is one of the core problems with the Company’s PST Tracker proposal. 13
Q. In light of the problems you have identified with the PST planning and PST 14
Tracker, what is the Division proposing in its place? 15
A. The Division believes it is inappropriate and detrimental to ratepayers for most of the 16
initiatives set forth in the Company’s PST proposal to be reviewed and addressed outside 17
of a rate case. We will elaborate further in the testimony on this point when we discuss 18
the need for multi-year rate plans, through which a comprehensive, integrated multi-year 19
business plan can be fully evaluated. Further, as explained in the testimony of Division 20
witness Greg Booth, the Company has chosen how to define activities that are grid 21
modernization for inclusion in its proposed PST cost tracker. In that context, the 22
Company has defined it too broadly. Specifically, there are at least two significant 23
85

Direct Testimony of Tim Woolf Page 28
initiatives that are not Grid Modernization at all. They are initiatives that the Company 1
should be undertaking as a regular part of its distribution business. 2
Q. Is there other information that supports the premise that cost recovery for 3
initiatives that modernize the grid should occur through base rates? 4
A. Yes. The practices of National Grid across jurisdictions is a good example. In Division 5
Data Request 24-12, the Division asked the Company the following data request: 6
“Has any of National Grid’s electric distribution affiliates in Massachusetts and 7 New York undertaken or completed any significant initiatives or projects over the 8
last five years to modernize the distribution system (other than the Worcester 9 pilot and Clifton Park demonstration projects)? If so, please identify and describe 10 the initiatives or projects undertaken over that period.” 11
In response, the Company identified numerous projects. After seeing the list, the 12
Division asked a follow-up data request as follows in Division 32-53: 13
“Referring to the response to DIV 24-12, for each of the initiatives identified in 14 the response, please indicate whether there were any special rate recovery 15
mechanisms (outside of base distribution rates) used to recover the costs of the 16 initiative, describe how the special rate recovery mechanism operates, and 17
indicate whether it is a fully reconciling tracker similar to the one proposed in 18 Docket 4780 that allows recovery of O&M and capital costs whether the they 19 exceed original estimates or not.” 20
Q. Did the Company’s answer reveal anything important? 21
A. Yes. Of the 20 initiatives identified, only 2 projects actually had costs recovered from a 22
two-way tracker. One was a demand response initiative, the costs of which apparently 23
flow through an applicable energy efficiency program tracker. The only other related to 24
utility-owned solar projects in Massachusetts. No other projects operated like the PST 25
86

Direct Testimony of Tim Woolf Page 29
Tracker proposed in Rhode Island. The response identifies only 4 other projects where 1
costs are tracked. But these projects arose in the context of the New York REV 2
proceeding, which deferred cost recovery and capped total expenditures at $44 million 3
for a selection of REV activities. It appears that the Company’s affiliate has the right to 4
file a petition to request higher recovery if the utility exceeds the budget, but it is not 5
guaranteed. All of the 14 remaining projects on the list were not recovered through a 6
tracker at all, with 11 of those projects specifically recovered through base distribution 7
rates. 8
Q. Do any of the projects being recovered through base distribution rates address 9
activities similar to what the Company proposed in Docket 4780? 10
A. Yes. The System Data Portal project, an Advanced Data Analytics project, a Hosting 11
Capacity Analysis relating to distributed generation interconnections, a Remote Terminal 12
Unit (RTU) project, a Data Management System (DMS) pilot project, an energy storage 13
demonstration project, automating field devices, installing feeder monitoring sensors, and 14
implementing some telecommunications upgrades relating to reclosers on the distribution 15
system. 16
Q. Does the Company explain why inclusion of these projects in base distribution rates 17
was possible? 18
A. Yes. The Company points out that there was a three-year multi-year rate plan, stating: 19
“Note that base distribution rates for Niagara Mohawk Power Corporation (NMPC), the 20
Company’s affiliate in upstate New York, are based on a three-year forward looking rate 21
case, so proposed revenue requirements are approved in addition to historic additions to 22
rate base, O&M costs are adjusted to include known and measurable impacts to the test 23
87

Direct Testimony of Tim Woolf Page 30
year O&M.” Ironically, this is the type of ratemaking the Division is advocating in this 1
rate case for addressing the recovery of costs in the future over several years, rather than 2
setting rates for one year at a time or adopting the fully reconciling PST Tracker 3
proposed by the Company in Docket 4780. 4
Q. Which initiatives has Mr. Booth identified as ones that should be undertaken by the 5
Company as a part of its traditional distribution business? 6
A. As Mr. Booth explains, the GIS Enhancements and the DSCADA program, each of 7
which is discussed in Chapter 3 of PST-1 that was originally filed in this docket, are 8
initiatives that the Company should be implementing as a part of its prudent operation of 9
the distribution business. For that reason, the Division proposes the Company move 10
forward immediately with the GIS Enhancements and begin to take steps for DSCADA 11
implementation. Division witness Michael Ballaban will address the Division’s proposal 12
on how the costs of the GIS Enhancements should be reflected in the revenue 13
requirement for the rate year. It is not clear whether the DSCADA program is ready for 14
advancement in the rate year, but the Division believes the Company should be 15
undertaking the project without delay by no later than calendar year 2020. The Company 16
should then seek recovery of the costs of the DSCADA by filing for rate relief through 17
the rate case process, but the Division does not believe it is appropriate to establish a 18
special cost tracker for the cost recovery outside of a rate case. 19
Q. What about the Company’s proposal for the System Data Portal? 20
A. The Division supports the implementation of the System Data Portal project. The project 21
has already been partially funded through the SRP. But the Company has not proposed to 22
move forward more completely yet. Like its other PST projects, the Company proposes 23
88
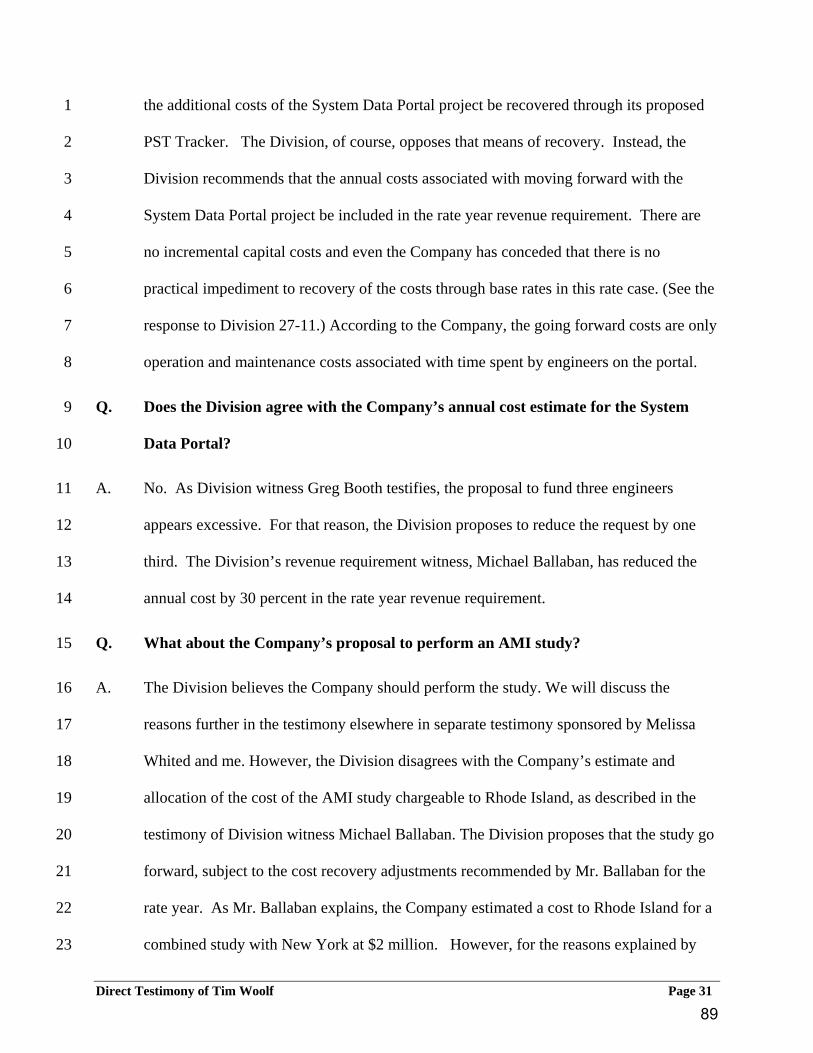
Direct Testimony of Tim Woolf Page 31
the additional costs of the System Data Portal project be recovered through its proposed 1
PST Tracker. The Division, of course, opposes that means of recovery. Instead, the 2
Division recommends that the annual costs associated with moving forward with the 3
System Data Portal project be included in the rate year revenue requirement. There are 4
no incremental capital costs and even the Company has conceded that there is no 5
practical impediment to recovery of the costs through base rates in this rate case. (See the 6
response to Division 27-11.) According to the Company, the going forward costs are only 7
operation and maintenance costs associated with time spent by engineers on the portal. 8
Q. Does the Division agree with the Company’s annual cost estimate for the System 9
Data Portal? 10
A. No. As Division witness Greg Booth testifies, the proposal to fund three engineers 11
appears excessive. For that reason, the Division proposes to reduce the request by one 12
third. The Division’s revenue requirement witness, Michael Ballaban, has reduced the 13
annual cost by 30 percent in the rate year revenue requirement. 14
Q. What about the Company’s proposal to perform an AMI study? 15
A. The Division believes the Company should perform the study. We will discuss the 16
reasons further in the testimony elsewhere in separate testimony sponsored by Melissa 17
Whited and me. However, the Division disagrees with the Company’s estimate and 18
allocation of the cost of the AMI study chargeable to Rhode Island, as described in the 19
testimony of Division witness Michael Ballaban. The Division proposes that the study go 20
forward, subject to the cost recovery adjustments recommended by Mr. Ballaban for the 21
rate year. As Mr. Ballaban explains, the Company estimated a cost to Rhode Island for a 22
combined study with New York at $2 million. However, for the reasons explained by 23
89

Direct Testimony of Tim Woolf Page 32
Mr. Ballaban, the Division believes the Company’s estimate is not reasonable and lacks a 1
defensible foundation. Mr. Ballaban explains why the rate allowance funded by Rhode 2
Island should be $1 million, which should be amortized over three years. 3
Q. Are there any other actions the Company should be taking in connection with grid 4
modernization? 5
A. Yes. Consistent with the testimony of Division witness Greg Booth, the Division 6
recommends that the Company be directed to complete a comprehensive grid 7
modernization plan (GMP) that is developed in sync with the AMI Study. The plan 8
should be developed with stakeholder input and could take place under the umbrella of 9
Docket 4780 or in a separate Docket. But the GMP should be filed with the Commission 10
around the same time as the AMI Study, to allow AMI deployment and the GMP to be 11
considered together. 12
Q. How do performance incentive mechanisms fit into the Division’s proposed 13
regulatory framework? 14
A. The Division is proposing a set of PIMs that are an important element in the regulatory 15
framework. These PIMs provide additional sources of revenues and thus utility 16
management incentives to implement some of the PST initiatives and achieve some of the 17
PST goals. These performance incentive mechanisms are directly connected with 18
consideration of the company’s rate of return in this docket. These PIMs are discussed in 19
more detail in separate testimony sponsored by me and Melissa Whited. 20
90

Direct Testimony of Tim Woolf Page 33
5. MULTI-YEAR RATE PLANS 1
Q. Why does the Division support the concept of multi-year rate plans? 2
A. One of the most important reasons is that a multi-year plan requires and facilitates 3
planning over a multi-year horizon on a fully integrated basis. In the context of Power 4
Sector Transformation, planning needs to take place with multiple years in view, relating 5
the activities to the core distribution business. For that reason alone, implementing a 6
multi-year plan is highly preferable. But there also is another important benefit. The 7
multi-year rate plan not only provides the most effective way to advance the very 8
important multi-year transformative initiatives, it also addresses in a balanced manner the 9
tension relating to cost recovery that often exists between the competing interests of 10
ratepayers and shareholders. 11
Q. What are the ratepayer interests in this context? 12
A. The most important is the obvious interest in protecting ratepayers from unreasonable 13
rates, including rate stability. In addition, there is the interest of advancing important 14
public policies that need the utility to make significant investments with cost discipline. 15
This interest is now becoming more important than ever as policymakers look to advance 16
important transformational initiatives relating to climate change, an evolving distribution 17
system, and accommodation of a distribution system with distributed resources. 18
Q. What is the interest of the utility in this context? 19
A. The interest of the utility is straightforward and not surprising. In providing service to 20
consumers, utilities incur costs. In past decades, costs could be more easily recovered by 21
sales growth and other factors that increased usage which, in turn, increased revenues to 22
91

Direct Testimony of Tim Woolf Page 34
cover on-going costs and investments. In recent years usage on the electric side of the 1
business is either flat or declining. Revenue decoupling helps stabilize the revenue 2
stream for the distribution utility, but it does not provide additional revenue in between 3
rate cases to provide the necessary financial signals for the utility to invest. In fact, we 4
believe this is the primary reason for the passage of the statute establishing the ISR. It 5
also is self-evident from the fact that it is embedded in the revenue decoupling section of 6
the law. The electric system was aging, yet the Company did not have the revenue stream 7
to invest without depleting its earnings in between rate cases. By creating the ISR at the 8
same time as implementing decoupling, conventional investments were facilitated and 9
service quality vastly improved while energy efficiency goals were being achieved. 10
There may have been other ways to address this issue, but Rhode Island policymakers 11
chose the ISR mechanism. 12
If we were on a path of business as usual, there might not be a need for a change. 13
But that is not the state of the industry. As mentioned earlier, policymakers acting on 14
behalf of customers desire transformational changes in the utility business to advance 15
important goals. But these initiatives require a longer-term investment vision that utilizes 16
multi-year investment plans. Phasing-in of significant projects is likely to become more 17
important over the next decade. The “one-year-at-a-time” ISR is not adequate, even if 18
the investments are eligible under the statute. The Company in this case acknowledges 19
that a large infusion of investments is needed to transform the power industry. But it is 20
reluctant to advance the programs unless it has assurance of cost recovery without any 21
regulatory lag or significant risk. 22
92

Direct Testimony of Tim Woolf Page 35
Q. Couldn’t the Commission simply order the Company to implement the initiatives 1
and address cost recovery in their next rate case? 2
A. Yes. The Commission, like other state commissions across the country, always has the 3
option to issue mandates for utilities to take certain actions or implement initiatives, 4
while addressing cost recovery in subsequent rate cases. It may be that the Commission 5
would need to resort to such action in Rhode Island. However, while the Commission 6
could assert its authority aggressively to simply order the Company to implement 7
programs without addressing how the costs will be recovered until the next rate case, 8
taking such action means the utility implements under regulatory duress. On the surface 9
it may appear effective, but too often risk averse, financially-influenced inertia can slow 10
or halt real progress behind the scenes. Many regulatory mandates can be effective and 11
are necessary. But the types of initiatives being contemplated here are intended to be 12
transformational. In order for the transformation to be effectively accomplished, it is 13
preferable to address it in a manner that works for all parties concerned. 14
Q. How has the Company proposed to address its interest to recover the costs in a 15
timely manner? 16
A. The Company has proposed a fully reconciling PST Tracker. The tracker would 17
undoubtedly address the Company’s interest in the most ideal manner from the 18
Company’s perspective. In such case, the Company would obtain up-front approval. The 19
approval would allow it to spend money on the initiative with no concerns about earnings 20
impacts because the Company would be virtually guaranteed to get all its money back 21
from the spending, with a formulaic return on its investment. 22
93

Direct Testimony of Tim Woolf Page 36
Q. But would that be a balanced approach that is fair to ratepayers? 1
A. No. The Company’s proposal does not address the interests of ratepayers who should be 2
assured that the utility is operating efficiently at reasonable cost. From the ratepayers’ 3
perspective, there needs to be some financial pressure created to assure the utility 4
experiences real consequences for any lack of discipline in spending. 5
Q. What about the Company’s claim that without timely cost recovery it would not be 6
able to meet the Commission’s PST objectives? 7
A. This claim assumes that the Company’s capability to implement an initiative is obstructed 8
unless the Company gets its money first or at least a guarantee for later. In the history of 9
ratemaking, this has never been the general rule. In fact, it has typically been the 10
opposite. Rates have been set for one year and the Company exercises its duty to 11
maintain safe and reliable service with the revenue obtained by the rates in effect. The 12
reconciliation of some of the ordinary business expenses and cost of capital is the 13
exception. Currently, only 15% of annual electric distribution-related revenue is 14
recovered through reconciling mechanisms. (See the response to PUC 3-9, Attachment 15
3-9, page 1 of 2, line 3) The idea that absent a fully reconciling cost recovery mechanism 16
the Company cannot do its job or run the business not only lacks credibility, but flies in 17
the face of ordinary principles of ratemaking. Timely recovery undoubtedly makes it 18
much easier for the Company to maintain higher earnings while carrying out its 19
responsibilities. However, while factors such as regulatory lag or lack of dollar-for-dollar 20
precision between revenues and costs may cause some earnings instability, they would 21
not, as a practical matter, prevent the Company from meeting the PST objectives. 22
94

Direct Testimony of Tim Woolf Page 37
Q. What is the Division’s proposal for a balanced and effective solution? 1
A. The balanced and most effective solution that is consistent with the Division’s vision for 2
advancing the “utility of the future” is the concept of multi-year rate plans. There is 3
nothing new in the industry about such plans. They have been implemented in many 4
places. But in recent years, they have not been utilized in Rhode Island. Given the needs 5
and interests already identified, it is the most balanced answer that is fair to all 6
participants. 7
Q. What are the key features of a multi-year rate plan? 8
A. First, the Company should be required to file a multi-year business plan with granular 9
and reliable forecasts of costs for each year of the plan, including any forecasted costs 10
relating to grid modernization and AMI. This would allow all parties to examine the 11
direction in which the utility is planning to move. It also would allow for significant 12
stakeholders and regulatory input in a comprehensive and integrated way. Most of the 13
utility’s distribution business activities that are funded on the delivery side of the bill 14
would be available for comprehensive review. To the extent there is a need to advance 15
transformational, multi-year initiatives that can only be accomplished by phasing in 16
investments across several years, the multi-year rate plan is ideal. A budget for the 17
activities can be established, the base distribution rates can be set to match the budget, 18
and the utility can be launched to achieve the goals. But unlike a mechanism that 19
reconciles costs, this type of planning and cost recovery provides better signals to the 20
utility. Instead of the utility falling into financially-neutral spending patterns because it is 21
ratepayer money it is using under a reconciliation, the utility will experience the budget 22
as its own money at risk. That is, if the utility achieves the objectives under budget, the 23
95

Direct Testimony of Tim Woolf Page 38
utility is rewarded. Conversely, if the utility mismanages and exceeds the budget, the 1
utility’s earnings suffer. 2
Q. Why is this fair to all participants? 3
A. If it is properly designed, the multi-year rate plan is fair to ratepayers because it caps 4
targeted spending at pre-determined reasonable levels. It also should be desirable to 5
policymakers because it advances the desired initiatives. Finally, it is fair to the utility 6
because it provides a reasonable opportunity for the utility to recover all of its costs of the 7
initiatives in a timely manner, while achieving a reasonable return for its shareholders. 8
Surely, the Company should have no legitimate complaint if it has a realistic opportunity 9
to recover its prudently-incurred costs, but has to accept the ordinary risks of running the 10
utility business along the way, including budget discipline. 11
Q. What about allowing time for stakeholder input? 12
A. Stakeholder input will continue to be important. Rhode Island has already recognized 13
this when it launched its Power Sector Transformation initiative. Numerous technical 14
sessions have been held. Other sessions have been held in the context of the companion 15
docket to this rate case, Docket 4780. But this is only the first step. A multi-year rate 16
plan requirement does not preclude further stakeholder sessions. 17
Q. The Company maintains that a PST Tracker is needed because of stakeholder input. 18
What is your view? 19
A. One of the main reasons given by the Company for a PST Tracker is that they want 20
stakeholder input that could affect costs. But stakeholder input and planning are not 21
dependent upon the Company getting fully-reconciled cost recovery. Reconciliations 22
96

Direct Testimony of Tim Woolf Page 39
should be the exception, not the rule. Effective stakeholder input is achieved through 1
engagement, not assurances of cost recovery with no regulatory lag. It is the Company’s 2
role and responsibility to invest in the initiatives that are prudent and support their request 3
for recovery with results. 4
Q. How long should the multi-year rate plan be? 5
A. The number of years should be at least three. This gives the utility two years of operating 6
under the budgets before it needs to file for another multi-year plan. During year three, it 7
operates under the third year’s budget while the next plan is negotiated or litigated. It is 8
possible that a plan that runs five years could work. But when there are new initiatives 9
never experienced before, three years is a better place to start. Otherwise, technology and 10
the industry can advance ahead, leaving policymakers and the Company behind. 11
Q. What is needed in the filing for financial data? 12
A. It is critical that the Company file a comprehensive revenue requirement for each year of 13
the Rate Plan. This needs to be for more than just one rate year. It should reflect a real 14
plan of spending that can be justified in a granular manner, not mere inflationary 15
adjustments off the first year of projected costs. The filing should also include 16
projections for three years of capital spending for capital projects that are both eligible 17
and not eligible under the ISR. This would allow the Division, the Commission, and 18
other intervenors to evaluate the overall plan on an integrated basis. 19
97

Direct Testimony of Tim Woolf Page 40
Q. What about projects and costs associated with “grid modernization”? 1
A. The three-year business plan should also provide an integrated plan to advance the goals 2
of modernizing the grid. The objectives should be clear and there should be a transparent 3
way to evaluate how well multiple initiatives relate to each other. 4
Q. Why would a capital plan for the three years be important, given the existence of the 5
ISR? 6
A. The ISR provides review of plans that proceed one year at a time. While the Company 7
has provided multi-year forecasts, the focus is on the upcoming year. This can result in 8
skewed, short-term vision. The full plan of capital spending on the conventional 9
investments eligible for the ISR should be included along with the other investments and 10
spending for the transformational programs that need multi-year schedules. Annual cost 11
recovery for ISR-eligible projects would continue to be addressed in the annual ISR 12
process. The ISR planning process would be effectively embedded within and function 13
in parallel with the multi-year plan. However, all capital projects that are not otherwise 14
eligible for ISR treatment would be addressed in a parallel capital budget. In this way, 15
all capital spending over the three-year period would be addressed together. 16
Q. Given the fact that the ISR is fully reconciling, how would the multi-year rate plan 17
address the concern that it does not result in a binding spending budget? 18
A. This can be resolved through a capital efficiency incentive. There may be several 19
different ways to design an incentive that works in tandem with the ISR and the multi-20
year plan. But the Division is considering a specific framework that would create 21
spending discipline. 22
98

Direct Testimony of Tim Woolf Page 41
Q. How would the capital spending efficiency incentive operate? 1
A. First, the Company would provide a three-year capital spending plan for all ISR eligible 2
projects for which it anticipates seeking approval under the ISR. This would be reviewed 3
and provisionally approved by the Commission. The spending budget would then be 4
tracked for the three years of the plan. The Division envisions a cumulative spending 5
budget in the aggregate. At the end of the three years, the three-year spending as it 6
actually occurred under the ISR is compared to the budget approved by the Commission 7
when approving the multi-year plan. To the extent the Company has achieved its 8
objective under the aggregate budget, savings can be kept or shared with ratepayers. 9
However, if the Company has exceeded the aggregate budget in circumstances where no 10
approved exceptions apply, the Company would be required to refund customers an 11
amount equal to the incremental increase in the revenue requirement during the rate plan 12
that was caused by the overspend. 13
Q. How does it affect the Company’s cost recovery after the plan is over? 14
A. The Company would still be able to include the capital costs in rate base in the future, 15
provided that the spending was prudent, but it will have suffered the equivalent of a one-16
year regulatory lag in partial cost recovery for missing the aggregate three-year budget 17
target, as measured at the end of the plan. This achieves a result which creates a virtual 18
budget for the three years, yet it does not affect the operation of the ISR under the statute. 19
There is no prohibition against exceeding the budget. Rather, it is simply an incentive 20
mechanism with a reward or penalty determined at the end of the rate plan period. As a 21
result, it provides spending discipline that does not currently exist without the multi-year 22
plan. It does not preclude the Company from doing what it needs to do to provide safe 23
99

Direct Testimony of Tim Woolf Page 42
and reliable service. The penalty would be financially analogous to creating a one or 1
two-year regulatory lag on a portion of the Company’s capital cost recovery that exceeds 2
the budget. It would be similar to what happens across the country for utilities that make 3
investments in one year, but do not obtain additional rate relief until the next rate case 4
after the projects are in service. 5
Q. What about the PST initiatives? 6
A. As explained earlier, the rate case filing would contain spending forecasts for any 7
proposed PST initiatives. A budget would be created for each year of the plan, including 8
allowances to cover approved expenses for the initiatives. The Company would then 9
need to implement the initiative within the approved budget. Incentives also could be 10
included, but the basic effect is to require the Company to operate with spending 11
discipline, knowing that excess costs will not be fully reconcilable. Some modifications 12
and exceptions could be included for more complex initiatives, but the basic objective of 13
creating a budget and spending discipline would be addressed. In effect, the goal would 14
be to have the costs of the PST initiatives recovered through base distribution rates rather 15
than a tracker. 16
Q. Are there any other features that would be included in a multi-year rate plan? 17
A. We would expect so if a plan is negotiated in this rate case. For example, a multi-year 18
rate plan is flexible enough to incorporate any consensus items that may emerge from 19
discussion among parties in Docket 4780 over the next three months, such as electric 20
transportation, electric heat and energy storage. In addition, we anticipate that a multi-21
year rate plan negotiated as a part of this docket could have an explicit re-opener for AMI 22
investments that we recommend the Commission address following submittal of the 23
100
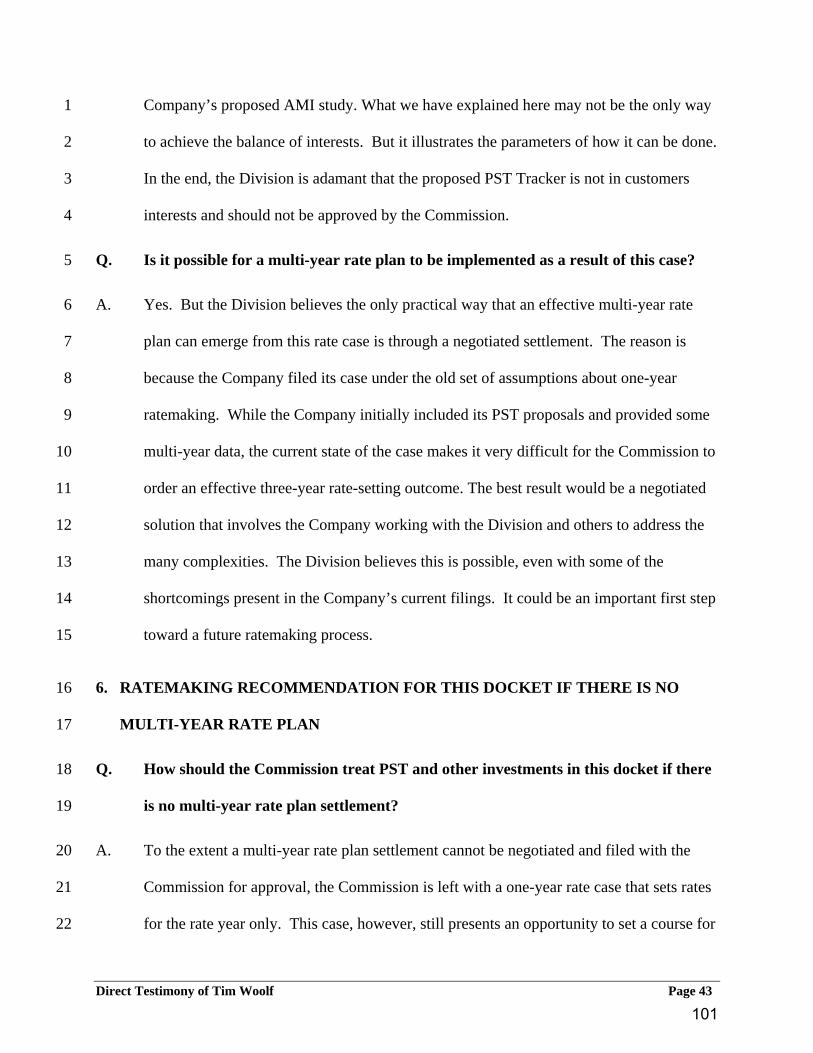
Direct Testimony of Tim Woolf Page 43
Company’s proposed AMI study. What we have explained here may not be the only way 1
to achieve the balance of interests. But it illustrates the parameters of how it can be done. 2
In the end, the Division is adamant that the proposed PST Tracker is not in customers 3
interests and should not be approved by the Commission. 4
Q. Is it possible for a multi-year rate plan to be implemented as a result of this case? 5
A. Yes. But the Division believes the only practical way that an effective multi-year rate 6
plan can emerge from this rate case is through a negotiated settlement. The reason is 7
because the Company filed its case under the old set of assumptions about one-year 8
ratemaking. While the Company initially included its PST proposals and provided some 9
multi-year data, the current state of the case makes it very difficult for the Commission to 10
order an effective three-year rate-setting outcome. The best result would be a negotiated 11
solution that involves the Company working with the Division and others to address the 12
many complexities. The Division believes this is possible, even with some of the 13
shortcomings present in the Company’s current filings. It could be an important first step 14
toward a future ratemaking process. 15
6. RATEMAKING RECOMMENDATION FOR THIS DOCKET IF THERE IS NO 16
MULTI-YEAR RATE PLAN 17
Q. How should the Commission treat PST and other investments in this docket if there 18
is no multi-year rate plan settlement? 19
A. To the extent a multi-year rate plan settlement cannot be negotiated and filed with the 20
Commission for approval, the Commission is left with a one-year rate case that sets rates 21
for the rate year only. This case, however, still presents an opportunity to set a course for 22
101

Direct Testimony of Tim Woolf Page 44
the future, beginning with clear and unequivocal directives that the Commission should 1
give to the Company in this case, combined with approval of some of the initiatives that 2
can be carved out of the Company’s PST proposal and embedded into the rate year 3
revenue requirement. The Commission also should establish new performance-based 4
incentive mechanisms to begin sending effective financial signals to the Company as we 5
move into the transformation of the industry. We will discuss the Division’s PIMs 6
proposal in the separate testimony of Melissa Whited and me. 7
Q. How should the Commission proceed if there is no multi-year plan? 8
A. First, in the absence of a multi-year rate plan, the Commission should set rates for the rate 9
year, without a new PST Tracker as proposed by the Company. In doing so, the 10
Commission should make it clear to the Company that recovery of non-eligible ISR costs 11
relating to all the PST initiatives is not favored. The Commission should establish the 12
principle that recovery of the costs of most PST initiatives should typically be addressed 13
in rate cases that set forth an integrated, multi-year plan. The Commission should leave 14
room to make exceptions as it deems sensible. But the initiatives should not be addressed 15
in special rate reconciliation processes that isolate those programs from the rest of the 16
distribution business. This would not preclude technical sessions related to major 17
initiatives that would benefit from Commission review and stakeholder participation, but 18
such technical processes should not be a process for obtaining rate recovery through 19
special mechanisms. They should be an evaluation of the details, benefits, and 20
desirability of integrated initiatives. 21
102

Direct Testimony of Tim Woolf Page 45
Second, the Commission should require the Company to move forward with the GIS 1
Enhancements, the AMI Study, and the System Data Portal commencing in the rate year, 2
with the costs recommended by the Division included in the revenue requirement. 3
4
Third, the Commission should establish new performance based ratemaking incentives 5
that work in tandem with the Company’s return on equity allowance. As mentioned, we 6
will address this proposal in greater detail in the direct testimony sponsored by me and 7
Ms. Whited. 8
Finally, the Company should be directed to develop a comprehensive, integrated plan for 9
Grid Modernization that builds upon the initiatives that are recommended by witness 10
Greg Booth for the rate year. This plan, in turn, should be filed with the Commission as a 11
part of a multi-year rate case that includes an integrated business plan with three years of 12
revenue requirement data that allows a complete and thorough review of the costs 13
forecasted for each year of the plan, including all of the costs of the distribution business 14
not otherwise governed by statutory requirements, such as the ISR. As a component of 15
the plan, new initiatives can be included that provide the opportunity to the Company for 16
recovery of the costs through base rates in each year of the plan. The Commission should 17
place a deadline on the Company for the filing of the multi-year plan no later than the 18
first half of 2020 for new rates to take effect no later than the first quarter of 2021. This 19
schedule will allow enough time for planning and continued stakeholder input on the PST 20
and Grid Modernization initiatives, including AMI. 21
Once the first multi-year rate plan is in place, the Company can be placed on a three-year 22
schedule going forward. During the interim, however, the Commission must be clear that 23
103

Direct Testimony of Tim Woolf Page 46
the company should be undertaking any projects it believes are prudent and cost-1
effective, whether conventional or PST. 2
Q. Does the Division believe the Commission has the authority to require a multi-year 3
rate plan by a specified date? 4
Yes. Absolutely. While the Company traditionally has been left with the discretion to 5
commence rate cases on its own schedule, this has been by default or regulatory tradition. 6
There are no statutory provisions or other legal requirements of which we have been 7
made aware that create a limitation or requirement that precludes such an action. The 8
Division believes the Commission has broad supervisory authority over the rates of the 9
utility that permits it to investigate rates and require rate filings relating to the costs of the 10
business. 11
Q. How should the Commission address AMI? 12
A. The Commission should direct the Company to complete the AMI study and file it with 13
the Commission for review prior to implementation. As described elsewhere in the 14
testimony, the costs of the study should be addressed in the rate year of this rate case, as 15
recommended by the Division in the testimony of Mr. Ballaban. If deployment is 16
ultimately approved by the Commission, the costs of deployment should be included in 17
base rates as a part of the multi-year rate plan filing made during the first half of 2020. 18
But implementation should not be delayed in order for the means of cost recovery to be 19
engraved in regulatory stone before the Company advances prudent programs. As the 20
Division’s witness Ballaban testifies, National Grid did not wait for all regulatory cost 21
approvals to be in place before launching the Gas Business Enablement program that 22
achieved higher proportional benefits to New York than Rhode Island. The program was 23
104

Direct Testimony of Tim Woolf Page 47
launched and the costs allocated to all jurisdictions. Likewise, it should not wait for 1
favorable cost recovery to be approved in all other jurisdictions to be in place before 2
beginning the process in Rhode Island, should the Commission find deployment of AMI 3
appropriate and prudent. 4
Q. Are there any particular components that the Division considers important to 5
include in the AMI study? 6
A. Yes. The Division has identified two distinct opportunities to significantly reduce the 7
potential cost of AMI deployment for ratepayers: alternative ownership models for meter 8
infrastructure and shared communications systems. While deployment of AMI without 9
either of these innovative approaches may still provide ratepayers greater benefits than 10
costs, the Division argues the AMI study should examine each of them. In addition, the 11
Division will request that it be involved in regular monthly meetings on the study 12
process. 13
Q. Does the Division’s case in this docket address the Company’s proposed electric 14
transportation, electric heat or energy storage initiatives? 15
A. No. However, as described in the November 2017 Power Sector Transformation Phase I 16
Report, the Division understands that electric transportation, electric heat and energy 17
storage are important components of a transformed power system and advance key 18
attributes of the electric power system codified in Docket 4600, such as addressing 19
climate change. Because of the decision to separate Docket 4770 and 4780, these topics 20
are currently under review in Docket 4780. The Division anticipates submitting its 21
testimony on these matters in Docket 4780 in two weeks. The Division further anticipates 22
that a settlement among parties in this docket may include versions of the electric 23
105

Direct Testimony of Tim Woolf Page 48
transportation, electric heat and energy storage programs currently proposed in Docket 1
4780. 2
Q. Does this conclude your testimony? 3
A. Yes. 4
106

107

Tim Woolf page 1 of 20
Tim Woolf, Vice President
Synapse Energy Economics I 485 Massachusetts Avenue, Suite 2 I Cambridge, MA 02139 I 617‐453‐7031
twoolf@synapse‐energy.com
PROFESSIONAL EXPERIENCE
Synapse Energy Economics Inc., Cambridge, MA. Vice President, 2011 ‒ present.
Provides expert consulting on the economic, regulatory, consumer, environmental, and public policy
implications of the electricity and gas industries. The primary focus of work includes technical and
economic analyses, electric power system planning, climate change strategies, energy efficiency
programs and policies, renewable resources and related policies, power plant performance and
economics, air quality, and many related aspects of consumer and environmental protection.
Massachusetts Department of Public Utilities, Boston, MA. Commissioner, 2007 ‒ 2011.
Oversaw a significant expansion of clean energy policies as a consequence of the Massachusetts Green
Communities Act, including an aggressive expansion of ratepayer‐funded energy efficiency programs;
the implementation of decoupled rates for electric and gas companies; an update of the DPU energy
efficiency guidelines; the promulgation of net metering regulations; review of smart grid pilot programs;
and review of long‐term contracts for renewable power. Oversaw six rate case proceedings for
Massachusetts electric and gas companies. Played an influential role in the development of price
responsive demand proposals for the New England wholesale energy market. Served as President of the
New England Conference of Public Utility Commissioners from 2009‐2010. Served as board member on
the Energy Facilities Siting Board from 2007‐2010. Served as co‐chair of the Steering Committee for the
Northeast Energy Efficiency Partnership’s Regional Evaluation, Measurement and Verification Forum.
Synapse Energy Economics Inc., Cambridge, MA. Vice President, 1997 ‒ 2007.
Tellus Institute, Boston, MA. Senior Scientist, Manager of Electricity Program, 1992 ‒ 1997.
Association for the Conservation of Energy, London, England. Research Director, 1991 ‒ 1992.
Massachusetts Department of Public Utilities, Boston, MA. Staff Economist, 1989 ‒ 1990.
Massachusetts Office of Energy Resources, Boston, MA. Policy Analyst, 1987 ‒ 1989.
Energy Systems Research Group, Boston, MA. Research Associate, 1983 ‒ 1987.
Union of Concerned Scientists, Cambridge, MA. Energy Analyst, 1982‐1983.
EDUCATION
Boston University, Boston, MA
Master of Business Administration, 1993
108

Tim Woolf page 2 of 20
London School of Economics, London, England
Diploma, Economics, 1991
Tufts University, Medford, MA
Bachelor of Science in Mechanical Engineering,
1982
Tufts University, Medford, MA
Bachelor of Arts in English, 1982
REPORTS
White, D., K. Takahashi, A. Napoleon, T. Woolf. 2018. Value of Energy Efficiency in New York: Assessment
of the Range of Benefits of Energy Efficiency Programs. Prepared by Synapse Energy Economics for
Natural Resources Defense Council.
Fisher, J., M. Whited, T. Woolf, D. Goldberg. 2018. Utility Investments for Market Transformation: How
Utilities Can Help Achieve Energy Policy Goals. Prepared by Synapse Energy Economics for Energy
Foundation.
Woolf, T., A. Hopkins, M. Whited, K. Takahashi, A. Napoleon. 2018. Review of New Brunswick Power’s
2018/2019 Rate Case Application. In the Matter of the New Brunswick Power Corporation and Section
103(1) of the Electricity Act Matter No. 375. Prepared by Synapse Energy Economics for the New
Brunswick Energy and Utilities Board Staff.
Woolf, T., C. Neme, M. Kushler, S. R. Schiller, T. Eckman. 2017. National Standard Practice Manual for
Assessing Cost‐Effectiveness of Energy Efficiency Resources. Edition 1, Spring 2017. Prepared by the
National Efficiency Screening Project.
Whited, M., A. Horowitz, T. Vitolo, W. Ong, T. Woolf. 2017. Distributed Solar in the District of Columbia:
Policy Options, Potential, Value of Solar, and Cost‐Shifting. Synapse Energy Economics for the Office of
the People’s Counsel for the District of Columbia.
Raab Associates and Synapse Energy Economics. 2017. Grid Modernization in New Hampshire: Report to
the New Hampshire Public Utilities Commission. Prepared by the New Hampshire Grid Modernization
Working Group. March 20, 2017.
Woolf, T. 2016. Expert Report: Rate Mechanism, Reconciliation of Provisional Rates, Energy Efficiency
Rider. Prepared for Puerto Rico Energy Commission regarding Matter No. CEPR‐AP‐2015‐0001,
November 21, 2016.
Woolf, T., M. Whited, P. Knight, T. Vitolo, K. Takahashi. 2016. Show Me the Numbers: A Framework for
Balanced Distributed Solar Policies. Synapse Energy Economics for Consumers Union.
Fisher, J., A. Horowitz, J. Migden‐Ostrander, T. Woolf. 2016. Puerto Rico Electric Power Authority’s 2015
Integrated Resource Plan. Prepared for Puerto Rico Energy Commission.
Woolf, T., A. Napoleon, P. Luckow, W. Ong, K. Takahashi. 2016. Aiming Higher: Realizing the Full
Potential of Cost‐Effective Energy Efficiency in New York. Synapse Energy Economics for Natural
109

Tim Woolf page 2 of 20
Resources Defense Council, E4TheFuture, CLEAResult, Lime Energy, Association for Energy Affordability,
and Alliance for Clean Energy New York.
Lowry, M. N., T. Woolf, M. Whited, M. Makos. 2016. Performance‐Based Regulation in a High Distributed
Energy Resources Future. Pacific Economics Group Research and Synapse Energy Economics for
Lawrence Berkley National Laboratory.
Woolf, T., M. Whited, A. Napoleon. 2015‐2016. Comments and Reply Comments in the New York Public
Service Commission Case 14‐M‐0101: Reforming the Energy Vision. Comments related to Staff’s (a) a
benefit‐costs analysis framework white paper, (b) ratemaking and utility business models white paper,
and (c) Distributed System Implementation Plan guide. Prepared by Synapse Energy Economics on
behalf of Natural Resources Defense Council and Pace Energy and Climate Center. August 21, 2015,
September 10, 2015, October 26, 2015, November 23, 2015, December 7, 2015, and January 6, 2016.
Kallay, J., K. Takahashi, A. Napoleon, T. Woolf. 2015. Fair, Abundant, and Low‐Cost: A Handbook for
Using Energy Efficiency in Clean Power Plan Compliance. Synapse Energy Economics for the Energy
Foundation.
Woolf, T., K. Takahashi, E. Malone, A. Napoleon, J. Kallay. 2015. Ontario Gas Demand‐Side Management
2016‐2020 Plan Review. Synapse Energy Economics for the Ontario Energy Board.
Whited, M., T. Woolf, A. Napoleon. 2015. Utility Performance Incentive Mechanisms: A Handbook for
Regulators. Synapse Energy Economics for the Western Interstate Energy Board.
Woolf, T., E. Malone, F. Ackerman. 2014. Cost‐Effectiveness Screening Principles and Guidelines for
Alignment with Policy Goals, Non‐Energy Impacts, Discount Rates, and Environmental Compliance Costs.
Synapse Energy Economics for Northeast Energy Efficiency Partnerships (NEEP) Regional Evaluation,
Measurement and Verification Forum.
Woolf, T., E. Malone, C. Neme. 2014. Regulatory Policies to Support Energy Efficiency in Virginia. Synapse
Energy Economics and Energy Futures Group for the Virginia Energy Efficiency Council.
Woolf, T., M. Whited, E. Malone, T. Vitolo, R. Hornby. 2014. Benefit‐Cost Analysis for Distributed Energy
Resources: A Framework for Accounting for All Relevant Costs and Benefits. Synapse Energy Economics
for the Advanced Energy Economy Institute.
Woolf, T., E. Malone, J. Kallay. 2014. Rate and Bill Impacts of Vermont Energy Efficiency Programs.
Synapse Energy Economics for the Vermont Public Service Department.
Woolf, T., C. Neme, P. Stanton, R. LeBaron, K. Saul‐Rinaldi, S. Cowell. 2014. The Resource Value
Framework: Reforming Energy Efficiency Cost‐Effectiveness Screening. The National Efficiency Screening
Project for the National Home Performance Council.
Malone, E., T. Woolf, K. Takahashi, S. Fields. 2013. “Appendix D: Energy Efficiency Cost‐Effectiveness
Tests.” Readying Michigan to Make Good Energy Decisions: Energy Efficiency. Synapse Energy Economics
for the Council of Michigan Foundations.
110

Tim Woolf page 3 of 20
Stanton, E. A., S. Jackson, G. Keith, E. Malone, D. White, T. Woolf. 2013. A Clean Energy Standard for
Massachusetts. Synapse Energy Economics for the Massachusetts Clean Energy Center and the
Massachusetts Departments of Energy Resources, Environmental Protection, and Public Utilities.
Woolf, T., K. Saul‐Rinaldi, R. LeBaron, S. Cowell, P. Stanton. 2013. Recommendations for Reforming
Energy Efficiency Cost‐Effectiveness Screening in the United States. Energy Efficiency Screening Coalition
for the National Home Performance Council.
Woolf, T., E. Malone, J. Kallay, K. Takahashi. 2013. Energy Efficiency Cost‐Effectiveness Screening in the
Northeast and Mid‐Atlantic States. Synapse Energy Economics for Northeast Energy Efficiency
Partnerships, Inc. (NEEP).
Raab Associates and Synapse Energy Economics. 2013. Massachusetts Electric Grid Modernization
Stakeholder Working Group Process: Report to the Department of Public Utilities from the Steering
Committee. Prepared for the Massachusetts Department of Public Utilities. DPU 12‐76.
Jackson, S., P. Peterson, D. Hurley, T. Woolf. 2013. Forecasting Distributed Generation Resources in New
England: Distributed Generation Must Be Properly Accounted for in Regional System Planning. Synapse
Energy Economics for E4 Group.
Woolf, T., E. Malone, L. Schwartz, J. Shenot. 2013. A Framework for Evaluating the Cost‐Effectiveness of
Demand Response. Synapse Energy Economics and Regulatory Assistance Project for the National Forum
on the National Action Plan on Demand Response: Cost‐effectiveness Working Group.
Woolf, T., W. Steinhurst, E. Malone, K. Takahashi. 2012. Energy Efficiency Cost‐Effectiveness Screening:
How to Properly Account for ‘Other Program Impacts’ and Environmental Compliance Costs. Synapse
Energy Economics for Regulatory Assistance Project and Vermont Housing Conservation Board.
Woolf, T., M. Whited, T. Vitolo, K. Takahashi, D. White. 2012. Indian Point Replacement Analysis: A Clean
Energy Roadmap. A Proposal for Replacing the Nuclear Plant with Clean, Sustainable Energy Resource.
Synapse Energy Economics for Natural Resources Defense Council (NRDC) and Riverkeeper.
Keith, G., T. Woolf, K. Takahashi. 2012. A Clean Electricity Vision for Long Island: Supplying 100% of Long
Island's Electricity Needs with Renewable Power. Synapse Energy Economics for Renewable Energy Long
Island.
Woolf, T. 2012. Best Practices in Energy Efficiency Program Screening: How to Ensure that the Value of
Energy Efficiency is Properly Accounted For. Synapse Energy Economics for National Home Performance
Council.
Woolf, T., J. Kallay, E. Malone, T. Comings, M. Schultz, J. Conyers. 2012. Commercial & Industrial
Customer Perspectives on Massachusetts Energy Efficiency Programs. Synapse Energy Economics for the
Massachusetts Energy Efficiency Advisory Council.
Woolf, T., M. Wittenstein, R. Fagan. 2011. Indian Point Energy Center Nuclear Plant Retirement Analysis.
Synapse Energy Economics for Natural Resources Defense Council (NRDC) and Riverkeeper.
111

Tim Woolf page 4 of 20
Woolf, T., V. Sabodash, B. Biewald. 2011. Equipment Price Forecasting in Energy Conservation Standards
Analysis. Synapse Energy Economics for Appliance Standards Awareness Project and Natural Resources
Defense Council (NRDC).
Johnston, L., E. Hausman, A. Sommer, B. Biewald, T. Woolf, D. Schlissel, A. Rochelle, D. White. 2007.
Climate Change and Power: Carbon Dioxide Emission Costs and Electricity Resource Planning. Synapse
Energy Economics for Tallahassee Electric Utility.
Woolf, T. 2007. Cape Light Compact Energy Efficiency Plan 2007‐2012: Providing Comprehensive Energy
Efficiency Services to Communities on Cape Cod and Martha’s Vineyard. Synapse Energy Economics for
the Cape Light Compact.
Woolf, T. 2007. Review of the District of Columbia Reliable Energy Trust Fund and Natural Gas Trust Fund
Working Group and Regulatory Processes. Synapse Energy Economics for the District of Columbia Office
of People's Counsel.
Woolf, T. 2006. Cape Light Compact Annual Report on Energy Efficiency Activities in 2005. Synapse
Energy Economics for the Cape Light Compact, submitted to the Massachusetts Department of
Telecommunications and Energy and the Massachusetts Division of Energy Resources.
Steinhurst, W., T. Woolf, A. Sommer, K. Takahashi, P. Chernick, J. Wallach. 2006. Integrated Portfolio
Management in a Restructured Supply Market. Synapse Energy Economics and Resource Insight for the
Ohio Office of Consumer Counsel.
Peterson, P., D. Hurley, T. Woolf, B. Biewald. 2006. Incorporating Energy Efficiency into the ISO‐New
England Forward Capacity Market. Synapse Energy Economics for Conservation Services Group.
Woolf, T., D. White, C. Chen, A. Sommer. 2005. Potential Cost Impacts of a Renewable Portfolio Standard
in New Brunswick. Synapse Energy Economics for New Brunswick Department of Energy.
Woolf, T., K. Takahashi, G. Keith, A. Rochelle, P. Lyons. 2005. Feasibility Study of Alternative Energy and
Advanced Energy Efficiency Technologies for Low‐Income Housing in Massachusetts. Synapse Energy
Economics and Zapotec Energy for the Low‐Income Affordability Network, Action for Boston Community
Development, and Action Inc.
Woolf, T. 2005. The Cape Light Compact Energy Efficiency Plan: Phase III 2005‐2007: Providing
Comprehensive Energy Efficiency Services to Communities on Cape Cod and Martha’s Vineyard. Synapse
Energy Economics for the Cape Light Compact.
Woolf, T. 2004. Review of Avoided Costs Used in Minnesota Electric Utility Conservation Improvement
Programs. Synapse Energy Economics for the Minnesota Office of Legislative Auditor.
Woolf, T. 2004. NEEP Strategic Initiative Review: Qualitative Assessment and Initiative Ranking for the
Residential Sector. Synapse Energy Economics for Northeast Energy Efficiency Partnerships, Inc.
Woolf, T. 2004. A Balanced Energy Plan for the Interior West. Synapse Energy Economics, West Resource
Advocates, and Tellus Institute for the Hewlett Foundation Energy Series.
112

Tim Woolf page 5 of 20
Steinhurst, W., P. Chernick, T. Woolf, J. Plunkett, C. Chen. 2003. OCC Comments on Alternative
Transitional Standard Offer. Synapse Energy Economics for the Connecticut Office of Consumer Counsel.
Woolf, T. 2003. Potential Cost Impacts of a Vermont Renewable Portfolio Standard. Synapse Energy
Economics for Vermont Public Service Board, presented to the Vermont RPS Collaborative.
Biewald, B., T. Woolf, A. Rochelle, W. Steinhurst. 2003. Portfolio Management: How to Procure
Electricity Resources to Provide Reliable, Low‐Cost, and Efficient Electricity Services to All Retail
Customers. Synapse Energy Economics for Regulatory Assistance Project and Energy Foundation.
Woolf, T., G. Keith, D. White, M. Drunsic, M. Ramiro, J. Ramey, J. Levy, P. Kinney, S. Greco, K. Knowlton,
B. Ketcham, C. Komanoff, D. Gutman. 2003. Air Quality in Queens: Cleaning Up the Air in Queens County
and Neighboring Regions. Synapse Energy Economics, Konheim & Ketcham, and Komanoff Energy
Associates for Natural Resources Defense Council (NRDC), Keyspan Energy, and the Coalition Helping to
Organize a Kleaner Environment.
Chen, C., D. White, T. Woolf, L. Johnston. 2003. The Maryland Renewable Portfolio Standard: An
Assessment of Potential Cost Impacts. Synapse Energy Economics for the Maryland Public Interest
Research Group.
Woolf, T. 2003. The Cape Light Compact Energy Efficiency Plan: Phase II 2003 ‒ 2007: Providing
Comprehensive Energy Efficiency Services to Communities on Cape Cod and Martha’s Vineyard. Synapse
Energy Economics, Cort Richardson, Vermont Energy Investment Corporation, and Optimal Energy
Incorporated for the Cape Light Compact.
Woolf, T. 2002. Green Power and Energy Efficiency Opportunities for Municipalities in Massachusetts:
Promoting Community Involvement in Energy and Environmental Decisions. Synapse Energy Economics
for the Massachusetts Energy Consumers Alliance.
Woolf, T. 2002. The Energy Efficiency Potential in Williamson County, Tennessee: Opportunities for
Reducing the Need for Transmission Expansion. Synapse Energy Economics for the Harpeth River
Watershed Association and the Southern Alliance for Clean Energy.
Woolf, T. 2002. Electricity Restructuring Activities in the US: A Survey of Selected States. Synapse Energy
Economics for Arizona Corporation Commission Utilities Division Staff.
Woolf, T. 2002. Powering the South: A Clean and Affordable Energy Plan for the Southern United States.
Synapse Energy Economics with and for the Renewable Energy Policy Project and a coalition of Southern
environmental advocates.
Johnston, L., G. Keith, T. Woolf, B. Biewald, E. Gonin. 2002. Survey of Clean Power and Energy Efficiency
Programs. Synapse Energy Economics for the Ozone Transport Commission.
Woolf, T. 2001. Proposal for a Renewable Portfolio Standard for New Brunswick. Synapse Energy
Economics for the Conservation Council of New Brunswick, presented to the New Brunswick Market
Design Committee.
113

Tim Woolf page 6 of 20
Woolf, T., G. Keith, D. White, F. Ackerman. 2001. A Retrospective Review of FERC’s Environmental Impact
Statement on Open Transmission Access. Synapse Energy Economics and the Global Development and
Environmental Institute for the North American Commission for Environmental Cooperation, with the
Global Development and Environment Institute.
Woolf, T. 2001. Repowering the Midwest: The Clean Energy Development Plan for the Heartland.
Synapse Energy Economics for the Environmental Law and Policy Center and a coalition of Midwest
environmental advocates.
Woolf, T. 2000. The Cape Light Compact Energy Efficiency Plan: Providing Comprehensive Energy
Efficiency Services to Communities on Cape Cod and Martha’s Vineyard. Synapse Energy Economics for
the Cape Light Compact.
Woolf, T., B. Biewald. 1999. Market Distortions Associated With Inconsistent Air Quality Regulations.
Synapse Energy Economics for the Project for a Sustainable FERC Energy Policy.
Woolf, T., B. Biewald, D. Glover. 1998. Competition and Market Power in the Northern Maine Electricity
Market. Synapse Energy Economics and Failure Exponent Analysis for the Maine Public Utilities
Commission.
Woolf, T. 1998. New England Tracking System. Synapse Energy Economics for the New England
Governors’ Conference, with Environmental Futures and Tellus Institute.
Woolf, T., D. White, B. Biewald, W. Moomaw. 1998. The Role of Ozone Transport in Reaching Attainment
in the Northeast: Opportunities, Equity and Economics. Synapse Energy Economics and the Global
Development and Environment Institute for the Northeast States for Coordinated Air Use Management.
Biewald, B., D. White, T. Woolf, F. Ackerman, W. Moomaw. 1998. Grandfathering and Environmental
Comparability: An Economic Analysis of Air Emission Regulations and Electricity Market Distortions.
Synapse Energy Economics and the Global Development and Environment Institute for the National
Association of Regulatory Utility Commissioners.
Biewald, B., T. Woolf, P. Bradford, P. Chernick, S. Geller, J. Oppenheim. 1997. Performance‐Based
Regulation in a Restructured Electric Industry. Synapse Energy Economics, Resource Insight, and the
National Consumer Law Center for the National Association of Regulatory Utility Commissioners.
Biewald, B., T. Woolf, M. Breslow. 1997. Massachusetts Electric Utility Stranded Costs: Potential
Magnitude, Public Policy Options, and Impacts on the Massachusetts Economy. Synapse Energy
Economics for the Union of Concerned Scientists, MASSPIRG, and Public Citizen.
Woolf, T. 1997. The Delaware Public Service Commission Staff’s Report on Restructuring the Electricity
Industry in Delaware. Tellus Institute for The Delaware Public Service Commission Staff. Tellus Study No.
96‐99.
114
Tim Woolf page 7 of 20
Woolf, T. 1997. Preserving Public Interest Obligations Through Customer Aggregation: A Summary of
Options for Aggregating Customers in a Restructured Electricity Industry. Tellus Institute for The
Colorado Office of Energy Conservation. Tellus Study No. 96‐130.
Woolf, T. 1997. Zero Carbon Electricity: the Essential Role of Efficiency and Renewables in New England’s
Electricity Mix. Tellus Institute for The Boston Edison Settlement Board. Tellus Study No. 94‐273.
Woolf, T. 1997. Regulatory and Legislative Policies to Promote Renewable Resources in a Competitive
Electricity Industry. Tellus Institute for The Colorado Governor’s Office of Energy Conservation. Tellus
Study No. 96‐130‐A5.
Woolf, T. 1996. Can We Get There From Here? The Challenge of Restructuring the Electricity Industry So
That All Can Benefit. Tellus Institute for The California Utility Consumers' Action Network. Tellus Study
No. 95‐208.
Woolf, T. 1995. Promoting Environmental Quality in a Restructured Electric Industry. Tellus Institute for
The National Association of Regulatory Utility Commissioners. Tellus Study No. 95‐056.
Woolf, T. 1995. Systems Benefits Funding Options. Tellus Institute for Wisconsin Environmental Decade.
Tellus Study No. 95‐248.
Woolf, T. 1995. Non‐Price Benefits of BECO Demand‐Side Management Programs. Tellus Institute for
Boston Edison Settlement Board. Tellus Study No. 93‐174.
Woolf, T., B. Biewald. 1995. Electric Resource Planning for Sustainability. Tellus Institute for the Texas
Sustainable Energy Development Council. Tellus Study No. 94‐114.
TESTIMONY
Rhode Island Public Utilities Commission (Docket No. 4783): Direct testimony of Tim Woolf and Melissa
Whited regarding National Grid's Advanced Metering Functionality Pilot. On behalf of the Rhode Island
Division of Public Utilities and Carriers. February 22, 2018.
New York Public Service Commission (Case 17‐E‐0459): Direct testimony of Tim Woolf regarding Energy
Efficiency Earnings Adjustment Mechanisms proposed by Central Hudson Gas & Electric Company. On
behalf of Natural Resources Defense Council. November 21, 2017.
New York Public Service Commission (Case 17‐E‐0238): Direct and rebuttal testimony of Tim Woolf and
Melissa Whited regarding Earnings Adjustment Mechanisms proposed by National Grid. On behalf of
Advanced Energy Economy Institute. August 25 and September 15, 2017.
Utah Public Service Commission (Docket No. 14‐035‐114): Direct and rebuttal testimony of Tim Woolf
regarding the Pacificorp’s analysis of the benefits and costs associated with distributed generation
resources. On behalf of Utah Clean Energy. June 8, 2017 and July 25, 2017.
Massachusetts Department of Public Utilities (D.P.U. 17‐05): Direct and surrebuttal testimony of Tim
Woolf and Melissa Whited regarding performance‐based regulation, the monthly minimum reliability
115
Tim Woolf page 8 of 20
contribution, storage pilots, and rate design in Eversource’s petition for approval of rate increases and a
performance‐based ratemaking mechanism. On behalf of Sunrun and the Energy Freedom Coalition of
America, LLC. April 28, 2017 and May 26, 2017.
Massachusetts Department of Public Utilities (D.P.U. 15‐120, D.P.U. 15‐121, D.P.U. 15‐122/15‐123):
Direct testimony of Tim Woolf and Ariel Horowitz, PhD, regarding the petitions by National Grid, Unitil,
NSTAR, and Eversource Energy for approval of their grid modernization plans. On behalf of Conservation
Law Foundation. March 10, 2017.
Massachusetts Department of Public (D.P.U. 16‐169): Direct testimony of Tim Woolf and Erin Malone
regarding Nation Grid’s petition for ruling regarding the provision of gas energy efficiency services. On
behalf of the Cape Light Compact. November 2, 2016.
New Jersey Board of Public Utilities (Docket No. ER16060524): Direct testimony regarding Rockland
Electric Company’s proposed advanced metering program. On behalf of the New Jersey Division of Rate
Counsel. September 9, 2016.
Colorado Public Utilities Commission (Proceeding No. 16AL‐0048E): Answer testimony regarding Public
Service Company of Colorado’s rate design proposal. On behalf of Energy Outreach Colorado. June 6,
2016.
Georgia Public Service Commission (Docket No. 40161 and Docket No. 40162): Direct testimony
regarding the demand‐side management programs proposed by Georgia Power Company in its
Certification, Decertification, and Amended Demand‐Side Management Plan and its 2016 Integrated
Resource Plan. On behalf of Sierra Club. May 3, 2016.
Massachusetts Department of Public Utilities (Docket No. 15‐155): Joint direct and rebuttal testimony
with M. Whited regarding National Grid’s rate design proposal. On behalf of Energy Freedom Coalition
of America, LLC. March 18, 2016 and April 28, 2016.
Maine Public Utilities Commission (Docket No. 2015‐00175): Direct testimony on Efficiency Maine
Trust’s petition for approval of the Triennial Plan for Fiscal Years 2017‐2019. On behalf of the Natural
Resources Council of Maine and the Conservation Law Foundation. February 17, 2016.
Nevada Public Utilities Commission (Docket Nos. 15‐07041 and 15‐07042): Direct testimony on NV
Energy’s application for approval of a cost of service study and net metering tariffs. On behalf of The
Alliance for Solar Choice. October 27, 2015.
New Jersey Board of Public Utilities (Docket No. ER14030250): Direct testimony on Rockland Electric
Company’s petition for investments in advanced metering infrastructure. On behalf of the New Jersey
Division of Rate Counsel. September 4, 2015.
Utah Public Service Commission (Docket No. 14‐035‐114): Direct, rebuttal, and surrebuttal testimony
on the benefit‐cost framework for net energy metering. On behalf of Utah Clean Energy, the Alliance for
Solar Choice, and Sierra Club. July 30, 2015, September 9, 2015, and September 29, 2015.
116

Tim Woolf page 9 of 20
Nova Scotia Utility and Review Board (Matter No. M06733): Direct testimony on EfficiencyOne’s 2016‐
2018 demand‐side management plan. On behalf of the Nova Scotia Utility and Review Board. June 2,
2015.
Missouri Public Service Commission (Case No. ER‐2014‐0370): Direct and surrebuttal testimony on the
topic of Kansas City Power and Light’s rate design proposal. On behalf of Sierra Club. April 16, 2015 and
June 5, 2015.
Missouri Public Service Commission (File No. EO‐2015‐0055): Rebuttal and surrebuttal testimony on the
topic of Ameren Missouri’s 2016‐2018 Energy Efficiency Plan. On behalf of Sierra Club. March 20, 2015
and April 27, 2015.
Florida Public Service Commission (Dockets No. 130199‐EI et al.): Direct testimony on the topic of
setting goals for increasing the efficiency of energy consumption and increasing the development of
demand‐side renewable energy systems. On behalf of the Sierra Club. May 19, 2014.
Massachusetts Department of Public Utilities (Docket No. DPU 14‐86): Direct and rebuttal Testimony
regarding the cost of compliance with the Global Warming Solution Act. On behalf of the Massachusetts
Department of Energy Resources and the Department of Environmental Protection. May 16, 2014.
Kentucky Public Service Commission (Case No. 2014‐00003): Direct testimony regarding Louisville Gas
and Electric Company and Kentucky Utilities Company’s proposed 2015‐2018 demand‐side management
and energy efficiency program plan. On behalf of Wallace McMullen and the Sierra Club. April 14, 2014.
Maine Public Utilities Commission (Docket No. 2013‐168): Direct and surrebuttal testimony regarding
policy issues raised by Central Maine Power’s 2014 Alternative Rate Plan, including recovery of capital
costs, a Revenue Index Mechanism proposal, and decoupling. On behalf of the Maine Public Advocate
Office. December 12, 2013 and March 21, 2014.
Colorado Public Utilities Commission (Docket No. 13A‐0686EG): Answer and surrebuttal testimony
regarding Public Service Company of Colorado’s proposed energy savings goals. On behalf of the Sierra
Club. October 16, 2013 and January 21, 2014.
Kentucky Public Service Commission (Case No. 2012‐00578): Direct testimony regarding Kentucky
Power Company’s economic analysis of the Mitchell Generating Station purchase. On behalf of the
Sierra Club. April 1, 2013.
Nova Scotia Utility and Review Board (Matter No. M04819): Direct testimony regarding Efficiency Nova
Scotia Corporation’s Electricity Demand Side Management Plan for 2013 ‒ 2015. On behalf of the
Counsel to Nova Scotia Utility and Review Board. May 22, 2012.
Missouri Office of Public Counsel (Docket No. EO‐2011‐0271): Rebuttal testimony regarding IRP rule
compliance. On behalf of the Missouri Office of the Public Counsel. October 28, 2011.
117

Tim Woolf page 10 of 20
Nova Scotia Utility and Review Board (Matter No. M03669): Direct testimony regarding Efficiency Nova
Scotia Corporation’s Electricity Demand Side Management Plan for 2012. On behalf of the Counsel to
Nova Scotia Utility and Review Board. April 8, 2011.
Rhode Island Public Utilities Commission (Docket No. 3790): Direct testimony regarding National Grid’s
Gas Energy Efficiency Programs. On behalf of the Division of Public Utilities and Carriers. April 2, 2007.
North Carolina Utilities Commission (Docket E‐100, Sub 110): Filed comments with Anna Sommer
regarding the Potential for Energy Efficiency Resources to Meet the Demand for Electricity in North
Carolina. Synapse Energy Economics on behalf of the Southern Alliance for Clean Energy. February 2007.
Rhode Island Public Utilities Commission (Docket No. 3765): Direct and Surrebuttal testimony
regarding National Grid’s Renewable Energy Standard Procurement Plan. On behalf of the Division of
Public Utilities and Carriers. January 17, 2007 and February 20, 2007.
Minnesota Public Utilities Commission (Docket Nos. CN‐05‐619 and TR‐05‐1275): Direct testimony
regarding the potential for energy efficiency as an alternative to the proposed Big Stone II coal project.
On behalf of the Minnesota Center for Environmental Advocacy, Fresh Energy, Izaak Walton League of
America, Wind on the Wires and the Union of Concerned Scientists. November 29, 2006.
Rhode Island Public Utilities Commission (Docket No. 3779): Oral testimony regarding the settlement of
Narragansett Electric Company’s 2007 Demand‐Side Management Programs. On behalf of the Division
of Public Utilities and Carriers. November 24, 2006.
Nevada Public Utilities Commission (Docket Nos. 06‐04002 & 06‐04005): Direct testimony regarding
Nevada Power Company’s and Sierra Pacific Power Company’s Renewable Portfolio Standard Annual
Report. On behalf of the Nevada Bureau of Consumer Protection. October 26, 2006
Nevada Public Utilities Commission (Docket No. 06‐06051): Direct testimony regarding Nevada Power
Company’s Demand‐Side Management Plan in the 2006 Integrated Resource Plan. On behalf of the
Nevada Bureau of Consumer Protection. September 13, 2006.
Nevada Public Utilities Commission (Docket Nos. 06‐03038 & 06‐04018): Direct testimony regarding
the Nevada Power Company’s and Sierra Pacific Power Company’s Demand‐Side Management Plans. On
behalf of the Nevada Bureau of Consumer Protection. June 20, 2006.
Nevada Public Utilities Commission (Docket No. 05‐10021): Direct testimony regarding the Sierra
Pacific Power Company’s Gas Demand‐Side Management Plan. On behalf of the Nevada Bureau of
Consumer Protection. February 22, 2006.
South Dakota Public Utilities Commission (Docket No. EL04‐016): Direct testimony regarding the
avoided costs of the Java Wind Project. On behalf of the South Dakota Public Utilities Commission Staff.
February 18, 2005.
118

Tim Woolf page 11 of 20
Rhode Island Public Utilities Commission (Docket No. 3635): Oral testimony regarding the settlement of
Narragansett Electric Company’s 2005 Demand‐Side Management Programs. On behalf of the Division
of Public Utilities and Carriers. November 29, 2004.
British Columbia Utilities Commission. Direct testimony regarding the Power Smart programs contained
in BC Hydro’s Revenue Requirement Application 2004/05 and 2005/06. On behalf of the Sierra Club of
Canada, BC Chapter. April 20, 2004.
Maryland Public Utilities Commission (Case No. 8973): Oral testimony regarding proposals for the PJM
Generation Attributes Tracking System. On behalf of the Maryland Office of People's Counsel. December
3, 2003.
Rhode Island Public Utilities Commission (Docket No. 3463): Oral testimony regarding the settlement of
Narragansett Electric Company’s 2004 Demand‐Side Management Programs. On behalf of the Division
of Public Utilities and Carriers. November 21, 2003.
California Public Utilities Commission (Rulemaking 01‐10‐024): Direct testimony regarding the market
price benchmark for the California renewable portfolio standard. On behalf of the Union of Concerned
Scientists. April 1, 2003.
Québec Régie de l'énergie (Docket R‐3473‐01): Direct testimony with Philp Raphals regarding Hydro‐
Québec’s Energy Efficiency Plan: 2003‐2006. On behalf of Regroupment national des Conseils régionaux
de l’environnement du Québec. February 5, 2003.
Connecticut Department of Public Utility Control (Docket No. 01‐10‐10): Direct testimony regarding the
United Illuminating Company’s service quality performance standards in their performance‐based
ratemaking mechanism. On behalf of the Connecticut Office of Consumer Counsel. April 2, 2002.
Nevada Public Utilities Commission (Docket No. 01‐7016): Direct testimony regarding the Nevada
Power Company’s Demand‐Side Management Plan. On behalf of the Bureau of Consumer Protection,
Office of the Attorney General. September 26, 2001.
United States Department of Energy (Docket Number‐EE‐RM‐500): Comments with Bruce Biewald,
Daniel Allen, David White, and Lucy Johnston of Synapse Energy Economics regarding the Department of
Energy’s proposed rules for efficiency standards for central air conditioners and heat pumps. On behalf
of the Appliance Standards Awareness Project. December 2000.
US Department of Energy (Docket EE‐RM‐500): Oral testimony at a public hearing on marginal price
assumptions for assessing new appliance efficiency standards. On behalf of the Appliance Standards
Awareness Project. November 2000.
Connecticut Department of Public Utility Control (Docket No. 99‐09‐03 Phase II): Direct testimony
regarding Connecticut Natural Gas Company’s proposed performance‐based ratemaking mechanism. On
behalf of the Connecticut Office of Consumer Counsel. September 25, 2000.
119

Tim Woolf page 12 of 20
Mississippi Public Service Commission (Docket No. 96‐UA‐389): Oral testimony regarding generation
pricing and performance‐based ratemaking. On behalf of the Mississippi Attorney General. February 16,
2000.
Delaware Public Service Commission (Docket No. 99‐328): Direct testimony regarding maintaining
electric system reliability. On behalf of Delaware Public Service Commission Staff. February 2, 2000.
Delaware Public Service Commission (Docket No. 99‐328): Filed expert report (“Investigation into the
July 1999 Outages and General Service Reliability of Delmarva Power & Light Company,” jointly authored
with J. Duncan Glover and Alexander Kusko). Synapse Energy Economics and Exponent Failure Analysis
Associates on behalf the Delaware Public Service Commission Staff. February 1, 2000.
New Hampshire Public Service Commission (Docket No. 99‐099 Phase II): Oral testimony regarding
standard offer services. On behalf of the Campaign for Ratepayers Rights. January 14, 2000.
West Virginia Public Service Commission (Case No. 98‐0452‐E‐GI): Rebuttal testimony regarding codes
of conduct. On behalf of the West Virginia Consumer Advocate Division. July 15, 1999.
West Virginia Public Service Commission (Case No. 98‐0452‐E‐GI): Direct testimony regarding codes of
conduct and other measures to protect consumers in a restructured electricity industry. On behalf of the
West Virginia Consumer Advocate Division. June 15, 1999.
Public Service Commission of West Virginia (Case No. 98‐0452‐E‐GI ): Filed expert report (“Measures to
Ensure Fair Competition and Protect Consumers in a Restructured Electricity Industry in West Virginia,”
jointly authored with Jean Ann Ramey and Theo MacGregor) in the matter of the General Investigation
to determine whether West Virginia should adopt a plan for open access to the electric power supply
market and for the development of a deregulation plan. Synapse Energy Economics and MacGregor
Energy Consultancy on behalf of the West Virginia Consumer Advocate Division. June 1999.
Massachusetts Department of Telecommunications and Energy (DPU/DTE 97‐111): Direct testimony
regarding Commonwealth Electric Company’s energy efficiency plan, and the role of municipal
aggregators in delivering demand‐side management programs. On behalf of Cape and Islands Self‐
Reliance Corporation. January 1998.
Delaware Public Service Commission (DPSC 97‐58): Direct testimony regarding Delmarva Power and
Light’s request to merge with Atlantic City Electric. On behalf of Delaware Public Service Commission
Staff. May 1997.
Delaware Public Service Commission (DPSC 95‐172): Oral testimony regarding Delmarva’s integrated
resource plan and DSM programs. On behalf of the Delaware Public Service Commission Staff. May
1996.
Colorado Public Utilities Commission (5A‐531EG): Direct testimony regarding the impact of proposed
merger on DSM, renewable resources and low‐income DSM. On behalf of the Colorado Office of Energy
Conservation. April 1996.
120

Tim Woolf page 13 of 20
Colorado Public Utilities Commission (3I‐199EG): Direct testimony regarding the impacts of increased
competition on DSM, and recommendations for how to provide utilities with incentives to implement
DSM. On behalf of the Colorado Office of Energy Conservation. June 1995.
Colorado Public Utilities Commission (5R‐071E): Oral testimony on the Commission's integrated
resource planning rules. On behalf of the Colorado Office of Energy Conservation. July 1995.
Colorado Public Utilities Commission (3I‐098E): Direct testimony on the Public Service Company of
Colorado's DSM programs and integrated resource plans. On behalf of the Colorado Office of Energy
Conservation. April 1994.
Delaware Public Service Commission (Docket No. 96‐83): Filed comments regarding the Investigation of
Restructuring the Electricity Industry in Delaware (Tellus Institute Study No. 96‐99). On behalf of the
Staff of the Delaware Public Service Commission. November 1996.
Colorado Public Utilities Commission (Docket No. 96Q‐313E): Filed comments in response to the
Questionnaire on Electricity Industry Restructuring (Tellus Institute Study No. 96‐130‐A3). On behalf of
the Colorado Governor's Office of Energy Conservation. October 1996.
State of Vermont Public Service Board (Docket No. 5854): Filed expert report (Tellus Institute Study No.
95‐308) regarding the Investigation into the Restructuring of the Electric Utility Industry in Vermont. On
behalf of the Vermont Department of Public Service. March 1996.
Pennsylvania Public Utility Commission (Docket No. I‐00940032): Filed comments (Tellus Institute
Study No. 95‐260) regarding an Investigation into Electric Power Competition. On behalf of The
Pennsylvania Office of Consumer Advocate. November 1995.
New Jersey Board of Public Utilities (Docket No. EX94120585Y): Initial and reply comments (“Achieving
Efficiency and Equity in the Electricity Industry Through Unbundling and Customer Choice,” Tellus
Institute Study No. 95‐029‐A3) regarding an investigation into the future structure of the electric power
industry. On behalf of the New Jersey Division of Ratepayer Advocate. September 1995.
ARTICLES
Woolf, T., E. Malone, C. Neme, R. LeBaron. 2014. “Unleashing Energy Efficiency.” Public Utilities
Fortnightly, October, 30‐38.
Woolf, T., A. Sommer, J. Nielson, D. Berry, R. Lehr. 2005. “Managing Electricity Industry Risk with Clean
and Efficient Resources.” The Electricity Journal 18 (2): 78‒84.
Woolf, T., A. Sommer. 2004. “Local Policy Measures to Improve Air Quality: A Case Study of Queens
County, New York.” Local Environment 9 (1): 89‒95.
Woolf, T. 2001. “Clean Power Opportunities and Solutions: An Example from America’s Heartland.” The
Electricity Journal 14 (6): 85‒91.
121

Tim Woolf page 14 of 20
Woolf, T. 2001. “What’s New With Energy Efficiency Programs.” Energy & Utility Update, National
Consumer Law Center: Summer 2001.
Woolf T., B. Biewald. 2000. “Electricity Market Distortions Associated With Inconsistent Air Quality
Regulations.” The Electricity Journal 13 (3): 42‒49.
Ackerman, F., B. Biewald, D. White, T. Woolf, W. Moomaw. 1999. “Grandfathering and Coal Plant
Emissions: the Cost of Cleaning Up the Clean Air Act.” Energy Policy 27 (15): 929‒940.
Biewald, B., D. White, T. Woolf. 1999. “Follow the Money: A Method for Tracking Electricity for
Environmental Disclosure.” The Electricity Journal 12 (4): 55‒60.
Woolf, T., B. Biewald. 1998. “Efficiency, Renewables and Gas: Restructuring As if Climate Mattered.” The
Electricity Journal 11 (1): 64‒72.
Woolf, T., J. Michals. 1996. “Flexible Pricing and PBR: Making Rate Discounts Fair for Core Customers.”
Public Utilities Fortnightly, July 1996.
Woolf, T., J. Michals. 1995. “Performance‐Based Ratemaking: Opportunities and Risks in a Competitive
Electricity Industry.” The Electricity Journal 8 (8): 64‒72.
Woolf, T. 1994. “Retail Competition in the Electricity Industry: Lessons from the United Kingdom.” The
Electricity Journal 7 (5): 56‒63.
Woolf, T. 1994. “A Dialogue About the Industry's Future.” The Electricity Journal 7 (5).
Woolf, T., E. D. Lutz. 1993. “Energy Efficiency in Britain: Creating Profitable Alternatives.” Utilities Policy
3 (3): 233‒242.
Woolf, T. 1993. “It is Time to Account for the Environmental Costs of Energy Resources.” Energy and
Environment 4 (1): 1‒29.
Woolf, T. 1992. “Developing Integrated Resource Planning Policies in the European Community.” Review
of European Community & International Environmental Law 1 (2) 118‒125.
PRESENTATIONS
Woolf, T., M. Whited. 2016. “Show Me the Numbers: A Framework for Balanced Distributed Solar
Policies.” Presentation for Consumers Union Webinar, December 2016.
Woolf, T. 2016. “Show Me the Numbers: Balancing Solar DG with Consumer Protection.” Public
workshop on solar distributed generation for the Federal Trade Commission, June 2016.
Woolf, T. 2016. “Rate Designs for Distributed Generation: State Activities & A New Framework.”
Presentation at the NASUCA 2016 Mid‐Year Meeting, June 2016.
Woolf, T., M. Whited. 2016. “3rd Annual 21st Century Electricity System Workshop – Implications of
Different Rate Designs.” Presentation at the Advanced Energy Economy Institute, April 2016.
122

Tim Woolf page 15 of 20
Woolf, T., M. Whited. 2016. “Decoupling in Pennsylvania: Advantages, Disadvantages, and Design
Issues.” Presentation to Pennsylvania Decoupling Stakeholders, February 2016.
Woolf, T. 2016. “Earnings Impact Mechanisms: Energy Efficiency.” Presentation at the New York REV
Technical Conference, January 2016.
Lowry, M. N., T. Woolf. 2015. “Performance‐Based Regulation in a High Distributed Energy Resources
Future.” Webinar on January 2016.
Woolf, T. 2015. “Performance Incentive Mechanisms: A Catalyst for Change.” Webinar for Power Sector
Transformation Group, December 2015.
Woof, T. 2015. “Energy Efficiency Valuation: Boogie Men, Time Warps, and other Terrifying Pitfalls.”
Presentation at ACEEE Conference on Energy Efficiency as a Resource, September 2015.
Woolf, T., M. Whited, A. Napoleon. 2015. “Thoughts on How to Design Clean Energy Performance
Incentive Mechanisms.” Webinar for the Western Clean Energy Advocates, April 2015.
Woolf, T. 2015. “Properly Valuing the Benefits and Costs of Energy Efficiency.” Presentation at the 2015
National Efficiency Advocates Meeting, April 2015.
Woolf, T. 2015. “Non‐Energy Benefits & Efficiency Program Screening.” Presentation for Georgia DSM
Work Group, March 2015.
Woolf, T. 2014. “Performance Incentive Mechanisms And Their Role in New Regulatory Models.”
Presentation at Acadia Center Conference, Envisioning Our Energy Future, December 2014.
Woolf, T., M. Whited., A. Napoleon. 2014. “Guiding Utility Performance: A Handbook for Regulators.”
Webinar for the Western Interstate Energy Board, December 2014.
Woolf, T. 2014. “Planning for Distributed Energy Resources.” Presentation for Advanced Energy
Economy Webinar, November 2014.
Woolf, T. 2014. “Benefit‐Cost Analysis for Distributed Energy Resources in New York: A Framework for
Accounting for All Relevant Costs and Benefits.” Presentation to NARUC ERE Committee, November
2014.
Woolf, T. 2014. “Presenting the Full Value of Energy Efficiency: Creating a Better Message.” Presentation
at Sierra Club Beyond Coal Conference, October 2014.
Woolf, T., C. Neme. 2014. “Regulatory Policies to Support Energy Efficiency in Virginia.” Presentation for
the 2014 Virginia Energy Efficiency Workshop, October 2014.
Woolf, T. 2014. “Benefit‐Cost Analysis for Distributed Energy Resources in New York: A Framework for
Accounting for All Relevant Costs and Benefits.” Presentation for Advanced Energy Economy Institute,
October 2014.
123

Tim Woolf page 16 of 20
Woolf, T. 2014. “Performance Incentive Mechanisms: Digging Deeper Into Performance‐Based
Regulation.” Presentation for National Governor’s Association Conference: Utility Business Models That
Align with State Clean Energy Goals, September 2014.
Woolf, T. 2014. “The Resource Value Framework: Reforming Energy Efficiency Cost‐Effectiveness
Screening.” Presentation at the ACEEE Summer Study, August 2014.
Woolf, T. 2014. “Cost‐Effectiveness of Demand Response.” Presentation at MADRI Working Group
Meeting #34, July 2014.
Woolf, T. 2014. “Time to Overhaul Our Energy Efficiency Screening Practices.” Presentation for U.S.
Environmental Protection Agency Energy Efficiency Cost‐Effectiveness Webinar, January 2014.
Woolf, T. 2013. “Survey of Energy Efficiency Screening Practices in the Northeast and Mid‐Atlantic.”
Presentation for Northeast Energy Efficiency Partnerships EM&V Forum Annual Public Meeting,
December 2013.
Woolf, T. 2013. “Recommendations for Reforming Energy Efficiency Cost‐Effectiveness Screening in the
United States.” Presentation at the National Association of Regulatory Commissioners Annual Meeting,
November 2013.
Woolf, T. 2013. “Energy Efficiency Program Screening: Let’s Get Beyond the TRC Test.” Presentation for
7th Annual ENERGY STAR Certified Homes Utility Sponsor Meeting, October 2013.
Woolf, T. 2013. “Decoupling in Maine: Why Decoupling is in Consumers’ Interest.” Presentation for
Office of Public Advocate‐ Decoupling Debate, October 2013.
Woolf, T. 2013. “NHPC Efficiency Screening Initiative: Unleashing the Potential for Energy Efficiency.”
Presentation for Advocates Meeting, September 2013.
Woolf, T. 2013. “Energy Efficiency: Rate, Bill and Participation Impacts.” Presentation for ACEEE’s Energy
Efficiency as a Resource Conference, September 2013.
Woof, T. 2013. “Energy Efficiency Screening: Challenges and Opportunities.” Presentation for NARUC
Summer Meeting Consumer Affairs Panel, July 2013.
Woolf, T., R. Sedano. 2013. “Decoupling Overview.” Presentation for Finding Common Ground Meeting,
July 2013.
Woolf, T. 2013. “Utility Incentives for Energy Efficiency.” Presentation for Finding Common Ground
Meeting, July 2013.
Woolf, T. 2013. “Energy Efficiency: Rate, Bill and Participation Impacts.” Presentation for State Energy
Efficiency Action Webinar, June 2013.
Woolf, T., B. Biewald, and J. Migden‐Ostrander. 2013. “NARUC Risk Workshop for Regulators.”
Presentation at the Mid‐Atlantic Conference of Regulatory Utility Commissioners, June 2013.
124

Tim Woolf page 17 of 20
Woolf, T. 2013. “Energy Efficiency Screening: Accounting for ‘Other Program Impacts’ & Environmental
Compliance Costs.” Presentation for the Consortium for Energy Efficiency Summer Meeting, May 2013.
Woolf, T. 2013. “Best Practices in Energy Efficiency Program Screening.” Presentation at ACI National
Home Performance Conference, May 2013.
Woolf, T. 2013. “Utility Shareholder Incentives to Support Energy Efficiency Programs.” Presentation to
Common Ground, May 2013.
Woolf, T. 2013. “Energy Efficiency Screening: Accounting for ‘Other Program Impacts’ & Environmental
Compliance Costs.” Presentation for Regulatory Assistance Project Webinar, March 2013.
Woolf, T. 2013. “Energy Efficiency: Rates, Bills, Participants, Screening, and More.” Presentation at
Connecticut Energy Efficiency Workshop, March 2013.
Woolf T. 2013. “Best Practices in Energy Efficiency Program Screening.” Presentation for SEE Action
Webinar, March 2013.
Woolf, T. 2013. “Energy Efficiency: Rates, Bills and Participants.” Presentation for Rhode Island Energy
Efficiency Collaborative, February 2013.
Woolf, T. 2013. “Energy Efficiency Screening: Application of the TRC Test.” Presentation for Energy
Advocates Webinar, January 2013.
Woolf, T. 2012. “Best Practices in Energy Efficiency Program Screening.” Presentation for American
Council for an Energy‐Efficient Economy Webinar, December 2012.
Woolf, T. 2012. Indian Point Replacement Analysis: A Clean Energy Roadmap. Presentation for Natural
Resource Defenses Council and Environmental Entrepreneurs, November 2012.
Woolf, T. 2012. “In Pursuit of All Cost‐Effective Energy Efficiency.” Presentation at Sierra Club Boot
Camp, October 2012.
Woolf, T. 2012. “Best Practices in Energy Efficiency Program Screening.” Webinar for Northeast Energy
Efficiency Partnerships, September 2012.
Woolf, T., L. Schwartz. “What Remains to be Done with Demand Response? A National Forum from the
FERC National Action Plan on Demand Response Tries to Give an Answer.” Presentation at NARUC
National Town Meeting on Demand Response, July 2012.
Woolf, T. 2012. “Best Practices in Energy Efficiency Program Screening.” Presentation at NARUC Summer
Meetings ‒ Energy Efficiency Cost‐Effectiveness Breakfast, July 2012.
Woolf, T. 2012. “Avoided Cost of Complying with Environmental Regulations in MA.” Presentation for
Mass Energy Consumer’s Alliance, January 2012.
Woolf, T. 2011. “Energy Efficiency Cost‐Effectiveness Tests.” Presentation at the Northeast Energy
Efficiency Partnerships Annual Meeting, October 2011.
125

Tim Woolf page 18 of 20
Woolf, T. 2011. “Why Consumer Advocates Should Support Decoupling.” Presentation at the 2011
ACEEE National Conference on Energy Efficiency as a Resource, September 2011.
Woolf, T. 2011. “A Regulator’s Perspective on Energy Efficiency.” Presentation at the Efficiency Maine
Symposium In Pursuit of Maine’s Least‐Cost Energy, September 2011.
Woolf, T. 2010. “Bill Impacts of Energy Efficiency Programs: The Importance of Analyzing and Managing
Rate and Bill Impacts.” Presentation at the Energy in the Northeast Conference, Law Seminar
International, September 2010.
Woolf, T. 2010. “Bill Impacts of Energy Efficiency Programs: The Implications of Bill Impacts in
Developing Policies to Motivate Utilities to Implement Energy Efficiency.” Presentation to the State
Energy Efficiency Action Network, Utility Motivation Work Group, November 2010.
Woolf, T. 2010. “Bill Impacts of Energy Efficiency Programs.” Presentation to the Energy Resources and
Environment Committee at the NARUC Winter Meetings, February 2010.
Woolf, T. 2009. “Price‐Responsive Demand in the New England Wholesale Energy Market: Description of
NECPUC’s Limited Supply‐Side Proposal.” Presentation at the NEPOOL Markets Committee Meeting,
November 2009.
Woolf, T. 2009. “Demand Response in the New England Wholesale Energy Market: How Much Should
We Pay for Demand Resources?” Presentation at the New England Electricity Restructuring Roundtable,
October 2009.
Woolf, T. 2008. “Promoting Demand Resources in Massachusetts: A Regulator’s Perspective.”
Presentation at the Energy Bar Association, Northeast Chapter Meeting, June 2008.
Woolf, T. 2008. “Turbo‐Charging Energy Efficiency in Massachusetts: A DPU Perspective.” Presentation
at the New England Electricity Restructuring Roundtable, April 2008.
Woolf T. 2002. “A Renewable Portfolio Standard for New Brunswick.” Presentation to the New
Brunswick Market Design Committee, January 10, 2002.
Woolf, T. 2001. “Potential for Wind and Renewable Resource Development in the Midwest.”
Presentation at WINDPOWER 2001 in Washington DC, June 7, 2001.
Woolf T. 1999. “Challenges Faced by Clean Generation Resources Under Electricity Restructuring.”
Presentation at the Symposium on the Changing Electric System in Florida and What it Means for the
Environment in Tallahassee, FL, November 1999.
Woolf, T. 2000. “Generation Information Systems to Support Renewable Portfolio Standards, Generation
Performance Standards and Environmental Disclosure.” Presentation at the Massachusetts
Restructuring Roundtable on behalf of the Union of Concerned Scientists, March 2000.
126

Tim Woolf page 19 of 20
Woolf, T. 1998. “New England Tracking System Project: An Electricity Tracking System to Support a Wide
Range of Restructuring‐Related Policies.” Presentation at the Ninth Annual Energy Services Conference
and Exposition in Orlando, FL, December 1998.
Woolf, T. 2000. “Comments of the Citizens Action Coalition of Indiana.” Presentation at Workshop on
Alternatives to Traditional Generation Resources, June 2000.
Woolf, T. 1996. “Overview of IRP and Introduction to Electricity Industry Restructuring.” Training session
provided to the staff of the Delaware Public Service Commission, April 1996.
Woolf, T. 1995. “Competition and Regulation in the UK Electric Industry.” Presentation at the Illinois
Commerce Commission's workshop on Restructuring the Electric Industry, August 1995.
Woolf, T. 1995. “Competition and Regulation in the UK Electric Industry.” Presentation at the British
Columbia Utilities Commission Electricity Market Review, February 1995.
Resume dated March 2018
127


Before the Rhode Island Public Utilities Commission
Proceeding on the Narragansett Electric ) Company d/b/a National Grid Proposed ) Docket No. 4770 Tariff Changes )
Direct Testimony of Tim Woolf and Melissa Whited
On Behalf of The Division of Public Utilities and Carriers
April 6, 2018
128

Table of Contents
1. INTRODUCTION AND QUALIFICATIONS ........................................................................ 1
2. SUMMARY OF CONCLUSIONS AND RECOMMENDATIONS ....................................... 4
3. THE ROLE OF PERFORMANCE INCENTIVE MECHANISMS ......................................... 8
4. THE DIVISION’S PERFORMANCE INCENTIVE MECHANISM PROPOSAL ............... 12 4.1. Summary of the Division PIM Proposal ................................................................... 12 4.2. Implications for the Authorized Return on Equity ................................................... 15 4.3. Principles and Methodology for Developing the Division’s Proposal ..................... 19 4.4. Division’s Proposed System Efficiency PIMs .......................................................... 27 4.5. Division’s Proposed Distributed Energy Resource PIMs ......................................... 34 4.6. Division’s Proposed Power Sector Transformation Support PIMs .......................... 45 4.7. Process for Reviewing PIMs and Recovering Incentives ......................................... 51
5. NATIONAL GRID’S PERFORMANCE INCENTIVE MECHANISM ............................... 55 5.1. National Grid’s Proposal ........................................................................................... 55 5.2. Critique of National Grid’s Proposal ........................................................................ 63
6. NEW GRID MODERNIZATION INVESTMENTS ............................................................. 70 6.1. National Grid’s Proposal ........................................................................................... 70 6.2. Integration of Distribution System Planning and Review ........................................ 72 6.3. Recommendations ..................................................................................................... 73
7. ADVANCED METERING FUNCTIONALITY ................................................................... 74 7.1. National Grid’s Proposal ........................................................................................... 74 7.2. The AMF Study ........................................................................................................ 76 7.3. Recommendations ..................................................................................................... 81
8. BENEFIT-COST ANALYSES ............................................................................................... 81 8.1. The Role of Benefit-Cost Analyses .......................................................................... 81 8.2. National Grid’s Benefit-Cost Analyses .................................................................... 84 8.3. Critique of National Grid’s Benefit-Cost Analysis ................................................... 89
129

8.4. Recommendations ..................................................................................................... 93
Exhibit TW/MW-1: Resume of Tim Woolf
Exhibit TW/MW-2: Resume of Melissa Whited
Exhibit TW/MW-3: Assumptions for the BCA Used to Determine PIM Incentive Levels
Exhibit TW/MW-4: Workbook Containing PIM Incentive Calculations
130

Direct Testimony of Tim Woolf and Melissa Whited Page 1
1. INTRODUCTION AND QUALIFICATIONS 1
Q. Please state your name, title, and employer. 2
A. Mr. Woolf: My name is Tim Woolf. I am the Vice President at Synapse Energy 3
Economics, located at 485 Massachusetts Avenue, Cambridge, MA 02139. 4
A. Ms. Whited: My name is Melissa Whited. I am a Principal Associate at Synapse Energy 5
Economics, located at 485 Massachusetts Avenue, Cambridge, MA 02139. 6
Q. Please describe Synapse Energy Economics. 7
A. Synapse Energy Economics is a research and consulting firm specializing in electricity 8
and gas industry regulation, planning, and analysis. Our work covers a range of issues, 9
including economic and technical assessments of demand-side and supply-side energy 10
resources; energy efficiency policies and programs; integrated resource planning; 11
electricity market modeling and assessment; renewable resource technologies and 12
policies; and climate change strategies. Synapse works for a wide range of clients, 13
including state attorneys general, offices of consumer advocates, trade associations, 14
public utility commissions, environmental advocates, the U.S. Environmental Protection 15
Agency, U.S. Department of Energy, U.S. Department of Justice, the Federal Trade 16
Commission, and the National Association of Regulatory Utility Commissioners. 17
Synapse has over 25 professional staff with extensive experience in the electricity 18
industry. 19
Q. Please summarize your professional and educational experience. 20
A. Mr. Woolf: Before joining Synapse Energy Economics, I was a commissioner at the 21
Massachusetts Department of Public Utilities (DPU) from 2007 through 2011. In that 22
131

Direct Testimony of Tim Woolf and Melissa Whited Page 2
capacity, I was responsible for overseeing a substantial expansion of clean energy 1
policies, including significantly increased ratepayer-funded energy efficiency programs; 2
an update of the DPU energy efficiency guidelines; the implementation of decoupled 3
rates for electric and gas companies; the promulgation of net metering regulations; review 4
and approval of smart grid pilot programs; and review and approval of long-term 5
contracts for renewable power. I was also responsible for overseeing a variety of other 6
dockets before the Commission, including several electric and gas utility rate cases. 7
Prior to being a commissioner at the Massachusetts DPU, I was employed as the Vice 8
President at Synapse Energy Economics; a Manager at Tellus Institute; the Research 9
Director at the Association for the Conservation of Energy; a Staff Economist at the 10
Massachusetts Department of Public Utilities; and a Policy Analyst at the Massachusetts 11
Executive Office of Energy Resources. 12
I hold a Masters in Business Administration from Boston University, a Diploma in 13
Economics from the London School of Economics, a BS in Mechanical Engineering and 14
a BA in English from Tufts University. My resume is attached as Exhibit TW/MW-1. 15
A. Ms. Whited: I have seven years of experience in economic research and consulting. At 16
Synapse, I have worked extensively on issues related to utility regulatory models, rate 17
design, policies to address distributed energy resources (DER), and market power. I have 18
testified before the Massachusetts Department of Public Utilities, the Hawaii Public 19
Utilities Commission, the Public Service Commission of Utah, the Public Utility 20
Commission of Texas, the Virginia State Corporation Commission, and the Federal 21
Energy Regulatory Commission. 22
132

Direct Testimony of Tim Woolf and Melissa Whited Page 3
I hold a Master of Arts in Agricultural and Applied Economics and a Master of Science 1
in Environment and Resources, both from the University of Wisconsin-Madison. Prior to 2
rejoining Synapse, I published an article in the Journal of Regional Analysis and Policy 3
regarding the economic impacts of water transfers, analyzed state water efficiency 4
policies while at the Wisconsin Public Service Commission, and conducted econometric 5
analyses of energy efficiency cost-effectiveness. My resume is attached as Exhibit 6
TW/MW-2. 7
Q. On whose behalf are you testifying in this case? 8
A. We are testifying on behalf of the Division of Public Utilities and Carriers (the Division). 9
Q. Have you previously testified before the Rhode Island Public Utilities Commission? 10
A. Mr. Woolf: Yes. I have testified before the Rhode Island Public Utilities Commission 11
(the Commission) on behalf of the Division in National Grid’s (the Company’s) Energy 12
Efficiency and System Reliability Plans. I was an active member of the Docket 4600 13
Working Group, and I assisted the Division with the Rhode Island Power Sector 14
Transformation report recently submitted to Governor Raimondo. I also recently testified 15
before the Commission on behalf of the Division in Docket 4783 on National Grid’s 16
proposed advanced metering (AMF) pilot. 17
Ms. Whited: Yes. I recently testified before the Commission on behalf of the Division in 18
Docket 4783 on National Grid’s proposed AMF pilot. 19
Q. What is the purpose of your testimony? 20
A. The purpose of our testimony is to review and comment on several topics that are directly 21
related to rate case issues in this docket and are contained in the joint pre-filed direct 22
133

Direct Testimony of Tim Woolf and Melissa Whited Page 4
testimony of National Grid’s Power Sector Transformation (PST) Panel (the Panel). We 1
address the Company’s proposed performance incentive mechanisms (PIMs), because 2
these are integrally related to the authorized ROE that will be set in this rate case. We 3
address the Company’s benefit-cost analyses (BCA), because these are used to determine 4
the PIM incentives that will affect the authorized ROE. We also address the Company’s 5
request for recovery of costs for the AMF study and for the distributed energy resources 6
(DER) enablement investments, because recovery of these costs will affect the revenue 7
requirements that are approved in this rate case. 8
Q. Is the Division sponsoring other witnesses that address issues related to your 9
testimony? 10
A. Yes. The following Division witnesses address issues that are related to our testimony: 11
Tim Woolf provides an overview of the Division’s case in this docket. It 12
introduces all of the Division’s witnesses, presents the Division’s overarching 13
vision for power sector transformation, and addresses the role of multi-year rate 14
plans in achieving that vision. 15
Matt Kahal addresses cost of capital and return on equity (ROE) issues. 16
Greg Booth addresses several elements of National Grid’s Power Sector 17
Transformation Plan that relate to this rate case, including advanced metering 18
functionality and the grid modernization elements. 19
Roger Colton addresses low-income issues, including those related to the A60 20
low-income discount rate. 21
2. SUMMARY OF CONCLUSIONS AND RECOMMENDATIONS 22
Q. Please summarize your conclusions. 23
A. Our conclusions are summarized as follows: 24
134

Direct Testimony of Tim Woolf and Melissa Whited Page 5
The amount of change and evolution in today’s power sector requires a more 1
integrated, long-term approach to utility planning and ratemaking, relative to 2
historical practices. All National Grid’s planning initiatives (energy efficiency, 3
system reliability and procurement, conventional distribution projects, grid 4
modernization, power sector transformation) should be planned for, reviewed by 5
stakeholders, and treated by the Commission in a more holistic way. 6
Performance incentive mechanisms should play an integral role in the overall 7
ratemaking approach used to achieve power sector transformation goals. PIMs 8
can align utility financial incentives with regulatory priorities and offset some of 9
the existing incentives that emphasize capital investments and hinders utility 10
investment in DERs. 11
PIMs are directly related to a utility’s authorized ROE, because they both provide 12
shareholder revenues and incentivize utility management decisions. These two 13
topics must be addressed by the Commission together in a rate case, to promote 14
economic decision-making, achieve desired performance outcomes, and avoid 15
over-recovery (or under-recovery) of revenues by the Company. 16
The shareholder revenues provided by existing and proposed PIMs will be 17
significant enough to warrant the Commission establishing National Grid’s 18
authorized ROE at the lower end of the reasonable cost of equity range. Such a 19
shifting of revenue sources will mitigate the Company’s incentive to increase rate 20
base and focus management’s attention on achieving power sector transformation 21
goals. 22
National Grid’s proposed PIMs are a reasonable attempt to improve the 23
Company’s incentives, consistent with the PST Report. However, many of them 24
suffer from some critical design flaws. In particular: 25
o The baseline for the FCM and the Transmission PIMs are based on a 26
historical year, which does not properly account for the natural variations 27
in the relevant metric. 28
135

Direct Testimony of Tim Woolf and Melissa Whited Page 6
o The Company does not have a forecast for its transmission peaks, which 1
makes it difficult to determine reasonable targets. 2
o Several of the Company’s PIMs have metrics that are not directly related 3
to the desired outcome or are not needed because they address activities 4
that the Company should be doing anyway. 5
The Company’s “new grid modernization” (i.e.,“DER-enabling”) investments 6
should not be treated separately from conventional investments or PST-related 7
investments, either in terms of planning, regulatory oversight, or cost recovery. 8
AMF can play a critical, foundational role in transforming the RI power sector, 9
and will be necessary to achieve the outcomes and goals articulated by the Docket 10
4600 Working Group and the Commission’s Guidance Document, particularly the 11
goal of implementing time-varying rates. National Grid’s BCA indicates that 12
AMF could be cost-effective under several likely scenarios. 13
National Grid’s proposal to study AMF is an important step toward implementing 14
AMF and achieving power sector transformation goals. However, the Division 15
concludes that this study should be done for less than the $2 million asked for by 16
the Company and should include examination of shared communications and 17
third-party ownership models. 18
National Grid’s BCAs have limited value for determining the magnitude of PIM 19
incentives because they do not include some important benefits and they use 20
outdated avoided costs. 21
Q. Please summarize your recommendations. 22
A. Our recommendations are summarized as follows: 23
The Commission should address National Grid’s proposed PIMs in this rate case 24
docket, to ensure that decisions regarding the Company’s authorized ROE fully 25
account for the shareholder revenues and the financial incentive implications of 26
the PIMs. 27
136

Direct Testimony of Tim Woolf and Melissa Whited Page 7
The Commission should adopt the set of PIMs proposed by the Division, as 1
described in detail in our testimony below. Table 1 provides a summary of the 2
Division’s proposed PIMs. 3
Table 1. Summary of the Division’s Proposed PIMs 4
Type PIM Description
System Efficiency
Transmission Peak Reduce transmission peaks relative to forecast FCM Peak Reduce annual FCM peak relative to forecast
Distributed Energy Resources
Demand Response – Res. Increase MW enrollment in cost-effective DR Demand Response - C&I Increase MW enrollment in cost-effective DR Electric Heat Initiative Increase MW of cost-effective electric heat Electric Vehicle Initiative Reduce GHG emissions relative to baseline Behind-the-Meter Storage Install MW of cost-effective storage Utility-Scale Storage Install MW of cost-effective storage Non-Wires Alternatives Procure cost-effective NWA from third-parties
PST Support
Low Income: Participation Increase LI participation in DER initiatives Low Income: Enrollment Increase customer enrollment in LI rate A60 Customer Information Provide key data to customers and third-parties Peak Demand Forecasting Improve and expand current forecasting practices
5
The Commission should establish National Grid’s authorized ROE at the lower 6
end of the cost of equity range to (a) account for the additional shareholder 7
revenues from our proposed PIMs, and (b) mitigate the existing financial 8
incentive to increase capital investments. 9
The Commission should establish the regulatory procedures to be used to 10
implement PIMs and allow the Company to recover the PIM incentives. This 11
should include: 12
o An annual Performance Incentive Mechanism Plan that presents all of the 13
relevant metrics, targets, baselines, and incentives for the PIMs to be 14
applied in the following calendar year. 15
o An annual Performance Report that presents all of the historical data on 16
the relevant metrics, targets, baselines, and incentives for the PIMs that 17
were in place in the previous calendar year. 18
137

Direct Testimony of Tim Woolf and Melissa Whited Page 8
o An incentive recovery process that adjusts rates once per year to reflect the 1
PIM incentives earned by the Company in the previous calendar year. 2
The Commission should require the Company to file the first (i.e., 2019) PIM 3
Plan by November 31, 2018. This plan should update all elements of the 4
Company’s PIMs based on the Commission findings and directives in this docket. 5
The Commission should approve National Grid’s request for funding of the AMF 6
Study. However, the Commission should approve only $1 million of the requested 7
funds. 8
The Commission should require the Company to file grid modernization plans 9
that comprehensively and consistently evaluate all distribution system 10
opportunities over the long-term. 11
The Commission should require the Company to treat “new grid modernization” 12
investments comparably with its conventional distribution system investments. 13
3. THE ROLE OF PERFORMANCE INCENTIVE MECHANISMS 14
Q. The Commission has bifurcated the rate case docket (Docket 4770) from the power 15
sector transformation docket (Docket 4780). Why is the Division sponsoring a 16
witness to address performance incentive mechanisms in this rate case docket? 17
A. As described in the direct testimony of Mr. Woolf, PIMs should play an integral role in 18
the overall ratemaking approach used to achieve power sector transformation goals. In 19
conjunction with multi-year rate plans, PIMs can help align a utility’s financial incentives 20
with regulatory policy goals. 21
Performance incentive mechanisms and the authorized ROE serve similar and 22
inter-related functions. They both provide revenues for the Company’s shareholders, for 23
the rate year and all the years until the next rate case. They also both provide utility 24
management with financial incentives that can have a large impact on utility 25
138

Direct Testimony of Tim Woolf and Melissa Whited Page 9
performance, utility rates, and services to customers. Because of this inter-relationship, it 1
is critical for the Commission to consider the authorized ROE and the PIMs together. 2
Otherwise, the ultimate impacts of these two mechanisms treated separately could lead to 3
unintended consequences, uneconomic decision-making, undesirable performance 4
outcomes, and over-recovery (or under-recovery) of revenues by the Company. These 5
points are described in Section 4.2 6
For this reason, it is essential that the Commission consider PIMs in the context of 7
Docket 4770. When determining the authorized ROE in Docket 4770, the Commission 8
should recognize the significant amount of shareholder revenues that the Company could 9
earn from PIM incentives. As we demonstrate in Section 4.2, potential shareholders 10
revenues from existing and proposed PIMs could be 200 basis points or higher. This 11
amount of shareholder revenues is too large to be ignored by the Commission as it makes 12
important decisions regarding the Company’s authorized ROE. 13
Q. What benefits do PIMs offer over traditional ratemaking practices? 14
A. PIMs offer many advantages relative to traditional cost-of-service ratemaking, including:1 15
They help to make regulatory goals and incentives explicit. 16
They allow regulators to offset or mitigate those current financial incentives that 17
are not well aligned with the public interest. 18
They allow regulators to improve utility performance in specific areas where 19
historical performance has been unsatisfactory. 20
1 These are taken from Synapse Energy Economics, Utility Performance Incentive Mechanisms: A Handbook for Regulators,
Prepared for the Western Interstate Energy Board, March 2015, page 1.
139
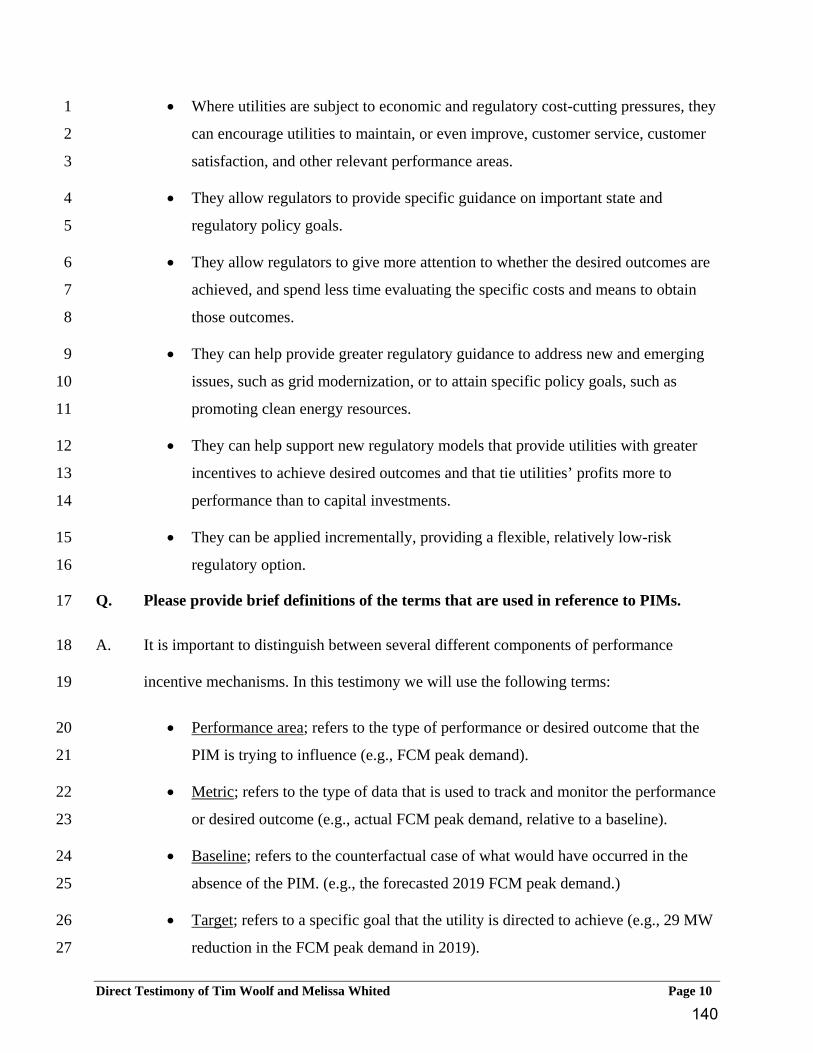
Direct Testimony of Tim Woolf and Melissa Whited Page 10
Where utilities are subject to economic and regulatory cost-cutting pressures, they 1
can encourage utilities to maintain, or even improve, customer service, customer 2
satisfaction, and other relevant performance areas. 3
They allow regulators to provide specific guidance on important state and 4
regulatory policy goals. 5
They allow regulators to give more attention to whether the desired outcomes are 6
achieved, and spend less time evaluating the specific costs and means to obtain 7
those outcomes. 8
They can help provide greater regulatory guidance to address new and emerging 9
issues, such as grid modernization, or to attain specific policy goals, such as 10
promoting clean energy resources. 11
They can help support new regulatory models that provide utilities with greater 12
incentives to achieve desired outcomes and that tie utilities’ profits more to 13
performance than to capital investments. 14
They can be applied incrementally, providing a flexible, relatively low-risk 15
regulatory option. 16
Q. Please provide brief definitions of the terms that are used in reference to PIMs. 17
A. It is important to distinguish between several different components of performance 18
incentive mechanisms. In this testimony we will use the following terms: 19
Performance area; refers to the type of performance or desired outcome that the 20
PIM is trying to influence (e.g., FCM peak demand). 21
Metric; refers to the type of data that is used to track and monitor the performance 22
or desired outcome (e.g., actual FCM peak demand, relative to a baseline). 23
Baseline; refers to the counterfactual case of what would have occurred in the 24
absence of the PIM. (e.g., the forecasted 2019 FCM peak demand.) 25
Target; refers to a specific goal that the utility is directed to achieve (e.g., 29 MW 26
reduction in the FCM peak demand in 2019). 27
140

Direct Testimony of Tim Woolf and Melissa Whited Page 11
Deadband; a deadband is a region around the target within which the Company 1
would not earn a reward (e.g., 14.5 MW below the forecasted 2019 FCM peak 2
demand). The concept of a deadband is often used to account for uncertainty 3
regarding the target or to allow for some deviation from the target due to factors 4
outside of utility control. 5
Incentive; refers to the amount of money that the utility can be rewarded for 6
performance relative to the target (e.g., five basis points for achieving the 2019 7
FCM peak demand reduction target). The financial incentive can be expressed in 8
terms of basis points on the utility’s return on equity, as we do in this testimony.2 9
Q. Why are PIMs appropriate for National Grid, given that the Company has multiple 10
statutory and regulatory obligations to provide service to customers and maintain 11
the distribution grid; including the overall obligation to provide safe, reliable, clean, 12
and affordable electricity services? 13
A. First, PIMs encourage utilities to focus on specific outcomes or goals that warrant 14
additional attention from a policy perspective, even if those outcomes or goals are 15
consistent with historical core performance areas. Utility management must balance 16
multiple objectives, and may need regulatory guidance and incentives to help prioritize 17
outcomes or goals that are important to the Commission. 18
Second, utilities currently have a financial incentive to maximize profits by 19
expanding capital investments and increasing rate base.3 This can lead to lead to undue 20
emphasis on capital investments, resulting in projects that are not least-cost for 21
customers. PIMs can be used to offset these financial incentives, and are thus a critical 22
2 Although the incentive may be expressed in terms of basis points, achievement of the incentive would be implemented
through the utility collecting the dollar equivalent, rather than by actually increasing the utility’s allowed ROE. 3 This incentive exists where the utility’s authorized ROE exceeds the cost of capital, as is often the case.
141

Direct Testimony of Tim Woolf and Melissa Whited Page 12
step toward establishing a new utility business model more aligned with power sector 1
transformation. 2
Third, PIMs can be used to encourage a utility to undertake a particular project 3
(such as a PST initiative) in a way that is most efficient, with reduced costs or increased 4
benefits or both, relative to what would occur in the absence of a PIM. 5
Q. The Division addressed PIMs in the Power Sector Transformation Phase I Report. 6
Does the current proposal differ from that described in the PST Report? 7
A. Yes. Although the overall approach to PIMs remains consistent, the proposal has 8
naturally evolved since November 2017 based on information gained from the Company 9
through the discovery process and from the analysis described in this testimony and 10
manifest in Exhibit 4. 11
4. THE DIVISION’S PERFORMANCE INCENTIVE MECHANISM PROPOSAL 12
4.1. Summary of the Division PIM Proposal 13
Q. Please provide a brief summary of the Division’s PIM proposal. 14
A. The Division’s proposal is summarized in Table 2, Table 3, Table 4, and Figure 1. Our 15
proposal builds off National Grid’s PIM proposal in many ways. The primary areas 16
where we deviate from the Company are in some of the baselines, some of the metrics, 17
some of the targets, and in the BCA used to determine PIM incentives. Additional details 18
for the Division’s proposal are provided in Sections 4.4, 4.5, and 4.6 below. 19
142

Direct Testimony of Tim Woolf and Melissa Whited Page 13
Table 2. The Division’s Proposed PIMs 1
Type PIM Description
System Efficiency
Transmission Peak Reduce monthly transmission peaks relative to forecast FCM Peak Reduce annual FCM peak relative to forecast
Distributed Energy Resources
Demand Response – Res. Increase MW enrollment in cost-effective DR Demand Response - C&I Increase MW enrollment in cost-effective DR Electric Heat Initiative Reduce GHG emissions relative to baseline Electric Vehicle Initiative Reduce GHG emissions relative to baseline Behind-the-Meter Storage Install MW of cost-effective storage Utility-Scale Storage Install MW of cost-effective storage Non-Wires Alternatives Procure cost-effective NWA from third-parties
PST Support
Low Income: Participation Increase LI participation in DER initiatives Low Income: Enrollment Increase customer enrollment in LI rate A60 Customer Information Provide key data to customers and third-parties Peak Demand Forecasting Improve and expand current forecasting practices
2
Table 3. Division’s Proposed PIM Targets 3
Type PIM 2019 (med)
2019 (high)
2020 (med)
2020 (high)
2021 (med)
2021 (high)
System Efficiency
Transmission Peak (Avg MW/mo) 21 31 23 35 26 39 FCM Peak 29 44 31 46 32 48 Subtotal
Distributed Energy Resources
DR: Residential (MW) 1 2 2 3 3 4 DR: C&I (MW) 8 14 10 16 12 18 Electric Heat Initiative (GHG) 464 556 580 696 595 714 Electric Vehicles (GHG) 557 1,114 757 1,511 1,026 2,051 BTM Storage (MW) 1 2 1 2 1 2 Utility-Scale Storage (MW) 3 6 3 6 3 6 Non-Wires Alternatives (MW) 3 6 3 6 3 6 Subtotal
PST Support
LI: PST Participation LI: Enrollment Customer Information Peak Forecasting Subtotal PST Support
Total 4
143

Direct Testimony of Tim Woolf and Melissa Whited Page 14
Table 4. Division’s Proposed PIM Incentives (bps) 1
Type PIM 2019 (med)
2019 (high)
2020 (med)
2020 (high)
2021 (med)
2021 (high)
System Efficiency
Transmission Peak 40 80 46 93 51 103 FCM Peak 9 18 15 30 21 42 Subtotal 49 98 61 122 73 145
Distributed Energy Resources
DR: Residential 1 1 1 1 1 2 DR: C&I 3 4 5 8 8 12 Electric Heat Initiative 3 5 4 5 4 5 Electric Vehicles 3 4 3 6 4 7 BTM Storage 1 3 2 3 2 4 Utility-Scale Storage 3 7 6 12 9 17 Non-Wires Alternatives 2 4 3 6 4 8 Subtotal 16 27 24 41 32 55
PST Support
LI: PST Participation 2 3 2 3 2 3 LI: Enrollment 2 3 2 3 2 3 Customer Information 1 2 0 0 0 0 Peak Forecasting 1 2 0 0 0 0 Subtotal PST Support 6 10 4 6 4 6
Total 71 135 89 169 108 206 2
Figure 1. Division’s Proposed PIM Incentives in 2021 (bps) 3
4
5
-
50
100
150
200
250
Med High
Basi
s Po
ints
in 2
021
NWAs
Utility-Scale Storage
BTM Storage
Elect. Vehicles
Elect. Heat
DR: C&I
DR: Res
FCM Peak
Trans Peak
144

Direct Testimony of Tim Woolf and Melissa Whited Page 15
4.2. Implications for the Authorized Return on Equity 1
Q. Why is it important to consider the Company’s authorized ROE in conjunction with 2
performance incentive mechanisms? 3
A. As described above, the Company’s authorized ROE and PIMs serve similar and inter-4
related functions. They both provide revenues for the Company’s shareholders, for the 5
rate year and all the years until the next rate case. They also both provide utility 6
management with financial incentives that can have a large impact on utility 7
performance, utility rates, and services to customers. Because of this inter-relationship, it 8
is critical for the Commission to consider the authorized ROE and the PIMs together; 9
otherwise the ultimate impacts of these two mechanisms treated separately could lead to 10
unintended consequences, uneconomic decision-making; undesirable performance 11
outcomes, and over-recovery (or under-recovery) of revenues by the Company. 12
Q. Please expand upon the implications of the financial incentive provided by the 13
authorized ROE and the PIMs. 14
A. As discussed the direct testimony of Mr. Woolf, utilities subject to traditional rate of 15
return regulation have a financial incentive to increase profits by increasing capital 16
expenditures and increasing their rate base. This incentive can lead to uneconomic 17
decision-making as a result of an overstated incentive to increase rate base, as well as too 18
much emphasis on capital costs at the expense of operations and maintenance impacts. 19
This preference to increase rate base can significantly dampen a utility’s incentive to 20
invest in DERs and other PST initiatives that can reduce capital costs. In order to fully 21
achieve the goals of power sector transformation, it will be necessary to mitigate this 22
145
Direct Testimony of Tim Woolf and Melissa Whited Page 16
undue preference for increased capital costs. PIMs offer a logical mechanism for doing 1
so. 2
Q. Please describe how PIMs can mitigate a utility’s preference for capital costs. 3
A. PIMs provide a utility with an alternative source of shareholders revenues. This can 4
dampen a utility’s emphasis on capital costs by providing another way to increase profits; 5
ideally in a way that is more consistent with regulatory goals. 6
In addition, since PIMs provide an alternative source of shareholder revenues, 7
regulators can establish the authorized ROE at the lower end of the cost of equity range to 8
reflect those additional revenues that will increase profits. In our view, this is one of the 9
most effective ways to modify the regulatory model to provide a utility the incentives it 10
needs to achieve power sector transformation objectives. 11
Q. Please elaborate on what you mean by establishing the authorized ROE at the lower 12
end of the range to reflect PIM revenues. 13
A. Mr. Kahal, addresses the appropriate way to determine an authorized ROE for National 14
Grid in this rate case. Here, we will touch upon some of the key issues that pertain to the 15
PIM revenues. 16
Setting the authorized ROE is not an exact science, and there are many techniques 17
that can be used to identify the best value. Each of these techniques has strengths and 18
limitations, and commissions are frequently presented with a range of reasonable 19
recommendations for the authorized ROE. Commissions will typically select a number 20
within this range, with the goal of balancing customer and shareholder interests. 21
146

Direct Testimony of Tim Woolf and Melissa Whited Page 17
In this context, the Commission could select an authorized ROE that is at the 1
lower end of a reasonable range, in order to reflect the revenues that a utility is expected 2
to recover through its PIMs. This lower authorized ROE could also be justified because 3
the PIMs reduce the utility’s risk by providing regulatory guidance and some assurance 4
that the costs associated with PIM initiatives will be allowed into rates. 5
Q. Are you recommending that the authorized ROE be lowered by the same number of 6
basis points that the Company is allowed to earn from the PIMs? 7
A. No. We are not necessarily recommending a one-for-one transfer of basis points from the 8
authorized ROE to the PIMs. As described above, there are some significant uncertainties 9
in the magnitudes of the PIM incentives proposed by the Company and by us. Further, 10
some of the PIMs incentives are for innovative initiatives that might not provide net 11
benefits to customers or utility incentives in the early years. We recommend that the 12
authorized ROE be set a level sufficiently below the expected PIM incentives, to ensure 13
that shareholders are not exposed to the risk of not recovering enough revenues. 14
Q. Is there evidence from existing PIMs that suggests that reducing the Company’s 15
authorized ROE is warranted? 16
A. Yes. The Company has been subject to an energy efficiency PIM since 1990. In our view, 17
the energy efficiency PIM is very robust in terms of the estimates of the costs, benefits, 18
net benefits, and targets, all of which are vetted by stakeholders in multiple forums and 19
are documented with independent evaluation, measurement, and verification studies. The 20
energy efficiency programs and PIM have clearly resulted in significant net benefits to 21
customers over many years. 22
147

Direct Testimony of Tim Woolf and Melissa Whited Page 18
The energy efficiency PIM has also increased the Company’s earned ROE. Table 1
5 presents the Company’s earned ROE for recent years for which data is available, and 2
breaks out the impact that the EE incentive has on earned ROE. As indicated, in the past 3
three years the EE incentive helped increase the Company’s earned ROE by 95 to 98 4
basis points. This is a significant impact on earned ROE, which demonstrates that the 5
revenue from PIM incentives can create room for the Commission to establish a lower 6
authorized ROE without harming utility shareholders. It also demonstrates the 7
importance of considering PIM incentives and authorized ROE together. 8
Table 5. National Grid Earned ROEs: Including and Excluding the EE Incentive 9
Year Earned ROE Excluding EE Incentive
Earned ROE Including EE Incentive
Basis Point Value of Earned EE Incentive
2013 6.98% 7.57% 59 2014 7.52% 8.50% 98 2015 8.28% 9.24% 96 2016 5.84% 6.79% 95
10
Q. What is the potential amount of basis points that the Company might earn from all 11
the PIMs proposed by the Division? 12
A. Table 6 provides a summary of the amount of basis points that the Company could earn 13
under the Division’s proposed PIMs. It also includes the basis points that the Company 14
could earn from the existing EE PIM, and all the PIMs combined. 15
Table 6. Potential Incentive Earnings from PIMs (basis points) 16
Performance Incentive Mechanism 2019 (med)
2019 (high)
2020 (med)
2020 (high)
2021 (med)
2021 (high)
Division’s Proposed PIMs 71 135 89 169 108 206 Existing Energy Efficiency PIM 105 105 90 90 86 86 Total PIMs 176 240 179 259 194 292
17
148

Direct Testimony of Tim Woolf and Melissa Whited Page 19
As indicated, the Company will have the opportunity to earn 176 to 194 basis from the 1
existing and proposed PIMs for achieving the medium targets. The incentives could be 2
considerably higher for achieving the high targets. 3
4.3. Principles and Methodology for Developing the Division’s Proposal 4
Q. In general, what principles should be used when designing PIMs? 5
A. Table 7 below presents a summary of the key principles that should be applied when 6
designing PIMs, including principles related to (a) identifying policy goals; 7
(b) establishing metrics; (c) establishing performance targets; and (d) establishing 8
rewards and penalties.4 9
4 These are taken from Synapse Energy Economics, Utility Performance Incentive Mechanisms: A Handbook for Regulators,
Prepared for the Western Interstate Energy Board, March 2015, page 4.
149

Direct Testimony of Tim Woolf and Melissa Whited Page 20
Table 7. Key Principles for Developing Performance Incentive Mechanisms 1 Policy Goals
• Articulate policy goals • Recognize financial incentives in the existing regulatory system • Design incentives to modify, supplement or balance existing incentives • Address areas of utility performance that have not been satisfactory or are not
adequately addressed by other incentives Performance Metrics
• Tie metrics to policy goals • Clearly define metrics • Ensure metrics can be readily quantified using reasonably available data • Adopt metrics that are reasonably objective and largely independent of factors
beyond utility control • Ensure metrics can be easily interpreted and independently verified
Performance Targets
• Tie targets to regulatory policy goals • Balance costs and benefits • Set realistic targets • Incorporate stakeholder input • Use deadbands to mitigate uncertainty and variability • Use time intervals that allow for long-term, sustainable solutions • Allow targets to evolve
Rewards and Penalties
• Consider the value of symmetrical versus asymmetrical incentives
• Ensure that any incentive formula is consistent with desired outcomes
• Ensure a reasonable magnitude for incentives
• Tie incentive formula to actions within the control of utilities
• Allow incentives to evolve
2
Q. Please describe the specific principles that you used in developing the PIMs for 3
National Grid. 4
A. We generally agree with the principles that the Company used in designing its PIMs:5 5
Establish incentives that will appropriately reward the Company for successful 6
delivery of activities, programs, investments, and outcomes that are foundational 7
to power sector transformation; 8
Align, to the extent possible, with the proposed performance incentive 9
mechanisms in the Power Sector Transformation Phase One Report; and 10
5 PST Panel Direct Testimony, January 12, 2018, page 88.
150
Direct Testimony of Tim Woolf and Melissa Whited Page 21
Assign values to individual performance incentive mechanisms based on a 1
combination of (1) relevance to developing a foundation for transforming the 2
power sector in the near term, and (2) the associated benefits or savings to 3
customers due to the activity encouraged by the incentive.6 4
We also applied several additional, more specific principles in designing the Division’s 5
PIMs: 6
Establish a portfolio of PIMs that is as simple and transparent as possible. This is 7
particularly important because some of the Company’s PIM proposals are 8
complex and opaque. 9
Establish a portfolio of PIMs that has an appropriate balance between outcome-10
based (e.g., system efficiency), program-based (e.g., distributed energy 11
resources), and action-based (e.g., data access). Each of these types of PIMs has 12
different strengths and challenges, so it is best to use a balanced mix of them. 13
Establish at least one PIM for each of the DERs that are expected to play a 14
foundational role in power sector transformation over the long-term. This is 15
necessary to send a signal to the Company of the importance of each type of DER. 16
Establish metrics and targets that are as concrete and as directly related to the 17
desired outcomes as possible. This is particularly important here because some of 18
the Company’s proposed PIM targets are not directly related to the desired 19
outcomes. 20
Q. Please describe how you determined the magnitude of the incentives for each of the 21
PIMs you propose. 22
A. Determining the magnitude of incentives is one of the more challenging aspects of 23
designing PIMs. Ideally, a PIM incentive should be designed to ensure that it will result 24
in net benefits to customers. This requires first estimating the benefits and the costs of the 25
6 PST Panel Direct Testimony, p. 88, lines 12-20.
151

Direct Testimony of Tim Woolf and Melissa Whited Page 22
initiative or action that the PIM applies to, and then deciding upon the appropriate portion 1
of the net benefits to provide to the utility relative to the customers. This was essentially 2
the approach that National Grid used in designing its proposed incentives. 3
We used the same approach in designing our incentives. However, given that our 4
PIMs are structured somewhat differently from the Company’s, and given that we have 5
some concerns about National Grid’s BCA assumptions, we developed PIM incentives 6
independently from the Company’s. We took the following steps: 7
Update or otherwise modify the avoided costs that National Grid used in its 8
BCAs. This includes using more recent information on forecast FCM prices, 9
energy prices, and transmission costs. It also includes adding in our own 10
assumption for avoided distribution capacity costs. 11
Apply those new avoided costs to the PIM targets to estimate the quantitative 12
benefits expected from achieving each of the PIMs in terms of peak demand 13
reductions, peak energy savings, and greenhouse gas emissions. For each PIM, we 14
made assumptions regarding the extent to which the utility’s actions would reduce 15
FCM, transmission, and distribution system peaks (using assumed coincidence 16
factors). 17
Estimate the likely costs of each of the PIM initiatives, to estimate the PIM’s 18
quantitative net benefits. 19
Assume a percentage of net benefits to be shared between the Company and its 20
customers, to estimate a dollar value for the PIM incentive. 21
Convert this dollar value of the PIM incentive into basis points for the Company. 22
For this purpose we used the Company’s information for the value of a basis 23
point. 24
Identify additional unquantified benefits associated with each of the PIMs. These 25
were assumed to be in the form of (a) improved reliability or resilience; (b) other 26
152
Direct Testimony of Tim Woolf and Melissa Whited Page 23
fuel benefits; (c) market innovation or transformation benefits; or (d) low-income 1
benefits. 2
Assign basis points for these unquantified benefits. The number of basis points for 3
each PIM was chosen based upon the type and number of unquantified benefits, 4
and the importance of each unquantified benefit in light of Docket 4600 goals and 5
state energy policies. 6
Add the basis point incentives for the quantified benefits to those for the 7
unquantified benefits, to determine the total basis point incentive. 8
Additional details and assumptions underlying these steps are provided in Exhibit 9
TW/MW-3. 10
Q. How did you incorporate the objective of ensuring consistent compensation for 11
benefits across various performance incentive mechanisms? 12
A. We achieved a significant degree of consistency. The methodology to determine the 13
magnitude of PIM incentives includes as a common input the benefits related to FCM 14
capacity, distribution, greenhouse gas emission reductions, transmission, and energy. 15
Those benefits populate our workbook consistently across individual performance 16
incentive mechanisms. 17
Q. The methodology you describe for determining the magnitude of the PIM incentives 18
includes multiple assumptions and estimates. Please comment. 19
A. Given that the magnitude of the PIM incentives should be based as much as possible on 20
the net benefits, and given that the initiatives that the PIMs are applied to can be new or 21
innovative, there is naturally a need to make some assumptions and estimates to 22
determine those net benefits. 23
153

Direct Testimony of Tim Woolf and Melissa Whited Page 24
Q. Please describe those assumptions and estimates that are mostly likely to affect the 1
results of your analyses. 2
A. The assumptions and estimates that are mostly likely to affect the results of our analyses 3
include the following: 4
Avoided FCM, energy, and transmission costs. These will have a large impact on 5
the benefits of the PIM initiative. We have used recent values from an analysis 6
provided at our request by Daymark Energy Advisors which we reviewed and 7
believe is very reasonable. We are confident that these assumptions are robust for 8
our purposes. 9
Avoided distribution costs. The Company chose to not include these benefits, 10
because of the challenges of estimating a value. We are concerned that this 11
decision ignores a potentially significant benefit from DERs. Therefore, we have 12
assumed the same avoided transmission costs that are used for evaluating energy 13
efficiency cost-effectiveness in Rhode Island. We recognize that this number is a 14
rough approximation, and that the value is likely higher for some distribution 15
circuits and lower for others. 16
Cost of the PIM initiative. The cost of an initiative or technology will clearly have 17
a large impact on its net benefits. For the FCM Peak and Transmission Peak PIMs 18
we assumed that there will be no additional cost to the customers, because the 19
Company has not requested recovery of any such costs in this rate case. For some 20
of the PIM initiatives (e.g., residential demand response, behind-the-meter 21
storage), the costs are not known at this time. Our cost estimates are based on our 22
understanding of the general cost-effectiveness of the relevant technology or 23
initiative. 24
PIM initiative or technology measure life. This assumption can have a very large 25
impact on the estimated benefits of a PIM initiative. Some of the actions taken in 26
the PIM initiatives might have measure lives of only one year (e.g., a demand 27
response program), while others could have measure lives of ten or twenty years 28
154

Direct Testimony of Tim Woolf and Melissa Whited Page 25
(e.g., electric vehicles or electric heating). Our measure life assumptions are based 1
on our understanding of the technologies and practices that are likely to be used in 2
each PIM initiative. 3
Coincidence of a PIM initiative or technology with the FCM, transmission, or 4
distribution system peak. These coincidence factors are likely to vary across 5
initiatives and technologies, and can have a very large impact on the estimated 6
benefits of a PIM initiative. Our coincidence estimates are based on our 7
understanding of the likely operating parameters of the relevant technology. 8
Q. Given all these assumptions and estimates that can significantly affect the outcome 9
of your analysis, are you confident that your analysis can be used at this time to 10
determine the magnitude of PIMs for National Grid? 11
A. Yes. There is no question that additional time and analyses will result in more robust 12
assumptions than those that we have used here. Nonetheless, our assumptions and 13
estimates are reasonable for our purpose here, for two reasons. First, in designing our 14
PIMs we have used a shared savings approach as much as possible to determine the 15
magnitude of the PIM incentives. A shared savings approach will provide the Company 16
with a certain portion of the net benefits of achieving a PIM target. The net benefits will 17
be determined after the year in which the target was achieved, at which time the actual 18
costs of the actions taken by the Company will be known. This approach means that, for 19
PIMs with a shared savings approach, the Company will only be awarded PIM incentives 20
if there are actual net benefits to customers. It also means that the magnitude of the PIM 21
incentive will depend upon the magnitude of the net benefits. 22
Second, as discussed in Section 4.7, the PIMs that we are proposing here would 23
not take effect until January 2019, and would be preceded by a filing from the Company 24
that provides up-to-date information, assumptions, and estimates on all aspects of the 25
155
Direct Testimony of Tim Woolf and Melissa Whited Page 26
PIMs, including the estimates of net benefits. The analyses that are presented in our 1
testimony are illustrative but are not the final analyses that should be used to set the PIM 2
incentives. Consequently, they are sufficiently robust for the Commission to take the next 3
step on the proposed PIMs and direct the Company to file more detailed PIM proposals at 4
a later date. 5
Q. Do you propose to include any penalties in your PIMs? 6
A. No. There are several reasons why we prefer to not apply penalties for the PIMs we 7
propose here, primarily based on our findings from energy efficiency PIMs applied in 8
other states. First, the initiatives that we are asking the Company to undertake are 9
somewhat new. This means that there is some uncertainty about the costs, the benefits, 10
and the outcomes of the initiatives. In this context, assigning penalties to the PIMs will be 11
more likely to discourage the Company from pursuing an initiative than encourage it. 12
Second, if the Company is likely to be subjected to penalties for not achieving a 13
specific PIM target, then it will be less likely to propose aggressive, or even reasonable, 14
targets. 15
Third, applying penalties can be much more contentious than applying rewards. 16
Having to return revenues that the Company was otherwise planning to retain can be a 17
very undesirable outcome for utility management, and they might be more inclined to 18
challenge any such penalty. 19
Q. Do you offer any other modifications to the Company’s proposal? 20
A. Yes, a minor but important modification. The Company proposes PIM targets for 21
minimum, target, and maximum levels. For any PIM in which there are shared savings, 22
156
Direct Testimony of Tim Woolf and Melissa Whited Page 27
there is no need to cap targets (and associated incentives) at a maximum level. If the 1
Company can increase net benefits associated with a PIM initiative by exceeding the 2
maximum target, then it should be encouraged to do so. For this reason, we refer to the 3
highest target level as the “high” target, instead of the “maximum” target. We also refer 4
to the middle target as the “medium” target, instead of the “target.” 5
4.4. Division’s Proposed System Efficiency PIMs 6
Q. Please summarize your rationale for the system efficiency PIMs. 7
A. System efficiency PIMs can play an important role in the total portfolio of utility PIMs. 8
The system efficiency PIMs proposed here can be described as “outcome-based,” because 9
they focus on the desired outcome, rather than on the means to achieve that outcome. 10
This approach is fundamentally different than “program-based” PIMs, such as the DER 11
PIMs described below, which are implemented through specific initiatives or programs. 12
Outcome-based programs require relatively little regulatory oversight as they 13
allow the utility to determine the best way to achieve the desired outcome. The advantage 14
of this is that the utility has a lot of flexibility to be creative and innovative in achieving 15
the desired outcome. The disadvantage of this approach is that regulators have much less 16
opportunity to identify, monitor, and evaluate the actions taken by the utility to achieve 17
the outcome. 18
Program-based PIMs, on the other hand, require relatively more regulatory 19
oversight in order to ensure that the programs are cost-effective, properly funded, and 20
157

Direct Testimony of Tim Woolf and Melissa Whited Page 28
executed efficiently.7 The advantage of this approach is that regulators can have more 1
involvement, certainty, and confidence in the program and the related PIM. The 2
disadvantage of this approach is that it might constrain the utility’s creativity, and the 3
regulatory oversight might be overly cumbersome. 4
Because of these different strengths and limitations of the two types of PIMs, we 5
recommend a balanced approach that includes them both. This should offer the right 6
amount of regulatory oversight and guidance, while enabling the utility to be creative and 7
innovative. 8
Q. Please describe the Division’s proposal for an FCM Peak Demand Reduction PIM. 9
A. Company activities to reduce FCM peak demand could significantly reduce generation 10
capacity costs and play a foundational role in achieving power sector transformation 11
objectives. Under current ratemaking practice, National Grid has little financial incentive 12
to reduce FCM peak demand, because FCM costs are entirely passed on to customers. An 13
FCM PIM can help create such an incentive while also creating net benefits to customers. 14
We propose that the metric for the FCM PIM be the reduction in demand (in 15
MW) for the single peak FCM hour for each year. The demand reduction would be 16
calculated as the difference between a forecasted baseline FCM peak and the actual FCM 17
peak for that year, rather than year-over-year reductions relative to 2018 peak, as 18
proposed by the Company. Both the baseline and the actual peaks would be calculated in 19
weather-normalized terms. The baseline should also include the impacts of DERs that 20
7 Consider, for example, the regulatory oversight of the energy efficiency programs in Rhode Island.
158

Direct Testimony of Tim Woolf and Melissa Whited Page 29
the Company would be expected to earn an incentive for, so that there is no double-1
counting of savings. 2
For the weather-normalized baseline, we have used the Company’s forecast of 3
FCM peak demand for 2019, 2020, and 2021, including expected impacts from energy 4
efficiency, solar PV, storage, VVO, and electric vehicles.8 The peak demand forecast, 5
along with our proposed deadband and PIM targets are presented in Figure 2. 6
Figure 2. FCM Peak Demand: Historical, Forecast, Deadband, and Targets 7
8 To account for uncertainty in the forecast and to ensure that the target is not 9
something that could be met too easily by the utility, we propose a deadband equal to 0.5 10
standard errors of the forecast for each year. 9 We propose that the medium targets for the 11
8 The Company provided these values in response to DIV 8-5. To illustrate, the Company’s reconstituted forecast included load
growth from 2018 to 2019 of 22.7 MW. However, the Company expects there will be 46.3 MW of load reductions through energy efficiency (35 MW), solar PV (7 MW), VVO (3 MW), and storage (1 MW). Because the Company proposes to earn incentives for these activities through other PIMs, we reduced the baseline by 46.3 MW, for a net reduction of 23.6 MW (22.7 – 46.3= -23.6).
9 The standard error is a measure of the accuracy of the model, based on the difference between the model’s estimated values and the actual values. For example, assuming a normal distribution with 10 degrees of freedom, 1.0 standard error is associated with an 83 percent level of confidence. This means that there is an 83 percent chance that a deviation from the
159

Direct Testimony of Tim Woolf and Melissa Whited Page 30
FCM PIM be set at 1.0 standard error below the forecast. This value of the standard error 1
suggests that there is an 83 percent chance that the Company was responsible for the 2
outcome. We also propose that the high target be set to 1.5 standard errors, which 3
suggests that there is a 92 percent chance that the Company was responsible for the 4
outcome. These targets are presented in Table 8. Note that these targets are relative to the 5
baseline, including impacts from energy efficiency, solar PV, and other utility programs 6
for which the Company proposes to earn an incentive. This means that, for example, in 7
year 2019 the Company will need to reduce peak demand by 29 MW beyond the 8
deadband. In that year the deadband amount is approximately 14.5 MW, which means 9
that the Company will need to reduce FCM peak demand by 43.5 MW in order to reach 10
this target. 11
We propose that the incentives for the FCM PIM be equal to 50 percent of the 12
quantified net benefits of the FCM reductions achieved. We do not propose any 13
additional basis points for unquantified benefits associated with FCM peak reductions, 14
because we are not aware that there are any. These FCM incentives are presented in 15
Table 8. 16
forecast is likely to be due to something other than the explanatory variables in the model, such as weather or the economy. In the context of defining PIM targets, a 1.0 standard error means that there is an 83 percent chance that the utility was responsible for the outcome.
160

Direct Testimony of Tim Woolf and Melissa Whited Page 31
Table 8. FCM Peak Demand Reduction PIM – Targets and Incentives 1
FCM Peak Demand Reduction 2019 (med)
2019 (high)
2020 (med)
2020 (high)
2021 (med)
2021 (high)
Targets (annual peak FCM MW savings) 29 44 31 46 32 48 Incentive for Quantified Benefits (bps) 9 18 15 30 21 42 Incentive for Unquantified Benefits (bps) - - - - - - Total Incentive (bps) 9 18 15 30 21 42
2
Q. Please describe the Division’s proposal for a Transmission Peak Demand Reduction 3
PIM. 4
A. Company efforts to reduce transmission peak demands could significantly reduce 5
transmission costs and play a foundational role in achieving power sector transformation 6
objectives. Under current ratemaking practice, National Grid has little financial incentive 7
to reduce transmission peak demand, because these costs are entirely passed on to 8
customers. A PIM can help create such an incentive while also creating net benefits to 9
customers. 10
We propose that the metric for the Transmission PIM be the sum of monthly peak 11
demands for each year, excluding the highest peak month. We exclude the highest month 12
to avoid double-counting, as this month is when the FCM peak demand occurs, and the 13
peak demand reductions in that month will be counted towards the FCM PIM. The 11-14
month transmission peak demand reduction would be calculated as the difference 15
between a baseline of transmission peaks and the actual transmission peaks. Both the 16
baseline and the actual peaks would be calculated in weather-normalized terms. 17
We propose that the baseline for the Transmission PIM be the 11-month sum of 18
forecasted weather-normalized peak demand for the year in question rather than year-19
over-year reductions, as proposed by the Company. The Company’s historical 20
161

Direct Testimony of Tim Woolf and Melissa Whited Page 32
transmission peak demand, along with our forecast, proposed deadband, and PIM targets 1
are presented in Figure 3. 2
Figure 3. Transmission Peak Demands: Historical, Our Forecast, Deadband, and Targets 3
4
The Company does not have a weather-normalized transmission peak demand 5
forecast.10 In addition, the Company has not weather-normalized its historical 6
transmission peak data.11 Without having weather-normalized historical data or a forecast 7
of future transmission peak demand, it is not possible to set a reasonable target or 8
determine with any certainty whether transmission peak reductions are the result of utility 9
action or some other factor. 10
In order to develop more reasonable targets for this PIM, we developed a weather-11
normalized forecast for transmission peaks by regressing 11 years of transmission peak 12
10 Response to (Docket 4770) Division 25-12. 11 Response to (Docket 4770) Division 25-14
Division Targets
Company Targets
12,000
12,500
13,000
13,500
14,000
14,500
15,000
15,500
Sum
of 1
1 M
onth
ly P
eaks
(M
W)
Deadband Sum of 11 Months Transmission Peaks
(Weather-Normalized)
162

Direct Testimony of Tim Woolf and Melissa Whited Page 33
data12 on various weather variables. We tested for multicollinearity and goodness of fit, 1
and selected the model containing the explanatory variables of cooling degree days 2
(CDD), heating degree days (HDD), and year. The model had an adjusted R2 of 0.67. 3
The regression coefficients from this model were then used to create a weather-4
normalized historical baseline and to forecast a 2019 – 2021 baseline. Once the baseline 5
was constructed, it became apparent that the Company’s targets were inadequate, as they 6
lay above the forecast, implying that the Company would be rewarded for doing nothing 7
at all. 8
To create reasonably aggressive targets, a deadband was created by subtracting 9
0.5 standard errors associated with each prediction for years 2019 – 2021 from that year’s 10
weather-normalized baseline. Achieved reductions that lie within the deadband are too 11
small to say with certainty whether utility action had an effect on the reduction. 12
Similar to the FCM PIM targets, the Division proposes to establish targets for the 13
transmission peak demand PIM at 0.5 standard errors, 1.0 standard error, and 1.5 standard 14
errors for the minimum, medium, and maximum targets, respectively. For clarity, these 15
targets are presented in Table 9 in terms of the sum of 11 months of reductions, and as 16
average monthly MW reductions. 17
The Company should be compensated only for peak reductions that fall below the 18
deadband, which means that, for example, in year 2019 the Company will need to reduce 19
peak demand by 228 MW beyond the baseline (equivalent to 21 MW on a monthly 20
12 Monthly data were collapsed into an annual sum of monthly transmission peaks, excluding the maximum month.
163

Direct Testimony of Tim Woolf and Melissa Whited Page 34
basis). In that year the deadband amount is 114 MW (equivalent to 10 MW on a monthly 1
basis). 2
We propose that the incentives for the Transmission PIM be equal to 50 percent 3
of the quantified net benefits of the transmission peak reductions achieved. We do not 4
propose any additional basis points for unquantified benefits associated with FCM peak 5
reductions, because we are not aware that there are any. These Transmission PIM 6
incentives are presented in Table 9. 7
Table 9. Transmission Peak Demand Reduction PIM Summary 8
Transmission Peak Demand Reduction 2019 (med)
2019 (high)
2020 (med)
2020 (high)
2021 (med)
2021 (high)
Targets (sum of 11 monthly peaks (MW)) 228 342 255 383 284 425 Targets (average monthly reduction (MW)) 21 31 23 35 26 39 Incentive for Quantified Benefits (bps) 40 80 46 93 51 103 Incentive for Unquantified Benefits (bps) - - - - - - Total Incentive (bps) 40 80 46 93 51 103
9
4.5. Division’s Proposed Distributed Energy Resource PIMs 10
Q. Please summarize your rationale for the proposed DER PIMs. 11
A. There is a wide variety of DERs available today for customers or the Company to take 12
advantage of. The various types of DERs have different levels of commercial 13
development, economic viability, and customer acceptance. Each type of DER is 14
expected to play an important role in power sector transformation over the long-term. 15
Accordingly, we believe it is appropriate to establish at least one PIM at this time for 16
each type of DER. 17
164

Direct Testimony of Tim Woolf and Melissa Whited Page 35
For some types of DERs, such as C&I demand response and electric heat, the 1
associated initiative and potential benefits are fairly well established and will likely offer 2
significant net benefits between now and the next rate case. For other types of DERs, 3
such as behind-the-meter storage, the associated initiative and potential benefits are not 4
yet well established and thus may have a relatively small impact prior to the next rate 5
case. We recommend establishing at least one PIM for each type of DER, even if the PIM 6
might have a small impact in the short-term, because that sends an important signal to the 7
Company that it should be investigating opportunities for all types of DERs. 8
Q. Please describe the Division’s proposal for a Residential Demand Response PIM. 9
A. Residential demand response is expected to play an important role in reducing peak 10
demands and helping to achieve power sector transformation objectives. The Company’s 11
residential demand response program “Connected Solutions” is in an early phase and 12
does not appear to be cost-effective, based on the data provided by the Company.13 13
However, National Grid is developing a more robust program for the 2019 Energy 14
Efficiency Plan. The opportunities for demand response program will expand 15
considerably if and when the Company installs AMF. Therefore, we propose a 16
Residential DR PIM where the incentive is based on shared savings, to encourage the 17
Company to develop a more cost-effective program, and to implement it as efficiently as 18
possible. 19
We propose that the metric for the Residential DR PIM be equal to the amount of 20
peak demand (in MW) that customers have signed up to reduce through participation in 21
13 Response to (Docket 4770) Division 1-39
165

Direct Testimony of Tim Woolf and Melissa Whited Page 36
the Residential DR program. Ideally, the metric would be the actual amount of capacity 1
that was reduced by customers as a result of the program. However, this amount might 2
depend upon the wholesale market prices during peak periods, which are beyond the 3
control of the Company.14 Instead, we propose that the targets be based on enrolled 4
capacity, but that the Company also provide an annual report regarding the number of 5
events called and the estimated demand reductions achieved each year. 6
The targets we propose for this PIM are presented in Table 10. These are 7
based on our expectation of the capacity that the Company might enroll through the 8
Residential DR program. The baseline for this PIM is simply zero, because there would 9
be no residential DR without the program. 10
The incentives we propose for this PIM are presented in Table 10. As indicated in 11
the table, we expect the quantified net benefits to be relatively small due to the relatively 12
small size of the program and our cost assumptions. Once these net benefits are shared 13
equally between the Company and the customers, the amount of the Company’s incentive 14
is less than one basis point. We add one basis point incentive targets achieved in each 15
year to reflect the unquantified benefits expected to result from residential demand 16
response programs. These unquantified benefits include improved reliability and the 17
development of markets and products related to residential demand response and home 18
energy management in general. For example, sophisticated thermostats enrolled in the 19
Connected Solutions program can be expected to provide energy savings as well as 20
capacity benefits. 21
14 It is possible that demand response events would not be called at all during mild summers.
166

Direct Testimony of Tim Woolf and Melissa Whited Page 37
Table 10. Residential Demand Response: Targets and Incentives 1
Demand Response – Residential 2019 (med)
2019 (high)
2020 (med)
2020 (high)
2021 (med)
2021 (high)
Targets (incremental MW savings) 1 2 2 3 3 4 Incentive for Quantified Benefits (bps) - - - - - 1 Incentive for Unquantified Benefits (bps) 1 1 1 1 1 1 Total Incentive (bps) 1 1 1 1 1 2
2
Q. Please describe the Division’s proposal for a C&I Demand Response PIM. 3
A. Commercial and Industrial (C&I) demand response is expected to play an important role 4
in reducing peak demands and helping to achieve power sector transformation objectives. 5
The Company’s C&I demand response program has been very cost-effective to date.15 6
We propose a C&I DR PIM where the incentive is based on shared savings to encourage 7
the Company to expand its C&I DR program cost-effectively. 8
We propose that the metric for the C&I DR PIM be equal to the amount of peak 9
demand (in MW) that customers have signed-up to reduce through participation in the 10
C&I DR program. Ideally, the metric would be the actual MW reductions provided by 11
customers as a result of the program. However, this amount might depend upon the 12
wholesale market prices during peak periods, which are beyond the control of the 13
Company. 14
The targets we propose for this PIM are presented in Table 11. These are based on 15
a moderate scaling up of the existing C&I DR program. The baseline for this PIM is 16
simply zero, because there would be no DR contracts with customers without the DR 17
program. 18
15 Based on our analysis of response to (Docket 4770) Division 3-14.
167

Direct Testimony of Tim Woolf and Melissa Whited Page 38
The incentives we propose for this PIMs are presented in Table 11. This program 1
is expected to result in a modest amount of net benefits, which lead to incentives based 2
on quantified net benefits of 2 to 3 basis points, increasing to 7 to 11 basis points in later 3
years. Further, given that there are additional unquantified benefits (such as reliability 4
and resiliency and market transformation, particularly with respect to new “smart” 5
devices that help customers manage their demand and energy consumption), we propose 6
that the Company be eligible to earn an additional basis point in incentives for achieving 7
its targets. Thus, the range of total basis points is 3 to 4 bps in 2019 increasing to 8 to 12 8
basis points in 2021. 9
Table 11. Commercial and Industrial Demand Response: Targets and Incentives 10
Demand Response – C&I 2019 (med)
2019 (high)
2020 (med)
2020 (high)
2021 (med)
2021 (high)
Targets (incremental MW savings) 8 14 10 16 12 18 Incentive for Quantified Benefits (bps) 2 3 4 7 7 11 Incentive for Unquantified Benefits (bps) 1 1 1 1 1 1 Total Incentive (bps) 3 4 5 8 8 12
11
Q. Please describe the Division’s proposal for an Electric Heat PIM. 12
A. Electric heat is a key component of strategic electrification, which advances the goals of 13
increasing energy efficiency and reducing greenhouse gases and other pollutants while 14
lowering costs to customers and society. National Grid estimates that its Electric Heat 15
initiative will be cost-effective, with a benefit-cost ratio of 1.4. 16 16
We have developed targets based on the avoided CO2 emission estimates 17
contained in the Company’s benefit-cost analysis for the Electric Heat Initiative.17 These 18
16 Response to (Docket 4770) Division 1-1-3, Attachment DIV 1-1-3. 17 Ibid.
168

Direct Testimony of Tim Woolf and Melissa Whited Page 39
avoided CO2 estimates are higher than those initially proposed by the Company for this 1
PIM. 2
In addition to proposing higher targets for this PIM, we propose some 3
modifications to the incentives. Most importantly, we propose a shared savings approach 4
based on 50/50 sharing of net savings. We also add an additional 1 to 2 basis points to 5
reflect unquantified benefits of reliability, market transformation, and low income 6
benefits. The targets and incentives we propose for the Electric Heat PIM are presented in 7
Table 12. 8
Table 12. Electric Heat Initiative: Targets and Incentives 9
Electric Heat 2019 (med)
2019 (high)
2020 (med)
2020 (high)
2021 (med)
2021 (high)
Targets (incremental Avoided CO2) 464 556 580 696 595 714 Incentive for Quantified Benefits (bps) 2 3 3 3 3 3 Incentive for Unquantified Benefits (bps) 1 2 1 2 1 2 Total Incentive (bps) 3 5 4 5 4 5
10
Q. Please describe the Division’s proposal for an Electric Vehicle PIM. 11
A. Electric vehicles are another key component of strategic electrification. In addition to 12
playing a key role in decarbonization, electric vehicles can save customers money and 13
potentially provide grid services. For these reasons, we support a PIM for electric 14
vehicles. 15
The Company’s has baseline and targets for an electric vehicles PIM are generally 16
reasonable. However, we prefer a metric that is more closely tied to the underlying policy 17
goal of reducing greenhouse gases, rather than simply rewarding higher adoption levels 18
of any type of electric vehicle. Such a metric will provide incentives for the Company to 19
169

Direct Testimony of Tim Woolf and Melissa Whited Page 40
prioritize encouraging adoption of vehicles that reduce the most greenhouse gases. 1
Therefore, we propose to convert the Company’s baseline and targets into tons of 2
greenhouse gases using the following methodology: 3
The Company’s proposed baseline was derived using the forecast growth rate for 4
EV sales in New England from the US Energy Information Administration’s 5
Annual Energy Outlook 2017. This growth rate would be applied to actual sales in 6
Rhode Island, as reported by the R.L. Polk Vehicles in Operation data source. 7
This data source reports both battery electric vehicles (BEVs) and plug-in hybrid 8
electric vehicles (PHEVs). 9
To convert this baseline into greenhouse gas emissions avoided, we used the 10
Company’s assumptions contained in the PST Initiative Benefit Cost Analysis 11
workbook (provided in response to DIV 1-1-3). The Company assumed that its 12
EV initiative would result in an adoption rate of 30% battery electric vehicles and 13
70% plug-in hybrid electric vehicles. The weighted average quantity of 14
greenhouse gases avoided annually per vehicle was estimated to be 3.5 tons. 15
Multiplying 3.5 tons by the baseline number of EVs provides a baseline in 16
greenhouse gas avoided emissions. 17
The Company’s targets were set to reflect a 20%, 40%, and 80% improvement 18
over the baseline. We have applied the same improvements to greenhouse gas 19
emissions to develop our proposed targets. 20
The Company’s proposed reporting of performance (using the total number of new 21
registrations in Company service territory during the calendar year based on data from 22
the R.L. Polk Vehicles in Operation data source) would generally remain the same, 23
170

Direct Testimony of Tim Woolf and Melissa Whited Page 41
except the number of each type of vehicle would then be multiplied by its respective 1
assumed emissions avoidance factor. In addition, the Company would be required to 2
report any adoption of fleet vehicles and provide assumed emissions avoidance for those 3
vehicles. 4
In recognition that electric vehicle adoption is a goal with particularly high importance at 5
this point in time, we have added an additional two basis points for achieving the medium 6
targets and three basis points for achieving the high targets. These additional basis points 7
are warranted given the substantial benefits provided by EVs, and the fact that EVs 8
require a critical mass before the market can be transformed. The targets and incentives 9
we proposed for this PIM are provided in Table 13. 10
Table 13. Electric Vehicle Initiative: Targets and Incentives 11
Electric Vehicles 2019 (med)
2019 (high)
2020 (med)
2020 (high)
2021 (med)
2021 (high)
Targets (incremental Avoided CO2) 557 1,114 757 1,511 1,026 2,051 Incentive for Quantified Benefits (bps) 1 1 1 3 2 4 Incentive for Unquantified Benefits (bps) 2 3 2 3 2 3 Total Incentive (bps) 3 4 3 6 4 7
12
Q. Please describe the Division’s proposal for a Behind-the-Meter Storage PIM. 13
A. Behind-the-meter electricity storage systems represent a flexible resource that can 14
provide important benefits to customers and the grid, including reducing peak demand 15
costs; reducing peak energy costs; increasing reliability and resilience; supporting 16
distributed generation, especially distributed solar; providing ancillary services; and 17
enabling the integration of high penetrations of renewable energy. 18
171

Direct Testimony of Tim Woolf and Melissa Whited Page 42
We support the Company’s proposal to implement a PIM for incremental MW of 1
installed behind-the-meter storage. However, we propose that the incentives be awarded 2
on a shared-savings basis to encourage the utility to promote cost-effective behind-the-3
meter storage, and to protect consumers if cost-effective options are not available during 4
this time period. 5
The targets and incentives we propose for this PIM are provided in Table 14. The 6
targets are slightly lower than those proposed by the Company, because our targets 7
require that the resource be cost-effective. Behind-the-meter storage is only economic if 8
customers have time-varying rates, which first require AMF. We therefore assume that 9
the only behind-the-meter storage that will be developed over the next three years will be 10
by commercial and industrial customers. 11
While the quantified benefits are expected to be small in this time period, we 12
include some incentive for the unquantified benefits expected from (a) technology and 13
market development, and (b) improved reliability and resilience. 14
Table 14. Behind-the-Meter Storage Initiative: Targets and Incentives 15
Behind-the-Meter Storage 2019 (med)
2019 (high)
2020 (med)
2020 (high)
2021 (med)
2021 (high)
Targets (incremental MW) 1 2 1 2 1 2 Incentive for Quantified Benefits (bps) - 1 1 1 1 2 Incentive for Unquantified Benefits (bps) 1 2 1 2 1 2 Total Incentive (bps) 1 3 2 3 2 4
16
Q. Please describe the Division’s proposal for a Utility-Scale Storage PIM. 17
A. Utility-scale electricity storage systems represent a flexible resource that can provide 18
important benefits to customers and the grid, including reducing peak demand costs; 19
172

Direct Testimony of Tim Woolf and Melissa Whited Page 43
reducing peak energy costs; increasing reliability and resilience; supporting distributed 1
generation, especially distributed solar; providing ancillary services; and enabling the 2
integration of high penetrations of renewable energy. 3
We support the Company’s proposal to implement a PIM for incremental MW of 4
installed utility-scale storage. However, National Grid’s BCA indicates that utility-scale 5
storage owned by the Company may not be cost-effective over the next three years.18 6
Therefore, we recommend expanding this PIM to include any form of utility-scale 7
storage, which could be owned by the Company or purchased from third-party providers. 8
In addition, we propose that the incentives be awarded on a shared-savings basis to 9
encourage the utility to promote cost-effective utility-scale storage, to protect consumers 10
if cost-effective options are not available during this time period. 11
The targets and incentives we propose for this PIM are provided in Table 15.The 12
targets are the same as those proposed by the Company. In addition to the incentives for 13
quantified net benefits, we include some incentive for the unquantified benefits expected 14
from (a) technology and market development, and (b) improved reliability and resilience. 15
18 Ibid.
173
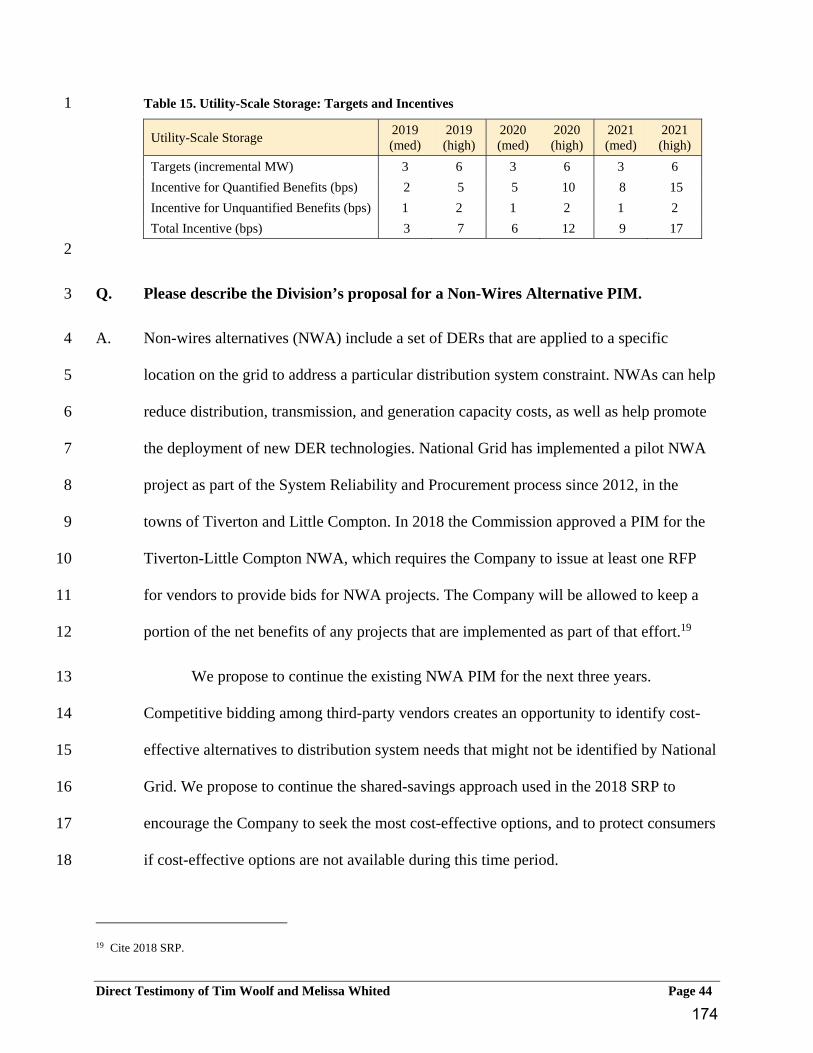
Direct Testimony of Tim Woolf and Melissa Whited Page 44
Table 15. Utility-Scale Storage: Targets and Incentives 1
Utility-Scale Storage 2019 (med)
2019 (high)
2020 (med)
2020 (high)
2021 (med)
2021 (high)
Targets (incremental MW) 3 6 3 6 3 6 Incentive for Quantified Benefits (bps) 2 5 5 10 8 15 Incentive for Unquantified Benefits (bps) 1 2 1 2 1 2 Total Incentive (bps) 3 7 6 12 9 17
2
Q. Please describe the Division’s proposal for a Non-Wires Alternative PIM. 3
A. Non-wires alternatives (NWA) include a set of DERs that are applied to a specific 4
location on the grid to address a particular distribution system constraint. NWAs can help 5
reduce distribution, transmission, and generation capacity costs, as well as help promote 6
the deployment of new DER technologies. National Grid has implemented a pilot NWA 7
project as part of the System Reliability and Procurement process since 2012, in the 8
towns of Tiverton and Little Compton. In 2018 the Commission approved a PIM for the 9
Tiverton-Little Compton NWA, which requires the Company to issue at least one RFP 10
for vendors to provide bids for NWA projects. The Company will be allowed to keep a 11
portion of the net benefits of any projects that are implemented as part of that effort.19 12
We propose to continue the existing NWA PIM for the next three years. 13
Competitive bidding among third-party vendors creates an opportunity to identify cost-14
effective alternatives to distribution system needs that might not be identified by National 15
Grid. We propose to continue the shared-savings approach used in the 2018 SRP to 16
encourage the Company to seek the most cost-effective options, and to protect consumers 17
if cost-effective options are not available during this time period. 18
19 Cite 2018 SRP.
174

Direct Testimony of Tim Woolf and Melissa Whited Page 45
The targets and incentives we propose for this PIM are provided in Table 16. The 1
targets are based on our assessment of the potential NWA savings that might be available 2
in the next three years. In addition to the incentives for quantified benefits, we include 3
some incentive for the unquantified benefits expected from technology and market 4
development. 5
Table 16. Non-Wires Alternatives: Targets and Incentives 6
Non-Wires Alternatives 2019 (med)
2019 (high)
2020 (med)
2020 (high)
2021 (med)
2021 (high)
Targets (incremental MW) 3 6 3 6 3 6 Incentive for Quantified Benefits (bps) 1 2 2 3 3 5 Incentive for Unquantified Benefits (bps) 1 2 1 2 1 2 Total Incentive (bps) 2 4 3 5 4 7
7
4.6. Division’s Proposed Power Sector Transformation Support PIMs 8
Q. Please summarize your rationale for the Power Sector Transformation Support 9
PIMs. 10
A. We propose two PIMs to help protect low-income customers. The first is to 11
encourage National Grid to increase low-income customer participation in all of the PST 12
initiatives. The second is to encourage National Grid to increase the percent of low-13
income customers that are enrolled in the A60 low-income discount rate. These PIMs are 14
important to enable low-income customers to enjoy the direct benefits of PST initiatives, 15
and to protect them from potential rate increases. 16
We also propose two PIMs to encourage the Company to provide customer 17
information and improve its distribution demand forecasting practices. These PIMs can 18
be described as “action-based,” because they are focused on specific actions that the 19
175

Direct Testimony of Tim Woolf and Melissa Whited Page 46
Company can take to achieve desired outcomes. This type of PIM is different from 1
outcome-based or program-based PIMs in that there may not be direct monetary benefit 2
or net benefit associated with the action. Instead, the action is presumed to lead to other 3
actions or outcomes that will provide net benefits to customers. Action-based PIMs are 4
appropriate to encourage a utility to take steps that are foundational to power sector 5
transformation objectives, but that the utility is unlikely to take without the PIM. Often 6
this type of PIM is only necessary for a short time, to help facilitate a transition. 7
Q. Please describe the Division’s proposal for a Low-Income PST Participation PIM. 8
A. Customers who participate in one of the Company’s DER programs will experience 9
direct benefits in terms of bill reductions. It is especially important to enroll low-income 10
customers in such programs, to make their electricity bills more affordable. When a low-11
income customer’s bill is more affordable they are more likely to pay their bills, which 12
will reduce the bill arrearages that all customers pay for. Reduced low-income 13
consumption and bills can also help reduce the amount of money that is used to pay for 14
the low-income discount rate, which is also paid for by all customers. 15
We propose that the metric for the LI Participation PIM be the percent of low-16
income customers enrolled in any one of the Company’s DER programs, including 17
demand response, electric heat, electric vehicles, and electric storage. We exclude the 18
Company’s energy efficiency program from this PIM, because the Company already has 19
a long history of promoting low-income energy efficiency programs. 20
The baseline for this PIM should be the percent of low-income customers relative 21
to total residential customers. 22
176

Direct Testimony of Tim Woolf and Melissa Whited Page 47
The targets for this PIM should be based on DER program participation rates 1
relative to the baseline percentage of low-income customers. We propose a medium 2
target equal to a program participation rate that is five percent higher than the baseline 3
percentage of low-income customers. Thus, if the baseline percentage is 15 percent, the 4
medium target should be 20 percent participation of low-income customers in the 5
relevant DER programs. For this calculation of program participation rate, low-income 6
participation in all of the relevant DER programs can be combined. We propose the high 7
target for this PIM equal to a program participation rate that is ten percent higher than the 8
baseline percentage of low-income customers. 9
The low-income participation PIM does not have any benefits that can be readily 10
quantified. Therefore, we propose an incentive based upon the unquantified benefits of 11
improving low-income customer affordability and reducing utility arrearages. The targets 12
and incentives we propose for this PIM are provided in Table 17. 13
Table 17. Low-Income PST Participation PIM: Targets and Incentives 14
Low Income PST Participation 2019 (med)
2019 (high)
2020 (med)
2020 (high)
2021 (med)
2021 (high)
Targets (percentage point increase) 5 10 5 10 5 10 Incentive for Quantified Benefits (bps) - - - - - - Incentive for Unquantified Benefits (bps) 2 3 2 3 2 3 Total Incentive (bps) 2 3 2 3 2 3
15
Q. Please describe the Division’s proposal for a Low-Income Discount PIM. 16
A. The low-income discount is an important mechanism for not only reducing the energy 17
burden of this important customer group, but also for enabling more low-income 18
customers to pay their bills thereby reducing the Company’s arrearages. Mr. Colton 19
177

Direct Testimony of Tim Woolf and Melissa Whited Page 48
addresses the Division’s proposal for modifications to the Company’s low-income 1
discount. 2
We propose establishing a PIM to encourage National Grid to increase the 3
number of low-income customers that are on the low-income, A60 discount. The metric 4
for this PIM would the percentage of total low-income customers that are on the A60 5
discount. The baseline would be the average of the low-income discount participation 6
percentage for the previous five years.20 7
The low-income discount PIM does not have any benefits that can be readily 8
quantified. Therefore, we propose an incentive based upon the unquantified benefits of 9
improving low-income customer affordability and reducing utility arrearages. The targets 10
and incentives we propose for this PIM are provided in Table 18. 11
Table 18. Low-Income Discount PIM: Targets and Incentives 12
Low Income Discount 2019 (med)
2019 (high)
2020 (med)
2020 (high)
2021 (med)
2021 (high)
Targets (percentage point increase) 4 8 4 8 4 8 Incentive for Quantified Benefits (bps) - - - - - - Incentive for Unquantified Benefits (bps) 2 3 2 3 2 3 Total Incentive (bps) 2 3 2 3 2 3
13
Q. Please describe the Division’s proposal for a Data Access PIM. 14
A. In order to fully enable increasing amounts or DERs and increasing levels of third-party 15
activities, it will be necessary to provide customers and third-parties with access to key 16
system data. This includes data on customer electricity consumption patterns and data 17
regarding the operation and the constraints on the distribution system. 18
20 For example, the baseline for 2021 would be the average participation percentage for 2016-2020.
178
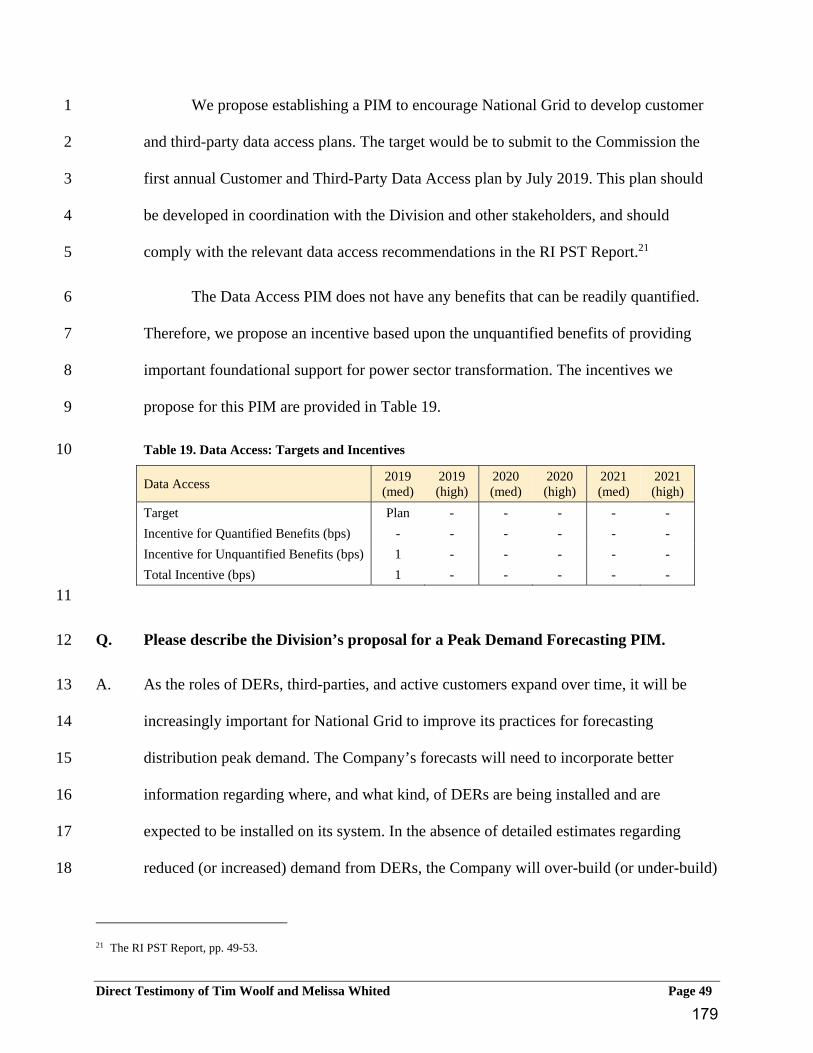
Direct Testimony of Tim Woolf and Melissa Whited Page 49
We propose establishing a PIM to encourage National Grid to develop customer 1
and third-party data access plans. The target would be to submit to the Commission the 2
first annual Customer and Third-Party Data Access plan by July 2019. This plan should 3
be developed in coordination with the Division and other stakeholders, and should 4
comply with the relevant data access recommendations in the RI PST Report.21 5
The Data Access PIM does not have any benefits that can be readily quantified. 6
Therefore, we propose an incentive based upon the unquantified benefits of providing 7
important foundational support for power sector transformation. The incentives we 8
propose for this PIM are provided in Table 19. 9
Table 19. Data Access: Targets and Incentives 10
Data Access 2019 (med)
2019 (high)
2020 (med)
2020 (high)
2021 (med)
2021 (high)
Target Plan - - - - - Incentive for Quantified Benefits (bps) - - - - - - Incentive for Unquantified Benefits (bps) 1 - - - - - Total Incentive (bps) 1 - - - - -
11
Q. Please describe the Division’s proposal for a Peak Demand Forecasting PIM. 12
A. As the roles of DERs, third-parties, and active customers expand over time, it will be 13
increasingly important for National Grid to improve its practices for forecasting 14
distribution peak demand. The Company’s forecasts will need to incorporate better 15
information regarding where, and what kind, of DERs are being installed and are 16
expected to be installed on its system. In the absence of detailed estimates regarding 17
reduced (or increased) demand from DERs, the Company will over-build (or under-build) 18
21 The RI PST Report, pp. 49-53.
179

Direct Testimony of Tim Woolf and Melissa Whited Page 50
its distribution system, resulting in excess costs, insufficient reliability, or both. 1
Information on the geographical location of new DERs will be necessary in order to fully 2
forecast distribution constraints and optimize its distribution investments. 3
We propose establishing a PIM to encourage National Grid to improve and 4
expand upon its current forecasting practices. The target would be to submit to the 5
Commission by July 2019 a Peak Demand Forecasting Report. This report should be 6
developed in coordination with the Division and other stakeholders, and should comply 7
with the relevant forecasting recommendations in the RI PST Report.22 8
The Peak Demand Forecasting PIM does not have any benefits that can be readily 9
quantified. Therefore, we propose an incentive based upon the unquantified benefits of 10
providing important foundational support for power sector transformation. The targets 11
and incentives we propose for this PIM are provided in Table 20. 12
Table 20. Peak Demand Forecasting: Targets and Incentives 13
Peak Demand Forecasting 2019 (med)
2019 (high)
2020 (med)
2020 (high)
2021 (med)
2021 (high)
Target Report - - - - - Incentive for Quantified Benefits (bps) - - - - - - Incentive for Unquantified Benefits (bps) 1 - - - - - Total Incentive (bps) 1 - - - - -
14
22 The RI PST Report, pp. 48-49.
180
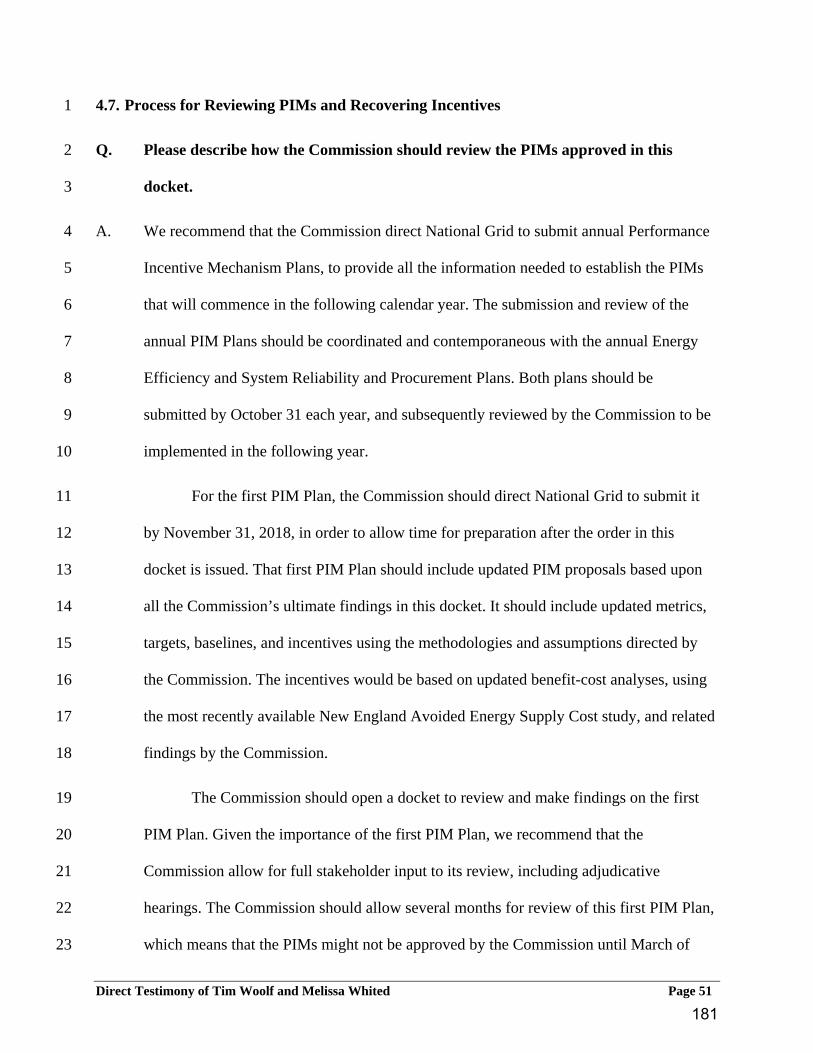
Direct Testimony of Tim Woolf and Melissa Whited Page 51
4.7. Process for Reviewing PIMs and Recovering Incentives 1
Q. Please describe how the Commission should review the PIMs approved in this 2
docket. 3
A. We recommend that the Commission direct National Grid to submit annual Performance 4
Incentive Mechanism Plans, to provide all the information needed to establish the PIMs 5
that will commence in the following calendar year. The submission and review of the 6
annual PIM Plans should be coordinated and contemporaneous with the annual Energy 7
Efficiency and System Reliability and Procurement Plans. Both plans should be 8
submitted by October 31 each year, and subsequently reviewed by the Commission to be 9
implemented in the following year. 10
For the first PIM Plan, the Commission should direct National Grid to submit it 11
by November 31, 2018, in order to allow time for preparation after the order in this 12
docket is issued. That first PIM Plan should include updated PIM proposals based upon 13
all the Commission’s ultimate findings in this docket. It should include updated metrics, 14
targets, baselines, and incentives using the methodologies and assumptions directed by 15
the Commission. The incentives would be based on updated benefit-cost analyses, using 16
the most recently available New England Avoided Energy Supply Cost study, and related 17
findings by the Commission. 18
The Commission should open a docket to review and make findings on the first 19
PIM Plan. Given the importance of the first PIM Plan, we recommend that the 20
Commission allow for full stakeholder input to its review, including adjudicative 21
hearings. The Commission should allow several months for review of this first PIM Plan, 22
which means that the PIMs might not be approved by the Commission until March of 23
181
Direct Testimony of Tim Woolf and Melissa Whited Page 52
2019. The Company should nonetheless begin working to achieve the PIM targets in 1
January of 2019, based on the direction provided by the Commission in the order in this 2
docket. 3
Q. Please describe how the Company should report information related to the PIMs to 4
the Commission. 5
A. We recommend that National Grid file with the Commission an annual Performance 6
Report, which would include all relevant information on the metrics, targets, and 7
incentives earned for the period covering the previous calendar year. This report should 8
be filed in the third quarter of the year following the relevant performance year, in order 9
to allow time to collect and verify the relevant information. The submission and review 10
of the annual Performance Reports should be coordinated and contemporaneous with the 11
annual Energy Efficiency and System Reliability and Procurement Plans. 12
The annual Performance Report should include information on every PIM that 13
applies to National Grid, including the Service Quality PIMs, the Energy Efficiency 14
PIMs, all the PIMs created in this rate case (Docket 4770), and any remaining SRP PIMs. 15
The reports would include information on the metrics for the most recent five years, to 16
the extent that the data is available, to provide an indication of performance trends over 17
time. The reports would also include information on the deviations between targets and 18
actual values. 19
National Grid should also file with the Commission streamlined versions of the 20
annual Performance Report on a quarterly basis, similar to how the Company currently 21
submits quarterly reports for its energy efficiency activities. The quarterly reports are 22
182

Direct Testimony of Tim Woolf and Melissa Whited Page 53
useful for monitoring whether the Company is roughly on track to meet its targets, and to 1
determine whether any mid-year corrections might be necessary. 2
Q. Please describe when and how the Company’s rates would be adjusted to provide 3
the Company with the PIM incentives. 4
A. Once an annual Performance Report has been approved by the Commission, the 5
Company’s rates should be adjusted to account for amount of incentives earned by the 6
Company. The PIM incentive rate adjustments should occur once per year and should 7
occur at the same time as the decoupling and energy efficiency rate adjustments, in order 8
to streamline the regulatory process and minimize the number of times within the year 9
that rates are adjusted. 10
4.8 The Mechanics of the Earnings Sharing Mechanism 11
Q. Please describe the earnings sharing mechanism that is currently in place. 12
A. Currently, the Company’s earnings are subject to an earnings sharing mechanism, under 13
which the Company must file annual reports calculating the Company’s return on equity 14
for the prior calendar year. This mechanism was established in Docket 4323. An 15
earnings report is filed for both the electric and gas businesses separately and calculates 16
the earned return on common equity (ROE) including and excluding any incentives 17
earned under the energy efficiency program. If the Company’s earned ROE is greater 18
than the allowed ROE, the Company shares the over-earnings with ratepayers 50/50 until 19
excess earnings reach 100 basis points over the allowed ROE. Any excess earnings in 20
excess of 100 basis points over the allowed ROE is shared 75/25 in favor of ratepayers. 21
Whether or not the energy efficiency incentive would be taken into account was not 22
183

Direct Testimony of Tim Woolf and Melissa Whited Page 54
specified. However, since the current mechanism was put in place, the Company has not 1
exceeded its allowed ROE, as measured by any of the filed reports in that Docket. For 2
that reason, the question of the applicability of the energy efficiency was never 3
addressed. 4
Q. What is the Division proposing in this case? 5
A. In this case, the Division recommends that an earnings sharing mechanism remain in 6
place, measured against the allowed ROE established by the Commission in this Docket. 7
However, the Division recommends some important changes to the mechanism applying 8
to electric side of the business that will work in conjunction with the PIMs. 9
Q. Please explain how the earnings sharing mechanism would work. 10
A. Similar to today’s mechanism, the Company would be required to file annual earnings 11
reports for both electric and gas. The gas earnings report should contain the same 12
information and operate the same as it is operating today, with the same sharing of excess 13
earnings as designated in Docket 4323. However, for the electric earnings report, the 14
reports should calculate the earnings with and without any PIMs awards from the prior 15
calendar year in order to show the Commission the effect of the PIMs on the Company’s 16
performance. The operation of the electric earnings sharing mechanism would also be 17
different. Specifically, to the extent the Company has earned over its allowed ROE, the 18
Company would be able to retain 100% of all earnings up to 100 basis points over the 19
allowed ROE. Once the excess earnings exceed 100 basis points, however, the amount of 20
excess earnings above 100 basis points would be shared 75/25 in favor of ratepayers. All 21
PIMs earned on the electric side of the business should be counted in the calculation of 22
the overearnings, including the energy efficiency incentive and any new PIMs approved 23
184

Direct Testimony of Tim Woolf and Melissa Whited Page 55
by the Commission. The earnings sharing mechanism will assure that the new PIMs 1
programs, in conjunction with the existing energy efficiency incentive, will not result in 2
excessive earnings. At the same time, since there is a sharing of any excess over 100 3
basis points, ratepayers are protected. 4
Q. Why are you recommending that 100% of the earnings be retained by the Company 5
up to 100 basis points? 6
A. This is an important change from the current mechanism in light of the incentives the 7
Division is proposing in this case. It is consistent with the recommendation to set the 8
allowed ROE at the lower end of the cost of equity range. By achieving the PIMs targets, 9
the Company has the opportunity to grow its earnings from the lower end of the range 10
upward. However, by setting a sharing point after 100 basis points that triggers a 75/25 11
sharing with ratepayers, it provides an important and significant incentive to the 12
Company, while at the same time protecting ratepayers from excessive earnings. 13
5. NATIONAL GRID’S PERFORMANCE INCENTIVE MECHANISM 14
5.1. National Grid’s Proposal 15
Q. Why has the Company proposed PIMs? 16
A. National Grid notes that it has developed PIMs to advance Rhode Island’s energy policy 17
goals, provide new benefits to customers, and reward utility performance in delivering 18
key programs.23 The Company claims that the current regulatory framework “is not 19
sufficient to drive innovative utility performance,” and that new compensation 20
23 PST Panel Direct Testimony, p. 81, lines 15-19.
185

Direct Testimony of Tim Woolf and Melissa Whited Page 56
mechanisms are needed to align utilities’ “financial interests with broader policy goals 1
and customer outcomes that expand beyond core performance obligations.”24 2
Q. What type of PIMs has the Company proposed? 3
A. National Grid has proposed four types of PIMs: capital efficiency, system efficiency, 4
DER, and network support service PIMs. 5
Q. What are the Company’s proposed PIMs based on? 6
A. National Grid states that it considered the PIM recommendations in the Power Sector 7
Transformation Report. The Company views the PIMs proposed in this docket as a “first 8
step in a broader evolution of the regulatory framework,” suggesting that the proposed 9
PIMs could be modified or expanded over time.25 National Grid also followed several 10
principles in designing its PIMs, as described in Section 4.3 11
Q. Does National Grid already have PIMs in place today? 12
A. Yes. Since 1990 the Company has had a shareholder incentive mechanism for its energy 13
efficiency programs. The energy efficiency PIM was developed through negotiations 14
with the Company in the DSM Collaborative, and it has been modified several times in 15
the past. National Grid also has a set of PIMs related to its service quality plans. The 16
Company is also allowed to earn shareholder incentives for long-term renewable 17
contracts, distributed generation contracts, and the Renewable Energy Growth program, 18
as determined by legislation. 19
24 PST Panel Direct Testimony, p. 83, lines 9-14. 25 PST Panel Direct Testimony, p. 84, lines 1-9.
186
Direct Testimony of Tim Woolf and Melissa Whited Page 57
Q. Does National Grid’s proposal for new PIMs include any penalties for 1
underperformance? 2
A. No. All of the PIMs proposed by the Company include only rewards for performance 3
related to the relevant targets. National Grid notes that the reward-only PIMs are 4
appropriate because they are related to new customer benefits, and they “reflect new 5
areas of accountability for the Company that expand beyond its core obligations.”26 6
Q. Please summarize the capital efficiency PIMs proposed by National Grid. 7
A. The Company has proposed two capital efficiency PIMs: 8
The Complex Capital Projects Capital Cost Incentive. The Company is proposing 9
to compare actual final capital costs to a baseline estimate of capital costs that 10
were used to review and approve the project. Any savings relative to the baseline 11
would be shared equally between customers and shareholders, and any costs 12
above the baseline would be borne by the Company’s shareholders. 13
The Construction Costs per Mile Productivity Incentive. The Company has not 14
fully developed this metric. National Grid plans to develop a metric based on the 15
construction cost per mile for distribution projects. The Company notes that it will 16
propose a baseline and targets for this PIM in its FY 2020 Electric ISR Plan 17
filing.27 18
Q. Please summarize the System Efficiency PIMs proposed by National Grid. 19
A. National Grid’s proposed System Efficiency PIMs are summarized in Table 21.28 20
26 PST Panel Direct Testimony, January 12, 2018, page 85, lines 4-9. 27 PST Panel Direct Testimony, January 12, 2018, page 86, lines 10-14. 28 PST Panel Direct Testimony, January 12, 2018, Redlined Tariff Sheet 15 (Bates 18)
187
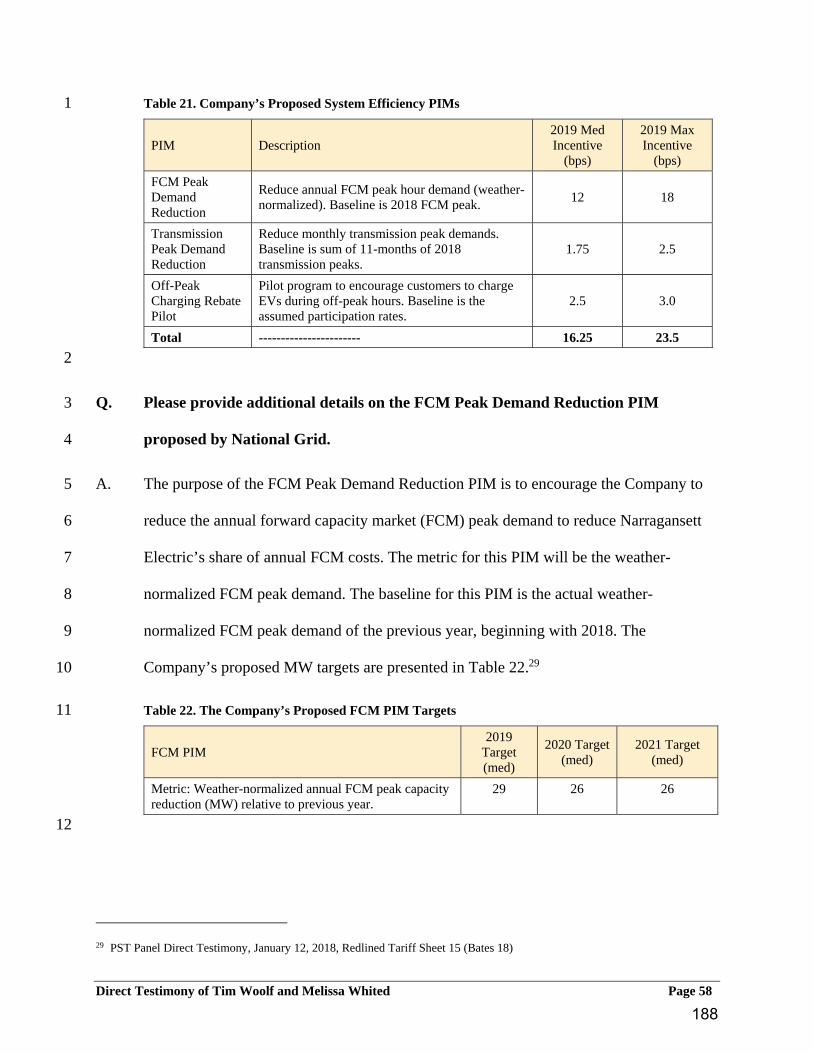
Direct Testimony of Tim Woolf and Melissa Whited Page 58
Table 21. Company’s Proposed System Efficiency PIMs 1
PIM Description 2019 Med Incentive
(bps)
2019 Max Incentive
(bps) FCM Peak Demand Reduction
Reduce annual FCM peak hour demand (weather-normalized). Baseline is 2018 FCM peak. 12 18
Transmission Peak Demand Reduction
Reduce monthly transmission peak demands. Baseline is sum of 11-months of 2018 transmission peaks.
1.75 2.5
Off-Peak Charging Rebate Pilot
Pilot program to encourage customers to charge EVs during off-peak hours. Baseline is the assumed participation rates.
2.5 3.0
Total ----------------------- 16.25 23.5 2
Q. Please provide additional details on the FCM Peak Demand Reduction PIM 3
proposed by National Grid. 4
A. The purpose of the FCM Peak Demand Reduction PIM is to encourage the Company to 5
reduce the annual forward capacity market (FCM) peak demand to reduce Narragansett 6
Electric’s share of annual FCM costs. The metric for this PIM will be the weather-7
normalized FCM peak demand. The baseline for this PIM is the actual weather-8
normalized FCM peak demand of the previous year, beginning with 2018. The 9
Company’s proposed MW targets are presented in Table 22.29 10
Table 22. The Company’s Proposed FCM PIM Targets 11
FCM PIM 2019
Target (med)
2020 Target (med)
2021 Target (med)
Metric: Weather-normalized annual FCM peak capacity reduction (MW) relative to previous year.
29 26 26
12
29 PST Panel Direct Testimony, January 12, 2018, Redlined Tariff Sheet 15 (Bates 18)
188

Direct Testimony of Tim Woolf and Melissa Whited Page 59
These annual FCM targets include the savings that the Company expects to achieve 1
through energy efficiency, distributed generation, volt-var optimization (VVO), and 2
storage.30 Consequently, the MW savings targets for the FCM PIM only represent 3
additional savings of 5 to 6 MW each year. 4
Q. Please provide additional details on the Transmission Peak Demand Reduction PIM 5
proposed by National Grid. 6
A. The purpose of the Transmission Peak Demand Reduction PIM is to encourage the 7
Company to reduce monthly transmission peaks to reduce Narragansett Electric’s share 8
of monthly transmission costs. The metric for this PIM is the sum of monthly weather-9
normalized transmission peak demand. It is unclear whether the Company intends for 10
these values represent the sum of 11 months of transmission peaks or 12 months of 11
transmission peaks. In response to DIV 3-9 (e), the Company states that “to avoid double 12
counting, the Company did not attribute any capacity savings from the month where the 13
annual peak occurs to the Monthly Peak Demand Reduction metric.” However, in 14
response to DIV 8-14 (d), the Company states that its proposal for the Monthly 15
Transmission Peak Demand metric is the “annual sum of 12 months peak demands, 16
inclusive of the maximum month. These targets are intended to capture additional 17
incremental effort by the Company to reduce peak demand outside of the annual peak 18
month.” 19
The Company proposes that the baseline for this PIM will be the sum of the actual 20
weather-normalized transmission peak demands in the previous year. This means that the 21
30 Attachment DIV 25-5.
189

Direct Testimony of Tim Woolf and Melissa Whited Page 60
Company’s proposed MW savings targets in 2019 are relative to the transmission peak 1
values in 2018, while the savings achieved in 2020 are relative to the transmission peak 2
values in 2019. The Company’s proposed MW targets and basis point incentives for this 3
PIM for 2019 are presented in Table 23.31 4
Table 23. The Company’s Proposed Transmission PIM Targets 5
Transmission Peak Demand Reduction PIM 2019
Target (med)
2020 Target (med)
2021 Target (med)
Metric: sum of monthly of transmission peak capacity savings (MW), year-over-year
29 26 26
6
Q. Please summarize the DER PIMs proposed by National Grid. 7
A. National Grid’s proposed DER PIMs are summarized in Table 24.32 8
31 PST Panel Direct Testimony, January 12, 2018, Redlined Tariff Sheet 15 (Bates 18) 32 PST Panel Direct Testimony, January 12, 2018, Redlined Tariff Sheet 16-17 (Bates 19-20)
190

Direct Testimony of Tim Woolf and Melissa Whited Page 61
Table 24. The Company’s Proposed DER PIMs 1
DER PIM Description Med
Incentive (bps)
Max Incentive
(bps) DG Friendly Substations
The number of substations that have ground fault detection (3V0) installed and that are capable of readily installing DG where significant amounts of DG have been proposed
6 10
Demand Response: Residential
Measured by the number of residential customers participating in the Company’s Connected Solutions program.
3 5
Demand Response: C&I
Measured by the contracted MWs in the Company’s C&I demand response programs. 3 5
Electric Heat Measured reductions in carbon in short tons per year. 1 2 Electric Vehicles EV ownership, measured by EVs registered after
commencement of program, in excess of projections based on Annual Energy Outlook 2017 forecast EV sales growth for New England.
2 3.5
Behind the Meter Storage
Measured by the annual MW growth in energy storage installed at customer locations behind a meter used to register electric load.
1 2
Company-Owned Storage
Measured by the installed MW of Company-owned in energy storage, inclusive of the ESS Program above, used to support peak load reduction and verified using interval metering.
1 2
Total ----------------------- 17 29.5 2
Q. Please summarize the network support services PIMs proposed by National Grid. 3
A. National Grid’s proposed network support services PIMs are summarized in Table 25.33 4
33 PST Panel Direct Testimony, January 12, 2018, Redlined Tariff Sheet 17-18 (Bates 20-21)
191

Direct Testimony of Tim Woolf and Melissa Whited Page 62
Table 25. The Company’s Proposed Network Services PIMs 1
Network Support PIM Description
Med Incentive
(bps)
Max Incentive
(bps) AMF Customer Engagement and Deployment
Measured based on achievement of stated milestones with documentation evidencing achievement provided by the Company. Basis points vary by year.
1 to 2 1 to 2
VVO Pilot Delivery
Project in service; delivery of expected results of VVO deployment measured by a 1 percent reduction in energy consumption and peak demand from that expected from primary VVO optimization that would not include AMF technology of 3 percent
2 2
Interconnection Support: Time to ISA
The actual average time to provide executable Interconnection Service Agreements, measured from the date on which the Company receives the interconnection application to the date the ISAs are provided to customers for execution, during a calendar year, against total time allowed in the required time frames identified in the Company’s Standards for Interconnecting Distributed Generation tariff, stated as a percentage.
4 6
Interconnection Support: Average Days to System Modification
The actual average time to complete system modifications, measured from the date ISAs are executed to the date on which system modifications are completed, during a calendar year, against total time allowed in the required time frames identified in the Company’s Standards for Interconnecting Distributed Generation tariff, stated as a percentage.
4 6
Interconnection Support: Estimate versus Actual Costs
The difference, measured as a percentage, between the sum of the costs estimated by the Company for interconnecting DG, during a calendar year, and the sum of the actual costs paid by those customers for the interconnection of DG where interconnection was completed in the same calendar year.
4 6
Total ------------------ 15 to 16 21 to 22 2
Q. Please summarize the total incentives that National Grid could potentially earn in 3
2019 from all its proposed PIMs. 4
A. These are summarized in Table 26. 5
192

Direct Testimony of Tim Woolf and Melissa Whited Page 63
Table 26. Incentives that National Grid Could Potentially Earn (bps) 1
Type of PIM 2019 (med)
2019 (max)
2020 (med)
2020 (max)
2021 (med)
2021 (med)
System Efficiency 16.25 23.25 16.25 23.25 16.25 23.25 Distributed Energy Resources 17.0 29.5 17.0 29.5 17.0 29.5 Network Support Services 16.0 22.0 15.0 21.0 15.0 21.0 Total 49.25 74.75 48.25 73.75 48.25 73.75
2
5.2. Critique of National Grid’s Proposal 3
Q. Please describe your concerns with National Grid’ proposed Capital Efficiency 4
PIMs. 5
A. Our primary concern with these PIM is that they are not necessary. As described in the 6
direct testimony of Mr. Woolf, the Division recommends that the Commission establish a 7
multi-year rate plan. Under this proposal the Company would automatically have a 8
financial incentive to reduce capital costs and improve productivity between rate cases. In 9
fact, this is one of the primary reasons for establishing an MRP. In the event that this case 10
does not yield an MRP, we offer alternative approaches for encouraging efficient use of 11
capital costs and improved productivity, as described in the direct testimony of Mr. 12
Woolf. 13
We are also concerned that these PIMs could place too much risk on the 14
customers. The Company would determine the initial capital costs used to set the targets, 15
and therefore has an incentive to overstate cost projections. 16
193

Direct Testimony of Tim Woolf and Melissa Whited Page 64
Q. Please describe your concerns with National Grid’s proposed FCM Peak Demand 1
Reduction PIM. 2
A. We have concerns regarding the baseline, targets, and incentives associated with National 3
Grid’s proposed FCM PIM. First, National Grid proposes to reduce peak demand on a 4
year-over-year basis. These targets were developed in relation to a baseline forecast of 5
peak demand, but converting them to year-over-year targets divorces them from the 6
baseline, rendering it meaningless.34 The use of a sound baseline in setting and measuring 7
targets is critical, as it captures the effects of many other drivers of peak demand 8
reductions. If these other factors are not accounted for in setting and measuring PIM 9
targets, then the Company might be rewarded for peak demand reductions that are not a 10
result of its actions (or not rewarded despite utility actions that successfully reduce FCM 11
peak demand.) 12
Second, the Company did not propose targets that provide a sufficient degree of 13
certainty that they will be achieved due to Company effort, rather than other factors. 14
When a forecast is used as a baseline for a PIM, it is often appropriate to establish a 15
“deadband” around the forecast. A deadband is a region around the target within which 16
the Company would not earn a reward (or incur penalties). The concept of a deadband is 17
often used to account for uncertainty regarding the target or to allow for some deviation 18
from the target due to factors outside of utility control. 35 Setting PIM targets outside of a 19
34 A consequence of this would be that the same total rewards could be earned over the three year period for varying levels of
cumulative peak demand reductions. Suppose, for example, that the Company increased peak demand in the first year artificially, followed by achieving “high” reductions the following two years, which would be easier to achieve. Because the PIM has no penalty for under-performance in year 1, the same rewards could be earned through this method, even though the cumulative reductions would be lower than if the Company had achieved the medium target each year.
35 Synapse Energy Economics, Utility Performance Incentive Mechanisms: A Handbook for Regulators.
194

Direct Testimony of Tim Woolf and Melissa Whited Page 65
deadband helps to ensure that the utility is not provided incentives for outcomes that it is 1
not responsible for. 2
The Company’s FCM peak forecast, along with our proposed deadband and PIM 3
targets are presented in Figure 2, in Section 4.4. The figure indicates that the Company’s 4
proposed FCM PIM targets for 2019 and 2020 fall within our estimate of a reasonable 5
deadband, suggesting that the Company could be rewarded for FCM peak reductions that 6
would have occurred in the absence of the PIM or the utility actions. In sum, the 7
Company’s proposal would result in PIM targets that have a reasonable likelihood of 8
being achieved without any additional effort by the Company. 9
Q. Please describe your concerns with National Grid’s proposed Transmission Peak 10
Demand Reduction PIM. 11
A. We have concerns regarding the baseline, the targets, and the incentives associated with 12
National Grid’s proposed Transmission PIM. As described above, we do not agree with 13
using the year-over-year reductions in demand as the metric for the transmission peak 14
reduction targets. Performance should be measured relative to a forecast baseline. The 15
use of a sound baseline in setting and measuring targets is critical, as it captures the 16
effects of many other drivers of transmission peak demand reductions. If these other 17
factors are not accounted for in setting and measuring PIM targets, then the Company 18
might be rewarded for peak demand reductions that are not a result of its actions 19
This is the same problem described above for the FCM PIM. However, unlike the 20
FCM peak demands, the Company does not have a forecast of monthly transmission peak 21
195

Direct Testimony of Tim Woolf and Melissa Whited Page 66
demands.36 In order to be able to properly evaluate the proposed Transmission PIM, we 1
have prepared our own transmission peak forecast, using historical data provided by the 2
Company. 3
Our analysis shows that the historical transmission peak demands have been 4
trending downward, and this trend is likely to continue. If the transmission peak 5
reduction targets are based on the 2018 historical peak demand, then the Company could 6
be rewarded for peak reductions that would have occurred without the Transmission PIM 7
and without utility actions. 8
As noted above, it is often appropriate to establish a “deadband” around the 9
forecast within which there would be no reward or penalties for performance. Deadbands 10
are useful for mitigating uncertainty regarding the target and to allow for some deviation 11
from the target due to factors outside of utility control.37 PIM targets should be designed 12
to fall outside of such a deadband, to ensure that the utility is not provided incentives for 13
outcomes that it is not responsible for. 14
The Company’s historical transmission peak demand, along with our forecast, 15
proposed deadband, and PIM targets are presented in Figure 3, in Section 4.4. As 16
indicated in the figure, the Company’s proposed Transmission PIM targets for 2019 and 17
2020 fall above our forecast and our estimate of a reasonable deadband, suggesting that 18
the Company could be rewarded for transmission peak reductions that would have 19
occurred in the absence of the PIM or the utility actions. In sum, the Company’s proposal 20
to use a historical year for the baseline, instead of a reasonable forecast, has resulted in 21
36 Response to (4770) Division 25-14 37 Synapse Energy Economics, Utility Performance Incentive Mechanisms: A Handbook for Regulators.
196

Direct Testimony of Tim Woolf and Melissa Whited Page 67
Transmission PIM targets that might be so easy to meet that they will not provide any 1
benefits to customers. 2
In addition, we do not agree with the way that National Grid determined the 3
magnitude of the incentive associated with the Transmission PIM. Because the Company 4
does not have estimates for monthly demand reductions from other initiatives, the 5
Company’s proposal appears to allow it to earn financial incentives under this PIM as a 6
result of the energy efficiency, distributed generation, and other PST initiatives that have 7
their own PIMs. This would result in the Company earning PIM incentives twice; once 8
for the Transmission PIM and once for the other PIMs that result in transmission peak 9
reductions. 10
Q. Please describe your concerns with National Grid’s proposed Off-Peak Charging 11
Rebate Pilot PIM. 12
A. In general, we agree with the Company’s goal of encouraging customers to charge their 13
EVs during off-peak hours, and that this could be an important way to transition EV 14
customers to TVR in the future. However, we do not think that participation in Off-Peak 15
Charging Rebate Pilot is a very robust metric for this purpose. Customer participation in 16
the rebate program does not necessarily mean that customers will change their charging 17
patterns. 18
In addition, we are not convinced that the Company’s proposed pilot is the best 19
way to promote the cost-effective adoption of EVs.38 We prefer an EV metric that is more 20
38 Our concerns about the Company’s proposed Electric Vehicle initiative are described in our testimony in Docket 4780.
197

Direct Testimony of Tim Woolf and Melissa Whited Page 68
closely tied with one of the primary objectives for promoting EVs: the reduction of 1
greenhouse gases. 2
Q. Please describe your concerns with National Grid’s proposed Distributed Energy 3
Resource PIMs. 4
A. Our concerns with National Grid’s proposed DER PIMs are summarized below: 5
DG-Friendly Substation Transformer. It is our impression that National Grid 6
should be installing ground fault detection (3VO) at substation transformers in a 7
timely fashion as part of its core performance obligation. Installation of these 8
technologies is now common practice for the Company, and National Grid does 9
not require a PIM to encourage better or timelier performance in meeting its 10
obligations. 11
Demand Response: Residential. The number of customers participating in the 12
program is not a good metric for demand response programs, because it does not 13
directly reflect the outcome desired, which is the ability to reduce demand during 14
peak hours. We prefer a metric that reflects the number of MW that the Company 15
has contracted customers to provide during peak hours. In addition, we prefer that 16
the magnitude of the incentive be based on a shared savings approach; which will 17
encourage the Company to design and implement programs in the most cost-18
effective way, and will protect customers in the event that the demand response 19
program net benefits are small or negative. 20
Demand Response C&I. We prefer that the magnitude of the incentive be based 21
on a shared savings approach; which will encourage the Company to design and 22
implement programs in the most cost-effective way, and will protect customers in 23
the event that the demand response program net benefits are small or negative. 24
Electric Heat Initiative. We prefer that the magnitude of this incentive be based on 25
a shared savings approach. This will encourage the Company to design and 26
implement programs in the most cost-effective way, and will protect customers in 27
the event that the initiative’s net benefits are small or negative. 28
198

Direct Testimony of Tim Woolf and Melissa Whited Page 69
Electric Vehicles. One of the primary policy goals for promoting EVs is to reduce 1
greenhouse gas emissions. Therefore, we prefer a metric that is more directly tied 2
to this policy goal. 3
Behind-the Meter Storage. We are concerned that the Company’s behind-the-4
meter storage program is not sufficiently defined at this time. Also, for the many 5
customers that do not have time-varying rates, behind-the-meter storage is not 6
likely to be economical. Even for those customers with TVR, the Company has 7
not demonstrated that behind-the-meter storage will provide net benefits to 8
customers. We prefer that the magnitude of any incentive be based on a shared 9
savings approach; which will encourage the Company to design and implement a 10
program in the most cost-effective way, and will protect customers in the event 11
that the program net benefits are small or negative. 12
Company-Owned Storage. We are concerned that the Company-Owned Storage 13
PIM is not justified on economic grounds. The Company’s BCA indicates that 14
company-owned storage has a benefit-cost ratio of 0.45.39 In addition, we prefer 15
that the magnitude of any incentive be based on a shared savings approach; which 16
will encourage the Company to design and implement a program that is cost-17
effective, and will protect customers in the event that the program net benefits are 18
small or negative. 19
Q. Please describe your concerns with National Grid’s proposed Network Support 20
Services PIMs. 21
A. In general, we are concerned that all of the Company’s Network Support Services PIMs 22
are not justified because they are for activities that National Grid should undertake 23
anyway. In particular: 24
AMF Customer Engagement and Deployment. This PIM is premature, given that 25
the Commission has not yet approved system-wide deployment of AMF. 26
39 Schedule PST-1, Chapter 7, Energy Storage, page 6 of 9.
199

Direct Testimony of Tim Woolf and Melissa Whited Page 70
VVO Pilot Delivery. The Company has clearly demonstrated that VVO will 1
improve the efficiency with which the electricity grid is operated and provide 2
significant net benefits to customers.40 While VVO technologies might be 3
described as relatively new, they fall within the Company’s core performance 4
obligations, and thus do not warrant a PIM. In addition, VVO technologies are not 5
necessarily foundational to power sector transformation. 6
Interconnection Support – Time to ISA. The Company already has a legislative 7
requirement and performance standards to complete certain aspects of the 8
interconnection process for distributed generation in a timely fashion.41 9
Interconnection Support – Estimate Versus Actual Cost. Interconnecting 10
distributed generation customers at a reasonable, low cost is already a part of the 11
Company’s core performance obligations, and thus does not warrant a PIM. 12
6. NEW GRID MODERNIZATION INVESTMENTS 13
6.1. National Grid’s Proposal 14
Q. Please describe National Grid’s proposal for new grid modernization investments. 15
A. The Company has submitted a request for approval of several projects intended to enable 16
the adoption and interconnection of higher levels of DER. National Grid introduces these 17
projects in Schedule PST – 1, Chapter 3 of its initial filing, and addresses them further in 18
Section V.a in the PST Panel testimony in Docket 4780. The Company sometimes refers 19
to these investments as “new grid modernization activities,” and sometimes as “DER 20
enabling investments.” These investments cover a variety of distribution system 21
40 Response to (4770) Division 3-20, Attachment DIV 3-20. 41 See, RI Gen L § 39-26.3-3 (2012): Upon receipt of a completed application requesting a feasibility study and receipt of the
applicable feasibility study fee, the electric distribution company shall provide a feasibility study to the applicant within thirty (30) days. Upon receipt of a completed application requesting an impact study and receipt of the applicable impact study fee, the electric distribution company shall provide an impact study within ninety (90) days.
200
Direct Testimony of Tim Woolf and Melissa Whited Page 71
upgrades, including those related to: a system data portal; feeder monitoring sensors; 1
control center enhancements; operation data management; telecommunications; and 2
cybersecurity.42 3
Q. Please explain why the Company’s proposed new grid modernization investments 4
are relevant to this rate case docket. 5
A. While National Grid’s proposal for new grid modernization projects was included as part 6
of Docket 4780, there are two categories of those projects that would impact the revenue 7
requirements in this rate case docket. First, the Company proposes to move forward with 8
a multi-jurisdictional deployment of its GIS Data Enhancement project and include some 9
of the new grid modernization investments, ranging from $0.43 million it its revenue 10
requirements for the 2019 rate year.43 They also include a study to help design the AMF 11
proposal, equal to $2 million in the 2019 rate year.44 If the Commission is to allow 12
recovery of the costs of these projects in the revenue requirements for rate year 2019, 13
then it will need to do so in this rate case. 14
Q. The Company has requested that the costs for the new grid modernization projects 15
be recovered separately from base rates through a PST Factor. Does this obviate the 16
need for the Commission to consider the proposed new grid modernization projects 17
in this rate case docket? 18
A. No. As described in Mr. Woolf’s testimony, the Division recommends that the 19
Commission reject the Company’s proposal to recover new grid modernization costs, or 20
42 Testimony of the Power Sector Transformation Panel, January 12, 2018, p. 27. 43 Response to (Docket 4770) Division 32-23. 44 Response to (Docket 4770) Division 19-8, Attachment DIV 19-8-3, pp 1-2.
201

Direct Testimony of Tim Woolf and Melissa Whited Page 72
any costs related to power sector transformation, in a PST Factor. Therefore, if the 1
Commission is to allow recovery of the costs of these projects in the revenue 2
requirements for rate year 2019, then it will need to do so in this rate case. 3
6.2. Integration of Distribution System Planning and Review 4
Q. Please explain why the Division does not support the Company’s proposal to 5
recover new grid modernization costs separately from base rates in a PST Factor. 6
A. As described in the Direct Testimony of Mr. Woolf, the Division strongly recommends 7
that the Commission direct the Company to better integrate the planning, review, and cost 8
recovery of the various projects that, in one way or another, contribute to providing 9
reliable, safe, clean, and affordable distribution services. This includes more integrated 10
planning practices for conventional distribution, grid modernization, DER-enabling, and 11
DER projects. It also includes more integrated regulatory review of these projects, 12
through rate cases, ISR cases, energy efficiency and system reliability plans, and any 13
other practices established as a result of the PST initiative in Docket 4770 and 4780. 14
National Grid has also stated a preference for better integration of the regulatory review 15
of its distribution system and DER-related projects.45 16
The Division is opposed to a PST Factor because it moves in exactly the opposite 17
direction by creating a new category of projects that will be given different regulatory 18
treatment than other projects. First, it is difficult to distinguish between conventional 19
distribution projects, grid modernization projects, DER-enabling projects, and DER 20
projects. Second, this fractured approach makes it difficult for the Division and the 21
45 Testimony of the Power Sector Transformation Panel, January 12, 2018, pages 16 and 29-30.
202

Direct Testimony of Tim Woolf and Melissa Whited Page 73
Commission to evaluate the distribution business activities of the Company on a logical, 1
integrated basis. Third, ability to recover all PST costs on a reconciling basis, while 2
recovering conventional distribution costs in the context of rate cases, would shift cost 3
risks to ratepayers with little or no risk to the Company. This would provide the 4
Company with inconsistent regulatory and financial incentives for projects that should be 5
compared directly with each other on an equivalent basis. 6
6.3. Recommendations 7
Q. What do you recommend regarding National Grid’s proposal for new grid 8
modernization investments? 9
A. We recommend that the Commission reject National Grid’s request for a PST Factor, and 10
direct the Company to submit requests for recovery of any type of distribution costs 11
through either the rate case process or the ISR process. As described in the direct 12
testimony of Mr. Woolf, rejecting the proposed PST Factor is one of the Division’s top 13
priorities in Dockets 4770 and 4780. 14
We also support Mr. Booth’s recommendation that the Commission direct the 15
Company to submit a grid modernization plan that considers all potential distribution 16
system projects and investments in an integrate fashion. The Commission should also 17
direct the Company to eliminate the unwarranted distinction between conventional, grid 18
modernization, DER-enabling, and DER projects, for the purpose of regulatory review 19
and cost recovery. 20
203

Direct Testimony of Tim Woolf and Melissa Whited Page 74
7. ADVANCED METERING FUNCTIONALITY 1
7.1. National Grid’s Proposal 2
Q. Please explain why the Company’s proposed AMF investments are relevant to 3
docket 4770. 4
A. As part of Docket 4780, the Company has requested approval to perform additional 5
design work during FY 2019 in order to “provide the necessary groundwork for 6
implementation of its future AMF investments” that it will submit for further review and 7
approval by December 1, 2018.46 The cost of this design work was very roughly 8
estimated by the Company to be $2,000,000, and would impact the revenue requirements 9
at issue in the instant docket.47 10
Q. Is AMF an investment that should be investigated further? 11
A. Yes. In order for Rhode Island to achieve the outcomes recommended by stakeholders in 12
Docket 4600, AMF investments will be necessary. For example, AMF enables the 13
following outcomes: “outage protection, faster outage restoration, access to various 14
pricing options that can save [customers] money, access to energy efficiency and 15
renewable services tailored to [customers’] usage, and more efficient use of the 16
distribution system that creates consumer savings.”48 17
46 Id, page 37 47 Direct Testimony of the Power Sector Transformation Panel, January 12, 2018, page 4 and response to Attachment DIV 19-8-
3 (Docket 4770). 48 Ibid., page 32.
204

Direct Testimony of Tim Woolf and Melissa Whited Page 75
Q. What analysis has the Company already performed with respect to AMF? 1
A. The Company has developed preliminary cost estimates associated with full deployment 2
of advanced metering functionality in Rhode Island, and expects that the deployment will 3
result in significant benefits to customers and system savings. These benefits include 4
enhanced energy management capability, enablement of third party programs and 5
offerings, enhanced volt-var optimization, avoided O&M costs, and storm outage 6
management system improvements.49 7
The Company’s initial benefit-cost analysis shows that the investment is expected 8
to be cost-effective under six of eight scenarios. These scenarios are shown in the table 9
below. 10
Rhode Island Only
Opt-In Opt-Out
Low Savings High Savings Low Savings High Savings
Net Benefits (NPV $Million) -$55.23 $16.99 -$30.53 $68.90 Benefit-Cost Ratio 0.79 1.07 0.88 1.27
Rhode Island and New York Joint Implementation
Opt-In Opt-Out
Low Savings High Savings Low Savings High Savings
Net Benefits (NPV $Million) $12.92 $85.14 $37.19 $137.05 Benefit-Cost Ratio 1.07 1.44 1.19 1.72
11
49 Id, page 38
205

Direct Testimony of Tim Woolf and Melissa Whited Page 76
7.2. The AMF Study 1
Q. Is it appropriate to conduct additional analysis prior to submitting an application 2
for a full roll-out of AMF? 3
A. Yes. It is appropriate for several reasons. First, the potential benefits associated with 4
AMF are large, but the costs are also large. Because of this, a relatively small percentage 5
error in either direction on the estimated costs and benefits could have large 6
consequences with respect to impacts on customers. To reduce this risk, it is appropriate 7
to thoroughly study the costs and benefits prior to implementation. 8
Second, the technology and business models associated with AMF are evolving 9
quickly. To fully capture the potential benefits associated with AMF, the Company 10
should study new and emerging approaches to AMF – approaches that would reduce 11
costs, avoid technology obsolescence, and reduce the risk of stranded costs. In other 12
words, we believe that additional study could enable the Company to employ innovative 13
practices for AMF implementation beyond what is typically done in the industry, 14
potentially providing much greater net benefits to customers and serving as a model 15
nationally. 16
Q. What innovative approaches to AMF should the Company study? 17
A. As discussed in the Rhode Island Power Sector Transformation report,50 the Company 18
should study the potential for shared communication infrastructure and enabling access to 19
50 Rhode Island Power Sector Transformation report, November 8, 2017, page 42.
206

Direct Testimony of Tim Woolf and Melissa Whited Page 77
third party providers. In addition, we recommend that the Company investigate 1
procurement of AMF as a service, rather than through a capital investment. 2
Q. Please describe the potential benefits of shared communication infrastructure. 3
A. The communication infrastructure backbone is one of the most costly aspects of AMF 4
deployment. By sharing or expanding upon that infrastructure through partnerships, 5
significant customer savings could be achieved. 6
Q. Please describe the benefits of enabling access to third party providers. 7
A. The competitive market is rapidly expanding the number of value-added services that can 8
be provided to customers based on an individual customer’s usage information. With 9
appropriate privacy and security protections, enabling access to meter data and 10
capabilities can greatly expand the services provided to customers in Rhode Island. For 11
example, through analysis of customer data, customers could be offered energy 12
efficiency, demand response, or distributed generation products tailored to their usage 13
profiles. 14
In addition, new services are emerging that disaggregate customer usage data to provide 15
services such as predictive analytics and preventative maintenance (e.g., informing 16
customers that their furnace is working harder than normal, so it may be time to replace 17
the filter), or informing customers about happenings in their home (for example, that their 18
kids are home or that their attic light is on).51 19
51 Examples of such companies currently providing these services are Powerley and Whisker Labs.
207

Direct Testimony of Tim Woolf and Melissa Whited Page 78
Q. Please explain what you mean by the procurement of “AMF as a service.” 1
A. In many industries, equipment manufacturers now provide equipment-as-a-service, rather 2
than requiring customers to purchase the equipment through a large capital investment. A 3
similar concept is being applied to the smart grid through “smart-grid-as-a-service”52 or 4
“metering-as-a-service” where a third party provider owns the equipment, fully manages 5
the project, and provides operational support to utilities through a subscription service.53 6
This approach is already common for software, but is becoming more common for 7
hardware as well. For example, Leidos has provided this service to several municipalities 8
and cooperatives nationwide.54 A presentation by the Company includes the following 9
52 Tom Damon and Josh Wepman, “Smart Grid as a Service: An Alternative Approach to Tackling Smart Grid Challenges,”
Electric Energy T&D, May 2011, http://electricenergyonline.com/show_article.php?mag=71&article=575. 53 MeterSys, “Metering as a Service® (MaaS),” MeterSys Advanced Metering Solutions, 2018, https://metersys.com/metering-
as-a-services-maas/. 54 See, for example: Smart Grid Today, “Lansing, Mich, Hires Leidos to Deploy Smart Grid,” Smart Grid Today, July 20, 2017,
https://www.smartgridtoday.com/public/Lansing-Mich-hires-Leidos-to-deploy-smart-grid.cfm.
208

Direct Testimony of Tim Woolf and Melissa Whited Page 79
comparison of utility AMI deployment strategies:55 1
2
Q. What has the Company proposed as part of its design work? 3
A. The Company states that the study will be used “to undertake the next phase of design, 4
including further exploration of partnerships, stakeholder input, and other innovative 5
program elements, and to undertake a procurement exercise.”56 In particular, the 6
Company states that it has “commenced an effort to explore the value of a state-wide 7
communications system,” and has issued a Request for Information to identify qualified 8
suppliers to receive an end-to-end “Request for Solution” and to gather market 9
55 Steven Root, “Best Practices on AMI Implementation and Operations for Improving Efficiency,” November 5, 2015,
http://www.publicpower.com/pdf/ecc15/Steven_Root.pdf. 56 Id., Page 3 of 31.
209

Direct Testimony of Tim Woolf and Melissa Whited Page 80
intelligence. In addition, the Company proposes to explore additional functionalities 1
including load disaggregation and gas demand response.57 2
Q. Please describe the work associated with conducting this design work. 3
A. The Company has not provided a detailed description for the study. Instead, the Company 4
developed a very general estimate of the costs at the departmental function level for its 5
New York affiliate58 that lacked detail. From this New York estimate, the Company 6
extrapolated a study cost that would apply to a combined New York/Rhode Island study. 7
Q. What is your assessment of the Company’s AMF study proposal? 8
A. The decision of whether and how to pursue AMF should not be taken lightly. It is a very 9
large investment with potentially large benefits. For this reason, the Company should 10
explore deployment scenarios, technologies, and other options very carefully. However, 11
the Company has not provided sufficient detail to justify spending $2 million on such a 12
study in Rhode Island, particularly when it states that such a study would be similar to 13
that undertaken by its New York affiliate.59 Division witness Michael Ballaban addresses 14
the cost of the study in his testimony, including what should be allowed in the revenue 15
requirement. 16
57 Response to (4770) Division 32-19. 58 Response to (4770) Division 23-5 59 Response to (4770) Division 23-5
210

Direct Testimony of Tim Woolf and Melissa Whited Page 81
7.3. Recommendations 1
Q. What do you recommend regarding the Company’s AMF study? 2
A. The Company’s analysis shows AMI to be very promising, and it is clear that further 3
study is warranted to develop the best approach for implementing AFM. However, such a 4
study should be designed to provide additional value beyond the exploration that the 5
Company is undertaking in New York. For this reason, we recommend that the 6
Commission direct the Company to work with the Division to develop a study plan that 7
provides significant additional information to the New York study. Further, the Company 8
should be required to periodically meet with the Division to discuss the study findings 9
and file a report with the Commission at the conclusion of the process. Following 10
submittal of the AMI study, the Division recommends that the Commission open a docket 11
to examine the study with stakeholders and to design a phased approach to application of 12
time varying rates consistent with the principles of Docket 4600. 13
8. BENEFIT-COST ANALYSES 14
8.1. The Role of Benefit-Cost Analyses 15
Q. Please explain why benefit-cost analyses relevant in this rate case. 16
A. As described in Section 3, the Commission should address PIMs in this rate case docket 17
because of the important inter-relationship between PIMs and the authorized ROE. 18
Benefit-cost analyses are a critical element in designing PIMs, because they can help 19
shed light on the potential net benefits of PIM activities, and thereby inform decisions 20
regarding the magnitude of PIM incentives. Ideally, PIM incentives should be set at a 21
level that will result in net benefits to customers. 22
211

Direct Testimony of Tim Woolf and Melissa Whited Page 82
Q. Please provide an overview of the role of benefit-cost analysis (BCA) in Rhode 1
Island. 2
A. The role of cost-effectiveness (and thus BCAs) was recently addressed in Docket 4600. 3
In April 2017, the Docket 4600 stakeholder working group submitted a report to the 4
Commission providing recommendations for a new cost-effectiveness test, among other 5
things.60 The proposed Rhode Island Benefit-Cost Framework built off the cost-6
effectiveness test that has been used historically for energy efficiency resources, and 7
included a broader range of costs and benefits to better reflect power sector 8
transformation and state energy policy goals. 9
In October 2017, the Commission issued a Guidance Document that provided 10
direction on how to address the issues raised in Docket 4600, and accepted the proposed 11
RI Benefit-Cost Framework as the appropriate cost-effectiveness methodology.61 12
Q. What does the Commission’s Guidance Document say about the role of BCAs? 13
A. The Guidance Document is clear that the RI Benefit-Cost Framework should play a 14
central role in evaluating a wide range of utility proposals. Specifically, the Guidance 15
Document states that: 16
in any case that proposes new programs or capital investment that will affect 17 National Grid’s electric distribution rates, the impact of any increased ratepayer 18 recovery should also reference the goals, rate design principles, and Benefit-Cost 19 Framework. National Grid should apply the Benefit-Cost Framework to changes 20
60 Docket 4600 Stakeholder Working Group, Report to the Rhode Island Public Utilities Commission, April 5, 2017. 61 Rhode Island Public Utilities Commission, Docket 4600, Guidance on Goals, Principles, and Values for Matters Involving the
Narragansett Electric Company, October 27, 2017.
212
Direct Testimony of Tim Woolf and Melissa Whited Page 83
in its cost of service for the primary purpose of complying with State policy or to 1 expand a current program.62 2
Q. What does the Commission’s Guidance Document say about using quantitative and 3
qualitative data in the RI Benefit-Cost Framework? 4
A. The Guidance Document acknowledges that there is still significant work remaining to 5
identify and quantify some of the impacts in the new framework. It clarifies that: 6
Where the costs and benefits can be quantified, the proponent should provide 7
such information and the basis for the conclusion reached. Where quantification 8 is not possible or not practical, the proponent should so explain. Regardless of 9 whether the quantification can be fully completed, a qualitative analysis should 10
be included.63 11
Q. Is the Benefit-Cost Framework the only factor that should be used to evaluate 12
proposals for new investments and new projects? 13
A. No. The Guidance Document states that: 14
the Benefit-Cost Framework will not be the exclusive measure of whether a 15 specific proposal should be approved. For example, there may be outside factors 16 that need to be considered by the PUC regardless of whether a specific proposal 17 is determined to be cost-effective or not. This may include statutory mandates or 18 other qualitative considerations.64 19
62 Guidance Document, p. 6. 63 Guidance Document, p. 6. 64 Guidance Document, p. 7.
213

Direct Testimony of Tim Woolf and Melissa Whited Page 84
8.2. National Grid’s Benefit-Cost Analyses 1
Q. Please provide an overview of the Company’s BCA methodology. 2
A. National Grid applied two different approaches to evaluating costs and benefits. For the 3
grid-side investments that are made to enable DER (i.e., those described in Chapter 3 of 4
their PST filing), the Company used a best-fit/least-cost assessment methodology. For the 5
investments in DER (i.e., those described in Chapters 4 through 7 of their PST filing) the 6
Company applied a Rhode Island specific cost-effectiveness methodology. 7
Q. Please describe the best-fit/least-cost methodology used by the Company for DER-8
enabling65 investments. 9
A. The Company refers to a recent US Department of Energy “Decision Guide” (DOE 10
Report) as the source of that methodology. That report presents many different 11
considerations for the best way to implement advanced distribution system technologies, 12
including DERs.66 With regard to cost-effectiveness considerations, the DOE Report 13
describes advanced distribution system technologies as belonging to four categories: 14
(a) traditional utility infrastructure investments; (b) DER-enabling investments; (c) DER-15
integration investments; and (d) self-support or direct-charge investments (i.e., those paid 16
for by customers or third-parties). The DOE Report recommends that traditional and 17
DER-enabling investments be subject to a best-fit/least-cost analysis or a traditional 18
65 We prefer not using the categories and terms “DER-enabling” and DER-integration,” because the categories are not well-
defined and the distinctions are difficult to make. We use these terms in this testimony in order to be consistent with the Company’s terminology.
66 The US Department of Energy, Modern Distribution Guide, Volume III, June 2017, Section 3.4.1.
214

Direct Testimony of Tim Woolf and Melissa Whited Page 85
utility benefit-cost analysis, and that DER-integration investments be subject to a societal 1
benefit-cost analysis.67 2
In this Docket, the Company notes that it used the best-fit/least cost method “to 3
evaluate proposed grid-side investments to enable DER using a conceptual cost estimate 4
and an expectation that it will utilize a competitive procurement process as part of the 5
deployment.”68 6
Q. Do you agree with the Company’s use of the best-fit/least-cost methodology for 7
DER-enabling investments? 8
A. No. First, the Division is concerned about the way that the Company evaluated and 9
proposed the DER-enabling investments in the absence of a more comprehensive, long-10
term grid modernization plan. This concern is addressed in more detail by Mr. Booth. 11
Second, the best-fit/least-cost approach used by the Company does not include 12
any quantitative assessment of the potential benefits of the proposed investments. 13
National Grid does not provide any benefit-cost analysis for these investments; it only 14
provides a narrative description of what the investments will do and why they are needed. 15
We note that the DOE Report is clear that it may be appropriate to apply benefit-16
cost analyses to DER-enabling projects. It states that utilities could use best-fit/least-cost 17
methodologies or traditional utility cost-benefit analyses.69 National Grid has chosen not 18
to use a traditional utility BCA. Further, there is nothing in the DOE Report to suggest 19
that the Company cannot or should not use a different type of BCA, such as the RI 20
67 The US Department of Energy, Modern Distribution Guide, Volume III, June 2017, Section 3.4.1. 68 PST Panel Direct Testimony, p. 25, lines 14-17. 69 DOE Report, p. 39 and p. 40.
215

Direct Testimony of Tim Woolf and Melissa Whited Page 86
Benefit-Cost Framework, if so directed by the Commission. National Grid has chosen not 1
to. 2
Q. Do you think that National Grid should use some form of BCA to justify its 3
proposed DER- enabling investments in this docket? 4
A. Yes. The DER-enabling projects that the Company proposes in this docket include a total 5
of $17.3 million over the three-year period from FY2018 – FY2020.70 This is 6
significantly larger than any other PST initiative in this docket (with the exception of the 7
AMF proposal that the Company is not asking for approval of in this docket) and thus 8
warrants more justification than the narrative that National Grid has provided. 9
Q. Does the fact that the Company is asking for a form of pre-approval of its PST 10
investments affect the importance of using a BCA to justify its proposed grid-11
enabling investments? 12
A. Yes. The Company is essentially asking the Commission for pre-approval of its PST 13
investments.71 As a general matter, any request for pre-approval of a project should be 14
supported with a comprehensive justification for the project, including a demonstration 15
that the project is cost-effective and will result in net benefits to customers. In the 16
absence of such a justification, the Commission should not pre-approve a project. The 17
Company has not provided such a justification for the DER-enabling projects in this 18
docket. 19
70 Response to (4770) Division 19-8-3 71 PST Panel Direct Testimony, p. 96, lines 1-4. Schedule PST- 1, Chapter 10, page 1.
216

Direct Testimony of Tim Woolf and Melissa Whited Page 87
It is important to note that this does not mean that the Company should not 1
undertake those DER-enabling projects. It means only that the Commission should not 2
pre-approve them without sufficient justification. If the Company believes that the DER-3
enabling projects will result in net benefits to customers, then it should undertake those 4
investments and seek recovery of them in the next rate case. 5
Q. Are there other reasons why the Company should apply a BCA to the DER-enabling 6
investments? 7
A. Yes. The Company’s proposal to categorize DER-enabling projects differently from 8
traditional distribution system projects and from DER-integrating investments creates 9
several problems. It is often difficult to draw a clear distinction between conventional and 10
DER-related projects, as described in more detail in Mr. Booth’s direct testimony. It is 11
also difficult to draw a clear distinction between DER-enabling and DER-integrating 12
technologies. Creating different standards of analysis and review for different categories 13
that are hard to define can lead to some projects being improperly categorized and thus 14
improperly treated. 15
In addition, the Company’s proposal means that traditional projects, DER-16
enabling projects, DER-integration projects are subject to different standards of review. 17
Traditional projects would be subject to the standard of review applied in the existing rate 18
case and ISR processes, while DER-enabling projects are subject to a best-fit/least cost 19
standard, and DER-integration projects are subject to a standard based on the RI Benefit-20
Cost Framework. This could result in some projects being inappropriately accepted or 21
rejected simply because they are subject to inconsistent standards. This would clearly be 22
217
Direct Testimony of Tim Woolf and Melissa Whited Page 88
inconsistent with the Commission’s directives in Docket 4600 and state energy policy 1
goals in general. 2
As described in the direct testimony of Mr. Woolf, National Grid should be 3
seeking ways to better integrate the planning of all types of resources, including EE, SRP, 4
ISR, DER-enabling, and DER-integrating resources. The Company’s proposal to treat 5
DER-enabling and DER-integrating resources different goes directly against this key 6
goal. 7
Q. Please describe the cost-effectiveness methodology used by the Company for DER-8
integrating investments. 9
A. The Company’s cost-effectiveness methodology was designed to reflect the RI Benefit-10
Cost Framework approved by the Commission in its Guidance Document. Some of the 11
costs and benefits are not yet sufficiently developed to be used in a quantitative fashion, 12
so the Company simply addressed them qualitatively. The Company also vetted some of 13
the inputs and value drivers with comparable exercises that it has undertaking for its 14
Massachusetts and New York affiliates. The Company used assumptions and 15
methodologies that are used to evaluate the EE programs, including all applicable 16
avoided costs from the 2015 New England Avoided Energy Supply Costs report.72 17
72 PST Panel Direct Testimony, pp.25-26.
218

Direct Testimony of Tim Woolf and Melissa Whited Page 89
8.3. Critique of National Grid’s Benefit-Cost Analysis 1
Q. Do you agree with the overall approach National Grid used for its BCAs? 2
A. For those projects where it applied a BCA, the Company used the RI Benefit-Cost 3
Framework approved by the Commission in the 4600 Guidance Document. This is 4
clearly the appropriate framework to use in this context. In addition, the Company 5
appropriately included a discussion of the qualitative benefits for each project, as 6
required in the 4600 Guidance Document. 7
However, we have concerns with three of the inputs that the Company used in its 8
BCAs. First, National Grid does not include any benefits associated with avoided 9
distribution costs in its BCAs. Second, it appears as though the Company used outdated 10
avoided FCM capacity costs in its BCA. Third, the Company used a discount rate based 11
on its weighted average cost of capital, rather than a societal discount rate that would be 12
more appropriate with the RI Benefit-Cost Framework. 13
Q. Please elaborate on your concern that National Grid does not include any benefits 14
associated with avoided distribution costs. 15
A. In all of its BCAs, National Grid assumes that there will be no avoided distribution 16
system costs. This is presumably because the Company did not have estimates of avoided 17
distribution costs that it deemed sufficiently robust. In addition, avoided distribution costs 18
can vary significantly by geographic location, creating another challenge in identifying 19
reasonable assumptions for a BCA. 20
We are sympathetic to the limitations of current estimates of avoided distribution 21
costs. However, assuming that DERs will provide no value in the form of avoided 22
219

Direct Testimony of Tim Woolf and Melissa Whited Page 90
distribution costs is overly conservative. Distribution system benefits can be significant, 1
particularly for some types of DERs, such as demand response or storage, which could be 2
specifically designed to defer or avoid distribution projects. This assumption by National 3
Grid will result in understating the benefits of the projects analyzed in the BCAs. 4
Q. Please elaborate on your concern that National Grid may have used outdated 5
avoided FCM costs. 6
A. It is not clear what source National Grid used to determine avoided FCM capacity costs. 7
In some instances, the Company refers to the 2015 AESC Report as the source of avoided 8
cost assumptions for its BCAs.73 In other instances, the Company refers to the AESC 9
2015 Update,74 which was performed to reflect significant changes that had occurred in 10
the New England wholesale electricity markets after the original report was conducted.75 11
The distinction is very important because the avoided costs in the AESC 2015 Update are 12
significantly lower than in the 2015 AESC Report. 13
Our review of the Company’s assumptions suggests that the values used were 14
those from the 2015 AESC Report. The Company’s avoided FCM assumptions76 are 15
considerably higher than those included in the AESC 2015 Update.77 If it is true that 16
National Grid used the original 2015 AESC values, then its BCAs will overstate the 17
benefits of the projects analyzed in the BCAs. 18
73 Schedule PST – 1, Chapter 2, p. 5, footnote 5. 74 Docket 4770 Response to Division 25-6, Attachment DIV 25-6, p. 1. 75 Tabors, Caramanis, Rudkevich, AESC 2015 Update Results and Assumptions, memo to the AESC Update Client Group,
December 2016. 76 Response to (4770) Division 25-6, Attachment DIV 25-6, p. 1. 77 As reported in the AESC 2015 Update, Appendix B, p 1 of 2.
220

Direct Testimony of Tim Woolf and Melissa Whited Page 91
Q. Why do you believe that a societal discount rate should be used when applying the 1
RI Benefit-Cost Framework? 2
A. A societal discount rate is most consistent with the RI Cost-Benefit Framework. The 3
Framework includes several impacts that are societal in nature, such as environmental, 4
job and economic development, low-income, and public health impacts. The RI 5
framework essentially represents a societal perspective, which warrants using a discount 6
rate that also reflects a societal perspective. 7
In addition, the Commission’s Guidance Document in 4600 emphasizes the 8
importance of long-term objectives and policy goals. The Guidance Document begins 9
with a list of stated electric industry goals that were approved by the Commission. The 10
first goal is to provide “reliable, safe, clean, and affordable energy to Rhode Island 11
customers over the long term” (emphasis added).78 The next two goals refer to addressing 12
climate change and other environmental challenges, and promoting jobs and economic 13
development; which also suggest a preference for long-term objectives and policy goals. 14
As noted below, a societal discount rate places greater emphasis on long-term impacts, 15
relative to a discount rate based on a utility WACC. 16
Further, using a utility WACC for a discount rate is not consistent with the goals 17
of the Company’s benefit-cost analysis in general.79 A utility WACC represents the time 18
preference of utility investors, primarily based on the cost of capital and the risks to those 19
investors. A utility WACC would be appropriate for the purposes of maximizing value to 20
78 Rhode Island Public Utilities Commission, Docket 4600 Guidance Document, page 3. 79 For additional discussion of this point, see: National Efficiency Screening Project, the National Standard Practice Manual,
Chapter 9, May 2017.
221

Direct Testimony of Tim Woolf and Melissa Whited Page 92
utility investors, but this is not the purpose of the BCA. The purpose of the BCA is to 1
identify the optimal mix of resources that will lead to “reliable, safe, clean, and 2
affordable energy to Rhode Island customers over the long-term.”80 A societal discount 3
rate is much more consistent with this purpose. 4
Finally, a societal discount rate is consistent with the discount rate that has been 5
used for EE cost-effectiveness analysis for many years. In that context, National Grid 6
uses a low-risk discount rate based on US Government Treasury Bills. This rate tends to 7
be much lower than the utility WACC, and is sometimes used to represent a societal 8
discount rate. 9
Q. How does a societal discount rate compare with a utility’s WACC? 10
A. A societal discount rate is typically much lower than a utility’s WACC. There is a range 11
of views on what a societal discount rate should be, and the specific value of a societal 12
discount rate should depend upon the impacts and the analysis it is applied to. Some 13
analysts argue that a societal discount rate for valuing environmental impacts should be 14
negative (in real terms). Others use societal discount rates on the order of one, two, or 15
three percent (in real terms).81 This entire range of societal discount rates is lower than 16
the Company’s WACC which is 7.5 percent in nominal terms, and 4.8 percent in real 17
terms. 18
80 Rhode Island Public Utilities Commission, Docket 4600 Guidance Document, page 3. 81 National Standard Practice Manual, page 75.
222

Direct Testimony of Tim Woolf and Melissa Whited Page 93
Q. In general, how does using a societal discount rate affect the results of the cost-1
effectiveness analyses? 2
A. A lower discount rate will give greater weight to long-term costs and benefits than to 3
short-term impacts as compared to a higher discount rate. In most cases, the PST 4
initiatives require capital costs to be incurred in the early years while the benefits are 5
experienced over a longer period of time. Consequently, a lower discount rate will 6
typically indicate increased benefits, increased net benefits, and a higher benefit-cost 7
ratio as compared to a higher discount rate like the WACC. 8
Q. Please provide an example of how the lower societal discount rate will affect the 9
BCA results. 10
A. As one example, we used different discount rates for the Company’s BCA for advanced 11
metering infrastructure, in the case where the AMF costs are shared with New York, and 12
in the Opt-Out Low Participation Scenario. Using the discount rate equal to the 13
Company’s WACC (4.8 percent in real terms) results in a benefit-cost ratio is 1.19; using 14
a societal discount rate of two percent (in real terms), results in a benefit-cost ratio of 15
1.34; and using the current energy efficiency BCA discount rate of roughly 0.3 percent 16
(in real terms) results in a benefit-cost ratio of 1.44. 17
8.4. Recommendations 18
Q. What do you recommend regarding the Company’s use of the best-fit/least cost 19
methodology to assess DER-enabling projects? 20
A. We recommend that the Commission reject the Company’s proposal to evaluate any PST 21
related projects, or any projects for which it is seeking pre-approval, with the best-22
223
Direct Testimony of Tim Woolf and Melissa Whited Page 94
fit/least cost methodology. This methodology is inconsistent with the Docket 4600 1
Guidance Document; is inconsistent with the overall goal of integrating the planning, 2
review, and approval of all types of distribution system investment; and does not provide 3
sufficient justification for the Commission to pre-approve projects. 4
Q. Which discount rate do you recommend be used for benefit-cost analyses in this 5
docket? 6
A. We recommend that the Commission determine that a societal discount rate is the most 7
appropriate rate to use when applying the Rhode Island Benefit-Cost Framework, and 8
that the Commission direct the Company and other analysts to use a societal discount rate 9
for all future applications of that framework. For the purposes of this rate case docket, we 10
recommend that the Commission recognize that the Company’s BCA results likely 11
understate project benefits because the Company’s discount rate is too high. 12
Q. What do you recommend regarding the benefits that the Company did not include 13
in its benefit-cost analyses? 14
A. We recommend that the Commission recognize that the Company’s BCA results likely 15
understate project benefits because they do not include the benefits of avoiding 16
distribution system costs. Further, the extent of any understatement will likely vary by 17
PST initiative, such that one may not be able to directly compare the BCAs across 18
initiatives. 19
224

Direct Testimony of Tim Woolf and Melissa Whited Page 95
Q. What do you recommend regarding the outdated avoided costs that the Company 1
appears to be using? 2
A. We recommend that the Commission recognize that the Company’s BCA results likely 3
overstate project benefits, particularly avoided FCM capacity costs, because they appear 4
to use outdated avoided cost assumptions that are higher than more recent assumptions. 5
Q. You have identified several significant problems with the Company’s BCAs, two of 6
which understate benefits, and one of which overstates benefits. Are you concerned 7
that these problems will lead to the Commission approving uneconomic outcomes in 8
this docket? 9
A. According to National Grid’s proposal, all the PST initiatives that National Grid is 10
proposing in this docket will be subject to further review by the Commission prior to 11
them being undertaken by the Company. These PST initiatives will be included in the 12
annual PST Plans that will be filed with the Commission. The first Plan will be filed by 13
December 1, 2018, to investigate the potential PST initiatives for FY 2020.82 At that time, 14
the Company should file updated BCAs for each PST initiative that it seeks approval for, 15
with improved methodologies and inputs using the Commission directives from this 16
docket. 17
The Division has a different proposal for the review and approval of PST 18
initiatives, as described in the direct testimony of Mr. Woolf. The Division recommends 19
that, in the absence of a multi-year rate plan over the next three years, the Company 20
82 PST Panel Direct Testimony, p. 5, lines 4-7.
225

Direct Testimony of Tim Woolf and Melissa Whited Page 96
should plan for and undertake PST initiatives that it expects to be cost-effective and to 1
provide net benefits to customers without specific pre-approval from the Commission. 2
Consequently, under either the Division’s or the Company’s PST review proposal, 3
the BCA results presented in this docket will not be the final BCA results used to make 4
decisions on future PST initiatives. 5
Q. Does this conclude your direct testimony? 6
A. Yes, it does. 7
226

227

228

Tim Woolf page 1 of 20
Tim Woolf, Vice President
Synapse Energy Economics I 485 Massachusetts Avenue, Suite 2 I Cambridge, MA 02139 I 617‐453‐7031
twoolf@synapse‐energy.com
PROFESSIONAL EXPERIENCE
Synapse Energy Economics Inc., Cambridge, MA. Vice President, 2011 ‒ present.
Provides expert consulting on the economic, regulatory, consumer, environmental, and public policy
implications of the electricity and gas industries. The primary focus of work includes technical and
economic analyses, electric power system planning, climate change strategies, energy efficiency
programs and policies, renewable resources and related policies, power plant performance and
economics, air quality, and many related aspects of consumer and environmental protection.
Massachusetts Department of Public Utilities, Boston, MA. Commissioner, 2007 ‒ 2011.
Oversaw a significant expansion of clean energy policies as a consequence of the Massachusetts Green
Communities Act, including an aggressive expansion of ratepayer‐funded energy efficiency programs;
the implementation of decoupled rates for electric and gas companies; an update of the DPU energy
efficiency guidelines; the promulgation of net metering regulations; review of smart grid pilot programs;
and review of long‐term contracts for renewable power. Oversaw six rate case proceedings for
Massachusetts electric and gas companies. Played an influential role in the development of price
responsive demand proposals for the New England wholesale energy market. Served as President of the
New England Conference of Public Utility Commissioners from 2009‐2010. Served as board member on
the Energy Facilities Siting Board from 2007‐2010. Served as co‐chair of the Steering Committee for the
Northeast Energy Efficiency Partnership’s Regional Evaluation, Measurement and Verification Forum.
Synapse Energy Economics Inc., Cambridge, MA. Vice President, 1997 ‒ 2007.
Tellus Institute, Boston, MA. Senior Scientist, Manager of Electricity Program, 1992 ‒ 1997.
Association for the Conservation of Energy, London, England. Research Director, 1991 ‒ 1992.
Massachusetts Department of Public Utilities, Boston, MA. Staff Economist, 1989 ‒ 1990.
Massachusetts Office of Energy Resources, Boston, MA. Policy Analyst, 1987 ‒ 1989.
Energy Systems Research Group, Boston, MA. Research Associate, 1983 ‒ 1987.
Union of Concerned Scientists, Cambridge, MA. Energy Analyst, 1982‐1983.
EDUCATION
Boston University, Boston, MA
Master of Business Administration, 1993
229
Tim Woolf page 2 of 20
London School of Economics, London, England
Diploma, Economics, 1991
Tufts University, Medford, MA
Bachelor of Science in Mechanical Engineering,
1982
Tufts University, Medford, MA
Bachelor of Arts in English, 1982
REPORTS
White, D., K. Takahashi, A. Napoleon, T. Woolf. 2018. Value of Energy Efficiency in New York: Assessment
of the Range of Benefits of Energy Efficiency Programs. Prepared by Synapse Energy Economics for
Natural Resources Defense Council.
Fisher, J., M. Whited, T. Woolf, D. Goldberg. 2018. Utility Investments for Market Transformation: How
Utilities Can Help Achieve Energy Policy Goals. Prepared by Synapse Energy Economics for Energy
Foundation.
Woolf, T., A. Hopkins, M. Whited, K. Takahashi, A. Napoleon. 2018. Review of New Brunswick Power’s
2018/2019 Rate Case Application. In the Matter of the New Brunswick Power Corporation and Section
103(1) of the Electricity Act Matter No. 375. Prepared by Synapse Energy Economics for the New
Brunswick Energy and Utilities Board Staff.
Woolf, T., C. Neme, M. Kushler, S. R. Schiller, T. Eckman. 2017. National Standard Practice Manual for
Assessing Cost‐Effectiveness of Energy Efficiency Resources. Edition 1, Spring 2017. Prepared by the
National Efficiency Screening Project.
Whited, M., A. Horowitz, T. Vitolo, W. Ong, T. Woolf. 2017. Distributed Solar in the District of Columbia:
Policy Options, Potential, Value of Solar, and Cost‐Shifting. Synapse Energy Economics for the Office of
the People’s Counsel for the District of Columbia.
Raab Associates and Synapse Energy Economics. 2017. Grid Modernization in New Hampshire: Report to
the New Hampshire Public Utilities Commission. Prepared by the New Hampshire Grid Modernization
Working Group. March 20, 2017.
Woolf, T. 2016. Expert Report: Rate Mechanism, Reconciliation of Provisional Rates, Energy Efficiency
Rider. Prepared for Puerto Rico Energy Commission regarding Matter No. CEPR‐AP‐2015‐0001,
November 21, 2016.
Woolf, T., M. Whited, P. Knight, T. Vitolo, K. Takahashi. 2016. Show Me the Numbers: A Framework for
Balanced Distributed Solar Policies. Synapse Energy Economics for Consumers Union.
Fisher, J., A. Horowitz, J. Migden‐Ostrander, T. Woolf. 2016. Puerto Rico Electric Power Authority’s 2015
Integrated Resource Plan. Prepared for Puerto Rico Energy Commission.
Woolf, T., A. Napoleon, P. Luckow, W. Ong, K. Takahashi. 2016. Aiming Higher: Realizing the Full
Potential of Cost‐Effective Energy Efficiency in New York. Synapse Energy Economics for Natural
230

Tim Woolf page 2 of 20
Resources Defense Council, E4TheFuture, CLEAResult, Lime Energy, Association for Energy Affordability,
and Alliance for Clean Energy New York.
Lowry, M. N., T. Woolf, M. Whited, M. Makos. 2016. Performance‐Based Regulation in a High Distributed
Energy Resources Future. Pacific Economics Group Research and Synapse Energy Economics for
Lawrence Berkley National Laboratory.
Woolf, T., M. Whited, A. Napoleon. 2015‐2016. Comments and Reply Comments in the New York Public
Service Commission Case 14‐M‐0101: Reforming the Energy Vision. Comments related to Staff’s (a) a
benefit‐costs analysis framework white paper, (b) ratemaking and utility business models white paper,
and (c) Distributed System Implementation Plan guide. Prepared by Synapse Energy Economics on
behalf of Natural Resources Defense Council and Pace Energy and Climate Center. August 21, 2015,
September 10, 2015, October 26, 2015, November 23, 2015, December 7, 2015, and January 6, 2016.
Kallay, J., K. Takahashi, A. Napoleon, T. Woolf. 2015. Fair, Abundant, and Low‐Cost: A Handbook for
Using Energy Efficiency in Clean Power Plan Compliance. Synapse Energy Economics for the Energy
Foundation.
Woolf, T., K. Takahashi, E. Malone, A. Napoleon, J. Kallay. 2015. Ontario Gas Demand‐Side Management
2016‐2020 Plan Review. Synapse Energy Economics for the Ontario Energy Board.
Whited, M., T. Woolf, A. Napoleon. 2015. Utility Performance Incentive Mechanisms: A Handbook for
Regulators. Synapse Energy Economics for the Western Interstate Energy Board.
Woolf, T., E. Malone, F. Ackerman. 2014. Cost‐Effectiveness Screening Principles and Guidelines for
Alignment with Policy Goals, Non‐Energy Impacts, Discount Rates, and Environmental Compliance Costs.
Synapse Energy Economics for Northeast Energy Efficiency Partnerships (NEEP) Regional Evaluation,
Measurement and Verification Forum.
Woolf, T., E. Malone, C. Neme. 2014. Regulatory Policies to Support Energy Efficiency in Virginia. Synapse
Energy Economics and Energy Futures Group for the Virginia Energy Efficiency Council.
Woolf, T., M. Whited, E. Malone, T. Vitolo, R. Hornby. 2014. Benefit‐Cost Analysis for Distributed Energy
Resources: A Framework for Accounting for All Relevant Costs and Benefits. Synapse Energy Economics
for the Advanced Energy Economy Institute.
Woolf, T., E. Malone, J. Kallay. 2014. Rate and Bill Impacts of Vermont Energy Efficiency Programs.
Synapse Energy Economics for the Vermont Public Service Department.
Woolf, T., C. Neme, P. Stanton, R. LeBaron, K. Saul‐Rinaldi, S. Cowell. 2014. The Resource Value
Framework: Reforming Energy Efficiency Cost‐Effectiveness Screening. The National Efficiency Screening
Project for the National Home Performance Council.
Malone, E., T. Woolf, K. Takahashi, S. Fields. 2013. “Appendix D: Energy Efficiency Cost‐Effectiveness
Tests.” Readying Michigan to Make Good Energy Decisions: Energy Efficiency. Synapse Energy Economics
for the Council of Michigan Foundations.
231

Tim Woolf page 3 of 20
Stanton, E. A., S. Jackson, G. Keith, E. Malone, D. White, T. Woolf. 2013. A Clean Energy Standard for
Massachusetts. Synapse Energy Economics for the Massachusetts Clean Energy Center and the
Massachusetts Departments of Energy Resources, Environmental Protection, and Public Utilities.
Woolf, T., K. Saul‐Rinaldi, R. LeBaron, S. Cowell, P. Stanton. 2013. Recommendations for Reforming
Energy Efficiency Cost‐Effectiveness Screening in the United States. Energy Efficiency Screening Coalition
for the National Home Performance Council.
Woolf, T., E. Malone, J. Kallay, K. Takahashi. 2013. Energy Efficiency Cost‐Effectiveness Screening in the
Northeast and Mid‐Atlantic States. Synapse Energy Economics for Northeast Energy Efficiency
Partnerships, Inc. (NEEP).
Raab Associates and Synapse Energy Economics. 2013. Massachusetts Electric Grid Modernization
Stakeholder Working Group Process: Report to the Department of Public Utilities from the Steering
Committee. Prepared for the Massachusetts Department of Public Utilities. DPU 12‐76.
Jackson, S., P. Peterson, D. Hurley, T. Woolf. 2013. Forecasting Distributed Generation Resources in New
England: Distributed Generation Must Be Properly Accounted for in Regional System Planning. Synapse
Energy Economics for E4 Group.
Woolf, T., E. Malone, L. Schwartz, J. Shenot. 2013. A Framework for Evaluating the Cost‐Effectiveness of
Demand Response. Synapse Energy Economics and Regulatory Assistance Project for the National Forum
on the National Action Plan on Demand Response: Cost‐effectiveness Working Group.
Woolf, T., W. Steinhurst, E. Malone, K. Takahashi. 2012. Energy Efficiency Cost‐Effectiveness Screening:
How to Properly Account for ‘Other Program Impacts’ and Environmental Compliance Costs. Synapse
Energy Economics for Regulatory Assistance Project and Vermont Housing Conservation Board.
Woolf, T., M. Whited, T. Vitolo, K. Takahashi, D. White. 2012. Indian Point Replacement Analysis: A Clean
Energy Roadmap. A Proposal for Replacing the Nuclear Plant with Clean, Sustainable Energy Resource.
Synapse Energy Economics for Natural Resources Defense Council (NRDC) and Riverkeeper.
Keith, G., T. Woolf, K. Takahashi. 2012. A Clean Electricity Vision for Long Island: Supplying 100% of Long
Island's Electricity Needs with Renewable Power. Synapse Energy Economics for Renewable Energy Long
Island.
Woolf, T. 2012. Best Practices in Energy Efficiency Program Screening: How to Ensure that the Value of
Energy Efficiency is Properly Accounted For. Synapse Energy Economics for National Home Performance
Council.
Woolf, T., J. Kallay, E. Malone, T. Comings, M. Schultz, J. Conyers. 2012. Commercial & Industrial
Customer Perspectives on Massachusetts Energy Efficiency Programs. Synapse Energy Economics for the
Massachusetts Energy Efficiency Advisory Council.
Woolf, T., M. Wittenstein, R. Fagan. 2011. Indian Point Energy Center Nuclear Plant Retirement Analysis.
Synapse Energy Economics for Natural Resources Defense Council (NRDC) and Riverkeeper.
232
Tim Woolf page 4 of 20
Woolf, T., V. Sabodash, B. Biewald. 2011. Equipment Price Forecasting in Energy Conservation Standards
Analysis. Synapse Energy Economics for Appliance Standards Awareness Project and Natural Resources
Defense Council (NRDC).
Johnston, L., E. Hausman, A. Sommer, B. Biewald, T. Woolf, D. Schlissel, A. Rochelle, D. White. 2007.
Climate Change and Power: Carbon Dioxide Emission Costs and Electricity Resource Planning. Synapse
Energy Economics for Tallahassee Electric Utility.
Woolf, T. 2007. Cape Light Compact Energy Efficiency Plan 2007‐2012: Providing Comprehensive Energy
Efficiency Services to Communities on Cape Cod and Martha’s Vineyard. Synapse Energy Economics for
the Cape Light Compact.
Woolf, T. 2007. Review of the District of Columbia Reliable Energy Trust Fund and Natural Gas Trust Fund
Working Group and Regulatory Processes. Synapse Energy Economics for the District of Columbia Office
of People's Counsel.
Woolf, T. 2006. Cape Light Compact Annual Report on Energy Efficiency Activities in 2005. Synapse
Energy Economics for the Cape Light Compact, submitted to the Massachusetts Department of
Telecommunications and Energy and the Massachusetts Division of Energy Resources.
Steinhurst, W., T. Woolf, A. Sommer, K. Takahashi, P. Chernick, J. Wallach. 2006. Integrated Portfolio
Management in a Restructured Supply Market. Synapse Energy Economics and Resource Insight for the
Ohio Office of Consumer Counsel.
Peterson, P., D. Hurley, T. Woolf, B. Biewald. 2006. Incorporating Energy Efficiency into the ISO‐New
England Forward Capacity Market. Synapse Energy Economics for Conservation Services Group.
Woolf, T., D. White, C. Chen, A. Sommer. 2005. Potential Cost Impacts of a Renewable Portfolio Standard
in New Brunswick. Synapse Energy Economics for New Brunswick Department of Energy.
Woolf, T., K. Takahashi, G. Keith, A. Rochelle, P. Lyons. 2005. Feasibility Study of Alternative Energy and
Advanced Energy Efficiency Technologies for Low‐Income Housing in Massachusetts. Synapse Energy
Economics and Zapotec Energy for the Low‐Income Affordability Network, Action for Boston Community
Development, and Action Inc.
Woolf, T. 2005. The Cape Light Compact Energy Efficiency Plan: Phase III 2005‐2007: Providing
Comprehensive Energy Efficiency Services to Communities on Cape Cod and Martha’s Vineyard. Synapse
Energy Economics for the Cape Light Compact.
Woolf, T. 2004. Review of Avoided Costs Used in Minnesota Electric Utility Conservation Improvement
Programs. Synapse Energy Economics for the Minnesota Office of Legislative Auditor.
Woolf, T. 2004. NEEP Strategic Initiative Review: Qualitative Assessment and Initiative Ranking for the
Residential Sector. Synapse Energy Economics for Northeast Energy Efficiency Partnerships, Inc.
Woolf, T. 2004. A Balanced Energy Plan for the Interior West. Synapse Energy Economics, West Resource
Advocates, and Tellus Institute for the Hewlett Foundation Energy Series.
233

Tim Woolf page 5 of 20
Steinhurst, W., P. Chernick, T. Woolf, J. Plunkett, C. Chen. 2003. OCC Comments on Alternative
Transitional Standard Offer. Synapse Energy Economics for the Connecticut Office of Consumer Counsel.
Woolf, T. 2003. Potential Cost Impacts of a Vermont Renewable Portfolio Standard. Synapse Energy
Economics for Vermont Public Service Board, presented to the Vermont RPS Collaborative.
Biewald, B., T. Woolf, A. Rochelle, W. Steinhurst. 2003. Portfolio Management: How to Procure
Electricity Resources to Provide Reliable, Low‐Cost, and Efficient Electricity Services to All Retail
Customers. Synapse Energy Economics for Regulatory Assistance Project and Energy Foundation.
Woolf, T., G. Keith, D. White, M. Drunsic, M. Ramiro, J. Ramey, J. Levy, P. Kinney, S. Greco, K. Knowlton,
B. Ketcham, C. Komanoff, D. Gutman. 2003. Air Quality in Queens: Cleaning Up the Air in Queens County
and Neighboring Regions. Synapse Energy Economics, Konheim & Ketcham, and Komanoff Energy
Associates for Natural Resources Defense Council (NRDC), Keyspan Energy, and the Coalition Helping to
Organize a Kleaner Environment.
Chen, C., D. White, T. Woolf, L. Johnston. 2003. The Maryland Renewable Portfolio Standard: An
Assessment of Potential Cost Impacts. Synapse Energy Economics for the Maryland Public Interest
Research Group.
Woolf, T. 2003. The Cape Light Compact Energy Efficiency Plan: Phase II 2003 ‒ 2007: Providing
Comprehensive Energy Efficiency Services to Communities on Cape Cod and Martha’s Vineyard. Synapse
Energy Economics, Cort Richardson, Vermont Energy Investment Corporation, and Optimal Energy
Incorporated for the Cape Light Compact.
Woolf, T. 2002. Green Power and Energy Efficiency Opportunities for Municipalities in Massachusetts:
Promoting Community Involvement in Energy and Environmental Decisions. Synapse Energy Economics
for the Massachusetts Energy Consumers Alliance.
Woolf, T. 2002. The Energy Efficiency Potential in Williamson County, Tennessee: Opportunities for
Reducing the Need for Transmission Expansion. Synapse Energy Economics for the Harpeth River
Watershed Association and the Southern Alliance for Clean Energy.
Woolf, T. 2002. Electricity Restructuring Activities in the US: A Survey of Selected States. Synapse Energy
Economics for Arizona Corporation Commission Utilities Division Staff.
Woolf, T. 2002. Powering the South: A Clean and Affordable Energy Plan for the Southern United States.
Synapse Energy Economics with and for the Renewable Energy Policy Project and a coalition of Southern
environmental advocates.
Johnston, L., G. Keith, T. Woolf, B. Biewald, E. Gonin. 2002. Survey of Clean Power and Energy Efficiency
Programs. Synapse Energy Economics for the Ozone Transport Commission.
Woolf, T. 2001. Proposal for a Renewable Portfolio Standard for New Brunswick. Synapse Energy
Economics for the Conservation Council of New Brunswick, presented to the New Brunswick Market
Design Committee.
234

Tim Woolf page 6 of 20
Woolf, T., G. Keith, D. White, F. Ackerman. 2001. A Retrospective Review of FERC’s Environmental Impact
Statement on Open Transmission Access. Synapse Energy Economics and the Global Development and
Environmental Institute for the North American Commission for Environmental Cooperation, with the
Global Development and Environment Institute.
Woolf, T. 2001. Repowering the Midwest: The Clean Energy Development Plan for the Heartland.
Synapse Energy Economics for the Environmental Law and Policy Center and a coalition of Midwest
environmental advocates.
Woolf, T. 2000. The Cape Light Compact Energy Efficiency Plan: Providing Comprehensive Energy
Efficiency Services to Communities on Cape Cod and Martha’s Vineyard. Synapse Energy Economics for
the Cape Light Compact.
Woolf, T., B. Biewald. 1999. Market Distortions Associated With Inconsistent Air Quality Regulations.
Synapse Energy Economics for the Project for a Sustainable FERC Energy Policy.
Woolf, T., B. Biewald, D. Glover. 1998. Competition and Market Power in the Northern Maine Electricity
Market. Synapse Energy Economics and Failure Exponent Analysis for the Maine Public Utilities
Commission.
Woolf, T. 1998. New England Tracking System. Synapse Energy Economics for the New England
Governors’ Conference, with Environmental Futures and Tellus Institute.
Woolf, T., D. White, B. Biewald, W. Moomaw. 1998. The Role of Ozone Transport in Reaching Attainment
in the Northeast: Opportunities, Equity and Economics. Synapse Energy Economics and the Global
Development and Environment Institute for the Northeast States for Coordinated Air Use Management.
Biewald, B., D. White, T. Woolf, F. Ackerman, W. Moomaw. 1998. Grandfathering and Environmental
Comparability: An Economic Analysis of Air Emission Regulations and Electricity Market Distortions.
Synapse Energy Economics and the Global Development and Environment Institute for the National
Association of Regulatory Utility Commissioners.
Biewald, B., T. Woolf, P. Bradford, P. Chernick, S. Geller, J. Oppenheim. 1997. Performance‐Based
Regulation in a Restructured Electric Industry. Synapse Energy Economics, Resource Insight, and the
National Consumer Law Center for the National Association of Regulatory Utility Commissioners.
Biewald, B., T. Woolf, M. Breslow. 1997. Massachusetts Electric Utility Stranded Costs: Potential
Magnitude, Public Policy Options, and Impacts on the Massachusetts Economy. Synapse Energy
Economics for the Union of Concerned Scientists, MASSPIRG, and Public Citizen.
Woolf, T. 1997. The Delaware Public Service Commission Staff’s Report on Restructuring the Electricity
Industry in Delaware. Tellus Institute for The Delaware Public Service Commission Staff. Tellus Study No.
96‐99.
235
Tim Woolf page 7 of 20
Woolf, T. 1997. Preserving Public Interest Obligations Through Customer Aggregation: A Summary of
Options for Aggregating Customers in a Restructured Electricity Industry. Tellus Institute for The
Colorado Office of Energy Conservation. Tellus Study No. 96‐130.
Woolf, T. 1997. Zero Carbon Electricity: the Essential Role of Efficiency and Renewables in New England’s
Electricity Mix. Tellus Institute for The Boston Edison Settlement Board. Tellus Study No. 94‐273.
Woolf, T. 1997. Regulatory and Legislative Policies to Promote Renewable Resources in a Competitive
Electricity Industry. Tellus Institute for The Colorado Governor’s Office of Energy Conservation. Tellus
Study No. 96‐130‐A5.
Woolf, T. 1996. Can We Get There From Here? The Challenge of Restructuring the Electricity Industry So
That All Can Benefit. Tellus Institute for The California Utility Consumers' Action Network. Tellus Study
No. 95‐208.
Woolf, T. 1995. Promoting Environmental Quality in a Restructured Electric Industry. Tellus Institute for
The National Association of Regulatory Utility Commissioners. Tellus Study No. 95‐056.
Woolf, T. 1995. Systems Benefits Funding Options. Tellus Institute for Wisconsin Environmental Decade.
Tellus Study No. 95‐248.
Woolf, T. 1995. Non‐Price Benefits of BECO Demand‐Side Management Programs. Tellus Institute for
Boston Edison Settlement Board. Tellus Study No. 93‐174.
Woolf, T., B. Biewald. 1995. Electric Resource Planning for Sustainability. Tellus Institute for the Texas
Sustainable Energy Development Council. Tellus Study No. 94‐114.
TESTIMONY
Rhode Island Public Utilities Commission (Docket No. 4783): Direct testimony of Tim Woolf and Melissa
Whited regarding National Grid's Advanced Metering Functionality Pilot. On behalf of the Rhode Island
Division of Public Utilities and Carriers. February 22, 2018.
New York Public Service Commission (Case 17‐E‐0459): Direct testimony of Tim Woolf regarding Energy
Efficiency Earnings Adjustment Mechanisms proposed by Central Hudson Gas & Electric Company. On
behalf of Natural Resources Defense Council. November 21, 2017.
New York Public Service Commission (Case 17‐E‐0238): Direct and rebuttal testimony of Tim Woolf and
Melissa Whited regarding Earnings Adjustment Mechanisms proposed by National Grid. On behalf of
Advanced Energy Economy Institute. August 25 and September 15, 2017.
Utah Public Service Commission (Docket No. 14‐035‐114): Direct and rebuttal testimony of Tim Woolf
regarding the Pacificorp’s analysis of the benefits and costs associated with distributed generation
resources. On behalf of Utah Clean Energy. June 8, 2017 and July 25, 2017.
Massachusetts Department of Public Utilities (D.P.U. 17‐05): Direct and surrebuttal testimony of Tim
Woolf and Melissa Whited regarding performance‐based regulation, the monthly minimum reliability
236

Tim Woolf page 8 of 20
contribution, storage pilots, and rate design in Eversource’s petition for approval of rate increases and a
performance‐based ratemaking mechanism. On behalf of Sunrun and the Energy Freedom Coalition of
America, LLC. April 28, 2017 and May 26, 2017.
Massachusetts Department of Public Utilities (D.P.U. 15‐120, D.P.U. 15‐121, D.P.U. 15‐122/15‐123):
Direct testimony of Tim Woolf and Ariel Horowitz, PhD, regarding the petitions by National Grid, Unitil,
NSTAR, and Eversource Energy for approval of their grid modernization plans. On behalf of Conservation
Law Foundation. March 10, 2017.
Massachusetts Department of Public (D.P.U. 16‐169): Direct testimony of Tim Woolf and Erin Malone
regarding Nation Grid’s petition for ruling regarding the provision of gas energy efficiency services. On
behalf of the Cape Light Compact. November 2, 2016.
New Jersey Board of Public Utilities (Docket No. ER16060524): Direct testimony regarding Rockland
Electric Company’s proposed advanced metering program. On behalf of the New Jersey Division of Rate
Counsel. September 9, 2016.
Colorado Public Utilities Commission (Proceeding No. 16AL‐0048E): Answer testimony regarding Public
Service Company of Colorado’s rate design proposal. On behalf of Energy Outreach Colorado. June 6,
2016.
Georgia Public Service Commission (Docket No. 40161 and Docket No. 40162): Direct testimony
regarding the demand‐side management programs proposed by Georgia Power Company in its
Certification, Decertification, and Amended Demand‐Side Management Plan and its 2016 Integrated
Resource Plan. On behalf of Sierra Club. May 3, 2016.
Massachusetts Department of Public Utilities (Docket No. 15‐155): Joint direct and rebuttal testimony
with M. Whited regarding National Grid’s rate design proposal. On behalf of Energy Freedom Coalition
of America, LLC. March 18, 2016 and April 28, 2016.
Maine Public Utilities Commission (Docket No. 2015‐00175): Direct testimony on Efficiency Maine
Trust’s petition for approval of the Triennial Plan for Fiscal Years 2017‐2019. On behalf of the Natural
Resources Council of Maine and the Conservation Law Foundation. February 17, 2016.
Nevada Public Utilities Commission (Docket Nos. 15‐07041 and 15‐07042): Direct testimony on NV
Energy’s application for approval of a cost of service study and net metering tariffs. On behalf of The
Alliance for Solar Choice. October 27, 2015.
New Jersey Board of Public Utilities (Docket No. ER14030250): Direct testimony on Rockland Electric
Company’s petition for investments in advanced metering infrastructure. On behalf of the New Jersey
Division of Rate Counsel. September 4, 2015.
Utah Public Service Commission (Docket No. 14‐035‐114): Direct, rebuttal, and surrebuttal testimony
on the benefit‐cost framework for net energy metering. On behalf of Utah Clean Energy, the Alliance for
Solar Choice, and Sierra Club. July 30, 2015, September 9, 2015, and September 29, 2015.
237

Tim Woolf page 9 of 20
Nova Scotia Utility and Review Board (Matter No. M06733): Direct testimony on EfficiencyOne’s 2016‐
2018 demand‐side management plan. On behalf of the Nova Scotia Utility and Review Board. June 2,
2015.
Missouri Public Service Commission (Case No. ER‐2014‐0370): Direct and surrebuttal testimony on the
topic of Kansas City Power and Light’s rate design proposal. On behalf of Sierra Club. April 16, 2015 and
June 5, 2015.
Missouri Public Service Commission (File No. EO‐2015‐0055): Rebuttal and surrebuttal testimony on the
topic of Ameren Missouri’s 2016‐2018 Energy Efficiency Plan. On behalf of Sierra Club. March 20, 2015
and April 27, 2015.
Florida Public Service Commission (Dockets No. 130199‐EI et al.): Direct testimony on the topic of
setting goals for increasing the efficiency of energy consumption and increasing the development of
demand‐side renewable energy systems. On behalf of the Sierra Club. May 19, 2014.
Massachusetts Department of Public Utilities (Docket No. DPU 14‐86): Direct and rebuttal Testimony
regarding the cost of compliance with the Global Warming Solution Act. On behalf of the Massachusetts
Department of Energy Resources and the Department of Environmental Protection. May 16, 2014.
Kentucky Public Service Commission (Case No. 2014‐00003): Direct testimony regarding Louisville Gas
and Electric Company and Kentucky Utilities Company’s proposed 2015‐2018 demand‐side management
and energy efficiency program plan. On behalf of Wallace McMullen and the Sierra Club. April 14, 2014.
Maine Public Utilities Commission (Docket No. 2013‐168): Direct and surrebuttal testimony regarding
policy issues raised by Central Maine Power’s 2014 Alternative Rate Plan, including recovery of capital
costs, a Revenue Index Mechanism proposal, and decoupling. On behalf of the Maine Public Advocate
Office. December 12, 2013 and March 21, 2014.
Colorado Public Utilities Commission (Docket No. 13A‐0686EG): Answer and surrebuttal testimony
regarding Public Service Company of Colorado’s proposed energy savings goals. On behalf of the Sierra
Club. October 16, 2013 and January 21, 2014.
Kentucky Public Service Commission (Case No. 2012‐00578): Direct testimony regarding Kentucky
Power Company’s economic analysis of the Mitchell Generating Station purchase. On behalf of the
Sierra Club. April 1, 2013.
Nova Scotia Utility and Review Board (Matter No. M04819): Direct testimony regarding Efficiency Nova
Scotia Corporation’s Electricity Demand Side Management Plan for 2013 ‒ 2015. On behalf of the
Counsel to Nova Scotia Utility and Review Board. May 22, 2012.
Missouri Office of Public Counsel (Docket No. EO‐2011‐0271): Rebuttal testimony regarding IRP rule
compliance. On behalf of the Missouri Office of the Public Counsel. October 28, 2011.
238

Tim Woolf page 10 of 20
Nova Scotia Utility and Review Board (Matter No. M03669): Direct testimony regarding Efficiency Nova
Scotia Corporation’s Electricity Demand Side Management Plan for 2012. On behalf of the Counsel to
Nova Scotia Utility and Review Board. April 8, 2011.
Rhode Island Public Utilities Commission (Docket No. 3790): Direct testimony regarding National Grid’s
Gas Energy Efficiency Programs. On behalf of the Division of Public Utilities and Carriers. April 2, 2007.
North Carolina Utilities Commission (Docket E‐100, Sub 110): Filed comments with Anna Sommer
regarding the Potential for Energy Efficiency Resources to Meet the Demand for Electricity in North
Carolina. Synapse Energy Economics on behalf of the Southern Alliance for Clean Energy. February 2007.
Rhode Island Public Utilities Commission (Docket No. 3765): Direct and Surrebuttal testimony
regarding National Grid’s Renewable Energy Standard Procurement Plan. On behalf of the Division of
Public Utilities and Carriers. January 17, 2007 and February 20, 2007.
Minnesota Public Utilities Commission (Docket Nos. CN‐05‐619 and TR‐05‐1275): Direct testimony
regarding the potential for energy efficiency as an alternative to the proposed Big Stone II coal project.
On behalf of the Minnesota Center for Environmental Advocacy, Fresh Energy, Izaak Walton League of
America, Wind on the Wires and the Union of Concerned Scientists. November 29, 2006.
Rhode Island Public Utilities Commission (Docket No. 3779): Oral testimony regarding the settlement of
Narragansett Electric Company’s 2007 Demand‐Side Management Programs. On behalf of the Division
of Public Utilities and Carriers. November 24, 2006.
Nevada Public Utilities Commission (Docket Nos. 06‐04002 & 06‐04005): Direct testimony regarding
Nevada Power Company’s and Sierra Pacific Power Company’s Renewable Portfolio Standard Annual
Report. On behalf of the Nevada Bureau of Consumer Protection. October 26, 2006
Nevada Public Utilities Commission (Docket No. 06‐06051): Direct testimony regarding Nevada Power
Company’s Demand‐Side Management Plan in the 2006 Integrated Resource Plan. On behalf of the
Nevada Bureau of Consumer Protection. September 13, 2006.
Nevada Public Utilities Commission (Docket Nos. 06‐03038 & 06‐04018): Direct testimony regarding
the Nevada Power Company’s and Sierra Pacific Power Company’s Demand‐Side Management Plans. On
behalf of the Nevada Bureau of Consumer Protection. June 20, 2006.
Nevada Public Utilities Commission (Docket No. 05‐10021): Direct testimony regarding the Sierra
Pacific Power Company’s Gas Demand‐Side Management Plan. On behalf of the Nevada Bureau of
Consumer Protection. February 22, 2006.
South Dakota Public Utilities Commission (Docket No. EL04‐016): Direct testimony regarding the
avoided costs of the Java Wind Project. On behalf of the South Dakota Public Utilities Commission Staff.
February 18, 2005.
239

Tim Woolf page 11 of 20
Rhode Island Public Utilities Commission (Docket No. 3635): Oral testimony regarding the settlement of
Narragansett Electric Company’s 2005 Demand‐Side Management Programs. On behalf of the Division
of Public Utilities and Carriers. November 29, 2004.
British Columbia Utilities Commission. Direct testimony regarding the Power Smart programs contained
in BC Hydro’s Revenue Requirement Application 2004/05 and 2005/06. On behalf of the Sierra Club of
Canada, BC Chapter. April 20, 2004.
Maryland Public Utilities Commission (Case No. 8973): Oral testimony regarding proposals for the PJM
Generation Attributes Tracking System. On behalf of the Maryland Office of People's Counsel. December
3, 2003.
Rhode Island Public Utilities Commission (Docket No. 3463): Oral testimony regarding the settlement of
Narragansett Electric Company’s 2004 Demand‐Side Management Programs. On behalf of the Division
of Public Utilities and Carriers. November 21, 2003.
California Public Utilities Commission (Rulemaking 01‐10‐024): Direct testimony regarding the market
price benchmark for the California renewable portfolio standard. On behalf of the Union of Concerned
Scientists. April 1, 2003.
Québec Régie de l'énergie (Docket R‐3473‐01): Direct testimony with Philp Raphals regarding Hydro‐
Québec’s Energy Efficiency Plan: 2003‐2006. On behalf of Regroupment national des Conseils régionaux
de l’environnement du Québec. February 5, 2003.
Connecticut Department of Public Utility Control (Docket No. 01‐10‐10): Direct testimony regarding the
United Illuminating Company’s service quality performance standards in their performance‐based
ratemaking mechanism. On behalf of the Connecticut Office of Consumer Counsel. April 2, 2002.
Nevada Public Utilities Commission (Docket No. 01‐7016): Direct testimony regarding the Nevada
Power Company’s Demand‐Side Management Plan. On behalf of the Bureau of Consumer Protection,
Office of the Attorney General. September 26, 2001.
United States Department of Energy (Docket Number‐EE‐RM‐500): Comments with Bruce Biewald,
Daniel Allen, David White, and Lucy Johnston of Synapse Energy Economics regarding the Department of
Energy’s proposed rules for efficiency standards for central air conditioners and heat pumps. On behalf
of the Appliance Standards Awareness Project. December 2000.
US Department of Energy (Docket EE‐RM‐500): Oral testimony at a public hearing on marginal price
assumptions for assessing new appliance efficiency standards. On behalf of the Appliance Standards
Awareness Project. November 2000.
Connecticut Department of Public Utility Control (Docket No. 99‐09‐03 Phase II): Direct testimony
regarding Connecticut Natural Gas Company’s proposed performance‐based ratemaking mechanism. On
behalf of the Connecticut Office of Consumer Counsel. September 25, 2000.
240
Tim Woolf page 12 of 20
Mississippi Public Service Commission (Docket No. 96‐UA‐389): Oral testimony regarding generation
pricing and performance‐based ratemaking. On behalf of the Mississippi Attorney General. February 16,
2000.
Delaware Public Service Commission (Docket No. 99‐328): Direct testimony regarding maintaining
electric system reliability. On behalf of Delaware Public Service Commission Staff. February 2, 2000.
Delaware Public Service Commission (Docket No. 99‐328): Filed expert report (“Investigation into the
July 1999 Outages and General Service Reliability of Delmarva Power & Light Company,” jointly authored
with J. Duncan Glover and Alexander Kusko). Synapse Energy Economics and Exponent Failure Analysis
Associates on behalf the Delaware Public Service Commission Staff. February 1, 2000.
New Hampshire Public Service Commission (Docket No. 99‐099 Phase II): Oral testimony regarding
standard offer services. On behalf of the Campaign for Ratepayers Rights. January 14, 2000.
West Virginia Public Service Commission (Case No. 98‐0452‐E‐GI): Rebuttal testimony regarding codes
of conduct. On behalf of the West Virginia Consumer Advocate Division. July 15, 1999.
West Virginia Public Service Commission (Case No. 98‐0452‐E‐GI): Direct testimony regarding codes of
conduct and other measures to protect consumers in a restructured electricity industry. On behalf of the
West Virginia Consumer Advocate Division. June 15, 1999.
Public Service Commission of West Virginia (Case No. 98‐0452‐E‐GI ): Filed expert report (“Measures to
Ensure Fair Competition and Protect Consumers in a Restructured Electricity Industry in West Virginia,”
jointly authored with Jean Ann Ramey and Theo MacGregor) in the matter of the General Investigation
to determine whether West Virginia should adopt a plan for open access to the electric power supply
market and for the development of a deregulation plan. Synapse Energy Economics and MacGregor
Energy Consultancy on behalf of the West Virginia Consumer Advocate Division. June 1999.
Massachusetts Department of Telecommunications and Energy (DPU/DTE 97‐111): Direct testimony
regarding Commonwealth Electric Company’s energy efficiency plan, and the role of municipal
aggregators in delivering demand‐side management programs. On behalf of Cape and Islands Self‐
Reliance Corporation. January 1998.
Delaware Public Service Commission (DPSC 97‐58): Direct testimony regarding Delmarva Power and
Light’s request to merge with Atlantic City Electric. On behalf of Delaware Public Service Commission
Staff. May 1997.
Delaware Public Service Commission (DPSC 95‐172): Oral testimony regarding Delmarva’s integrated
resource plan and DSM programs. On behalf of the Delaware Public Service Commission Staff. May
1996.
Colorado Public Utilities Commission (5A‐531EG): Direct testimony regarding the impact of proposed
merger on DSM, renewable resources and low‐income DSM. On behalf of the Colorado Office of Energy
Conservation. April 1996.
241
Tim Woolf page 13 of 20
Colorado Public Utilities Commission (3I‐199EG): Direct testimony regarding the impacts of increased
competition on DSM, and recommendations for how to provide utilities with incentives to implement
DSM. On behalf of the Colorado Office of Energy Conservation. June 1995.
Colorado Public Utilities Commission (5R‐071E): Oral testimony on the Commission's integrated
resource planning rules. On behalf of the Colorado Office of Energy Conservation. July 1995.
Colorado Public Utilities Commission (3I‐098E): Direct testimony on the Public Service Company of
Colorado's DSM programs and integrated resource plans. On behalf of the Colorado Office of Energy
Conservation. April 1994.
Delaware Public Service Commission (Docket No. 96‐83): Filed comments regarding the Investigation of
Restructuring the Electricity Industry in Delaware (Tellus Institute Study No. 96‐99). On behalf of the
Staff of the Delaware Public Service Commission. November 1996.
Colorado Public Utilities Commission (Docket No. 96Q‐313E): Filed comments in response to the
Questionnaire on Electricity Industry Restructuring (Tellus Institute Study No. 96‐130‐A3). On behalf of
the Colorado Governor's Office of Energy Conservation. October 1996.
State of Vermont Public Service Board (Docket No. 5854): Filed expert report (Tellus Institute Study No.
95‐308) regarding the Investigation into the Restructuring of the Electric Utility Industry in Vermont. On
behalf of the Vermont Department of Public Service. March 1996.
Pennsylvania Public Utility Commission (Docket No. I‐00940032): Filed comments (Tellus Institute
Study No. 95‐260) regarding an Investigation into Electric Power Competition. On behalf of The
Pennsylvania Office of Consumer Advocate. November 1995.
New Jersey Board of Public Utilities (Docket No. EX94120585Y): Initial and reply comments (“Achieving
Efficiency and Equity in the Electricity Industry Through Unbundling and Customer Choice,” Tellus
Institute Study No. 95‐029‐A3) regarding an investigation into the future structure of the electric power
industry. On behalf of the New Jersey Division of Ratepayer Advocate. September 1995.
ARTICLES
Woolf, T., E. Malone, C. Neme, R. LeBaron. 2014. “Unleashing Energy Efficiency.” Public Utilities
Fortnightly, October, 30‐38.
Woolf, T., A. Sommer, J. Nielson, D. Berry, R. Lehr. 2005. “Managing Electricity Industry Risk with Clean
and Efficient Resources.” The Electricity Journal 18 (2): 78‒84.
Woolf, T., A. Sommer. 2004. “Local Policy Measures to Improve Air Quality: A Case Study of Queens
County, New York.” Local Environment 9 (1): 89‒95.
Woolf, T. 2001. “Clean Power Opportunities and Solutions: An Example from America’s Heartland.” The
Electricity Journal 14 (6): 85‒91.
242

Tim Woolf page 14 of 20
Woolf, T. 2001. “What’s New With Energy Efficiency Programs.” Energy & Utility Update, National
Consumer Law Center: Summer 2001.
Woolf T., B. Biewald. 2000. “Electricity Market Distortions Associated With Inconsistent Air Quality
Regulations.” The Electricity Journal 13 (3): 42‒49.
Ackerman, F., B. Biewald, D. White, T. Woolf, W. Moomaw. 1999. “Grandfathering and Coal Plant
Emissions: the Cost of Cleaning Up the Clean Air Act.” Energy Policy 27 (15): 929‒940.
Biewald, B., D. White, T. Woolf. 1999. “Follow the Money: A Method for Tracking Electricity for
Environmental Disclosure.” The Electricity Journal 12 (4): 55‒60.
Woolf, T., B. Biewald. 1998. “Efficiency, Renewables and Gas: Restructuring As if Climate Mattered.” The
Electricity Journal 11 (1): 64‒72.
Woolf, T., J. Michals. 1996. “Flexible Pricing and PBR: Making Rate Discounts Fair for Core Customers.”
Public Utilities Fortnightly, July 1996.
Woolf, T., J. Michals. 1995. “Performance‐Based Ratemaking: Opportunities and Risks in a Competitive
Electricity Industry.” The Electricity Journal 8 (8): 64‒72.
Woolf, T. 1994. “Retail Competition in the Electricity Industry: Lessons from the United Kingdom.” The
Electricity Journal 7 (5): 56‒63.
Woolf, T. 1994. “A Dialogue About the Industry's Future.” The Electricity Journal 7 (5).
Woolf, T., E. D. Lutz. 1993. “Energy Efficiency in Britain: Creating Profitable Alternatives.” Utilities Policy
3 (3): 233‒242.
Woolf, T. 1993. “It is Time to Account for the Environmental Costs of Energy Resources.” Energy and
Environment 4 (1): 1‒29.
Woolf, T. 1992. “Developing Integrated Resource Planning Policies in the European Community.” Review
of European Community & International Environmental Law 1 (2) 118‒125.
PRESENTATIONS
Woolf, T., M. Whited. 2016. “Show Me the Numbers: A Framework for Balanced Distributed Solar
Policies.” Presentation for Consumers Union Webinar, December 2016.
Woolf, T. 2016. “Show Me the Numbers: Balancing Solar DG with Consumer Protection.” Public
workshop on solar distributed generation for the Federal Trade Commission, June 2016.
Woolf, T. 2016. “Rate Designs for Distributed Generation: State Activities & A New Framework.”
Presentation at the NASUCA 2016 Mid‐Year Meeting, June 2016.
Woolf, T., M. Whited. 2016. “3rd Annual 21st Century Electricity System Workshop – Implications of
Different Rate Designs.” Presentation at the Advanced Energy Economy Institute, April 2016.
243

Tim Woolf page 15 of 20
Woolf, T., M. Whited. 2016. “Decoupling in Pennsylvania: Advantages, Disadvantages, and Design
Issues.” Presentation to Pennsylvania Decoupling Stakeholders, February 2016.
Woolf, T. 2016. “Earnings Impact Mechanisms: Energy Efficiency.” Presentation at the New York REV
Technical Conference, January 2016.
Lowry, M. N., T. Woolf. 2015. “Performance‐Based Regulation in a High Distributed Energy Resources
Future.” Webinar on January 2016.
Woolf, T. 2015. “Performance Incentive Mechanisms: A Catalyst for Change.” Webinar for Power Sector
Transformation Group, December 2015.
Woof, T. 2015. “Energy Efficiency Valuation: Boogie Men, Time Warps, and other Terrifying Pitfalls.”
Presentation at ACEEE Conference on Energy Efficiency as a Resource, September 2015.
Woolf, T., M. Whited, A. Napoleon. 2015. “Thoughts on How to Design Clean Energy Performance
Incentive Mechanisms.” Webinar for the Western Clean Energy Advocates, April 2015.
Woolf, T. 2015. “Properly Valuing the Benefits and Costs of Energy Efficiency.” Presentation at the 2015
National Efficiency Advocates Meeting, April 2015.
Woolf, T. 2015. “Non‐Energy Benefits & Efficiency Program Screening.” Presentation for Georgia DSM
Work Group, March 2015.
Woolf, T. 2014. “Performance Incentive Mechanisms And Their Role in New Regulatory Models.”
Presentation at Acadia Center Conference, Envisioning Our Energy Future, December 2014.
Woolf, T., M. Whited., A. Napoleon. 2014. “Guiding Utility Performance: A Handbook for Regulators.”
Webinar for the Western Interstate Energy Board, December 2014.
Woolf, T. 2014. “Planning for Distributed Energy Resources.” Presentation for Advanced Energy
Economy Webinar, November 2014.
Woolf, T. 2014. “Benefit‐Cost Analysis for Distributed Energy Resources in New York: A Framework for
Accounting for All Relevant Costs and Benefits.” Presentation to NARUC ERE Committee, November
2014.
Woolf, T. 2014. “Presenting the Full Value of Energy Efficiency: Creating a Better Message.” Presentation
at Sierra Club Beyond Coal Conference, October 2014.
Woolf, T., C. Neme. 2014. “Regulatory Policies to Support Energy Efficiency in Virginia.” Presentation for
the 2014 Virginia Energy Efficiency Workshop, October 2014.
Woolf, T. 2014. “Benefit‐Cost Analysis for Distributed Energy Resources in New York: A Framework for
Accounting for All Relevant Costs and Benefits.” Presentation for Advanced Energy Economy Institute,
October 2014.
244
Tim Woolf page 16 of 20
Woolf, T. 2014. “Performance Incentive Mechanisms: Digging Deeper Into Performance‐Based
Regulation.” Presentation for National Governor’s Association Conference: Utility Business Models That
Align with State Clean Energy Goals, September 2014.
Woolf, T. 2014. “The Resource Value Framework: Reforming Energy Efficiency Cost‐Effectiveness
Screening.” Presentation at the ACEEE Summer Study, August 2014.
Woolf, T. 2014. “Cost‐Effectiveness of Demand Response.” Presentation at MADRI Working Group
Meeting #34, July 2014.
Woolf, T. 2014. “Time to Overhaul Our Energy Efficiency Screening Practices.” Presentation for U.S.
Environmental Protection Agency Energy Efficiency Cost‐Effectiveness Webinar, January 2014.
Woolf, T. 2013. “Survey of Energy Efficiency Screening Practices in the Northeast and Mid‐Atlantic.”
Presentation for Northeast Energy Efficiency Partnerships EM&V Forum Annual Public Meeting,
December 2013.
Woolf, T. 2013. “Recommendations for Reforming Energy Efficiency Cost‐Effectiveness Screening in the
United States.” Presentation at the National Association of Regulatory Commissioners Annual Meeting,
November 2013.
Woolf, T. 2013. “Energy Efficiency Program Screening: Let’s Get Beyond the TRC Test.” Presentation for
7th Annual ENERGY STAR Certified Homes Utility Sponsor Meeting, October 2013.
Woolf, T. 2013. “Decoupling in Maine: Why Decoupling is in Consumers’ Interest.” Presentation for
Office of Public Advocate‐ Decoupling Debate, October 2013.
Woolf, T. 2013. “NHPC Efficiency Screening Initiative: Unleashing the Potential for Energy Efficiency.”
Presentation for Advocates Meeting, September 2013.
Woolf, T. 2013. “Energy Efficiency: Rate, Bill and Participation Impacts.” Presentation for ACEEE’s Energy
Efficiency as a Resource Conference, September 2013.
Woof, T. 2013. “Energy Efficiency Screening: Challenges and Opportunities.” Presentation for NARUC
Summer Meeting Consumer Affairs Panel, July 2013.
Woolf, T., R. Sedano. 2013. “Decoupling Overview.” Presentation for Finding Common Ground Meeting,
July 2013.
Woolf, T. 2013. “Utility Incentives for Energy Efficiency.” Presentation for Finding Common Ground
Meeting, July 2013.
Woolf, T. 2013. “Energy Efficiency: Rate, Bill and Participation Impacts.” Presentation for State Energy
Efficiency Action Webinar, June 2013.
Woolf, T., B. Biewald, and J. Migden‐Ostrander. 2013. “NARUC Risk Workshop for Regulators.”
Presentation at the Mid‐Atlantic Conference of Regulatory Utility Commissioners, June 2013.
245
Tim Woolf page 17 of 20
Woolf, T. 2013. “Energy Efficiency Screening: Accounting for ‘Other Program Impacts’ & Environmental
Compliance Costs.” Presentation for the Consortium for Energy Efficiency Summer Meeting, May 2013.
Woolf, T. 2013. “Best Practices in Energy Efficiency Program Screening.” Presentation at ACI National
Home Performance Conference, May 2013.
Woolf, T. 2013. “Utility Shareholder Incentives to Support Energy Efficiency Programs.” Presentation to
Common Ground, May 2013.
Woolf, T. 2013. “Energy Efficiency Screening: Accounting for ‘Other Program Impacts’ & Environmental
Compliance Costs.” Presentation for Regulatory Assistance Project Webinar, March 2013.
Woolf, T. 2013. “Energy Efficiency: Rates, Bills, Participants, Screening, and More.” Presentation at
Connecticut Energy Efficiency Workshop, March 2013.
Woolf T. 2013. “Best Practices in Energy Efficiency Program Screening.” Presentation for SEE Action
Webinar, March 2013.
Woolf, T. 2013. “Energy Efficiency: Rates, Bills and Participants.” Presentation for Rhode Island Energy
Efficiency Collaborative, February 2013.
Woolf, T. 2013. “Energy Efficiency Screening: Application of the TRC Test.” Presentation for Energy
Advocates Webinar, January 2013.
Woolf, T. 2012. “Best Practices in Energy Efficiency Program Screening.” Presentation for American
Council for an Energy‐Efficient Economy Webinar, December 2012.
Woolf, T. 2012. Indian Point Replacement Analysis: A Clean Energy Roadmap. Presentation for Natural
Resource Defenses Council and Environmental Entrepreneurs, November 2012.
Woolf, T. 2012. “In Pursuit of All Cost‐Effective Energy Efficiency.” Presentation at Sierra Club Boot
Camp, October 2012.
Woolf, T. 2012. “Best Practices in Energy Efficiency Program Screening.” Webinar for Northeast Energy
Efficiency Partnerships, September 2012.
Woolf, T., L. Schwartz. “What Remains to be Done with Demand Response? A National Forum from the
FERC National Action Plan on Demand Response Tries to Give an Answer.” Presentation at NARUC
National Town Meeting on Demand Response, July 2012.
Woolf, T. 2012. “Best Practices in Energy Efficiency Program Screening.” Presentation at NARUC Summer
Meetings ‒ Energy Efficiency Cost‐Effectiveness Breakfast, July 2012.
Woolf, T. 2012. “Avoided Cost of Complying with Environmental Regulations in MA.” Presentation for
Mass Energy Consumer’s Alliance, January 2012.
Woolf, T. 2011. “Energy Efficiency Cost‐Effectiveness Tests.” Presentation at the Northeast Energy
Efficiency Partnerships Annual Meeting, October 2011.
246
Tim Woolf page 18 of 20
Woolf, T. 2011. “Why Consumer Advocates Should Support Decoupling.” Presentation at the 2011
ACEEE National Conference on Energy Efficiency as a Resource, September 2011.
Woolf, T. 2011. “A Regulator’s Perspective on Energy Efficiency.” Presentation at the Efficiency Maine
Symposium In Pursuit of Maine’s Least‐Cost Energy, September 2011.
Woolf, T. 2010. “Bill Impacts of Energy Efficiency Programs: The Importance of Analyzing and Managing
Rate and Bill Impacts.” Presentation at the Energy in the Northeast Conference, Law Seminar
International, September 2010.
Woolf, T. 2010. “Bill Impacts of Energy Efficiency Programs: The Implications of Bill Impacts in
Developing Policies to Motivate Utilities to Implement Energy Efficiency.” Presentation to the State
Energy Efficiency Action Network, Utility Motivation Work Group, November 2010.
Woolf, T. 2010. “Bill Impacts of Energy Efficiency Programs.” Presentation to the Energy Resources and
Environment Committee at the NARUC Winter Meetings, February 2010.
Woolf, T. 2009. “Price‐Responsive Demand in the New England Wholesale Energy Market: Description of
NECPUC’s Limited Supply‐Side Proposal.” Presentation at the NEPOOL Markets Committee Meeting,
November 2009.
Woolf, T. 2009. “Demand Response in the New England Wholesale Energy Market: How Much Should
We Pay for Demand Resources?” Presentation at the New England Electricity Restructuring Roundtable,
October 2009.
Woolf, T. 2008. “Promoting Demand Resources in Massachusetts: A Regulator’s Perspective.”
Presentation at the Energy Bar Association, Northeast Chapter Meeting, June 2008.
Woolf, T. 2008. “Turbo‐Charging Energy Efficiency in Massachusetts: A DPU Perspective.” Presentation
at the New England Electricity Restructuring Roundtable, April 2008.
Woolf T. 2002. “A Renewable Portfolio Standard for New Brunswick.” Presentation to the New
Brunswick Market Design Committee, January 10, 2002.
Woolf, T. 2001. “Potential for Wind and Renewable Resource Development in the Midwest.”
Presentation at WINDPOWER 2001 in Washington DC, June 7, 2001.
Woolf T. 1999. “Challenges Faced by Clean Generation Resources Under Electricity Restructuring.”
Presentation at the Symposium on the Changing Electric System in Florida and What it Means for the
Environment in Tallahassee, FL, November 1999.
Woolf, T. 2000. “Generation Information Systems to Support Renewable Portfolio Standards, Generation
Performance Standards and Environmental Disclosure.” Presentation at the Massachusetts
Restructuring Roundtable on behalf of the Union of Concerned Scientists, March 2000.
247
Tim Woolf page 19 of 20
Woolf, T. 1998. “New England Tracking System Project: An Electricity Tracking System to Support a Wide
Range of Restructuring‐Related Policies.” Presentation at the Ninth Annual Energy Services Conference
and Exposition in Orlando, FL, December 1998.
Woolf, T. 2000. “Comments of the Citizens Action Coalition of Indiana.” Presentation at Workshop on
Alternatives to Traditional Generation Resources, June 2000.
Woolf, T. 1996. “Overview of IRP and Introduction to Electricity Industry Restructuring.” Training session
provided to the staff of the Delaware Public Service Commission, April 1996.
Woolf, T. 1995. “Competition and Regulation in the UK Electric Industry.” Presentation at the Illinois
Commerce Commission's workshop on Restructuring the Electric Industry, August 1995.
Woolf, T. 1995. “Competition and Regulation in the UK Electric Industry.” Presentation at the British
Columbia Utilities Commission Electricity Market Review, February 1995.
Resume dated March 2018
248

Melissa Whited page 1 of 7
Melissa Whited, Principal Associate
Synapse Energy Economics I 485 Massachusetts Avenue, Suite 2 I Cambridge, MA 02139 I 617‐453‐7024
mwhited@synapse‐energy.com
PROFESSIONAL EXPERIENCE
Synapse Energy Economics, Cambridge MA. Principal Associate, 2017 – present, Senior Associate, 2015 – 2017, Associate, 2012 ‒ 2015
Conduct research, author reports, and assist in preparation of expert testimony. Consult on issues
related to distributed energy resources, rate design, cost‐benefit analysis, integrated resource planning,
utility regulation, water use and conservation, and market power.
University of Wisconsin ‐ Madison, Department of Agricultural and Applied Economics, Madison, WI. Teaching Assistant – Environmental Economics, 2011 ‒ 2012
Developed teaching materials and led discussions on cost‐benefit analysis, carbon taxes and cap‐and‐
trade programs, management of renewable and non‐renewable resources, and other topics.
Public Service Commission of Wisconsin, Water Division, Madison, WI. Program and Policy Analyst ‐ Intern, Summer 2009
Researched water conservation programs nationwide to develop a proposal for Wisconsin’s state
conservation program. Developed spreadsheet model to calculate avoided costs of water conservation
in terms of energy savings and avoided emissions.
Synapse Energy Economics, Cambridge, MA. Communications Manager, 2005 ‒ 2008
Developed technical proposals for state and federal agencies, environmental and public interest groups,
and businesses. Edited reports on energy efficiency, integrated resource planning, greenhouse gas
regulations, renewable resources, and other topics.
EDUCATION
University of Wisconsin, Madison, WI
Master of Arts in Agricultural and Applied Economics, 2012.
Certificate in Energy Analysis and Policy.
National Science Foundation Fellow.
University of Wisconsin, Madison, WI
Master of Science in Environment and Resources, 2010.
Certificate in Humans and the Global Environment (CHANGE).
Nelson Distinguished Fellowship.
Southwestern University, Georgetown, TX
Bachelor of Arts in International Studies, Magna cum laude, 2003.
249

Melissa Whited page 2 of 7
ADDITIONAL SKILLS
Econometric Modeling – Linear and nonlinear modeling including time‐series, panel
data, logit, probit, and discrete choice regression analysis
Nonmarket Valuation Methods for Environmental Goods – Hedonic valuation, travel
cost method, and contingent valuation
Cost‐Benefit Analysis
Input‐Output Modeling for Regional Economic Analysis
FELLOWSHIPS AND AWARDS
Winner, M. Jarvin Emerson Student Paper Competition, Journal of Regional Analysis and Policy, 2010
Fellowship, National Science Foundation Integrative Graduate Education and Research Traineeship (IGERT), University of Wisconsin – Madison, 2009
Nelson Distinguished Fellowship, University of Wisconsin – Madison, 2008
PUBLICATIONS
Fisher, J., M. Whited, T. Woolf, D. Goldberg. 2018. Utility Investments for Market Transformation: How
Utilities Can Help Achieve Energy Policy Goals. Prepared by Synapse Energy Economics for Energy
Foundation.
Whited, M., T. Woolf. 2018. Electricity Prices in the Tennessee Valley: Are customers being treated fairly?
Prepared by Synapse Energy Economics for the Southern Alliance for Clean Energy.
Woolf, T., A. Hopkins, M. Whited, K. Takahashi, A. Napoleon. 2018. Review of New Brunswick Power’s
2018/2019 Rate Case Application. In the Matter of the New Brunswick Power Corporation and Section
103(1) of the Electricity Act Matter No. 375. Prepared by Synapse Energy Economics for the New
Brunswick Energy and Utilities Board Staff.
Whited, M., T. Vitolo. 2017. Reply comments in District of Columbia Public Service Commission Formal
Case No. 1130: Reply Comments of the Office of the People’s Counsel for the District of Columbia
Regarding Pepco’s Comments on the Office of the People’s Counsel’s Value of Solar Study. Prepared by
Synapse Energy Economics. July 24, 2017.
Whited, M., A. Horowitz, T. Vitolo, W. Ong, T. Woolf. 2017. Distributed Solar in the District of Columbia:
Policy Options, Potential, Value of Solar, and Cost‐Shifting. Synapse Energy Economics for the Office of
the People’s Counsel for the District of Columbia.
Whited, M., E. Malone, T. Vitolo. 2016. Rate Impacts on Customers of Maryland’s Electric Cooperatives:
Impacts on SMECO and Choptank Customers. Synapse Energy Economics for Maryland Public Service
Commission.
250
Melissa Whited page 3 of 7
Woolf, T., M. Whited, P. Knight, T. Vitolo, K. Takahashi. 2016. Show Me the Numbers: A Framework for
Balanced Distributed Solar Policies. Synapse Energy Economics for Consumers Union.
Whited, M., T. Woolf, J. Daniel. 2016. Caught in a Fix: The Problem with Fixed Charges for Electricity.
Synapse Energy Economics for Consumers Union.
Lowry, M. N., T. Woolf, M. Whited, M. Makos. 2016. Performance‐Based Regulation in a High Distributed
Energy Resources Future. Pacific Economics Group Research and Synapse Energy Economics for
Lawrence Berkley National Laboratory.
Woolf, T., M. Whited, A. Napoleon. 2015‐2016. Comments and Reply Comments in the New York Public
Service Commission Case 14‐M‐0101: Reforming the Energy Vision. Comments related to Staff’s (a) a
benefit‐costs analysis framework white paper, (b) ratemaking and utility business models white paper,
and (c) Distributed System Implementation Plan guide. Prepared by Synapse Energy Economics on
behalf of Natural Resources Defense Council and Pace Energy and Climate Center.
Luckow, P., B. Fagan, S. Fields, M. Whited. 2015. Technical and Institutional Barriers to the Expansion of
Wind and Solar Energy. Synapse Energy Economics for Citizens’ Climate Lobby.
Wilson, R., M. Whited, S. Jackson, B. Biewald, E. A. Stanton. 2015. Best Practices in Planning for Clean
Power Plan Compliance. Synapse Energy Economics for the National Association of State Utility
Consumer Advocates.
Whited, M., T. Woolf, A. Napoleon. 2015. Utility Performance Incentive Mechanisms: A Handbook for
Regulators. Synapse Energy Economics for the Western Interstate Energy Board.
Stanton, E. A., S. Jackson, B. Biewald, M. Whited. 2014. Final Report: Implications of EPA’s Proposed
“Clean Power Plan.” Synapse Energy Economics for the National Association of State Utility Consumer
Advocates.
Peterson, P., S. Fields, M. Whited. 2014. Balancing Market Opportunities in the West: How participation
in an expanded balancing market could save customers hundreds of millions of dollars. Synapse Energy
Economics for the Western Grid Group.
Woolf, T., M. Whited, E. Malone, T. Vitolo, R. Hornby. 2014. Benefit‐Cost Analysis for Distributed Energy
Resources: A Framework for Accounting for All Relevant Costs and Benefits. Synapse Energy Economics
for the Advanced Energy Economy Institute.
Peterson, P., M. Whited, S. Fields. 2014. Synapse Comments on FAST Proposals in ERCOT. Synapse
Energy Economics for Sierra Club.
Hornby, R., N. Brockway, M. Whited, S. Fields. 2014. Time‐Varying Rates in the District of Columbia.
Synapse Energy Economics for the Office of the People’s Counsel for the District of Columbia, submitted
to Public Service Commission of the District of Columbia in Formal Case No. 1114.
251

Melissa Whited page 4 of 7
Peterson, P., M. Whited, S. Fields. 2014. Demonstrating Resource Adequacy in ERCOT: Revisiting the
ERCOT Capacity, Demand and Reserves Forecasts. Synapse Energy Economics for Sierra Club ‒ Lone Star
Chapter.
Stanton, E. A., M. Whited, F. Ackerman. 2014. Estimating the Cost of Saved Energy in Utility Efficiency
Programs. Synapse Energy Economics for the U.S Environmental Protection Agency.
Ackerman, F., M. Whited, P. Knight. 2014. “Would banning atrazine benefit farmers?” International
Journal of Occupational and Environmental Health 20 (1): 61‒70.
Ackerman, F., M. Whited, P. Knight. 2013. Atrazine: Consider the Alternatives. Synapse Energy
Economics for Natural Resources Defense Council (NRDC).
Whited, M., F. Ackerman, S. Jackson. 2013. Water Constraints on Energy Production: Altering our Current
Collision Course. Synapse Energy Economics for Civil Society Institute.
Whited, M. 2013. Water Constraints on Energy Production: Altering our Current Collision Course ‒ Policy
Brief. Synapse Energy Economics for Civil Society Institute.
Hurley, D., P. Peterson, M. Whited. 2013. Demand Response as a Power System Resource: Program
Designs, Performance, and Lessons Learned in the United States. Synapse Energy Economics for
Regulatory Assistance Project.
Whited, M., D. White, S. Jackson, P. Knight, E.A. Stanton. 2013. Declining Markets for Montana Coal.
Synapse Energy Economics for Northern Plains Resource Council.
Woolf, T., M. Whited, T. Vitolo, K. Takahashi, D. White. 2012. Indian Point Energy Center Replacement
Analysis: A Plan for Replacing the Nuclear Plant with Clean, Sustainable, Energy Resources. Synapse
Energy Economics for National Resources Defense Council and Riverkeeper.
Whited, M., K. Charipar, G. Brown. Demand Response Potential in Wisconsin. Nelson Institute for
Environmental Studies, Energy Analysis & Policy Capstone for the Wisconsin Public Service Commission.
Whited, M. 2010. “Economic Impacts of Irrigation Water Transfers in Uvalde County, Texas.” Journal of
Regional Analysis and Policy 40 (2): 160‒170.
Grabow, M., M. Hahn and M. Whited. 2010. Valuing Bicycling’s Economic and Health Impacts in
Wisconsin. Nelson Institute for Environmental Studies, Center for Sustainability and the Global
Environment (SAGE) for State Representative Spencer Black.
Whited, M., D. Bernhardt, R. Deitchman, C. Fuchsteiner, M. Kirby, M. Krueger, S. Locke, M. Mcmillen, H.
Moussavi, T. Robinson, E. Schmitz, Z. Schuster, R. Smail, E. Stone, S. Van Egeren, H. Yoshida, Z. Zopp.
2009. Implementing the Great Lakes Compact: Wisconsin Conservation and Efficiency Measures Report.
Department of Urban and Regional Planning, University of Wisconsin‐Madison, Extension Report 2009‐
01.
Whited, M. 2009. 2009 Wisconsin Water Fact Sheet. Public Service Commission of Wisconsin.
252

Melissa Whited page 5 of 7
Whited, M. 2003. Gender, Water, and Trade. International Gender and Trade Network Washington, DC.
TESTIMONY
Rhode Island Public Utilities Commission (Docket No. 4783): Direct testimony of Tim Woolf and Melissa
Whited regarding National Grid's Advanced Metering Functionality Pilot. On behalf of the Rhode Island
Division of Public Utilities and Carriers. February 22, 2018.
Virginia State Corporation Commission (Case No. PUR‐2017‐00044): Direct testimony of Melissa
Whited regarding Rappahannock Electric Cooperative's proposed increases to fixed charges for
residential customers and small business customers. On behalf of Sierra Club. September 19, 2017.
California Public Utilities Commission (Application 17‐01‐020, 17‐01‐021, and 17‐01‐022): Joint opening
testimony with Max Baumhefner and Katherine Stainken on fast charging infrastructure and rates; joint
opening testimony with Max Baumhefner and Joel Espino on medium and heavy‐duty and fleet charging
infrastructure and commercial EV rates; joint opening testimony with Max Baumhefner and Chris King
on residential charging infrastructure and rates. Rebuttal testimony on public fast charging rate design,
commercial EV rate design, and residential EV rate design. On behalf of Natural Resources Defense
Council, the Greenlining Institute, Plug In America, the Coalition of California Utility Employees, Sierra
Club, and the Environmental Defense Fund. July 25, August 1, August 7, and September 5, 2017.
New York Public Service Commission (Case 17‐E‐0238): Direct and rebuttal testimony of Tim Woolf and
Melissa Whited regarding Earnings Adjustment Mechanisms proposed by National Grid. On behalf of
Advanced Energy Economy Institute. August 25 and September 15, 2017.
Utah Public Service Commission (Docket No. 14‐035‐114): Direct testimony of Melissa Whited
regarding Pacificorp’s proposed rates for customers with distributed generation. On behalf of Utah
Clean Energy. June 8, 2017.
Texas Public Utilities Commission (SOAH Docket No. 473‐17‐1764, PUC Docket No. 46449): Cross‐
rebuttal testimony evaluating Southwestern Electric Power Company’s proposed revisions to its
Distributed Renewable Generation tariff. On behalf of Sierra Club and Dr. Lawrence Brough. May 19,
2017.
Massachusetts Department of Public Utilities (Docket No. 17‐05): Direct and surrebuttal testimony of
Tim Woolf and Melissa Whited regarding performance‐based regulation, the monthly minimum
reliability contribution, storage pilots, and rate design in Eversource’s petition for approval of rate
increases and a performance‐based ratemaking mechanism. On behalf of Sunrun and the Energy
Freedom Coalition of America, LLC. April 28, 2017 and May 26, 2017.
Public Utilities Commission of Hawaii (Docket No. 2015‐0170): Direct testimony regarding Hawaiian
Electric Light Company’s proposed performance incentive mechanisms. On behalf of the Division of
Consumer Advocacy. April 28, 2017.
253

Melissa Whited page 6 of 7
Massachusetts Department of Public Utilities (Docket No. 15‐155): Joint direct and rebuttal testimony
with T. Woolf regarding National Grid’s rate design proposal. On behalf of Energy Freedom Coalition of
America, LLC. March 18, 2016 and April 28, 2016.
Federal Energy Regulatory Commission (Docket No. EC13‐93‐000): Affidavit regarding potential market
power resulting from the acquisition of Ameren generation by Dynegy. On behalf of Sierra Club. August
16, 2013.
Wisconsin Senate Committee on Clean Energy: Joint testimony with M. Grabow regarding the
importance of clean transportation to Wisconsin’s public health and economy. February 2010.
TESTIMONY ASSISTANCE
Colorado Public Utilities Commission (Proceeding No. 16AL‐0048E): Answer testimony of Tim Woolf
regarding Public Service Company of Colorado’s rate design proposal. On behalf of Energy Outreach
Colorado. June 6, 2016.
Nevada Public Utilities Commission (Docket Nos. 15‐07041 and 15‐07042): Direct testimony on NV
Energy’s application for approval of a cost of service study and net metering tariffs. On behalf of The
Alliance for Solar Choice. October 27, 2015.
Missouri Public Service Commission (Case No. ER‐2014‐0370): Direct and surrebuttal testimony on the
topic of Kansas City Power and Light’s rate design proposal. On behalf of Sierra Club. April 16, 2015 and
June 5, 2015.
Wisconsin Public Service Commission (Docket No. 05‐UR‐107): Direct and surrebuttal testimony of Rick
Hornby regarding Wisconsin Electric Power Company rate case. On behalf of The Alliance for Solar
Choice. August 28, 2014 and September 22, 2014.
Maine Public Utilities Commission (Docket No. 2013‐00519): Direct testimony of Richard Hornby and
Martin R. Cohen on GridSolar's smart grid coordinator petition. On behalf of the Maine Office of the
Public Advocate. August 28, 2014.
Maine Public Utilities Commission (Docket No. 2013‐00168): Direct and surrebuttal testimony of Tim
Woolf regarding Central Maine Power’s request for an alternative rate plan. December 12, 2013 and
March 21, 2014.
Massachusetts Department of Public Utilities (Docket No. 14‐04): Comments of Massachusetts
Department of Energy Resources on investigation into time varying rates. On behalf of the
Massachusetts Department of Energy Resources. March 10, 2014.
State of Nevada, Public Utilities Commission of Nevada (Docket No. 13‐07021): Direct testimony of
Frank Ackerman regarding the proposed merger of NV Energy, Inc. and MidAmerican Energy Holdings
Company. On behalf of the Sierra Club. October 24, 2013.
254

Melissa Whited page 7 of 7
PRESENTATIONS
Whited, M. 2016. “Energy Policy for the Future: Trends and Overview.” Presentation to the National
Conference of State Legislators’ Capitol Forum, Washington, DC, December 8.
Whited, M. 2016. “Ratemaking for the Future: Trends and Considerations.” Presentation to the Midwest
Governors’ Association, St. Paul, MN, July 14.
Whited, M. 2016. “Performance Based Regulation.” Presentation to the NARUC Rate Design
Subcommittee. September 12.
Whited, M. 2016. “Demand Charges: Impacts and Alternatives (A Skeptic’s View).” EUCI 2nd Annual
Residential Demand Charges Summit, Phoenix, AZ, June 7.
Whited, M. 2016. “Performance Incentive Mechanisms.” Presentation to the National Governors
Association, Wisconsin Workshop, Madison WI, March 29.
Whited, M., T. Woolf. 2016. “Caught in a Fix: The Problem with Fixed Charges for Electricity.” Webinar
presentation sponsored by Consumers Union, February.
Whited, M. 2015. “Performance Incentive Mechanisms.” Presentation to the National Governors
Association, Learning Lab on New Utility Business Models & the Electricity Market Structures of the
Future, Boston, MA, July 28.
Whited, M. 2015. “Rate Design: Options for Addressing NEM Impacts.” Presentation to the Utah Net
Energy Metering Workgroup, Workshop 4, Salt Lake City, UT, July 8.
Whited, M. 2015. “Performance Incentive Mechanisms.” Presentation to the e21 Initiative, St. Paul, MN,
May 29.
Whited, M., F. Ackerman. 2013. “Water Constraints on Energy Production: Altering our Current Collision
Course.” Webinar presentation sponsored by Civil Society Institute, September 12.
Whited, M., G. Brown, K. Charipar. 2011. “Electricity Demand Response Programs and Potential in
Wisconsin.” Presentation to the Wisconsin Public Service Commission, April.
Whited, M. 2010. “Economic Impact of Irrigation Water Transfers in Uvalde County, Texas.”
Presentation at the Mid‐Continent Regional Science Association’s 41st Annual Conference/IMPLAN
National User’s 8th Biennial Conference in St. Louis, MO, June
Whited, M., M. Grabow, M. Hahn.2009. “Valuing Bicycling’s Economic and Health Impacts in Wisconsin.”
Presentation before the Governor’s Coordinating Council on Bicycling, December.
Whited, M., D. Sheard. 2009. “Water Conservation Initiatives in Wisconsin.” Presentation before the
Waukesha County Water Conservation Coalition Municipal Water Conservation Subgroup, July.
Resume dated March 2018
255
Direct Testimony of Tim Woolf and Melissa Whited – Exhibit TW/MW‐3 Page 1
Direct Testimony of Tim Woolf and Melissa Whited RIDPUC Docket No. 4770
Exhibit TW/MW‐3
Assumptions for the Benefit‐Cost Analysis Used to Determine PIM Incentive Levels
Contents
1. Introduction .................................................................................................................. 1
2. Avoided Costs ................................................................................................................ 1
3. Discount Rate ................................................................................................................ 3
4. Peak Coincidence Factors ............................................................................................. 3
5. Assumed Costs to Customers of Implementing PIM .................................................... 4
6. PIM Incentives ............................................................................................................... 5
1. Introduction Ideally, performance incentives should be proportionate to the importance of the performance goal to customers, and they should not exceed the net benefits to customers (including both quantified and unquantified benefits). We applied this principle by estimating the benefits and the costs associated with achieving each PIM, and then assigning a portion of net benefits to the utility in the form of an incentive payment.
Below we describe the assumptions and data sources that we relied upon to calculate the benefits and costs associated with meeting each PIM. Additional details on the assumptions and calculations are provided in Exhibit TW/MW‐4, which is the Excel workbook used to make the calculations.
2. Avoided Costs
Avoided Generation Capacity Costs
Daymark estimated avoided generation capacity costs for 2019–2038 using Daymark’s proprietary capacity model and the cost of new entry (CONE) for Forward Capacity Auction (FCA) clearing prices. These cost estimates rely on the 2017 CELT Load Forecast for 2016 through 2026, with projections for load between 2027–2038 and assuming a 14.3 percent planning reserve margin.
Because FCAs 10, 11, and 12 have already been completed, the avoided costs for 2019–2021 are assumed to be zero. While there could be a small benefit through reconfiguration auctions, these benefits are assumed to be negligible.
256
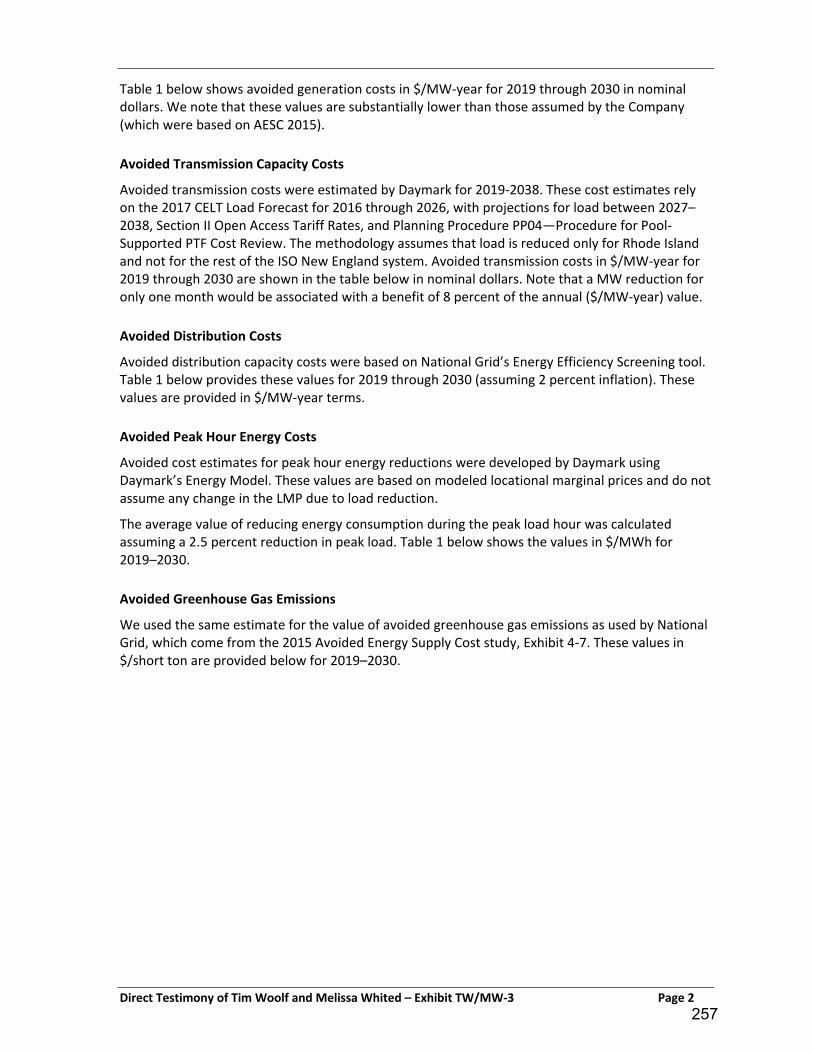
Direct Testimony of Tim Woolf and Melissa Whited – Exhibit TW/MW‐3 Page 2
Table 1 below shows avoided generation costs in $/MW‐year for 2019 through 2030 in nominal dollars. We note that these values are substantially lower than those assumed by the Company (which were based on AESC 2015).
Avoided Transmission Capacity Costs
Avoided transmission costs were estimated by Daymark for 2019‐2038. These cost estimates rely on the 2017 CELT Load Forecast for 2016 through 2026, with projections for load between 2027–2038, Section II Open Access Tariff Rates, and Planning Procedure PP04—Procedure for Pool‐Supported PTF Cost Review. The methodology assumes that load is reduced only for Rhode Island and not for the rest of the ISO New England system. Avoided transmission costs in $/MW‐year for 2019 through 2030 are shown in the table below in nominal dollars. Note that a MW reduction for only one month would be associated with a benefit of 8 percent of the annual ($/MW‐year) value.
Avoided Distribution Costs
Avoided distribution capacity costs were based on National Grid’s Energy Efficiency Screening tool. Table 1 below provides these values for 2019 through 2030 (assuming 2 percent inflation). These values are provided in $/MW‐year terms.
Avoided Peak Hour Energy Costs
Avoided cost estimates for peak hour energy reductions were developed by Daymark using Daymark’s Energy Model. These values are based on modeled locational marginal prices and do not assume any change in the LMP due to load reduction.
The average value of reducing energy consumption during the peak load hour was calculated assuming a 2.5 percent reduction in peak load. Table 1 below shows the values in $/MWh for 2019–2030.
Avoided Greenhouse Gas Emissions
We used the same estimate for the value of avoided greenhouse gas emissions as used by National Grid, which come from the 2015 Avoided Energy Supply Cost study, Exhibit 4‐7. These values in $/short ton are provided below for 2019–2030.
257

Direct Testimony of Tim Woolf and Melissa Whited – Exhibit TW/MW‐3 Page 3
Table 1. Avoided Costs for Years 2019–2030
Year
Avoided Capacity Costs ($/MW‐yr)
Avoided Transmission
Costs ($/MW‐yr)
Avoided Distribution Costs
($/MW‐yr)
Avoided Peak Hour Energy
Costs ($/MWh)
Non‐Embedded CO2 Cost
($/short ton)
2019 0 $124,913 $80,000 $80 $94
2020 0 $133,170 $84,897 $82 $95
2021 0 $141,612 $86,595 $74 $95
2022 $55,042 $150,390 $88,326 $76 $94
2023 $55,936 $159,312 $90,093 $77 $93
2024 $62,393 $168,380 $91,895 $83 $92
2025 $64,297 $177,593 $93,733 $87 $91
2026 $69,950 $186,950 $95,607 $94 $90
2027 $75,749 $196,453 $97,520 $96 $89
2028 $84,529 $206,100 $99,470 $101 $88
2029 $102,516 $215,893 $101,459 $110 $87
2030 $97,070 $225,830 $103,489 $116 $85
3. Discount Rate To estimate the net benefits of each PIM, we included societal benefits consistent with the Rhode Island Benefit‐Cost Framework. Therefore, we applied a societal discount rate of 3 percent (equivalent to approximately 5.5 percent nominal).
4. Peak Coincidence Factors Not all reductions in demand will have the same impact on the grid. For example, a reduction in the monthly peak demand for the month of April would provide a benefit in terms of avoided transmission costs for that month, but it would not provide a benefit in terms of forward capacity market (FCM) costs, unless it was assumed to be available in the annual peak hour as well. For each PIM, we made assumptions regarding the extent to which measures implemented for one PIM would help to avoid annual peak demand, monthly transmission peak demand, and local distribution peak demand (that is, at the feeder or substation level).
These assumptions are expressed in terms of assumed coincidence factors, which are then multiplied by the targets to develop assumed MW reductions for each type of demand reduction. These coincidence factors are shown in the table below for the System Efficiency and distributed energy resource PIMs.
258

Direct Testimony of Tim Woolf and Melissa Whited – Exhibit TW/MW‐3 Page 4
Table 2. Assumed Peak Demand Coincidence for Measures Implemented to Achieve Each PIM
Performance Incentive Mechanism FCM Peak Coincidence
Transmission Peak
Coincidence
Distribution Peak
Coincidence
Transmission Peak Demand Reduction 0% 100% 5%
FCM Peak Demand Reduction 100% 8% 20%
Demand Response ‐ Residential 100% 25% 80%
Demand Response ‐ C&I 100% 25% 80%
Electric Heat Initiative 0% 0% 0%
Electric Vehicle Initiative 0% 0% 0%
Behind‐the‐Meter Storage 80% 30% 40%
Utility‐Scale Storage 90% 90% 90%
Non‐Wires Alternatives 60% 30% 100%
5. Assumed Costs to Customers of Implementing PIM
The cost of an initiative or technology implemented to achieve a PIM will have a large impact on the net benefits that the PIM provides. For the FCM Peak and Transmission Peak PIMs we assumed that there will be no additional cost to the customers, because the Company has not requested recovery of any such costs in this rate case.
For most of the PIM initiatives (e.g., residential demand response, behind‐the‐meter storage), the forward‐going costs are not known at this time. Our cost estimates are based on our understanding of the general cost‐effectiveness of the relevant technology or program. Although these costs are not known with great certainty, the majority of these PIMs are designed to provide shared savings so that the Company is rewarded only when the PIM is cost‐effective.
Our assumptions regarding the costs of achieving the PIM targets are expressed as a percent of benefits in the table below.
259
Direct Testimony of Tim Woolf and Melissa Whited – Exhibit TW/MW‐3 Page 5
Table 3. Assumed Costs to Customers as Percent of Benefits for Each PIM
Performance Incentive Mechanism Assumed Costs as % of Benefits
Transmission Peak Demand Reduction 0%
FCM Peak Demand Reduction 0%
Demand Response ‐ Residential 90%
Demand Response ‐ C&I 70%
Electric Heat Initiative 71%
Electric Vehicle Initiative 80%
Behind‐the‐Meter Storage 90%
Utility‐Scale Storage 90%
Non‐Wires Alternatives 90%
6. PIM Incentives
Our approach to calculating the PIM incentives to provide to the Company includes the following steps.
First, we determined the quantified net benefits for each of the PIM initiatives. These are based on all of the assumptions described above.
Second, we determined how the quantified net benefits should be shared between the Company and customers. For each PIM, we propose that the net benefits be shared on a 50/50 basis.
Third, we divided the quantified net benefits by the expected value of a basis point in each year, using the Company’s assumptions. These assumptions may change if the revenue requirement is changed from the Company’s assumption. The table below provides the assumed value of a basis point.
Table 4. Assumed Value per Basis Point ($/bp)
2019 2020 2021
$59,493 $60,526 $63,602
Fourth, we identified additional unquantified benefits associated with each of the PIMs. We assumed these to be in the form of (a) improved reliability or resilience; (b) other fuel benefits; (c) market innovation or transformation benefits; or (d) low‐income benefits. We chose the number of basis points for each PIM based upon the type and number of unquantified benefits, and the importance of each unquantified benefit in light of Docket 4600 goals and state energy policies. The table below shows the categories of likely unquantified benefits and the basis points assigned to reflect these benefits.
260
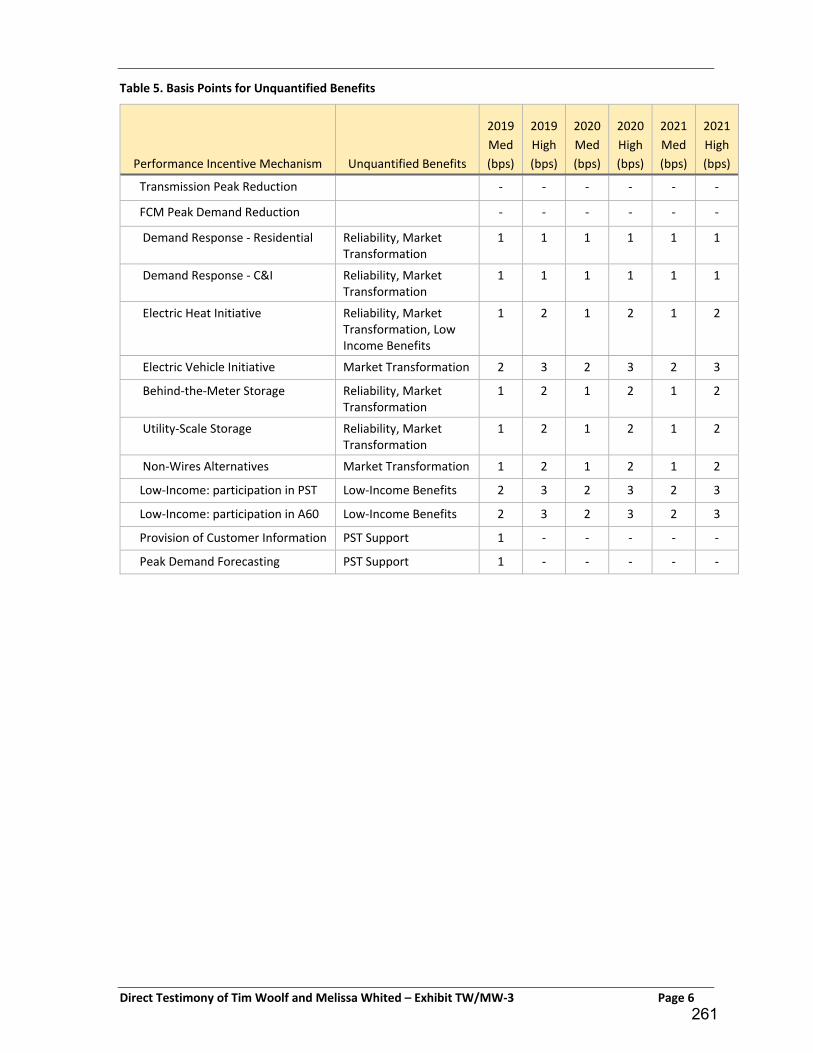
Direct Testimony of Tim Woolf and Melissa Whited – Exhibit TW/MW‐3 Page 6
Table 5. Basis Points for Unquantified Benefits
Performance Incentive Mechanism Unquantified Benefits
2019
Med
(bps)
2019
High
(bps)
2020
Med
(bps)
2020
High
(bps)
2021
Med
(bps)
2021
High
(bps)
Transmission Peak Reduction ‐ ‐ ‐ ‐ ‐ ‐
FCM Peak Demand Reduction ‐ ‐ ‐ ‐ ‐ ‐
Demand Response ‐ Residential Reliability, Market Transformation
1 1 1 1 1 1
Demand Response ‐ C&I Reliability, Market Transformation
1 1 1 1 1 1
Electric Heat Initiative Reliability, Market Transformation, Low Income Benefits
1 2 1 2 1 2
Electric Vehicle Initiative Market Transformation 2 3 2 3 2 3
Behind‐the‐Meter Storage Reliability, Market Transformation
1 2 1 2 1 2
Utility‐Scale Storage Reliability, Market Transformation
1 2 1 2 1 2
Non‐Wires Alternatives Market Transformation 1 2 1 2 1 2
Low‐Income: participation in PST Low‐Income Benefits 2 3 2 3 2 3
Low‐Income: participation in A60 Low‐Income Benefits 2 3 2 3 2 3
Provision of Customer Information PST Support 1 ‐ ‐ ‐ ‐ ‐
Peak Demand Forecasting PST Support 1 ‐ ‐ ‐ ‐ ‐
261

DIVISION EXHIBIT 4
SUBMITTED IN DOCKET 4770
ON BEHALF OF THE DIVISION OF PUBLIC UTILITIES AND CARRIERS
SUMMARYDivision Proposal
Unquantified
Benefits
2019 2019 2020 2020 2021 2021 2019 2019 2020 2020 2021 2021
Bps or Shared
Savings
% to
Company
Assumed
Costs as %
of Benefits
BCR Target Units Medium High Medium High Medium High Medium High Medium High Medium HighMediu
m (bps)
High
(bps)
Mediu
m (bps)
High
(bps)
Mediu
m (bps)
High
(bps)
Medium
(bps)
High
(bps)
Medium
(bps)
High
(bps)
Medium
(bps)
High
(bps)
Medium
($1,000)
High
($1,000)
Medium
($1,000)
High
($1,000)
Medium
($1,000)
High
($1,000)
Transmission Peak Demand Reduction bps 50% 0% MW below baseline 228 342 255 383 284 425 $4,765 $9,531 $5,599 $11,198 $6,531 $13,062 ‐ ‐ ‐ ‐ ‐ ‐ 40 80 46 93 51 103 $2,383 $4,765 $2,800 $5,599 $3,266 $6,531
FCM Peak Demand Reduction bps 50% 0% MW below baseline 29 44 31 46 32 48 $1,054 $2,108 $1,814 $3,629 $2,702 $5,405 ‐ ‐ ‐ ‐ ‐ ‐ 9 18 15 30 21 42 $527 $1,054 $907 $1,814 $1,351 $2,702
$0 $0 $0 $0 $0 $0
shared savings 50% 90% 1.11 Incremental MW 1 2 2 3 3 4 $9 $17 $27 $46 $59 $88 R&R; Mkt Trnsf 1 1 1 1 1 1 1 1 1 1 1 2 $64 $68 $74 $83 $93 $108
shared savings 50% 70% 1.43 Incremental MW 8 14 10 16 12 18 $206 $360 $491 $819 $881 $1,410 R&R; Mkt Trnsf 1 1 1 1 1 1 3 4 5 8 8 12 $162 $239 $306 $470 $504 $769
shared savings 50% 71% 1.40 Incremental Tonnes CO2 464 556 580 696 595 714 $263 $315 $329 $395 $337 $405 R&R; Mkt Trnsf; LI 1 2 1 2 1 2 3 5 4 5 4 5 $191 $277 $225 $318 $232 $330
bps 50% 80% 1.25 Incremental Tonnes CO2 557 1,114 757 1,511 1,026 2,051 $67 $134 $157 $313 $276 $551 Mkt Trnsf 2 3 2 3 2 3 3 4 3 6 4 7 $152 $245 $199 $338 $265 $467
shared savings 50% 90% 1.11 Incremental MW 1 2 1 2 1 2 $38 $75 $87 $173 $146 $292 R&R; Mkt Trnsf 1 2 1 2 1 2 1 3 2 3 2 4 $78 $157 $104 $208 $137 $273
shared savings 50% 90% 1.11 Incremental MW 3 6 3 6 3 6 $270 $539 $595 $1,190 $963 $1,926 R&R; Mkt Trnsf 1 2 1 2 1 2 3 7 6 12 9 17 $194 $389 $358 $716 $545 $1,090
shared savings 50% 90% 1.11 Incremental MW 3 6 3 6 3 6 $96 $192 $213 $425 $354 $709 Mkt Trnsf 1 2 1 2 1 2 2 4 3 6 4 8 $108 $215 $167 $334 $241 $482
Existing Energy Efficiency 5% 33% 3.03 Incremental MW 30 37 35 38 34 38 $314,010 $314,010 $342,693 $342,693 $342,693 $342,693 ‐ ‐ ‐ ‐ ‐ ‐ 105 105 90 90 86 86 $6,247 $6,247 $5,455 $5,455 $5,455 $5,455
‐ ‐ ‐ ‐ ‐ ‐ $0 $0 $0 $0 $0 $0
Low‐Income: participation in PST initiatives bps % LI cust in initiative 5 10 5 10 5 10 LI benefits 2 3 2 3 2 3 2 3 2 3 2 3 $119 $178 $121 $182 $127 $191
Low‐Income: participation in LI rate bps % LI cust in initiative 4 8 4 8 4 8 LI benefits 2 3 2 3 2 3 2 3 2 3 2 3 $119 $178 $121 $182 $127 $191
Data Access bps Plan ‐‐ ‐‐ ‐‐ ‐‐ ‐‐ PST Support 1 ‐ ‐ ‐ ‐ ‐ 1 #VALUE! ‐ ‐ ‐ ‐ $59 #VALUE! $0 $0 $0 $0
Peak Demand Forecasting (one‐year) bps Report ‐‐ ‐‐ ‐‐ ‐‐ ‐‐ PST Support 1 ‐ ‐ ‐ ‐ ‐ 1 #VALUE! ‐ ‐ ‐ ‐ $59 #VALUE! $0 $0 $0 $0
AMI Capabilities (2022) # cust with TVR ‐‐ ‐‐ ‐‐ ‐‐ ‐‐ ‐‐
Subtotal Existing PIMs $314,010 $314,010 $342,693 $342,693 $342,693 $342,693 105 105 90 90 86 86
Subtotal New PIMs $6,767 $13,271 $9,312 $18,187 $12,250 $23,848 71 #VALUE! 89 169 108 206 $4,216 #VALUE! $5,382 $10,244 $6,888 $13,132
Total PIMs $320,777 $327,281 $352,005 $360,880 $354,943 $366,541 176 #VALUE! 179 259 194 292
Monthly Tx MW 21 31 23 35 26 39 16 27 24 41 32 55
6 #VALUE! 4 6 4 6
Info for Charts
Med High Med High
Trans Peak $6,531 $13,062 51 103
FCM Peak $2,702 $5,405 21 42
DR: Res $59 $88 1 2
DR: C&I $881 $1,410 8 12
Elect. Heat $337 $405 4 5
Elect. Vehicles $276 $551 4 7
BTM Storage $146 $292 2 4
Utility‐Scale Storage $963 $1,926 9 17
NWAs $354 $709 4 8
Energy Efficiency ####### ###### 86 86
Total New PIMs $12,250 $23,848 104 200
Targets
2021
Demand Response ‐ C&I
System Efficiency
Distributed Energy Resources
Demand Response ‐ Residential
2019 2020 2019 2020 2021
Incentives (Basis Points)Quantified Net Benefits ($1000) (before incentive) Incentives ($1000)
Net Benefits Basis Pts
Additional Bps for Unquantified Benefits
Electric Heat Initiative
PST Support Services
2019 2020 2021
Utility‐Scale Storage
Non‐Wires Alternatives
Electric Vehicle Initiative
Behind‐the‐Meter Storage
Performance Incentive Mechanism
$0
$5,000
$10,000
$15,000
$20,000
$25,000
$30,000
Med High
Net
Ben
efits
in 2
021
($10
00) NWAs
Utility-ScaleStorageBTM Storage
Elect. Vehicles
Elect. Heat
DR: C&I
DR: Res -
50
100
150
200
250
Med High
Bas
is Po
ints
in 2
021
NWAs
Utility-Scale Storage
BTM Storage
Elect. Vehicles
Elect. Heat
DR: C&I
DR: Res
FCM Peak
Trans Peak
$0
$5,000
$10,000
$15,000
$20,000
$25,000
$30,000
Med High
Net
Ben
efits
in 2
021
($10
00)
-
50
100
150
200
250
Med High
Ince
ntiv
es in
202
1 ($
1000
)
262

OUTCOMESDivision Proposal
2019 2019 2020 2020 2021 2021 2019 2019 2020 2020 2021 2021 2019 2019 2020 2020 2021 2021 2019 2019 2020 2020 2021 2021 2019 2019 2020 2020 2021 2021 2019 2019 2020 2020 2021 2021
Target Units Medium High Medium High Medium High Medium High Medium High Medium High Medium High Medium High Medium High Medium High Medium High Medium High Medium High Medium High Medium High Medium High Medium High Medium High
Transmission Peak Demand Reduction MW below baseline 0 0 0 0 0 0 10 21 12 23 13 26 6 11 6 13 7 14 0 0 0 0 0 0 0 0 0 0 0 0 0 0 0 0 0 0
FCM Peak Demand Reduction MW below baseline 15 29 15 31 16 32 1 2 1 3 1 3 3 6 3 6 3 6 0 0 0 0 0 0 15 29 15 31 16 32 0 0 0 0 0 0
Incremental MW 1 2 3 5 6 9 0 1 1 1 2 2 1 2 2 4 5 7 0 0 0 0 0 0 1 2 3 5 6 9 0 0 0 0 0 0
Incremental MW 8 14 18 30 30 48 2 4 5 8 8 12 6 11 14 24 24 38 0 0 0 0 0 0 8 14 18 30 30 48 0 0 0 0 0 0
Incremental Tonnes CO2 0 0 0 0 0 0 0 0 0 0 0 0 0 0 0 0 0 0 0 0 0 0 0 0 0 0 0 0 0 0 0 0 0 0 0 0
Incremental Tonnes CO2 0 0 0 0 0 0 0 0 0 0 0 0 0 0 0 0 0 0 0 0 0 0 0 0 0 0 0 0 0 0 557 1,114 1,314 2,625 2,339 4,676
Incremental MW 1 2 2 3 2 5 0 1 1 1 1 2 0 1 1 2 1 2 0 0 0 0 0 0 1 2 2 4 3 6 0 0 0 0 0 0
Incremental MW 3 5 5 11 8 16 3 5 5 11 8 16 3 5 5 11 8 16 0 0 0 0 0 0 3 6 6 12 9 18 0 0 0 0 0 0Incremental MW 2 4 4 7 5 11 1 2 2 4 3 5 3 6 6 12 9 18 0 0 0 0 0 0 0 0 0 0 0 0 0 0 0 0 0 0
Existing Energy Efficiency Incremental MW 0 0 0 0 0 0 0 0 0 0 0 0 0 0 0 0 0 0 0 0 0 0 0 0 0 0 0 0 0 0 0 0 0 0 0 0
Low‐Income: participation in PST initiatives % LI cust in initiative 0 0 0 0 0 0 0 0 0 0 0 0 0 0 0 0 0 0 0 0 0 0 0 0 0 0 0 0 0 0 0 0 0 0 0 0
Low‐Income: participation in LI rate % LI cust in initiative 0 0 0 0 0 0 0 0 0 0 0 0 0 0 0 0 0 0 0 0 0 0 0 0 0 0 0 0 0 0 0 0 0 0 0 0
Provision of Customer Information 0 0 0 0 0 0 0 0 0 0 0 0 0 0 0 0 0 0 0 0 0 0 0 0 0 0 0 0 0 0 0 0 0 0 0 0 0
Peak Demand Forecasting (one‐year) 0 0 0 0 0 0 0 0 0 0 0 0 0 0 0 0 0 0 0 0 0 0 0 0 0 0 0 0 0 0 0 0 0 0 0 0 0
AMI Capabilities (2022) # cust with TVR 0 0 0 0 0 0 0 0 0 0 0 0 0 0 0 0 0 0 0 0 0 0 0 0 0 0 0 0 0 0 0 0 0 0 0 0
Subtotal New PIMs ‐ 29 56 47 87 68 121 18 35 26 50 35 66 22 42 38 71 57 103 ‐ ‐ ‐ ‐ ‐ ‐ 28 53 44 82 64 113 557 1,114 1,314 2,625 2,339 4,676
GHG (Tons)
Utility‐Scale StorageNon‐Wires Alternatives
Performance Incentive Mechanism
System Efficiency
FCM Savings (MW‐yr) Transmission Savings (MW‐yr) Distribution Savings (MW‐yr) Energy Avg (MWh) Energy Peak (MWh)
PST Support Services
Distributed Energy Resources
Demand Response ‐ Residential
Demand Response ‐ C&I
Electric Heat Initiative
Electric Vehicle Initiative
Behind‐the‐Meter Storage
263

INCENTIVESDivision Proposal
Unquantified
Benefits
2019 2019 2020 2020 2021 2021 2019 2019 2020 2020 2021 2021
Bps or Shared
Savings
% to
Company
Assumed
Costs as %
of Benefits
BCR Target Units Medium High Medium High Medium HighMedium
(bps)
High
(bps)
Medium
(bps)
High
(bps)
Medium
(bps)
High
(bps)
Medium
(bps)
High
(bps)
Medium
(bps)
High
(bps)
Medium
(bps)
High
(bps)
Medium
($1,000)
High
($1,000)
Medium
($1,000)
High
($1,000)
Medium
($1,000)
High
($1,000)
Transmission Peak Demand Reduction bps 50% 0% MW below baseline 40 80 46 93 51 103 ‐ ‐ ‐ ‐ ‐ ‐ 40 80 46 93 51 103 $2,383 $4,765 $2,800 $5,599 $3,266 $6,531
FCM Peak Demand Reduction bps 50% 0% MW below baseline 9 18 15 30 21 42 ‐ ‐ ‐ ‐ ‐ ‐ 9 18 15 30 21 42 $527 $1,054 $907 $1,814 $1,351 $2,702
‐ ‐ ‐ ‐ ‐ ‐ ‐ ‐ ‐ ‐ ‐ ‐ ‐ ‐ ‐ ‐ ‐ ‐ $0 $0 $0 $0 $0 $0
shared savings 50% 90% 1.11 Incremental MW 0 0 0 0 0 1 R&R; Mkt Trnsf 1 1 1 1 1 1 1 1 1 1 1 2 $64 $68 $74 $83 $93 $108
shared savings 50% 70% 1.43 Incremental MW 2 3 4 7 7 11 R&R; Mkt Trnsf 1 1 1 1 1 1 3 4 5 8 8 12 $162 $239 $306 $470 $504 $769
shared savings 50% 71% 1.40 Incremental Tonnes CO 2 3 3 3 3 3 R&R; Mkt Trnsf; LI 1 2 1 2 1 2 3 5 4 5 4 5 $191 $277 $225 $318 $232 $330
bps 50% 80% 1.25 Incremental Tonnes CO 1 1 1 3 2 4 Mkt Trnsf 2 3 2 3 2 3 3 4 3 6 4 7 $152 $245 $199 $338 $265 $467
shared savings 50% 90% 1.11 Incremental MW 0 1 1 1 1 2 R&R; Mkt Trnsf 1 2 1 2 1 2 1 3 2 3 2 4 $78 $157 $104 $208 $137 $273
shared savings 50% 90% 1.11 Incremental MW 2 5 5 10 8 15 R&R; Mkt Trnsf 1 2 1 2 1 2 3 7 6 12 9 17 $194 $389 $358 $716 $545 $1,090
shared savings 50% 90% 1.11 Incremental MW 1 2 2 4 3 6 Mkt Trnsf 1 2 1 2 1 2 2 4 3 6 4 8 $108 $215 $167 $334 $241 $482
Existing Energy Efficiency 5% 33% 3.03 Incremental MW 264 264 283 283 269 269 ‐ ‐ ‐ ‐ ‐ ‐ 105 105 90 90 86 86 $6,247 $6,247 $5,455 $5,455 $5,455 $5,455
0 0 0 0 0 0 ‐ ‐ ‐ ‐ ‐ ‐ ‐ ‐ ‐ ‐ ‐ ‐ $0 $0 $0 $0 $0 $0
Low‐Income: participation in PST initiatives bps % LI cust in initiative 0 0 0 0 0 0 LI benefits 2 3 2 3 2 3 2 3 2 3 2 3 $119 $178 $121 $182 $127 $191
Low‐Income: participation in LI rate bps % LI cust in initiative 0 0 0 0 0 0 LI benefits 2 3 2 3 2 3 2 3 2 3 2 3 $119 $178 $121 $182 $127 $191
Provision of Customer Information bps 0 0 0 0 0 0 0 PST Support 1 ‐ ‐ ‐ ‐ ‐ 1 #VALUE! ‐ ‐ ‐ ‐ $59 #VALUE! $0 $0 $0 $0
Peak Demand Forecasting (one‐year) bps 0 0 0 0 0 0 0 PST Support 1 ‐ ‐ ‐ ‐ ‐ 1 #VALUE! ‐ ‐ ‐ ‐ $59 #VALUE! $0 $0 $0 $0
AMI Capabilities (2022) # cust with TVR 0 0 0 0 0 0 ‐ ‐ ‐ ‐ ‐ ‐ ‐ ‐ ‐ ‐ ‐ ‐ $0 $0 $0 $0 $0 ‐
Subtotal Existing PIMs 264 264 283 283 269 269 105 105 90 90 86 86
Subtotal New PIMs 57 112 77 150 96 187 71 #VALUE! 89 169 108 206 $4,216 #VALUE! $5,382 $10,244 $6,888 $13,132
Total PIMs 321 375 360 433 366 457 176 #VALUE! 179 259 194 292
System Efficiency 49 98 61 122 73 145
New DERs 16 27 24 41 32 55
Other 6 #VALUE! 4 6 4 6
Utility‐Scale Storage
Non‐Wires Alternatives
Behind‐the‐Meter Storage
2019
Distributed Energy Resources
Demand Response ‐ Residential
Demand Response ‐ C&I
PST Support Services
Electric Heat Initiative
Electric Vehicle Initiative
2020 2021
Performance Incentive Mechanism
System Efficiency
2019 2020 2021
Incentive for Quantified Net Benefits Additional Bps for Unquantified Benefits Incentives (Basis Points) Incentives ($1000)
264
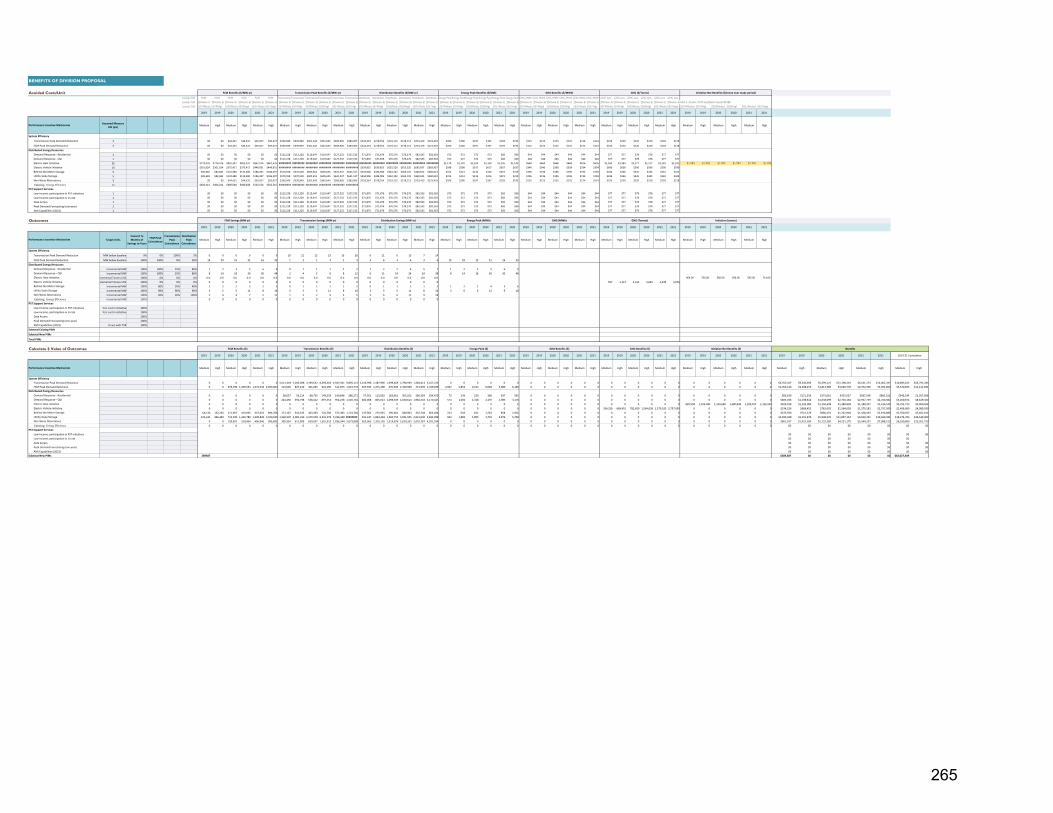
BENEFITS OF DIVISION PROPOSAL
Avoided Costs/UnitLookup Cells FCM FCM FCM FCM FCM FCM TransmissionTransmissionTransmissionTransmissionTransmissionTransmissionDistribution Distribution Distribution Distribution Distribution Distribution Energy PeakEnergy PeakEnergy PeakEnergy PeakEnergy PeakEnergy Peak GHG MWh GHG MWh GHG MWh GHG MWh GHG MWh GHG MWh GHG tons GHG tons GHG tons GHG tons GHG tons GHG tonsLookup Cells '[Division Ex'[Division Ex'[Division Ex'[Division Ex'[Division Ex'[Division Ex'[Division Ex'[Division Ex'[Division Ex'[Division Ex'[Division Ex'[Division Ex'[Division Ex'[Division Ex'[Division Ex'[Division Ex'[Division Ex'[Division Ex'[Division Ex'[Division Ex'[Division Ex'[Division Ex'[Division Ex'[Division Ex'[Division Ex'[Division Ex'[Division Ex'[Division Ex'[Division Ex'[Division Ex'[Division Ex'[Division Ex'[Division Ex'[Division Ex'[Division Ex'[Division Exhibit 4_Docket 4770.xlsx]Global Inputs'!$H$86Lookup Cells 2019Mediu 2019High 2020Mediu 2020High 2021Mediu 2021High 2019Mediu 2019High 2020Mediu 2020High 2021Mediu 2021High 2019Mediu 2019High 2020Mediu 2020High 2021Mediu 2021High 2019Mediu 2019High 2020Mediu 2020High 2021Mediu 2021High 2019Mediu 2019High 2020Mediu 2020High 2021Mediu 2021High 2019Mediu 2019High 2020Mediu 2020High 2021Mediu 2021High 2019Medium2019High 2020Medium2020High 2021Medium2021High
2019 2019 2020 2020 2021 2021 2019 2019 2020 2020 2021 2021 2019 2019 2020 2020 2021 2021 2019 2019 2020 2020 2021 2021 2019 2019 2020 2020 2021 2021 2019 2019 2020 2020 2021 2021 2019 2019 2020 2020 2021 2021
Assumed Measure
Life (yrs)Medium High Medium High Medium High Medium High Medium High Medium High Medium High Medium High Medium High Medium High Medium High Medium High Medium High Medium High Medium High Medium High Medium High Medium High Medium High Medium High Medium High
Transmission Peak Demand Reduction 3 $0 $0 $44,431 $44,431 $92,027 $92,027 $339,949 $339,949 $361,643 $361,643 $383,905 $383,905 $218,354 $218,354 $219,113 $219,113 $223,419 $223,419 $200 $200 $197 $197 $193 $193 $125 $125 $125 $125 $124 $124 $220 $220 $220 $220 $218 $218
FCM Peak Demand Reduction 3 $0 $0 $44,431 $44,431 $92,027 $92,027 $339,949 $339,949 $361,643 $361,643 $383,905 $383,905 $218,354 $218,354 $219,113 $219,113 $223,419 $223,419 $200 $200 $197 $197 $193 $193 $125 $125 $125 $125 $124 $124 $220 $220 $220 $220 $218 $218
1 $0 $0 $0 $0 $0 $0 $112,228 $112,228 $119,647 $119,647 $127,232 $127,232 $71,876 $71,876 $76,276 $76,276 $82,563 $82,563 $72 $72 $73 $73 $66 $66 $44 $44 $44 $44 $44 $44 $77 $77 $78 $78 $77 $77
1 $0 $0 $0 $0 $0 $0 $112,228 $112,228 $119,647 $119,647 $127,232 $127,232 $71,876 $71,876 $76,276 $76,276 $82,563 $82,563 $72 $72 $73 $73 $66 $66 $44 $44 $44 $44 $44 $44 $77 $77 $78 $78 $77 $77
25 $779,476 $779,476 $822,347 $822,347 $867,576 $867,576 ######### ######### ######### ######### ######### ######### ######### ######### ######### ######### ######### ######### $1,170 $1,170 $1,159 $1,159 $1,145 $1,145 $660 $660 $668 $668 $676 $676 $1,164 $1,164 $1,177 $1,177 $1,191 $1,191 $1,984 $1,984 $1,984 $1,984 $1,984 $1,984
10 $301,924 $301,924 $375,417 $375,417 $449,931 $449,931 ######### ######### ######### ######### ######### ######### $639,855 $639,855 $655,520 $655,520 $683,937 $683,937 $598 $598 $617 $617 $637 $637 $340 $340 $338 $338 $334 $334 $600 $600 $596 $596 $590 $590
5 $82,682 $82,682 $132,480 $132,480 $186,397 $186,397 $570,558 $570,558 $605,655 $605,655 $641,537 $641,537 $344,906 $344,906 $363,102 $363,102 $360,623 $360,623 $314 $314 $316 $316 $319 $319 $196 $196 $196 $196 $194 $194 $346 $346 $345 $345 $342 $342
5 $82,682 $82,682 $132,480 $132,480 $186,397 $186,397 $570,558 $570,558 $605,655 $605,655 $641,537 $641,537 $344,906 $344,906 $363,102 $363,102 $360,623 $360,623 $314 $314 $316 $316 $319 $319 $196 $196 $196 $196 $194 $194 $346 $346 $345 $345 $342 $342
3 $0 $0 $44,431 $44,431 $92,027 $92,027 $339,949 $339,949 $361,643 $361,643 $383,905 $383,905 $218,354 $218,354 $219,113 $219,113 $223,419 $223,419 $200 $200 $197 $197 $193 $193 $125 $125 $125 $125 $124 $124 $220 $220 $220 $220 $218 $218
Existing Energy Efficiency 12 $404,241 $404,241 $480,648 $480,648 $562,516 $562,516 ######### ######### ######### ######### ######### #########
Low‐Income: participation in PST initiatives 1 $0 $0 $0 $0 $0 $0 $112,228 $112,228 $119,647 $119,647 $127,232 $127,232 $71,876 $71,876 $76,276 $76,276 $82,563 $82,563 $72 $72 $73 $73 $66 $66 $44 $44 $44 $44 $44 $44 $77 $77 $78 $78 $77 $77
Low‐Income: participation in LI rate 1 $0 $0 $0 $0 $0 $0 $112,228 $112,228 $119,647 $119,647 $127,232 $127,232 $71,876 $71,876 $76,276 $76,276 $82,563 $82,563 $72 $72 $73 $73 $66 $66 $44 $44 $44 $44 $44 $44 $77 $77 $78 $78 $77 $77
Data Access 1 $0 $0 $0 $0 $0 $0 $112,228 $112,228 $119,647 $119,647 $127,232 $127,232 $71,876 $71,876 $76,276 $76,276 $82,563 $82,563 $72 $72 $73 $73 $66 $66 $44 $44 $44 $44 $44 $44 $77 $77 $78 $78 $77 $77
Peak Demand Forecasting (one‐year) 1 $0 $0 $0 $0 $0 $0 $112,228 $112,228 $119,647 $119,647 $127,232 $127,232 $71,876 $71,876 $76,276 $76,276 $82,563 $82,563 $72 $72 $73 $73 $66 $66 $44 $44 $44 $44 $44 $44 $77 $77 $78 $78 $77 $77
AMI Capabilities (2022) 1 $0 $0 $0 $0 $0 $0 $112,228 $112,228 $119,647 $119,647 $127,232 $127,232 $71,876 $71,876 $76,276 $76,276 $82,563 $82,563 $72 $72 $73 $73 $66 $66 $44 $44 $44 $44 $44 $44 $77 $77 $78 $78 $77 $77
Outcomes
2019 2019 2020 2020 2021 2021 2019 2019 2020 2020 2021 2021 2019 2019 2020 2020 2021 2021 2019 2019 2020 2020 2021 2021 2019 2019 2020 2020 2021 2021 2019 2019 2020 2020 2021 2021 2019 2019 2020 2020 2021 2021
Target Units
Convert Tx
Months of
Savings to Years
FCM Peak
Coincidence
Transmission
Peak
Coincidence
Distribution
Peak
Coincidence
Medium High Medium High Medium High Medium High Medium High Medium High Medium High Medium High Medium High Medium High Medium High Medium High Medium High Medium High Medium High Medium High Medium High Medium High Medium High Medium High Medium High
Transmission Peak Demand Reduction MW below baseline 9% 0% 100% 5% 0 0 0 0 0 0 10 21 12 23 13 26 6 11 6 13 7 14
FCM Peak Demand Reduction MW below baseline 100% 100% 8% 20% 15 29 15 31 16 32 1 2 1 3 1 3 3 6 3 6 3 6 15 29 15 31 16 32
Incremental MW 100% 100% 25% 80% 1 2 3 5 6 9 0 1 1 1 2 2 1 2 2 4 5 7 1 2 3 5 6 9
Incremental MW 100% 100% 25% 80% 8 14 18 30 30 48 2 4 5 8 8 12 6 11 14 24 24 38 8 14 18 30 30 48
cremental Tonnes CO2 100% 0% 0% 0% 0.0 0.0 0.0 0.0 0.0 0.0 0.0 0.0 0.0 0.0 0.0 0.0 0.0 0.0 0.0 0.0 0.0 0.0 464.00 556.00 580.00 696.00 595.00 714.00
cremental Tonnes CO2 100% 0% 0% 0% 0 0 0 0 0 0 0 0 0 0 0 0 0 0 0 0 0 0 557 1,114 1,314 2,625 2,339 4,676
Incremental MW 100% 80% 30% 40% 1 2 2 3 2 5 0 1 1 1 1 2 0 1 1 2 1 2 1 2 2 4 3 6
Incremental MW 100% 90% 90% 90% 3 5 5 11 8 16 3 5 5 11 8 16 3 5 5 11 8 16 3 6 6 12 9 18
Incremental MW 100% 60% 30% 100% 2 4 4 7 5 11 1 2 2 4 3 5 3 6 6 12 9 18
Existing Energy Efficiency Incremental MW 100% 0 0 0 0 0 0 0 0 0 0 0 0 0 0 0 0 0 0
Low‐Income: participation in PST initiatives % LI cust in initiative 100%
Low‐Income: participation in LI rate % LI cust in initiative 100%
Data Access 100%
Peak Demand Forecasting (one‐year) 100%
AMI Capabilities (2022) # cust with TVR 100%
Subtotal Existing PIMs
Subtotal New PIMs
Total PIMs
Calculate $ Value of Outcomes
2019 2019 2020 2020 2021 2021 2019 2019 2020 2020 2021 2021 2019 2019 2020 2020 2021 2021 2019 2019 2020 2020 2021 2021 2019 2019 2020 2020 2021 2021 2019 2019 2020 2020 2021 2021 2019 2019 2020 2020 2021 2021 2019 2019 2020 2020 2021 2021
Medium High Medium High Medium High Medium High Medium High Medium High Medium High Medium High Medium High Medium High Medium High Medium High Medium High Medium High Medium High Medium High Medium High Medium High Medium High Medium High Medium High Medium High Medium High Medium High Medium High
Transmission Peak Demand Reduction 0 0 0 0 0 0 3,521,349 7,042,698 4,199,652 8,399,305 4,947,561 9,895,121 1,243,998 2,487,996 1,399,469 2,798,939 1,583,613 3,167,226 0 0 0 0 0 0 0 0 0 0 0 0 0 0 0 0 0 0 0 0 0 0 0 0 $4,765,347 $9,530,693 $5,599,122 $11,198,244 $6,531,173 $13,062,347 $16,895,642 $33,791,284
FCM Peak Demand Reduction 0 0 679,796 1,359,591 1,472,432 2,944,864 413,605 827,210 461,095 922,190 511,874 1,023,747 637,595 1,275,190 670,485 1,340,969 714,939 1,429,879 2,927 5,853 3,014 6,028 3,085 6,169 0 0 0 0 0 0 0 0 0 0 0 0 0 0 0 0 0 0 $1,054,126 $2,108,253 $1,814,389 $3,628,778 $2,702,330 $5,404,660 $5,570,845 $11,141,691
0 0 0 0 0 0 28,057 56,114 89,735 149,559 190,848 286,271 57,501 115,002 183,061 305,102 396,303 594,455 72 143 220 366 397 595 0 0 0 0 0 0 0 0 0 0 0 0 0 0 0 0 0 0 $85,630 $171,259 $273,016 $455,027 $587,548 $881,322 $946,194 $1,507,608
0 0 0 0 0 0 224,456 392,798 538,412 897,353 954,238 1,526,781 460,008 805,013 1,098,369 1,830,614 1,981,516 3,170,425 573 1,002 1,318 2,197 1,985 3,176 0 0 0 0 0 0 0 0 0 0 0 0 0 0 0 0 0 0 $685,036 $1,198,814 $1,638,099 $2,730,164 $2,937,739 $4,700,382 $5,260,874 $8,629,360
0 0 0 0 0 0 0 0 0 0 0 0 0 0 0 0 0 0 0 0 0 0 0 0 0 0 0 0 0 0 0 0 0 0 0 0 920,558 1,103,083 1,150,698 1,380,838 1,180,457 1,416,549 $920,558 $1,103,083 $1,150,698 $1,380,838 $1,180,457 $1,416,549 $3,251,714 $3,900,469
0 0 0 0 0 0 0 0 0 0 0 0 0 0 0 0 0 0 0 0 0 0 0 0 0 0 0 0 0 0 334,226 668,452 782,659 1,564,038 1,379,183 2,757,099 0 0 0 0 0 0 $334,226 $668,452 $782,659 $1,564,038 $1,379,183 $2,757,099 $2,496,069 $4,989,590
66,146 132,291 211,967 423,935 447,354 894,708 171,167 342,335 363,393 726,786 577,383 1,154,766 137,963 275,925 290,482 580,964 432,748 865,496 314 628 632 1,264 958 1,916 0 0 0 0 0 0 0 0 0 0 0 0 0 0 0 0 0 0 $375,590 $751,179 $866,474 $1,732,948 $1,458,443 $2,916,886 $2,700,507 $5,401,014
223,241 446,482 715,390 1,430,780 1,509,820 3,019,639 1,540,507 3,081,014 3,270,538 6,541,076 5,196,448 ######## 931,247 1,862,494 1,960,753 3,921,505 2,921,049 5,842,098 943 1,885 1,895 3,791 2,874 5,748 0 0 0 0 0 0 0 0 0 0 0 0 0 0 0 0 0 0 $2,695,938 $5,391,876 $5,948,576 $11,897,152 $9,630,191 $19,260,381 $18,274,704 $36,549,409
0 0 159,952 319,904 496,946 993,892 305,954 611,909 650,957 1,301,915 1,036,544 2,073,089 655,063 1,310,126 1,314,676 2,629,352 2,010,767 4,021,534 0 0 0 0 0 0 0 0 0 0 0 0 0 0 0 0 0 0 0 0 0 0 0 0 $961,017 $1,922,035 $2,125,585 $4,251,170 $3,544,257 $7,088,515 $6,630,860 $13,261,720
Existing Energy Efficiency 0 0 0 0 0 0 0 0 0 0 0 0 0 0 0 0 0 0 0 0 0 0 0 0 0 0 0 0 0 0 0 0 0 0 0 0 0 0 0 0 0 0 $0 $0 $0 $0 $0 $0 $0 $0
Low‐Income: participation in PST initiatives $0 $0 $0 $0 $0 $0 $0 $0
Low‐Income: participation in LI rate $0 $0 $0 $0 $0 $0 $0
Data Access $0 $0 $0 $0 $0 $0 $0 $0
Peak Demand Forecasting (one‐year) $0 $0 $0 $0 $0 $0 $0 $0
AMI Capabilities (2022) $0 $0 $0 $0 $0 $0 $0 $0
Subtotal New PIMs 289387 $289,387 $0 $0 $0 $0 $0 $62,027,409
Initiative Net Benefits ($/tonne over study period)
PST Support Services
GHG Benefits ($) GHG Benefits ($)
Demand Response ‐ Residential
Demand Response ‐ C&I
Electric Heat Initiative
Electric Vehicle Initiative
Behind‐the‐Meter Storage
Performance Incentive Mechanism
System Efficiency
Distributed Energy Resources
GHG (Tonnes)
Non‐Wires Alternatives
Utility‐Scale Storage
Non‐Wires Alternatives
Electric Vehicle Initiative
Demand Response ‐ C&I
Behind‐the‐Meter Storage
2019‐21 Cumulative
Initiative Net Benefits ($)
System Efficiency
Distributed Energy Resources
Demand Response ‐ Residential
Performance Incentive Mechanism
Utility‐Scale Storage
Initiative (tonnes)
BenefitsFCM Benefits ($) Transmission Benefits ($) Distribution Benefits ($) Energy Peak ($)
GHG (MWh) Transmission Savings (MW‐yr)FCM Savings (MW‐yr) Distribution Savings (MW‐yr) Energy Peak (MWh)
PST Support Services
Electric Heat Initiative
Energy Peak Benefits ($/MW) GHG ($/Tonne)FCM Benefits ($/MW‐yr) Distribution Benefits ($/MW‐yr) GHG Benefits ($/MWh)
Distributed Energy Resources
Transmission Peak Benefits ($/MW‐yr)
Performance Incentive Mechanism
System Efficiency
PST Support Services
Demand Response ‐ Residential
Demand Response ‐ C&I
Electric Heat Initiative
Electric Vehicle Initiative
Behind‐the‐Meter Storage
Utility‐Scale Storage
Non‐Wires Alternatives
265
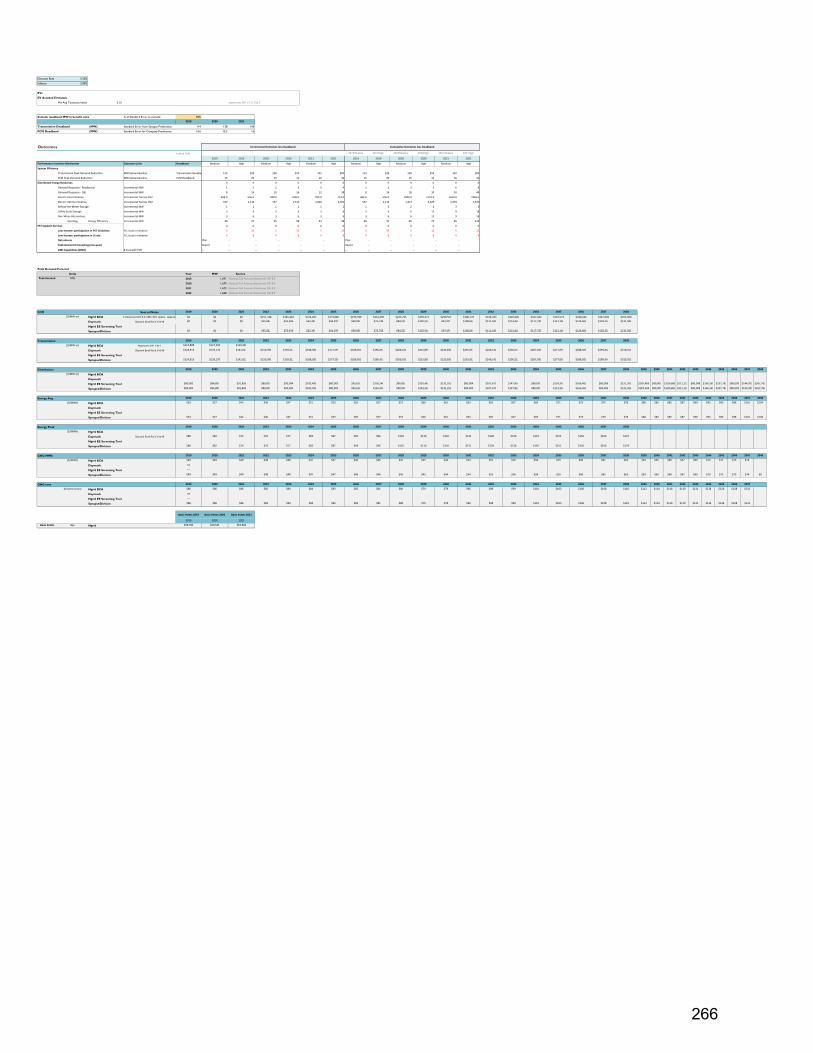
Discount Rate 5.50%
Inflation 2.00%
EVs
EV Avoided Emissions
Wt Avg Tonnes/yr/vehicle 2.15 Attachment DIV 1-1-3, Tab 5
Exclude deadband MW in benefit calcs % of Standard Error to exclude: 50%
2019 2020 2021
Transmission Deadband (MW) Standard Error from Synapse Predictions 114 128 142
FCM Deadband (MW) Standard Error for Company Predictions 14.6 15.3 16
Outcomes
Lookup Cells 2019Medium 2019High 2020Medium 2020High 2021Medium 2021High
2019 2019 2020 2020 2021 2021 2019 2019 2020 2020 2021 2021
Performance Incentive Mechanism Outcome Units Deadband Medium High Medium High Medium High Medium High Medium High Medium High
System Efficiency
Transmission Peak Demand Reduction MW below baseline Transmission Deadba 114 228 128 255 142 284 114 228 128 255 142 284
FCM Peak Demand Reduction MW below baseline FCM Deadband 15 29 15 31 16 32 15 29 15 31 16 32
Distributed Energy Resources 0 0 0 0 0 0 0 0 0 0 0 0
Incremental MW 1 2 2 3 3 4 1 2 3 5 6 9
Incremental MW 8 14 10 16 12 18 8 14 18 30 30 48
Incremental Tonnes CO2 464.0 556.0 580.0 696.0 595.0 714.0 464.0 556.0 1044.0 1252.0 1639.0 1966.0
Incremental Tonnes CO2 557 1,114 757 1,511 1,026 2,051 557 1,114 1,314 2,625 2,339 4,676
Incremental MW 1 2 1 2 1 2 1 2 2 4 3 6
Incremental MW 3 6 3 6 3 6 3 6 6 12 9 18
Incremental MW 3 6 3 6 3 6 3 6 6 12 9 18
Existing Energy Efficiency Incremental MW 30 37 35 38 34 38 30 37 65 75 99 113
PST Support Services 0 0 0 0 0 0 0 0 0 0 0 0
Low‐Income: participation in PST initiatives % LI cust in initiative 5 10 5 10 5 10 5 10 5 10 5 10
Low‐Income: participation in LI rate % LI cust in initiative 4 8 4 8 4 8 4 8 4 8 4 8
Data Access Plan ‐‐ ‐‐ ‐‐ ‐‐ ‐‐ Plan ‐‐ ‐‐ ‐‐ ‐‐ ‐‐
Peak Demand Forecasting (one‐year) Report ‐‐ ‐‐ ‐‐ ‐‐ ‐‐ Report ‐‐ ‐‐ ‐‐ ‐‐ ‐‐
AMI Capabilities (2022) # cust with TVR ‐‐ ‐‐ ‐‐ ‐‐ ‐‐ ‐‐ ‐‐ ‐‐ ‐‐ ‐‐ ‐‐ ‐‐
Peak Demand Forecast
Units Year MW Source
2019 1,691 National Grid Forecast Attachment DIV 8-5
2020 1,679 National Grid Forecast Attachment DIV 8-5
2021 1,672 National Grid Forecast Attachment DIV 8-5
2022 1,668 National Grid Forecast Attachment DIV 8-5
FCM Source/Notes 2019 2020 2021 2022 2023 2024 2025 2026 2027 2028 2029 2030 2031 2032 2033 2034 2035 2036 2037 2038
Ngrid BCA 3; Attachment DIV 8-6; AESC 2015 Update - Appendix $0 $0 $0 $151,748 $145,443 $154,497 $173,685 $193,939 $214,296 $235,795 $259,373 $290,551 $308,170 $314,333 $320,620 $327,032 $333,573 $340,244 $347,049 $353,990
Daymark Daymark Email Rec'd 3/16/18 $0 $0 $0 $55,042 $55,936 $62,393 $64,297 $69,950 $75,749 $84,529 $102,516 $97,070 $108,661 $111,185 $114,424 $117,749 $121,160 $124,661 $128,254 $131,940
Ngrid EE Screening Tool
Synapse/Division $0 $0 $0 $55,042 $55,936 $62,393 $64,297 $69,950 $75,749 $84,529 $102,516 $97,070 $108,661 $111,185 $114,424 $117,749 $121,160 $124,661 $128,254 $131,940
Transmission 2019 2020 2021 2022 2023 2024 2025 2026 2027 2028 2029 2030 2031 2032 2033 2034 2035 2036 2037 2038
Ngrid BCA Attachment DIV 1-36-1 $114,808 $117,104 $119,446
Daymark Daymark Email Rec'd 3/16/18 $124,913 $133,170 $141,612 $150,390 $159,312 $168,380 $177,593 $186,950 $196,453 $206,100 $215,893 $225,830 $235,913 $246,141 $256,513 $267,031 $277,693 $288,501 $299,454 $310,551
Ngrid EE Screening Tool
Synapse/Division $124,913 $133,170 $141,612 $150,390 $159,312 $168,380 $177,593 $186,950 $196,453 $206,100 $215,893 $225,830 $235,913 $246,141 $256,513 $267,031 $277,693 $288,501 $299,454 $310,551
Distribution 2019 2020 2021 2022 2023 2024 2025 2026 2027 2028 2029 2030 2031 2032 2033 2034 2035 2036 2037 2038 2039 2040 2041 2042 2043 2044 2045 2046 2047 2048
Ngrid BCA
Daymark
Ngrid EE Screening Tool $80,000 $84,897 $91,895 $80,001 $90,094 $103,490 $80,002 $95,610 $116,548 $80,003 $101,463 $131,253 $80,004 $107,675 $147,814 $80,005 $114,267 $166,465 $80,006 $121,262 $187,469 $80,007 $128,686 $211,123 $80,008 $136,565 $237,762 $80,009 $144,925 $267,762
Synapse/Division $80,000 $84,897 $91,895 $80,001 $90,094 $103,490 $80,002 $95,610 $116,548 $80,003 $101,463 $131,253 $80,004 $107,675 $147,814 $80,005 $114,267 $166,465 $80,006 $121,262 $187,469 $80,007 $128,686 $211,123 $80,008 $136,565 $237,762 $80,009 $144,925 $267,762
Energy Avg 2019 2020 2021 2022 2023 2024 2025 2026 2027 2028 2029 2030 2031 2032 2033 2034 2035 2036 2037 2038 2039 2040 2041 2042 2043 2044 2045 2046 2047 2048
Ngrid BCA $33 $37 $42 $46 $47 $51 $53 $56 $57 $57 $60 $61 $63 $65 $67 $69 $71 $73 $75 $78 $80 $82 $85 $87 $90 $93 $95 $98 $101 $104
Daymark
Ngrid EE Screening Tool
Synapse/Division $33 $37 $42 $46 $47 $51 $53 $56 $57 $57 $60 $61 $63 $65 $67 $69 $71 $73 $75 $78 $80 $82 $85 $87 $90 $93 $95 $98 $101 $104
Energy Peak 2019 2020 2021 2022 2023 2024 2025 2026 2027 2028 2029 2030 2031 2032 2033 2034 2035 2036 2037 2038
Ngrid BCA
Daymark Daymark Email Rec'd 3/16/18 $80 $82 $74 $76 $77 $83 $87 $94 $96 $101 $110 $116 $121 $128 $136 $142 $151 $156 $166 $174
Ngrid EE Screening Tool
Synapse/Division $80 $82 $74 $76 $77 $83 $87 $94 $96 $101 $110 $116 $121 $128 $136 $142 $151 $156 $166 $174
GHG MWh 2019 2020 2021 2022 2023 2024 2025 2026 2027 2028 2029 2030 2031 2032 2033 2034 2035 2036 2037 2038 2039 2040 2041 2042 2043 2044 2045 2046 2047 2048
Ngrid BCA $49 $49 $49 $48 $48 $47 $47 $46 $46 $45 $45 $44 $54 $55 $56 $58 $59 $60 $61 $62 $63 $65 $66 $67 $69 $70 $71 $73 $74
Daymark na
Ngrid EE Screening Tool ‐‐‐
Synapse/Division $49 $49 $49 $48 $48 $47 $47 $46 $46 $45 $45 $44 $54 $55 $56 $58 $59 $60 $61 $62 $63 $65 $66 $67 $69 $70 $71 $73 $74 $0
GHG tons 2019 2020 2021 2022 2023 2024 2025 2026 2027 2028 2029 2030 2031 2032 2033 2034 2035 2036 2037 2038 2039 2040 2041 2042 2043 2044 2045 2046 2047
Ngrid BCA $86 $86 $86 $85 $84 $84 $83 $82 $81 $80 $79 $78 $96 $98 $99 $101 $103 $106 $108 $110 $112 $114 $116 $119 $121 $124 $126 $128 $131
Daymark na
Ngrid EE Screening Tool ‐‐‐
Synapse/Division $86 $86 $86 $85 $84 $84 $83 $82 $81 $80 $79 $78 $96 $98 $99 $101 $103 $106 $108 $110 $112 $114 $116 $119 $121 $124 $126 $128 $131
Basis Points 2019 Basis Points 2020 Basis Points 2021
2019 2020 2021
Basis Points Bps Ngrid $59,493 $60,526 $63,602
($/MW‐yr)
($/MWh)
($/MWh)
$/metric tonne
($/MWh)
($/MW‐yr)
($/MW‐yr)
Cumulative Outcomes less Deadband
Demand Response ‐ Residential
Incremental Outcomes less Deadband
Peak Demand MW
Non‐Wires Alternatives
Demand Response ‐ C&I
Electric Heat Initiative
Electric Vehicle Initiative
Behind‐the‐Meter Storage
Utility‐Scale Storage
266

Source: RIPDUC_2018_PeakLoadReduction_Summary_v1 (Received from Daymark 3/16/18)
Values calculated for 2.5% peak reduction
2019 2020 2021 2022 2023 2024 2025 2026 2027 2028 2029 2030 2031 2032 2033 2034 2035 2036 2037 2038
$/MW Generation Capacity -$ -$ -$ 55,042$ 55,936$ 62,393$ 64,297$ 69,950$ 75,749$ 84,529$ 102,516$ 97,070$ 108,661$ 111,185$ 114,424$ 117,749$ 121,160$ 124,661$ 128,254$ 131,940$
$/MW Transmission Capacity 124,913$ 133,170$ 141,612$ 150,390$ 159,312$ 168,380$ 177,593$ 186,950$ 196,453$ 206,100$ 215,893$ 225,830$ 235,913$ 246,141$ 256,513$ 267,031$ 277,693$ 288,501$ 299,454$ 310,551$
$/MWh Energy 80$ 82$ 74$ 76$ 77$ 83$ 87$ 94$ 96$ 101$ 110$ 116$ 121$ 128$ 136$ 142$ 151$ 156$ 166$ 174$
267

The Narragansett Electric Company
d/b/a National Grid
RIPUC Docket No. 4780
Attachment DIV 1-1-3
Page 7 of 22
Source: Attachment DIV-1-1-3
Input Rhode Island Power Sector Transformation | Benefit-Cost Analysis (BCA) Models | Inputs - General
General assumptions applied to investment categories
Inputs - GeneralReturn to Contents -->
General Assumptions
Assumption Value Unit Source
Line Losses 8.0% % AESC 2015, p. 286. ISO Distribution Losses.
Wholesale Risk Premium (WRP) 9.0% % AESC 2015. Appendix B
Distribution Losses 8.0% % AESC 2015. Appendix B
Real Discount Rate 1.4% % AESC 2015. Appendix B
Percent of Capacity Bid into FCM (%Bid) 75.0% % AESC 2015. Appendix B
After-tax WACC 7.5% % See email from Josh Nowak
Inflation Rate 2.0% %
Emissions Assumptions
Assumption Value Unit Source Comments
CO2 Grid Emissions Factors 1029 lbs / MWh http://www.neep.org/sites/default/files/Emission_Factors_Annu1 short ton = 1 US ton = 2,000 lbs
SO2 Grid Emissions Factor 0.17 lbs / MWh http://www.neep.org/sites/default/files/Emission_Factors_Annu1 short ton = 1 US ton = 2,000 lbs
NOX Grid Emissions Factor 0.35 lbs / MWh http://www.neep.org/sites/default/files/Emission_Factors_Annu1 short ton = 1 US ton = 2,000 lbs
NE-ISO Off-Peak LMU Marginal CO2 Emission rate 832 lbs / MWh 2015 ISO New England Electric Generator Air Emissions Report, Table 5.3, https://www.iso-ne.com/static-assets/documen
NE-ISO On-Peak LMU Marginal CO2 Emission rate 891 lbs / MWh 2015 ISO New England Electric Generator Air Emissions Report, Table 5.3, https://www.iso-ne.com/static-assets/documen
Unit Conversions
Assumption Value Unit Source
Pounds to Tons conversion 0.0005 # Standard value
kg to pounds conversion 2.2046
kWh to MWh conversion 1000
Time Assumptions
Assumption Unit Source Comments 2018 2019 2020 2021 2022 2023 2024 2025 2026 2027 2028 2029 2030 2031 2032 2033 2034 2035 2036 2037 2038 2039 2040 2041 2042 2043 2044 2045 2046 2047
CO2 Abatement Cost $ / short ton 2015 AESC. Exhibit 4-7 AESC duration terminated at 2030. Kept same value through 2042 100.00 100.00 100.00 100.00 100.00 100.00 100.00 100.00 100.00 100.00 100.00 100.00 100.00 100.00 100.00 100.00 100.00 100.00 100.00 100.00 100.00 100.00 100.00 100.00 100.00 100.00 100.00 100.00 100.00 100.00
Embedded Cost in Electric Energy Market Prices $ / short ton 2015 AESC. Exhibit 4-7 AESC duration terminated at 2030. Projected linear trend through 2042 8.47 9.32 10.16 12.54 14.92 17.30 19.67 22.05 24.43 26.80 29.18 31.56 33.94 20.11 20.12 20.13 20.14 20.15 20.16 20.17 20.18 20.19 20.20 20.21 20.22 20.23 20.24 20.25 20.26 20.27
Non-embedded CO2 Costs (pre-inflation) $ / short ton 2015 AESC. Exhibit 4-7 91.53 90.68 89.84 87.46 85.08 82.70 80.33 77.95 75.57 73.20 70.82 68.44 66.06 79.89 79.88 79.87 79.86 79.85 79.84 79.83 79.82 79.81 79.80 79.79 79.78 79.77 79.76 79.75 79.74 79.73
Non-embedded CO2 Costs (post-inflation) $ / short ton 2015 AESC. Exhibit 4-7 93.36 94.34 95.34 94.67 93.94 93.13 92.27 91.33 90.31 89.23 88.06 86.80 85.46 105.41 107.51 109.64 111.82 114.04 116.31 118.62 120.98 123.38 125.84 128.34 130.89 133.49 136.14 138.85 141.61 144.42
Non-embedded CO2 Costs (pre-inflation) $ / MWh Calculated 47.09 46.65 46.22 45.00 43.77 42.55 41.33 40.11 38.88 37.66 36.44 35.21 33.99 41.10 41.10 41.09 41.09 41.08 41.08 41.07 41.07 41.06 41.06 41.05 41.05 41.04 41.04 41.03 41.03 41.02
Non-embedded CO2 Costs (post-inflation) $ / MWh Calculated 48.03 48.54 49.05 48.71 48.33 47.92 47.47 46.99 46.47 45.91 45.30 44.66 43.97 54.23 55.31 56.41 57.53 58.68 59.84 61.03 62.24 63.48 64.74 66.03 67.34 68.68 70.05 71.44 72.86 74.30
SO2 & NOx Emissions Factors - non-electric fuels
Fuel Source
Reported Unit SO2 Constant S value SO2 NOx MMBTU Short Tons SO2 NOx
Natural Gas lb/million cuft 0.6 2000 0.6 94 1032 2000 2.907E-07 4.55426E-05 0.000581395 EPA
Propane lb/thousand gallons 0.1 0.54 0.054 13 91.333 2000 2.9562E-07 7.11681E-05 0.000591243 https://www3
Fuel Oil lb/thousand gallons 142 0.003 42.6 18 138.5 2000 0.00015379 6.49819E-05 0.307581227 https://www3
SO2 and NOX - AESC 2015 Update
Source: AESC 2015 Exhibit 4.1. Emission Allowance Prices per Short Ton. AESC notes pulled from SNL Financial.
NOX & SO2 Costs (pre-inflation)
Year 2015$ 2017$ 2015$ 2017$ 2018 2019 2020 2021 2022 2023 2024 2025 2026 2027 2028 2029 2030 2031 2032 2033 2034 2035 2036 2037 2038 2039 2040 2041 2042 2043 2044 2045 2046 2047
2015 10 10 1.11 1.11 NOX Cost 10.61208 10.8243216 11.04080803 11.26162419 11.4868567 11.7165938 11.9509257 12.1899442 12.4337431 12.6824179 12.9360663 13.1947876 13.4586834 13.7278571 14.0024142 14.2824625 14.5681117 14.859474 15.1566634 15.4597967 15.7689926 16.0843725 16.4060599 16.7341811 17.0688648 17.4102421 17.7584469 18.1136158 18.4758882 18.84541
2016 10 10.2 1.11 1.1322 SO2 Cost 1.17794088 1.2014997 1.225529692 1.250040285 1.27504109 1.30054191 1.32655275 1.35308381 1.38014548 1.40774839 1.43590336 1.46462143 1.49391386 1.52379213 1.55426798 1.58535333 1.6170604 1.64940161 1.68238964 1.71603743 1.75035818 1.78536535 1.82107265 1.85749411 1.89464399 1.93253687 1.97118761 2.01061136 2.05082359 2.09184
2017 10 10.404 1.11 1.154844
2018 10 10.61208 1.11 1.17794088 NOX & SO2 Costs (post-inflation)
2019 10 10.8243216 1.11 1.201499698 2018 2019 2020 2021 2022 2023 2024 2025 2026 2027 2028 2029 2030 2031 2032 2033 2034 2035 2036 2037 2038 2039 2040 2041 2042 2043 2044 2045 2046 2047
2020 10 11.04080803 1.11 1.225529692 NOX Cost 10.8243216 11.2616242 11.71659381 12.1899442 12.6824179 13.1947876 13.7278571 14.2824625 14.859474 15.4597967 16.0843725 16.7341811 17.4102421 18.1136158 18.8454059 19.6067603 20.3988734 21.2229879 22.0803966 22.9724447 23.9005314 24.8661129 25.8707039 26.9158803 28.0032819 29.1346144 30.3116529 31.5362436 32.8103079 34.13584
2021 10 11.26162419 1.11 1.250040285 SO2 Cost 1.201499698 1.25004029 1.300541913 1.353083806 1.40774839 1.46462143 1.52379213 1.58535333 1.64940161 1.71603743 1.78536535 1.85749411 1.93253687 2.01061136 2.09184006 2.1763504 2.26427495 2.35575166 2.45092403 2.54994136 2.65295899 2.76013853 2.87164813 2.98766271 3.10836429 3.2339422 3.36459347 3.50052304 3.64194418 3.789079
2022 10 11.48685668 1.11 1.275041091
2023 10 11.71659381 1.11 1.300541913
2024 10 11.95092569 1.11 1.326552751
2025 10 12.1899442 1.11 1.353083806
2026 10 12.43374308 1.11 1.380145482
2027 10 12.68241795 1.11 1.407748392
2028 10 12.9360663 1.11 1.43590336
2029 10 13.19478763 1.11 1.464621427
2030 10 13.45868338 1.11 1.493913856
2031 10 13.72785705 1.11 1.523792133
2032 10 14.00241419 1.11 1.554267975
2033 10 14.28246248 1.11 1.585353335
2034 10 14.56811173 1.11 1.617060402
2035 10 14.85947396 1.11 1.64940161
2036 10 15.15666344 1.11 1.682389642
2037 10 15.45979671 1.11 1.716037435
2038 10 15.76899264 1.11 1.750358183
2039 10 16.08437249 1.11 1.785365347
2040 10 16.40605994 1.11 1.821072654
2041 10 16.73418114 1.11 1.857494107
2042 10 17.06886477 1.11 1.894643989
2043 10 17.41024206 1.11 1.932536869
2044 10 17.7584469 1.11 1.971187606
2045 10 18.11361584 1.11 2.010611358
2046 10 18.47588816 1.11 2.050823586
2047 10 18.84540592 1.11 2.091840057
Avoided Unit Cost of Electric Capacity
Source AESC 2015 Update, Appendix B
Period Unit Value Source 2018 2019 2020 2021 2022 2023 2024 2025 2026 2027 2028 2029 2030 2031 2032 2033 2034 2035 2036 2037 2038 2039 2040 2041 2042 2043 2044 2045 2046 20472018 $/kW-yr 0 AESC 2015 Update-Appendix B Avoided Capacity Cost - - - - 137.44 129.15 134.50 148.24 162.28 175.80 189.64 204.51 224.61 233.55 233.55 233.55 233.55 233.55 233.55 233.55 233.55 233.55 233.55 233.55 233.55 233.55 233.55 233.55 233.55 233.55
2019 $/kW-yr 0 AESC 2015 Update-Appendix B
2020 $/kW-yr 0 AESC 2015 Update-Appendix B
2021 $/kW-yr 0 AESC 2015 Update-Appendix B Inflation 2%
2022 $/kW-yr 137.4430625 AESC 2015 Update-Appendix B Conversion to MW 1000
2023 $/kW-yr 129.149657 AESC 2015 Update-Appendix B2024 $/kW-yr 134.4992808 AESC 2015 Update-Appendix B Avoided Capacity Cost - - - - 151,748.25 145,443.49 ####### ####### ####### ####### ####### ####### ####### ####### ####### ####### ####### ####### ####### ####### ####### ####### ####### ####### ####### ####### ####### ####### ####### #######
2025 $/kW-yr 148.2384617 AESC 2015 Update-Appendix B
2026 $/kW-yr 162.2792734 AESC 2015 Update-Appendix B
2027 $/kW-yr 175.7974832 AESC 2015 Update-Appendix B
2028 $/kW-yr 189.6410963 AESC 2015 Update-Appendix B
2029 $/kW-yr 204.5142091 AESC 2015 Update-Appendix B
2030 $/kW-yr 224.6053249 AESC 2015 Update-Appendix B
2031 $/kW-yr 233.5542486 AESC 2015 Update-Appendix B
2032 $/kW-yr 233.5542486 AESC 2015 Update-Appendix B
2033 $/kW-yr 233.5542486 AESC 2015 Update-Appendix B
2034 $/kW-yr 233.5542486 AESC 2015 Update-Appendix B
2035 $/kW-yr 233.5542486 AESC 2015 Update-Appendix B
2036 $/kW-yr 233.5542486 AESC 2015 Update-Appendix B
2037 $/kW-yr 233.5542486 AESC 2015 Update-Appendix B
2038 $/kW-yr 233.5542486 AESC 2015 Update-Appendix B
2039 $/kW-yr 233.5542486 AESC 2015 Update-Appendix B
2040 $/kW-yr 233.5542486 AESC 2015 Update-Appendix B
2041 $/kW-yr 233.5542486 AESC 2015 Update-Appendix B
2042 $/kW-yr 233.5542486 AESC 2015 Update-Appendix B
2043 $/kW-yr 233.5542486 AESC 2015 Update-Appendix B
2044 $/kW-yr 233.5542486 AESC 2015 Update-Appendix B
2045 $/kW-yr 233.5542486 AESC 2015 Update-Appendix B
2046 $/kW-yr 233.5542486 AESC 2015 Update-Appendix B
2047 $/kW-yr 233.5542486 AESC 2015 Update-Appendix B
Avoided Unit Cost of Energy
Source AESC 2015 Update, Appendix B
Period Units Winter Peak Winter Off Peak Summer Peak
Summer Off
Peak
Electric Heat
Weighted Avg. Simple Average $/MWh Year
2018 $/kWh 0.042948462 0.036876354 0.028704835 0.02178498 0.032578658 0.032578658 32.58 2018
2019 $/kWh 0.046553286 0.04066292 0.033877957 0.026867315 0.03699037 0.03699037 36.99 2019
2020 $/kWh 0.050901503 0.043353232 0.042024216 0.030786197 0.041766287 0.041766287 41.77 2020
2021 $/kWh 0.055575249 0.047862525 0.044949693 0.034145396 0.045633216 0.045633216 45.63 2021
2022 $/kWh 0.056916434 0.048943738 0.046748022 0.03582828 0.047109119 0.047109119 47.11 2022
lbs/MMBTU
NOX SO2
Physical Units Conversion Factors Short Tons/MMBTU
268

The Narragansett Electric Company
d/b/a National Grid
RIPUC Docket No. 4780
Attachment DIV 1-1-3
Page 8 of 22
2023 $/kWh 0.060706346 0.052195695 0.050601754 0.039739327 0.050810781 0.050810781 50.81 2023
2024 $/kWh 0.063356121 0.054474697 0.053075039 0.043059944 0.05349145 0.05349145 53.49 2024
2025 $/kWh 0.065459372 0.056791445 0.057419018 0.045059684 0.05618238 0.05618238 56.18 2025
2026 $/kWh 0.065377361 0.056618223 0.058916675 0.045774345 0.056671651 0.056671651 56.67 2026
2027 $/kWh 0.066370041 0.057470526 0.059460932 0.04649156 0.057448265 0.057448265 57.45 2027
2028 $/kWh 0.067678713 0.058651355 0.063320806 0.048644215 0.059573772 0.059573772 59.57 2028
2029 $/kWh 0.069197745 0.060328826 0.065926997 0.050250116 0.061425921 0.061425921 61.43 2029
2030 $/kWh 0.070740047 0.06252036 0.067778112 0.051705298 0.063185955 0.063185955 63.19 2030
2031 $/kWh 0.071133805 0.063467611 0.073302463 0.05315417 0.065264512 0.065264512 65.26 2031
2032 $/kWh 0.072344541 0.064933877 0.076576345 0.05476718 0.067155486 0.067155486 67.16 2032
2033 $/kWh 0.073575886 0.066434018 0.079996448 0.056429138 0.069108872 0.069108872 69.11 2033
2034 $/kWh 0.074828188 0.067968815 0.083569301 0.05814153 0.071126959 0.071126959 71.13 2034
2035 $/kWh 0.076101805 0.069539071 0.087301728 0.059905886 0.073212123 0.073212123 73.21 2035
2036 $/kWh 0.0773971 0.071145603 0.091200854 0.061723783 0.075366835 0.075366835 75.37 2036
2037 $/kWh 0.078714442 0.072789251 0.095274126 0.063596846 0.077593666 0.077593666 77.59 20372038 $/kWh 0.080054206 0.074470871 0.099529321 0.065526748 0.079895286 0.079895286 79.90 2038
2039 $/kWh 0.081416773 0.076191341 0.103974564 0.067515215 0.082274473 0.082274473 82.27 2039
2040 $/kWh 0.082802531 0.077951558 0.108618344 0.069564024 0.084734114 0.084734114 84.73 2040
2041 $/kWh 0.084211876 0.079752441 0.113469527 0.071675006 0.087277212 0.087277212 87.28 2041
2042 $/kWh 0.085645209 0.081594929 0.118537377 0.073850047 0.08990689 0.08990689 89.91 2042
2043 $/kWh 0.087102938 0.083479983 0.12383157 0.076091092 0.092626396 0.092626396 92.63 2043
2044 $/kWh 0.088585479 0.085408586 0.129362216 0.078400143 0.095439106 0.095439106 95.44 2044
2045 $/kWh 0.090093253 0.087381746 0.135139876 0.080779265 0.098348535 0.098348535 98.35 2045
2046 $/kWh 0.09162669 0.08940049 0.141175581 0.083230583 0.101358336 0.101358336 101.36 2046
2047 $/kWh 0.093186227 0.091465873 0.147480857 0.085756288 0.104472311 0.104472311 104.47 2047
269

The Narragansett Electric Company
d/b/a National Grid
RIPUC Docket No. 4780
Attachment DIV 1-1-3
Page 9 of 22
Avoided Energy Costs Electric Heat and Electric Vehicles Weighted Average
Seasonal Avoided Energy Costs (pre-inflation)
Period 2018 2019 2020 2021 2022 2023 2024 2025 2026 2027 2028 2029 2030 2031 2032 2033 2034 2035 2036 2037 2038 2039 2040 2041 2042 2043 2044 2045 2046 2047
Winter On-Peak 0.042948462 0.046553286 0.050901503 0.055575249 0.056916434 0.060706346 0.063356121 0.06545937 0.065377361 0.066370041 0.06767871 0.06919774 0.07074005 0.0711338 0.07234454 0.07357589 0.07482819 0.07610181 0.0773971 0.07871444 0.08005421 0.08141677 0.08280253 0.08421188 0.08564521 0.08710294 0.08858548 0.09009325 0.09162669 0.09318623
Winter Off-Peak 0.036876354 0.04066292 0.043353232 0.047862525 0.048943738 0.052195695 0.054474697 0.05679145 0.056618223 0.057470526 0.05865135 0.06032883 0.06252036 0.06346761 0.06493388 0.06643402 0.06796882 0.06953907 0.0711456 0.07278925 0.07447087 0.07619134 0.07795156 0.07975244 0.08159493 0.08347998 0.08540859 0.08738175 0.08940049 0.09146587
Summer On-Peak 0.028704835 0.033877957 0.042024216 0.044949693 0.046748022 0.050601754 0.053075039 0.05741902 0.058916675 0.059460932 0.06332081 0.065927 0.06777811 0.07330246 0.07657635 0.07999645 0.0835693 0.08730173 0.09120085 0.09527413 0.09952932 0.10397456 0.10861834 0.11346953 0.11853738 0.12383157 0.12936222 0.13513988 0.14117558 0.14748086
Summer Off-Peak 0.02178498 0.026867315 0.030786197 0.034145396 0.03582828 0.039739327 0.043059944 0.04505968 0.045774345 0.04649156 0.04864421 0.05025012 0.0517053 0.05315417 0.05476718 0.05642914 0.05814153 0.05990589 0.06172378 0.06359685 0.06552675 0.06751522 0.06956402 0.07167501 0.07385005 0.07609109 0.07840014 0.08077926 0.08323058 0.08575629
Seasonal and Peak Segmentation
Winter months / year 8
Summer months / year 4
Hours / year 8760
On-peak hours / day 16
Off-peak hours / day 8
Season On-Peak Off-Peak Total
Winter 3,893.33 1,946.67 5,840.00
Summer 1,946.67 973.33 2,920.00
Electric Heat & EV Seasonal Load Segmentation
Season Ratio
Summer Off-Peak 11.11%
Summer On-Peak 22.22%
Winter Off-Peak 22.22%
Winter On-Peak 44.44%
100.00%
Weighted Average Annual Price (pre-inflation & WRP)
2018 2019 2020 2021 2022 2023 2024 2025 2026 2027 2028 2029 2030 2031 2032 2033 2034 2035 2036 2037 2038 2039 2040 2041 2042 2043 2044 2045 2046 2047
Hourly Wght. Avg. YOY 0.0361 0.0402 0.0450 0.0491 0.0505 0.0542 0.0568 0.0595 0.0598 0.0606 0.0626 0.0644 0.0661 0.0679 0.0697 0.0715 0.0734 0.0753 0.0773 0.0794 0.0815 0.0837 0.0860 0.0883 0.0907 0.0932 0.0958 0.0985 0.1012 0.1040
Add MRP & Inflation
MRP 1.09
Inflation 0.02
Weighted Average Annual Price (pre-inflation & WRP)
2018 2019 2020 2021 2022 2023 2024 2025 2026 2027 2028 2029 2030 2031 2032 2033 2034 2035 2036 2037 2038 2039 2040 2041 2042 2043 2044 2045 2046 2047
Hourly Wght. Avg. YOY 0.0401 0.0456 0.0521 0.0580 0.0608 0.0666 0.0712 0.0760 0.0779 0.0806 0.0848 0.0890 0.0933 0.0977 0.1022 0.1070 0.1120 0.1173 0.1228 0.1286 0.1347 0.1411 0.1478 0.1549 0.1623 0.1701 0.1783 0.1869 0.1959 0.2054
Avoided REC Cost
Source AESC 2015 Update, Appendix B
Period Units Value 2018 2019 2020 2021 2022 2023 2024 2025 2026 2027 2028 2029 2030 2031 2032 2033 2034 2035 2036 2037 2038 2039 2040 2041 2042 2043 2044 2045 2046 2047
2018 $/kWh 0.005508139 Avoided Capacity Cost (pre 0.0055 0.0060 0.0057 0.0068 0.0065 0.0061 0.0058 0.0054 0.0050 0.0046 0.0042 0.0046 0.0043 0.0043 0.0043 0.0043 0.0043 0.0043 0.0043 0.0043 0.0043 0.0043 0.0043 0.0043 0.0043 0.0043 0.0043 0.0043 0.0043 0.0043
2019 $/kWh 0.005958249
2020 $/kWh 0.005659665 MRP 1.09
2021 $/kWh 0.00680032 Inflation 2%
2022 $/kWh 0.006509963 Convert to MW 1,000.00
2023 $/kWh 0.006051674
2024 $/kWh 0.005772086
2025 $/kWh 0.005405181
2026 $/kWh 0.004985127 Avoided Capacity Cost (pos 6.12 6.76 6.55 8.02 7.83 7.43 7.23 6.90 6.49 6.09 5.70 6.30 6.00 6.12 6.24 6.36 6.49 6.62 6.75 6.89 7.03 7.17 7.31 7.46 7.61 7.76 7.91 8.07 8.23 8.40
2027 $/kWh 0.004586611
2028 $/kWh 0.004206788
2029 $/kWh 0.004558828
2030 $/kWh 0.004253013
2031 $/kWh 0.004253013
2032 $/kWh 0.004253013
2033 $/kWh 0.004253013
2034 $/kWh 0.004253013
2035 $/kWh 0.004253013
2036 $/kWh 0.004253013
2037 $/kWh 0.004253013
2038 $/kWh 0.004253013
2039 $/kWh 0.004253013
2040 $/kWh 0.004253013
2041 $/kWh 0.004253013
2042 $/kWh 0.004253013
2043 $/kWh 0.004253013
2044 $/kWh 0.004253013
2045 $/kWh 0.004253013
2046 $/kWh 0.004253013
2047 $/kWh 0.004253013
DRIPE
Source AESC 2015 Update, Appendix B
Energy
Period Unit Winter Peak Winter Off Peak Summer Peak
Summer Off
Peak
Electric Heat -Wgt.
Avg.
Seasonal
Weighted
Average
Energy
Storage -
Wgt. Avg.
2018 $/kWh 1.25566E-06 5.06517E-07 0 0 4.40545E-07 7.3969E-07 8.12081E-07
2019 $/kWh 0 0 0 0 0 0 0
2020 $/kWh 0 0 0 0 0 0 0Capacity
Period Unit Winter Summer tric Heat - Weighted Ave
2018 $/kWh 0.001583956 0.00103838 0.001311168 0.00136285 0.001402097
2019 $/kWh 0.001012791 0.00068337 0.00084808 0.000879286 0.000902984
2020 $/kWh 0.000991781 0.000669757 0.000830769 0.000861274 0.00088444
2021 $/kWh 0.000179686 0.000165304 0.000172495 0.000173857 0.000174892
2022 $/kWh 0.000179201 0.000164577 0.000171889 0.000173274 0.000174326
2023 $/kWh 0.000178737 0.000163881 0.000171309 0.000172717 0.000173785
2024 $/kWh 0.000178182 0.000163048 0.000170615 0.000172049 0.000173137
2025 $/kWh 0.00017763 0.000162221 0.000169925 0.000171385 0.000172494
2026 $/kWh 0.000177082 0.000161399 0.000169241 0.000170726 0.000171855
2027 $/kWh 0.000176538 0.000160583 0.00016856 0.000170072 0.00017122
2028 $/kWh 0.000175998 0.000159772 0.000167885 0.000169422 0.000170589
2029 $/kWh 0.000175461 0.000158967 0.000167214 0.000168776 0.000169963
2030 $/kWh 0.000174928 0.000158167 0.000166548 0.000168135 0.000169341
2031 $/kWh 0.000174928 0.000158167 0.000166548 0.000168135 0.000169341
2032 $/kWh 0.000174928 0.000158167 0.000166548 0.000168135 0.000169341
2033 $/kWh 0.000174928 0.000158167 0.000166548 0.000168135 0.000169341
2034 $/kWh 0.000174928 0.000158167 0.000166548 0.000168135 0.000169341
2035 $/kWh 0.000174928 0.000158167 0.000166548 0.000168135 0.000169341
2036 $/kWh 0.000174928 0.000158167 0.000166548 0.000168135 0.000169341
2037 $/kWh 0.000174928 0.000158167 0.000166548 0.000168135 0.000169341
2038 $/kWh 0.000174928 0.000158167 0.000166548 0.000168135 0.000169341
2039 $/kWh 0.000174928 0.000158167 0.000166548 0.000168135 0.000169341
2040 $/kWh 0.000174928 0.000158167 0.000166548 0.000168135 0.000169341
2041 $/kWh 0.000174928 0.000158167 0.000166548 0.000168135 0.000169341
2042 $/kWh 0.000174928 0.000158167 0.000166548 0.000168135 0.000169341
2043 $/kWh 0.000174928 0.000158167 0.000166548 0.000168135 0.000169341
2044 $/kWh 0.000174928 0.000158167 0.000166548 0.000168135 0.000169341
2045 $/kWh 0.000174928 0.000158167 0.000166548 0.000168135 0.000169341
2046 $/kWh 0.000174928 0.000158167 0.000166548 0.000168135 0.000169341
2047 $/kWh 0.000174928 0.000158167 0.000166548 0.000168135 0.000169341
Electric Heat and Electric Vehicles - DRIPE (pre-inflation)
2018 2019 2020 2021 2022 2023 2024 2025 2026 2027 2028 2029 2030 2031 2032 2033 2034 2035 2036 2037 2038 2039 2040 2041 2042 2043 2044 2045 2046 2047
Energy 4.40545E-07 0 0
Capacity 0.001311168 0.00084808 0.000830769 0.000172495 0.000171889 0.000171309 0.000170615 0.00016993 0.000169241 0.00016856 0.00016788 0.00016721 0.00016655 0.00016655 0.00016655 0.00016655 0.00016655 0.00016655 0.00016655 0.00016655 0.00016655 0.00016655 0.00016655 0.00016655 0.00016655 0.00016655 0.00016655 0.00016655 0.00016655 0.00016655
Total DRIPE 0.001311609 0.00084808 0.000830769 0.000172495 0.000171889 0.000171309 0.000170615 0.00016993 0.000169241 0.00016856 0.00016788 0.00016721 0.00016655 0.00016655 0.00016655 0.00016655 0.00016655 0.00016655 0.00016655 0.00016655 0.00016655 0.00016655 0.00016655 0.00016655 0.00016655 0.00016655 0.00016655 0.00016655 0.00016655 0.00016655
Inflation 2%
Conversion to MW 1,000.00
Electric Heat DRIPE (post inflation)
2018 2019 2020 2021 2022 2023 2024 2025 2026 2027 2028 2029 2030 2031 2032 2033 2034 2035 2036 2037 2038 2039 2040 2041 2042 2043 2044 2045 2046 2047
Total DRIPE 1.337840737 0.882342644 0.881618693 0.186713876 0.189779136 0.19292199 0.195982934 0.19909469 0.202258148 0.205474195 0.20874375 0.21206773 0.2154471 0.21975604 0.22415116 0.22863418 0.23320687 0.237871 0.24262842 0.24748099 0.25243061 0.25747922 0.26262881 0.26788139 0.27323901 0.27870379 0.28427787 0.28996343 0.2957627 0.30167795
Solar - Seasonal Weighted
Average
Energy Storage -
Wgt. Avg.
270

The Narragansett Electric Company
d/b/a National Grid
RIPUC Docket No. 4780
Attachment DIV 1-1-3
Page 10 of 22
Solar DRIPE
Solar DRIPE (pre-inflation) 2018 2019 2020 2021 2022 2023 2024 2025 2026 2027 2028 2029 2030 2031 2032 2033 2034 2035 2036 2037 2038 2039 2040 2041 2042 2043 2044 2045 2046 2047
Energy 7.39688E-07 0 0
Capacity 0.00136285 0.000879286 0.000861274 0.000173857 0.000173274 0.000172717 0.000172049 0.00017139 0.000170726 0.000170072 0.00016942 0.00016878 0.00016814 0.00016814 0.00016814 0.00016814 0.00016814 0.00016814 0.00016814 0.00016814 0.00016814 0.00016814 0.00016814 0.00016814 0.00016814 0.00016814 0.00016814 0.00016814 0.00016814 0.00016814
Total DRIPE 0.00136359 0.000879286 0.000861274 0.000173857 0.000173274 0.000172717 0.000172049 0.00017139 0.000170726 0.000170072 0.00016942 0.00016878 0.00016814 0.00016814 0.00016814 0.00016814 0.00016814 0.00016814 0.00016814 0.00016814 0.00016814 0.00016814 0.00016814 0.00016814 0.00016814 0.00016814 0.00016814 0.00016814 0.00016814 0.00016814
Inflation 2%
Conversion to MW 1,000.00
Solar DRIPE (post-inflation)
2018 2019 2020 2021 2022 2023 2024 2025 2026 2027 2028 2029 2030 2031 2032 2033 2034 2035 2036 2037 2038 2039 2040 2041 2042 2043 2044 2045 2046 2047
Total DRIPE 1.39086186 0.914809363 0.913991069 0.188188586 0.19130869 0.194506868 0.197629728 0.20080504 0.20403371 0.207316685 0.21065491 0.21404936 0.21750102 0.22185104 0.22628807 0.23081383 0.2354301 0.24013871 0.24494148 0.24984031 0.25483712 0.25993386 0.26513254 0.27043519 0.27584389 0.28136077 0.28698798 0.29272774 0.2985823 0.30455394
Solar - Seasonal Demand by System Type
Season
Sum of 250 kW
System - Annual
Output (MW)
Sum of 500 kW
System - Annual
Output (MW)
Sum of 1,500 kW System - Annual Output
(MW)
Summer Off-Peak 1% 1% 1%
Summer On-Peak 39% 39% 39%
Winter Off-Peak 1% 1% 1%
Winter On-Peak 59% 59% 59%
Total 1 1 1
271

The Narragansett Electric Company
d/b/a National Grid
RIPUC Docket No. 4780
Attachment DIV 1-1-3
Page 11 of 22
Energy Storage DRIPE (pre-inflation)
Energy Storage DRIPE (pre-inflation) 2018 2019 2020 2021 2022 2023 2024 2025 2026 2027 2028 2029 2030 2031 2032 2033 2034 2035 2036 2037 2038 2039 2040 2041 2042 2043 2044 2045 2046 2047
Energy 8.12081E-07 0 0 0 0 0 0 0 0 0 0 0 0 0 0 0 0 0 0 0 0 0 0 0 0 0 0 0 0 0
Capacity 0.001402097 0.000902984 0.00088444 0.000174892 0.000174326 0.000173785 0.000173137 0.00017249 0.000171855 0.00017122 0.00017059 0.00016996 0.00016934 0.00016934 0.00016934 0.00016934 0.00016934 0.00016934 0.00016934 0.00016934 0.00016934 0.00016934 0.00016934 0.00016934 0.00016934 0.00016934 0.00016934 0.00016934 0.00016934 0.00016934
Total DRIPE 0.001402909 0.000902984 0.00088444 0.000174892 0.000174326 0.000173785 0.000173137 0.00017249 0.000171855 0.00017122 0.00017059 0.00016996 0.00016934 0.00016934 0.00016934 0.00016934 0.00016934 0.00016934 0.00016934 0.00016934 0.00016934 0.00016934 0.00016934 0.00016934 0.00016934 0.00016934 0.00016934 0.00016934 0.00016934 0.00016934
Inflation 2.00%
Convert to MWh 1,000.00
Energy Storage DRIPE (post-inflation) 2018 2019 2020 2021 2022 2023 2024 2025 2026 2027 2028 2029 2030 2031 2032 2033 2034 2035 2036 2037 2038 2039 2040 2041 2042 2043 2044 2045 2046 2047
Total 1.430967683 0.939464253 0.938574317 0.189308465 0.192470217 0.195710408 0.198880287 0.20210385 0.205382054 0.208715853 0.21210623 0.2155542 0.21906076 0.22344197 0.22791081 0.23246903 0.23711841 0.24186077 0.24669799 0.25163195 0.25666459 0.26179788 0.26703384 0.27237452 0.27782201 0.28337845 0.28904601 0.29482693 0.30072347 0.30673794
New England Residential Energy Prices
Energy Prices Residential (Case Reference case Region New England)
https://www.eia.gov/outlooks/aeo/data/browser/#/?id=3-AEO2017®ion=1-1&cases=ref2017~ref_no_cpp&start=2015&end=2050&f=A&linechart=~~
09:51:48 GMT-0400 (Eastern Daylight Time)
Source: U.S. Energy Information Administration
New England Residential Energy Prices
Year
Propane 2016
$/MMBtu
Distillate Fuel Oil
2016 $/MMBtu Natural Gas 2016 $/MMBtu
Electricity 2016
$/MMBtu2015 20.059196 19.634937 12.999855 57.913372
2016 18.986731 15.391558 12.499926 52.962849
2017 19.159531 18.481035 12.559583 53.759666
2018 20.3908 20.35202 12.730404 46.24337
2019 20.428343 21.432173 12.863449 47.102016
2020 20.36684 21.913502 13.038426 45.619492
2021 20.38199 22.292168 13.248834 45.495861
2022 20.818222 22.562029 13.447027 47.376621
2023 21.09973 22.895624 13.598397 49.17429
2024 21.193447 23.217937 13.719156 50.349106
2025 21.149662 23.695726 13.810126 51.765896
2026 21.188416 24.066542 13.868716 52.8061412027 21.388361 24.263973 13.997381 53.399616
2028 21.446894 24.305296 14.186235 53.822887
2029 21.470636 24.524441 14.388145 54.817307
2030 21.637087 24.984591 14.524349 55.649223
2031 22.067629 25.394388 14.584588 55.851391
2032 22.390608 25.889307 14.683081 55.949352
2033 22.452869 25.806747 14.751159 56.23835
2034 22.691654 26.115984 14.936297 56.59457
2035 22.800667 26.332081 15.181598 57.886639
2036 23.140226 26.861704 15.332048 58.283558
2037 23.296213 26.936857 15.496017 58.576546
2038 23.60668 27.103247 15.618446 58.816032
2039 24.046312 27.475222 15.740956 57.837711
2040 24.210247 27.673616 15.790576 59.10891
2041 24.474936 27.717131 15.916462 59.452782
2042 24.614227 27.769522 16.047209 59.981743
2043 24.814363 27.830799 16.209641 60.750565
2044 24.986708 27.928757 16.403036 61.422989
2045 25.068331 28.020597 16.601873 61.820881
2046 25.256636 28.191952 16.78653 62.281025
2047 25.456972 28.537254 16.932384 63.031494
2048 25.692049 28.555511 17.094194 63.291729
2049 25.812935 28.743196 17.232834 63.588299
2050 26.039854 29.019983 17.207699 65.033279
Spot vs. Long-term Fuel Purchases
Category Percent of Total
Discount from
Base Residential
Long-term 10% 10%
Spot Purchase 90% 0%
Total 100% N/A
Source http://www.treesfullofmoney.com/2017-heating-oil-price-predictions/
Assumptions Based on EIA forecast, assume prices are increasing and customers experience historical 5 - 15% savings from pre-buy
Spot vs. Long-term - Natural Gas
Category Percent of Total
Discount from
Base Residential
Long-term 5% 5%
Spot Purchase 95% 0%
Total 100% N/A
Spot vs. Long-term - Natural Gas
Category Percent of Total
Discount from
Base Residential
Long-term 0% 5%
Spot Purchase 100% 0%
Total 100% N/A
Adjusted Residential Fuel Oil Prices Based on Pre-Buy Forecast
2015 2016 2017 2018 2019 2020 2021 2022 2023 2024 2025 2026 2027 2028 2029 2030 2031 2032 2033 2034 2035 2036 2037 2038 2039 2040 2041 2042 2043 2044 2045 2046 2047 2048 2049 2050
Base Distillate Fuel Oil 19.63 15.39 18.48 20.35 21.43 21.91 22.29 22.56 22.90 23.22 23.70 24.07 24.26 24.31 24.52 24.98 25.39 25.89 25.81 26.12 26.33 26.86 26.94 27.10 27.48 27.67 27.72 27.77 27.83 27.93 28.02 28.19 28.54 28.56 28.74 29.02
Base Distillate Fuel Oil - Convert $ / MMBTU to $ / Gallon #REF! #REF! #REF! #REF! #REF! #REF! #REF! #REF! #REF! #REF! #REF! #REF! #REF! #REF! #REF! #REF! #REF! #REF! #REF! #REF! #REF! #REF! #REF! #REF! #REF! #REF! #REF! #REF! #REF! #REF! #REF! #REF! #REF! #REF! #REF! #REF!
Distillate Fuel Oil - Apply Pre-buy Discount #REF! #REF! #REF! #REF! #REF! #REF! #REF! #REF! #REF! #REF! #REF! #REF! #REF! #REF! #REF! #REF! #REF! #REF! #REF! #REF! #REF! #REF! #REF! #REF! #REF! #REF! #REF! #REF! #REF! #REF! #REF! #REF! #REF! #REF! #REF! #REF!
Pre-buy discount 10%
Distillate Fuel Oil - Convert $ / Gallon to $ / MMBTU #REF! #REF! #REF! #REF! #REF! #REF! #REF! #REF! #REF! #REF! #REF! #REF! #REF! #REF! #REF! #REF! #REF! #REF! #REF! #REF! #REF! #REF! #REF! #REF! #REF! #REF! #REF! #REF! #REF! #REF! #REF! #REF! #REF! #REF! #REF! #REF!
Adjusted Residential Natural Gas Prices Based on Pre-Buy Forecast
2015 2016 2017 2018 2019 2020 2021 2022 2023 2024 2025 2026 2027 2028 2029 2030 2031 2032 2033 2034 2035 2036 2037 2038 2039 2040 2041 2042 2043 2044 2045 2046 2047 2048 2049 2050
Base Natural Gas ($ / MMBTU) 13.00 12.50 12.56 12.73 12.86 13.04 13.25 13.45 13.60 13.72 13.81 13.87 14.00 14.19 14.39 14.52 14.58 14.68 14.75 14.94 15.18 15.33 15.50 15.62 15.74 15.79 15.92 16.05 16.21 16.40 16.60 16.79 16.93 17.09 17.23 17.21
Natural Gas - Apply Price Protection Discount 12.96735536 12.46867619 12.52818404 12.69857799 12.83129038 13.00582994 13.2157119 13.41340943 13.56440101 13.6848581 13.7756007 13.8340442 13.9623875 14.1507694 14.3521746 14.4880381 14.5481265 14.6463733 14.7142811 14.8989563 15.143644 15.2937179 15.457277 15.5793999 15.7016036 15.7510996 15.8766708 16.007091 16.1691169 16.3620284 16.5603683 16.7445637 16.890053 17.0514585 17.18975 17.165
Assume pre-buy discount is 5%, with 5% of customers using
Propane 2016 $/MMBtu
2015 2016 2017 2018 2019 2020 2021 2022 2023 2024 2025 2026 2027 2028 2029 2030 2031 2032 2033 2034 2035 2036 2037 2038 2039 2040 2041 2042 2043 2044 2045 2046 2047 2048 2049 2050
Base Propane 2016 $/MMBtu 20.06 18.99 19.16 20.39 20.43 20.37 20.38 20.82 21.10 21.19 21.15 21.19 21.39 21.45 21.47 21.64 22.07 22.39 22.45 22.69 22.80 23.14 23.30 23.61 24.05 24.21 24.47 24.61 24.81 24.99 25.07 25.26 25.46 25.69 25.81 26.04
Propane - Apply Price Discount 20.06 18.99 19.16 20.39 20.43 20.37 20.38 20.82 21.10 21.19 21.15 21.19 21.39 21.45 21.47 21.64 22.07 22.39 22.45 22.69 22.80 23.14 23.30 23.61 24.05 24.21 24.47 24.61 24.81 24.99 25.07 25.26 25.46 25.69 25.81 26.04
Assume pre-buy discount is zero
272

% of standard error: 50% 100% 150.0% 100% 50%
Deadband using Company Baseline - Company Forecast SE Weather-Normalized Peak Demand (with DER Impacts)
Year
Peak - Weather
Norm Actual less
impacts of EE
and PV
Company
Forecast
Company
Targets
(YoY
Reduc)
Company
Target
Peak
Cumulative
Reductions
Company
Forecast SE
Forecast
Less 0.5 SE
Synapse Min
MW
Reductions
Synapse
Target MW
Reductions
Synapse Max
MW
Reductions
Synapse
Med Target
Synaspe
Max Target
Min - MW of
Benefits
Med - MW of
Benefits
Max - MW of
Benefits
Company
Forecast with No
DERs
Company
Forecast with No
DERs Line
Cumulative Load
Growth
Cumulative
EE Reductions
Cumulative
PV
Reductions
Company
Forecast VVO
(Cumulative)
Company
Forecast
Storage
(Cumulative)
Company
Forecast EVs
(Cumulative)
Income
Eligible
Solar
Company
Forecast
After DERs
Cumulative
EE Relative
to 2018
Cumulative
PV Relative
to 2018
Cumulative
Additional
Company
Effort
Company
Target
Incremental
Load
Growth
Increme
ntal EE
Increme
ntal PV
Increme
ntal
VVO
Increment
al Storage
Increme
ntal EVs
Incrementa
l Income
Eligible
Solar
Net
Incremental
Company
Effort
2003 1803 1,813 1,813 (9) 0 0 0 0 0 1,803
2004 1839 1,860 1,860 (21) 0 0 0 0 0 1,839
2005 1772 1,802 1,802 (30) 0 0 0 0 0 1,772
2006 1803 1,844 1,844 (41) 0 0 0 0 0 1,803
2007 1852 1,902 1,902 (51) 0 0 0 0 0 1,852
2008 1817 1,878 1,878 (61) 0 0 0 0 0 1,817
2009 1816 1,893 1,893 (77) 0 0 0 0 0 1,816
2010 1798 1,887 1,887 (89) 0 0 0 0 0 1,798
2011 1817 1,919 1,919 (102) (0) 0 0 0 0 1,817
2012 1822 1,944 1,944 (121) (0) 0 0 0 0 1,822
2013 1817 1,968 1,968 (148) (2) 0 0 0 0 1,817
2014 1811 2,001 2,001 (187) (4) 0 0 0 0 1,811
2015 1850 2,075 2,075 (220) (5) 0 0 0 0 1,850
2016 1778 2,036 2,036 (250) (7) 0 0 0 0 1,778
2017 1723 1723 2,018 2,018 (279) (16) 0 0 0 0 1,723
2018 1706 1706 1706 2,041 2,041 (310) (25) 0 0 0 0 1,706
2019 1682 -29 1677 -4.6 29.2 1667 14.6 29 44 1653 1638 0 15 29 2,063 2,063 22 (340) (32) -2 -1 0 -2 1,686 -35 -7 -5 1,681 22 (31) (7) (2) (1) 0 (2) (26) -5
2020 1661 -26 1651 -9.6 30.6 1646 15.3 31 46 1630 1615 0 15 31 2,087 2,087 46 (369) (39) -3 -2 0 -3 1,671 -70 -14 -10 1,661 24 (29) (7) (1) (1) 0 (1) (20) -5
2021 1642 -26 1625 -16.6 32.0 1626 16.0 32 48 1610 1594 0 16 32 2,109 2,109 68 (395) (42) -5 -3 1 -3 1,662 -104 -18 -16 1,646 22 (26) (3) (2) (1) 1 0 (15) -6
Notes:
Company Forecast = "Reconstituted" less EE, PV, VVO, Storage, + EVs. See Attachment DIV 8-5.
Company Forecast Standard Error: Attachment DIV 8-7-2
Weather-Normalized Peak Demand (with DER Impacts)
Company TargetsDivision …
1,500
1,550
1,600
1,650
1,700
1,750
1,800
1,850
1,900
2003
2004
2005
2006
2007
2008
2009
2010
2011
2012
2013
2014
2015
2016
2017
2018
2019
2020
2021
Peak
Dem
and
(MW
)
Deadband
1,500
1,600
1,700
1,800
1,900
2,000
2,100
2,200
2003
2004
2005
2006
2007
2008
2009
2010
2011
2012
2013
2014
2015
2016
2017
2018
2019
2020
2021
Income Eligible Solar
Company Forecast EVs(Cumulative)
Company Forecast Storage(Cumulative)
Company Forecast VVO(Cumulative)
Cumulative PV Reductions
Cumulative EE Reductions
Company Forecast AfterDERs
Company Forecast with NoDERs Line
Naturally Occurring Load Growth
Incremental EE
Incremental PV
Incremental VVO
Incremental Storage
Incremental EVs
-5 MW
-5 MW
-6 MW
(50)
(40)
(30)
(20)
(10)
0
10
20
30
2019 2020 2021
Incremental Company…
273

Sum of 11 Monthly Peaks
Sum of 11
Monthly % of standard error: 50% 100% 150%
Actuals and Predictions Year Monthly_Peak
Weather-
Norm 11 Mo
Baseline
Company's
YoY Target
Reductions
Company's
Targets
Standard
_Error
Bottom of
Deadband
Synapse
Target
Synapse Min
MW
Reductions
Synapse
Medium
MW
Reductions
Synapse
High MW
Reductions
Min MW for
Benefits Calc
(excl
Deadband)
Med MW for
Benefits Calc
(excl
Deadband)
High MW for
Benefits Calc
(excl
Deadband)2007 15,038 14,924
2008 14,290 14,192
2009 13,420 13,919
2010 15,098 15,253
2011 14,177 14,198
2012 14,380 14,194
2013 14,826 14,462
2014 13,909 13,628
2015 13,990 13,921
2016 13,928 14,121
2017 13,906 14,151
2018 NA 13,843
2019 NA 13,772 36 13,807 228 13,658 13,544 114 228 342 0 114 228
2020 NA 13,701 34 13,773 255 13,573 13,445 128 255 383 0 128 255
2021 NA 13,630 36 13,737 284 13,488 13,346 142 284 425 0 142 284
Division Targets
Company …
12,000
12,500
13,000
13,500
14,000
14,500
15,000
15,500
Sum
of 1
1 M
onth
ly P
eaks
(M
W)
Deadband Sum of 11 Months Transmission Peaks
(Weather-Normalized)
Division Forecast
274
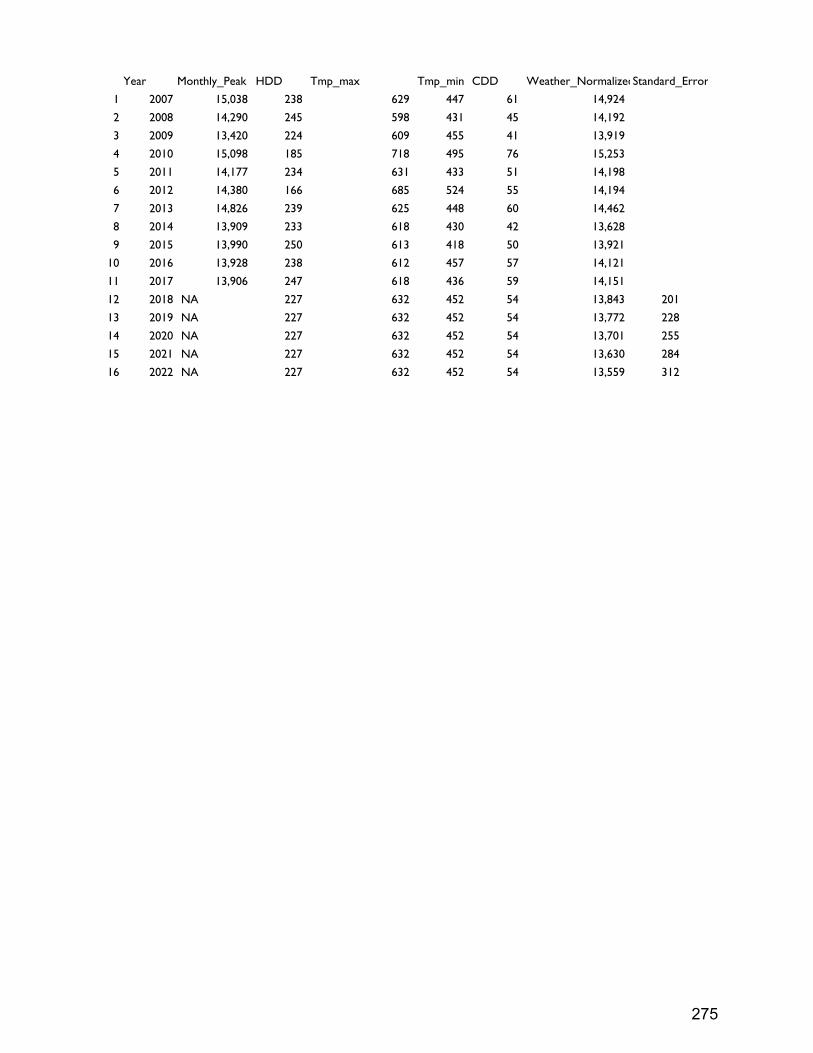
Year Monthly_Peak HDD Tmp_max Tmp_min CDD Weather_NormalizedStandard_Error
1 2007 15,038 238 629 447 61 14,924
2 2008 14,290 245 598 431 45 14,192
3 2009 13,420 224 609 455 41 13,919
4 2010 15,098 185 718 495 76 15,253
5 2011 14,177 234 631 433 51 14,198
6 2012 14,380 166 685 524 55 14,194
7 2013 14,826 239 625 448 60 14,462
8 2014 13,909 233 618 430 42 13,628
9 2015 13,990 250 613 418 50 13,921
10 2016 13,928 238 612 457 57 14,121
11 2017 13,906 247 618 436 59 14,151
12 2018 NA 227 632 452 54 13,843 201
13 2019 NA 227 632 452 54 13,772 228
14 2020 NA 227 632 452 54 13,701 255
15 2021 NA 227 632 452 54 13,630 284
16 2022 NA 227 632 452 54 13,559 312
275

Source: Attachment DIV 8-4
Polk Data - National Grid
Synapse Analysis
RI - Cumulative 2013-201 2017-2021
2010 2011 2012 2013 2014 2015 2016 2017 2018 2019 2020 2021 CAGR CAGR
BEV(PEV) 32 41 117 193 313 483 725 1069 1557 77% 49%
HEV(PHEV) 178 182 413 538 772 1080 1486 2021 2726 44% 37%
210 223 530 731 1085 1563 2211 3090 4283 51% 41%
RI - Incremental 2014-20172014-202
2010 2011 2012 2013 2014 2015 2016 2017 - Annualized 2018 2019 2020 2021 Std Dev 131 359
BEV(PEV) 32 9 76 76 120 170 242 344 488
HEV(PHEV) 178 4 231 125 234 308 406 535 705
210 13 307 201 354 478 648 879 1193
Synapse Forecast + .5 SD 0.5 827 1,058 1,372
Check Forecast + 1 SD 1 1,007 1,238 1,552
Forecast + 1.5 SD 1.5 1,186 1,417 1,731
120% 778 1,055 1,432
140% 907 1,231 1,670
180% 1,166 1,582 2,147
Min 130 176 239
Target 259 352 477
Max 518 703 954
Medium High Medium High Medium High
259 518 352 703 477 954
Tons Avoided/Vehicle 2.15 2.15 2.15 2.15 2.15 2.15
Targets in Tons 556.85 1113.7 756.8 1511.45 1025.55 2051.1
2021
Company Forecast
Company Forecast
Company Gross
Targets
Company Net
Targets
2019 2020
276

1
277

Source: Attachment DIV-1-1-3, Tab "9.EH - BCA Summary"
EH ‐ BCA Su Rhode Island Power Sector Transformation | Benefit‐Cost Analysis (BCA) Models | EH ‐ BCA Summary
EH BCA ratios, comprehensive benefits and costs, and sensitivity analyses
EH ‐ BCA Summary
SCT UCT RIM
Forward Commitment: Capacity Value 832,005$ x x x Forward Commitment: Capacity Value 832,005$
Energy Supply & Transmission Operating Value of Energy Provided or Saved (time- and location-specific LMP) (3,591,188)$
x x x
Energy Supply & Transmission Operating Value of
Energy Provided or Saved (time‐ and location‐specific
LMP) (3,591,188)$
Avoided Renewable Energy Credit (REC) Cost (324,190)$ x x x Avoided Renewable Energy Credit (REC) Cost (324,190)$
x x Wholesale Market Price Impacts (16,575)$
Greenhouse Gas (GHG) Externality Costs 1,479,569$ x Greenhouse Gas (GHG) Externality Costs 1,479,569$
Criteria Air Pollutant and Other Environmental Costs 672$ x Criteria Air Pollutant and Other Environmental Costs 672$
Non-Electric Avoided Fuel Cost 12,737,349$ x Non‐Electric Avoided Fuel Cost 12,737,349$
Economic Development -$ x Economic Development -$
x x Change in Utility Revenue 11,484,377$
11,134,218$ 22,602,020$
Utility / Third Party Developer Renewable Energy, Efficiency, or DER Costs 1,126,843$ x x x
Utility / Third Party Developer Renewable Energy,
Efficiency, or DER Costs 1,126,843$
Program Participant / Prosumer Benefits / Costs 6,756,766$ x Program Participant / Prosumer Benefits / Costs 6,756,766$
7,883,608$ 7,883,608$
BCA Ratio 1.41 Net Benefits 3,250,610$
First-Year Tonnes CO2 Avoided 1,638$ Net Benefit/Incremental Tonne CO2 1,984$
Source: Attachment DIV 1-1-3, Tab "11.EH - Benefits"
Forward Commitment: Capacity Value Yr 1 Yr 2 Yr 3 Yr 4 Yr 5 Yr 6 Yr 7 Yr 8 Yr 9 Yr 10 Yr 11 Yr 12 Yr 13 Yr 14 Yr 15 Yr 16 Yr 17 Yr 18 Yr 19 Yr 20 Yr 21 Yr 22 Yr 23 Yr 24 Yr 25 Yr 26 Yr 27 Yr 28 Yr 29 Yr 30
Reduction in Peak Load (4-yr delay) kW Calculated. Based on RI draft testimony. 139.21 298.16 476.84 476.84 476.84 476.84 476.84 476.84 476.84 476.84 476.84 476.84 476.84 476.84 476.84 402.59 317.87 222.69 222.69 222.69 222.69 222.69 222.69 222.69 222.69 157.74 83.51 - - -
/ 1 - Losses % AESC 2015, p. 286. ISO Distribution Losses. 92% 92% 92% 92% 92% 92% 92% 92% 92% 92% 92% 92% 92% 92% 92% 92% 92% 92% 92% 92% 92% 92% 92% 92% 92% 92% 92% 92% 92% 92%
= Change in Electric Load at System kW 151.32 324.09 518.31 518.31 518.31 518.31 518.31 518.31 518.31 518.31 518.31 518.31 518.31 518.31 518.31 437.59 345.51 242.06 242.06 242.06 242.06 242.06 242.06 242.06 242.06 171.46 90.77 - - -
x System Coincidence Factor % Based on NY BCA model 1.00 1.00 1.00 1.00 1.00 1.00 1.00 1.00 1.00 1.00 1.00 1.00 1.00 1.00 1.00 1.00 1.00 1.00 1.00 1.00 1.00 1.00 1.00 1.00 1.00 1.00 1.00 1.00 1.00 1.00
x Derating Factor % Based on NY BCA model 1.00 1.00 1.00 1.00 1.00 1.00 1.00 1.00 1.00 1.00 1.00 1.00 1.00 1.00 1.00 1.00 1.00 1.00 1.00 1.00 1.00 1.00 1.00 1.00 1.00 1.00 1.00 1.00 1.00 1.00
= Avoided Generation Capacity kW 151.32 324.09 518.31 518.31 518.31 518.31 518.31 518.31 518.31 518.31 518.31 518.31 518.31 518.31 518.31 437.59 345.51 242.06 242.06 242.06 242.06 242.06 242.06 242.06 242.06 171.46 90.77 - - -
Increased Energy Use MWh (1,473) (3,214) (5,103) (5,103) (5,103) (5,103) (5,103) (5,103) (5,103) (5,103) (5,103) (5,103) (5,103) (5,103) (5,103) (3,906) (2,541) (1,008) (1,008) (1,008) (1,008) (1,008) (1,008) (1,008) (1,008) (731) (355) - - -
1-Losses % 92% 92% 92% 92% 92% 92% 92% 92% 92% 92% 92% 92% 92% 92% 92% 92% 92% 92% 92% 92% 92% 92% 92% 92% 92% 92% 92% 92% 92% 92%
Change in Energy Use at System MWh -1601 -3493 -5547 -5547 -5547 -5547 -5547 -5547 -5547 -5547 -5547 -5547 -5547 -5547 -5547 -4246 -2762 -1095 -1095 -1095 -1095 -1095 -1095 -1095 -1095 -795 -386 0 0 0
Non-Embedded CO2 Cost per MWh $/MWh 48.03 48.54 49.05 48.71 48.33 47.92 47.47 46.99 46.47 45.91 45.30 44.66 43.97 54.23 55.31 56.41 57.53 58.68 59.84 61.03 62.24 63.48 64.74 66.03 67.34 68.68 70.05 71.44 72.86 74.30
Electricity Added Carbon Costs -76908 -169566 -272075 -270165 -268069 -265782 -263328 -260637 -257733 -254643 -251291 -247703 -243871 -300822 -306800 -239527 -158919 -64264 -65541 -66844 -68172 -69527 -70908 -72318 -73755 -54583 -27061 0 0 0
Non-Embedded CO2 Cost per Metric Ton $/Metric Ton 93.36 94.34 95.34 94.67 93.94 93.13 92.27 91.33 90.31 89.23 88.06 86.80 85.46 105.41 107.51 109.64 111.82 114.04 116.31 118.62 120.98 123.38 125.84 128.34 130.89 133.49 136.14 138.85 141.61 144.42
Increase in Metric Tons of CO2 Metric Tons (824) (1,797) (2,854) (2,854) (2,854) (2,854) (2,854) (2,854) (2,854) (2,854) (2,854) (2,854) (2,854) (2,854) (2,854) (2,185) (1,421) (563) (563) (563) (563) (563) (563) (563) (563) (409) (199) - - -
Fuel Oil CO2 Reduction
Fuel Oil CO2 Emissions Reduction metric tons 1,287 2,841 4,492 4,492 4,492 4,492 4,492 4,492 4,492 4,492 4,492 4,492 4,492 4,492 4,492 3,593 2,567 1,414 1,414 1,414 1,414 1,414 1,414 1,414 1,414 1,026 499 - - - -
Net Reduction in CO2 metric tons 464 1,043 1,638 1,638 1,638 1,638 1,638 1,638 1,638 1,638 1,638 1,638 1,638 1,638 1,638 1,408 1,146 851 851 851 851 851 851 851 851 617 300 - - - -
Synapse Targets: Incremental Reduction in CO2 metric tons (medium target) 464 580 595
(High Target) 556 696 714
Compare to Company Calculations
Source: Attachment DIV 1-1-3, Tab "10.EH - Inputs"
Number of Conversions - ASHP 3 ton 39 45 50
Number of Conversions - GSHP 4 ton 18 20 24
Number of Conversions - GSHP 82 ton 1
Source: Attachment DIV 25-18, Assumptions
Avoided CO2 per Year/unit - ASHP 3 ton 3 3 3
Avoided CO2 per Year/unit - GSHP 4 ton 8 8 8
Avoided CO2 per Year/unit - GSHP 82 ton 59
Source: Attachment DIV 25-18, Targets
Incremental Avoided CO2 per Year - Equipment Incentives 171 194 224
Incremental Avoided CO2 per Year - GSHP 82 ton - 59 -
Cos
ts
Costs
Societal Cost TestRI Electric Heat BCA Comprehensive Benefits & Costs
Electric Heat - BCA RatioApplicable Cost Test
Electric Heat ‐ BCA Ratio
Ben
efits
Benefits
278

The Narragansett Electric Company
d/b/a National Grid
RIPUC Docket No. 4780
Attachment DIV 1-1-3
Page 18 of 22
EH - Rhode Island Power Sector Transformation | Benefit-Cost Analysis (BCA) Models | EH - Benefits
Detailed build-up of EH benefits
EH - BenefitsReturn to Contents -->
RI Benefit Yr 1 Yr 2 Yr 3 Yr 4 Yr 5 Yr 6 Yr 7 Yr 8 Yr 9 Yr 10 Yr 11 Yr 12 Yr 13 Yr 14 Yr 15 Yr 16 Yr 17 Yr 18 Yr 19 Yr 20 Yr 21 Yr 22 Yr 23 Yr 24 Yr 25 Yr 26 Yr 27 Yr 28 Yr 29 Yr 30
Description / Calculations Unit SCT UTC RIM Source Nominal Value NPV
Forward Commitment: Capacity Value
Reduction in Peak Load (4-yr delay) kW Calculated. Based on RI draft testimony. 139.21 298.16 476.84 476.84 476.84 476.84 476.84 476.84 476.84 476.84 476.84 476.84 476.84 476.84 476.84 402.59 317.87 222.69 222.69 222.69 222.69 222.69 222.69 222.69 222.69 157.74 83.51 - - - / 1 - Losses % AESC 2015, p. 286. ISO Distribution Losses. 92% 92% 92% 92% 92% 92% 92% 92% 92% 92% 92% 92% 92% 92% 92% 92% 92% 92% 92% 92% 92% 92% 92% 92% 92% 92% 92% 92% 92% 92%
= Change in Electric Load at System kW 151.32 324.09 518.31 518.31 518.31 518.31 518.31 518.31 518.31 518.31 518.31 518.31 518.31 518.31 518.31 437.59 345.51 242.06 242.06 242.06 242.06 242.06 242.06 242.06 242.06 171.46 90.77 - - - 10,195.21 $4,758.02
x System Coincidence Factor % Based on NY BCA model 1.00 1.00 1.00 1.00 1.00 1.00 1.00 1.00 1.00 1.00 1.00 1.00 1.00 1.00 1.00 1.00 1.00 1.00 1.00 1.00 1.00 1.00 1.00 1.00 1.00 1.00 1.00 1.00 1.00 1.00
x Derating Factor % Based on NY BCA model 1.00 1.00 1.00 1.00 1.00 1.00 1.00 1.00 1.00 1.00 1.00 1.00 1.00 1.00 1.00 1.00 1.00 1.00 1.00 1.00 1.00 1.00 1.00 1.00 1.00 1.00 1.00 1.00 1.00 1.00
= Avoided Generation Capacity kW 151.32 324.09 518.31 518.31 518.31 518.31 518.31 518.31 518.31 518.31 518.31 518.31 518.31 518.31 518.31 437.59 345.51 242.06 242.06 242.06 242.06 242.06 242.06 242.06 242.06 171.46 90.77 - - - 10,195.21 4,758.02
x Avoided Unit Cost of Electric Capacity $ / MW AESC 2015 Update, Appendix B - - - - 151,748.25 145,443.49 154,497.40 173,684.98 193,938.75 214,296.15 235,794.87 259,373.47 290,550.94 308,169.87 314,333.27 320,619.93 327,032.33 333,572.98 340,244.44 347,049.33 353,990.31 361,070.12 368,291.52 375,657.35 383,170.50 390,833.91 398,650.59 406,623.60 414,756.07 423,051.19
= Benefit from Forward Commitment: Capacity Value $ x x x -$ -$ -$ -$ 78,653$ 75,385$ 80,077$ 90,023$ 100,520$ 111,072$ 122,215$ 134,436$ 150,595$ 159,727$ 162,922$ 140,301$ 112,993$ 80,744$ 82,359$ 84,006$ 85,686$ 87,400$ 89,148$ 90,930$ 92,749$ 67,011$ 36,186$ -$ -$ -$ $ 2,315,136 $ 832,005
Energy Supply & Transmission Operating Value of
Energy Provided or Saved (time- and location-specific
LMP)
Change in Energy Usage at Meter MWh Calculated. Based on RI draft testimony. (1,473.03) (3,213.87) (5,102.95) (5,102.95) (5,102.95) (5,102.95) (5,102.95) (5,102.95) (5,102.95) (5,102.95) (5,102.95) (5,102.95) (5,102.95) (5,102.95) (5,102.95) (3,906.37) (2,541.26) (1,007.61) (1,007.61) (1,007.61) (1,007.61) (1,007.61) (1,007.61) (1,007.61) (1,007.61) (731.16) (355.43) - - -
/ 1 - Losses % AESC 2015, p. 286. ISO Distribution Losses. 92% 92% 92% 92% 92% 92% 92% 92% 92% 92% 92% 92% 92% 92% 92% 92% 92% 92% 92% 92% 92% 92% 92% 92% 92% 92% 92% 92% 92% 92%
= Change in Energy Usage at System MWh Calculated (1,601.12) (3,493.34) (5,546.68) (5,546.68) (5,546.68) (5,546.68) (5,546.68) (5,546.68) (5,546.68) (5,546.68) (5,546.68) (5,546.68) (5,546.68) (5,546.68) (5,546.68) (4,246.05) (2,762.24) (1,095.23) (1,095.23) (1,095.23) (1,095.23) (1,095.23) (1,095.23) (1,095.23) (1,095.23) (794.74) (386.34) - - - (94,152.56) (47,709.01)
x Avoided Energy Cost $ / MWh AESC 2015 Update, Appendix B 40.12 45.63 52.07 57.95 60.82 66.58 71.17 75.96 77.92 80.58 84.83 89.02 93.26 97.68 102.23 107.00 112.02 117.28 122.80 128.60 134.69 141.08 147.80 154.86 162.27 170.07 178.25 186.86 195.91 205.42
= Benefit from Energy Supply & Transmission Operating V$ x x x Calculated (64,231)$ (159,415)$ (288,822)$ (321,447)$ (337,375)$ (369,301)$ (394,762)$ (421,338)$ (432,202)$ (446,972)$ (470,502)$ (493,756)$ (517,283)$ (541,781)$ (567,025)$ (454,343)$ (309,414)$ (128,446)$ (134,495)$ (140,846)$ (147,516)$ (154,520)$ (161,877)$ (169,607)$ (177,727)$ (135,158)$ (68,867)$ -$ -$ -$ $ (8,009,028) $ (3,591,188)
Avoided Renewable Energy Credit (REC) Cost
Change in Energy Usage at Meter MWh Calculated. Based on RI draft testimony. (1,473.03) (3,213.87) (5,102.95) (5,102.95) (5,102.95) (5,102.95) (5,102.95) (5,102.95) (5,102.95) (5,102.95) (5,102.95) (5,102.95) (5,102.95) (5,102.95) (5,102.95) (3,906.37) (2,541.26) (1,007.61) (1,007.61) (1,007.61) (1,007.61) (1,007.61) (1,007.61) (1,007.61) (1,007.61) (731.16) (355.43) - - -
/ 1 - Losses % AESC 2015, p. 286. ISO Distribution Losses. 92% 92% 92% 92% 92% 92% 92% 92% 92% 92% 92% 92% 92% 92% 92% 92% 92% 92% 92% 92% 92% 92% 92% 92% 92% 92% 92% 92% 92% 92%
= Change in Energy Usage at System MWh Calculated (1,601.12) (3,493.34) (5,546.68) (5,546.68) (5,546.68) (5,546.68) (5,546.68) (5,546.68) (5,546.68) (5,546.68) (5,546.68) (5,546.68) (5,546.68) (5,546.68) (5,546.68) (4,246.05) (2,762.24) (1,095.23) (1,095.23) (1,095.23) (1,095.23) (1,095.23) (1,095.23) (1,095.23) (1,095.23) (794.74) (386.34) - - - (94,152.56) (47,709.01)
x Avoided REC Cost $ / MWh AESC 2015 Update, Appendix B 6.12 6.76 6.55 8.02 7.83 7.43 7.23 6.90 6.49 6.09 5.70 6.30 6.00 6.12 6.24 6.36 6.49 6.62 6.75 6.89 7.03 7.17 7.31 7.46 7.61 7.76 7.91 8.07 8.23 8.40
Benefit from Avoided REC Cost $ x x x Calculated (9,805)$ (23,604)$ (36,312)$ (44,503)$ (43,455)$ (41,204)$ (40,086)$ (38,289)$ (36,019)$ (33,803)$ (31,624)$ (34,955)$ (33,263)$ (33,928)$ (34,607)$ (27,022)$ (17,930)$ (7,252)$ (7,397)$ (7,545)$ (7,695)$ (7,849)$ (8,006)$ (8,166)$ (8,330)$ (6,165)$ (3,057)$ -$ -$ -$ $ (631,871) $ (324,190)
Wholesale Market Price Impacts
Change in Energy Usage at Meter MWh Calculated. Based on RI draft testimony. (1,473.03) (3,213.87) (5,102.95) (5,102.95) (5,102.95) (5,102.95) (5,102.95) (5,102.95) (5,102.95) (5,102.95) (5,102.95) (5,102.95) (5,102.95) (5,102.95) (5,102.95) (3,906.37) (2,541.26) (1,007.61) (1,007.61) (1,007.61) (1,007.61) (1,007.61) (1,007.61) (1,007.61) (1,007.61) (731.16) (355.43) - - -
/ 1 - Losses % AESC 2015, p. 286. ISO Distribution Losses. 92% 92% 92% 92% 92% 92% 92% 92% 92% 92% 92% 92% 92% 92% 92% 92% 92% 92% 92% 92% 92% 92% 92% 92% 92% 92% 92% 92% 92% 92%
= Change in Energy Usage at System MWh Calculated (1,601.12) (3,493.34) (5,546.68) (5,546.68) (5,546.68) (5,546.68) (5,546.68) (5,546.68) (5,546.68) (5,546.68) (5,546.68) (5,546.68) (5,546.68) (5,546.68) (5,546.68) (4,246.05) (2,762.24) (1,095.23) (1,095.23) (1,095.23) (1,095.23) (1,095.23) (1,095.23) (1,095.23) (1,095.23) (794.74) (386.34) - - - (94,152.56) (47,709.01)
x DRIPE (Energy + Cross-fuel Capacity) $ / MWh AESC 2015 Update, Appendix B 1.34 0.88 0.88 0.19 0.19 0.19 0.20 0.20 0.20 0.21 0.21 0.21 0.22 0.22 0.22 0.23 0.23 0.24 0.24 0.25 0.25 0.26 0.26 0.27 0.27 0.28 0.28 0.29 0.30 0.30
= Benefit from Wholesale Market Price Impacts $ x x Calculated (2,142)$ (3,082)$ (4,890)$ (1,036)$ (1,053)$ (1,070)$ (1,087)$ (1,104)$ (1,122)$ (1,140)$ (1,158)$ (1,176)$ (1,195)$ (1,219)$ (1,243)$ (971)$ (644)$ (261)$ (266)$ (271)$ (276)$ (282)$ (288)$ (293)$ (299)$ (221)$ (110)$ -$ -$ -$ $ (27,899) $ (16,575)
279

The Narragansett Electric Company
d/b/a National Grid
RIPUC Docket No. 4780
Attachment DIV 1-1-3
Page 19 of 22
Greenhouse Gas (GHG) Externality Costs
Change in Energy Usage at Meter MWh Calculated. Based on RI draft testimony. (1,473.03) (3,213.87) (5,102.95) (5,102.95) (5,102.95) (5,102.95) (5,102.95) (5,102.95) (5,102.95) (5,102.95) (5,102.95) (5,102.95) (5,102.95) (5,102.95) (5,102.95) (3,906.37) (2,541.26) (1,007.61) (1,007.61) (1,007.61) (1,007.61) (1,007.61) (1,007.61) (1,007.61) (1,007.61) (731.16) (355.43) - - -
/ 1 - Losses % AESC 2015, p. 286. ISO Distribution Losses. 92% 0.92 0.92 0.92 0.92 0.92 0.92 0.92 0.92 0.92 0.92 0.92 0.92 0.92 0.92 0.92 0.92 0.92 0.92 0.92 0.92 0.92 0.92 0.92 0.92 0.92 0.92 0.92 0.92 0.92
= Change in Energy Usage at System MWh Calculated (1,601.12) (3,493.34) (5,546.68) (5,546.68) (5,546.68) (5,546.68) (5,546.68) (5,546.68) (5,546.68) (5,546.68) (5,546.68) (5,546.68) (5,546.68) (5,546.68) (5,546.68) (4,246.05) (2,762.24) (1,095.23) (1,095.23) (1,095.23) (1,095.23) (1,095.23) (1,095.23) (1,095.23) (1,095.23) (794.74) (386.34) - - - (94,152.56) (47,709.01)
x Non-Embedded CO2 Cost $ / MWh 2015 AESC. Exhibit 4-7 48.03 48.54 49.05 48.71 48.33 47.92 47.47 46.99 46.47 45.91 45.30 44.66 43.97 54.23 55.31 56.41 57.53 58.68 59.84 61.03 62.24 63.48 64.74 66.03 67.34 68.68 70.05 71.44 72.86 74.30
= Electricity Added Carbon Benefits $ Calculated (76,908)$ (169,566)$ (272,075)$ (270,165)$ (268,069)$ (265,782)$ (263,328)$ (260,637)$ (257,733)$ (254,643)$ (251,291)$ (247,703)$ (243,871)$ (300,822)$ (306,800)$ (239,527)$ (158,919)$ (64,264)$ (65,541)$ (66,844)$ (68,172)$ (69,527)$ (70,908)$ (72,318)$ (73,755)$ (54,583)$ (27,061)$ -$ -$ -$ $ (4,740,810) $ (2,338,135)
Increase in tons CO2 implied tons CO2 from addl electricity (824) (1,797) (2,854) (2,854) (2,854) (2,854) (2,854) (2,854) (2,854) (2,854) (2,854) (2,854) (2,854) (2,854) (2,854) (2,185) (1,421) (563) (563) (563) (563) (563) (563) (563) (563) (409) (199) - - -
Non-Embedded CO2 Cost $ / metric ton 2015 AESC. Exhibit 4-7 93.36 94.34 95.34 94.67 93.94 93.13 92.27 91.33 90.31 89.23 88.06 86.80 85.46 105.41 107.51 109.64 111.82 114.04 116.31 118.62 120.98 123.38 125.84 128.34 130.89 133.49 136.14 138.85 141.61 144.42
Natural Gas CO2 Emissions per Unit metric ton / MMBTU source: EIA 0.05 0.05 0.05 0.05 0.05 0.05 0.05 0.05 0.05 0.05 0.05 0.05 0.05 0.05 0.05 0.05 0.05 0.05 0.05 0.05 0.05 0.05 0.05 0.05 0.05 0.05 0.05 0.05 0.05 0.05
Natural Gas Usage Reduction MMBTU Calculated - - - - - - - - - - - - - - - - - - - - - - - - - - - - - -
x Natural Gas CO2 Emissions Reduction metric tons Calculated - - - - - - - - - - - - - - - - - - - - - - - - - - - - - -
= Natural Gas Carbon Benefits $ Portion of data needed is not available -$ -$ -$ -$ -$ -$ -$ -$ -$ -$ -$ -$ -$ -$ -$ -$ -$ -$ -$ -$ -$ -$ -$ -$ -$ -$ -$ -$ -$ -$ $ - $ -
Fuel Oil CO2 Emissions per Unit metric ton / MMBTU https://www.eia.gov/tools/faqs/faq.cfm?id=73&t=11 0.07 0.07 0.07 0.07 0.07 0.07 0.07 0.07 0.07 0.07 0.07 0.07 0.07 0.07 0.07 0.07 0.07 0.07 0.07 0.07 0.07 0.07 0.07 0.07 0.07 0.07 0.07 0.07 0.07 0.07
Fuel Oil Usage Reduction MMBTU Calculated 17,595.13 38,825.92 61,398.76 61,398.76 61,398.76 61,398.76 61,398.76 61,398.76 61,398.76 61,398.76 61,398.76 61,398.76 61,398.76 61,398.76 61,398.76 49,105.98 35,081.82 19,326.28 19,326.28 19,326.28 19,326.28 19,326.28 19,326.28 19,326.28 19,326.28 14,023.93 6,817.30 - - -
x Fuel Oil CO2 Emissions Reduction metric tons Calculated 1,287 2,841 4,492 4,492 4,492 4,492 4,492 4,492 4,492 4,492 4,492 4,492 4,492 4,492 4,492 3,593 2,567 1,414 1,414 1,414 1,414 1,414 1,414 1,414 1,414 1,026 499 - - -
= Fuel Oil Carbon Benefits $ Portion of data needed is not available 120,187$ 268,000$ 428,283$ 425,276$ 421,977$ 418,376$ 414,514$ 410,278$ 405,706$ 400,842$ 395,565$ 389,917$ 383,885$ 473,533$ 482,944$ 393,929$ 287,020$ 161,259$ 164,464$ 167,732$ 171,066$ 174,465$ 177,933$ 181,469$ 185,075$ 136,967$ 67,906$ -$ -$ -$ $ 8,108,566 $ 3,817,704
Propane CO2 Emissions per Unit metric ton / MMBTU NY BCA model 0.06 0.06 0.06 0.06 0.06 0.06 0.06 0.06 0.06 0.06 0.06 0.06 0.06 0.06 0.06 0.06 0.06 0.06 0.06 0.06 0.06 0.06 0.06 0.06 0.06 0.06 0.06 0.06 0.06 0.06
Propane Usage Reduction MMBTU Calculated - - - - - - - - - - - - - - - - - - - - - - - - - - - - - -
x Propane CO2 Emissions Reduction metric tons Calculated - - - - - - - - - - - - - - - - - - - - - - - - - - - - - -
= Propane Carbon Benefits $ Portion of data needed is not available -$ -$ -$ -$ -$ -$ -$ -$ -$ -$ -$ -$ -$ -$ -$ -$ -$ -$ -$ -$ -$ -$ -$ -$ -$ -$ -$ -$ -$ -$ $ - $ -
= Benefit from Reduced Greenhouse Gas Externality Cost$ x Portion of data needed is not available 43,279$ 98,434$ 156,207$ 155,111$ 153,908$ 152,594$ 151,186$ 149,640$ 147,973$ 146,199$ 144,274$ 142,214$ 140,014$ 172,712$ 176,144$ 154,402$ 128,101$ 96,995$ 98,923$ 100,889$ 102,894$ 104,939$ 107,024$ 109,151$ 111,320$ 82,384$ 40,844$ -$ -$ -$ $ 3,367,756 $ 1,479,569
net reduction in co2 (metric tons) 464 1,043 1,638 1,638 1,638 1,638 1,638 1,638 1,638 1,638 1,638 1,638 1,638 1,638 1,638 1,408 1,146 851 851 851 851 851 851 851 851 617 300 - - -
Criteria Air Pollutant and Other Environmental Costs
Natural Gas SO2 Emissions per Unit short ton / MMBTU EPA 2.90698E-07 2.90698E-07 2.90698E-07 2.90698E-07 2.90698E-07 2.90698E-07 2.90698E-07 2.90698E-07 2.90698E-07 2.90698E-07 2.90698E-07 2.90698E-07 2.90698E-07 2.90698E-07 2.90698E-07 2.90698E-07 2.90698E-07 2.90698E-07 2.90698E-07 2.90698E-07 2.90698E-07 2.90698E-07 2.90698E-07 2.90698E-07 2.90698E-07 2.90698E-07 2.90698E-07 2.90698E-07 2.90698E-07 2.90698E-07
Natural Gas NOX Emissions per Unit short ton / MMBTU EPA -4.55426E-05 -4.55426E-05 -4.55426E-05 -4.55426E-05 -4.55426E-05 -4.55426E-05 -4.55426E-05 -4.55426E-05 -4.55426E-05 -4.55426E-05 -4.55426E-05 -4.55426E-05 -4.55426E-05 -4.55426E-05 -4.55426E-05 -4.55426E-05 -4.55426E-05 -4.55426E-05 -4.55426E-05 -4.55426E-05 -4.55426E-05 -4.55426E-05 -4.55426E-05 -4.55426E-05 -4.55426E-05 -4.55426E-05 -4.55426E-05 -4.5543E-05 -4.5543E-05 -4.5543E-05
x Natural Gas Usage Reduction MMBTU Natural gas is not used in base case and thus not replaced - - - - - - - - - - - - - - - - - - - - - - - - - - - - - -
= Natural Gas SO2 Emissions Reduction short tons Calculated - - - - - - - - - - - - - - - - - - - - - - - - - - - - - - - -
= Natural Gas NOX Emissions Reduction short tons Calculated - - - - - - - - - - - - - - - - - -
Fuel Oil SO2 Emissions per Unit short ton / MMBTU https://www3.epa.gov/ttnchie1/conference/ei12/area/hane 0.000153791 0.000153791 0.000153791 0.000153791 0.000153791 0.000153791 0.000153791 0.000153791 0.000153791 0.000153791 0.000153791 0.000153791 0.000153791 0.000153791 0.000153791 0.000153791 0.000153791 0.000153791 0.000153791 0.000153791 0.000153791 0.000153791 0.000153791 0.000153791 0.000153791 0.000153791 0.000153791 0.000153791 0.000153791 0.000153791
Fuel Oil NOX Emissions per Unit short ton / MMBTU https://www3.epa.gov/ttnchie1/conference/ei12/area/hane 6.49819E-05 6.49819E-05 6.49819E-05 6.49819E-05 6.49819E-05 6.49819E-05 6.49819E-05 6.49819E-05 6.49819E-05 6.49819E-05 6.49819E-05 6.49819E-05 6.49819E-05 6.49819E-05 6.49819E-05 6.49819E-05 6.49819E-05 6.49819E-05 6.49819E-05 6.49819E-05 6.49819E-05 6.49819E-05 6.49819E-05 6.49819E-05 6.49819E-05 6.49819E-05 6.49819E-05 6.49819E-05 6.49819E-05 6.49819E-05
x Fuel Oil Usage Reduction MMBTU Calculated. 17,595.13 38,825.92 61,398.76 61,398.76 61,398.76 61,398.76 61,398.76 61,398.76 61,398.76 61,398.76 61,398.76 61,398.76 61,398.76 61,398.76 61,398.76 49,105.98 35,081.82 19,326.28 19,326.28 19,326.28 19,326.28 19,326.28 19,326.28 19,326.28 19,326.28 14,023.93 6,817.30 - - -
= Fuel Oil SO2 Emissions Reduction short tons Calculated 2.71 5.97 9.44 9.44 9.44 9.44 9.44 9.44 9.44 9.44 9.44 9.44 9.44 9.44 9.44 7.55 5.40 2.97 2.97 2.97 2.97 2.97 2.97 2.97 2.97 2.16 1.05 - - - 171.36 83.60
= Fuel Oil NOX Emissions Reduction short tons Calculated 1.14 2.52 3.99 3.99 3.99 3.99 3.99 3.99 3.99 3.99 3.99 3.99 3.99 3.99 3.99 3.19 2.28 1.26 1.26 1.26 1.26 1.26 1.26 1.26 1.26 0.91 0.44 - - -
Propane SO2 Emissions per Unit short ton / MMBTU https://www3.epa.gov/ttn/chief/ap42/ch01/index.html 2.95622E-07 2.95622E-07 2.95622E-07 2.95622E-07 2.95622E-07 2.95622E-07 2.95622E-07 2.95622E-07 2.95622E-07 2.95622E-07 2.95622E-07 2.95622E-07 2.95622E-07 2.95622E-07 2.95622E-07 2.95622E-07 2.95622E-07 2.95622E-07 2.95622E-07 2.95622E-07 2.95622E-07 2.95622E-07 2.95622E-07 2.95622E-07 2.95622E-07 2.95622E-07 2.95622E-07 2.95622E-07 2.95622E-07 2.95622E-07
Propane NOX Emissions per Unit short ton / MMBTU https://www3.epa.gov/ttn/chief/ap42/ch01/index.html 7.11681E-05 7.11681E-05 7.11681E-05 7.11681E-05 7.11681E-05 7.11681E-05 7.11681E-05 7.11681E-05 7.11681E-05 7.11681E-05 7.11681E-05 7.11681E-05 7.11681E-05 7.11681E-05 7.11681E-05 7.11681E-05 7.11681E-05 7.11681E-05 7.11681E-05 7.11681E-05 7.11681E-05 7.11681E-05 7.11681E-05 7.11681E-05 7.11681E-05 7.11681E-05 7.11681E-05 7.11681E-05 7.11681E-05 7.11681E-05
x Propane Usage Reduction MMBTU Propane is not used in base case and thus not replaced - - - - - - - - - - - - - - - - - - - - - - - - - - - - - -
= Propane SO2 Emissions Reduction short tons Calculated - - - - - - - - - - - - - - - - - - - - - - - - - - - - - - - -
= Propane NOX Emissions Reduction short tons Calculated - - - - - - - - - - - - - - - - - - - - - - - - - - - - - -
Total SO2 Emissions Reduction short tons Calculated 2.71 5.97 9.44 9.44 9.44 9.44 9.44 9.44 9.44 9.44 9.44 9.44 9.44 9.44 9.44 7.55 5.40 2.97 2.97 2.97 2.97 2.97 2.97 2.97 2.97 2.16 1.05 - - -
x SO2 Pollutant Cost $ / short ton AESC 2015 Exhibit 4.1. Emission Allowance Prices per Sh 1.20 1.25 1.30 1.35 1.41 1.46 1.52 1.59 1.65 1.72 1.79 1.86 1.93 2.01 2.09 2.18 2.26 2.36 2.45 2.55 2.65 2.76 2.87 2.99 3.11 3.23 3.36 3.50 3.64 3.79
= Net Avoided SO2 Cost $ Calculated 3$ 7$ 12$ 13$ 13$ 14$ 14$ 15$ 16$ 16$ 17$ 18$ 18$ 19$ 20$ 16$ 12$ 7$ 7$ 8$ 8$ 8$ 9$ 9$ 9$ 7$ 4$ -$ -$ -$ $ 319 $ 140
Total NOX Emissions Reduction short tons Calculated 1.14 2.52 3.99 3.99 3.99 3.99 3.99 3.99 3.99 3.99 3.99 3.99 3.99 3.99 3.99 3.19 2.28 1.26 1.26 1.26 1.26 1.26 1.26 1.26 1.26 0.91 0.44 - - -
x NOX Pollutant Cost $ / short AESC 2015 Exhibit 4.1. Emission Allowance Prices per Sh 10.82 11.26 11.72 12.19 12.68 13.19 13.73 14.28 14.86 15.46 16.08 16.73 17.41 18.11 18.85 19.61 20.40 21.22 22.08 22.97 23.90 24.87 25.87 26.92 28.00 29.13 30.31 31.54 32.81 34.14
= Net Avoided NOX Cost $ Calculated 12$ 28$ 47$ 49$ 51$ 53$ 55$ 57$ 59$ 62$ 64$ 67$ 69$ 72$ 75$ 63$ 47$ 27$ 28$ 29$ 30$ 31$ 32$ 34$ 35$ 27$ 13$ -$ -$ -$ $ 1,215 $ 532
= Total Avoided Cost from SO2 and NOX Reduction $ x Calculated 16$ 36$ 59$ 61$ 64$ 66$ 69$ 72$ 75$ 78$ 81$ 84$ 88$ 91$ 95$ 79$ 59$ 34$ 35$ 36$ 38$ 39$ 41$ 43$ 44$ 34$ 17$ -$ -$ -$ $ 1,534 $ 672
Non-Electric Avoided Fuel Cost
Natural Gas Consumption Cost $ / MMBTU https://www.eia.gov/outlooks/aeo/data/browser/#/?id=3-A 12.73 12.86 13.04 13.25 13.45 13.60 13.72 13.81 13.87 14.00 14.19 14.39 14.52 14.58 14.68 14.75 14.94 15.18 15.33 15.50 15.62 15.74 15.79 15.92 16.05 16.21 16.40 16.60 16.79 16.93
x Natural Gas Reduced Consumption MMBTU Calculated - - - - - - - - - - - - - - - - - - - - - - - - - - - - - -
= Natural Gas Avoided Cost $ Calculated -$ -$ -$ -$ -$ -$ -$ -$ -$ -$ -$ -$ -$ -$ -$ -$ -$ -$ -$ -$ -$ -$ -$ -$ -$ -$ -$ -$ -$ -$ $ - $ -
Fuel Oil Consumption Cost $ / MMBTU https://www.eia.gov/outlooks/aeo/data/browser/#/?id=3-A 20.15 21.22 21.69 22.07 22.34 22.67 22.99 23.46 23.83 24.02 24.06 24.28 24.73 25.14 25.63 25.55 25.85 26.07 26.59 26.67 26.83 27.20 27.40 27.44 27.49 27.55 27.65 27.74 27.91 28.25
x Fuel Oil Reduced Consumption MMBTU Calculated 17,595.13 38,825.92 61,398.76 61,398.76 61,398.76 61,398.76 61,398.76 61,398.76 61,398.76 61,398.76 61,398.76 61,398.76 61,398.76 61,398.76 61,398.76 49,105.98 35,081.82 19,326.28 19,326.28 19,326.28 19,326.28 19,326.28 19,326.28 19,326.28 19,326.28 14,023.93 6,817.30 - - -
= Fuel Oil Avoided Cost $ Calculated 354,515$ 823,803$ 1,332,007$ 1,355,024$ 1,371,428$ 1,391,705$ 1,411,297$ 1,440,339$ 1,462,879$ 1,474,880$ 1,477,392$ 1,490,713$ 1,518,683$ 1,543,592$ 1,573,676$ 1,254,593$ 907,034$ 503,812$ 513,945$ 515,383$ 518,567$ 525,684$ 529,480$ 530,312$ 531,315$ 386,394$ 188,495$ -$ -$ -$ $ 26,926,948 $ 12,737,349
Propane Consumption Cost $ / MMBTU https://www.eia.gov/outlooks/aeo/data/browser/#/?id=3-A 20.39 20.43 20.37 20.38 20.82 21.10 21.19 21.15 21.19 21.39 21.45 21.47 21.64 22.07 22.39 22.45 22.69 22.80 23.14 23.30 23.61 24.05 24.21 24.47 24.61 24.81 24.99 25.07 25.26 25.46
x Propane Reduced Consumption MMBTU Calculated - - - - - - - - - - - - - - - - - - - - - - - - - - - - - -
= Propane Avoided Cost $ Calculated -$ -$ -$ -$ -$ -$ -$ -$ -$ -$ -$ -$ -$ -$ -$ -$ -$ -$ -$ -$ -$ -$ -$ -$ -$ -$ -$ -$ -$ -$ $ - $ -
= Non-Electric Avoided Fuel Costs $ x Calculated 354,515$ 823,803$ 1,332,007$ 1,355,024$ 1,371,428$ 1,391,705$ 1,411,297$ 1,440,339$ 1,462,879$ 1,474,880$ 1,477,392$ 1,490,713$ 1,518,683$ 1,543,592$ 1,573,676$ 1,254,593$ 907,034$ 503,812$ 513,945$ 515,383$ 518,567$ 525,684$ 529,480$ 530,312$ 531,315$ 386,394$ 188,495$ -$ -$ -$ $ 26,926,948 $ 12,737,349
Economic Development
Economic development (residential)
Economic development factor $ / Total Resource Cost RI Collaborative, RI EERMC. Email C. Lane, dated 10/24/1 - - - - - - - - - - - - - - - - - - - - - - - - - - - - - -
x Total resource cost $ Calculated 2,782,449$ 2,989,632$ 3,223,932$ -$ -$ -$ -$ -$ -$ -$ -$ -$ -$ -$ -$ -$ -$ -$ -$ -$ -$ -$ -$ -$ -$ -$ -$ -$ -$ -$
= Total residential economic benefit $ -$ -$ -$ -$ -$ -$ -$ -$ -$ -$ -$ -$ -$ -$ -$ -$ -$ -$ -$ -$ -$ -$ -$ -$ -$ -$ -$ -$ -$ -$ $ - $ -
Economic development (commercial)
Economic development factor $ / Total Resource Cost RI Collaborative, RI EERMC. Email C. Lane, dated 10/24/1 - - - - - - - - - - - - - - - - - - - - - - - - - - - - - -
x Total resource cost $ Calculated -$ 965,000$ -$ -$ -$ -$ -$ -$ -$ -$ -$ -$ -$ -$ -$ -$ -$ -$ -$ -$ -$ -$ -$ -$ -$ -$ -$ -$ -$ -$
= Total commercial economic benefit $ -$ -$ -$ -$ -$ -$ -$ -$ -$ -$ -$ -$ -$ -$ -$ -$ -$ -$ -$ -$ -$ -$ -$ -$ -$ -$ -$ -$ -$ -$ $ - $ -
= Total economic benefit (residential + commercial) $ x -$ -$ -$ -$ -$ -$ -$ -$ -$ -$ -$ -$ -$ -$ -$ -$ -$ -$ -$ -$ -$ -$ -$ -$ -$ -$ -$ -$ -$ -$ $ - $ -
Increased Utility RevenueElectricity Increase at Revenue MWh Need specific systems and specifications from NG 1,473.03 3,213.87 5,102.95 5,102.95 5,102.95 5,102.95 5,102.95 5,102.95 5,102.95 5,102.95 5,102.95 5,102.95 5,102.95 5,102.95 5,102.95 3,906.37 2,541.26 1,007.61 1,007.61 1,007.61 1,007.61 1,007.61 1,007.61 1,007.61 1,007.61 731.16 355.43 - - -
x Non-Bypassable Charges $ / MWh Confirm approach. Used Appendix B, wholesale + risk pr 171$ 181$ 192$ 204$ 237$ 245$ 254$ 265$ 272$ 279$ 290$ 302$ 315$ 326$ 335$ 344$ 353$ 362$ 372$ 383$ 395$ 407$ 420$ 433$ 447$ 460$ 482$ -$ -$ -$
= Increased Utility Revenue $ x Calculated Value 252,143$ 581,787$ 977,675$ 1,040,401$ 1,210,928$ 1,250,397$ 1,296,618$ 1,353,368$ 1,386,284$ 1,425,385$ 1,479,117$ 1,542,917$ 1,606,809$ 1,662,625$ 1,708,459$ 1,343,760$ 897,932$ 364,288$ 374,997$ 386,196$ 397,910$ 410,165$ 422,990$ 436,413$ 450,466$ 336,324$ 171,169$ -$ -$ -$ 24,767,521$ 11,484,377$
280

THE NARRAGANSETT ELECTRIC COMPANYd/b/a NATIONAL GRIDRIPUC Docket No. 4770
Attachment DIV 25-18Page 1 of 2
Attachment DIV 25-18
Electric Heat Workpaper 9.2
PREVIOUS TARGETS (INCORRECT)ANNUALIZED CO2
Reductions
2018 2019 2020Min 0 44 0Mid 0 55 0Max 0 66 0Min 119 134 156Mid 149 168 195Max 179 202 234
Final Targets (combined metric tons CO2 avoided per yer) 2018 2019 2020Min 119 178 156Mid 149 223 195Max 179 268 234
GSHP: 55.23 tons avoided CO2 expected per year of the system Equipment Incentives: 149, 168, and 195 incremental tons annually for years 1, 2, 3
REVISED TARGETS (CORRECTED)
2018 2019 2020Min 0 47 0Mid 0 59 0Max 0 71 0Min 137 155 179Mid 171 194 224Max 206 232 269
Final Targets (combined metric tons CO2 avoided per yer) 2018 2019 2020Min 137 202 179Mid 171 253 224Max 206 303 269
GSHP: 59 tons avoided CO2 expected per year of the system Equipment Incentives: 171, 194, and 224 incremental tons annually for years 1, 2, 3
Change in Targets (absolute) 2018 2019 2020Min 18 24 23Mid 22 30 29Max 27 36 35
Change in Targets (percentage) 2018 2019 2020Min 15% 13% 15%Mid 15% 13% 15%Max 15% 13% 15%
1. GSHP ProgramCarbon reduction (metric tons CO2 avoided per year)
2. Equipment IncentivesCarbon reduction (metric tons CO2 avoided per year)
2. Equipment IncentivesCarbon reduction (metric tons CO2 avoided per year)
Program Design Element Program Metrics Target Levels
Targets (annual
Program Design Element Program Metrics Target Levels
Targets (annual metric tons CO2)
1. GSHP ProgramCarbon reduction (metric tons CO2 avoided per year)
281
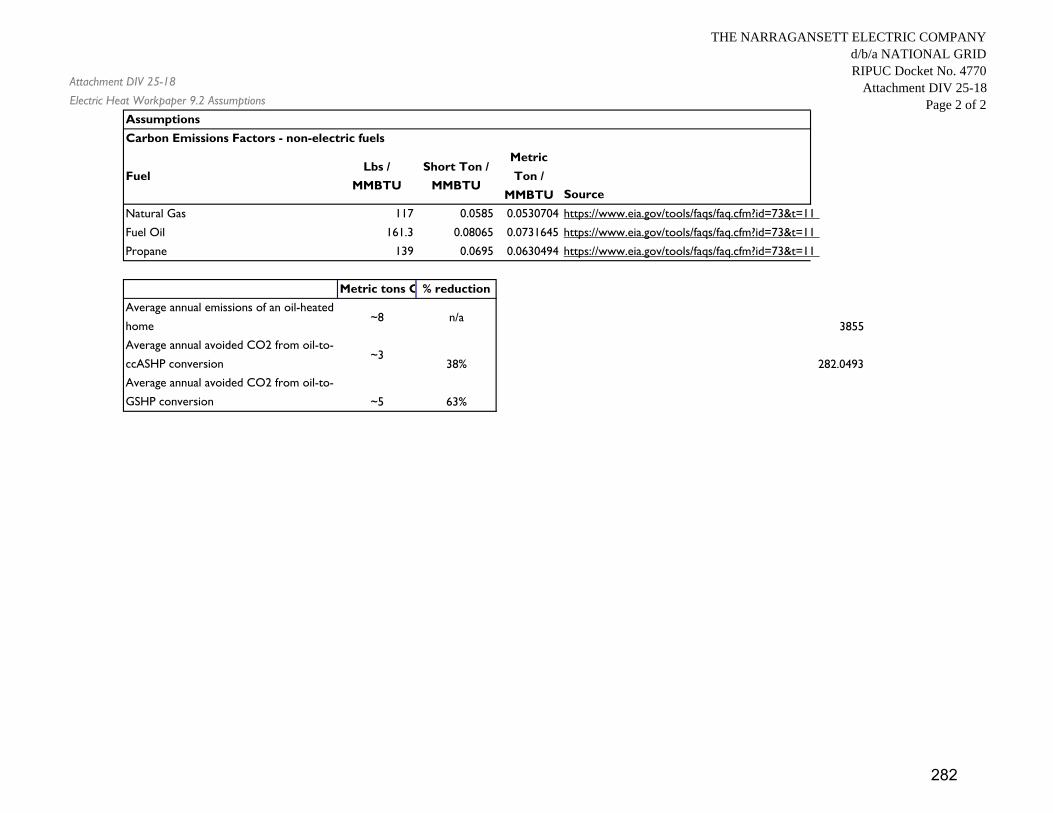
THE NARRAGANSETT ELECTRIC COMPANYd/b/a NATIONAL GRIDRIPUC Docket No. 4770
Attachment DIV 25-18Page 2 of 2
Attachment DIV 25-18
Electric Heat Workpaper 9.2 Assumptions
Assumptions
Carbon Emissions Factors - non-electric fuels
FuelLbs /
MMBTU
Short Ton /
MMBTU
Metric
Ton /
MMBTU Source
Natural Gas 117 0.0585 0.0530704 https://www.eia.gov/tools/faqs/faq.cfm?id=73&t=11
Fuel Oil 161.3 0.08065 0.0731645 https://www.eia.gov/tools/faqs/faq.cfm?id=73&t=11
Propane 139 0.0695 0.0630494 https://www.eia.gov/tools/faqs/faq.cfm?id=73&t=11
Metric tons C % reduction
Average annual emissions of an oil-heated
home~8 n/a
3855
Average annual avoided CO2 from oil-to-
ccASHP conversion~3
38% 282.0493
Average annual avoided CO2 from oil-to-
GSHP conversion ~5 63%
282

2017 2018 2019 2020 2021
Medium Target:
EE Measure Lifetime (years) 9.5 9.8 11.4 11.4
EE Energy Savings (lftm MWh) 1,712,064 1,904,592 2,160,318 2,160,318
EE Energy Savings (MWh) 201,347 179,968 194,677 189,509 189,509
EE Capacity Savings (MW) 29 30 35 34 34
EE Benefits ($1000) $373,005 $438,942 $451,783 $451,783
EE Funding ($1000) $115,547 $124,932 $109,090 $109,090
EE Net Benefits (before incentive) $257,458 $314,010 $342,693 $342,693
Costs as % of Benefits 31% 28% 24% 24%
EE COSE ($/MWh) 7.1 7.7 6.2 6.2
EE Incentive ($1000) 5,777 6,247 5,455 5,455
Maximum Target:
Scale-up factor 1.06 1.12 1.12
EE Energy Savings (MWh) 205,801 211,804 211,804
EE Capacity Savings (MW) 37 38 38
EE Funding ($1000) 132,071 121,924 121,924
EE Incentive ($1000) 6,604 6,096 6,096
Notes:
Nat Grid Workpaper 9-1, page 3 has EE MW targets that are the same as the Three-Year Plan
It also has EE MW Max targets. They are presented above.
The rest of the max target information is just scaled up by the same ratio as MW.
Table From National Grid 2018-2020 Three-Year EE Plan
283

CERTIFICATION I hereby certify that on April 25, 2018, I sent a copy of the within to all parties set forth
on the attached Service List by electronic mail and copies to Luly Massaro, Commission Clerk, by electronic mail and regular mail.
Name/Address E-mail Distribution List Phone National Grid Celia O’Brien, Esq. Jennifer Hutchinson, Esq. National Grid 280 Melrose St. Providence, RI 02907
[email protected]; 781-907-2153 401-784-7288
[email protected]; [email protected]; [email protected]; [email protected]; [email protected]; [email protected]; [email protected]; [email protected]; [email protected]; [email protected]; kayte.o'[email protected]; [email protected]; [email protected]; [email protected];
Adam Ramos, Esq. Hinckley Allen Hinckley Allen 100 Westminster Street, Suite 1500 Providence, RI 02903-2319
[email protected]; 401-457-5164
Division of Public Utilities (Division) Leo Wold, Esq. Dept. of Attorney General 150 South Main St. Providence, RI 02903
[email protected]; 404-274-4400 [email protected]; [email protected];
Jonathan Schrag, Deputy Administrator Division of Public Utilities and Carriers 89 Jefferson Blvd. Warwick, RI 02888
[email protected]; 401-780-2140 [email protected]; [email protected]; [email protected]; [email protected]; [email protected];

[email protected]; Tim Woolf Jennifer Kallay Synapse Energy Economics 22 Pearl Street Cambridge, MA 02139
617-661-3248
[email protected]; [email protected]; [email protected];
David Effron Berkshire Consulting 12 Pond Path North Hampton, NH 03862-2243
603-964-6526
Bruce Oliver Tim Oliver Revilo Hill Associates 7103 Laketree Drive Fairfax Station, VA 22039
703-569-6480
Matt Kahal 1108 Pheasant Crossing Charlottesville, VA 22901
[email protected]; 434-964-0604
M. Ballaban LaCapra Associates
T. Bennett S. Bobo Daymark Energy Advisors
[email protected]; [email protected];
William Dunkel and Associates 8625 Farmington Cemetery Road Pleasant Plains, IL 62677
217-626-1934
Gregory L. Booth, PE, PLS Linda Kushner PowerServices, Inc. 1616 East Millbrook Rd. Suite 210 Raleigh, NC 27609
919-256-5900
Office of Energy Resources (OER) Andrew Marcaccio, Esq. Dept. of Administration Division of Legal Services One Capitol Hill, 4th Floor Providence, RI 02908
[email protected]; 401-222-8880
Carol Grant, Commissioner Office of Energy Resources
[email protected]; 401-574-9100 [email protected]; [email protected]; [email protected] ; [email protected]; [email protected];
Conservation Law Foundation (CLF) Jerry Elmer, Esq. Max Greene, Esq. Conservation Law Foundation 235 Promenade Street Suite 560, Mailbox 28 Providence, RI 02908
[email protected]; 401-228-1904
Dept. of Navy (DON) Kelsey A. Harrer, Esq. Office of Counsel NAVFAC Atlantic, Department of the Navy 6506 Hampton Blvd. Norfolk, VA 23508-1278
[email protected]; 757-322-4119
Kay Davoodi, Director Larry R. Allen, Public Utilities Specialist Utilities Rates and Studies Office NAVFAC HQ, Department of the Navy 1322 Patterson Avenue SE Suite 1000 Washington Navy Yard, D.C. 20374
Ali Al-Jabir Brubaker and Associates 5106 Cavendish Dr. Corpus Christi, TX 78413

Maurice Brubaker Brubaker and Associates P.O. Box 412000 St Louis, Missouri 63141-2000
New Energy Rhode Island (NERI) Seth H. Handy, Esq. Handy Law, LLC 42 Weybosset St. Providence, RI 02903 The RI League of Cities and Towns c/o Brian Daniels, Executive Director One State Street, Ste. 502 Providence, RI 02908 PRISM & WCRPC c/o Jeff Broadhead, Executive Director Newport Solar c/o Doug Sabetti Green Development, LLC c/o Michelle Carpenter Clean Economy Development, LLC c/o Julian Dash ISM Solar Development, LLC c/o Michael Lucini Heartwood Group, Inc. c/o Fred Unger
[email protected]; 401-626-4839
401 272-3434
401-792-9900
401.787.5682
401.295.4998
401.435.7900
401.861.1650
Energy Consumers Alliance of NE James Rhodes Rhodes Consulting 860 West Shore Rd. Warwick, RI 02889
401-225-3441

Kat Burnham, PPL Joshua Berman, Sierra Club Noah Garcia, NRDC
[email protected]; [email protected]; [email protected];
401-276-0600
Acadia Center Robert D. Fine, Esq. Chace, Ruttenberg & Freedman, LLP One Park Row, Suite 300 Providence, RI 02903 Amy Boyd, Esq. Acadia Center 31 Milk St., Suite 501 Boston MA 02109-5128
401-453-6400 Ext. 115
[email protected]; [email protected]; 617-472-0054
Ext. 102 [email protected];
Northeast Clean Energy Council Joseph A. Keough, Jr., Esq. Keough & Sweeney 41 Mendon Ave. Pawtucket, RI 02861 Jannet Besser, NECEC
401-724-3600
[email protected]; [email protected];
The George Wiley Center John Willumsen-Friedman, Esq. Deputy Director Rhode Island Center for Justice 1 Empire Plaza, Suite 410 Providence, RI 02903 Camilo Viveros, Wiley Center
401-491-1101 Ext. 810
ChargePoint, Inc. Edward D. Pare, Jr., Esq. Brown Rudnick LLP One Financial Center Boston, MA 02111 Anne Smart, Charge Point, Inc.
617-856-8338

Direct Energy Craig R. Waksler, Esq. Eckert Seamans Cherin & Mellott, LLC Two International Place, 16th Floor Boston, MA 02110 Marc Hanks, Sr. Mgr./GRA Direct Energy Services,
[email protected]; 617-342-6800
[email protected]; [email protected]; [email protected]; 413-642-3575
Original & 9 copies file w/: Luly E. Massaro, Commission Clerk Public Utilities Commission 89 Jefferson Blvd. Warwick, RI 02888
[email protected]; 401-780-2107 [email protected];
[email protected]; [email protected] ; [email protected];
Interested Persons EERMC Marisa Desautel, Esq. Kate Desrochers
[email protected]; 401-477-0023 [email protected];
[email protected]; [email protected];
Bob Chatham [email protected]; 401-742-8264 John DiTomasso, AARP [email protected]; 401-248-2655 Frank Epps, EDP [email protected]; Matt Davey [email protected]; Nathan Phelps [email protected]; Karl Rabago [email protected]; Radina Valova, Pace Energy & Climate Ctr.
Eli Sherman, PBN [email protected]; Tim Faulkner, ecoRI News [email protected]; Douglas W. Gablinske, TEC-RI [email protected];
Joseph A. Keough, Jr., Esquire # 4925
KEOUGH & SWEENEY, LTD. 41 Mendon Avenue Pawtucket, RI 02861 (401) 724-3600 (phone) (401) 724-9909 (fax) [email protected]
JKeough
New Stamp