Bifocal Lens Inhibition of Myopia Progression Study
10
Purpose: Evidence continues to accumulate regarding the role of the peripheral retina for regulating eye growth. Corneal reshaping contact lenses have been shown to effectively slow eye growth, and the hypothesized mechanism of treatment effect is relative periph- eral myopia. Soft bifocal contact lenses with a distance center may provide a similar effect as corneal reshaping. The purpose of this study is to examine the one-year myopia control effects of soft bifo- cal contact lenses with a distance center. Methods: 40 children with -1.00 to -6.00 D myopia, less than -1.00 D astigmatism, and healthy eyes were fit with Proclear Multifocal “D” lenses with a +2.00 add. This two-year study will compare the cycloplegic spherical equivalent myopic progression between the children wearing soft bifocal contact lenses to a historical control group matched on age and gender who wear soft spherical contact lenses. These results include only information from the right eye. Results: Forty children were fit with soft bifocal contact lenses, and 28 have completed one year. Eight children have been discontinued (5 were lost to follow-up, 2 moved, and 1 had difficulty with inser- tion), and four have not yet completed one year. These results in- clude only the 28 subjects and the matched controls. The average (±SD) age was 10.8 ± 0.75 years and 10.9 ± 0.88 years (p = 0.58), the average spherical equivalent was -2.45 ± 1.03 D and -2.29 ± 0.98 D (p = 0.56), and the average axial length was 24.4 ± 0.94 mm and 24.3 ± 0.94 mm (p = 0.62) for the soft bifocal and spherical contact lens wearers, respectively. After one year, the change in spherical equivalent was -0.39 ± 0.53 D for the soft bifocal wearers and -0.60 ± 0.32 D for the soft spherical wearers (p = 0.08). The change in ax- ial length was 0.17 ± 0.21 mm for the soft bifocal wearers and 0.23 ± 0.17 mm for the soft spherical wearers (p = 0.32). With a sample size of 28 subjects, we have 75% power to detect a 50% reduction in spherical equivalent refractive error with a standard deviation of 0.50 D and assuming alpha = 0.05. Conclusion: Over one year, the myopia progressed 35% slower for the soft bifocal contact lens wearers, but the results are not statisti- cally significant for either the spherical equivalent refractive error progression or the axial elongation. The presentation will include a complete one year dataset and partial two-year results. • Power Year 1: 73% to detect a significant difference with sam- ple size of 32 (α = 0.05) • Power Year 2: 77.6% to detect a significant difference with sample size of 13 (α = 0.05) • At two years, the myopic progression is 50% slower for soft bifocal contact lens wearers (not statistically significant with preliminary data) • At two years, axial elongation is 32% slower for soft bifocal contact lens wearers (not statistically significant with prelimi- nary data) • Trial completed July 2011, so stay tuned! • 40 subjects enrolled – 32 completed one year – 14 completed two years so far • Baseline characteristics: mean ± standard deviation • Age- and gender-matched to soft spherical lens wearer from ACHIEVE Study • Baseline and annual examinations • Cycloplegia: 25 minutes after two drops of 1% tropicamide, separat- ed by 5 minutes • Refractive error: 10 autorefractor readings while fixating 20/30 let- ters located beyond infinity on Badal track • Axial length: five a-scan ultrasounds with equal lens peaks and abrupt retinal spike • Average of two eyes 1. Hung LF, Crawford ML, Smith EL. Spectacle lenses alter eye growth and the refractive status of young monkeys. Nat Med 1995;1:761-5. 2. Smith EL, Hung LF, Harwerth RS. Effects of optically induced blur on the refractive status of young monkeys. Vision Res 1994;34:293-301. 3. Wildsoet C, Wallman J. Choroidal and scleral mechanisms of compensation for spectacle lenses in chicks. Vision Res 1995;35:1175-94. 4. Smith EL, 3rd, Hung LF, Huang J. Relative peripheral hyperopic defocus alters central refrac- tive development in infant monkeys. Vision Res 2009;49:2386-92. 5. Smith EL, 3rd, Kee CS, Ramamirtham R, Qiao-Grider Y, Hung LF. Peripheral vision can influ- ence eye growth and refractive development in infant monkeys. Invest Ophthalmol Vis Sci 2005;46:3965-72. 6. Cho P, Cheung SW, Edwards M. The longitudinal orthokeratology research in children (LO- RIC) in Hong Kong: a pilot study on refractive changes and myopic control. Curr Eye Res 2005;30:71-80. 7. Walline JJ, Jones LA, Sinnott LT. Corneal reshaping and myopia progression. Br J Ophthal- mol 2009;93:1181-5. 8. Aller TA, Wildsoet C. Bifocal soft contact lenses as a possible myopia control treatment: a case report involving identical twins. Clin Exp Optom 2008;91:394-9. 9. Aller TA. Controlling myopia progression - why not try something that works for a change? Optometry and Vision Science 2009;86:55. • Eye growth influenced by location of focus of light 1-3 • Peripheral retina is more important to control eye growth than pre - viously believed to be true 4-5 • Corneal reshaping contact lenses slow eye growth in myopic chil- dren 6-7 – Mechanism of treatment effect is thought to be peripheral myo- pic blur • Distance center soft bifocal contact lenses provide similar topo- graphic profile as corneal reshaping (Figure) • To compare axial elongation and myopia progression between soft bifocal and soft spherical contact lens wearers • Sphere: –1.00 D to –6.00 D • Cylinder: Less than 1.00 DC • 20/20 or better best-corrected visual acuity in each eye • No gas permeable contact lens wear • No ocular or systemic health problems that could affect contact lens wear ABSTRACT CONCLUSIONS CONCLUSIONS METHODS REFERENCES BACKGROUND PURPOSE INCLUSION CRITERIA MYOPIA CONTROL WITH A SOFT BIFOCAL CONTACT LENS Jeffrey J. Walline, OD PhD Liz McVey, OD MS Figure. Corneal reshaping (left) and soft bifocal (right) contact lenses provide similar topographic results with a central flat portion sur- rounded by mid-peripheral steepening • If both provide peripheral myopic blur, then soft bifocal contact lenses may slow myopia progression as well • Anecdotal evidence that soft bifocal contact lenses slow myopia progression 8 • Randomized clinical trial reports significant slowing of eye growth with soft bifocal contact lenses, but not published in peer-reviewed literature 9 Contact Lenses Soft Bifocal Soft Spherical Brand Proclear Multifocal “D” Acuvue 1 Day Material omafilcon A etafilcon A Water Content 62% 58% Add Power +2.00 N/A Replacement Monthly Daily dK 27 28 Soft Bifocal Soft Spherical p-value M (D) –2.31 ± 1.05 –2.22 ± 0.97 0.75 J 0 (D) 0.00 ± 0.21 –0.07 ± 0.15 0.14 J 45 (D) +0.04 ± 0.08 +0.06 ± 0.08 0.54 Anterior Chamber Depth (mm) 3.82 ± 0.27 4.01 ± 0.24 0.002 Lens Thickness(mm) 3.45 ± 0.17 3.36 ± 0.17 0.05 Vitreous Chamber Depth (mm) 17.00 ± 1.03 16.94 ± 0.84 0.76 Axial Length (mm) 24.28 ± 0.99 24.30 ± 0.87 0.09 Soft Bifocal (n=32) Soft Spherical (n=32) p-value M –0.37 ± 0.41 –0.61 ± 0.33 0.15 J0 +0.07 ± 0.16 +0.01 ± 0.11 0.08 J45 +0.01 ± 0.10 0.00 ± 0.12 0.71 Anterior Chamber Depth +0.04 ± 0.09 –0.01 ± 0.07 0.88 Lens Thickness –0.02 ± 0.09 0.00 ± 0.06 0.71 Vitreous Chamber Depth +0.13 ± 0.15 +0.22 ± 0.16 0.08 Axial Length +0.15 ± 0.13 +0.21 ± 0.16 0.12 Soft Bifocal (n=14) Soft Spherical (n=14) p-value M –0.55 ± 0.49 –1.10± 0.54 0.12 J0 +0.15 ± 0.19 +0.06 ± 0.11 0.09 J45 +0.01 ± 0.12 –0.02 ± 0.08 0.68 Anterior Chamber Depth +0.05 ± 0.10 0.00 ± 0.10 0.57 Lens Thickness –0.01 ± 0.15 –0.01 ± 0.05 0.24 Vitreous Chamber Depth +0.28 ± 0.20 +0.48 ± 0.31 0.09 Axial Length +0.32 ± 0.16 +0.47 ± 0.33 0.18 • One year change: mean ± standard deviation, controlling for baseline Anterior Chamber Depth and Lens Thickness • Two year change: mean ± standard deviation, controlling for baseline Anterior Chamber Depth and Lens Thickness B i f o c a l L e n s I n h i b i t i o n o f M y o p i a P r o g r e s s i on S t u d y
-
Upload
khangminh22 -
Category
Documents
-
view
0 -
download
0
Transcript of Bifocal Lens Inhibition of Myopia Progression Study
Purpose: Evidence continues to accumulate regarding the role of the peripheral retina for regulating eye growth. Corneal reshaping contact lenses have been shown to effectively slow eye growth, and the hypothesized mechanism of treatment effect is relative periph-eral myopia. Soft bifocal contact lenses with a distance center may provide a similar effect as corneal reshaping. The purpose of this study is to examine the one-year myopia control effects of soft bifo-cal contact lenses with a distance center.
Methods: 40 children with -1.00 to -6.00 D myopia, less than -1.00 D astigmatism, and healthy eyes were fit with Proclear Multifocal “D” lenses with a +2.00 add. This two-year study will compare the cycloplegic spherical equivalent myopic progression between the children wearing soft bifocal contact lenses to a historical control group matched on age and gender who wear soft spherical contact lenses. These results include only information from the right eye.
Results: Forty children were fit with soft bifocal contact lenses, and 28 have completed one year. Eight children have been discontinued (5 were lost to follow-up, 2 moved, and 1 had difficulty with inser-tion), and four have not yet completed one year. These results in-clude only the 28 subjects and the matched controls. The average (±SD) age was 10.8 ± 0.75 years and 10.9 ± 0.88 years (p = 0.58), the average spherical equivalent was -2.45 ± 1.03 D and -2.29 ± 0.98 D (p = 0.56), and the average axial length was 24.4 ± 0.94 mm and 24.3 ± 0.94 mm (p = 0.62) for the soft bifocal and spherical contact lens wearers, respectively. After one year, the change in spherical equivalent was -0.39 ± 0.53 D for the soft bifocal wearers and -0.60 ± 0.32 D for the soft spherical wearers (p = 0.08). The change in ax-ial length was 0.17 ± 0.21 mm for the soft bifocal wearers and 0.23 ± 0.17 mm for the soft spherical wearers (p = 0.32). With a sample size of 28 subjects, we have 75% power to detect a 50% reduction in spherical equivalent refractive error with a standard deviation of 0.50 D and assuming alpha = 0.05.
Conclusion: Over one year, the myopia progressed 35% slower for the soft bifocal contact lens wearers, but the results are not statisti-cally significant for either the spherical equivalent refractive error progression or the axial elongation. The presentation will include a complete one year dataset and partial two-year results.
• Power Year 1: 73% to detect a significant difference with sam-ple size of 32 (α = 0.05)
• Power Year 2: 77.6% to detect a significant difference with sample size of 13 (α = 0.05)
• At two years, the myopic progression is 50% slower for soft bifocal contact lens wearers (not statistically significant with preliminary data)
• At two years, axial elongation is 32% slower for soft bifocal contact lens wearers (not statistically significant with prelimi-nary data)
• Trial completed July 2011, so stay tuned!
• 40 subjects enrolled– 32 completed one year – 14 completed two years so far
• Baseline characteristics: mean ± standard deviation
• Age- and gender-matched to soft spherical lens wearer from ACHIEVE Study
• Baseline and annual examinations• Cycloplegia: 25 minutes after two drops of 1% tropicamide, separat-
ed by 5 minutes• Refractive error: 10 autorefractor readings while fixating 20/30 let-
ters located beyond infinity on Badal track• Axial length: five a-scan ultrasounds with equal lens peaks and
abrupt retinal spike• Average of two eyes
1. Hung LF, Crawford ML, Smith EL. Spectacle lenses alter eye growth and the refractive status of young monkeys. Nat Med 1995;1:761-5.
2. Smith EL, Hung LF, Harwerth RS. Effects of optically induced blur on the refractive status of young monkeys. Vision Res 1994;34:293-301.
3. Wildsoet C, Wallman J. Choroidal and scleral mechanisms of compensation for spectacle lenses in chicks. Vision Res 1995;35:1175-94.
4. Smith EL, 3rd, Hung LF, Huang J. Relative peripheral hyperopic defocus alters central refrac-tive development in infant monkeys. Vision Res 2009;49:2386-92.
5. Smith EL, 3rd, Kee CS, Ramamirtham R, Qiao-Grider Y, Hung LF. Peripheral vision can influ-ence eye growth and refractive development in infant monkeys. Invest Ophthalmol Vis Sci 2005;46:3965-72.
6. Cho P, Cheung SW, Edwards M. The longitudinal orthokeratology research in children (LO-RIC) in Hong Kong: a pilot study on refractive changes and myopic control. Curr Eye Res 2005;30:71-80.
7. Walline JJ, Jones LA, Sinnott LT. Corneal reshaping and myopia progression. Br J Ophthal-mol 2009;93:1181-5.
8. Aller TA, Wildsoet C. Bifocal soft contact lenses as a possible myopia control treatment: a case report involving identical twins. Clin Exp Optom 2008;91:394-9.
9. Aller TA. Controlling myopia progression - why not try something that works for a change? Optometry and Vision Science 2009;86:55.
• Eye growth influenced by location of focus of light1-3
• Peripheral retina is more important to control eye growth than pre-viously believed to be true4-5
• Corneal reshaping contact lenses slow eye growth in myopic chil-dren6-7
– Mechanism of treatment effect is thought to be peripheral myo-pic blur
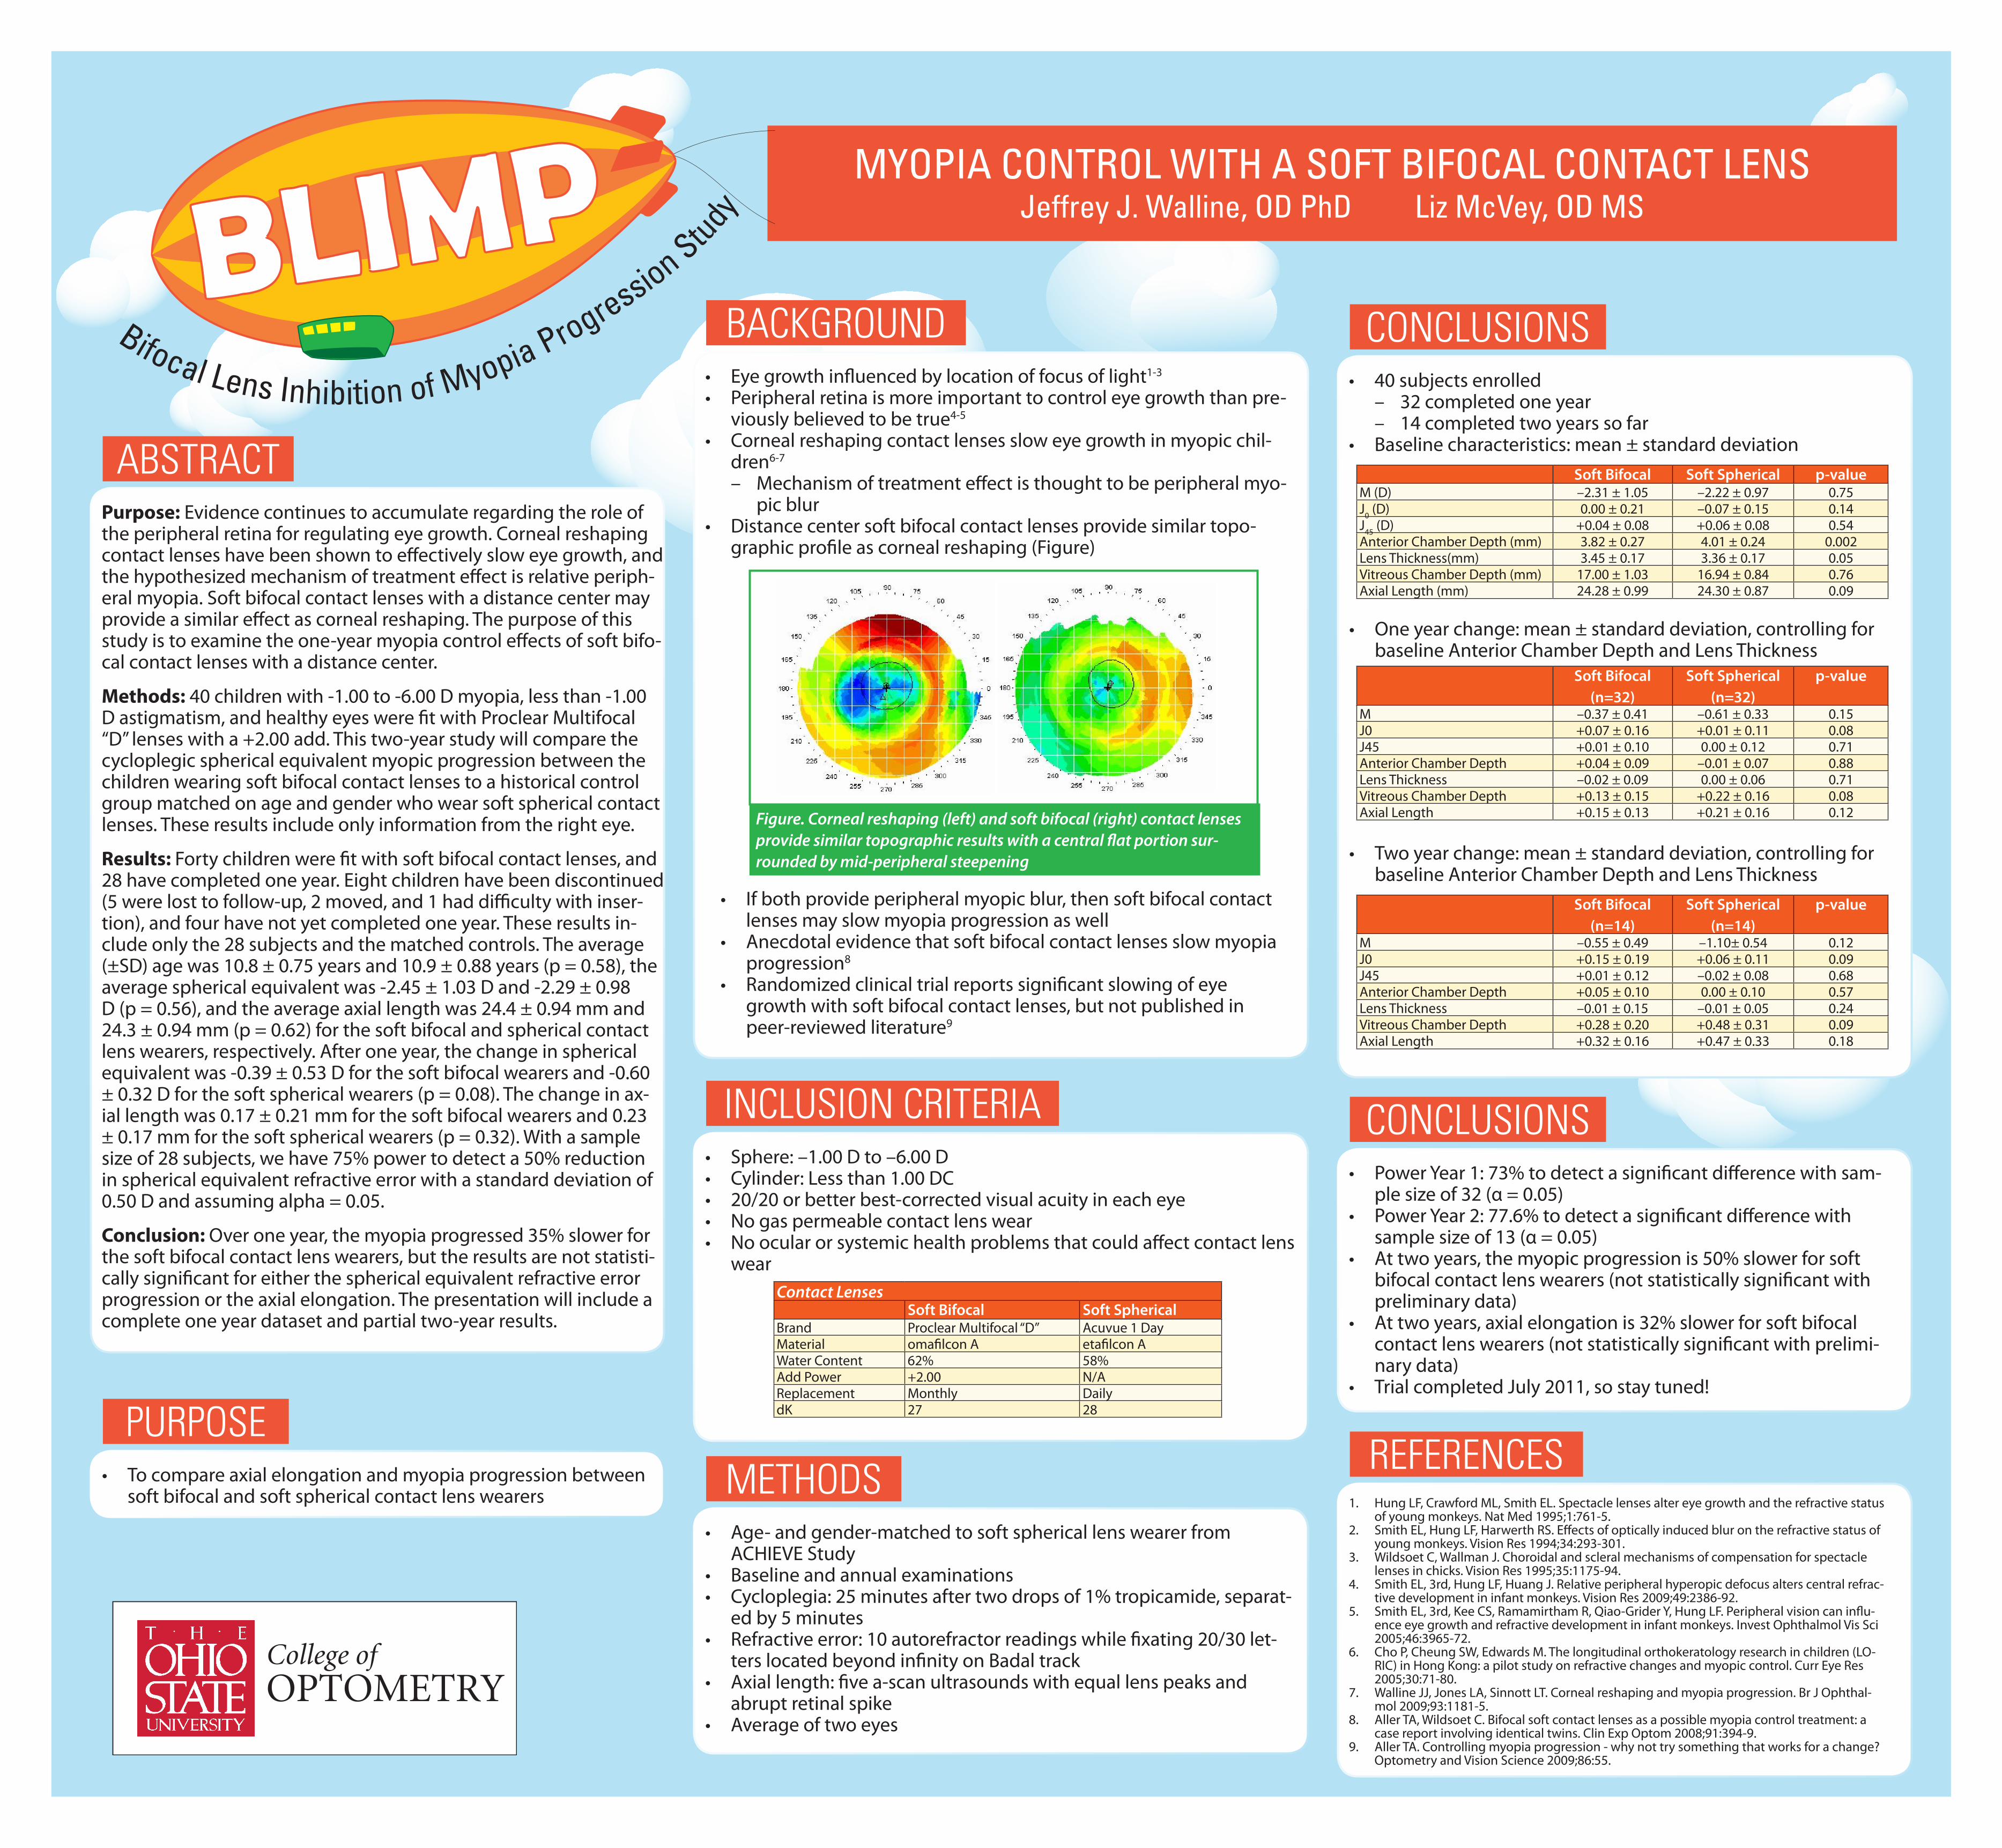
• Distance center soft bifocal contact lenses provide similar topo-graphic profile as corneal reshaping (Figure)
• To compare axial elongation and myopia progression between soft bifocal and soft spherical contact lens wearers
• Sphere: –1.00 D to –6.00 D• Cylinder: Less than 1.00 DC• 20/20 or better best-corrected visual acuity in each eye• No gas permeable contact lens wear• No ocular or systemic health problems that could affect contact lens
wear
ABSTRACT
CONCLUSIONS
CONCLUSIONS
METHODSREFERENCES
BACKGROUND
PURPOSE
INCLUSION CRITERIA
MYOPIA CONTROL WITH A SOFT BIFOCAL CONTACT LENS Jeffrey J. Walline, OD PhD Liz McVey, OD MS
Figure. Corneal reshaping (left) and soft bifocal (right) contact lenses provide similar topographic results with a central flat portion sur-rounded by mid-peripheral steepening
• If both provide peripheral myopic blur, then soft bifocal contact lenses may slow myopia progression as well
• Anecdotal evidence that soft bifocal contact lenses slow myopia progression8
• Randomized clinical trial reports significant slowing of eye growth with soft bifocal contact lenses, but not published in peer-reviewed literature9
Contact LensesSoft Bifocal Soft Spherical
Brand Proclear Multifocal “D” Acuvue 1 DayMaterial omafilcon A etafilcon AWater Content 62% 58%Add Power +2.00 N/AReplacement Monthly DailydK 27 28
Soft Bifocal Soft Spherical p-valueM (D) –2.31 ± 1.05 –2.22 ± 0.97 0.75J
0 (D) 0.00 ± 0.21 –0.07 ± 0.15 0.14
J45
(D) +0.04 ± 0.08 +0.06 ± 0.08 0.54Anterior Chamber Depth (mm) 3.82 ± 0.27 4.01 ± 0.24 0.002Lens Thickness(mm) 3.45 ± 0.17 3.36 ± 0.17 0.05Vitreous Chamber Depth (mm) 17.00 ± 1.03 16.94 ± 0.84 0.76Axial Length (mm) 24.28 ± 0.99 24.30 ± 0.87 0.09
Soft Bifocal (n=32)
Soft Spherical (n=32)
p-value
M –0.37 ± 0.41 –0.61 ± 0.33 0.15J0 +0.07 ± 0.16 +0.01 ± 0.11 0.08J45 +0.01 ± 0.10 0.00 ± 0.12 0.71Anterior Chamber Depth +0.04 ± 0.09 –0.01 ± 0.07 0.88Lens Thickness –0.02 ± 0.09 0.00 ± 0.06 0.71Vitreous Chamber Depth +0.13 ± 0.15 +0.22 ± 0.16 0.08Axial Length +0.15 ± 0.13 +0.21 ± 0.16 0.12
Soft Bifocal (n=14)
Soft Spherical (n=14)
p-value
M –0.55 ± 0.49 –1.10± 0.54 0.12J0 +0.15 ± 0.19 +0.06 ± 0.11 0.09J45 +0.01 ± 0.12 –0.02 ± 0.08 0.68Anterior Chamber Depth +0.05 ± 0.10 0.00 ± 0.10 0.57Lens Thickness –0.01 ± 0.15 –0.01 ± 0.05 0.24Vitreous Chamber Depth +0.28 ± 0.20 +0.48 ± 0.31 0.09Axial Length +0.32 ± 0.16 +0.47 ± 0.33 0.18
• One year change: mean ± standard deviation, controlling for baseline Anterior Chamber Depth and Lens Thickness
• Two year change: mean ± standard deviation, controlling for baseline Anterior Chamber Depth and Lens Thickness
Bifocal Lens Inhibition of Myopia Progression Study
y = -5E+08x + 1E+09
R² = 0.0069
0.00E+00
5.00E+08
1.00E+09
1.50E+09
2.00E+09
2.50E+09
3.00E+09
3.50E+09
4.00E+09
-0.5 -0.4 -0.3 -0.2 -0.1 0 0.1 0.2
Cu
mu
lati
ve
Lig
ht
Ex
po
su
re (
Lu
x)
Change in Refraction (D)
Refractive Error Progression and Light Exposure
y = 1E+06x - 1E+07
R² = 0.9449
0.00E+00
1.00E+07
2.00E+07
3.00E+07
4.00E+07
5.00E+07
6.00E+07
7.00E+07
8.00E+07
9.00E+07
1.00E+08
0 10 20 30 40 50 60 70 80 90 100
Cu
mu
lati
ve
Lig
ht
Ex
po
su
re (
Lu
x)
Time (Hours)
Average Cumulative Weekly Indoor Light Exposure
y = 4E+07x + 9E+07
R² = 0.2956
0.00E+00
2.00E+08
4.00E+08
6.00E+08
8.00E+08
1.00E+09
1.20E+09
1.40E+09
1.60E+09
0 2 4 6 8 10 12 14 16 18 20
Cu
mu
lati
ve
Lig
ht
Ex
po
su
re (
Lu
x)
Time (Hours)
Average Cumulative Weekly Outdoor Light Exposure
0.00E+00
2.00E+04
4.00E+04
6.00E+04
8.00E+04
1.00E+05
1.20E+05
1.40E+05
1.60E+05
1.80E+05
2.00E+05
0 20 40 60 80 100 120 140 160 180
Illu
min
ati
on
(Lu
x)
Time (Hours)
Individual Illumination Profile for Seven Days (10 Second Measurements)
Light Exposure Patterns in Children - A Pilot Study
Simon Backhouse1, Hannah Ng2, John Phillips1 1. Department of Optometry and Vision Science, NZ National Eye Centre, The University of Auckland,
New Zealand. 2. LENScience, Liggins Institute, The University of Auckland, New Zealand
Email: [email protected]
y = -4E+06x + 5E+08
R² = 0.0009
0.00E+00
2.00E+08
4.00E+08
6.00E+08
8.00E+08
1.00E+09
1.20E+09
1.40E+09
1.60E+09
1.80E+09
-7 -6 -5 -4 -3 -2 -1 0 1 2
Cu
mu
lati
ve
Lig
ht
Ex
po
su
re (
Lu
x)
Refraction (D)
Average Cumulative Weekly Light Exposure
0.00E+00
2.50E+08
5.00E+08
7.50E+08
1.00E+09
1.25E+09
1.50E+09
1.75E+09
2.00E+09
2.25E+09
2.50E+09
2.75E+09
3.00E+09
3.25E+09
3.50E+09
3.75E+09
4.00E+09
0 2 4 6 8 1012141618202224262830323436384042444648505254565860626466687072747678808284
Cu
mu
lati
ve
Lig
ht
Ex
po
su
re (
Lu
x)
Weekly Time Outdoors (Hours, from a maximum of 84 hours)
Modelling Cumulative Light Exposure Per Week
Outdoors
Indoors
Cumulative total light exposure with a weekly outdoor exposure component of: 3 hours = 2.02E+08 lux 13 hours = 6.24E+08 lux
0
10
20
30
40
50
60
70
80
90
100
0 2 4 6 8 10 12 14 16 18 20 22 24 26 28 30 32 34 36 38 40 42 44 46 48 50 52 54 56 58 60 62 64 66 68 70 72 74 76 78 80 82 84
Pro
po
rtio
n o
f C
um
ula
tive
Lig
ht
Ex
po
su
re (
%)
Weekly Time Outdoors (Hours, from a maximum of 84 hours)
Modelling Proportion of Light Exposure Per Week
Outdoors
Indoors
Proportion of total light exposure resulting from a weekly outdoor exposure of: 3 hours = 63.90% 13 hours = 89.74%
Purpose
• To examine the light exposure patterns of school-aged children in relation to refractive error.
Methods
• School-aged children (13-14 years old, n = 12) were issued with self- contained light meters that recorded the individual light exposure levels every 10 seconds (HOBO Pendant UA-002-064, Onset Computer Corporation, USA) [Fig. 1 and Fig. 2A].
• The ambient outdoor light levels were also recorded every 10 seconds over seven days (one period) [Fig. 2B].
• Measurements were made in three periods over three consecutive months in Southern Hemisphere winter (June, July, August).
• Cycloplegic autorefraction and axial length measurements were made at the beginning and end of the three month study.
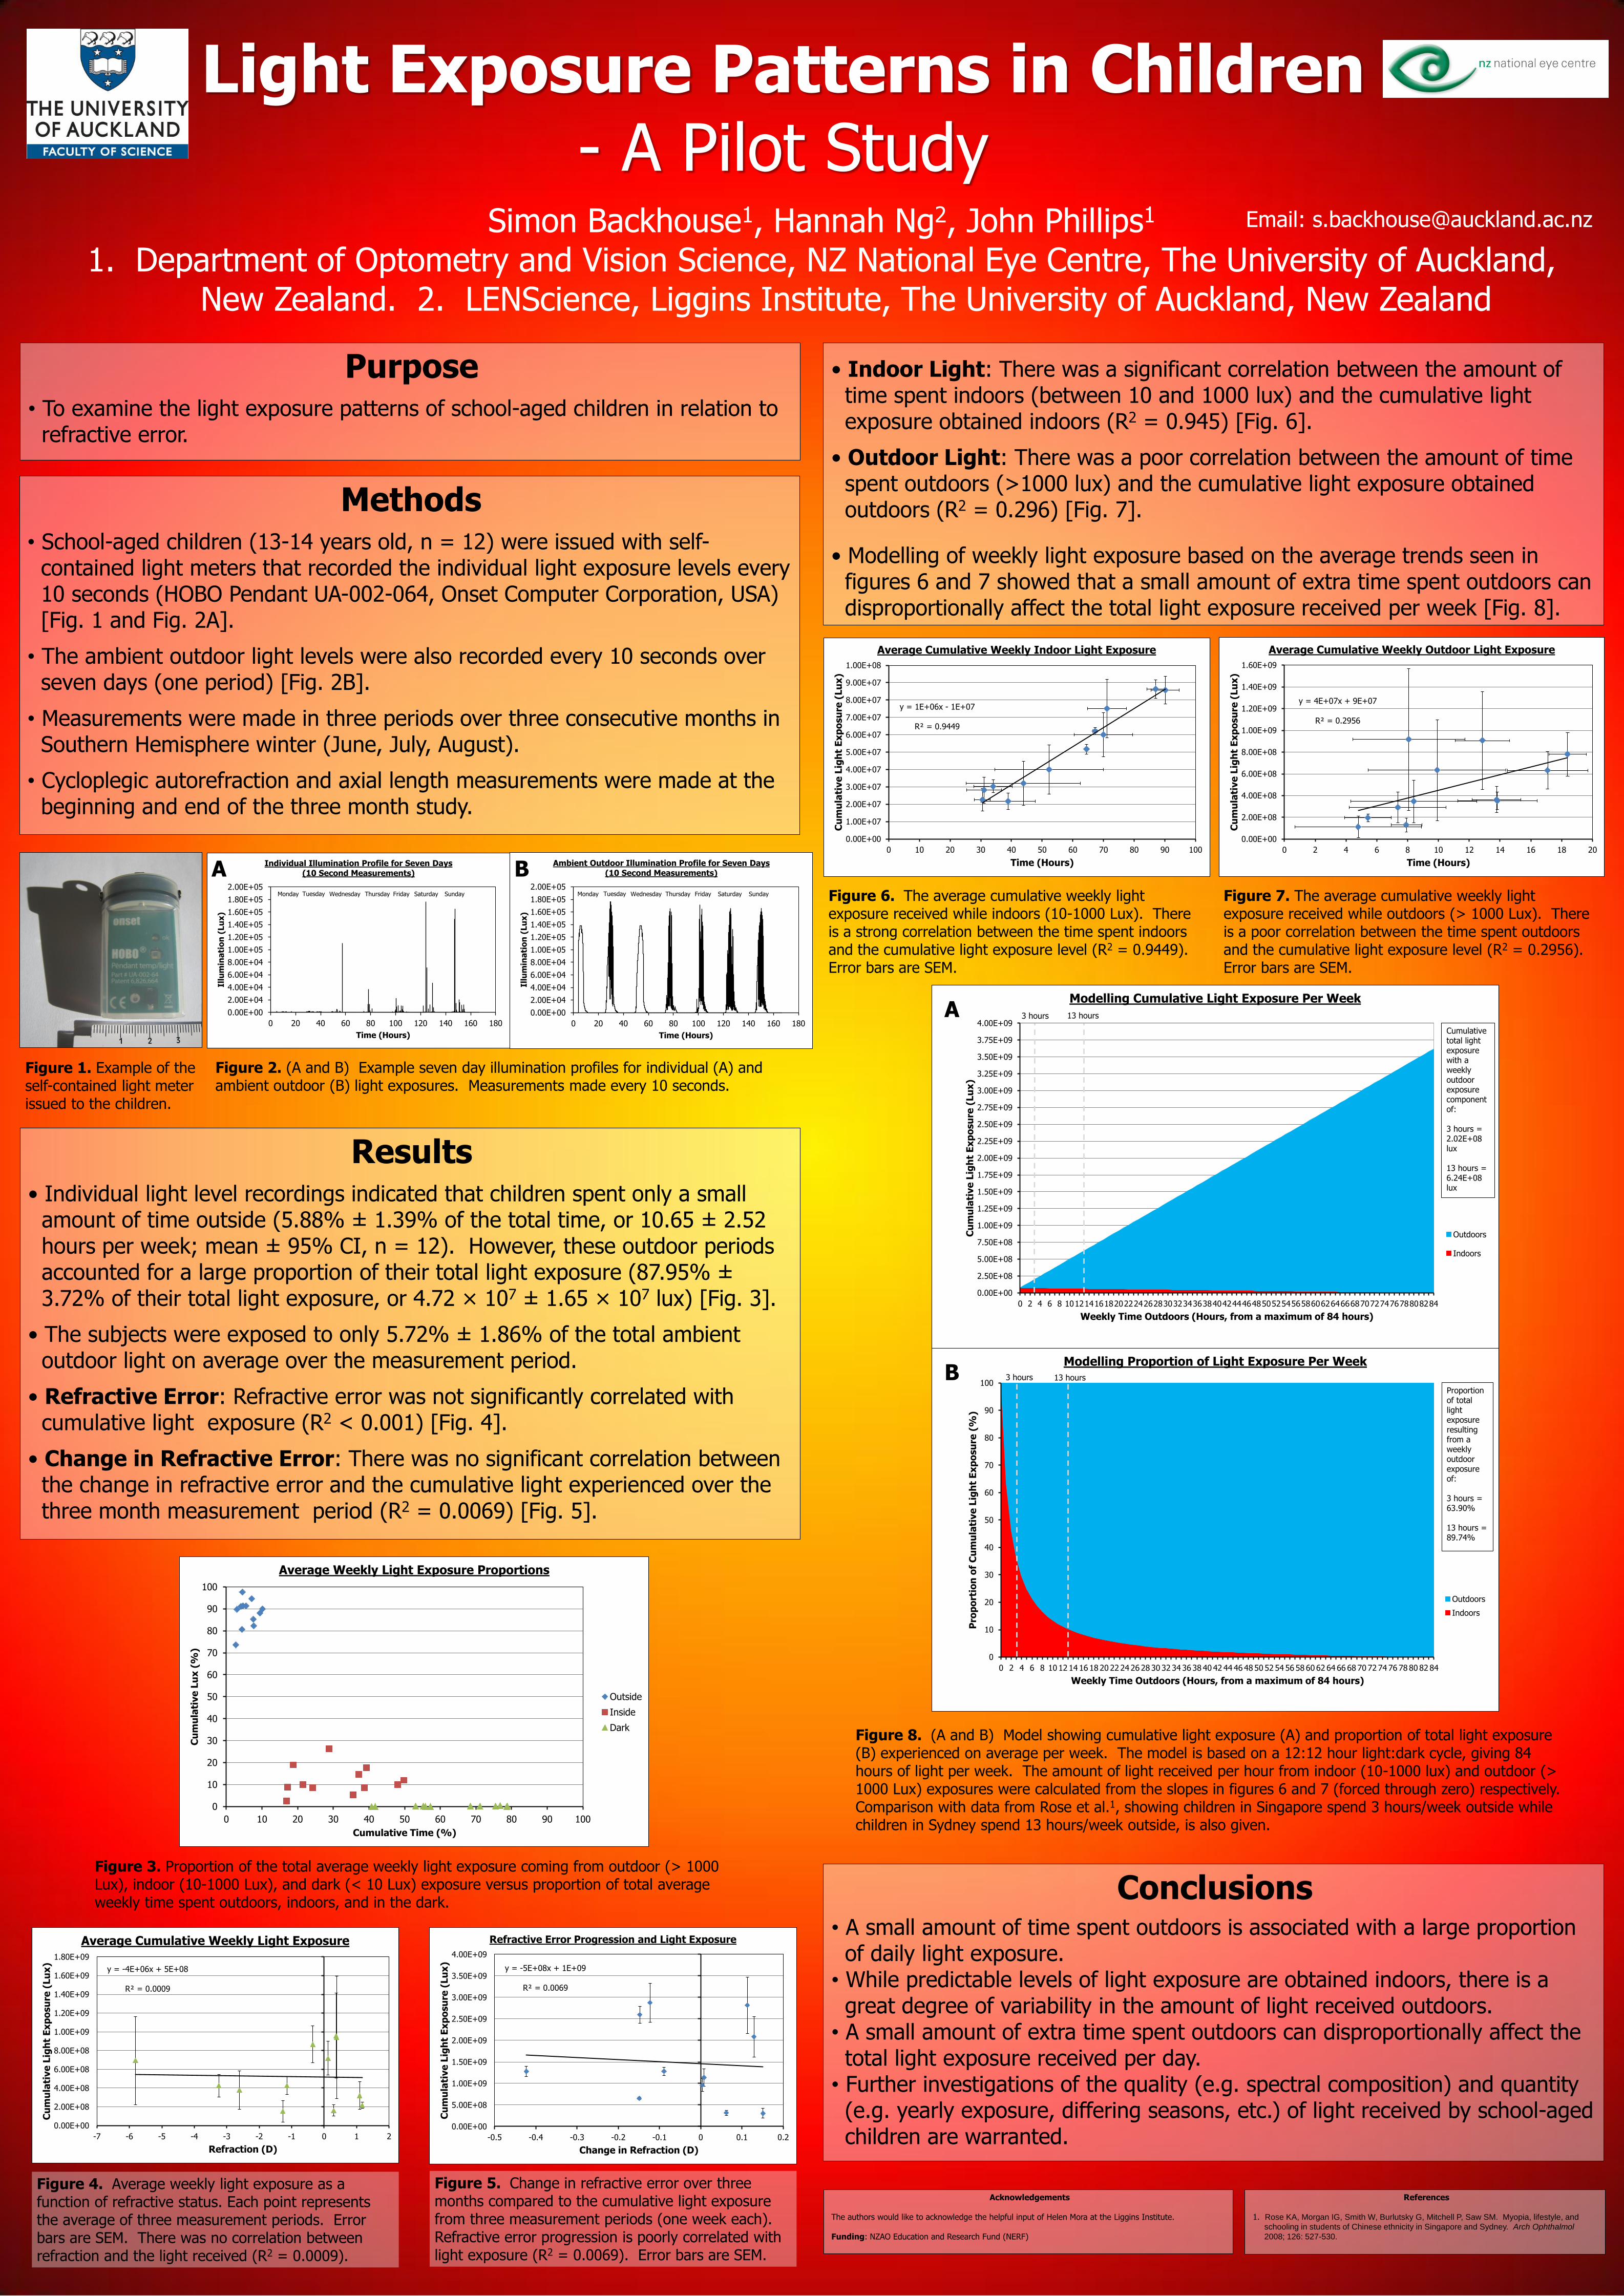
• Indoor Light: There was a significant correlation between the amount of time spent indoors (between 10 and 1000 lux) and the cumulative light exposure obtained indoors (R2 = 0.945) [Fig. 6].
• Outdoor Light: There was a poor correlation between the amount of time spent outdoors (>1000 lux) and the cumulative light exposure obtained outdoors (R2 = 0.296) [Fig. 7].
• Modelling of weekly light exposure based on the average trends seen in figures 6 and 7 showed that a small amount of extra time spent outdoors can disproportionally affect the total light exposure received per week [Fig. 8].
Figure 1. Example of the self-contained light meter issued to the children.
Figure 2. (A and B) Example seven day illumination profiles for individual (A) and ambient outdoor (B) light exposures. Measurements made every 10 seconds.
Figure 8. (A and B) Model showing cumulative light exposure (A) and proportion of total light exposure (B) experienced on average per week. The model is based on a 12:12 hour light:dark cycle, giving 84 hours of light per week. The amount of light received per hour from indoor (10-1000 lux) and outdoor (> 1000 Lux) exposures were calculated from the slopes in figures 6 and 7 (forced through zero) respectively. Comparison with data from Rose et al.1, showing children in Singapore spend 3 hours/week outside while children in Sydney spend 13 hours/week outside, is also given.
Figure 3. Proportion of the total average weekly light exposure coming from outdoor (> 1000 Lux), indoor (10-1000 Lux), and dark (< 10 Lux) exposure versus proportion of total average weekly time spent outdoors, indoors, and in the dark.
Figure 6. The average cumulative weekly light exposure received while indoors (10-1000 Lux). There is a strong correlation between the time spent indoors and the cumulative light exposure level (R2 = 0.9449). Error bars are SEM.
Figure 7. The average cumulative weekly light exposure received while outdoors (> 1000 Lux). There is a poor correlation between the time spent outdoors and the cumulative light exposure level (R2 = 0.2956). Error bars are SEM.
Figure 4. Average weekly light exposure as a function of refractive status. Each point represents the average of three measurement periods. Error bars are SEM. There was no correlation between refraction and the light received (R2 = 0.0009).
Conclusions
• A small amount of time spent outdoors is associated with a large proportion of daily light exposure. • While predictable levels of light exposure are obtained indoors, there is a great degree of variability in the amount of light received outdoors. • A small amount of extra time spent outdoors can disproportionally affect the total light exposure received per day. • Further investigations of the quality (e.g. spectral composition) and quantity (e.g. yearly exposure, differing seasons, etc.) of light received by school-aged children are warranted.
Acknowledgements
The authors would like to acknowledge the helpful input of Helen Mora at the Liggins Institute. Funding: NZAO Education and Research Fund (NERF)
References
1. Rose KA, Morgan IG, Smith W, Burlutsky G, Mitchell P, Saw SM. Myopia, lifestyle, and
schooling in students of Chinese ethnicity in Singapore and Sydney. Arch Ophthalmol
2008; 126: 527-530.
0
10
20
30
40
50
60
70
80
90
100
0 10 20 30 40 50 60 70 80 90 100
Cu
mu
lati
ve
Lu
x (
%)
Cumulative Time (%)
Average Weekly Light Exposure Proportions
Outside
Inside
Dark
Figure 5. Change in refractive error over three months compared to the cumulative light exposure from three measurement periods (one week each). Refractive error progression is poorly correlated with light exposure (R2 = 0.0069). Error bars are SEM.
0.00E+00
2.00E+04
4.00E+04
6.00E+04
8.00E+04
1.00E+05
1.20E+05
1.40E+05
1.60E+05
1.80E+05
2.00E+05
0 20 40 60 80 100 120 140 160 180
Illu
min
ati
on
(Lu
x)
Time (Hours)
Ambient Outdoor Illumination Profile for Seven Days (10 Second Measurements)
Monday Tuesday Wednesday Thursday Friday Saturday Sunday
A B
A
B
Results
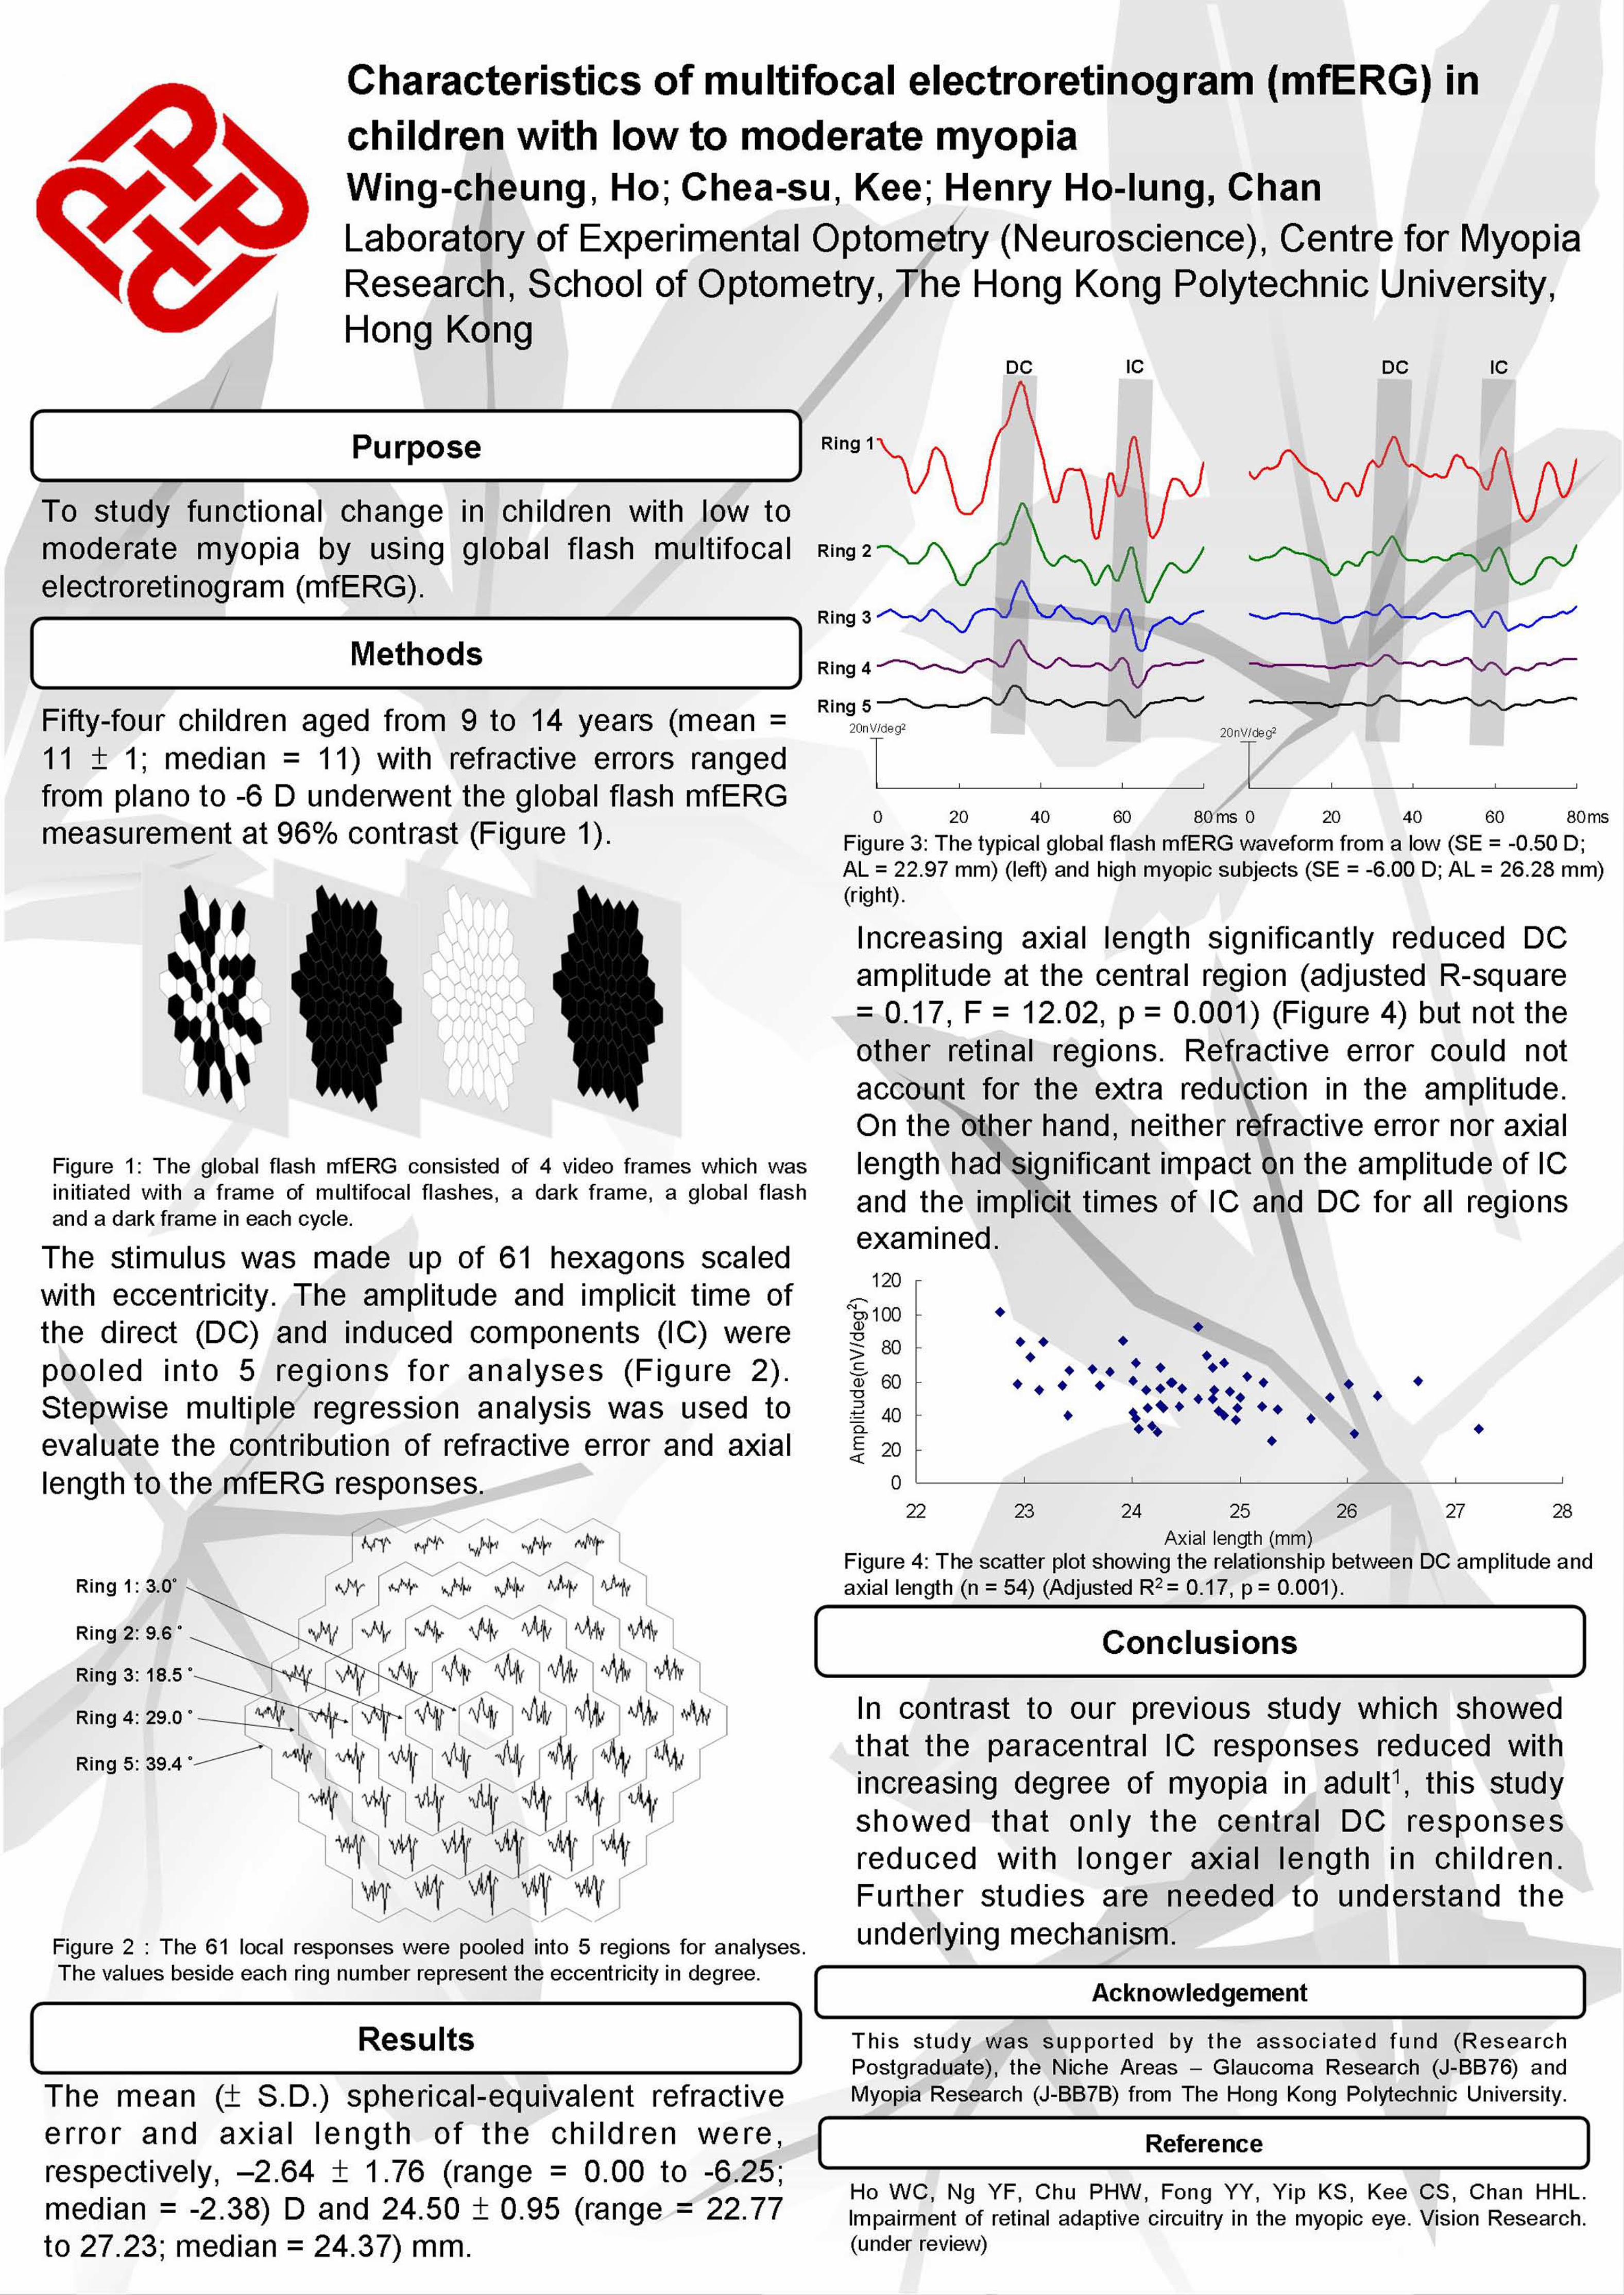
• Individual light level recordings indicated that children spent only a small amount of time outside (5.88% ± 1.39% of the total time, or 10.65 ± 2.52 hours per week; mean ± 95% CI, n = 12). However, these outdoor periods accounted for a large proportion of their total light exposure (87.95% ± 3.72% of their total light exposure, or 4.72 × 10⁷ ± 1.65 × 10⁷ lux) [Fig. 3].
• The subjects were exposed to only 5.72% ± 1.86% of the total ambient outdoor light on average over the measurement period.
• Refractive Error: Refractive error was not significantly correlated with cumulative light exposure (R2 < 0.001) [Fig. 4].
• Change in Refractive Error: There was no significant correlation between the change in refractive error and the cumulative light experienced over the three month measurement period (R2 = 0.0069) [Fig. 5].
3 hours 13 hours
3 hours 13 hours
Monday Tuesday Wednesday Thursday Friday Saturday Sunday
Myopic reduction after sport activity
Jorge Jorge, José González-Méijome, Rui Ramoa-Marques, Carla Casal
CEORLab: Clinical & Experimental Optometry Research Lab. Center of Physics. University of Minho. Portugal.
Introduction
In Europe the prevalence rates of myopia in adults and young adults vary around the 20% and
30% in south Europe and around 30 and 50% in north Europe. Such variability of myopia
prevalence around the world could indicate some influence of the environmental factors as
near work activities, education or light exposure. Rose et al found a significant association
between the time spent in outdoor activity and myopia prevalence. They concluded that
higher levels of total time spent outdoors were associated with less myopia and a more
hyperopic mean refraction. Some other studies report the same association between outdoor
activity and lower myopia prevalence rates and a more hyperopic refractive error. However
these studies fail to prove the association between sport activities and refractive error.
Results
Conclusions
With this work, we cannot establish a direct relation between myopia prevalence or
degree and sport activity, but we can say that the practice of a sport activity induce a
temporary myopic reduction and it is probably produced by changes in
accommodation, since the ocular parameters remain unchanged. This effect,
although in the opposite direction, is similar to what occurs after sustained near-work
activities.
Sport activities could have some influence in temporary myopic reduction; however,
it is necessary to study the effect over time of this refractive alteration.
Bibliography
Acknowledgements The authors thanks to the all participants in this study.
And to the Sport and Culture Department of the Social
Services of the University of Minho.
Purpose
The aim of this study was to evaluate the influence of sport activity in refractive error and potentially related ocular parameters that could explain any significant change.
Methods Age ranged from 15 to 54 years (mean ± SD, 25.7 ± 8.4)
Using the same procedure, the refractive error and the ocular parameters are measured before the subject staring their
usual sport activity and repeated after one hour of sport activity. The sport activity was performed in a gym with a glass
wall overlooking a garden. Each subject performed their sport activity as it normally does and was not required any
activity in particular or any specific speed or performance requirement.
The refractive error was measured using an open field auto-refractor Grand Seiko Auto Ref/Keratometer WAM-5500. The
ocular parameters including corneal curvature, anterior chamber depth (ACD), and axial length (AL) were assessed with
IOL Master. Three readings of each parameter were taken and averaged.
Sphero-cylindrical refractive results were converted into vector representations by Fourier analysis, M, J0 and J45.
Myopia was defined as M≤ –0.50 D, emmetropia as M > –0.50 D and < +0.50 D and hyperopia as M ≥ +0.50 D.
Data were analyzed using the statistical package SPSS version 18.0
138 72
1 hour
+ +
a) Wilcoxon signed rank test; b) Paired sample t test ; c) Kruskal Wallis test
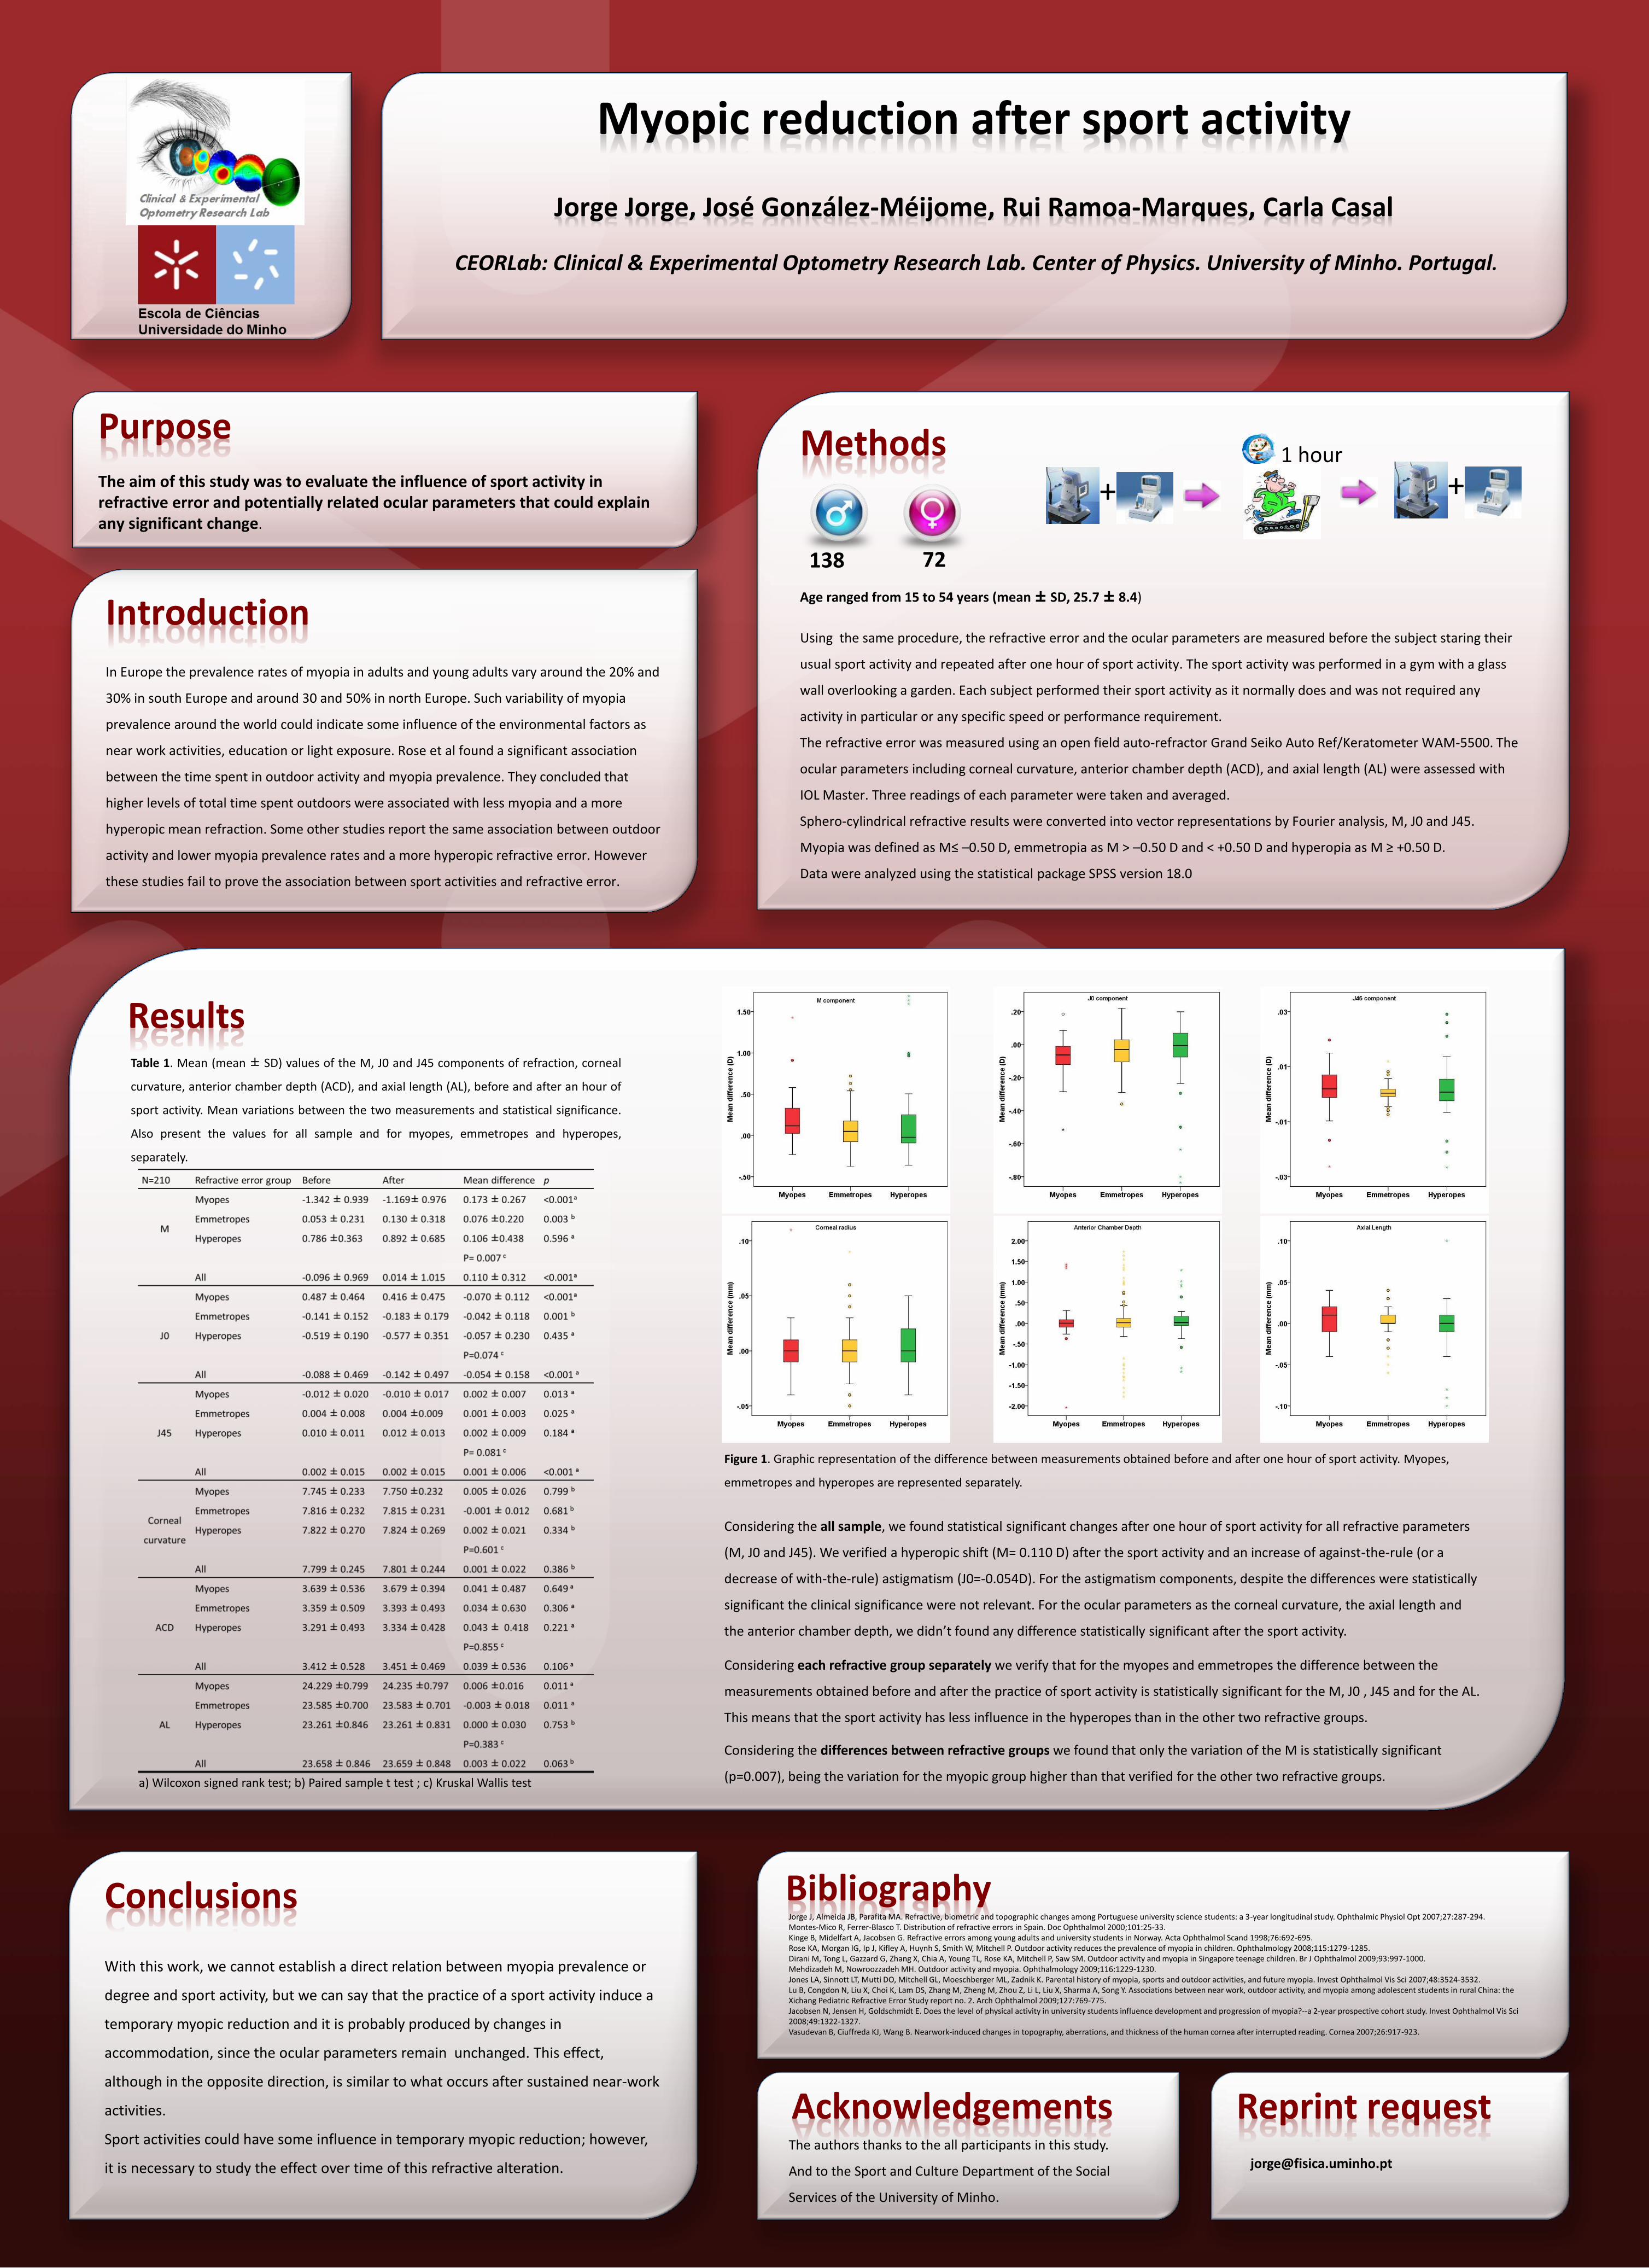
Considering the all sample, we found statistical significant changes after one hour of sport activity for all refractive parameters
(M, J0 and J45). We verified a hyperopic shift (M= 0.110 D) after the sport activity and an increase of against-the-rule (or a
decrease of with-the-rule) astigmatism (J0=-0.054D). For the astigmatism components, despite the differences were statistically
significant the clinical significance were not relevant. For the ocular parameters as the corneal curvature, the axial length and
the anterior chamber depth, we didn’t found any difference statistically significant after the sport activity.
Considering each refractive group separately we verify that for the myopes and emmetropes the difference between the
measurements obtained before and after the practice of sport activity is statistically significant for the M, J0 , J45 and for the AL.
This means that the sport activity has less influence in the hyperopes than in the other two refractive groups.
Considering the differences between refractive groups we found that only the variation of the M is statistically significant
(p=0.007), being the variation for the myopic group higher than that verified for the other two refractive groups.
Table 1. Mean (mean ± SD) values of the M, J0 and J45 components of refraction, corneal
curvature, anterior chamber depth (ACD), and axial length (AL), before and after an hour of
sport activity. Mean variations between the two measurements and statistical significance.
Also present the values for all sample and for myopes, emmetropes and hyperopes,
separately.
Figure 1. Graphic representation of the difference between measurements obtained before and after one hour of sport activity. Myopes,
emmetropes and hyperopes are represented separately.
Reprint request
Jorge J, Almeida JB, Parafita MA. Refractive, biometric and topographic changes among Portuguese university science students: a 3-year longitudinal study. Ophthalmic Physiol Opt 2007;27:287-294. Montes-Mico R, Ferrer-Blasco T. Distribution of refractive errors in Spain. Doc Ophthalmol 2000;101:25-33. Kinge B, Midelfart A, Jacobsen G. Refractive errors among young adults and university students in Norway. Acta Ophthalmol Scand 1998;76:692-695. Rose KA, Morgan IG, Ip J, Kifley A, Huynh S, Smith W, Mitchell P. Outdoor activity reduces the prevalence of myopia in children. Ophthalmology 2008;115:1279-1285. Dirani M, Tong L, Gazzard G, Zhang X, Chia A, Young TL, Rose KA, Mitchell P, Saw SM. Outdoor activity and myopia in Singapore teenage children. Br J Ophthalmol 2009;93:997-1000. Mehdizadeh M, Nowroozzadeh MH. Outdoor activity and myopia. Ophthalmology 2009;116:1229-1230. Jones LA, Sinnott LT, Mutti DO, Mitchell GL, Moeschberger ML, Zadnik K. Parental history of myopia, sports and outdoor activities, and future myopia. Invest Ophthalmol Vis Sci 2007;48:3524-3532. Lu B, Congdon N, Liu X, Choi K, Lam DS, Zhang M, Zheng M, Zhou Z, Li L, Liu X, Sharma A, Song Y. Associations between near work, outdoor activity, and myopia among adolescent students in rural China: the Xichang Pediatric Refractive Error Study report no. 2. Arch Ophthalmol 2009;127:769-775. Jacobsen N, Jensen H, Goldschmidt E. Does the level of physical activity in university students influence development and progression of myopia?--a 2-year prospective cohort study. Invest Ophthalmol Vis Sci 2008;49:1322-1327. Vasudevan B, Ciuffreda KJ, Wang B. Nearwork-induced changes in topography, aberrations, and thickness of the human cornea after interrupted reading. Cornea 2007;26:917-923.
PURPOSE
.
.
.
DISCUSSION AND CONCLUSIONS
.
Two year follow-up of refractive error progression and optical component changes
of college students
Manho Jang 1), OD · Dongpil Kim2), MPH · Hang-woon Baik3), MD ·Seung-sun Baek 4), PhD, FIACLE ·Hun-soo Kim5),
PhD · Ki-choong Mah2), PhD, FIACLE, FAAO1)SOMO Optical Co. Seoul Korea, 2) Graduate school of Eulji University, 3) School of Medicine Eulji University, 4) Daejeon Health Science College, 5) College of Health and Sports Science, Daejeon University.
To elucidate which aspects affect refractive error progression in
young adulthood.
E-mail : [email protected]
RESULTS
METHODS
Cycloplegic refractive error was measured by Canon RK-F1. And
anterior chamber depth(ACD), corneal radius(CR) and axial length(AL)
were measured by IOLMaster on 74 eyes of 37 young adults in 2008
and 2010. Initial age ranged between 18 and 21.
Table 1. Mean values of ocular components in 2008 and 2010.
SER: spherical equivalent of refractive error, CR: corneal radius, AL: axial length, AL/CR ratio: axial length/corneal
radius, ACD: anterior chamber depth.
Myopia increased by an average of 0.305±0.430D(t=6.115, p=0.000)
between 2008 and 2010[Table 1]. A significant correlation was found
between changes in SE and CR(r=0.282, p=0.015) and in SE and
AL/CR ratio(r=-0.240, p=0.039). But no significant correlation between
change in SE and AL(r=-0.102, p=0.388) was found[Table 2].
Table 2. The results of ordinal correlation(pearson’s) for variable
constants in ocular components changes.
SER: spherical equivalent of refractive error, CR: corneal radius, AL: axial length, AL/CR
ratio: axial length/corneal radius, ACD: anterior chamber depth.
2008
(n=74 eyes)
2010
(n=74 eyes)
Difference
Variables Mean±SD Mean(±SD) Mean(±SD)
SER (D) -2.466±2.823 -2.772±3.153 0.305±0.430
CR(mm) 7.779±0.244 7.775±0.251 0.004±0.035
ACD(mm) 3.760±0.227 3.758±0.245 0.002±0.069
AL(mm) 24.722±1.439 24.767±1.446 -0.044±0.188
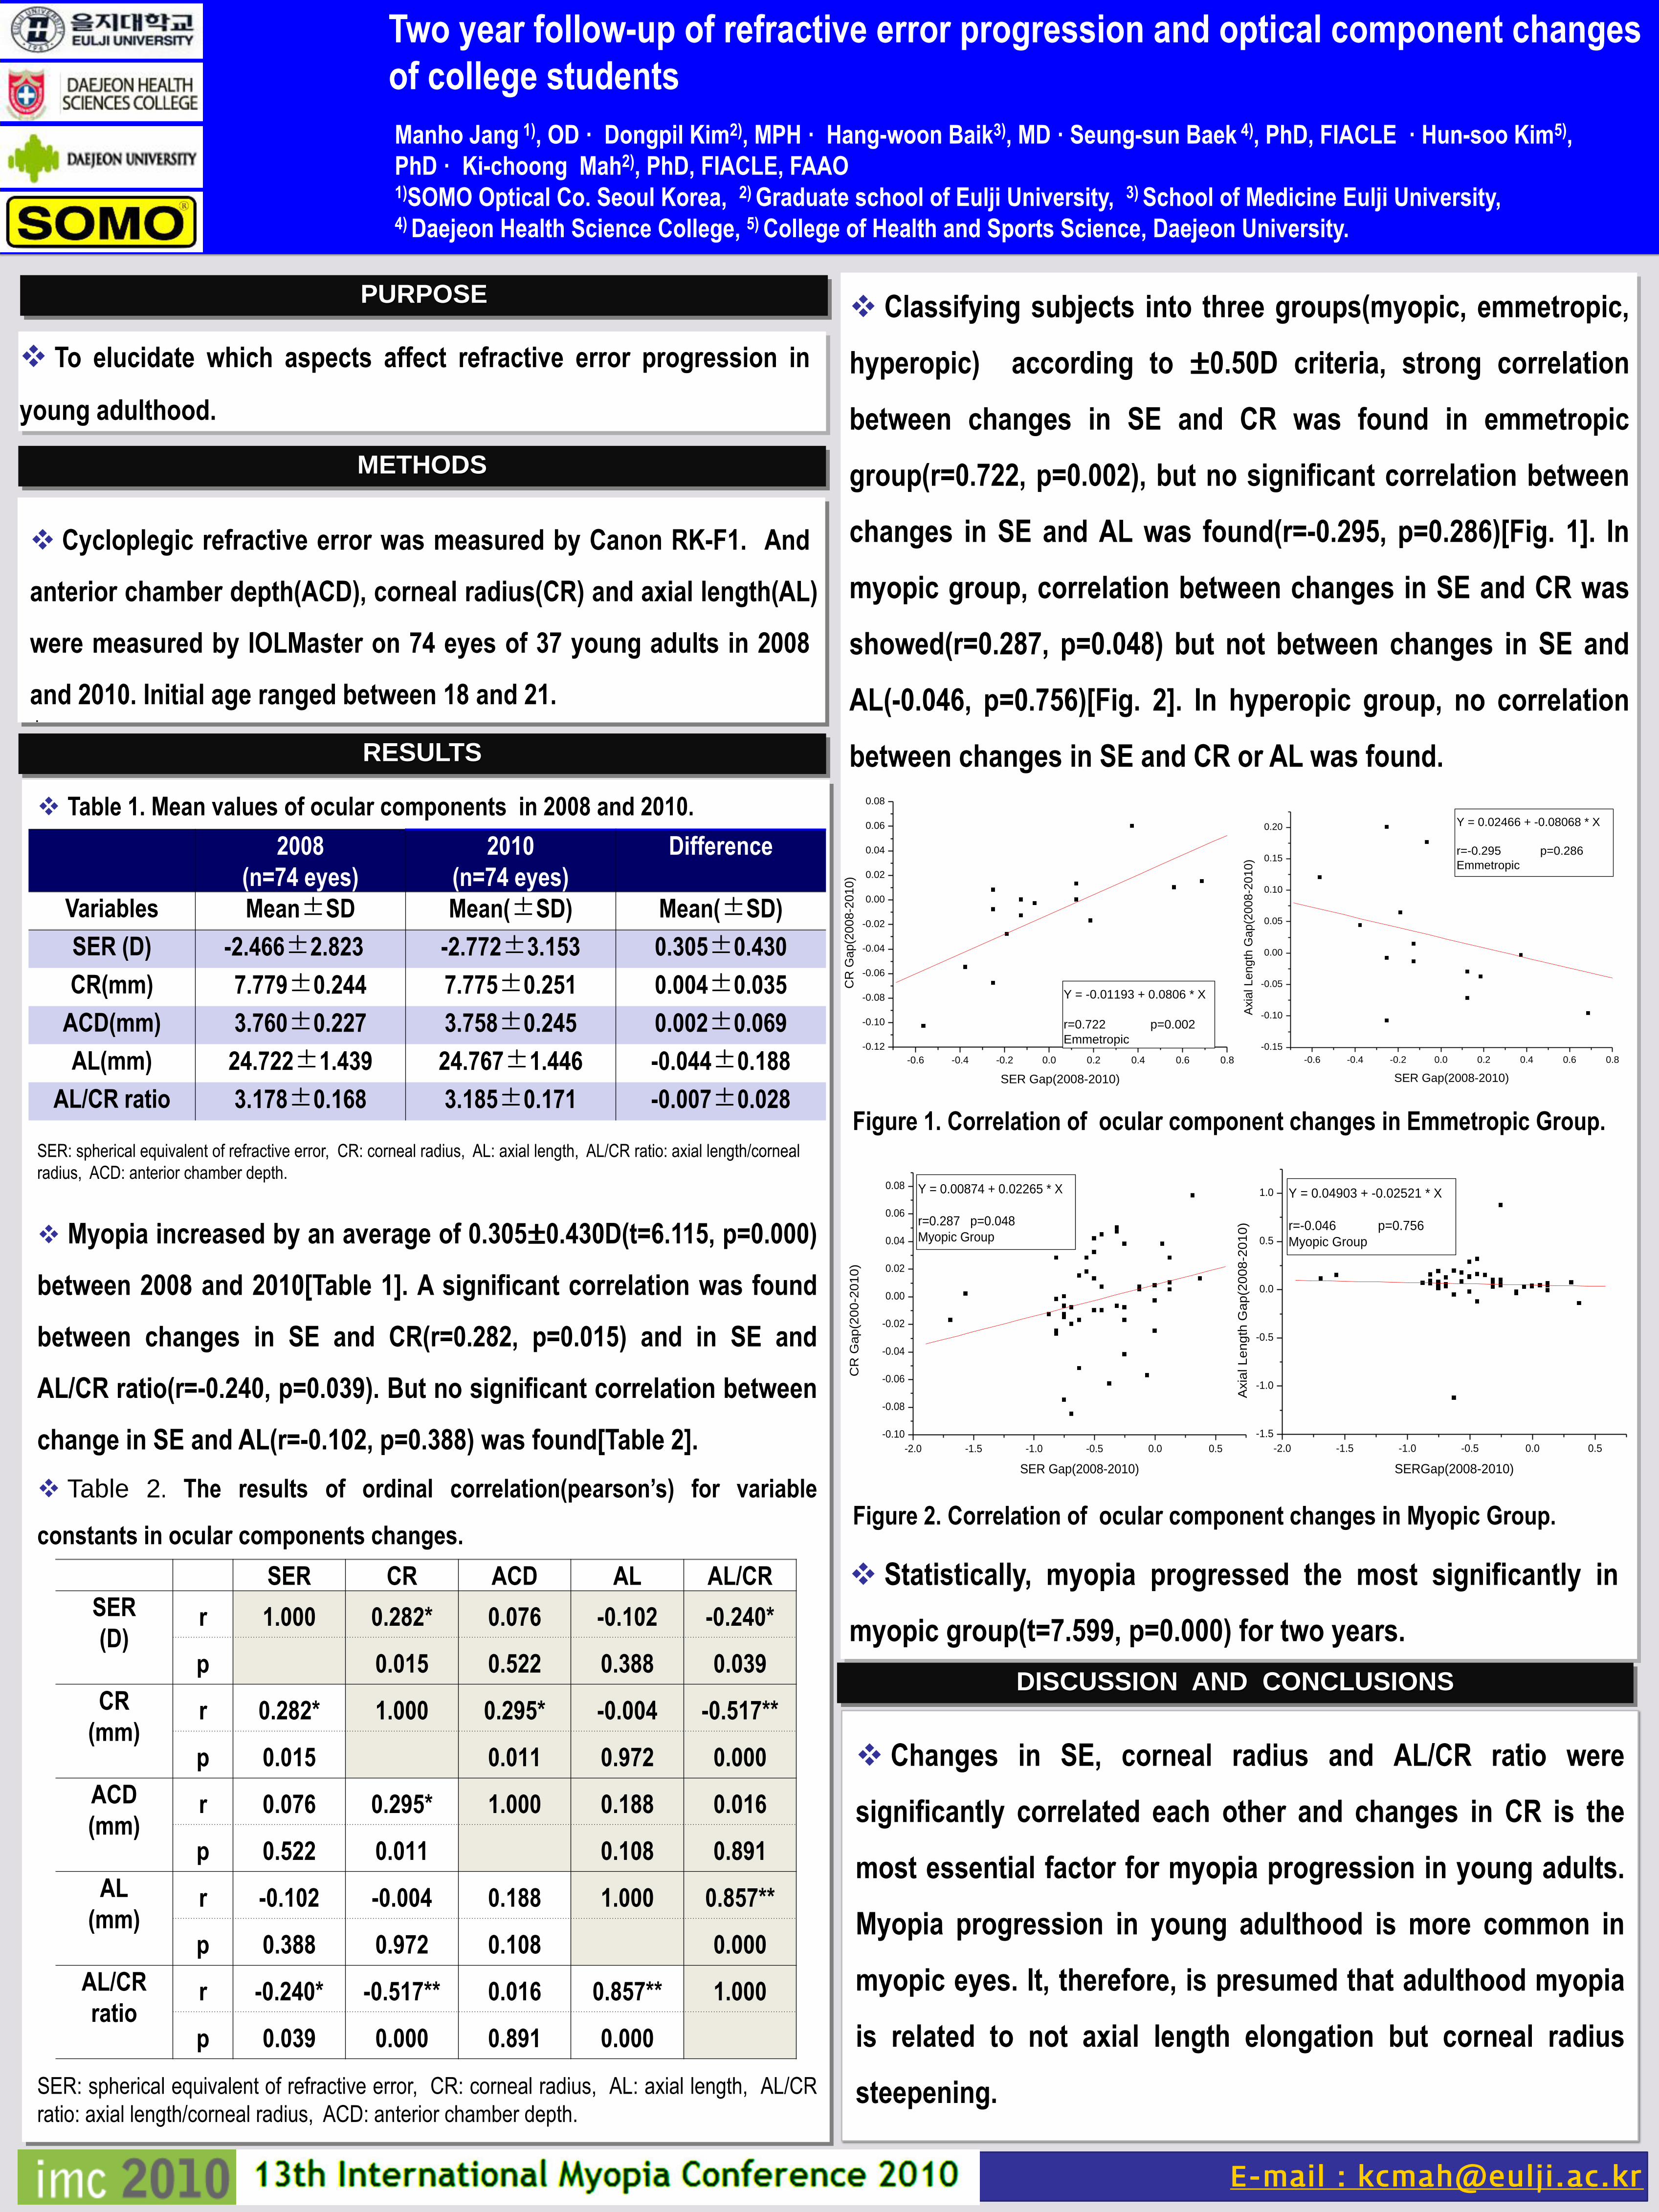
AL/CR ratio 3.178±0.168 3.185±0.171 -0.007±0.028Figure 1. Correlation of ocular component changes in Emmetropic Group.
Statistically, myopia progressed the most significantly in
myopic group(t=7.599, p=0.000) for two years.
SER CR ACD AL AL/CR
SER
(D)r 1.000 0.282* 0.076 -0.102 -0.240*
p 0.015 0.522 0.388 0.039
CR
(mm)r 0.282* 1.000 0.295* -0.004 -0.517**
p 0.015 0.011 0.972 0.000
ACD
(mm)r 0.076 0.295* 1.000 0.188 0.016
p 0.522 0.011 0.108 0.891
AL
(mm)r -0.102 -0.004 0.188 1.000 0.857**
p 0.388 0.972 0.108 0.000
AL/CR
ratior -0.240* -0.517** 0.016 0.857** 1.000
p 0.039 0.000 0.891 0.000
Classifying subjects into three groups(myopic, emmetropic,
hyperopic) according to ±0.50D criteria, strong correlation
between changes in SE and CR was found in emmetropic
group(r=0.722, p=0.002), but no significant correlation between
changes in SE and AL was found(r=-0.295, p=0.286)[Fig. 1]. In
myopic group, correlation between changes in SE and CR was
showed(r=0.287, p=0.048) but not between changes in SE and
AL(-0.046, p=0.756)[Fig. 2]. In hyperopic group, no correlation
between changes in SE and CR or AL was found.
-2.0 -1.5 -1.0 -0.5 0.0 0.5
-0.10
-0.08
-0.06
-0.04
-0.02
0.00
0.02
0.04
0.06
0.08
CR
Gap(2
00
-20
10)
SER Gap(2008-2010)
Y = 0.00874 + 0.02265 * X
r=0.287 p=0.048
Myopic Group
-2.0 -1.5 -1.0 -0.5 0.0 0.5
-1.5
-1.0
-0.5
0.0
0.5
1.0
Axia
l L
en
gth
Ga
p(2
00
8-2
01
0)
SERGap(2008-2010)
Y = 0.04903 + -0.02521 * X
r=-0.046 p=0.756
Myopic Group
-0.6 -0.4 -0.2 0.0 0.2 0.4 0.6 0.8
-0.12
-0.10
-0.08
-0.06
-0.04
-0.02
0.00
0.02
0.04
0.06
0.08
CR
Ga
p(2
00
8-2
01
0)
SER Gap(2008-2010)
Y = -0.01193 + 0.0806 * X
r=0.722 p=0.002
Emmetropic
-0.6 -0.4 -0.2 0.0 0.2 0.4 0.6 0.8
-0.15
-0.10
-0.05
0.00
0.05
0.10
0.15
0.20
Axia
l Le
ng
th G
ap
(200
8-2
01
0)
SER Gap(2008-2010)
Y = 0.02466 + -0.08068 * X
r=-0.295 p=0.286
Emmetropic
Figure 2. Correlation of ocular component changes in Myopic Group.
Changes in SE, corneal radius and AL/CR ratio were
significantly correlated each other and changes in CR is the
most essential factor for myopia progression in young adults.
Myopia progression in young adulthood is more common in
myopic eyes. It, therefore, is presumed that adulthood myopia
is related to not axial length elongation but corneal radius
steepening.
Differential Differential protein expression using twoprotein expression using two--dimensional salt plug mass dimensional salt plug mass sspectrometry pectrometry techniquestechniques
The risks of myopia emergence and development can be classified to nature and nurture[1]. Chick (Gallus Gallus) as a well-established myopicanimal model is used to study the mechanism of nurture in myopia[2]. The rapid advancement of proteomic technology provides a powerful tooland new sight to investigate the effect of proteins in myopic chicks[3].In this study we aim to study the retinal protein expressions in lens induced myopia (LIM) and lens induced hyperopia (LIH) chicks using two-dimensional salt plug mass spectrometry (2D-LCMS) coupled with isotope coded protein labeling (ICPL).
Introduction
SamplesSamples preparationpreparation
The right eyes of white leghorn chicks (3 days old, n=5) wore -10D lens and left eyes with +10D lens for 3 days. Refractive error and eyeparameter before and after the treatment were measured using a streak retinoscope and high frequency ultrasonography respectively. Retinatissues were harvested and homogenised in Guanidine-HCl buffer using a dismembrator with liquid nitrogen. The protein concentration of eachretina sample was measured using 2-D Quant KitTM.
Feng-Juan Yu,1 King-Kit Li,1 Thomas C. Lam,2 and Chi-Ho To1,3
1 Laboratory of Experimental Optometry, Centre for Myopia Research, School of Optometry, The Hong Kong Polytechnic University, HKSAR2 Singapore Polytechnic-University of Manchester FSI-Optometry, School of Chemical and Life Sciences, Singapore Polytechnic, Singapore3 State Key Laboratory of Ophthalmology, Zhongshan Ophthalmic Centre, SunYat-sen University, Guangzhou, PR China
Methods
Conclusions
2-D salt plug mass spectrometry showed its good usability as aprotein separating technique in analytical researches. We havefound 16 differentially expressed protein candidates in thisexperiment using this proteomic approach. Some of these proteinsmay play an important role in the development of chick eyes andfurther studies are needed to elucidate the mechanism of them.
Results
Fig.2 ESI-MS/MS results of ICPL data using 2-D salt plug separation. Total 789 proteins were identified, in which 544 protein Ids (70.2%) have paired ratios and 127 IDs have more than 3 paired rations. 16 protein IDs were selected using our criterion (at least 3 paired-ratios & ratios >1.35 or <0.7).
Table.1 Differentially expressed protein candidates
IsotopeIsotope codedcoded proteinprotein labellinglabelling (ICPL)(ICPL)Equal amount of proteins from both eyes were labelled with12C-Nic-reagent (right eye) and 13C-Nic-reagent (left eye)respectively and mixed according to SERVA ICPL Kit. Themixture was in-solution digested by trypsin andendoproteinase GluC overnight.
[1] Wallman J. Nature and nurture of myopia. Nature. 1994;371:201-202.[2] Wallman J, Adams JI, Trachtman JN. Invest Ophthalmol Vis Sci.
1981;20:557-61.[3] Lam, T. C., Li, K. K., Lo, S. C., Guggenheim, J. A. and To, C. H. J Proteome
Res. 2006;5 (4):771-84.
Fig.1 Refractive error and axial length changes (Mean SEM, n=5) after 3 days lens wearing (R: -10D & L: +10D, compared to left eye, ***as p<0.001 using paired t-test)
This study was supported by the Centre for Myopia Research (A360), the Myopia Niche Area Fund (JBB7P), RGC General Research Fund (B-Q15Q) and PolyU PhD Studentship (RPEX)
TwoTwo--dimensional (2dimensional (2--D) salt plugD) salt plug
Using HCTultra IonTrap Mass Spectrometry, 22ug protein mixture was loaded into a strong cation-exchange (SCX) column as a 1st-dimension separation and subsequently separated in a reversed-phase (RP) column for 2nd-dimension separation. The concentrations of NaCl range from 1mM to 1M. After separation the samples were sent to Electrospray Ionization Tandem Mass Spectrometry (ESI-MS/MS) fordetection. Peptides labelling for isotope pairing (SILE pair detection) and protein quantification were performed in WARP-LCTM software.International Protein Index (IPI) database of chick was used for peptide sequences searching to get the protein IDs.
.
789
16
127
544
0
200
400
600
800
1000
prot
ein
ID n
umber
Combine together ESI-MS/MS analysis
digestion
12C-label 13C-label
Left eyeRight eye
equal amount light heavy
Labelled peptides
Left eyeRight eye8.2
8.4
8.6
8.8
9.0
9.2
axial leng
th (mm) ***
Left eye
Right eye
-5
0
5
10
refra
ctive
err
or
(D)
***
Wavefront aberration sensitivity of intraocular lens implantation position in myopic eyes
Huanqing Guo, Yang Wang, Alexander Goncharov, Eamonn O’Donoghue and Chris DaintyApplied Optics Group, School of Physics, National University of Ireland, Galway, Ireland
Eye Clinic, University College Hospital, Galway, Ireland
Communication Engineering Department, Hebei Industrial University, Tianjin, China
Email: [email protected]
References[1]. Jack T. Holladay, Patricia A. Piers, Gabor Koranyi, Marrie van der Mooren and N.
E. Sverker Norrby, “A New Intraocular Lens Design to Reduce Spherical
Aberration of Pseudophakic Eyes”, J. Ref. Surg., 18, 683 – 691 (2002).
[2]. Patricia A. Piers, Henk A. Weeber, Pablo Artal and Sverker Norrby, “Theoretical
Comparison of Aberration-correcting Customized and Aspheric Intraocular
Lenses”, J. Ref. Surg., 23, 374 – 384 (2007).
[3]. Huanqing Guo, Zhaoqi wang, Qiulingzhao, Wei Quan and Yan Wang, “Individual
model eye based on wavefront aberration”, Optik - International Journal for Light
and Electron Optics, 116, 80 – 85 (2005).
AcknowledgementsThis work is supported by Enterprise Ireland International Research Funding (EI
grant number IR-2008-0014) and Science Foundation of Ireland funding (SFI grant
number SFI/07/IN.1/1906).
Cataract patients usually need intraocular lens (IOL) with proper optical power to
replace their less transparent or opaque crystalline lens. IOL is therefore an artificial
human eye lens. Fig. 1 shows a photo of an isolated IOL.
The necessary IOL power calculation and prediction are generally based on
biometrics of cataractous eyes and surgical protocols. Any IOL implantation error
such as de-centrations, tilts, axial shifts, rotation and/or combinations of these,
reduces the vision quality of the pseudophakic eyes.
Previous studies (e. g. Ref. [1], [2]) have separately considered some of the IOL
position errors by use of biometric measurement and/or statistical data. In this
study, we use new method based on random mixture of all possible IOL position
errors to understand the sensitivity of IOL to its implantation position in individual
pseudophakic eyes. We focus on IOLs that are designed for myopic eyes.
4. ResultsFig. 4 shows averaged nine individual eyes’ wavefront aberration RMS values with
four types of IOL design. For IOL at its nominal position (best correction position),
IOLs with sphere plus cylinder correction, sphere plus spherical correction and full
correction can provide significantly better quality compared to sphere only
correction IOL (p < 0.05). If IOL implantation position is displaced from its nominal
position by means of random displacement mixture, sphere plus spherical and full
corrections are significantly more sensitive to their position change than sphere
only correction (p < 0.05), while sphere plus cylinder correction has no significant
difference with sphere only correction IOL (p > 0.05) .
Individual optical eye models (Ref. [3]) were constructed to design IOLs and analyse
pseudophakic eye’s optical quality. We used individual eye’s biometric data
measured by corresponding instruments.
Fig. 2 shows a flow chart for constructing individual eye optical model, and
customized designed IOLs hereby were incorporated into these eye models aiming
to provide proper optical power correction. In this study, we selected 9 eyes data
from 6 subjects who have no other eye pathology except myopia, and their ocular
wavefront aberrations are in normal range. Nine individual models were constructed
for these eyes and different IOL designs were invesgated. These designs included:
a) the IOLs which only corrected the eye’s sphere refractive error; b) which corrected
sphere plus cylinder errors; c) which corrected sphere plus spherical errors and d)
which corrected all wavefront aberrations up to 17 ophthalmic Zernike terms.
Although only monochromatic aberrations and their changes at 546 nm wavelength
were calculated by ray-tracing method, chromatic effect of all components in the
models were included to cover wavelengths shift. Zernike coefficients describing the
aberrations and the root mean square (RMS) value was calculated from these
coefficients for estimation of optical quality. Pupil size of 5.2 mm and 6 meters
distance object were used in the calculation. Five field points within 2 degree visual
field were combined together to estimate RMS value of wavefront aberrations.
2. PurposeTo use real eye’s biometric data to theoretically calculate the influence of
IOL’s implantation position errors on pseudophakic eye’s monochromatic
wavefront aberrations for individual myopic eyes.
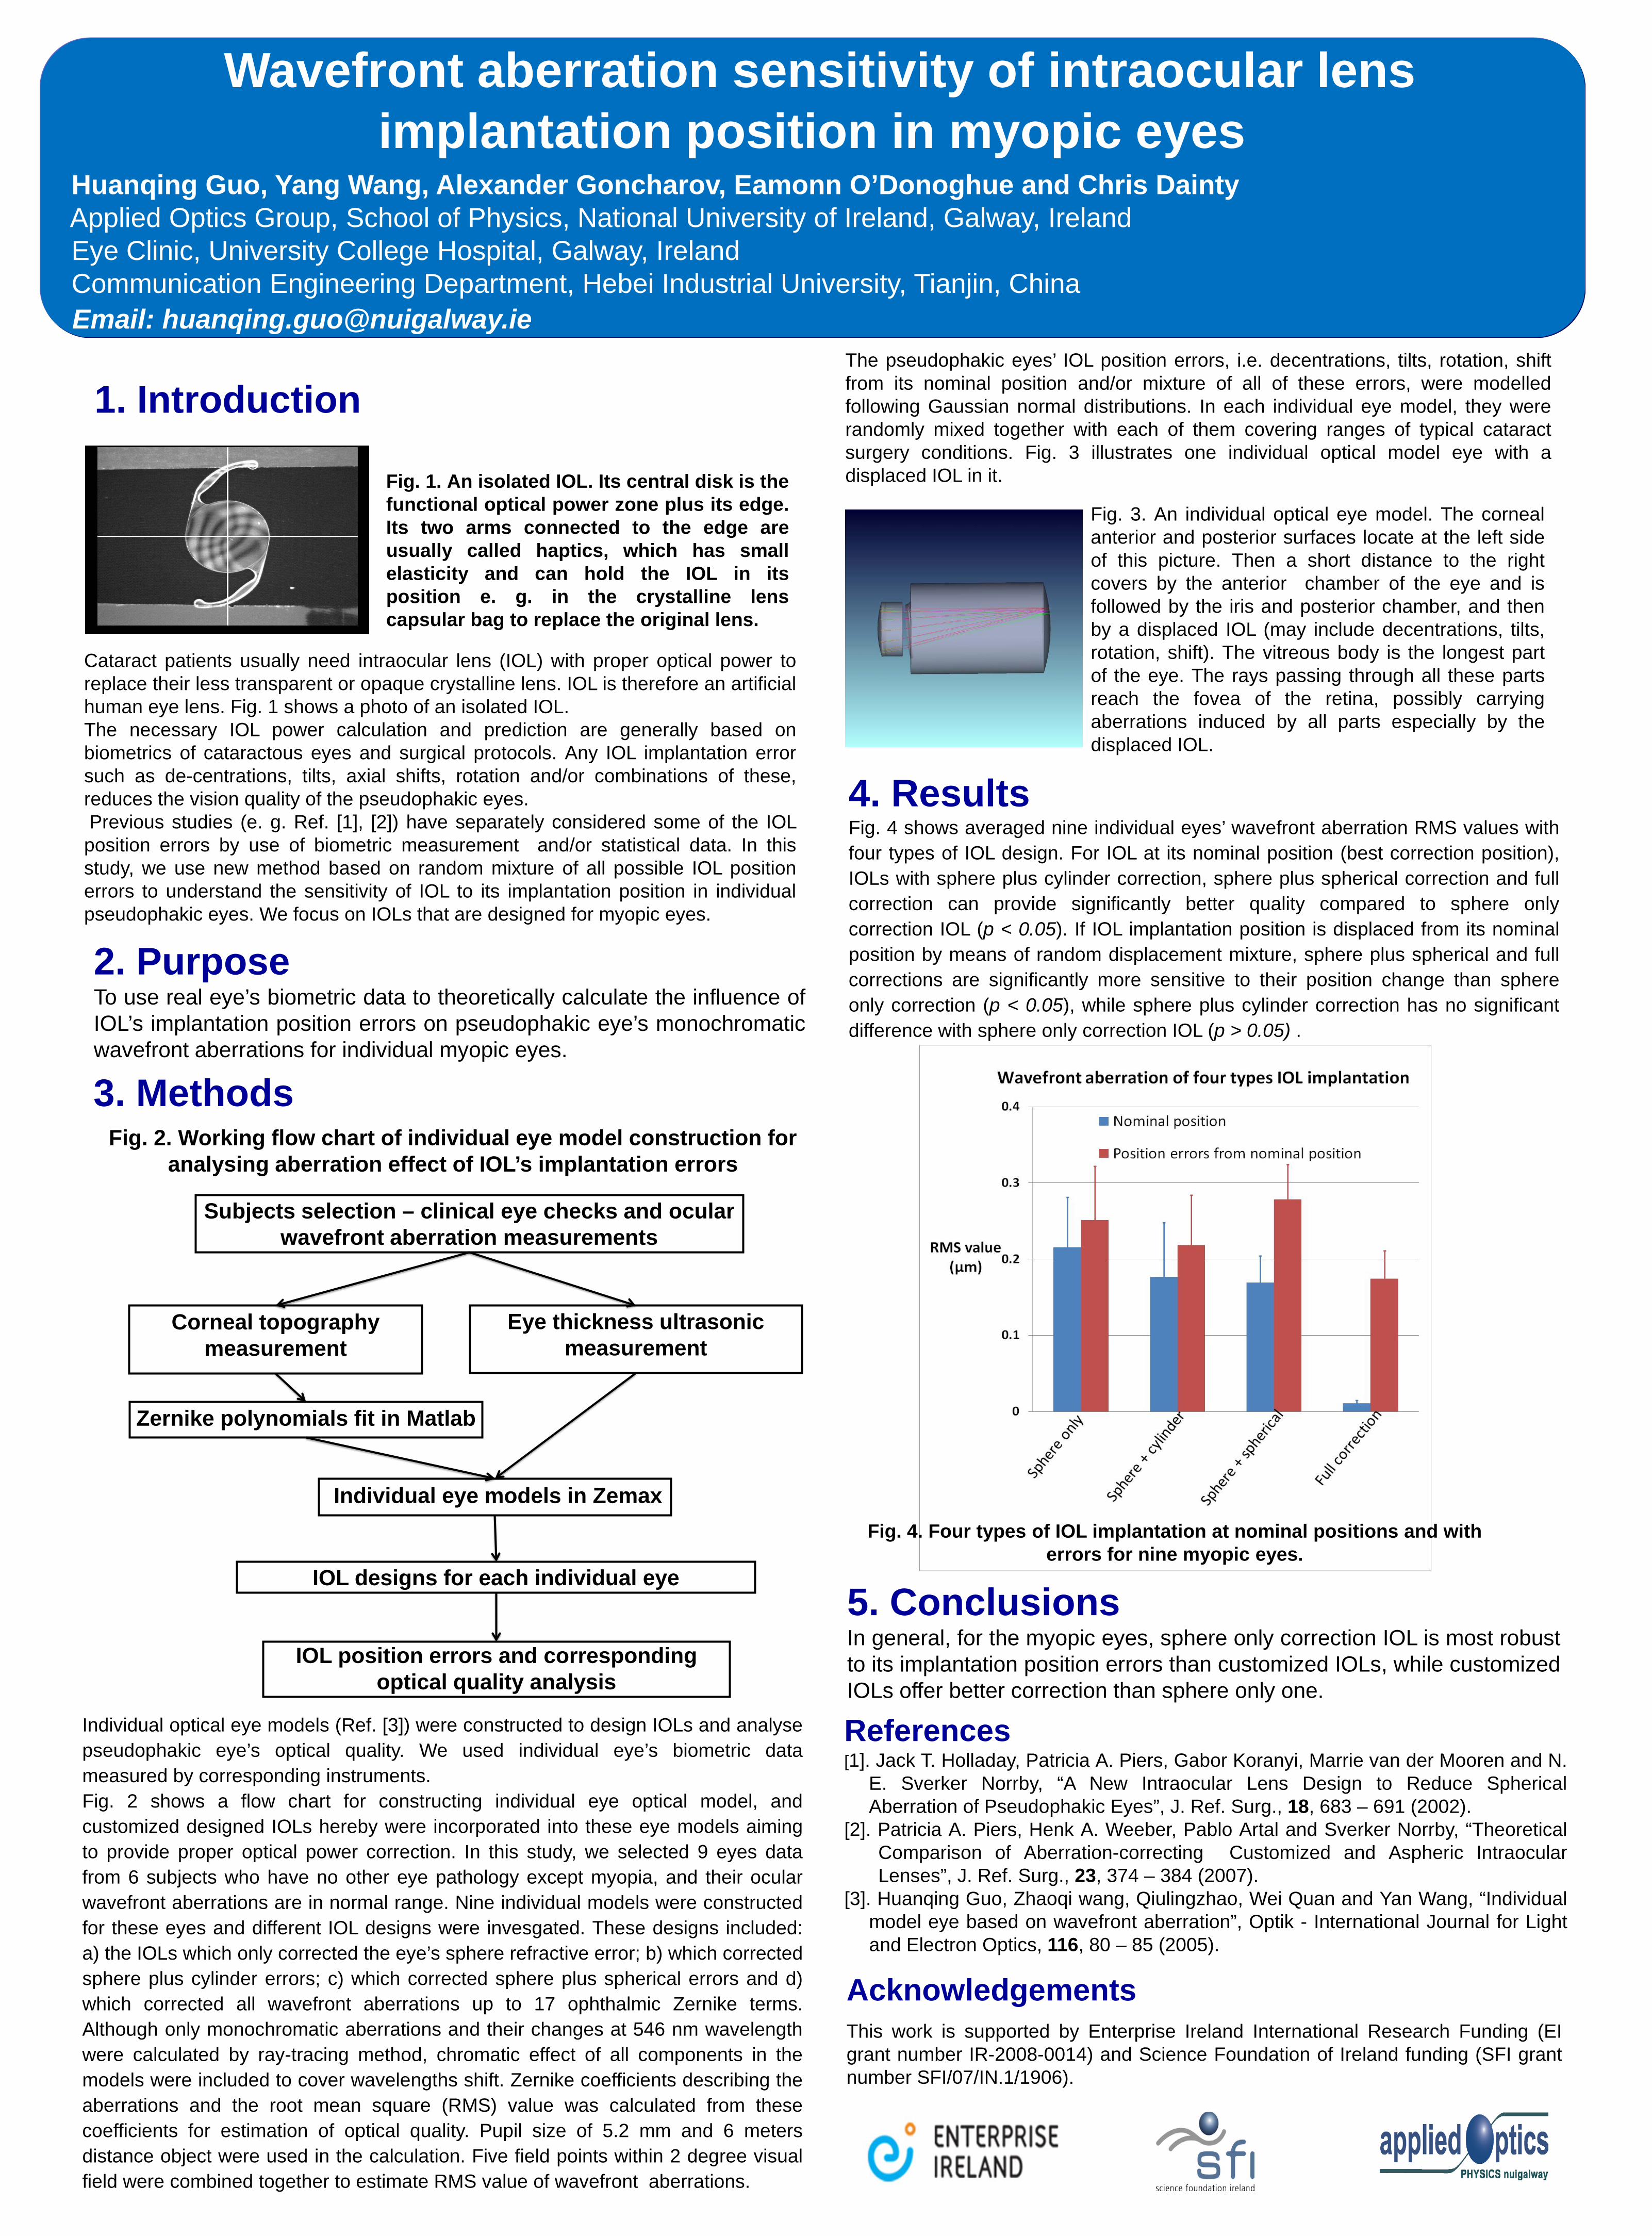
Fig. 1. An isolated IOL. Its central disk is thefunctional optical power zone plus its edge.Its two arms connected to the edge areusually called haptics, which has smallelasticity and can hold the IOL in itsposition e. g. in the crystalline lenscapsular bag to replace the original lens.
Corneal topography measurement
Eye thickness ultrasonic measurement
Zernike polynomials fit in Matlab
Individual eye models in Zemax
IOL designs for each individual eye
IOL position errors and corresponding optical quality analysis
Subjects selection – clinical eye checks and ocular wavefront aberration measurements
Fig. 2. Working flow chart of individual eye model construction for analysing aberration effect of IOL’s implantation errors
Fig. 3. An individual optical eye model. The corneal
anterior and posterior surfaces locate at the left side
of this picture. Then a short distance to the right
covers by the anterior chamber of the eye and is
followed by the iris and posterior chamber, and then
by a displaced IOL (may include decentrations, tilts,
rotation, shift). The vitreous body is the longest part
of the eye. The rays passing through all these parts
reach the fovea of the retina, possibly carrying
aberrations induced by all parts especially by the
displaced IOL.
5. ConclusionsIn general, for the myopic eyes, sphere only correction IOL is most robust
to its implantation position errors than customized IOLs, while customized
IOLs offer better correction than sphere only one.
3. Methods
The pseudophakic eyes’ IOL position errors, i.e. decentrations, tilts, rotation, shift
from its nominal position and/or mixture of all of these errors, were modelled
following Gaussian normal distributions. In each individual eye model, they were
randomly mixed together with each of them covering ranges of typical cataract
surgery conditions. Fig. 3 illustrates one individual optical model eye with a
displaced IOL in it.
Fig. 4. Four types of IOL implantation at nominal positions and with errors for nine myopic eyes.
1. Introduction
Longitudinal observations on the role of the peripheral
refraction profile in myopia development
Bastian Cagnolati, Niall C. Strang, Lyle S. Gray
Department of Vision Sciences, Glasgow Caledonian University, UK
INTRODUCTIONIn recent years the roles of peripheral refraction and ocular shape in the development
of myopia are subject of increased interest and discussion (Charman, 2005; Stone and
Flitcroft, 2004; Wallman and Winawer, 2004).
Hoogerheide (1971) showed that pilots with relative peripheral hyperopia had the
greatest risk of developing myopia.
Contact information: [email protected]
METHODS� 4-year longitudinal study on refractive development conducted in private optometric
practice in Duisburg, Germany
� 140 subjects between 5 and 20 years with visual acuity of 6/6 or better
� Exclusion criteria: ocular or systemic disease, strabismus, astigmatism > 2D,
anisometropia > 2D, RGP lens wear
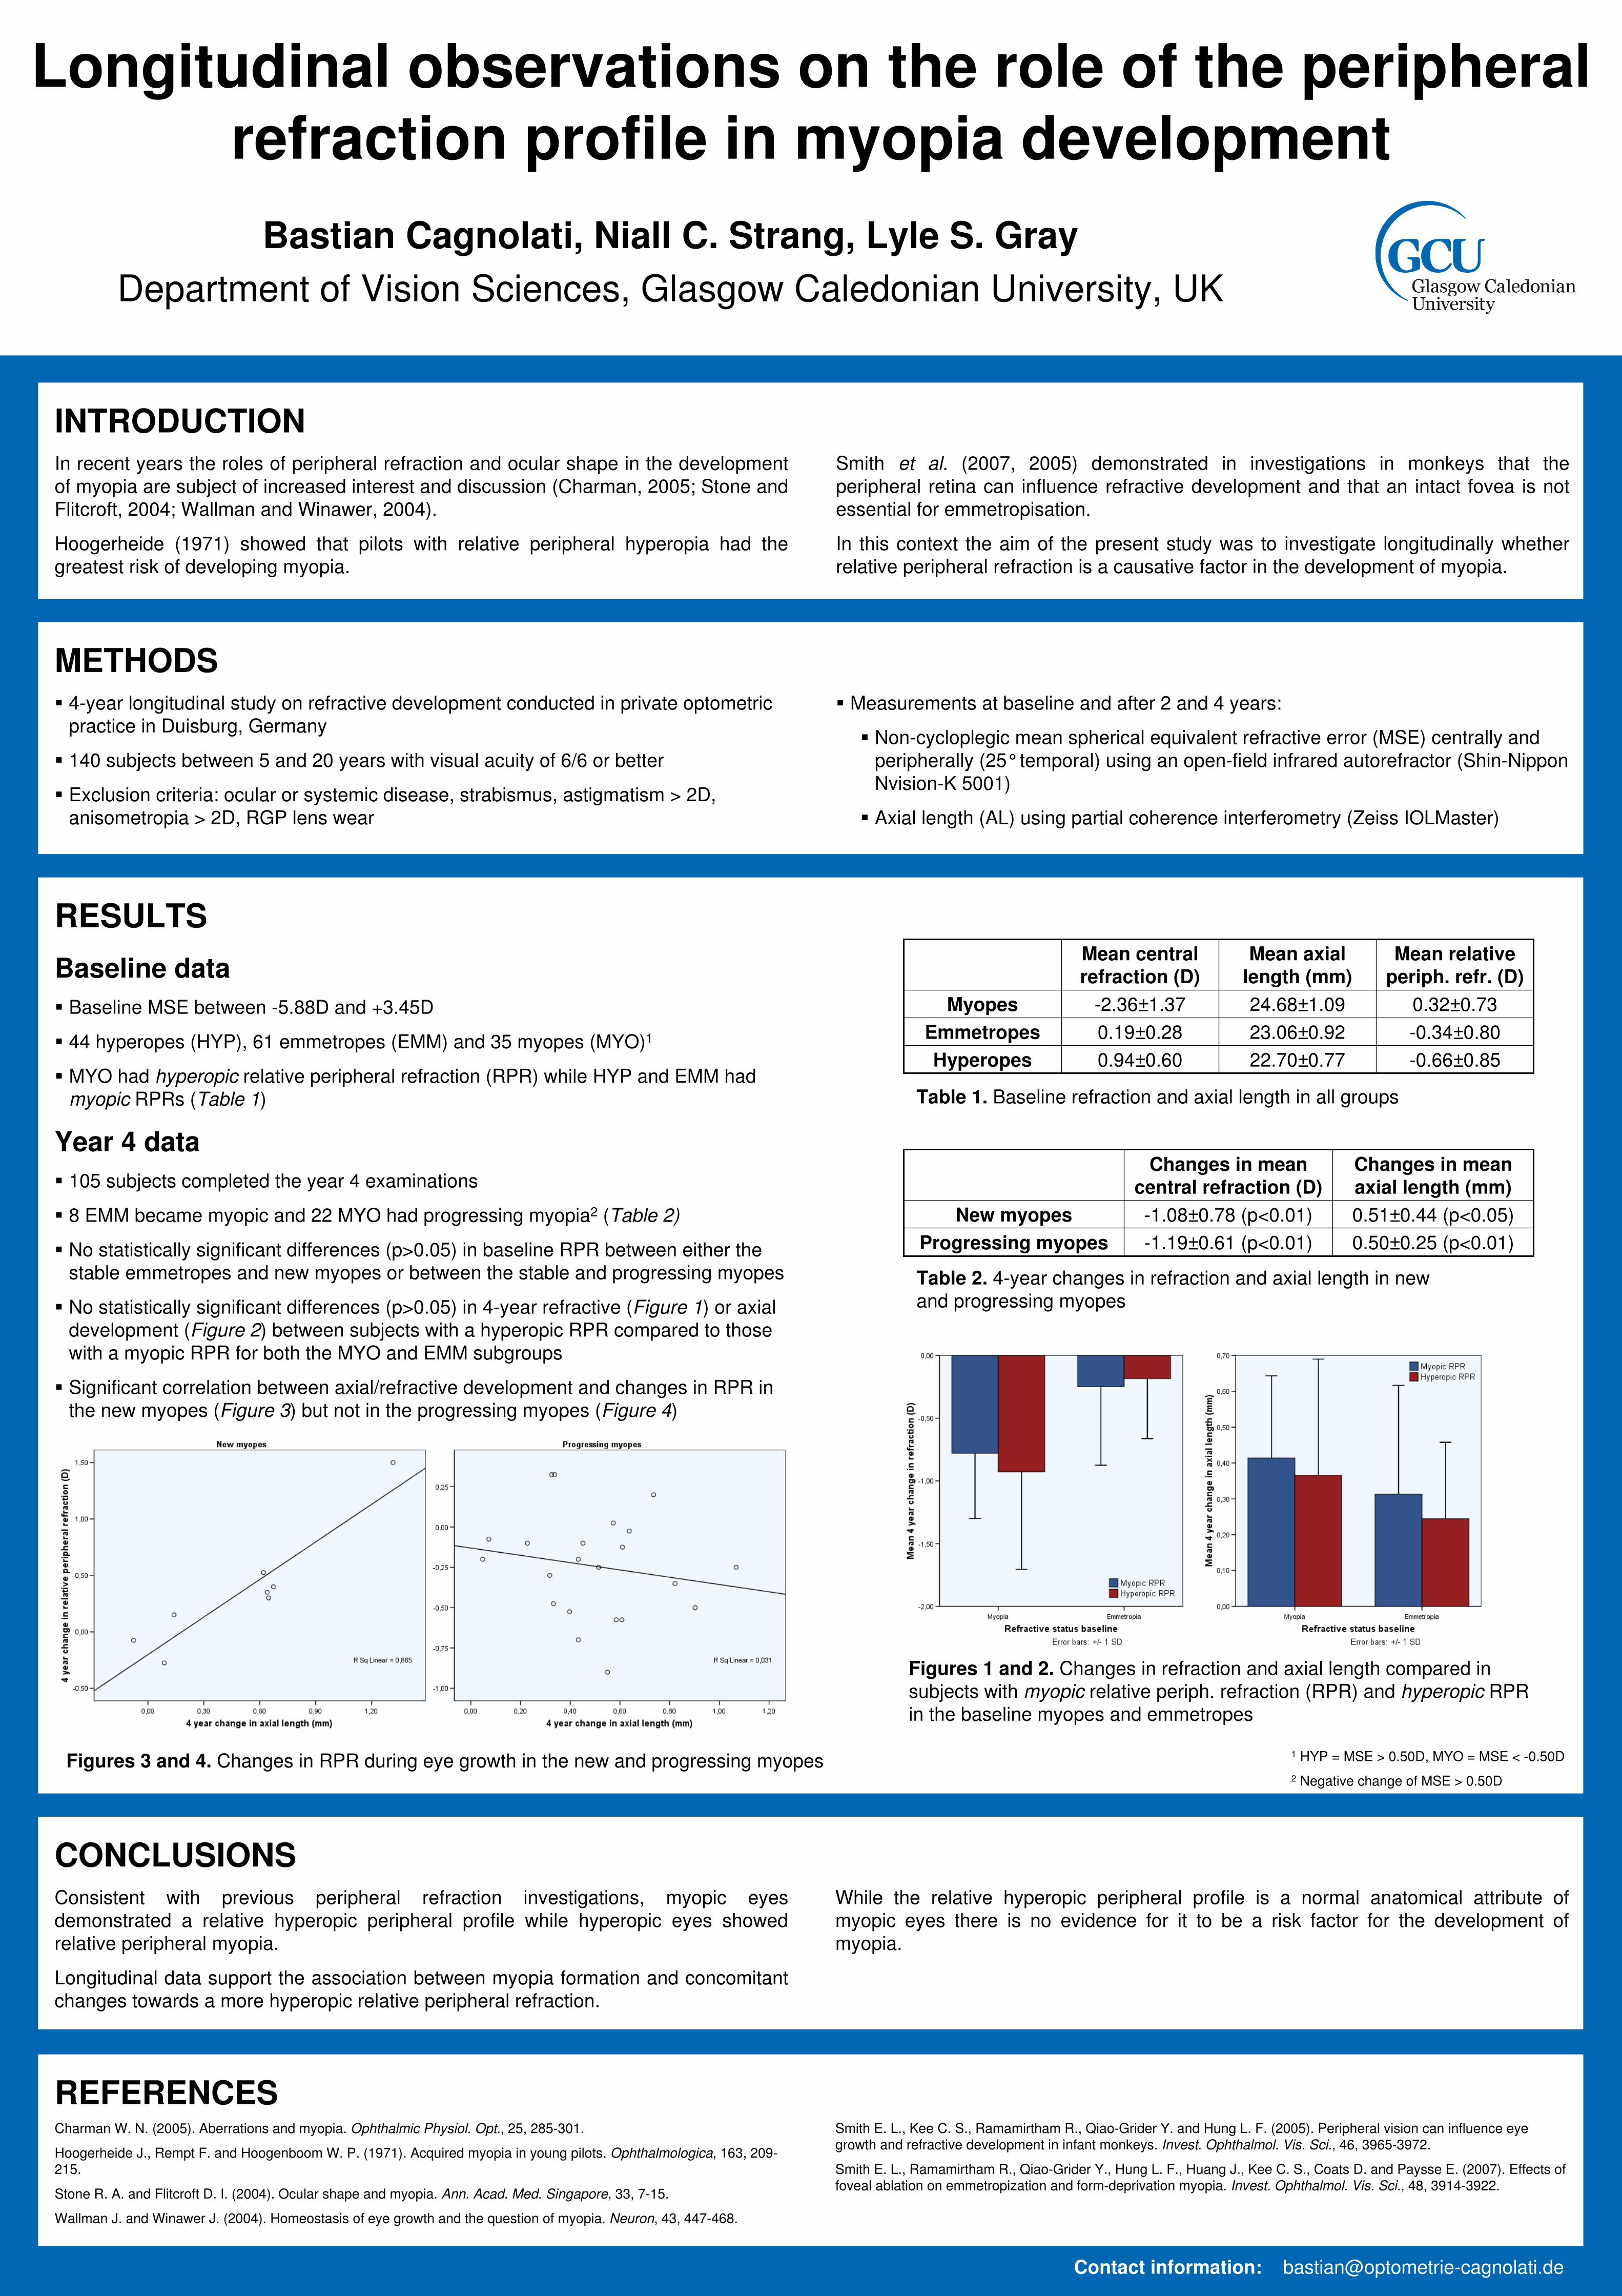
RESULTS
Baseline data
� Baseline MSE between -5.88D and +3.45D
� 44 hyperopes (HYP), 61 emmetropes (EMM) and 35 myopes (MYO)1
� MYO had hyperopic relative peripheral refraction (RPR) while HYP and EMM had
myopic RPRs (Table 1)
CONCLUSIONSConsistent with previous peripheral refraction investigations, myopic eyes
demonstrated a relative hyperopic peripheral profile while hyperopic eyes showed
relative peripheral myopia.
Longitudinal data support the association between myopia formation and concomitant
changes towards a more hyperopic relative peripheral refraction.
REFERENCESCharman W. N. (2005). Aberrations and myopia. Ophthalmic Physiol. Opt., 25, 285-301.
Hoogerheide J., Rempt F. and Hoogenboom W. P. (1971). Acquired myopia in young pilots. Ophthalmologica, 163, 209-215.
Stone R. A. and Flitcroft D. I. (2004). Ocular shape and myopia. Ann. Acad. Med. Singapore, 33, 7-15.
Wallman J. and Winawer J. (2004). Homeostasis of eye growth and the question of myopia. Neuron, 43, 447-468.
-0.66±0.8522.70±0.770.94±0.60Hyperopes
-0.34±0.8023.06±0.920.19±0.28Emmetropes
0.32±0.7324.68±1.09-2.36±1.37Myopes
Mean relative
periph. refr. (D)
Mean axial
length (mm)
Mean central
refraction (D)
Table 1. Baseline refraction and axial length in all groups
� Measurements at baseline and after 2 and 4 years:
� Non-cycloplegic mean spherical equivalent refractive error (MSE) centrally and
peripherally (25°temporal) using an open-field infrared autorefractor (Shin-Nippon
Nvision-K 5001)
� Axial length (AL) using partial coherence interferometry (Zeiss IOLMaster)
1 HYP = MSE > 0.50D, MYO = MSE < -0.50D
2 Negative change of MSE > 0.50D
Year 4 data
� 105 subjects completed the year 4 examinations
� 8 EMM became myopic and 22 MYO had progressing myopia2 (Table 2)
� No statistically significant differences (p>0.05) in baseline RPR between either the
stable emmetropes and new myopes or between the stable and progressing myopes
� No statistically significant differences (p>0.05) in 4-year refractive (Figure 1) or axial
development (Figure 2) between subjects with a hyperopic RPR compared to those
with a myopic RPR for both the MYO and EMM subgroups
� Significant correlation between axial/refractive development and changes in RPR in
the new myopes (Figure 3) but not in the progressing myopes (Figure 4)
0.50±0.25 (p<0.01)-1.19±0.61 (p<0.01)Progressing myopes
0.51±0.44 (p<0.05)-1.08±0.78 (p<0.01)New myopes
Changes in mean
axial length (mm)
Changes in mean
central refraction (D)
Table 2. 4-year changes in refraction and axial length in new
and progressing myopes
Figures 1 and 2. Changes in refraction and axial length compared in
subjects with myopic relative periph. refraction (RPR) and hyperopic RPR
in the baseline myopes and emmetropes
Figures 3 and 4. Changes in RPR during eye growth in the new and progressing myopes
While the relative hyperopic peripheral profile is a normal anatomical attribute of
myopic eyes there is no evidence for it to be a risk factor for the development of
myopia.
Smith et al. (2007, 2005) demonstrated in investigations in monkeys that the
peripheral retina can influence refractive development and that an intact fovea is not
essential for emmetropisation.
In this context the aim of the present study was to investigate longitudinally whether
relative peripheral refraction is a causative factor in the development of myopia.
Smith E. L., Kee C. S., Ramamirtham R., Qiao-Grider Y. and Hung L. F. (2005). Peripheral vision can influence eye growth and refractive development in infant monkeys. Invest. Ophthalmol. Vis. Sci., 46, 3965-3972.
Smith E. L., Ramamirtham R., Qiao-Grider Y., Hung L. F., Huang J., Kee C. S., Coats D. and Paysse E. (2007). Effects of foveal ablation on emmetropization and form-deprivation myopia. Invest. Ophthalmol. Vis. Sci., 48, 3914-3922.

Psychophysical measurements of blur adaptation in myopia
Andrew Collins, Simon Backhouse, Erin Tan, Benjamin ThompsonNZ National Eye Centre, Department of Optometry and Vision Science,
The University of Auckland, New Zealand.
Purpose To investigate the differences in blur adaptation between myopic and non-myopic participants using both sinusoidal grating and letter acuity measurements.
To determine whether exposure to visual tasks of varying visual demand affects blur adaptation in these groups.
Methods Refractive error was measured under cycloplegia at least one day prior to blur adaptation measurements. Contact lenses were used to provide correction during later experimental sessions.
Acuity thresholds were measured in 13 adult participants (7 myopes, 6 non-myopes) using computer-generated sinusoidal gratings (40% contrast) and a high contrast logMAR (Bailey-Lovie) letter chart.
Acuity thresholds were measured immediately prior to, and following induction of 1.00D myopic blur. A period of one hour of blur adaptation was undertaken while the participant performed either a visually demanding task (fast-paced action computer game) [Fig. 1], or a less visually demanding task (slow-paced geometric puzzle game) at a viewing distance of 3 m.
Acuity thresholds were re-measured immediately following the period of blur adaptation both with and without blur.
Results Following blur adaptation, both myopic and non-myopic participants showed a significant improvement in letter acuity with the blur in place of -0.052 logMAR and -0.084 logMAR respectively (mixed ANOVA, F(1.9) = 5.94, P=0.037) regardless of the visual task [Fig. 2a].
On removal of the blur, myopic participants returned to baseline letter acuity while the non-myopic participants showed a significant improvement over baseline letter acuity (-0.046 logMAR, P=0.018) [Fig. 2a].
The type of video game played during blur adaptation had no significant effect on the above outcome however the non-myopic group exhibited a trend for a greater blur adaptation effect with the action game [Fig. 2b] than with the puzzle game [Fig. 2c]
No significant change in grating acuity was found following blur adaptation, irrespective of the adaptation task (action vs puzzle game) or of the participant's refractive status (myopic vs non-myopic) [Figs 3a, 3b, 3c].
Conclusions The observed increase in letter acuity following a one hour period of induced blur is consistent with previous findings that the visual system is capable of rapidly adapting to a degraded visual stimulus.
The differential response of myopic observers to removal of blur (when measured by letter acuity) suggests that this group is less able to adapt to blur.
The differences in adaptation found using high-contrast letters versus sinusoidal gratings suggests that the underlying adaptation mechanism is based on modulating edge-detection sensitivity.
Variation in blur adaptation between myopic and non-myopic observers may be related to the effectiveness of emmetropisation in these two groups.
-0.6
-0.4
-0.2
0
0.2
0.4
Pre Action Game No Blur
Pre Action Game With
Blur
Post Action Game With
Blur
Post Action Game No Blur
Lo
g M
AR
Myopes
Non-Myopes
-0.6
-0.4
-0.2
0
0.2
0.4
Pre Puzzle Game No Blur
Pre Puzzle Game With
Blur
Post Puzzle Game With
Blur
Post Puzzle Game No Blur
Lo
g M
AR
Myopes
Non-Myopes
-0.6
-0.4
-0.2
0
0.2
0.4
Pre Game Without Blur
Pre Game With Blur
Post Game With Blur
Post Game Without Blur
Lo
g M
AR
Myopes
Non-Myopes
Figure 1. A screen capture of the action computer game simulating the difference in image quality between the in-focus view (left half of image) and the blurred image (right half of image). Note the loss of clearly defined edges under blur.
Figure 2a. Letter acuity measurements as a function of blur condition and refractive status. Myopic and non-myopic groups both show a significant improvement in letter acuity under blur following visual adaptation.
Figure 2b. Letter acuity measurements for the fast-paced action game adaptation task. The non-myopic group exhibits a trend for a greater blur adaptation effect than the myopic group.
Figure 2c. Letter acuity measurements for the slow-paced puzzle game adaptation task. The non-myopic and myopic groups exhibit a parallel trend in acuity improvement following blur adaptation.
Supported by:The New Zealand Optometric Vision Research Foundation
Statement on proprietary interests :The authors have no proprietary interests in this research project
Email:[email protected]
15
20
25
30
35
40
Pre Game No Blur
Pre Game With Blur
Post Game With Blur
Post Game No Blur
Sp
ati
al F
req
ue
nc
y (
cp
d)
Myopes
Non-Myopes
Figure 3a. Grating acuity measurements as a function of blur condition and refractive status. Myopic and non-myopic groups showed no significant improvement in grating acuity following visual adaptation.
15
20
25
30
35
40
Pre Action Game No Blur
Pre Action Game With
Blur
Post Action Game With
Blur
Post Action Game No Blur
Sp
ati
al F
req
ue
nc
y (
cp
d)
Myopes
Non-Myopes
Figure 3b. Grating acuity measurements for the fast-paced action game adaptation task.
15
20
25
30
35
40
Pre Puzzle Game No Blur
Pre Puzzle Game With
Blur
Post Puzzle Game With
Blur
Post Puzzle Game No Blur
Sp
ati
al F
req
ue
nc
y (
cp
d)
Myopes
Non-Myopes
Figure 3c. Grating acuity measurements for the slow-paced puzzle game adaptation task.
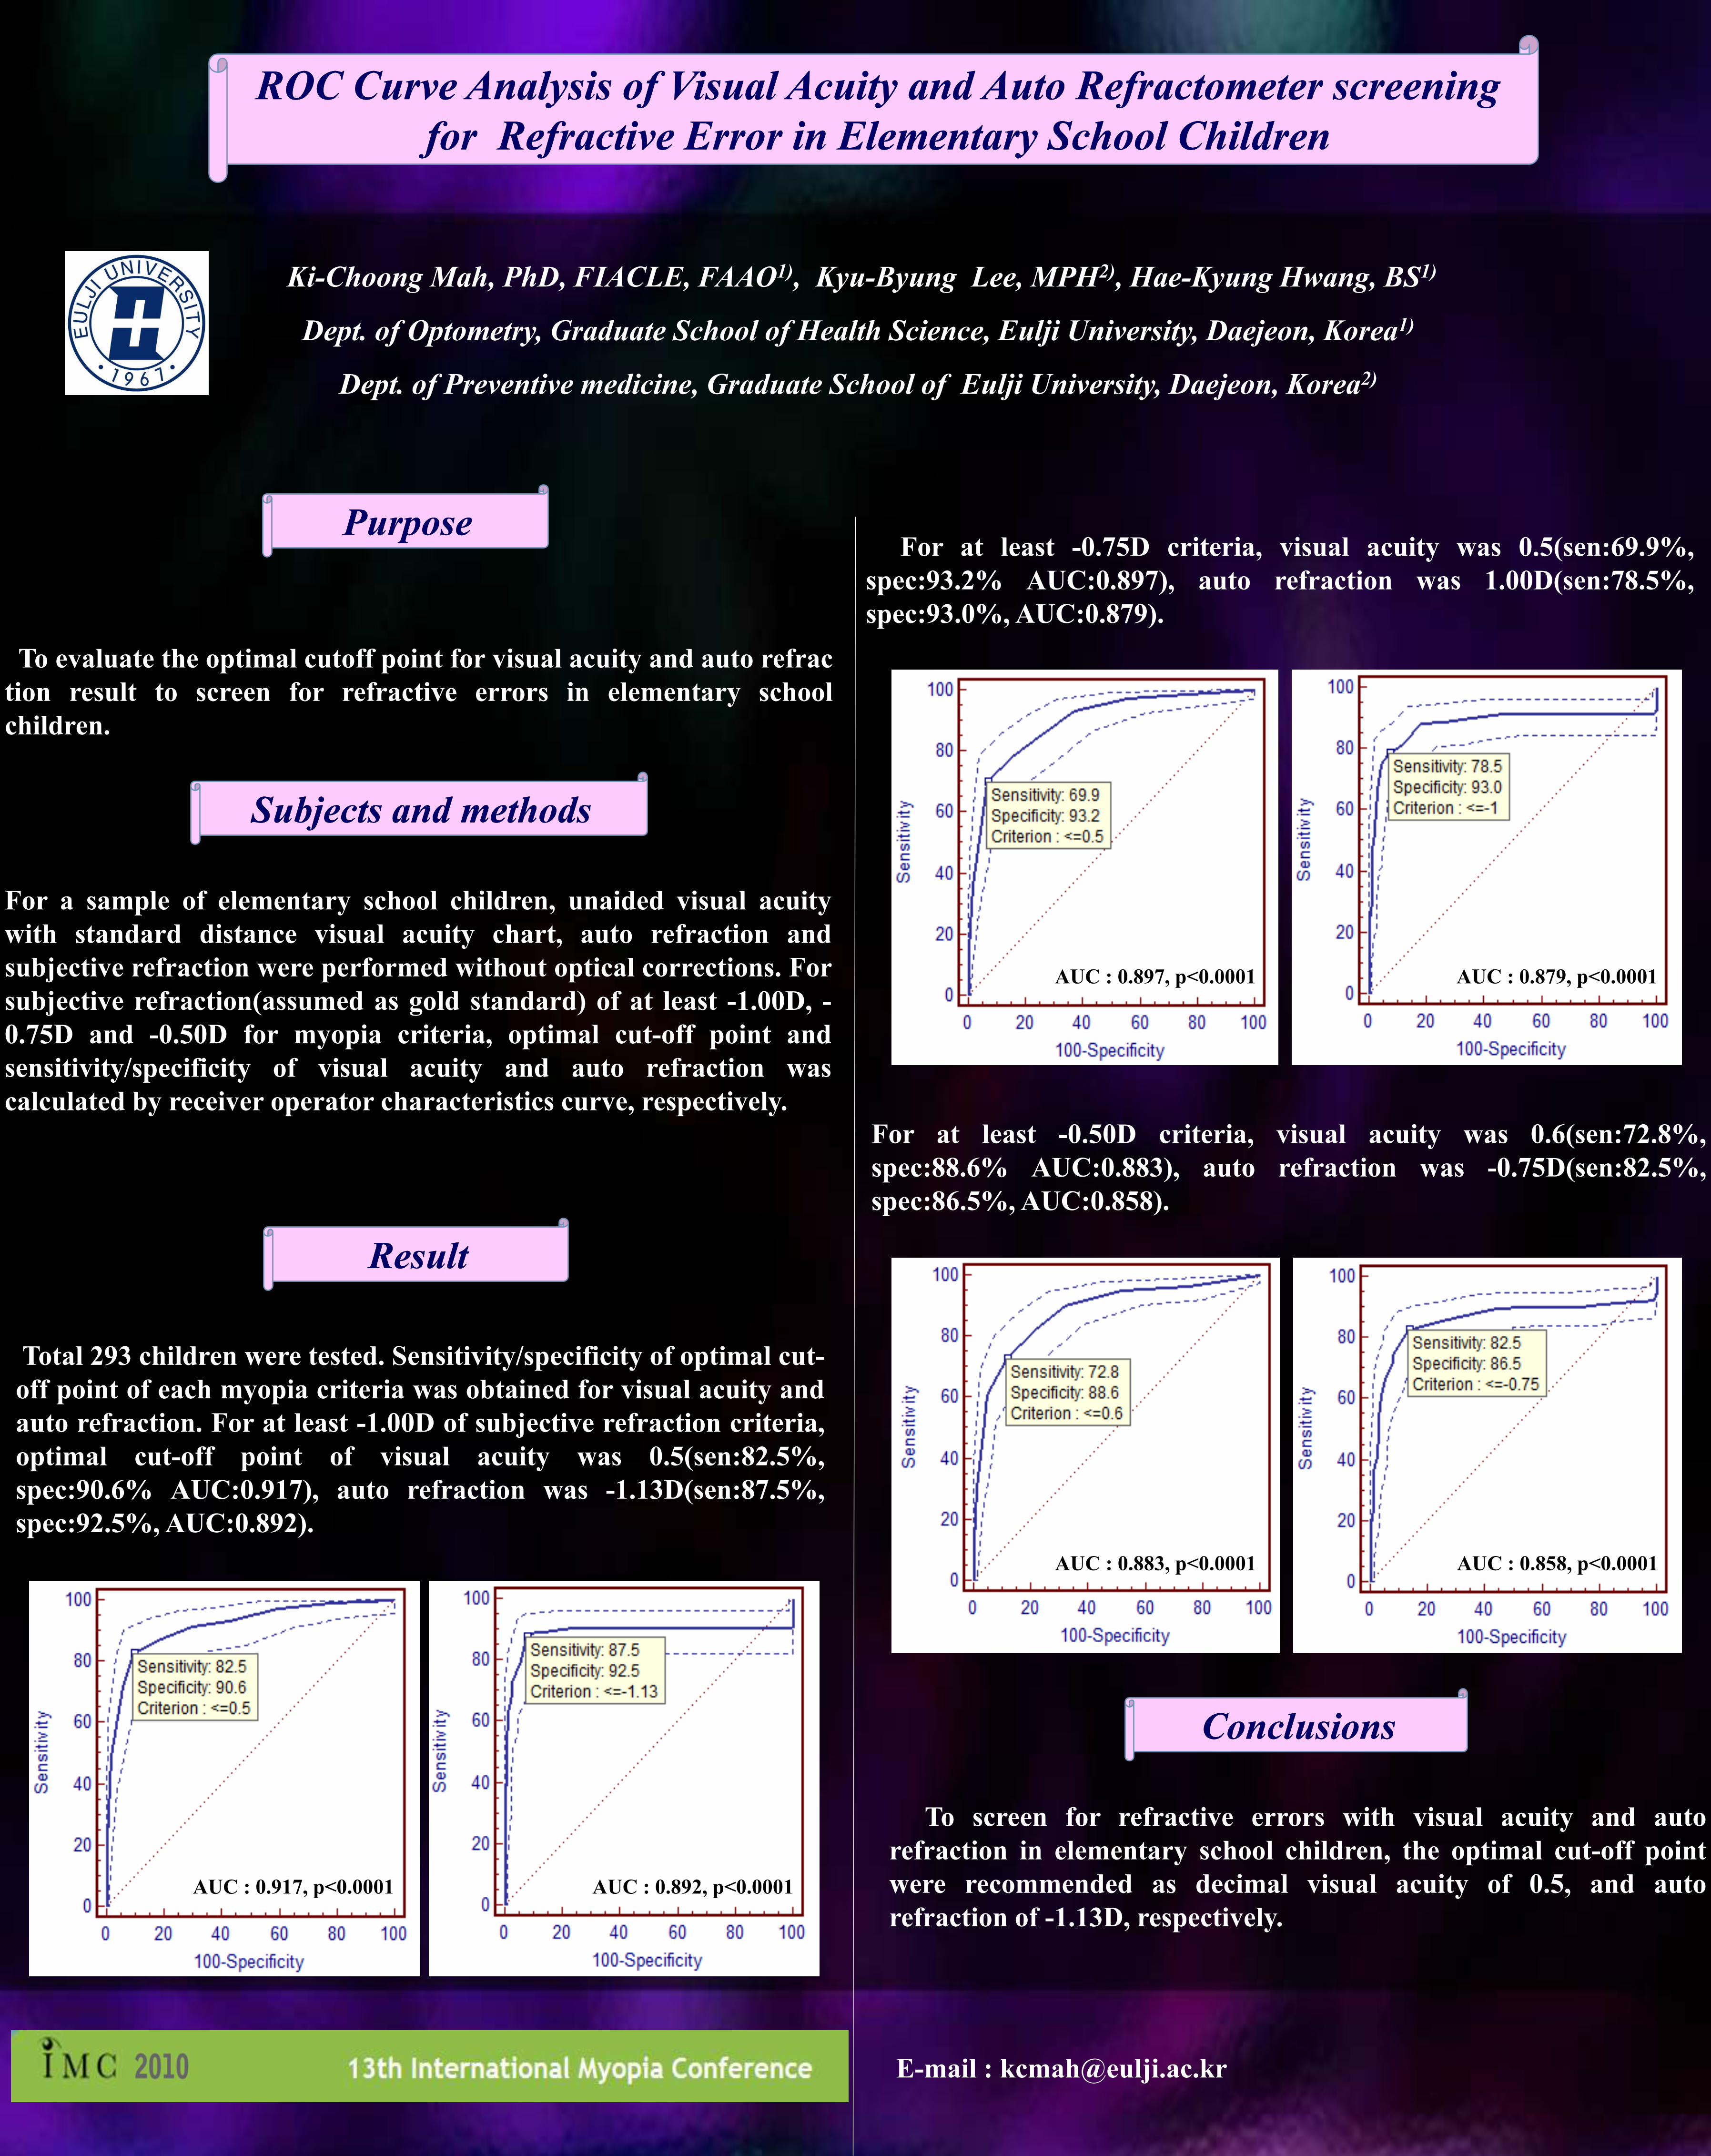
Ki-Choong Mah, PhD, FIACLE, FAAO1), Kyu-Byung Lee, MPH2), Hae-Kyung Hwang, BS1)
Dept. of Optometry, Graduate School of Health Science, Eulji University, Daejeon, Korea1)
Dept. of Preventive medicine, Graduate School of Eulji University, Daejeon, Korea2)
To evaluate the optimal cutoff point for visual acuity and auto refrac
tion result to screen for refractive errors in elementary school
children.
PurposePurpose
Subjects and methodsSubjects and methods
For a sample of elementary school children, unaided visual acuity
with standard distance visual acuity chart, auto refraction and
subjective refraction were performed without optical corrections. For
subjective refraction(assumed as gold standard) of at least -1.00D, -
0.75D and -0.50D for myopia criteria, optimal cut-off point and
sensitivity/specificity of visual acuity and auto refraction was
calculated by receiver operator characteristics curve, respectively.
ResultResult
Total 293 children were tested. Sensitivity/specificity of optimal cut-
off point of each myopia criteria was obtained for visual acuity and
auto refraction. For at least -1.00D of subjective refraction criteria,
optimal cut-off point of visual acuity was 0.5(sen:82.5%,
spec:90.6% AUC:0.917), auto refraction was -1.13D(sen:87.5%,
spec:92.5%, AUC:0.892).
ConclusionsConclusions
E-mail : [email protected]
ROC Curve Analysis of Visual Acuity and Auto ROC Curve Analysis of Visual Acuity and Auto RefractometerRefractometer screening screening
for Refractive Error in Elementary School Childrenfor Refractive Error in Elementary School Children
To screen for refractive errors with visual acuity and auto
refraction in elementary school children, the optimal cut-off point
were recommended as decimal visual acuity of 0.5, and auto
refraction of -1.13D, respectively.
For at least -0.50D criteria, visual acuity was 0.6(sen:72.8%,
spec:88.6% AUC:0.883), auto refraction was -0.75D(sen:82.5%,
spec:86.5%, AUC:0.858).
For at least -0.75D criteria, visual acuity was 0.5(sen:69.9%,
spec:93.2% AUC:0.897), auto refraction was 1.00D(sen:78.5%,
spec:93.0%, AUC:0.879).
AUC : 0.917, p<0.0001 AUC : 0.892, p<0.0001
AUC : 0.879, p<0.0001AUC : 0.897, p<0.0001
AUC : 0.883, p<0.0001 AUC : 0.858, p<0.0001