BACHELOR OF COMMERCE AGHI M.A (CCASBCM080) Ms ...
58
1 “A STUDY ON CONSUMER BUYING BEHAVIOUR TOWARDS SOFT DRINKS AMONG YOUTH WITH SPECIAL REFERENCE TO THE STUDENTS OF CHRIST COLLEGE IRINJALAKUDA” Project Report submitted to UNIVERSITY OF CALICUT In partial fulfilment of the requirement for the award of the degree of BACHELOR OF COMMERCE Submitted by AGHI M.A (CCASBCM080) Under the supervision of Ms. SIJI PAUL V DEPARTMENT OF COMMERCE CHRIST COLLEGE (AUTONOMOUS), IRINJALAKUDA MARCH 2021
-
Upload
khangminh22 -
Category
Documents
-
view
1 -
download
0
Transcript of BACHELOR OF COMMERCE AGHI M.A (CCASBCM080) Ms ...

1
“A STUDY ON CONSUMER BUYING BEHAVIOUR
TOWARDS SOFT DRINKS AMONG YOUTH WITH
SPECIAL REFERENCE TO THE STUDENTS OF CHRIST
COLLEGE IRINJALAKUDA”
Project Report submitted to
UNIVERSITY OF CALICUT
In partial fulfilment of the requirement for the award of the degree of
BACHELOR OF COMMERCE
Submitted by
AGHI M.A
(CCASBCM080)
Under the supervision of
Ms. SIJI PAUL V
DEPARTMENT OF COMMERCE
CHRIST COLLEGE (AUTONOMOUS), IRINJALAKUDA
MARCH 2021

2
CHRIST COLLEGE (AUTONOMOUS), IRINJALAKUDA
CALICUT UNIVERSITY
DEPARTMENT OF COMMERCE
CERTIFICATE
This is to certify that the project report entitled “A STUDY ON CONSUMER
BUYING BEHAVIOUR TOWARDS SOFT DRINKS AMONG YOUTH
WITH SPECIAL REFERENCE TO THE STUDENTS OF CHRIST
COLLEGE IRINJALAKUDA” is a bonafide record of project done by AGHI
M.A, Reg. No. CCASBCM080, under my guidance and supervision in partial
fulfilment of the requirement for the award of the degree of BACHELOR OF
COMMERCE and it has not previously formed the basis for any Degree,
Diploma and Associateship or Fellowship.
Prof. K.J.JOSEPH Ms. SIJI PAUL V
Co-ordinator Project Guide

3
DECLARATION
I, Aghi M.A, hereby declare that the project work entitled “A STUDY ON
CONSUMER BUYING BEHAVIOUR TOWARDS SOFT DRINKS
AMONG YOUTH WITH REFERENCE TO THE STUDENTS CHRIST
COLLEGE IRINJALAKUDA” is a record of independent and bona fide
project work carried out by me, under the supervision and guidance of Prof. Siji
Paul V, Asst. Professor-On contract, Department of Commerce and Management
Studies, Christ College, Irinjalakuda.
The information and data given in the report is authentic to the best of my
knowledge. The report has not been previously submitted for the award of any
Degree, Diploma, Associate ship or other similar title of any other university or
institute.
Place: Irinjalakuda Aghi M. A
Date: CCASBCM080

4
ACKNOWLEDGMENT
I would like to take the opportunity to express my sincere gratitude to all people
who have helped me with sound advice and able guidance.
Above all, I express my eternal gratitude to the Lord Almighty under whose
divine guidance; I have been able to complete this work successfully.
I would like to express my sincere obligation to Rev. Dr. Jolly Andrews,
Principal-in-charge, Christ College Irinjalakuda for providing various facilities.
I am thankful to Prof. K. J. Joseph, Co-Ordinator of B. Com (Finance), for
providing proper help and encouragement in the preparation of this report.
I am thankful to Mr. Lipin Raj k, class teacher for his cordial support, valuable
information and guidance, which helped me in completing this task through
various stages.
I express my sincere gratitude to Ms. Siji Paul V, Assistant Professor, whose
guidance and support throughout the training period helped me to complete this
work successfully.
I would like to express my gratitude to all the faculties of the Department for
their interest and cooperation in this regard.
I extent my hearty gratitude to the librarian and other library staffs of my college
for their wholehearted cooperation
I express my sincere thanks to my friends and family for their support in
completing this report successfully.
5
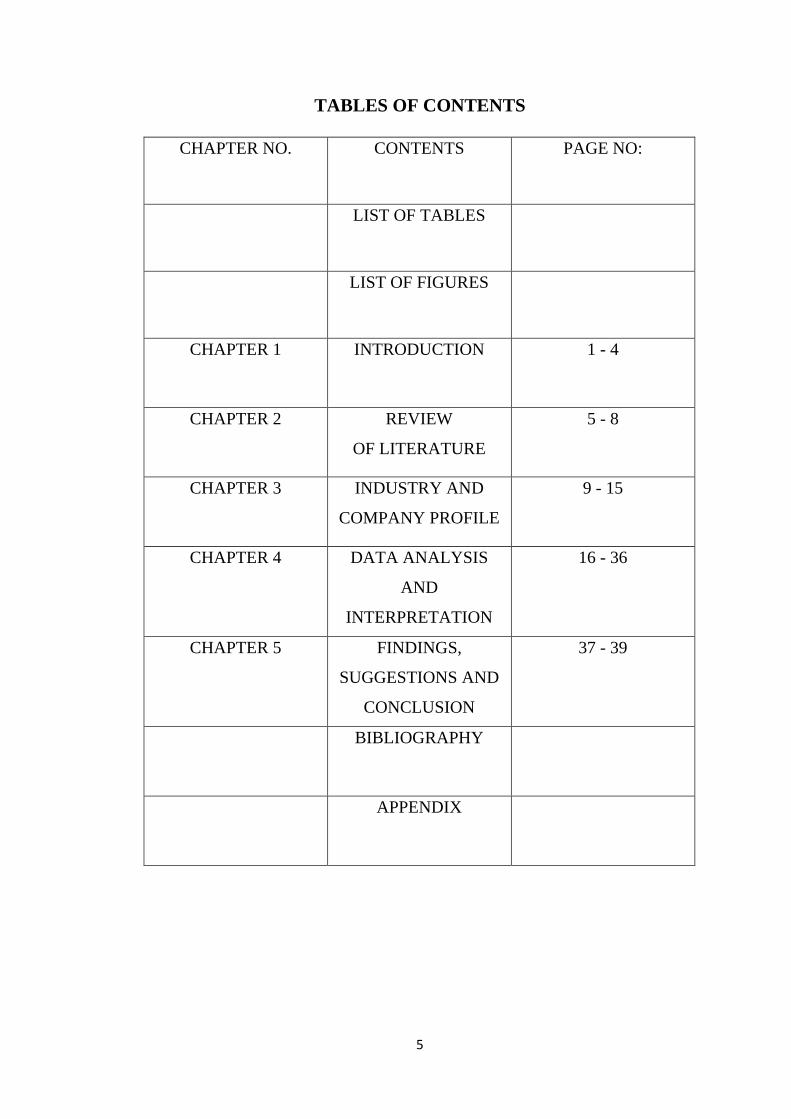
TABLES OF CONTENTS
CHAPTER NO. CONTENTS PAGE NO:
LIST OF TABLES
LIST OF FIGURES
CHAPTER 1 INTRODUCTION 1 - 4
CHAPTER 2 REVIEW
OF LITERATURE
5 - 8
CHAPTER 3 INDUSTRY AND
COMPANY PROFILE
9 - 15
CHAPTER 4 DATA ANALYSIS
AND
INTERPRETATION
16 - 36
CHAPTER 5 FINDINGS,
SUGGESTIONS AND
CONCLUSION
37 - 39
BIBLIOGRAPHY
APPENDIX
6
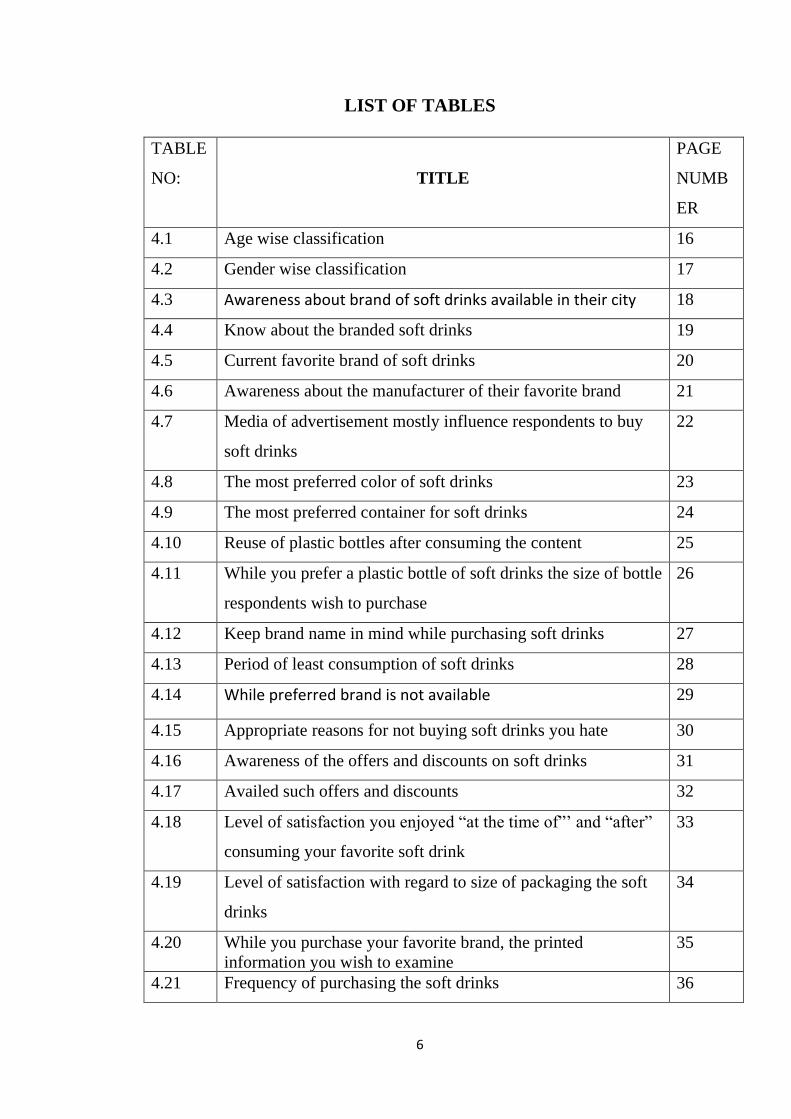
LIST OF TABLES
TABLE
NO:
TITLE
PAGE
NUMB
ER
4.1 Age wise classification 16
4.2 Gender wise classification 17
4.3 Awareness about brand of soft drinks available in their city 18
4.4 Know about the branded soft drinks 19
4.5 Current favorite brand of soft drinks 20
4.6 Awareness about the manufacturer of their favorite brand 21
4.7 Media of advertisement mostly influence respondents to buy
soft drinks
22
4.8 The most preferred color of soft drinks 23
4.9 The most preferred container for soft drinks 24
4.10 Reuse of plastic bottles after consuming the content 25
4.11 While you prefer a plastic bottle of soft drinks the size of bottle
respondents wish to purchase
26
4.12 Keep brand name in mind while purchasing soft drinks 27
4.13 Period of least consumption of soft drinks 28
4.14 While preferred brand is not available 29
4.15 Appropriate reasons for not buying soft drinks you hate 30
4.16 Awareness of the offers and discounts on soft drinks 31
4.17 Availed such offers and discounts 32
4.18 Level of satisfaction you enjoyed “at the time of”’ and “after”
consuming your favorite soft drink
33
4.19 Level of satisfaction with regard to size of packaging the soft
drinks
34
4.20 While you purchase your favorite brand, the printed
information you wish to examine
35
4.21 Frequency of purchasing the soft drinks 36

7
LIST OF FIGURES
FIGUR
E NO:
TITLE PAGE
NUMB
ER
4.1 Showing age wise classification 16
4.2 showing gender wise classification 17
4.3 Showing awareness about brand of soft drinks available in
their city
18
4.4 Showing came to know about the branded soft drinks 19
4.5 Showing current favorite brand of soft drinks 20
4.6 Showing awareness about the manufacturer of your favorite
brand
21
4.7 Showing media of advertisement mostly influence you to buy
soft drinks
22
4.8 Showing most preferred color of soft drinks 23
4.9 Showing most preferred container for soft drinks 24
4.10 Showing reuse of plastic bottle after consuming the content 25
4.11 Showing while you prefer a plastic bottle of soft drinks the size
of bottle respondents wish to purchase
26
4.12 Showing Keep brand name in mind while purchasing soft
drinks
27
4.13 Showing Period of least consumption of soft drinks 28
4.14 Showing While preferred brand is not available 29
4.15 Showing appropriate reasons for not buying soft drinks you
hate
30
4.16 Showing awareness of the offers and discounts on soft drinks 31
4.17 Showing availed such offers and discounts 32
4.18 Showing level of satisfaction, you enjoyed “at the time of”’
and “after” consuming your favorite soft drink
33

8
4.19 Showing level of satisfaction with regard to size of packaging
the soft drinks
34
4.20 Showing while you purchase your favorite brand, the printed
information you wish to examine
35
4.21 Showing frequency of purchasing the soft drinks 36
CHAPTER 1
INTRODUCTION

9
1.1 Introduction
In our modern world, the living pattern and lifestyles of the people have
changed a lot. It is becoming increasingly difficult to ignore the existence of soft
drinks in today’s marketers. Its consumption has steadily increased with
technological advances in production and product availability.
Consumer buying behavior refers to the actions taken by consumers before
buying a product or service. This process may include consulting search engines,
engaging with social media posts, or a variety of other actions. It is valuable for
businesses to understand this process because it helps businesses to better
tailor their marketing initiatives to the marketing efforts that have successfully
influenced consumers to buy in the past. A variety of factors go into the
consumer buying behavior process, they are cultural factors, social factors,
personal factors, and so on.
Consumer behavior is the study of how individual customers, groups, or
organizations select, buy, use, dispose of ideas, goods, and services to satisfy
their needs and wants. It refers to the actions of the consumers in the market
place and the underlying motives for those actions.
Soft drinks are an important product item in modern society. In urban and rural
becoming more popular in the consumer world. At present soft drink, the
market is one of the most competitive markets in the world. Today’s business
environment is highly competitive and rapidly changing. Therefore, if a firm
wants to succeed or survive in the market, there should be a continuous
observation of consumer behavior and their preference because consumers are
the kings in the business.
Today soft drink not only reduces the thirst but also has become style and
fashion. The interest of the survey is to know what people like most about soft
drinks and what attracts them towards buying this product. Soft drinks are one
of the most popular drinks which are consumed on all types of occasions. The
demand for soft drinks is increasing day by day due to changes in climate
conditions, liking for fast food, and change in culture. The soft drink includes all
types of non-alcoholic, carbonated, and flavored beverages. These artificially
sweetened drinks are available in different flavors, different sizes, and in
different packages. The buying behavior largely depends upon taste, quality;
price, availability, and advertisement, etc. There are soft drink brands like Pepsi,
Coca-Cola, Sprite, Fanta, 7up, and so on.
10
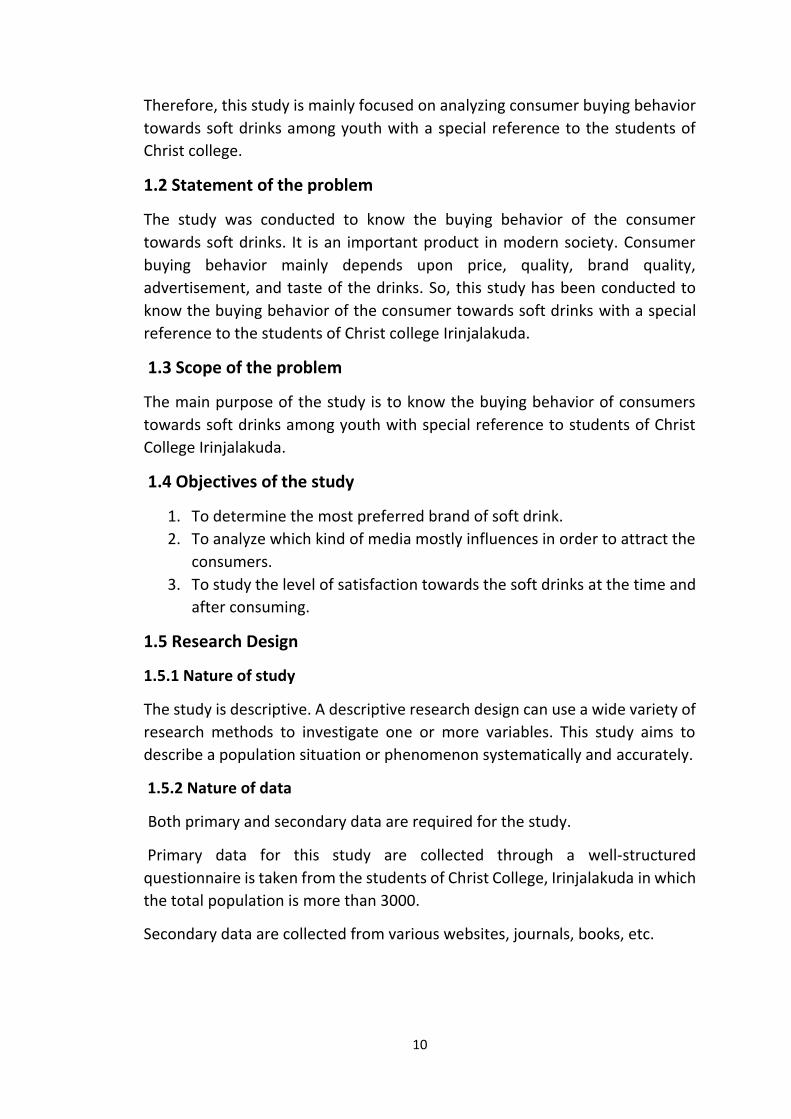
Therefore, this study is mainly focused on analyzing consumer buying behavior
towards soft drinks among youth with a special reference to the students of
Christ college.
1.2 Statement of the problem
The study was conducted to know the buying behavior of the consumer
towards soft drinks. It is an important product in modern society. Consumer
buying behavior mainly depends upon price, quality, brand quality,
advertisement, and taste of the drinks. So, this study has been conducted to
know the buying behavior of the consumer towards soft drinks with a special
reference to the students of Christ college Irinjalakuda.
1.3 Scope of the problem
The main purpose of the study is to know the buying behavior of consumers
towards soft drinks among youth with special reference to students of Christ
College Irinjalakuda.
1.4 Objectives of the study
1. To determine the most preferred brand of soft drink.
2. To analyze which kind of media mostly influences in order to attract the
consumers.
3. To study the level of satisfaction towards the soft drinks at the time and
after consuming.
1.5 Research Design
1.5.1 Nature of study
The study is descriptive. A descriptive research design can use a wide variety of
research methods to investigate one or more variables. This study aims to
describe a population situation or phenomenon systematically and accurately.
1.5.2 Nature of data
Both primary and secondary data are required for the study.
Primary data for this study are collected through a well-structured
questionnaire is taken from the students of Christ College, Irinjalakuda in which
the total population is more than 3000.
Secondary data are collected from various websites, journals, books, etc.

11
1.5.3 Sources of data
Data are collected from the students of Christ College Irinjalakuda through a
well-structured questionnaire.
1.6 Sample Design
1.6.1 Nature of population
A population is a group of individuals, objects, or items from which samples are
taken for measurement. The population of this study is finite in nature.
Population in this study includes students of Christ College Irinjalakuda in which
the total population is more than 3000.
1.6.2 Sample unit
Sampling unit refers to one number of a set of entities being studied. The
Student of Christ College Irinjalakuda is the sampling unit under this study.
1.6.3 Method of sampling
The method of sampling used for the study is stratified random sampling under
the probability sampling technique. Stratified random sampling is a method of
sampling that involves dividing a population into smaller groups called strata.
1.6.4 Size of samples
The size of the sample used for collecting the data is 50 respondents.
Respondents are classified into 2 strata, each strata consists of 25 students,
among 25 of them are from arts and other from science.
1.7 Tools for Analysis
Primary data for this study are collected through a well-structured
questionnaire is taken from the students of Christ college, Irinjalakuda. Scaling
techniques like Likert scale, Simple percentage analysis, Tables, Charts and
Diagrams are the tools used for this data analysis.
1.8 Limitation
• The sample size is limited to 50 students only from Christ college
Irinjalakuda in which the total population is more than 3000.
• The direct investigation was not possible to conduct due to COVID-19
Pandemic.

12
1.9 Chapterization
This project is organized into chapters namely Introduction, Review of
literature, Industry profile and company profile, Data analysis and
interpretation, findings, suggestions and conclusion.
Chapter 1 Introduction
Chapter 1 includes the introduction to the study. It includes the Statement of
the problem, Scope of the study, Objective of the study, Hypothesis Sample
design, and limitation.
Chapter 2 Review of literature
This chapter deals with the review of literature of the study.
Chapter 3 Industry profile and company profile
This chapter deals with the study soft drinks industries and company profiles
of different brands of soft drinks.
Chapter 4 Data analysis and interpretation
This chapter deals with the study on consumer buying behavior towards soft
drinks among youth with special reference to the students of Christ college
Irinjalakuda by using percentage analysis with tables and pie diagrams.
Chapter 5 Findings, suggestions and conclusion
This chapter deals with important findings, suggestions and conclusion about
the study on consumer buying behavior towards soft drinks among youth with
special reference to the students of Christ college Irinjalakuda.

13
CHAPTER 2
REVIEW OF LITERATURE

14
2.1 Conceptual Review
2.1.1Concept of consumer buying behavior
Consumer buying behavior is the mix of a consumer’s attitudes, preferences
and decision-making process when the consumer is acting in the market place
to buy a good or service. It is a study of actions of the consumers that drive
them to buy and use certain products. Study of consumer buying behavior is
most important for marketers as they can understand the expectations of the
consumers. Consumer preferences are defined as the subjective tastes, as
measured by utility, of various bundles of goods. They permit the consumer to
rank these bundles of goods according to the levels of utility they give the
consumer. Ability to purchase goods does not determine consumers likes or
dislikes.
2.1.2 Factors affecting consumer buying behavior
Consumer preference is also influenced by such social factors as reference
groups, family and social roles and status. Personal factors such as buyer’s
decisions are also influenced by personal characteristics, the buyer’s age, life
cycle stages, occupation, economic circumstances, life style and personality and
self-concept.
• Psychological factors like motivation, perception, learning, beliefs and
attitudes.
• Personal factors like age and life-cycle stage, occupation, economic
circumstances, life style, personality and self-concept.
• Social factors like reference group, family, roles and status.
• Cultural factors like subculture, social class system.
2.1.3 Advantages
• Helps in formulating right marketing strategy.
• Helps in the segmentation of market.
• Helps in the development of new products.
• Helps in product orientation
• Helps in reorientation of packaging
• Help consumers to study their behavior.
2.2 EMPIRICAL LITERATURE
Mishra (2010) in his study on "Rural Marketing India towards Soft Drinks
Opportunity and Challenges", concluded that the rural markets have opened a
new front for the modem marketers. The income of rural population in India

15
and their purchasing power has also increased in recent years. Soft drinks
companies have to ascertain their needs and exploit the vast potential of rural
markets with appropriate marketing strategies. The Indian rural market can be
considered soft drinks that need to be explored. However, broadly scattered
and heterogeneous rural markets, inadequate and insufficient rural
transportation, inefficient communication and warehousing facilities, overall
backwardness, preference for the way of life of the rural people, etc., are some
such factors which must to tackled as these have been hindering the growth of
rural markets. Soft drinks companies have to meet the challenges of availability
affordability, acceptability, and awareness in rural India.
Hyman (2009) in his study on "promotional as co-operation in the soft drink
industry" concluded that the customer information gathering explanation of
promotions is ruled out by the longevity and nature of this market. Soft drink
penetration is among the highest in grocery stores, and it is unlikely that
enough nonusers exist to account for the intensity of observed promotions. Soft
drink bottlers promote brands for a mixture of co-operative and competitive
reasons that supports the brand interdependence framework, which uses
asymmetric competitive draw to explain promotions as co-operation. As one
former Pepsi executive said about competing with coke, "When I worked at
Pepsi, we thought of the market as ours, theirs and up for grabs. We wanted to
get more than our fair share of what was up for grabs." Soft drink penetration
is among the highest in grocery stores, and it is unlikely that enough nonusers
exist to account for the intensity of observed promotions.
Guthery (2005) in his study on "Coco-Cola's marketing challenges in Brazil"
concluded that the sale of the soft drink has grown globally an average of 5% a
year. The company's "Global soft drinks report 2002" states that in 2001
consumers around the world drink 4,12,000 million liters of soft drinks which
represent 67.5 liters per capita. Coco- cola company has resigned as the
supreme soft drink market leader. The company sells its products in more than
200 countries. In the U.S., Coco-Cola and Pepsi hold, respectively, (44%) and
(31%) market shares. The Coco-Cola brand was the leader in the Brazilian soft
drink market with a 35.6% market share. It was a major investment destination
of global companies, particularly manufacturers of mass consumer goods.
Johnson and Peppas (2003) in their study on "Crisis Management in Belgium
the Case of Coca-Cola" concluded that the Coco-cola comp. has been a
standard-bearer of management and leadership practices against which other
companies have been measured. The Coco-cola brand has become a symbol of
globalization the second most recognized phrase World Wide. It also enjoyed
unparalleled loyalty and commitment from employees, customers, and

16
stockholders. The company had a reputation for doing the right thing and for
doing things right.
Sarwade and Babasaheb Ambedkar (2002) in their study on "Emerging
Dimensions of Buyer Behavior in rural Area" said that good quality and
availability of retail price are the main factor which influenced the rural
consumer of a particular brand of a product. Retail price, advertisement, word
of mouth, and retail shopkeepers are the other factors that influenced the
brand of soft drinks in the study area. A study was undertaken to identify the
popular brands of soft drinks and the factors that contribute to the purchase of
it in the rural area of Tamil Nadu. The soft drink market in the rural area
constitutes an important market for both coke and Pepsi because it contributes
up to 8% of their total sales on an all India level of rural area.
Anderson and Vileassim (2001) in their study on "Soft drinks structural demand
model for retail category pricing" concluded that the derivation of carbonated
for soft drinks demand from consumer theory ensures that aggregate demand
is "well behaved". Such that a retailer's corresponding profit function satisfied
all the conditions necessary for deriving an optimal price vector. Once this
specification is used to study category profitability, additional ad-hoc
restrictions may need to be imposed for the profit function to be maximized.
He was compensating variation that can be used to measure consumer
willingness to pay in dollars to maintain the status quo versus a hypothetical
change in the marketing or category conditions.
Tepper and Amy (1998) in their study on "Consumer Acceptance of Coco-cola
Drinks in Rural Area (Taste (or) health)" concluded that the relative
contributions of taste and health considerations on consumer liking and
purchase intent of Coco-cola drinks. Eight types of commercial Coco-cola drinks
were evaluated by 305 adult consumers who also completed a brief
questionnaire on food habits. These variables emerged as the first factor in the
analysis, suggesting that consumers perceive these characteristics as being
most important in their choice of Coco-cola drinks. The second factor described
a health dimension and was related to respondents' attitudes towards fat in the
diet. The factory three comprised two remaining sensory attributes (color and
crunchiness) which were of minor importance to the respondents.
Park and Srinivasan (1994) in their study in "A survey-based method for
measuring and understanding soft drinks brand and its extensibility condoned
that soft drink as the difference between an individual consumer's overall brand
preference and his or her multi-attribute preference based on objectively
measured attribute levels. According to that, the soft drinks brand is the

17
difference between subjective and objective preferences, and this difference is
attributed to the influence of soft drinks.
Richard (1993) in his study on "Co-branding aims to double the appeal"
concluded that our approach accommodates three significant and novel
challenges that a product with branded components raises for marketers and
research alike: The first is the presence of multiple decision-makers. Consumer
valuations and market-level pay off must satisfy two classes of decision-makers
in the supply side: (a) the seller of the bundled product and (b) the branded
component manufacturer(s). The seller's return is tied to the bundle level
impact such as price premiums, profit, and/or market expansion by marketing
the bundle of branded components the second is the issue of contingent value.
A branded component carries certain equity. It signals quality and performance
more strongly than a conventional attribute. The component's value is also
susceptible to the interactive influence of its partnering component via
mechanisms.
Srivastava and Shocker (1991) in their study on "Soft drinks: A perspective on
its meaning and measurement" soft drinks consist of size and price. Size is the
set of associations and behavior on the part of the brand's customers, channel
members, and parent corporation that permits the brand to enjoy sustainable
and differentiated competitive advantages. Price is the financial outcome of the
management's ability to average brand size via tactical and strategic actions in
providing superior current and future profits and lower risk. It can be concluded
that size refers to the consumer aspect of brand equity and price refers to the
financial aspect of brand equity and price refers to the financial aspect of the
same concept.

18
CHAPTER 3
INDUSTRY AND COMPANY
PROFILE

19
3.1 INDUSTRY PROFILE
The term soft drinks were originated to distinguish the flavored drinks from
hard liquor or distilled spirits. Soft drinks were recommended has a substitute
in the effort to change the harder-drinking habits of early Americans. Indeed,
health concerns of modern consumers lead to new categories of soft drinks
emphasizing low calorie count, low sodium content, no caffeine and all-natural
ingredients.
Soft drinks are called “soft” in contrast with “hard” alcoholic drinks. Small
amounts of alcohol may be present in the soft drinks, but the alcohol content
must be less than 0.5% of the total volume of drink in many countries and
locality.
Soft drinks may be served cold, over ice cube, or at room temperature, they are
available in many container formats. Including cans, glass bottles and plastic
bottles. Containers come in a verity of sizes ranging from small bottles to large
multi-liter containers. Soft drinks are widely available at fast food restaurants,
movie theaters casual-dining restaurants, dedicated soda stores, vending
machines and bars from soda fountain machines.
A Soft drink that typically contains a carbonated, sweetener and natural or
artificial flavoring. The sweetener may be sugar, high fructose, corn syrup, fruit
juice, sugar substitutes or some combination of these soft drinks may also
contain caffeine, coloring, preservative, and other ingredients.
Soft drinks are called "soft" in contrast with "hard" alcoholic beverages. A small
amount of alcohol content must be less than 0.5% of the volume of alcoholic,
fruit punch. Tea and other such non-alcoholic beverage are technically soft
drinks by this definition but are not generally referred to as such.
3.1.1 Materials used in soft drinks
There are different types of raw materials used in different soft drinks.
Most of the raw materials are:
• Water: the simple sweetened soft drink contains about 90% of
water, while in diet drinks. It contains 95% water.
• Flavor: flavor is of great importance in a soft drink. Even water from
different places has a different taste. The flavor for taste added can
be natural or artificial, acidic, caffeine.
• Acids: acids like citric acid & phosphoric acid are added to give
refreshing tartness or bite & help in preserving the quality of a
drink.

20
• Natural flavors: these are the flavors, which are extracted from
fruits, vegetables, nuts, barks, leaves, etc. in soft drinks containing
natural flavors& fruit juice.
• Artificial flavor: these are the flavors manufactured from natural
extracts. This is used to give greater choice, in taste to consumers.
• Caffeine: caffeine has a special kind of taste that makes the taste of
soft drink a royal one. Caffeine was added to soft drinks from its
introduction to a commercial market but now caffeine free soft
drinks are also available. Its quality is Y4 than compared with the
same amount of coffee.
• Carbon dioxide: carbon dioxide is a colorless & smell-less gas, which
is added to cold drink to get bubble & it also helps in keeping drink
strong &fresh
• Color: along with the taste of soft drinks is also very important, the
company tries to maintain both the taste & color of the soft drink
everywhere in the world.
• Sugar: sugar syrup is added to the drink at around 75 degrees C to
the pure drinking water, this is to make the soft drink taste sweet.
Even artificial sweetness is also used.
3.1.2 History
The original soft drinks lie in the development of fruit-flavored drinks. In the
medieval Middle East, a verity of fruit- flavored soft drinks were widely drunk
such as sharbat, and were often sweetened with ingredient such as sugar, syrup
and honey. Another early type of soft drink was lemonade, made of water and
lemon juice sweetened with honey, but without carbonated water.
3.2 COMPANY PROFILE
3.2.1 Brand preference
Brand preference is strongly linked to the brand choice that can influence
the decision making of consumers and activate brand purchase. One of
the indicators of the strength of the brand in the hearts and minds of
customers, a brand represents which brands are preferred under the
assumption of the equality in price and availability.
Measures of brand preference attempt to quantify the impact of
marketing activities in the hearts and minds of customers and potential
customers. Higher brand preference usually indicates more revenues

21
(sales) and profit, also making it an indicator of company financial
performance.
3.2.2 Top Selling soft drinks brands in India
• Coca-Cola Coca-Cola is a carbonated soft drink sold in stores, restaurants, and
vending machines throughout the world. It is produced by the Coca-Cola
referred to simply as Coke (a registered trademark of the Coca-Cola
company in the united states since March 27, 1944). Originally invented
as a patent medicine when it was invented in the late 19th century by
John Pemberton, Coca-Cola was brought out by businessman Asa Griggs
Candler, whose marketing tactics led Coke to its dominance of the world
throughout the 20th century.
The company produces concentrate, which is then sold to licensed Coca-
Cola bottlers throughout the world. The bottlers, who hold territorially
exclusive contracts with the company, produce finished products in cans
and bottles from the concentrate in combination with filtered water and
sweeteners. The bottlers then sell and merchandise Coca-Cola to retail
stores and vending machines. The Coca-Cola company also sells
concentrate for soda fountains to major restaurants and foodservice
distributors.
The Coca-Cola company has, on occasion, introduced other cola drinks
under the Coke brand name. The most common of these is diet coke,
with others including caffeine-free Coca-Cola, diet coke caffeine-free,
Coca-Cola cherry, Coca-Cola zero, Coca-Cola vanilla, and special versions
with lemon, lime, or coffee. In 2013, Coke products could be found in
over 200 countries worldwide, with consumers downing more than 1.8
billion company beverage servings each day.
• Pepsi Pepsi is a carbonated soft drink that is produced and manufactured by
PepsiCo. Created and developed in 1893 and introduced as brad's drink,
it was renamed as Pepsi cola on Aug 28, 1898, then to Pepsi in 1961, and
in select areas of North America, "Pepsi Cola made with real sugar" as of
2014.
The drink Pepsi was first introduced as "Brad's Drink" in New Bern, North
Carolina, United States, in 1893 by Caleb Bradham, who made it at his
drugstore where the drink was sold. It was renamed Pepsi –cola in 1898,
named after the digestive enzyme pepsin and kola nuts used in the
recipe. The original recipe also included sugar and vanilla. Bradham

22
sought to create a fountain drink that was appealing and would aid in
digestion and boost energy.
In 1903, Bradham moved the bottling of Pepsi cola from his drugs stores
to a rented warehouse that year, Bradham sold 7968 gallons of syrup.
The next year, Pepsi was sold in six-ounce bottles, and sales increased to
19848 gallons. In 1909, automobile race pioneer Barney Oldfield was the
first celebrity to endorse Pepsi cola, describing it as "A bully drink...
refreshing, invigorating, fibracer before a race". The advertising theme
"dishes and healthful" was then used over to the next two decades. In
1926, Pepsi received its first logo redesign since the original design of
1905. In 1929, the logo was changed again.
In 1931, at the depth of the great depression, the Pepsi cola company
entered bankruptcy in large part due to financial losses incurred by
speculating on the widely fluctuating sugar prices as a result of World
War I. Assets were sold and Roy c. Megargel bought the Pepsi trademark.
Megargel was unsuccessful, and soon Pepsi's assets were purchased by
Charles Guth, the president of Loft. The loft was a candy manufacturer
with retail stores that contained soda fountains. He sought to replace
coco-cola at his store fountains after Coke refused to give him a discount
on syrup. Guth then had Lofts chemists reformulate the Pepsi cola syrup
formula.
On three separate occasions between 1922 and 1933, the Coca-Cola
company was offered the opportunity to purchase the Pepsi Cola
company, and it declined on each occasion.
• Sprite
Sprite is a colorless, lemon and lime flavored, caffeine-free soft drink,
created by the Coca-Cola company. It was developed in West Germany
in the United States as a sprite in 1961. This was coke's response to the
popularity of 7 up. It comes in a primary silver, green, and blue can or a
green transparent bottle with a primarily green and blue label.
• Fanta
Fanta originated as a result of difficulties importing Coca-Cola syrup
into nazi germane during World War II due to trade embargo. To
circumvent this, Max Keith, the head of Coca-Cola Deutschland
(Coca-Cola) during the second world war, decided to create a new
project for the German market, using only ingredients available in
Germany at the time including whey and pomace – "leftovers of
leftovers " as Keith later recalled. The name was a result of a brief
brainstorming section, which started with Keith's exhorting his

23
team to "use their imagination ("Fantasia" in German) to which one
of his salesmen, Joe Knipp, immediately retorted "Fanta"
The plant was effectively cut off from Coca-Cola headquarters
during the war. After the war, the Coca-Cola Corporation regained
control of the plant, formula, and trademark to the new Fanta
product as well as the plant profit during the war.
Fanta was discontinued when the parent company was reunited
with the German branch. Following the launch of several drinks by
the Pepsi corporation in the 1950s, Coca-Cola competed by
relaunching Fanta in 1955. The drink was heavily marketed in
Europe, Asia, Africa, and South America.
• 7up 7 Up is a brand of lemon-lime-flavored non-caffeinated soft drink. The
rights to the brand are held by Keurig Dr. Pepper in the United States and
by 7 Up international in the rest of the world. The U.S. version of the 7
Up logo includes a red circle between the "7" and "Up"; this red circle
has been animated and used as a mascot for the brand as Cool Spot.
Before that, the mascot was a fictional character named Fido Dido
created by Joanna Ferrone and Sue Rose. He is still used outside the U.S.
for a limited time only 7 Up retro cups.
3.2.3 The Advantages of Soft Drinks Soft drink consumption has increased substantially over the last 50 years
and it has been established that people have large amounts of soft drinks
regularly.
• Caffeine Benefits
Caffeine is a stimulant that is found in soft drinks. In large amounts can
have detrimental effects on your health but it also has numerous
benefits. Caffeine stimulates your central nervous system, helps
breakdown fatty acids in your liver, boosts your mood, and alleviates
headaches. People who regularly ingest caffeine are less likely to
develop Parkinson's disease, colon cancer, gallstones, and cirrhosis of
the liver.
• Carbonated Water
Carbonated water is a primary ingredient of soft drinks. Carbonated
water was created by Joseph Priestly in the year 1767 and has since
proven to have many benefits for the gastrointestinal tract. Carbonated
water eases stomachaches, quells nausea, and has been proven to
alleviate constipation.

24
• Sodium Benefits
Sodium is another product found in soft drinks. Sodium is an important
mineral found in almost all-natural foods. Sodium helps your body retain
water, helps avoid and treat muscle cramps, keeps electrolyte balance,
prevents the effects of aging of your skin, and prevents the drop of your
blood pressure.
3.2.4 The Disadvantages of Soft Drinks
• Dehydration
Sixty percent of our body weight is comprised of water, report mayo
clinic.com. we lose water when you sweat, urinate and breathe. For the
body to continue functioning properly, we must replace the lost water
with ingested fluids. sodas are often consumed in the place of water or
other hydrating fluids. Many sodas contain caffeine, which acts as a
diuretic, increasing urination and leaving the body with less available
fluid to carry out an important function. additionally, some diet sodas
contain significant amounts of sodium, which may draw water from the
cells and promote dehydration.
• High sugar content
Many soft drinks contain significant quantities of sugar. one 12-ounce
serving of cola, for example, includes 39 grams, or 3.3 tablespoons, of
sugar. Consuming such large quantities of sugar elevates your blood
glucose level and may increase your risk for cardiovascular disease.
Additionally, may sodas contain high fructose corn syrup or HFCS as their
primary sugar ingredient. HFCS may stress the pancreas and lead to
fluctuating blood sugar levels. Consuming sugary sodas day after day can
contribute to the onset of non-insulin-dependent diabetes, or type 2
diabetes.
• Weight Gain
Weight gain results when you consume more calories than your body
burns. A 12-ounce serving of cola contains 140 calories, often called
"empty calories" Because they provide no nutritional value. Drinking one
can of cola a day for four Weeks is equivalent to ingesting 3,920 extra
calories, or a gain of 1.1 pounds if the calories are not burned. A 160-
pound person must walk for 27 minutes at 3.5 miles per hour to burn off
the calories in one can of cola, according to the calorie-expenditure
analysis provided by the MayoClinic.com. If these calories are not
burned, you may gain more than 12 pounds in one year. Additionally,

25
sweet-flavored sodas may disrupt appetite signals and promote cravings
for other sugary foods.
• Calcium Depletion
Calcium is an essential mineral for strong bones and teeth. Consuming
high amounts of phosphoric acid, a common ingredient in sodas, can
deplete the calcium from your bones and decrease calcium absorption.
Among women, this may lead to poor bone development or
osteoporosis, a condition characterized by brittle and weak bones.

26
CHAPTER 4
DATA ANALYSIS AND
INTERPRETATION

27
4.1 Introduction
Buying behavior towards soft drinks among youth has been made use of both
primary and secondary data. The primary data was collected from 50 people
using questionnaire, the samples being selected on the basis of convenience
was classified and analysis details of the collected data.
4.2 Analysis and interpretation
Table 4.1
Age wise classification
Age
No of respondents percentage
Below 18 1 2
18 - 20 32 64
21 - 22 17 34
Total 50 100
(Source Primary Data)
From the above table, 34% belongs to the age group of 21-22, 2% belongs to
the age group of below 18 and 64% belong to the age group of 18-20. Hence, it
can be interpreted that most of the respondents are belongs to the age group
of 18-20.
Figure 4.1
Showing age wise classification.
Age
Below 18 18 -20 21 -22

28
Table 4.2
Gender wise classification
Gender No of respondents Percentage
Male 23 46
Female 27 54
Total 50 100
(Source Primary Data)
From the above table, 54% respondents are female and 46% are male. Hence,
it can be interpreted that most of the respondents are female.
Figure 4.2
showing Gender wise classification.
Gender
Male Female Other

29
Table 4.3
Awareness about brand of soft drinks available in your city
Particulars No of respondents percentage
Yes 49 98
No 1 2
Total 50 100
(Source: Primary Data)
From the above table, 98% respondents are aware about the brand of soft
drinks available in their city and 2% respondents are not aware about the brand
of soft drinks available in the city. Hence it can be interpreted that most of the
respondents are aware about the brand of soft drinks available in their city.
Figure 4.3
Showing awareness of the brand of soft drinks available in your city.
Table 4.4
Know about the branded soft drinks.
Aware about the brand of soft drinks
Yes No

30
Particulars No of respondents Percentage
Advertisement 36 72
Friends 6 12
Family members 2 4
Retail shops 5 10
Other consumers 1 2
Total 50 100
(Source: Primary Data)
From the above table, 72% of respondents came to know about the branded
soft drinks through advertisement. 12% respondents came to know about the
branded soft drinks through friends, 4% respondents came to know about the
branded soft drinks through family members, 10% respondents came to know
about the branded soft drinks through retail shops and 2% respondents came
to know about the branded soft drinks through other consumers. Hence it can
be interepreted that most of the respondents are came to know about branded
soft drinks through advertisement.
Figure 4.4
showing came to know about the branded soft drinks.
Table 4.5
Current favorite brand of soft drinks
Know about branded soft drinks
Advertisement Friends Family members Retail shop Other consumers

31
Particulars No of respondents Percentage
Coca-Cola 11 22
Fanta 0 0
Sprite 22 44
Mountain Dew 6 12
Pepsi 5 10
7-Up 6 12
Total 50 100
(Source: Primary Data)
From the above table, 22% respondents favorite soft drinks is Coca-Cola, 0%
respondents favorite soft drinks is Fanta, 44% respondents favorite soft drinks
is Sprite, 12% respondents favorite soft drinks is Moutain Dew, 10%
respondents favorite soft drinks is Pepsi and 12% respondents favorite soft
drinks is 7-Up. Hence it can be interepreted that most of the respondents
favorite brand is Sprite.
Figure 4.5
showing current favorite brand of soft drinks
Table 4.6
Awareness about the manufacturer of your favorite brand.
Favorite Brand
Coca-Cola Fanta Sprite Moutain Dew Pepsi

32
Particulars No of respondents Percentage
Yes 34 68%
No 16 32%
Total 50 100%
(Source: Primary Data)
From the above table, 68% respondents are aware about the manufacturer of
your favorite brand and 32% respondents are not aware about the
manufacturer of their favorite brand. Hence it can be interpreted that most of
the respondents are aware about the manufacturer of their favorite brand.
Figure 4.6
Showing awareness about the manufacturer of their favorite brand
Aware about the manufacturer
Yes No

33
Table 4.7
Media of advertisement mostly influence respondents to buy soft drinks.
(Source: Primary Data)
From the above table, it can be interpreted that 74% respondents are
influenced to buy soft drinks through the advertisement of television.
Figure 4.7
showing media of advertisedement mostly influence you to buy soft drink.
Media of advertisement mostly influence to buy soft drinks
Newspaper Television Internet Posters Banners
Particulars No of respondents Percentage
Newspaper 0 0%
Television 37 74%
Internet 12 24%
Posters 1 2%
Banners 0 0%
Total 50 100%

34
Table 4.8
The most preferred color of soft drinks.
Particulars No of respondents Percentage
Orange 5 10%
Dark color 14 28%
Colorless 28 56%
Others 3 6%
Total 50 100%
(Source: Primary Data)
From the above table, 10% respondents preferred orange color of soft drinks,
28% respondents preferred dark color of soft drinks, 56% respondents
preferred colorless soft drinks and 6% respondents preferred other color of soft
drinks. Hence it can be interpreted that most of the respondents preferred
colorless soft drinks.
Figure 4.8
showing most preferred color of soft drinks
Table 4.9
The most preferred container for soft drinks.
Preferred color
Orange Dark color Colorless Others

35
Particulars
No of respondents Percentage
Glass bottles 10 20
Plastic bottles 18 36
Cans 22 44
Others 0 0
Total 50 100
Source: Primary Data)
From the above table, 20% respondents are preferred the glass bottles, 36%
respondents are preferred the plastic bottles and 44% respondents are
preferred the cans. Hence it can be interpreted that most of the respondents
preferred cans containers of soft drinks.
Figure 4.9
showing most preferred container for soft drinks.
Table 4.10
Reuse of plastic bottles after consuming the content.
Preferred container
Glass bottles Plastic bottles Cans Others

36
Particulars No of respondents Percentage
Yes 34 68
No 16 32
Total 50 100
(Source: Primary Data)
From the above table, 68% of respondents are reusing the plastic bottle after
consuming the content and 32% of respondents are not reusing the plastic
bottles after consuming the content. Hence it can be interpreted that most of
the respondents are reusing the plastic bottles after consuming the content.
Figure 4.10
showing reuse of plastic bottle after consuming the content.
Table 4.11
Reuse of plastic bottles
Yes No

37
While you prefer a plastic bottle of soft drinks the size of bottle respondents
wish to purchase
Particulars
No of respondents Percentage
Small 13 26
Medium 32 64
Large 5 10
Total 50 100
(Source: Primary Data)
From the above table, 26% respondents preferred small bottles, 64%
respondents preferred medium bottles and 10% respondents preferred large
bottles. Hence it can be interpreted that most of the respondents are preferred
medium size plastic bottle of soft drinks.
Figure 4.11
showing while you prefer a plastic bottle of soft drinks the size of bottle
respondents wish to purchase.
Table 4.12
keep the brand name in mind while purchasing soft drinks.
Size of bottles
Small Medium Large

38
Particulars
No of respondents Percentage
Yes 39 78
No 11 22
Total 50 100
(Source: Primary Data)
From the above table, 78% respondents keep the brand name in while
purchasing soft drinks and 22% respondents do not keep the brand name.
Hence it can be interpreted that most of the respondents keep the brand name
in while purchasing soft drinks.
Figure 4.12
showing keep the brand name in mind while purchasing soft drinks.
Table 4.13
Period of least consumption of soft drinks.
Brand name
Yes No

39
Particulars No of respondents
Percentage
Sickness
15 30
Summer season 13 26
Rainy season 14 28
Others 8 16
Total 50 100
(Source: Primary Data)
From the above table, 30% respondents have least consumption of soft drinks
while sickness, 26% respondents have least consumption of soft drinks while
summer season, 28% respondents have least consumption of soft drinks while
rainy summer and 16% respondents have least consumption of soft drinks while
others. Hence it can be interpreted that most of the respondents have least
consumption of soft drinks in sickness.
Figure 4.13
showing period of least consumption of soft drinks.
Table 4.14
While the preferred brand is not available.
Least consumption
Sickness Summer season Rainy season Others

40
Particulars
No of respondents Percentage
Post pone purchase 4 8
Buy another brand 31 62
Search in another shop 15 30
Total 50 100
(Source: primary Data)
From the above table, 8% respondents postpone purchase, 62% respondents
buy another brand and 30% search another shop. Hence it can be interpreted
that most of the respondents buy another brand while preferred brand is not
available.
Figure 4.14
Showing while the preferred brand is not available.
Table 4.15
Appropriate reason for not buying soft drinks you hate.
Preferred brand is not available
Postpone purchase Buy another brand Search in another shop

41
Particulars
No of respondents Percentage
Not interested 14 28
Not expected taste 11 22
Not good for the health 23 46
Not known about the product
2 4
Total 50 100
(Source: Primary Data)
From the above table, 28% respondents are not interested, 22% respondents
are not buying the soft drinks because of less expected taste, 46% respondents
are not buying the soft drinks because of not good for health and 4%
respondents are not buying the soft drinks they hate because of not known
about the product. Hence it can be interpreted that most of the respondents
are not buying the soft drinks because of not good for health.
Figure 4.15
showing appropriate reason for not buying soft drinks you hate.
Table 4.16
Aware of the offers and discounts on soft drinks
Reasons for not buying soft drinks
Not interested Not expected taste Not good for health Not known about the product

42
Particulars
No of respondents Percentage
Yes 31 62
No 19 38
Total 50 100
(Source: Primary Data)
From the above table, 62% respondents are aware of offers and discounts and
38% respondents are not aware of offers and discounts. Hence it can be
interpreted that most of the respondents are aware of offers and discount on
soft drinks.
Figure 4.16
showing awareness of the offers and discounts on soft drinks.
Table 4.17
Availed such offers and discounts of soft drinks.
Aware of the offers and discounts
Yes No

43
Particulars
No of respondents Percentage
Yes 26 52
No 24 48
Total 50 100
(Source: Primary Data)
From the above table, 52% respondents are availed such offers and discounts
and 48% respondents are not availed such offers and discounts. Hence it can be
interpreted that most of the respondents are availed such offers and discounts
of soft drinks.
Figure 4.17
showing availed such offers and discounts of soft drinks
Table 4.18
Availed offers and discounts
Yes No

44
The level of satisfaction you enjoyed “at the time of” and “after” consuming
your favorite soft drinks.
Particulars No of respondents Percentage
Highly satisfied 10 20
Satisfied 23 46
Neutral 17 34
Dissatisfied 0 0
Highly dissatisfied 0 0
Total 50 100
(Source: primary Data)
From the above table, 20% respondents are highly satisfied, 46% respondents
are satisfied and 34% respondents feels neutral at the time of consumption.
Hence it can be interpreted that most of the respondents are satisfied “at the
time of” and “after” consuming your favorite brand.
Figure 4.18
showing the level of satisfaction, you enjoyed “at the time of” and “after”
consuming your favorite brand.
Table 4.19
Level of satisfaction
Highly satisfied Satisfied Normal Dissatisfied Highly dissatisfied

45
Level of satisfaction with regard to size of packaging the soft drinks.
Particulars
No of respondents Percentage
Highly satisfied 5 10
Satisfied 28 56
Neutral 16 32
Dissatisfied 0 0
Highly Dissatisfied 1 2
Total 50 100
(Source: Primary Data)
From the above table, 10% respondents are highly satisfied, 56% respondents
are satisfied, 32% respondents feel neutral and 2% respondents are highly
dissatisfied. Hence, it can be interpreted that most of the respondents are
satisfied with regard of size of packaging the soft drinks.
Figure 4.19
showing the level of satisfaction with regard to size of packaging the soft
drinks.
Table 4.20
Level of satisfaction towards size of packaging
Highly satisfied Satisfied Normal Dissatisfied Highly dissatisfied

46
while you purchase your favorite soft drinks, the printed information wishes
to examine.
Particulars No of respondents
Percentage
Nam of the manufacturer
1 2
Price 13 26
Quantity 4 8
Special offers 2 4
Date of manufacturing 25 50
Ingredients 5 10
Total 50 100
(Source: Primary Data)
From the above table, 2% respondents examine name of manufacturer, 26%
respondents examine price, 8% respondents examine quantity, 4% respondents
examine special offers, 50% respondents examine date of manufacturing and
10% respondents examine ingredients. Hence it can be interpreted that most
of the respondents wish to examine date of manufacturing while purchasing
your favorite brand.
Figure 4.20
showing while you purchase your favorite soft drinks, the printed
information you wish to examine.
Printed information that wish to examine
Name of manufacturer Price Quantity Special offers Date of manufacturing Ingredients

47
Table 4.21
frequency of purchasing the soft drinks.
Particulars No of respondents Percentage
Daily 0 0
Many times, in a week 2 4
Sometimes in a week 10 20
As and when required 38 76
Never 0 0
Total 50 100
(Source: Primary Data)
From the above table, 4% respondents are purchasing soft drinks many times
in a week, 20% respondents are purchasing soft drinks sometimes in a week
and 76% respondents are purchasing soft drinks as and when required. Hence
it can be interpreted that most of the respondents are purchasing soft drinks as
and when required.
Figure 4.21
showing frequency of purchasing the soft drinks.
Frequency of purchasing
Daily Many times in a week Sometimes in a week As and when requried Never

48
CHAPTER 5
FINDINGS, SUGGESTIONS
AND CONCLUSION

49
5.1 Findings
• Most of the respondents belongs to the age group of 18 -20.
• Majority of the respondents are females
• Majority of the respondents are aware about the brand of soft drinks
available in their city.
• The most of the respondents are influenced to buy soft drinks through
the advertisement of television.
• Majority of the respondents prefer Sprite and the second most preferred
soft drink is Coca-Cola.
• Majority of the respondents are aware about the manufacturer of their
favorite brand.
• Most of the respondents are influenced to buy soft drinks through
television.
• The most of the respondents preferred colorless soft drinks.
• The most of the respondents preferred cans for soft drinks.
• The most of the respondents reuse the bottle after consuming the
content.
• Majority of respondents are preferred medium size plastic bottle soft
drinks.
• The most of the respondents will keep brand name in their mind while
purchasing soft drinks.
• The most of the respondents have least consumption of soft drinks in
sickness.
• From the study it is found out that when preferred brand is not available
the most of the respondents will buy another brand.
• Most of the respondents preferred that the soft drinks they hate to buy
is not good for health.
• Most of the respondents are aware about the offers and discounts of
soft drinks.
• Most of the respondents are availed such offers and discounts.
• Most of the respondents are satisfied “at the time of” and “after”
• Consuming their favorite brand.
• Most of the respondents are satisfied with regard to size of packaging
the soft drinks.
• The most of the respondents are wished to examine the date of
manufacturing while purchasing favorite soft drinks.

50
5.2 Suggestions
• From the study, none of the respondents not preferred the brand Fanta.
So, it is to be suggested that the brand should extend their marketing
channel and achieve the potential market for their product.
• It is to be suggested that through newspapers and banners the
respondents were not influenced to buy soft drinks. So, the brands
should advertise their products more through newspapers and banners.
• From the study it is to be suggested that most of the respondents were
not buying the soft drinks because it is not good for health.
5.3 Conclusion
The consumer buying behavior of these different soft drinks is done
through well-structured questionnaire and getting feedback from 50
students of Christ college Irinjalakuda. This project helps to know about
the customer satisfaction towards soft drinks. Majority of the respondents
are aware about the brand of soft drinks available in their city. Most of the
respondents are influenced to buy soft drinks through television. The most
of the respondents preferred colorless soft drinks. The most of the
respondents preferred cans for soft drinks. The most of the respondents
reuse the bottle after consuming the content. Majority of respondents are
preferred medium size plastic bottle soft drinks. The most of the
respondents will keep brand name in their mind while purchasing soft
drinks. The most of the respondents have least consumption of soft drinks
in sickness. From the study it is found out that when preferred brand is not
available the most of the respondents will buy another brand. Most of the
respondents preferred that the soft drinks they hate to buy is not good for
health. Most of the respondents are aware about the offers and discounts
of soft drinks. Most of the respondents are availed such offers and
discounts. Most of the respondents are satisfied “at the time of” and
“after” Consuming their favorite brand. The most of the respondents are
wished to examine the date of manufacturing while purchasing favorite
soft drinks.

51
So, from this study we came to know the consumer preference towards soft
drinks also its factors affecting consumer buying behavior and the most
preferred brand of soft drinks. The study was conducted to know the buying
behavior of the consumer towards soft drinks. It is an important product in
modern society. Consumer buying behavior mainly depends upon price, quality,
brand quality, advertisement, and taste of the drinks. So, this study has been
conducted to know the buying behavior of the consumer towards soft drinks
with a special reference to the students of Christ college Irinjalakuda.

52
BIBLIOGRAPHY

53
Books
1. Assael. H 1992 “Consumer Behavior and Marketing Action”.
2. Dr. S.L. Gupta &Sumitra Pal, 2001 “Consumer Behavior an Indian
Perspective, Text & Cases”, Sultan Publication, New Delhi.
3. Kotler, Philip, and Armstrong, Gary, 2003, “Marketing: An Introduction”.
4. Kothari C.R, 2007, “Research Methodology Methods and Techniques”,
Second Edition, New Age International Publisher, New Delhi.
Reference
1. Arvindkumar Mishra, 2010, “Rural Marketing in India towards Soft Drinks
Opportunities and Challenges”.
2. MichaleR.Hyman, 2009, “Promotion as Co-operation in the Soft Drink
Industry”.
3. Dennis Guthery, 2005. Coca-Cola's marketing challenges in Brazil:
Thetubaínaswar. Thunderbird International Business Review, 47(2), pp
4. Gertner, D., Gertner, R., & Guthery, D. (2005). Coca-Cola's marketing
challenges in Brazil: Thetubaínaswar. Thunderbird International Business
Review, 47(2), 231-254. doi: 10.1002/tie.20050
5. Johnson, V., & Peppas, S. (2003). Crisis management in Belgium: the case
of Coca‐Cola. Corporate Communications: An International Journal, 8(1),
18-22. doi: 10.1108/13563280310458885
6. Victoria Johnson and Spero C. Peppas, 2003, “Crisis Management in
Belgium: The Case of Coca-Cola, Corporate Communication: An
International Journal, Vol.8(1).
7. Sarwade W.K., and BahasahebAmbedkar, 2002, Emerging Dimensions of
Buyer Behavior in Rural Area”,
8. Park C.S. and Srinivasan V. May 1994, “A Survey Based Method for
Measuring and Understanding Soft Drinks and Its Extendibility”, Journal
of Marketing Research, Vol.31.
9. Gibson, Richard 1993, “Co-branding Aims to Double the Appeal,” The
Wall Street Journal.
10. Srivastava R., and Shocker A.D,1991, “Soft Drinks: A Perspective on Its
Meaning and Measurement”.
Website
1. https://www.coca-cola.com/
2. https://www.pepsico.com/
3. https://www.7up.com/
4. https://www.fanta.com/
5. https://www.sprite.com/
6. https://www.euromonitor.com/

54
APPENDIX

55
A study on consumer buying behavior towards soft drinks among
youth with special reference to students of Christ college Irinjalakuda
Questionnaire
1.Name
2.Age
3.Gender
4.Are you aware of the branded soft drinks available in your city?
a) Yes
b) No
5.How did you come to know about the branded soft drinks?
a) Advertisement
b) Friends
c) Family members
d) Retail shop
e) Others
6.Brand currently favored:
a) Coca Cola
b) Fanta
c) Sprite
d) Mountain Dew
e) Pepsi d) 7 up
f) others
7.Are you aware of the manufacturer of your favorite brand
a) yes
b) no
8.Which media of advertisement mostly influences you to buy soft drinks?
a) newspaper
b) television
56
c) internet
d) posters
e) banners
f) other source
9.Most preferred color of soft drink
a) orange
b) dark color
c) colorless
d) others
10.Most preferred container for soft drinks
a) glass bottles
b) plastic bottles
c) cans
d) others
11.If your answer is plastic bottle, will you reuse after consuming the
content.
a) yes
b) no
12.While you prefer plastic bottle, the size of bottle you wish to examine is
a) small
b) medium
c) large
13.Will you keep brand name in your mind while purchasing soft drink
a) yes
b) no
14.Period of least consumption of soft drink
a) sickness
b) summer season

57
c) rainy season
d) others
15.When preferred brand is not available you would
a) postpone purchase
b) buy another brand
c) search in another brand
16.please tick the appropriate reasons for not buying the soft drinks you
hate
a) not interested
b) no expected taste
c) not good for health
d) not known about product
17.Are you aware of offers and discounts?
a) yes
b) no
18.have you availed such offers and discounts?
a) yes
b) no
19.Tick the level of satisfaction you enjoyed “at the time of” and “after”
consuming your favorite brand
a) Highly satisfied
b) satisfied
c) neutral
d) dissatisfied
e) highly dissatisfied
20.tick the level of satisfaction with regard to size of packaging the soft
drinks
a) Highly satisfied
b) satisfied

58
c) neutral
d) dissatisfied
e) highly dissatisfied
21.While you purchase your favorite brand the printed information you
wish to examine is
a) name of the manufacturer
b) price
c) quantity
d) special offers
e) date of manufacturing
f) ingredients
22.Frequency of purchasing the soft drinks
a) daily
b) many times, in a week
c) sometimes in a week
d) as and when required e) never

![BC2122 Bachelor of Commerce [B. Com.] wef 202 - DTSS ...](https://static.fdokumen.com/doc/165x107/631d131d7051d371800fc3e6/bc2122-bachelor-of-commerce-b-com-wef-202-dtss-.jpg)