AutoQuiz: an online, adaptive, test practice system
67
AutoQuiz: an online, adaptive, test practice system Zhiping Xiao Electrical Engineering and Computer Sciences University of California at Berkeley Technical Report No. UCB/EECS-2018-54 http://www2.eecs.berkeley.edu/Pubs/TechRpts/2018/EECS-2018-54.html May 11, 2018
-
Upload
khangminh22 -
Category
Documents
-
view
2 -
download
0
Transcript of AutoQuiz: an online, adaptive, test practice system

AutoQuiz: an online, adaptive, test practice system
Zhiping Xiao
Electrical Engineering and Computer SciencesUniversity of California at Berkeley
Technical Report No. UCB/EECS-2018-54http://www2.eecs.berkeley.edu/Pubs/TechRpts/2018/EECS-2018-54.html
May 11, 2018

Copyright © 2018, by the author(s).All rights reserved.
Permission to make digital or hard copies of all or part of this work forpersonal or classroom use is granted without fee provided that copies arenot made or distributed for profit or commercial advantage and that copiesbear this notice and the full citation on the first page. To copy otherwise, torepublish, to post on servers or to redistribute to lists, requires prior specificpermission.
Acknowledgement
Thanks to everyone in CS10 and BJC family for all that you have contributedto the course. Merely knowing that we are fighting for the same goal helpsme a lot. Thanks to my advisor Dan Garcia for the continual support and guidance.Thanks to Prof. Zachary Pardos for his advise and help when I implementedthe backend model. Lots of thanks to other professors and students whohave inspired me on my work. Thanks to my parents, especially my mother, for her kindness and devotionin educating her daughter, and for her endless support at all times. Thanksto other family members who raised me up with love.


Abstract
Students often have trouble knowing how to prepare for high-stakes exams. Even in thebest case where legacy problems and solutions are available, there are usually no indicationsof the difficulty of a particular question or relevance to the material with which the studentneeds the most help. The problem is exacerbated by traditionally large introductory courses,where there’s no way a teacher could suggest a custom plan of study for every student, asthey could in a small, face-to-face setting.
In this report, we present AutoQuiz, an online, adaptive, test practice system. At itsheart is a model of user content knowledge, which we call an “adapted DKT model”. We testit on two datasets, ASSISTments and PKUMOOC, to verify its effectiveness. We build aknowledge graph and encode assessment items from UC Berkeley’s non-majors introductionto computing course, CS10: The Beauty and Joy of Computing (BJC), and have volunteerstudents from the Spring 2018 version of the course use the system and provide qualitativefeedback. We also measure the system quantitatively based on how well it improved theirexam performance. The high-level user interaction is as follows:
1. If a student prefers choosing a specific question on her own or iterating through allthe questions in the system, we’ll give her adequate freedom to select questions underspecified topics.
2. If a student chooses “challenge” mode to test herself, we’ll pull a fixed-sized1 groupof multiple-choice questions from an archive based on our estimation of the student’sperformance on the skills she is expected to master. The student will receive automatedand dynamic feedback after each submission.
1The default size of a challenge is set to 5.
2

i
To my family
This thesis is dedicated to my parents, especially my mother, for her kindness and devotionin educating her daughter, and for her endless support at all times.
To other family members who raised me up with love.

ii
Contents
Contents ii
List of Figures iii
List of Tables v
Introduction 1
1 Related Work 41.1 Beauty and Joy of Computing . . . . . . . . . . . . . . . . . . . . . . . . . . 4
2 Design 92.1 AutoQuiz System Overview . . . . . . . . . . . . . . . . . . . . . . . . . . . 92.2 Adapted Deep Knowledge Tracing Model . . . . . . . . . . . . . . . . . . . . 20
3 Implementation 233.1 Environmental Settings . . . . . . . . . . . . . . . . . . . . . . . . . . . . . . 233.2 Library Dependencies & Detailed Settings . . . . . . . . . . . . . . . . . . . 233.3 The adapted DKT model issues . . . . . . . . . . . . . . . . . . . . . . . . . 26
4 Results 304.1 Testing the standard and multi-grained DKT model . . . . . . . . . . . . . . 304.2 Students Feedback . . . . . . . . . . . . . . . . . . . . . . . . . . . . . . . . 344.3 Students Participation . . . . . . . . . . . . . . . . . . . . . . . . . . . . . . 354.4 Students Performance . . . . . . . . . . . . . . . . . . . . . . . . . . . . . . . 434.5 Discussion . . . . . . . . . . . . . . . . . . . . . . . . . . . . . . . . . . . . . 49
5 Conclusion 515.1 Summary . . . . . . . . . . . . . . . . . . . . . . . . . . . . . . . . . . . . . 515.2 Future Work . . . . . . . . . . . . . . . . . . . . . . . . . . . . . . . . . . . . 51
References 55

iii
List of Figures
1.1 The structure of Octal system . . . . . . . . . . . . . . . . . . . . . . . . . . . . 5
2.1 The structure of AutoQuiz system . . . . . . . . . . . . . . . . . . . . . . . . . . 102.2 Illustration of the interaction flow. . . . . . . . . . . . . . . . . . . . . . . . . . 102.3 Knowledge Structure Page . . . . . . . . . . . . . . . . . . . . . . . . . . . . . . 112.4 Topics Page . . . . . . . . . . . . . . . . . . . . . . . . . . . . . . . . . . . . . . 112.5 Challenge Feedback (example 1) . . . . . . . . . . . . . . . . . . . . . . . . . . . 112.6 Challenge Feedback (example 2) . . . . . . . . . . . . . . . . . . . . . . . . . . . 112.7 Questions Under a Specific Topic . . . . . . . . . . . . . . . . . . . . . . . . . . 122.8 A Specific Exercise . . . . . . . . . . . . . . . . . . . . . . . . . . . . . . . . . . 122.9 Exercise Feedback . . . . . . . . . . . . . . . . . . . . . . . . . . . . . . . . . . . 122.10 Challenge Interface . . . . . . . . . . . . . . . . . . . . . . . . . . . . . . . . . . 122.11 Illustration of DKT model variable connections . . . . . . . . . . . . . . . . . . 202.12 A single student and her predicted responses as she solves 50 Khan Academy
exercises. Figure 1 in [2]. . . . . . . . . . . . . . . . . . . . . . . . . . . . . . . . 212.13 Illustration of adaption made to standard DKT model. . . . . . . . . . . . . . . 22
4.1 The result of KT models on PKU dataset . . . . . . . . . . . . . . . . . . . . . 314.2 The result of KT models on ASSISTments dataset . . . . . . . . . . . . . . . . 324.3 Illustration of Students’ overall participation in AutoQuiz . . . . . . . . . . . . 334.4 Students Overall Satisfactory in Feedback . . . . . . . . . . . . . . . . . . . . . 344.5 Students Overall Satisfactory in Feedback . . . . . . . . . . . . . . . . . . . . . 354.6 Count of Newly-Registered Users per Day . . . . . . . . . . . . . . . . . . . . . 374.7 Count of Submission Records per Day . . . . . . . . . . . . . . . . . . . . . . . 374.8 The Number of Records grouped by Login / Anonymous Users per Day . . . . . 384.9 The Number of Records of Each Login User . . . . . . . . . . . . . . . . . . . . 394.10 The Number of Records of Each Login User Per Day . . . . . . . . . . . . . . . 404.11 The Number of Records of Each Login User Per Day Illustrated by Heat-map . 404.12 The Number of Students who Answered each Question . . . . . . . . . . . . . . 414.13 The Number of Exercise Completed by Each Student . . . . . . . . . . . . . . . 414.14 The Number of Exercise Completed by Each Student Per Day . . . . . . . . . . 42
iv
4.15 The Number of Exercise Completed by Each Student Per Day Illustrated byHeat-map . . . . . . . . . . . . . . . . . . . . . . . . . . . . . . . . . . . . . . . 42
4.16 Summary on Correct and Wrong Records . . . . . . . . . . . . . . . . . . . . . . 434.17 Summary on Records’ Correctness . . . . . . . . . . . . . . . . . . . . . . . . . 444.18 Summary on Individual Students’ Right and Wrong Records . . . . . . . . . . . 454.19 Summary on Individual Students’ Correctness . . . . . . . . . . . . . . . . . . . 454.20 Summary on Individual Students’ Correctness Per Day . . . . . . . . . . . . . . 454.21 Summary on Individual Students’ Correctness Per Day Illustrated by Heat-map 464.22 Anonymous Users’ and Login Users’ Performance . . . . . . . . . . . . . . . . . 474.23 Summary on Students’ Performance on Each Question . . . . . . . . . . . . . . 474.24 Summary on Correctness on Each Question . . . . . . . . . . . . . . . . . . . . 484.25 Summary on Correctness on Each Question per Student . . . . . . . . . . . . . 48

v
List of Tables
2.1 Content of the users table in Database . . . . . . . . . . . . . . . . . . . . . . 142.2 Content of the questions table in Database . . . . . . . . . . . . . . . . . . . . 152.3 Content of the topics table in Database . . . . . . . . . . . . . . . . . . . . . . 152.4 Content of the records table in Database . . . . . . . . . . . . . . . . . . . . . 152.5 Content of the skill2topic table in Database . . . . . . . . . . . . . . . . . . . 162.6 Content of the links table in Database . . . . . . . . . . . . . . . . . . . . . . . 162.7 Content of the next_question_map table in Database . . . . . . . . . . . . . 17
4.1 adaptive DKT on PKU MOOC 2013 results . . . . . . . . . . . . . . . . . . . . 304.2 PKU Dataset AUC Score (step=20001) . . . . . . . . . . . . . . . . . . . . . . . 314.3 ASSISTment Dataset AUC Score (step=20001) . . . . . . . . . . . . . . . . . . 324.4 Summary of Reported Issues . . . . . . . . . . . . . . . . . . . . . . . . . . . . . 364.5 The amount of students registering per day. . . . . . . . . . . . . . . . . . . . . 384.6 The amount of records per day . . . . . . . . . . . . . . . . . . . . . . . . . . . 39

vi
Acknowledgments
Thanks to everyone in CS10 and BJC family for all that you have contributed to thecourse. Merely knowing that we are fighting for the same goal helps me a lot.
Thanks to my advisor Dan Garcia for the continual support and guidance. Thanks toProf. Zachary Pardos for his advise and help when I implemented the backend model. Lotsof thanks to other professors and students who have inspired me on my work.

1
Introduction
Almost every computing class has exams, as well as nervous students who have to pre-pare for them. An adaptive tutoring system would not only be a win for students in small,face-to-face classes, but especially for those in large, introductory courses, where individual-ized instruction is not always available. A customized solution follows the mantra of “worksmarter, not harder”, in that it allows a student to pick the areas they’d like to learn, andadaptively suggests the right problems to allow for efficient practice toward specific goals.In most of the cases, such goals are likely to be mastering specific skills or concepts.
In the UC Berkeley CS10 (Beauty and Joy of Computing) class in 2015, a survey onstudents’ requests for future improvements of the course indicated that about 75% of thestudents wanted mini self-test quizzes, which turns out to be the demand ranking the secondhighest2.
We implemented the AutoQuiz system as a web application using the Flask framework [1],and base the backend recommender algorithm on the Deep Knowledge Tracing (DKT) model[2] with an adaption of adding multiple granularities. We have tested the data model on theASSISTment and PKU MOOC 2013 datasets (of the course Data Structures & Algorithms)to verify its effectiveness before putting it into use. AutoQuiz was specifically designed tohelp students in the Beauty and Joy of Computing (BJC) course [3].
Considering the time-limit defined by the third-party server providers3, we used multiplethreads to accelerate the processing time and user cache to synchronize data among thethreads. We also used a database and designed the queries to be efficient and straightforwardto optimize runtime performance.
There are two different modes of using the system: one is exercise, the other is challenge.In exercise mode, users answer one question at a time, and they can manually choose aspecific question to answer. Challenge mode recommends proper exercise packs to the users,five questions at a time, and gives feedback after the answers are submitted.
AutoQuiz provides login option while allowing the users to interact with it anonymously,but these users receive neither personalized recommendations nor customized feedback whentaking challenges. They get recommendations and feedback based on the general performance
2The most demand was for a more collaborative Snap! environment, chosen by nearly 100% of thestudents.
3We use Pythonanywhere, but to our knowledge, other cloud server hosts such as Amazon AWS, or SinaSAE, have similar limitations, no matter how much you pay them.

List of Tables 2
of all users (anonymous and login), unlike login users who get recommendations accordingto their performance.
Whenever a user hits “submit” in challenge mode, feedback and hints / explanations4are immediately shown on the screen. In exercise mode, they only appear after clickingthe “check answer” button. Meanwhile, the system’s backend does the following in anotherthread:
1. Check if enough data is collected to feed into the adapted DKT model, if so, do thefollowing steps, if not, stop here and wait for more data to come.
1a. Embed the quiz questions, feed the question IDs and the corresponding correctnessof the student’s responses to the adapted DKT model to get predictions on the theirperformance; use their interaction data to train the model afterward.
1b. Provide students with suggested questions and reasonable feedback based on the resultof the DKT model, the Zone of Proximal Development (ZPD) [4], and the knowledgegraph of CS10.
We compensate for the cold-start problem by providing a simple but reasonable alterna-tive recommender algorithm as well. Users never have to wait for a response; if the adaptedDKT model’s results are ready to be used, the front-end fetches them directly from thecache; otherwise, it uses the alternative algorithm and gets results in a few seconds.
AutoQuiz makes contributions from the following perspectives:
• To our knowledge, this is the first trial of putting the DKT model into a real-timeonline training system.
• Courses rarely provide students with an intelligent training system to help them preparefor important exams, due to development expense; while AutoQuiz is open-source5 andcould easily be modified and used in other courses.
• The system is open-source and expandable, so more functions could be added at anytime.
• Since the system is an individual application and not a plug-in module of anothersystem, it doesn’t rely on an eternal, 3rd-party API to manage user data, which meansthat we have direct access to the database. This results in fewer hurdles to jumpthrough to get to the data, reducing the usual friction to conduct further studies onthe data, such as trying to develop a user model that takes responding time intoconsideration.
4When a user has a wrong answer, we call them "hints", and when the user answers correctly, we callthem "explanations".
5The source code of the project is vailable on Github at https://github.com/PatriciaXiao/AutoQuiz_v2

List of Tables 3
• It offers an opportunity for educators to witness students’ behavior during exam re-view. Normally students review for exams at home without necessarily report theirprogress to the instructors, but AutoQuiz records their activities and thus could pro-vide educators a better view of their students’ performance. In fact, one could imaginenot needing high-stakes exams at all, if the student could spent enough time withAutoQuiz, which could verify the student was sufficiently above threshold on all therequired material.
The overall organization of the thesis is as follows:In Chapter 1, we discuss motivation for the system, as well as related works. System
designing is discussed in Chapter 2. AutoQuiz is fully open-source on Github6, and wewill discuss the library-dependency issues and other implementation details in Chapter 3.Chapter 4 includes all the related experiments we have done either before or after the systemreleased, and also includes discussions on the experimental results as well. Finally, weconclude our work and list some of the potential future works in Chapter 5.
6https://github.com/PatriciaXiao/AutoQuiz_v2

4
Chapter 1
Related Work
1.1 Beauty and Joy of ComputingThe Beauty and Joy of Computing [3], teaches not only programming-related knowledge
and the usage of Snap! [5], but also computational thinking and the social implications ofcomputing. Just as is described on the official website1:
“The Beauty and Joy of Computing (BJC) is an introductory computer sciencecurriculum developed at the University of California, Berkeley, intended for non-CS majors at the high school junior through undergraduate freshman level. Itwas one of the five initial pilot programs for the AP CS Principles course beingdeveloped by the College Board and the National Science Foundation. We offerit as CS10 at Berkeley.”
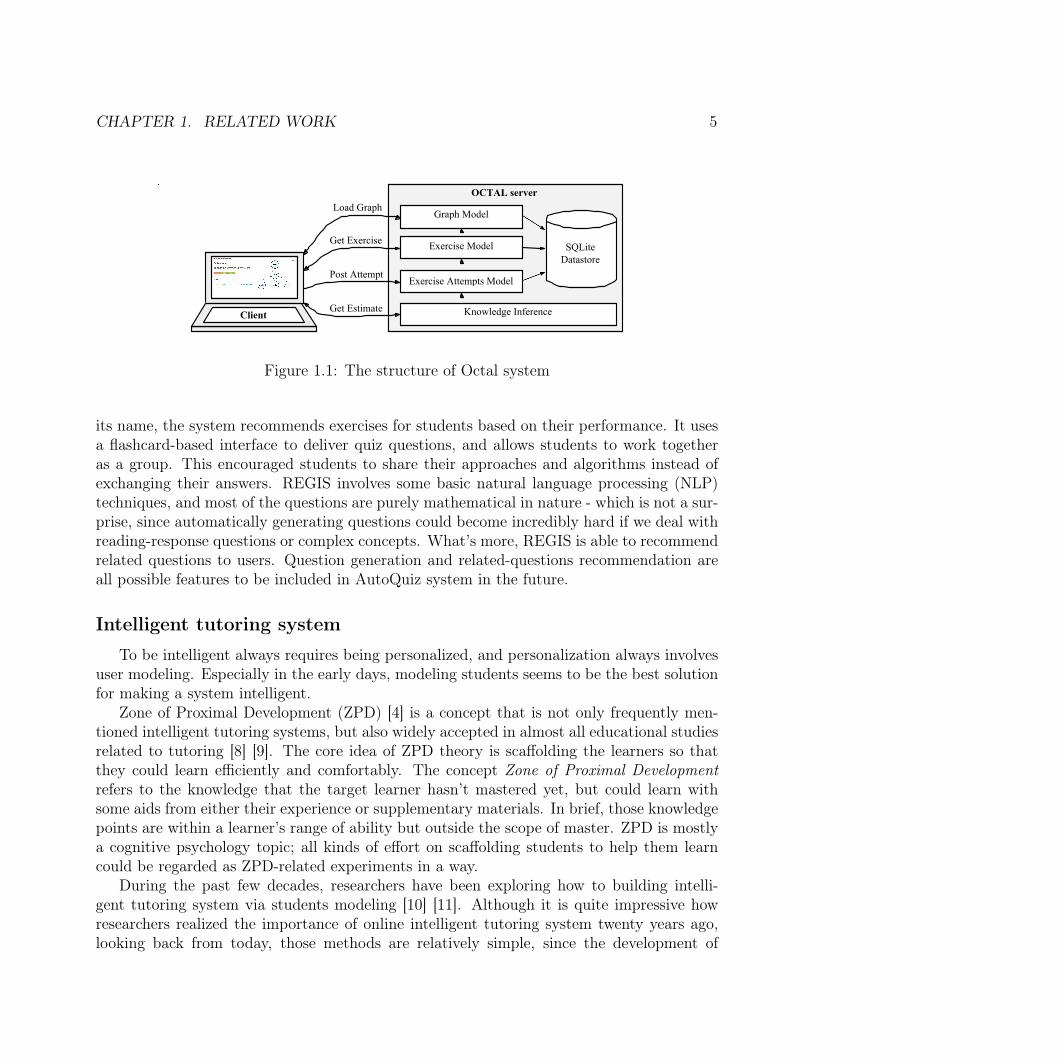
Over the years, many educators, researchers and developers have been working to im-prove BJC’s curriculum and pedagogy, with the goal of optimizing the learning and teachingexperience for all involved. For instance, Daniel Armendariz developed OCTAL [6], anonline course tool for adaptive learning, supporting Learning Tools Interoperability (LTI)specification, so that it could be easily embedded into many platforms, including edX. Octalsystem’s structure is as shown in Figure 1.1. AutoQuiz inherits the design of a multiple-choice-questions-only exercise system, as well as the feature of showing students the knowl-edge structure as well as how well they are doing in each part. AutoQuiz and Octal aredifferent enough that they don’t compete, but could complement each other. For instance,AutoQuiz is an individual web application, while Octal could embed into existing onlinetutoring systems; AutoQuiz has five colors indicating the different level of mastering, whileOctal chose the simplest but clear expression: green or not - a boolean status. AutoQuizand Octal should fit in different situations.
Albert “Luke” Segars tried to help non-major CS course students by building a systemcalled Random Exercise Generation and Inference System REGIS [7]. As is suggested by
1https://bjc.berkeley.edu/
CHAPTER 1. RELATED WORK 5
OCTAL server Load Graph
Get Exercise SQLite
Datastore Post Attempt
Exercise Attempts Model
Client Get Estimate Knowledge Inference
Exercise Model
Graph Model
Figure 1.1: The structure of Octal system
its name, the system recommends exercises for students based on their performance. It usesa flashcard-based interface to deliver quiz questions, and allows students to work togetheras a group. This encouraged students to share their approaches and algorithms instead ofexchanging their answers. REGIS involves some basic natural language processing (NLP)techniques, and most of the questions are purely mathematical in nature - which is not a sur-prise, since automatically generating questions could become incredibly hard if we deal withreading-response questions or complex concepts. What’s more, REGIS is able to recommendrelated questions to users. Question generation and related-questions recommendation areall possible features to be included in AutoQuiz system in the future.
Intelligent tutoring system
To be intelligent always requires being personalized, and personalization always involvesuser modeling. Especially in the early days, modeling students seems to be the best solutionfor making a system intelligent.
Zone of Proximal Development (ZPD) [4] is a concept that is not only frequently men-tioned intelligent tutoring systems, but also widely accepted in almost all educational studiesrelated to tutoring [8] [9]. The core idea of ZPD theory is scaffolding the learners so thatthey could learn efficiently and comfortably. The concept Zone of Proximal Developmentrefers to the knowledge that the target learner hasn’t mastered yet, but could learn withsome aids from either their experience or supplementary materials. In brief, those knowledgepoints are within a learner’s range of ability but outside the scope of master. ZPD is mostlya cognitive psychology topic; all kinds of effort on scaffolding students to help them learncould be regarded as ZPD-related experiments in a way.
During the past few decades, researchers have been exploring how to building intelli-gent tutoring system via students modeling [10] [11]. Although it is quite impressive howresearchers realized the importance of online intelligent tutoring system twenty years ago,looking back from today, those methods are relatively simple, since the development of
CHAPTER 1. RELATED WORK 6
machine learning and artificial intelligence has exploded, and the field is still undergoingsignificant developments. Just like what Stellan Ohlsson proposed in 1994 [11]: constrainingviolations on the parts indicated incomplete or incorrect knowledge, using it to guide theresponse of an intelligent tutoring system.
Researchers remain highly interested in improving the intelligence of the tutoring system,especially when the I.T. industry is undergoing booming development and tons of studentscrowd into CS courses. Mingyu Feng et al. pointed out some challenges and introduced theASSISTment system [12], which is an accessible system that is still in use today2.
Recently, many researchers have conducted research on recommending a personalizedsequence of learning. For instance, Siddharth, Igor, and Thorsten [13] has proposed a methodaiming at utilizing features of lessons to recommend a personalized learning sequence oflessons. The model they proposed is data-driven without requiring any labor-intensive expertannotation. By learning vectorized embedding of the lessons’ skill gains, the model is able torecommend lessons based on the content of the previously-learned lessons and the learninggoals, and model graded learner responses by extended-SPARFA [14].
Researchers are still focusing on algorithm and data analysis to help enhance the intel-ligent tutoring systems today. Others have narrowed their focus to the design of the userinterface. For instance, Lamiya Al-Shanfari et al. did an experimental study on the effectof visualizing uncertainty when showing students how well they are doing [15]. We concludefrom their results that the more precise students know about their status, the stronger theirmotivation/engagement would be. These underlying assumptions are taken into accountwhen we design our interface (See Chapter 2).
Modeling a Sequence
From the perspective of recommending according to students’ recent behaviors, the def-inition of the problem is also similar to recommendation systems. Researchers proposedthe session-based recommendation systems using RNN in the year 2015 [16], and it remainspopular up till now.
Unlike the traditional methods of recommending that fail to consider recent history,the session-based recommendation can make more precise predictions. “Remembering theshort-term history” is achieved by the RNN structure, especially LSTM units3. Althoughrecommending items to customers in an e-commerce system is a different scenario comparedwith recommending exercises to students, they share some common features. With the useof RNN, predicting students’ performances using DKT (Deep Knowledge Tracing) model isa method widely-used in recent years [2].
In fact, we have also investigated into previous researchers works on words and sentencessequences in text documents [17], as well as sequential data’s hierarchical modeling in actionrecognition [18]; the hierarchical structure in those cases aren’t the same as ours (see our
2We used their public dataset to verify the effectiveness of our model in Chapter 4.3LSTM is a popular alternative of RNN.

CHAPTER 1. RELATED WORK 7
idea of multiple granularities described in subsection 1.1). In lack of localization of itemsunder the same category, sequential-based knowledge tracing is entirely different.
Knowledge Tracing Model
We are inspired by knowledge tracing models, which we adopted and adapted into our sys-tem. These Models analyze a student’s performance in a series of problem-solving attempts,to figure out whether or not the specific student masters a skill. Most of the knowledgetracing models today are derived from the two following models: BKT (Bayesian KnowledgeTracing) model, and DKT (Deep Knowledge Tracing) model.
We can see that the BKT [19]-derived models in use today more or less inherit the idea ofconstraining and modeling students with meaningful parameters from early-day intelligenttutoring system designs. DKT [2] models seem to be inheriting the typical way of deeplearning: instead of focusing on modeling and understanding the students’ performances,DKT focus solely on students’ problem-solving sequences.
In general, most of the DKT models could achieve high performance with simple modelstructure and simple data streams. On the one hand, deep learning doesn’t necessarily meanbetter performance, shallow and relatively-traditional models like BKT can perform just aswell and offer us greater interpretability and explanatory power in modeling student learning;on the other hand, we can say that DKT is a more powerful, useful, and general-purposeframework [20].
Bayesian Knowledge Tracing Model (BKT)Bayesian Knowledge Tracing Model [19] is a Hidden Markov Model (HMM) where stu-
dent’s knowledge states are represented by a series of 0/1 values of a skill. There are four keyparameters in BKT, namely: prior knowledge, probability of learning, guessing, and slipping.
It is a relatively classical model for knowledge tracing, a model that has long-lastingeffects and is still in use today. Before Deep Knowledge Tracing was introduced into thefield, almost all researchers are using BKT model to solve knowledge tracing problems. Forinstance, MacHardy used BKT model to evaluate the impact of educational videos’ contentsin addition to assessment activity [21].
The most apparent advantage of BKT over DKT is that its mechanism is explainable,thus would be easily redesigned or modified. Michael V. Yudelson et al. came up with anindividualized BKT model early in 2013 [22]. They made BKT individualized by introducingstudent-specific parameters, in addition to the four parameters in the standard BKT model.
Zhuo Wang et al. came up with an exciting idea of introducing knowledge structure intothe BKT model [23]. In the paper, they proposed two different improvements. One is toadd multiple granularities.4 The other is to utilize history information5. We were inspired
4Adding multiple granularities means that, for example, the model knows that a question is a booleanexpression logic questions, while it recognizes that “boolean” falls under the “Math” category as well; takinginto consideration both “Math” and “boolean”, it is expected to make prediction more precisely.
5For instance, last time you did a question correctly, we believe you are more likely to answer the samequestion correctly this time.
CHAPTER 1. RELATED WORK 8
by their granularity idea when designing our system. The reason why we don’t need thehistorical model is that the DKT model records history by nature. DKT 6 with LSTM7
would automatically “remember” previous performances in a session8. Moreover, LSTM ismodeling “forgetting” as well - all these features make our model elegant and straightforward.
Deep Knowledge Tracing ModelWith the booming development of deep learning in recent years, an increasing amount
of researchers has come to realize their convenience and power. Deep Knowledge Tracing(DKT) model [2] uses RNN (mostly LSTM) to model student learning. The RecurrentNeural Networks (RNNs) map an input sequence of vectors to an output sequence of vectorsby computing a sequence of hidden states which is a series of encodings of past inputs.The LSTM model is slightly more complicated than standard RNN. While, in principle,there’s no fundamental difference between them; the LSTM model is more powerful becausehidden nodes are updated using multiplicative interactions, transforming the inputs in amore complexed way [18].
Researchers expanded the usage of standard DKT model by introducing novel methodsof embedding [24]. They applied DKT model to block-based programming practices, justlike Snap!. We were inspired by their idea of modifying the input & output embedding toadjust the standard DKT model so as to fit into the specific application. If AutoQuiz decidesto include programming practice modules in the future, their work throws light on the wayahead.
The AutoQuiz system has very simple components. All exercises included are multiple-choice questions centered around programming-related issues9. But there are reasons whywe have to modify the standard DKT model (see Chapter 2). We use LSTM in our system,just as what previous researchers did in their implementations [2] [20] [24].
6DKT stands for Deep Knowledge Tracing.7LSTM is Long Short Term Memory, a special kind of RNN (Recurrent Neural Network) that is especially
good at learning long-term dependencies.8The word “session” here refers to the session in DKT model, that is, a series of user behavior records.9The modules are namely “Math and Logic Basics”, “Programming and Algorithm”, “Lists and HOFs”,
“Recursion”, “Programming and Algorithm”, and “Concurrency”.

9
Chapter 2
Design
2.1 AutoQuiz System OverviewFrom a highly-abstracted level, the whole system is illustrated in Figure 2.1. The sys-
tem contains four essential modules, namely the User Interface, User Cache, Database, andKnowledge Tracing Model. There are two other crucial assistant models: data files, whichhelps with easier question designing and better rendering outcomes, as well as log file keepingtrack of the user’s activities and serving the KT model.
Users interact directly with the User Interface, through which the data stored in theDatabase is updated. Questions are indexed in Database by their topics and their uniqueIDs, while the actual content is stored in separated Data Files. The Database and DataFiles help render the User Interface. The User Cache is a necessary component, notonly for effectiveness, but also for data synchronizing. Multiple threads communicate witheach other through the shared cache - some threads are responsible for running the KTModel and dropping data in, while some others will pick data out - either to render theUser Interface or to collect “session”1 data and store it in Log File. The KT Modelin Figure 2.1 refers to Knowledge Tracing model, which means Multi-grained DKT modelin this context; it receives batches of data from the user cache. Whenever initialized, thedatabase re-load the indexes from Data Files archive, and KT Model re-trains itself byrunning the logged data read from Log File.
The interaction flow is illustrated in Figure 2.2. As is indicated in the picture, theo-retically speaking, a user could play with the system infinitely until she feels tired. We willgive the users hints and explanations as support, and try to guide them toward the goal ofmastering all the topics by giving them feedback on their level of mastering according totheir performance doing the exercises.
1Here, session refers to “session” to be fed into DKT model, in other words: a sequence of action.

CHAPTER 2. DESIGN 10
User
Database Data Files
KT Model
Frontend Backend
User Interface
User Cache Log File
Figure 2.1: The structure of AutoQuiz system
No
Start Already Logged in?
Login / Register?
Which Tab Clicked?Login User
Which Tab Clicked?Anonymous Show KnowledgeStructure
Show Questions Under Topic X
Show Progress of each Topic
Generate personalmini-size Quiz
Generate generalmini-size Quiz
Structure
Topics
Topic X
Challenge
Challenge
Select Question Yand answer it
Retry
Return
Is theLast Question in the Topic?
Next
Yes
Y = next(Y)
No
Return
Return
NextChallenge
Yes
No
Yes
No Logout?
Yes
Hint or Explanations&
Totally-personalizedfeedback
Submit
Hints or Explanations
CheckAnswer
NextChallengeSubmit
Return
Hint or Explanations&
Partly-personalizedfeedback
Figure 2.2: Illustration of the interaction flow.

CHAPTER 2. DESIGN 11
Figure 2.3: Knowledge Structure Page Figure 2.4: Topics Page
Figure 2.5: Challenge Feedback (example 1) Figure 2.6: Challenge Feedback (example 2)
User Interface
The designing of AutoQuiz user interface pays attention to the well-known 10 usabilityheuristics for User Interface Design [25], following the guidelines carefully. The user interfaceis the only component of the system that the students have direct access to. Our designprinciple of this part is to be simple and easy to use for the students. We want them to focuson the content, and not to suffer from getting used to interacting with the system.
However, CS10 is available to all students so our users have a vast variety of backgrounds,and is relatively hard to define our target users so as to optimize the interface design. Theyrange from CS-intended freshmen to seniors in non-CS fields to graduate students. The onlycommon feature that they share seems to be “taking CS10”. To make most of them feelcomfortable using our system, we decided that AutoQuiz should stick to the standard CS10styles and therefore wouldn’t bring extra learning cost.
Based on the assumption that most of our students are using the CS10 course website2
at least as frequently as required, we design AutoQuiz to be a style very similar with that,which is also referred to as “standard CS10 style” in this report. As is shown in Figure2.3 and 2.4, the user interface resembles CS10’s course website. To be specific, we inherit
2http://cs10.org/sp18/
CHAPTER 2. DESIGN 12
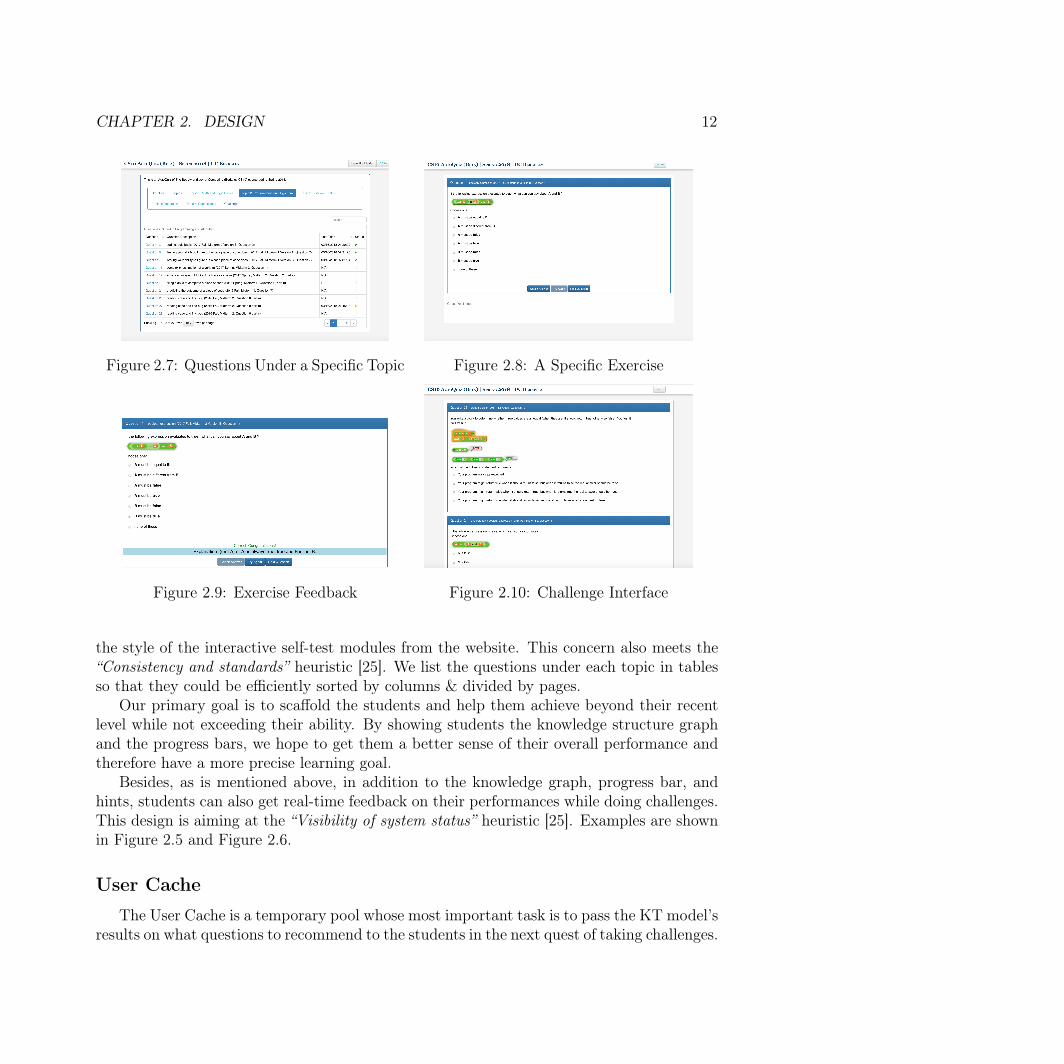
Figure 2.7: Questions Under a Specific Topic Figure 2.8: A Specific Exercise
Figure 2.9: Exercise Feedback Figure 2.10: Challenge Interface
the style of the interactive self-test modules from the website. This concern also meets the“Consistency and standards” heuristic [25]. We list the questions under each topic in tablesso that they could be efficiently sorted by columns & divided by pages.
Our primary goal is to scaffold the students and help them achieve beyond their recentlevel while not exceeding their ability. By showing students the knowledge structure graphand the progress bars, we hope to get them a better sense of their overall performance andtherefore have a more precise learning goal.
Besides, as is mentioned above, in addition to the knowledge graph, progress bar, andhints, students can also get real-time feedback on their performances while doing challenges.This design is aiming at the “Visibility of system status” heuristic [25]. Examples are shownin Figure 2.5 and Figure 2.6.
User Cache
The User Cache is a temporary pool whose most important task is to pass the KT model’sresults on what questions to recommend to the students in the next quest of taking challenges.

CHAPTER 2. DESIGN 13
Meanwhile, it could also keep some frequently accessed data (but not mandatory), such asstudents’ IDs, etc., so as to reduce the times we have to connect to the database.
On the one hand, time-limit-exceeded is always a fatal problem if we conduct every stepof every task sequentially.3 If we do without a cache, it’ll be difficult to exchange messagesamong different threads and give a timely response to the user sitting in front of the screen.
The primary concern that drives the system to adopt a cache is the time-efficiency issue.Considering that there’s no easier way to solve the conflict between the long running timeof KT model and the strict time limit of the server responding, a cache should be regardedas an essential part of the system, proved to be useful for running knowledge tracing modelin the back-end.
Getting instant feedback is almost always part of ideal satisfying user experience, espe-cially in an interactive system like AutoQuiz. Otherwise, the “Flexibility and efficiency ofuse” heuristic would be violated [25]. In general, we use the user cache to accelerate theinteraction, while improving the user experience.
Data Files
The Data files in the AutoQuiz back-end refers to the files that store the content of eachof the exercises. Contents of data files should be easily used to specify question IDs, thetopic each question belongs to, hints content, correct options and wrong options, questioncontent. They also contain layout information of the text paragraphs and names of theimages (if any) that are attached to each specific question.
There are two main reasons why AutoQuiz uses data files to store the questions, insteadof putting everything into the database. One reason is that it’ll be easier to read, writeand modify new questions. Tables in the database are not accessible by text editors, andthe content stored in the database would not be clearly naturally and intuitively visible.The other reason is that there’s no necessity putting everything into a database. The mostsignificant advantage of using a database is the immediate response of each query so thatthat data could be selected, unioned, or concluded easily and quickly. In this case, however,a constant amount of questions are loaded each time, and fetching data from data files causesno more than a negligible delay4. In brief, a data file should:
1. contain all the necessary information needed for showing, grading, and giving feedbackon the corresponding question;
2. Make it easy to locate and access questions once we know the IDs of the questions wewant.
3For details, please refer to Pythonanywhere officially in their announcement (https://help.pythonanywhere.com/pages/ErrorReloadingWebApp/), time limit is stringent - 20 seconds for respond-ing to requests before the thread is killed.
4It would be less than 2 seconds in the worst case.

CHAPTER 2. DESIGN 14
All data files are stored in the same directory. Specifically, in our design, we make fulluse of the file system by naming the data files by question IDs. A file contains a question’scontent, correct and incorrect options of the answer5, hint, description, and category.
Database
The dataset is designed to include he following information:
• Information of all the registered users in the system;
• All the records of the students’ activities on doing exercises;
• Information of all the questions included in the system, including the questions’ meta-data (id, description, etc.) that could be used to locate the files storing the detailedcontent.
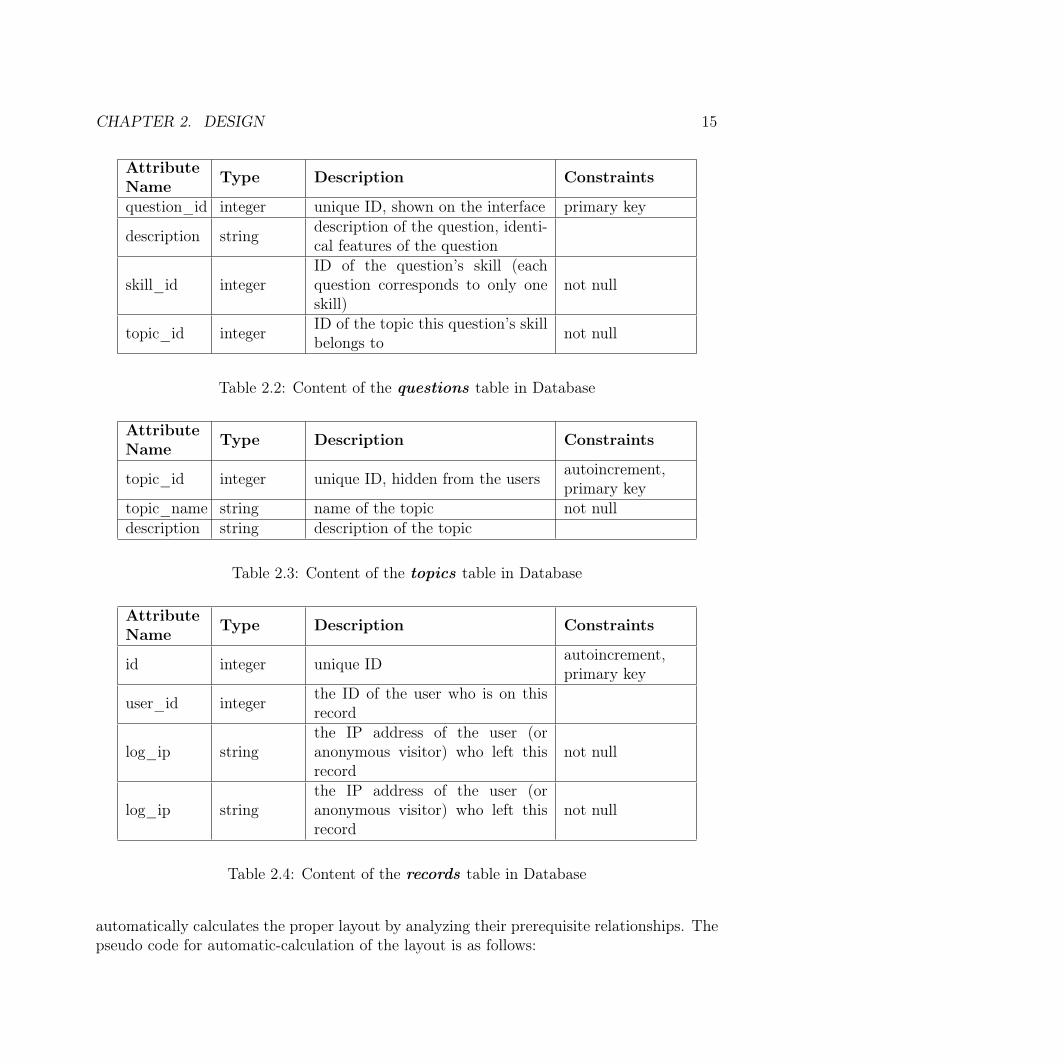
AutoQuiz includes a database containing the following tables. Table 2.1 shows the at-tributes of users table, Table 2.2 shows attributes of questions, Table 2.3 for topics, Table2.4 for records table that logs the users’ activity doing exercises.
AttributeName Type Description Constraints
id integer unique ID, invisible to users autoincrement,primary key
name string user name, should be unique not nullpassword string password of the account not nullreg_time timestamp time of registration not null
Table 2.1: Content of the users table in Database
Beside the above essential tables, some other tables in the database could probably bereplaced by asset files, but we decided to put them into the database for convenience.
Functioning as a quick-lookup dictionary, table skill2topic shown in Table 2.5 makesinitialization of the database easier. It is used whenever we need to look up the id / name/ topic of a specific skill.
In order to separate the front-end and back-end to the largest extent possible, we reducedthe amount of hard-coded parameters in the front-end, trying to make the layouts as dynamicand data-driven as possible.
One example is how we make the knowledge graph’s layout customizable. The connectionsamong the topics are recorded in table links (see Table 2.6). Whenever the knowledge graphstructure (Figure 2.3) is to be shown to a user, AutoQuiz fetches information from links and
5AutoQuiz currently contains only multiple choice questions.
CHAPTER 2. DESIGN 15
AttributeName Type Description Constraints
question_id integer unique ID, shown on the interface primary key
description string description of the question, identi-cal features of the question
skill_id integerID of the question’s skill (eachquestion corresponds to only oneskill)
not null
topic_id integer ID of the topic this question’s skillbelongs to not null
Table 2.2: Content of the questions table in Database
AttributeName Type Description Constraints
topic_id integer unique ID, hidden from the users autoincrement,primary key
topic_name string name of the topic not nulldescription string description of the topic
Table 2.3: Content of the topics table in Database
AttributeName Type Description Constraints
id integer unique ID autoincrement,primary key
user_id integer the ID of the user who is on thisrecord
log_ip stringthe IP address of the user (oranonymous visitor) who left thisrecord
not null
log_ip stringthe IP address of the user (oranonymous visitor) who left thisrecord
not null
Table 2.4: Content of the records table in Database
automatically calculates the proper layout by analyzing their prerequisite relationships. Thepseudo code for automatic-calculation of the layout is as follows:

CHAPTER 2. DESIGN 16
AttributeName Type Description Constraints
skill_id integer unique ID of each skill autoincrement,primary key
skill_name string unique name of each skill not null, unique
topic_id integer the ID of the topic a skill belongsto not null
Table 2.5: Content of the skill2topic table in Database
AttributeName Type Description Constraints
id integer unique ID of each link autoincrement,primary key
source integer the link’s start-point topic’s ID not nulltarget integer the link’s end-point topic’s ID not null
Table 2.6: Content of the links table in Database
1 de f ca l cu la t e_layout ( l i n k s ) :2 going through the l i n k s l i s t :3 summarize the content4 cur rent l ay e r = [ t op i c id o f the t op i c s5 that aren ’ t p r e r e q u i s i t e o f any other t op i c ]6 s t o r e cur rent l ay e r in fo rmat ion7 whi le the re i s s t i l l a t op i c with undef ined l ay e r :8 cur rent l ay e r = [ t op i c id o f a l l t o p i c s9 that aren ’ t p r e r e q u i s i t e o f any other t op i c
10 with undef ined l ay e r id ]11 s t o r e cur rent l ay e r in fo rmat ion12 re turn a l l the l a y e r s
Listing 2.1: Knowledge Structure Auto-layout Algorithm
The auto-layout algorithm works well on structures without a circular reference. Thedata-driven auto-layout method makes it easy to update the data structure in the system.
Another table, next_question_map, as is shown in Table 2.7, is specifically included forthe convenience of “next” button when users are doing exercise in the sequential order. Itis never updated unless there are more questions added to the system, and it provides thefastest access to the next question’s ID. It also caters to the “Flexibility and efficiency ofuse” heuristic [25].

CHAPTER 2. DESIGN 17
AttributeName Type Description Constraints
temp_id integer the id of a specific question primary key
next_id integerthe question’s id of the next ques-tion under the same topic, follow-ing the question No. <temp_id>
not null
Table 2.7: Content of the next_question_map table in Database
Log File
If we can save and restore model6 checkpoints in a cross-platform method, the log filemight not be necessary. However, the checkpoint we saved on the server uses the abso-lute path, instead of the relative path, so as to reduce misunderstanding across differentplatforms7.
Generally speaking, this design is for developers’ convenience. However, whenever theAutoQuiz system is migrated to another platform, the KT model needs to be retrained. Totrain the KT model again, we would have to load the content of the Log File and feed it intoan initialized KT model. Data in the log file is stored as readable plain text, in a specificformat:
1 162 33 ,35 ,36 ,42 ,44 ,45 ,46 ,47 ,47 ,47 ,47 ,47 ,47 ,48 ,48 ,493 1 , 1 , 1 , 1 , 1 , 1 , 1 , 0 , 0 , 0 , 0 , 0 , 1 , 0 , 1 , 14 55 1 ,41 ,8 ,20 ,516 0 ,1 ,1 ,1 , 17 168 7 ,16 ,17 ,17 ,17 ,17 ,18 ,18 ,18 ,18 ,21 ,26 ,27 ,28 ,31 ,329 0 , 1 , 0 , 0 , 0 , 1 , 0 , 0 , 0 , 1 , 1 , 1 , 1 , 1 , 1 , 1
10 . . . . . .
Listing 2.2: Log File Content Example
Above are a few lines randomly selected from the log file in use.The knowledge tracing model AutoQuiz uses is based on DKT [2]. Therefore, the training
input is a series of question-answering outcomes, which we call a textbfsession. A session’smeaning is a series of exercise-taking actions of a student. Considering that sessions mighthave different lengths, it is necessary to know the length of each session before processing it.
We designed the format to be what is shown above, so that each session is well-conveyedby three lines of numbers. The first line contains only one integer N, indicating the length
6https://www.tensorflow.org/programmers_guide/saved_model7On Mac, Windows, and Linux, details on paths’ meanings vary a lot. It is too hard to unify it if we use
the relative path, so we decided to use the absolute path.

CHAPTER 2. DESIGN 18
of this session. The second line contains N question_id numbers, indicating the IDs of thequestions being answered in this session, listed in the order that they are done; and the thirdline is the correctness of each question answered in this session, containing only 0s and 1s,0 for “incorrect attempt”, while 1 for “correctly answered ”.
KT Model
KT model refers to Knowledge Tracing model, and it is the adapted Deep KnowledgeTracing model in this specific case. The KT model in AutoQuiz system takes in a session ofdata each run, no matter training or testing. A session refers to a sequence of interactionswithin a short period and by the same user. Some researchers are working on determiningthe boundary of sessions in web logs [26]. However, since our model is not sensitive to thedividing of sessions, it is okay to divide it casually by length, by time slot, or by any othermethod that makes sense.
This is how it works on an abstract level:
1. Train the model with batches of sessions and save the model.
2. Reload the model, and feed in a session containing information such as “a user didquestion 1 correctly, then did question 5 correctly, then did question 3 incorrectly, thendid question 3 correctly”.8
3. Use the user’s behavior within the current session to generate prediction on the user’sperformance on all exercises and all topics. Such as “according to the user’s previousperformance in this session, there’s 50% chance question 1 could be answered correctly,40% chance for question 2, ... 70% chance for topic 1 to be answered correctly, 20%chance for topic 2...”
The prediction would be used to generate feedback to the student (as is shown in Figure2.5 and Figure 2.6), and to decide what questions to give to the student in the next challenge.How we could use a prediction vector to generate recommendation and feedback is veryflexible in AutoQuiz. Initially, we designed a strategy of “recommending the questions withthe largest (topic_predicted_correctness - question_predicted_correctness)” to the student,which means that, recommending the questions that a student is good at that topic, but notso good at the specific problem. There is part of ZPD [4] consideration in this design: if astudent is good at math, but not so good at boolean expression, we are expecting that thestudent would be able to utilize her knowledge in other fields of math to help her fix thisshortcoming.
However, we didn’t observe noticeable downgrade of the overall performance of AutoQuizwhen turning off the complex scaffolding strategy and replacing it with a simple one: recom-mending the question with the least correctly-answered time to the student. This might be
8This example session will be represented as (4; (1, 5, 3, 3); (1, 1, 0, 1)) in the log file.

CHAPTER 2. DESIGN 19
caused by the insufficient size of the exercise database9. Considering the trade-off of time-limit-exceeded hazard and the neglectable improvement of the recommendation accuracy,the strategy is not included in AutoQuiz. But it could be brought back to later versions,especially if many more questions are added. For further information of the model, pleaserefer to the content of Section 2.2.
Interaction Flow
As is shown in Figure 2.2, we carefully designed the users’ interaction process so that theycould swiftly shift between either anonymous and login mode, or between challenge moduleand exercise module. This design is to satisfy the “User control and freedom” heuristic [25].The interaction flow graph defined the user experience at an abstract level.
Generally speaking, the system has two different modes for login user and anonymoususers respectively. It also includes two modules and two summary pages, among which userscould shift frequently and easily by clicking on the pills in the navigation bar on top of thepages, as is shown in Figure 2.3.
The first summary page (Figure 2.3) shows all the topics and the prerequisite relationshipsamong them by putting them into the same knowledge graph. The knowledge graph issupposed to be a directed acyclic graph, according to the nature of “prerequisite” relationship.The second summary page shows each topic individually, it doesn’t show the relationshipamong them, but it shows more details on how well you are doing for each topic (Figure2.4).
Both summary pages work only for login users. Under incognito mode, an anonymoususer’s activity is also recorded, but we were unable to identify her identity accurately. There-fore, anonymous users would be able to access these pages, but the summary they get wouldbe blank10.
The two modules are the exercise module and the challenge module. Exercises areorganized into topics so that users could visit any specific question directly by selecting fromthe list under that topic (Figure 2.7). After choosing a specific question to start, the userwill be able to answer the questions one by one. A hint / explanation is given whenever theuser checks the answer (Figure 2.8, Figure 2.9). Under challenge module, the user will see agroup of questions.11
Challenge questions are selected from the same pool of the exercise questions. After eachsubmission, users will be given hints/explanations of each question in the challenge, as wellas feedback on their overall performance (Figure 2.10, Figure 2.5, Figure 2.6).
If a user is logged in, the feedback would be based on all the user’s records in AutoQuiz,as well as the user’s performance in the challenge just done. Otherwise, we could only givefeedback based on the user’s performance doing the challenges.
9There are 60 questions in the system by the midterm of Spring 2018.10The same with 0% done for every topic.11The current setting of the group size is 5.

CHAPTER 2. DESIGN 20
Figure 2.11: Illustration of DKT model variable connections
In addition, only login users would get personalized recommendation of challenge ques-tions based on their personal records in the system. Anonymous users can only get challengequestions based on the overall performance of all the users. Although not mandatory, werecommend using AutoQuiz as login users.
2.2 Adapted Deep Knowledge Tracing ModelAutoQuiz uses the adapted deep knowledge tracing model, which is a kind of deep learning
model, in its back-end. Instead of running scheduled task to update the model several timesa day, we designed it to be real-time updated. To our knowledge, our system is the firstsystem trying to embed deep knowledge tracing model into an intelligent tutoring systemthis way.
Our model is based on the standard deep knowledge tracing model (DKT model) [2]. Asis shown in Figure 2.11, standard DKT model is a dynamic network built upon traditionalRecurrent Neural Networks (RNNs) that map an input sequence of vectors X = {x1, x2, ...xT}, to the corresponding output sequence of vectors, prediction Y = {y1, y2, ... yT}, viacalculating a sequence of hidden states H = {h1, h2, ... hT}. The sequence of hidden statescontains past information that will help with the future predictions [2].
In standard DKT model, inputs in X could be one-hot encodings, compressed represen-tations [24], or random embedding. Any prediction yt is a vector representing the probabilityof the corresponding student getting each of the dataset exercises correct.
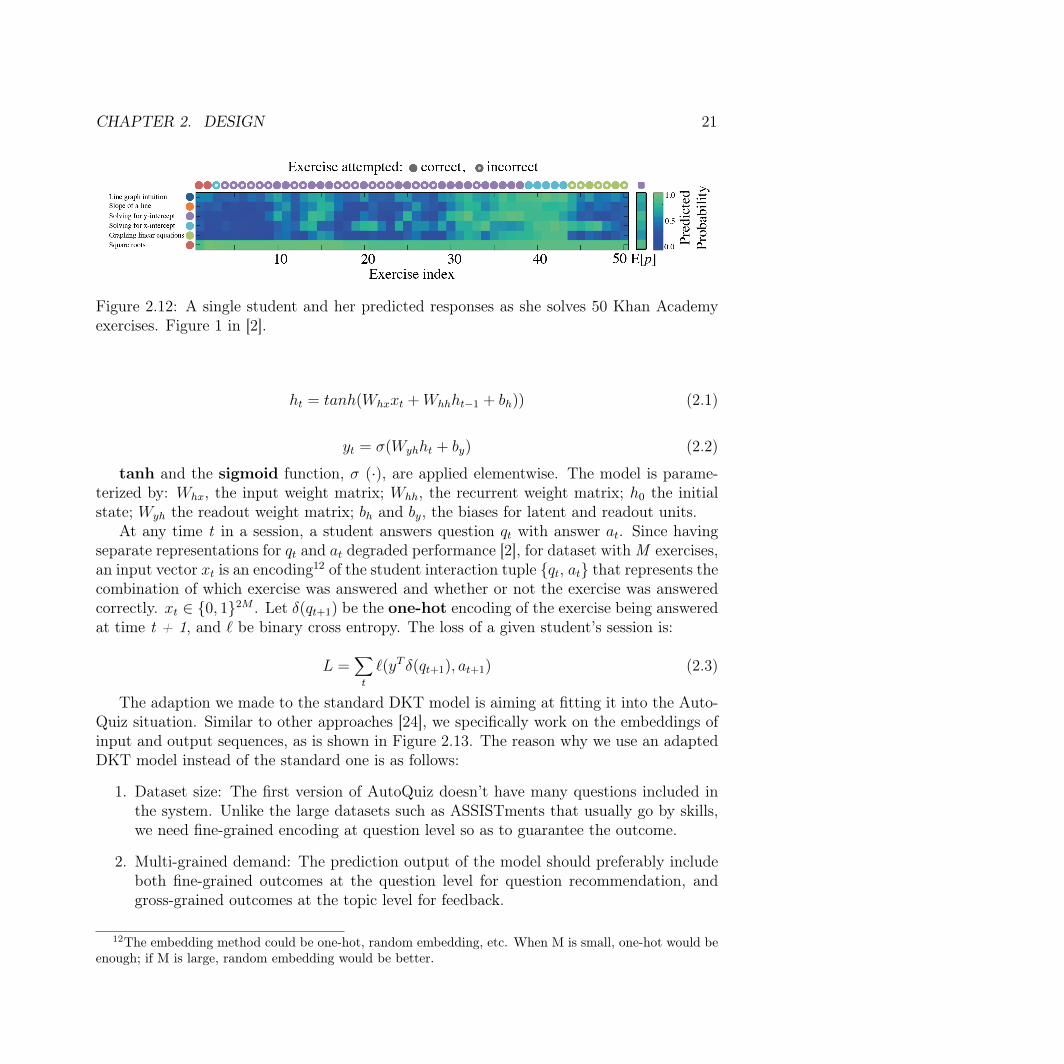
As is shown in Figure 2.12, each column represents a prediction on the specific stage. Asthe number of exercises that the student has done started to accumulate, the state moves fromthe left-most column to the right-most column. The prediction of the student performancechanges gradually during the process. The network is defined by the equations:
CHAPTER 2. DESIGN 21
Figure 2.12: A single student and her predicted responses as she solves 50 Khan Academyexercises. Figure 1 in [2].
ht = tanh(Whxxt +Whhht−1 + bh)) (2.1)
yt = σ(Wyhht + by) (2.2)
tanh and the sigmoid function, σ (·), are applied elementwise. The model is parame-terized by: Whx, the input weight matrix; Whh, the recurrent weight matrix; h0 the initialstate; Wyh the readout weight matrix; bh and by, the biases for latent and readout units.
At any time t in a session, a student answers question qt with answer at. Since havingseparate representations for qt and at degraded performance [2], for dataset with M exercises,an input vector xt is an encoding12 of the student interaction tuple {qt, at} that represents thecombination of which exercise was answered and whether or not the exercise was answeredcorrectly. xt ∈ {0, 1}2M . Let δ(qt+1) be the one-hot encoding of the exercise being answeredat time t + 1, and ` be binary cross entropy. The loss of a given student’s session is:
L =∑t
`(yT δ(qt+1), at+1) (2.3)
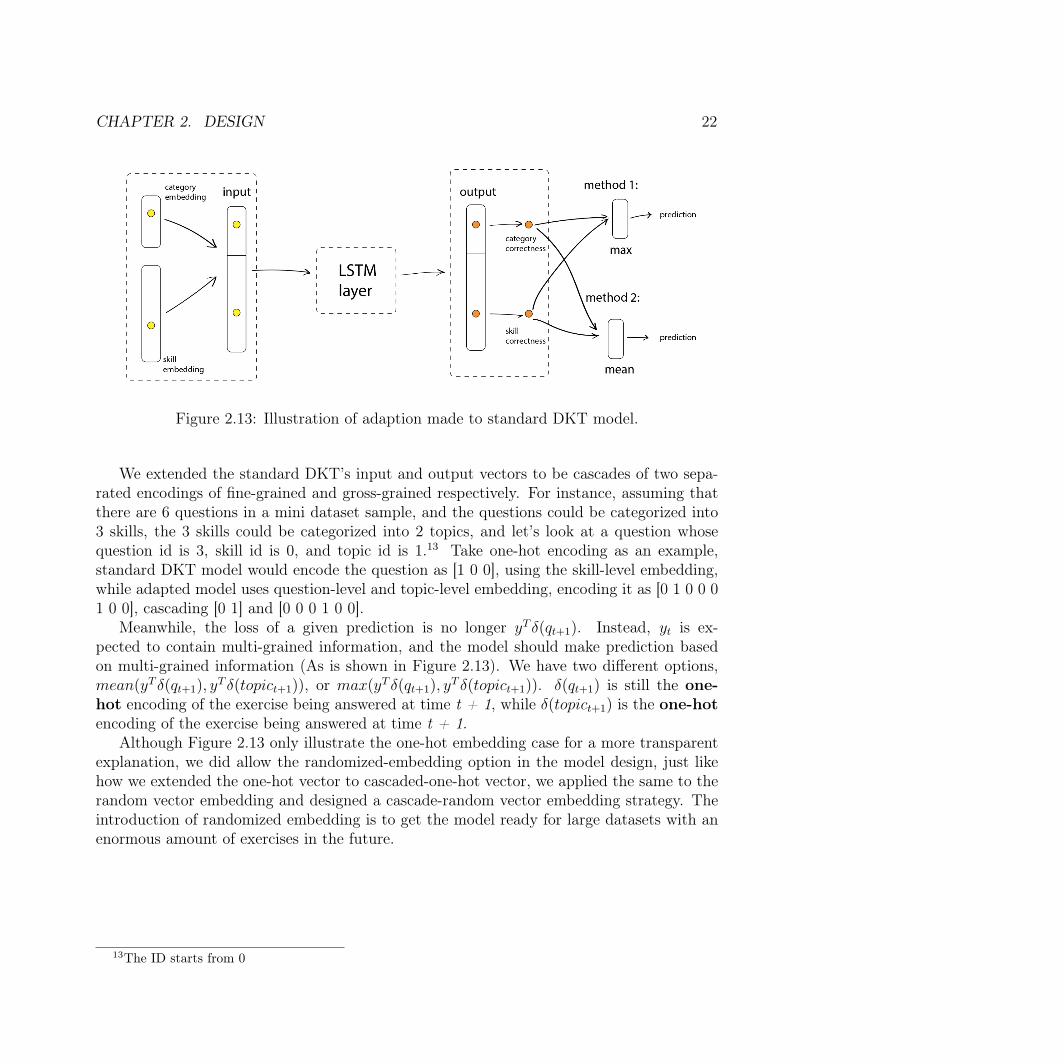
The adaption we made to the standard DKT model is aiming at fitting it into the Auto-Quiz situation. Similar to other approaches [24], we specifically work on the embeddings ofinput and output sequences, as is shown in Figure 2.13. The reason why we use an adaptedDKT model instead of the standard one is as follows:
1. Dataset size: The first version of AutoQuiz doesn’t have many questions included inthe system. Unlike the large datasets such as ASSISTments that usually go by skills,we need fine-grained encoding at question level so as to guarantee the outcome.
2. Multi-grained demand: The prediction output of the model should preferably includeboth fine-grained outcomes at the question level for question recommendation, andgross-grained outcomes at the topic level for feedback.
12The embedding method could be one-hot, random embedding, etc. When M is small, one-hot would beenough; if M is large, random embedding would be better.
CHAPTER 2. DESIGN 22
Figure 2.13: Illustration of adaption made to standard DKT model.
We extended the standard DKT’s input and output vectors to be cascades of two sepa-rated encodings of fine-grained and gross-grained respectively. For instance, assuming thatthere are 6 questions in a mini dataset sample, and the questions could be categorized into3 skills, the 3 skills could be categorized into 2 topics, and let’s look at a question whosequestion id is 3, skill id is 0, and topic id is 1.13 Take one-hot encoding as an example,standard DKT model would encode the question as [1 0 0], using the skill-level embedding,while adapted model uses question-level and topic-level embedding, encoding it as [0 1 0 0 01 0 0], cascading [0 1] and [0 0 0 1 0 0].
Meanwhile, the loss of a given prediction is no longer yT δ(qt+1). Instead, yt is ex-pected to contain multi-grained information, and the model should make prediction basedon multi-grained information (As is shown in Figure 2.13). We have two different options,mean(yT δ(qt+1), y
T δ(topict+1)), or max(yT δ(qt+1), yT δ(topict+1)). δ(qt+1) is still the one-
hot encoding of the exercise being answered at time t + 1, while δ(topict+1) is the one-hotencoding of the exercise being answered at time t + 1.
Although Figure 2.13 only illustrate the one-hot embedding case for a more transparentexplanation, we did allow the randomized-embedding option in the model design, just likehow we extended the one-hot vector to cascaded-one-hot vector, we applied the same to therandom vector embedding and designed a cascade-random vector embedding strategy. Theintroduction of randomized embedding is to get the model ready for large datasets with anenormous amount of exercises in the future.
13The ID starts from 0
23
Chapter 3
Implementation
3.1 Environmental SettingsUsers don’t need to worry about setting up the environment, as long as they have a
browser installed, preferably Chrome.1 The AutoQuiz system is designed to be web appli-cation at the very beginning. Similar to any other web APP, it is available cross-platform.Developers should be aware of some of the libraries, frameworks, and other environmentalsettings we used, so as to set the system up and make it work.
The AutoQuiz system is developed on macOS 10.13.3, and tested on Ubuntu 14.04.52,while theoretically, it should work on Windows3 as well. Flask4 is a microframework forPython based on Werkzeug and Jinja2. AutoQuiz is built upon Flask 0.12 framework5, usingPython 2.7.12., GCC 4.2.1. Programming languages used are simply Python and JavaScript(with HTML/CSS6 for sure). Python works mostly for the back-end, and JavaScript for theback-end.
3.2 Library Dependencies & Detailed Settings
User Interface
The user interface of AutoQuiz is rendered by Flask, using the Jinja2 template. Modeledafter Django’s templates, Jinja2 is a fast, widely-used designer-friendly templating languagefor Python, secure with the optional sandboxed template execution. It also provides powerful
1This is because we developed and tested the system using Chrome.2Ubuntu 14.04.5 is the OS provided by Pythonanywhere servers for now.3Running Flask applications on Windows requires different command, see http://flask.pocoo.org/
docs/0.12/installation/#virtualenv for more details.4http://flask.pocoo.org/5http://flask.pocoo.org/docs/0.12/6HTML5.1, https://www.w3schools.com/html/html5_intro.asp, CSS https://www.w3schools.
com/css/

CHAPTER 3. IMPLEMENTATION 24
automatic HTML escaping system for XSS prevention, template inheritance, easy-to-debugexception-reports, etc.7
Our data transmission needs are fully satisfied by Flask (Jinja2), and jQuery8. Flask isresponsible for gathering data to render the interface, while jQuery makes real-time updatesthe interface, and transmit data back to the back-end via jQuery AJAX9.
To implement the cool style of CS10, we used Bootstrap10, a famous HTML, CSS and JSlibrary, well-known for its convenience in helping with web-page styling, and is widely usedin previous BJC websites11.
There’s a Bootstrap extension, Bootstrap Table12, that helped us a lot in displaying thetables (Figure 2.7). The version of Bootstrap Table we used is 1.11.1.
For the interactive visualization needs (Figure 2.3), we used eCharts v313, an easy-to-use visualization tool that sacrifices parts of user freedom in exchange of the ease of use,developed by Baidu. Although eCharts doesn’t consist powerful visualization componentsas D314 offers, it provides fantastic animation effects that otherwise requires expert canvasknowledge to implement.
Part of the icons used in this thesis or on our website are drawn by myself using AdobeIllustrator, BJC-related icons and favicon are inherited from other BJC projects, some othericons are downloaded from iconfinder 15.
User Cache
User cache is used for not only efficiency but also avoiding of time-limit-exceeded prob-lem. In AutoQuiz we use the Cache16 object provided by Werkzeug, a WSGI utility librarythat Flask is built upon. For our simple requirements like storing the user informationtemporarily, or storing the users’ most recent exercise logs, the SimpleCache class wouldbe good enough. In our cache there stores user_id the user ID numbers, user_name thename string, question_id the list of recently-done questions’ ID numbers, correctness thelist of recently-done questions’ correctness, next_session the recommended next challengequestion set from KT model, category_correctness the estimated mastering level of eachtopic according to the prediction from the KT model.
7http://jinja.pocoo.org/docs/2.10/8AutoQuiz uses jQuery v2.1.3.9http://flask.pocoo.org/docs/0.12/patterns/jquery/
10https://getbootstrap.com/11http://cs10.org/sp18/ and https://bjc.berkeley.edu/12http://bootstrap-table.wenzhixin.net.cn/documentation/ ; http://issues.wenzhixin.net.
cn/bootstrap-table/13https://ecomfe.github.io/echarts-doc/public/en/index.html14https://d3js.org/15https://www.iconfinder.com/search/?q=black+box&price=free16http://werkzeug.pocoo.org/docs/0.14/contrib/cache/

CHAPTER 3. IMPLEMENTATION 25
Data Files
To make the files as readable to human as possible, while as well-organized and easily-recognized by python programs as possible, we use XML17 file format, and use xml.etree.ElementTree18
module for loading and processing the data files’ contents. The data file content format isas follows:
1 <?xml ve r s i on ="1.0" encoding="ISO−8859−1"?>2 <content>3 <s k i l l kind="de t a i l e d">boolean</ s k i l l >4 <des c r i p t i on >5 boolean e x e r c i s e (2017 Spring , Midterm 1 , Question 5)6 </de s c r i p t i on>7 <quest ion>8 <p>9 <l in e >You ’ re comfy in bed . . . </ l i n e >
10 <l in e >The f o l l ow i n g p i c t u r e s show . . . </ l i n e >11 </p>12 <img>13 <name he ight ="1">10.1.png</name>14 </img>15 . . . . . .16 <p>17 <l in e >Let ’ s . . . P lease choose one :</ l i n e >18 </p>19 </quest ion>20 <answers>21 <opt ion id="c1">22 <p>23 <l in e >24 exp r e s s i on A and B25 </l i n e >26 </p>27 </option>28 . . . . . . .29 <opt ion id="c5" c o r r e c t="true">30 <p>31 <l in e >32 exp r e s s i on B and C33 </l i n e >34 </p>35 </option>36 . . . . . .37 </answers>38 <hint >(not (A and B) ) == ( not (A) or not (B) ) ; . . . </ hint>39 </content>
Listing 3.1: Data File Content Example
17https://www.w3schools.com/xml/default.asp18https://docs.python.org/2/library/xml.etree.elementtree.html

CHAPTER 3. IMPLEMENTATION 26
Database
From the related works and sample Flask projects19, we’ve learned that Flask gets alongwith sqlite320 pretty well. We chose sqlite3 because it is well-embedded into Python21, easyto use and debug, requires no prerequisite tools to develop on it, light-weight and durableon our data size, and support the standard SQL queries.
AutoQuiz initializes the database by running schema.sql, while updating everything usingPython. Efforts are made to simplify the queries. Our principle is to have the simplest andthe most efficient queries possible. This rule turns out to well-optimize the running time ofthe system.
Log File
The log file is stored in CSV22 format so that it is easier to be viewed via Excel, so thatbugs could be easily spotted, if any. It is not standard CSV format, though: lines are notguaranteed the same amount of elements included, and no column name for the elements ina session. Although pandas couldn’t process the data from log file directly, we use the csvlibrary23 of Python to read the file line by line according to the format we defined.
KT Model
Our KT Model is built upon Tensorflow 1.6.0 for Python.24 Although it is said thatKeras25 is much easier to use than Tensorflow, we considered the environment settingson Pythonanywhere. Testing on their console, we found that they have TensorFlow pre-installed, but neither support Keras nor make it easy for Keras to be installed on the server.Besides, we noticed that Keras is mostly built upon other libraries such as Tensorflow, andusing Keras would sacrifice parts of our freedom in modifying the model. We finally decidedto use Tensorflow to implement the adapted Deep Knowledge Tracing model.
3.3 The adapted DKT model issues
Running Time
The adapted DKT model we used to trace students’ knowledge is, as mentioned above, adeep learning model, which could take a while to get trained and give a response. According
19https://github.com/pallets/flask20https://www.sqlite.org/index.html21https://docs.python.org/2/library/sqlite3.html or https://docs.python.org/3/library/
sqlite3.html22https://tools.ietf.org/html/rfc418023https://docs.python.org/2/library/csv.html24https://www.tensorflow.org/api_docs/python/25https://keras.io/

CHAPTER 3. IMPLEMENTATION 27
to the tests we’ve done before setting it up on the server, the cost to finish the followingsteps is approximately 40 to 45 seconds in total each run:
1. pass user-response data to the back-end;
2. loaded knowledge tracing model from a saved model file;
3. feed it into the KT model;
4. collect predictions from the model indicating how well the specific student is doing oneach topic and each question;
5. generate proper feedback to the current student;
6. pass the feedback data back to the front-end and show it to the use.
The bottleneck, according to our observation, is the running time of the training phase.It is obviously necessary to train the model, while it is inevitable that training takes a longwhile to finish. To fix this, as we just mentioned before, we used concurrency and cache.
Using concurrency is a must. We don’t have any other choice to avoid time-limit-exceeding. Even if we set up the system on our own server, users would be annoyed bythe 40+ seconds waiting time of getting a response.
As is mentioned before, our solution is to use multiple threads. The pseudo code of theparallel programming structure serving for the KT model is as shown below.
1 s t a r t Thread 22 i f a v a i l a b l e r e s u l t s in cache :3 f e t ch KT−r e l a t e d data from cache4 c l e a r the f e t ched data from the cache5 e l s e :6 run the s imple a l t e r n a t i v e a lgor i thm
Listing 3.2: Thread 1: Front-end-Fetching Thread (main thread)
1 data = prev ious data−s e s s i o n2 p r ed i c t i on = the whole p r ed i c t i o n tenso r3 a f t e r f e ed ing data in to KT model4 AUC_score = the AUC sco r e t r a i n i n g the KT model us ing data5 i f AUC_score >= THRESHOLD:6 put r e s u l t s i n to cache
Listing 3.3: Thread 2: Back-end-Calculation Thread
Save & Load
In order to update the model actively, we’d have to save and load the model frequently.The save and load methods we use are the ones given by Tensorflow official website.26 How-
26https://www.tensorflow.org/programmers_guide/saved_model

CHAPTER 3. IMPLEMENTATION 28
ever, as the instructions on the official website are inadequate to help with implementation,we used the methods from CV-Tricks.com as well.27
There are two points to be aware of when developing the system. First, as is mentionedpreviously, the saving process should better use an absolute path. Although using absolutepath makes it annoying having to retrain the KT model whenever migrated to a new server,having relative path could be even worse by causing unexpected errors in different types ofoperating systems. Second, the restoring strategy in Tensorflow built-in library isn’t makingeverything ready-to-use as the same way before the model is saved.
1 m = grainedDKTModel ( parameters )2 s e s s = t f . S e s s i on ( )3 s e s s . run ( t f . g l o b a l_v a r i a b l e s_ i n i t i a l i z e r ( ) )4 . . . . . .5 f eed_dict ={m. x : x_value ,m. y : y_value}6 s e s s . run ( [m. train_op ,m. l o s s ] , f eed_dict )7 . . . . . .8 t f . t r a i n . Saver ( ) . save ( se s s , model_saved_path )
Listing 3.4: Model Saving Example
1 saver = t f . t r a i n . import_meta_graph (model_saved_path )2 saver . r e s t o r e ( s e s s i on , t f . t r a i n . l a t e s t_checkpo int ( checkpoint_dir ) )3 graph = t f . get_default_graph ( )4 x = graph . get_tensor_by_name ("x : 0 " )5 y = graph . get_tensor_by_name ("y : 0 " )6 f eed_dict ={x : x_value , y : y_value}7 op_to_restore = graph . get_tensor_by_name (" op_to_restore : 0 " )8 l o s s_to_res tore = graph . get_tensor_by_name (" lo s s_to_res tore : 0 " )9 s e s s . run ( [ op_to_restore , l o s s_to_res tore ] , f eed_dict )
Listing 3.5: Model Restoring Example
As is listed above, unlike the model before saving (Listing 3.4), the model after restoring(Listing 3.5) loads every tensor by their name and index. There might be more convenientstorage and loading method just like what is provided by Python library numpy28 in thefuture.
Alternative Algorithm
In order to solve the problem of cold-start, as well as the problem of adapted DKTresults’ delaying, we use an alternative algorithm as plan B when the result is unavailable,or unreliable29.
27http://cv-tricks.com/tensorflow-tutorial/save-restore-tensorflow-models-quick-complete-tutorial/28https://docs.scipy.org/doc/numpy-1.13.0/reference/generated/numpy.save.html29It is regarded unreliable when the AUC score is lower than a certain threshold. AUC refers to “area
under ROC curve”. ROC stands for “Receiver Operating Characteristic”, a term from signal theory. AUCscore is a reliable and popular measurement for classifiers. Random guess will get an AUC score of 0.5.

CHAPTER 3. IMPLEMENTATION 29
The alternative algorithm, since it’ll be called when reliable KT results aren’t available,should be fast and reasonable, but it doesn’t have to be perfect. It must be guaranteedthat the alternative algorithm could generate usable results in no time. Comparing with aninaccurate result, having no result at all is much more intolerable.
Therefore, we come up with an extremely simple algorithm, whose pseudocode is as shownbelow. This algorithm, although being quite simple, does effectively return a reasonable setof recommended questions, and thus solves the problem of cold-start of the KT model aswell as compensating for the uncertainty of parallel programming.
1 de f random_questions :2 # count how many times each ques t i on i s answered c o r r e c t l y3 i f anonymous :4 quest ion_correct_count = how many times in t o t a l5 i s each ques t i on answered c o r r e c t l y by a l l u s e r s6 e l s e :7 quest ion_correct_count = how many times in t o t a l8 i s each ques t i on answered c o r r e c t l y by t h i s user9 s h u f f l e the order o f que s t i on s
10 s o r t the que s t i on s by the order o f quest ion_correct_count11 re turn the que s t i on s with the l e a s t t imes being answered c o r r e c t l y
Listing 3.6: Alternative Algorithm of KT Recommender

30
Chapter 4
Results
4.1 Testing the standard and multi-grained DKT modelAs is mentioned in previous chapters, we keep and train a DKT model to record and
predict the students’ performance. In addition to the standard DKT model where questionsare categorized into skills, and where the model is trained at skill level, our model embeddedmultiple granularities into the input vector. Since we don’t have a large-scale database inAutoQuiz, we turned out to use question-level id and skill-level id to label the data in theend.
Before putting the multi-grained DKT model into AutoQuiz system to use, we testedthe model on other existing datasets: ASSISTment dataset (2009-2010), and PKU MOOCdataset (2013). The previous researchers have labeled the datasets for us. We use theirlabeling for ASSISTment [27] and PKU MOOC [23] respectively. The default parametersettings are as shown in Table 4.1.
batch size embeddingmethod dropout
numberof hiddenunits
initiallearningrate
finallearningrate
16 one hot 0.5 200 0.001 0.00001
Table 4.1: adaptive DKT on PKU MOOC 2013 results
This setting is proved to be relatively suitable for both PKU dataset and ASSISTmentsdataset. We chose the value based on the AUC scores we had testing various parametersettings. The same parameters are used in AutoQuiz as well.
As is mentioned in Section 2.2, the adapted DKT model we use has two different optionsfor input vector embedding: single-grained and multi-grained. The output vector could alsobe either single-grained or multi-grained ; in addition, we have two options for generatingprediction using a multi-grained output vector: mean and max. When having multi-grained

CHAPTER 4. RESULTS 31
single-grainedoutput
multi-grainedoutput; pred bymax
multi-grainedoutput; pred bymean
single-grainedinput 0.7638 0.7641 0.7326
multi-grainedinput 0.7660 0.7726 0.7787
Table 4.2: PKU Dataset AUC Score (step=20001)
0.5
0.55
0.6
0.65
0.7
0.75
0.8
PKU Dataset Result AUC
Standard DKT (single grained in + single grained out)
single grained in + multi grained out (max)
single grained in + multi grained out (mean)
multi grained in + single grained out
multi grained in + multi grained out (max)
multi grained in + multi grained out (mean)
Figure 4.1: The result of KT models on PKU dataset
output, predictions would be made based on the multi-grained prediction of the student’sperformance on a specific question, namely how likely a student could answer each questioncorrectly. Using mean method, the possibility that the student would answer the questioncorrectly would be the mean value of the predicted correctness on different granularity level;similarly, in max mode, the final prediction would be the maximum value of those correct-nesses predicted. For example, if the model predicts that a student has 0.5 chance to answera math problem correctly, and 0.9 chance to answer a boolean-expression question (undermath topic) correctly, in the mean mode the final prediction would be 0.5 + 0.9 / 2 = 0.7,while in the max mode the prediction would be max(0.5, 0.9) = 0.9. Therefore, there’ll be 2options for input embedding and 3 options for output decoding, so that there’ll be 2× 3 = 6modes of KT model to test on each dataset.
The AUC scores of the models on PKU MOOC 2013 dataset under the parameter settingis as listed in Table 4.2. How the AUC score changes accordingly as the number of stepsincreases is as shown in Figure 4.1.
The AUC scores of the models on ASSISTments 2009-2010 dataset under the parametersetting is as listed in Table 4.3. How the AUC score changes accordingly as the number ofsteps increases is as shown in Figure 4.2. As is shown in the tables and figures, the adapted

CHAPTER 4. RESULTS 32
single-grainedoutput
multi-grainedoutput; pred bymax
multi-grainedoutput; pred bymean
single-grainedinput 0.7693 0.7526 0.7490
multi-grainedinput 0.7682 0.7534 0.7633
Table 4.3: ASSISTment Dataset AUC Score (step=20001)
0.62
0.64
0.66
0.68
0.7
0.72
0.74
0.76
0.78
ASSISTment Dataset Result AUC
Standard DKT (single grained in + single grained out)
single grained in + multi grained out (max)
single grained in + multi grained out (mean)
multi grained in + single grained out
multi grained in + multi grained out (max)
multi grained in + multi grained out (mean)
Figure 4.2: The result of KT models on ASSISTments dataset
model with multi-grained input and multi-grained output always performs pretty well, andthe adapted model with single-grained input and multi-grained output always performs theworst. Comparing mean method and max method, mean method always works better.
It is also obvious that although our best model (multi-grained input + multi-grainedoutput with mean prediction) performs better than standard DKT model on PKU MOOCdataset, it works slightly worse than standard DKT model on ASSISTments dataset. Theoutstanding performance on the PKU dataset is because that PKU dataset is closer to oursituation where we have direct access to the quiz questions and details on student perfor-mances. The multiple granularities we used on PKU dataset are question-level and topic-level. On the other hand, ASSISTments dataset is provided by the platform1, and we don’thave direct access to the details. Therefore, we used skill-level and topic-level embedding,without knowing the question IDs. Besides, the topics might be categorized too coarsely:111 skills for a wide range of math problems categorizing into 5 topics is not convincing.A shred of evidence we have is that the multi-grained input + single-grained output modelworks better than multi-grained input + multi-grained output models in this case, and worksslightly worse than the standard DKT model. It means that the multi-grained informationis not appropriately added - it is somehow a distraction rather than improvement in this
1https://sites.google.com/site/assistmentsdata/home/assistment-2009-2010-data

CHAPTER 4. RESULTS 33
All CS10 StudentsEnrolled Spring 2018
(162)
AutoQuizRegistered Users
(42)Students
Giving Feedback(7)
Figure 4.3: Illustration of Students’ overall participation in AutoQuiz
case.In general, the PKU dataset proved that our model has a high performance when cate-
gorized properly, and the ASSISTments dataset proved that it works even when skills/topicsaren’t labeled appropriately. Both datasets showed that the adapted model is able to performwell when the number of training steps is not large enough.
Based on the above understanding, we applied the multi-grained input + multi-grainedoutput (predicted by mean) model to AutoQuiz system. However, by using the students’response-session data collected right before midterm, the model is well-trained and the AUCscore fluctuates around 0.662 on almost any randomly selected test-set. This score isexpected to be much higher as number of questions included and the amount of user datastart to accumulate.

CHAPTER 4. RESULTS 34
0
1
2
3
4
5
6
7
1 2 3 4 5
User Satisfaction (1 for Useless, 5 for Useful)
Figure 4.4: Students Overall Satisfactory in Feedback
4.2 Students FeedbackIn Spring 2018, AutoQuiz was released to CS10 students several days before the midterm
exam2. 162 students were enrolled in this course3. Among them, 42 students registered touse our system as login users, and 7 out of the 42 students gave us direct feedback by fillingout the response form4. One out of the 7 students gave feedback twice, another student gavefeedback three times in total.
Figure 4.3 illustrates the students participation status in general.5 We are very gratefulfor those students’ participation, and we carefully read through their comments. Knowingthat there’s always long-tail distribution analyzing a large group of people, the participationrate is pretty satisfying.
As is shown in Figure 4.4, students were satisfied with the AutoQuiz system, accordingto the feedback. Some ratings are from the same users. However, since we’ve observed oneuser rating the system 4 in the first feedback and then 5 in the second, we notice the users’opinions change as time goes by, so we decide to keep all the records.
Although it is theoretically correct that if more users are involved there should be more2The URL of AutoQuiz is: http://cs10autoquiz.pythonanywhere.com/3http://classes.berkeley.edu/content/2018-spring-compsci-10-001-lec-0014https://goo.gl/forms/3g9ZEoaciXxMCX0V25The figure is generated using matplotlib, https://blog.csdn.net/lanchunhui/article/details/
50667052

CHAPTER 4. RESULTS 35
64% 9%
9%
9%
9%
Reported Issues
Hint/Explanation
Question
AnswerChoices
Challenge
Statistic
Figure 4.5: Students Overall Satisfactory in Feedback
feedback for us to analyze, the current students share some common ideas in their feedbackcomments. With 4 glitch reports fixed and 1 lovely simply-“wants it back for the final”comment excluded, we summarize the feedback opinions as is shown in Table 4.4. It isquite obviously shown in Figure 4.5 that the largest problem students see from AutoQuizis the rigid and insufficient hints. Improving the hint system will boost user experiencedramatically.
4.3 Students ParticipationStudents participated in AutoQuiz quite actively, as is shown in Figure 4.3. The amount
of newly-registered users per day is as shown in Figure 4.6 as well as Table 4.5. The totalnumber of submissions in the system per day is as shown in Figure 4.7. As we can see fromthe course website6, we had two paper midterms for students, one on March 19th, the otheron March 21st. And these two days are when the highest peak and the second-highest peakhappen on both curves respectively. It proves to us that when there are two upcoming examsnext to together, most students will pay more efforts preparing for the first one, and as forthe second one, then just go with it, not working for the second one as hard.
There’s an unexpected, interesting finding on anonymous users. As is shown in Figure4.8, the records left by anonymous users is approximately as many as, and a little bit more
6http://cs10.org/sp18/

CHAPTER 4. RESULTS 36
WhatIssue
WhyReportit
How toFix it How to Fix it (Detail) Other Points
Hint /Expla-nation
rough group effort submit explanations andshare with others
the best way to learnthings is teach others
Hint /Expla-nation
rough make itclearer
especially the HOF prac-tice
Hint /Expla-nation
rough changequestions
use exactly the samequestions as they are inprevious midterms
easier to look up
Hint /Expla-nation
rough should makebetter hints
AnswerChoice too much should have
less 5 or so mimics the exam format
Hintmostly oncorrectanswer
a hintafter everywronganswer
Statistics
lack of“getting-wrong”informa-tion
want to seewhich typeof questionsI frequentlyget wrong
Hint /Expla-nation
rough more expla-nations
more explanation needed,hints could change witheach wrong answer
Hint /Expla-nation
rough more expla-nations
want the answer expla-nations be more specificand be different from thehints
Questions notenough
more ques-tions
more practice problemsto do beyond just the pre-vious exam questions
Challenge answerhidden
show an-swers
showing the answers onthe challenge questionswould be nice
Table 4.4: Summary of Reported Issues

CHAPTER 4. RESULTS 37
0
5
10
15
20
25
3/17/18 3/18/18 3/19/18 3/20/18 3/21/18 3/22/18
Registered Users over time
Figure 4.6: Count of Newly-Registered Users per Day
0
1000
2000
3000
4000
5000
6000
3/17/18 3/18/18 3/19/18 3/20/18 3/21/18 3/22/18
Number of Records
Figure 4.7: Count of Submission Records per Day

CHAPTER 4. RESULTS 38
Date March17th
March18th
March19th
March20th
March21st
March22nd
Registers 2 14 23 1 2 0
Table 4.5: The amount of students registering per day.
0
500
1000
1500
2000
2500
3000
3/17/18 3/18/18 3/19/18 3/20/18 3/21/18 3/22/18
Records of Login / Anonymous Users
LoginUserLog AnonymousLog
Figure 4.8: The Number of Records grouped by Login / Anonymous Users per Day
than, those left by login users each day. The two curves in the figure are of the samedistribution. This finding might infer that there are many more students willing to use thesystem anonymously than we previously expected, even after we announced that “login isrecommended”.
However, it remains unclear why these curves track so perfectly. One possible reasonis that students tend to behave the similar way as exams are approaching. That is to say,the curves might become different if we’ve released AutoQuiz earlier. Another possibilitywould be that students sometimes use anonymous mode to make random guess on what theanswers are. To reveal what exactly is the story behind the curves, we need insight into theanonymous group, which could be an individual research topic on its own.
The exact amount of records left by login users and anonymous users are explicitly listedin Table 4.6. The amount of questions answered by each login user is as shown in Figure4.9. We are delighted to see that registered users are actively involved.
As we are interested in the students’ individual participation each day, as well as their

CHAPTER 4. RESULTS 39
Date March17th
March18th
March19th
March20th
March21st
March22nd
Login 67 669 2452 55 664 6Anonymous 93 867 2664 168 631 0Total 160 1536 5116 223 1295 6
Table 4.6: The amount of records per day
203
166
159
157
142
131
129
129
128
126
126
118
114
112
110
103
103
102
102
100
99 96 95 95 90 87 86 84 84 74 7356 53 50 45 40 39 30 27 17 12
0
50
100
150
200
250
32 24 43 6 35 33 13 36 39 4 18 10 9 29 45 8 28 7 34 26 14 44 23 37 17 21 27 19 38 31 46 42 20 25 40 30 22 41 16 12 15
Num
ber o
f Rec
ords
in T
otal
User ID
Individual Participation
Figure 4.9: The Number of Records of Each Login User
study pattern during the reviewing phase, we plotted the number of records per user in Figure4.10 and Figure 4.11. Students have various kinds of participating curves. Some studentsstarted extremely early7, and many of them began using AutoQuiz the day before the firstmidterm, which took place on March 19th. March 20th, the day after the first midtermand before the second midterm, was when most students weren’t interested in AutoQuiz atall. However, there are two users, ID 9 and 17 respectively, who keep on using the systemevery day, including March 20th. There are students start early and students who start late,students who are motivated by deadlines and those who plan ahead, students who makeprogress piece by piece every day, and who prefer getting everything done all at once.
Knowing the students’ habits better, in the latter iteration of AutoQuiz, as well as otherteaching practice, we might be able to improve the students’ learning experience. From thequestions’ perspective, we analyzed how many students have answered each of the questions.
7In fact, we released the system on March 17th, but one student, with user ID 4, as is shown in Figure4.12, managed to get the URL of our system during class when we were showing them the online demo of thesystem. We didn’t realize it until started analyzing the data we got. That student appeared extraordinarilyactive and self-motivated.

CHAPTER 4. RESULTS 40
0
20
40
60
80
100
120
140
160
180
3/16/18 3/17/18 3/18/18 3/19/18 3/20/18 3/21/18 3/22/18
NumberofRecords
Date
Individual Daily Participation
4 6 7 8 9 10 12 13 14 15 16 17 18 19 20 21 22 23 24 25 26
27 28 29 30 31 32 33 34 35 36 37 38 39 40 41 42 43 44 45 46
Figure 4.10: The Number of Records of Each Login User Per Day
2018-03-17 2018-03-18 2018-03-19 2018-03-20 2018-03-21date
46789
101213141516171819202122232425262728293031323334353637383940414243444546
use
r ID
55 66 5 0 00 157 0 0 00 68 34 0 00 65 38 0 00 31 83 0 00 66 52 0 00 17 0 0 00 43 86 0 00 93 6 0 00 6 6 0 00 26 1 0 00 29 29 32 00 0 126 0 00 1 58 0 250 0 39 0 140 0 87 0 00 0 39 0 00 0 95 0 00 0 87 20 590 0 41 0 90 0 100 0 00 0 86 0 00 0 103 0 00 0 112 0 00 0 40 0 00 0 74 0 00 0 117 0 860 0 130 1 00 0 102 0 00 0 142 0 00 0 129 0 00 0 95 0 00 0 39 0 450 0 128 0 00 0 45 0 00 0 30 0 00 0 56 0 00 0 10 0 1490 0 0 2 940 0 0 0 1100 0 0 0 73
0
30
60
90
120
150
Figure 4.11: The Number of Records of Each Login User Per Day Illustrated by Heat-map
Although questions with smaller IDs, who are listed in the front page in the system, are

CHAPTER 4. RESULTS 41
more likely to be visited, it is also obvious that the number of users doing each exercise isquite balanced, as is shown in Figure 4.12.
4036 35 35 35 36 35 3436 36 35 36
33 3336 37
33 3336 36
33 34 34 3436
33 33 33 3432 33 32 33 33 33 33 33 32 32 32 3331 32 31 32
2629 3028 29
34 3328 2927 27 28
31 32
0
5
10
15
20
25
30
35
40
45
1 3 5 7 9 11 13 15 17 19 21 23 25 27 29 31 33 35 37 39 41 43 45 47 49 51 53 55 57 59
Num
ber o
f Use
rs
question ID
User Participation per Question
Figure 4.12: The Number of Students who Answered each Question
59 59 59 59 59 59 59 59 59 59 59 59 59 59 59 59 58 58 58 56 55 53 52 52 5044 44 41 40 37
32 32 31 29 2824
2016 15
3 2
0
10
20
30
40
50
60
70
4 6 7 13 14 18 24 26 27 31 32 33 34 36 39 43 8 9 10 29 19 23 28 38 44 35 45 21 37 42 17 40 25 46 20 22 30 41 16 15 12
NumberofQuestions
User ID
NumberofQuestions Completed
Figure 4.13: The Number of Exercise Completed by Each Student
On the other hand, although it is shown in Figure 4.9 that every registered user hassubmitted exercise at least ten times, when examining the total amount of questions com-pleted by the users, we found that users with ID 15 and 12 are only trying 3 and 2 questionsrespectively, again and again, but not moving forward to other exercises. We are kind ofworry if this is due to that they started with the hardest questions, and thus were unwillingto keep using the system again. There is another possibility, though, that some studentsmight have multiple accounts in the system. Those students might be driven by their desirefor perfectionism, doing everything they could to keep their primary account’s log look nice.Since we never forced them to log in with their real name, it remains unclear if those accountsare someone else’s subsidiary accounts.
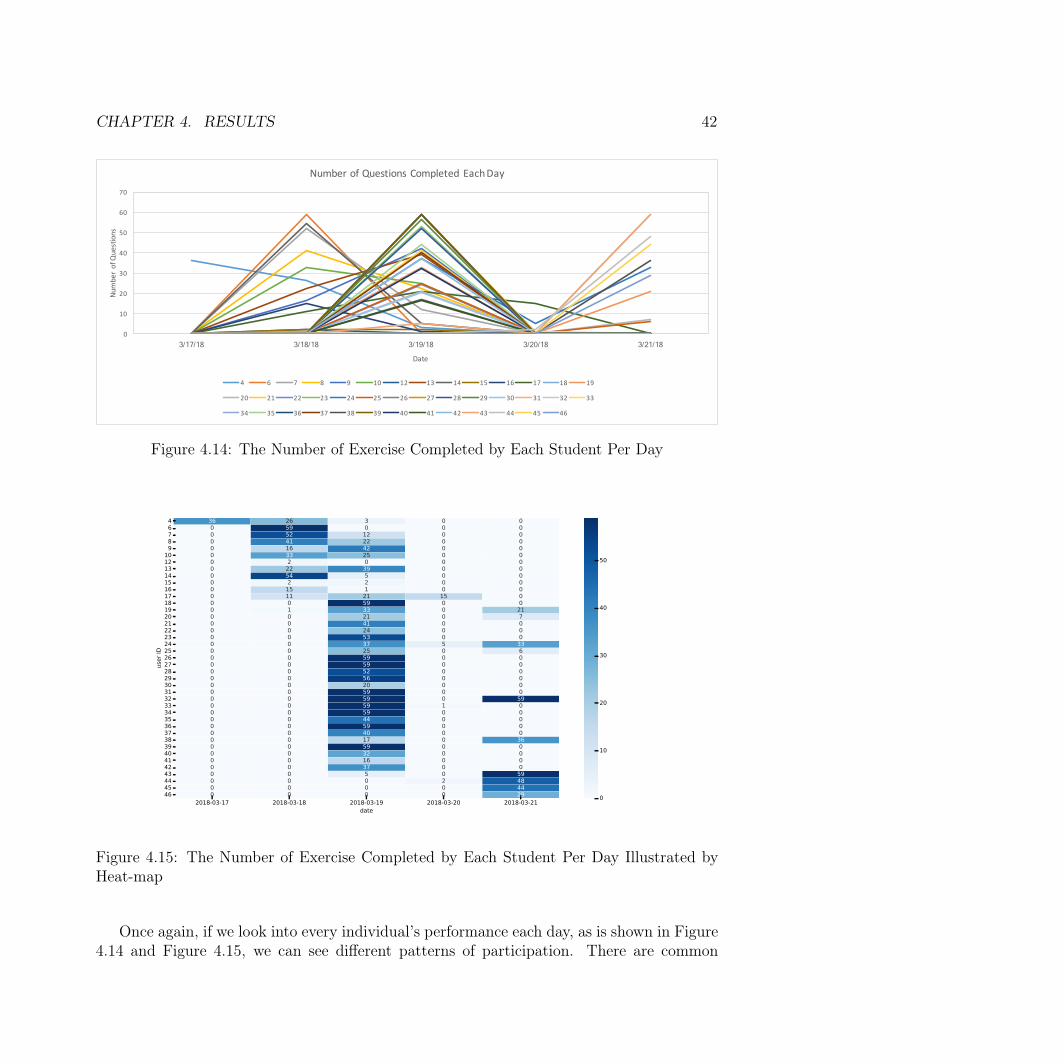
CHAPTER 4. RESULTS 42
0
10
20
30
40
50
60
70
3/17/18 3/18/18 3/19/18 3/20/18 3/21/18
NumberofQuestions
Date
Number of Questions Completed EachDay
4 6 7 8 9 10 12 13 14 15 16 17 18 19
20 21 22 23 24 25 26 27 28 29 30 31 32 33
34 35 36 37 38 39 40 41 42 43 44 45 46
Figure 4.14: The Number of Exercise Completed by Each Student Per Day
2018-03-17 2018-03-18 2018-03-19 2018-03-20 2018-03-21date
46789
101213141516171819202122232425262728293031323334353637383940414243444546
use
r ID
36 26 3 0 00 59 0 0 00 52 12 0 00 41 22 0 00 16 42 0 00 33 25 0 00 2 0 0 00 22 39 0 00 54 5 0 00 2 2 0 00 15 1 0 00 11 21 15 00 0 59 0 00 1 33 0 210 0 21 0 70 0 41 0 00 0 24 0 00 0 53 0 00 0 37 5 330 0 25 0 60 0 59 0 00 0 59 0 00 0 52 0 00 0 56 0 00 0 20 0 00 0 59 0 00 0 59 0 590 0 59 1 00 0 59 0 00 0 44 0 00 0 59 0 00 0 40 0 00 0 17 0 360 0 59 0 00 0 32 0 00 0 16 0 00 0 37 0 00 0 5 0 590 0 0 2 480 0 0 0 440 0 0 0 29
0
10
20
30
40
50
Figure 4.15: The Number of Exercise Completed by Each Student Per Day Illustrated byHeat-map
Once again, if we look into every individual’s performance each day, as is shown in Figure4.14 and Figure 4.15, we can see different patterns of participation. There are common
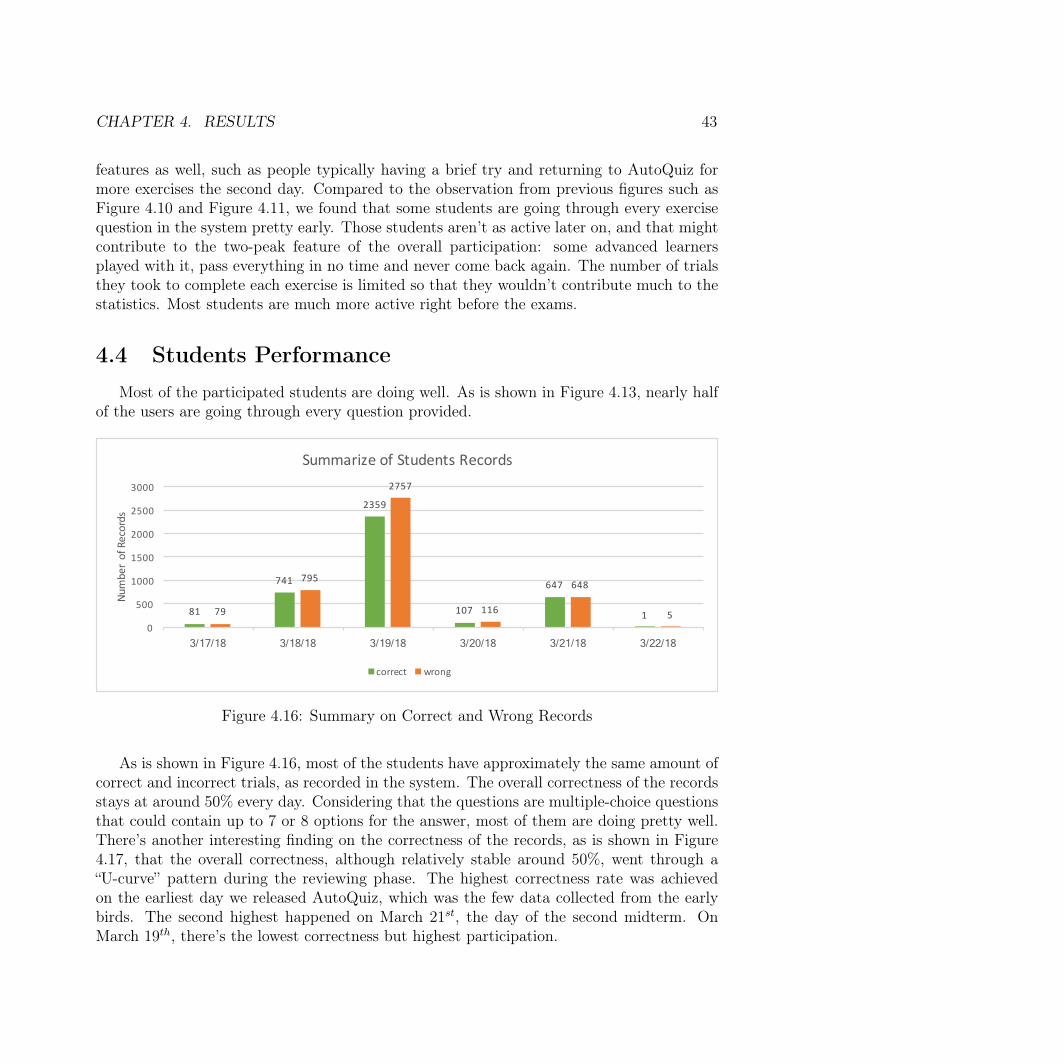
CHAPTER 4. RESULTS 43
features as well, such as people typically having a brief try and returning to AutoQuiz formore exercises the second day. Compared to the observation from previous figures such asFigure 4.10 and Figure 4.11, we found that some students are going through every exercisequestion in the system pretty early. Those students aren’t as active later on, and that mightcontribute to the two-peak feature of the overall participation: some advanced learnersplayed with it, pass everything in no time and never come back again. The number of trialsthey took to complete each exercise is limited so that they wouldn’t contribute much to thestatistics. Most students are much more active right before the exams.
4.4 Students PerformanceMost of the participated students are doing well. As is shown in Figure 4.13, nearly half
of the users are going through every question provided.
81
741
2359
107
647
179
795
2757
116
648
50
500
1000
1500
2000
2500
3000
3/17/18 3/18/18 3/19/18 3/20/18 3/21/18 3/22/18
NumberofRecords
Summarize of Students Records
correct wrong
Figure 4.16: Summary on Correct and Wrong Records
As is shown in Figure 4.16, most of the students have approximately the same amount ofcorrect and incorrect trials, as recorded in the system. The overall correctness of the recordsstays at around 50% every day. Considering that the questions are multiple-choice questionsthat could contain up to 7 or 8 options for the answer, most of them are doing pretty well.There’s another interesting finding on the correctness of the records, as is shown in Figure4.17, that the overall correctness, although relatively stable around 50%, went through a“U-curve” pattern during the reviewing phase. The highest correctness rate was achievedon the earliest day we released AutoQuiz, which was the few data collected from the earlybirds. The second highest happened on March 21st, the day of the second midterm. OnMarch 19th, there’s the lowest correctness but highest participation.

CHAPTER 4. RESULTS 44
50.63% 48.24% 46.11% 47.98% 49.96%
0.00%
10.00%
20.00%
30.00%
40.00%
50.00%
60.00%
70.00%
80.00%
90.00%
100.00%
3/17/18 3/18/18 3/19/18 3/20/18 3/21/18
RecordsCorrectness
Figure 4.17: Summary on Records’ Correctness
By analyzing the data collected, we suspect that before the first midterm, more andmore students started reviewing and used AutoQuiz, while the advanced learners tend tostart earlier than the rest of the class, and that’s why we observe the decreasing of accuracy.On the other hand, after the first midterm, students are feeling more comfortable with thetest style8, and thus had better performance.
From Figure 4.18, we could see that students’ participation, as well as their performance,vary a lot. It seems that the students who started early don’t necessarily have the highestcorrectness rate in answering questions9. Besides, as is shown in Figure 4.19, most stu-dents are performing well, most of them have correctness rate higher than 25%, which isapproximately the correctness rate of random guess.10
Due to the limited amount of questions included in AutoQuiz, it normally takes a student8Note that the questions in AutoQuiz system are all from previous exams.9We can tell if a student started early or late because the system assigns the user ID by using the
autoincrement key of the user table. The users with smaller user IDs are always those who started earlier.10In fact, most questions in the AutoQuiz system have more than 4 options of the answers, so the overall
expectation of correctness is lower than 20%, so we could say that the students’ performances are significantlyhigher than random guessing.

CHAPTER 4. RESULTS 45
60
86
31
42
58 60
14
65
45
10 11
39
67
34
24
46
14
40
97
26
41
32
52
59
21
12
78
66
38
101
65 59
32
66
14 14
23
98
46
66
45
66 71 71
61 56 58
3
64
54
2
16
51
59
50
29
41
25
55
69
24
59 54 51 53
19
62
125
65 64
41
64
36
52
62
31
16
33
61
50 44
28
0
20
40
60
80
100
120
140
4 6 7 8 9 10 12 13 14 15 16 17 18 19 20 21 22 23 24 25 26 27 28 29 30 31 32 33 34 35 36 37 38 39 40 41 42 43 44 45 46
NumberofRecords
User ID
Individual Correct and Wrong Records
wrong correct
Figure 4.18: Summary on Individual Students’ Right and Wrong Records
83.78%
69
.61%
68
.89%
64
.10%
62
.79%
62.75%
61
.90%
61
.58%
59
.52%
59
.26%
59
.22%
59
.00%
58
.93%
57
.89%
56
.67%
54
.72%
54
.55%
53
.33%
52
.38%
52
.08%
49
.62%
49
.61%
49
.61%
49
.51%
49
.15%
49
.12%
48
.44%
48
.00%
47
.50%
47
.32%
47
.13%
46
.83%
45
.22%
41
.57%
40
.00%
38
.36%
38
.36%
37
.89%
28
.87%
17
.65%
16
.67%
0.00% 10.00% 20.00% 30.00% 40.00% 50.00% 60.00% 70.00% 80.00% 90.00%
100.00%
31 7 40 22 27 34 38 32 19 16 8 26 42 23 17 20 14 41 4 44 33 13 36 28 10 9 39 25 30 29 21 18 6 24 45 43 46 37 35 12 15
User ID
Individual Record Correctness
Figure 4.19: Summary on Individual Students’ Correctness
0.00%
10.00%
20.00%
30.00%
40.00%
50.00%
60.00%
70.00%
80.00%
90.00%
100.00%
3/17/18 3/18/18 3/19/18 3/20/18 3/21/18
Correctness of Users' Daily Records
4 6 7 8 9 10 12 13 14 15 16 17 19 18 20 21 22 23 24 25 26
27 28 29 30 31 32 33 34 35 36 37 38 39 40 41 42 43 44 45 46
Figure 4.20: Summary on Individual Students’ Correctness Per Day
less than 3 days to get through every one of them. We visualize their performance byplotting their correctness rate in answering AutoQuiz questions, as is shown in Figure 4.20

CHAPTER 4. RESULTS 46
2018-03-17 2018-03-18 2018-03-19 2018-03-20 2018-03-21date
46789
101213141516171819202122232425262728293031323334353637383940414243444546
use
r ID
0.654545 0.409091 0.600000 0.000000 0.0000000.000000 0.452229 0.000000 0.000000 0.0000000.000000 0.764706 0.558824 0.000000 0.0000000.000000 0.661538 0.473684 0.000000 0.0000000.000000 0.516129 0.481928 0.000000 0.0000000.000000 0.500000 0.480769 0.000000 0.0000000.000000 0.176471 0.000000 0.000000 0.0000000.000000 0.511628 0.488372 0.000000 0.0000000.000000 0.537634 0.666667 0.000000 0.0000000.000000 0.166667 0.166667 0.000000 0.0000000.000000 0.576923 1.000000 0.000000 0.0000000.000000 0.379310 0.758621 0.562500 0.0000000.000000 0.000000 0.468254 0.000000 0.0000000.000000 1.000000 0.568966 0.000000 0.6400000.000000 0.000000 0.564103 0.000000 0.5000000.000000 0.000000 0.471264 0.000000 0.0000000.000000 0.000000 0.641026 0.000000 0.0000000.000000 0.000000 0.578947 0.000000 0.0000000.000000 0.000000 0.425287 0.100000 0.5084750.000000 0.000000 0.512195 0.000000 0.3333330.000000 0.000000 0.590000 0.000000 0.0000000.000000 0.000000 0.627907 0.000000 0.0000000.000000 0.000000 0.495146 0.000000 0.0000000.000000 0.000000 0.473214 0.000000 0.0000000.000000 0.000000 0.475000 0.000000 0.0000000.000000 0.000000 0.837838 0.000000 0.0000000.000000 0.000000 0.529915 0.000000 0.7325580.000000 0.000000 0.492308 1.000000 0.0000000.000000 0.000000 0.627451 0.000000 0.0000000.000000 0.000000 0.288732 0.000000 0.0000000.000000 0.000000 0.496124 0.000000 0.0000000.000000 0.000000 0.378947 0.000000 0.0000000.000000 0.000000 0.435897 0.000000 0.7777780.000000 0.000000 0.484375 0.000000 0.0000000.000000 0.000000 0.688889 0.000000 0.0000000.000000 0.000000 0.533333 0.000000 0.0000000.000000 0.000000 0.589286 0.000000 0.0000000.000000 0.000000 0.300000 0.000000 0.3892620.000000 0.000000 0.000000 1.000000 0.5106380.000000 0.000000 0.000000 0.000000 0.4000000.000000 0.000000 0.000000 0.000000 0.383562
0.0
0.2
0.4
0.6
0.8
1.0
Figure 4.21: Summary on Individual Students’ Correctness Per Day Illustrated by Heat-map
and Figure 4.21. The visualized figure also indicates that students aren’t necessarily havinghigher performance in AutoQuiz system from day to day. Compared with their participation,it makes sense, since most of them will not return once they’ve done all the questions, andwe don’t have enough questions in the system to keep a student involved for more than threedays11.
Examining the difference between the performance of anonymous user and login user,we found that anonymous users are having worse performance than login users, except onMarch 20th, when only a few students were using the system. It is also interesting to see theanonymous students’ performance “catching up” in the end. We suspect that it might be dueto that many students started using the system as anonymous users, but later on switchedto login user when they realize that they need the system’s help, and other users who startedwith anonymous mode might be either advanced or unwilling to use the system anymore.We calculated the correlation coefficient of factor anonymous/login and factor correctness,|r| value is 0.467, which means that the anonymity and performance are correlated, but notobvious.
As for different questions, Figure 4.23 shows that students performance vary a lot an-swering different questions. We used previous year’s exam questions directly, and thus thedifficulty of the questions varies in nature. The amount of correct trials on each question
11By March 17th 2018, AutoQuiz includes 59 questions in its database.

CHAPTER 4. RESULTS 47
65.45% 51.65% 51.39%
41.82%
50.00%
41.96% 45.56% 41.25%
50.00%
49.92%
0.00% 10.00% 20.00% 30.00% 40.00% 50.00% 60.00% 70.00% 80.00% 90.00%
100.00%
3/17/18 3/18/18 3/19/18 3/20/18 3/21/18
Corre
ctness
Date
3/17/18 3/18/18 3/19/18 3/20/18 3/21/18 LoginUser 0.6545 0.5165 0.5139 0.4182 0.5
AnonymousUser 0.4196 0.4556 0.4125 0.5 0.4992
Performance of Login / Anonymous Users
LoginUser AnonymousUser
Figure 4.22: Anonymous Users’ and Login Users’ Performance
0
50
100
150
200
250
300
51 30 6 20 35 38 52 37 41 57 1 49 33 42 55 46 28 53 40 58 7 32 25 47 50 54 5 15 11 3 23 22 4 56 24 27 16 48 26 43 29 19 9 31 21 18 36 39 8 45 44 59 34 17 10 14 2 12 13
NumberofRecords
Question ID (ordered by correctness)
Records on each Question
correct wrong
Figure 4.23: Summary on Students’ Performance on Each Question
remains almost the same, while the wrong trials times are what contributes the most to thedifference in performance. The correctness data is shown in Figure 4.24.
Question 12 and Question 13 are questions on List and HOFs, which is hard and needexplanation, and there are often 8 or more options of the answers, making it even harderfor the students to make a random guess correctly. Correctness is expected to increase if anintelligent hint system is provided. The challenge of making hints for some of the questions,such as question 12 and question 13, is that it is hard to explain “how to” solve the problemwithout letting students know the exact answer of the specific exercise.
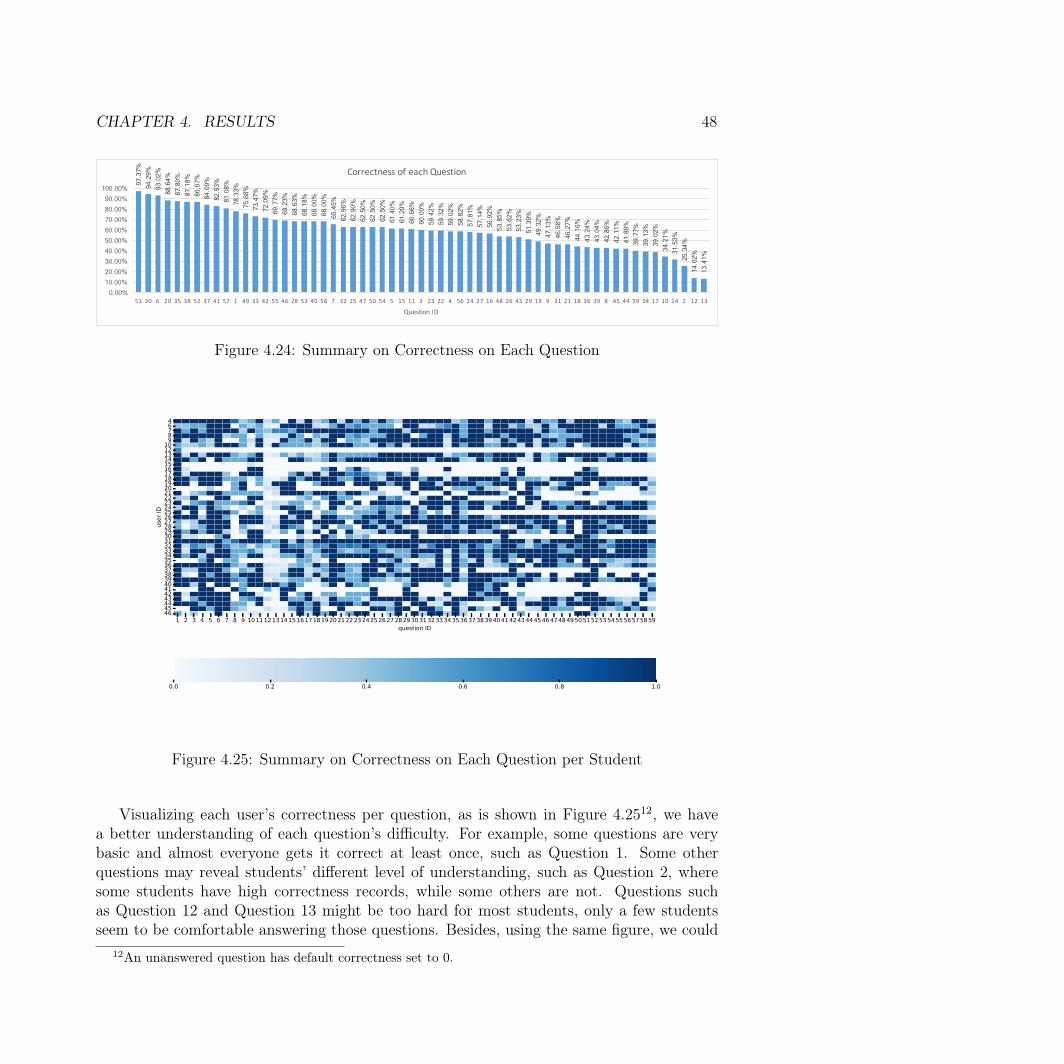
CHAPTER 4. RESULTS 4897
.37%
94
.29%
93
.02%
88
.64%
87
.80%
87
.18%
86
.67%
84
.09%
82
.93%
81
.08%
78
.33%
75
.68%
73
.47%
72
.09%
69
.77%
69
.23%
68
.63%
68
.18%
68
.00%
68
.00%
65
.45%
62
.96%
62
.90%
62
.50%
62
.50%
62
.50%
61
.40%
61
.29%
60
.66%
60
.00%
59
.42%
59
.32%
59
.02%
58
.82%
57
.81%
57
.14%
56
.92%
53
.85%
53
.62%
53
.23%
51
.39%
49
.32%
47
.13%
46
.58%
46
.27%
44
.16%
43
.24%
43
.04%
42
.86%
42
.11%
41
.89%
39
.77%
39
.13%
39
.02%
34
.21%
31
.53%
25
.34%
14
.02%
13
.41%
0.00% 10.00% 20.00% 30.00% 40.00% 50.00% 60.00% 70.00% 80.00% 90.00%
100.00%
51 30 6 20 35 38 52 37 41 57 1 49 33 42 55 46 28 53 40 58 7 32 25 47 50 54 5 15 11 3 23 22 4 56 24 27 16 48 26 43 29 19 9 31 21 18 36 39 8 45 44 59 34 17 10 14 2 12 13
Question ID
Correctness of each Question
Figure 4.24: Summary on Correctness on Each Question
1 2 3 4 5 6 7 8 9 1011121314151617181920212223242526272829303132333435363738394041424344454647484950515253545556575859question ID
46789
101213141516171819202122232425262728293031323334353637383940414243444546
use
r ID
0.0 0.2 0.4 0.6 0.8 1.0
Figure 4.25: Summary on Correctness on Each Question per Student
Visualizing each user’s correctness per question, as is shown in Figure 4.2512, we havea better understanding of each question’s difficulty. For example, some questions are verybasic and almost everyone gets it correct at least once, such as Question 1. Some otherquestions may reveal students’ different level of understanding, such as Question 2, wheresome students have high correctness records, while some others are not. Questions suchas Question 12 and Question 13 might be too hard for most students, only a few studentsseem to be comfortable answering those questions. Besides, using the same figure, we could
12An unanswered question has default correctness set to 0.

CHAPTER 4. RESULTS 49
tell each student’s strength and weakness, and whether or not they are active users. Thoseinformation we get from the user data might be useful to instructors.
We calculated the correlation coefficient of factor performance, measured by correctness,and factor participation, measured by the number of records left in the system, and foundthe |r| value be 0.00977, which means that performance and participation are not likelyto be linear correlated. However, it is intuitively true that these two factors might infecteach other, and that there are no correlations between them doesn’t mean that they aren’trelated to each other in other forms.
4.5 DiscussionFrom the experiments, we can have a better understanding of students’ behaviors prepar-
ing for CS10 exams. First of all, to our pleasure, seems that students are satisfied withAutoQuiz. Some of our assumptions did come true, for example, that allowing students touse AutoQuiz anonymously is necessary, and that some of them might feel more comfortablenot logging in.
We observe different participating patterns of the students, as well as various correctnesspatterns, while the majority group of the students has similar behavior patterns. Most ofthe students devote their time to reviewing one or two days before our first midterm andaren’t putting much effort into preparing for the second. However, unlike the decreasing par-ticipation, we observe increasing performance during the period. Students have significantlyhigher accuracy answering the questions around the second midterm comparing with theirperformance around the first midterm. Given that both paper midterms were hosted withina week, it is quite exciting that students are learning a lot.
The user data from AutoQuiz might be a shred of evidence that the two-midterm settingdoes help students learn better by testing them while allowing them a second chance. Asis shown in Figure 4.14 and Figure 4.15, some students start late but catch up by midtermtwo.
Also, we found anonymity and performance somehow related. In general, login users arehaving better performance than anonymous users. Considering that the anonymous usersproduce half of the record, we suggest that the anonymous records in AutoQuiz system shouldbe taken into consideration when analyzing the students’ weaknesses and giving instructionsaccordingly.
We also found that participation and performance are unlikely to have a linear correlation.In other words, students won’t be turned away if they are not answering the questionscorrectly. This is an amazing finding, but it doesn’t mean that we could ignore the difficultylevel of the questions in AutoQuiz system and throw whatever questions on students. Sofar all we know about this “non-correlation” is that the difficulty level of the questions wehave for now isn’t affecting the overall usability, and things might change as we expand thedatabase size.

CHAPTER 4. RESULTS 50
We are also grateful for all the feedback students gave to us. Some of the suggestions areinspiring, and will be discussed in Chapter 5, Section 5.2.

51
Chapter 5
Conclusion
5.1 SummaryAutoQuiz is an intelligent, web-based, real-time, adaptive system for helping students
prepare for tests. Although it is just the first released version, we can see much potential inthe system, and we can say that it has an auspicious future if we keep working on it.
First of all, since AutoQuiz not depending on any third-party API, developing and main-taining the system will not be very difficult. Second, by implementing AutoQuiz, we devel-oped an open-source framework of an intelligent online training system that could be easilyused in other courses and is open to new modules. Third, according to the students’ perfor-mance and their feedback, we believe the system is very successful in helping students havea better experience preparing for the paper midterms.
During the process of developing the system and gathering students’ feedback on it, wefound that there are many potential extensions to AutoQuiz. We’ll discuss these ideas inSection 5.2.
5.2 Future WorkThe system has an excellent start and is ready to launch any further improvements. Due
to the time-limit and the cost performance trade-off, we decided to postpone some of theimprovements to the future versions. Some of them are complex enough to be an individualresearch topic on their own. Here are some of the future works we propose:
User Modeling
The temporary structure of AutoQuiz doesn’t have a user model. We model the user’sbehavior based on the current session of data, which means that previous information couldbe lost. Besides, we aren’t keeping a user profile, while user profile might contain usefulinformation on making recommendations or evaluating the students’ performances.

CHAPTER 5. CONCLUSION 52
Recommender systems always try their best to model their users, so as to provide moresuitable items and thus make the system more attractive to the users [28]. Not only e-commerce scenario but also social networking systems are making good use of their userdata [29]. There has long been the saying of “Facebook knows you better than your friends”.In March 2018, Facebook was criticized for leaking user data to Cambridge Analytica.1According to Christopher Wylie, one of the co-founders of Cambridge Analytica who revealedthis issue to the public, those data were used for a range much more comprehensive thanadvertising. By modeling the users, they potentially influenced the 2016 US election of thepresident.
Compared to the incredible or even excessive use of user modeling in the informationindustry, student modeling is very insufficient. Although AutoQuiz is proved to be a helpfultutoring system, it is not as good as an experienced personal human tutor at this point. Inorder to make it more intelligent, better user modeling is almost a must. According to theAutoQuiz structure and the CS10 course curriculum, we could:
1. incorporate the labs2 into the system, so the system would have a full model of theusers;
2. make use of the particular wrong answer chosen as part of the user model. A user’sweakness might be revealed how the user incorrectly answer questions, and AutoQuizshould recommend exercises accordingly.
Adaptive Hint
According to the students’ feedback on their user experiences, students are looking for-ward to having more useful hints in the system. Our hints are often derived from the exams’answer-explanations, which we would typically hand out to students and TAs, and TAswould explain the answers more explicitly during the first discussion session following eachexam. The answers were written in such a way that as long as TAs could understand andexplain them to the class, it would be fine.
Now that students are asking for hints suitable for the tutoring system, we should treatthis requirement seriously by redesigning the hints. One of the comments from studentsstated that specific hints should be provided to each answer choice. We agree and believethat having more particular hints should help us scaffolding the students better.
Another suggestion from the students also sounds attractive while not being as easy asit seems to be: creating hints and explanations via group efforts. Crowdsourcing-hint is abrilliant idea, but would bring about the concern of what if some students paste the correctanswer directly in the hints? That’ll degrade the system’s effectiveness to other learners.
1https://www.nytimes.com/2018/03/19/technology/facebook-cambridge-analytica-explained.html
2See http://cs10.org/sp18/, the lab is an important component of CS10. During the labs, studentswrite programs with aid from TAs and LAs (teaching assistants and lab assistants).

CHAPTER 5. CONCLUSION 53
One possible solution might be ranking the hints in the order of “how well this hint helpsusers avoid making mistakes in similar questions”. That is to say: if the users seldom makethe same mistake after reading this hint, this specific hint should be considered educationaland useful. There are plenty of details to explore on improving the hint system.
Automatically-assigned Exercise Relationships
In the Discovering Exercise Relationships part mentioned by Chris Piech et al. [2], it issaid that by calculating influence factor Jij of every directed pair of exercises i and j, latentstructure or concepts in the data could be performed. Defining knowledge structure is atask that typically performed by human experts. In the current version of AutoQuiz, theknowledge structure is predefined according to previous teaching experience and hard-codedinto the system. However, if the number of exercises, as well as the number of topics wehave in the system, increase to a level that human experts could easily make mistakes tryingto process them manually, having the system automatically assign relationships, or at leasthelp human experts labeling the data by providing suggestions, would be a great idea.
Question Generation
Question Generation could be an independent topic worth investigating. Generatingquestions automatically also attracts plenty of researchers; some of them are generatingquestions using ontologies [30] [31], while some others are using existing rules of a specificfield to create questions, such as Peter Wood’s research on linguistic course’s automatic testgeneration published in 2015 [32].
In general, the question-generating issue’s bottleneck and its primary focus of today layon natural language processing: how to generate questions that make human feel comfortablereading. Previous researchers have proved the effectiveness of using templates in generatingmath questions (REGIS [7]). Those work could also be inherited to the future version ofAutoQuiz.
Programming Practice Module
CS10 midterms and finals have online parts beside the paper exams. From our observa-tion, online exams are also a source of anxiety to the students. They are almost as nervousabout the online exams as they are of the paper exams.
If we do decide to include programming practices & online midterm questions into thesystem, understanding the implementation of Snap!, even cooperating with the Snap! de-veloper team, might be an idea to investigate. Doing knowledge tracing for these exercisescould refer to the methods Lisa Wang et al. proposed [24].

CHAPTER 5. CONCLUSION 54
Gamified AutoQuiz
One potential we see from the system is that it could be more attractive if we make itmore gamified. It is not just to say something like developing an educational online videogame, such as Dragonbox [33], and it is not the same with making the educational processenjoyable and making ideas more natural to be conveyed.
What we mean is that games have some shared features that keep them attractive, evenin a way “addictive”. For example, scores, rankings, competitions, limited rewards, time-limitevents, etc. Humans are also easily attracted by the desire of collecting, see how people arekeen on Pokémon Go [34].
In fact, showing the progress bar as well as the knowledge graph has already given thestudents a similar feeling with “collecting” or “completing tasks”. If we go further into thisdirection, we believe that the system could be more appealing to the students. For example,instead of having “challenge”, we can make it a game with different levels and time limits,which might make it more challenging and exciting for students to work on.
We can also have user level system. By doing exercises correctly, they could gain experi-ence points and get level-up as EXP points accumulate. The core idea of gamified-AutoQuizis to make it more exciting and more enjoyable to use. CS10 has the tradition of beingenjoyable and is famous for its ability to stimulate students’ interests of learning. The Au-toQuiz system we have for now is quite useful, but not appealing enough. We are expectingto see more valuable strategies introduced into the system so as to attract more users, andstimulate the users’ interest.
Use Our Own Server
Pythonanywhere, whose server hosts and runs our application, for now, might not be thefinal choice of AutoQuiz. There are some apparent limits caused by the Pythonanywhereplatform, such as the strict limit of responding time3, or the invisibility of some of the logdata4.
We are not to blame Pythonanywhere for limiting our freedom as developers since theyare using the best strategy to allocate a fixed amount of resources properly to a massiveamount of users on their server. In fact, to our knowledge, all the cloud server serviceproviders have similar constraints. Therefore, the only way that we could gain adequatefreedom to access data and log, as well as freedom of occupying as much computationalresource as we like, is to set up a private server, either renting one or using an existing oneowned by the department, etc.
3Detailed requirements on time limit and possible consequences are:https://help.pythonanywhere.com/pages/ErrorReloadingWebApp/
4Detailed information is logged only when there’s a bug encountered.

55
References
[1] M. Grinberg, Flask web development: Developing web applications with python. " O’ReillyMedia, Inc.", 2018.
[2] C. Piech, J. Bassen, J. Huang, S. Ganguli, M. Sahami, L. J. Guibas, and J. Sohl-Dickstein, “Deep knowledge tracing”, in Advances in Neural Information ProcessingSystems, 2015, pp. 505–513.
[3] D. Garcia, B. Harvey, and T. Barnes, “The beauty and joy of computing”, ACM In-roads, vol. 6, no. 4, pp. 71–79, 2015.
[4] L. Vygotsky, “Zone of proximal development”, Mind in society: The development ofhigher psychological processes, vol. 5291, p. 157, 1987.
[5] B. Harvey, D. D. Garcia, T. Barnes, N. Titterton, O. Miller, D. Armendariz, J. McK-insey, Z. Machardy, E. Lemon, S. Morris, et al., “Snap!(build your own blocks)”, inProceedings of the 45th ACM technical symposium on Computer science education,ACM, 2014, pp. 749–749.
[6] D. Armendariz, Z. MacHardy, and D. D. Garcia, “Octal: Online course tool for adaptivelearning”, in Proceedings of the first ACM conference on Learning@ scale conference,ACM, 2014, pp. 141–142.
[7] A. Segars, D. Garcia, and D. Song, “Regis: A tool for building and distributing per-sonalized practice problems”, 2012.
[8] J. V. Wertsch, “The zone of proximal development: Some conceptual issues”, NewDirections for Child and Adolescent Development, vol. 1984, no. 23, pp. 7–18, 1984.
[9] M. Cole, “The zone of proximal development-where culture and cognition create eachother”, 1985.
[10] C. Conati, A. S. Gertner, K. VanLehn, and M. J. Druzdzel, “On-line student modelingfor coached problem solving using bayesian networks”, in User Modeling, Springer,1997, pp. 231–242.
[11] S. Ohlsson, “Constraint-based student modeling”, in Student modelling: The key toindividualized knowledge-based instruction, Springer, 1994, pp. 167–189.

REFERENCES 56
[12] M. Feng, N. Heffernan, and K. Koedinger, “Addressing the assessment challenge withan online system that tutors as it assesses”, User Modeling and User-Adapted Interac-tion, vol. 19, no. 3, pp. 243–266, 2009.
[13] S. Reddy, I. Labutov, and T. Joachims, “Latent skill embedding for personalized lessonsequence recommendation”, ArXiv preprint arXiv:1602.07029, 2016.
[14] A. S. Lan, A. E. Waters, C. Studer, and R. G. Baraniuk, “Sparse factor analysis forlearning and content analytics”, The Journal of Machine Learning Research, vol. 15,no. 1, pp. 1959–2008, 2014.
[15] L. Al-Shanfari, C. D. Epp, and C. Baber, “Evaluating the effect of uncertainty visu-alisation in open learner models on students’ metacognitive skills”, in InternationalConference on Artificial Intelligence in Education, Springer, 2017, pp. 15–27.
[16] B. Hidasi, A. Karatzoglou, L. Baltrunas, and D. Tikk, “Session-based recommendationswith recurrent neural networks”, ArXiv preprint arXiv:1511.06939, 2015.
[17] J. Li, M.-T. Luong, and D. Jurafsky, “A hierarchical neural autoencoder for paragraphsand documents”, ArXiv preprint arXiv:1506.01057, 2015.
[18] Y. Du, W. Wang, and L. Wang, “Hierarchical recurrent neural network for skeletonbased action recognition”, in Proceedings of the IEEE conference on computer visionand pattern recognition, 2015, pp. 1110–1118.
[19] M. Khajah, R. Wing, R. Lindsey, and M. Mozer, “Integrating latent-factor and knowledge-tracing models to predict individual differences in learning”, in Educational Data Min-ing 2014, Citeseer, 2014.
[20] M. Khajah, R. V. Lindsey, and M. C. Mozer, “How deep is knowledge tracing?”, ArXivpreprint arXiv:1604.02416, 2016.
[21] Z. MacHardy, “Applications of bayesian knowledge tracing to the curation of educa-tional videos”, 2015.
[22] M. V. Yudelson, K. R. Koedinger, and G. J. Gordon, “Individualized bayesian knowl-edge tracing models”, in International Conference on Artificial Intelligence in Educa-tion, Springer, 2013, pp. 171–180.
[23] Z. Wang, J. Zhu, X. Li, Z. Hu, and M. Zhang, “Structured knowledge tracing models forstudent assessment on coursera”, in Proceedings of the Third (2016) ACM Conferenceon Learning@ Scale, ACM, 2016, pp. 209–212.
[24] L. Wang, A. Sy, L. Liu, and C. Piech, “Learning to represent student knowledge onprogramming exercises using deep learning”, in Proceedings of the 10th InternationalConference on Educational Data Mining; Wuhan, China, 2017, pp. 324–329.
[25] J. Nielsen, “10 usability heuristics for user interface design”, Nielsen Norman Group,vol. 1, no. 1, 1995.
REFERENCES 57
[26] X. Huang, F. Peng, A. An, and D. Schuurmans, “Dynamic web log session identificationwith statistical language models”, Journal of the Association for Information Scienceand Technology, vol. 55, no. 14, pp. 1290–1303, 2004.
[27] L. Razzaq, N. T. Heffernan, M. Feng, and Z. A. Pardos, “Developing fine-grained trans-fer models in the assistment system.”, Technology, Instruction, Cognition & Learning,vol. 5, no. 3, 2007.
[28] L. Ardissono, C. Gena, P. Torasso, F. Bellifemine, A. Difino, and B. Negro, “Usermodeling and recommendation techniques for personalized electronic program guides”,in Personalized Digital Television, Springer, 2004, pp. 3–26.
[29] F. Abel, E. Herder, G.-J. Houben, N. Henze, and D. Krause, “Cross-system user mod-eling and personalization on the social web”, User Modeling and User-Adapted Inter-action, vol. 23, no. 2-3, pp. 169–209, 2013.
[30] D. Seyler, M. Yahya, and K. Berberich, “Knowledge questions from knowledge graphs”,in Proceedings of the ACM SIGIR International Conference on Theory of InformationRetrieval, ACM, 2017, pp. 11–18.
[31] K. Stasaski and M. A. Hearst, “Multiple choice question generation utilizing an on-tology”, in Proceedings of the 12th Workshop on Innovative Use of NLP for BuildingEducational Applications, 2017, pp. 303–312.
[32] P. Wood, “Automatic and semi-automatic test generation for introductory linguisticscourses using natural language processing resources and text corpora”, GSTF Journalon Education (JEd), vol. 1, no. 3, pp. 1–6, 2015.
[33] N. M. Siew, J. Geofrey, and B. N. Lee, “Students’ algebraic thinking and attitudes to-wards algebra: The effects of game-based learning using dragonbox 12+ app”, Electron.J. Math. Technol, vol. 10, no. 1, pp. 1–17, 2016.
[34] K. B. Howe, C. Suharlim, P. Ueda, D. Howe, I. Kawachi, and E. B. Rimm, “Gottacatch’em all! pokémon go and physical activity among young adults: Difference indifferences study”, Bmj, vol. 355, p. i6270, 2016.