Autophagosome Formation Depends on the Small GTPase Rab1 and Functional ER Exit Sites
16
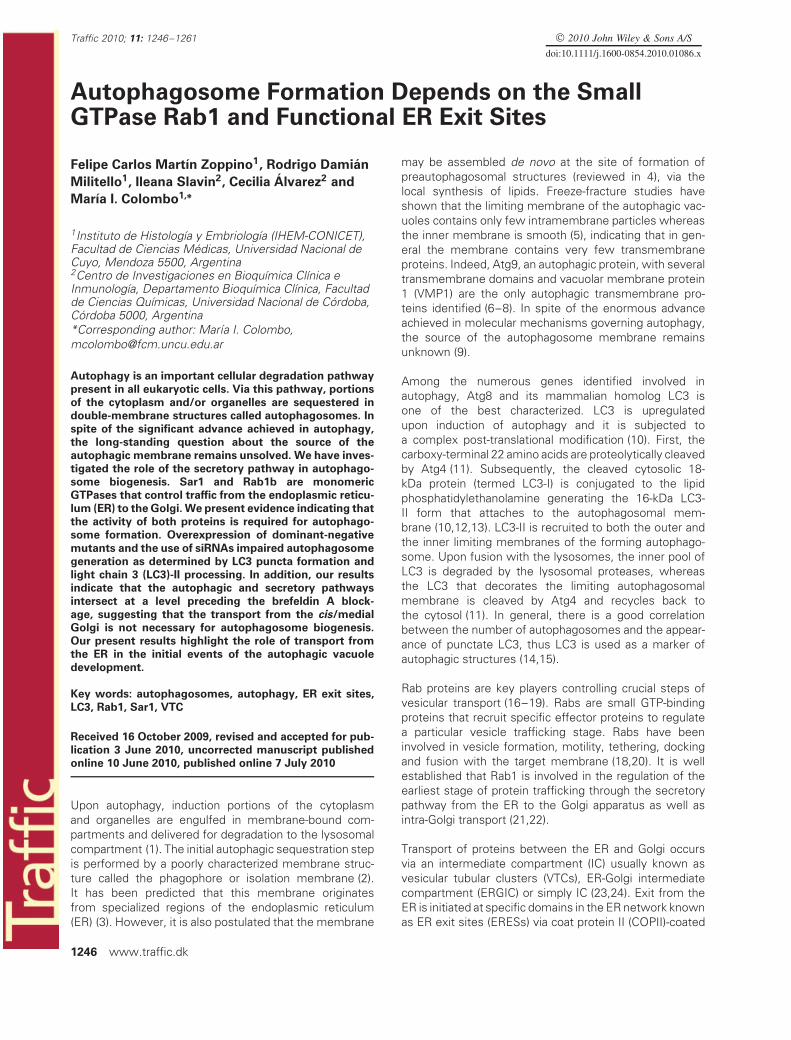
Traffic 2010; 11: 1246–1261 © 2010 John Wiley & Sons A/S doi:10.1111/j.1600-0854.2010.01086.x Autophagosome Formation Depends on the Small GTPase Rab1 and Functional ER Exit Sites Felipe Carlos Mart´ ın Zoppino 1 , Rodrigo Dami ´ an Militello 1 , Ileana Slavin 2 , Cecilia ´ Alvarez 2 and Mar´ ıa I. Colombo 1,∗ 1 Instituto de Histología y Embriología (IHEM-CONICET), Facultad de Ciencias M ´ edicas, Universidad Nacional de Cuyo, Mendoza 5500, Argentina 2 Centro de Investigaciones en Bioquímica Clínica e Inmunología, Departamento Bioquímica Clínica, Facultad de Ciencias Químicas, Universidad Nacional de C ´ ordoba, C ´ ordoba 5000, Argentina *Corresponding author: Mar ´ ıa I. Colombo, [email protected] Autophagy is an important cellular degradation pathway present in all eukaryotic cells. Via this pathway, portions of the cytoplasm and/or organelles are sequestered in double-membrane structures called autophagosomes. In spite of the significant advance achieved in autophagy, the long-standing question about the source of the autophagic membrane remains unsolved. We have inves- tigated the role of the secretory pathway in autophago- some biogenesis. Sar1 and Rab1b are monomeric GTPases that control traffic from the endoplasmic reticu- lum (ER) to the Golgi. We present evidence indicating that the activity of both proteins is required for autophago- some formation. Overexpression of dominant-negative mutants and the use of siRNAs impaired autophagosome generation as determined by LC3 puncta formation and light chain 3 (LC3)-II processing. In addition, our results indicate that the autophagic and secretory pathways intersect at a level preceding the brefeldin A block- age, suggesting that the transport from the cis/medial Golgi is not necessary for autophagosome biogenesis. Our present results highlight the role of transport from the ER in the initial events of the autophagic vacuole development. Key words: autophagosomes, autophagy, ER exit sites, LC3, Rab1, Sar1, VTC Received 16 October 2009, revised and accepted for pub- lication 3 June 2010, uncorrected manuscript published online 10 June 2010, published online 7 July 2010 Upon autophagy, induction portions of the cytoplasm and organelles are engulfed in membrane-bound com- partments and delivered for degradation to the lysosomal compartment (1). The initial autophagic sequestration step is performed by a poorly characterized membrane struc- ture called the phagophore or isolation membrane (2). It has been predicted that this membrane originates from specialized regions of the endoplasmic reticulum (ER) (3). However, it is also postulated that the membrane may be assembled de novo at the site of formation of preautophagosomal structures (reviewed in 4), via the local synthesis of lipids. Freeze-fracture studies have shown that the limiting membrane of the autophagic vac- uoles contains only few intramembrane particles whereas the inner membrane is smooth (5), indicating that in gen- eral the membrane contains very few transmembrane proteins. Indeed, Atg9, an autophagic protein, with several transmembrane domains and vacuolar membrane protein 1 (VMP1) are the only autophagic transmembrane pro- teins identified (6–8). In spite of the enormous advance achieved in molecular mechanisms governing autophagy, the source of the autophagosome membrane remains unknown (9). Among the numerous genes identified involved in autophagy, Atg8 and its mammalian homolog LC3 is one of the best characterized. LC3 is upregulated upon induction of autophagy and it is subjected to a complex post-translational modification (10). First, the carboxy-terminal 22 amino acids are proteolytically cleaved by Atg4 (11). Subsequently, the cleaved cytosolic 18- kDa protein (termed LC3-I) is conjugated to the lipid phosphatidylethanolamine generating the 16-kDa LC3- II form that attaches to the autophagosomal mem- brane (10,12,13). LC3-II is recruited to both the outer and the inner limiting membranes of the forming autophago- some. Upon fusion with the lysosomes, the inner pool of LC3 is degraded by the lysosomal proteases, whereas the LC3 that decorates the limiting autophagosomal membrane is cleaved by Atg4 and recycles back to the cytosol (11). In general, there is a good correlation between the number of autophagosomes and the appear- ance of punctate LC3, thus LC3 is used as a marker of autophagic structures (14,15). Rab proteins are key players controlling crucial steps of vesicular transport (16–19). Rabs are small GTP-binding proteins that recruit specific effector proteins to regulate a particular vesicle trafficking stage. Rabs have been involved in vesicle formation, motility, tethering, docking and fusion with the target membrane (18,20). It is well established that Rab1 is involved in the regulation of the earliest stage of protein trafficking through the secretory pathway from the ER to the Golgi apparatus as well as intra-Golgi transport (21,22). Transport of proteins between the ER and Golgi occurs via an intermediate compartment (IC) usually known as vesicular tubular clusters (VTCs), ER-Golgi intermediate compartment (ERGIC) or simply IC (23,24). Exit from the ER is initiated at specific domains in the ER network known as ER exit sites (ERESs) via coat protein II (COPII)-coated 1246 www.traffic.dk
-
Upload
independent -
Category
Documents
-
view
0 -
download
0
Transcript of Autophagosome Formation Depends on the Small GTPase Rab1 and Functional ER Exit Sites
Traffic 2010; 11: 1246–1261 © 2010 John Wiley & Sons A/S
doi:10.1111/j.1600-0854.2010.01086.x
Autophagosome Formation Depends on the SmallGTPase Rab1 and Functional ER Exit Sites
Felipe Carlos Martın Zoppino1, Rodrigo Damian
Militello1, Ileana Slavin2, Cecilia Alvarez2 and
Marıa I. Colombo1,∗
1Instituto de Histología y Embriología (IHEM-CONICET),Facultad de Ciencias Medicas, Universidad Nacional deCuyo, Mendoza 5500, Argentina2Centro de Investigaciones en Bioquímica Clínica eInmunología, Departamento Bioquímica Clínica, Facultadde Ciencias Químicas, Universidad Nacional de Cordoba,Cordoba 5000, Argentina*Corresponding author: Marıa I. Colombo,[email protected]
Autophagy is an important cellular degradation pathway
present in all eukaryotic cells. Via this pathway, portions
of the cytoplasm and/or organelles are sequestered in
double-membrane structures called autophagosomes. In
spite of the significant advance achieved in autophagy,
the long-standing question about the source of the
autophagic membrane remains unsolved. We have inves-
tigated the role of the secretory pathway in autophago-
some biogenesis. Sar1 and Rab1b are monomeric
GTPases that control traffic from the endoplasmic reticu-
lum (ER) to the Golgi. We present evidence indicating that
the activity of both proteins is required for autophago-
some formation. Overexpression of dominant-negative
mutants and the use of siRNAs impaired autophagosome
generation as determined by LC3 puncta formation and
light chain 3 (LC3)-II processing. In addition, our results
indicate that the autophagic and secretory pathways
intersect at a level preceding the brefeldin A block-
age, suggesting that the transport from the cis/medial
Golgi is not necessary for autophagosome biogenesis.
Our present results highlight the role of transport from
the ER in the initial events of the autophagic vacuole
development.
Key words: autophagosomes, autophagy, ER exit sites,
LC3, Rab1, Sar1, VTC
Received 16 October 2009, revised and accepted for pub-
lication 3 June 2010, uncorrected manuscript published
online 10 June 2010, published online 7 July 2010
Upon autophagy, induction portions of the cytoplasmand organelles are engulfed in membrane-bound com-partments and delivered for degradation to the lysosomalcompartment (1). The initial autophagic sequestration stepis performed by a poorly characterized membrane struc-ture called the phagophore or isolation membrane (2).It has been predicted that this membrane originatesfrom specialized regions of the endoplasmic reticulum(ER) (3). However, it is also postulated that the membrane
may be assembled de novo at the site of formation ofpreautophagosomal structures (reviewed in 4), via thelocal synthesis of lipids. Freeze-fracture studies haveshown that the limiting membrane of the autophagic vac-uoles contains only few intramembrane particles whereasthe inner membrane is smooth (5), indicating that in gen-eral the membrane contains very few transmembraneproteins. Indeed, Atg9, an autophagic protein, with severaltransmembrane domains and vacuolar membrane protein1 (VMP1) are the only autophagic transmembrane pro-teins identified (6–8). In spite of the enormous advanceachieved in molecular mechanisms governing autophagy,the source of the autophagosome membrane remainsunknown (9).
Among the numerous genes identified involved inautophagy, Atg8 and its mammalian homolog LC3 isone of the best characterized. LC3 is upregulatedupon induction of autophagy and it is subjected toa complex post-translational modification (10). First, thecarboxy-terminal 22 amino acids are proteolytically cleavedby Atg4 (11). Subsequently, the cleaved cytosolic 18-kDa protein (termed LC3-I) is conjugated to the lipidphosphatidylethanolamine generating the 16-kDa LC3-II form that attaches to the autophagosomal mem-brane (10,12,13). LC3-II is recruited to both the outer andthe inner limiting membranes of the forming autophago-some. Upon fusion with the lysosomes, the inner pool ofLC3 is degraded by the lysosomal proteases, whereasthe LC3 that decorates the limiting autophagosomalmembrane is cleaved by Atg4 and recycles back tothe cytosol (11). In general, there is a good correlationbetween the number of autophagosomes and the appear-ance of punctate LC3, thus LC3 is used as a marker ofautophagic structures (14,15).
Rab proteins are key players controlling crucial steps ofvesicular transport (16–19). Rabs are small GTP-bindingproteins that recruit specific effector proteins to regulatea particular vesicle trafficking stage. Rabs have beeninvolved in vesicle formation, motility, tethering, dockingand fusion with the target membrane (18,20). It is wellestablished that Rab1 is involved in the regulation of theearliest stage of protein trafficking through the secretorypathway from the ER to the Golgi apparatus as well asintra-Golgi transport (21,22).
Transport of proteins between the ER and Golgi occursvia an intermediate compartment (IC) usually known asvesicular tubular clusters (VTCs), ER-Golgi intermediatecompartment (ERGIC) or simply IC (23,24). Exit from theER is initiated at specific domains in the ER network knownas ER exit sites (ERESs) via coat protein II (COPII)-coated
1246 www.traffic.dk

Autophagosomes and ER Exit Sites
transport carriers (reviewed in 25–27). COPII vesicularcarriers deliver cargo from ERES to the stationary ERGICclusters and then COPI-coated vesicles bud from this com-partment to deliver material to the cis Golgi compartment(reviewed in 28). Coat protein I (COPI) vesicles are alsoresponsible for retrograde transport back to the ER, fromthe ERGIC and the Golgi. It has been shown that Rab1functions in COPI recruitment (29), thus it is likely involvedin COPI-mediated events. Furthermore, a role for Rab1 inexit from the ER has also been suggested (30), raising thepossibility that this GTPase may participate in vesiculartransport steps other than the well-established traffickingfrom the IC to the Golgi and intracisternae. Indeed, anovel pathway connecting the IC with the cell peripherythat bypasses the Golgi has been recently described (31).
Here, we report that two well-known proteins of the secre-tory pathway, Sar1 and Rab1, are required for autophago-some formation, under starvation or rapamycin treatment.Furthermore, Rab1b-labeled vesicles, distributed periph-erally from the Golgi perinuclear area, colocalize with theautophagy protein LC3 upon induction of autophagy.
Results
Sar1, the GTPase required for export from the ER,
is required for autophagosome formation
The initial events in the secretory pathway correspondto the formation of vesicles emerging from special-ized sites of the ER known as ‘ERES’. ERES formationdepends on the action of the small GTPase Sar1 (32). Ithas been shown that overexpression of the dominant-negative mutant Sar1 T39N (GDP-bound form) blocksERES formation with the consequent disorganization ofthe secretory pathway (33). Furthermore, overexpressionof the GTPase-defective mutant Sar1 H79G (GTP-boundform) allows the development of ERES, but the transportto the Golgi apparatus is blocked because this mutantinhibits COPII coat dissociation (34–37). To determinewhether autophagosome formation requires the initialevents of the secretory pathway, we inhibited ER exitby overexpression of Sar1 mutants. To evaluate cellularautophagy, Chinese hamster ovary (CHO) cells coexpress-ing GFP-LC3 and either Sar1 wt or the mutants Sar1 H79Gor Sar1 T39N were incubated for 2 h in starvation mediumto stimulate autophagy. In addition, bafilomycin A1, anH+-ATPase inhibitor that blocks autophagosome degra-dation leading to its accumulation (38,39), was added tothe starvation medium. The effect of overexpression ofSar1 and its mutants in the secretory pathway was eval-uated by analysis of the Golgi morphology, using Rab6as a Golgi marker (40). As expected, in CHO cells over-expressing Sar1 wt, the Golgi apparatus localized nearto the nucleus and presented a compact distribution(Figure 1A, panel b). In contrast, the expression of Sar1H79G or Sar1 T39N induced Golgi fragmentation as indi-cated by Rab6 dispersion (Figure 1A, cells marked withasterisks in panels e and h). Autophagosome formationwas determined, by confocal microscopy, analyzing the
distribution of GFP-LC3, a well-characterized method usedto visualize autophagosomes (14,15). In CHO cells over-expressing Sar1 wt, GFP-LC3 was observed as dots,representing the accumulation of a membrane-bound formof LC3 onto autophagic vacuoles (Figure 1A, arrowheadsin panel c). Interestingly, in cells overexpressing Sar1T39N or Sar1 H79G, GFP-LC3 distribution showed a cyto-plasmic pattern (as well as some nuclear localization),indicating a limited formation of autophagosomes or alack of them (Figure 1A, panels f and i). This inhibition inLC3-dot formation is clearly shown by quantification asdepicted in Figure 1B. Similar to the results obtained withoverexpressed GFP-LC3, the distribution of endogenousLC3 showed a cytoplasmic pattern in cells overexpress-ing the Sar1 mutants (Figure 1C). Taken together, thesedata suggest that a functional Sar1, a well-known proteinrequired for the initial steps in the secretory pathway, isnecessary for autophagosome formation.
To confirm the requirement for Sar1 function in theautophagy pathway, the levels of this protein were down-regulated. HeLa cells were transfected with a smallinterfering RNA (siRNA) for Sar1a (siRNA Sar1a) or witha non-related siRNA (siRNA NR) as control. After 48 h oftreatment with the siRNA, cells were transfected withthe pEGFP-LC3 plasmid to monitor autophagosome for-mation. The effect of siRNA was evaluated 72 h aftersiRNA transfection, at this time the cells were treated for2 h with the autophagy stimulatory compound rapamycinand with NH4Cl to accumulate the autophagosomesformed (41). Upon autophagy activation, LC3 is processedfrom the cytosolic form (LC3-I) to the membrane-boundform (LC3-II) (10). Therefore, autophagy can be monitoredby the conversion of GFP-LC3-I to GFP-LC3-II, which canbe detected by immunoblotting as LC3-II migrates fasterthan GFP-LC3-I during SDS–PAGE (42). The levels of theproteins Sar1, GFP-LC3-I, GFP-LC3-II and tubulin weredetermined by western blot analysis. In the cells treatedwith the siRNA Sar1a, a marked decrease in Sar1 pro-tein was observed compared with the control conditionsiRNA NR (Figure 2A). The intensity of the Sar1 bands wasquantified and then normalized against the intensity of thetubulin bands. In the siRNA Sar1a treatment, the level ofSar1 protein was at least three times lower than the con-trol (Figure 2B). Sar1a depletion was functionally effectiveas it induced Golgi disruption (Figure 2C), indicated by theGolgi marker GM130 (43). We hypothesize that if Sar1is involved in the formation of autophagic vacuoles, theLC3 modification should be inhibited by knockdown ofSar1. As expected, the processing of LC3-I to LC3-II wasdecreased in cells treated with siRNA Sar1a comparedwith the control (Figure 2A). The percentage of GFP-LC3-IIconversion (measured as the intensity of GFP-LC3-II banddivided by the total intensity of GFP-LC3-II plus GFP-LC3-I)showed a decrease of 50% compared with the conver-sion percentage in the control condition (Figure 2D). Wenext assessed the effect of depleting both Sar1 isoforms(i.e. Sar1a and Sar1b) at the same time. In this case, thelevels of endogenous LC3-II were detected by western
Traffic 2010; 11: 1246–1261 1247

Zoppino et al.
DsRed mergeGM130 LC3
a b c d
Sar
1 w
t
Sar1 Rab6 GFP-LC3
a
g
d
h i
e f
cb
*
**
Sar1 wt
Sar1 H79G
Sar1 T39N
A
C
0
0.25
0.5
0.75
1
Sar1wt
Sar1T39N
Sar1H79G
LC3
dots
per
cel
l (r
elat
ive
units
)
B
Sar
1 H
79G
Sar
1 T
39N
i j k l
e f g h
Figure 1: Overexpression of either Sar1 H79G or Sar1 T39N mutant proteins results in inhibition of autophagosome formation.A) CHO cells were transiently cotransfected with pEGFP-LC3 and the bicistronic plasmid pIRES-DsRed2, encoding either Sar1 wt, theGTPase-defective H79G, or the dominant-negative mutant T39N. At 24 h post-transfection, the cells were incubated for 2 h in starvationmedium plus 100 nM bafilomycin A1. Cells were fixed and immunostained for endogenous Rab6 (used as a Golgi marker). Arrowheadsindicate autophagosomes, asterisks show a dispersed Golgi. Scale bar represents 10 μm. Images are representative of at least threeindependent experiments. B) Quantification of LC3 dots from similar experiments to panel (A). The data evaluated correspond tothree independent experiments. C) HeLa cells were transiently transfected with the bicistronic plasmid pIRES-DsRed2 encoding eitherSar1 wt, Sar1 H79G or Sar1 T39N. After 24 h of transfection, cells were incubated as indicated in panel (A). Cells were fixed andimmunostained for GM130 (Golgi marker) and for endogenous LC3. Arrowheads indicate autophagosomes. Delineated areas point outtransfected cells. In cells overexpressing Sar1 H79G or Sar1 T39N, note the dispersion of the Golgi apparatus (f and j) and the cytosolicLC3 pattern (g and k). Scale bars represent 10 μm.
1248 Traffic 2010; 11: 1246–1261

Autophagosomes and ER Exit Sites
C
siRNA Sar1asiRNA NR
GM130 Hoechst GM130 Hoechsta b
D
% o
f GF
P-L
C3
II c
onve
rsio
n
siRNA NRsiRNA Sar1a
0
100
50
Tubulin
Sar1
GFP-LC3 IGFP-LC3 II
siRNANR
siRNASar1
A
Sar
1 pr
otei
n le
vel
siRNA NRsiRNA Sar1a
0
1
0.5
B
Figure 2: Knockdown of Sar1 decreases autophagosome
formation. HeLa cells were subjected to a knockdown treatmentwith either a non-related siRNA (siRNA NR) (as a control) or withan siRNA for Sar1 (siRNA Sar1a) for 72 h. Twenty-four hoursbefore subjecting the cells to the autophagic stimulus, they weretransfected with a plasmid encoding GFP-LC3. Subsequently, thecells were subjected to 50 μg/mL rapamycin and 30 mM NH4Cltreatment for 2 h. Several analyses were performed as indicatedbelow. A) Immunoblot analyses were carried out to detect tubulin(used as a loading control), Sar1, GFP-LC3-I and GFP-LC3-II, withthe corresponding primary antibodies. B) Levels of Sar1 proteinafter siRNA treatment. The intensity of the Sar1 bands from panel(A) was measured and normalized against the respective intensityof the tubulin bands. The data are shown relative to siRNA NRintensity value. C) Morphology of the Golgi apparatus. (panelsa and b). GM130, used as a Golgi marker, was detected byindirect immunofluorescence. Nuclear staining was performedwith Hoechst. Scale bar represents 10 μm. D) Percentage ofGFP-LC3-II conversion measured as the intensity of GFP-LC3-IIrelative to the total intensity of the GFP-LC3 (sum of I and IIbands). The measurements were normalized against the tubulinbands in panels (B) and (C). The results are representative of atleast two independent experiments.
blot. HeLa cells were transfected with both siRNAs andafter 48 h the cells were incubated in starvation mediumplus bafilomycin A1 to favor autophagosome accumula-tion. As shown in Figure S1A,B, a marked decrease inLC3-II accumulation was observed.
These data show that the capacity to form autophago-somes in Sar1 knockdown cells is markedly hinderedand confirm the requirement for Sar1 in the autophagicpathway.
The autophagosomes colocalize with the GTPase
Rab1b
The above results indicate that Sar1 is required forautophagosome formation and given that Sar1 is a compo-nent of the early events of the secretory pathway, we won-dered whether Rab1b, another regulatory protein involved
in the early stages of secretory pathway, also affectsautophagosome formation. The small GTPase Rab1b actsdownstream of Sar1 and controls the anterograde trans-port from the ER to the Golgi apparatus (22). To examinethe role of Rab1 in autophagy, confocal microscopy anal-yses were performed and the intracellular distribution ofRab1b and RFP-LC3 was analyzed in cells cotransfectedwith RFP-LC3 and different Rab1 constructs. CHO cellsoverexpressing GFP-Rab1b wt or the mutant GFP-Rab1bQ67L (GTPase deficient) were incubated in starvationmedium to stimulate autophagy. As shown in Figure 3A,GFP-Rab1b wt and GFP-Rab1 Q67L were observed inautophagic structures labeled with RFP-LC3 as disperseddots in the cytoplasm (Figure 3A). Comparable resultswere observed when endogenous LC3 was analyzed inCHO cells expressing either GFP-Rab1 wt or GFP-Rab1bQ67L; in both cases, colocalization with LC3 was observed(Figure 3B). After 2 h of incubation in complete mediumor in starvation conditions, we quantified the percentageof LC3 puncta structures colocalizing with GFP-Rab1b wt.Our results show a significant increase when cells werestarved (38%) versus cells incubated in complete medium(13%) (Figure 3C). The extent of colocalization in CHO cellsoverexpressing GFP-Rab1b Q67L was 29% in cells incu-bated in full nutrient media and slightly higher (35%) understarvation conditions (Figure 3C). We also analyzed bytime-lapse microscopy the association between LC3 andRab1. For this purpose, cells overexpressing GFP-Rab1wt or GFP-Rab1 Q76L were cotransfected with RFP-LC3(Video S1). The rapid movement of numerous colabeledvesicles was clearly visualized. As depicted in Figure 3C,the vesicles remained colabeled by both markers duringthe observation period.
When cells were subjected to starvation in the pres-ence of bafilomycin A1, the colocalization of GFP-Rab1bwt or GFP-Rab1b Q67L with endogenous LC3 notablyincreased, with the concomitant increase in the size of thelabeled structures (Figure 4A, arrowheads in panels c andf). Similarly, when CHO cells overexpressing GFP-Rab1bQ67L were treated with nocodazole, another inhibitor ofautophagosome maturation by means of blocking micro-tubule polymerization (44), an extensive colocalization ofGFP-Rab1b Q67L and endogenous LC3 was observed(Figure 4B, arrowheads in panel c). Taken together, theseresults indicate that conditions that led to accumulationof autophagosomal structures cause a marked increase inthe colocalization between Rab1 and LC3, suggesting thatRab1 is involved in this pathway.
Maturation properties of the punctate peripheral
GFP-Rab1b compartments
The results presented above indicate that a fractionof the structures marked with Rab1b localized withautophagosomes. The mature autophagosomes are acidicorganelles that subsequently fuse with lysosomes gener-ating autolysosomes capable to degrade the sequesteredmaterial. To assess the degree of maturation of thestructures labeled with GFP-Rab1b, we evaluated the
Traffic 2010; 11: 1246–1261 1249

Zoppino et al.
T 0ms T 4min T 8min T 12min T 16min T 20min T 24min T 40min
T 0ms T 1min 0s 156ms T 3min 30s 172ms T 7min 30s 203ms T 11min 30s 218ms
C
% o
f GF
P-R
ab1b
/LC
3 co
loca
lizat
ion
0
20
40
60
80
GFP-Rab1bWT
GFP-Rab1bQ67L
controlstarvation
*
GFP-Rab1b Q67LGFP-Rab1b WTst
arva
tion
GFP-Rab1GFP-Rab1RFP-LC3RFP-LC3
GFP-Rab1GFP-Rab1RFP-LC3RFP-LC3
star
vatio
nst
arva
tion
B
GFP-Rab1b Q67L mergeLC3
GFP-Rab1b WT mergeLC3
A
D
wt
Q67
L
Figure 3: GFP-Rab1 localizes in autophago-
somes marked with either RFP-LC3 or
endogenous LC3. A) Confocal microscopeimages of CHO cells overexpressing tran-siently RFP-LC3 and either GFP-Rab1b wt orGFP-Rab1b Q67L. After 48 h of transfectionwith the corresponding plasmids, cells weresubjected to starvation for 2 h. Note the punc-tate areas of colocalization in yellow. Insetsshow colocalization details. Scale bar rep-resents 10 μm. B) Immunofluorescence ofendogenous LC3 in CHO cells overexpress-ing GFP-Rab1b wt or GFP-Rab1b Q67L. Cellswere incubated in starvation medium for 2 h,fixed, immunostained for LC3 and then ana-lyzed by confocal microscopy. Note the colo-calization in dot-like structures shown in detailin the insets. Scale bar represents 10 μm.C) Quantitative analysis of the colocalizationbetween GFP-Rab1b and endogenous LC3.The assays were performed as described inpanel (B). The percentage of LC3-positive dotscolocalizing with GFP-Rab1 was determined.The control condition corresponds to incu-bation in complete medium. Data representmean ± SEM of three independent exper-iments. Asterisk denotes significance levelof p < 0.01. D) Stably transfected CHO cellsoverexpressing either GFP-Rab1b wt or GFP-Rab1b Q67L were transfected with RFP-LC3.After 24–48 h, the cells were placed in star-vation media and immediately analyzed bytime-lapse confocal microscopy. Frames cor-responding to the vesicles are depicted inVideo S1. Arrowheads indicate selected rep-resentative vesicles colabeled by GFP-Rab1and RFP-LC3. Scale bars represent 1 μm.
acidic characteristics, the presence of lysosomal enzymesand the degradative activity of these structures. CHOcells overexpressing GFP-Rab1b wt or GFP-Rab1b Q67Lwere labeled in vivo with the acidotrophic fluorescentstain LysoTracker Red and analyzed by confocal scan-ning microscopy. In cells overexpressing GFP-Rab1b wtincubated under full nutrient conditions, the punctatestructures practically did not colocalize with LysoTracker(Figure 5A, panel a), whereas an important colocalization
was observed in cells subjected to starvation conditions(Figure 5A, panel b). In cells overexpressing GFP-Rab1bQ67L either in control or starvation conditions, a largemajority of the peripheral GFP-Rab1b Q67L dots wereacidic (Figure 5A, panels d and e). Quantification of colocal-ization indicates that in control conditions 11% of the acidicstructures were marked with GFP-Rab1b (Figure 5B),whereas in cells subjected to starvation the value reached62%. In the case of CHO cells overexpressing GFP-Rab1b
1250 Traffic 2010; 11: 1246–1261
Autophagosomes and ER Exit Sites
a b
fe
c
d
GFP-Rab1b mergeLC3w
tQ
67L
starvation + bafilomycin A1
GFP-Rab1b Q67L
a
GFP-Rab1b Q67LRFP-LC3
c
RFP-LC3
b
A
B starvation + nocodazole
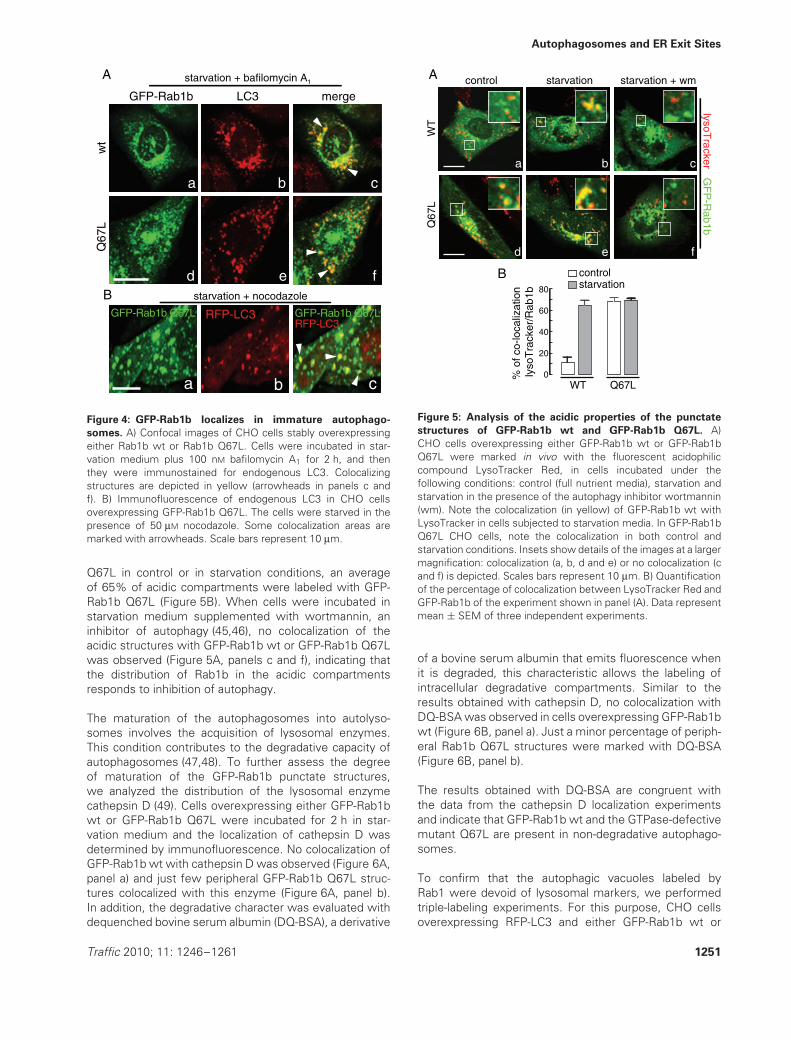
Figure 4: GFP-Rab1b localizes in immature autophago-
somes. A) Confocal images of CHO cells stably overexpressingeither Rab1b wt or Rab1b Q67L. Cells were incubated in star-vation medium plus 100 nM bafilomycin A1 for 2 h, and thenthey were immunostained for endogenous LC3. Colocalizingstructures are depicted in yellow (arrowheads in panels c andf). B) Immunofluorescence of endogenous LC3 in CHO cellsoverexpressing GFP-Rab1b Q67L. The cells were starved in thepresence of 50 μM nocodazole. Some colocalization areas aremarked with arrowheads. Scale bars represent 10 μm.
Q67L in control or in starvation conditions, an averageof 65% of acidic compartments were labeled with GFP-Rab1b Q67L (Figure 5B). When cells were incubated instarvation medium supplemented with wortmannin, aninhibitor of autophagy (45,46), no colocalization of theacidic structures with GFP-Rab1b wt or GFP-Rab1b Q67Lwas observed (Figure 5A, panels c and f), indicating thatthe distribution of Rab1b in the acidic compartmentsresponds to inhibition of autophagy.
The maturation of the autophagosomes into autolyso-somes involves the acquisition of lysosomal enzymes.This condition contributes to the degradative capacity ofautophagosomes (47,48). To further assess the degreeof maturation of the GFP-Rab1b punctate structures,we analyzed the distribution of the lysosomal enzymecathepsin D (49). Cells overexpressing either GFP-Rab1bwt or GFP-Rab1b Q67L were incubated for 2 h in star-vation medium and the localization of cathepsin D wasdetermined by immunofluorescence. No colocalization ofGFP-Rab1b wt with cathepsin D was observed (Figure 6A,panel a) and just few peripheral GFP-Rab1b Q67L struc-tures colocalized with this enzyme (Figure 6A, panel b).In addition, the degradative character was evaluated withdequenched bovine serum albumin (DQ-BSA), a derivative
control starvation starvation + wm
WT
Q67
L
% o
f co-
loca
lizat
ion
lyso
Tra
cker
/Rab
1b
0
20
40
60
80
WT Q67L
controlstarvation
A
B
lysoTracker G
FP
-Rab1b
a
fed
cb
Figure 5: Analysis of the acidic properties of the punctate
structures of GFP-Rab1b wt and GFP-Rab1b Q67L. A)CHO cells overexpressing either GFP-Rab1b wt or GFP-Rab1bQ67L were marked in vivo with the fluorescent acidophiliccompound LysoTracker Red, in cells incubated under thefollowing conditions: control (full nutrient media), starvation andstarvation in the presence of the autophagy inhibitor wortmannin(wm). Note the colocalization (in yellow) of GFP-Rab1b wt withLysoTracker in cells subjected to starvation media. In GFP-Rab1bQ67L CHO cells, note the colocalization in both control andstarvation conditions. Insets show details of the images at a largermagnification: colocalization (a, b, d and e) or no colocalization (cand f) is depicted. Scales bars represent 10 μm. B) Quantificationof the percentage of colocalization between LysoTracker Red andGFP-Rab1b of the experiment shown in panel (A). Data representmean ± SEM of three independent experiments.
of a bovine serum albumin that emits fluorescence whenit is degraded, this characteristic allows the labeling ofintracellular degradative compartments. Similar to theresults obtained with cathepsin D, no colocalization withDQ-BSA was observed in cells overexpressing GFP-Rab1bwt (Figure 6B, panel a). Just a minor percentage of periph-eral Rab1b Q67L structures were marked with DQ-BSA(Figure 6B, panel b).
The results obtained with DQ-BSA are congruent withthe data from the cathepsin D localization experimentsand indicate that GFP-Rab1b wt and the GTPase-defectivemutant Q67L are present in non-degradative autophago-somes.
To confirm that the autophagic vacuoles labeled byRab1 were devoid of lysosomal markers, we performedtriple-labeling experiments. For this purpose, CHO cellsoverexpressing RFP-LC3 and either GFP-Rab1b wt or
Traffic 2010; 11: 1246–1261 1251

Zoppino et al.
B
A
GFP-Rab1b Q67LDQ-BSA
ba
GFP-Rab1b wtDQ-BSA
GFP-Rab1b Q67Lcathepsin D
b
GFP-Rab1b wtcathepsin D
a
Figure 6: The punctate Rab1b-positive structures are imma-
ture: they do not possess hydrolytic enzymes nor degrada-
tive capacity. CHO cells overexpressing either GFP-Rab1b wt orGFP-Rab1b Q67L were incubated in starvation medium for 2 h.A) Immunofluorescence for the lysosomal enzyme cathepsin D.Note that only a few compartments labeled with cathepsin Dcolocalized with GFP-Rab1b Q67L in starved cells (insets in panelb). B) Confocal images of in vivo labeling of degradative com-partments with DQ-BSA as described in Materials and Methods.Only a small amount of the peripheric structures of Rab1b Q67Lwere marked with DQ-BSA in starved cells (insets in panel b).Scale bar represents 10 μm.
GFP-Rab1b Q67L were incubated in control or starva-tion medium for 2 h and cathepsin D was detected byindirect immunofluorescence. As shown in the imagesdepicted (Figure S2), the large majority of the vesi-cles colabeled by LC3 and Rab1 (arrowheads) werenot labeled by the lysosomal enzyme. Quantificationof the data indicates that only 10–20% of the vesi-cles were positively labeled for all three markers (datanot shown). One example of a triple-labeled vesicle isshown in the inset (panels m–p). No major differenceswere observed in cells overexpressing either Rab1wt orthe GTPase-deficient mutant Rab1Q67L. Likewise verylimited colocalization with cathepsin D was observedin both control and starvation conditions (not shown).These data indicate that the Rab1-labeled autophagicvacuoles mostly represent autophagosomes rather thanautolysosomes.
Overexpression of Rab1b increases the number of
autophagosomes
An unexpected result was observed in GFP-Rab1b-overexpressing CHO cells, as we detected the presence
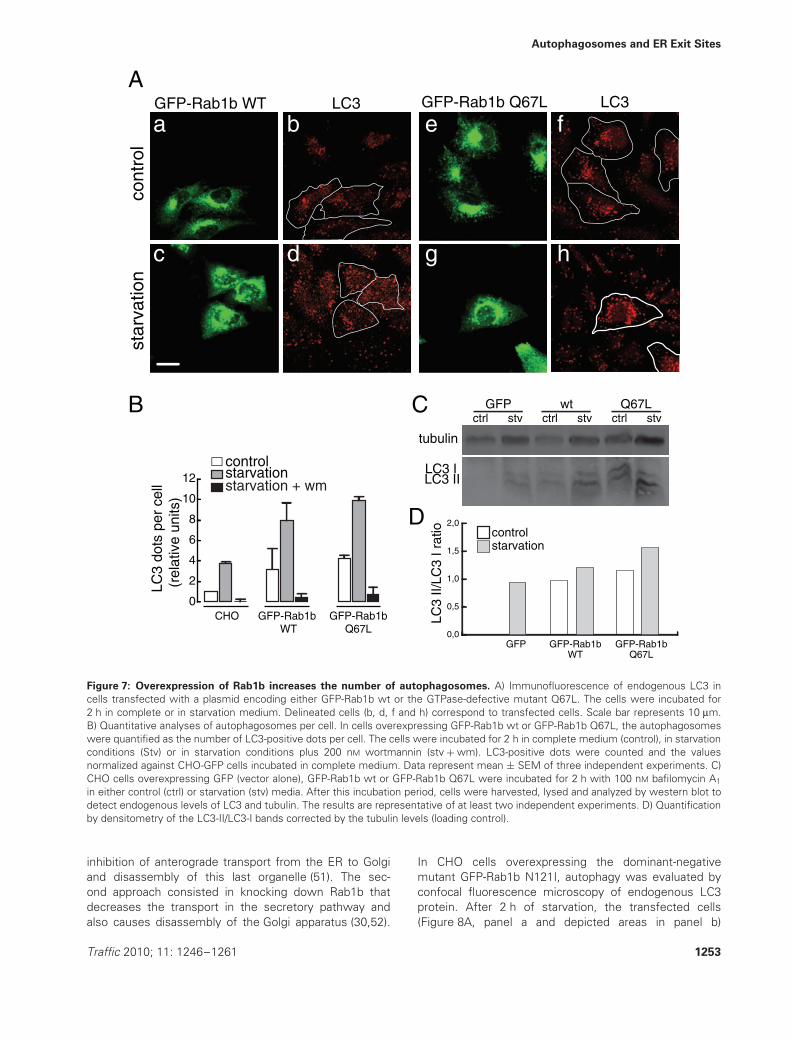
of autophagosomes even in the control condition (i.e.full nutrient media) (Figure 3C). Therefore, we decided toevaluate whether overexpression of GFP-Rab1b affectsautophagosome formation. For this purpose, autophagywas evaluated, analyzing the distribution of endogenousLC3 by immunofluorescence, in CHO cells overexpressingeither GFP-Rab1b wt or the GTPase-defective mutant.In cells overexpressing GFP-Rab1b wt, the number ofautophagosomes in control and starvation conditions washigher than in non-transfected cells (Figure 7A, delineatedareas in panels b and d). The same situation was observedin GFP-Rab1b Q67L-overexpressing cells (Figure 7A,delineated areas in panels f and h). In all cases, the numberof autophagosomes was even higher in starvation than incontrol conditions. The quantification of autophagosomeswas determined by counting the endogenous LC3-positivedots per cell and the values were normalized against thevalue obtained in CHO-green fluorescent protein (GFP)cells (as control) incubated in complete medium. GFP-Rab1b wt- or GFP-Rab1b Q67L-overexpressing cells inthe control condition showed an average increase of4.7 times with respect to the control (Figure 7B). Understarvation, the number of LC3-positive dots in GFP-Rab1b wt- or GFP-Rab1b Q67L-overexpressing CHO cellsincreased by an average of 2.36 times compared withthe value of CHO-GFP cells (Figure 7B). Treatment withthe autophagy inhibitor wortmannin caused a decreasein autophagosome numbers in all cells and treatments(Figure 7B). Taking together, these data suggest thatGFP-Rab1b overexpression promotes autophagosomeformation. This process was sensitive to wortmannin,indicating that the process depends on the regulatoryactivity of a phosphatidylinositol (PI)3 kinase, as previouslyshown for several autophagy responses (45,46).
To determine whether the overexpression of eitherRab1wt or the mutant Q67L affects autophagosomeformation or maturation, the amount of endogenous LC3-IIwas analyzed. For this purpose, the levels of LC3-IIwere determined by western blot in cells incubated inthe presence of bafilomycin A, an inhibitor of proteindegradation (50). As shown in Figure 7C,D, an increasein LC3-II accumulation was observed in both control andstarvation conditions. No major differences were observedin cells overexpressing GFP-Rab1wt or the GTPase-deficient mutant. As there is a significant buildup ofLC3-II in the presence of bafilomycin A1 even in controls,our data correlate with an enhanced autophagosomesynthesis (50).
Loss of function of Rab1 decreases autophagosome
formation
To obtain further knowledge about the role of Rab1bin autophagy, loss-of-function experiments were per-formed. Two different approaches with well-knowneffects in the secretory pathway were used. First, inhibit-ing Rab1 function by means of transient overexpres-sion of the dominant-negative mutant GFP-Rab1b N121I(nucleotide empty form). This mutant causes a potent
1252 Traffic 2010; 11: 1246–1261
Autophagosomes and ER Exit Sites
0,0
0,5
1,0
1,5
2,0
GFP GFP-Rab1bWT
GFP-Rab1bQ67L
LC3
II/LC
3 I r
atio control
starvation
tubulin
LC3 ILC3 II
ctrl stvGFP
ctrl stvwt
ctrl stvQ67L
LC
3 do
ts p
er c
ell
(rel
ativ
e un
its)
0
2
4
6
8
10
12controlstarvationstarvation + wm
GFP-Rab1b Q67L LC3A
star
vatio
n
GFP-Rab1b WT LC3
cont
rol
a
d hc
feb
g
CHO GFP-Rab1b WT
GFP-Rab1bQ67L
D
CB
Figure 7: Overexpression of Rab1b increases the number of autophagosomes. A) Immunofluorescence of endogenous LC3 incells transfected with a plasmid encoding either GFP-Rab1b wt or the GTPase-defective mutant Q67L. The cells were incubated for2 h in complete or in starvation medium. Delineated cells (b, d, f and h) correspond to transfected cells. Scale bar represents 10 μm.B) Quantitative analyses of autophagosomes per cell. In cells overexpressing GFP-Rab1b wt or GFP-Rab1b Q67L, the autophagosomeswere quantified as the number of LC3-positive dots per cell. The cells were incubated for 2 h in complete medium (control), in starvationconditions (Stv) or in starvation conditions plus 200 nM wortmannin (stv + wm). LC3-positive dots were counted and the valuesnormalized against CHO-GFP cells incubated in complete medium. Data represent mean ± SEM of three independent experiments. C)CHO cells overexpressing GFP (vector alone), GFP-Rab1b wt or GFP-Rab1b Q67L were incubated for 2 h with 100 nM bafilomycin A1
in either control (ctrl) or starvation (stv) media. After this incubation period, cells were harvested, lysed and analyzed by western blot todetect endogenous levels of LC3 and tubulin. The results are representative of at least two independent experiments. D) Quantificationby densitometry of the LC3-II/LC3-I bands corrected by the tubulin levels (loading control).
inhibition of anterograde transport from the ER to Golgiand disassembly of this last organelle (51). The sec-ond approach consisted in knocking down Rab1b thatdecreases the transport in the secretory pathway andalso causes disassembly of the Golgi apparatus (30,52).
In CHO cells overexpressing the dominant-negativemutant GFP-Rab1b N121I, autophagy was evaluated byconfocal fluorescence microscopy of endogenous LC3protein. After 2 h of starvation, the transfected cells(Figure 8A, panel a and depicted areas in panel b)
Traffic 2010; 11: 1246–1261 1253
Zoppino et al.
B
0
2
4
control
GFP-Rab1b N121I
3
1
GFP
56
GFP-Rab1 N121I LC3A
*
*
*
*
b
c
a
d
GFP-Rab1b I121N GM130 RFP-LC3
HaC
at
Vero
**
*
*
*a
fd e
cb
C
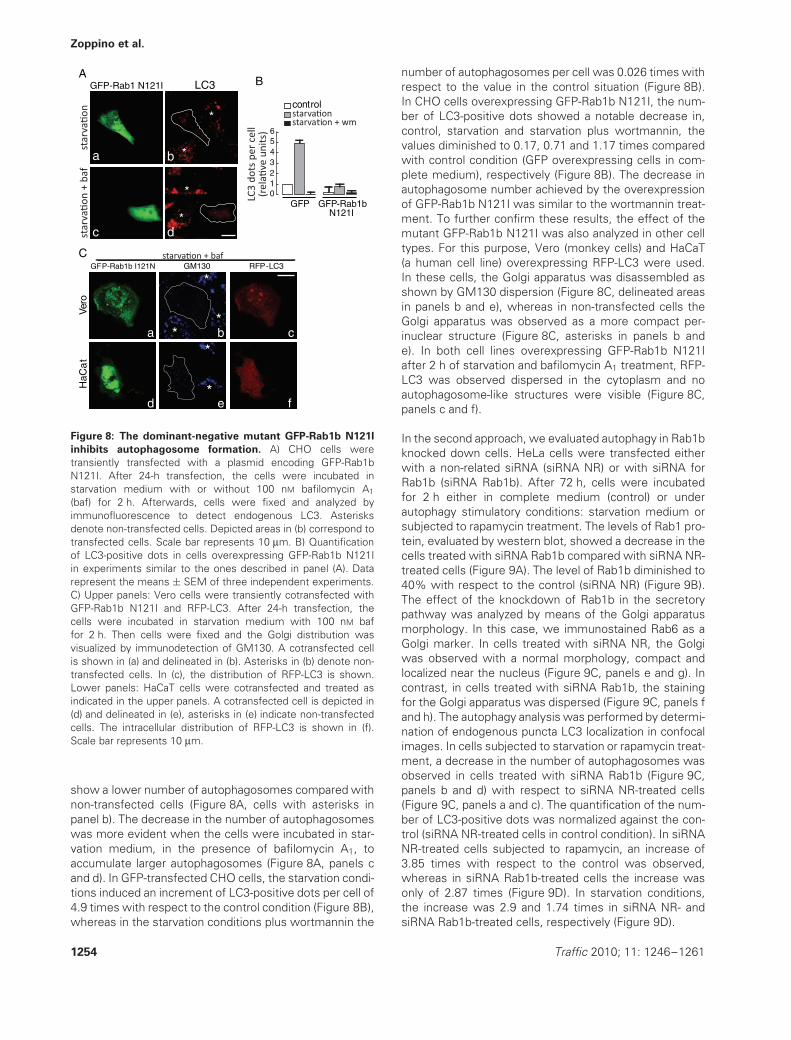
Figure 8: The dominant-negative mutant GFP-Rab1b N121I
inhibits autophagosome formation. A) CHO cells weretransiently transfected with a plasmid encoding GFP-Rab1bN121I. After 24-h transfection, the cells were incubated instarvation medium with or without 100 nM bafilomycin A1
(baf) for 2 h. Afterwards, cells were fixed and analyzed byimmunofluorescence to detect endogenous LC3. Asterisksdenote non-transfected cells. Depicted areas in (b) correspond totransfected cells. Scale bar represents 10 μm. B) Quantificationof LC3-positive dots in cells overexpressing GFP-Rab1b N121Iin experiments similar to the ones described in panel (A). Datarepresent the means ± SEM of three independent experiments.C) Upper panels: Vero cells were transiently cotransfected withGFP-Rab1b N121I and RFP-LC3. After 24-h transfection, thecells were incubated in starvation medium with 100 nM baffor 2 h. Then cells were fixed and the Golgi distribution wasvisualized by immunodetection of GM130. A cotransfected cellis shown in (a) and delineated in (b). Asterisks in (b) denote non-transfected cells. In (c), the distribution of RFP-LC3 is shown.Lower panels: HaCaT cells were cotransfected and treated asindicated in the upper panels. A cotransfected cell is depicted in(d) and delineated in (e), asterisks in (e) indicate non-transfectedcells. The intracellular distribution of RFP-LC3 is shown in (f).Scale bar represents 10 μm.
show a lower number of autophagosomes compared withnon-transfected cells (Figure 8A, cells with asterisks inpanel b). The decrease in the number of autophagosomeswas more evident when the cells were incubated in star-vation medium, in the presence of bafilomycin A1, toaccumulate larger autophagosomes (Figure 8A, panels cand d). In GFP-transfected CHO cells, the starvation condi-tions induced an increment of LC3-positive dots per cell of4.9 times with respect to the control condition (Figure 8B),whereas in the starvation conditions plus wortmannin the
number of autophagosomes per cell was 0.026 times withrespect to the value in the control situation (Figure 8B).In CHO cells overexpressing GFP-Rab1b N121I, the num-ber of LC3-positive dots showed a notable decrease in,control, starvation and starvation plus wortmannin, thevalues diminished to 0.17, 0.71 and 1.17 times comparedwith control condition (GFP overexpressing cells in com-plete medium), respectively (Figure 8B). The decrease inautophagosome number achieved by the overexpressionof GFP-Rab1b N121I was similar to the wortmannin treat-ment. To further confirm these results, the effect of themutant GFP-Rab1b N121I was also analyzed in other celltypes. For this purpose, Vero (monkey cells) and HaCaT(a human cell line) overexpressing RFP-LC3 were used.In these cells, the Golgi apparatus was disassembled asshown by GM130 dispersion (Figure 8C, delineated areasin panels b and e), whereas in non-transfected cells theGolgi apparatus was observed as a more compact per-inuclear structure (Figure 8C, asterisks in panels b ande). In both cell lines overexpressing GFP-Rab1b N121Iafter 2 h of starvation and bafilomycin A1 treatment, RFP-LC3 was observed dispersed in the cytoplasm and noautophagosome-like structures were visible (Figure 8C,panels c and f).
In the second approach, we evaluated autophagy in Rab1bknocked down cells. HeLa cells were transfected eitherwith a non-related siRNA (siRNA NR) or with siRNA forRab1b (siRNA Rab1b). After 72 h, cells were incubatedfor 2 h either in complete medium (control) or underautophagy stimulatory conditions: starvation medium orsubjected to rapamycin treatment. The levels of Rab1 pro-tein, evaluated by western blot, showed a decrease in thecells treated with siRNA Rab1b compared with siRNA NR-treated cells (Figure 9A). The level of Rab1b diminished to40% with respect to the control (siRNA NR) (Figure 9B).The effect of the knockdown of Rab1b in the secretorypathway was analyzed by means of the Golgi apparatusmorphology. In this case, we immunostained Rab6 as aGolgi marker. In cells treated with siRNA NR, the Golgiwas observed with a normal morphology, compact andlocalized near the nucleus (Figure 9C, panels e and g). Incontrast, in cells treated with siRNA Rab1b, the stainingfor the Golgi apparatus was dispersed (Figure 9C, panels fand h). The autophagy analysis was performed by determi-nation of endogenous puncta LC3 localization in confocalimages. In cells subjected to starvation or rapamycin treat-ment, a decrease in the number of autophagosomes wasobserved in cells treated with siRNA Rab1b (Figure 9C,panels b and d) with respect to siRNA NR-treated cells(Figure 9C, panels a and c). The quantification of the num-ber of LC3-positive dots was normalized against the con-trol (siRNA NR-treated cells in control condition). In siRNANR-treated cells subjected to rapamycin, an increase of3.85 times with respect to the control was observed,whereas in siRNA Rab1b-treated cells the increase wasonly of 2.87 times (Figure 9D). In starvation conditions,the increase was 2.9 and 1.74 times in siRNA NR- andsiRNA Rab1b-treated cells, respectively (Figure 9D).
1254 Traffic 2010; 11: 1246–1261

Autophagosomes and ER Exit Sites
LC3
dots
per
cel
l(r
elat
ive
units
)
0
1
2
3
4
5
rap stv
siRNA NRsiRNA Rab1b
******
A
Rab6LC3
siRNA Rab1bsiRNA NR siRNA Rab1bsiRNA NR
rapamycin starvation
Rab6LC3 Rab6LC3 Rab6LC3
Mer
geLC
3
a cb d
e f g h
Tubulin
Rab1
siRNA NR
siRNA Rab1b
siRNA NRsiRNA Rab1b
0
1
0.5
B
C
D
ctrl
Figure 9: Knockdown of Rab1b de-
creases autophagosome formation.
HeLa cells were transfected for 72 heither with a specific siRNA for Rab1b(siRNA Rab1b) or with a non-relatedsiRNA (siRNA NR) as control. There-after, cells were treated for 2 h eitherwith 50 ng/μL rapamycin (rap) or incu-bated in starvation medium (stv). Sub-sequently both, Rab6 (Golgi marker)and LC3, were detected by immunos-taining. Scale bar represents 10 μm. A)Western blot to detect tubulin (as aloading control) and Rab1. B) Quantifica-tion of the intensity of the Rab1 bands.The value of the Rab1b band was nor-malized against tubulin. C) Immunoflu-orescence to localize Rab6 (as a Golgimarker). D) The number of LC3 dotsper cell. The values were normalizedagainst the control treatment (siRNANR-treated cells in control medium).Data represent the means ± SEM ofthree independent experiments. Aster-isks denote significance level of p <
0.01.
We also assessed the effect of depleting both Rab1isoforms (i.e. Rab1a and Rab1b) at the same time.The levels of endogenous LC3-II were detected bywestern blot in cells incubated in starvation mediumplus bafilomycin A1. As shown in Figure S1A,B, a markeddecrease (60–75%) in LC3-II accumulation was observed.Taken together, these data support the idea that Rab1bhas a key role in autophagosome formation.
Disruption of the secretory pathway by brefeldin A
does not affect autophagosome formation
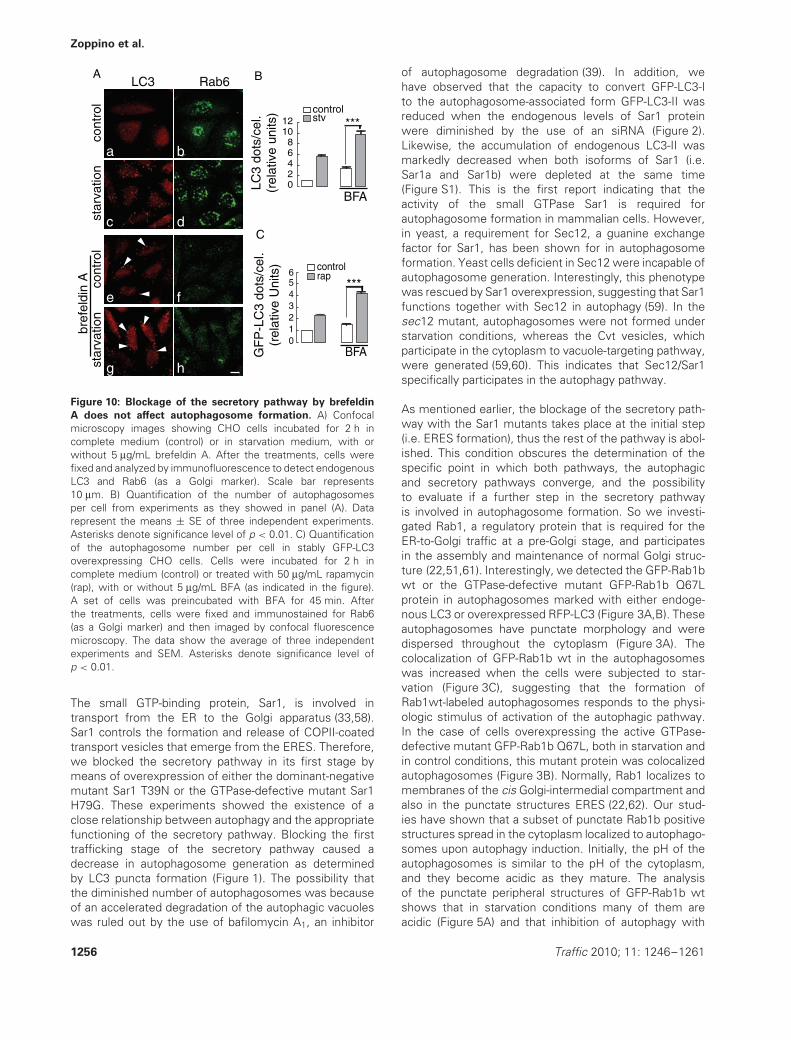
We next decided to determine whether stages of thesecretory pathway downstream to Sar1 and Rab1 areinvolved in autophagosome formation. It is known thatthe transport from the IC to the Golgi, trafficking throughthe Golgi apparatus and retrograde transport from theGolgi or IC to the ER, is carried out by COPI-coated vesi-cles (53,54). The assembly of the COPI coat is regulatedby the small GTPase Arf1 (55,56). It is possible to cause amorphological and functional disorganization of the secre-tory pathway at a pre-Golgi level without affecting theERES exportation machinery. This can be achieved byoverexpression of the Arf1 dominant-negative mutant (i.e.Arf1 T39N) or by inhibiting its guanine nucleotide exchangefactor (GEF) with the compound brefeldin A (BFA) (43,57).Therefore, we used BFA and evaluated autophagy by ana-lyzing the LC3 distribution using confocal fluorescencemicroscopy. As previously shown, in CHO cells treatedwith BFA for 2 h, the secretory pathway was disorganizedcausing the disassembly of the Golgi apparatus, evidenced
by the dispersion of Rab6 (Figure 10A, panels f and h). Thedistribution of the endogenous LC3 protein indicated thateven with the secretory pathway blocked at this levelautophagosomes were still formed (Figure 10A, arrow-heads in panels e and g). Quantification of autophago-somes was determined as LC3-positive dots per cell, andthe values were analyzed with respect to the control (cellsin complete medium without BFA). A clear response tothe autophagic stimulus was observed in the starvationplus BFA condition, where the number of LC3-positivedots increased 2.91 times compared with cells incubatedwith BFA but in full nutrient media (Figure 10B). In thoseexperiments, BFA was added together with the starva-tion media. However, it is possible that the autophagicresponse to starvation could be faster than the BFA action.To rule out this possibility, stably overexpressing GFP-LC3cells were preincubated with BFA for 45 min before acti-vating autophagy with rapamycin. As observed before,the cells treated with BFA were able to respond to theautophagic stimulus, and a significant increase of 2.4 timesin the number of autophagosomes, quantified as GFP-LC3-positive dots per cell, was observed (Figure 10C). Theseresults suggest that the latest stages of the early secretorypathway are not necessary for autophagosome formation.
Discussion
In this report, we have studied the relationship betweenautophagy and the initial events of the secretory pathway.
Traffic 2010; 11: 1246–1261 1255
Zoppino et al.
B
C
cont
rol
star
vatio
nLC3 Rab6
cont
rol
star
vatio
nbr
efel
din
AA
a
hg
fe
c d
b
GF
P-L
C3
dots
/cel
.(r
elat
ive
Uni
ts)
BFA
controlrap
012345 ***
BFA
controlstv
02468
1012 ***
LC3
dots
/cel
.(r
elat
ive
units
)6
Figure 10: Blockage of the secretory pathway by brefeldin
A does not affect autophagosome formation. A) Confocalmicroscopy images showing CHO cells incubated for 2 h incomplete medium (control) or in starvation medium, with orwithout 5 μg/mL brefeldin A. After the treatments, cells werefixed and analyzed by immunofluorescence to detect endogenousLC3 and Rab6 (as a Golgi marker). Scale bar represents10 μm. B) Quantification of the number of autophagosomesper cell from experiments as they showed in panel (A). Datarepresent the means ± SE of three independent experiments.Asterisks denote significance level of p < 0.01. C) Quantificationof the autophagosome number per cell in stably GFP-LC3overexpressing CHO cells. Cells were incubated for 2 h incomplete medium (control) or treated with 50 μg/mL rapamycin(rap), with or without 5 μg/mL BFA (as indicated in the figure).A set of cells was preincubated with BFA for 45 min. Afterthe treatments, cells were fixed and immunostained for Rab6(as a Golgi marker) and then imaged by confocal fluorescencemicroscopy. The data show the average of three independentexperiments and SEM. Asterisks denote significance level ofp < 0.01.
The small GTP-binding protein, Sar1, is involved intransport from the ER to the Golgi apparatus (33,58).Sar1 controls the formation and release of COPII-coatedtransport vesicles that emerge from the ERES. Therefore,we blocked the secretory pathway in its first stage bymeans of overexpression of either the dominant-negativemutant Sar1 T39N or the GTPase-defective mutant Sar1H79G. These experiments showed the existence of aclose relationship between autophagy and the appropriatefunctioning of the secretory pathway. Blocking the firsttrafficking stage of the secretory pathway caused adecrease in autophagosome generation as determinedby LC3 puncta formation (Figure 1). The possibility thatthe diminished number of autophagosomes was becauseof an accelerated degradation of the autophagic vacuoleswas ruled out by the use of bafilomycin A1, an inhibitor
of autophagosome degradation (39). In addition, wehave observed that the capacity to convert GFP-LC3-Ito the autophagosome-associated form GFP-LC3-II wasreduced when the endogenous levels of Sar1 proteinwere diminished by the use of an siRNA (Figure 2).Likewise, the accumulation of endogenous LC3-II wasmarkedly decreased when both isoforms of Sar1 (i.e.Sar1a and Sar1b) were depleted at the same time(Figure S1). This is the first report indicating that theactivity of the small GTPase Sar1 is required forautophagosome formation in mammalian cells. However,in yeast, a requirement for Sec12, a guanine exchangefactor for Sar1, has been shown for in autophagosomeformation. Yeast cells deficient in Sec12 were incapable ofautophagosome generation. Interestingly, this phenotypewas rescued by Sar1 overexpression, suggesting that Sar1functions together with Sec12 in autophagy (59). In thesec12 mutant, autophagosomes were not formed understarvation conditions, whereas the Cvt vesicles, whichparticipate in the cytoplasm to vacuole-targeting pathway,were generated (59,60). This indicates that Sec12/Sar1specifically participates in the autophagy pathway.
As mentioned earlier, the blockage of the secretory path-way with the Sar1 mutants takes place at the initial step(i.e. ERES formation), thus the rest of the pathway is abol-ished. This condition obscures the determination of thespecific point in which both pathways, the autophagicand secretory pathways converge, and the possibilityto evaluate if a further step in the secretory pathwayis involved in autophagosome formation. So we investi-gated Rab1, a regulatory protein that is required for theER-to-Golgi traffic at a pre-Golgi stage, and participatesin the assembly and maintenance of normal Golgi struc-ture (22,51,61). Interestingly, we detected the GFP-Rab1bwt or the GTPase-defective mutant GFP-Rab1b Q67Lprotein in autophagosomes marked with either endoge-nous LC3 or overexpressed RFP-LC3 (Figure 3A,B). Theseautophagosomes have punctate morphology and weredispersed throughout the cytoplasm (Figure 3A). Thecolocalization of GFP-Rab1b wt in the autophagosomeswas increased when the cells were subjected to star-vation (Figure 3C), suggesting that the formation ofRab1wt-labeled autophagosomes responds to the physi-ologic stimulus of activation of the autophagic pathway.In the case of cells overexpressing the active GTPase-defective mutant GFP-Rab1b Q67L, both in starvation andin control conditions, this mutant protein was colocalizedautophagosomes (Figure 3B). Normally, Rab1 localizes tomembranes of the cis Golgi-intermedial compartment andalso in the punctate structures ERES (22,62). Our stud-ies have shown that a subset of punctate Rab1b positivestructures spread in the cytoplasm localized to autophago-somes upon autophagy induction. Initially, the pH of theautophagosomes is similar to the pH of the cytoplasm,and they become acidic as they mature. The analysisof the punctate peripheral structures of GFP-Rab1b wtshows that in starvation conditions many of them areacidic (Figure 5A) and that inhibition of autophagy with
1256 Traffic 2010; 11: 1246–1261

Autophagosomes and ER Exit Sites
wortmannin reduces the acidic character of the struc-tures labeled with GFP-Rab1b (Figure 5A). These datasuggest that autophagosomes recruit Rab1b or that theyhave fused with Rab1-positive vesicles that subsequentlybecome acidic. A more accurate characterization of struc-tures labeled with GFP-Rab1 wt showed that they donot possess lysosomal enzymes or degradation activity(Figures 6 and S2). The data suggest that GFP-Rab1bis likely involved in early or intermediate stages ofthe autophagic pathway (i.e. the formation of immatureautophagic vesicles). Moreover, when autophagosomematuration is blocked with bafilomycin A1 or with themicrotubule depolymerizing agent nocodazole, the colo-calization of either GFP-Rab1b wt or GFP-Rab1b Q67Lwith LC3 notably increased (Figure 4), supporting the ideathat Rab1 is participating in early stages of the autophagicpathway.
During the development of the colocalization experiments,we noticed an increased number of autophagosomes incells overexpressing either GFP-Rab1b wt or GFP-Rab1bQ67L. The quantitative analysis confirmed our observa-tion (Figure 7). As stated earlier, the raise in the numberof autophagosomes per cell is likely the result of anincrease in the generation or an inhibition in the degrada-tion of these organelles. If Rab1b overexpression causedinhibition of autophagosome degradation, the addition ofanother inhibitory agent like bafilomycin A1 would not fur-ther increase the number of autophagosomes. In ourcase, the addition of bafilomycin A1 to starved cellstransfected with GFP-Rab1b Q67L caused an increasein autophagosome accumulation. Therefore, the analysisof the data suggests that overexpression of GFP-Rab1bpromotes autophagosome formation. Consistent with ourresults, yeast mutants expressing a GTPase-deficientYpt1 (homolog of Rab1 in yeast) and lacking the GAPs(GTPase-activating proteins) for Ypt1, have been shownthe accumulation of autophagosome-like structures (63).The morphological alterations observed indicate that, sim-ilar to our findings, an autophagic process is induced inyeast cells with an effective block of the hydrolysis ofYpt1p-bound GTP. An interesting feature was that haploidcells expressing the Ypt1 Q67L mutant did not allow thedeletion of the autophagy genes Atg8 or Atg1 making thecells inviable (63). This synthetic lethality suggests thatthe two mutations affect a single function or pathway,supporting the idea of the involvement of Ypt1/Rab1 inthe autophagic pathway.
In the present article, the role of Rab1 in autophagyis supported by the observation that cells overexpress-ing the dominant-negative mutant GFP-Rab1b N121Ishowed an altered autophagic response upon a star-vation stimulus, characterized by a marked reductionin the number of autophagosomes (Figure 8). The pos-sibility that this decrease was caused by acceleratedautophagosome degradation was discarded by the use ofbafilomycin A1, suggesting that autophagosome formationis indeed the stage affected (Figure 8). Furthermore, the
experiments with an siRNA against Rab1b corroboratedthe requirement of Rab1b for autophagosome genera-tion. The capacity to form autophagosomes significantlydecayed in cells with diminished levels of the Rab1bprotein (Figure 10). Consistent with this the accumula-tion of endogenous LC3-II was diminished by 70–80% incells knocked down for both isoforms of Rab1 (Rab1aand Rab1b), confirming the requirement for Rab1 inautophagosome formation (Figure S1).
Trafficking between the ER and Golgi can be disruptedby BFA, which inhibits a GEF for ADP ribosylation factor(ARF), a small GTPase required for the formation of COPIvesicles. BFA is believed to prevent the assembly of COPIcoats at the level of the VTC/intermediate compartment,ultimately blocking normal traffic between the ER andGolgi (55,64). The VTCs represent the first post-ER andpre-Golgi membrane structures. Thus, our experimentswith BFA to test the possible role of other stages (i.e.following to the Rab1 stage) of the secretory pathway indi-cated that the block in the secretory pathway at this leveldoes not inhibit autophagosome formation (Figure 10).Indeed, our results indicate that BFA increased the num-ber of the LC3-labeled vesicles in both full nutrient andstarvation conditions (Figure 10B). Our present findingsare in agreement with previous observations showing thatthe volume of autophagic vacuoles increased about three-fold in control cells treated with BFA and about sixfold inserum-deprived cells (65). Our results, in conjunction withthose of our colleagues, indicate that although secretion isseverely affected by the BFA block, an intact Golgi appara-tus and trans Golgi network, as well as a post-VTC secre-tory membrane flux, are not essential for autophagosomebiogenesis. This is also consistent with previous resultsin yeast that the late sec mutants, sec4 and sec15, whichmediate the fusion of secretory vesicles to the plasmamembrane, do not exhibit defects in autophagy (59). BFAleads to dramatic changes on the structure of the Golgiapparatus causing the conversion of the staked cisternaeinto vesicular/cisternal remnants. In addition, a distinctmembrane compartment is generated which has beentermed ‘BFA bodies’ (66). These BFA bodies consist ofmodified ER cisternae with smooth and rough domains.Of note, BFA treatment, besides forming these BFA bod-ies, does not appreciably alter the transitional regionsof the ER, characterized by budding profiles labeled bySec23, a component of COPII vesicles. This implies theexistence of a budding mechanism in the presence ofBFA, which may contribute to the autophagic pathway.
It is important to take into account that in yeast a spe-cial set of COPII proteins, such as Sec12, Sec23 andSec24, are required for autophagosome formation (59). Incontrast, the proteins Sec13 and Sec31 involved in theformation of the outer coat are dispensable. This indicatesthat a specialized type of ER-budding vesicles is involvedin autophagosome formation. In the present report, wehave established that functional ERES and budding vesi-cles as well as a Rab1-controlled traffic are necessary
Traffic 2010; 11: 1246–1261 1257

Zoppino et al.
for the generation of autophagosomes. Taken together,this evidences points to the conclusion that the machin-ery involved in autophagosome formation, although itmay share certain molecular components such as Rab1and Sar1, diverge from the classical early secretorypathway.
Of note, Sec23 binds to the Trapp1 complex, whichis a guanine exchange factor for Rab1 activating thisRab protein. Interestingly, cells deleted for one of thecomponents of the Trapp 1 complex show a defect inthe organization of the preautophagosomal structure (67),supporting a role for Rab1 in this pathway. A recentpublication indicates that overexpression of another Rab,Rab32, which predominantly localizes to the ER inducesthe formation of autophagic vesicles labeled by LC3 (68).Similar to our results, the expression of Rab32 mutantssuppressed the formation of LC3 dots upon autophagyactivation. In summary, our results in conjunction withthose of other colleagues point to specialized ER domainsas the source for the autophagosomal membrane. Live-cell imaging has shown that PI(3)P-enriched membranestermed ‘omegasomes’ were frequently seen in asso-ciation with the underlying ER. It was proposed thatomegasomes, dynamically interconnected with the ER,may provide the sites for biogenesis of at least a certaintype of autophagosome (69). Recent studies by elec-tron tomography have shown not only that the ER isinterconnected with the phagophore but also that the iso-lation membrane seems to originate from a subdomainof the ER as a distinct membrane (70,71). We believethat our findings support these electron microscopyobservations and significantly contribute to the molec-ular understanding of autophagosome membrane bio-genesis, a long-standing question in the autophagyfield.
Materials and Methods
Cell culture and transfectionsCHO and HeLa cells were cultured in α-MEM or DMEM (Gibco Labo-ratories), respectively, supplemented with 10% fetal bovine serum, 100units/mL penicillin and 100 μg/mL streptomycin, at 37◦C with 5% CO2. Fortransient expression, Lipofectamine 2000 (Invitrogen) was used accord-ing to the manufacturer’s instructions. For stable expression, transfectionswere performed with Lipofectamine (Invitrogen) according to the manufac-turer’s instructions and subsequently cells were selected with 0.5 mg/mLgeneticin.
AntibodiesPolyclonal antibodies against LC3 were raised in mice by immunizationwith GST-LC3. Immunoglobulin G (IgG)s were separated from asciticliquid (caprylic acid method), concentrated by ammonium sulfate (40%)precipitation and the specific antibodies against LC3 were affinity purified.The characterization of this antibody is shown in Figure S3. The rabbitpolyclonals anti-Rab6 and anti-Rab1 (which recognizes both Rab1 isoforms:Rab1a and Rab1b) were kindly provided by Dr Bruno Goud (Curie Institut),whereas the rabbit polyclonal anti-cathepsin D was a generous gift ofDr William J. Brown (Cornell University). Other antibodies were as follows:monoclonal anti-GM130 (BD Transduction Laboratories), polyclonal chicken
anti-Sar1 (Abcam) and polyclonal rabbit anti-LC3 (Cell Signalling) (used forwestern blot analysis).
PlasmidsPlasmids encoding Rab1b used in this work were obtained by subcloninghuman cDNA of Rab1b, Rab1bQ67L or Rab1bN121I from the pEF6/Myc-His B 6P vector (provided by Dr Cecilia Alvarez) into the pEGFP vector(Clontech). Briefly, Rab1b and its mutants were restricted with EcoR1 andBamH1 and ligated into the pEGFP vector (BD Clontech). pIRES2-DsRed2bicistronic vectors encoding Sar1, Sar1H79G and Sar1T39N were a giftfrom Hirofumi Kai and Akiko Niibori (Faculty of Pharmaceutical Sciences,Kumamoto University). Plasmids encoding GFP-LC3 and its mutants werekindly provided by Drs Noboru Mizushima and Tamotsu Yoshimori (NationalInstitute for Basic Biology). The pRFP-LC3 was constructed by subcloningLC3 into the EcoRI and BglII sites of the plasmid pRFP following standardprocedures.
ChemicalsCells were incubated in solution containing drugs as indicated in eachexperimental condition. Drugs were used as follows: 200 nM wortmanin,100 nM bafilomycin A1,5 μg/mL brefeldin A. All chemicals were purchasedfrom Sigma, unless stated otherwise.
siRNA suppression of gene expressionHeLa cells cultured on a 35-mm dish were transiently transfected with100nM of Rab1b siRNA (catalogue #120885, Ambion) or Rab1a siRNA (cata-logue #1125379) with siLentFect (Mirus), according to the manufacturer’sinstructions. Control transfections were carried out using a 19-nucleotidescrambled oligonucleotide (catalogue #6201, Cell Signalling). Seventy-twohours after transfection, cells were subjected to the indicated treatments.Knockdown of Sar1a was performed by transfecting HeLa cells witheither 100 nM negative control siRNA (bioneer) or with 100 nM specificSar1a or Sar1b siRNAs (catalogue #1133177 or #1133187, respectively,from Bioneer), using oligofectamine (Invitrogen) according to the manufac-turer’s instructions. The cells were subjected to the indicated treatmentsafter 72 h of transfection.
Confocal microscopyFor immunofluorescence, cells were grown on coverslips overnight to50–80% confluence. After incubation under different experimental con-ditions, cells were fixed with 3% paraformaldehyde in PBS for 15 minat room temperature washed with PBS, blocked with 50 mM NH4Cl inPBS and subsequently permeabilized with PBS containing 0.05% saponinand 0.2% bovine serum albumin for 15 min. Cells were then incubatedwith a primary antibody for 45 min at room temperature. After washing5× with PBS (5 min each), primary antibodies were detected using theadequate secondary antibodies labeled with Alexa 488 (Molecular Probes),Cy5 or Cy3 (Jackson ImmunoResearch) as required. The coverslips weremounted with Mowiol. For detection of acidic compartments, LysoTrackerRed was incorporated into living cells according to the manufacturer’sinstructions (Molecular Probes). Living and fixed cells were imagedusing a Nikon Eclipse 2000 confocal microscope or Olympus Fluoview1000 confocal microscope [objective 60× PlanApo oil numerical aperture(NA) 1.42].
Autophagy analysisAutophagy was induced by amino acid and serum deprivation. Briefly,cells were washed 3× with PBS and incubated in Earle’s Balanced SaltSolution (EBSS) at 37◦C for different periods of time in the presenceor the absence of different drugs (as indicated in the figure legends).In some experiments, autophagy was induced by rapamycin treatment(50 μg/mL). Autophagy was assessed by counting, in the confocal images,the number of LC3 dots per cell and normalizing the results according tothe respective control conditions. Confocal images of 10 random fields
1258 Traffic 2010; 11: 1246–1261
Autophagosomes and ER Exit Sites
were quantified, representing around 80 cells per experiment. Data arepresented as mean values and error bars indicate the SEM from at leastthree independent experiments. Statistical calculations (Student’s test,significant differences were ∗p < 0.05; ∗∗p < 0.01; ∗∗∗p < 0.001) weremade using Kyplot statistical software and graphs were plotted with AdobeIllustrator.
Western blotThe cells were lysed with RIPA buffer supplemented with inhibitors:10 μg/mL aprotinin, 10 μg/mL leupeptin, 5 μg/mL pepstatin A, 1 mM
sodium orthovanadate and 1 mM sodium fluoride for 30 min at 4◦C.The lysates were treated with Laemmli’s buffer and separated byelectrophoresis in polyacrylamide (72). After electrophoresis, the proteinswere transferred to nitrocellulose in a wet system at 200 mAmp for 1 h (73).The proteins bands were immunodetected with the adequate primaryantibodies incubated for 1 h (overnight in the case of anti-LC3). The primaryantibodies were revealed with horseradish peroxidase (HRP)-conjugatedsecondary antibodies, visualized by enhanced chemiluminescence (ECL)(GE) and exposed to X-ray films or analyzed with a Fujifilm LAS-4000 equipment (Fuji). Densitometric analysis of bands was performedusing the software IMAGEJ (Wayne Rasband, National Institutes ofHealth).
Acknowledgments
We are indebted to Drs Hirofumi Kai and Akiko Niibori (Faculty of Pharma-ceutical Sciences, Kumamoto University) for providing the pIRES2-DsRed2bicistronic vectors encoding Sar1, Sar1H79G and Sar1T39N. We thankMarcelo Furlan, Alejandra Medero, Graciela Gutierrez and Tirso Sartor fortheir valuable technical assistance. We are also grateful to Dr ClaudiaTomes and collaborators for useful technical advice. This work was partlysupported by grants from Agencia Nacional de Promocion Científica y Tec-nologica (PICT2004 #01-20711 and PICT2005 #38420), Sepcyt (UniversidadNacional de Cuyo) to María I. Colombo.
Supporting Information
Additional Supporting Information may be found in the online version ofthis article:
Figure S1: Knockdown of Sar1 or Rab1 decreased LC3-II accumulation.
A) HeLa cells were subjected to 100 nM siRNA treatment: siRNA negativecontrol, siRNA Sar1a + siRNA Sar1b (Sar1), siRNA Rab1a + siRNA Rab1b(Rab1) as described under Materials and Methods. After 48 h, the cellswere incubated in starvation medium plus 100 nM bafilomycin A1to favorautophagosome accumulation. Then the cells were lysed and analyzed bywestern blot to detect endogenous LC3 and tubulin. B) Quantification ofthe intensity of LC3-II bands. The graph shows the ratio between LC3-IIand the tubulin band shown in panel (A). Data correspond to one of thetwo independent experiments.
Figure S2: Rab1-labeled autophagosomes are predominantly imma-
ture structures that do not contain hydrolytic enzymes. CHO cellsoverexpressing RFP-LC3 and either GFP-Rab1b wt or GFP-Rab1b Q67Lwere incubated in control or starvation medium for 2 h. The lysosomalenzyme cathepsin D was detected by immunofluorescence. Arrowheadsdenote RFP-LC3-labeled autophagosomes colocalizing with GFP-Rab1.Note that only very few vesicles labeled with cathepsin D colocalized withGFP-Rab1b (inset in m–p). Scale bars represent 10 μm. The results arerepresentative of at least three independent experiments.
Figure S3: Characterization of the anti-LC3 polyclonal antibody
generated in our lab. A) Representative images of the colocalizationanalysis showing dots labeled with anti-LC3 (red) clearly colocalizing withGFP-LC3 (green). CHO cells overexpressing GFP-LC3 were subjected todifferent treatments as indicated in the figure: starvation (Stv), starvationplus 100 nM vinblastine (stv + vin) or starvation plus 200 nM wortmannin(stv + wm), a well-known autophagy inhibitor. Arrowheads show dots
colocalized likely corresponding to autophagosomes. Scale bar represents10 μm. B) Confocal images of CHO cells immunolabeled with the anti-LC3antibody. The subcellular distribution of endogenous LC3 was analyzedunder different conditions: control, starvation or starvation plus 100 nM
bafilomycin A1(baf A1) to accumulate autophagosomes. The primaryantibody was visualized with an anti-mouse Cy3. Arrowheads showautophagosomes. Scale bar represents 10 μm.
Video S1: Visualization of GFP-LC3-labeled autophagosomes decoratedby GFP-Rab1. Stably transfected CHO cells overexpressing either GFP-Rab1b wt or GFP-Rab1b Q67L were cotransfected with RFP-LC3. After24–48 h, the cells were transferred to starvation media and immediatelyanalyzed by time-lapse confocal microscopy. Slides every 20 seconds weretaken for a total period of 40 (in GFP-Rab1bwt-expressing cells) or 15 min(GFP-Rab1b Q67L).
Please note: Wiley-Blackwell are not responsible for the content orfunctionality of any supporting materials supplied by the authors.Any queries (other than missing material) should be directed to thecorresponding author for the article.
References
1. Yoshimori T. Autophagy: a regulated bulk degradation process insidecells. Biochem Biophys Res Commun 2004;313:453–458.
2. Mizushima N, Ohsumi Y, Yoshimori T. Autophagosome formation inmammalian cells. Cell Struct Funct 2002;27:421–429.
3. Dunn WA Jr. Studies on the mechanisms of autophagy: formation ofthe autophagic vacuole. J Cell Biol 1990;110:1923–1933.
4. Reggiori F, Klionsky DJ. Autophagosomes: biogenesis from scratch?Curr Opin Cell Biol 2005;17:415–422.
5. Hirsimaki Y, Hirsimaki P, Lounatmaa K. Vinblastine-induced auto-phagic vacuoles in mouse liver and Ehrlich ascites tumor cells asassessed by freeze-fracture electron microscopy. Eur J Cell Biol1982;27:298–301.
6. Young AR, Chan EY, Hu XW, Kochl R, Crawshaw SG, High S,Hailey DW, Lippincott-Schwartz J, Tooze SA. Starvation and ULK1-dependent cycling of mammalian Atg9 between the TGN andendosomes. J Cell Sci 2006;119:3888–3900.
7. Webber JL, Young AR, Tooze SA. Atg9 trafficking in mammalian cells.Autophagy 2007;3:54–56.
8. Vaccaro MI, Ropolo A, Grasso D, Iovanna JL. A novel mammaliantrans-membrane protein reveals an alternative initiation pathway forautophagy. Autophagy 2008;4:388–390.
9. Juhasz G, Neufeld TP. Autophagy: a forty-year search for a missingmembrane source. PLoS Biol 2006;4:161–164.
10. Kabeya Y, Mizushima N, Ueno T, Yamamoto A, Kirisako T, Noda T,Kominami E, Ohsumi Y, Yoshimori T. LC3, a mammalian homologueof yeast Apg8p, is localized in autophagosome membranes afterprocessing. EMBO J 2000;19:5720–5728.
11. Kirisako T, Ichimura Y, Okada H, Kabeya Y, Mizushima N,Yoshimori T, Ohsumi M, Takao T, Noda T, Ohsumi Y. The reversiblemodification regulates the membrane-binding state of Apg8/Aut7essential for autophagy and the cytoplasm to vacuole targetingpathway. J Cell Biol 2000;151:263–276.
12. Ichimura Y, Kirisako T, Takao T, Satomi Y, Shimonishi Y, Ishi-hara N, Mizushima N, Tanida I, Kominami E, Ohsumi M, Noda T,Ohsumi Y. A ubiquitin-like system mediates protein lipidation. Nature2000;408:488–492.
13. Tanida I, Tanida-Miyake E, Komatsu M, Ueno T, Kominami E. HumanApg3p/Aut1p homologue is an authentic E2 enzyme for multiple sub-strates, GATE-16, GABARAP, and MAP-LC3, and facilitates the conju-gation of hApg12p to hApg5p. J Biol Chem 2002;277:13739–13744.
14. Klionsky DJ, Abeliovich H, Agostinis P, Agrawal DK and others.Guidelines for the use and interpretation of assays for monitoringautophagy in higher eukaryotes. Autophagy 2008;4:151–175.
15. Mizushima N. Methods for monitoring autophagy. Int J Biochem CellBiol 2004;36:2491–2502.
16. Pfeffer SR. Rab GTPases: specifying and deciphering organelleidentity and function. Trends Cell Biol 2001;11:487–491.
17. Segev N. Ypt/rab gtpases: regulators of protein trafficking. Sci STKE2001;2001:RE11
Traffic 2010; 11: 1246–1261 1259
Zoppino et al.
18. Zerial M, McBride H. Rab proteins as membrane organizers. Nat RevMol Cell Biol 2001;2:107–117.
19. Schwartz SL, Cao C, Pylypenko O, Rak A, Wandinger-Ness A. RabGTPases at a glance. J Cell Sci 2007;120:3905–3910.
20. Stenmark H. Rab GTPases as coordinators of vesicle traffic. Nat RevMol Cell Biol 2009;10:513–525.
21. Plutner H, Schwaninger R, Pind S, Balch WE. Synthetic peptides ofthe Rab effector domain inhibit vesicular transport through thesecretory pathway. EMBO J 1990;9:2375–2383.
22. Plutner H, Cox AD, Pind S, Khosravi-Far R, Bourne JR, SchwaningerR, Der CJ, Balch WE. Rab1b regulates vesicular transport betweenthe endoplasmic reticulum and successive Golgi compartments. JCell Biol 1991;115:31–43.
23. Saraste J, Kuismanen E. Pathways of protein sorting and membranetraffic between the rough endoplasmic reticulum and the Golgicomplex. Semin Cell Biol 1992;3:343–355.
24. Lippincott-Schwartz J, Roberts TH, Hirschberg K. Secretory proteintrafficking and organelle dynamics in living cells. Annu Rev Cell DevBiol 2000;16:557–589.
25. Bannykh SI, Nishimura N, Balch WE. Getting into the Golgi. TrendsCell Biol 1998;8:21–25.
26. Antonny B, Schekman R. ER export: public transportation by the COPIIcoach. Curr Opin Cell Biol 2001;13:438–443.
27. Barlowe C. COPII-dependent transport from the endoplasmic reticu-lum. Curr Opin Cell Biol 2002;14:417–422.
28. Appenzeller-Herzog C, Hauri HP. The ER-Golgi intermediate compart-ment (ERGIC): in search of its identity and function. J Cell Sci2006;119:2173–2183.
29. Alvarez C, Garcia-Mata R, Brandon E, Sztul E. COPI recruitmentis modulated by a Rab1b-dependent mechanism. Mol Biol Cell2003;14:2116–2127.
30. Monetta P, Slavin I, Romero N, Alvarez C. Rab1b interacts with GBF1and modulates both ARF1 dynamics and COPI association. Mol BiolCell 2007;18:2400–2410.
31. Sannerud R, Marie M, Nizak C, Dale HA, Pernet-Gallay K, Perez F,Goud B, Saraste J. Rab1 defines a novel pathway connecting thepre-Golgi intermediate compartment with the cell periphery. Mol BiolCell 2006;17:1514–1526.
32. Tang BL, Wang Y, Ong YS, Hong W. COPII and exit from theendoplasmic reticulum. Biochim Biophys Acta 2005;1744:293–303.
33. Barlowe C, Orci L, Yeung T, Hosobuchi M, Hamamoto S, Salama N,Rexach MF, Ravazzola M, Amherdt M, Schekman R. COPII: a mem-brane coat formed by Sec proteins that drive vesicle budding fromthe endoplasmic reticulum. Cell 1994;77:895–907.
34. Nakano A, Otsuka H, Yamagishi M, Yamamoto E, Kimura K,Nishikawa S, Oka T. Mutational analysis of the Sar1 protein, asmall GTPase which is essential for vesicular transport from theendoplasmic reticulum. J Biochem 1994;116:243–247.
35. Saito Y, Kimura K, Oka T, Nakano A. Activities of mutant Sar1 proteinsin guanine nucleotide binding, GTP hydrolysis, and cell-free transportfrom the endoplasmic reticulum to the Golgi apparatus. J Biochem1998;124:816–823.
36. Oka T, Nakano A. Inhibition of GTP hydrolysis by Sar1p causesaccumulation of vesicles that are a functional intermediate of theER-to-Golgi transport in yeast. J Cell Biol 1994;124:425–434.
37. Aridor M, Bannykh SI, Rowe T, Balch WE. Sequential couplingbetween COPII and COPI vesicle coats in endoplasmic reticulumto Golgi transport. J Cell Biol 1995;131:875–893.
38. Bowman EJ, Siebers A, Altendorf K. Bafilomycins: a class of inhibitorsof membrane ATPases from microorganisms, animal cells, and plantcells. Proc Natl Acad Sci U S A 1988;85:7972–7976.
39. Yamamoto A, Tagawa Y, Yoshimori T, Moriyama Y, Masaki R,Tashiro Y. Bafilomycin A1 prevents maturation of autophagic vacuolesby inhibiting fusion between autophagosomes and lysosomes in rathepatoma cell line, H-4-II-E cells. Cell Struct Funct 1998;23:33–42.
40. Roa M, Cornet V, Yang CZ, Goud B. The small GTP-binding proteinrab6p is redistributed in the cytosol by brefeldin A. J Cell Sci1993;106:789–802.
41. Amenta JS, Hlivko TJ, McBee AG, Shinozuka H, Brocher S. Specificinhibition by NH4CL of autophagy-associated proteolysis in culturedfibroblasts. Exp Cell Res 1978;115:357–366.
42. Mizushima N, Yoshimori T. How to interpret LC3 immunoblotting.Autophagy 2007;3:542–545.
43. Ward TH, Polishchuk RS, Caplan S, Hirschberg K, Lippincott-SchwartzJ. Maintenance of Golgi structure and function depends on theintegrity of ER export. J Cell Biol 2001;155:557–570.
44. Kochl R, Hu XW, Chan EY, Tooze SA. Microtubules facilitateautophagosome formation and fusion of autophagosomes with endo-somes. Traffic 2006;7:129–145.
45. Petiot A, Ogier-Denis E, Blommaart EF, Meijer AJ, Codogno P. Dis-tinct classes of phosphatidylinositol 3’-kinases are involved in signalingpathways that control macroautophagy in HT-29 cells. J Biol Chem2000;275:992–998.
46. Blommaart EF, Krause U, Schellens JP, Vreeling-Sindelarova H,Meijer AJ. The phosphatidylinositol 3-kinase inhibitors wortmanninand LY294002 inhibit autophagy in isolated rat hepatocytes. EurJ Biochem 1997;243:240–246.
47. Tooze J, Hollinshead M, Ludwig T, Howell K, Hoflack B, Kern H. Inexocrine pancreas, the basolateral endocytic pathway converges withthe autophagic pathway immediately after the early endosome. J CellBiol 1990;111:329–345.
48. Liou W, Geuze HJ, Geelen MJ, Slot JW. The autophagic andendocytic pathways converge at the nascent autophagic vacuoles.J Cell Biol 1997;136:61–70.
49. Zaidi N, Maurer A, Nieke S, Kalbacher H. Cathepsin D: a cellularroadmap. Biochem Biophys Res Commun 2008;376:5–9.
50. Rubinsztein DC, Cuervo AM, Ravikumar B, Sarkar S, Korolchuk V,Kaushik S, Klionsky DJ. In search of an ‘‘autophagomometer’’.Autophagy 2009;5:585–589.
51. Tisdale EJ, Bourne JR, Khosravi-Far R, Der CJ, Balch WE. GTP-binding mutants of rab1 and rab2 are potent inhibitors of vesiculartransport from the endoplasmic reticulum to the Golgi complex. J CellBiol 1992;119:749–761.
52. Simpson JC, Cetin C, Erfle H, Joggerst B, Liebel U, Ellenberg J,Pepperkok R. An RNAi screening platform to identify secretionmachinery in mammalian cells. J Biotechnol 2007;129:352–365.
53. Presley JF, Cole NB, Schroer TA, Hirschberg K, Zaal KJ, Lippincott-Schwartz J. ER-to-Golgi transport visualized in living cells. Nature1997;389:81–85.
54. Liu W, Lippincott-Schwartz J. Illuminating COPII coat dynamics. NatStruct Mol Biol 2005;12:106–107.
55. Donaldson JG, Finazzi D, Klausner RD. Brefeldin A inhibits Golgimembrane-catalysed exchange of guanine nucleotide onto ARFprotein. Nature 1992;360:350–352.
56. Bonifacino JS, Lippincott-Schwartz J. Coat proteins: shaping mem-brane transport. Nat Rev Mol Cell Biol 2003;4:409–414.
57. Dascher C, Balch WE. Dominant inhibitory mutants of ARF1 blockendoplasmic reticulum to Golgi transport and trigger disassembly ofthe Golgi apparatus. J Biol Chem 1994;269:1437–1448.
58. Nakano A, Muramatsu M. A novel GTP-binding protein, Sar1p, isinvolved in transport from the endoplasmic reticulum to the Golgiapparatus. J Cell Biol 1989;109:2677–2691.
59. Ishihara N, Hamasaki M, Yokota S, Suzuki K, Kamada Y, Kihara A,Yoshimori T, Noda T, Ohsumi Y. Autophagosome requires specificearly Sec proteins for its formation and NSF/SNARE for vacuolarfusion. Mol Biol Cell 2001;12:3690–3702.
60. Klionsky DJ, Cueva R, Yaver DS. Aminopeptidase I of Saccharomycescerevisiae is localized to the vacuole independent of the secretorypathway. J Cell Biol 1992;119:287–299.
61. Pind SN, Nuoffer C, McCaffery JM, Plutner H, Davidson HW,Farquhar MG, Balch WE. Rab1 and Ca2+ are required for the fusionof carrier vesicles mediating endoplasmic reticulum to Golgi transport.J Cell Biol 1994;125:239–252.
62. Saraste J, Lahtinen U, Goud B. Localization of the small GTP-bindingprotein rab1p to early compartments of the secretory pathway. J CellSci 1995;108:1541–1552.
63. De Antoni A, Schmitzova J, Trepte HH, Gallwitz D, Albert S. Signifi-cance of GTP hydrolysis in Ypt1p-regulated endoplasmic reticulum toGolgi transport revealed by the analysis of two novel Ypt1-GAPs. JBiol Chem 2002;277:41023–41031.
64. Helms JB, Rothman JE. Inhibition by brefeldin A of a Golgi membraneenzyme that catalyses exchange of guanine nucleotide bound to ARF.Nature 1992;360:352–354.
65. Purhonen P, Pursiainen K, Reunanen H. Effects of brefeldin A onautophagy in cultured rat fibroblasts. Eur J Cell Biol 1997;74:63–67.
1260 Traffic 2010; 11: 1246–1261
Autophagosomes and ER Exit Sites
66. Orci L, Perrelet A, Ravazzola M, Wieland FT, Schekman R, RothmanJE. ‘‘BFA bodies’’: a subcompartment of the endoplasmic reticulum.Proc Natl Acad Sci U S A 1993;90:11089–11093.
67. Meiling-Wesse K, Epple UD, Krick R, Barth H, Appelles A, Voss C,Eskelinen EL, Thumm M. Trs85 (Gsg1), a component of the TRAPPcomplexes, is required for the organization of the preautophagosomalstructure during selective autophagy via the Cvt pathway. J Biol Chem2005;280:33669–33678.
68. Hirota Y, Tanaka Y. A small GTPase, human Rab32, is required forthe formation of autophagic vacuoles under basal conditions. Cell MolLife Sci 2009;66:2913–2932.
69. Axe EL, Walker SA, Manifava M, Chandra P, Roderick HL, HabermannA, Griffiths G, Ktistakis NT. Autophagosome formation from mem-brane compartments enriched in phosphatidylinositol 3-phosphate
and dynamically connected to the endoplasmic reticulum. J Cell Biol2008;182:685–701.
70. Yla-Anttila P, Vihinen H, Jokitalo E, Eskelinen EL. 3D tomographyreveals connections between the phagophore and endoplasmicreticulum. Autophagy 2009;5:1180–1185.
71. Hayashi-Nishino M, Fujita N, Noda T, Yamaguchi A, Yoshimori T,Yamamoto A. A subdomain of the endoplasmic reticulum formsa cradle for autophagosome formation. Nat Cell Biol 2009;11:1433–1437.
72. Laemmli UK. Cleavage of structural proteins during the assembly ofthe head of bacteriophage T4. Nature 1970;227:680–685.
73. Towbin H, Staehelin T, Gordon J. Electrophoretic transfer of proteinsfrom polyacrylamide gels to nitrocellulose sheets: procedure andsome applications. Proc Natl Acad Sci U S A 1979;76:4350–4354.
Traffic 2010; 11: 1246–1261 1261