Automobiles - Prabhudas Lilladher
33
September 04, 2013 Prabhudas Lilladher Pvt. Ltd. and/or its associates (the 'Firm') does and/or seeks to do business with companies covered in its research reports. As a result investors should be aware that the Firm may have a conflict of interest that could affect the objectivity of the report. Investors should consider this report as only a single factor in making their investment decision. Please refer to important disclosures and disclaimers at the end of the report Automobiles Two Wheelers – Ahead in the race Sector Report Surjit Arora [email protected] +91-22-66322235 Sensex v/s. Hero Motocorp & Bajaj Auto 70 80 90 100 110 120 130 140 Sep-12 Nov-12 Jan-13 Mar-13 May-13 Jul-13 Sep-13 Sensex Bajaj Auto Hero Motocorp Source: Bloomberg Stock Performance (%) 1M 6M 12M Sensex (3.1) (1.6) 6.5 Auto (0.1) (1.9) 10.7 Bajaj Auto (1.1) (5.0) 14.6 Hero Motocorp 6.9 17.6 6.6 Stock Data CMP (Rs) TP (Rs) PE (x) FY14E FY15E Bajaj Auto 1,889 2,083 15.9 13.6 Hero Motocorp 1,927 2,176 17.6 13.3 How we differ from Consensus EPS (Rs) PL Cons. % Diff. Bajaj Auto 2014 119.1 123.5 ‐3.6 2015 138.8 141.8 ‐2.1 Hero Motocorp 2014 109.3 109.4 0.0 2015 145.1 139.3 4.2 We believe that with the interest rate cycle reversing (read inching up) and robust rural economy, two‐wheeler stocks are likely to outperform over the next one year. Three key factors leading to our stance are a) strong rural economy led by good monsoon and increase in MSPs b) export potential ‐ Indian firms are better placed compared to Chinese counterparts (Africa & Latin America dominated by Chinese) on currency and labour cost front 3) Valuation attractive at 13‐14.0x 1yr fwd P/E, given the strong 18% earnings CAGR, coupled with strong balance sheet and better corporate governance. We upgrade Bajaj to ‘Accumulate’ from ‘Reduce’ mainly on account of higher export realization in FY14E and volume recovery from Jan’14. At the same time, with scooter volumes growing faster than motorcycle (women are increasing opting for the same), entry into the export market and strong rural sales (which account for ~45%), we upgrade Hero Motocorp from ‘Reduce’ to ‘Accumulate’. Recovery in two‐wheelers likely: According to Hero Motocorp management, recovery in two-wheeler industry demand is likely, given the good monsoon, coupled with possible increase in government spending ahead of 2014 national elections. We expect 12-13% CAGR in scooter volumes for the next two years. We expect two-wheeler volumes to grow at ~7% CAGR mainly led by 12.2% CAGR in scooter volumes and 6.0% CAGR in motorcycle volumes over FY13- FY15E period. Scooter share in the last three years has increased from 15% to 21% of two-wheeler volumes mainly driven by (a) growing acceptability of gearless scooters, particularly by women, (b) rising urbanization and increasing proportion of working women. Rural economy to spur demand: In the country's main cropping regions, monsoon has been timely and 20-30% above average so far, prompting farmers to expand cultivated area by 9% to 930 lakh hectares, with the biggest gains in pulses, oilseeds and coarse cereals. Going by the current trend of rising rural incomes with higher yields and minimum support prices, the outlook on two- wheelers is positive. Low penetration level, lack of adequate mode public transport and rising per capita income in rural India would lead to long-term healthy volume of two-wheelers. With rural economy accounting for 40-45% of the sales for two-wheelers, we expect good times ahead for two-wheeler manufacturers. Competitive intensity likely to slowdown: Over the last two years, HMSI has gained 450bps in motorcycles to 11.8% in FY13 and 520bps market share in scooters segment to 48.6% in FY13E. At the same time, HMCL has lost only 150bps market share in motorcycles to 53.6% in FY13E whereas it has gained market share of 210bps to 18.8% in FY13 in the scooter segment. Going forward, in our view, Hero would gain 180bps in market share in scooter segment thanks to ‘Maestro’ and ‘Pleasure’ to 21.6%, whereas it is likely to protect its turf in the motorcycle segment by maintaining its market share at 53.3% in FY15E. HMSI is likely to further gain market share to the tune of 260bps to 14.7% by FY15E at the cost of Bajaj Auto.
-
Upload
khangminh22 -
Category
Documents
-
view
3 -
download
0
Transcript of Automobiles - Prabhudas Lilladher
September 04, 2013
Prabhudas Lilladher Pvt. Ltd. and/or its associates (the 'Firm') does and/or seeks to do business with companies covered in its research reports. As a result investors should be aware that the Firm may have a conflict of interest that could affect the objectivity of the report. Investors should consider this report as only a single factor in making their investment decision.
Please refer to important disclosures and disclaimers at the end of the report
Automobiles
Two Wheelers – Ahead in the race
Sector Report Surjit Arora
[email protected] +91-22-66322235
Sensex v/s. Hero Motocorp & Bajaj Auto
708090
100110120130140
Sep-
12
Nov
-12
Jan-
13
Mar
-13
May
-13
Jul-1
3
Sep-
13
Sensex Bajaj Auto
Hero Motocorp
Source: Bloomberg
Stock Performance
(%) 1M 6M 12M
Sensex (3.1) (1.6) 6.5
Auto (0.1) (1.9) 10.7
Bajaj Auto (1.1) (5.0) 14.6
Hero Motocorp 6.9 17.6 6.6
Stock Data
CMP (Rs) TP (Rs) PE (x)
FY14E FY15E
Bajaj Auto 1,889 2,083 15.9 13.6
Hero Motocorp 1,927 2,176 17.6 13.3
How we differ from Consensus
EPS (Rs) PL Cons. % Diff.
Bajaj Auto
2014 119.1 123.5 ‐3.6
2015 138.8 141.8 ‐2.1
Hero Motocorp
2014 109.3 109.4 0.0
2015 145.1 139.3 4.2
We believe that with the interest rate cycle reversing (read inching up) and robust
rural economy, two‐wheeler stocks are likely to outperform over the next one year.
Three key factors leading to our stance are a) strong rural economy led by good
monsoon and increase in MSPs b) export potential ‐ Indian firms are better placed
compared to Chinese counterparts (Africa & Latin America dominated by Chinese)
on currency and labour cost front 3) Valuation attractive at 13‐14.0x 1yr fwd P/E,
given the strong 18% earnings CAGR, coupled with strong balance sheet and better
corporate governance. We upgrade Bajaj to ‘Accumulate’ from ‘Reduce’ mainly on
account of higher export realization in FY14E and volume recovery from Jan’14. At
the same time, with scooter volumes growing faster than motorcycle (women are
increasing opting for the same), entry into the export market and strong rural sales
(which account for ~45%), we upgrade Hero Motocorp from ‘Reduce’ to
‘Accumulate’.
Recovery in two‐wheelers likely: According to Hero Motocorp management, recovery in two-wheeler industry demand is likely, given the good monsoon, coupled with possible increase in government spending ahead of 2014 national elections. We expect 12-13% CAGR in scooter volumes for the next two years. We expect two-wheeler volumes to grow at ~7% CAGR mainly led by 12.2% CAGR in scooter volumes and 6.0% CAGR in motorcycle volumes over FY13-FY15E period. Scooter share in the last three years has increased from 15% to 21% of two-wheeler volumes mainly driven by (a) growing acceptability of gearless scooters, particularly by women, (b) rising urbanization and increasing proportion of working women.
Rural economy to spur demand: In the country's main cropping regions, monsoon has been timely and 20-30% above average so far, prompting farmers to expand cultivated area by 9% to 930 lakh hectares, with the biggest gains in pulses, oilseeds and coarse cereals. Going by the current trend of rising rural incomes with higher yields and minimum support prices, the outlook on two-wheelers is positive. Low penetration level, lack of adequate mode public transport and rising per capita income in rural India would lead to long-term healthy volume of two-wheelers. With rural economy accounting for 40-45% of the sales for two-wheelers, we expect good times ahead for two-wheeler manufacturers.
Competitive intensity likely to slowdown: Over the last two years, HMSI has gained 450bps in motorcycles to 11.8% in FY13 and 520bps market share in scooters segment to 48.6% in FY13E. At the same time, HMCL has lost only 150bps market share in motorcycles to 53.6% in FY13E whereas it has gained market share of 210bps to 18.8% in FY13 in the scooter segment. Going forward, in our view, Hero would gain 180bps in market share in scooter segment thanks to ‘Maestro’ and ‘Pleasure’ to 21.6%, whereas it is likely to protect its turf in the motorcycle segment by maintaining its market share at 53.3% in FY15E. HMSI is likely to further gain market share to the tune of 260bps to 14.7% by FY15E at the cost of Bajaj Auto.
September 04, 2013 2
Automobiles
Indian Manufactures to gain at the cost of Chinese: Two key export markets, mainly Africa and Latin America, are currently dominated by Chinese players, with ~75-80% market share and ~70% market share, respectively. While the Indian players have been gaining share from the Chinese mainly on account of their better quality, there is a likelihood of further market share gains on account of a) rising labour cost in China b) 16% rupee depreciation v/s 3% CNY appreciation against the USD.
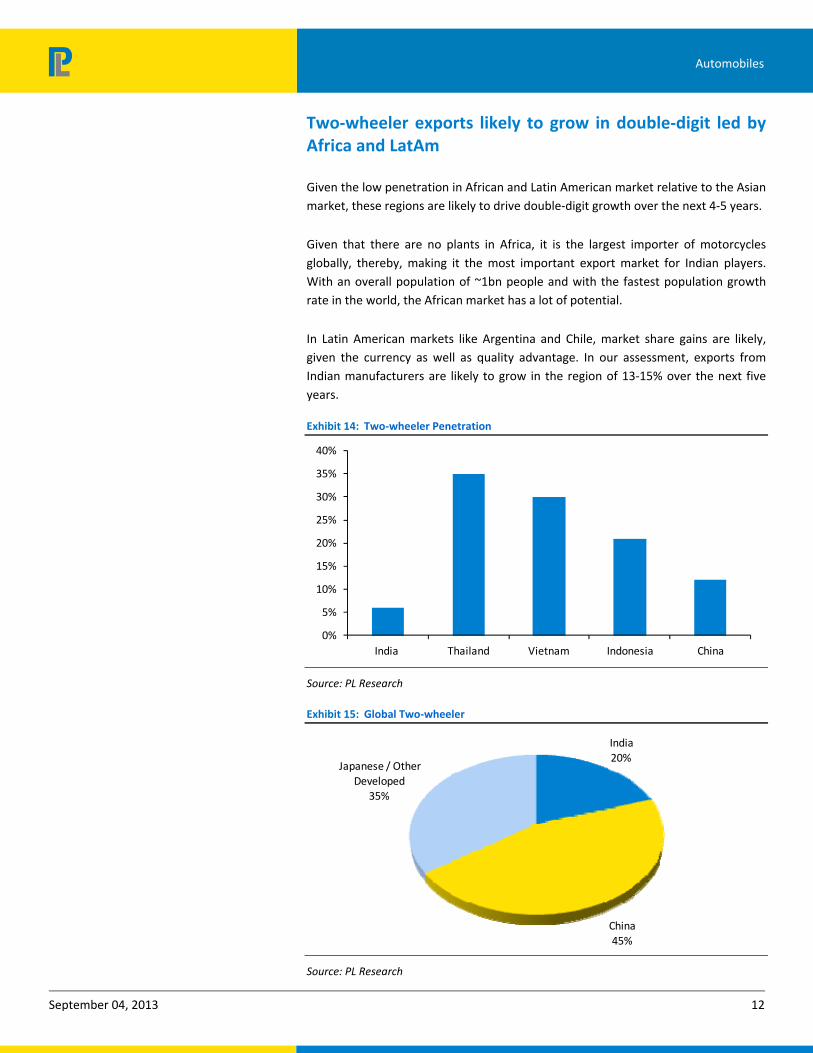
Exports likely to grow in double‐digit led by Africa and LatAm: Given the low penetration in African and Latin American market relative to the Asian market, these regions are likely to drive double-digit growth over the next 4-5 years. Given that there are no plants in Africa, it is the largest importer of motorcycles globally, thereby, making it the most important export market for Indian players. With an overall population of ~1bn people and with the fastest population growth rate in the world, African market has a lot of potential. In Latin American markets like Argentina and Chile, market share gains are likely, given the currency as well as quality advantage. In our assessment, exports from Indian manufacturers are likely to grow in the region of 13-15% over the next five years.
Prefer Two‐wheelers over Four‐Wheelers; Upgrade Bajaj Auto & Hero
Motocorp to Accumulate: With exports, three-wheeler and spares accounting for ~55% of its FY14E turnover, we believe Bajaj Auto is better placed to mitigate the impact of slowdown in the two-wheeler industry. With earnings CAGR of 17-18% for FY13FY15E period, coupled with attractive dividend yields of 3%+ and ROEs in excess of 38%, we believe valuation at 13.6x FY15E EPS for Bajaj and 13.3x FY15E EPS for Hero Motocorp looks attractive. Given that interest rates are unlikely to come down, we believe two-wheelers are likely to outperform four-wheelers.
September 04, 2013 3
Automobiles
CONTENTS
Page No
Two wheeler segment - recovery likely ...................................................................... 4
Competitive intensity likely to slowdown .................................................................. 7
Scooters ............................................................................................................................................. 7
Motorcycles ....................................................................................................................................... 8
New / Recent Launches .............................................................................................. 9
Indian manufactures to gain at the cost of their Chinese counterparts .................. 11
Two-wheeler exports likely to grow in double-digit led by Africa and LatAm ......... 12
African Market – Motorcycles used as Taxis - Dominated by Chinese Players ............................... 13
Nigeria – Dominated by Chinese ................................................................................................ 13
Western Africa ........................................................................................................................... 15
Latin America – dominated by Japanese and Chinese Players ........................................................ 16
South Asia – Dominated by Indian Manufacturers ......................................................................... 17
Companies
Bajaj Auto ........................................................................................................................................ 20
Hero Motocorp ................................................................................................................................ 26
September 04, 2013 4
Automobiles
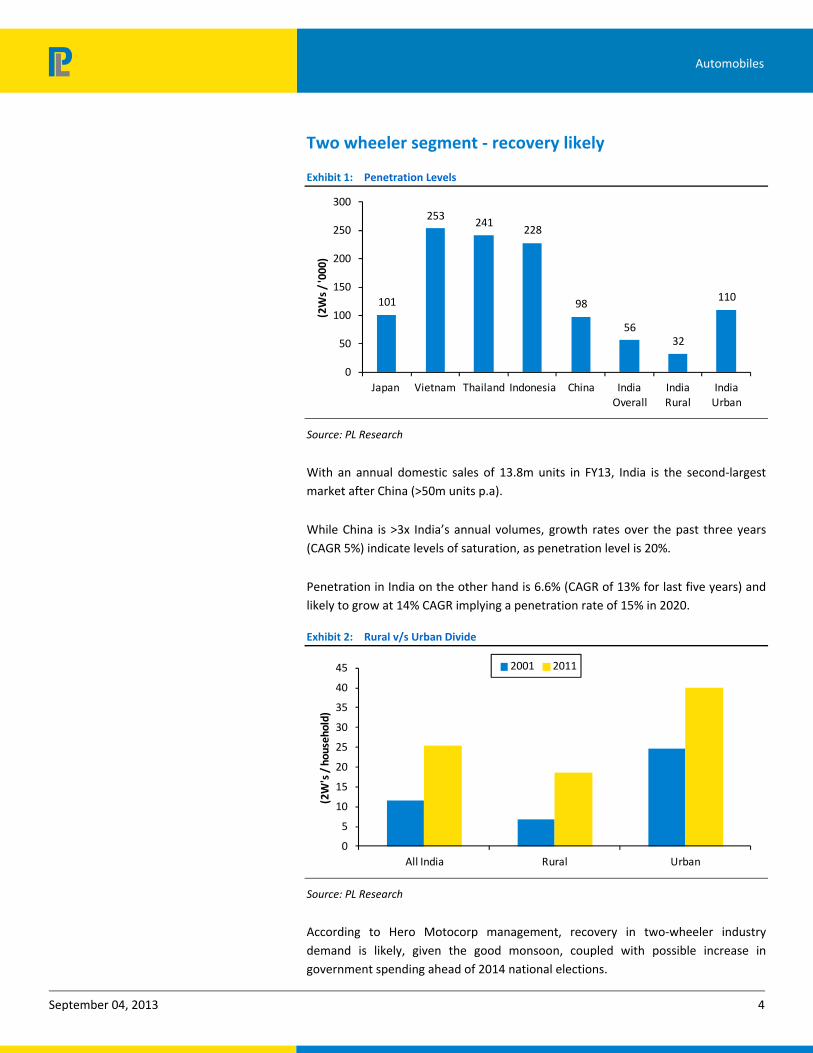
Two wheeler segment ‐ recovery likely
Exhibit 1: Penetration Levels
101
253 241228
98
5632
110
0
50
100
150
200
250
300
Japan Vietnam Thailand Indonesia China India Overall
India Rural
India Urban
(2Ws / '000)
Source: PL Research
With an annual domestic sales of 13.8m units in FY13, India is the second-largest market after China (>50m units p.a).
While China is >3x India’s annual volumes, growth rates over the past three years (CAGR 5%) indicate levels of saturation, as penetration level is 20%.
Penetration in India on the other hand is 6.6% (CAGR of 13% for last five years) and likely to grow at 14% CAGR implying a penetration rate of 15% in 2020.
Exhibit 2: Rural v/s Urban Divide
0
5
10
15
20
25
30
35
40
45
All India Rural Urban
(2W's / household)
2001 2011
Source: PL Research
According to Hero Motocorp management, recovery in two-wheeler industry demand is likely, given the good monsoon, coupled with possible increase in government spending ahead of 2014 national elections.
September 04, 2013 5
Automobiles
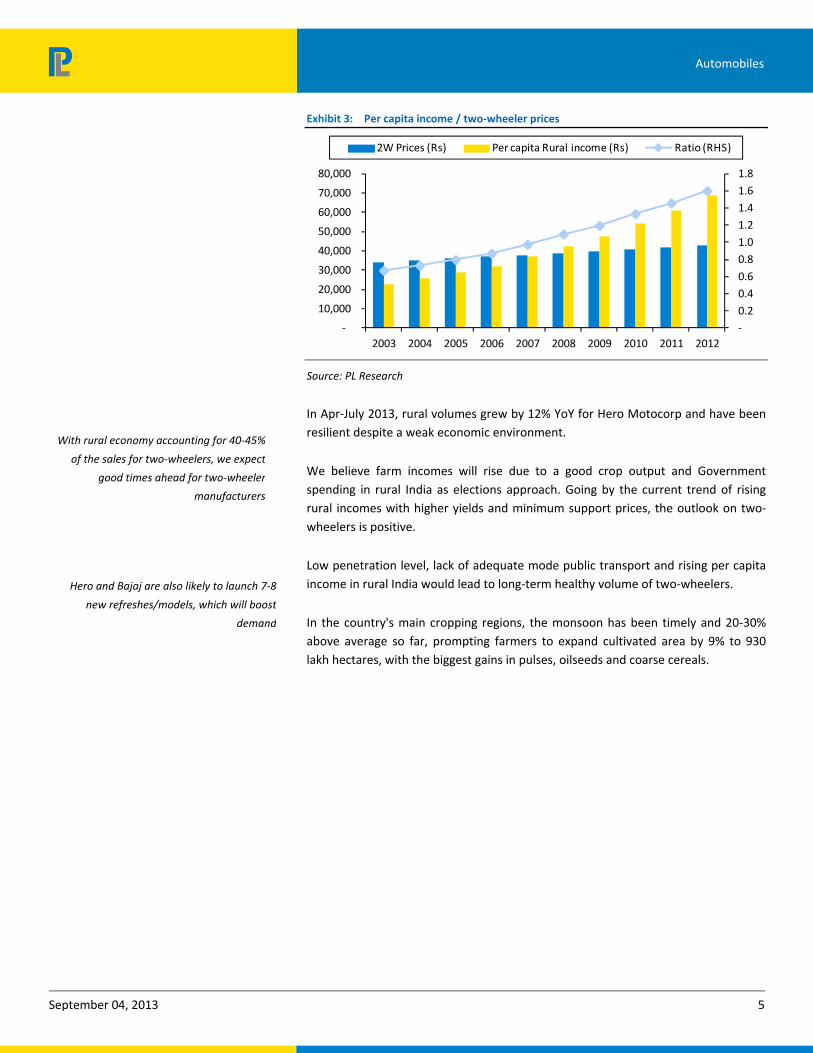
Exhibit 3: Per capita income / two‐wheeler prices
-
0.2
0.4
0.6
0.8
1.0
1.2
1.4
1.6
1.8
-
10,000
20,000
30,000
40,000
50,000
60,000
70,000
80,000
2003 2004 2005 2006 2007 2008 2009 2010 2011 2012
2W Prices (Rs) Per capita Rural income (Rs) Ratio (RHS)
Source: PL Research
In Apr-July 2013, rural volumes grew by 12% YoY for Hero Motocorp and have been resilient despite a weak economic environment.
We believe farm incomes will rise due to a good crop output and Government spending in rural India as elections approach. Going by the current trend of rising rural incomes with higher yields and minimum support prices, the outlook on two-wheelers is positive.
Low penetration level, lack of adequate mode public transport and rising per capita income in rural India would lead to long-term healthy volume of two-wheelers.
In the country's main cropping regions, the monsoon has been timely and 20-30% above average so far, prompting farmers to expand cultivated area by 9% to 930 lakh hectares, with the biggest gains in pulses, oilseeds and coarse cereals.
With rural economy accounting for 40‐45%
of the sales for two‐wheelers, we expect
good times ahead for two‐wheeler
manufacturers
Hero and Bajaj are also likely to launch 7‐8
new refreshes/models, which will boost
demand
September 04, 2013 6
Automobiles
Exhibit 4: Paddy
-10%
0%
10%
20%
30%
40%
50%
-
500
1,000
1,500
2,000
Apr
11
Jun
11
Aug
11
Oct
11
Dec
11
Feb
12
Apr
12
Jun
12
Aug
12
Oct
12
Dec
12
Feb
13
Apr
13
Market Price (Rs / Qtl) % over MSP (RHS)
Source: Ministry of Agriculture, PL Research
Exhibit 5: Jowar
-20%
0%
20%
40%
60%
80%
1,200
1,300
1,400
1,500
1,600
1,700
1,800
Apr
11
Jun
11
Aug
11
Oct
11
Dec
11
Feb
12
Apr
12
Jun
12
Aug
12
Oct
12
Dec
12
Feb
13
Apr
13
Market Price (Rs / Qtl) % over MSP (RHS)
Source: Ministry of Agriculture, PL Research
Exhibit 6: Cotton
0%
10%
20%
30%
40%
50%
60%
2,000
3,000
4,000
5,000
6,000
Apr
11
Jun
11
Aug
11
Oct
11
Dec
11
Feb
12
Apr
12
Jun
12
Aug
12
Oct
12
Dec
12
Feb
13
Apr
13
Market Price (Rs / Qtl) % over MSP (RHS)
Source: Ministry of Agriculture, PL Research
Exhibit 7: Wheat
0%5%10%15%20%25%30%35%
1,000
1,200
1,400
1,600
1,800
Apr
11
Jun
11
Aug
11
Oct
11
Dec
11
Feb
12
Apr
12
Jun
12
Aug
12
Oct
12
Dec
12
Feb
13
Apr
13
Market Price (Rs / Qtl) % over MSP (RHS)
Source: Ministry of Agriculture, PL Research
September 04, 2013 7
Automobiles
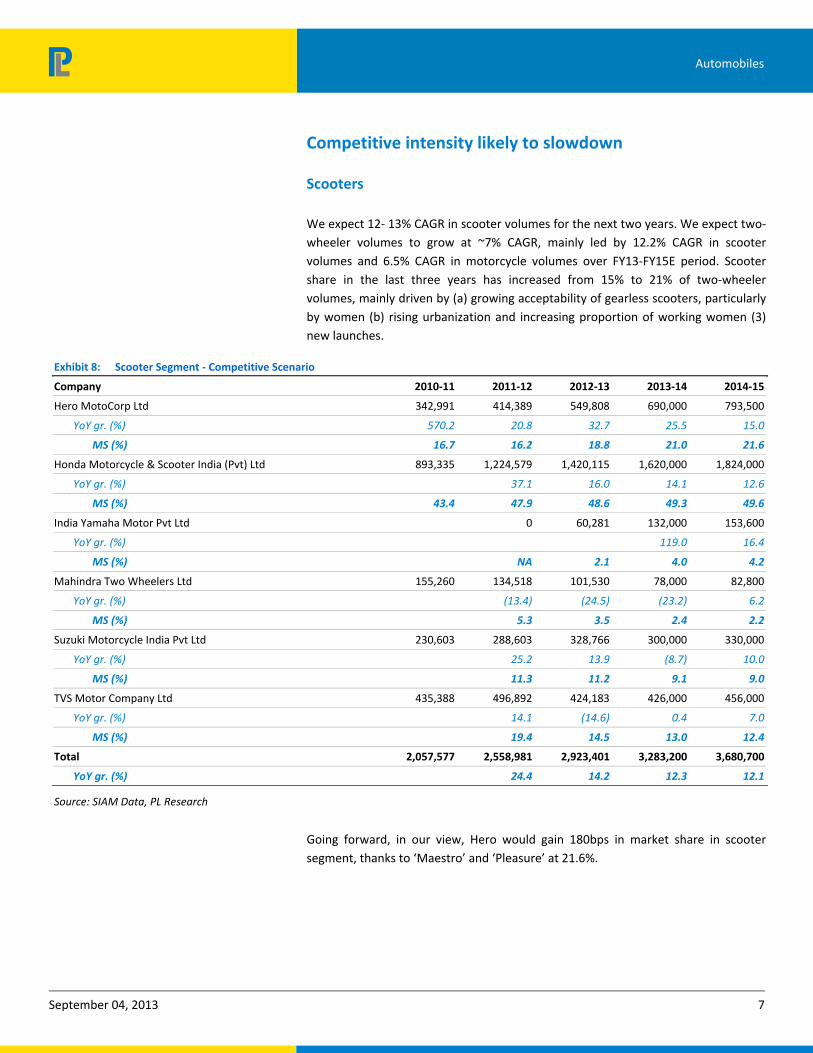
Competitive intensity likely to slowdown
Scooters
We expect 12- 13% CAGR in scooter volumes for the next two years. We expect two-wheeler volumes to grow at ~7% CAGR, mainly led by 12.2% CAGR in scooter volumes and 6.5% CAGR in motorcycle volumes over FY13-FY15E period. Scooter share in the last three years has increased from 15% to 21% of two-wheeler volumes, mainly driven by (a) growing acceptability of gearless scooters, particularly by women (b) rising urbanization and increasing proportion of working women (3) new launches.
Exhibit 8: Scooter Segment ‐ Competitive Scenario
Company 2010‐11 2011‐12 2012‐13 2013‐14 2014‐15
Hero MotoCorp Ltd 342,991 414,389 549,808 690,000 793,500
YoY gr. (%) 570.2 20.8 32.7 25.5 15.0
MS (%) 16.7 16.2 18.8 21.0 21.6
Honda Motorcycle & Scooter India (Pvt) Ltd 893,335 1,224,579 1,420,115 1,620,000 1,824,000
YoY gr. (%) 37.1 16.0 14.1 12.6
MS (%) 43.4 47.9 48.6 49.3 49.6
India Yamaha Motor Pvt Ltd 0 60,281 132,000 153,600
YoY gr. (%) 119.0 16.4
MS (%) NA 2.1 4.0 4.2
Mahindra Two Wheelers Ltd 155,260 134,518 101,530 78,000 82,800
YoY gr. (%) (13.4) (24.5) (23.2) 6.2
MS (%) 5.3 3.5 2.4 2.2
Suzuki Motorcycle India Pvt Ltd 230,603 288,603 328,766 300,000 330,000
YoY gr. (%) 25.2 13.9 (8.7) 10.0
MS (%) 11.3 11.2 9.1 9.0
TVS Motor Company Ltd 435,388 496,892 424,183 426,000 456,000
YoY gr. (%) 14.1 (14.6) 0.4 7.0
MS (%) 19.4 14.5 13.0 12.4
Total 2,057,577 2,558,981 2,923,401 3,283,200 3,680,700
YoY gr. (%) 24.4 14.2 12.3 12.1
Source: SIAM Data, PL Research
Going forward, in our view, Hero would gain 180bps in market share in scooter segment, thanks to ‘Maestro’ and ‘Pleasure’ at 21.6%.
September 04, 2013 8
Automobiles
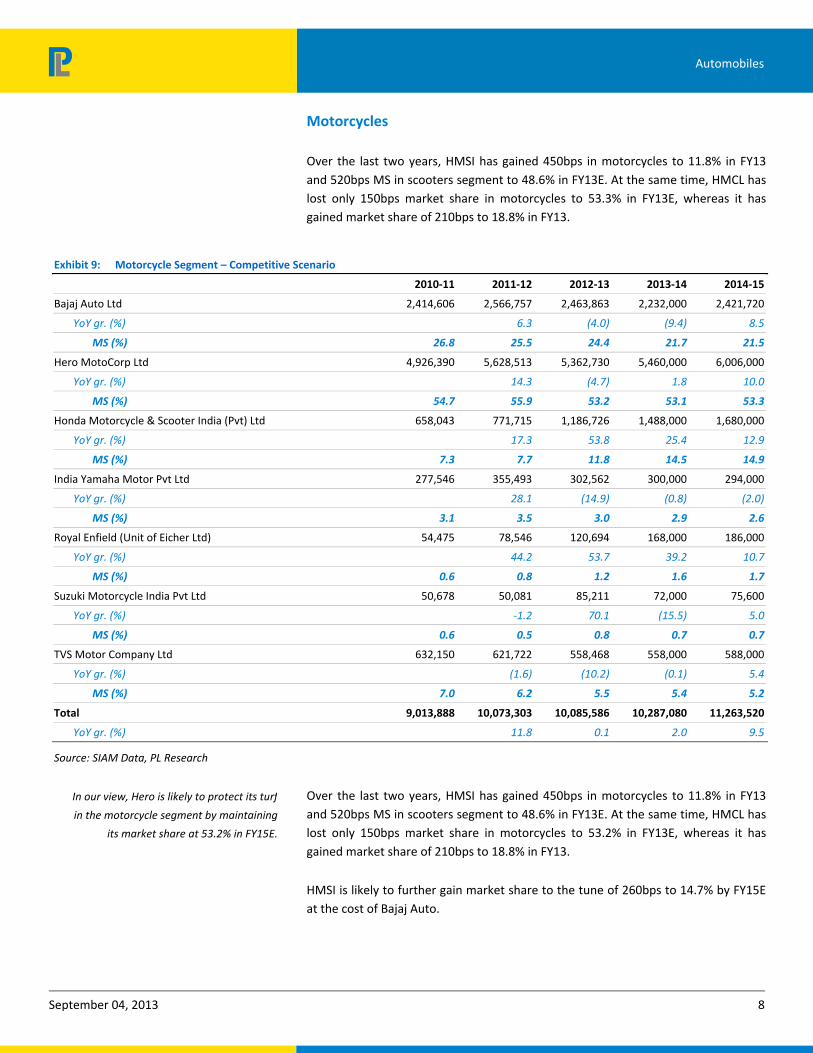
Motorcycles
Over the last two years, HMSI has gained 450bps in motorcycles to 11.8% in FY13 and 520bps MS in scooters segment to 48.6% in FY13E. At the same time, HMCL has lost only 150bps market share in motorcycles to 53.3% in FY13E, whereas it has gained market share of 210bps to 18.8% in FY13.
Exhibit 9: Motorcycle Segment – Competitive Scenario
2010‐11 2011‐12 2012‐13 2013‐14 2014‐15
Bajaj Auto Ltd 2,414,606 2,566,757 2,463,863 2,232,000 2,421,720
YoY gr. (%) 6.3 (4.0) (9.4) 8.5
MS (%) 26.8 25.5 24.4 21.7 21.5
Hero MotoCorp Ltd 4,926,390 5,628,513 5,362,730 5,460,000 6,006,000
YoY gr. (%) 14.3 (4.7) 1.8 10.0
MS (%) 54.7 55.9 53.2 53.1 53.3
Honda Motorcycle & Scooter India (Pvt) Ltd 658,043 771,715 1,186,726 1,488,000 1,680,000
YoY gr. (%) 17.3 53.8 25.4 12.9
MS (%) 7.3 7.7 11.8 14.5 14.9
India Yamaha Motor Pvt Ltd 277,546 355,493 302,562 300,000 294,000
YoY gr. (%) 28.1 (14.9) (0.8) (2.0)
MS (%) 3.1 3.5 3.0 2.9 2.6
Royal Enfield (Unit of Eicher Ltd) 54,475 78,546 120,694 168,000 186,000
YoY gr. (%) 44.2 53.7 39.2 10.7
MS (%) 0.6 0.8 1.2 1.6 1.7
Suzuki Motorcycle India Pvt Ltd 50,678 50,081 85,211 72,000 75,600
YoY gr. (%) ‐1.2 70.1 (15.5) 5.0
MS (%) 0.6 0.5 0.8 0.7 0.7
TVS Motor Company Ltd 632,150 621,722 558,468 558,000 588,000
YoY gr. (%) (1.6) (10.2) (0.1) 5.4
MS (%) 7.0 6.2 5.5 5.4 5.2
Total 9,013,888 10,073,303 10,085,586 10,287,080 11,263,520
YoY gr. (%) 11.8 0.1 2.0 9.5
Source: SIAM Data, PL Research
Over the last two years, HMSI has gained 450bps in motorcycles to 11.8% in FY13 and 520bps MS in scooters segment to 48.6% in FY13E. At the same time, HMCL has lost only 150bps market share in motorcycles to 53.2% in FY13E, whereas it has gained market share of 210bps to 18.8% in FY13.
HMSI is likely to further gain market share to the tune of 260bps to 14.7% by FY15E at the cost of Bajaj Auto.
In our view, Hero is likely to protect its turf
in the motorcycle segment by maintaining
its market share at 53.2% in FY15E.
September 04, 2013 9
Automobiles
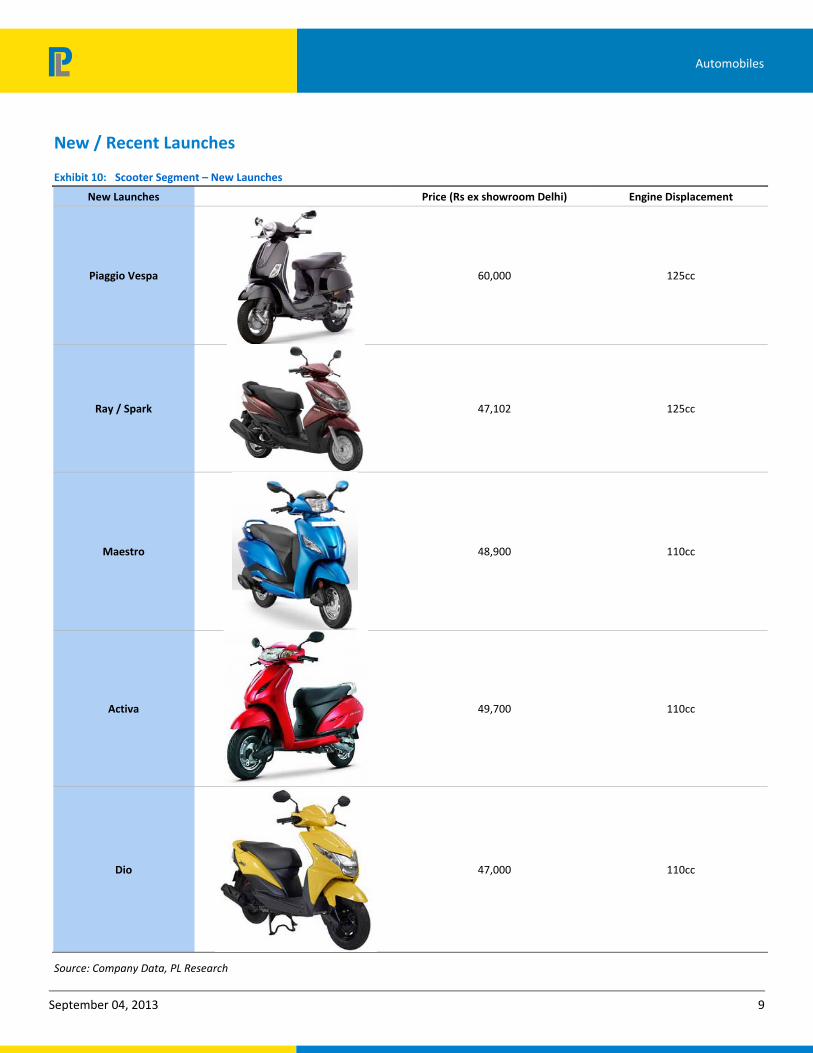
New / Recent Launches
Exhibit 10: Scooter Segment – New Launches
New Launches Price (Rs ex showroom Delhi) Engine Displacement
Piaggio Vespa 60,000 125cc
Ray / Spark 47,102 125cc
Maestro 48,900 110cc
Activa 49,700 110cc
Dio 47,000 110cc
Source: Company Data, PL Research
September 04, 2013 10
Automobiles
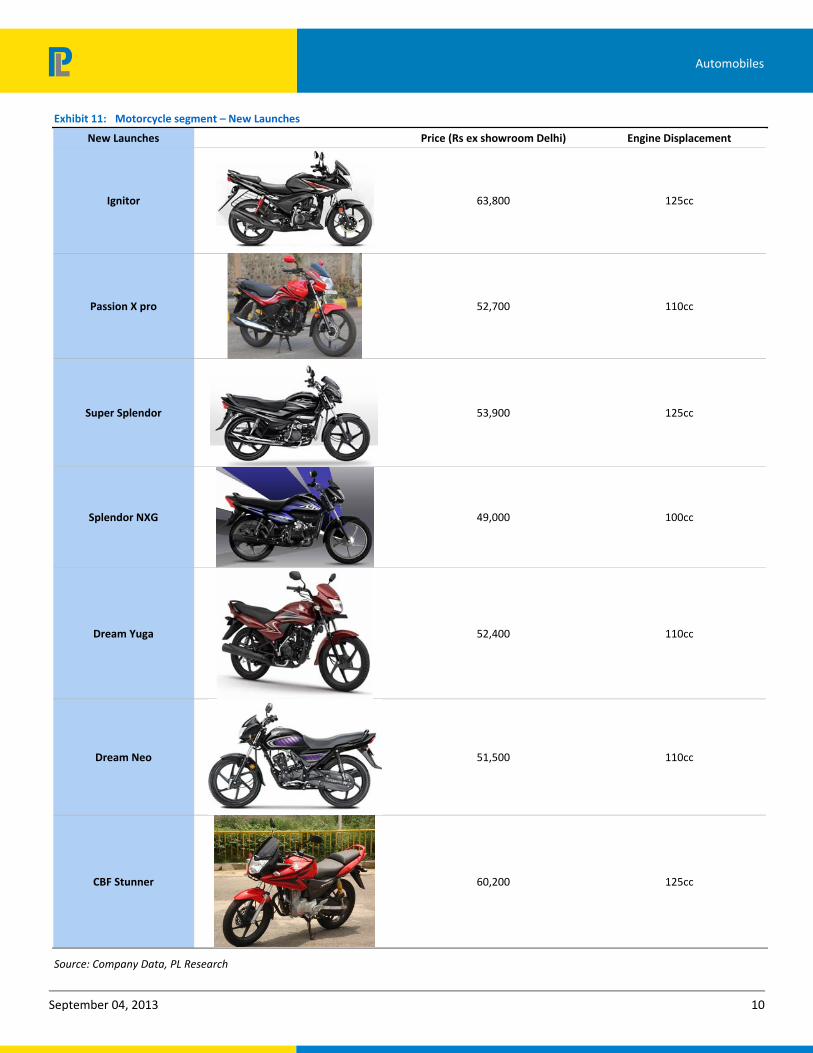
Exhibit 11: Motorcycle segment – New Launches
New Launches Price (Rs ex showroom Delhi) Engine Displacement
Ignitor 63,800 125cc
Passion X pro 52,700 110cc
Super Splendor 53,900 125cc
Splendor NXG 49,000 100cc
Dream Yuga 52,400 110cc
Dream Neo 51,500 110cc
CBF Stunner 60,200 125cc
Source: Company Data, PL Research
September 04, 2013 11
Automobiles
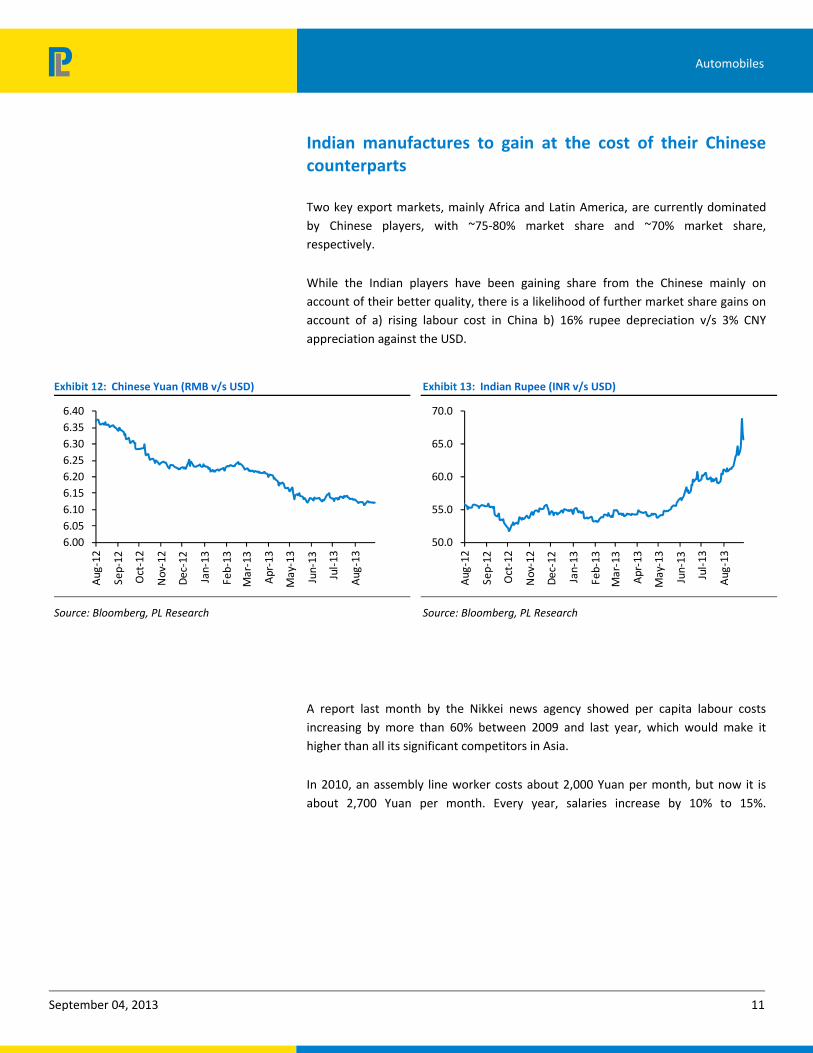
Indian manufactures to gain at the cost of their Chinese counterparts
Two key export markets, mainly Africa and Latin America, are currently dominated by Chinese players, with ~75-80% market share and ~70% market share, respectively.
While the Indian players have been gaining share from the Chinese mainly on account of their better quality, there is a likelihood of further market share gains on account of a) rising labour cost in China b) 16% rupee depreciation v/s 3% CNY appreciation against the USD.
Exhibit 12: Chinese Yuan (RMB v/s USD)
6.006.056.106.156.206.256.306.356.40
Aug
-12
Sep-
12
Oct
-12
Nov
-12
Dec
-12
Jan-
13
Feb-
13
Mar
-13
Apr
-13
May
-13
Jun-
13
Jul-
13
Aug
-13
Source: Bloomberg, PL Research
Exhibit 13: Indian Rupee (INR v/s USD)
50.0
55.0
60.0
65.0
70.0
Aug
-12
Sep-
12
Oct
-12
Nov
-12
Dec
-12
Jan-
13
Feb-
13
Mar
-13
Apr
-13
May
-13
Jun-
13
Jul-
13
Aug
-13
Source: Bloomberg, PL Research
A report last month by the Nikkei news agency showed per capita labour costs increasing by more than 60% between 2009 and last year, which would make it higher than all its significant competitors in Asia.
In 2010, an assembly line worker costs about 2,000 Yuan per month, but now it is about 2,700 Yuan per month. Every year, salaries increase by 10% to 15%.
September 04, 2013 12
Automobiles
Two‐wheeler exports likely to grow in double‐digit led by Africa and LatAm
Given the low penetration in African and Latin American market relative to the Asian market, these regions are likely to drive double-digit growth over the next 4-5 years.
Given that there are no plants in Africa, it is the largest importer of motorcycles globally, thereby, making it the most important export market for Indian players. With an overall population of ~1bn people and with the fastest population growth rate in the world, the African market has a lot of potential.
In Latin American markets like Argentina and Chile, market share gains are likely, given the currency as well as quality advantage. In our assessment, exports from Indian manufacturers are likely to grow in the region of 13-15% over the next five years.
Exhibit 14: Two‐wheeler Penetration
0%
5%
10%
15%
20%
25%
30%
35%
40%
India Thailand Vietnam Indonesia China
Source: PL Research
Exhibit 15: Global Two‐wheeler
India20%
China45%
Japanese / Other Developed
35%
Source: PL Research
September 04, 2013 13
Automobiles
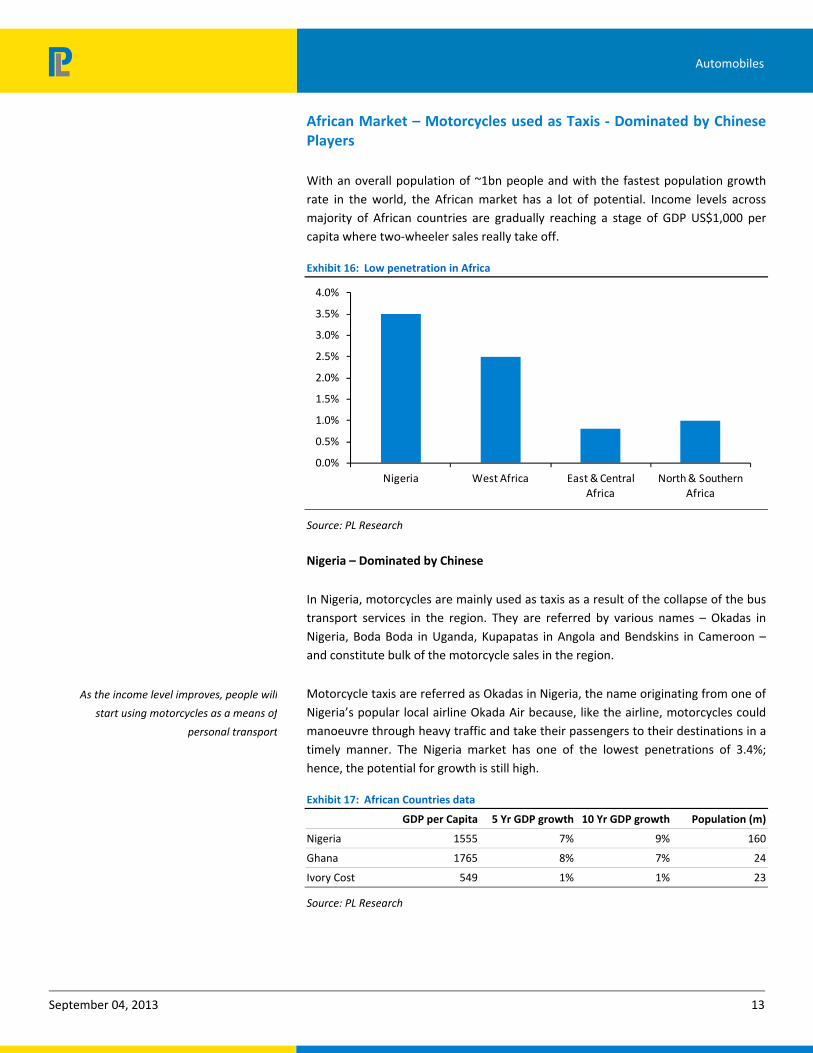
African Market – Motorcycles used as Taxis ‐ Dominated by Chinese Players
With an overall population of ~1bn people and with the fastest population growth rate in the world, the African market has a lot of potential. Income levels across majority of African countries are gradually reaching a stage of GDP US$1,000 per capita where two-wheeler sales really take off.
Exhibit 16: Low penetration in Africa
0.0%
0.5%
1.0%
1.5%
2.0%
2.5%
3.0%
3.5%
4.0%
Nigeria West Africa East & Central Africa
North & Southern Africa
Source: PL Research
Nigeria – Dominated by Chinese
In Nigeria, motorcycles are mainly used as taxis as a result of the collapse of the bus transport services in the region. They are referred by various names – Okadas in Nigeria, Boda Boda in Uganda, Kupapatas in Angola and Bendskins in Cameroon – and constitute bulk of the motorcycle sales in the region.
Motorcycle taxis are referred as Okadas in Nigeria, the name originating from one of Nigeria’s popular local airline Okada Air because, like the airline, motorcycles could manoeuvre through heavy traffic and take their passengers to their destinations in a timely manner. The Nigeria market has one of the lowest penetrations of 3.4%; hence, the potential for growth is still high.
Exhibit 17: African Countries data
GDP per Capita 5 Yr GDP growth 10 Yr GDP growth Population (m)
Nigeria 1555 7% 9% 160
Ghana 1765 8% 7% 24
Ivory Cost 549 1% 1% 23
Source: PL Research
As the income level improves, people will
start using motorcycles as a means of
personal transport
September 04, 2013 14
Automobiles
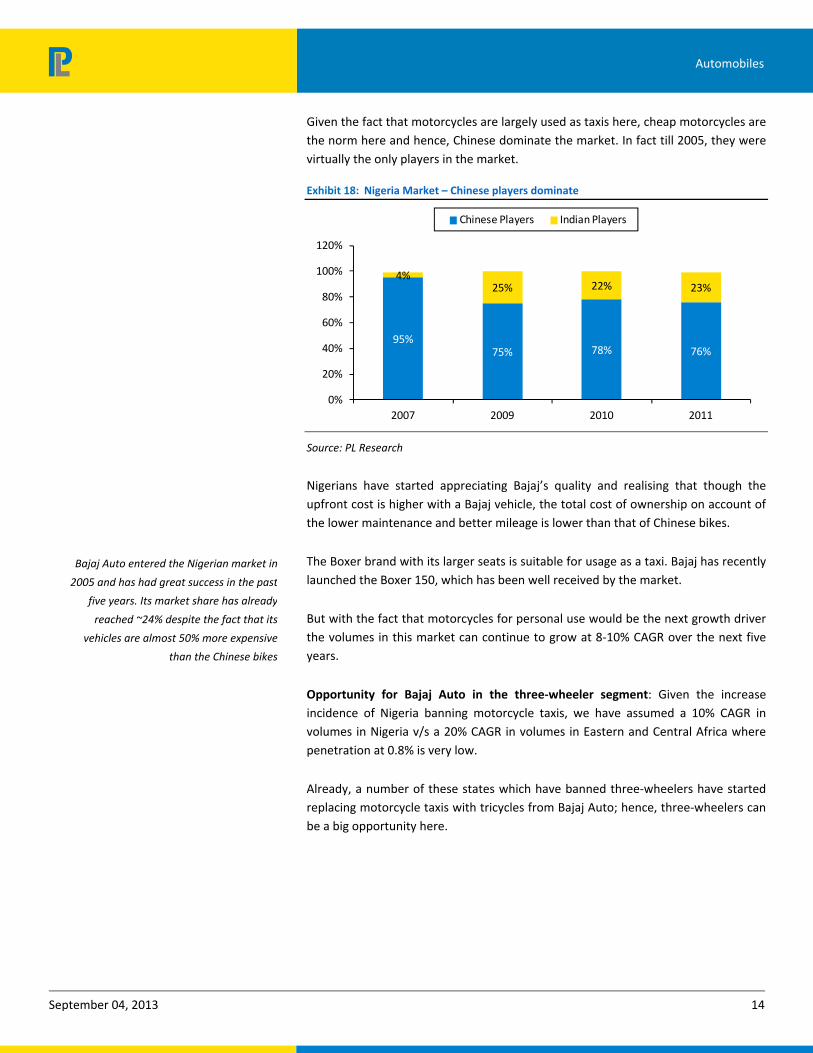
Given the fact that motorcycles are largely used as taxis here, cheap motorcycles are the norm here and hence, Chinese dominate the market. In fact till 2005, they were virtually the only players in the market.
Exhibit 18: Nigeria Market – Chinese players dominate
95%75% 78% 76%
4%25% 22% 23%
0%
20%
40%
60%
80%
100%
120%
2007 2009 2010 2011
Chinese Players Indian Players
Source: PL Research
Nigerians have started appreciating Bajaj’s quality and realising that though the upfront cost is higher with a Bajaj vehicle, the total cost of ownership on account of the lower maintenance and better mileage is lower than that of Chinese bikes.
The Boxer brand with its larger seats is suitable for usage as a taxi. Bajaj has recently launched the Boxer 150, which has been well received by the market.
But with the fact that motorcycles for personal use would be the next growth driver the volumes in this market can continue to grow at 8-10% CAGR over the next five years.
Opportunity for Bajaj Auto in the three‐wheeler segment: Given the increase incidence of Nigeria banning motorcycle taxis, we have assumed a 10% CAGR in volumes in Nigeria v/s a 20% CAGR in volumes in Eastern and Central Africa where penetration at 0.8% is very low.
Already, a number of these states which have banned three-wheelers have started replacing motorcycle taxis with tricycles from Bajaj Auto; hence, three-wheelers can be a big opportunity here.
Bajaj Auto entered the Nigerian market in
2005 and has had great success in the past
five years. Its market share has already
reached ~24% despite the fact that its
vehicles are almost 50% more expensive
than the Chinese bikes
September 04, 2013 15
Automobiles
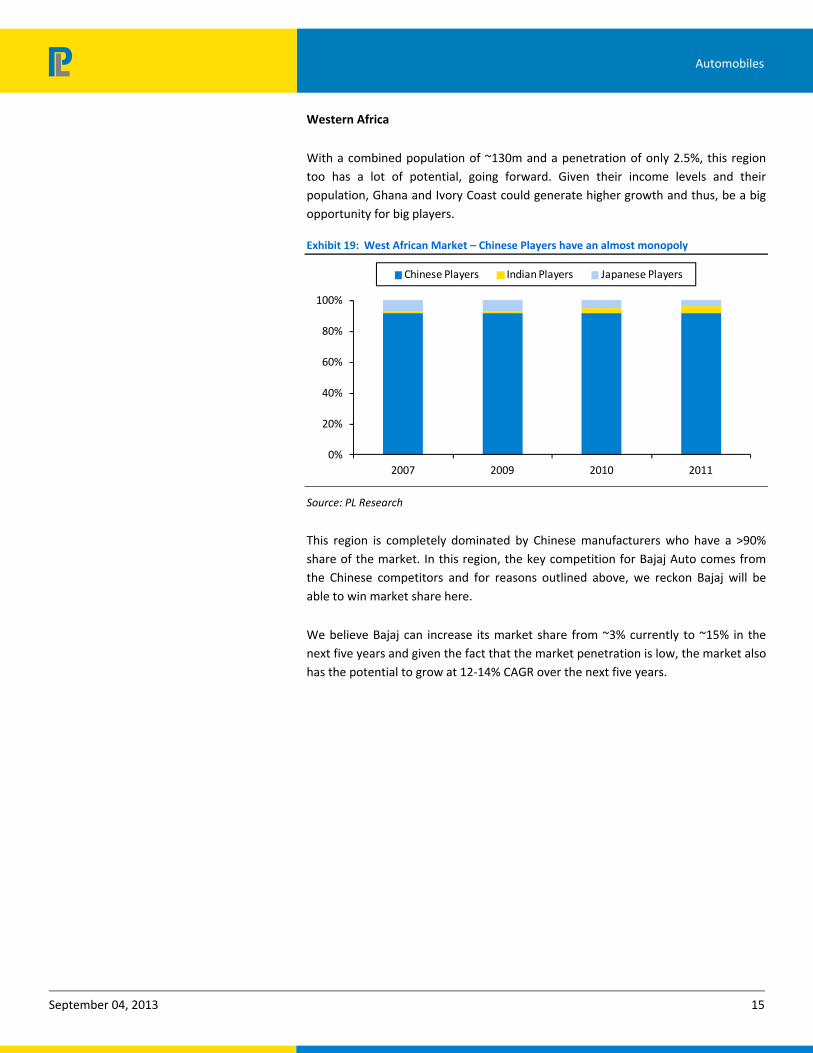
Western Africa
With a combined population of ~130m and a penetration of only 2.5%, this region too has a lot of potential, going forward. Given their income levels and their population, Ghana and Ivory Coast could generate higher growth and thus, be a big opportunity for big players.
Exhibit 19: West African Market – Chinese Players have an almost monopoly
0%
20%
40%
60%
80%
100%
2007 2009 2010 2011
Chinese Players Indian Players Japanese Players
Source: PL Research
This region is completely dominated by Chinese manufacturers who have a >90% share of the market. In this region, the key competition for Bajaj Auto comes from the Chinese competitors and for reasons outlined above, we reckon Bajaj will be able to win market share here.
We believe Bajaj can increase its market share from ~3% currently to ~15% in the next five years and given the fact that the market penetration is low, the market also has the potential to grow at 12-14% CAGR over the next five years.
September 04, 2013 16
Automobiles
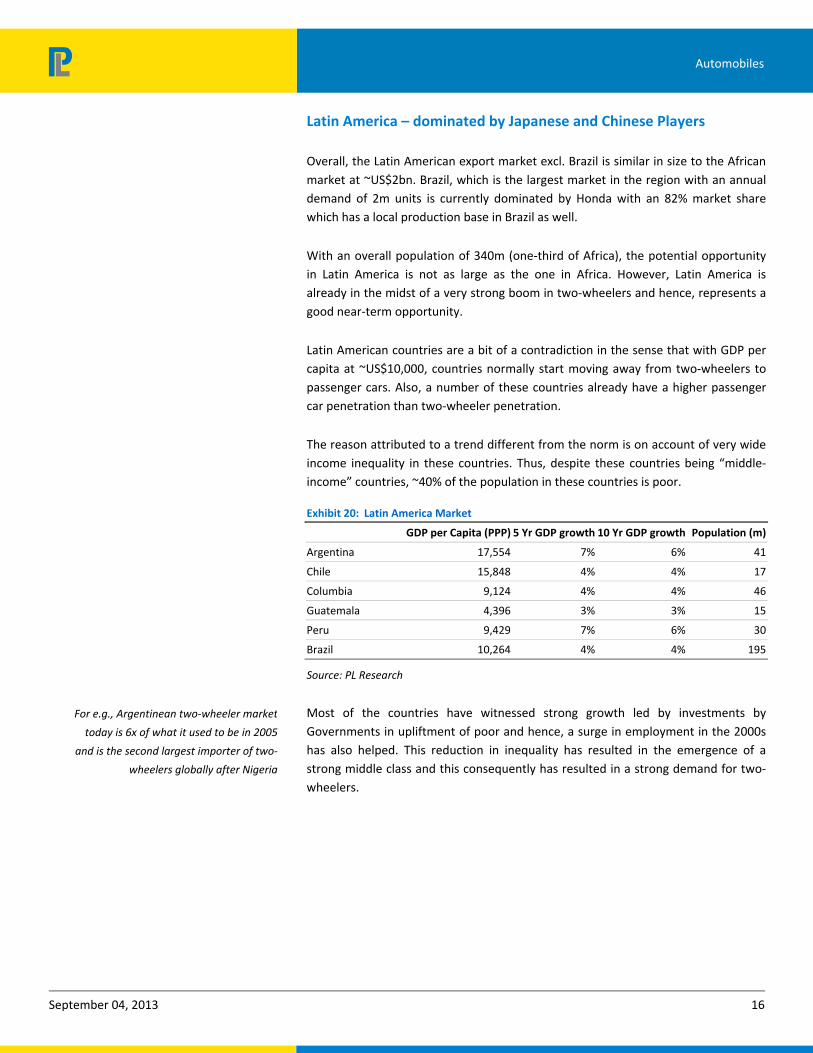
Latin America – dominated by Japanese and Chinese Players
Overall, the Latin American export market excl. Brazil is similar in size to the African market at ~US$2bn. Brazil, which is the largest market in the region with an annual demand of 2m units is currently dominated by Honda with an 82% market share which has a local production base in Brazil as well.
With an overall population of 340m (one-third of Africa), the potential opportunity in Latin America is not as large as the one in Africa. However, Latin America is already in the midst of a very strong boom in two-wheelers and hence, represents a good near-term opportunity.
Latin American countries are a bit of a contradiction in the sense that with GDP per capita at ~US$10,000, countries normally start moving away from two-wheelers to passenger cars. Also, a number of these countries already have a higher passenger car penetration than two-wheeler penetration.
The reason attributed to a trend different from the norm is on account of very wide income inequality in these countries. Thus, despite these countries being “middle-income” countries, ~40% of the population in these countries is poor.
Exhibit 20: Latin America Market
GDP per Capita (PPP) 5 Yr GDP growth 10 Yr GDP growth Population (m)
Argentina 17,554 7% 6% 41
Chile 15,848 4% 4% 17
Columbia 9,124 4% 4% 46
Guatemala 4,396 3% 3% 15
Peru 9,429 7% 6% 30
Brazil 10,264 4% 4% 195
Source: PL Research
Most of the countries have witnessed strong growth led by investments by Governments in upliftment of poor and hence, a surge in employment in the 2000s has also helped. This reduction in inequality has resulted in the emergence of a strong middle class and this consequently has resulted in a strong demand for two-wheelers.
For e.g., Argentinean two‐wheeler market
today is 6x of what it used to be in 2005
and is the second largest importer of two‐
wheelers globally after Nigeria
September 04, 2013 17
Automobiles
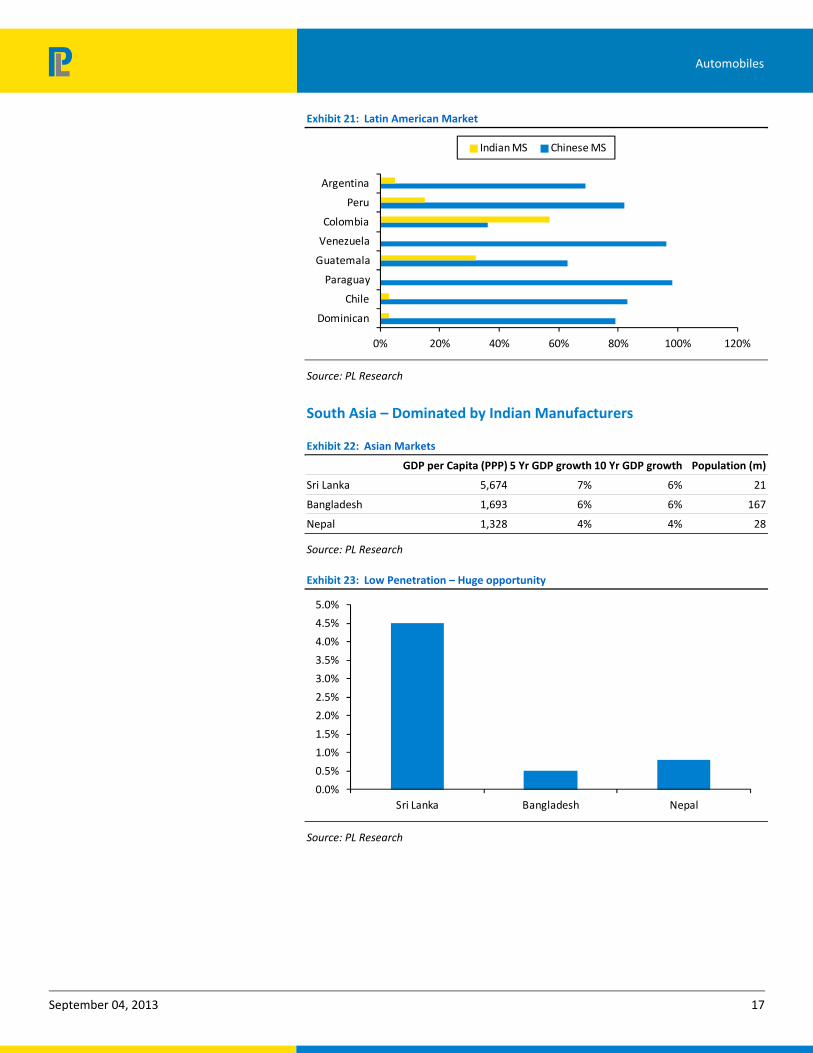
Exhibit 21: Latin American Market
0% 20% 40% 60% 80% 100% 120%
Dominican
Chile
Paraguay
Guatemala
Venezuela
Colombia
Peru
Argentina
Indian MS Chinese MS
Source: PL Research
South Asia – Dominated by Indian Manufacturers
Exhibit 22: Asian Markets
GDP per Capita (PPP) 5 Yr GDP growth 10 Yr GDP growth Population (m)
Sri Lanka 5,674 7% 6% 21
Bangladesh 1,693 6% 6% 167
Nepal 1,328 4% 4% 28
Source: PL Research
Exhibit 23: Low Penetration – Huge opportunity
0.0%
0.5%
1.0%
1.5%
2.0%
2.5%
3.0%
3.5%
4.0%
4.5%
5.0%
Sri Lanka Bangladesh Nepal
Source: PL Research
September 04, 2013 18
Automobiles
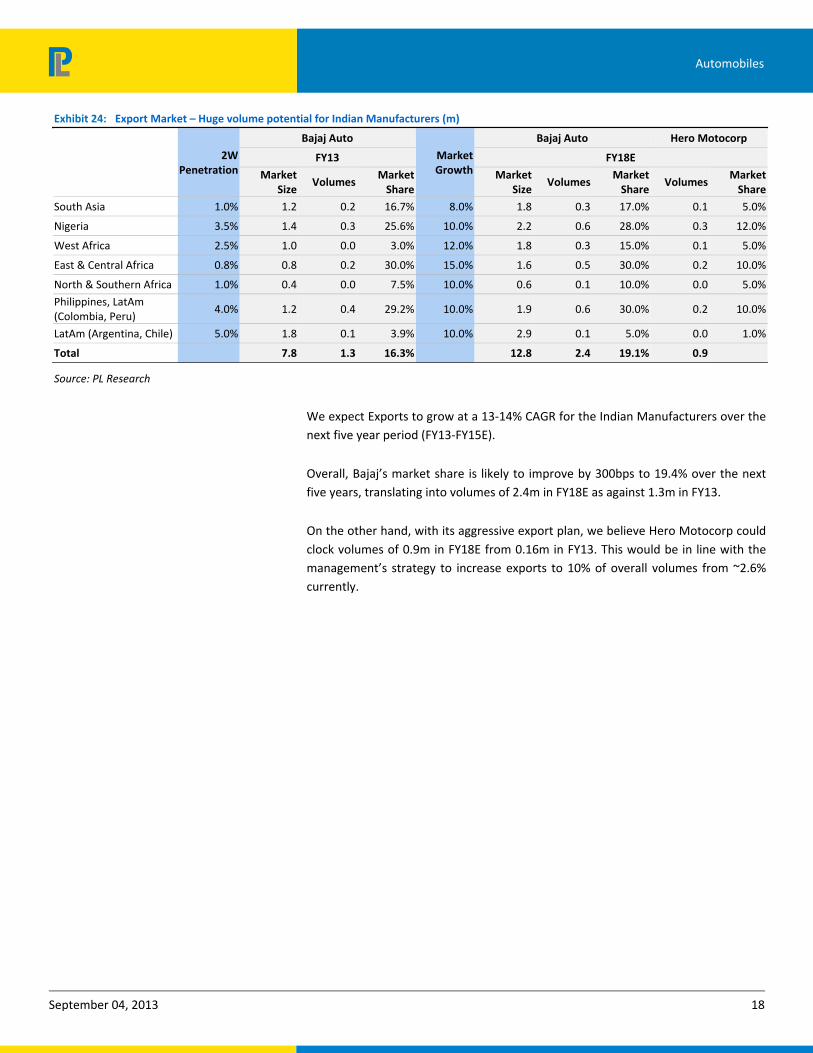
Exhibit 24: Export Market – Huge volume potential for Indian Manufacturers (m)
2W
Penetration
Bajaj Auto
Market Growth
Bajaj Auto Hero Motocorp
FY13 FY18E
Market Size
VolumesMarket Share
Market Size
Volumes Market Share
VolumesMarket Share
South Asia 1.0% 1.2 0.2 16.7% 8.0% 1.8 0.3 17.0% 0.1 5.0%
Nigeria 3.5% 1.4 0.3 25.6% 10.0% 2.2 0.6 28.0% 0.3 12.0%
West Africa 2.5% 1.0 0.0 3.0% 12.0% 1.8 0.3 15.0% 0.1 5.0%
East & Central Africa 0.8% 0.8 0.2 30.0% 15.0% 1.6 0.5 30.0% 0.2 10.0%
North & Southern Africa 1.0% 0.4 0.0 7.5% 10.0% 0.6 0.1 10.0% 0.0 5.0%
Philippines, LatAm (Colombia, Peru)
4.0% 1.2 0.4 29.2% 10.0% 1.9 0.6 30.0% 0.2 10.0%
LatAm (Argentina, Chile) 5.0% 1.8 0.1 3.9% 10.0% 2.9 0.1 5.0% 0.0 1.0%
Total 7.8 1.3 16.3% 12.8 2.4 19.1% 0.9
Source: PL Research
We expect Exports to grow at a 13-14% CAGR for the Indian Manufacturers over the next five year period (FY13-FY15E).
Overall, Bajaj’s market share is likely to improve by 300bps to 19.4% over the next five years, translating into volumes of 2.4m in FY18E as against 1.3m in FY13.
On the other hand, with its aggressive export plan, we believe Hero Motocorp could clock volumes of 0.9m in FY18E from 0.16m in FY13. This would be in line with the management’s strategy to increase exports to 10% of overall volumes from ~2.6% currently.
September 04, 2013 19
Automobiles
COMPANIES
Bajaj Auto
Export revenues to shore up margins; Upgrade to Accumulate
September 04, 2013
Prabhudas Lilladher Pvt. Ltd. and/or its associates (the 'Firm') does and/or seeks to do business with companies covered in its research reports. As a result investors should be aware that the Firm may have a conflict of interest that could affect the objectivity of the report. Investors should consider this report as only a single factor in making their investment decision.
Please refer to important disclosures and disclaimers at the end of the report
Compan
y Update Surjit Arora
[email protected] +91-22-66322235
Rating Accumulate
Price Rs1,889
Target Price Rs2,083
Implied Upside 10.3%
Sensex 18,568
Nifty 5,448
(Prices as on September 04, 2013)
Trading data
Market Cap. (Rs bn) 545.8
Shares o/s (m) 289.0
3M Avg. Daily value (Rs m) 913.7
Major shareholders
Promoters 50.02%
Foreign 18.20%
Domestic Inst. 7.26%
Public & Other 24.52%
Stock Performance
(%) 1M 6M 12M
Absolute (1.1) (5.0) 14.6
Relative 2.0 (3.4) 8.2
How we differ from Consensus
EPS (Rs) PL Cons. % Diff.
2014 119.1 123.5 ‐3.6
2015 138.8 141.8 ‐2.1
Price Performance (RIC:BAJA.BO, BB:BJAUT IN)
Source: Bloomberg
0
500
1,000
1,500
2,000
2,500
Sep-
12
Nov
-12
Jan-
13
Mar
-13
May
-13
Jul-1
3
Sep-
13
(Rs)
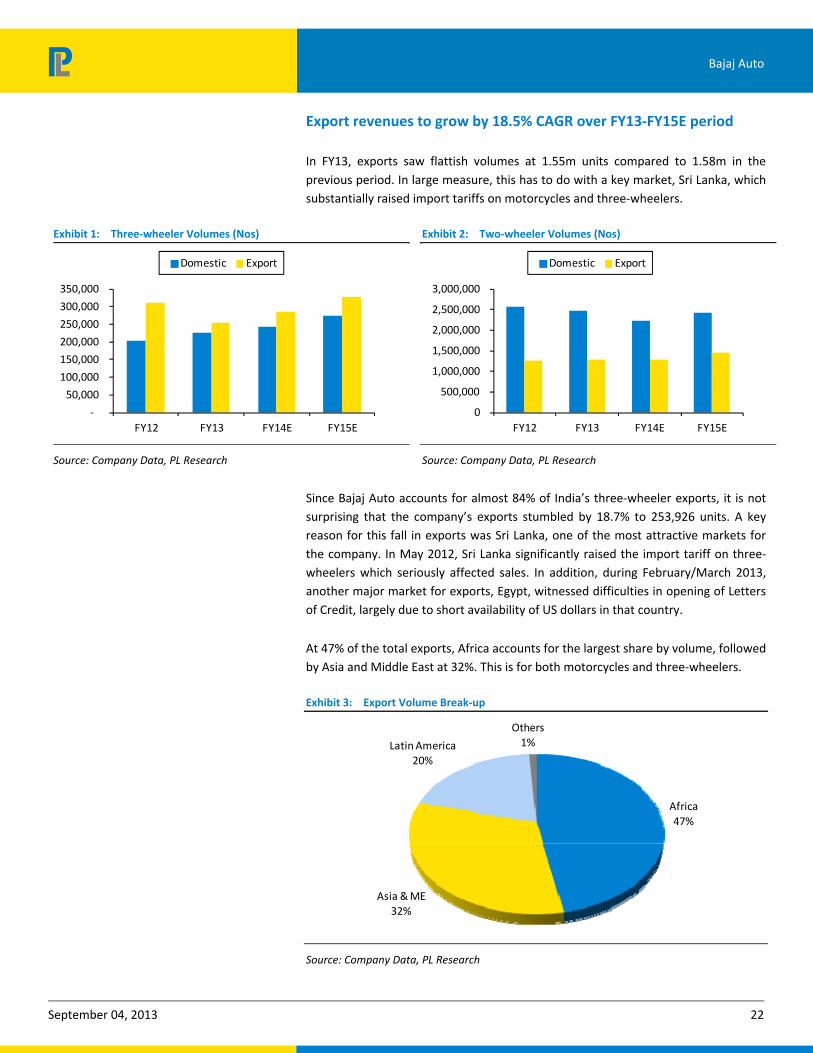
Export revenues to grow by 18.5% CAGR over FY13‐FY15E period: Led by 10.5% CAGR in average realisation/unit on account of rupee depreciation, export revenues are likely to increase from Rs67bn in FY13 to Rs94bn in FY15E. As against flattish two-wheeler volumes in FY14E, we anticipate a strong recovery of 13-14% in volumes in FY15E led by growth in African market and market share gain in Latin American market. Sri Lanka seems to have bottomed out; however, environment in Egypt has not improved. We expect the ASPs/vehicle to increase by 14% YoY in FY14E mainly on account of rupee depreciation. (We have assumed 60% benefit being retained). The management highlighted that the export realisation in the Q1FY14 stood at Rs55.6/$ which would inch upwards to Rs58-59/$ in the coming quarters.
Three‐wheeler volumes to grow at 11.8% CAGR during FY13‐FY15E period: With the opening of new permits and launch of diesel passenger three-wheelers, volumes are likely to grow at a CAGR of 10% during FY13-FY15E period. Permits for 20,000 three-wheelers have opened in Hyderabad and 35,000 permits are likely to open in Maharashtra soon. The company is confident of maintaining a monthly run-rate of 40,000 driven by new permits and strong exports. Bajaj Auto would tend to benefit the most from new permits being issued as it holds a dominant market share in this segment. We expect the domestic segment to grow at ~10.0% CAGR and exports to grow at ~13.5% CAGR for FY13-FY15E period.
Contd…21
Key financials (Y/e March) 2012 2013 2014E 2015E
Revenues (Rs m) 198,041 202,880 209,408 238,863
Growth (%) 20.8 2.4 3.2 14.1
EBITDA (Rs m) 39,951 39,260 45,552 53,585
PAT (Rs m) 31,375 29,116 34,451 40,167
EPS (Rs) 108.4 100.6 119.1 138.8
Growth (%) 20.1 (7.2) 18.3 16.6
Net DPS (Rs) 45.0 50.0 55.0 60.0
Profitability & Valuation 2012 2013 2014E 2015E
EBITDA margin (%) 20.2 19.4 21.8 22.4
RoE (%) 51.9 36.8 36.3 35.0
RoCE (%) 73.0 57.9 54.2 53.0
EV / sales (x) 2.7 2.7 2.6 2.2
EV / EBITDA (x) 13.3 13.8 11.9 10.0
PE (x) 17.4 18.8 15.9 13.6
P / BV (x) 9.0 6.9 5.8 4.8
Net dividend yield (%) 2.4 2.6 2.9 3.2
Source: Company Data; PL Research
September 04, 2013 21
Bajaj Auto
Two‐wheeler volumes to recover post CY13: As the slowdown in the domestic market continues and the competitive intensity increases, we don’t see a meaningful growth in the domestic market in FY14E for Bajaj Auto. However, given the six new variants of Discover to be launched over the next six months, there is likely to be recovery in volumes in H2FY14. We expect a 9.5% decline in domestic two-wheeler volumes in FY14E (YTD -14.0% decline) and build in 8.5% volume growth in FY15E (anticipating recovery in the two-wheeler sector).
Valuations attractive, given 17.5% earnings CAGR; Upgrade to ‘Accumulate’: We expect earnings to grow at a 17.5% CAGR over the next two years led by higher realisation in exports in FY14E and volume recovery in both export and domestic market in FY15E. We had a ‘Reduce’ rating on the stock in our post result note ((Stock Price: 1,985). However, with a positive outlook on the two-wheeler sector, the valuation at 15.9x FY12E EPS and 13.6x FY15E EPS seems attractive. Hence, we upgrade the stock to ‘Accumulate’ from ‘Reduce’ with a target price of Rs2,083 based on 15x FY15E EPS, a 10% premium to its average P/E of 13.5x 1 year fwd. (Earlier TP – Rs1,904 @14x FY15E EPS).
September 04, 2013 22
Bajaj Auto
Export revenues to grow by 18.5% CAGR over FY13‐FY15E period
In FY13, exports saw flattish volumes at 1.55m units compared to 1.58m in the previous period. In large measure, this has to do with a key market, Sri Lanka, which substantially raised import tariffs on motorcycles and three-wheelers.
Exhibit 1: Three‐wheeler Volumes (Nos)
-
50,000
100,000
150,000
200,000
250,000
300,000
350,000
FY12 FY13 FY14E FY15E
Domestic Export
Source: Company Data, PL Research
Exhibit 2: Two‐wheeler Volumes (Nos)
0
500,000
1,000,000
1,500,000
2,000,000
2,500,000
3,000,000
FY12 FY13 FY14E FY15E
Domestic Export
Source: Company Data, PL Research
Since Bajaj Auto accounts for almost 84% of India’s three-wheeler exports, it is not surprising that the company’s exports stumbled by 18.7% to 253,926 units. A key reason for this fall in exports was Sri Lanka, one of the most attractive markets for the company. In May 2012, Sri Lanka significantly raised the import tariff on three-wheelers which seriously affected sales. In addition, during February/March 2013, another major market for exports, Egypt, witnessed difficulties in opening of Letters of Credit, largely due to short availability of US dollars in that country.
At 47% of the total exports, Africa accounts for the largest share by volume, followed by Asia and Middle East at 32%. This is for both motorcycles and three-wheelers.
Exhibit 3: Export Volume Break‐up
Africa 47%
Asia & ME32%
Latin America20%
Others1%
Source: Company Data, PL Research
September 04, 2013 23
Bajaj Auto
Product wise, the highlights of the year have been the successful launch of Discover 125 ST and the Pulsar 200 NS across Latin America and Asia. In Latin America, both these models have helped reinforce Bajaj Auto’s dominant leadership position.
As in the last year, Boxer is the largest selling single brand in Africa. A new 150 cc version of it, the BM150, has continued to do well in East Africa and Egypt. Within Africa, Nigeria has witnessed significant growth in volumes and Bajaj Auto has captured market share from Chinese brands.
Within motorcycles, Boxer is the largest selling single brand in Africa. BM‐150 has been received well and holds good growth prospects. In Philippines, Boxer BM‐150 and the Pulsar 135 were launched and were well received, with the latter helping Bajaj Auto gain 34% market share in the Sports segment.
In Latin America, where Bajaj Auto sells 20% of its total motorcycle exports, market shares increased with the Pulsar brand doing exceptionally well. Pulsar 135 ranks among the top selling motorcycle models in various Latin American markets.
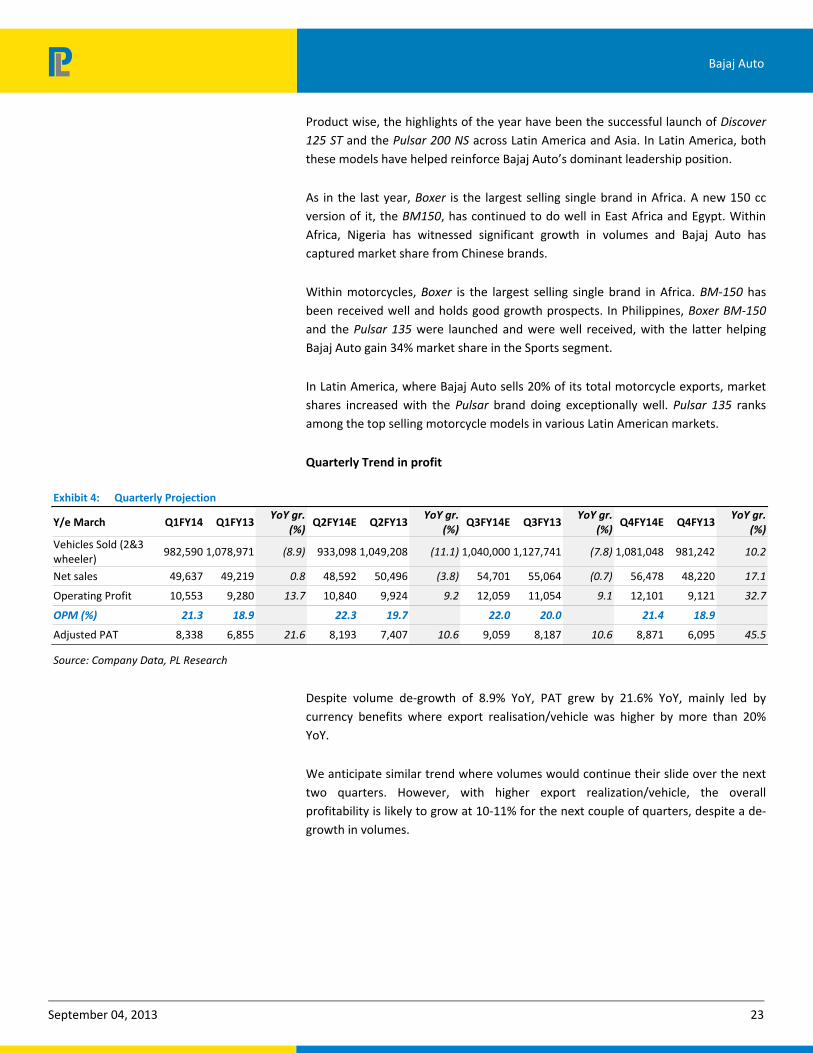
Quarterly Trend in profit
Exhibit 4: Quarterly Projection
Y/e March Q1FY14 Q1FY13 YoY gr.
(%) Q2FY14E Q2FY13
YoY gr. (%)
Q3FY14E Q3FY13 YoY gr.
(%) Q4FY14E Q4FY13
YoY gr. (%)
Vehicles Sold (2&3 wheeler)
982,590 1,078,971 (8.9) 933,098 1,049,208 (11.1) 1,040,000 1,127,741 (7.8) 1,081,048 981,242 10.2
Net sales 49,637 49,219 0.8 48,592 50,496 (3.8) 54,701 55,064 (0.7) 56,478 48,220 17.1
Operating Profit 10,553 9,280 13.7 10,840 9,924 9.2 12,059 11,054 9.1 12,101 9,121 32.7
OPM (%) 21.3 18.9 22.3 19.7 22.0 20.0 21.4 18.9
Adjusted PAT 8,338 6,855 21.6 8,193 7,407 10.6 9,059 8,187 10.6 8,871 6,095 45.5
Source: Company Data, PL Research
Despite volume de-growth of 8.9% YoY, PAT grew by 21.6% YoY, mainly led by currency benefits where export realisation/vehicle was higher by more than 20% YoY.
We anticipate similar trend where volumes would continue their slide over the next two quarters. However, with higher export realization/vehicle, the overall profitability is likely to grow at 10-11% for the next couple of quarters, despite a de-growth in volumes.
September 04, 2013 24
Bajaj Auto
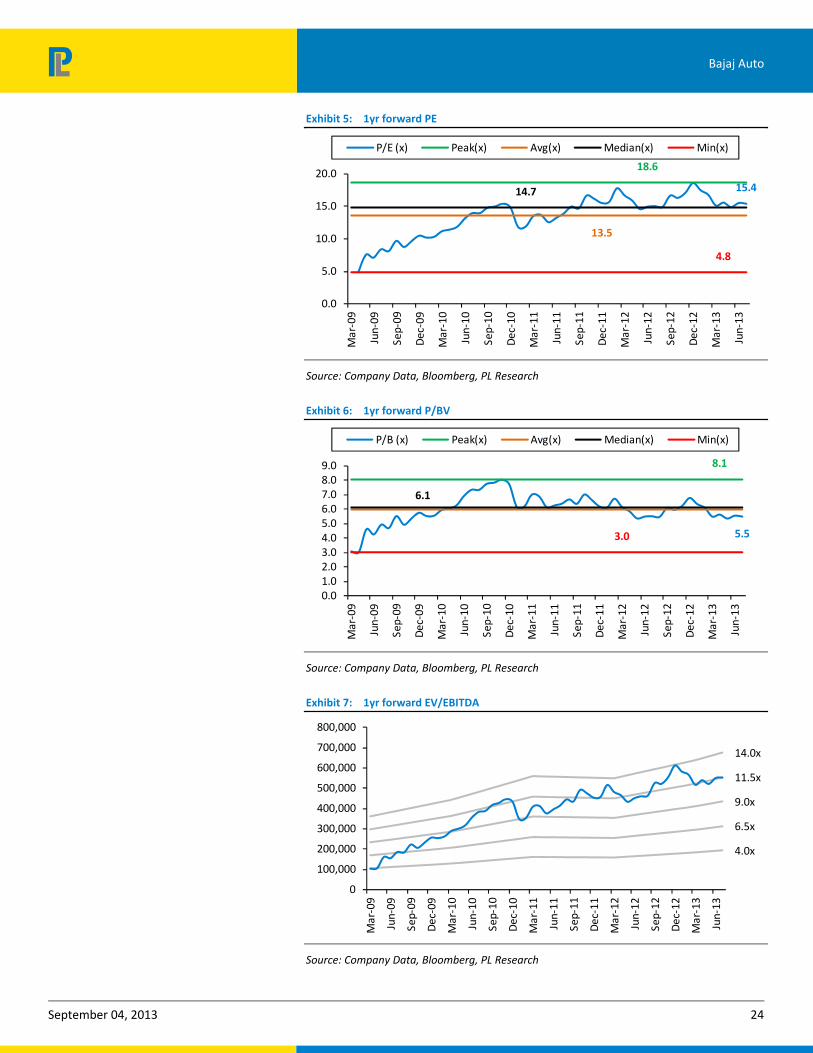
Exhibit 5: 1yr forward PE
15.4
18.6
13.5
14.7
4.8
0.0
5.0
10.0
15.0
20.0
Mar
-09
Jun-
09
Sep-
09
Dec
-09
Mar
-10
Jun-
10
Sep-
10
Dec
-10
Mar
-11
Jun-
11
Sep-
11
Dec
-11
Mar
-12
Jun-
12
Sep-
12
Dec
-12
Mar
-13
Jun-
13
P/E (x) Peak(x) Avg(x) Median(x) Min(x)
Source: Company Data, Bloomberg, PL Research
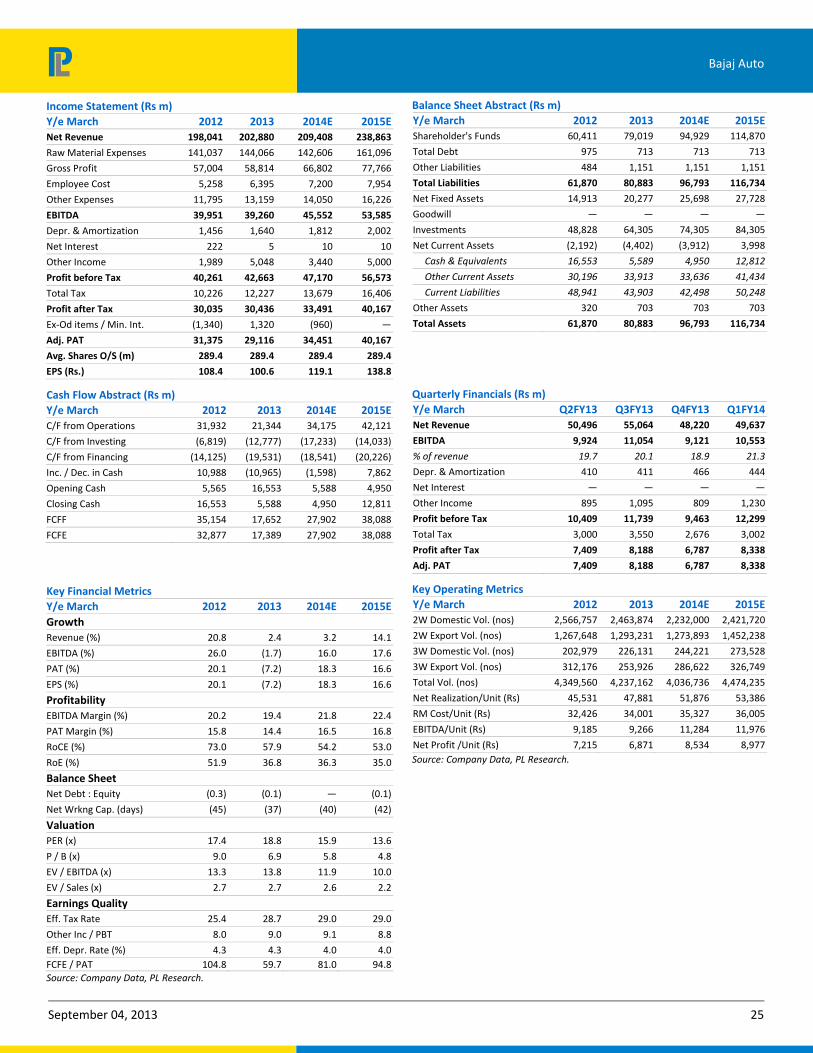
Exhibit 6: 1yr forward P/BV
5.5
8.1
6.1
3.0
0.01.02.03.04.05.06.07.08.09.0
Mar
-09
Jun-
09
Sep-
09
Dec
-09
Mar
-10
Jun-
10
Sep-
10
Dec
-10
Mar
-11
Jun-
11
Sep-
11
Dec
-11
Mar
-12
Jun-
12
Sep-
12
Dec
-12
Mar
-13
Jun-
13
P/B (x) Peak(x) Avg(x) Median(x) Min(x)
Source: Company Data, Bloomberg, PL Research
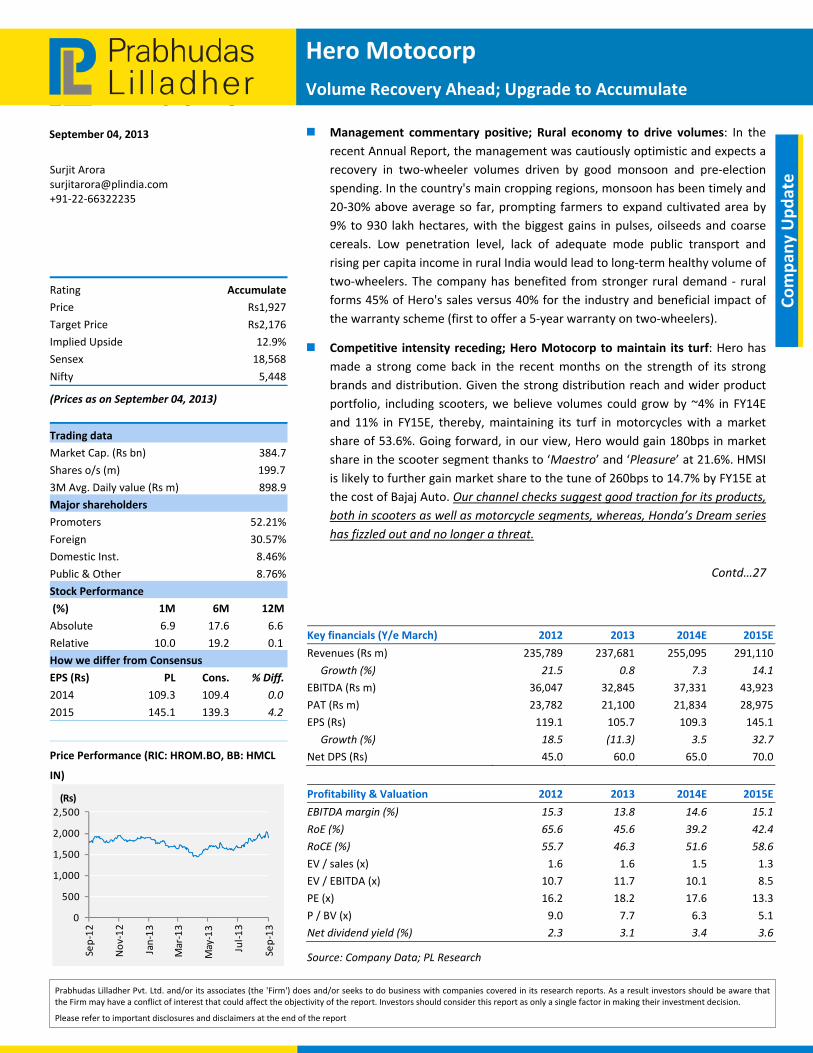
Exhibit 7: 1yr forward EV/EBITDA
4.0x
6.5x
9.0x
11.5x
14.0x
0
100,000
200,000
300,000
400,000
500,000
600,000
700,000
800,000
Mar
-09
Jun-
09
Sep-
09
Dec
-09
Mar
-10
Jun-
10
Sep-
10
Dec
-10
Mar
-11
Jun-
11
Sep-
11
Dec
-11
Mar
-12
Jun-
12
Sep-
12
Dec
-12
Mar
-13
Jun-
13
Source: Company Data, Bloomberg, PL Research
September 04, 2013 25
Bajaj Auto
Income Statement (Rs m)
Y/e March 2012 2013 2014E 2015E
Net Revenue 198,041 202,880 209,408 238,863
Raw Material Expenses 141,037 144,066 142,606 161,096
Gross Profit 57,004 58,814 66,802 77,766
Employee Cost 5,258 6,395 7,200 7,954
Other Expenses 11,795 13,159 14,050 16,226
EBITDA 39,951 39,260 45,552 53,585
Depr. & Amortization 1,456 1,640 1,812 2,002
Net Interest 222 5 10 10
Other Income 1,989 5,048 3,440 5,000
Profit before Tax 40,261 42,663 47,170 56,573
Total Tax 10,226 12,227 13,679 16,406
Profit after Tax 30,035 30,436 33,491 40,167
Ex-Od items / Min. Int. (1,340) 1,320 (960) —
Adj. PAT 31,375 29,116 34,451 40,167
Avg. Shares O/S (m) 289.4 289.4 289.4 289.4
EPS (Rs.) 108.4 100.6 119.1 138.8
Cash Flow Abstract (Rs m)
Y/e March 2012 2013 2014E 2015E
C/F from Operations 31,932 21,344 34,175 42,121
C/F from Investing (6,819) (12,777) (17,233) (14,033)
C/F from Financing (14,125) (19,531) (18,541) (20,226)
Inc. / Dec. in Cash 10,988 (10,965) (1,598) 7,862
Opening Cash 5,565 16,553 5,588 4,950
Closing Cash 16,553 5,588 4,950 12,811
FCFF 35,154 17,652 27,902 38,088
FCFE 32,877 17,389 27,902 38,088
Key Financial Metrics
Y/e March 2012 2013 2014E 2015E
Growth
Revenue (%) 20.8 2.4 3.2 14.1
EBITDA (%) 26.0 (1.7) 16.0 17.6
PAT (%) 20.1 (7.2) 18.3 16.6
EPS (%) 20.1 (7.2) 18.3 16.6
Profitability
EBITDA Margin (%) 20.2 19.4 21.8 22.4
PAT Margin (%) 15.8 14.4 16.5 16.8
RoCE (%) 73.0 57.9 54.2 53.0
RoE (%) 51.9 36.8 36.3 35.0
Balance Sheet
Net Debt : Equity (0.3) (0.1) — (0.1)
Net Wrkng Cap. (days) (45) (37) (40) (42)
Valuation
PER (x) 17.4 18.8 15.9 13.6
P / B (x) 9.0 6.9 5.8 4.8
EV / EBITDA (x) 13.3 13.8 11.9 10.0
EV / Sales (x) 2.7 2.7 2.6 2.2
Earnings Quality
Eff. Tax Rate 25.4 28.7 29.0 29.0
Other Inc / PBT 8.0 9.0 9.1 8.8
Eff. Depr. Rate (%) 4.3 4.3 4.0 4.0FCFE / PAT 104.8 59.7 81.0 94.8Source: Company Data, PL Research.
Balance Sheet Abstract (Rs m)
Y/e March 2012 2013 2014E 2015E
Shareholder's Funds 60,411 79,019 94,929 114,870
Total Debt 975 713 713 713
Other Liabilities 484 1,151 1,151 1,151
Total Liabilities 61,870 80,883 96,793 116,734
Net Fixed Assets 14,913 20,277 25,698 27,728
Goodwill — — — —
Investments 48,828 64,305 74,305 84,305
Net Current Assets (2,192) (4,402) (3,912) 3,998
Cash & Equivalents 16,553 5,589 4,950 12,812
Other Current Assets 30,196 33,913 33,636 41,434
Current Liabilities 48,941 43,903 42,498 50,248
Other Assets 320 703 703 703
Total Assets 61,870 80,883 96,793 116,734
Quarterly Financials (Rs m)
Y/e March Q2FY13 Q3FY13 Q4FY13 Q1FY14
Net Revenue 50,496 55,064 48,220 49,637
EBITDA 9,924 11,054 9,121 10,553
% of revenue 19.7 20.1 18.9 21.3
Depr. & Amortization 410 411 466 444
Net Interest — — — —
Other Income 895 1,095 809 1,230
Profit before Tax 10,409 11,739 9,463 12,299
Total Tax 3,000 3,550 2,676 3,002
Profit after Tax 7,409 8,188 6,787 8,338
Adj. PAT 7,409 8,188 6,787 8,338
Key Operating Metrics
Y/e March 2012 2013 2014E 2015E
2W Domestic Vol. (nos) 2,566,757 2,463,874 2,232,000 2,421,720
2W Export Vol. (nos) 1,267,648 1,293,231 1,273,893 1,452,238
3W Domestic Vol. (nos) 202,979 226,131 244,221 273,528
3W Export Vol. (nos) 312,176 253,926 286,622 326,749
Total Vol. (nos) 4,349,560 4,237,162 4,036,736 4,474,235
Net Realization/Unit (Rs) 45,531 47,881 51,876 53,386
RM Cost/Unit (Rs) 32,426 34,001 35,327 36,005
EBITDA/Unit (Rs) 9,185 9,266 11,284 11,976
Net Profit /Unit (Rs) 7,215 6,871 8,534 8,977Source: Company Data, PL Research.
Hero Motocorp
Volume Recovery Ahead; Upgrade to Accumulate
September 04, 2013
Prabhudas Lilladher Pvt. Ltd. and/or its associates (the 'Firm') does and/or seeks to do business with companies covered in its research reports. As a result investors should be aware that the Firm may have a conflict of interest that could affect the objectivity of the report. Investors should consider this report as only a single factor in making their investment decision.
Please refer to important disclosures and disclaimers at the end of the report
Compan
y Update Surjit Arora
[email protected] +91-22-66322235
Rating Accumulate
Price Rs1,927
Target Price Rs2,176
Implied Upside 12.9%
Sensex 18,568
Nifty 5,448
(Prices as on September 04, 2013)
Trading data
Market Cap. (Rs bn) 384.7
Shares o/s (m) 199.7
3M Avg. Daily value (Rs m) 898.9
Major shareholders
Promoters 52.21%
Foreign 30.57%
Domestic Inst. 8.46%
Public & Other 8.76%
Stock Performance
(%) 1M 6M 12M
Absolute 6.9 17.6 6.6
Relative 10.0 19.2 0.1
How we differ from Consensus
EPS (Rs) PL Cons. % Diff.
2014 109.3 109.4 0.0
2015 145.1 139.3 4.2
Price Performance (RIC: HROM.BO, BB: HMCL
IN)
0
500
1,000
1,500
2,000
2,500
Sep-
12
Nov
-12
Jan-
13
Mar
-13
May
-13
Jul-1
3
Sep-
13
(Rs)
Management commentary positive; Rural economy to drive volumes: In the recent Annual Report, the management was cautiously optimistic and expects a recovery in two-wheeler volumes driven by good monsoon and pre-election spending. In the country's main cropping regions, monsoon has been timely and 20-30% above average so far, prompting farmers to expand cultivated area by 9% to 930 lakh hectares, with the biggest gains in pulses, oilseeds and coarse cereals. Low penetration level, lack of adequate mode public transport and rising per capita income in rural India would lead to long-term healthy volume of two-wheelers. The company has benefited from stronger rural demand - rural forms 45% of Hero's sales versus 40% for the industry and beneficial impact of the warranty scheme (first to offer a 5-year warranty on two-wheelers).
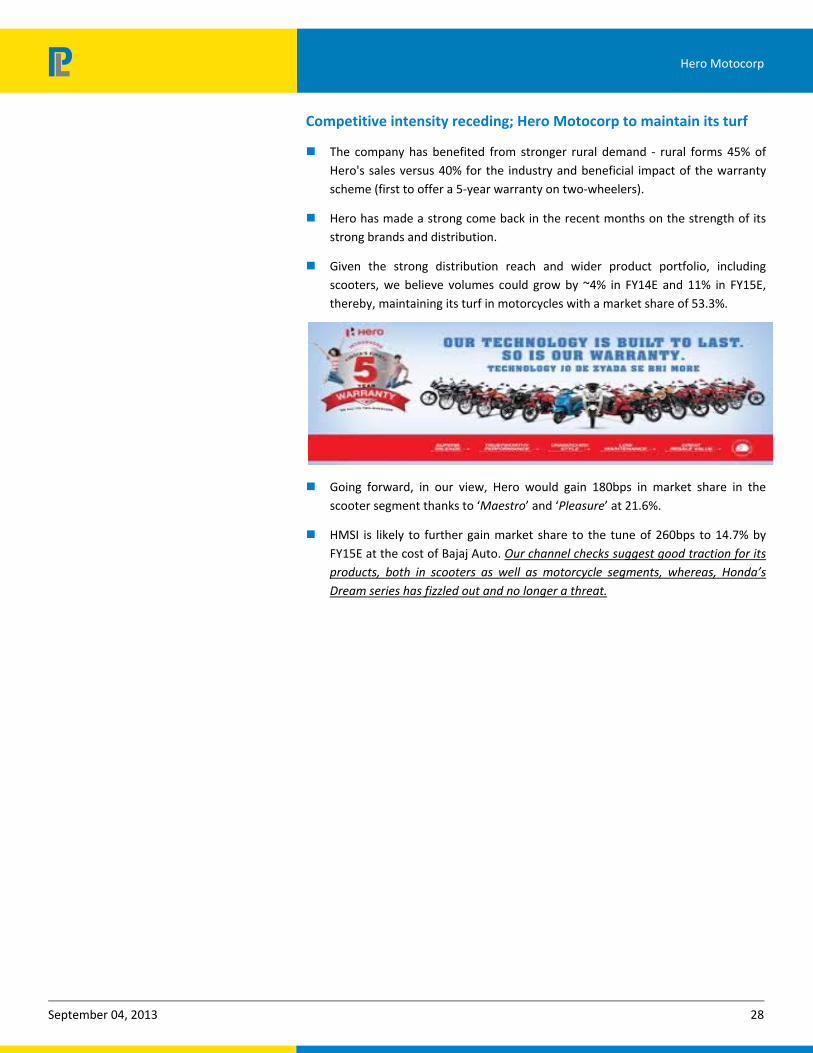
Competitive intensity receding; Hero Motocorp to maintain its turf: Hero has made a strong come back in the recent months on the strength of its strong brands and distribution. Given the strong distribution reach and wider product portfolio, including scooters, we believe volumes could grow by ~4% in FY14E and 11% in FY15E, thereby, maintaining its turf in motorcycles with a market share of 53.6%. Going forward, in our view, Hero would gain 180bps in market share in the scooter segment thanks to ‘Maestro’ and ‘Pleasure’ at 21.6%. HMSI is likely to further gain market share to the tune of 260bps to 14.7% by FY15E at the cost of Bajaj Auto. Our channel checks suggest good traction for its products, both in scooters as well as motorcycle segments, whereas, Honda’s Dream series
has fizzled out and no longer a threat.
Contd…27
Key financials (Y/e March) 2012 2013 2014E 2015E
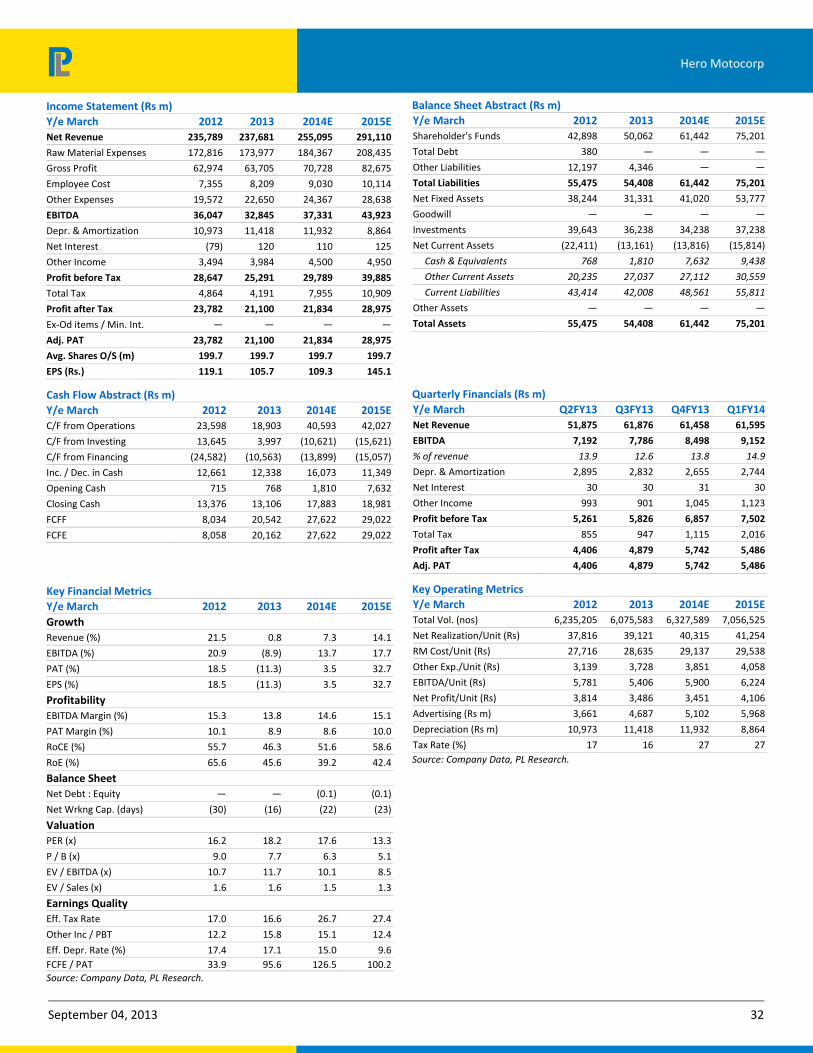
Revenues (Rs m) 235,789 237,681 255,095 291,110
Growth (%) 21.5 0.8 7.3 14.1
EBITDA (Rs m) 36,047 32,845 37,331 43,923
PAT (Rs m) 23,782 21,100 21,834 28,975
EPS (Rs) 119.1 105.7 109.3 145.1
Growth (%) 18.5 (11.3) 3.5 32.7
Net DPS (Rs) 45.0 60.0 65.0 70.0
Profitability & Valuation 2012 2013 2014E 2015E
EBITDA margin (%) 15.3 13.8 14.6 15.1
RoE (%) 65.6 45.6 39.2 42.4
RoCE (%) 55.7 46.3 51.6 58.6
EV / sales (x) 1.6 1.6 1.5 1.3
EV / EBITDA (x) 10.7 11.7 10.1 8.5
PE (x) 16.2 18.2 17.6 13.3
P / BV (x) 9.0 7.7 6.3 5.1
Net dividend yield (%) 2.3 3.1 3.4 3.6
Source: Company Data; PL Research
September 04, 2013 27
Hero Motocorp
Advanced R&D by tie‐ups with various international companies: During 2012-13, Hero Motocorp tied up with the Italian design firm Engines Engineering. The Bologna-based firm has been developing and designing scooters and motorcycles for various manufacturers over the years and is now sharing its expertise with Hero MotoCorp to help develop next generation two-wheelers. At the same time, R&D tie-up with AVL of Austria will help in developing new engines. It also tied up with EBR of the US to launch high-performance platform bikes for meeting domestic and international needs.
Entered high growth markets of Africa, LatAm and Asia: HMCL entered into a partnership with the reputed ABANS Group of Sri Lanka. Under the alliance, ABANS has been appointed as the sole distributor of Hero MotoCorp range of two-wheelers in Sri Lanka. HMCL has launched its range of two-wheelers in Guatemala City, El Salvador and Honduras, marking the iconic Indian brand’s first foray into new international markets. A partnership has been forged with Indy Motos Group of Guatemala to bring its two-wheelers to these markets. Under the alliance, Indy Motos has been appointed as the authorized distributor of Hero MotoCorp range of two-wheelers in Guatemala, Honduras and El Salvador. We expect exports to account for ~10% of volumes (0.9m) by FY18E end. We expect exports to grow by 40% in FY15E albeit at a lower base.
Earnings to grow at a CAGR of 18.0% for FY13‐FY15E period: We expect Hero to gain market share in scooters segment and maintain its market share in the motorcycle segment. We expect a 10.7% CAGR in revenues with margins likely to expand by 130bps (given the lower competitive intensity and cost cutting initiatives). At the same time, we expect savings of Rs4.5bn on account of royalty payments to Honda ending by March 2014. As a result, earnings are expected to grow at 18.0% CAGR for FY13-FY15E period. At the CMP, the stock trades at 17.6x FY14E EPS and 13.3x FY15E EPS. Hence, we upgrade the stock from ‘Reduce’ to ‘Accumulate’ with a TP of Rs2,176 based on 15x FY15E earnings, in line with its past 5 year average. The stock is likely to get re-rated given the strong rural economy and higher interest rates leading to a shift from four-wheeler stocks to two-wheelers.
September 04, 2013 28
Hero Motocorp
Competitive intensity receding; Hero Motocorp to maintain its turf
The company has benefited from stronger rural demand - rural forms 45% of Hero's sales versus 40% for the industry and beneficial impact of the warranty scheme (first to offer a 5-year warranty on two-wheelers).
Hero has made a strong come back in the recent months on the strength of its strong brands and distribution.
Given the strong distribution reach and wider product portfolio, including scooters, we believe volumes could grow by ~4% in FY14E and 11% in FY15E, thereby, maintaining its turf in motorcycles with a market share of 53.3%.
Going forward, in our view, Hero would gain 180bps in market share in the scooter segment thanks to ‘Maestro’ and ‘Pleasure’ at 21.6%.
HMSI is likely to further gain market share to the tune of 260bps to 14.7% by FY15E at the cost of Bajaj Auto. Our channel checks suggest good traction for its products, both in scooters as well as motorcycle segments, whereas, Honda’s
Dream series has fizzled out and no longer a threat.
September 04, 2013 29
Hero Motocorp
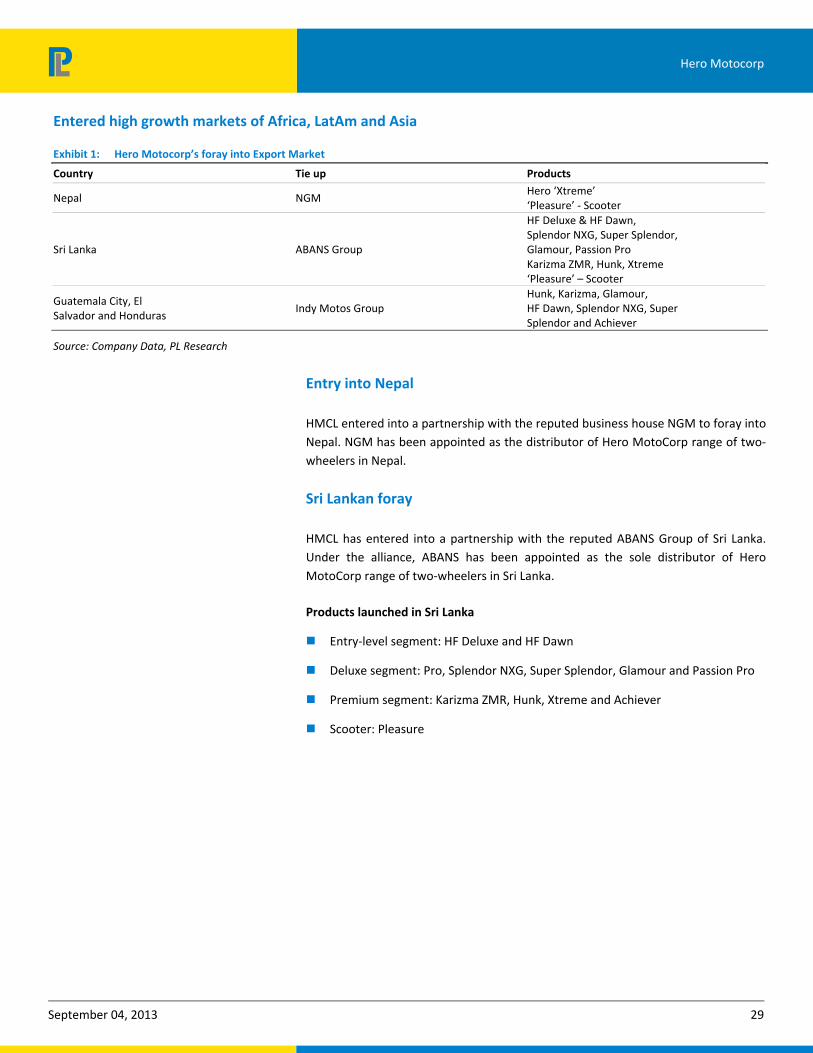
Entered high growth markets of Africa, LatAm and Asia
Exhibit 1: Hero Motocorp’s foray into Export Market
Country Tie up Products
Nepal NGM Hero ‘Xtreme’ ‘Pleasure’ - Scooter
Sri Lanka ABANS Group
HF Deluxe & HF Dawn, Splendor NXG, Super Splendor, Glamour, Passion Pro Karizma ZMR, Hunk, Xtreme ‘Pleasure’ – Scooter
Guatemala City, El Salvador and Honduras
Indy Motos Group Hunk, Karizma, Glamour, HF Dawn, Splendor NXG, Super Splendor and Achiever
Source: Company Data, PL Research
Entry into Nepal
HMCL entered into a partnership with the reputed business house NGM to foray into Nepal. NGM has been appointed as the distributor of Hero MotoCorp range of two-wheelers in Nepal.
Sri Lankan foray
HMCL has entered into a partnership with the reputed ABANS Group of Sri Lanka. Under the alliance, ABANS has been appointed as the sole distributor of Hero MotoCorp range of two-wheelers in Sri Lanka.
Products launched in Sri Lanka
Entry-level segment: HF Deluxe and HF Dawn
Deluxe segment: Pro, Splendor NXG, Super Splendor, Glamour and Passion Pro
Premium segment: Karizma ZMR, Hunk, Xtreme and Achiever
Scooter: Pleasure
September 04, 2013 30
Hero Motocorp
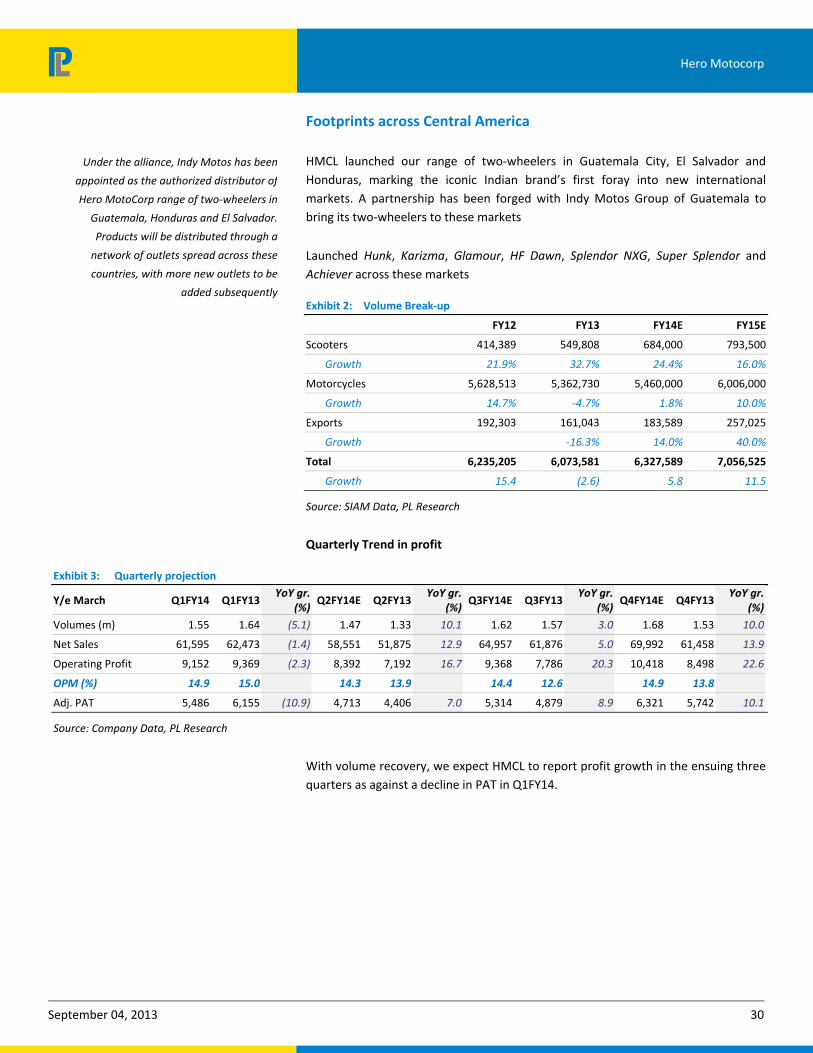
Footprints across Central America
HMCL launched our range of two-wheelers in Guatemala City, El Salvador and Honduras, marking the iconic Indian brand’s first foray into new international markets. A partnership has been forged with Indy Motos Group of Guatemala to bring its two-wheelers to these markets
Launched Hunk, Karizma, Glamour, HF Dawn, Splendor NXG, Super Splendor and Achiever across these markets
Exhibit 2: Volume Break‐up
FY12 FY13 FY14E FY15E
Scooters 414,389 549,808 684,000 793,500
Growth 21.9% 32.7% 24.4% 16.0%
Motorcycles 5,628,513 5,362,730 5,460,000 6,006,000
Growth 14.7% ‐4.7% 1.8% 10.0%
Exports 192,303 161,043 183,589 257,025
Growth ‐16.3% 14.0% 40.0%
Total 6,235,205 6,073,581 6,327,589 7,056,525
Growth 15.4 (2.6) 5.8 11.5
Source: SIAM Data, PL Research
Quarterly Trend in profit
Exhibit 3: Quarterly projection
Y/e March Q1FY14 Q1FY13 YoY gr.
(%) Q2FY14E Q2FY13
YoY gr. (%)
Q3FY14E Q3FY13YoY gr.
(%) Q4FY14E Q4FY13
YoY gr. (%)
Volumes (m) 1.55 1.64 (5.1) 1.47 1.33 10.1 1.62 1.57 3.0 1.68 1.53 10.0
Net Sales 61,595 62,473 (1.4) 58,551 51,875 12.9 64,957 61,876 5.0 69,992 61,458 13.9
Operating Profit 9,152 9,369 (2.3) 8,392 7,192 16.7 9,368 7,786 20.3 10,418 8,498 22.6
OPM (%) 14.9 15.0 14.3 13.9 14.4 12.6 14.9 13.8
Adj. PAT 5,486 6,155 (10.9) 4,713 4,406 7.0 5,314 4,879 8.9 6,321 5,742 10.1
Source: Company Data, PL Research
With volume recovery, we expect HMCL to report profit growth in the ensuing three quarters as against a decline in PAT in Q1FY14.
Under the alliance, Indy Motos has been
appointed as the authorized distributor of
Hero MotoCorp range of two‐wheelers in
Guatemala, Honduras and El Salvador.
Products will be distributed through a
network of outlets spread across these
countries, with more new outlets to be
added subsequently
September 04, 2013 31
Hero Motocorp
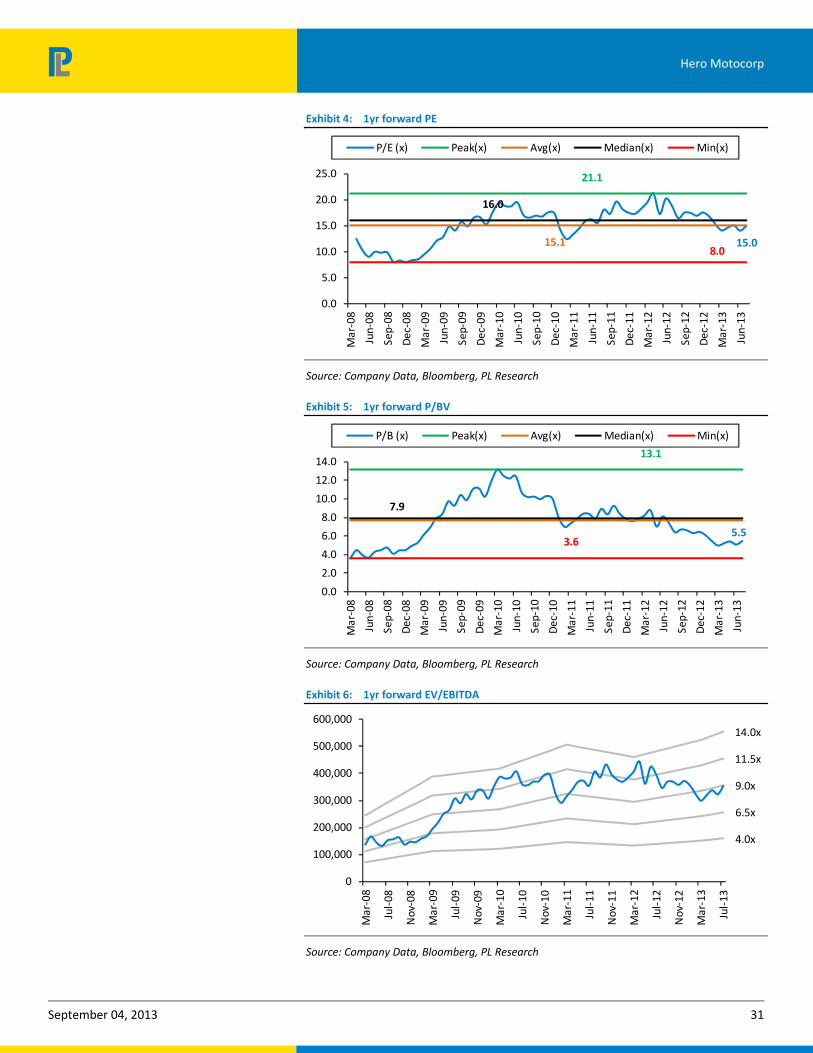
Exhibit 4: 1yr forward PE
15.0
21.1
15.1
16.0
8.0
0.0
5.0
10.0
15.0
20.0
25.0
Mar
-08
Jun-
08
Sep-
08
Dec
-08
Mar
-09
Jun-
09
Sep-
09
Dec
-09
Mar
-10
Jun-
10
Sep-
10
Dec
-10
Mar
-11
Jun-
11
Sep-
11
Dec
-11
Mar
-12
Jun-
12
Sep-
12
Dec
-12
Mar
-13
Jun-
13
P/E (x) Peak(x) Avg(x) Median(x) Min(x)
Source: Company Data, Bloomberg, PL Research
Exhibit 5: 1yr forward P/BV
5.5
13.1
7.9
3.6
0.0
2.0
4.0
6.0
8.0
10.0
12.0
14.0
Mar
-08
Jun-
08
Sep-
08
Dec
-08
Mar
-09
Jun-
09
Sep-
09
Dec
-09
Mar
-10
Jun-
10
Sep-
10
Dec
-10
Mar
-11
Jun-
11
Sep-
11
Dec
-11
Mar
-12
Jun-
12
Sep-
12
Dec
-12
Mar
-13
Jun-
13
P/B (x) Peak(x) Avg(x) Median(x) Min(x)
Source: Company Data, Bloomberg, PL Research
Exhibit 6: 1yr forward EV/EBITDA
4.0x
6.5x
9.0x
11.5x
14.0x
0
100,000
200,000
300,000
400,000
500,000
600,000
Mar
-08
Jul-
08
Nov
-08
Mar
-09
Jul-
09
Nov
-09
Mar
-10
Jul-
10
Nov
-10
Mar
-11
Jul-
11
Nov
-11
Mar
-12
Jul-
12
Nov
-12
Mar
-13
Jul-
13
Source: Company Data, Bloomberg, PL Research
September 04, 2013 32
Hero Motocorp
Income Statement (Rs m)
Y/e March 2012 2013 2014E 2015E
Net Revenue 235,789 237,681 255,095 291,110
Raw Material Expenses 172,816 173,977 184,367 208,435
Gross Profit 62,974 63,705 70,728 82,675
Employee Cost 7,355 8,209 9,030 10,114
Other Expenses 19,572 22,650 24,367 28,638
EBITDA 36,047 32,845 37,331 43,923
Depr. & Amortization 10,973 11,418 11,932 8,864
Net Interest (79) 120 110 125
Other Income 3,494 3,984 4,500 4,950
Profit before Tax 28,647 25,291 29,789 39,885
Total Tax 4,864 4,191 7,955 10,909
Profit after Tax 23,782 21,100 21,834 28,975
Ex-Od items / Min. Int. — — — —
Adj. PAT 23,782 21,100 21,834 28,975
Avg. Shares O/S (m) 199.7 199.7 199.7 199.7
EPS (Rs.) 119.1 105.7 109.3 145.1
Cash Flow Abstract (Rs m)
Y/e March 2012 2013 2014E 2015E
C/F from Operations 23,598 18,903 40,593 42,027
C/F from Investing 13,645 3,997 (10,621) (15,621)
C/F from Financing (24,582) (10,563) (13,899) (15,057)
Inc. / Dec. in Cash 12,661 12,338 16,073 11,349
Opening Cash 715 768 1,810 7,632
Closing Cash 13,376 13,106 17,883 18,981
FCFF 8,034 20,542 27,622 29,022
FCFE 8,058 20,162 27,622 29,022
Key Financial Metrics
Y/e March 2012 2013 2014E 2015E
Growth
Revenue (%) 21.5 0.8 7.3 14.1
EBITDA (%) 20.9 (8.9) 13.7 17.7
PAT (%) 18.5 (11.3) 3.5 32.7
EPS (%) 18.5 (11.3) 3.5 32.7
Profitability
EBITDA Margin (%) 15.3 13.8 14.6 15.1
PAT Margin (%) 10.1 8.9 8.6 10.0
RoCE (%) 55.7 46.3 51.6 58.6
RoE (%) 65.6 45.6 39.2 42.4
Balance Sheet
Net Debt : Equity — — (0.1) (0.1)
Net Wrkng Cap. (days) (30) (16) (22) (23)
Valuation
PER (x) 16.2 18.2 17.6 13.3
P / B (x) 9.0 7.7 6.3 5.1
EV / EBITDA (x) 10.7 11.7 10.1 8.5
EV / Sales (x) 1.6 1.6 1.5 1.3
Earnings Quality
Eff. Tax Rate 17.0 16.6 26.7 27.4
Other Inc / PBT 12.2 15.8 15.1 12.4
Eff. Depr. Rate (%) 17.4 17.1 15.0 9.6FCFE / PAT 33.9 95.6 126.5 100.2Source: Company Data, PL Research.
Balance Sheet Abstract (Rs m)
Y/e March 2012 2013 2014E 2015E
Shareholder's Funds 42,898 50,062 61,442 75,201
Total Debt 380 — — —
Other Liabilities 12,197 4,346 — —
Total Liabilities 55,475 54,408 61,442 75,201
Net Fixed Assets 38,244 31,331 41,020 53,777
Goodwill — — — —
Investments 39,643 36,238 34,238 37,238
Net Current Assets (22,411) (13,161) (13,816) (15,814)
Cash & Equivalents 768 1,810 7,632 9,438
Other Current Assets 20,235 27,037 27,112 30,559
Current Liabilities 43,414 42,008 48,561 55,811
Other Assets — — — —
Total Assets 55,475 54,408 61,442 75,201
Quarterly Financials (Rs m)
Y/e March Q2FY13 Q3FY13 Q4FY13 Q1FY14
Net Revenue 51,875 61,876 61,458 61,595
EBITDA 7,192 7,786 8,498 9,152
% of revenue 13.9 12.6 13.8 14.9
Depr. & Amortization 2,895 2,832 2,655 2,744
Net Interest 30 30 31 30
Other Income 993 901 1,045 1,123
Profit before Tax 5,261 5,826 6,857 7,502
Total Tax 855 947 1,115 2,016
Profit after Tax 4,406 4,879 5,742 5,486
Adj. PAT 4,406 4,879 5,742 5,486
Key Operating Metrics
Y/e March 2012 2013 2014E 2015E
Total Vol. (nos) 6,235,205 6,075,583 6,327,589 7,056,525
Net Realization/Unit (Rs) 37,816 39,121 40,315 41,254
RM Cost/Unit (Rs) 27,716 28,635 29,137 29,538
Other Exp./Unit (Rs) 3,139 3,728 3,851 4,058
EBITDA/Unit (Rs) 5,781 5,406 5,900 6,224
Net Profit/Unit (Rs) 3,814 3,486 3,451 4,106
Advertising (Rs m) 3,661 4,687 5,102 5,968
Depreciation (Rs m) 10,973 11,418 11,932 8,864
Tax Rate (%) 17 16 27 27Source: Company Data, PL Research.
September 04, 2013 33
Hero Motocorp
Prabhudas Lilladher Pvt. Ltd.
3rd Floor, Sadhana House, 570, P. B. Marg, Worli, Mumbai-400 018, India
Tel: (91 22) 6632 2222 Fax: (91 22) 6632 2209
Rating Distribution of Research Coverage
26.4%
52.8%
17.6%
3.2%
0%
10%
20%
30%
40%
50%
60%
BUY Accumulate Reduce Sell
% of Total Coverage
PL’s Recommendation Nomenclature
BUY : Over 15% Outperformance to Sensex over 12-months Accumulate : Outperformance to Sensex over 12-months
Reduce : Underperformance to Sensex over 12-months Sell : Over 15% underperformance to Sensex over 12-months
Trading Buy : Over 10% absolute upside in 1-month Trading Sell : Over 10% absolute decline in 1-month
Not Rated (NR) : No specific call on the stock Under Review (UR) : Rating likely to change shortly
This document has been prepared by the Research Division of Prabhudas Lilladher Pvt. Ltd. Mumbai, India (PL) and is meant for use by the recipient only as
information and is not for circulation. This document is not to be reported or copied or made available to others without prior permission of PL. It should not be
considered or taken as an offer to sell or a solicitation to buy or sell any security.
The information contained in this report has been obtained from sources that are considered to be reliable. However, PL has not independently verified the accuracy
or completeness of the same. Neither PL nor any of its affiliates, its directors or its employees accept any responsibility of whatsoever nature for the information,
statements and opinion given, made available or expressed herein or for any omission therein.
Recipients of this report should be aware that past performance is not necessarily a guide to future performance and value of investments can go down as well. The
suitability or otherwise of any investments will depend upon the recipient's particular circumstances and, in case of doubt, advice should be sought from an
independent expert/advisor.
Either PL or its affiliates or its directors or its employees or its representatives or its clients or their relatives may have position(s), make market, act as principal or
engage in transactions of securities of companies referred to in this report and they may have used the research material prior to publication.
We may from time to time solicit or perform investment banking or other services for any company mentioned in this document.