Automatic text summarisation using linguistic knowledge ...
240
AUTOMATIC TEXT SUMMARISATION USING LINGUISTIC KNOWLEDGE-BASED SEMANTICS MUHIDIN ABDULLAHI MOHAMED Thesis submitted for the degree of Doctor of Philosophy Department of Electronic, Electrical and Systems Engineering School of Engineering College of Engineering and Physical Sciences University of Birmingham January 2016
-
Upload
khangminh22 -
Category
Documents
-
view
1 -
download
0
Transcript of Automatic text summarisation using linguistic knowledge ...

AUTOMATIC TEXT SUMMARISATION USING
LINGUISTIC KNOWLEDGE-BASED SEMANTICS
MUHIDIN ABDULLAHI MOHAMED
Thesis submitted for the degree of
Doctor of Philosophy
Department of Electronic, Electrical and Systems Engineering
School of Engineering
College of Engineering and Physical Sciences
University of Birmingham
January 2016

University of Birmingham Research Archive
e-theses repository This unpublished thesis/dissertation is copyright of the author and/or third parties. The intellectual property rights of the author or third parties in respect of this work are as defined by The Copyright Designs and Patents Act 1988 or as modified by any successor legislation. Any use made of information contained in this thesis/dissertation must be in accordance with that legislation and must be properly acknowledged. Further distribution or reproduction in any format is prohibited without the permission of the copyright holder.

ii
ACKNOWLEDGEMENT
The work in thesis would not have been fruitful without the support of others.
My deep thanks to my supervisor Dr. Mourad Oussalah for his priceless advice and guidance
throughout the duration of this study, which has enabled me to complete it in time. I benefited
from the endless discussions with him while making me feel not only as a supervisor but also
as a helpful friend.
I would also like to thank my second supervisor Professor Martin Russell for his help and
invaluable advice, particularly towards the end of this work. My gratitude also goes to Dr.
Bernd Bohnet for his support and advice while doing this thesis.
My sincere gratitude to my financial sponsor, the Islamic Development Bank – IDB, for
awarding me the Merit Scholarship Programme for High Technology (MSP) and for their
generous financial support without which this work would have been fruitless.
Last but not least, let me take this opportunity to express my special appreciation to my
family for their love and encouragement to complete this work.

iii
ABSTRACT
Text summarisation is reducing a text document to a short substitute summary. Since the
commencement of the field, almost all summarisation research works implemented to this
date involve identification and extraction of the most important document/cluster segments,
called extraction. This typically involves scoring each document sentence according to a
composite scoring function consisting of surface level and semantic features. Enabling
machines to analyse text features and understand their meaning potentially requires both text
semantic analysis and equipping computers with an external semantic knowledge. This thesis
addresses extractive text summarisation by proposing a number of semantic and knowledge-
based approaches. The work combines the high-quality semantic information in WordNet, the
crowdsourced encyclopaedic knowledge in Wikipedia, and the manually crafted categorial
variation in CatVar, to improve the summary quality. Such improvements are accomplished
through sentence level morphological analysis and the incorporation of Wikipedia-based
named-entity semantic relatedness while using heuristic algorithms. The study also
investigates how sentence-level semantic analysis based on semantic role labelling (SRL),
leveraged with a background world knowledge, influences sentence textual similarity and text
summarisation. The proposed sentence similarity and summarisation methods were evaluated
on standard publicly available datasets such as the Microsoft Research Paraphrase Corpus
(MSRPC), TREC-9 Question Variants, and the Document Understanding Conference 2002,
2005, 2006 (DUC 2002, DUC 2005, DUC 2006) Corpora. The project also uses Recall-
Oriented Understudy for Gisting Evaluation (ROUGE) for the quantitative assessment of the
proposed summarisers’ performances. Results of our systems showed their effectiveness as
compared to related state-of-the-art summarisation methods and baselines. Of the proposed
summarisers, the SRL Wikipedia-based system demonstrated the best performance.

iv
CONTENTS
ACKNOWLEDGEMENT ..................................................................................ii
ABSTRACT ....................................................................................................... iii
CONTENTS ........................................................................................................ iv
LIST OF FIGURES ........................................................................................... ix
LIST OF TABLES ............................................................................................xii
LIST OF ABBREVIATIONS ......................................................................... xiv
1. INTRODUCTION ........................................................................................ 1
1.1 Introduction ....................................................................................................... 1
1.2 Motivation ......................................................................................................... 4
1.3 Scope of the Thesis ........................................................................................... 5
1.4 Research Questions ........................................................................................... 6
1.5 Contributions of the Thesis ............................................................................... 7
1.6 Organisation of the Thesis ................................................................................ 9
2. A BACKGROUND REVIEW ON EXISTING LITERATURE ............ 13
2.1 Introduction ..................................................................................................... 13
2.2 Automatic Text Summarisation (ATS) ........................................................... 13
2.3 Categorisation of Text Summaries .................................................................. 15
2.4 Approaches for Extractive Text Summarisation ............................................. 20
2.4.1 Statistical Methods ................................................................................................ 20
2.4.2 Linguistic Knowledge-based Methods .................................................................. 22
2.4.3 Graph-based Methods ............................................................................................ 25
2.4.4 Machine Learning Based Methods ........................................................................ 28
2.4.5 Other Methods ....................................................................................................... 30
2.5 Evaluation Methods for Text Summarisation ................................................. 32
2.5.1 Intrinsic Evaluation................................................................................................ 32
2.5.1.1 Co-selection Methods .................................................................................................. 33
2.5.1.2 Content-based Methods ................................................................................................ 34
2.5.2 Extrinsic Evaluation .............................................................................................. 37
2.5.3 Evaluation Conferences for Text Summarisation .................................................. 38
2.6 Challenges of Text Summarisation ................................................................. 40

v
2.7 Summary ......................................................................................................... 44
3. LEXICAL-SEMANTIC KNOWLEDGE SOURCES ............................. 45
3.1 Introduction ..................................................................................................... 45
3.2 WordNet .......................................................................................................... 46
3.3 Wikipedia ........................................................................................................ 50
3.4 Categorial Variation Database (CatVar) ......................................................... 53
3.5 Morphosemantic Database .............................................................................. 54
3.6 Usage of the Resources ................................................................................... 55
3.7 Summary ......................................................................................................... 57
4. TAXONOMY BASED SENTENCE TEXTUAL SIMILARITY
ENHANCED WITH SYNTACTIC CATEGORY CONVERSION ............ 58
4.1 Introduction ..................................................................................................... 58
4.2 Taxonomy-based Word Similarity .................................................................. 61
4.2.1 WordNet Taxonomy .............................................................................................. 61
4.2.2 Similarity Measures ............................................................................................... 63
4.2.2.1 Path Based Measures ................................................................................................... 65
4.2.2.2 Information Content (IC) Based Measures .................................................................. 66
4.2.3 Some Properties of Taxonomy-based Semantic Similarity Measures ................... 68
4.3 WordNet-based Sentence Textual Similarity ................................................. 73
4.3.1 Traditional Approach ............................................................................................. 74
4.3.2 An Approach Aided with Part of Speech Conversion ........................................... 75
4.3.2.1 An Illustrative Example ............................................................................................... 77
4.3.2.2 CatVar-Assisted Part-of-Speech Conversion ............................................................... 78
4.3.2.3 Using WordNet Relations for Part-of-Speech Conversion .......................................... 80
4.3.2.4 Part-of-Speech Conversion Aided with Morphosemantic Links ................................. 83
4.4 Experiments ......................................................................................................... 84
4.4.1 Experiment 1: Target Category Identification: ...................................................... 84
4.4.1.1 Dataset .......................................................................................................................... 84
4.4.1.2 Results and Discussion................................................................................................. 84
4.4.2 Experiment 2: Comparison of the Conversion Aided Methods ............................ 87
4.4.2.1 Dataset .......................................................................................................................... 87
4.4.2.2 Results and Discussion................................................................................................ 88

vi
4.4.3 Experiment 3: Evaluation of the Proposed Approach on Paraphrase Identification
.......................................................................................................................................... 91
4.4.3.1 Dataset .......................................................................................................................... 91
4.4.3.2 Evaluation Metrics ....................................................................................................... 92
4.4.3.3 Results and Discussion................................................................................................. 93
4.5 Related Works ..................................................................................................... 95
4.6 Summary ............................................................................................................. 98
5. A HYBRID APPROACH FOR QUERY-FOCUSSED MULTI-
DOCUMENT SUMMARISATION USING KNOWLEDGE-ENRICHED
SEMANTIC HEURISTICS ............................................................................. 99
5.1 Introduction ..................................................................................................... 99
5.2 Using Wikipedia as a Named Entity Repository .......................................... 101
5.2.1 Overview ............................................................................................................. 101
5.2.2 Named-entities in Wikipedia ............................................................................... 102
5.2.3 Extracting Named-entities from Wikipedia. ........................................................ 104
5.3 A Knowledge-Enriched Short Text Semantic Similarity Measure ............... 107
5.3.1 Semantic Similarity between Content Words ...................................................... 107
5.3.2 Semantic Relatedness between Named-entities .................................................. 108
5.3.3 A Brief Discussion on the Named Entity Semantic Relatedness Measure.......... 111
5.3.4 A Hybrid Similarity Measure .............................................................................. 115
5.4 Sentence Ranking in MMR Framework for Query-focused Summarisation 120
5.4.1 Maximum Marginal Relevance ........................................................................... 120
5.4.2 Feature Design ..................................................................................................... 121
5.4.2.1 Query Relevance ........................................................................................................ 121
5.4.2.2 Sentence Centrality .................................................................................................... 122
5.4.3 Sentence Scoring ................................................................................................. 123
5.4.4 Summary Extraction ............................................................................................ 123
5.5 Experiments .................................................................................................. 124
5.5.1 Experiment 1: Classification and Extraction of Wikipedia Entities .................... 125
5.5.1.1 Experimental Setup .................................................................................................... 125
5.5.1.2 Dataset ........................................................................................................................ 126
5.5.1.3 Results and Discussion............................................................................................... 127
5.5.2 Experiment 2: Paraphrase Identification with the Hybrid Approach .................. 129
5.5.2.1 Dataset ........................................................................................................................ 129

vii
5.5.2.2 Results and Discussion............................................................................................... 129
5.5.3 Experiment 3: Query-focussed Multi-document Summarisation with the Hybrid
Approach ........................................................................................................................ 135
5.5.3.1 Experimental Setup .................................................................................................... 135
5.5.3.2 Evaluation Metric ....................................................................................................... 136
5.5.3.3 Evaluation Dataset ..................................................................................................... 139
5.5.3.4 Results and Discussion............................................................................................... 139
5.6 Related Works ............................................................................................... 145
5.7 Summary ....................................................................................................... 148
6. SEMANTIC ROLE LABELING WITH WIKIPEDIA-BASED
EXPLICIT SEMANTIC ANALYSIS FOR TEXT SUMMARISATION . 150
6.1 Introduction ................................................................................................... 150
6.2 Applied Techniques for Semantic Analysis .................................................. 153
6.2.1 Semantic Role Labelling ..................................................................................... 153
6.2.2 Explicit Semantic Analysis .................................................................................. 156
6.3 SRL-ESA Based Summarisation Model ....................................................... 157
6.3.1 Overview ............................................................................................................. 157
6.3.2 Merging Cluster Documents ................................................................................ 160
6.3.3 Computing SRL-ESA Based Semantic Similarity .............................................. 161
6.3.3.1 Role-Term Tables ...................................................................................................... 163
6.3.3.2 Terms to Concepts Interpretation ............................................................................... 164
6.3.3.3 Similarity Function .................................................................................................... 166
6.3.4 Generic Single and Multi-document Summarisation .......................................... 168
6.3.4.1 PageRank Algorithm .................................................................................................. 169
6.3.4.2 Ranking Sentences with PageRank Algorithm .......................................................... 170
6.3.5 Query-focussed Multi-document Summarisation ................................................ 174
6.3.5.1 Query Dependent Features ......................................................................................... 175
6.3.5.2 Query Independent Features ...................................................................................... 177
6.3.5.3 Ranking Sentences and Extracting the Summary ...................................................... 178
6.4 Experiments .................................................................................................. 179
6.4.1 Evaluation Datasets ............................................................................................. 179
6.4.2 Experiment 1: Query-based Summarisation ....................................................... 179
6.4.2.1 Influence of Feature Weighting ................................................................................. 181
6.4.2.2 Comparison with Related Works ............................................................................... 182

viii
6.4.3 Experiment 2: Generic Single Document and Multi-document Summarisation . 183
6.4.3.1 Generalization and the Impact of Data size ............................................................... 184
6.4.3.2 Comparison with Benchmark Methods ...................................................................... 186
6.5 Related Works ............................................................................................... 188
6.6 Summary ....................................................................................................... 189
7. CONCLUSIONS AND FUTURE WORK .............................................. 191
7.1 Summary of the Thesis Contributions .......................................................... 191
7.1.1 Taxonomy-based STS Enhanced with Syntactic Category Conversion ............. 191
7.1.2 A Hybrid Qf-MDS Approach Based on Knowledge-enriched Semantic Heuristics
........................................................................................................................................ 192
7.1.3 Wikipedia-based Text Summarisation with Semantic Role Labelling ............... 193
7.2 Conclusions ................................................................................................... 194
7.3 Future Work .................................................................................................. 195
References ........................................................................................................ 197
Appendices ....................................................................................................... 208
Appendix A ............................................................................................................. 209
Appendix B ............................................................................................................. 214
Appendix C ............................................................................................................. 216
Appendix D ............................................................................................................. 224
ix
LIST OF FIGURES
Figure 1.1: Thesis components and research workflow. .......................................................... 10
Figure 2.1: A generic automatic text summarisation system [26]. .......................................... 15
Figure 2.2: Classification of text summaries based on context factors and language. ............ 18
Figure 2.3: A generic sentence similarity graph for 8-sentence document.............................. 25
Figure 2.4: Sentence similarity graph based on wAA method [21]. ........................................ 27
Figure 2.5: Approaches for extractive text summarisation. ..................................................... 31
Figure 2.6: Categorising evaluation measures for text summarisation. ................................... 37
Figure 2.7: Document Understanding Conferences (DUC). .................................................... 39
Figure 3.1: WordNet fragment: taxonomy, synsets and semantic relations. ........................... 48
Figure 3.2: The growth of English Wikipedia articles from January 2001 to July 2015. ........ 52
Figure 3.3: Lexical distribution in CatVar database [16]. ....................................................... 54
Figure 4.1: An example of WordNet IS-A hierarchy. ............................................................. 62
Figure 4.2: Classification of semantic similarity measures. .................................................... 64
Figure 4.3: A fragment of WordNet Taxonomy for the example concepts. ............................ 70
Figure 4.4: Sentence semantic similarity assisted with PoS conversion. ................................ 76
Figure 4.5: Tokenised PoS tagged tokens of the Illustrative Example. ................................... 77
Figure 4.6: An example CatVar cluster. .................................................................................. 80
Figure 4.7: The 4-level WordNet aided part-of-speech conversion. ...................................... 81
Figure 4.8: Changing WordNet 3.0 verbs to nouns using the 4-level WordNet-aided PoS
conversion. ............................................................................................................................... 82
Figure 4.9: Comparative setup of conversion aided methods for sentence similarity. ............ 88
Figure 4.10: Correlations coefficients (r) between the WordNet-based PoS conversion aided
similarity measures, the baseline methods and the human ratings. ......................................... 90
Figure 4.11: Relationships between our results and human judgements for the benchmark
dataset. ..................................................................................................................................... 91
Figure 4.12: Comparing our results with baselines on (A) TREC-9 and (B) MSRPC datasets.
.................................................................................................................................................. 95
Figure 5.1: Wikipedia article on the University of Birmingham. .......................................... 103
Figure 5.2: An Infobox template for location entity. ............................................................. 105
Figure 5.3: Classifier's access mechanisms to Wikipedia. ..................................................... 106
Figure 5.4: Wikipedia-based named-entity similarity. .......................................................... 109
Figure 5.5: A hybrid measure of conversion-aided WordNet and Wikipedia. ...................... 116

x
Figure 5.6: Perl-styled pseudocode algorithm for Wikipedia Infobox-based named entity
classification. ......................................................................................................................... 125
Figure 5.7: Named entity classifier flowchart. ....................................................................... 126
Figure 5.8: Named entity distribution in TREC-9 and MRSCP datasets; Both: both sentences
of the pair contain named-entities; One: only one sentence of the pair has named-entities;
None: None of the sentence pair hold named-entities. .......................................................... 130
Figure 5.9: Knowledge-based summarisation system. .......................................................... 135
Figure 5.10: DUC2005/DUC2006 corpora cluster sizes (No of sentences in each cluster). . 140
Figure 5.11: Experimental results on DUC2005 Dataset: A) Rouge-1, 2, SU4 with a single
coefficient (λ=0.5); B) Rouge-1 scores with varying λ; C) Rouge-2 scores with varying λ;
D) Rouge-SU4 scores with varying λ. ................................................................................. 141
Figure 5.12: Experimental results on DUC2006 Dataset: A) Rouge-1, 2, SU4 with a single
coefficient (λ=0.5); B) Rouge-1 scores with varying λ; C) Rouge-2 scores with varying λ; D)
Rouge-SU4 scores with varying λ. ........................................................................................ 143
Figure 6.1: Example 6.1 semantically parsed with SRL. ....................................................... 155
Figure 6.2: Explicit Semantic Analysis. ................................................................................ 156
Figure 6.3: SRL-ESA based summarisation model. .............................................................. 158
Figure 6.4: Merging cluster documents with redundancy removal. ...................................... 161
Figure 6.5: Sentence 1 (A) and Sentence 2 (B) semantically parsed with SRL. ................... 162
Figure 6.6: SRL-ESA based semantic similarity computation for short texts. ...................... 167
Figure 6.7: A simple illustration for PageRank ranks transfer. ............................................. 169
Figure 6.8: Semantic argument level (A) and sentence level (B) document similarity graphs.
................................................................................................................................................ 170
Figure 6.9: A sample document to be summarised. ............................................................... 172
Figure 6.10: Sentence similarity graph for document FBIS4-26327. .................................... 172
Figure 6.11: Sentence similarity graph for document FBIS4-26327 with sentence ranks after
20 iterations. ........................................................................................................................... 173
Figure 6.12: Extracted summary from the example document: FBIS4-26327. ..................... 174
Figure 6.13: A sample query. ................................................................................................. 175
Figure 6.14: Example title. ..................................................................................................... 176
Figure 6.15: Sizes (number of sentences) of DUC2006 document sets before and after
merging. ................................................................................................................................. 180
Figure 6.16: Impact of data size on the SRL-ESA graph based single document (A) and .... 185

xi
Figure 6.17: Comparative view of the ROUGE results for the proposed SRL-ESA graph
based summariser, the MS Word summariser, and the top related DUC System. ................ 187

xii
LIST OF TABLES
Table 3.1: WordNet 3.0 statistic: number of words, synsets, and senses. ............................... 47
Table 3.2: Lexical and semantic relations in WordNet 3.0. ..................................................... 49
Table 3.3: Top Wikipedia languages with article counts exceeding 1 million. ....................... 51
Table 3.4: Morphosemantic relations. ..................................................................................... 55
Table 4.1: Morphosemantic database record for –withdraw. .................................................. 83
Table 4.2: Similarity scores of the sentence pair in Example 4.1 using traditional WordNet
and conversion aided WordNet similarity measures. .............................................................. 84
Table 4.3: Notations used to indicate different similarity schemes. ........................................ 85
Table 4.4: A sample extract of the similarity scores from the Gulf Air crash dataset. ............ 85
Table 4.5: Summary of the results for the entire Gulf Air crash dataset. ................................ 86
Table 4.6: Semantic anchors. ................................................................................................... 87
Table 5.1: Core attributes extracted from Infobox templates. ............................................... 106
Table 5.2: Pairwise token comparison of the example using different similarity measures.. 118
Table 5.3: Results: percentage accuracy with varying data sizes. ......................................... 127
Table 5.4: Overall classifier results. ...................................................................................... 128
Table 5.5: The total named-entities of each type extracted from Wikipedia. ....................... 128
Table 5.6: Notation for different similarity measures. ........................................................... 129
Table 5.7: System-baseline comparison on the TREC-9 dataset. .......................................... 131
Table 5.8: System-baseline comparison on the MSRPC dataset. .......................................... 131
Table 5.9: Comparing paraphrase detection results with related state of the art works. ....... 132
Table 5.10: Statistical significance testing (T-test)................................................................ 134
Table 5.11: Dataset statistical description. ............................................................................ 139
Table 5.12: System notations. ................................................................................................ 140
Table 5.13: Comparative with the best DUC2005 systems and recent closely related works.
................................................................................................................................................ 143
Table 5.14: Comparison with best DUC2006 systems and recent closely related works...... 144
Table 6.1: Verb-arguments pairs for the example in Figure 6.1. ........................................... 155
Table 6.2: Semantic role arguments....................................................................................... 162
Table 6.3: Tokenised Example 6.2 sentences with their predicates and semantic role tags. . 163
Table 6.4: Role-terms table. ................................................................................................... 164
Table 6.5: Role-term(s) -common semantic roles and their corresponding term vectors. ..... 164
Table 6.6: First 5 Wikipedia concepts of each argument term(s) in Sentence 1. .................. 165

xiii
Table 6.7: First 5 Wikipedia concepts of each argument terms in Sentence 2. ..................... 165
Table 6.8: Sentence ranking features for SRL-ESA based Qf-MDS. .................................... 174
Table 6.9: Comparison of the SRL-ESA based summarisation using different unweighted
feature combination on the DUC2006 data. .......................................................................... 180
Table 6.10: ROUGE (1-2, SU4) results of the SRL-ESA based approach on the DUC2006
dataset using weighed features............................................................................................... 182
Table 6.11: Performance comparison of the current SRL-ESA based method, the hybrid
approach (Chapter 5), and the related summarisation systems on the DUC2006 dataset using
ROUGE measures. ................................................................................................................. 182
Table 6.12: The overall results of the SRL-ESA graph based single document summarisation
(SDS): average recall of the four selected ROUGE measures at 95% confidence interval. .. 184
Table 6.13: The overall results of the SRL-ESA graph based multi-document summarisation
(MDS): average recall of the three selected ROUGE measures at 95% confidence interval.
................................................................................................................................................ 184

xiv
LIST OF ABBREVIATIONS
TS Text Summarisation
ATS Automatic Text Summarisation
Qf-MDS Query-focussed Multi-document Summarisation
NLP Natural Language Processing
STS Sentence Textual Similarity
SRL Semantic Role Labelling
TF-IDF Term Frequency – Inverse Document Frequency
ESA Explicit Semantic Analysis
CatVar Categorial variation database
POS Part-of-speech
DUC Document Understanding Conference
NIST National Institute of Standards and Technology
TAC Text Analysis Conference
MMR Maximum Marginal Relevance
SDS Single Document Summarisation
MDS Multi-document Summarisation
ROUGE Recall Oriented Understudy for Gisting Evaluation
KB Knowledge Base
AI Artificial Intelligence
LCS Lowest Common Subsume
IR Information Retrieval
IC Information Content
LSA Latent Semantic Analysis
STASIS Sentence Similarity Based on Semantic Nets and Corpus Statistics

1
1. INTRODUCTION
1.1 Introduction
Text Summarisation is the process of reducing a long text document to a short summary
while retaining the most important facts of the source document. Nearly 6 decades have
elapsed since Luhn [1] first investigated the practicality of summarising documents using
machines. From that seminal work, research in text summarisation has progressed with a
slow pace over the first 3 decades but intensified in the 1990s. The annual Document
Understanding (DUC) and Text Analysis Conferences (TAC)1 conferences, organised for the
evaluation of automatic summarisation systems, best illustrate that the interest in the field of
research has reached a higher level of maturity in the last 15 years than ever before. Research
on text summarisation initially focussed on generic single document summarisation before
stepping to distil the main facts from sets of newswire articles [2]. The DUC competitions
evaluated these tasks for the first few years (see Section 2.5.3, Chapter 2).
Two distinct techniques, namely extraction and abstraction are used in text summarisation.
The extraction technique, which is the most widely adopted, selects the most important
segments in the source document on the basis of their statistical and/or linguistic features,
such as word/phrase frequency, the position of sentences, the centroid of words, the
similarity with the first and title sentences etc. The abstraction technique is more complicated
than extraction for it requires developing an understanding of the main concepts in a
document and then expressing these concepts in an alternative and clear natural language [3].
1 DUC was annually run forum for the evaluation of text summarisation by the National Institute of
Standard and Technology (NIST) from 2001-2007 and was later superseded by TAC in 2008.
CHAPTER 1

2
The details of these techniques, the main approaches applied in extractive text summarisation,
and the different types of text summaries are thoroughly explained in the next chapter.
In recent years, new summarisation methods, notably query-focussed multi-document
summarisation (Qf-MDS), have gradually emerged. The DUC conference was specifically
dedicated to Qf-MDS for two years, 2005/2006 and as a result enjoyed greater participation
as compared to other evaluation workshops. One explanation for this attention is that Qf-
MDS is more practically appealing due to its relatedness to information retrieval, question
answering and other commercial applications. The 10-fold rise of the generated internet text
and electronic textbooks, which led to an information overload and a drowning growth of
textual information, has triggered further research interest in Qf-MDS. Generally speaking,
given the overwhelming volume of available information on the web and elsewhere,
automatic text summarisation helps users to grasp the gist of long text documents within a
reasonable time while retaining the main contents of the source documents(s).
To date, a number of important studies have taken place, and have been reported in the
literature, ranging from simple surface level methods [1, 4, 5], through graph-based [6-8] and
machine learning methods [9-12] to the more recent knowledge-based approaches [13-17].
However, the state-of-the-art machine-based summarisation approaches have numerous
research gaps and are far away from producing high quality human-like coherent summaries.
The next chapter reviews existing works starting from Luhn’s pioneering study [1] to the
current state and summarises the major challenges facing the field while highlighting those
addressed in the thesis.
Needless to say that the human beings are considered to be the best summarisers with their
intelligence and ability to understand, analyse, and identify salient contents. From this
context, we believe that the emerging manually engineered, collaboratively collected and

3
automatically created machine-readable knowledge bases (see Chapter 3) can help machines
mimic humans in the production of good quality summaries. From this assertion, our study
strives to improve the quality of the generated document summaries through enhancing
semantic similarity detection methods by augmenting world knowledge and text semantic
analysis. In addition, the work investigates the effectiveness of heuristic approaches and
knowledge-based semantic methodologies for the development of an effective text
summarisation system. In particular, we concentrate on the problem of query-focussed multi-
document summarisation with little coverage of generic single document and multi-document
summarisation approaches (see Section 6.3.4 and Section 6.4.3, Chapter 6).
In this thesis, the summarisation task is dealt with using a bottom-up approach in which the
summary quality is improved through the development of effective new similarity metrics
and heuristic algorithms (see Chapter 4). The enhanced similarity measures combined with
statistical measures are then employed to optimise the scoring functions for sentence ranking
and extraction. To score each sentence for salience in a query-focussed summarisation, we
modelled centrality, query relevance and anti-redundancy factors in a diversity-based
framework using improved similarity measures (see Chapter 5). For summary generation, the
sentences are selected using a modified Maximum Marginal Relevance (MMR) algorithm to
maximise diversity and encourage information novelty (see Section 5.4.1, Chapter 5). For
generic single and multi-document summarisation, we use semantic document representation
based on sentence similarity graphs. Document graphs are connected using similarity
measures underpinned with semantic role arguments, mapped to a conceptual knowledge (see
Chapter 6).
The summarisation approaches proposed in this thesis were found to contribute to the field by
raising the performance of extractive summarisation systems by enhancing the relative
summary content as detailed in the rest of the thesis. Similarly, the developed similarity
4
measures achieved outstanding performance on the relevant problem of paraphrase
identification (see Section 4.4.3, Chapter 4; Section 5.5.2, Chapter 5).
1.2 Motivation
About 40% of the world’s population is estimated to have an Internet connection, up from 2
billion in 2010 to 3 billion in 20142. Consequently, a high volume of textual information is
generated by these netizens every day. This takes different forms including; web pages on the
Internet; user feeds, comments and tweets from social media; exchanged emails; electronic
books and degree dissertations, etc., all collectively yielding vast text corpora. Similarly, the
increase in capacity of storage media and other information processing tools contribute to the
growth of information, to the extent that it is no longer easily manageable by humans. With
that exponential growth comes the development of high quality well-maintained semantic
ontologies and knowledge bases. Such resources embed well-structured conceptual
information suitable to aid the creation of efficient information extraction techniques.
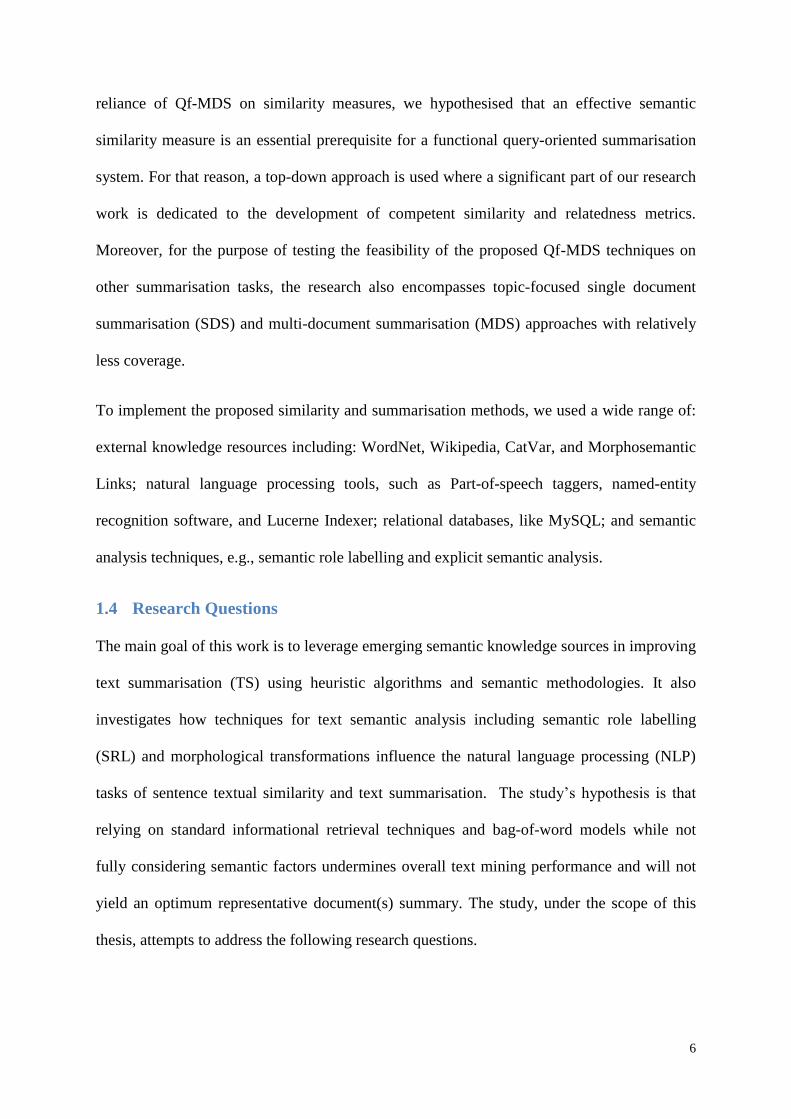
Knowledge-based scoring methods are now believed to hold the future potential of semantic-
based text summarisation and retrieval [2]. In 2015, Google proposed a knowledge-based
scoring function for web pages, called Knowledge-Based Trust (KBT) [18]. Their proposal is
expected to enhance the existing link-based scoring method where websites were ranked
using the number of their hyperlinks. KBT assigns a trust score to each webpage reflecting
the accuracy of the information in it. The algorithm examines knowledge triples, namely a
subject, a predicate and an object to determine the trust score [18]. The subject and the
predicate represent a named entity and its attribute, while the object can be an entity or any
other token. Google’s KBT algorithm demonstrates how knowledge bases can aid machine-
based systems to verify the correctness of textual information. This implies that the
2 http://www.internetlivestats.com/

5
knowledge-based scoring approaches can be applied to text summarisation, which clearly
substantiates our findings as reported in Chapters 4-6.
Today, electronic gadgets including mobiles, tablets and iPads are widely used by the public.
These devices present additional challenges when reading documents owing to their small
screens, the high load time for large documents and the inconvenience of browsing through
long texts. All these indicate the need for summarisation systems allowing users to grasp the
gist of text documents quickly and conveniently. Summly3 is an example of a recent
commercial application introduced for summarising mobile news articles. It started with a
simple extraction algorithm for general news before applying machine learning and natural
language processing techniques. The application received Apple’s Best Award in 2012
before being acquired by Yahoo for a sum of 30 million dollars [19].
Given the above stated facts, the aim of this work is to build knowledge-based summarisation
methods by availing the linguistic, semantic, and statistical clues for the identification of key
text segments. With the availability of high-quality lexical knowledge sources and semantic
analysis techniques, it was foreseeable that an advancement of extractive summarisation is
likely if the text’s semantic representation is properly utilised. Further to this, it is thought
that the semantic information encoded in the manually, semi-automatic and automatically
built knowledge repositories holds further potential for improving text summarisation.
Moreover, in today’s Internet age, additional improvements are believed to be achievable
using crowdsourced world knowledge such as that in Wikipedia.
1.3 Scope of the Thesis
This thesis presents work on linguistic knowledge-based summarisation approaches with its
focal point being on query-focussed multi-document summarisation. Due to the direct
3 http://summly.com/
6
reliance of Qf-MDS on similarity measures, we hypothesised that an effective semantic
similarity measure is an essential prerequisite for a functional query-oriented summarisation
system. For that reason, a top-down approach is used where a significant part of our research
work is dedicated to the development of competent similarity and relatedness metrics.
Moreover, for the purpose of testing the feasibility of the proposed Qf-MDS techniques on
other summarisation tasks, the research also encompasses topic-focused single document
summarisation (SDS) and multi-document summarisation (MDS) approaches with relatively
less coverage.
To implement the proposed similarity and summarisation methods, we used a wide range of:
external knowledge resources including: WordNet, Wikipedia, CatVar, and Morphosemantic
Links; natural language processing tools, such as Part-of-speech taggers, named-entity
recognition software, and Lucerne Indexer; relational databases, like MySQL; and semantic
analysis techniques, e.g., semantic role labelling and explicit semantic analysis.
1.4 Research Questions
The main goal of this work is to leverage emerging semantic knowledge sources in improving
text summarisation (TS) using heuristic algorithms and semantic methodologies. It also
investigates how techniques for text semantic analysis including semantic role labelling
(SRL) and morphological transformations influence the natural language processing (NLP)
tasks of sentence textual similarity and text summarisation. The study’s hypothesis is that
relying on standard informational retrieval techniques and bag-of-word models while not
fully considering semantic factors undermines overall text mining performance and will not
yield an optimum representative document(s) summary. The study, under the scope of this
thesis, attempts to address the following research questions.

7
1. Has research on automatic text summarisation reached a maturity level and what are the
key challenges and limitations facing the field?
2. Can taxonomy-based textual similarity be improved through the use of morphological
analysis and semantic heuristics and what is the influence of lexical coverage on text
summarisation?
3. To what extent can the use of large knowledge bases (with a high lexical coverage), such
as Wikipedia, and the consideration of relevance, centrality, and diversity factors,
contributes to the extraction of informative query-focussed summaries?
4. Can named-entity tokens be exploited to improve sentence textual similarity and text
summarisation tasks?
5. How do we overcome the impacts of greedy word pairing approaches and accurately
judge the similarity of sentence length short texts using text semantic structures and world
knowledge?
6. Can semantic-role-sensitive similarity metrics, underpinned by related Wikipedia-derived
term concepts, improve sentence scoring functions and the summarisation performance?
1.5 Contributions of the Thesis
The work presented in this thesis has made several original contributions to automatic text
summarisation, both at the sentence textual similarity level, as listed in contributions 1 & 2
and at the summarisation level, as in contributions 3 & 4. These contributions are briefly
listed below and explored in more detail in Chapters 4-6.
1 Syntactic Category Conversion for Sentence Textual Similarity (Chapter 4)
We proposed a novel integration of several manually built lexical resources for
measuring short text semantic similarity in a way that complements the weakness of
one resource, e.g., WordNet, with the strength of another, e.g., CatVar.

8
Heuristic algorithms for carrying out morphological transformations at sentence-level
syntactic structure are developed, where we subsume poorly or non-hierarchized word
categories under derivationally related nouns in WordNet taxonomy.
We experimentally compared the performance of different algorithms, background
resources, and syntactic target categories. Through this, WordNet’s noun taxonomy
was identified to be the optimum target category, and CatVar was found to be the best
supplementary resource for syntactic category conversion.
The effectiveness of the CatVar aided similarity measure is experimentally validated
for sentence textual similarity and paraphrase identification tasks.
2 Wikipedia-based Named Entity Semantic Relatedness (Chapter 5)
We introduced a binary Infobox-based entity classification and extraction algorithm
for assessing Wikipedia’s coverage in named-entities with empirical quantification.
A technique for measuring semantic relatedness between named-entities was put
forward by exploring the level of their co-occurrences in Wikipedia articles in the
same spirit as normalized Google distance.
3 Hybrid Qf-MDS using Semantic Heuristics and Linguistic Knowledge (Chapter 5)
The category conversion enhanced WordNet similarity (1), and the Wikipedia-based
named entity semantic relatedness (2) are integrated to form a hybrid system where
each component is weighted with respective word category proportions.
We introduced a hybrid query-focussed multi-document summarisation framework
extensively utilising the hybrid knowledge-enriched semantic similarity measure in
conjunction with other statistical measures as the chief indicators of salient content.
The performance of the proposed summarisation framework was determined by
applying its experiments on standard datasets and comparing its results with state-of-

9
the-art related works. This was preceded by a separate validation of the hybrid
similarity measure on the related paraphrase identification task.
4 SRL-ESA Based Text Summarisation (Chapter 6)
An iterative merging algorithm was designed for the unification of related document
clusters into a single cluster file while filtering out redundant sentences.
Semantic representations of document sentences were built using semantic role
labelling. This is followed by the construction of semantic role-argument term vectors
projected to corresponding Wikipedia concepts.
We proposed a semantic relatedness metric based on the interpreted concept vectors
of semantic arguments as a component of a composite scoring function for query-
focussed summarisation. The measure is also employed as an edge weight for graph-
based generic SDS and MDS approaches.
We implemented two versions of the SRL-ESA based summarisation system; a
feature-based query-focussed multi-document summariser and a graph-based generic
single and multi-documents summariser.
The performance of both implementations was empirically demonstrated using
standard datasets from the relevant Document Understanding Conference (DUC).
Several scientific papers, published, accepted or submitted for publication in international
peer-reviewed journals or conference proceedings, were produced from the above-stated
contributions. The list of these publications is included in Appendix B.
1.6 Organisation of the Thesis
The work that produced this thesis has been conducted in a sequential manner whereby
solving one problem led to the identification of another pressing research problem. Having
handled the problems of taxonomy inconsistency and part-of-speech boundary (Chapter 4),
this work discovered that the low lexical coverage, especially in terms of named-entities,

10
hinders the summary quality. Thus, from an improved WordNet textual similarity, we moved
to the investigation of named entity semantic relatedness based on Wikipedia and the
integration of the two measures in a summarisation framework (chapter 5). With the heavy
lifting success achieved using Wikipedia-based named entity relatedness and the conversion
aided WordNet similarity techniques, we were convinced that more powerful semantic
representations, such as semantic role labelling combined with the vast Wikipedia concept
structure as background knowledge, would enable us to accomplish further advancement in
the field. This consecutive research workflow translated to logic connections of the thesis
components is summarised in Figure 1.1.
Chapter 1:
Introduction
Chapter 2:
A Background Review
on Existing Literature
Chapter 3:
Lexical-semantic
Knowledge sources
Introduction and Preliminaries
Chapter 4:
Taxonomy Based
STS Enhanced with
Syntactic Category
Conversion
Chapter 5:
A Hybrid Approach
for Qf-MDS using
Knowledge-enriched
Semantic Heuristics
Chapter 6:
Semantic Role
Labelling with
Explicit Semantic
Analysis for TS
Contributions of the Study
Chapter 7:
Conclusions and Future Work
Conclusions and Future Work
Figure 1.1: Thesis components and research workflow.
11
The thesis consists of 7 chapters. The first and last chapters contain the introduction and the
conclusions respectively. Chapters 2 & 3 present a review of existing literature and the
applied external linguistic resources in order. The other three chapters, namely Chapter 4
through Chapter 6, are dedicated to the detailed description, experiments and evaluation of
the thesis novel contributions. Given below is a brief overview of each chapter excluding this
chapter -the Introduction.
Chapter 2 presents a comprehensive background review on the topic of text summarisation.
It starts with a brief definition of automatic text summarisation elaborating the processing
stages of a generic summarisation system. The chapter also covers the classification of text
summaries on the basis of input, output, purpose and language factors before introducing the
main approaches used to summarise text documents. Next, extrinsic and intrinsic methods for
evaluating generated system summaries are discussed with key challenges and limitations of
the field highlighted at the end.
Chapter 3 reports a concise introduction to four external knowledge repositories that are
extensively employed in this study. The four resources are: WordNet, the most widely used
handcrafted semantic network in natural language processing (NLP); Wikipedia, the largest
crowdsourced encyclopaedic knowledge; Categorial Variation database (CatVar), a lexical
resource of morphological derivations for the English language; and Morphosemantic Links,
an add-on database to WordNet relating morphologically related nouns and verbs.
Chapter 4 investigates an approach incorporating manually engineered lexical resources and
a semantic network to boost the accuracy of short text semantic similarity measures and
ultimately improve the performance of query-focussed summarisation. Formally, WordNet
relations, CatVar and Morphosemantic Links were used to subsume verb, adjective and

12
adverb classes under derivationally related nouns in WordNet. This heuristic process is
referred as part-of-speech (PoS) or syntactic category conversion.
Chapter 5 extends Chapter 4 by building a hybrid framework for query-focussed multi-
document summarisation based on an integrated similarity measure. This combines
Wikipedia-based named-entity semantic relatedness and improved WordNet-based text
similarity measures. In addition, the framework considers relevance, centrality and anti-
redundancy factors in identifying important query relevant sentences. The semantic features
derived from the combination of manually built and crowdsourced knowledge bases attained
the best of both for paraphrase detection and summarisation tasks.
Chapter 6 discusses an SRL-ESA based summarisation model where text features are
extracted using Semantic Role Labeling (SRL) with Wikipedia-based Explicit Semantic
Analysis (ESA). The SRL is used for the semantic representation of document sentences
while the ESA algorithm facilitates the interpretation of semantically parsed sentences to
indexed Wikipedia concepts. Two implementations, a graph-based generic SDS, MDS and a
feature-based Qf-MDS, have been realised using this model.
Chapter 7 includes a final summary of the thesis contributions and draws some conclusions
from the current study before pointing out areas of further work.

13
2. A BACKGROUND REVIEW ON EXISTING LITERATURE
2.1 Introduction
In this chapter, we present background research and a review of existing literature on text
summarisation. This includes a definition of automatic text summarisation, categorisation of
machine generated summaries based on context and language factors, approaches used to
summarise text documents, as well as extrinsic and intrinsic methods used to evaluate
extracted summaries. Eventually, the chapter highlights the major challenges and limitations
facing the current research on automatic text summarisation.
2.2 Automatic Text Summarisation (ATS)
Text Summarisation is the reduction of source document text to a short summary by selecting
and/or generalising the most important passages of the document [20]. Humans are the best
summarisers for they possess the knowledge to understand and interpret the meaning of text
documents. ATS is the automation of this process by equipping computers with the
knowledge required to carry out the summarisation.
Research on text summarisation started nearly 6 decades ago when Luhn [1] investigated the
summarisation of scientific documents using statistical features such as the frequency of
words. He used this frequency information to identify the salient sentences through the
importance of their constituent words. Luhn’s work has been extended by other researchers
who used alternative shallow features such as the position of a sentence in a document [4],
pragmatic words (e.g., significant, impossible, hardly), and heading/title words [5]. These
earlier pioneering works showed that summarising texts using machines was feasible. Since
then, the field has seen continuous evolution from simple statistical approaches to the
CHAPTER 2

14
application of robust NLP and artificial intelligence (AI) methods including machine learning
[9-12], graph representation [6, 8, 21, 22], linguistic knowledge-based approaches [13-17],
and heuristic methods [23, 24]. Today, the need to advance research in the area of ATS is
greater than ever before because of the overwhelming growth of textual information available
on the Internet.
Hovy and Lin [25] suggested three main steps, namely, topic identification, interpretation
and summary generation, to summarise text documents automatically. From its name, the
first step identifies the key units (be they words, phrases, or sentences) in a document, usually
by using a composite scoring function that assigns a score indicating its level of importance.
Most automatic text summarisers today implement this step. Indicators of sentence salience
range from, word frequency, position, cue phrases, title overlap, query overlap, named-
entities, sentence centrality, the semantic similarity with the query and other sentences,
among others. Interpretation, on the other hand, deals with the fusion of identified topics and
represents them in new terms before finally generating the summary in the third step using
NLP methods. Due to the summary generation stage requiring complex language generation
techniques, most state of the art extractive summarisation approaches apply the first two
stages only. Specifically, they identify and extract key document sentences and fuse them
according to their appearance in the source document(s).
In the same year and similar to Hovy and Lin [25], Spark Jones [20, 26] put forward a three
phased text summarisation model using a rather different terminology. The three phases are:
Interpretation of source document text to source representation (analysis). This stage
utilises statistical, linguistic and semantic information to analyse the topic structure of
the source text. This may include understanding the key concepts in the document, the
follow of these concepts within the text and its coherence.

15
Figure 2.1: A generic automatic text summarisation system [26].
Transformation of source representation to a summary representation using
statistically derived data and semantic models for the generalization.
Generation of summary text from summary representation (synthesis). This final stage
uses the information obtained from the previous two processing stages to synthesize a
meaningful coherent output summary.
Figure 2.1 shows a generic architecture of an automatic text summarisation system
illustrating the three main processing stages in which each may subsume into other sub-
stages [27].The compression rate (n%), printed at the top of the figure, defines the ratio of
the generated machine summary from the original source document(s).
2.3 Categorisation of Text Summaries
Several distinctions between machine generated summaries are made in text summarisation.
The most common taxonomy for the summary classification was proposed by Spark Jones
[20] where she highlighted three main context-based criteria for classifying summaries; input,
purpose and output factors. A very similar categorisation strategy is also suggested by Hovy
and Lin [25]. In addition, Mani and Maybury [26] suggested a different classification criteria
based on the text processing level as; surface, entity and discourse levels. In this thesis, we

16
classify document summaries on the basis of these three main context-based criteria in a
similar manner as Lloret and Palomar [27] while considering emerging summarisation tasks.
Firstly, a distinction can be made between extract and abstract summaries based on the
source of the output and the two main distinct approaches employed in text summarisation;
namely, extraction and abstraction (aka extractive and abstractive summarisation).
Extraction is the most well-established and practically-oriented technique as implemented in
MEAD [28], SUMMARIST [25] and other available extractive summarisers. It picks the
most salient sentences from the original document on the basis of predefined salience
indicators, such as the statistical and semantic features used to score and rank sentences. A
subset containing the highest scored and ranked document sentences deemed to be the key
segments are then concatenated to form an extract summary. By comparison, abstractive
summarisation synthesises a new substitute text for the concepts conveyed by the key
sentences identified as important. The produced summaries are called abstracts which may
contain linguistically generated phrases and reused portions from the source text. Abstractive
summarisation is more complicated than the extraction method for it requires developing an
understanding of the main concepts in a document and then expressing them in an alternative
and clear natural language. Very few research works have given attention to abstractive
summarisation due to the required complex language generation and deeper analysis to
synthesis abstracts [29]. In this thesis, we use an extractive fashion for producing text
summaries.
Secondly, with respect to the nature of the input, summaries can contain information from
one document (single document summaries) or from a set of related documents (multi-
document summaries). The respective summarisation processes are referred to as a single
document and a multi-document summarisation, accordingly. Most of the existing text
summarisation research lies in the area of generic and single document summarisation though

17
research interest on a cluster of related documents has emerged in the 1990s [2, 26]. The
multi-document summarisation (MDS) is distinct from the single document summarisation in
that it identifies differences and similarities across a corpus of related documents [26, 30].
Consequently, MDS has been recently gaining much attention and popularity, but research is
a long way from slowing the most challenging issues including the high degree of
redundancy, and the extremely small compression ratio. Whether it is for a single or a multi-
document summary, three commonly aspired to attributes of generated summaries are: having
a wide document coverage, the inclusion of distinct concepts in the document (diversity) and
reducing information redundancy to its minimum while ensuring coherence of the summary
[13, 21, 22].
Next, another classification can also be made between indicative and informative summaries
based on the level of summary details and the purpose of the summary [2, 26, 31]. An
Indicative summary is a contracted form of the source document presenting only its main idea
to the reader, e.g., headlines and movie trailer packs. Its primary purpose is to drag the reader
into seeing the source document. By comparison, an informative summary provides enough
information for the reader to rely on the summary instead of reading the entire source
document. Nowadays, most summarisation systems produce paragraph-length informative
summaries where the length is mostly limited by a given number of words, sentences or by a
compression rate.
Topic-focussed (aka generic) and query-focussed summaries are produced on the basis of the
purpose of the summary content. As already pointed out, ATS research focussed on generic
summarisation from the earlier days until recently. Generic summarisation techniques
provide the gist or the overall content meaning of the source document. In this way, a generic
summary tells the reader the about-ness of the source text saving the time that the user would
have spent by reading its entirety. Alternatively, query-focussed summarisation aims to distil

18
a document summary merely based on the information need of a specific user expressed in
the form of a query.
A query-focussed summariser extracts the most query relevant sentences in the documents
and is seen as an advancement in the field of ATS due to its relatedness to search engines,
Classification of
Text summaries
Input
Output
Purpose
Language
Single-document
Multi-document
Extract
Abstract
Generic
Query-focused
Personalized
Indicative
Informative
Sentiment-based
Update
Mono-lingual
Multi-lingual
Cross-lingual
Figure 2.2: Classification of text summaries based on context factors and language.

19
question answering and other commercial applications. Generally speaking, query-based
summarisation is tailored to suit the user’s declared information need while a generic
summarisation reflects the essential content as conveyed by the source document. The
primary focus of the work presented in this thesis is on extractive query-focussed multi-
document summarisation though it includes generic single and multi-document
summarisation at smaller emphasis (see Sections 6.3.4 and Section 6.4.3; Chapter 6).
With the recent appearance of Web 2.0 technology, and user-generated content platforms
such as social media and other domains producing a vast amount of textual data, new
summarisation tracks yielding new types of summaries are coming to light. These range from
the user-oriented sentiment and personalised summarisation to update summarisation.
Sentiment summarisation is a bridge connecting Sentiment Analysis (aka as opinion mining)4
to text summarisation by extracting a summary which exposes the sentiment of the user
towards a topic, product, place, service, etc. [27]. A personalised summary renders the user
with specific information according to their needs and preferences. Also, in an update
summarisation, the user is expected to have already acquired background knowledge about
the document and only needs any further recently updated information in it. Text
summarisation techniques are also applied to the biomedical domain [32]. A biomedical
summary aims to assist the user to grasp pertinent clinical information in a short time.
Another important criterion for summary classification is the language of the input and output
documents for a text summarisation system. In this regard, at least three types of summaries,
namely mono-lingual, multi-lingual, and cross-lingual, can be distinguished. If a summariser
processes a text document in a language, e.g., English, and produces a summary in the same
language, it is known as a mono-lingual summary. This is in contrast with a cross-lingual
4 The use of NLP and computational linguistics to identify and extract user’s subjective information
(e.g., sentiment they have towards something) in documents.

20
summary where the input document to the system is written in a language (e.g., English) and
the resulting summary is in another language (e.g., Arabic). Sometimes a mono-lingual
summariser can deal with different languages, but only one at a time. For instance, it can
summarise English, Arabic and German documents generating a summary in the same
respective language. In such a scenario, this system is said to be capable of producing a
multi-lingual summary. Figure 2.2 shows the discussed classification of text summaries.
2.4 Approaches for Extractive Text Summarisation
2.4.1 Statistical Methods
For the identification and extraction of important document sentences, earlier works and
some contemporary studies rely on statistical surface-level features. For instance, Luhn [1]
counted the frequency of words to identify salient sentences before Baxendale [4] and
Edmundson [5] extended his work by adding position and cue word statistics. In these earlier
works, the researchers selected these features based on the intuition that sentences containing
highly frequent topic words and pragmatic phrases carry more significance than other
sentences. It is also worth mentioning that the frequency counts of frequent noise words (aka
as stop words), such as the, an, of, in, at etc., are not considered here as they do not convey
meaningful content.
One very common derivate of the term frequency feature is the widely adapted information
retrieval metric, the TF-IDF (term frequency-inverse document frequency). This metric
combines the influence of the term frequency and its count in the document collection. In
other words, frequent terms in a document are considered significant given that these terms
are not as frequent in the entire corpus as in the document [27]. In this respect and very
recently, Ferreira, et al. [33] evaluated a group of sentence scoring features including term
frequency (TF) and TF-IDF in an attempt to figure out the most performing features for text

21
summarisation. Interestingly, their empirical assessment disclosed TF and TF-IDF as the top
two features in a sample of 15 different statistical, semantic and graph-based features. This
finding justifies why most current studies [9, 13, 31, 34-37] use derived forms of TF and TF-
IDF as the primary components in their scoring functions for text summarisation. This also
implies that term frequency and its derived forms are still very powerful sentence
significance indicators in the context of text summarisation.
The frequency driven methods in the previous paragraphs operate at the word level. There are
several other sentence level surface features such as the position [4, 9], cue words or phrases
[4, 9], named entity inclusion [38], numerical inclusion [33], sentence centrality [6, 33]
sentence length [28, 39], and title similarity [9, 33] employed to indicate salient information
in the text. Sentence position is an extensively used feature value for scoring document
sentences [4, 9, 33, 39, 40]. It defines the location of a sentence in the document order.
Giving high scores to first document sentences is a widely accepted practice in ATS with the
philosophy that these contain the core topical description, whilst the succeeding sentences
provide further discussion [4, 39]. Sentences containing cue phrases such as “in conclusion”,
“the most important”, “in summary”, etc., are assumed to contain significant information
and are scored higher for summary inclusion. Each sentence is assigned with a cue phrase
values as per expression (2.1). Besides, sentence centrality measures the information
coverage of a given sentence with respect to the rest of the sentences in the document [13, 33,
39]. The centrality can fall into a statistical or a knowledge-based approach depending on the
source of the similarity information.
𝑆𝑐𝑜𝑟𝑒𝑐𝑝(𝑠𝑖) =# 𝑜𝑓 𝑐𝑢𝑒 𝑝ℎ𝑟𝑎𝑠𝑒𝑠 𝑖𝑛 (𝑠𝑖)
# 𝑜𝑓 𝑐𝑢𝑒 𝑝ℎ𝑟𝑎𝑠𝑒𝑠 𝑖𝑛 𝑡ℎ𝑒 𝑑𝑜𝑐𝑢𝑚𝑒𝑛𝑡 𝑐𝑜𝑛𝑡𝑎𝑖𝑛𝑖𝑛𝑔 (𝑠𝑖) (2.1)
Abuobieda et al. [39] investigated the best scoring statistical methods using five random
features; sentence length, sentence position, title feature, numerical data and thematic words,

22
using genetic concepts. From their experimental analysis, the researchers found that the
sentence position ranks the second best feature after the title feature (sentence overlap with
title words) and is followed by thematic words (most frequent words). This again confirms
the all-time applicability of these simple but powerful statistical methods. The primary focus
of this thesis is on semantic-based knowledge-driven approaches while, at the same time,
augmenting some selected statistical features (e.g., TF-IDF, position, title similarity etc.) in
many of our experiments.
2.4.2 Linguistic Knowledge-based Methods
Text summarisation using statistical approaches is based only on surface level features
without considering the semantics of words in the sentence. That is why such techniques are
sometimes referred to as knowledge poor methods. One obvious criticism for statistical
features is that they sometimes fail to accurately capture the meaning of textual expressions,
especially when calculating their similarities. For instance, the sentence pair; Mary gave a
book to Mohamed and Mohamed gave a book to Mary will be considered identical sentences
using surface level features, e.g., lexical overlap, while they have a different meaning.
However using linguistic techniques, such as considering the syntactic position or the
semantic role of each word augmented with world knowledge, can solve this problem (see
Chapter 6). In the context of this thesis, linguistic knowledge-based methods describe
summarisation approaches utilising semantic information derived from linguistic knowledge
sources (e.g., electronic dictionaries, hand-crafted semantic networks & lexical databases,
crowdsourced resources, etc.), syntactic parsing (e.g., parse trees, parts of speech tagging)
and semantic analysis (e.g., semantic role labelling, named entity recognition). One may find
that some works in the literature [41, 42] call this category of methods as a deep natural

23
language processing. Chapter 3 introduces the main lexical-semantic knowledge sources used
for the current work.
WordNet (see Section 3.2, Chapter 3) has proved to be one of the most extensively used
knowledge sources for text summarisation [10, 13, 14, 16, 17, 25, 33, 34, 38, 43]. Ye, et al.
[43] built a query-based summarisation system using sentence similarity and concept links in
WordNet. Semantic relations were also used in [14] where researchers combined semantic
information from WordNet and syntactic information to extract a query-oriented summary
from a set of related documents. Similarly, Bawakid and Oussalah [14] exploited WordNet
measures to form the basis for their extractive query-based scheme. In most cases knowledge-
based semantic information is used in combination with other summarisation approaches.
Hovy and Lin [25, 26] combined semantic knowledge embedded in WordNet with NLP
techniques to foster a knowledge rich system called SUMMARIST. One unique property of
this summariser is that it works for extractive and abstractive summarisation using the
equation in expression (2.2). Although WordNet was used in our previous works [13, 44],
again we addressed some identified limitations including the part-of-speech boundary in its
taxonomy and its limited coverage. In each case, we augmented the semantic network with
other lexical resources to handle its drawbacks.
𝑆𝑢𝑚𝑚𝑎𝑟𝑖𝑠𝑎𝑡𝑖𝑜𝑛 = 𝐼𝑑𝑒𝑛𝑡𝑖𝑓𝑖𝑐𝑎𝑡𝑖𝑜𝑛 + 𝐼𝑛𝑡𝑒𝑟𝑝𝑟𝑒𝑡𝑎𝑡𝑖𝑜𝑛 + 𝐺𝑒𝑛𝑒𝑟𝑎𝑡𝑖𝑜𝑛 (2.2)
Recently, Wikipedia (see Section 3.3, Chapter 3) has gained a considerable usage among
NLP research community for different applications, e.g., word semantic similarity [45], text
similarity [46], named entity disambiguation [47], named entity classification [48], text
classification [49], and text clustering [50]. Text summarisation is not an exception where a
number of studies endorsed Wikipedia as a reliable lexical resource [13, 15, 51, 52]. Some
studies are entirely built on Wikipedia as the sole information source such as the work of

24
Sankarasubramaniam [15]. The authors related document sentences to Wikipedia concepts in
graph representation which they then ranked using generative models. Others amalgamated
Wikipedia features with other statistical features, for example; the work of Bawakid and
Oussalah [51] in which the researchers enriched Wikipedia-derived concepts with some
surface-level features like the position and term overlap to perform multi-document update
summarisation; the work of Zhou et al. [53] where they employed Wikipedia concept
similarity and other shallow features including the position and the length of sentences; and
our earlier study [13] in which conversion aided WordNet similarity is complemented with
named entity semantic relatedness acquired from Wikipedia database.
Categorisation of summarisation approaches is not uniquely defined. For example, S.
Gholamrezazadeh et al. [31] and M. El-Haj [54] consider graph-based summarisation as a
linguistic knowledge approach. This is sometimes possible from the graph association
perspective especially when edges are weighted using knowledge-based similarity. However,
this logic is not applicable all the time, for instance if the graph connections are weighed
using knowledge-poor methods as in [6]. This explains why graph-based and knowledge-
driven are held to be independent TS methods [2, 41, 42]. Various other summarisation
systems rely on other less common linguistic schemes such as lexical chains (sequence of
semantically related terms in a text) [55], and rhetorical structures (binary trees representing
connections of sentence parts) [56].
Recently, an extensive exploration of knowledge-based summarisation methods has emerged.
The recent Google proposal of enhancing traditional hyperlink-based page ranking algorithms
with a knowledge-based scoring function demonstrates the significance of knowledge bases
for intelligent text processing [18]. With the availability of full-fledged massive lexical
knowledge sources, and the constant emergence of new ones, this thesis places a huge
emphasis on the application of knowledge-driven semantic heuristics. One of our motivations

25
for this is the assertion that using semantic knowledge holds the potential for further
improvements in text summarisation research and, therefore, needs more research
investigation [2].
2.4.3 Graph-based Methods
Graph-based methods represent text documents graphically. Typically text units (e.g., words,
phrases, or sentences) form the nodes (vertices) of the graph, whilst the associations between
these units fill the position of the graph edges. In the summarisation context, the association
takes the form of unit similarity such as the sentence similarity if the nodes contain sentences.
Figure 2.3: A generic sentence similarity graph for 8-sentence document.
More formally, a document is represented by a graph G = (V, E) with the set of vertices V
representing terms, phrases or sentences and a set of edges E (a sub-set of V×V) denoting the
links between the vertices. The edges are associated with values (aka edge weights)
quantifying the strength of the associations. Since the vertices represent text granularities in
the summarisation context, e.g., sentences, the edge weights take the form of their intra-
similarities. The resulting graph is called a weighted graph since its edges are associated with

26
similarity values. Graph-based approaches usually rely on other methods, e.g., statistically or
semantically computed similarities for edge weights. This creates a situation where some
research can fall into more than one category depending on the criteria of the classification.
When a document is semantically represented as a graph, a ranking algorithm is employed to
identify the salient segments of the document. The rationale behind document graph
presentation for summarisation is that such topology can easily disclose the important
segments of the text [27]. The use of graph-based algorithms for text summarisation has been
widely adopted and has shown its effectiveness for text summarisation [6, 8, 21, 31, 42, 57].
Figure 2.3 shows a generic document similarity graph where only semantically and lexically
overlapping sentences are connected.
The conventional methods of graph-based summarisation applied in the majority of the
related literature use document sentences as vertices, and are sometimes referred to as
sentence-based document graphs. Erkan and Radev [6] proposed one of the most popular
sentence-based document graph representations for multi-document summarisation. Their
system, called LexRank, is based on the concept of eigenvector centrality and ranked the first
in the DUC2004 competition. LexRank performs a random walk on the document graph to
identify the most central sentences. In the same year, Mihalcea and Tarau [7] presented
TextRank, another graph-based ranking method which constructed a similarity graph using
content overlap. Both LexRank and TextRank are derivatives of the popular PageRank
algorithm [58] (see Section 6.3.4, Chapter 6). Later on, Otterbacher et al. [59] proposed a
query-sensitive version of LexRank tailored for query-focussed summarisation.
Moving from mere sentence-level relations, recent graph-based approaches have cross-linked
other levels of text granularities, i.e, relating vertices of terms to sentences and/or those of
sentences and documents. These proposals have been particularly applied to multi-document
summarisation [21, 60]. In this way, Zha [61] built a generic text summarisation based on a

27
weighted bipartite document graph. He used the terms and sentences in the graph and
established links between each term and sentence if that term appears in the sentence text.
This will presumably create a high degree of links for highly frequent words. In addition, the
work presented by Wei et al. [60] considered the influence of global information from the
document clusters on local sentence evaluation while distinguishing between intra-document
and inter-document sentence relations. Their evaluation indicated that the document-sensitive
approach outperforms other graph models for multi-document summarisation task if the set of
documents is treated as a single combined document. Canhasi and Kononenko [21] proposed
a multi-layered graph-based query-focussed multi-document summarisation approach based
on a weighted archetypal analysis (wAA), a multivariate data representation making use of
matrix factorisation and clustering. They built three layers of terms, sentences, and document
vertices, and linked them via term-sentence and sentence-document links on top of the
sentence similarity graphs as in Figure 2.4. The wAA-based Qf-MDS approach organises
document clusters as a multi-element graph enabling simultaneous sentence clustering and
ranking. The queries are connected to related cluster sentences with edges weighted by the
corresponding query-sentence similarities.
Figure 2.4: Sentence similarity graph based on wAA method [21].

28
Instead of directly representing source text units, concept graphs have been emerging as an
alternative semantic representation of the source text. In this category of methods, sentences
are related to concepts using semantic ontologies which are then used to construct the
document’s graph representation. Such a method is adopted in [62] where Plaza et al
modelled an extractive biomedical summarisation on concept graphs after mapping sentence
text to relevant concepts with the aid of UMLS ontology and its IS-A taxonomic relations. In
a similar manner, Sankarasubramaniam [15] constructed bipartite sentence–concept graphs to
extract single and multi-document summaries availing from Wikipedia concepts. Concept
graph modelling proves its success particularly in domain-specific areas such as biomedical
and news summarisations [27]. In this work, we use Wikipedia concepts by translating
document sentences to relevant concepts to compute the edge weights between the graph
vertices. But unlike the previous methods, we map sub-sentence level argument terms to their
related concepts after parsing each sentence semantically with semantic role labeller (see
Chapter 6 for more details).
2.4.4 Machine Learning Based Methods
Extractive summarisation primarily relies on sentence scoring. Typically, a number of
sentence features indicating its importance is extracted for scoring. These feature scores are
then combined according to some metric to form an aggregate sentence salience value. As
different significance levels are attached to sentence features, an effective mechanism for
combining these indicators (feature weighing) and identifying which ones are more important
than others is needed. This is where machine learning approaches play their role. Learning
algorithms applied in TS range from simple naïve Bayes classifiers [63, 64], through hidden
Markov (HMM) [65] and regression models [30] to support vectors machines (SVM) [66].

29
Indeed, Kupiec et al. [63] extended the summarisation method of Edmundson [5] by adding
two new features, the sentence length cut-off and uppercase words, to the feature set while
enabling the summary extraction algorithm to learn from the data. Precisely, they used a
Naïve Bayes Classifier to categorise summary included and excluded sentences. Assuming
independence of features, each sentence is assigned a score according to its probability of
including the summary (S) as in expression (2.3) where 𝐹1 … 𝐹𝑘 is the set of 𝑘 features. Their
system, called trainable summariser, was trained on corpus of summary-document pairs.
𝑃(𝑠 ∈ 𝑆|𝐹1, 𝐹2, … 𝐹𝑘) =∐ 𝑃(𝐹𝑖|𝑠 ∈ 𝑆). 𝑃(𝑠 ∈ 𝑆)𝑘
𝑖=1
∐ 𝑃(𝐹𝑖)𝑘𝑖=1
(2.3)
From that seminal work, a Naïve Bayes Classifier was again applied on a more extended
feature set including the frequency-driven TF*IDF [64]. In their study, which resulted in the
DimSum summariser, Aone et al. data-mined a group of key terms called signature words, to
constitute the document concepts. They also considered several other important factors, such
as noun collocations, entity tokens, shallow co-references resolution and morphological
variants in the scoring process.
Later on, Conroy and O’Leary [65] adapted HMM classification for text summarisation using
five simple statistical features; the sentence position in the document, the sentence position in
the paragraph, the number of words in the sentence, and the probability of each term and
sentence. A year later, Hirao and Isozaki [66] used a support vector machine (SVM)
classification algorithm on a manually annotated data to recognise and extract the key
document sentences as a summary. In their paper, authors claimed that their SVM based
system outperformed other machine learning methods including decision tree classification
[25]. Recently, Ouyang et al. [30] studied the application of regression models to sentence
ranking for query-focussed multi-document summarisation. They experimented their

30
proposal on DUC (2005-2007) datasets and showed that regression models can be preferred
over other classification and learning-to-rank models for computing sentence importance in
extractive summarisation.
Although learning based summarisation systems have the advantage of recognising best
performing features over the other techniques, but they have their drawbacks. One obvious
major problem inherent in supervised machine learning algorithms for summarisation is the
need for a human annotated dataset to train the summariser. This is not only a laborious task
but very expensive and time-consuming as it requires human expertise for building training
corpus. To bypass this requirement, some researchers [67] opted to automatically generate a
labelled data from the model summaries and test documents created for the evaluation of
summarisation systems. In general, supervised machine learning algorithms did not achieve a
considerable improvement in extractive summarisation as knowledge-driven methods [2].
2.4.5 Other Methods
There are several other less common approaches for extractive text summarisation including
non-negative matrix factorisation [68], fuzzy logic [69], swarm optimisation and hybrid
methods [35]. Lee et al. [68, 70] put forward a query-focussed multi-document
summarisation method based on Non-negative Matrix Factorisation (NMF). A NMF is a
procedure for the decomposition or factorisation of a non-negative matrix 𝑉 into two matrix
factors 𝑊 and 𝐻 ; 𝑉 ≈ 𝑊𝐻. In the context of summarisation, Lee et al. applied NMF on
term-sentence matrices to identify important sentences that are worth extraction for summary
inclusion. The researchers argue that NMF extracted semantic features are more intuitively
appealing than those selected with latent semantic analysis (LSA), another matrix
decomposition method, also used in TS [71]. The rationale is that the presence of negative
components in LSA matrices and the absence of their counterparts in NMF give an advantage
to the latter. In other words, the semantic features extracted using the NMF method are more

31
intuitive than those extracted with the LSA approach. This is because the NMF components
are very sparse consisting of non-negative values only while the LSA components contain
both positive and negative values with few zeros [68].
Approaches for Extractive Text Summarisation
Statistical Methods
Term Frequency
Thematic words
TF.IDF
Cue Phrases
Sentence Position
Linguistic Knowledge-based Methods
Decision Trees
Ontology-based
Lexical chains
Semantic Analysis
Rhetorical structures
Graph-based Methods
PageRank
LexRank
TextRank
Archetypal Analysis
Machine Learning-based Methods
Support Vector Machine
Regression Models
Hidden Markov Models
Naïve Bayes Classifier
Other Methods
Matrix factorisation
Fuzzy Logic
Swarm Optimisation
Hybrid Methods
Figure 2.5: Approaches for extractive text summarisation.

32
In contrast, Binwahlan et al. [70] introduced a feature-based generic single document
summarisation method using particle swarm optimisation (PSO), a population based
stochastic optimisation technique [72]. Their proposal aimed to optimise the combination of
sentence features according to the importance of each contributing feature. In their PSO
model, they selected five features; sentence centrality, title feature, word TF*ISF, Keyword
feature, and similarity with the first sentence. The weights from the said features were
determined by training their model on 100 selected documents from the DUC2002 dataset.
The proposed model was claimed to create summaries that are 43% similar to the gold
reference summaries. In a later study [35], Binwahlan et al. extended their previous work by
integrating the swarm intelligence with fuzzy logic in MMR diversity based framework. Such
integration was experimentally found to improve the summarisation performance. However,
their empirical investigation proved that the diversity does not influence summary quality.
Figure 2.5 summarises the summarisation approaches with examples as discussed in this
section.
2.5 Evaluation Methods for Text Summarisation
One of the main challenges of text summarisation is the lack of complete evaluation tools that
address all aspects of the summary quality. Currently, techniques used in assessing the
accuracy and usefulness of text summaries can be divided into two main categories: intrinsic
and extrinsic [73]. Extrinsic metrics estimate the quality of the summary based on its impact
on the completion of other tasks, e.g., question answering [2, 26] while intrinsic measures
compare the summary with human generated reference summaries or the original documents
to assess its quality in terms of the information content.
2.5.1 Intrinsic Evaluation
Extract summaries are judged intrinsically based on their content. Manual human
judgements, for instance, checking several linguistic qualities, e.g., readability, coherence,

33
conciseness and grammaticality, are seen as appropriate means of summary evaluation [26].
Although such manual evaluations have been performed at the major annual conferences,
such as the DUC due to the availability of resources, it is less likely, if not impossible, to
apply manual evaluation on the wider text summarisation field. This is because researchers
aim rapid system development and quick dissemination of results. In addition, manual
judgements are time-consuming, very expensive and require a significant amount of human
effort. Subsequently, automated schemes for assessing summary quality have drawn research
attention among the summarisation community. The work of Lin and Hovy [74] was one of
the earliest studies that investigated the feasibility of automatic summary evaluation. The
researchers indicated the existence of a very low inter-human agreement between human
summaries created from the same document. Hence, such high disagreement among human
summarisers in the selection of summaries, motivated them to propose accumulative n-gram
matching score (NAMS), an automatic evaluation tool formulated as in equation (2.4).
𝑁𝐴𝑀𝑆 = 𝑎1𝑁𝐴𝑀1 + 𝑎2𝑁𝐴𝑀2 + 𝑎3𝑁𝐴𝑀3 + 𝑎4𝑁𝐴𝑀4 (2.4 )
Where 𝑁𝐴𝑀𝑛 =#𝑚𝑎𝑡𝑐ℎ𝑒𝑑−𝑛−𝑔𝑟𝑎𝑚𝑠 𝑏𝑒𝑡𝑤𝑒𝑒𝑛 𝑀𝑈 𝑎𝑛𝑑 𝑆
𝑡𝑜𝑡𝑎𝑙 # 𝑜𝑓 𝑛−𝑔𝑟𝑎𝑚𝑠 𝑖𝑛 𝑀𝑈 (2.5) is the n-gram overlap, MU is
the model unit (e.g., clauses), S represents the generated summary and 𝑎𝑛 is a parameter used
to weight the n-gram (𝑁𝐴𝑀𝑛). NAMS is based on the same principle as BLUE, an automatic
metric for the evaluation of machine translations [75]. An n-gram refers to a sequence of n
words, for instance, the 1-grams (aka unigrams) of the summary are the single words of the
summary. Similarly, the 2-grams (aka bigrams) of the summary constitute the two-word
sequences of the summary.
2.5.1.1 Co-selection Methods
Three common co-selection methods for summary evaluation are precision, recall, and f-
measure. In the summarisation context, precision (P) denotes the proportion of sentences

34
present in both machine generated and human reference summaries over the entire
automatically extracted summary. The extract may consist of correctly and wrongly selected
sentences. The recall (R) measure indicates the number of matching sentences in machine
generated and the model summaries normalised by the total number of sentences in the
reference summary. The F-score is a composite measure that effectively combines the two
measures. The computation of the F-score accounts for the harmonic average of precision and
recall using a parameter, 𝛽, which balances the two metrics.
𝐹 − 𝑠𝑐𝑜𝑟𝑒 =(𝛽2 + 1) ∗ 𝑅 ∗ 𝑃
𝛽2 ∗ 𝑅 + 𝑃 (2.6)
When two human beings summarise the same document, they may produce two different
summaries depending on their understanding and knowledge. Both recall and precision are
influenced by such variations and can evaluate two equally good summaries differently [76].
To mitigate this problem, Radev and Tam [28] came up with Relative Utility (RU), another
measure for judging the usefulness of extract summaries. RU is defined in expression (2.7)
while further details pertaining to the evaluation method can be found in [76].
𝑅𝑈 =∑ 𝛿𝑗 ∑ 𝑢𝑖𝑗
𝑁𝑖=1
𝑛𝑗=1
∑ 𝜖𝑗 ∑ 𝑢𝑖𝑗𝑁𝑖=1
𝑛𝑗=1
(2.7)
where 𝑢𝑖𝑗 is a utility value for sentence j assigned by annotator i, 𝛿𝑗 is the summary
characteristic function for judge i and sentence j, 𝜖𝑗 is the multi-judge characteristic function.
2.5.1.2 Content-based Methods
The co-selection measures, discussed in the previous section, operate at the sentence level.
This means they merely count the exact sentence level overlaps between system and model
summaries ignoring the possibility of sub-sentence level content co-occurrences. This
precludes the consideration of likely word or phrase level, and n-gram matches, yielding a

35
significant amount of content overlap. Content-based techniques, e.g., ROUGE (Recall-
Oriented Understudy for Gisting Evaluation) [77], are proposed to address this limitation by
computing the similarity between system and model summaries at a more fine-grained sub-
sentence levels. In this section, we discuss content-based evaluation schemes that correlate
system to human summaries.
Papineni et al. [75] proposed one of the first n-gram based text selection evaluation methods
for assessing the quality of machine translated texts. Their metric, called BLUE5, is a
precision-oriented approach designed to auto-evaluate machine translation. BLUE works on
the premise that “the closer a machine translation is to a professional human translation, the
better it is.” In other words, it measures the correlation between the machine and human
reference translations. Since the principle of evaluating machine translation and automatically
generated summaries are closely related from textual context, Papineni et al. suggested BLUE
be adapted for evaluating summarisation systems. In this situation, BLUE correlates the auto-
generated system summaries with human model summaries by estimating the number of
matching n-grams. BLUE uses the modified corpus-based n-gram precision formula (𝑃𝑛)
given in quantification (2.8).
𝑃𝑛 =∑ ∑ 𝐶𝑜𝑢𝑛𝑡𝑐𝑙𝑖𝑝(𝑛 − 𝑔𝑟𝑎𝑚)𝑛−𝑔𝑟𝑎𝑚∈𝐶𝐶∈{𝐶𝑎𝑛𝑑𝑖𝑑𝑎𝑡𝑒𝑠}
∑ ∑ 𝐶𝑜𝑢𝑛𝑡(𝑛 − 𝑔𝑟𝑎𝑚′)𝑛−𝑔𝑟𝑎𝑚′∈𝐶′𝐶′∈{𝐶𝑎𝑛𝑑𝑖𝑑𝑎𝑡𝑒𝑠} (2.8)
where Candidates are translated sentences.
BLUE’s idea founded the development of the currently most popular summary evaluation
package, the ROUGE [77]. To establish the similarity between two extracted summaries,
ROUGE computes the n-gram matches between them. Due to its approved effectiveness and
5 Bilingual Language Evaluation Understudy

36
popularity, ROUGE is widely adapted in all DUC and TAC6 competitions and by the wider
summarisation community. Formally, ROUGE determines the quality of a system summary
by comparing it to an ideal human summary (known as model/reference summary) and
computes machine–to-human summary overlap in terms of n-grams. The ROUGE metric
defines a group of measures including ROUGE-N (N=1, 2, k), ROUGE-S, ROUGE-SU
(maximum skip distance dskip = 1, 4, 9), ROUGE-L, and ROUGE-W (weighting factor α =
1.2). A brief description of each of the preceding ROUGE measures is included in Appendix
D. Similar to the wider research community of the field, we use ROUGE in all our
evaluations and because the entire summarisation experiments in this thesis are based on
standard DUC datasets where ROUGE has been the primary evaluation tool. Further details
of this package can be found in Section 5.5.3 of Chapter 5 and in the original paper [77].
In 2006, two years after ROUGE’s introduction, Hovy et al. attempted to address ROUGE’s
drawbacks by creating another metric called Basic Elements (BE) [78]. ROUGE limitations
include the reliance on n-gram units only without any syntactic and semantic information and
the lack of discrimination between low informative bigrams, e.g., “Of the”, and highly
informative bigrams, such as “Birmingham University”. Unlike ROUGE, the BE evaluation
framework uses small semantic units called Basic Elements (BEs). Formally speaking, BEs
are defined as either the heads of major syntactic constituents (e.g., noun, verb, adjective,
adverbial phrase) or relations between BE-heads and their modifier expressed as a triple of
(head|modifier|relation). It is worth noting that although BEs address some ROUGE
shortcomings, the latter proved to be a real-world measure receiving a wider usage and
popularity in the field. One possible reason for this is due to its high correlation with human
judgments, the reliability of its results and ROUGE’s adoption in the major summarisation
conferences and competitions including the DUC and the TAC.
6 DUC: Document Understanding Conference; TAC: Text Analysis Conference

37
2.5.2 Extrinsic Evaluation
Text summarisation can be viewed as an intermediate step in achieving an extrinsic objective.
For example, one would assuredly spend less time to read the summary than the original
source document with an extrinsic objective of time saving. In the task of document retrieval
using search engines, we are often presented with a short summary of each ranked document.
The quality of such summaries can be estimated by assessing how it answers user’s
questions. This raises the importance of evaluating text summary extrinsically in the context
of the ultimate real-world objective. In this way, an extrinsic evaluation assesses the quality
Evaluation of
Text Summaries
Extrinsic
Intrinsic
Question answering
Reading comprehension
Relevance assessment
Co-selection
Content-based
Recall
Precision
ROUGE
BLUE
Basic Elements
Linguistic quality
Readability
Grammaticality
Coherence
Relative utility
Figure 2.6: Categorising evaluation measures for text summarisation.
38
of a summary based on the effectiveness of its usage for a specified task, such as question
answering and information retrieval.
Previously proposed extrinsic evaluations include relevance assessment [79], and reading
compression [79]. In a relevance assessment (aka responsiveness), a description statement on
a topic or about an event along with its source document and generated summary is given to
an assessor and a decision has to be reached as to whether the summary is relevant to the
topic or the event [80]. In reading compression, a distinction is made between answers to
multiple choice questions after reading the document summary and responses to the same
questions after reading the entire source document instead. The performance of the examinee
is then evaluated by cross-checking their answers in both occasions. Extrinsic evaluations
were used in the Document Understanding Conference competition of 2005 in which 31
systems participated [81]. In general, extrinsic measures help to evaluate if the summary can
act as an appropriate substitute for the full source documents. Figure 2.6 categorises summary
evaluation measures and provides examples of each category.
2.5.3 Evaluation Conferences for Text Summarisation
The first evaluation conference for automatic text summarisation systems was the TIPSTER
Text Summarisation Evaluation (SUMMAC) in 1998 [82]. The only evaluation methods used
for testing participating systems were extrinsic. For example, text summaries were assessed
to see if they can effectively replace the source documents in document categorisation and
question answering tasks. Mani et al. [82] discuss the SUMMAC conference, presenting
further details about the evaluation, its trade-offs and challenges. From this initial road
mapping workshop, NIST7 introduced a series of yearly conferences, called Document
Understanding Conference (DUC) in 2001, for the evaluation of summarisation systems.
7 National Institute of Standards and Technology

39
DUC conferences (Figure 2.7) have addressed different types of summarisation tasks over the
years from generic single document summarisation, through topic-focussed and query-
Document Understudying Conferences (DUC): DUC2001 - DUC2007
DUC2001: This conference evaluated three tasks: generic single document
(~100-word summaries), multi-document (~50, 100, 200, 400 word summaries)
and exploratory summarisations using a total 60 document sets (30 for training
and 30 testing) with their human summaries. A total of 15 systems participated in
that competition. NIST used SEE to support manual evaluation.
DUC2002: The tasks in the second year were similar to DUC2001 except that
exploration summarisation was omitted. Again, 60 document sets (but all for
testing) with manual summaries were distributed. 17 research groups participated
in that evaluation conference by submitting their systems.
DUC2003: In its third year, DUC focussed on very short single document (~10
words) and multi-document (~100 words) summarisations with strong emphasis
on events, viewpoints, questions, and novel topics in the document(s). 30 TDT
and another 30 TREC clusters were used to evaluate the 21 participating systems.
DUC2004: In this year ROUGE was used in evaluating summaries for the first
time. But, both datasets and tasks of this year were similar to the previous year
except the introduction of summarising unstructured texts (Arabic to English
translations), thus involving a kind of cross-lingual summarisation. A number of
22 summarisation systems took part in the DUC2004 competition.
DUC2005/DUC2006: DUC conferences of these two years made a major shift in
its direction by focussing on a complex real-world user-oriented summarisation.
Given 50 clusters of about 25 documents each along with user queries, the task
required the extraction of query-focussed summaries of about 250 words. Due to
the interesting problem, there was an increased participation than any prior year
where 31 and 34 systems engaged in 2005 and 2006 competitions respectively.
DUC2007: There were two tasks for evaluation this year; a main task which was
the same as the previous two years and a new pilot update summarisation task.
The evaluation data was reduced to 45 clusters for the main task (query-based)
and 10 document sets for the update with a requirement of 100-word update
summaries to be sought. 32 systems participated in the evaluation of DUC2007.
Figure 2.7: Document Understanding Conferences (DUC).

40
focussed multi-document summarisation to update and guided summarisation. In each year’s
evaluation, an independent advisory committee at NIST was assigned the task of
identification of the topics to be considered in that evaluation. The performance of each
participating system was assessed using manual evaluation methods, e.g., coherence and
completeness, and using automatic evaluation measures, such as ROUGE [77] and Basic
Elements [78]. In both cases system summaries are compared with human generated
reference summaries. In this thesis, we extensively utilised datasets from DUC2002,
DUC2005 and DUC2006 as this study pays particular attention to query-based multi-
document summarisation.
From 2008, DUC was superseded by the Text Analysis conference (TAC). TAC combined
evaluating text summarisation systems and several other text processing tasks such as
question answering and textual entailment until 20118. However, its main focus has since
been on Knowledge Base Population. Knowledge Base Population is an NLP task where a
structured incomplete knowledge base frameworks, e.g., Wikipedia infoboxes [83], are
completed with facts and entities extracted from large text corpora such as the Web, or
Wikipedia itself [84].
2.6 Challenges of Text Summarisation
Generating perfect text summaries is viewed as a difficult task to be achieved by human
summarisers, and at the time of writing, there is still a long way to go to enable machines to
produce human-like summaries. Although, there are plenty of challenges inherent in the
current approaches to text summarisation, the following are deemed to be the most pressing
limitations of the field:
8 http://www.nist.gov/tac/data/

41
1. The majority of the state of the art summarisers rely on the selection and scoring of most
significant portions of the text based on mainly non-semantic scoring features. However,
there has been a recent evolution to incorporate conceptual information of the text from
semantic networks in the summary extraction process [14-17]. However, in many cases,
the limitations of the background semantic knowledge, such as the part-of-speech
boundary, the limited lexical coverage, and the imbalance between category taxonomies
(e.g, in WordNet) all hinder a full semantic knowledge manipulation to resolve the
challenge and extract high-quality summaries [13].
2. Research is still needed to overcome the challenges posed by the continuous variation and
dynamic nature of named-entities, informative text tokens constituting a relatively
significant portion of textual data. Given the low named entity coverage in the high
quality manually crafted lexical resources [83], word-to-sentence similarity extension
methods fail to consider such informative tokens. Subsequently, this undermines the
overall semantic extraction leading to poor text summarisation systems. As far as text
summarisation is concerned, named-entities can be seen as clues of importance.
Researchers in [85, 86] proposed techniques for quantifying the relatedness of named-
entities in an isolated manner without incorporating their context.
3. One primary criticism and challenge attributed to the current knowledge-based
summarisation approaches is that they perceive text-to-text semantic relatedness as a sum
of the semantics carried by its decontextualised constituent words without considering
their context, syntactic order, and semantic roles in the current context. We think that a
more robust semantic mining method can be constructed by paying attention to word
semantic roles and linking them to a background semantic knowledge.
4. Linked with the previous points is the very common research question in ATS: How can
the overall coherence of an extractive summary be improved? Documents are normally

42
organised in a way that conserves the logical flow of ideas presented in their text. The
extraction of representative summary sentences out of the context of the document leads
to dangling references and omitted discourse linkages [87]. Albeit, the output summary
may reveal the main constituent points in the source document, but again fails to convey
strongly coherent and meaningful summary. Problems, such as dangling anaphor [88],
arising from the decontextualised content posed challenges that the research has to
overcome. Though, significant work is reported in the literature, we seem to be far away
from generating and extracting close to the human summary in coherence, readability and
in its overall quality.
5. Lastly, automatic evaluation of text summaries is still a controversial issue in text
summarisation. This is due to the fact that major evaluation techniques rely on human
generated reference summaries and whereas human summarisers always have different
ideas on what may represent a document summary [3, 26]. These differences in the
human reference summaries affect the evaluation of the machine generated summaries.
Take the example of two human experts H1 and H2 where both summarise a text
document consisting of n sentences. Let us assume that these sentences are numbered in
the order S1 to Sn and that the two human summarisers are instructed to produce two
sentence summaries. The first expert decides that S2 and S7 can convey entire document
content and considered those as the summary while H2 picked S3 and S5 as the
reprehensive summary. Similarly, the system generates a summary comprising of S7 and
S9. If the system summary is now assessed against each of the model summaries, the
evaluation results obtained in the case of the H2 reference summary is more likely to be
smaller than that of H1 and may tend to be zero if there are no n-gram co-occurrences.
The following conclusions can be drawn from the scenario:
43
The system summary sentences may have a similar meaning as S3 or S5 in H2
reference but with different wordings and henceforth, the content overlap
checking may not always yield accurate results because of lacking semantic
inference.
When using model summaries, evaluation results will highly reflect the content
against which the system summary is assessed while humans produce subjective
summaries.
To this end, the current research study contributes to addressing challenges stated in the first,
the second and third points. We attempt to address the first problem by using heuristic-based
semantic methods. Specifically, we enriched the WordNet taxonomy with other lexical
resources via morphological analysis to compensate some of its limitations. Part of our initial
methodology for this analysis is presented in [44] with further details included in Chapter 4.
For the second challenge, the work takes a different perspective from the literature by
considering the surrounding context as a contributing semantic factor. For this, we
investigated the usefulness of Wikipedia encyclopaedic knowledge for the quantification of
semantic relatedness between named entity tokens, a task performed because it supports the
study’s identification of key points and the extraction of the summaries based on semantic
methods. The approach is further augmented with an improved content word similarity
derived from WordNet taxonomy. The resulting heuristic based hybrid approach is presented
in our previous work [13] with further details included in Chapter 5.
Similarly, the issues raised in the third challenge are accounted for as follows. First, we set up
a summarisation methodology where each word in a sentence is annotated with their semantic
role using Semantic Role Labelling. Second, grouped semantic arguments on the basis of
their role are mapped to relevant encyclopaedic concepts derived from Wikipedia. Details of
this approach are thoroughly presented in Chapter 6.

44
2.7 Summary
This chapter reviews existing literature on the topic of text summarisation. Following a brief
definition, text summaries are classified on the basis of input, output, purpose and language
factors. Current summarisation approaches are then grouped into five high-level categories;
statistical methods, linguistic knowledge-based methods, machine-learning approaches,
graph-based schemes and other methods. Each of these approaches has then been thoroughly
discussed while highlighting the strengths and weakness, where applicable. Next, extrinsic
and intrinsic techniques for evaluating text summaries have been explored with an emphasis
on intrinsic measures due to their wide usage and practical application in the field. The
chapter wraps up with a brief examination of the challenges facing the current summarisation
research with an indication of the problems addressed in the current work and those
contributed to their solution.

45
3. LEXICAL-SEMANTIC KNOWLEDGE SOURCES
3.1 Introduction
Automatic text summarisation, like all other computationally intelligent text processing
systems, relies on machine readable knowledge to mimic summarisation capacity possessed
by humans in identifying key document portions. The emergence of these knowledge sources
is one of the main drivers behind the fast pace of NLP and Artificial Intelligence (AI) at
large. But one main challenge facing today’s intelligent text processing systems is the lack of
a single lexical resource that can provide sufficient knowledge to enable understanding of all
naturally produced human utterances. In other words, each knowledge base has its own
limitations in terms of its lexical coverage, e.g. WordNet, or the accuracy of information in
the repository, as is the case for Wikipedia. One way to mitigate some of these deficiencies,
as investigated in this thesis, is the combination of different lexical semantic resources to
supplement one another.
A human being continuously acquires world knowledge and builds his reasons accordingly.
To achieve similar reasoning with machine-based systems, it is necessary to extend such
capabilities to automated based systems. The role of knowledge for automatic language
understanding has been pointed out earlier on in the literature review starting from
McCarthy’s pioneering work [89], who suggested that machines should have access to world
knowledge to act as intelligent as humans. This argument is again acknowledged in [90]
whose authors indicated that automated language understanding is a knowledge-intensive
task requiring vast amounts of syntactic, semantic and discourse knowledge.
On the basis of data acquisition, knowledge sources are primarily categorised as manually
engineered and automatically acquired knowledge bases. The former category is built by
CHAPTER 3

46
human experts who represent the information in machine-readable format, e.g., a semantic
network or an ontology. The format is then made accessible to computers. A very good
example of a manually built knowledge base (KB) is WordNet, which we will discuss shortly
in the next section. By comparison, automatically acquired KBs are derived from
unstructured texts, such as webpages by means of information extraction (IE) techniques.
This has been made possible by the volume of textual information generated by netizens and
the availability of emerging powerful IE methods. Each type of these two knowledge sources
has its own pros and cons. For instance, manual approaches provide high quality and accurate
information, but are expensive to build and have low scalability. Automatic methods generate
comparably lower quality information but with low cost, high coverage and better scalability
[91].
In this chapter, we briefly introduce four lexical resources, which are intensively utilised in
our work to build extractive text summarisers. These include three manually engineered
lexical knowledge bases, namely WordNet (Section 3.2), CatVar (Section 3.4) and
Morphosemantic Links (Section 3.5), and Wikipedia (Section 3.3), a crowdsourced resource.
WordNet, CatVar and Morphosemantic Links are extensively employed in Chapter 4 and
partially in Chapter 5 in combination with Wikipedia. Due to the promising attributes of
automatically acquired knowledge, such as its large-scale lexical coverage, and the presence
of up-to-date information, Chapter 6 is entirely based on Wikipedia as background
knowledge for text summarisation.
3.2 WordNet
When we want to understand the meaning of a sentence as a human being, the level of our
understanding will depend on the extent of our knowledge of the meaning of the words in the
sentence. Similarly, a computer system processing natural language text requires information

47
about the semantics of words, normally from machine-readable electronic dictionaries, e.g.,
WordNet. WordNet is a hierarchical lexical database for English developed at Princeton
University [92]. It is based on psycholinguistic principles and has four primary word groups:
nouns, verbs, adjectives and adverbs. Its words are organised into synonym sets (synsets)
where each synset contains a conceptually interchangeable number of lexical units
representing a unique concept. Semantic relations (e.g., hyponymy) create sense-to-sense
links, while lexical relations, such as antonymy, are defined for word-to-word connections
[92]. Every synset, defined by a short accompanying text called the gloss, is linked to the
other synonym sets via semantic relations [93]. For instance, the synset in which the word
research occurs is defined by the gloss “systematic investigation to establish facts” and is
connected to the synset operations research (research designed to determine the most efficient
way to do something) by hyponymy relation.
Table 3.1: WordNet 3.0 statistic: number of words, synsets, and senses.
POS Unique Strings Synsets Total: Word-Sense Pairs
Noun 117798 82115 146312
Verb 11529 13767 25047
Adjective 21479 18156 30002
Adverb 4481 3621 5580
Total 155287 120982 206941
Table 3.1 shows the word, synset and sense proportions of WordNet 3.0, which is the version
of the resource used in this thesis. The table shows the dominance of the noun syntactic
category where over 75% of the database is of the noun class. This suggests that nouns can
achieve better results in semantic similarity calculus, which is empirically verified when used
as a target category in comparison to other word classes (see Section 4.4.1, Chapter 4). If a

48
word form in a particular syntactic category (POS), e.g., bank, is associated with a specific
sense (meaning), e.g., financial institution, it is called a word-sense pair (see the fourth
column header, Table 3.1). In fact, the total unique strings for all four word categories is
actually 147278, however, many strings are unique within a specific word category, but
exist in more than one category [94].
WordNet uses different semantic relations for different syntactic categories depending on the
word organisation. The noun category is structured as topical hierarchies using subordinate or
hyponymy relation (aka IS-A relationship) which is deemed to be the most prominent
semantic association in WordNet because of it underpinning the largest hierarchical semantic
organisation, the noun taxonomy. Other semantic relations defined among noun synsets
include antonymy, hypernymy and meronymy. Figure 3.1 shows a WordNet fragment in
which semantic relations connect specific concepts (synsets) under the general concept
{transport, conveyance}.
armers
doorlock
Hinge;
flexible joint Meronyms
Car mirror
Car
window
Car
door
Bumper
Hypernymy
{Conveyance; transport}
{Vehicle}
{Motor vehicle; automotive vehicle}
{Car; auto; automobile; machine; motorcar}
{Cruiser, police cruiser, patrol
car, police car, prowl car, squad
car}
{Cab, taxi, hack,
taxicab}
Hypernymy
Hypernymy
Hypernymy Hypernymy
Figure 3.1: WordNet fragment: taxonomy, synsets and semantic relations.

49
Table 3.2: Lexical and semantic relations in WordNet 3.0.
Relation S. Category Description Example
Synonymy N, V, Aj, Av similar to cab is a synonym for taxi
Hyponymy N kind of vehicle is a hyponym of transport
Hypernymy N, V, Aj is a generalization of machine is a hypernym of cruiser
Antonym N, V, Aj, Av opposite of man is an antonym of women
Meronym N part of bumper is a meronym of car
Holonym N contains part door is a holonym of lock
Troponym V manner of whisper is a troponym of speak
Pertainym Aj pertains to radial pertains to radius
Entailment V Entails snoring entails sleeping.
Similar to Aj similar to evil is similar to bad
Cause V cause to to treat causes to recover
Derived form N, V root form of inventor is derived from invent
Also See V, Aj related verb to lodge is related to reside
Participle of Aj participle of paid is the participle of to pay
Instance of N Instance of UK is an instance of a country
Has instance N Has instance a country has instance of UK
Attribute Aj Attribute of large is an attribute of size
N: Nouns, V: Verbs, Aj: Adjectives, Av: Adverbs, S.: Syntactic
Besides, verbs are organised by a variety of entailment relations using troponymy relation,
which is the hyponymy equivalent in the verb taxonomy [95]. WordNet organises verbs
similar to nouns in that they also have a hierarchy though it is flatter. Unlike nouns and verbs,
adjectives and adverbs are organised as N-dimensional hyperspaces. Because of the lack of
taxonomical structure for these latter two categories, applying similarity measures is not
straightforward. Table 3.2 summarises the main lexical and semantic relations of WordNet

50
3.0, the word category that uses it, followed by a brief description and example for each
relation.
Although WordNet is the most well-established and widely used semantic network in NLP,
various anomalies and limitations are attributed to it [13, 91]. Firstly, of the four syntactic
categories, three classes, namely verbs, adjectives, and adverbs constitute less than 25% of its
database lexicon as indicated in Table 3.1. This disproportionately biased composition
hinders text semantic processing where typical texts may contain fairly equal distribution of
the four primary word categories. This makes the noun taxonomy to be the most important in
WordNet in terms of it accommodating three-quarters of the database lexicon in addition to
its well-structured hierarchy. For instance, depth of the noun taxonomy reaches up to 20
levels in WordNet 3.0 as compared to only 14 levels for the verb hierarchy9. WordNet also
suffers from a limited lexical coverage to an extent that some researchers including [96]
suggested cooperative editing approach for its database similar to Wikipedia. Addressing
these WordNet limitations will be the main topic of the next chapter.
3.3 Wikipedia
Wikipedia is a freely available encyclopaedia with a collective knowledge contributed by the
entire world netizens. Since its foundation in 2001, the site has grown in both popularity and
size. At the time of our initial related experiments (April 2014), Wikipedia contained over 32
million articles in over 260 languages [83] while its English version had more than 4.5
million articles10
. Almost a year and half later (October 2015), at the time of writing this
thesis, Wikipedia has expanded to over 36 million articles with 280 active languages and its
English version hitting 4985881 articles. This shows an increase of nearly half million
articles during this period giving a view of the fast pace of the encyclopaedia’s growth.
9 This is an experimentally extracted information based on WordNet 3.0 lexical resource
10 http://en.wikipedia.org/wiki/Main_Page
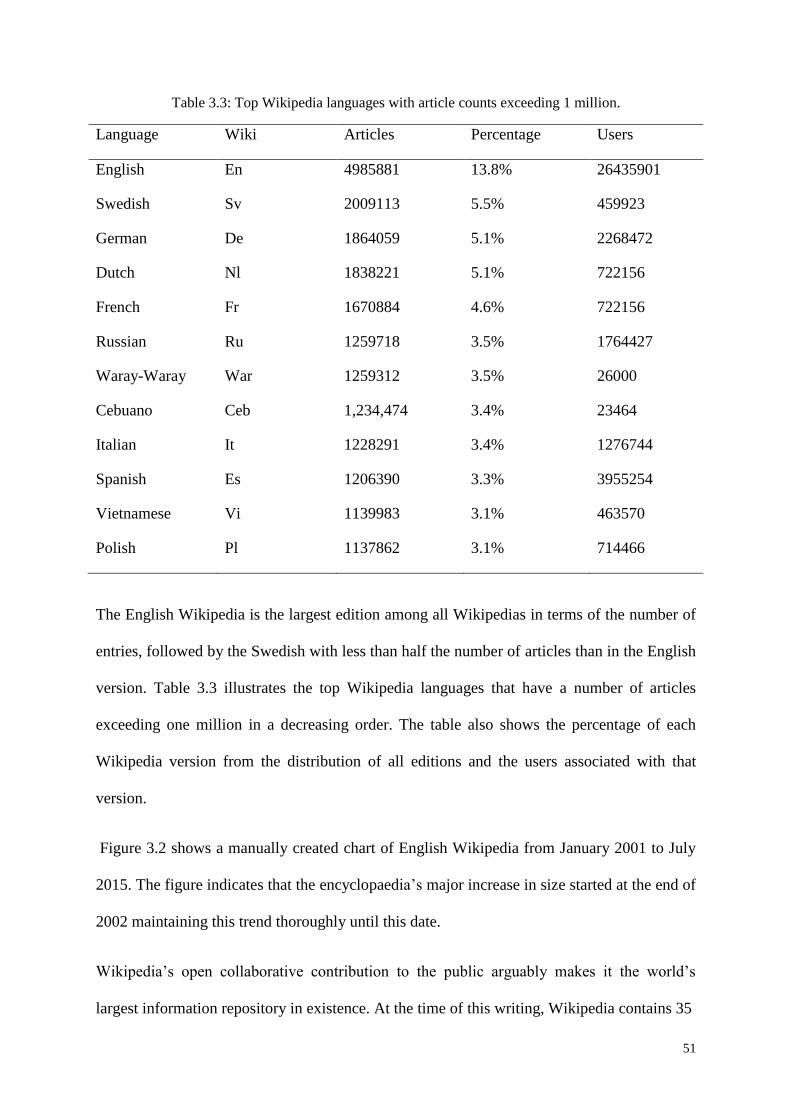
51
Table 3.3: Top Wikipedia languages with article counts exceeding 1 million.
Language Wiki Articles Percentage Users
English En 4985881 13.8% 26435901
Swedish Sv 2009113 5.5% 459923
German De 1864059 5.1% 2268472
Dutch Nl 1838221 5.1% 722156
French Fr 1670884 4.6% 722156
Russian Ru 1259718 3.5% 1764427
Waray-Waray War 1259312 3.5% 26000
Cebuano Ceb 1,234,474 3.4% 23464
Italian It 1228291 3.4% 1276744
Spanish Es 1206390 3.3% 3955254
Vietnamese Vi 1139983 3.1% 463570
Polish Pl 1137862 3.1% 714466
The English Wikipedia is the largest edition among all Wikipedias in terms of the number of
entries, followed by the Swedish with less than half the number of articles than in the English
version. Table 3.3 illustrates the top Wikipedia languages that have a number of articles
exceeding one million in a decreasing order. The table also shows the percentage of each
Wikipedia version from the distribution of all editions and the users associated with that
version.
Figure 3.2 shows a manually created chart of English Wikipedia from January 2001 to July
2015. The figure indicates that the encyclopaedia’s major increase in size started at the end of
2002 maintaining this trend thoroughly until this date.
Wikipedia’s open collaborative contribution to the public arguably makes it the world’s
largest information repository in existence. At the time of this writing, Wikipedia contains 35
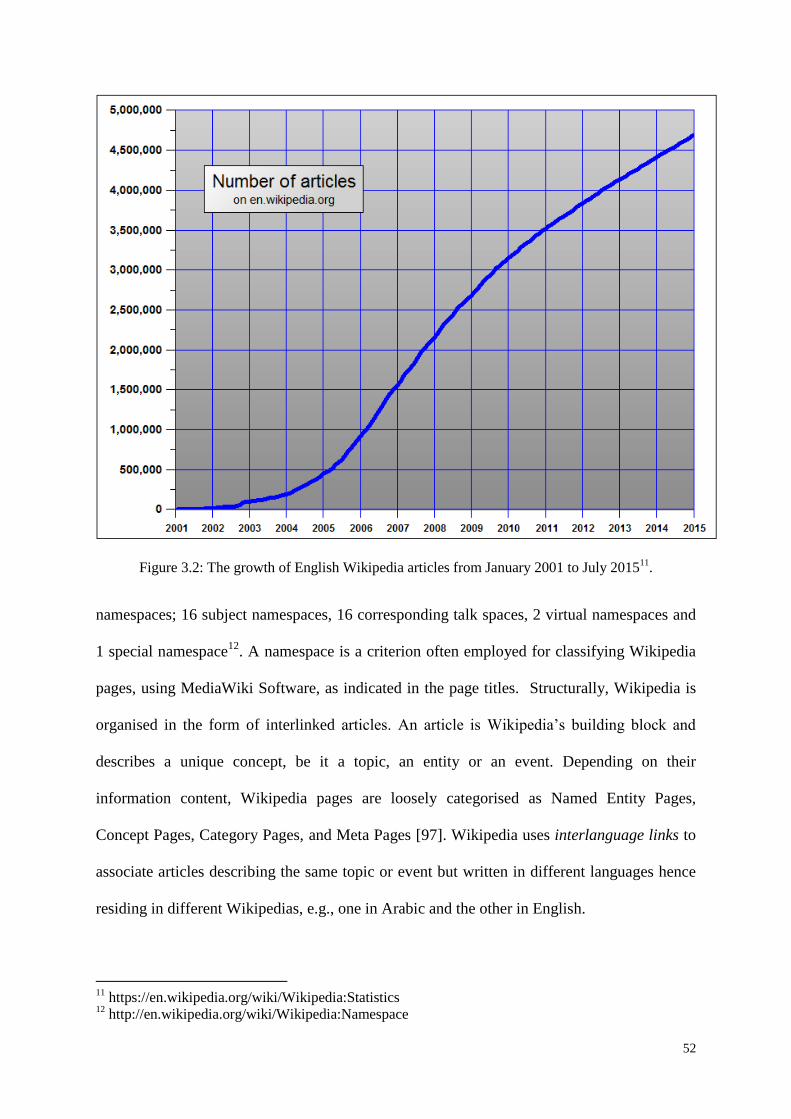
52
Figure 3.2: The growth of English Wikipedia articles from January 2001 to July 201511
.
namespaces; 16 subject namespaces, 16 corresponding talk spaces, 2 virtual namespaces and
1 special namespace12
. A namespace is a criterion often employed for classifying Wikipedia
pages, using MediaWiki Software, as indicated in the page titles. Structurally, Wikipedia is
organised in the form of interlinked articles. An article is Wikipedia’s building block and
describes a unique concept, be it a topic, an entity or an event. Depending on their
information content, Wikipedia pages are loosely categorised as Named Entity Pages,
Concept Pages, Category Pages, and Meta Pages [97]. Wikipedia uses interlanguage links to
associate articles describing the same topic or event but written in different languages hence
residing in different Wikipedias, e.g., one in Arabic and the other in English.
11
https://en.wikipedia.org/wiki/Wikipedia:Statistics 12
http://en.wikipedia.org/wiki/Wikipedia:Namespace

53
There have been some concerns raised about the accuracy of the crowdsourced world
knowledge in Wikipedia and in this regard a comparative study evaluating its accuracy
against the Britannica Encyclopedia13
has been conducted [98]. The findings from this study
were encouraging and concluded that Wikipedia has high-quality knowledge as accurate as
Britannica. In recent years, there has been a growing research interest among the NLP and
information retrieval (IR) research communities for the use of Wikipedia as a semantic
lexical resource for several NLP tasks, e.g., word semantic relatedness [99], word
disambiguation [100], text classification [49], ontology construction [101], named entity
classification [102], and summarisation [15].
3.4 Categorial Variation Database (CatVar)
CatVar [103] is a database containing English lexemes of distinct forms but derivationally-
related classes. The categorial variants fall in different parts-of-speech but share the same
morphological base form, e.g., researchV, researcherN, researchableAJ. Morphological
relations are very important for NLP applications in general and for the summarisation task in
particular. For instance, when determining the semantic similarity between sentences, which
typically comprise of different parts of speech, we need to account for all word categories, as
will be detailed in Chapter 4. CatVar organises its database in the form of word clusters
where each cluster contains variations of a particular stem as given previously.
CatVar was constructed using other lexical resources including WordNet 1.6 [92], Longman
Dictionary of Contemporary English (LDOCE) [104], the Brown Corpus section of the Penn
Treebank [105], the English morphological analysis lexicon developed for PC-Kimmo
(Englex) [106] and NOMLEX [107]. Developers also used the Porter Stemmer [108] to
create clusters of morphologically related variants.
13
http://www.britannica.com/

54
Figure 3.3: Lexical distribution in CatVar database [16].
In this thesis, we used the machine readable version of Catvar 2.0 which contains 62232
clusters and 96,368 unique lexemes [103]. Of these lexemes, 62% were of noun category
while the rest is distributed as 24% for adjectives, 10% for verbs and 4% for adverbs. Figure
3.3 demonstrates the word-cluster distribution where nearly half of the database clusters
contain one word only. The figure also shows that remaining lexemes are distributed in a Zipf
fashion over clusters of 2 to 27 words.
3.5 Morphosemantic Database
Morphosemantic database14
is a manually built WordNet-related linguistic resource that links
morphologically related nouns and verbs in WordNet, e.g, the verb direct (“guide the actors
in plays and films”) is connected to the noun director (“someone who supervises the actors
and directs the action in the production of a show”) [109].
14
https://wordnet.princeton.edu/wordnet/download/standoff/

55
It is primarily based on derivational links associating noun and verb senses in WordNet 3.0
while defining semantic types for these relations. Through manual inspection, the database
developers identified and employed 14 different semantic relations for its construction. Table
3.4 lists 7 of these relations along with an example for each relation.
Table 3.4: Morphosemantic relations.
Relation Example: Noun - Verb Pair
Agent Employer – employ
body-part adduct/adductor
state transcend/transcendence
by-means-of dilate/dilator
instrument poke/poker
property cool/cool
result liquify/liquid
3.6 Usage of the Resources
Text summarisation, like many other NLP tasks, fundamentally relies on the underlying
semantic knowledge on which it is built. It is believed that the higher the quality and
accuracy of a knowledge base, the better the performance of the summarisation based on it.
From this perspective, we employed WordNet to extract the semantic meaning of lexemes,
which are therefore employed to underpin our semantic similarity and summarisation
systems. By virtue of its organisation, WordNet excels in lexical categorisation and similarity
determination. Chapter 4 is entirely based on WordNet as a knowledge base whereas Chapter
5 relies on the semantic network for content words semantic relatedness only. Comparably,
we utilised Wikipedia because of its high quality well-formed semantic information and other
fascinating attributes, such as the high coverage of world knowledge and its up-to-date
information. Research has confirmed that Wikipedia offers more structured knowledge than

56
search engines and higher coverage than WordNet [91]. The encyclopaedia is primarily used
as a knowledge base in Chapter 6 after its partial employment for named entity semantic
relatedness in Chapter 5.
Although WordNet embeds highly accurate manually engineered semantic information, it
neither provides cross category hierarchical links nor morphological derivations, for instance,
one cannot associate investigate with investigation. This is to say that the lexical and
semantic relations, as discussed in Section 3.2, are specified among words with the same part
of speech. This hinders a full exploitation of its high-quality knowledge. Likewise, the quality
of the category hierarchies and their lexical distribution are not balanced where three-quarters
of the WordNet lexicon is under the noun taxonomy. To address these WordNet deficiencies,
we integrated WordNet with CatVar and Morphosemantic Links, as will be detailed in the
next chapter.
The motivation behind this resource combination was to use the highly accurate manually
engineered semantic information embedded in WordNet while seeking ways of handling the
cross-category limitation and the disproportionate distribution of its lexicon. Since both
CatVar and Morphosemantic links provide morphological relations of terms derived from the
same root words, we found that their combination enriches WordNet taxonomy by furnishing
a mapping between morphologically derived words. More specifically, this integration is
aimed at finding a technique to cross WordNet’s parts of speech boundary and to map verb,
adverb, and adjective categories into nouns to utilise its well-developed deep hierarchical
taxonomy and its rich IS-A semantic links. Chapter 4 gives a detailed presentation of these
category transformation techniques.

57
3.7 Summary
In this chapter, we presented four linguistic knowledge sources used for this thesis. We
briefly introduced each resource while highlighting their strengths and weaknesses. The
structure, semantic relations and lexical distribution of each resource are also discussed. The
chapter further indicates the utilisation of the lexical resources and the thesis chapter that
made use of each knowledge source. Where applicable, we stated the reasons why some
resources are combined in some parts of this thesis.

58
CHAPTER 4
4. TAXONOMY BASED SENTENCE TEXTUAL SIMILARITY
ENHANCED WITH SYNTACTIC CATEGORY CONVERSION
4.1 Introduction
Sentence Textual Similarity (STS) is the process of determining the extent to which two
sentences are semantically equivalent using a quantitative scale, usually in the interval
between 0 and 1, with 1 indicating sentences that are alike and zero that they are unrelated.
There has been a growing interest in the research of STS among the natural language
processing (NLP) community to the point that a series of yearly workshops, with the name
Semeval/*SEM15
, have been dedicated to the advancement and the evaluation of this task.
Measuring the semantic equivalence between two short texts is a basic research component
for many NLP applications including question answering [110], text summarisation [15],
paraphrase identification [111], plagiarism checking [112], event detection [113], machine
translation [114], conversational agents [115], and automatic essay scoring [116], among
others. The process of discovering semantic similarity typically involves quantifying the
extent to which pairs of words, phrases or sentences are semantically related to each other.
In Automatic Text Summarisation, for instance, the computation of the similarity between
candidate sentences permits the promotion of a good summary coverage and prevents
redundancy. On the one hand, the similarity of all sentences in a document with a single
predefined sentence, such as the first sentence of a document or its title, is sometimes used as
a scoring feature in extractive text summarisation [117]. Also, query-based summarisation
relies on query similarity scores for summary extraction [13]. Likewise, question answering
15
http://ixa2.si.ehu.es/stswiki/index.php/Main_Page

59
applications require similarity identification between a question-answer or question-question
pairs [110]. STS also plays very crucial role in information retrieval where documents
requested in the form of a query are ranked according to their similarity with the supplied
query statement [118, 119]. Plagiarism detection is a very recent area of research which is
solely based on text similarity detection [112, 120].
Judging the degree to which two textual expressions are semantically similar involves
statistical features from large corpora like Wikipedia and/or semantic features from
knowledge networks such as WordNet [121]. Particularly, many of the STS approaches are
substantially built on WordNet Taxonomy [122-126]. WordNet is a lexical database where
English words are grouped into synonym sets (synsets), which are interlinked by means of
semantic and lexical relations (see Section 3.2, Chapter 3) [127]. The existence of noun and
verb hierarchical relations in WordNet enables the construction of useful semantic similarity
measures that quantify the extent to which two distinct nouns/verbs are semantically related
[92]. This can, therefore, be extended to phrase and sentence levels, which allows us to
quantify the amount of semantic overlap between textual expressions.
Nevertheless, the use of the WordNet-based similarity approach is subject to at least three
main inherent limitations. First, the taxonomic hierarchy relations are only available for noun
and verb categories. Therefore, one can only compute the semantic similarity between a pair
of nouns or verbs. This excludes other part-of-speech (PoS) categories, such as adverb and
adjective, from semantic similarity calculus. Second, there is a strong discrepancy between
the hierarchy of noun and verb categories where the noun entity is much more abundant and
the associated depth (of the hierarchy) is much more important than that of verb category
[128]. This renders the semantic similarity of nouns and that of verb entities somehow biased.
Third, many of commonly known named-entities are almost absent in the WordNet lexical
database [91]. This substantially reduces the semantic overlap detection capabilities of any

60
WordNet-based semantic similarity measure. The first two limitations will be addressed in
this chapter while the third, among other issues, will be the emphasis of the next chapter.
In this chapter, we investigate how the incorporation of manually engineered lexical
resources with a semantic network helps in capturing the semantic similarity between short
text snippets. Especially, we use WordNet relations (Section 3.2), the Categorial Variation
Database (CatVar) (Section 3.4) and the Morphosemantic Links (Section 3.5) to subsume
verb, adjective and adverb classes under derivationally related nouns in WordNet. In the rest
of this chapter and the entire thesis, this process will be referred to as part-of-speech (PoS) or
syntactic category conversion. The contributions of this chapter are three-fold. First, we
improve traditional WordNet sentence similarity by converting poorly or non-hierarchized
word categories (e.g., verbs, adverbs and adjectives) to nouns due to the well-structured full-
fledged noun taxonomy as compared to other parts of speech encoded in WordNet. This
conversion is assisted with the use of WordNet relations, CatVar and Morphosemantic Links,
which allows covering a wide range of word pairings that would not have been matched
without such conversion. Second, WordNet’s Noun Taxonomy has been experimentally
recognised as an optimum syntactic target category to which all other word classes can be
converted (see Section 4.4.1). This followed experiments performed on two word classes;
verbs and nouns, as target categories. Third, three PoS conversion algorithms have been
compared to discover the most appropriate supplementary database to WordNet. Finally, the
proposed conversion aided approach is extensively evaluated using a set of publicly available
datasets where a comparison with some baseline approaches has been carried out.
The rest of the chapter is structured as follows. Section 4.2 deals with taxonomy-based word
similarity covering WordNet taxonomy, taxonomy-based similarity measures and some of
their algebraic properties and theoretical constraints. Section 4.3 presents WordNet-based
Sentence Textual Similarity, highlighting both conventional approach of extending WordNet

61
pairwise semantic similarity to sentence based semantic similarity, and the proposed
conversion aided WordNet similarity. Section 4.4 details our extensive experiments and
evaluation of the proposed similarity measures. In Section 4.5, we provide a brief review of
related works before drawing a summary of the chapter in Section 4.6.
4.2 Taxonomy-based Word Similarity
4.2.1 WordNet Taxonomy
WordNet Taxonomy is a hierarchical organisation of its lexicon where nodes represent word
clusters of conceptually similar terms. The edges connecting the nodes represent semantic
relations between them. Words are grouped into synsets containing conceptually similar
lexical units. Typically, synsets are used to represent lexical concepts by bounding words and
word senses together in a lexical matrix.
As already stated in Chapter 3 (see Section 3.2), taxonomic concepts are interlinked with
each other through various semantic relations such as Hypernymy, Hyponymy, Meronymy,
Entailment and many more. The preceding relations hold between concepts in WordNet.
Other relations, including the Antonymy, hold between words instead of concepts. Relations
between concepts and words in WordNet are made explicit and are labelled so that users can
select a specific relation to guide them from one concept to the next. Interestingly, relations
like hypernymy/hyponymy confer a hierarchical structure to WordNet and for that, this
relation (aka IS-A relation) is deemed to be the most useful relation in WordNet Taxonomy.
Some interesting unique properties of the hyponymy relations and their relationship with
taxonomy based similarity measures will be presented in the next section.
On the other hand, a word may appear in more than one synset, which agrees with the fact
that a word may have multiple meanings or can belong to different parts of speech (verb,
noun, adjective, adverb). Nouns and verbs are organised into hierarchical taxonomies based

62
on the hypernymy/hyponymy or hyponymy/troponymy relationships between synsets.
Indeed, WordNet assumes that each hypernymy can be broken down into other hypernymies.
However, since it is impossible to represent hypernymy with words because words have
multiple senses, hypernymy is represented as a particular sense relation. In WordNet, this
relation between lexicalized concepts is implemented by a pointer between appropriate
synsets. Therefore, a lexical hierarchy is represented by following the trail of hypernymically
related synsets. This design creates a sequence of levels going from a specific thing at the
lower level to a broader category at the top level. For example, if we use #n to denote the
sense number of the word, the curly brackets to indicate synsets, and @→ to represent a
relation with the meaning of ‘IS-A’ or ‘IS-A-KIND-OF’, a possible hierarchy would be:
{Scientist#1} @→ {researcher#1, research_worker#1, investigator#1} @→ {{boffin#1},
{experimenter#1}, {fieldworker#1},{postdoc#2}, {post_doc#2}}.
Figure 4.1 shows an example of IS-A Hierarchy. In this example taken from WordNet 3.1,
the terms {researcher; research worker; investigator} form a synset because they can be used
to refer to the same concept. A synset is often further described by a gloss: "a scientist who
devotes himself to doing research". As stated in the preceding, synsets can be related to each
other by semantic relations, such as hyponymy (between specific and more general concepts),
{researcher#1, research_worker#1, investigator#1}
{experimenter#1} {boffin#1} {fieldworker#1} {postdoc#2, post_doc#2}
{Scientist#1}
Hyponymy
Hyponymy
Figure 4.1: An example of WordNet IS-A hierarchy.

63
meronymy (between parts and wholes), cause, etc. In this example, the synset {researcher;
research_worker; investigator} is related to:
A more general concept or the hyperonym synset: (scientist),
More specific concepts or hyponym synsets: e.g., (experimenter), (boffin),
(fieldworker) and (postdoc).
This manner of representing hypernymy/hyponymy relations yields a lexical hierarchy in the
form of a tree diagram. Such hierarchies are called inheritance systems because items are
inheriting information from their superordinates. Thus, all properties of the superordinate are
assumed to be properties of the subordinate object. The nouns in WordNet are an example of
a lexical inheritance system.
In theory, it is possible to combine all hypernyms into one hierarchy subordinate to an empty
synset with no super-ordinates called a unique beginner. And in WordNet, there are several
noun hierarchies each starting with a different unique beginner [92]. These multiple
hierarchies belong to distinct semantic fields, each with a different vocabulary. Furthermore,
since all hyponyms inherit the information of their hypernym, each unique beginner
represents a primitive semantic component of the hyponym in question.
4.2.2 Similarity Measures
Knowing the similarity between two words requires us to measure how much meaning of a
word is related to the meaning of another. The terms similarity and relatedness are
occasionally used interchangeably in NLP. But in a strict sense, when a semantic association
is obtained from taxonomic IS-A relations, it is called a similarity whereas that from other
semantic relations is known as relatedness. Therefore, it should be obvious that WordNet
similarity measures discussed here primarily use the taxonomic information, especially, the
Hyponymy/Hypernymy relations. Typically, the similarity is established on the basis of a

64
Figure 4.2: Classification of semantic similarity measures.
shared pattern of characters or semantic associations derived from corpus statistics and
lexical knowledge bases. Methods that rely on information extracted from semantic networks
for the purpose of similarity calculus are known as knowledge-based measures. Classification
of similarity measures on the basis of their information sources is given in Figure 4.2 with a
detailed expansion of knowledge-based metrics employed in the current research study. The
notations IC and PL in Figure 4.2 stand for information content and path length based
measures, respectively. Similarly, the terms; res, lin, jcn, lch, wup, and path, in the figure,
represent Resnik, Lin, Jiang, Leacock & Chodoron, Wu & Palmer and Path similarity
measures, as discussed in the following sections. Knowledge-based similarity measures
operate on taxonomic hierarchies. We will mainly focus on WordNet similarity measures
because this chapter heavily utilises WordNet Taxonomy.

65
4.2.2.1 Path Based Measures
Using path-based measures, the similarity of any two words is predicted from the path
lengths connecting their concepts in a taxonomical structure. Shorter paths separating two
concepts in taxonomy are simply viewed as an indication of a higher similarity. In this
section, we briefly outline three widely used WordNet path-based measures; Shortest Path
(path), Leacock & Chodorow (lch) [129], and Wu & Palmer (wup) [130].
Shortest Path Measure (Path): It is a simple similarity measure based on the path length
between two concepts c1 and c2 in the WordNet hierarchy. This measure assumes that the
distance between the two concepts determines the strength of their likeness. The closer the
two concepts are, the higher their similarity. This implies that the similarity score is inversely
proportional to the path length represented by the number of edges along the shortest path
between the two holding synsets as given in expression (4.1).
Simpath(c1, c2) = 1 len(c1, c2)⁄ (4.1)
Where len(c1, c2) is the shortest path between concepts c1 and c2 in the WordNet taxonomy.
Wu & Palmer measure (WuP): WuP estimates the semantic relation between two synsets
from the position of their concepts, say, c1 and c2. It compares the depth of the lowest
common subsume (lcs) of the two concepts to the depth of individual concepts as in
expression (4.2).
Simwup(c1, c2) = 2 ∗depth(lcs(c1, c2))
depth(c1) + depth(c2) (4.2)
Where lcs(c1, c2) is the lowest common ancestor of concept 1 and concept 2, and depth(c1)
(𝑟𝑒𝑠𝑝. depth(c2)) is the depth of concept 1 (resp. concept 2) from the root node.

66
Leacock & Chodoron Measure (lch): Leacock and Chodoron proposed a similarity metric
which is a function of the shortest path between the two concepts, but normalized with the
maximum depth in the taxonomy (max_depth):
Simlch(c1, c2) = −log (len(c1, c2)
2 ∗ max _depth) (4.3)
It should be noted that Simwup and Simpath measures are normalized within a unit interval
while Simlch ranges from log 2 to log(2 ∗ max _depth). Normalization in the unit interval
can be achieved by the following expression.
Simlch∗ (c1, c2) =
Simlch(c1, c2) − log 2
log((2 ∗ max _depth)) − log 2 (4.4)
The similarity between two words, say, w1 and w2, is generated from the similarity of the
concepts they induce as follows: 𝑆𝑖𝑚(𝑤1, 𝑤2) = max𝑐1∈𝑠(𝑤1),𝑐2∈𝑠(𝑤2) 𝑆𝑖𝑚(𝑐1, 𝑐2) where
𝑠(𝑤1) (resp. 𝑠(𝑤2)) is the set of concepts in WordNet taxonomy that are senses of word w1
(resp. w2).
Path-based similarity measures are extensively used in this chapter for word level similarity
determination. This is due to the focus of this study being on knowledge-based similarity
measures. Their selection is also influenced by our initial experiments where they were found
to work well with the proposed conversion aided similarity measures (see Section 4.4.1).
4.2.2.2 Information Content (IC) Based Measures
Measures that merely rely on path lengths between concepts in a WordNet graph capture a
reasonable approximation of the semantic similarity. However, they ignore the consideration
of the generality and specificity of concepts as indicated by their position in the taxonomy.
For this, Resnik [131] proposed a technique for augmenting path lengths with information

67
content mined from corpora. Consequently, more specific concepts (e.g., experimenter in
Figure 4.1) will be given more weight than general concepts (such as scientist). Two of these
measures; lin and jcn, augment the information content of the lowest sub-ordinate concept
with the sum of the information contents of concepts c1 and c2 [132].
Resnik’s Measure (res): Resnik [131] defines an information content based similarity
measure that is built on the amount of information content of the lowest common subsumer
(lcs) subsuming the two concepts, c1 and c2, to be compared using the expression (4.5).
Simres(c1, c2) = IC(lcs(c1, c2)) (4.5)
Where IC(lcs(c1, c2)) is the information content of the lowest common subsumer given by its
probability in terms of concept frequencies from large corpora −logp(lcs(c1, c2)).
Lin Measure (lin): Lin [133] proposed a universal metric that normalizes the information
content of the LCS by the aggregate of concepts’ IC as given in the following relationship.
Simlin(c1, c2) = 2 ∗2 ∗ IC(lcs(c1, c2))
IC(c1) + IC(c2) (4.6)
Jiang’s measure (jcn): Jiang [134] computes the semantic equivalence of two concepts by
obtaining the difference between the sum of the concepts’ information contents (IC) and that
of the super-ordinate concept.
Simjcn(c1, c2) = (IC(c1) + IC(c2)) − 2 ∗ IC(lso(c1, c2)) (4.7)
Information content-based measures suffer from several pitfalls. First, the similarity scores
are computed from concept frequencies of a third party resource without completely utilising
the entire information in the semantic network. Second, as the similarity is derived from an
external resource, the effectiveness of the measure will be influenced by the choice of the

68
resource. Third, if different concepts share the same lowest ancestor, for res measure or have
equal information content values for lin and jcs, this will yield the same similarity scores.
4.2.3 Some Properties of Taxonomy-based Semantic Similarity Measures
In this section, we will discuss some interesting properties of taxonomy-based similarity
measures. Particularly, we will focus on the path-based measures as they purely utilise the
taxonomic information and because our emphasis is on knowledge-enriched metrics. Also,
our empirical investigation, as will be revealed later in Section 4.4.1, shows the superiority of
path-based measures with the proposed part-of-speech conversion algorithms.
Looking at the hyponymy/hypernymy or the “..IS A KIND OF..” relation R (@→):, which is
deemed to be the most important semantic relation in WordNet, shows that R acts as a partial
order relation on the set of all synsets (WordNet concepts). Indeed,
- R is reflexive: any synset can be considered as a synset of itself
- R is transitive: for any synsets c1, c2, c3 such that c1@→c2 @→ c3, entails c1 @→ c3. For
example, since “dog” is a hyponym of “mammal” and “mammal” is a hyponym of
“animal”, “dog is a hyponym of animal”.
- R is anti-symmetric: for any synsets c1, c2, if c1@→c2 and c2 @→ c1, entails c1 = c2.
The partial ordering follows from the fact that there are synsets which are not related by the
hyponymy relationship. However, the translation of the hyponymy relationship into semantic
relations in the sense of the previous properties is not straightforward. One possible
interesting question, as will be discussed later, is whether there is any relationship between
the value of the semantic similarity and the occurrence or absence of any hyponymy relation.
Intuitively, synsets 𝑐𝑖 and 𝑐𝑗 are linked by a hyponymy relation if either 𝑐𝑖 = 𝑙𝑐𝑠(𝑐𝑖, 𝑐𝑗) or
𝑐𝑗 = lcs(𝑐𝑖, 𝑐𝑗). This shows that information about lowest common subsumer provides

69
relevant information regarding the existence of a hyponymy relation. Nevertheless, such
information is not straightforwardly inferred from semantic similarity measures. Let us now
investigate the properties of the semantic similarity measures in terms of range of values
assigned to each of them, monotonicity and boundary cases. We shall use
notation 𝑆𝑖𝑚𝑥(. , . ) to denote any of previously discussed path-based similarity measures.
Consider the relations “𝑐𝑖 is semantically related to 𝑐𝑗 in the sense of 𝑆𝑖𝑚𝑥”, then it holds:
- Reflexivity: 𝑆𝑖𝑚𝑥(𝑐𝑖, 𝑐𝑗) = 1, 𝑖𝑓 𝑐𝑖 = 𝑐𝑗.
- Symmetry: Simx(ci, cj) = Simx(cj, ci).
- 0 ≤ Simx(ci, cj) ≤ 1
The above-stated properties are trivial and follow straightforwardly from the definition of the
similarities measures in (4.1), (4.2) and (4.4). Other properties of 𝑆𝑖𝑚𝑥(. , . ) are summarised
in the following statements whose proofs are included in Appendix A.
1. For synsets 𝑐𝑖, 𝑐𝑗, it holds:
i) 1
2∗max _depth≤ Simpath(ci, cj) ≤ 1 (4.8)
ii) 2
2∗max _depth+2≤ Simwup(ci, cj) ≤ 1 (4.9)
iii) 0 ≤ Simlch∗ (ci, cj) ≤ 1 (4.10)
2. For synsets 𝑐𝑖, 𝑐𝑗, it holds 𝑆𝑖𝑚𝑥(𝑐𝑖, 𝑐𝑗) = 1 ⇔ 𝑐𝑖 = 𝑐𝑗 (4.11)
Property 2 demonstrates that the only case where the semantic similarities take their
maximum value is when the underlying pair of words belongs to the same synset.
3. For synsets 𝑐𝑖, 𝑐𝑗, 𝑐𝑘, 𝑐𝑙,.
i) Simpath(ci, cj) = Simpath(ck, cl) ⇔ Simlch(ci, cj) = Simlch(ck, cl) (4.12)

70
ii) Simpath(ci, cj) < Simpath(ck, cl) ⇔ Simlch(ci, cj) < Simlch(ck, cl)
To prove the above statements, it is enough to see Simpath and Simlch are related to each
other through the log and linear transformations, and since both logarithmic and linear
transformations are both strictly monotonic functions, the result follows straightforwardly.
Besides, results in the core of property 3 are also valid for the normalized Leacock and
Chodoron similarity Simlch∗ . However, such monotonic equivalence property does not hold
between Simwup and any other two semantic similarities. To see it, one shall consider the
following counter-example and the corresponding taxonomic fragment in Figure 4.3.
Example
Simpath (process#n#6, attribute#n#2) = 0.2; Simwup (process#n#6, attribute#n#2) = 0.5.
Simpath (whole#n#2, food#n#1) = 0.1667; Simwup (whole#n#2, food#n#1) = 0.5455.
So it is easy to notice that:
Simpath (process#n#6, attribute#n#2) > Simpath (whole #n#2, food#n#1), while
Simwup (process#n#6, attribute#n#2) < Simwup (whole #n#1, food#n#1)
Figure 4.3: A fragment of WordNet Taxonomy for the example concepts.
4. For synsets 𝑐𝑖, 𝑐𝑗 it holds that:
i) Simpath(ci, cj) ≤ Simwup(ci, cj) ( 4.14)
(4.13)

71
ii) Simwup(ci, cj) ≤ Simlch∗ (ci, cj), if len(ci, cj) ≤ 2
Otherwise, Simwup(ci, cj) > Simlch∗ (ci, cj) (4.15)
Property 4 shows that for pairs of synsets that are semantically close in the WordNet
hierarchy (either being synonyms or one is a direct hyponym of another), the path similarity
is the most conservative among the three similarity measures. Otherwise, the normalized
Leacock and Chodorow measure is the less conservative one. This is especially relevant when
the order magnitude of semantic similarity is deemed important.
5. 𝑐𝑖 ≠ 𝑐𝑗 ⇒ 𝑆𝑖𝑚𝑝𝑎𝑡ℎ(𝑐𝑖, 𝑐𝑗) ≤ 0.5 and 𝑆𝑖𝑚𝑙𝑐ℎ∗ (𝑐𝑖, 𝑐𝑗) < 0.77 if 𝑙𝑒𝑛(𝑐𝑖, 𝑐𝑗) ≥ 2 (4.16)
The proof of the above statement follows straightforwardly from the fact that in the case of
different synsets, trivially 𝑙𝑒𝑛(𝑐𝑖, 𝑐𝑗) ≥ 2, which after putting the lower bound ‘2’ in
equations 4.1 (page 65) and 4.4 (page 66 ) and considering the maximum depth of WordNet
3.0 to be 20, is translated into the inequalities pointed out in the core of this property.
Property 5 indicates that the Wu and Palmer similarity is the only one that allows the user to
expect to obtain high similarity values, close to one when using different synsets. From this
perspective, 𝑆𝑖𝑚𝑤𝑢𝑝 has some theoretical and empirical advantages with respect to other two
path-based semantic similarity measures. Another interesting property to look at is the
behaviour of these semantic similarity measures when one of the synsets is a direct hyponym
of the other one. Strictly speaking, intuitively, a (full) equivalence relation between the
hyponymy and semantic similarity relations cannot be held as the former is anti-symmetric
and the latter is symmetric. Nevertheless, this does not exclude the existence of hints and/or
links between the two concepts. In this course, the following holds.
6. Assume synsets 𝑐1@ → 𝑐1′ , 𝑐2@ → 𝑐2
′ , , then it holds
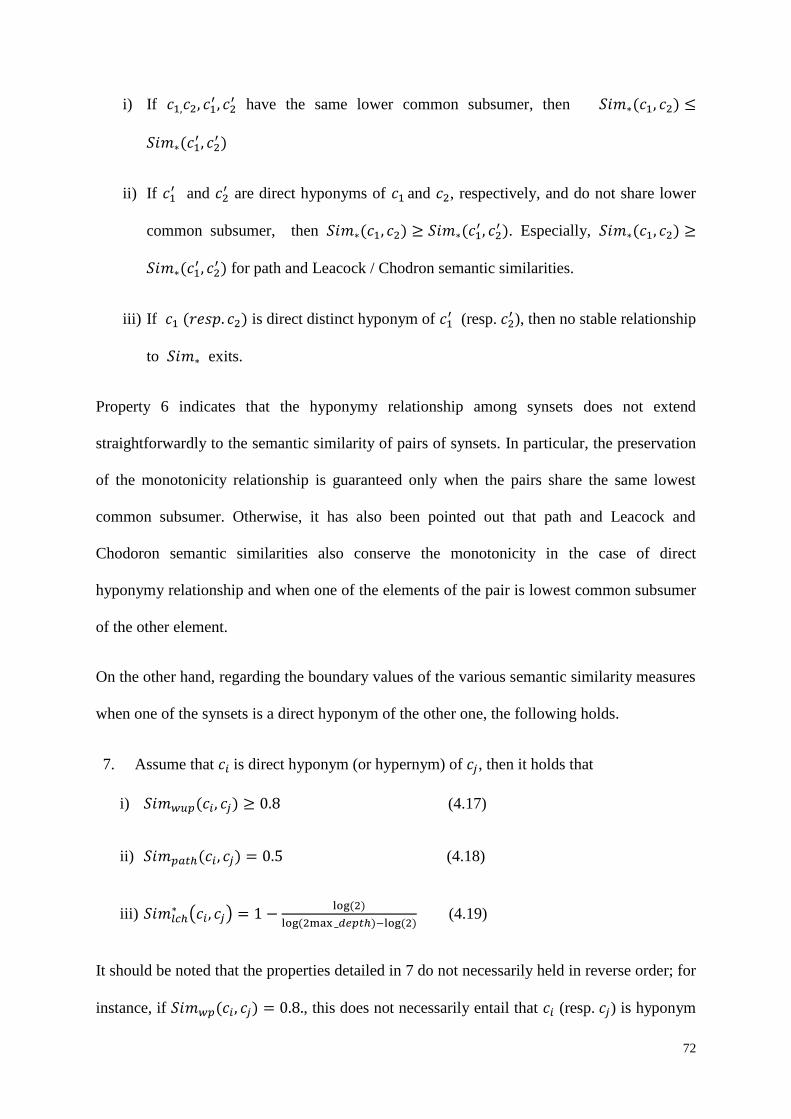
72
i) If 𝑐1,𝑐2, 𝑐1′ , 𝑐2
′ have the same lower common subsumer, then 𝑆𝑖𝑚∗(𝑐1, 𝑐2) ≤
𝑆𝑖𝑚∗(𝑐1′ , 𝑐2
′ )
ii) If 𝑐1′ and 𝑐2
′ are direct hyponyms of 𝑐1 and 𝑐2, respectively, and do not share lower
common subsumer, then 𝑆𝑖𝑚∗(𝑐1, 𝑐2) ≥ 𝑆𝑖𝑚∗(𝑐1′ , 𝑐2
′ ). Especially, 𝑆𝑖𝑚∗(𝑐1, 𝑐2) ≥
𝑆𝑖𝑚∗(𝑐1′ , 𝑐2
′ ) for path and Leacock / Chodron semantic similarities.
iii) If 𝑐1 (𝑟𝑒𝑠𝑝. 𝑐2) is direct distinct hyponym of 𝑐1′ (resp. 𝑐2
′ ), then no stable relationship
to 𝑆𝑖𝑚∗ exits.
Property 6 indicates that the hyponymy relationship among synsets does not extend
straightforwardly to the semantic similarity of pairs of synsets. In particular, the preservation
of the monotonicity relationship is guaranteed only when the pairs share the same lowest
common subsumer. Otherwise, it has also been pointed out that path and Leacock and
Chodoron semantic similarities also conserve the monotonicity in the case of direct
hyponymy relationship and when one of the elements of the pair is lowest common subsumer
of the other element.
On the other hand, regarding the boundary values of the various semantic similarity measures
when one of the synsets is a direct hyponym of the other one, the following holds.
7. Assume that 𝑐𝑖 is direct hyponym (or hypernym) of 𝑐𝑗, then it holds that
i) 𝑆𝑖𝑚𝑤𝑢𝑝(𝑐𝑖, 𝑐𝑗) ≥ 0.8 (4.17)
ii) 𝑆𝑖𝑚𝑝𝑎𝑡ℎ(𝑐𝑖, 𝑐𝑗) = 0.5 (4.18)
iii) 𝑆𝑖𝑚𝑙𝑐ℎ∗ (𝑐𝑖, 𝑐𝑗) = 1 −
log(2)
log(2max _𝑑𝑒𝑝𝑡ℎ)−log(2) (4.19)
It should be noted that the properties detailed in 7 do not necessarily held in reverse order; for
instance, if 𝑆𝑖𝑚𝑤𝑝(𝑐𝑖, 𝑐𝑗) = 0.8., this does not necessarily entail that 𝑐𝑖 (resp. 𝑐𝑗) is hyponym

73
of 𝑐𝑗 (resp. 𝑐𝑖). However, the reverse implication holds in the case of path or normalized
Leacock and Chodron semantic similarities because, if the length between the two synsets is
two, this implicitly entails that one is a direct hyponym of the other one.
8. Given a sequence of hyponymy relations as: 𝑐1@ → 𝑐2@ → 𝑐3@ → ⋯ 𝑐𝑛−1@ → 𝑐𝑛,
then it holds that 𝑆𝑖𝑚∗(𝑐1, 𝑐2) ≥ 𝑆𝑖𝑚∗(𝑐1, 𝑐3) ≥ 𝑆𝑖𝑚∗(𝑐1, 𝑐4) ≥ ⋯ . ≥ 𝑆𝑖𝑚∗(𝑐1, 𝑐𝑛−1) ≥ 𝑆𝑖𝑚(𝑐1, 𝑐𝑛),
Property 8 indicates that when a direct hyponym is available, this yields the highest semantic
similarity measures with its associated hepernym among all possible other distinct hyponyms.
Property 8 also highlights typical scenario in which the monotonicity of the hyponymy
relation is preserved when translated into semantic similarity measure.
The result pointed out in property 8 is in full agreement with the intuition behind the concept
of a synset in the sense that the more the hyponym synset is close to the current synset, the
more one expects the underlying semantic similarity becomes higher. The preceding property
reveals the importance of the concept of direct hyponym in order to ensure the satisfaction of
the monotonicity relation. To see it, it suffices to see the example of Figure A.2 (b) in
Appendix A where 𝑐1 is also a hyponym (but not direct hyponym) of 𝑐2′ and nothing prevents
𝑆𝑖𝑚∗(𝑐1, 𝑐2) to be greater than 𝑆𝑖𝑚∗(𝑐1, 𝑐2′ ).
4.3 WordNet-based Sentence Textual Similarity
In Section 4.2, we have discussed taxonomy based word level similarity measures inferred
from their conceptual semantic encoding in WordNet. This level of similarity represents the
first stage and the basis of the relatedness for other higher level text granularities such as
sentences. Since a sentence is constituted of a set of words, the sentence-to-sentence semantic
similarity is intuitively linked to word-to-word semantic similarities. However, a sentence is
more than a simple bag of words because of the importance of word disposition, parts of
speech, and punctuation, among others, which all convey a specific meaning to the sentence.

74
In this section, we present an existing WordNet-based approach of sentence textual similarity
and our proposed PoS conversion aided methods.
4.3.1 Traditional Approach
As stated previously, the IS-A relations encoded among synsets of WordNet Hierarchy create
a semantic distance. For example, the hypernymy/hyponymy chain: researcher1 @
scientist1@ person
1@ organism
1@ livingthing
1, with @ and superscripts
indicating IS-A relation and word sense respectively, provides semantic similarity
information of the words in the chain. These semantic distances and word sense links
represent the information source of similarity measures derived from path lengths of
knowledge networks. Extrapolating from word semantic similarity measures to sentence
similarity measures requires further investigation as sentences contain a group of words that
convey a complete conceptual sense. As such, any means of measuring the semantic
similarity between two sentences should somehow utilise the association from the semantic
distance between the concepts where, typically, pairwise comparison of similar word classes
using either noun or verb WordNet taxonomy is employed.
With the conventional WordNet approach, the similarity of two words can be computed only
if they are of the same part of speech and they form part of one of two syntactic categories:
nouns and verbs. Besides, given that a word may be associated to more than one concept
(synset), the semantic similarity between any pair of words is computed from the maximum
pairwise conceptual score of the two words. Related studies including [122, 124] applied
such a conventional method and extended it to sentence granularity. By this extension, if SA
and SB denote two sentences to be compared, their semantic similarity, assuming a
symmetrical contribution of the two sentences, is computed as per quantification (4.20). Any

75
of the word-to-word measures in (4.1-4.7) can be used to compute the semantic similarity
between the same PoS words (only nouns and verbs are considered).
𝑆𝑖𝑚𝑊𝑁(𝑆𝐴, 𝑆𝐵) =1
2[∑ max
𝑥∈𝑆𝐵
𝑆𝑖𝑚(𝑥, 𝑤)𝑤∈𝑆𝐴
|𝑆𝐴| +
∑ max𝑥∈𝑆𝐴
𝑆𝑖𝑚(𝑥, 𝑤)𝑤∈𝑆𝐵
|𝑆𝐵|] , 𝑃𝑜𝑆(𝑥) = 𝑃𝑜𝑆(𝑤) (4.20)
Where 𝑆𝑖𝑚(𝑥, 𝑤) stands for the word-to-word similarity measure, 𝑃𝑜𝑆(𝑤) represents the
part-of-speech of word w, and |SA| (resp. |SB|) stands for the number of terms in sentence A
(resp. sentence B).
4.3.2 An Approach Aided with Part of Speech Conversion
As indicated in Equation (4.20), the conventional approach of WordNet sentence textual
similarity is derived from averaging over all one-to-one word level semantic similarities for
words of the two sentences. Nevertheless, the above average is restricted to pairs of words
that belong either to verb or noun word categories only. This is because the IS-A relations of
WordNet do not cross part of speech boundary due to each hierarchy having a separate root
node. Therefore, semantic similarity between words, like convert and conversion cannot be
established in the conventional way because they belong to distinct PoS, which precludes
relating similar stem words. It also leaves other important sentence tokens, such as proper
nouns, adverbs and adjectives unaccounted for [44]. On the other hand, hypernymy/
hyponymy relations do not exist among adjectives and adverbs hindering the application of
similarity measures on them. From the stated limitations, it should be obvious that a means of
putting all word classes into a single class with IS-A hierarchy can solve the problem.
Consequently, we propose an approach for addressing the above limitations. It permits words
of dissimilar types to be compared by maximizing the comparable sentence semantic space
through converting loosely encoded or non-hierarchized word classes into a single strongly
hierarchized word category. To this end, we set up comparative experiments between noun

76
and verb classes in seeking a target category. Through this empirical investigation, detailed in
Section 4.4.1, the noun category was found to be an optimum target category enabling the
three primary word categories, namely verbs, adjectives and adverbs to be subsumed under
their equivalent nouns of WordNet taxonomy.
Figure 4.4: Sentence semantic similarity assisted with PoS conversion.
In addition to WordNet relations, the word category conversion is accomplished with the aid
of two other lexical resources, namely, Categorial Variation Database and Morphosemantic
Links (see Chapter 3). Furthermore, we carried out a comparison of the conversion assisted
methods based on the aiding resource as will be described later in Section 4.4.2. This whole
raft of supplementary procedures gave the opportunity of handling the stated part of speech
boundary limitation in WordNet. A block diagram of the proposed architecture for CatVar-
aided sentence textual similarity is depicted in Figure 4.4. It comprises four main modules:
Text Pre-processing, Sentence Semantic Similarity, Word PoS Conversion and WordNet

77
Similarity Measure. The pre-processing module performs basic pre-processing tasks such as
part of speech tagging, tokenization and the removal of stop words. Stemming was omitted to
keep the original meaning of the words because a linguistic measure is to be applied. The
Sentence Semantic Similarity Module represents the core component of the system. The pre-
processed sentence texts are fed into the core module whilst an interface is designed between
this core module and the part-of-speech conversion module interacted with CatVar database.
4.3.2.1 An Illustrative Example
For explication, consider the pair of semantically equivalent sentences in Example 4.1. Note
that from the pair, the tokens “the”, “of”, “is”, “an”, and “for” are part of extremely common
words known as stop words, and are eliminated as part of the pre-processing stage.
Example 4.1:
S1: The transformation of word forms is an improvement for the sentence similarity.
S2: Converting word forms enhances the sentence similarity.
Figure 4.5: Tokenised PoS tagged tokens of the Illustrative Example.
After initial text pre-processing, including part-of-speech tagging, lemmatization and stop
words removal, the two sentences boil down to the token-based representation given in
Figure 4.5 (A). The double-headed arrows in the figure indicate the plausibility of pair’s
similarity quantification. It is easy to notice that unlike sentence 2, sentence 1 contains no

78
verb PoS, which would result in the words converting and enhances not contributing to the
overall sentence similarity score. Applying expression (4.20) to the token representation in
Figure 4.5 (A) with conventional WordNet approach yields a sentence similarity score of:
𝑆𝑖𝑚(𝑆1, 𝑆2) =1
2[0.7619 + 1 + 1 + 0.6667 + 1 + 1 + 0 + 1 + 1 + 0 + 1 + 1
6] ≈ 0.7857
However, converting the syntactic category of the two non-contributing tokens to their
equivalent nouns, as shown in Figure 4.5 (B), improves the similarity score as follows:
𝑆𝑖𝑚(𝑆1, 𝑆2) =1
2[0.9412 + 1 + 1 + 0.9524 + 1 + 1 + 1 + 1 + 1 + 1 + 1 + 1
6] ≈ 0.991
The following notes can be made from the above example:
The two sentences reduced to content words in two classes; verbs and nouns without
adjectives and adverbs. The two verbs (converting and enhances) have been changed
to their equivalent nouns; converting to conversion and enhances to enhancement.
The generated nouns attain good counterparts from the partner sentence, say,
improvement for enhancement and transformation for conversion. This is why the
final similarity score is boosted.
The Wu & Palmer measure has been used to compute the similarity of word pairings.
We will later explain the rationale behind the selection of this similarity measure (see
Section 4.4.1).
For simplicity, each sentence of the pair consists of an equal number of tokens which
leads to a unified normalization factor and simplifies expression 4.20 (page 75).
4.3.2.2 CatVar-Assisted Part-of-Speech Conversion
The Categorial Variation Database or CatVar has been already mentioned in Section 3.4 of
the previous chapter. We have used local machine readable version of the database for the

79
…………………………………………………………………………………………
Algorithm 4.1: Word Category Conversion using CatVar.
WCConvert ( S, TargetCategory )
# A vector that holds the category converted sentence terms
W ← { }
W ← tokenize(S)
Open(CatVarDB)
# Check each token of the sentence and convert every non-noun term in it
For all ( wi ϵ W ) do
# Resolve the inflections of the inflected words
If wi ϵ inflectedwords then
POSwi ← ExtractPOSTag(wi)
# Retrieve the valid forms of the word from WordNet 3.0
VFS ← ValidForms(wi)
For each wj ϵ VFS
POSwi ← ExtractPOSTag(wj)
If POSwi ≡ POSwj then
wi ← wj
Break;
End if
End for
End if
# The CatVar-aided conversion is carried out using its clusters
CurrentCluster ← firstDBCluster
While CurrentCluster ≠ EOF do
If wi ϵ currentCluster then
# The conversion is achieved as shown in Figure 4.6
cw ← Covert(wi)
Break;
End if
End while
W ← W υ { CW }
End for
return W
…………………………………………………………………………………………..
task of word category conversion. The PoS conversion assisted with CatVar is a simple
process. It is accomplished by finding the database cluster containing the word to be
converted and replacing it with a target word. As an example, if we want to convert the word
assimilate to its noun counterpart, we retrieve the CatVar cluster holding it, as in Figure 4.6,
and replace it with the noun assimilation. We have developed a Perl module that implements

80
the conversion on this manner using local Perl readable version of the CatVar database. There
were challenges associated with inflectional words, such as nouns in their plural forms or
verbs in different tenses during the conversion. Inflectional forms are reduced, after which
content morphomes are fed into a converting module. The procedural flow of the CatVar
aided class transformation is summarised in Algorithm 4.1.
Figure 4.6: An example CatVar cluster.
Interestingly, the CatVar database differs from other employed lexical resources in that it
provides exact word categorial variants where the word syntactic conversion assisted with
Morphosemantic database and WordNet is accomplished through conceptual relatedness.
4.3.2.3 Using WordNet Relations for Part-of-Speech Conversion
The basis of word class conversion, in this case, is to make use of both the various senses that
can be associated to the given word according to the WordNet lexical database as well the
hierarchy in the set of associated hyponyms. Unlike CatVar-aided conversion, this technique
of PoS conversion distinguishes adverb/adjective and verb part of speech categories. In the
case of adverbs and adjectives, the basis of the conversion is to use the derivationally related
forms and pertainym relationships in WordNet to output the noun form, if any.
However for the conversion of verbs, we follow a systematic four level conversion procedure
(Figure 4.7) starting with verb surface forms where the verb itself is checked for having a

81
Figure 4.7: The 4-level WordNet aided part-of-speech conversion.
noun form. For example, the words run and research are verbs and nouns at the same time.
The second level investigates the synonyms of the verb senses. In this level every synset
harbouring each sense of that verb is examined, and if it has a noun member a replacement is
made with it. At this level, the verb ignore changes to the noun disregard. The third level
differs from the previous two in that it goes down one level to the child node in the WordNet
taxonomy following the hyponymy relation in which case the word is converted by replacing
it with the first encountered node of the target category. The conversion of the verb deceive to
the noun cheat is an example achieved at this level. Lastly, the fourth level is based on
moving one parent node up the taxonomy through hypernymy relation where the first
obtained noun is used as an approximate noun counterpart. By this method, the verb
hibernate is transformed to the noun sleep. The WordNet aided conversion levels are shown
in Figure 4.7 with the example converted for each level underneath the same figure.

82
From Figure 4.7, one can note that nouns obtained through the conversion via WordNet
relations do not always yield exact verb equivalent nouns. Especially, as the conversion is
achieved in the higher levels, the resulting noun expression tends to be approximated nouns
rather than equivalents. Nouns extracted at Level 3 contain narrower categories due to the
hyponymy relation while Level 4 provides a broader noun expression. To view the
applicability of the proposed category conversion, we attempted to change the entire
WordNet 3.0 verbs to their equivalent and approximate nouns in its taxonomy.
Figure 4.8: Changing WordNet 3.0 verbs to nouns using the 4-level WordNet-aided PoS conversion.
Figure 4.8 indicates the proportions of the total WordNet 3.0 verbs (13767) converted at each
level. Noticeably, 7379 of these verbs which are about 54% of total verbs in WordNet 3.0 are
mapped to their noun counterparts at level 1. Level 2 achieved the conversion of 3107 verbs
(about 23%) making it nearly half of the previous level followed by around 14% at level 4.
Surprisingly, conversion of only 408 verbs (3%) attain their approximate nouns at level 3
making the hyponym the least successful semantic relation in providing noun forms.
0%
10%
20%
30%
40%
50%
60%
Level 1 Level 2 Level 3 Level 4
Co
nv
erte
d v
erb
s
Levels of conversion
Propertions of coverted verbs at each level

83
The remaining 9% of total verbs have failed to attain noun counterparts. The fact that only
9% of WordNet 3.0 verbs are left unconverted shows the effectiveness of this strategy.
However, the question remains as to whether this PoS conversion approach employing
WordNet relations can equally perform as the CatVar-aided method offering exact word class
substitutions. This is best answered by the experimental findings presented in Section 4.4.2.
4.3.2.4 Part-of-Speech Conversion Aided with Morphosemantic Links
Using Morphosemantic Links for subsuming verbs under derivationally and semantically
related nouns is the simplest of the three approaches. The conversion method aided with this
method is performed by looking up the word to be converted from the corresponding
database entry and replacing it with the target category word. For example to convert the verb
withdraw, a simple look-up database matching yields withdrawal as an equivalent noun to
withdraw in the database (withdraw ⇒ withdrawal). Table 4.1 shows the related database
record after omitting the offset sense keys. Unlike CatVar, Morphosemantic Links does not
hold adverb/adjective categories and it is for this reason that we think to be the primary
cause of CatVar being the excelling scheme over the other two PoS conversion approaches
because of them improperly handling these two main word categories.
Table 4.1: Morphosemantic database record for –withdraw.
Verb relation Noun Verb Gloss Noun Gloss
withdraw event withdrawal break from a meeting or
gathering;
the act of withdrawing;
Table 4.2 shows the similarity scores between the two sentences in Example 4.1 before and
after applying the three discussed PoS conversion algorithms. On this occasion, it is obvious
that the WordNet-aided PoS conversion fails to properly transform the constituent verbs to

84
nouns yielding the same score as traditional WordNet similarity. However, the CatVar-aided
conversion accurately captures the semantic likeness of the sentence pair.
Table 4.2: Similarity scores of the sentence pair in Example 4.1 using traditional WordNet and
conversion aided WordNet similarity measures.
Traditional WordNet WordNet with syntactic category conversion using:
WordNet Relations Morphosemantic Links CatVar
0.7857 0.7858 0.9051 0.991
4.4 Experiments
This section presents the experiments for evaluating the proposed similarity measure with the
syntactic category conversion algorithms. First, we describe a few initial experiments used to
identify a suitable target category and the best supplementary lexical resource for the
conversion. Then, we validate the measure comparing our large scale dataset results to
baselines. Four different standard datasets were used in the course of testing and evaluation
experiments, as presented in the following section.
4.4.1 Experiment 1: Target Category Identification:
4.4.1.1 Dataset
In the first experiment, aimed at classifying a suitable target category as in this section, we
employed a publicly available dataset on the Gulf Air Crash in Bahrain 2000 [135]. This
consists of three related documents, named 41, 81 and 87, which in total contain a set of 100
sentences. This dataset has been used in MEAD16
[28], an automatic centroid-based text
summarisation software. A topic statement in the form of a query comes with the dataset.
4.4.1.2 Results and Discussion
The first step taken towards building the PoS conversion aided similarity measure was to
identify a suitable target category to which all other open class content words should be
16
Available at: http://www.summarisation.com/mead/.

85
turned. From the nature of the WordNet graph where only nouns and verbs are hierarchically
organised, we learned that there are only two routes to achieve this; a conversion to nouns or
to verbs, which we termed as All-to-nouns and All-to-verbs, respectively (see Figure 4.4 for
the setup). All-to-nouns is meant that all other primary categories in a sentence are changed
to their equivalent nouns making only nouns to participate in the scoring, whilst All-to-verbs
is the vice versa. This comes after an analysis and evaluation for these two routes made in the
form of experiments that were conducted under different scenarios as reported in Table 4.4.
Notations indicating different similarity schemes used in Table 4.4 and their interpretations
are listed in Table 4.3.
Table 4.3: Notations used to indicate different similarity schemes.
Notation Interpretation
CosSim Cosine similarity
TWN Traditional WordNet / without conversion
CwW_tV Conversion with WordNet to verbs
CwW_Tn Conversion with WordNet to nouns
CwC_tV Conversion with CatVar to verbs
CwC_tN Conversion with CatVar to nouns
CwM_tV Conversion with Morphosemantics to verbs
CwM_tN Conversion with Morphosemantics to nouns
DID: SN Document ID, sentence number
Table 4.4: A sample extract of the similarity scores from the Gulf Air crash dataset.
DID : SNO CosSim TWN CwW_tV CwC_tV CwW_tN CwC_tN CwM_tV CwM_tN
41:1 vs Q
41:2 vs Q
41:3 vs Q
81:1 vs Q
81:2 vs Q
81:3 vs Q
87:1 vs Q
87:2 vs Q
87:3 vs Q
0.0351
0.2373
0.2533
0.0537
0.1578
0.1541
0.0445
0.1733
0.0188
0.5937
0.9325
0.5733
0.3871
0.7521
0.8002
0.5278
0.8456
0.7525
0.3248
0.5119
0.3758
0.3051
0.5009
0.4873
0.2839
0.4059
0.3703
0.3067
0.5890
0.3878
0.3876
0.6717
0.5277
0.3403
0.4840
0.4478
0.6508
0.9690
0.7739
0.3871
0.8493
0.9137
0.5278
0.8763
0.8119
0.7995
1
0.8616
0.6697
0.9130
1
0.5863
0.8920
0.9753
0.3321
0.4449
0.2980
0.4390
0.4072
0.3299
0.2803
0.3139
0.2820
0.7337
0.8045
0.7222
0.6619
0.7515
0.7831
0.7315
0.8101
0.6716

86
This included tests carried out under the conventional WordNet approach without conversion
followed by experiments done using the PoS conversion schemes discussed in Section 4.3.2.
The scores were also compared against the well-established similarity measure; the cosine
similarity for evaluation.
Table 4.4 shows an extract of the results for Gulf Air Crash dataset. The values in the table
are the similarity scores between document sentences and a related topic statement
represented in the form of query (Q). The scores range from 0 to 1 with the high scores
showing strong semantic similarities and the vice versa. Table 4.4 indicates that using noun
taxonomy as the target class achieves promising results in all different conversion aided
similarity measures. In other words, the All-to-Noun scheme performs much better than the
All-to-verbs in all scenarios. This should not be surprising because, unlike verbs, noun
taxonomy in WordNet possesses well-structured deeper taxonomy than verbs which makes it
offer more semantic information. The underperformance of verbs as a target category can
also be attributed to the fact that a large number of nouns, including proper nouns such as
those for people, places, organisations, things, times, events, numbers and many adjectives
and adverbs, are unchangeable to verbs. In addition, 75% of WordNet database is on the noun
class, as highlighted in Chapter 3. Also, most verbs, adverbs and adjectives have
derivationally and semantically related nouns. Therefore, the All-to-Nouns scheme ensures
the comparison of a maximum number of words in a sentence because all terms now form
part of the same taxonomic hierarchy in the WordNet database.
Table 4.5: Summary of the results for the entire Gulf Air crash dataset.
Measure Average Sentence Similarity Scores
TWN CwW_tV CwC_tN CwW_tN CwC_tN CwM_tN CwM_tV
Lin
WuP
0.34266
0.55824
0.19472
0.2742
0.20134
0.34967
0.39577
0.63578
0.35821
0.74792
0.30453
0.64640
0.08889
0.24762

87
At the word level similarity, we made use of two different WordNet-based measures; Wup (a
path based measure, equation 4.2, page 65) and Lin (information content based measure,
equation 4.6, page 67) both of which are implemented in [132]. The two measures have been
employed for two reasons; scrutinizing the extent to which the PoS conversion affects the
statistical and probabilistic properties of the type-changed words, and specifying the optimum
WordNet measure that best works with the scheme. Table 4.5 summarises the semantic
similarity scores of entire test data. The path-based measure (WuP) significantly outperforms
its corresponding information content based measure (Lin). From these findings, we conclude
that the proposed methodology works well with path-based similarity measures which will be
used in the rest of the experiments.
4.4.2 Experiment 2: Comparison of the Conversion Aided Methods
4.4.2.1 Dataset
The comparative experiments of the conversion aided methods in this section were conducted
on a pilot short text semantic similarity benchmark dataset created for a similar purpose
[136]. It contains 65 sentence pairs with human similarity judgements assigned to each pair.
During this dataset creation, 32 graduate native speakers were assigned to score the similarity
degree between each pair using scores from 0.0 to 4.0 and following the guideline of
semantic anchors [137] listed in Table 4.6.
Table 4.6: Semantic anchors.
Scale Point Semantic Anchor
0.0 The sentences are unrelated in meaning
1.0 The sentences are vaguely similar in meaning
2.0 The sentences are very much a like in meaning
3.0 The sentences are strongly related in meaning
4.0 The sentences are identical in meaning

88
4.4.2.2 Results and Discussion
A critical observation of the results in Table 4.4 and Table 4.5 shows that the CatVar-assisted
system is the performant scheme among the previously discussed conversion aided methods.
This led us to set up comparative experiments aimed at identifying the best supplementary
lexical resource for word category conversion. Figure 4.9 depicts our layered implementation
of the multiple conversion aided sentence textual similarity. For every two sentences, we
determine how closely the two are semantically related using scores between 1.0 and 0.0 with
1.0 indicating identical texts. In this setup, all text pre-processing tasks including
tokenization, parts of speech tagging, and stop words removal are implemented in layer 1.
Figure 4.9: Comparative setup of conversion aided methods for sentence similarity.
The second layer houses the three previously discussed word category conversion
approaches. In each experimental run, only one approach is used depending on the choice of

89
internally hardcoded system logic. The generated outputs from layer 2 are sentence text
vectors having the same part of speech. These vectors are then fed into the Text Semantic
Similarity Module to measure the similarity score using the Wu and Palmer measure [130]
for word level similarity and the WordNet taxonomy as an information source according to
equations 4.2 (page 65) and 4.20 (page 74).
This set of experiments is evaluated with the 65 human annotated sentence pairs described in
Section 4.4.2.1. Our evaluation for all three conversion assisted systems is centered around
the human judgements that reflect the extent to which every two sentences are semantically
related from the human perception. A comparison of our conversion aided methods
(WNwWNC, WNwMLC, WNwCVC) and the findings of two baselines (STASIS, LSA) [136,
138, 139], which were based on the same benchmark dataset, is carried out. The notations
WNwWNC, WNwMLC, and WNwCVC represent Conversion with WordNet, Conversion with
Morphosemantics and conversion with CatVar respectively. To measure the strength of the
linear association, we computed the correlation coefficients (r) between the score of each
conversion aided method from one side and the human judgements plus the baselines from
the other as presented in Figure 4.10. The correlation coefficients are computed using
equation 4.21, where n is the number of sentence pairs while m and h represent machine-
based and human assigned scores, respectively.
𝑟 =n ∑ ℎ𝑖𝑚𝑖𝑖 − ∑ ℎ𝑖 ∑ 𝑚𝑖𝑖𝑖
√(𝑛 ∑ ℎ𝑖2
𝑖 − (∑ ℎ𝑖𝑖 )2) √(𝑛 ∑ 𝑚𝑖2
𝑖 − (∑ 𝑚𝑖𝑖 )2)
(4.21)
The correlation coefficients between our conversion aided schemes and the two compared
benchmark methods along with the human judgements are shown in Figure 4.10. They show
that statistically speaking, latent semantic analysis (LSA) provides the best consistency with
WordNet-based similarity. Of the three schemes, CatVar-aided conversion establishes the

90
highest semantic correlation between the sentence pairs corroborating the hypothesis that
CatVar can be used as a supplementary resource to WordNet. This is in line with the trend of
results presented in Section 4.4.1. Overall, scores of correlation coefficients of the developed
approaches with the baseline methods; STASIS [138], and LSA [139], and human
judgements indicate that CatVar-based conversion is the competitive scheme.
Figure 4.10: Correlation coefficients (r) between the WordNet-based PoS conversion aided similarity
measures and the baseline methods and human ratings.
To further visualize the effect of correlation scores across the dataset sentence pairs, Figure
4.11 illustrates the association between the human ratings and each of the achieved results. It
is evident that all the three relationships follow a positive linear trend with slightly varying
but a strong correlation with the human judgements and without outliers. For those sentence
pairs which are either strongly related or identical in meaning, there is a high agreement
between the human evaluation and machine assessment for semantic similarity. The results
also confirm that CatVar aided conversion yields a strong positive correlation with the human
rating. From what has been conveyed so far, we draw the conclusion that CatVar is the most
suitable add-on lexical resource to WordNet in the improvement of WordNet-based short text
0
0.1
0.2
0.3
0.4
0.5
0.6
0.7
0.8
0.9
Human STASIS LSA
Co
rrel
ati
on
sco
res
Similarity measures
WNwWNC
WNwMLC
WNwCVC

91
semantic similarity. As such, we will utilise this approach in the final evaluation of the
proposed conversion aided similarity measure presented in Section 4.4.3.
Figure 4.11: Relationships between our results and human judgements for the benchmark dataset.
In a nutshell, the experiments on the search for an appropriate target category and optimum
complementary lexical resource to WordNet demonstrated that weaknesses of the semantic
network can be improved by resource integration.
4.4.3 Experiment 3: Evaluation of the Proposed Approach on Paraphrase Identification
4.4.3.1 Dataset
In this experiment, we used two different datasets, namely Microsoft Research Paraphrase
Corpus and TREC-9 Question Variants both which are briefly described below.
Microsoft Research Paraphrase Corpus
Microsoft Research Paraphrase Corpus (MSRPC) is a human annotated dataset created from
news articles on the web for the evaluation of machine-based similarity detection and
paraphrase identification tasks [140]. Its creation has undergone a series of refining stages
from which developers finally produced a set of 5801 sentence pairs. The data is unequally
split into 30% testing and 70% training. We used 750 sentence pairs extracted from the
training data to determine an optimum demarcation threshold for the classification of

92
sentence pairs as positive or negative paraphrases. For the performance evaluation, we used
the entire test data (1725 pairs).
TREC-9 Question Variants
Similar to MSRPC, TREC-9 Question Variants17
is created by human assessors to describe
semantically identical but syntactically different questions. The dataset contains 54 sets with
each derived from an original question paraphrased to equivalent variants ranging from 1 to 7
questions. Unlike, MSRPC, it is characterized by a smaller size and shorter sentence lengths.
We created 228 pairs of sentences from the same dataset classified into two groups of pairs;
semantically equivalent composed of an original question and its paraphrased variants, and
dissimilar questions randomly paired from its different subsets. This was done to strengthen
the assessment of the proposed system using the information retrieval metrics of precision,
recall, f-measure and accuracy as presented in Section 4.4.3.2.
4.4.3.2 Evaluation Metrics
Our similarity based paraphrase identification approach produces four possible outcomes. In
the first case, two semantically equivalent sentences might be identified as positive
paraphrases of one another, commonly referred to as true positive (TP). Secondly, a false
negative (FN) occurs when a pair is incorrectly classified as similar sentences. Thirdly, there
exists a situation known as false positive (FP) where a given sentence pair is semantically
inequivalent, but the system labels them as paraphrases. Lastly, when a semantically
unrelated sentence pair is correctly predicted as non-paraphrases, it is referred to as true
negative (TN). Based on these outcomes, we evaluated the performance of the proposed
method using four different metrics namely precision, recall, F-measure and accuracy (exp.
4.22).
17
http://trec.nist.gov/data/qa/t9_qadata.html

93
𝐴𝑐𝑐𝑢𝑟𝑎𝑐𝑦 =𝑇𝑃 + 𝑇𝑁
𝑇𝑃 + 𝑇𝑁 + 𝐹𝑃 + 𝐹𝑁 (4.22)
In this context, the precision as given in expression (4.23), is the proportion of really similar
sentences over the total pairs identified as semantic equivalents.
𝑃𝑟𝑒𝑐𝑖𝑠𝑖𝑜𝑛 =𝑇𝑃
𝑇𝑃 + 𝐹𝑃 (4.23)
Unlike the precision, recall (exp. 4. 24) measures the proportion of pairs that are alike and
have been correctly classified.
𝑅𝑒𝑐𝑎𝑙𝑙 =𝑇𝑃
𝑇𝑃 + 𝐹𝑁 (4.24)
Empirical evidences have shown the existence of a trade-off between precision and recall
[141]. Consequently, the F-measure (exp. 4.25) has been developed as a compromise and a
proper measure that combines the effect of the two.
𝐹 − 𝑚𝑒𝑎𝑠𝑢𝑟𝑒 =2 ∗ 𝑅𝑒𝑐𝑎𝑙𝑙 ∗ 𝑃𝑟𝑒𝑐𝑖𝑠𝑖𝑜𝑛
𝑅𝑒𝑐𝑎𝑙𝑙 + 𝑃𝑟𝑒𝑐𝑖𝑠𝑖𝑜𝑛 (4.25)
The notations FP, TP, FN & TN in equations (4.22-4.24) signpost false positives, true
positives, false negatives and true negatives respectively and are as defined above.
4.4.3.3 Results and Discussion
The final experiment considers a large scale evaluation of our proposed conversion aided
similarity measure using larger datasets, namely TREC-9 and MSRPC described in Section
4.4.3.1. The purpose of the current experiment is to automatically determine if two given
sentences are semantically similar using a predefined threshold where each pair is classified
as similar if the established similarity score is above/equals the threshold.

94
Initially, we ran a set of training experiments using 750 sentence pairs from MSRPC and 30%
of the total TREC-9 dataset while reserving the rest 70% and the entire MSRPC testing data
(1725 pairs) for testing and evaluation. During this training, we empirically determined a
threshold value of 0.7 to be the optimum demarcation criteria. In other words, we classify
sentence pairs as true paraphrases if their overall semantic similarity score equals or exceeds
0.7. All other pairs with similarity scores less than that are identified as negative paraphrases.
Unlike the commonly employed demarcation threshold (0.5), an attractive property of using
the higher threshold (0.7) is that it precludes the misidentification of negative paraphrases
with significant semantic overlaps whereas a the former low threshold can easily and
mistakenly identify these negative paraphrases as semantic equivalents.
Finally, two similarity measures; namely, cosine (CosSim) and traditional WordNet (TWN)
were selected as baselines. Cosine similarity, as defined in expression 4.26, quantifies the
similarity between two pieces of text in the form of word vectors (bag of words) while
conventional WordNet is as explained in Section 4.3.1. These two benchmark methods are
evaluated against our CatVar-aided WordNet method (WNwCVC) using the traditional
information retrieval metrics presented in Section 4.4.3.2. The symbol 𝑎𝑖 in equation 4.26 is
the tf-idf weight of term i in sentence A and 𝑏𝑖 is the tf-idf weight of term i in sentence B. Tf
is the term frequency which is the number of times a word repeats in a document whereas the
idf is the reciprocal of the number of documents containing that word.
𝐶𝑜𝑠𝑆𝑖𝑚(𝐴, �⃗⃗�) = 𝐴
|𝐴|.
�⃗⃗�
|�⃗⃗�| =
∑ 𝑎𝑖𝑏𝑖|𝑉|𝑖=1
√∑ 𝑎𝑖2|𝑉|
𝑖=1 √∑ 𝑏𝑖2|𝑉|
𝑖=1
(4.26)

95
Figure 4.12: Comparing our results with baselines on (A) TREC-9 and (B) MSRPC datasets.
Figures 4.12 (A) and 4.12 (B) demonstrate the comparison of our system results and the
baselines on TREC-9 and MSRPC datasets, respectively. On both datasets, the results
indicate the superiority of the PoS conversion aided similarity measure where it beats both
baselines in all evaluation measures. Notably, the system’s better performance on the TREC-
9 dataset, in Figure 4.12 (A), is understandably due to its smaller size and short sentence
lengths as compared to MSRPC. Overall, the evaluation of the final system setup on large-
scale datasets provides enough evidence about the competency of the proposed conversion
aided measure for similarity detection. This also implies an improvement for other relevant
NLP applications underpinned by short text similarity measurement, e.g., paraphrase
detection and text summarisation.
4.5 Related Works
WordNet has been extensively used for building word similarity measures which are
exploited to the more general text similarity such as Sentence Textual Similarity. Pedersen et
al. [132] developed an open source Perl package which implements WordNet similarity and
relatedness measures. It provides six similarity and three relatedness measures all which take
word concepts from WordNet lexical database. Since its availability, the similarity and
relatedness measures have been widely used in similarity based tasks including textual

96
entailment [142], text semantic similarity [13, 44] and paraphrase identification [111, 124].
Improving text semantic similarity serves the advancement of a great deal of other dependent
NLP applications including text summarisation [117], text clustering [143], automatic
question answering [110], automatic text scoring [116], plagiarism detection [112], machine
translation [114], and conversational agents [115], among others.
Sentence Textual Similarity uses different approaches including knowledge-driven methods
that utilise various linguistic features. However, some of the well-established techniques use
semantic relations between words, information from sentence syntactic structures and the
order in which terms appear in it. To start with, Mihalcea et al. [124] combined corpus-based
and knowledge-based semantic similarity using word similarity scores derived from WordNet
and British National Corpus. The scores are then weighted with word specificity scores.
Fernando and Stevenson [111] proposed a similarity based paraphrase identification
algorithm based on word level similarities derived from WordNet taxonomy. Later on, Das
and Smith [127] utilised quasi-synchronous dependency grammars in a probabilistic model
incorporating lexical semantics from WordNet. Authors in [144] applied machine learning
based on longest common subsequence (LCS) and semantic heuristics inferred from
WordNet. Alternatively, Kozareva and Montoyo [125] put forward a system designed on
content overlap (e.g., n-grams and proper names) and semantic features derived from
WordNet. In a more entailment oriented approach, researchers of [126] built a graphical
representation of text by mapping relations within its syntactic dependency trees. Synonymy
and antonymy relations from WordNet have been used to improve lexical overlap and to
handle Text-Hypothesis negation in textual entailment. Additionally, pairwise semantic
features of single words and multiword expressions from syntactic trees have also been
utilised in [123]. They avail syntactic parse trees, corpus-based training and feature learning.

97
Our work uses combined semantic information from Morphosemantic Links, CatVar
database and WordNet. Similar to [111, 124-127, 144], we advocate the use of WordNet-
sourced semantics for similarity determination and paraphrase detection. However, several
improvements have been introduced such as enabling content words to cross PoS boundaries
when evaluating word level similarities in WordNet. The lack of a hierarchical organisation
for adjectives & adverbs and the imbalance between noun and verb taxonomies has also been
addressed. The evaluation of the suggested method on a wide range of standard datasets and
yielded experimental results assured its competence.
However, the present scheme has some pitfalls and should not be understood as a perfect
sentence similarity measure in any sense. This includes limitations attributed to the employed
resource such as the lexical coverage (Chapter 5) and missing information since they are all
manually engineered knowledge sources. Trivially, there are other shortcomings stemming
from other basic tools used in building our system such as the errors introduced by parts of
speech taggers. The current system is algorithmically simpler but achieves promising results.
However, we only rely on maximal word similarities when computing the sentence textual
similarities without accounting for its syntactic structure and word order, an issue that will be
addressed in Chapter 6. One main advantage of the approach is the simplicity of its algorithm
and the power of the semantic heuristics used in designing the developed sentence textual
similarity measure. As a final note, it is worth mentioning that the PoS conversion aided with
WordNet conceptual relations, yields approximate noun counterparts as opposed to the
CatVar-aided counterpart, which is one of the primary reasons behind the supremacy of this
measure.

98
4.6 Summary
This chapter introduced a sentence textual similarity using the WordNet lexical database. In
addition, two other lexical resources have been complemented with it for the purpose of
subsuming some word syntactic categories under their derivationally related nouns. The
primary goal of this approach is to investigate ways of handling inherent limitations of
traditional WordNet-based sentence similarity and improving its performance. The proposal
has been applied to several publicly available datasets: the STS Benchmark Dataset, the
Microsoft Research Paraphrase Corpus and the TREC-9 Question Variants. The comparative
experiments on STS Benchmark Dataset indicate the outstanding performance of CatVar-
aided similarity measure. Moreover, experimental results obtained through the system
evaluation on TREC-9 and MSRPC prove the competency of the measure and that it
outperforms baselines. Overall, these findings encourage the extension of WordNet semantic
relations to accommodate cross category links. This is especially appealing since derivational
morphology already existed in WordNet database as distinct lexical terms.

99
5. A HYBRID APPROACH FOR QUERY-FOCUSSED MULTI-
DOCUMENT SUMMARISATION USING KNOWLEDGE-
ENRICHED SEMANTIC HEURISTICS
5.1 Introduction
Text summarisation (TS) is the process of producing a short summary from one or more text
documents. This can be achieved by extracting a group of representative sentences from the
original source document(s) (extraction) then concatenating them, or generating a novel
summary text representing the gist. From an input perspective, a summary can either be
sourced from one document through a process called single- document summarisation, or
from a collection of documents (multi-document summarisation). Depending on the desired
content, a summary is either a query-focussed (tailored to a user query) or topic-focussed
(containing the document gist). Most of the existing text summarisation researches lie in the
area of generic and single document summarisation [2]. Query-based summarisation is
therefore seen as an advancement in the field due to its relatedness to question answering and
other commercial applications. The work presented in this chapter falls in the realm of
extractive query-focussed multi-document summarisation which involves scoring and
selecting core query-relevant sentences.
Today’s increasing number of news sites, emails, customer product reviews, social media
comments, tweets, blog posts and question answering communities (QA) all contribute to the
rapid growth of already vast volume of textual information. As of June 2015, the amount of
information indexed on the Internet is estimated to be about 4.71 billion pages18
.
However, as the size of generated unstructured text increases, it renders the task of designing
optimum systems that extract concise and meaningful information from this sea of
18
http://www.worldwidewebsize.com/
CHAPTER 5
100
unorganised textual data rather difficult. However, proposals have been put forward to
summarise these large-scale textual data [145].
The challenge of extracting a fluent query-based representative summary from a group of text
documents lies in finding the most relevant text segments to the given query. This involves
the ability to understand the underlying semantic relatedness of the pieces of text in question.
In this chapter, we investigate the problem of query focussed multi-document summarisation
using relevance, centrality and anti-redundancy factors which are all based on improved text
similarity measures to data-mine the most query relevant sentences from a pool of cluster
sentences. We use WordNet-based text similarity measures supplemented with two other
lexical resources for the purpose of transforming some word syntactic categories to others.
This is further augmented with named entity semantic relatedness derived from Wikipedia.
As is always the case, named-entities are considered as the most informative text tokens that
indicate importance. As such, we believe that the incorporation of these textual constituents
will help the identification of the most important key parts of the text as required for text
summarisation. In the wider context, we think that by combining manually engineered and
crowdsourced knowledge bases, we can attain the best of both.
Our chief contributions in this chapter are as follows:
First, we introduce a simple Infobox based named entity extraction and classification
algorithm for the assessment of Wikipedia’s named entity coverage.
Second, we have devised a technique for measuring semantic relatedness between named-
entities by exploring the level of their co-occurrences in the Wikipedia articles in the
same spirit as normalized Google distance.
Third, the PoS conversion enhanced WordNet similarity, described in chapter 4 (see
Section 4.3.2), and the current Wikipedia-based named entity semantic relatedness are

101
integrated to form a hybrid system for a better comprehensive judgment of sentence
semantic similarity and relatedness. This is intended to improve the quality of the
generated query focussed summaries by boosting the accuracy of detecting semantic
relatedness between document sentences and queries, on the one hand, and intra-
sentences similarities, on the other hand.
Next, the proposed hybrid method is separately evaluated with the MSRPC and TREC-9
datasets (see Chapter 4, Section 4.4.3.1) before carrying out an extensive validation of
proposed query summarisation system using a set of publicly available datasets, namely
DUC2005, and DUC2006.
Finally, we use the hybrid knowledge-enriched semantic similarity measure in
conjunction with other statistical measures as the chief indicators of salient content for
feature-based extractive multi-document summarisation. Then, the performance of the
summariser is assessed by comparing it with some baselines and related works.
5.2 Using Wikipedia as a Named Entity Repository
5.2.1 Overview
Wikipedia is a freely available encyclopaedia with a collective intelligence contributed by the
entire world community [146]. Since its foundation in 2001, the site has grown in both
popularity and size. At the time of writing (October 2015), Wikipedia contains over 36
million articles with 280 active languages and its English version hitting 4985881 articles19
.
Its open collaborative contribution to the public arguably makes it the world’s largest
information repository in existence. The encyclopedia contains 35 namespaces; 16 subject
namespaces, 16 corresponding talk spaces, 2 virtual namespaces and 1 special namespace20
.
A namespace is a criterion often employed for classifying Wikipedia pages, using MediaWiki
19
https://stats.wikimedia.org/EN/Sitemap.htm#comparisons. 20
http://en.wikipedia.org/wiki/Wikipedia:Namespace

102
Software, as indicated in the page titles. Structurally, Wikipedia is organised in the form of
interlinked pages. Depending on the information content, the pages are loosely categorised as
Named Entity Pages, Concept Pages, Category Pages, and Meta Pages [97]. In recent years,
there has been a growing research interest among the NLP and IR research communities for
the use of the encyclopedia as a semantic lexical resource for tasks such as word semantic
relatedness [99], word disambiguation [100], text classification [49], ontology construction
[101], named entity classification [102], and text summarisation [15], among others.
5.2.2 Named-entities in Wikipedia
The word named-entity (NE) as used today in text mining and Natural Language Processing
(NLP) was introduced in the Sixth Message Understanding Conference [147]. It represents a
major part of all textual data covering proper names of individuals, places, organisations,
events, and times, e.g., Shakespeare, UK, FIFA, Mogadishu, and Mount Everest. Although,
NEs represent core components in natural language utterances, they are still poorly covered
in the state of the art language dictionaries. This might be due either to their ever-changing
nature and dynamicity, in which some named-entities disappear while new ones emerge on
regular basis, or to the fact that many NEs might be genuinely classified to more than one
class, where one may encounter, for instance, several place names that are also person names,
and/or corporate names. For example, if you search some of the world’s largest corporations
such as Microsoft and Apple, you are unlikely to find them in the well-established manually
built knowledge networks such as WordNet. Improved coverage of named entities is now
being made in the constantly updated live online repositories like Wikipedia [148] and Open
Directory Project [85] where they possess higher named entity coverage than manually built
lexical resources, such as WordNet.

103
Research has found that around 74% of Wikipedia pages describe named-entities [102], a
clear indication of Wikipedia’s high coverage for named-entities. Each Wikipedia article
associated with a named entity is identified with its name. Most Wikipedia articles on named-
entities offer useful unique properties starting with a brief informational text that describes
the entity, followed by a list of subtitles which provide further information specific to that
entity. For example, one may find information related to main activities, demography, and
environment for location named-entities; education, career, personal life and so on for person
named-entities. Relating concepts to that named entity are linked to the entity article by
outgoing hyperlinks. Moreover, a semi-structured table, called infobox, summarising
essential attributes for that entity lives in the top right hand of each article [149]. It is the core
attributes of the article infobox that our algorithm for the extraction and classification of
named-entities stands on without any other prior knowledge.
Figure 5.1: Wikipedia article on the University of Birmingham.

104
The snapshot in Figure 5.1 illustrates the Wikipedia article on the “University of
Birmingham”, which corresponds to a named entity of type organisation21
. The infobox table
on the right summarises very important unique properties of the entity in the form of
attribute-value pairs. Consequently, such tables are extracted, stored and analysed for the
purpose of NE extraction as explained in Section 5.2.3.
5.2.3 Extracting Named-entities from Wikipedia.
Besides the literature assuring that three-quarters of the Wikipedia articles are on named-
entities, we set up an approach for named entity extraction from this vast encyclopedia. This
is to empirically evaluate the current named entity composition in Wikipedia as it is in
constant growth. The extraction mechanism relies on the content information of a single
structured table, the infobox, but achieves a good performance for the identification and
extraction of entities. We match predefined core entity attributes built from Wikipedia
Infobox Templates (WIT) and entity specific attributes extracted from the related named
entity Wikipedia article. Using predefined core attributes extracted from WIT, a semi-
supervised binary algorithm is developed. Being the main classifier, it predicts whether a
particular named entity belongs to any of the three main entity type; location, organisation,
and person. In other words, the classifier is designed to match named-entities against these
set of core class attributes and consequently identify these entities based on the outcomes of
the matching process. The classification is achieved according to the following definition.
Definition: Let ne be a named entity in Wikipedia (WP) belonging to any of the three types,
person (P), location (L) and organisation (O). If XITA denotes infobox template attributes22
of type X (X = P|L|O) and IA(ne) is the infobox attributes extracted from WP article
associated with ne, then the classifier identifies ne type according to quantification (5.1).
21
http://en.wikipedia.org/wiki.
22
These are the core attributes used for matching
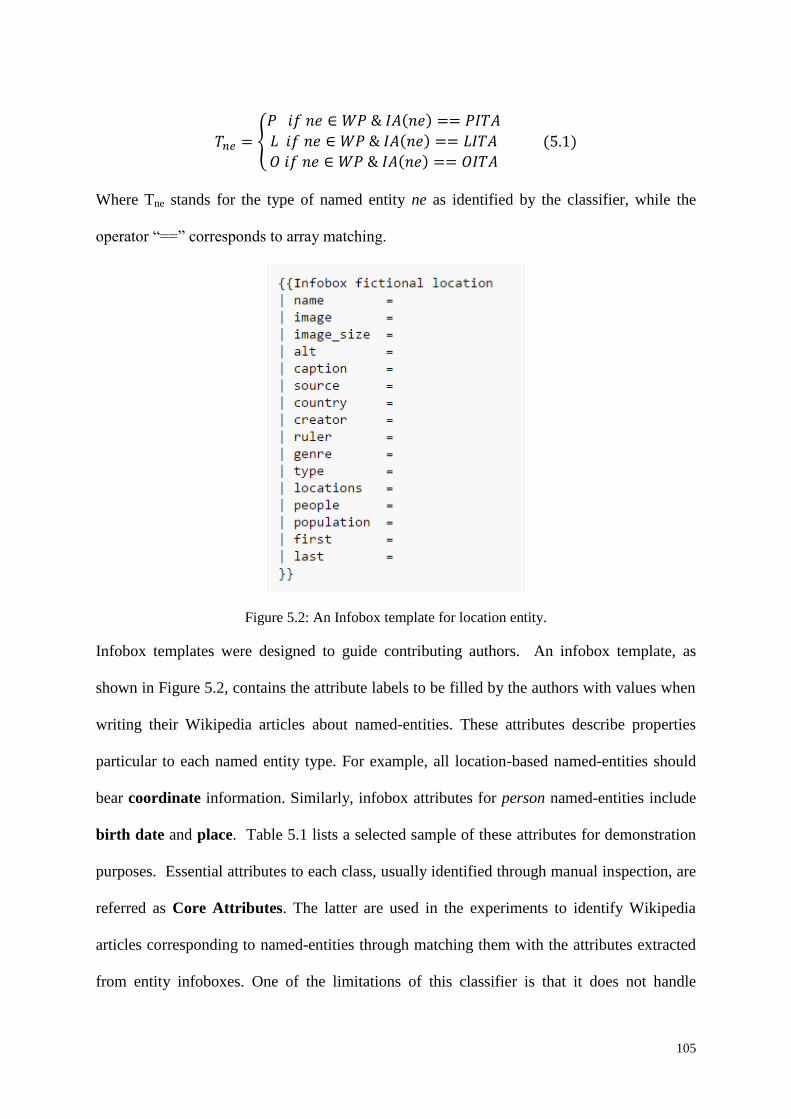
105
𝑇𝑛𝑒 = {
𝑃 𝑖𝑓 𝑛𝑒 ∈ 𝑊𝑃 & 𝐼𝐴(𝑛𝑒) == 𝑃𝐼𝑇𝐴
𝐿 𝑖𝑓 𝑛𝑒 ∈ 𝑊𝑃 & 𝐼𝐴(𝑛𝑒) == 𝐿𝐼𝑇𝐴
𝑂 𝑖𝑓 𝑛𝑒 ∈ 𝑊𝑃 & 𝐼𝐴(𝑛𝑒) == 𝑂𝐼𝑇𝐴
(5.1)
Where Tne stands for the type of named entity ne as identified by the classifier, while the
operator “==” corresponds to array matching.
Figure 5.2: An Infobox template for location entity.
Infobox templates were designed to guide contributing authors. An infobox template, as
shown in Figure 5.2, contains the attribute labels to be filled by the authors with values when
writing their Wikipedia articles about named-entities. These attributes describe properties
particular to each named entity type. For example, all location-based named-entities should
bear coordinate information. Similarly, infobox attributes for person named-entities include
birth date and place. Table 5.1 lists a selected sample of these attributes for demonstration
purposes. Essential attributes to each class, usually identified through manual inspection, are
referred as Core Attributes. The latter are used in the experiments to identify Wikipedia
articles corresponding to named-entities through matching them with the attributes extracted
from entity infoboxes. One of the limitations of this classifier is that it does not handle

106
recognition of Miscellaneous entities due to them lacking uniquely identifiable core
attributes. Experimented core attributes are denoted by stars in Table 5.1.
Table 5.1: Core attributes extracted from Infobox templates.
Person Organisation Location
Birth_date* Ceo, Founded* Coordinates*
Birth_place* Headquarters* Population*
Spouse Service_area* Area*
Children Industry, Profit* Region
Relatives Traded_as, revenue* Country*
Occupation Num_staff*, Timezone
Nationality Num_employee* iso_code
Parents Established* area_code
Education Founder/chancellor* Settlement
Salary {Post|under}graduates* Leader_name
Partner {operating|net}income* Leader_name
Figure 5.3: Classifier's access mechanisms to Wikipedia.
To use Wikipedia as an external knowledge repository for named entity extraction and
classification, a mechanism for accessing its database should be in place. Designed system’s
access to the encyclopaedia is summarised in Figure 5.3. Primarily there are two methods for
107
accomplishing such data access; namely, either querying through a web interface or accessing
a downloaded local Wikipedia dump. We used the query access method for the system
evaluation. However, for the actual named entity extraction, a local access is made to a
downloaded Wikipedia XML dump of February 2014. In implementing the query access
method, this technique partially adapts the Wikipedia Automated Interface [150] while the
local access to the Wikipedia Dump is built on a MediaWiki dump Files Processing Tool
[151]. The preference of query access over the local access for the evaluation is tied to the
unsuitability of the dump files for random access as the dumps are primarily designed for
sequential access. The evaluation and extraction experiments of this classifier are presented
in Section 5.5.1.
5.3 A Knowledge-Enriched Short Text Semantic Similarity Measure
5.3.1 Semantic Similarity between Content Words
In chapter 4, we discussed the limitations of WordNet in terms of its less coverage and cross
category connectivity. We also described in Section 4.3.2 of that chapter a proposal to handle
some of the semantic network’s deficiencies, particularly the part of speech boundary. The
proposal presented an approach for word category conversion in which all non-noun content
words are transformed to their noun counterparts. Three methods for turning adverb,
adjective and verb categories were put forward and experimented, as detailed in Sections
(4.3.2, 4.4.2). The experimental investigation detailed in Chapter 4 showed nouns as an
optimal target category and Categorial Variation database (CatVar) as the best supplementary
resource for the purpose of changing word part of speech to nouns. For further details of the
approach and the evaluation experiments, one can be referred to Chapter 4. Based on these
findings, we adapted the conversion aided WordNet similarity measures to compute the
similarity of content words. Content words are the remaining terms in a text following the
identification and extraction of named-entities. More formally, let T = {w1, w2, w3, w4, w5}

108
be a short text constituting named-entities and common words. For simplicity, suppose a
named entity recogniser identifies the second and fifth tokens in T as two named-entities.
Consequently, we now split T into content words having three terms; TW = {w1, w3, w4} and
named-entities containing two entities; TE = { e2, e5}. If we now want to compute the
similarity of two short texts, say a sentence S and a query Q, in terms of their content words,
we first apply this procedure to obtain the content words only; SW and QW for the sentence
and the query respectively. Then, the semantic similarity of content words is formulated as in
quantification (5.2).
𝑆𝑖𝑚𝑊𝑁(𝑄𝑊, 𝑆𝑊) =1
2[∑ max
𝑥∈𝑆𝑊𝑆𝑖𝑚(𝑥, 𝑤)𝑤∈𝑄𝑊
|𝑄𝑊|+
∑ max𝑥∈𝑄𝑊
𝑆𝑖𝑚(𝑥, 𝑤)𝑤∈𝑆𝑊
|𝑆𝑊|] , 𝑃𝑜𝑆(𝑥) = 𝑃𝑜𝑆(𝑤) (5.2)
In equation (5.2), 𝑆𝑖𝑚(𝑥, 𝑤) is the word level similarity between the terms, x and w,
belonging to the same part of speech after either of them or both have been category
transformed. The |QW| (resp. |SW|) is the number of content words for the query (resp.
sentence), which has been used as a normalizing factor instead of the original sentence length
(cf. equation 4.20, pages 75, Chapter 4). This goes with the intuition as the named-entities
are not contributing to the similarity computation and hence, it makes sense to reflect this in
the normalization factor by neglecting all non-contributing words from the sentence length.
5.3.2 Semantic Relatedness between Named-entities
Establishing semantic associations among designated names is a critical component in text
processing, information retrieval, and knowledge management. Despite this fact, these proper
names are insufficiently covered in the language thesaurus and knowledge networks (e.g.,
electronic dictionaries, WordNet,). For that reason, the accurate determination of the
semantic relatedness between two pieces of text containing these entities remains an open
challenge and a research problem. In English and other languages, some words have a high

109
probability of co-occurrences than others in language corpora. For example, the name Joseph
S Blatter is more likely to appear alongside the named entity FIFA than NASA. This can be
perceived as a clue to the semantic association between the two words. At the time of our
experiments, the number of Wikipedia articles returned with a singleton search of the names
FIFA and Joseph S Blatter were 33123 and 291 respectively while a doubleton search of the
combined names resulted in 267 articles, yielding intuitively a high similarity score between
the two concepts as will be detailed later on. In distributional semantics, such word co-
occurrences are normally extracted from large English corpora, such as the British National
Corpus. A similar concept is used here to establish semantic relatedness between two named-
entities using Normalized Google Distance (NGD) algorithm downscaled to Wikipedia.
Figure 5.4: Wikipedia-based named-entity similarity.
Our approach is based on entity co-occurrences in the form of Wikipedia article counts (AC)
underpinned by the NGD, a mathematical theory based on Information Distance and
Kolmogorov Complexity [152]. Especially, we downscaled NGD to Wikipedia as illustrated

110
in Figure 5.4. In other words, if 𝑛𝑒𝑖 and 𝑛𝑒𝑗 are two entities, we extract the number of
Wikipedia articles 𝐴𝐶(𝑛𝑒𝑖), 𝐴𝐶(𝑛𝑒𝑗), & 𝐴𝐶(𝑛𝑒𝑖, 𝑛𝑒𝑗) for the entities 𝑛𝑒𝑖 , 𝑛𝑒𝑗, and their
coexistence respectively. The article counts from Wikipedia are treated as a semantic distance
between the two names. Other motivations for the use of Normalized Google Distance
(NGD) on the Wikipedia database for the task of the named entity semantic similarity
quantification in our work are summarised below:
1. Empirical and survey research found that around 74% of Wikipedia pages describe
named-entities [102] justifying that Wikipedia has a high coverage of named-entities.
2. The insufficient coverage of named-entities in the current resources, e.g., WordNet.
More formally, with NGD, the Wikipedia-based similarity distance of two named-entities,
called normalized Wikipedia distance (NWD), can be computed as:
𝑁𝑊𝐷(𝑛𝑒𝑖, 𝑛𝑒𝑗) =max [log2 𝐴𝐶(𝑛𝑒𝑖) , log2 𝐴𝐶(𝑛𝑒𝑗)] − log2 𝐴𝐶(𝑛𝑒𝑖, 𝑛𝑒𝑗)
log2 𝑁 − min [log2 𝐴𝐶(𝑛𝑒𝑖) , log2 𝐴𝐶(𝑛𝑒𝑗)] (5.3)
The parameter N in the denominator is the total number of English Wikipedia articles
(4617085 articles/documents at the time of our latest experiments).
Next, inspired from [153], the similarity between named-entities nei and nej is computed
using an exponential function that ensures the score to be normalized in the unit interval.
𝑆𝑖𝑚𝑁𝑊𝐷(𝑛𝑒𝑖, 𝑛𝑒𝑗) = 𝑒−𝑁𝑊𝐷(𝑛𝑒𝑖,𝑛𝑒𝑗) (5.4)
From an implementation perspective, (5.4) turns out to be quite simple, effective and
language-independent named entity similarity measure with shorter response time. The
approach can also be employed for common semantic words, not necessarily named-entities
provided the existence of a Wikipedia entry. But such an approach has not been pursued in
this chapter, although one acknowledges other related works following such direction [99].

111
For example, the application of (5.4) to seek the semantic similarity between named-entities
FIFA and Sepp Blatter, with their previously stated article counts, yields:
SimNWD(FIFA, Sepp Blatter) = e−NWD(FIFA,SeppBlatter)
= e−
max [log2 33123, log2 291]−log2 267log2 N−min [log2 33123, log2 291]
= e−0.4984 ≅ 0.6075
The above example shows how the Wikipedia-based measure improves the determination of
the semantic relatedness between named-entities. This is because if WordNet thesaurus has
been used the similarity would have been 0. This is due to the resource lacking the coverage
of the two entities, which renders the measure to lift the entity relatedness score from 0 to
0.6075.
Expression (5.4) can also be extended to determine the similarity of two short texts in view of
their named-entities only. Using a complementary formulation to (5.2), let us assume that QE
represents the set of named-entities contained in the query and SE denotes the set of named-
entities in the sentence, then the associated similarity is calculated as in quantification (5.5):
𝑆𝑖𝑚𝑊𝑃(𝑄𝐸, 𝑆𝐸) = 1
2(
∑ max𝑛𝑒𝑗∈𝑆𝐸
𝑆𝑖𝑚∗(𝑛𝑒𝑖 , 𝑛𝑒𝑗)𝑛𝑒𝑖∈𝑄𝐸
|𝑄𝐸| +
∑ max𝑛𝑒𝑖∈𝑄𝐸
𝑆𝑖𝑚∗(𝑛𝑒𝑖 , 𝑛𝑒𝑗)𝑛𝑒𝑗∈𝑆𝐸
|𝑆𝐸|) (5.5)
5.3.3 A Brief Discussion on the Named Entity Semantic Relatedness Measure
Equations (5.3-5.4) deserve special attention when looking at their boundary condition and
monotonicity behaviour:
Assuming the similarity function (5.4) as inducing a relation between two named-
entities, say, nei nej if and only if SimNWD(nei, nej) ≥ δ (δ is some threshold value,
0 < δ ≤ 1), then it is easy to see that is reflexive, e.g., for any identical named-

112
entities, it holds SimNWD(nei, nei) = 1, symmetric because of the symmetry of
SimNWD (e.g., SimNWD(nei, nej) = SimNWD(nej, nei)). However, is not transitive,
as it is easy to find three named-entities in Wikipedia such that SimNWD(nei, nej) ≥ δ
and SimNWD(nej, nel) ≥ δ but 𝑆imNWD(nei, nel) < δ. Nevertheless, it should be noted
that if a weaker construction of is allowed, where more flexibility in terms of
definition of threshold δ is enabled, then the transitivity can be restored. This follows
from the observation that if there is co-occurrence of named-entities nei and nej, and
between nej and nel, then predominantly, there is also co-occurrence between named-
entities nei and nel, although, not necessarily on the same order of magnitude to ensure
the strict fulfilment of the transitivity relation (for sufficiently high value of ).
Since the Wikipedia-based similarity will only be fired if both named-entities possess
entries in Wikipedia, which guarantees 𝐴𝐶(𝑛𝑒𝑖) > 0 and 𝐴𝐶(𝑛𝑒𝑗) > 0, and thereby,
expression (5.4) is always fully defined.
If there are no co-occurrences of named-entities 𝑛𝑒𝑖 and 𝑛𝑒𝑗 in Wikipedia, then
𝐴𝐶(𝑛𝑒𝑖, 𝑛𝑒𝑗) = 0. Substituting this into (5.4) yields 𝑁𝑊𝐷(𝑛𝑒𝑖, 𝑛𝑒𝑗) = +∞. Therefore,
𝑆𝑖𝑚𝑁𝑊𝐷(𝑛𝑒𝑖 , 𝑛𝑒𝑗) = 0. Besides, it is easy to see from (5.4) that 𝑁𝑊𝐷(𝑛𝑒𝑖, 𝑛𝑒𝑗) = +∞
entails 𝐴𝐶(𝑛𝑒𝑖, 𝑛𝑒𝑗) = 0. This indicates that the Wikipedia-based similarity is minimal
for any pair of named-entities whose joint-occurrence in fully absent.
Similarly, if the occurrence of named-entity 𝑛𝑒𝑖 always coincides with occurrence of
named-entity 𝑛𝑒𝑗 , e.g., any Wikipedia article containing 𝑛𝑒𝑖 also contains 𝑛𝑒𝑗, then
𝐴𝐶(𝑛𝑒𝑖, 𝑛𝑒𝑗) = 𝐴𝐶(𝑛𝑒𝑖) = 𝐴𝐶(𝑛𝑒𝑗). This entails 𝑁𝑊𝐷(𝑛𝑒𝑖, 𝑛𝑒𝑗) = 0, thereby ensuring
that 𝑆𝑖𝑚𝑁𝑊𝐷(𝑛𝑒𝑖 , 𝑛𝑒𝑗) = 1.
From the numerator of expression (5.3), the higher the proportion of the joint
occurrence of the two named-entities 𝐴𝐶(𝑛𝑒𝑖, 𝑛𝑒𝑗) the smaller is the distance measure

113
𝑁𝑊𝐷(𝑛𝑒𝑖, 𝑛𝑒𝑗), and, in turn, the higher the similarity score 𝑆𝑖𝑚𝑁𝑊𝐷(𝑛𝑒𝑖, 𝑛𝑒𝑗). To
investigate the detailed behaviour with respect to individual parameters, let us denote
by A the set of Wikipedia articles containing named-entity 𝑛𝑒𝑖 and B the set of
Wikipedia articles containing named-entity 𝑛𝑒𝑗, and let x be the cardinality of the
intersection of sets A and B corresponding to the number of articles of joint occurrences
of both named-entities. Assume without loss of generality that |A| < |B|, then (5.3) is
equivalent to
𝑁𝑊𝐷(𝑛𝑒𝑖, 𝑛𝑒𝑗) =𝑙𝑜𝑔2|𝐵| − 𝑙𝑜𝑔2𝑥
𝑙𝑜𝑔2𝑁 − 𝑙𝑜𝑔2|𝐴| (5.6)
From the preceding, it is straightforward that:
- 𝑁𝑊𝐷 is decreasing with respect to x
- If x remains constant, then NWD is monotonically increasing with respect to size
of A as well as size of B, so, the similarity 𝑆𝑖𝑚𝑁𝑊𝐷 is monotonically decreasing.
- If x remains constant while the size of both A and B increases in the same order of
magnitude, then the normalized distance increases as well, which, in turn, induces a
decrease of a similarity score. To see it, let us consider an increase of magnitude of
y in each of A and B, then the difference with former normalized distance (without
increase of A and B) is
𝑙𝑜𝑔2(|𝐵| + 𝑦) − 𝑙𝑜𝑔2𝑥
𝑙𝑜𝑔2𝑁 − 𝑙𝑜𝑔2(|𝐴| + 𝑦)−
𝑙𝑜𝑔2(|𝐵|) − 𝑙𝑜𝑔2𝑥
𝑙𝑜𝑔2𝑁 − 𝑙𝑜𝑔2(|𝐴|)
The latter expression is positively valued because from the monotonicity of the
logarithmic function, it follows that 𝑙𝑜𝑔2𝑁 − 𝑙𝑜𝑔2(|𝐴| + 𝑦) < 𝑙𝑜𝑔2𝑁 − 𝑙𝑜𝑔2(|𝐴|), and
𝑙𝑜𝑔2(|𝐵| + 𝑦) − 𝑙𝑜𝑔2𝑥 > 𝑙𝑜𝑔2(|𝐵|) − 𝑙𝑜𝑔2𝑥. Besides, the above result is still valid
even if the expansion of A and B is not uniform; namely, for y, z > 0, it holds that
𝑙𝑜𝑔2(|𝐵| + 𝑦) − 𝑙𝑜𝑔2𝑥
𝑙𝑜𝑔2𝑁 − 𝑙𝑜𝑔2(|𝐴| + 𝑧)−
𝑙𝑜𝑔2(|𝐵|) − 𝑙𝑜𝑔2𝑥
𝑙𝑜𝑔2𝑁 − 𝑙𝑜𝑔2(|𝐴|)> 0 (5.7)

114
The above shows that any expansion of the initial set of articles containing any of the
named-entities while keeping the number of articles pertaining to joint occurrences
constant induces an increase of the normalized distance, and therefore, a decrease of
similarity score.
Since the values of the cardinality in the logarithmic functions in (5.3) are integer valued,
it turns out that the ranges of values of the normalized distance, and thereby of the
similarity function are not equally distributed. Indeed, for x = 1, we have
𝑁𝑊𝐷(𝑛𝑒𝑖, 𝑛𝑒𝑗) =𝑙𝑜𝑔2|𝐵|
𝑙𝑜𝑔2𝑁−𝑙𝑜𝑔2|𝐴|. The latter is maximal by minimizing |A| and maximizing
|B|; that is, by choosing a pair of named-entities such that the first one has most number
of entries while the second has the less number of entries in Wikipedia. Besides, given
that the number N is of several order of magnitudes of any |A| or |B|, it holds that NWD <
1. On the other hand, as soon as there are no co-occurrences (x=0), 𝑁𝑊𝐷(𝑛𝑒𝑖, 𝑛𝑒𝑗)
tends to be ∞ . This makes all the range of values from 1 to ∞ unrepresented. This is
mainly due to the absence of the logarithm of numbers less than one in expression (5.3).
Accordingly, the high value similarity scores are extensively dominant. This is especially
of paramount importance when deciding to assign a threshold value in order to trigger
some decision related to the subsequent analysis based on similarity score.
Equation (5.5) extends the named-entity based similarity scores to two sentences
containing several named-entities. The formula assumes similar contribution of both
sentences to the similarity score. It is easy to see that when the two sentences contain a
single named-entity each, then (5.5) coincides with (5.4). Trivially, if the two sentences
have named-entities which have high similarity scores in the sense of 𝑆𝑖𝑚𝑁𝑊𝐷(𝑛𝑒𝑖, 𝑛𝑒𝑗)
for each 𝑛𝑒𝑖 of the first sentence and 𝑛𝑒𝑗 of the second sentence, then straightforwardly,
the resulting 𝑆𝑖𝑚𝑊(𝑁𝐸1, 𝑁𝐸2) is equally high.

115
A special case of (5.5) corresponds to the situation where one sentence bears only one
single named-entity while the second one bears many. In this case, (5.5) can be rewritten
as, assuming, for instance, NE1 contains only ne0.
𝑆𝑖𝑚𝑊(𝑁𝐸1, 𝑁𝐸2) = 1
2( max
𝑛𝑒𝑗∈𝑁𝐸2
𝑆𝑖𝑚𝑁𝑊𝐷(𝑛𝑒0, 𝑛𝑒𝑗) + ∑ 𝑆𝑖𝑚𝑁𝑊𝐷(𝑛𝑒0, 𝑛𝑒𝑗)𝑛𝑒𝑗∈𝑁𝐸2
|𝑁𝐸2|) (5.8)
Especially, comparing the latter with the similarity of the pair of named-entities yielding
the highest score turns out that the use of extra named-entities can either increase or
decrease the individual similarity score depending on the contributions of other entities,
since 𝑆𝑖𝑚𝑊(𝑁𝐸1, 𝑁𝐸2) ≥ max𝑛𝑒𝑗∈𝑁𝐸2𝑆𝑖𝑚𝑁𝑊𝐷(𝑛𝑒0, 𝑛𝑒𝑗) 𝑜𝑟 𝑆𝑖𝑚𝑊(𝑁𝐸1, 𝑁𝐸2) ≤ max𝑛𝑒𝑗∈𝑁𝐸2
𝑆𝑖𝑚𝑁𝑊𝐷(𝑛𝑒0, 𝑛𝑒𝑗)
are equally likely. Nevertheless, trivially, the more the named-entities of NE2 bear
similarity with ne0, the more 𝑆𝑖𝑚𝑊(𝑁𝐸1, 𝑁𝐸2) ≥ max𝑛𝑒𝑗∈𝑁𝐸2𝑆𝑖𝑚𝑁𝑊𝐷(𝑛𝑒0, 𝑛𝑒𝑗) is valid.
5.3.4 A Hybrid Similarity Measure
Figure 5.5 shows the hybrid system. It is an integration of the CatVar-enhanced WordNet
similarity (see Section 4.3.2, Chapter 4) and Wikipedia-based named entity similarity through
some convex combination. We achieved the system implementation with Perl scripts in the
Linux environment. For the Wikipedia based similarity component, we extracted Wikipedia
article counts associated with named-entities by parsing the raw Wikipedia entries retrieved
via a custom search which we built on Wikipedia automated interface [150]. As for the word
level similarity of the WordNet-based component, we adapted the implementation of
WordNet similarity measures [132] for computing conceptual relatedness of individual words
after applying the CatVar-aided part of speech conversion. In addition to the traditional text
pre-processing steps (e.g., sentence splitting, tokenization, and stop-words removal), two
more system specific tasks; namely, named-entity tagging and token classification have been
applied to the input texts. Named entity tagging, which is recognizing and labelling all proper
nouns in the text, is realized with the use of Illinois Named Entity Tagger [154].

116
Figure 5.5: A hybrid measure of conversion-aided WordNet and Wikipedia.
Token classification is a post tagging step in which sentence tokens are split into common
word vectors and named-entity vectors as explicated in Section 5.3.1. In Figure 5.5, the
inputs to the subsystems denoted by the notations QE, SE, QW, and SW are all term vectors of
the corresponding sentences with QE and QW being the named-entity and content word
vectors for the query. The semantic similarity of the named-entity (QE, SE) and content word
(QW, SW ) sets are formulated as per the quantifications (5.2, 5.5). Finally, the overall
semantic similarity of the two sentences, accounting for the occurrence of named-entities and
non-named-entities is given as the combination of the 𝑆𝑖𝑚𝑊𝑁 and 𝑆𝑖𝑚𝑊𝑃:
𝑆𝑖𝑚(𝑄, 𝑆) = 𝛼𝑆𝑖𝑚𝑊𝑁(𝑄𝑊, 𝑆𝑊) + 𝛽𝑆𝑖𝑚𝑊𝑃(𝑄𝐸, 𝑆𝐸) (5.9)
The coefficients α and β (0 ≤ α ≤ 1, 0 ≤ β ≤ 1, α + β = 1) balance the contribution of the
Wikipedia-based and WordNet-based similarity components.

117
A simple modeling of the convex coefficients relies on the number of entity and content word
tokens employed in the Wikipedia-based and WordNet-based similarity components. This
follows the statistical argumentation that the greater the number of tokens associated to
WordNet is higher than the number of named-entities in the query or the sentence, the more
one expects the contribution of 𝑆𝑖𝑚𝑊𝑁 to be of larger significance than that of 𝑆𝑖𝑚𝑊𝑃 in the
integrated hybrid model. More specifically, let QW, and SW be the set of WordNet related
tokens in the query (Q) and sentence (S), respectively and QE, and SE be the set of named
entities in Q and S, respectively. Then the parameters α and β are given by:
𝛼 =|𝑄𝑊| + |𝑆𝑊|
|𝑄𝑊| + |𝑆𝑊| + |𝑄𝐸| + |𝑆𝐸|; 𝛽 =
|𝑄𝐸| + |𝑆𝐸|
|𝑄𝑊| + |𝑆𝑊| + |𝑄𝐸| + |𝑆𝐸| (5.10)
In the boundary case, from (5.9), it is easy to see that if there are no named-entities in the
query and the sentence, then |𝑄𝐸| = |𝑆𝐸| = 0, which entails α = 1 & β = 0, so that 𝑆𝑖𝑚(𝑄, 𝑆)
= 𝑆𝑖𝑚𝑊𝑁(𝑄𝑊, 𝑆𝑊). Similarly, if the pair of sentences are primarily constituted of named-
entities, then β = 1 & α = 0 which entails 𝑆𝑖𝑚(𝑄, 𝑆) = 𝑆𝑖𝑚𝑊𝑁(𝑄𝐸, 𝑆𝐸). Additionally, even in
the case where only one sentence contains a named-entity (resp. non-named entity token), it
holds that |𝑄𝐸| = |𝑆𝐸| = 0 (resp. |𝑄𝑊| = |𝑆𝑊| = 0) as the Wikidia-based similarity can only be
performed if both sentences possess entry in Wikipedia articles (resp. existence of noun
counterpart).
The following example shows a pair of sentences picked to illustrate the functioning of the
overall hybrid measure. At the same time, it sheds light on the advantages of the hybrid
approach with respect to either individual WordNet-based or Wikipedia-based similarity.
An Illustrative Example:
Sent1: Joseph Chamberlain was the first chancellor of the University of Birmingham.
Sent2: Joseph Chamberlain founded the University of Birmingham.

118
The limitations pointed for WordNet only based semantic similarity are clearly observable in
this example as neither chancellor nor founded can be quantified due to the absence of
similar PoS word in the partner sentence. Similarly, the two multiword named-entities in both
sentences, Joseph Chamberlain and the University of Birmingham, are not covered in
WordNet. For simplicity, both sentences have three tokens each: two named-entities and one
content word. If we assume that Sent1 tokenizes to S1 = (ne11 , w11, ne12 ) and Sent2
tokenizes to S2= (ne21 , w21 , ne22 ) then we can place each sentence across the columns or
rows as in Table 5.2. The latter presents pairwise word comparisons for conventional
WordNet, WordNet with CatVar conversion and the proposed Hybrid Method.
Table 5.2: Pairwise token comparison of the example using different similarity measures.
Table 5.2 (A) : Conventional WordNet Similarity
Sent1
Sent1
𝑛𝑒21
𝑤21 𝑛𝑒22 𝑀𝑎𝑥
𝑛𝑒11 0* 0* 0* 0
𝑛𝑒12 0* 0* 0* 0
𝑤11 0* 0* 0* 0
𝑀𝑎𝑥 0 0 0 0*
Table 5.2 (B) : CatVar-aided WordNet Similarity
Sent1
Sent1
𝑛𝑒21
𝑤21 𝑛𝑒22 𝑀𝑎𝑥
𝑛𝑒11 0 0 0 0
𝑤11 0 0.19 0 0.19
𝑛𝑒12 0 0 0 0
𝑀𝑎𝑥 0 0.19 0 0.19*
Table 5.2 (C): Hybrid Method Similarity
Sent1
Sent1
𝑛𝑒21
𝑤21 𝑛𝑒22 𝑀𝑎𝑥
𝑛𝑒11 1 0 0.49 1
𝑤11 0 0.19 0 0.19
𝑛𝑒12 0.49 0 1 1
𝑀𝑎𝑥 1 0.19 1 0.76*
From Table 5.2 (A), all word pairings of the conventional WordNet similarity yield zero
scores (0*) as the included named-entities are not covered in WordNet and that the only two
content words differ in PoS. In Table 5.2 (B), a conversion is incorporated, which means that

119
all verbs (only founded) are turned to nouns. In addition to applying word part of speech
conversion, Wikipedia-based named entity similarity is augmented to form the Hybrid
Method as given in Table 5.2 (C). Maximum scores of each row and column are listed in the
corresponding cells. The highlighted value in the last cell of every row and column for each
of the three sub-tables is the final similarity score of the respective scheme as per
quantifications (4.20, 5.2, 5.5, 5.9). Improvements achieved through the single word PoS
conversion (0 → 0.19) and further page count retrieval of the two proper nouns from
Wikipedia (0.19 → 0.76) are already apparent through the obtained scores.
Strictly speaking, a large number of English words exist in compound forms, e.g., post office,
however, there is a limited coverage of these compounds in WordNet. To preserve their
meaning, such words need to be used in their compound form for text similarity computation.
This is to say that each compound named entity contained in our pair of sentences in the
Illustrative Example has to be treated as a single word, e.g., Joseph Chamberlain to maintain
the actual concept of the name. Regardless of how, the traditional WordNet based measure
recognises the name Joseph Chamberlain as two tokens, Joseph and Chamberlain. These
tokens might be separately found in WordNet without referring to this person. Similar logic
applies to the other named entity, University of Birmingham. Another profound anomaly is
observable in equation 4.20 (page 75), especially in the normalization parameter. In this
regard, the sentence length is used as a normalizing factor. The intuition supports that many
words, e.g., named-entities do not appear in WordNet and hence won’t contribute to the
similarity. In that situation, it makes sense to reflect this in the normalization factor by
neglecting all non-contributing words from the sentence length. This has clearly shown an
improvement when used in expressions (5.2, 5.5, 5.9).

120
5.4 Sentence Ranking in MMR Framework for Query-focused Summarisation
5.4.1 Maximum Marginal Relevance
Maximum Marginal Relevance (MMR), introduced by Carbonell and Goldstein [155], is a
seminal algorithm in information retrieval and text summarisation. It was proposed to
minimize redundancy and maximize diversity. In the context of extractive automatic text
summarisation, MMR enables the extraction of summaries that cover the most distinct
contents of the document(s). It also ensures the least redundancy in the summary and strives
to achieve marginal relevance by maximizing query relevance and diversity simultaneously.
In a nutshell, a sentence with maximum marginal relevance, in a text summarisation context,
means it has a high query relevance and less redundancy. Obviously, if an anti-redundancy
mechanism is devised with the requirement of a restricted summary length, this may be
perceived as a way of automatically entailing a certain degree of diversity. This is why
diversity and anti-redundancy are occasionally interchangeably used in the literature. The
MMR algorithm is defined through expression (5.11).
𝑀𝑀𝑅(𝐶, 𝑄, 𝑅, 𝑆) = argmax𝐷𝑖∈
𝑅𝑆
[𝜆𝑆𝑖𝑚1(𝐷𝑖, 𝑄) − (1 − 𝜆) max𝐷𝑗∈𝑆
𝑆𝑖𝑚2(𝐷𝑖 , 𝐷𝑗)] (5.11)
Where C is a document collection; Q is the query; R is the ranked list of retrieved documents
by an information retrieval (IR) system, S is the subset of documents in R already selected;
R\S is the set of yet unselected documents in R; 𝑆𝑖𝑚1 and 𝑆𝑖𝑚2 are the similarity measures.
It should be noted that the sentences replace documents in the context of text summarisation
while the document, or a flattened cluster of documents, usually takes the place of the IR
document collection. For equation (5.11), the parameter λ is a weighting factor which
controls the trade-off between the two similarity components of the combined MMR formula.
It incrementally computes the standard relevance-ranked list when the parameter λ = 1, and a

121
maximal diversity ranking among the documents in R when λ = 0. For all other intermediate
values of λ in the interval [0, 1], a trade-off is sought between relevance and diversity.
Maximum Marginal Relevance initially worked well on information retrieval and single
document summarisation [155]. Later on, Goldstein et al. [156] extended it from a single
document summarisation method to a multi-document summarisation method by using
additional available information of the document collection and mitigating extra problems
including the degree of redundancy, the temporal dimension, the compression ratio and co-
reference resolution. MMR was deemed as one of the pioneering and influential works for
diversity based text summarisation where some researchers built on and furthered the
algorithm [35, 43, 157-159], while others including [13, 160, 161] utilised it in their own
studies. Most approaches inspired by the MMR algorithm and those using it have either
extended or adapted the measure by employing different similarity functions.
5.4.2 Feature Design
5.4.2.1 Query Relevance
The discovery of query-relevant sentences is modeled on the query semantic similarity with
cluster sentences. The semantic similarity between a query (including both narrative and the
title) and a sentence is the quantification of any shared lexical and semantic content. It can be
argued that cluster sentences containing a high semantic similarity with the query are highly
likely to be candidates for summary inclusion. Strictly speaking, our relevance calculation
distinguished named entity tokens from other content words (see equation 5.9, page 116). The
latter is implemented using equation 5.2 (page 108) while applying the WordNet-based
conversion aided similarity measures proposed in Chapter 4 (see Chapter 4, Section 4.3.2).
The named entity similarity between the query and each cluster sentence is separately
evaluated due to the low coverage of this word category in WordNet and other lexical
resources. If a user query contains a named entity, there is a strong likelihood that related

122
answers to this information need can be elicited from document sentences having the same
named entity. To boost the similarity of query-sentence or sentence-sentence pairs sharing
lexically similar entities, a further statistical named entity overlap measure, based on the
above prejudice, has been designed using the Jaccard similarity measure. In other words, if
QE denotes all named-entities occurring in a query (Q) and SE represents the set of named-
entities in a sentence (S), then the named entity overlap measure is quantified as shown in
expression (5.12).
𝑁𝐸𝑆𝑖𝑚(𝑄, 𝑆) =𝑄𝐸 ∩ 𝑆𝐸
𝑄𝐸 ∪ 𝑆𝐸 (5.12)
5.4.2.2 Sentence Centrality
Related works [21, 145, 162] point out the insufficiency of relevance as the only scoring
parameter for a summary responding to a typical user query. Centrality and coverage are two
terms used interchangeably in text summarisation. In the design of our summariser, we model
the centrality using two parameters; Subsumed Semantic Content and Centroid. The
Subsumed Semantic Content (SSC) of a sentence is the degree of semantic information
subsumed in each cluster sentence from other sentences within the same cluster but in
different documents. In other words, the SSC score for sentence 𝑠𝑖, SSC(𝑠𝑖) (exp. 5.13), is
computed as the average similarity score between the current sentence and the rest of the
cluster sentences excluding those from the same document, 𝐷𝑖 .
𝑆𝑆𝐶(𝑠𝑖) =1
|𝐶| − |𝐷𝑖| − 1∑ 𝑆𝑖𝑚
𝑠𝑗∈𝐶/𝐷𝑖
(𝑠𝑖, 𝑠𝑗) (5.13)
Where, |C| is the number of sentences in the entire cluster; |Di| is the number of sentences of
the document containing si; C/Di is the set of cluster sentences excluding those in Di. In
addition, the centroid is a query-independent feature whose value is computed from a group
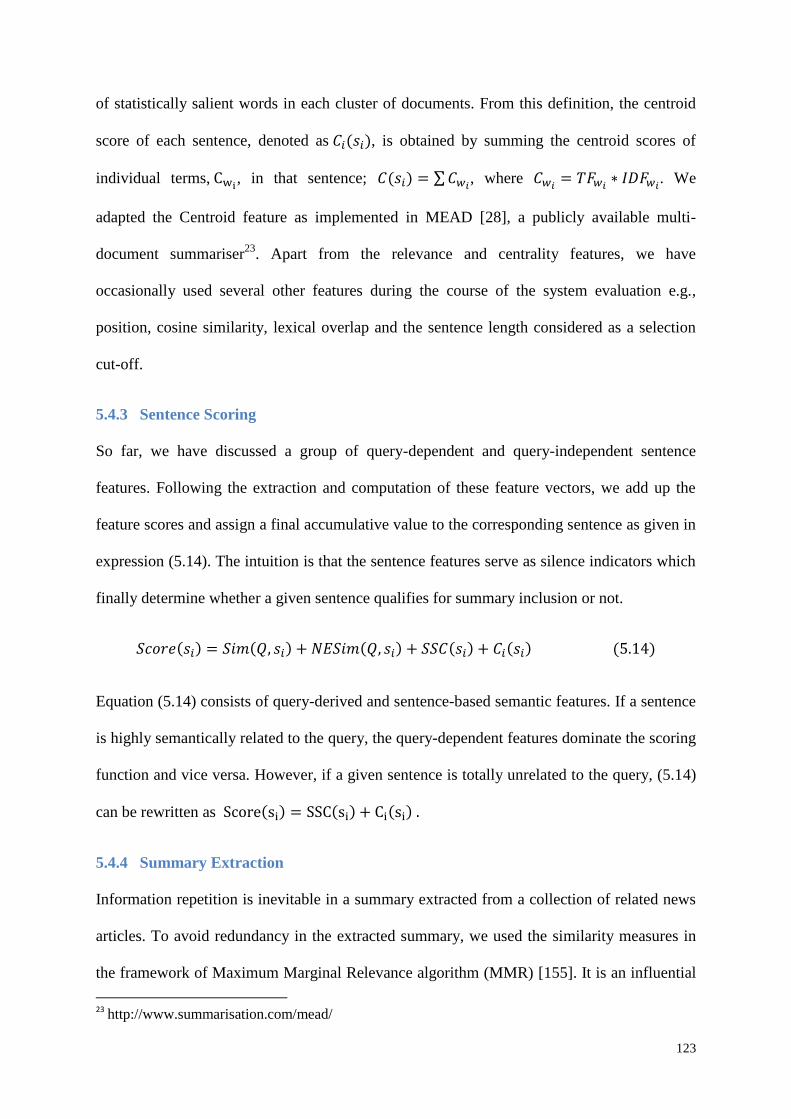
123
of statistically salient words in each cluster of documents. From this definition, the centroid
score of each sentence, denoted as 𝐶𝑖(𝑠𝑖), is obtained by summing the centroid scores of
individual terms, Cwi, in that sentence; 𝐶(𝑠𝑖) = ∑ 𝐶𝑤𝑖
, where 𝐶𝑤𝑖= 𝑇𝐹𝑤𝑖
∗ 𝐼𝐷𝐹𝑤𝑖. We
adapted the Centroid feature as implemented in MEAD [28], a publicly available multi-
document summariser23
. Apart from the relevance and centrality features, we have
occasionally used several other features during the course of the system evaluation e.g.,
position, cosine similarity, lexical overlap and the sentence length considered as a selection
cut-off.
5.4.3 Sentence Scoring
So far, we have discussed a group of query-dependent and query-independent sentence
features. Following the extraction and computation of these feature vectors, we add up the
feature scores and assign a final accumulative value to the corresponding sentence as given in
expression (5.14). The intuition is that the sentence features serve as silence indicators which
finally determine whether a given sentence qualifies for summary inclusion or not.
𝑆𝑐𝑜𝑟𝑒(𝑠𝑖) = 𝑆𝑖𝑚(𝑄, 𝑠𝑖) + 𝑁𝐸𝑆𝑖𝑚(𝑄, 𝑠𝑖) + 𝑆𝑆𝐶(𝑠𝑖) + 𝐶𝑖(𝑠𝑖) (5.14)
Equation (5.14) consists of query-derived and sentence-based semantic features. If a sentence
is highly semantically related to the query, the query-dependent features dominate the scoring
function and vice versa. However, if a given sentence is totally unrelated to the query, (5.14)
can be rewritten as Score(si) = SSC(si) + Ci(si) .
5.4.4 Summary Extraction
Information repetition is inevitable in a summary extracted from a collection of related news
articles. To avoid redundancy in the extracted summary, we used the similarity measures in
the framework of Maximum Marginal Relevance algorithm (MMR) [155]. It is an influential
23
http://www.summarisation.com/mead/

124
algorithm in information retrieval and text summarisation introduced to maximize query
relevance and minimize redundancy. Arguably, if an anti-redundancy mechanism is devised
with the requirement of a restricted summary length, this may be perceived as a way of
automatically entailing a certain degree of diversity. Our proposed system summarises each
cluster in the following manner. In each iteration, the MMR based greedy method selects a
sentence that maximizes relevance and centrality while minimising the similarity with the
sentences selected in previous iterations. In other words, we rescored and reranked sentences
using MMR with the original scoring function (expression 5.14) representing 𝑆𝑖𝑚1. Inspired
from the same algorithm and to further motivate summary diversity, we replaced 𝑆𝑖𝑚2 with
two parameters. The first is the similarity of each candidate summary sentence (𝑠𝑖) with
already selected sentences (S); while the second discourages selecting sentences from
documents of the previously selected; (𝑠𝑖, 𝐷𝑖, ) = 1𝐷𝑖
⁄ ∑[𝑠𝑖 ∈ 𝑆] . In the latter expression, 𝑠𝑖
denotes sentence i already included in the summary S from document Di. Formally, each
candidate cluster sentence to be selected is rescored with the modified MMR expression in
equation (5.15).
𝑆𝑀𝑀𝑅(𝑠𝑖) = 𝜆𝑆𝑐𝑜𝑟𝑒(𝑠𝑖) − (1 − 𝜆)[𝑆𝑖𝑚(𝑠𝑖, 𝑆) + 𝑓(𝑠𝑖, 𝐷𝑖 , 𝑆)] (5.15)
5.5 Experiments
In this section, we report a set of three experiments. The first is aimed at extracting named-
entities from the Wikipedia database using a simple infobox-based classifier. The second set
is an intermediate evaluation step designed to assess the performance of the hybrid method
based on the integration of WordNet and Wikipedia. The last experiment is intended to test
and evaluate the proposed knowledge-based summariser. Notably, the second experiment is
related to Chapter 4 where we use the conclusion drawn from its findings.
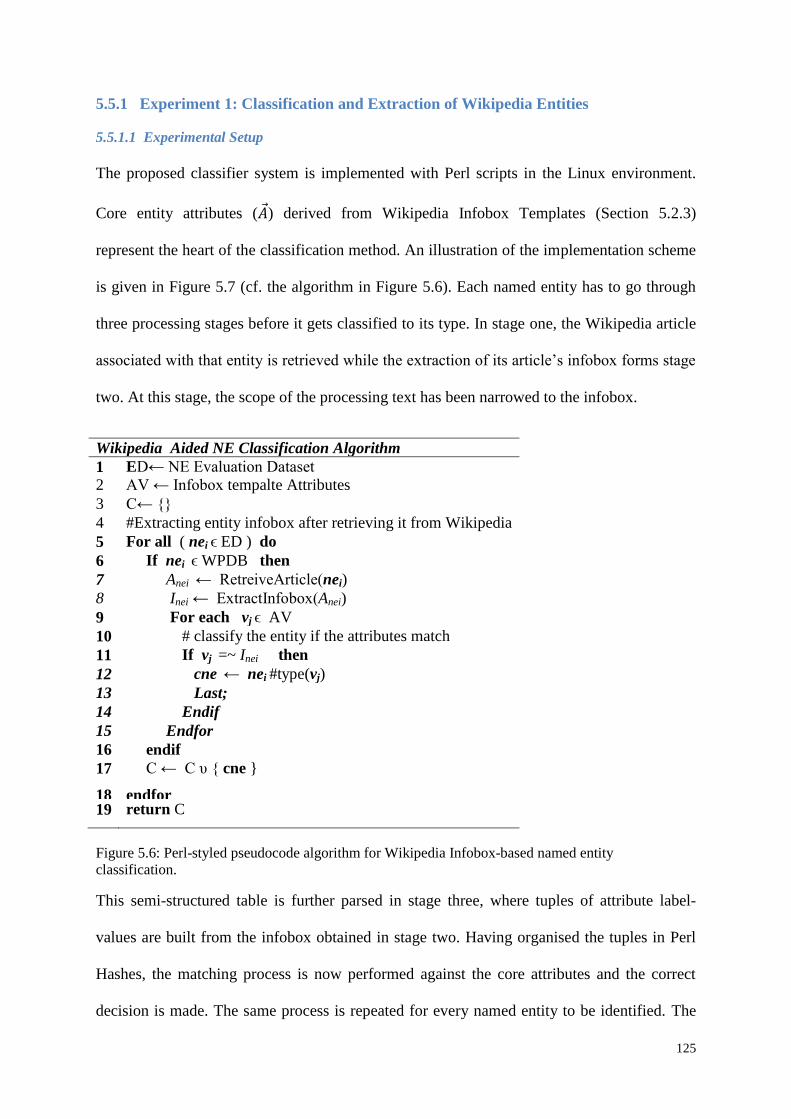
125
5.5.1 Experiment 1: Classification and Extraction of Wikipedia Entities
5.5.1.1 Experimental Setup
The proposed classifier system is implemented with Perl scripts in the Linux environment.
Core entity attributes (𝐴) derived from Wikipedia Infobox Templates (Section 5.2.3)
represent the heart of the classification method. An illustration of the implementation scheme
is given in Figure 5.7 (cf. the algorithm in Figure 5.6). Each named entity has to go through
three processing stages before it gets classified to its type. In stage one, the Wikipedia article
associated with that entity is retrieved while the extraction of its article’s infobox forms stage
two. At this stage, the scope of the processing text has been narrowed to the infobox.
Wikipedia Aided NE Classification Algorithm
1 ED← NE Evaluation Dataset
2 AV ← Infobox tempalte Attributes
3 C← {}
4 #Extracting entity infobox after retrieving it from Wikipedia
5 For all ( nei ϵ ED ) do
6 If nei ϵ WPDB then
7 Anei ← RetreiveArticle(nei)
8 Inei ← ExtractInfobox(Anei)
9 For each vj ϵ AV
10 # classify the entity if the attributes match
11 If vj =~ Inei then
12 cne ← nei #type(vj)
13 Last;
14 Endif
15 Endfor
16 endif
17 C ← C υ { cne }
18 endfor 19 return C
Figure 5.6: Perl-styled pseudocode algorithm for Wikipedia Infobox-based named entity
classification.
This semi-structured table is further parsed in stage three, where tuples of attribute label-
values are built from the infobox obtained in stage two. Having organised the tuples in Perl
Hashes, the matching process is now performed against the core attributes and the correct
decision is made. The same process is repeated for every named entity to be identified. The

126
Pseudocode algorithm in Figure 5.6 and the block diagram in Figure 5.7 better summarise the
logical flow of the discussed classification methodology.
Figure 5.7: Named entity classifier flowchart.
5.5.1.2 Dataset
The experiments were conducted on two datasets. The first test-data comprised of 3600
named-entities with different proportions of the three considered entity types (PER, LOC,
ORG), which is created from two sources; namely, Forbes and GeoWordNet. Specifically, all
person and organisation names were excerpted from the Forbes400 and Forbes2000 lists24
.
On the other hand, location named-entities were sourced from GeoWordNet database25
. The
second test uses a dataset constructed from CoNLL-2003 shared task’s named entity data26
.
Checking the coverage and the availability of all names with their surface forms in Wikipedia
has been performed over all datasets prior to the experiments.
24
http://www.forbes.com/lists/ 25
http://datahub.io/dataset/geowordnet 26
http://www.cnts.ua.ac.be/conll2003/ner/

127
5.5.1.3 Results and Discussion
Testing the classification and extraction algorithm was made in two rounds. In the first round,
the test dataset is divided into 4 smaller parts containing 100, 500, 1000, 2000 NEs all with
different proportions of their types. This splitting has been performed for two reasons. First,
this helps to securitize the data size effect on the observed parameters. Second, it reduces
Wikipedia server’s overhead with large data since all the testing and evaluation experiments
used Query-based access (see Section 5.2.3) to the online version of the encyclopaedia.
Table 5.3: Results: percentage accuracy with varying data sizes.
Dataset Size Person Location Organisation
100 96% 99% 97%
500 91.6% 95.4% 94%
1000 93.8% 94.2% 94.3%
2000 95.5% 93.9% 97.25%
The results of the round 1 experiment are reported in Table 5.3, where the accuracy level is
determined using expression 4.22 (page 93). The trend of the scores shown in the table
indicates that varying data sizes have little effect on the accuracy for the person and
organisation entity types. However, a slight decrease is observable in the case of location
names. Overall, the round 1 experiment on the test-data reveals that the classifier can achieve
an average accuracy of above 93% irrespective of the data size.
In the second round, the experiment was conducted using named-entities constructed from
the CoNLL-2003 shared task data for named entity recognition, to observe three of the
traditional information retrieval metrics namely; precision, recall, and F-measure (see 4.4.3.2,
Chapter 4). We used Wikipedia assisted disambiguation to exclude all ambiguous names.
Similarly, all named-entities whose Wikipedia articles lack infobox tables have been
iteratively removed from the evaluation dataset. The round 2 experimental results, in terms of

128
precision, recall and f-measure, are summarised in Table 5.4. The F-measure scores of
locations and organisations indicate that the selected core attributes represent good criteria for
identifying Wikipedia named-entities. Again the results confirmed that such attributes are
mainly added by article contributors when authoring Wikipedia articles through adapting
infobox templates.
Table 5.4: Overall classifier results.
Type Precision Recall F-score
Person 1 0.98 0.99
Location 0.99 0.95 0.97
Organisation 0.94 0.97 0.96
Table 5.4 shows that person names achieved the highest F-score as the ambiguities of these
have been accounted for. If any named entity with an entry in Wikipedia can be identified,
then a hypothesis on the likelihood of recognizing all Wikipedia articles with infoboxes can
be reached. On that basis, the proposed classification algorithm is applied to the English
Wikipedia dump dated third February 2014. Table 5.5 shows the number of each named
entity type extracted from Wikipedia database. The number of named-entities obtained
through this approach (1575966) significantly outnumbers the figure of Wikipedia articles on
named-entities (1547586) derived from the same database in the work of Wentland et al. [97].
Table 5.5: The total named-entities of each type extracted from Wikipedia.
Person Location Organisation Total
620790 290134 665042 1575966
One may argue that this has been an earlier study while Wikipedia is constantly growing in
size. This is true to an extent, however, this study has only considered three types of named-
entities while [97] contains Miscellaneous named-entities in addition to the three considered

129
in this work. The generated database of named-entities can be used as a training data for
supervised classification strategies.
5.5.2 Experiment 2: Paraphrase Identification with the Hybrid Approach
5.5.2.1 Dataset
For this experiment, we have used the Microsoft Research Paraphrase Corpus (MSRPC) and
TREC-9 corpora, which are the same datasets used in Chapter 4 for the evaluation of the
conversion aided methods (see Section 4.4.3, Chapter 4). The corpora are created for testing
applications measuring short text semantic similarity (e.g., paraphrase identification) and we
used them for that purpose to evaluate the proposed hybrid text similarity measure.
Employing the same dataset allowed us to visualize the improvement that the hybrid
approach achieves over the conversion aided WordNet similarity measure in Chapter 4.
5.5.2.2 Results and Discussion
The significance of named-entities in the used datasets is highlighted in Figure 5.8, where
more than 71% of the sentence pairs contain one or more named-entities for both the TREC-9
and MSRPC datasets. This is a supporting evidence which signifies the criticality of these
textual components overlooked in the state of the art knowledge-based similarity approaches.
Table 5.6: Notation for different similarity measures.
Notation Interpretation
CosSim Cosine Similarity
TWN Traditional WordNet
WNwCVC WordNet with CatVar conversion
NeSim Wikipedia-based Named Entity Similarity
HYB Hybrid Method

130
Figure 5.8: Named entity distribution in TREC-9 and MRSCP datasets; Both: both sentences of the
pair contain named-entities; One: only one sentence of the pair has named-entities; None: None of the
sentence pair hold named-entities.
The primary focus of this experiment is on the evaluation of the Hybrid Method (equation
5.9, page 116), which determines if two given sentences are semantically unrelated (negative
paraphrase) or semantically similar (positive paraphrase) using scores scaled between 1.0 and
0.0 and with a predefined threshold where each pair is classified as positive paraphrases if the
similarity is above/equals the threshold. However, prior to the combined method, we
performed a rather superfluous assessment of the conversion aided WordNet semantic
similarity and the Wikipedia-based named entity semantic relatedness schemes separately.
This is to give an idea about the performance of each sub-system in isolation and the
substantial improvement achieved after their combination. Evaluation results of these systems
against baselines are given in Table 5.7 and Table 5.8 for the TREC-9 and MSRPC corpora in
order.

131
Table 5.7: System-baseline comparison on the TREC-9 dataset.
Measure Precision Recall F-measure Accuracy
TWN 0.9744 0.6387 0.7716 0.6764
CosSim 0.9792 0.395 0.5629 0.4748
WNwCVC 0.9775 0.7311 0.8365 0.7554
NeSim 1 0.6471 0.7857 0.6978
HYB 0.8077 1 0.8936 0.871
Table 5.8: System-baseline comparison on the MSRPC dataset.
Measure Precision Recall F-measure Accuracy
TWN 0.826031 0.558849 0.666667 0.55793
CosSim 0.906801 0.313862 0.466321 0.431724
WNwCVC 0.818505 0.802092 0.810216 0.702759
NeSim 0.7943 0.5589 0.6561 0.5366
HYB 0.82 0.887 0.852 0.757
For the validation of the hybrid approach, we selected three similarity measures; namely,
cosine measure, traditional WordNet and CatVar-aided WordNet, as baselines. Cosine
similarity quantifies the similarity between two pieces of text in the form of word vectors
(bag of words) while conventional and CatVar-aided WordNet measures are as explained in
Section 4.3 of the previous chapter. These three benchmark methods are evaluated against the
proposed Wikipedia-based named entity and the hybrid similarity measures using the metrics
presented in Section 4.4.3.2 (see Section 4.4.3, Chapter 4). Table 5.7 and Table 5.8 chart the
system-baseline comparison for TREC-9 and MSRPC datasets respectively while related
notations are defined in Table 5.6. Notably, the system’s better performance on the TREC-9
dataset, in Table 5.7, might be due to either the dominance of named-entities after the stop
word removal and/or its smaller size and short sentence lengths as compared to MSRPC.
What is very interesting in the findings is the fact that Wikipedia-based named entity measure

132
can reliably achieve near WordNet performance, which in turn indicates the significance of
designated names in a full-text semantic extraction. Therefore, it is not surprising for the
combined approach to achieve a significant improvement over the separate sub-systems.
From all obtained experimental results, it is apparent that both the CatVar-aided WordNet
scheme (before integrating with Wikipedia similarity) and the Hybrid Method (after the
integration) achieved a significant improvement over the baselines (p < 0.001)27
.
Table 5.9: Comparing paraphrase detection results with related state of the art works.
System F-measure Accuracy
Finch et al. [163] 82.7 (7) 75.0 (8)
Wan et al. [164] 83.0 (6) 75.6 (7)
Fernando and Stevenson [111] 82.4 (8) 74.1 (9)
Das and Smith [127] 82.7 (7) 76.1 (5)
Socher, Huang et al. [123] 83.6 (5) 76.8 (4)
Blacoe and Lapata [165] 82.3 (9) 73.0 (10)
Madnani, Tetreault et al. [166] 84.1 (4) 77.4 (3)
Ji and Eistenstein [167] 85.96 (2) 80.41 (1)
This Study (Th = 0.5) 88.3 (1) 79 (2)
This Study (Th = 0.7) 85.2 (3) 75.7 (6)
As presented in Tables 5.7-5.8 and their related discussion, the system-baseline comparison
indicated that the hybrid method outperformed the baselines. Furthermore, we performed an
additional evaluation step by comparing our system’s paraphrase detection level with related
state of the art works for paraphrase identification (Table 5.9). This process was not
straightforward as major discrepancies arise from the peculiarity of each approach, their
supervision method, and whether they use distributional or knowledge-based similarity.
Regardless the employed algorithm or method, we compare our results with published state
of the art related studies in Table 5.9. We report our results from experiments based on two
different thresholds (Th), the empirically determined (0.7) and the commonly employed
27
See Table 5.10 for significance testing.

133
demarcation threshold (0.5) used in the state of the art methods. The former threshold value
(0.7) is determined to optimise the performance of the system on training data. The numbers
in the parenthesis following the scores indicate the ranking of each approach. Two or more
methods are equally ranked if they yield the same results. One attractive property of using a
high threshold is that it precludes the misidentification of negative paraphrases with
significant semantic overlaps whereas a low threshold can easily and mistakenly identify
these negative paraphrases as semantic equivalents.
All paraphrase identification methods used to compare our system are based on the MSRPC
dataset. Consequently, only the MSRPC results can be considered for strict comparison,
which is why we excluded the TREC-9 results from this table. Of the related works used in
the comparison, the best result is from [167]. However, in this work, we use an
algorithmically simpler approach based on unsupervised heuristic methods as compared to
other studies, including [167], which employ complex techniques such as supervised machine
learning and vector space models. Interestingly, our results outperform all related works with
the exception of the best performant where we underperform in accuracy by 1.42%. Overall,
it is evident that the combination of Wikipedia and WordNet has clearly improved the
paraphrase identification performance. Especially, the proposed hybrid system outperforms
baselines and improves performance aspects of the present state of art systems by 2.34% in F-
measure. This clearly advocates the utilisation of WordNet noun taxonomy and the
augmentation of named entity rich resources, e.g., Wikipedia for semantic similarity and
paraphrase identification applications.
Besides comparing our system with baselines and related works, we have also conducted a
paired T-Test to determine whether the improvements achieved with the proposed methods
are statistically significant in comparison to the baselines. A paired T-Test tells us whether or
not two variable averages are statistically significantly different. Table 5.10 summarises the

134
T-Test statistical measures for the entire MSRPC test data. From the obtained values, we
reject the null hypothesis and conclude that the improvement is statistically significant since
the confidence interval excludes zero and the statistical significance p-value (column p) is
lower than the typical demarcation criteria (0.05). The pair numbers 1, 2, 3 and 4 represent
system combinations of CosSim-WnWCC, CosSim−Hm, WnWoC-WnWCC and WnWoC–Hm,
respectively.
Table 5.10: Statistical significance testing (T-test).
Additionally, the 2-tailed paired T-Test has shown that both the conversion aided method ( m
= 0.7825410) and the Hybrid Method (m= 0.8103128) achieve significant improvements over
the two the baselines; the cosine (m = 0.5354011) and conventional WordNet similarities ( m
=.6937230 ), t(1724) , p <= 0.001 where m denotes the mean scores. In other words, the p-
values for all conducted paired t-tests were less than 0.001. The symbols SD and SEM in
Table 5.10 denote standard deviation and standard error mean respectively. As a final note,
the use of word proportions from the sentence pairs (equation 5.10, page 117) as coefficients
for the combination of the two similarity components (equation 5.9, page 116) has some
desirable attributes. First, it conforms to unity sum. Second, it serves as a weighting control
strategy for the relative contribution of each similarity component. An empirical observation
showed that the higher the number of named entity tokens in a sentence pair (e.g., the more
the Wikipedia-based named entity semantic similarity is weighted), the better the
performance of the paraphrase detection in terms of its recall, accuracy and f-measure. This
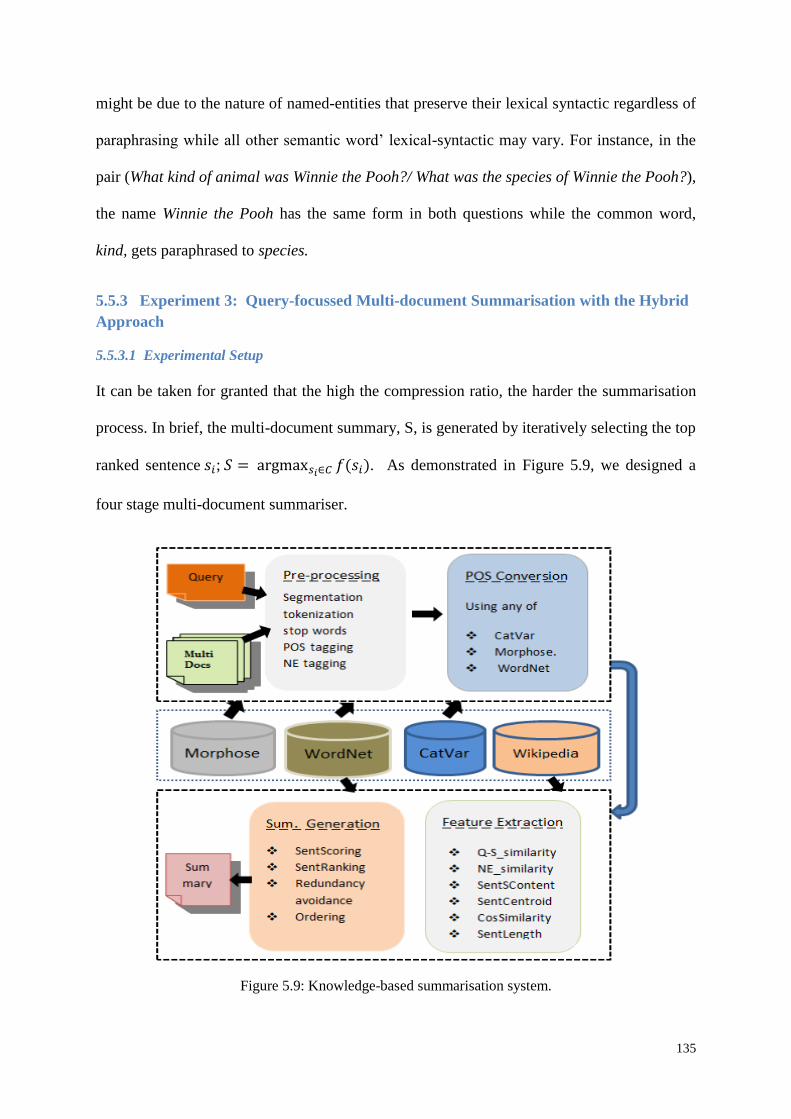
135
might be due to the nature of named-entities that preserve their lexical syntactic regardless of
paraphrasing while all other semantic word’ lexical-syntactic may vary. For instance, in the
pair (What kind of animal was Winnie the Pooh?/ What was the species of Winnie the Pooh?),
the name Winnie the Pooh has the same form in both questions while the common word,
kind, gets paraphrased to species.
5.5.3 Experiment 3: Query-focussed Multi-document Summarisation with the Hybrid
Approach
5.5.3.1 Experimental Setup
It can be taken for granted that the high the compression ratio, the harder the summarisation
process. In brief, the multi-document summary, S, is generated by iteratively selecting the top
ranked sentence 𝑠𝑖; 𝑆 = argmax𝑠𝑖∈𝐶 𝑓(𝑠𝑖). As demonstrated in Figure 5.9, we designed a
four stage multi-document summariser.
Figure 5.9: Knowledge-based summarisation system.

136
In the first stage, we performed some fundamental pre-processing tasks such as segmenting
documents into sentences, tokenizing the sentences and queries to build a bag of word
(BOW) vectors, removing stop words, tagging the part of speech of each token and labelling
all constituent named-entities (NEs).
Secondly, having PoS tagged BOW vectors representing each sentence or query; we
transformed all non-noun primary word categories into nouns, with the help of WordNet,
CatVar and Morphsemantic Links as discussed in the previous chapter (see Section 4.3.2,
Chapter 4). It is worthwhile noting that a single PoS conversion method is incorporated in
each experimental run.
Next, query relevance and sentence centrality features including query-sentence similarity,
intra-sentence similarities, subsumed semantic content and centroids, are extracted in the
third stage of the summarisation process. At this stage of the system development, we used
MEAD [28] as a base framework and integrated all our developed features with its
implementation. Summary generation formed the fourth and final stage of the system
development.
5.5.3.2 Evaluation Metric
As stated in Chapter 2 (see Section 2.5), there are two primary methods for evaluating the
quality of automatically generated summarises; intrinsic and extrinsic. The intrinsic
evaluation assesses the actual quality of system summaries, usually by comparing it with gold
standard human summaries. By comparison, the extrinsic, also called task-based evaluation,
assesses how the summaries aid the completion of a related task such as reading
comprehension, etc. Today, intrinsic evaluation is the most widely used approach in text
summarisation. For all quantitative evaluations of the system summary against baselines and
other related state-of-the-art systems, we used Recall Oriented Understudy for Gisting

137
Evaluation (ROUGE) [77], a heavily used official intrinsic evaluation tool in text
summarisation. Due to its approved effectiveness, the ROUGE is adopted in all DUC28
competitions. It determines the quality of a system summary by comparing it to an ideal
human summary (known as model/reference summary) and computing machine-human
summary overlap in terms of n-grams. An n-gram refers to n sequence of words, for instance,
two-word is called bigram. The ROUGE metric defines a group of measures including
ROUGE-N (N=1, 2, k), ROUGE-S, ROUGE-SU (maximum skip distance dskip = 1, 4, 9),
ROUGE-L, ROUGE-W (weighting factor α = 1.2). ROUGE-N measures the n-gram overlap
between system summary and the gold standard human summaries. Let N be the length of n-
gram, 𝑔𝑟𝑎𝑚𝑛 and 𝐶𝑜𝑢𝑛𝑡(𝑔𝑟𝑎𝑚𝑛) be the number of n-grams in the reference (RS) or
system summary (SS). If 𝐶𝑜𝑢𝑛𝑡𝑚𝑎𝑡𝑐ℎ(𝑔𝑟𝑎𝑚𝑛) is the maximum number of n-grams co-
occurring in the system summary and the collection of reference summaries (resp. system
summaries), then ROUGE-N for metrics recall, precision and F-measure are computable as
per expressions (5.16 -5.18) respectively.
𝑅𝑂𝑈𝐺𝐸 − 𝑁𝑟𝑒𝑐𝑎𝑙𝑙 =∑ ∑ 𝐶𝑜𝑢𝑛𝑡𝑚𝑎𝑡𝑐ℎ(𝑔𝑟𝑎𝑚𝑛)𝑔𝑟𝑎𝑚𝑛∈𝑆𝑆∈𝑅𝑆
∑ ∑ 𝐶𝑜𝑢𝑛𝑡(𝑔𝑟𝑎𝑚𝑛)𝑔𝑟𝑎𝑚𝑛∈𝑆𝑆∈𝑅𝑆 (5.16)
𝑅𝑂𝑈𝐺𝐸 − 𝑁𝑝𝑟𝑒𝑐𝑖𝑠𝑖𝑜𝑛 =∑ ∑ 𝐶𝑜𝑢𝑛𝑡𝑚𝑎𝑡𝑐ℎ(𝑔𝑟𝑎𝑚𝑛)𝑔𝑟𝑎𝑚𝑛∈𝑆𝑆∈𝑆𝑆
∑ ∑ 𝐶𝑜𝑢𝑛𝑡(𝑔𝑟𝑎𝑚𝑛)𝑔𝑟𝑎𝑚𝑛∈𝑆𝑆∈𝑆𝑆 (5.17)
𝑅𝑂𝑈𝐺𝐸 − 𝑁𝐹−𝑚𝑒𝑎𝑠𝑢𝑟𝑒 =2 ∗ 𝑅𝑂𝑈𝐺𝐸 − 𝑁𝑟𝑒𝑐𝑎𝑙𝑙 ∗ 𝑅𝑂𝑈𝐺𝐸 − 𝑁𝑝𝑟𝑒𝑐𝑖𝑠𝑖𝑜𝑛
𝑅𝑂𝑈𝐺𝐸 − 𝑁𝑟𝑒𝑐𝑎𝑙𝑙 + 𝑅𝑂𝑈𝐺𝐸 − 𝑁𝑝𝑟𝑒𝑐𝑖𝑠𝑖𝑜𝑛 (5.18)
ROUGE-S counts Skip-Bigram (any pair of words in their sentence order with any gaps in
between) Co-occurrence Statistics. If X is a human reference summary of length n and Y is a
system summary of length m, the skip-bigram-based F-measure is computed as in expression
(5.19). From expression (5.19), one can take a note that β determines the relative importance
between precision and recall where β→0 favors precision. Typically a value of 0.5 is used
28
Document understanding conference

138
for β. ROUGE-SU is an extension of ROUGE-S with the addition of unigram co-occurrence
counts.
𝐹𝑠𝑘𝑖𝑝2 = (1 + 𝛽2)𝑅𝑠𝑘𝑖𝑝2𝑃𝑠𝑘𝑖𝑝2
𝑅𝑠𝑘𝑖𝑝2 + 𝛽2𝑃𝑠𝑘𝑖𝑝2 (5.19)
𝑅𝑠𝑘𝑖𝑝2 =𝑆𝐾𝐼𝑃2(𝑋, 𝑌)
𝐶(𝑚, 2) (5.20)
𝑃𝑠𝑘𝑖𝑝2 =𝑆𝐾𝐼𝑃2(𝑋, 𝑌)
𝐶(𝑛, 2) (5.21)
ROUGE-L computes the longest common subsequence between a candidate summary and
human reference summary by capturing the common word sequence with the maximum
length. This can be done either at the sentence or at the summary level. ROUGE-W is a
version of the ROUGE-L measure whereby consecutive longest common sequences are given
more weight than discontinuous ones. We used version 1.5.5 of the ROUGE package in the
evaluation of the summaries. Of the three scores that ROUGE yields; precision, recall and f-
measure, we report the average recall scores of ROUGE-1, ROUGE-2 and ROUGE-SU4
measures in line with DUC evaluations. This is because only the recall is recommended when
a summary length is enforced29
, which is the case with all DUC evaluation datasets.
Likewise, we have selected ROUGE-N (N=1, 2) and ROUGE-SU4 as they were found to
work reasonably well for the evaluation of multi-document summarisation [77], and are
widely adopted in DUC2005 and DUC2002 summarisation tasks. The statistical significance
of ROUGE results is assessed by applying a bootstrap resampling technique to estimate 95%
confidence intervals (CIs) for all n-gram co-occurrence computations. We used 1000
sampling points in the bootstrap resampling for the evaluations. The higher the computed
ROUGE scores, the more the system summary is similar to the human summary.
29
ROUGE-1.5.5

139
5.5.3.3 Evaluation Dataset
We conducted evaluation experiments on datasets constructed from the DUC2005 and
DUC2006 Corpora30
, standard datasets specifically created for the evaluation of query-
focussed multi-document summarisation systems. These corpora are part of the dataset
developed for the competitions at Document Understanding Conferences (DUC). The data
sets contain 50 clusters each with corresponding gold summaries31
. Within every cluster of
the DUC2005, there is a group of 25 to 50 related documents of varying lengths while, on
average, the DUC2006 clusters comprise 25 documents each. Table 5.11 gives a brief
description of the DUC2005 and DUC2006 corpora whereas Figure 5.10 shows their cluster
sizes in terms of their content sentences. A number of pre-processing tasks have been
performed on the data during our experiments as explained in the previous section.
Table 5.11: Dataset statistical description.
Statistic DUC2005 DUC2006
No of clusters 50 50
No docs per cluster 25 to 50 documents 25 documents
The desired summary limit 250 words 250 words
Cluster size rage 356 to 1814 sentences 165 to 1349 sentences
Average cluster size 930.94 sentences 716.48 sentences
5.5.3.4 Results and Discussion
Following the DUC guidelines for summary evaluation, our summariser generates a 250
word summary of each cluster for both DUC2005 and DUC2006 datasets. We then compute
the n-gram co-occurrence statistics between the system summaries and the human reference
summaries, which come with the dataset, using the ROUGE. All the ROUGE evaluations
implemented stemming and jacknifing. We measured the quality of our system summaries
based on the recall score of three ROUGE metrics; ROUGE-1, ROUGE-2 and ROUGESU4.
30
http://duc.nist.gov/data.html 31
This is extracted by human assessors in the National Institute of Standards and Technology (NIST).

140
Table 5.12: System notations.
Notation Description
TWN Traditional WordNet
WNwWNC WordNet with WordNet Conversion
WNwMLC WordNet with Morphosemantic Conversion
WNwCVC WordNet with CatVar Conversion
HYB Combined Wikipedia and WordNet
In Fig. 5.11 (A), we show the acquired results for the DUC2005 dataset in terms of the three
aforementioned measures for all system implementations with the application of the
traditional WordNet, conversion aided WordNet and the hybrid method (the integration of
Wikipedia and WordNet ) as the underlying scoring functions. For the summarisation task,
we use the notations defined in Table 5.12 to indicate different similarity measures in the
knowledge-based summariser.
Figure 5.10: DUC2005/DUC2006 corpora cluster sizes (No of sentences in each cluster).

141
Figure 5.11: Experimental results on DUC2005 Dataset: A) Rouge-1, 2, SU4 with a single coefficient
(λ=0.5); B) Rouge-1 scores with varying λ; C) Rouge-2 scores with varying λ; D) Rouge-SU4
scores with varying λ.
It is evident from the scores in Fig. 5.11 (A) that the incorporation of different lexical
resources achieved varying degrees of improvements over the system built on the pure
traditional WordNet similarity measures. From this baseline-hybrid method comparison, we
can make the following three observations:
Of all systems, the CatVar-aided summariser exhibits a slightly better performance at the
given single λ.
These results agree with our findings in Chapter 4 where the WordNet-based similarity
with CatVar-aided conversion was deemed the performant PoS conversion scheme (see
Section 4.4.2, Chapter 4).
This agreement substantiates our hypothesis that CatVar is the most suitable add-on
resource to WordNet, among the examined resources, for the task of PoS conversion.

142
It is worth mentioning that this score was deemed the best obtained score over all
experiments though the combined approach yields a better performance in the overall MMR
weighing coefficients as will be discussed soon in this section. We use the ROUGE scores of
this combination to compare the system’s performance with closely related works. One
possible explanation of CatVar’s better performance might be attributed to the fact that it
contains exact word categorial variants whereas the PoS conversions assisted with
Morphosemantic database and WordNet relations are accomplished through some form of
conceptual relatedness.
However, the summarisation algorithm assisted with CatVar fails to maintain its supremacy
in all experiments. To consolidate the system’s evaluation, we have tuned the value of the
MMR weighting parameter (λ) from 0.1 to 0.9 to visualize how the trade-off between query
relevance and summary diversity impacts on the performance of the different summariser
implementations. This is shown in Figures 5.11 (B-D), where the integrated summarisation
approach built on the combination of WordNet and Wikipedia attains the overall best
performance in all the experiments except at λ value of 0.5. This is the reason why the results
at this λ are isolated in Fig. 5.11 (A). Figures 5.11 (B-D) illustrate the scores of ROUGE-1,
ROUGE-2 and ROUGE-SU4 of the DUC2005 dataset respectively using a varying weight (λ)
in the range of (0.1 to 0.9) and with a step size of 0.1. It is clear from the chart that all the
three ROUGE measures follow similar trends. In the same manner, Table 5.13 presents a
comparison between our best recorded ROUGE results and the top DUC2005 systems plus
three of the most recent closely related works all which are experimented on the same dataset.
From the table, it is obvious that our system surpasses all DUC2005 top systems as well as
their overall average scores. Similarly, it obviously outperforms the other state-of-the-art
comparators listed in Table 5.13 in at least one of ROUGE-1 or ROUGE-SU4 and sometimes

143
both metrics, for instance [57]. However, it is equally the case that all the three systems do
better in ROUGE-2 scores.
Table 5.13: Comparative with the best DUC2005 systems and recent closely related works.
Summariser Rouge-1 Rouge-2 Rouge-SU4
95% confidence interval (CI)
AVG-DUC2005 0.3434 (8) 0.0602 (8) 0.1148 (8)
DUC2005-System 4 0.3748 (5) 0.0685 (7) 0.1277 (6)
DUC2005-System 10 0.36369 (7) 0.06984 (5) 0.12526 (7)
DUC2005-System 15 0.3751 (4) 0.0725 (4) 0.1316 (4)
Cai at. Al (2012) 0.37621 (3) 0.07703 (3) 0.13128 (5)
Luo at. Al (2013) 0.3728 (6) 0.08070 (1) 0.13535 (2)
Canhasi et al. (2014) 0.3945 (2) 0.0797 (2) 0.1420 (1)
Our system 0.3949 (1) 0.06933 (6) 0.133339 (3)
Figure 5.12: Experimental results on DUC2006 Dataset: A) Rouge-1, 2, SU4 with a single coefficient
(λ=0.5); B) Rouge-1 scores with varying λ; C) Rouge-2 scores with varying λ; D) Rouge-SU4 scores
with varying λ.

144
Figure 5.12 demonstrates results obtained from the DUC2006 and is the equivalent to Figure
5.11. Unlike DUC2005, the multi-document summariser underpinned with conversion aided
WordNet similarity competes with the hybrid approach in performance for the DUC2006. For
instance, there is no noticeable difference in ROUGE-2 scores between the summariser built
with conversion aided similarity measure and the one based on the hybrid approach.
However, there is a strong agreement among all the results when it comes to the enhancement
realized over the summariser implemented with traditional WordNet similarity measures. The
overall system performance of the proposed summariser beats all top relevant DUC2006
systems in ROUGE scores, as listed in Table 5.14. As for the related works, we have
maintained the three comparators we used in Table 5.13 for comparing DUC2005 results. On
this occasion, we outperform two of the comparators, namely [57, 162] in ROUGE-1 and
ROUGE-SU4 scores. By comparison, [21] appears to have performed entirely better on the
DUC2006 dataset as shown in Table 5.14. The relative improvement and outperformance
(e.g., the ROUGE-1 results) of the knowledge-based summariser, as indicated in Tables 5.13
and 5.14, reveal the competency of conversion aided WordNet similarity and the hybrid
methods to be used for the identification of key text segments.
Table 5.14: Comparison with best DUC2006 systems and recent closely related works.
Summariser 95% confidence interval (CI)
Rouge-1 Rouge-2 Rouge-SU4
AVG-DUC2006 0.3795 (8) 0.0754 (8) 0.1321 (8)
DUC2006-System 24 0.4102 (3) 0.0951 (1) 0.1546 (2)
DUC2006-System 12 0.4049 (5) 0.0899 (5) 0.1476 (3)
Canhasi et al. (2014) 0.4238 (1) 0.0917 (3) 0.1671 (1)
DUC2006-System 15 0.40279 (6) 0.09097 (4) 0.14733 (5)
Cai at. Al (2012) 0.39615 (7) 0.08975 (6) 0.13905 (7)
Luo at. Al (2013) 0.40869 (4) 0.0922 (2) 0.14372 (6)
Our system 0.41242 (2) 0.08794 (7) 0.14744 (4)

145
In a nutshell, we can draw from the conducted experiments and the obtained results the
conclusion that the problem of paraphrase identification and extractive query-focussed
summarisation are both critically dependent on similarity measures. Likewise, the summary
quality of an extractive question-centred summarisation can be boosted by selecting proper
relevance, centrality and anti-redundancy parameters. These parameters are in turn
fundamentally influenced by the improvement of their underlying modelling features, as
empirically verified via the enrichment of WordNet with other manually engineered and
collaboratively built lexical resources.
5.6 Related Works
To our knowledge, this study is the first of its kind that utilised word parts of speech
conversion for the purpose of improving text semantic similarity which ultimately helps the
advancement of all other NLP applications that build on it including text summarisation. For
this reason, our evaluation includes an experimental phase whereby the hybrid method is
validated prior to its use for the design of the proposed knowledge-enriched summariser as
described in Section 5.5.2. In this phase, we have applied the hybrid method to the problem
of paraphrase identification as some form of an extension to chapter 4 where we used similar
dataset for the validation of the conversion aided WordNet similarity measure.
Important research has been conducted to identify short paraphrases using different
strategies. Researchers in [163, 166] investigated the applicability of machine translation
approaches to text paraphrase identification. Similarly, Fernando and Stevenson [111]
proposed a paraphrase identification algorithm based on word level similarities derived from
WordNet taxonomy whereas [127] utilised quasi-synchronous dependency grammars in a
probabilistic model incorporating lexical semantics from WordNet. On the other hand, [165]
employed three distributional representations of text: simple semantic space, sytax-aware
146
space and word embeddings for phrasal and sentential semantic similarity to identify text
paraphrases. Authors in [123] exploited semantic and syntactic dependency-based features
for the classification of paraphrases. Ji and Eisenstein [167] used a very simple distributional
similarity model by designing a discriminative term-weighting metric called TF-KLD instead
of the conventional TF-IDF (Term Frequency - Inverse Document Frequency). Similar to
[111, 127], our hybrid similarity measure advocates the use of WordNet-sourced semantics
for paraphrase detection. However, several improvements have been put forward in order to
address the coverage and part of speech boundary limitations of WordNet by employing word
category conversion and a new Wikipedia-based named entity similarity measure.
In the field of text summarisation, named-entities have been recognised as informative text
tokens worth consideration in combination with other features for the identification of salient
passages in textual documents. Hassel [168] presented an extractive summarisation approach
for Swedish texts where named-entities are recognised and assigned weights. These weights
are then combined with other scoring parameters for the identification of key text segments.
Their study found that named-entities carry important clues that point out salient sentences
without avoiding redundancy. However, their study also disclosed that the named entity
combined technique prioritized elaborative sentences over the introductory ones, which
occasionally led to the omission of sentences carrying background information. In a different
approach, Aker and Gaizauskas [169] put forward a method of producing multi-document
summaries for location based named-entities. They summarised Wikipedia articles on
location named-entities and used the generated summaries as image captions. These images
are the ones residing within the same documents. Farzindar et al. [38] participated in the
DUC2005 competition with a summarisation system in which four named entity types;
person, location, organisation and time, were recognised. They counted the number of times a
particular named entity appears in the query/sentence. They also made a preference of some

147
entity types (location) over others (person) by boosting sentences containing the former. The
named entity aspect of their scoring function is finally computed as the named entity overlap
of the same category between a sentence and a query. Researchers of [170] applied similar
method without restricting the overlap to the same category. They themselves utilised the role
of named-entities in measuring the query sentence relevance in query-oriented extractive
summarisation [171]. Our hybrid approach of integrating named-entities has a fundamental
distinction from the above works where [38] applied lexical matching to obtain the common
named entity counts while researchers in [170] used only entity categorical information. One
obvious limitation in their methods is that the association of highly semantically statistically
related named-entities of different lexical forms and entity types, e.g., UK and London will
be missed. However, our approach assuredly captures the semantic relatedness due to their
high co-occurrences in Wikipedia.
Several other approaches have been employed in the past to summarise multiple documents.
The main methods used to this date for extractive multi-document summarisation include
vector space models (e.g., TFIDF ) [22], Graph-based models [6], Clustering and non-
negative matrix factorization [68], Bayesian Models [172], Manifold-ranking [57] and
Support Vector Regression models [43]. Recently, Canhasi and Kononenko [21] proposed a
query-focussed multi-document summarisation approach based on a weighted archetypal
analysis (wAA), a multivariate data representation making use of matrix factorisation and
clustering. They modelled documents and queries as a multi-element graph. Authors stated
that wAA enables simultaneous sentence clustering and ranking [21]. Interestingly, their
paper highlighted the usefulness of WordNet as an underlying semantic resource for multi-
document summarisation tasks. Besides, Luo et al. [162] suggested three focal considerations
of query-focussed summarisation; 1) relevance, 2) coverage and 3) novelty in a probabilistic
modelling framework. In a closely related work, Lu Wang et al. [145] proposed a feature-

148
based query-focussed opinion summarisation entirely built on text similarity metrics. They
designed a submodular function based model in which each of the relevance, coverage and
dispersion (diversity) is a subfunction before combining them into a single objective function.
Shiren et al. [43] participated in the DUC2005 competition with a system based on sentence
similarity and concept links using WordNet. Their system was ranked the first of the 31
systems that participated in the contest in terms of the ROUGE evaluation.
There are some important distinctions between the previous works and our summarisation
approach. Firstly, while most of these studies quantify the query relevance using some form
of statistical similarity measures, e.g., IDF (inverse document frequency) and cosine-
similarity, our work establishes such relationships using supplemented knowledge-based
measures. Secondly, non-noun text tokens of the queries and sentences are mapped to their
equivalent nouns in WordNet taxonomy with the aid of CatVar, Morphosemantic Links and
WordNet relations. Thirdly, we put aside named entity tokens from the rest of the text and
compute their semantic relatedness separately using Wikipedia.
5.7 Summary
In this chapter, we presented a similarity-based framework for extractive query-focussed
multi-document summarisation. The employed similarity measures were enhanced in two
ways; incorporating WordNet with other manually built lexical resources for changing the
PoS of content words, and designing a new named entity relatedness measure based on
Wikipedia entity co-occurance statistics. This is followed by a superfluous experiment where
we classified and extracted 3-typed named-entities from Wikipedia using a simple Infobox-
based algorithm. Its aim was to empirically verify the Wikipedia’s high coverage in named-
entities. The proposed feature-based summariser ranks document sentences based on three
factors: the relevance to the query, the centrality of the sentence and its diversity from other

149
cluster sentences. These factors are modelled on the aforementioned enhanced semantic
similarity measures. We conducted a set of three experiments, named entity extraction from
Wikipedia (Section 5.5.1), an intermediate application of the hybrid approach to the relevant
paraphrase identification problem (Section 5.5.2), and finally the multi-document
summarisation (Section 5.5.3) all using large-scale standard datasets. Experimental results
revealed that the proposed hybrid approach achieves outstanding performance on the
paraphrase identification standard dataset. Similarly, it improves the quality of the produced
multi-document summaries when combined with other lexical and statistical features in
MMR framework using datasets created for the evaluation of automatic multi-document
summarisers. Our findings reaffirm that subsuming non-noun open class words under
derivationally related nouns improves WordNet-based similarity measures. We also found
that the use of the Wikipedia repository for named entity semantic relatedness supplements
WorNet taxonomy in the design of a comprehensive similarity measure.

150
6. SEMANTIC ROLE LABELING WITH WIKIPEDIA-BASED
EXPLICIT SEMANTIC ANALYSIS FOR TEXT
SUMMARISATION
6.1 Introduction
In Chapter 5, we have drawn the conclusion that augmenting the enhanced WordNet
similarity measure with Wikipedia-based named entity semantic relatedness results in a
significant improvement of text similarity determination and extractive multi-document
summarisation. This motivated us to investigate approaches entirely based on Wikipedia as
an external knowledge repository. Following the popularity of Wikipedia as a reliable lexical
resource for different NLP tasks, e.g., word semantic similarity [45], text similarity [46],
named entity disambiguation [47], named entity classification [48], text classification [49],
and text clustering [50], some researchers of automatic text summarisation have opted for the
encyclopedia as their favorite lexical resource [15, 51-53]. This is primarily due to its high
coverage of domain-independent regularly updated world knowledge.
In this chapter, we will investigate the feasibility of Wikipedia-based Explicit Semantic
Analysis with Semantic Role Labelling for text summarisation. Semantic role labelling (SRL)
is a shallow semantic parsing in NLP which identifies the semantic arguments associated
with the predicate verbs of a sentence. It classifies the semantic roles of syntactic arguments
within a given frame of the sentence and with respect to the predicate. On the other hand,
Explicit Semantic Analysis (ESA) is a semantic interpretation technique used to determine
the relatedness between two text fragments based on vector space model. The motivations for
the use of the SRL-ESA based summarisation proposal include the following. Traditional
knowledge-based approaches for text summarisation employ scoring functions, which are
either based on statistical information from iterative word pairing or similarity information
CHAPTER 6

151
from maximal word comparisons (see Chapter 5). Such conventional approaches have been
widely used in text summarisation [13, 39, 40], but suffer from some pitfalls which include
the following:
1. They fail to consider word syntactic order and semantic roles, which consequently
undermines the accuracy of the computed similarity leading to poor scoring functions
for summary extraction.
2. At the word similarity level, each word is dealt with in isolation and without
considering the context from which it was taken. This overlooks significant semantic
information conveyed by these words if associated with their roles when analyzing
them semantically.
3. Since every word of each sentence is to be compared with every other word of the
partner sentence, the complexity of similarity computation algorithm goes up with
increasing sentence length.
4. In the case of substantially implemented knowledge-based measures e.g., WordNet,
there is a part-of-speech boundary, which limits word comparability and a full
semantic exploitation of the given text as addressed in Chapter 4.
5. There is a limited coverage of named-entities in both language corpora and lexical
knowledge-bases, e.g., WordNet, as covered in Chapter 5.
The above limitations allude to the need to investigate new solutions. One possible solution is
to leverage Wikipedia as a knowledge repository due to its strengths of high coverage, and its
up-to-date information [45]. Semantic role labeling is also used to address the issues of
decontextualization, lack of consideration for semantic roles and syntactic order. It also
enriches the semantic representation of graph-based summarisation model as will be
152
discussed in Section 6.5.3 and Section 6.6.3. Although we have addressed limitations 4 and 5
in the previous chapters, our current SRL-ESA based approach is an attempt to
simultaneously address all limitations where the corresponding semantic arguments of the
compared sentences are projected to Wikipedia concepts. The SRL-ESA based approach
accommodates different summarisation tasks as follows:
1. It uses a feature-based extractive framework, which scores and ranks sentences
according to some composite scoring function in conjunction with the relatedness of
the corresponding role-based concepts for query-focussed multi-document
summarisation. The highest ranked sentences are then extracted to represent the
source document(s). The model searches for an optimum composite scoring function
with a tuned feature set.
2. As for a generic single document and topic-focussed multi-document summarisation,
the methodology constructs a semantic representation of document(s) using a
weighted undirected graph, where sentences are represented as vertices and intra-
sentence similarities are the edge weights between vertices. Then, sentences are
ranked using the well-known Pagerank algorithm [58]. The highest ranked sentences,
according to the importance of their respective graph vertices, are selected and fused
as a summary.
The contributions of this chapter are as follows:
First, we unified each cluster of multiple documents into a single cluster file
containing less redundancy. This is done by merging cluster files sequentially and
iterating over flattened cluster sentences while removing every sentence with a
similarity score above a predefined threshold with the current sentence. This step
minimizes repeated information across original documents and reduces cluster sizes
for subsequent processing.

153
Second, we utilise semantic role labeling to build a semantic representation of
document sentences and then pair matching semantic roles for any two texts to be
compared before they are mapped to their corresponding concepts in Wikipedia.
Third, a short text semantic relatedness measure is designed based on the Wikipedia
concepts interpreted from pairs of corresponding semantic arguments. Next, the
semantic arguments are extracted from sentence-query or sentence-sentence pairs.
Then, the computed score is used as a component of a scoring function for query-
focussed summarisation or as an edge weight for the graph-based generic single
document (SDS) and multi-document (MDS) summarisations.
Fourth, we have implemented two versions of the SRL-ESA based summarisation
system; a feature-based query-focussed multi-document summariser and a graph-
based generic single and multi-documents summariser. This ensures that the approach
combines the advantages of graph and feature based summarisation models.
Fifth, both implementations were evaluated on standard datasets from the relevant
Document Understanding Conference (DUC)32
, which fully demonstrate the
feasibility and superior performance of the proposal.
6.2 Applied Techniques for Semantic Analysis
6.2.1 Semantic Role Labelling
Semantic role labeling (SRL) is a technique for sentence-level semantic analysis. It segments
the text and identifies the semantic role of each syntactic constituent word with reference to
the predicate verbs of a sentence. Semantic roles are the basic units of a semantic frame
which is a collection of facts that specify “characteristic features, attributes, and functions of
a denotatum, and its characteristic interactions with things necessarily or typically
32
DUC was an annually run competition for the evaluation of text summarisation systems by the
National Institute of Standards and Technology (NIST) from 2001-2007 before later changing to the
Text Analysis Conference (TAC) in 2008.

154
associated with it” [173]. Relations between semantic frames and word meanings, as encoded
in the FrameNet lexical database [174], represent the core of Frame Semantics Theory [175].
PropBank [176], another relevant resource, houses a large corpus of human annotated
predicate-argument relations added to the syntactic trees of the Penn Treebank. The basic
concept of Frame Semantics is that word meanings must be described in relation to semantic
frames.
Sentence semantic parsing is a fundamental task that has a large number of immediate NLP
applications including text summarisation [34], plagiarism detection [112], and information
extraction [177]. With the help of human annotated resources such as ProbBank [176] and
FrameNet [174], the development of automatic systems for the identification of semantic
roles is a well investigated current research topic in NLP. One of the seminal works about
building automatic semantic role labellers was proposed by Gildea and Jurafsky [178]. Their
system is based on a statistical classifier trained on a hand-annotated dataset from FrameNet.
In the same year, Gildea and Palmer [179] applied their approach on Propbank. Some other
researchers, including [180, 181], exploited machine learning techniques to build semantic
parsers. Recently, Collobert et al. [182] proposed a unified neural network architecture and
learning algorithm which was applied to different natural language processing tasks such as
part-of-speech tagging, chunking, named entity recognition, and semantic role labelling.
Their algorithm learns internal data representations using vast amounts of mostly un-
annotated training data. They have built freely available software called SENNA, which we
used for the prediction of semantic roles in the current work. One of the attractive features of
this tagging system is its good performance in terms of the speed and the minimal
computational requirements.
The primary goal of SRL is to single out all component words that fill a semantic role for a
predicate verb and then assign it the corresponding semantic role tag. It is usually stated that

155
SRL answers the question of basic event structures such as who did what to whom when
where and why. The following sentence exemplifies the labelling of semantic roles.
Example 6.1
John finalized the experiment and reported the findings to the supervisor.
Figure 6.1 shows the semantically parsed sentence in Example 6.1 using the SRL technique,
particularly the Lund Semantic Role Labeler33
. The semantic parser recognises the predicate
verbs and their associated arguments. Core SRL arguments include Agent (aka subject),
Theme (aka direct object), and Instrument, among others. They also include adjunctive
arguments indicating Locative, Negation, Temporal, Purpose, Manner, Extent, Cause,
etc. Figure 6.1 indicates that the example sentence has two verbs: finalized and reported. The
Table 6.1: Verb-arguments pairs for the example in Figure 6.1.
Arguments
Verbs
A0 A1 A2
Finalize John the experiment --
Report John the findings to the supervisor
labels A0, A1 and A2 in the figure indicate the subject, object and indirect object of the
respective verb, in order whilst rolesets of the predicate verbs finalized, and reported are
listed in Table 6.1. The hyphen (–) in the table indicates that the predicate lacks this
argument. One can note that the subject John is a common agent for both verbs.
33
http://barbar.cs.lth.se:8081/parse
Figure 6.1: Example 6.1 semantically parsed with SRL.

156
6.2.2 Explicit Semantic Analysis
Explicit Semantic Analysis (ESA) is a Wikipedia-based technique for computing text
semantic relatedness proposed by Gabrilovich and Markovitch [46]. The ESA procedure
maps text snippets to a vector space containing Wikipedia-derived concepts. The technique
assumes that Wikipedia articles represent natural language concepts and, hence, mapping text
fragments to their accommodating concepts is perceived as a representation of the text
meaning. Formally speaking, ESA constructs an inverted index from the Wikipedia database
and uses that to represent input texts by building ordered and weighted Wikipedia concepts.
This is done by iterating over each token of a text to be interpreted. The actual computation
of the text semantic relatedness is then performed by comparing translated vectors of two
texts using cosine similarity.
Figure 6.2 demonstrates the explicit semantic analysis process. For two natural language
fragments to be compared the semantic interpreter iterates over each word of every text,
retrieves its corresponding entry from the inverted index, and represents the word by the
retrieved vector of concepts weighted by their TF-IDF scores. More formally, if 𝑇 = {𝑤𝑖} is
the input text, 𝐾𝑤𝑖⃗⃗ ⃗⃗ ⃗⃗⃗ is the inverted index entry for word 𝑤𝑖 where 𝑘𝑤𝑖
represents the strength
of association of 𝑤𝑖 with the Wikipedia concepts set 𝐶 = {𝑐1, 𝑐2, … , 𝑐𝑁} , then the semantic
W1
W2
.
W1
Weighted
Wikipedia
concepts/
articles
Weighed Inverted Index
Text1
Semantic
Interpreter
Text2
Vector
Comparison
Relate
dness
score Building
inverted
index from
Wikipedia
Weighed
Vector
Wikipedia
concepts
Figure 6.2: Explicit Semantic Analysis.

157
interpretation for T is the vector 𝑉 = {𝑣1, … 𝑣𝑁}. Each element in V quantifies the association
of the corresponding concept 𝑐𝑗 to the text T, which is defined as ∑ 𝑡𝑓. 𝑖𝑑𝑓𝑤𝑖. 𝑘𝑤𝑖
.𝑤𝑖∈𝑇 The
TF-IDF (term frequency- inverse document frequency) is one of commonest weighting
schemes in information retrieval [141]. It calculates the weight of a word as per expression
(6.1).
𝑡𝑓. 𝑖𝑑𝑓(𝑤, 𝑑) = 𝑡𝑓𝑤 ,𝑑 . 𝑙𝑜𝑔𝑁
𝑛𝑤 (6.1)
Where 𝑡𝑓𝑤 ,𝑑 is the frequency of word w in document (article) d, 𝑛𝑤 is the number of
documents in which w occurs, and N is the number of documents in the text collection (size
of English Wikipedia articles in our work). Once the text T is mapped to its corresponding
Wikipedia concepts vector, the final stage of the ESA process is to compute the semantic
relatedness. In other words, if T1 and T2 are two text fragments, their semantic relatedness,
Rel(T1, T2), is computed by comparing their respective vectors; V1 and V2 as in expression
(6.2).
𝑅𝑒𝑙(𝑇1, 𝑇2) = 𝑽𝟏. 𝑽𝟐
||𝑽𝟏||||𝑽𝟐|| (6.2)
ESA has been used for various NLP tasks such as text categorisation [183] and information
retrieval [184].
6.3 SRL-ESA Based Summarisation Model
6.3.1 Overview
The use of Semantic Role Labelling with Wikipedia-based explicit semantic analysis for text
summarisation is intended to improve the sentence scoring functions for feature-based query
summarisation and document similarity graphs for graph-based summarisation.

158
This is achieved by observing several considerations, as pointed out previously, when
assessing the semantic relatedness and similarity between short text segments. As shown in
Figure 6.3, SRL-ESA based summarisation can be divided into four implementation stages.
In the first stage, pre-processing tasks are carried out. This includes cluster merging for multi-
document summarisation, where documents of each cluster are combined to form a single
cluster document as described in the next section. The second stage represents the application
of semantic parsing, identification of semantic frames, selection of common semantic roles
between sentence-query or sentence-sentence pairs, and the collection of all words filling the
Figure 6.3: SRL-ESA based summarisation model.
Single-document Multi-documents Query
Pre-processing
Semantic Role Labeling
Building Role-based Term Vectors
Role-Term Vectors to Wikipedia Concept Vectors
Comparing Concept Vectors
Query-focussed multi-doc
summarisation
Generic multi-doc and single-
doc summarisation
Summary
MySQL DB
Inverted
index file
Indexing
159
same semantic role for the query/sentence to build role-term vectors. In the third stage, role-
term vectors are semantically interpreted to their corresponding Wikipedia concept vectors.
This is then followed by the estimation of the semantic relatedness between concept vectors.
In the final stage, we apply the technique to the summarisation task by computing the intra-
sentence semantic associations for graph-based generic single and multi-documents, and
extracting query-dependent & query-independent sentence semantic features for feature-
based query-focussed multi-documents. From Figure 6.3, particularly in the third stage, an
inverted index file is used to map role-term vectors to their corresponding Wikipedia
concepts. The final index is built from the 5th
February 2015 Wikipedia dump.
Gabrilovich pre-processed the English Wikipedia dump of 11 November 200534
. However,
that old data could not be used for this work since Wikipedia has more than tripled since that
time. As such, we pre-processed the Wikipedia Dump of 5th
February 2015 with an original
XML size of 11.6 GB (cf. 3.5 GB for 11 November 2005 XML Dump). Our pre-processing
is built on the Wikipedia Pre-processor (Wikiprep) [46, 183]. Furthermore, we separated each
Wikipedia article into three parts: the title (concept), the text (description), and embedded
hyperlinks before indexing. For the creation of the inverted index, we adapted Apache
Lucene35
, a publicly available information retrieval library. Although Lucene was initially
started as a Java exercise by Doug Cutting in 1977, it is adopted by most of today’s popular
websites, applications, and devices including Twitter, and LinkedIn36
. The inverted index file
maps words to accommodating weighted Wikipedia concepts to be used for text to concepts
semantic interpretation as will be discussed soon. Finally, the generated inverted index file is
stored in MySQL database for convenient and fast access during the experimental evaluation.
34
http://www.cs.technion.ac.il/~gabr/resources/code/wikiprep/wikipedia-051105-preprocessed.tar.bz2. 35
http://lucene.apache.org. 36
http://wiki.apache.org/lucene-java/PoweredBy

160
6.3.2 Merging Cluster Documents
In a multi-document summarisation, a single representative synopsis is sought from across
many documents that describe the same topic. These documents, which are written by
different authors, are normally taken from different news sources. Unlike single document
summarisation, the process of summarising a collection of related documents poses a number
of other challenges including a high degree of redundancy, which conceivably results from
merging multiple descriptions of the same topic; the inconsistency among the document
collection, and the ordering of the extracted text units from the collection. Therefore, we have
designed a pre-processing stage to mitigate these challenges. Firstly, each cluster of related
documents to be summarised is merged together to form a single text file, called a cluster
document while arranging the entire text in the order of the source documents’ timeline. We
then iteratively removed similar sentences to exclude repeated content. This is done by
finding the similarity of each sentence with the rest of the cluster sentence and removing
those with a similarity score exceeding a certain threshold. This produces a unified cluster
document with minimized information repetition.
More formally, let C = {D1, D2, D3, … DM} be a cluster of M documents to be summarised,
we combine the entire documents’ sentences to obtain a flattened cluster, C = {S1, S2, S3,
S4, S4, S4 … SN}, where N is the total number of cluster sentences. We then apply the filtering
process where we sieve cluster sentences by discarding all highly similar sentences to the
current one. Figure 6.4 describes the cluster merging process. For better visibility and clarity,
the figure indicates outward arrows for S1 only, but the same logic applies to the rest of the
sentences. By this merging, we remove (𝑵 − 𝑲) sentences where (𝑵 ≥ 𝑲). It is worth
reiterating that this cluster unification step does not apply to the SRL-ESA based single
document summarisation.

161
6.3.3 Computing SRL-ESA Based Semantic Similarity
The fundamental building block of our summarisers is the determination of the role-based
semantic similarity for query relevance, intra-sentence similarity, and redundancy avoidance.
To calculate the semantic similarity, we first pre-process documents by merging each
collection of related documents (multi-document summarisation only) and then segment both
single and multi-documents into sentences. Next, we constructed the semantic representation
of each sentence by parsing it with semantic role labelling software. This semantic parsing
aims at discovering semantic frames and associated arguments for each document sentence.
The semantically parsed sentences are then formatted to a custom template for subsequent
processing.
For exemplification, consider Example 6.2 of highly semantically related sentences.
S1 S2 S3 S4 SK
D3 D2 D1 DM
S1 S2 S3 S4 S5 S6 SN
Figure 6.4: Merging cluster documents with redundancy removal.

162
Table 6.2: Semantic role arguments.
Core Arguments Non-core Arguments
Label Modifier Label Modifer
V Verb AM-DIR Direction
A0 Subject AM-ADV Adverb
A1 Object AM-LOC Location
A2 Indirect Object AM-TMP Temporal marker
A3 Start Point AM-MNR Manner
A4 End Point AM-DIS Discourse marker
A5 Direction AM-PRP Purpose
-- -- AM-NEG Negation
-- -- AM-EXT Extent
-- -- AM-PNC Proper noun
Example 6.2
S1: FIFA is accused of corruption.
S2: FIFA is being officially investigated for corruption.
Figure 6.5 (A) and (B) illustrate the example sentences parsed with the Lund Semantic Role
Labeling Demo [185]. As shown in the figure, the semantic parsing identifies the predicate
verbs of each sentence. In this case, each sentence has a single predicate verb, accuse for
sentence 1 and investigate for sentence 2, and hence one primary semantic frame each. The
role set of each predicate is classified according to the semantic roles they sit with respect to
the verb. With this respect, three arguments, namely, A1 (direct object), A2 (indirect object)
Figure 6.5: Sentence 1 (A) and Sentence 2 (B) semantically parsed with SRL.
A
B

163
and AM-MNR (manner) are identified in both sentences. Table 6.3 shows a breakdown of
both sentences in Example 6.2 into semantic frames indicating the semantic role that each
token fills in the predicate.
Table 6.3: Tokenised Example 6.2 sentences with their predicates and semantic role tags.
S1 predicates and semantic arguments S2 predicates and semantic arguments
Terms Predicates Role Tags Terms Predicates Role Tags
FIFA
is
accused
of
corruption
.
--
--
accused
--
--
--
A1
0
V
B-A2
E-A2
0
FIFA
is
being
officially
investigated
for
corruption
.
--
--
--
--
investigated
--
--
--
A1
0
0
AM-MNR
S-V
B-A2
E-A2
0
6.3.3.1 Role-Term Tables
Formally speaking, let S1 and S2 be two sentences consisting of semantic frames f1 and f2
respectively. Let 𝑅1 = {𝑟1, 𝑟2, … , 𝑟𝑘} and 𝑅2 = {𝑟1, 𝑟2, … , 𝑟𝑙} be the semantic role sets
associated with f1 and f2 where k, and l are the numbers of arguments in the semantic frames.
From the two role sets of the semantic frames, we select the common roles, 𝑅𝑐 =
{𝑟1, 𝑟2, … , 𝑟𝑚}, co-occurring in both sentences. All other unshared semantic roles are
discarded from the calculation of the semantic similarity. This is because we believe that an
accurate similarity can be captured by comparing the semantic arguments corresponding to
matching semantic roles. Having identified all shared semantic roles, the next step of our
similarity computation involves building a Role-Terms Table for each sentence. The Role-
Terms Table is a table that lists all shared semantic roles along with their related term
vectors. For instance, if we assume that TV = {WV1i, WV2i … WVmi } are term vectors
related to the semantic roles {r1, r2, … rm} of sentence i, the Role-Terms Table can be
constructed as:

164
Table 6.4: Role-terms table.
Semantic Roles Term Vectors
R1 WV1i
R2 WV2i
Rm WVmi
Returning to the pair of sentences in Example 6.2 for further elaboration and organising the
data in Table 6.3, we can come up with a list of role-term pairs as in Table 6.5. The table
shows argument terms of the shared roles for the example sentences after normalizing tokens,
removing the noise (stop) words, and leaving semantic content words. Since there are few
words in the example pair, we created a single Role-Terms Table for both sentences.
Table 6.5: Role-term(s) -common semantic roles and their corresponding term vectors.
Role (Arg.) label Sentence 1 argument terms (WVi1) Sentence 2 argument terms (WVi2)
V Accuse Investigate
A1 FIFA FIFA
A2 corruption Corruption
6.3.3.2 Terms to Concepts Interpretation
Once Role-Terms Tables are constructed, the next step of our SRL-ESA based semantic
similarity calculation is to translate the argument terms to their corresponding Wikipedia
concepts. This is aided by a pre-built inverted index file containing a mapping of English
content words to a weighted vector of hosting natural concepts derived from the English
Wikipedia. Continuing from our previous discussion, we interpret the Role-Terms Table to a
table of concept vectors where each concept vector replaces argument terms filling the same
semantic role. If 𝑊𝑉𝑖𝑗 represents the argument term(s) of role 𝑖 from sentence 𝑗, it translates
to 𝐶𝑉𝑖𝑗, the weighed vector of Wikipedia concepts corresponding to 𝑊𝑉𝑖𝑗.

165
Table 6.6: First 5 Wikipedia concepts of each argument term(s) in Sentence 1.
(A) Argument term: accuse
Wikipedia ID# Concepts TF*IDF Weight
41941281 Man Accused 0.7186557651
22544670 Criminal accusation 0.64798426628
3370479
18128311
26278955
List of charities accused of ties to terrorism
Accusing Evidence
I Accuse
0.4180444181
0.38470098376
0.3645495474
(B) Argument term: FIFA
Wikipedia ID# Concepts TF*IDF Weight
11052
28698793
36954065
22818470
5531201
List of presidents of FIFA
2021 FIFA Confederations Cup
Lee Min-hu
List of official FIFA World Cup films
2006 FIFA World Cup Group F
0.9060152769
0.89785248041
0.88642716408
0.75978928804
0.7028101683
(C) Argument term: corruption
Wikipedia ID# Concepts TF*IDF Weight
20055663
2110801
25239439
3174020
66241
Prevention of Corruption Act
Corruption (linguistics)
Corruption in the United States
Corruption Perceptions Index
Transparency International
0.5399063230
0.5140590668
0.4959531128
0.45036080479
0.4280707538
Table 6.7: First 5 Wikipedia concepts of each argument terms in Sentence 2.
(A) Argument term: investigated
Wikipedia ID# Concepts TF*IDF Weight
3634121 Investigative Reporters and Editors 0.5345352292
11917620 United States House Energy Subcommittee on
Oversight and Investigations
0.4757126868
11676740
43032911
5236980
Crime & Investigation Network
Special Investigations
Criminal investigation
0.45890626311
0.45019975305
0.42023929954
(B) Argument terms: FIFA, corruption: see Table 6.6

166
For illustrative purposes, we are returning to Example 6.2 and particularly in Table 6.5 where
we translate argument terms to their equivalent Wikipedia concepts. Tables 6.6 and 6.7 show
the first 5 concepts of each argument terms(s) along with their unique Wikipedia ID numbers
and TF-IDF weights for the first and second sentences in order. Note argument terms FIFA
and corruption have been omitted in Table 6.7 to avoid repetition as their corresponding
concepts are already listed in Table 6.6.
6.3.3.3 Similarity Function
Tables (6.6-6.7) demonstrate the interpretation of the argument terms to hosting weighted
Wikipedia concept vectors. Following this, the next step is to compute the actual semantic
similarity between the two sentences using these representative natural concepts. If
𝑟1, … , 𝑟𝑚 denote the shared semantic roles between the two sentences drawn in Section
6.3.3.2 where 𝑚 is the number of the common roles, we use the Wikipedia concept vectors
translated from the argument terms filling in these semantic roles. More formally, let
{𝐶𝑉𝑘1, … , 𝐶𝑉𝑘𝑖} and {𝐶𝑉𝑙1, … , 𝐶𝑉𝑙𝑖} be the concept vectors interpreted from the argument
terms of the common roles between sentences 𝑘 and 𝑙. The semantic similarity between
sentences 𝑘 and 𝑙 is calculated as the average role similarities (RSim) obtained from the
corresponding shared role sets. This is defined in expression (6.3) where i denotes the shared
roles.
𝑆𝑖𝑚𝑠𝑟𝑙−𝑒𝑠𝑎(𝑆𝑘, 𝑆𝑙) =1
𝑚∑ 𝑅𝑆𝑖𝑚(𝐶𝑉𝑘𝑖, 𝐶𝑉𝑙𝑖)
𝑚
𝑖=1
(6.3)
where 𝑅𝑆𝑖𝑚(𝐶𝑉𝑘𝑖, 𝐶𝑉𝑙𝑖) is computed using individual concepts representing the original
argument terms.
𝑅𝑆𝑖𝑚(𝐶𝑉𝑘𝑖, 𝐶𝑉𝑙𝑖) =∑ 𝑤𝑐𝑗𝑘 ∗ 𝑤𝑐𝑗𝑙𝑗=1
√∑ 𝑤𝑐𝑗𝑘2
𝑗=1 √∑ 𝑤𝑐𝑗𝑙2
𝑗=1
(6.4)

167
In Equation (6.4), 𝑤𝑐𝑗𝑘 represents the tf-idf weight of term j with respect to its corresponding
concept from argument role i of sentence k while 𝑤𝑐𝑗𝑙 is the tf-idf weight of term j with
respect to its corresponding concept from argument role i of sentence l.
Figure 6.6 demonstrates the procedure for calculating the semantic similarity between two
short texts ST1 and ST2. The figure summarises four procedural stages as follows:
1. The first step applies the semantic parsing by using semantic role labelling (SRL). The
input to this stage is a pre-processed short text and the output is a semantically
tagged/parsed text.
Semantic Parsing Semantic Parsing
{𝑟11, 𝑟12, 𝑟13 , … , 𝑟1𝑁} {𝑟21, 𝑟22, 𝑟23 , … , 𝑟2𝑁}
{𝑊𝑉11, 𝑊𝑉12, 𝑊𝑉13} {𝑊𝑉21, 𝑊𝑉22, 𝑊𝑉23}
{𝐶𝑉11, 𝐶𝑉12, 𝐶𝑉13} {𝐶𝑉21, 𝐶𝑉22, 𝐶𝑉23}
ST1 ST2
3
SASR
4
TTC
T
2
IPA
SR
1 SRL
𝑆𝑖𝑚(𝑆𝑇1,𝑆𝑇2) =
1
𝑚∑𝑅𝑆𝑖𝑚(𝑊𝑉𝑘𝑖 𝐶𝑉𝑙𝑖)
Figure 6.6: SRL-ESA based semantic similarity computation for short texts.

168
2. Secondly, the predicate verbs for the texts are detected together with their semantic role
sets. Therefore, this stage is called Identification of Predicates and Associated Semantic
Roles, shortly abbreviated as IPASR.
3. Our process recognises that all semantic roles are not shared in typical short texts and
selects the arguments of common semantic roles in the third stage. This is referred to as
Selecting Arguments of Shared Roles (SASR) with the assumption of three shared roles.
4. The final stage translates all grouped argument terms to their corresponding weighted
Wikipedia concepts before carrying out the actual similarity calculation. This stage is
known as Terms to Concepts Translation, or TTCT.
6.3.4 Generic Single and Multi-document Summarisation
The SRL-ESA based generic single document and multi-document summarisations have been
implemented using an iterative graph-based ranking algorithm. Firstly, for multi-document
summarisation, documents of each cluster were merged to form a single cluster document as
explained previously. Having transformed all clusters to a single cluster document, we now
treat multi-documents as a single document. In the next step of the process, every document
is represented by a weighted undirected graph where the nodes (vertices) are the sentences of
the document and the connections between the sentences (edges) are the semantic similarities
between them. The similarities are calculated using the SRL-ESA based measure discussed in
Section 6.3.3. It is worth noting that in some rare cases the sentences without predicate verbs
are not included in the graph representation. This is because the SRL-ESA based measure
cannot be applied to such sentences as they do not contain semantic frames. To extract a
representative summary for a text document, we combine the SRL-ESA based similarity
measure with a ranking algorithm in order to make use of the document’s graph structure in
computing the rank of each sentence with respect to the rest of the document sentences. The
following section gives a brief explanation of the adapted ranking algorithm.

169
6.3.4.1 PageRank Algorithm
PageRank [186] is an algorithm designed for Search Engine Optimisation (SEO). Precisely,
PageRank is defined as a measure of relative importance that computes the ranking of each
webpage in the affinity of the graph of the World Wide Web. The algorithm was named after
Larry Page, one of the founders of Google, and used by the giant search engine to rank
websites in the returned search results [58]. In simple terms, PageRank is the number of web
pages with incoming links to a given website and the importance of these links. For instance,
Figure 6.7 shows a network of four webpages A, B, C and D where A and B divide their
ranks (the numbers in square brackets) between C and D via their outgoing links. In the
figure, D has two incoming links and one outgoing link.
More formally, let 𝑝𝑖 be a webpage being pointed to by another page, 𝑝𝑗. If we assume that
𝐼𝑛(𝑝𝑖) and 𝑂𝑢𝑡(𝑝𝑗) are the total numbers of incoming and outgoing links for pages 𝑝𝑖 and
𝑝𝑗 respectively, then the PageRank for page 𝑝𝑖, 𝑃𝑅(𝑝𝑖), is computed according to the
following formula:
𝑃𝑅(𝑝𝑖) = 1 − 𝜆
𝑁+ 𝜆 ∑
𝑃𝑅(𝑝𝑗)
𝑂𝑢𝑡(𝑝𝑗)𝑝𝑗∈𝐼𝑛(𝑝𝑖)
(6.5)
2
17 A
[25]
C
[11]
D
[3]
B
[6] 2
Figure 6.7: A simple illustration for PageRank ranks transfer.

170
Where 𝑁 is the total number of pages and 𝜆 is the probability that an internet surfer will
continue navigating to other pages randomly, known as a damping factor. The recommended
value for 𝜆 is 0.85 but can be set to any number between 0 and 1. From equation (6.5), the
algorithm is recursive and will continue computing the page ranks until a steady state is
reached.
6.3.4.2 Ranking Sentences with PageRank Algorithm
Although we used sentence-based graph representation in the actual implementation, we
profited from semantic links under sentence level, logically modelling each sentence as
multi-node vertex representing concept vectors of the semantic arguments. Scores computed
at the argument concept node level are then averaged to form a sentence to sentence link
scores. Figure 6.8 shows the semantic argument representation (A) for the similarity
computation and sentence level similarity graph (B) for sentence ranking.
Figure 6.8: Semantic argument level (A) and sentence level (B) document similarity graphs.
Once we have built a graph representation of the documents, we applied the PageRank
algorithm to rank and identify the most important document sentences to be extracted as a
summary. In the context of applying PageRank to text summarisation, we rank document

171
sentences instead of web pages, hence sentences play the role of webpages. For a document
graph, intra-sentence semantic similarities take the place of incoming and outgoing links in
the computation of sentence ranks. The rank of each sentence indicates its salience which
depends on the number and the importance of semantic links connecting each sentence to the
rest of the document sentences. In other words, sentences with strong connections (high
semantic similarities) are more likely to be candidates for summary inclusion than those with
many weak connections (low similarities). The edge weight (W) between two vertices in the
similarity graph is the semantic association between the two sentences, S1 and S2, and is
computed as in expression (6.6) for the generic multi-documents summarisation:
𝑊𝐺𝑒𝑛𝑀𝑢𝑙𝑡𝑖𝑑𝑜𝑐(𝑆1, 𝑆2) = 𝑆𝑖𝑚𝑠𝑟𝑙−𝑒𝑠𝑎 (𝑆1, 𝑆2) (6.6)
Edge weight for single document summarisation is measured in a slightly different way by
considering the similarity between each sentence with the title. This is because each
document in the single document summarisation dataset has a unique title. We believe that
having a high semantic association with the document title contributes to stressing the
importance of a given sentence in that document. From this understanding, edge weights for
single document graphs are formulated as per relation (6.7):
𝑊𝑆𝑖𝑛𝐷𝑜𝑐(𝑆1, 𝑆2) = 𝑆𝑖𝑚𝑠𝑟𝑙−𝑒𝑠𝑎 (𝑆1, 𝑆2) + 0.5(𝑆𝑖𝑚𝑒𝑠𝑎 (𝑆1, 𝑇) + 𝑆𝑖𝑚𝑒𝑠𝑎 (𝑆2, 𝑇)) ( 6.7)
where T is the document title and 𝑆𝑖𝑚𝑒𝑠𝑎 (𝑆1, 𝑇) is the similarity between the title T and
sentence 𝑆1 based on ESA only. The reason why the title-sentence similarity is built on ESA
only is due to the nature of most document titles which lack predicate verbs and semantic
frames.
For illustration, we will use a short document of 5 sentences (Figure 6.9) taken from the
cluster ID: d109h of the DUC2002 dataset. The document ID is FBIS4-26327.

172
Document ID: FBIS4-26327 , Cluster ID: d109h, Dataset: DUC2002
Sentence
Number
Sentence Text
1 (S1) BFN Text Guangzhou, 19 Jun XINHUA -- Jiang Zemin, general secretary of the
CPC Central Committee Political Bureau and chairman of the Central Military
Commission, and Li Peng, premier of the State Council, are very much
concerned about floods in Guangdong Province.
2 (S2) Recently, they repeatedly inquired about the flood situation in the Zhu Jiang
valley, particularly that of Bei Jiang and Xi Jiang.
3 (S3) They expressed their deep concern for the people in the flood-hit areas, as well as
extended their warm greetings to the vast number of cadres, officers, and men of
the People's Liberation Army; armed police officers; and public security police
who battle on the frontline against floods and provide disaster relief.
4 (S4) Jiang Zemin and Li Peng gave important directives for current flood prevention
and disaster relief tasks in Guangdong.
5 (S5) They expressed the hope that under the leadership of the Guangdong provincial
party committee and government, the Guangdong army and people would make
concerted efforts in disaster relief; earnestly help flood victims solve their living
problems; and go all out to battle floods to ensure the safety of the Bei Jiang
dike, Guangzhou city, and the Zhu Jiang Delta.
Figure 6.9: A sample document to be summarised.
0.20162 [+31395]
0.2
0411
[+0.1
6905]
0.00466 [+0.1795]
0.1
2218
[+0.3
244]
𝑆2 𝑆3
𝑆5 𝑆4
Figure 6.10: Sentence similarity graph for document FBIS4-26327.

173
Having pre-processed the document, we then performed semantic parsing where we found
the first sentence does not contain a predicate verb (or semantic frame) and hence is excluded
from further processing. There is a clear relationship between the sentence not having a
predicate verb and its coherence with the rest of the document sentences. At a glance, one can
see that sentence 1 primarily describes positions of entities. This leaves the document with
only four sentences (2-5) to be summarised. Figure 6.10 shows the sentence similarity graph
of the remaining four sentences. The numbers in the square brackets preceded by the plus are
the average title similarities, which mean that the edge weight is the sum of the intra-sentence
similarity and title similarity as indicated in equation (6.7). Figure 6.11 shows the same
graph with the final sentence ranks in brackets after running the PageRank algorithm for 20
iterations.
From the given sentence ranking scores in Figure 6.11, the document sentences are ranked
according to their importance as (5, 4, 3, 2) with the most and least salient sentences being
the fifth and the second respectively. For the summary generation, the highest ranked
sentences of not more than the required summary length are selected as a summary.
[1.0356]
0.51557
0.3
7316
0.18416
0.4
4658
𝑆2 𝑆3
𝑆5 𝑆4
[0.9499] [0.9351]
[1.0794]
Figure 6.11: Sentence similarity graph for document FBIS4-26327 with sentence ranks
after 20 iterations.

174
Applying the summary length limit of 100 words, the extracted summary, which is given in
Figure 6.12, comprises of sentences 5 and 4 and part of sentence 3.
They expressed their deep concern for the people in the flood-hit areas, as well as extended
their warm greetings to the vast number of cadres, officers, and men of the People's
Liberation Army; armed police officers; and public security police who battle on the frontline
against floods and provide disaster relief. Jiang Zemin and Li Peng gave important directives
for current flood prevention and disaster relief tasks in Guangdong. They expressed the hope
that under the leadership of the Guangdong provincial party committee and government, the
Guangdong army and people would make concerted efforts in disaster relief; earnestly help
flood victims solve their living problems.
Figure 6.12: Extracted summary from the example document: FBIS4-26327.
6.3.5 Query-focussed Multi-document Summarisation
The problem of query-focussed multi-document summarisation, in this context, can be
defined as follows. Given a set of document clusters where each cluster, 𝐶𝑖, is merged and
flattened to form N sentences, 𝐶𝑖 = {𝑠1, 𝑠2, 𝑠3 … , 𝑠𝑁}, we want a subset summary S,
𝑆 ⊆ 𝐶𝑖 , that maximizes the scoring function 𝐹𝑖 , query relevant (QR) and has the highest
cluster coverage (ℎ𝐶𝐶𝑖); 𝑆 = 𝐴𝑟𝑔max𝑠𝑖
{𝐹𝑖|𝑠𝑖, 𝑊ℎ𝑒𝑟𝑒 𝑠𝑖 𝑖𝑠 𝑄𝑅 𝑤𝑖𝑡ℎ ℎ𝐶𝐶𝑖 }.
Table 6.8: Sentence ranking features for SRL-ESA based Qf-MDS.
Query-dependent features Query-independent features
Feature Notation Feature Notation
Query Similarity QS Sentence Centrality SC
Title Similarity TS Position P
Query Cosine Similarity QCS Centroid C
Named Entity Overlap NEO Sentence Length L
Query Terms Overlap QTO -- --
Our SRL-ESA based Qf-MDS approach is achieved by the combination of the 8 features in
Table 6.8. The scoring features are of two categories, query-dependent and query-
independent. Using these features, we ensure that the issues of relevance and coverage are
properly considered in ranking cluster sentences and extracting the summary. In addition, the

175
most pressing issue of redundancy for multi-document summarisation is addressed in two
stages, in the cluster merging and in the convex combination of the features by the re-use of
the MMR algorithm (see Section 5.4.1, Chapter 5).
6.3.5.1 Query Dependent Features
Query-dependent features involve a semantic and lexical comparison between the queries and
the cluster sentences. We used five different query-dependent features to determine query
relevance: Query Similarity, Title Similarity, Named Entity Overlap, Query Cosine
Similarity, and Query Terms Overlap. The last two features are primarily used to extract
baseline summaries. The core for this class of features, and for the entire set of scoring
features, are the Query Similarity and Title Similarity, both which are derived from
Wikipedia concepts. The Named Entity Overlap feature has been re-used from Chapter 5 and
is as determined by Equation 5.12 (see Section 5.4.2.1, page 122). The other four features are
briefly defined below.
Discuss the prevalence of steroid use among female athletes over the years. Include
information regarding trends, side effects and consequences of such use.
Figure 6.13: A sample query.
Query Similarity
The query relevance (QR) is the heart of the query-focussed summarisation. The QR of
sentences is assessed in terms of their semantic relatedness with the query. Query Similarity
is the semantic association between the natural concept vectors of the query (Q) and each
cluster sentence. It is the core feature of the scoring function and applies the SRL-ESA based
metric discussed earlier. If we think about the query-focussed summarisation as a question
answering problem where the answer is the summary, the query is a question that expresses a
user’s information need. Figure 6.13 gives an example of a query for the cluster D0602B of
the DUC2006 dataset. The Query similarity is computed as in expression (6.8),

176
𝑆𝑖𝑚𝑞𝑢𝑒𝑟𝑦 (𝑄, 𝑆𝑖) = 𝑆𝑖𝑚𝑠𝑟𝑙−𝑒𝑠𝑎(𝑄, 𝑆𝑖) (6.8)
where Q and 𝑆𝑖 are the query and sentence i, respectively.
steroid use among female athletes
Figure 6.14: Example title.
Query Term Overlap (QTO)
QTO computes the lexical overlap between the query (Q) and every cluster sentence 𝑠𝑖. It is
used as a component feature to visualize its effect and primarily acts as a baseline feature.
The aim of including this feature in the scoring is to give preference to sentences with lexical
co-occurrence with Q. If we assume |𝑄| to be the cardinality of the query terms and |𝑠𝑖| to be
the number of words in the 𝑖𝑡ℎ sentence, the QTO is computed as per expression (6.9).
𝑄𝑇𝑂(𝑄, 𝑠𝑖) = |𝑄| ∩ |𝑠𝑖|
|𝑄| ∪ |𝑠𝑖| − |𝑄| ∩ |𝑠𝑖| (6.9)
Title Similarity
The title of a document describes its content in a compact form. Therefore, we think that a
candidate summary sentence needs to be semantically related to the title. The Title Similarity
is a feature designed to capture this relatedness. It computes semantic association between
Wikipedia concepts translated from the cluster title and those of the cluster sentences. Unlike
the query and sentences, the title comprises of noun phrases lacking semantic frames due to
the absence of predicate verbs (see the example title in Figure 6.14). As such, we
straightforwardly computed the similarity from Wikipedia concepts regardless of semantic
roles. In other words, we do not apply semantic role labelling to cluster titles. If we let T be
the title and 𝑠𝑖 to be sentence i, the Title Similarity for sentence 𝑠𝑖 is computed as:
𝑆𝑖𝑚𝑡𝑖𝑡𝑙𝑒(𝑇, 𝑠𝑖) = 𝑆𝑖𝑚𝑒𝑠𝑎(𝑇, 𝑠𝑖) (6.10)

177
Query Cosine Similarity (QCS)
The QCS feature computes cosine similarity between the query and sentence terms. It
supplements the QTO feature in forming a baseline summariser. If we let �⃗⃗� and 𝑠𝑖⃗⃗⃗ to be
term vectors for the query and sentences, the QCS is formulated as in equation (6.11),
𝑄𝐶𝑆(𝑄, 𝑆𝑖) =∑ 𝑞𝑖𝑠𝑖𝑖=1
√∑ 𝑞𝑖2
𝑖=1 √∑ 𝑠𝑖2
𝑖=1
(6.11)
where 𝑠𝑖 (resp. 𝑞𝑖) is the TF-IDF weight for word 𝑤𝑖, in document 𝑑𝑘 for the sentence
(resp. query).
6.3.5.2 Query Independent Features
Members for this category of features are the centrality, the centroid, the length and the
position of the cluster sentences. The first two features define the sentence semantic coverage
in the cluster and remains as defined in the previous chapter (see Section 5.4.2.2, Chapter 5).
Sentence Length (L)
When you aim to extract a length restricted summary, particularly by the number of words, a
sentence length cut-off is a focal feature. If the extracted summary consists of very short
sentences, they may not convey enough content which therefore undermines the summary
quality. In contrast, much longer sentences contain high word proportions and will quickly
take the word count to the maximum permitted summary length. To achieve a trade-off
between the two extremes, we used a sentence length of 10 words, where possible. In other
words, sentences containing a high end of no more than 10 words are encouraged to be part
of the summary. The length of sentence 𝑖, 𝐿 (𝑠𝑖), is the number of terms in it.
𝐿 (𝑠𝑖) = |𝑠𝑖| (6.13)

178
Sentence Position (P)
In some discourse texts, such as news articles, documents are structured such that sentences
at the beginning of the document or at the start of each paragraph convey very important
content about the document/paragraph. Since our evaluation datasets are mainly collected
from news sources, we included this feature in our scoring function. The positional feature
values are assigned to document sentences such that the first sentence receives the highest
score followed by the rest in a decreasing pattern. The feature value is calculated as the
reciprocal of the sentence number (𝑁(𝑠𝑖)) in the document, as given in expression (6.14).
𝑃 (𝑠𝑖) =1
𝑁 (𝑠𝑖) (6.14)
6.3.5.3 Ranking Sentences and Extracting the Summary
The objective of the SRL-ESA based query-focussed summarisation is to score and rank
cluster sentences. The highest ranking sentences according to the composite scoring function
are selected as a representative summary of each collection of documents. In this case, a
scoring function (Expression 6.15) is designed such that it computes the final sentence score
by linearly combining weighted scores of a selected combination from the 8 different
mentioned features.
𝑆𝑐𝑜𝑟𝑒(𝑠𝑖) = ∑ 𝑤𝑓𝑗𝑓𝑗(𝑠𝑖)
𝑛
𝑗=1 (6.15)
Here, 𝑠𝑖 denotes the 𝑖𝑡ℎ sentence, 𝑤𝑓𝑗 is the weight given to feature 𝑓𝑗(𝑠𝑖) and 𝑛 is the
number of aggregated features. Various feature combinations and feature weights were used
in the experiments as will be detailed in following sections. Finally, the MMR ranking
algorithm has been applied for the final ranking. When all cluster sentences are completely
ranked, we select the top ranked m sentences that satisfy the summary length restriction.

179
6.4 Experiments
In this section, we present our experiments conducted on some DUC datasets and the results
obtained through these experiments while highlighting improvements over benchmark
methods and related works. We also investigate the influence of some parameters such as the
feature weights and data sizes on the effectiveness of our proposal.
6.4.1 Evaluation Datasets
In this chapter, we used the DUC2002 and DUC2006 datasets for the evaluation of our
systems. For testing and validating generic multi-document and single document
summarisation, we used 21 clusters (D061j, D062j, D064j, D065j, D066j, D067f, D068f,
D070f, D071f, D072f, D074b, D075b, D076b, D077b, D079a, D080a, D081a, D083a,
D108g, D109h, D113h) consisting of 160 documents from the DUC2002 corpus. These sets
are semi-randomly selected mainly from the first half of the DUC2002, a standard publicly
available collection of documents initially created for testing single and multi-document
summarisation systems in the Document Understanding Conference (DUC). The entire
collection contains 60 sets of about 10 documents each. In addition, every document cluster
comes with a model summary of various lengths, which are either created or extracted by
human experts to serve as reference summaries. The DUC2006 dataset, by comparison, is
designed for the performance assessment of automatic query-focussed multi-document
summarisation system. This experimental data has been applied to the hybrid approach
proposed in Chapter 5 (see Section 5.5.3.3 for a brief description of this corpus).
6.4.2 Experiment 1: Query-based Summarisation
As a first step in testing and evaluating the system, we merged the set of documents in each
DUC2006 cluster. This yielded a unified cluster document in which all highly similar
sentences are reduced to a single representative sentence. Figure 6.15 shows DUC2006
cluster sizes before and after merging. It can be seen that the original document sets have

180
varying numbers of sentences ranging from around 160 sentences to over 1300. The figure
also indicates that larger document sets tend to have more information redundancy than the
smaller clusters. Through this initial stage similarity filtering, we managed to reduce cluster
sizes to speed up subsequent processing and removed redundancy, at the same time.
Figure 6.15: Sizes (number of sentences) of DUC2006 document sets before and after merging.
As an evaluation metric, we used the ROUGE Evaluation Toolkit [77] (see also Section
5.5.3.2, Chapter 5). We selected three particular measures, namely, ROUGE-N (N =1, 2) and
ROUGE-SU4, for they were found to perform well in multi-document summarisation. In
Table 6.9, we show the results of these three measures for different feature combinations
starting with query and title similarity features built purely on our concept-based similarity
functions. The fact that the two features (QS+TS) achieve almost similar performance as all
Table 6.9: Comparison of the SRL-ESA based summarisation using different unweighted feature
combination on the DUC2006 data.
Features ROUGE-1 ROUGE-2 ROUGE-SU4
QS+TS +L 0.409695 0.08910575 0.1475425
QS+TS+SC+NEO+L 0.411499 0.093285 0.149829
QS+TS+SC+NEO+C+L 0.412494 0.090985 0.148855
QS+TS+SC+NEO+C+P+L 0.412655 0.090007 0.147785
QS+TS+SC+NEO+C+P+L+QCS 0.413158 0.089982 0.147837
QS+TS+SC+NEO+L+C+P+ QCS + QTO 0.417009 0.091685 0.1149906
Baseline (QCS + QTO) 0.357546 0.056337 0.116578

181
the combined features, shows that Wikipedia concepts, interpreted from argument terms
filling the same semantic roles, can effectively capture the semantic relatedness of natural
language utterances. We note that on this occasion all features are linearly combined without
applying any weighting mechanism. Using this unweighted feature combination underpinned
with the SRL-ESA based scoring function, the best results were found corresponding to the
indicated feature sets, as highlighted in Table 6.9. We have also created a simple baseline
summariser that employs two query dependent features, the QCS and QTO. The ROUGE
results for this baseline are also listed in the same table.
6.4.2.1 Influence of Feature Weighting
Furthermore, we investigated the impact of feature weights on the effectiveness of the
summariser. For this, we determined the optimum feature weight values for all features37
.
The weighting coefficients for all features were manually optimised to maximize the ROUGE
recall scores for the three measures on the DUC2006 test data, using pertinent human
reference and our automatically generated system summaries. The optimum values for the
feature weights were computed in an iterative manner where we tested numbers in the
interval (1-5) only. Table 6.10 illustrates the overall system results after applying the
weighted features. The numbers in the brackets following the average scores are minimum
and maximum ROUGE recall values in the format [min-max]. The final scores show that
weighing features have slightly enhanced the system performance even though that is not
very significant if compared to the results in Table 6.9, where unweighted features were
employed. The final best score for each ROUGE measure on the DUC2006 dataset is as
highlighted in Table 6.10.
37
Optimum found feature weights were 5.0, 3.0, 5.0, 2.0, 1.0, 1.5, 1.0, 1.0, 1.0 for QS, TS, SC,
NEO, P, C, QCS , QTO and L respectively, as tuned from numbers in the interval between 1 and 5.

182
Table 6.10: ROUGE (1-2, SU4) results of the SRL-ESA based approach on the DUC2006 dataset
using weighed features.
Metric ROUGE-1 ROUGE-2 ROUGE-SU4
Recall 0.4182 [0.3551 - 0.5035] 0.092 [0.0474 - 0.1331] 0.1519 [0.1089 - 0.2083]
Precision 0.3865 [0.3261 - 0.4488] 0.0854 [0.0454 - 0.1227] 0.1404 [0.098 - 0.1788]
F-measure 0.4014 [0.3404 - 0.4671] 0.0885 [0.0464 - 0.1277] 0.1458 [0.1032 – 0.1925]
6.4.2.2 Comparison with Related Works
To further examine the quality of our SRL-ESA based query-focussed summarisation system
and demonstrate its usefulness, we compared our results with those of 6 most related works,
three recent studies on the topic of Qf-MDS and the three highest ranked pertinent DUC
systems, and the average score of all DUC participating systems. In addition, we also used
our baseline and the hybrid model proposed in the previous chapter, both experimented on
the same dataset as other benchmark methods for comparison. This comparison of the SRL-
ESA based Qf-MDS and other methods is given in Table 6.11. The numbers in the
parenthesis following the scores indicate the ranking position of each method in the list.
Table 6.11: Performance comparison of the current SRL-ESA based method, the hybrid approach
(Chapter 5), and the related summarisation systems on the DUC2006 dataset using ROUGE measures.
System 95% confidence interval (CI)
Rouge-1 Rouge-2 Rouge-SU4
Our Baseline 0.3575 (10) 0.0563 (10) 0.1166 (10)
AVG-DUC2006 0.3795 (9) 0.0754 (9) 0.1321 (9)
DUC2006-System 24 0.4102 (4) 0.0951 (1) 0.1546 (2)
DUC2006-System 12 0.4049 (6) 0.0899 (6) 0.1476 (4)
Canhasi et al. (2014) 0.4238 (1) 0.0917 (4) 0.1671 (1)
DUC2006-System 15 0.40279 (7) 0.09097 (5) 0.14733 (6)
Cai at. Al (2012) 0.39615 (8) 0.08975 (7) 0.13905 (8)
Luo at. Al (2013) 0.40869 (5) 0.0922 (2) 0.14372 (7)
HBY App. (Chapter 5) 0.41242 (3) 0.08794 (8) 0.14744 (5)
SRL-ESA Method 0.4182 (2) 0.092 (3) 0.1519 (3)

183
As shown in Table 6.11, Canhasi et al. [21] proves to be the most competent scheme by being
in the top of the listed query focussed multi-document summarisation systems in two ROUGE
measures. Also, as indicated, the SRL-ESA based method proposed in this chapter ranks in
second place for ROUGE-1 and in third place for the other two measures and hence
outperforming most of the related methods. The hybrid approach, detailed in Chapter 5, is
pushed into the third position for the first ROUGE measure.
Overall, the use of feature-based scoring functions underpinned by crowdsourced Wikipedia
concepts, translated from role matched semantic arguments, achieve considerable
improvements even though our results are outperformed by one or two related works.
6.4.3 Experiment 2: Generic Single Document and Multi-document Summarisation
In this set of experiments, an iterative graph-based ranking algorithm has been used on the
evaluation dataset from the DUC2002 corpus. Specifically, to extract a representative
summary, S, for SDS and MDS, we made use of the semantic graph interconnectivity among
document sentences to calculate a quality ranking for each sentence. All sentences are ranked
equally at the beginning of the algorithm, which is run recursively on document similarity
graphs until it reaches a study state. Each sentence is ranked depending on the number of
other connected sentences and the strength of the similarity between it and the rest of the
document sentences. Sentences with high semantic similarity and linked with many other
document sentences are favoured and ranked higher. These sentences are finally sorted
according to their ranks and selected as a summary. In most cases, our experimental results
proved that the employed ranking algorithm converges before reaching the 20th
iteration. For
the dataset construction guidelines, the lengths of extracted summaries are 100 and 200 words
for SDS and MDS respectively. Table 6.12 and Table 6.13 show the quality of the system
summaries produced for SDS and G-MDS in terms of the average ROUGE recall scores of
the selected measures. The choice of the measures is made on the basis of the findings in

184
[77], where researchers reported that the measures used for Qf-MDS are the ones that work
well for topic-focussed MDS and that the measures, ROUGE-N (N = 1, 2), ROUGE-L, and
ROUGE-SU4 effectively reflect the effectiveness of generic SDS systems.
Table 6.12: The overall results of the SRL-ESA graph based single document summarisation (SDS):
average recall of the four selected ROUGE measures at 95% confidence interval.
Metric
Measure
Recall Precision F-measure
ROUGE-1 0.5037 [0.228 - 0.7902] 0.4305 [0.2124 - 0.6651] 0.4623 [0.2320 - 0.6763]
ROUGE-2 0.2353 [0.0291 - 0.5373] 0.2005 [0.0231 - 0.5095] 0.2156 [0.0258 - 0.5182]
ROUGE-L 0.3345 [0.1324 - 0.5924] 0.2857 [0.1013 - 0.5591] 0.3069 [0.1211 - 0.5721 ]
ROUGE-SU4 0.2537 [0.0624 - 0.5343] 0.2156 [0.0610 - 0.4871 ] 0.2321 [0.0634 - 0.4960 ]
Table 6.13: The overall results of the SRL-ESA graph based multi-document summarisation (MDS):
average recall of the three selected ROUGE measures at 95% confidence interval.
Measure
Metric
ROUGE-1 ROUGE-2 ROUGE-SU4
Recall 0.4743 [0.3356 - 0.6420] 0.2123 [0.0679 - 0.3797] 0.2455 [0.1056 - 0.41284]
Precision 0.4267 [0.3184 - 0.5286] 0.1902 [0.0644 - 0.3230] 0.2199 [0.1001 - 0.3363]
F-Measure 0.4489 [0.3268 - 0.5771] 0.2005 [0.0661 - 0.3411] 0.2318 [0.1028 - 0.3707]
6.4.3.1 Generalization and the Impact of Data size
To draw some kind of generalization, we investigated the impact of data size on the
performance of the summarisers. Figure 6.16 illustrates how changing data sizes, in terms of
the number of documents for SDS and the number of document sets for the MDS, affects the
summariser performance. Interestingly, what we found were almost stable results on average.
This indicates that the variation of the evaluation data size has little influence on the quality
of the summaries. Therefore, we may conclude that the proposed SRL-ESA Graph Based
SDS and G-MDS system is scalable, which leads us to generalize that the evaluation can
represent a dataset of any size.

185
Figure 6.16: Impact of data size on the SRL-ESA graph based single document (A) and
multi-document (B) summarisation.
A very commonly used statistical technique for generalization is the concept of confidence
intervals (CI). It is the range of values that is thought to include the true representative value,
or the mean, of the entire results. In our case, that figure is the average ROUGE score of the
entire data. Luckily, for our results, this generalization has been achieved by the evaluation
metric, the ROUGE measure, which applies a bootstrap resampling technique to generalize
evaluation results [77]. Specifically, it uses a 95% confidence interval, which indicates the
range within which any result in the evaluation is true 95% of the time for the entire data.
0
0.1
0.2
0.3
0.4
0.5
0.6
10 20 30 40 50 60 70 80 90 100 110 120
RO
UG
E S
CO
RE
S
Number of documents (Single document summarisation)
R-1
R-2
R-L
R-SU4
(A)
0
0.1
0.2
0.3
0.4
0.5
0.6
1 2 3 4 5 6 7 8 9 10
RO
UG
E S
CO
RE
S
Number of clusters (Generic Multi-document Summarisation)
R-1
R-2
R-SU4
(B)

186
6.4.3.2 Comparison with Benchmark Methods
Besides summarising the evaluation with the proposed SRL-ESA Graph Based system, we
extracted a representative summary of the same dataset with the Microsoft Word
Summariser, which we used as a benchmark method. The Microsoft Word Summariser is a
summarisation tool embedded in the Microsoft Word Application. It determines key
sentences by analysing the document and assigning a score to each sentence38
. Word uses
term frequencies to calculate the score for each sentence. This means that the Microsoft Word
Summariser assigns higher scores to sentences that contain frequently used words in the
document. It is widely used in related studies [34, 35, 55, 187, 188] as a benchmark method
for automatic summarisation systems.
In addition, the best performing system at the relevant competition in the Document
Understanding Conference (DUC), labelled as System 19, is employed as another baseline
comparator. The bar charts (A) and (B) in Figure 6.17 demonstrate the comparison of our
results and those from the two comparators for the SDS and MDS tasks. The figure shows the
competency of the proposed SRL-ESA Graph Based summarisation where it outperforms
both benchmark methods with variations in all ROUGE measures. The standard error (SE), as
indicated by the error bars, for the SDS is slightly more than twice that of the MDS. We think
this is because of the large document sizes, in terms of the number of sentences. This
intuition can be supported with the fact that it would be more difficult to comply with the
compression rate (CR) without errors for multi-document summarisation than for single
document summarisation. The CR is the ratio of summary length to source length as shown in
expression (6.16).
𝐶𝑜𝑚𝑝𝑟𝑒𝑠𝑠𝑖𝑜𝑛 𝑅𝑎𝑡𝑖𝑜 = 𝑆𝑢𝑚𝑚𝑎𝑟𝑦 𝐿𝑒𝑛𝑔𝑡ℎ 𝑆𝑜𝑢𝑟𝑐𝑒 𝐿𝑒𝑛𝑔𝑡ℎ (6.16)⁄
38
https://support.office.com/en-in/article/Automatically-summarize-a-document-b43f20ae-ec4b-41cc-
b40a-753eed6d7424

187
Figure 6.17: Comparative view of the ROUGE results for the proposed SRL-ESA graph based
summariser, the MS Word summariser, and the top related DUC System.
Finally, as indicated by the evaluation results of all tested summarisation tasks, Qf-MDS, the
SDS, and G-MDS, the proposed SRL-ESA based approach revealed a very good performance
in terms of ROUGE scores as compared to benchmark methods and the state-of-the-art
summarisation methods. This clearly shows the advantages of the proposed SRL-ESA based
approach for single and multi-document summarisation tasks.
0
0.1
0.2
0.3
0.4
0.5
0.6
ROUGE-1 ROUGE-2 ROUGE-L ROUGE-SU4
RO
UG
E s
core
s
ROUGE measures
SRL-ESA
Word
System 19
0
0.1
0.2
0.3
0.4
0.5
0.6
ROUGE-1 ROUGE-2 ROUGE-SU4
RO
UG
E sc
ore
s
ROUGE measures
SRL-ESA
Word
System19
(A) Single document summarisation
(B) Generic multi-document summarisation

188
6.5 Related Works
The emergence of large-scale crowdsourced knowledge bases and the powerful semantic
analysis techniques contributed to the advancing pace of text summarisation. Despite that,
and at least to our knowledge, research on semantic-based text summarisation using semantic
role labeling with Wikipedia-based explicit semantic analysis has not been explored in the
past. This makes our SRL-ESA summarisation approach to be the first of its kind utilising the
best of the SRL technique and the vast human knowledge encoded in the Wikipedia database.
Nevertheless, several related works have independently utilised semantic role labeling for
extractive and abstractive text summarisation. This includes feature-based approaches in
association with SRL, such as the work of Khan et al. [29] where the researchers used
predicate argument structures to represent source documents and produce abstract summaries;
the proposal of Suanmali et al. [34] where the authors combined statistical and SRL-based
features to build an extractive text summarisation method; and a semantic argument
frequency based scheme [189] where the investigators relied on the semantic argument
frequencies to identify key document sentences by giving high ranks to sentences containing
the most frequent semantic phrases. On the other hand, SRL has been used in association
with an iterative graph-based ranking algorithm for text summarisation. For instance, Canhasi
and Kononenko [8] introduced a multilayered document similarity graph where they linked
sentence semantic frames. The strength of the shallow semantic parsing for text
summarisation has been highlighted in all the above studies where key improvements are
reported in each case. Nonetheless, the uniqueness of our approach is that it investigates ways
of finding further improvements in the field by combining the strengths of the SRL
technology with other semantic analysis techniques. Also, different from the above studies,
we leverage text semantic analysis with a high coverage encyclopedic knowledge as
background information source.

189
Moreover, the application of explicit semantic analysis to text summarisation is still in its
infancy. Sankarasubramaniam et al. [15] suggested a Wikipedia-based multi-document
summarisation algorithm. They used a bipartite sentence concept graphs and ranked the
source document sentences according to their concepts. In a more feature-based fashion,
Zhou et al. [53] applied ESA to query-focussed text summarisation. They integrated an ESA-
based technique and traditional sentence features to score document sentences using machine
learning algorithms. The distinction between the current SRL-ESA based summarisation and
the preceding two methods is the consideration of under sentence-level semantic parsing
which gives this approach an advantage over these methods. This is because, intuitively,
pairing matching semantic roles captures more semantics than applying indiscriminate word
pairing greedily. Thus, realizing the strengths of world knowledge and semantic parsing, our
approach adapts both SRL and ESA techniques for extractive text summarisation including
SDS, MDS and Qf-MDS.
6.6 Summary
In this chapter, we introduced an approach for text summarisation encompassing both SDS
and MDS at different degrees. We used semantic role labelling for semantic representation of
documents and queries. Semantic roles are paired if they fill the same semantic position of a
sentence. Argument texts pertaining to the shared semantic roles are then projected to a
vector of corresponding Wikipedia concepts where the intra-sentence semantic relatedness
and the similarity between the query and document sentences are computed from such
concept vectors. A feature-based Qf-MDS and graph-based SDS & MDS are developed on
the basis of the resulting SRL-ESA based similarity measures. The chapter also presented an
experimental evaluation of the proposed methodology on a standard publicly available
dataset from the relevant DUC conferences. The results revealed considerable performance

190
improvements. The fact that the SRL-ESA summarisation methods achieved significant
improvement in the summary quality illustrates the power of the matched role-based semantic
relatedness of natural language text mapped to the human generated natural concepts encoded
in Wikipedia. This also suggests that the other NLP tasks underpinned by semantic similarity
functions can also be enhanced with this approach.

191
7. CONCLUSIONS AND FUTURE WORK
In this thesis, we have proposed a number of knowledge-enriched semantic similarity and
summarisation methods. The study’s aim is to contribute to improving selection strategies of
extractive text summarisation where the summary constitutes a subset of the document
sentences. We started our investigation with a core relevant aspect, the similarity
measurement, before introducing our summarisation approaches. We then addressed three
different summarisation tasks; generic single document summarisation, topic-focussed multi-
document summarisation and query-focussed multi-document summarisation in a biased
manner where an emphasis is placed on the user-oriented query-based task.
In this chapter, we summarise the thesis contributions and draw some conclusions from this
study. Finally, we will highlight some perspective works which may further improve the
current findings.
7.1 Summary of the Thesis Contributions
This section presents a summary review of the main thesis contributions, the experiments and
evaluations performed to validate the proposed systems. We also indicate the thesis chapter
that contains each principal contribution and relate to the publications made from each part,
where applicable.
7.1.1 Taxonomy-based STS Enhanced with Syntactic Category Conversion
This principal contribution, with its sub-contributions, is thoroughly described in Chapter 4.
The proposal introduced an improved sentence textual similarity method based on a WordNet
taxonomy with a combination of two other manually built lexical resources. Several heuristic
algorithms for subsuming three primary syntactic categories, verbs, adjectives and adverbs
CHAPTER 7

192
under derivationally related nouns in WordNet taxonomy are put forward. The essence of the
proposed approach is to improve WordNet-based similarity by investigating ways of handling
inherent limitations of its traditional measures. This ultimately improves the performance of
dependent NLP applications including text summarisation. We conducted comparative
empirical analysis on human annotated datasets and found that the CatVar-aided similarity
determination establishes the strongest correlation with human judgements and baseline
systems. This comparative study is published in [44]. It alluded to the assertion that WordNet
taxonomy can be supplemented with other linguistic resources, such as CatVar, to enhance
the measurement of sentence semantic similarity. The final proposal, which formed part of
the hybrid method published in [13], has been applied to several publicly available datasets
including the STS Benchmark Dataset, the Microsoft Research Paraphrase Corpus and the
TREC-9 Question Variants. Experiments on the aforementioned evaluation datasets proved
the competency of the measure in which it outperformed baselines, as shown in Chapter 4.
The findings encourage the extension of WordNet semantic relations to accommodate cross
category links since derivational morphology already existed in its database as distinct lexical
terms without specified semantic connection.
7.1.2 A Hybrid Qf-MDS Approach Based on Knowledge-enriched Semantic Heuristics
The hybrid summarisation framework is the topic of Chapter 5. It presents a model which
structures Qf-MDS in a similarity and feature-based framework grounded on relevance,
centrality and diversity factors. The approach benefits from the Catvar-aided WordNet-based
similarity measure (Chapter 4) and a proposed new named-entity relatedness measure based
on Wikipedia entity co-occurrence statistics. Chapter 5 discussed initial experiments in which
we assessed the named-entity coverage in Wikipedia. Based on the introduced infobox-based
binary classification algorithm, we identified and extracted 1.6 million designated names
belonging to location, person, and organisation entities. This part of the work, which aimed

193
to empirically verify Wikipedia’s high coverage in named-entities, has been published in
[83]. The proposed feature-based summarisation ranks document sentences based on three
factors: the relevance to the query, the centrality of the sentence and its diversity from other
cluster sentences all which are based on the discussed similarity measures. For a
comprehensive evaluation of the hybrid summarisation framework, a set of three experiments
were conducted; the assessment of Wikipedia coverage in named-entities, an intermediate
application of the hybrid approach to paraphrase identification problem, and finally the Qf-
MDS, all using large-scale standard datasets. Empirical findings showed that the proposed
hybrid approach achieves outstanding performance on TREC-9 Question Variants and
MSRPC datasets. It also improves the quality of the produced multi-document summaries
when combined with other statistical features in an MMR framework. DUC2005 and
DUC2006 were used for the evaluation of the Qf-MDS. The results also imply that
subsuming non-noun open class words under derivationally related nouns combined with
Wikipedia-based named entity semantic relatedness measure improves the performance of
both similarity measurement and extractive text summarisation.
7.1.3 Wikipedia-based Text Summarisation with Semantic Role Labelling
A detailed description of the SRL Wikipedia based summarisation model, along with its
experimental evaluation, is reported in Chapter 6. It introduces two implementations, namely
single document and multi-document summarisation which were both introduced within the
proposed summarisation framework. A brief introduction of the SRL technique, which we
used for the semantic representation of documents and queries, is given in the chapter. In
order to improve the accuracy of measuring semantic relatedness across sentences, semantic
roles are paired if they fill the same semantic position in a sentence. Argument texts
pertaining to the shared semantic roles are then projected to a vector of corresponding
Wikipedia concepts where the intra-sentence semantic relatedness and the similarity between

194
the query and document sentences are computed from representative concept vectors. The
SRL Wikipedia-based technique is exploited to extract semantic features for sentence scoring
in Qf-MDS and to weight sentence links in a generic graph-based SDS & MDS [192].
Chapter 6 also presents an experimental evaluation of the proposed methodology on
DUC2006 and DUC2002 datasets for Qf-MDS and generic SDS, MDS, respectively. The
empirical results disclosed a considerable system performance in all tasks. The fact that the
proposed SRL Wikipedia based summarisation achieved significant improvement in the
summary quality shows the power of the semantic argument matching and their translation to
the human generated natural concepts encoded in Wikipedia. It also suggests that the other
NLP tasks underpinned by semantic similarity functions can be enhanced with this approach.
7.2 Conclusions
Several final conclusions can be drawn from this study. First and foremost, semantic feature
extraction for the purpose of sentence scoring in extractive text summarisation can be
potentially improved if the text concepts are properly linked to relevant semantic and
conceptual relations encoded in the external semantic knowledge sources. This enabled us to
overcome the bottlenecks of relying on shallow text features, which overlook the meaning of
the text. Second, using knowledge base only, or relying on the manually engineered lexical
resource, has shown to be inadequate without using effective heuristic algorithms. The issues
of lexical coverage and up-to-date information were also found to be very pressing for
semantic feature extraction and similarity measurement in text summarisation. This is the
rationale behind the extensive use of Wikipedia, deemed to be the largest crowdsourced
knowledge repository with a high lexical coverage. Third, sentence-level semantic parsing
was discovered to work well with knowledge-based semantic similarity determination and
feature extraction for summarisation. One of its strengths in this context is the consideration
of syntactic word order and term semantic roles before linking each sentence to the

195
corresponding concepts in the background knowledge and generating its underlying semantic
features. Finally, the issue of summary evaluation needs much work due to the limitations of
the widely used ROUGE package to measure system-human n-gram overlaps. Judgements
measuring the linguistic qualities of the summary could provide a solid evaluation but is
unlikely to be achieved without a human intervention. The latter is not possible to be applied
by researchers aiming rapid system development and quick dissemination of their results.
7.3 Future Work
Although all research questions of the study have been addressed, some of the approaches
can still be investigated for further improvements in the study’s perspective works.
Firstly, the proposed similarity measures can be applied to relevant applications such as
plagiarism detection, which is entirely based on measuring the text semantic similarity. The
application can benefit from the new similarity measures and is thought to result in
significant impact on its performance as it crucially depends on the similarity determination,
which is one of the core contributions of this thesis.
Secondly, the summarisation approaches proposed in this thesis can be extended to other
summarisation tasks. Particularly, the SRL Wikipedia-based method can be suitably applied
to guided summarisation. Guided summarisation involves the retrieval of a summary
response to an event described in a user question. Documents relating to topics of template-
like categories, such as attacks, accidents and natural disasters, investigations and trails,
endangered resource and health & safety, are best summarised using the guided task [190].
These topics contain highly predictable facts such as who did what when and where and
interestingly SRL can be the best tool for answering such event-based questions.
Thirdly, sentence features have been linearly combined and/or were weighted iteratively and
manually to optimise the ROUGE recall scores. However, in the future, we plan to apply

196
machine learning algorithms such as regression models or genetic algorithms to more
effectively weight feature coefficients. This can serve as a better weighting scheme which
may provide further clues to the identification of the most significant semantic features and
their optimum combination.
Fourth, some parameter values, such as the similarity threshold in the paraphrase
identification experiments and document merging (see Section 5.5.2, Chapter 5 and Section
6.3.2 Chapter 6), have been set to numbers widely used in the relevant literature. Similarly,
the coefficient values of the hybrid similarity measure (see Section 5.3.4, Chapter 5) have
been modelled on word proportions. Determining the values of these parameters
automatically may provide further strengths to the proposed approaches and is anticipated to
be part of the future works.
Fifth, in addition to the used semantic knowledge sources (see Chapter 3), we plan to
examine ConceptNet, another large-scale common sense knowledge base and semantic
network which excels in both simple and compound concepts [191]. It supports practical
textual reasoning tasks such as topic-gisting and analogy-making. The KB is especially
capable of aiding the comprehension of basic common sense knowledge facts, for instance, to
pass the exam, you need to read the relevant material; if you get sick, visit a doctor. As
computers do not possess such basic facts and extracting their relationships automatically is
currently impossible, the application of ConceptNet as background knowledge for
summarisation may advance the field.
Finally, the developed semantic-based text feature extraction methods could also be used to
predict personality traits in social media. Particularly, we aim to improve our previous work
[193] on personality trait identification where Twitter datasets from UK geolocated tweets
were employed to identify personality traits of the users.

197
References
[1] H. P. Luhn, "The automatic creation of literature abstracts," IBM Journal of research and
development, vol. 2, pp. 159-165, 1958.
[2] A. Nenkova, S. Maskey, and Y. Liu, "Automatic summarization," in Proceedings of the 49th
Annual Meeting of the Association for Computational Linguistics: Tutorial Abstracts of ACL
2011, 2011, p. 3.
[3] V. Gupta and G. S. Lehal, "A survey of text summarization extractive techniques," Journal of
Emerging Technologies in Web Intelligence, vol. 2, pp. 258-268, 2010.
[4] P. B. Baxendale, "Machine-made index for technical literature: an experiment," IBM Journal
of Research and Development, vol. 2, pp. 354-361, 1958.
[5] H. P. Edmundson, "New methods in automatic extracting," Journal of the ACM (JACM), vol.
16, pp. 264-285, 1969.
[6] G. Erkan and D. R. Radev, "LexRank: Graph-based lexical centrality as salience in text
summarization," Journal of Artificial Intelligence Research, pp. 457-479, 2004.
[7] R. Mihalcea and P. Tarau, "TextRank: Bringing order into texts," 2004.
[8] E. Canhasi and I. Kononenko, "Semantic role frames graph-based multidocument
summarization," Proc. SiKDD'11, 2011.
[9] M. A. Fattah, "A hybrid machine learning model for multi-document summarization,"
Applied intelligence, vol. 40, pp. 592-600, 2014.
[10] C.-Y. Lin, "Training a selection function for extraction," in Proceedings of the eighth
international conference on Information and knowledge management, 1999, pp. 55-62.
[11] K. M. Svore, L. Vanderwende, and C. J. Burges, "Enhancing Single-Document
Summarization by Combining RankNet and Third-Party Sources," in EMNLP-CoNLL, 2007,
pp. 448-457.
[12] A. L. Blum and P. Langley, "Selection of relevant features and examples in machine
learning," Artificial intelligence, vol. 97, pp. 245-271, 1997.
[13] M. Mohamed and M. Oussalah, "Similarity-based Query-focused Multi-document
Summarization using Crowdsourced and Manually-built Lexical-Semantic Resources " in
The 9th IEEE International Conference on Big Data Science and Engineering (IEEE
BigDataSE-15), Helsinki, Finland, 2015.
[14] A. Abdi, N. Idris, R. M. Alguliyev, and R. M. Aliguliyev, "Query-based multi-documents
summarization using linguistic knowledge and content word expansion," Soft Computing, pp.
1-17, 2015.
[15] Y. Sankarasubramaniam, K. Ramanathan, and S. Ghosh, "Text summarization using
Wikipedia," Information Processing & Management, vol. 50, pp. 443-461, 2014.
[16] A. Bawakid and M. Oussalah, "A semantic summarization system: University of Birmingham
at TAC 2008," in Proceedings of the First Text Analysis Conference, 2008.
[17] A. R. Pal and D. Saha, "An approach to automatic text summarization using WordNet," in
Advance Computing Conference (IACC), 2014 IEEE International, 2014, pp. 1169-1173.
[18] X. L. Dong, E. Gabrilovich, K. Murphy, V. Dang, W. Horn, C. Lugaresi, S. Sun, and W.
Zhang, "Knowledge-based trust: Estimating the trustworthiness of web sources," Proceedings
of the VLDB Endowment, vol. 8, pp. 938-949, 2015.
[19] J. Yarow. (2013). Yahoo Buys Summly: A Mobile New Summarizer. Available:
http://www.businessinsider.com/yahoo-buys-summly-2013-3?IR=T
[20] K. S. Jones, "Automatic summarizing: factors and directions," Advances in automatic text
summarization, pp. 1-12, 1999.

198
[21] E. Canhasi and I. Kononenko, "Weighted archetypal analysis of the multi-element graph for
query-focused multi-document summarization," Expert systems with applications, vol. 41, pp.
535-543, 2014.
[22] L. Zhao, L. Wu, and X. Huang, "Using query expansion in graph-based approach for query-
focused multi-document summarization," Information Processing & Management, vol. 45, pp.
35-41, 2009.
[23] D. McDonald and H. Chen, "Using sentence-selection heuristics to rank text segments in
TXTRACTOR," in Proceedings of the 2nd ACM/IEEE-CS joint conference on Digital
libraries, 2002, pp. 28-35.
[24] M. K. Dalal and M. A. Zaveri, "Heuristics based automatic text summarization of
unstructured text," in Proceedings of the International Conference & Workshop on Emerging
Trends in Technology, 2011, pp. 690-693.
[25] E. Hovy and C.-Y. Lin, "Automated text summarization and the SUMMARIST system," in
Proceedings of a workshop on held at Baltimore, Maryland: October 13-15, 1998, 1998, pp.
197-214.
[26] I. Mani and M. T. Maybury, Advances in automatic text summarization vol. 293: MIT Press,
1999.
[27] E. Lloret and M. Palomar, "Text summarisation in progress: a literature review," Artificial
Intelligence Review, vol. 37, pp. 1-41, 2012.
[28] D. R. Radev, H. Jing, M. Styś, and D. Tam, "Centroid-based summarization of multiple
documents," Information Processing & Management, vol. 40, pp. 919-938, 2004.
[29] A. Khan, N. Salim, and Y. J. Kumar, "A framework for multi-document abstractive
summarization based on semantic role labelling," Applied Soft Computing, vol. 30, pp. 737-
747, 2015.
[30] Y. Ouyang, W. Li, S. Li, and Q. Lu, "Applying regression models to query-focused multi-
document summarization," Information Processing & Management, vol. 47, pp. 227-237,
2011.
[31] S. Gholamrezazadeh, M. A. Salehi, and B. Gholamzadeh, "A comprehensive survey on text
summarization systems," Proceedings of CSA, vol. 9, pp. 1-6, 2009.
[32] R. Mishra, J. Bian, M. Fiszman, C. R. Weir, S. Jonnalagadda, J. Mostafa, and G. Del Fiol,
"Text summarization in the biomedical domain: a systematic review of recent research,"
Journal of biomedical informatics, vol. 52, pp. 457-467, 2014.
[33] R. Ferreira, L. de Souza Cabral, R. D. Lins, G. P. e Silva, F. Freitas, G. D. Cavalcanti, R.
Lima, S. J. Simske, and L. Favaro, "Assessing sentence scoring techniques for extractive text
summarization," Expert systems with applications, vol. 40, pp. 5755-5764, 2013.
[34] N. Salim, "SRL-GSM: a hybrid approach based on semantic role labeling and general statistic
method for text summarization," Journal of Applied Sciences, vol. 10, pp. 166-173, 2010.
[35] M. S. Binwahlan, N. Salim, and L. Suanmali, "Fuzzy swarm diversity hybrid model for text
summarization," Information processing & management, vol. 46, pp. 571-588, 2010.
[36] Y. J. Kumar, N. Salim, and B. Raza, "Cross-document structural relationship identification
using supervised machine learning," Applied Soft Computing, vol. 12, pp. 3124-3131, 2012.
[37] L. Li and T. Li, "An empirical study of ontology-based multi-document summarization in
disaster management," Systems, Man, and Cybernetics: Systems, IEEE Transactions on, vol.
44, pp. 162-171, 2014.
[38] A. Farzindar, F. Rozon, and G. Lapalme, "CATS a topic-oriented multi-document
summarization system at DUC 2005," in Proc. of the 2005 Document Understanding
Workshop (DUC2005), 2005.

199
[39] A. Abuobieda, N. Salim, A. T. Albaham, A. H. Osman, and Y. J. Kumar, "Text
summarization features selection method using pseudo genetic-based model," in Information
Retrieval & Knowledge Management (CAMP), 2012 International Conference on, 2012, pp.
193-197.
[40] A. Barrera and R. Verma, "Combining syntax and semantics for automatic extractive single-
document summarization," in Computational Linguistics and Intelligent Text Processing, ed:
Springer, 2012, pp. 366-377.
[41] A. Bawakid, "Automatic documents summarization using ontology based methodologies,"
University of Birmingham, 2011.
[42] D. Das and A. F. Martins, "A survey on automatic text summarization," Literature Survey for
the Language and Statistics II course at CMU, vol. 4, pp. 192-195, 2007.
[43] S. Ye, L. Qiu, T.-S. Chua, and M.-Y. Kan, "NUS at DUC 2005: Understanding documents via
concept links," in Proceedings of Document Understanding Conferences, 2005.
[44] M. Mohamed and M. Oussalah, "A Comparative Study of Conversion Aided Methods for
WordNet Sentence Textual Similarity," COLING 2014, p. 37, 2014.
[45] M. Strube and S. P. Ponzetto, "WikiRelate! Computing semantic relatedness using
Wikipedia," in AAAI, 2006, pp. 1419-1424.
[46] E. Gabrilovich and S. Markovitch, "Wikipedia-based semantic interpretation for natural
language processing," Journal of Artificial Intelligence Research, pp. 443-498, 2009.
[47] S. Cucerzan, "Large-Scale Named Entity Disambiguation Based on Wikipedia Data," in
EMNLP-CoNLL, 2007, pp. 708-716.
[48] J. Knopp, "Extending a multilingual Lexical Resource by bootstrapping Named Entity
Classification using Wikipedia’s Category System," in Proceedings of the Fifth International
Workshop On Cross Lingual Information Acces, 2011, pp. 35-43.
[49] P. Wang, J. Hu, H.-J. Zeng, and Z. Chen, "Using Wikipedia knowledge to improve text
classification," Knowledge and Information Systems, vol. 19, pp. 265-281, 2009.
[50] S. Banerjee, K. Ramanathan, and A. Gupta, "Clustering short texts using wikipedia," in
Proceedings of the 30th annual international ACM SIGIR conference on Research and
development in information retrieval, 2007, pp. 787-788.
[51] A. Bawakid and M. Oussalah, "Summarizing with Wikipedia," in Proceedings of the text
analysis conference (TAC), 2010.
[52] A. Guran, N. G. BAYAZIT, and M. Z. Gurbuz, "Efficient feature integration with Wikipedia-
based semantic feature extraction for Turkish text summarization," Turkish Journal of
Electrical Engineering & Computer Sciences, vol. 21, 2013.
[53] Y. Zhou, Z. Guo, P. Ren, and Y. Yu, "Applying wikipedia-based explicit semantic analysis
for query-biased document summarization," in Advanced Intelligent Computing Theories and
Applications, ed: Springer, 2010, pp. 474-481.
[54] M. El-Haj, U. Kruschwitz, and C. Fox, "Multi-document Arabic text summarisation," in
Computer Science and Electronic Engineering Conference (CEEC), 2011 3rd, 2011, pp. 40-
44.
[55] R. Barzilay and M. Elhadad, "Using lexical chains for text summarization," Advances in
automatic text summarization, pp. 111-121, 1999.
[56] D. Marcu, "Improving summarization through rhetorical parsing tuning," in The 6th
Workshop on Very Large Corpora, 1998, pp. 206-215.
[57] X. Cai and W. Li, "Mutually reinforced manifold-ranking based relevance propagation model
for query-focused multi-document summarization," Audio, Speech, and Language Processing,
IEEE Transactions on, vol. 20, pp. 1597-1607, 2012.

200
[58] S. Brin and L. Page, "Reprint of: The anatomy of a large-scale hypertextual web search
engine," Computer networks, vol. 56, pp. 3825-3833, 2012.
[59] J. Otterbacher, G. Erkan, and D. R. Radev, "Biased LexRank: Passage retrieval using random
walks with question-based priors," Information Processing & Management, vol. 45, pp. 42-
54, 2009.
[60] F. Wei, W. Li, Q. Lu, and Y. He, "A document-sensitive graph model for multi-document
summarization," Knowledge and information systems, vol. 22, pp. 245-259, 2010.
[61] H. Zha, "Generic summarization and keyphrase extraction using mutual reinforcement
principle and sentence clustering," in Proceedings of the 25th annual international ACM
SIGIR conference on Research and development in information retrieval, 2002, pp. 113-120.
[62] L. P. Morales, A. D. Esteban, and P. Gervás, "Concept-graph based biomedical automatic
summarization using ontologies," in Proceedings of the 3rd Textgraphs Workshop on Graph-
Based Algorithms for Natural Language Processing, 2008, pp. 53-56.
[63] J. Kupiec, J. Pedersen, and F. Chen, "A trainable document summarizer," in Proceedings of
the 18th annual international ACM SIGIR conference on Research and development in
information retrieval, 1995, pp. 68-73.
[64] B. Larsen, "A trainable summarizer with knowledge acquired from robust NLP techniques,"
Advances in Automatic Text Summarization, p. 71, 1999.
[65] J. M. Conroy and D. P. O'leary, "Text summarization via hidden markov models," in
Proceedings of the 24th annual international ACM SIGIR conference on Research and
development in information retrieval, 2001, pp. 406-407.
[66] T. Hirao, H. Isozaki, E. Maeda, and Y. Matsumoto, "Extracting important sentences with
support vector machines," in Proceedings of the 19th international conference on
Computational linguistics-Volume 1, 2002, pp. 1-7.
[67] L. Zhou and E. Hovy, "A web-trained extraction summarization system," in Proceedings of
the 2003 Conference of the North American Chapter of the Association for Computational
Linguistics on Human Language Technology-Volume 1, 2003, pp. 205-211.
[68] J.-H. Lee, S. Park, C.-M. Ahn, and D. Kim, "Automatic generic document summarization
based on non-negative matrix factorization," Information Processing & Management, vol. 45,
pp. 20-34, 2009.
[69] J.-P. Mei and L. Chen, "SumCR: a new subtopic-based extractive approach for text
summarization," Knowledge and information systems, vol. 31, pp. 527-545, 2012.
[70] M. S. Binwahlan, N. Salim, and L. Suanmali, "Swarm based text summarization," in
Computer Science and Information Technology-Spring Conference, 2009. IACSITSC'09.
International Association of, 2009, pp. 145-150.
[71] M. G. Ozsoy, I. Cicekli, and F. N. Alpaslan, "Text summarization of turkish texts using latent
semantic analysis," in Proceedings of the 23rd international conference on computational
linguistics, 2010, pp. 869-876.
[72] J. Kennedy, "Particle swarm optimization," in Encyclopedia of Machine Learning, ed:
Springer, 2010, pp. 760-766.
[73] J. R. Galliers and K. S. Jones, "Evaluating natural language processing systems," 1993.
[74] C.-Y. Lin and E. Hovy, "Manual and automatic evaluation of summaries," in Proceedings of
the ACL-02 Workshop on Automatic Summarization-Volume 4, 2002, pp. 45-51.
[75] K. Papineni, S. Roukos, T. Ward, and W.-J. Zhu, "BLEU: a method for automatic evaluation
of machine translation," in Proceedings of the 40th annual meeting on association for
computational linguistics, 2002, pp. 311-318.

201
[76] D. R. Radev and D. Tam, "Summarization evaluation using relative utility," in Proceedings of
the twelfth international conference on Information and knowledge management, 2003, pp.
508-511.
[77] C.-Y. Lin, "Rouge: A package for automatic evaluation of summaries," in Text
summarization branches out: Proceedings of the ACL-04 workshop, 2004.
[78] E. Hovy, C.-Y. Lin, L. Zhou, and J. Fukumoto, "Automated summarization evaluation with
basic elements," in Proceedings of the Fifth Conference on Language Resources and
Evaluation (LREC 2006), 2006, pp. 604-611.
[79] I. Mani, Automatic summarization vol. 3: John Benjamins Publishing, 2001.
[80] G. Carenini, G. Murray, and R. Ng, "Methods for mining and summarizing text
conversations," Synthesis Lectures on Data Management, vol. 3, pp. 1-130, 2011.
[81] H. T. Dang, "Overview of DUC 2005," in Proceedings of the document understanding
conference, 2005, p. 1Ą12.
[82] I. Mani, G. Klein, D. House, L. Hirschman, T. Firmin, and B. Sundheim, "SUMMAC: a text
summarization evaluation," Natural Language Engineering, vol. 8, pp. 43-68, 2002.
[83] M. Mohamed and M. Oussalah, "Identifying and Extracting Named Entities from Wikipedia
Database Using Entity Infoboxes," International Journal of Advanced Computer Science and
Applications(IJACSA), , vol. 5, pp. 164-169, 2014.
[84] P. McNamee and H. T. Dang, "Overview of the TAC 2009 knowledge base population track,"
in Text Analysis Conference (TAC), 2009, pp. 111-113.
[85] J. Liu and L. Birnbaum, "Measuring semantic similarity between named entities by searching
the web directory," in Proceedings of the IEEE/WIC/ACM international Conference on Web
intelligence, 2007, pp. 461-465.
[86] H. Liu and Y. Chen, "Computing semantic relatedness between named entities using
Wikipedia," in Artificial Intelligence and Computational Intelligence (AICI), 2010
International Conference on, 2010, pp. 388-392.
[87] L. C. Hovy E, "Automated multilingual text summarization and its evaluation " University
of Southern California., 1999.
[88] J. Steinberger, M. Poesio, M. A. Kabadjov, and K. Ježek, "Two uses of anaphora resolution in
summarization," Information Processing & Management, vol. 43, pp. 1663-1680, 2007.
[89] J. McCarthy, Programs with common sense: Defense Technical Information Center, 1963.
[90] L. Schubert, "Turing's Dream and the Knowledge Challenge," in Proceedings of the national
conference on artificial intelligence, 2006, p. 1534.
[91] S. P. Ponzetto, Knowledge Acquisition from a Collaboratively Generated Encyclopedia: IOS
Press, 2010.
[92] G. A. Miller, "WordNet: a lexical database for English," Communications of the ACM, vol.
38, pp. 39-41, 1995.
[93] G. A. Miller, R. Beckwith, C. Fellbaum, D. Gross, and K. J. Miller, "Introduction to wordnet:
An on-line lexical database*," International journal of lexicography, vol. 3, pp. 235-244,
1990.
[94] A. Krizhanovsky and F. Lin, "Related terms search based on WordNet/Wiktionary and its
application in Ontology Matching," arXiv preprint arXiv:0907.2209, 2009.
[95] T. Richens, "Anomalies in the WordNet verb hierarchy," in Proceedings of the 22nd
International Conference on Computational Linguistics-Volume 1, 2008, pp. 729-736.
[96] J. Szymanski, K. Dusza, and L. Byczkowski, "Cooperative editing approach for building
wordnet database," in Proceedings of the XVI international conference on system science,
2007, pp. 448-457.

202
[97] W. Wentland, J. Knopp, C. Silberer, and M. Hartung, "Building a Multilingual Lexical
Resource for Named Entity Disambiguation, Translation and Transliteration," in LREC, 2008.
[98] J. Giles, "Internet encyclopaedias go head to head," Nature, vol. 438, pp. 900-901, 2005.
[99] M. A. H. Taieb, M. B. Aouicha, and A. B. Hamadou, "Computing semantic relatedness using
Wikipedia features," Knowledge-Based Systems, vol. 50, pp. 260-278, 2013.
[100] B. Dandala, R. Mihalcea, and R. Bunescu, "Word sense disambiguation using Wikipedia," in
The People’s Web Meets NLP, ed: Springer, 2013, pp. 241-262.
[101] J. Hoffart, F. M. Suchanek, K. Berberich, and G. Weikum, "YAGO2: A spatially and
temporally enhanced knowledge base from Wikipedia," in Proceedings of the Twenty-Third
international joint conference on Artificial Intelligence, 2013, pp. 3161-3165.
[102] J. Nothman, N. Ringland, W. Radford, T. Murphy, and J. R. Curran, "Learning multilingual
named entity recognition from Wikipedia," Artificial Intelligence, vol. 194, pp. 151-175,
2013.
[103] N. Habash and B. Dorr, "A categorial variation database for English," in Proceedings of the
2003 Conference of the North American Chapter of the Association for Computational
Linguistics on Human Language Technology-Volume 1, 2003, pp. 17-23.
[104] M. Mayor, Longman dictionary of contemporary English: Pearson Education India, 2009.
[105] M. P. Marcus, M. A. Marcinkiewicz, and B. Santorini, "Building a large annotated corpus of
English: The Penn Treebank," Computational linguistics, vol. 19, pp. 313-330, 1993.
[106] E. L. Antworth, "PC-KIMMO: a two-level processor for morphological analysis," 1991.
[107] C. Macleod, R. Grishman, A. Meyers, L. Barrett, and R. Reeves, "Nomlex: A lexicon of
nominalizations," in Proceedings of EURALEX, 1998, pp. 187-193.
[108] M. F. Porter, "An algorithm for suffix stripping," Program, vol. 14, pp. 130-137, 1980.
[109] C. Fellbaum, A. Osherson, and P. E. Clark, "Putting semantics into WordNet’s"
morphosemantic" links," in Human Language Technology. Challenges of the Information
Society, ed: Springer, 2009, pp. 350-358.
[110] P. Achananuparp, X. Hu, X. Zhou, and X. Zhang, "Utilizing sentence similarity and question
type similarity to response to similar questions in knowledge-sharing community," in
Proceedings of QAWeb 2008 Workshop, Beijing, China, 2008.
[111] S. Fernando and M. Stevenson, "A semantic similarity approach to paraphrase detection," in
Proceedings of the 11th Annual Research Colloquium of the UK Special Interest Group for
Computational Linguistics, 2008, pp. 45-52.
[112] A. H. Osman, N. Salim, M. S. Binwahlan, R. Alteeb, and A. Abuobieda, "An improved
plagiarism detection scheme based on semantic role labeling," Applied Soft Computing, vol.
12, pp. 1493-1502, 2012.
[113] S. Unankard, X. Li, and M. A. Sharaf, "Emerging event detection in social networks with
location sensitivity," World Wide Web, pp. 1-25, 2014.
[114] R. Haque, S. K. Naskar, A. Way, M. R. Costa-Jussà, and R. E. Banchs, "Sentence similarity-
based source context modelling in pbsmt," in Asian Language Processing (IALP), 2010
International Conference on, 2010, pp. 257-260.
[115] K. O’Shea, "An approach to conversational agent design using semantic sentence similarity,"
Applied Intelligence, vol. 37, pp. 558-568, 2012.
[116] W. H. Gomaa and A. A. Fahmy, "A survey of text similarity approaches," International
Journal of Computer Applications, vol. 68, pp. 13-18, 2013.
[117] M. M. Ali and M. K. Ghosh, "Multi-document Text Summarization: SimWithFirst Based
Features and Sentence Co-selection Based Evaluation," in Future Computer and
Communication, 2009. ICFCC 2009. International Conference on, 2009, pp. 93-96.
[118] R. E. Banchs, Text Mining with MATLAB®: Springer Science & Business Media, 2013.

203
[119] N. Balasubramanian, J. Allan, and W. B. Croft, "A comparison of sentence retrieval
techniques," in Proceedings of the 30th annual international ACM SIGIR conference on
Research and development in information retrieval, 2007, pp. 813-814.
[120] T. C. Hoad and J. Zobel, "Methods for identifying versioned and plagiarized documents,"
Journal of the American society for information science and technology, vol. 54, pp. 203-215,
2003.
[121] Y. Jiang, X. Zhang, Y. Tang, and R. Nie, "Feature-based approaches to semantic similarity
assessment of concepts using Wikipedia," Information Processing & Management, vol. 51,
pp. 215-234, 2015.
[122] R. Malik, L. V. Subramaniam, and S. Kaushik, "Automatically Selecting Answer Templates
to Respond to Customer Emails," in IJCAI, 2007, pp. 1659-1664.
[123] R. Socher, E. H. Huang, J. Pennin, C. D. Manning, and A. Y. Ng, "Dynamic pooling and
unfolding recursive autoencoders for paraphrase detection," in Advances in Neural
Information Processing Systems, 2011, pp. 801-809.
[124] R. Mihalcea, C. Corley, and C. Strapparava, "Corpus-based and knowledge-based measures
of text semantic similarity," in AAAI, 2006, pp. 775-780.
[125] Z. Kozareva and A. Montoyo, "Paraphrase identification on the basis of supervised machine
learning techniques," in Advances in natural language processing, ed: Springer, 2006, pp.
524-533.
[126] V. Rus, P. M. McCarthy, M. C. Lintean, D. S. McNamara, and A. C. Graesser, "Paraphrase
Identification with Lexico-Syntactic Graph Subsumption," in FLAIRS conference, 2008, pp.
201-206.
[127] D. Das and N. A. Smith, "Paraphrase identification as probabilistic quasi-synchronous
recognition," in Proceedings of the Joint Conference of the 47th Annual Meeting of the ACL
and the 4th International Joint Conference on Natural Language Processing of the AFNLP:
Volume 1-Volume 1, 2009, pp. 468-476.
[128] G. A. Miller and F. Hristea, "WordNet nouns: Classes and instances," Computational
linguistics, vol. 32, pp. 1-3, 2006.
[129] C. Leacock and M. Chodorow, "Combining local context and WordNet similarity for word
sense identification," WordNet: An electronic lexical database, vol. 49, pp. 265-283, 1998.
[130] Z. Wu and M. Palmer, "Verbs semantics and lexical selection," in Proceedings of the 32nd
annual meeting on Association for Computational Linguistics, 1994, pp. 133-138.
[131] P. Resnik, "Using information content to evaluate semantic similarity in a taxonomy," arXiv
preprint cmp-lg/9511007, 1995.
[132] T. Pedersen, S. Patwardhan, and J. Michelizzi, "WordNet:: Similarity: measuring the
relatedness of concepts," in Demonstration Papers at HLT-NAACL 2004, 2004, pp. 38-41.
[133] D. Lin, "Extracting collocations from text corpora," in First workshop on computational
terminology, 1998, pp. 57-63.
[134] J. J. Jiang and D. W. Conrath, "Semantic similarity based on corpus statistics and lexical
taxonomy," arXiv preprint cmp-lg/9709008, 1997.
[135] (2000). Gulf Air Crash. Available: http://www.albawaba.com/news/143-passengers-killed-
gulf-air-plane-crash-bahrain.
[136] J. O’Shea, Z. Bandar, K. Crockett, and D. McLean, "A comparative study of two short text
semantic similarity measures," in Agent and Multi-Agent Systems: Technologies and
Applications, ed: Springer, 2008, pp. 172-181.
[137] W. G. Charles, "Contextual correlates of meaning," Applied Psycholinguistics, vol. 21, pp.
505-524, 2000.

204
[138] Y. Li, D. McLean, Z. A. Bandar, J. D. O'shea, and K. Crockett, "Sentence similarity based on
semantic nets and corpus statistics," Knowledge and Data Engineering, IEEE Transactions on,
vol. 18, pp. 1138-1150, 2006.
[139] S. Deerwester, S. T. Dumais, G. W. Furnas, T. K. Landauer, and R. Harshman, "Indexing by
latent semantic analysis," Journal of the American society for information science, vol. 41, p.
391, 1990.
[140] B. Dolan, C. Quirk, and C. Brockett, "Unsupervised construction of large paraphrase corpora:
Exploiting massively parallel news sources," in Proceedings of the 20th international
conference on Computational Linguistics, 2004, p. 350.
[141] R. Baeza-Yates and B. Ribeiro-Neto, Modern information retrieval vol. 463: ACM press New
York, 1999.
[142] Y. Mehdad, A. Moschitti, and F. M. Zanzotto, "Syntactic/semantic structures for textual
entailment recognition," in Human Language Technologies: The 2010 Annual Conference of
the North American Chapter of the Association for Computational Linguistics, 2010, pp.
1020-1028.
[143] T. Wei, Y. Lu, H. Chang, Q. Zhou, and X. Bao, "A semantic approach for text clustering
using WordNet and lexical chains," Expert Systems with Applications, vol. 42, pp. 2264-
2275, 2015.
[144] Z. Ul-Qayyum and W. Altaf, "Paraphrase Identification using Semantic Heuristic Features,"
Research Journal of Applied Sciences, Engineering and Technology, pp. 4894-4904, 2012.
[145] L. Wang, H. Raghavan, C. Cardie, and V. Castelli, "Query-Focused Opinion Summarization
for User-Generated Content," in Proceedings of COLING, 2014, pp. 1660-1669.
[146] T. Zesch, I. Gurevych, and M. Mühlhäuser, "Analyzing and accessing Wikipedia as a lexical
semantic resource," Data Structures for Linguistic Resources and Applications, pp. 197-205,
2007.
[147] R. Grishman and B. Sundheim, "Message Understanding Conference-6: A Brief History," in
COLING, 1996, pp. 466-471.
[148] F. Wu and D. S. Weld, "Open information extraction using Wikipedia," in Proceedings of the
48th Annual Meeting of the Association for Computational Linguistics, 2010, pp. 118-127.
[149] D. Lange, C. Böhm, and F. Naumann, "Extracting structured information from Wikipedia
articles to populate infoboxes," in Proceedings of the 19th ACM international conference on
Information and knowledge management, 2010, pp. 1661-1664.
[150] B. C. Ed Summers. (2011). WWW::Wikipedia - Automated interface to the Wikipedia.
Available: http://search.cpan.org/~bricas/WWW-Wikipedia-2.01/
[151] T. Riddle, "Parse::MediaWikiDump- Tools to process MediaWiki dump files," 2010.
[152] R. L. Cilibrasi and P. Vitanyi, "The google similarity distance," Knowledge and Data
Engineering, IEEE Transactions on, vol. 19, pp. 370-383, 2007.
[153] R. M. Aliguliyev, "A new sentence similarity measure and sentence based extractive
technique for automatic text summarization," Expert Systems with Applications, vol. 36, pp.
7764-7772, 2009.
[154] L. Ratinov and D. Roth, "Design challenges and misconceptions in named entity recognition,"
in Proceedings of the Thirteenth Conference on Computational Natural Language Learning,
2009, pp. 147-155.
[155] J. Carbonell and J. Goldstein, "The use of MMR, diversity-based reranking for reordering
documents and producing summaries," in Proceedings of the 21st annual international ACM
SIGIR conference on Research and development in information retrieval, 1998, pp. 335-336.
205
[156] J. Goldstein, V. Mittal, J. Carbonell, and M. Kantrowitz, "Multi-document summarization by
sentence extraction," in Proceedings of the 2000 NAACL-ANLPWorkshop on Automatic
summarization-Volume 4, 2000, pp. 40-48.
[157] K. W. Lim, S. Sanner, and S. Guo, "On the Mathematical Relationship between Expected n-
call@ k and the Relevance vs. Diversity Trade-off," in Proceedings of the 35th international
ACM SIGIR conference on Research and development in information retrieval, 2012, pp.
1117-1118.
[158] H. Lin and J. Bilmes, "Multi-document summarization via budgeted maximization of
submodular functions," in Human Language Technologies: The 2010 Annual Conference of
the North American Chapter of the Association for Computational Linguistics, 2010, pp. 912-
920.
[159] D. M. Zajic, B. Dorr, J. Lin, and R. Schwartz, "Sentence compression as a component of a
multi-document summarization system," in Proceedings of the 2006 Document
Understanding Workshop, New York, 2006.
[160] S. Vargas and P. Castells, "Rank and relevance in novelty and diversity metrics for
recommender systems," in Proceedings of the fifth ACM conference on Recommender
systems, 2011, pp. 109-116.
[161] L. Marujo, R. Ribeiro, D. M. de Matos, J. P. Neto, A. Gershman, and J. Carbonell,
"Extending a single-document summarizer to multi-document: a hierarchical approach,"
arXiv preprint arXiv:1507.02907, 2015.
[162] W. Luo, F. Zhuang, Q. He, and Z. Shi, "Exploiting relevance, coverage, and novelty for
query-focused multi-document summarization," Knowledge-Based Systems, vol. 46, pp. 33-
42, 2013.
[163] A. Finch, Y.-S. Hwang, and E. Sumita, "Using machine translation evaluation techniques to
determine sentence-level semantic equivalence," in Proceedings of the Third International
Workshop on Paraphrasing (IWP2005), 2005, pp. 17-24.
[164] S. Wan, M. Dras, R. Dale, and C. Paris, "Using dependency-based features to take the “para-
farce” out of paraphrase," in Proceedings of the Australasian Language Technology
Workshop, 2006.
[165] W. Blacoe and M. Lapata, "A comparison of vector-based representations for semantic
composition," in Proceedings of the 2012 Joint Conference on Empirical Methods in Natural
Language Processing and Computational Natural Language Learning, 2012, pp. 546-556.
[166] N. Madnani, J. Tetreault, and M. Chodorow, "Re-examining machine translation metrics for
paraphrase identification," in Proceedings of the 2012 Conference of the North American
Chapter of the Association for Computational Linguistics: Human Language Technologies,
2012, pp. 182-190.
[167] Y. Ji and J. Eisenstein, "Discriminative Improvements to Distributional Sentence Similarity,"
in EMNLP, 2013, pp. 891-896.
[168] M. Hassel, "Exploitation of named entities in automatic text summarization for swedish," in
NODALIDA’03–14th Nordic Conferenceon Computational Linguistics, Reykjavik, Iceland,
May 30–31 2003, 2003, p. 9.
[169] A. Aker and R. Gaizauskas, "Generating descriptive multi‐ document summaries of geo‐
located entities using entity type models," Journal of the Association for Information Science
and Technology, vol. 66, pp. 721-738, 2015.
[170] W. Li, B. Li, and M. Wu, "Query focus guided sentence selection strategy for duc 2006," in
Proceedings of Document Understanding Conferences, 2006, p. 20.

206
[171] W. Li, F. Wei, O. You, Q. Lu, and Y. He, "Exploiting the role of named entities in query-
oriented document summarization," in PRICAI 2008: Trends in Artificial Intelligence, ed:
Springer, 2008, pp. 740-749.
[172] C. Shen, T. Li, and C. H. Ding, "Integrating Clustering and Multi-Document Summarization
by Bi-Mixture Probabilistic Latent Semantic Analysis (PLSA) with Sentence Bases," in
AAAI, 2011.
[173] K. Allan, "Natural language semantics," 2001.
[174] C. F. Baker, C. J. Fillmore, and J. B. Lowe, "The berkeley framenet project," in Proceedings
of the 17th international conference on Computational linguistics-Volume 1, 1998, pp. 86-90.
[175] C. J. Fillmore and C. Baker, "A frames approach to semantic analysis," The Oxford handbook
of linguistic analysis, pp. 313-339, 2010.
[176] M. Palmer, D. Gildea, and P. Kingsbury, "The proposition bank: An annotated corpus of
semantic roles," Computational linguistics, vol. 31, pp. 71-106, 2005.
[177] J. Christensen, S. Soderland, and O. Etzioni, "Semantic role labeling for open information
extraction," in Proceedings of the NAACL HLT 2010 First International Workshop on
Formalisms and Methodology for Learning by Reading, 2010, pp. 52-60.
[178] D. Gildea and D. Jurafsky, "Automatic labeling of semantic roles," Computational linguistics,
vol. 28, pp. 245-288, 2002.
[179] D. Gildea and M. Palmer, "The necessity of parsing for predicate argument recognition," in
Proceedings of the 40th Annual Meeting on Association for Computational Linguistics, 2002,
pp. 239-246.
[180] P. Koomen, V. Punyakanok, D. Roth, and W.-t. Yih, "Generalized inference with multiple
semantic role labeling systems," in Proceedings of the Ninth Conference on Computational
Natural Language Learning, 2005, pp. 181-184.
[181] J. Chen and O. Rambow, "Use of deep linguistic features for the recognition and labeling of
semantic arguments," in Proceedings of the 2003 conference on Empirical methods in natural
language processing, 2003, pp. 41-48.
[182] R. Collobert, J. Weston, L. Bottou, M. Karlen, K. Kavukcuoglu, and P. Kuksa, "Natural
language processing (almost) from scratch," The Journal of Machine Learning Research, vol.
12, pp. 2493-2537, 2011.
[183] E. Gabrilovich and S. Markovitch, "Overcoming the brittleness bottleneck using Wikipedia:
Enhancing text categorization with encyclopedic knowledge," in AAAI, 2006, pp. 1301-1306.
[184] O. Egozi, S. Markovitch, and E. Gabrilovich, "Concept-based information retrieval using
explicit semantic analysis," ACM Transactions on Information Systems (TOIS), vol. 29, p. 8,
2011.
[185] A. Björkelund, L. Hafdell, and P. Nugues, "Multilingual semantic role labeling," in
Proceedings of the Thirteenth Conference on Computational Natural Language Learning:
Shared Task, 2009, pp. 43-48.
[186] L. Page, S. Brin, R. Motwani, and T. Winograd, "The PageRank citation ranking: bringing
order to the Web," 1999.
[187] A. Abuobieda, N. Salim, Y. J. Kumar, and A. H. Osman, "Opposition differential evolution
based method for text summarization," in Intelligent Information and Database Systems, ed:
Springer, 2013, pp. 487-496.
[188] S. Xu, H. Jiang, and F. Lau, "User-oriented document summarization through vision-based
eye-tracking," in Proceedings of the 14th international conference on Intelligent user
interfaces, 2009, pp. 7-16.

207
[189] C. Aksoy, A. Bugdayci, T. Gur, I. Uysal, and F. Can, "Semantic argument frequency-based
multi-document summarization," in Computer and Information Sciences, 2009. ISCIS 2009.
24th International Symposium on, 2009, pp. 460-464.
[190] K. Owczarzak and H. T. Dang, "Overview of the TAC 2011 summarization track: Guided
task and AESOP task," in Proceedings of the Text Analysis Conference (TAC 2011),
Gaithersburg, Maryland, USA, November, 2011.
[191] H. Liu and P. Singh, "ConceptNet—a practical commonsense reasoning tool-kit," BT
technology journal, vol. 22, pp. 211-226, 2004.
[192] M. Mohamed and M. Oussalah, “Graph-based Single and Multi-document Summarization
Approach using Semantic Role Labelling with Wikipedia Concepts”, proceeding of IEEE
BigdataService 2016, Oxford, UK 29 March – 01 April 2016.
[193] Mourad Oussalah, W. Zhebotian, M. Mohamed, “Analysis of Personality trait identification
and Prediction Using Twitter dataset.”, Computers in Human Behaviour, 2016 (accepted).

208
Appendices

209
Appendix A
Proofs
The following proofs provide a further explanation about the properties of the taxonomy-
based similarity measures discussed in Section 4.2.3 of Chapter 4.
Proof of Property 2
The implication Simx(ci, cj) = 1 ⇐ ci = cj is trivial from the reflexivity property of the three
semantic similarity measures. To prove the reverse implication Simx(ci, cj) = 1 ⇒ ci = cj,
one shall proceed for each similarity measure, and noticing that len(ci, cj) = 1 only if ci =
cj.
- Using path length measure in (4.1), we have: 1
len(ci,cj)= 1 ⇒ len(ci, cj) = 1 ⇒ ci = cj.
- Using normalized lch measure in (4.3), we have: Simlch(ci, cj) = log(2 ∗ max _depth)
so, 2∗max _depth
len(ci,cj)= 2 ∗ max _depth ⇒ len(ci , cj) = 1 ⇒ ci = cj
- Using WuP measure in (4.2), let us assume that 𝑐𝑖 , 𝑐𝑗have distinct nodes in the taxonomy.
Then, let depth(lcs((ci,cj))=l, length(ci,lcs)=l1, lenth(cj, lcs)=l2. Therefore, depth(ci)=l+l1,
depth(cj)=l+l2. So, 𝑆𝑖𝑚𝑤𝑝(𝑐𝑖, 𝑐𝑗) = 1 ⇒2𝑙
2𝑙+𝑙1+𝑙2= 1 ⇒ 𝑙1 + 𝑙2 = 0 ⇒ (𝑙1 = 0 𝑎𝑛𝑑 𝑙2 =
0) ⇒ 𝑐𝑖 = 𝑐𝑗 .
Proof of Property 4
To prove the statements in property 4, let us consider without loss of generality the generic
taxonomy of Figure A.1 showing the path between the two synsets c1 and c2 as well as their
lower common subsummer. From the figure, the path and Wup measures can be given as:

210
𝑆𝑖𝑚𝑝𝑎𝑡ℎ(𝑐𝑖, 𝑐𝑗) =1
𝑝+𝑞, 𝑆𝑖𝑚𝑤𝑢𝑝(𝑐𝑖, 𝑐𝑗) =
2𝑙
2𝑙+𝑝+𝑞. Since parameters p, q and l are positively
valued, it holds that 𝑝 + 𝑞 + 2𝑙 ≥ 𝑝 + 𝑞, this again entails that: 1
𝑝+𝑞+2𝑙≤
1
𝑝+𝑞 ≤
2𝑙
𝑝+𝑞
(Since 2𝑙 > 1). Thus, the inequality 𝑆𝑖𝑚𝑝𝑎𝑡ℎ(𝑐𝑖, 𝑐𝑗) ≤ 𝑆𝑖𝑚𝑤𝑢𝑝(𝑐𝑖, 𝑐𝑗) trivially holds.
Denoting for simplicity, 𝑥 = 𝑙𝑒𝑛(𝑐𝑖, 𝑐𝑗), d = max_depth, then 𝑆𝑖𝑚𝑤𝑢𝑝(𝑐𝑖, 𝑐𝑗) ≤ 𝑆𝑖𝑚𝑙𝑐ℎ∗ (𝑐𝑖, 𝑐𝑗)
is equivalent to log(
2𝑑
𝑥)−log 2
log(2𝑑)−log 2≥
1
𝑥 or, equivalently
−log 𝑥+log(2𝑑)−log 2
log(2𝑑)−log 2−
1
𝑥≥ 0. By deriving
the latter with respect to x, we have 1
𝑥(
1
𝑥−
1
log(2𝑑)−log 2) ≥ 0 which always holds, since d>x
and both parameters are positively valued.
Figure A.1: A taxonomy of two concepts
Proof of Property 6
To illustrate the skeleton of the proofs for the statements in property 6, let us consider the
generic two examples shown in Figure A.2. To prove the statement in i), notice that Figure
A.2 (a) highlights a typical scenario which 𝑐1, 𝑐2, 𝑐1′ and 𝑐2
′ have the same lower common
subsumer. In such case, it holds that:

211
𝑙𝑒𝑛(𝑐1′ , 𝑐2
′ ) = 𝑝′ + 𝑞′ ≤ 𝑝 + 𝑞 = 𝑙𝑒𝑛(𝑐1, 𝑐2) ⇒ 𝑆𝑖𝑚𝑝𝑎𝑡ℎ(𝑐1′ , 𝑐2
′ ) ≥ 𝑆𝑖𝑚𝑝𝑎𝑡ℎ(𝑐1, 𝑐2 ) . This entails
𝑆𝑖𝑚𝑙𝑐ℎ∗ (𝑐1
′ , 𝑐2′ ) ≥ 𝑆𝑖𝑚𝑙𝑐ℎ
∗ (𝑐1, 𝑐2). Similarly, we have 𝑆𝑖𝑚𝑤𝑢𝑝∗ (𝑐1
′ , 𝑐2,′ ) =
2𝑙
𝑝′+𝑞′+2𝑙 ≥
2𝑙
𝑝+𝑞+2𝑙=
𝑆𝑖𝑚𝑤𝑢𝑝(𝑐1, 𝑐2). To prove statement ii) where synsets are such that 𝑐1′ and 𝑐2
′ are direct
hyponyms of 𝑐1 and 𝑐2 without a lowest super-ordinate concept, one notices that such
scenario implicitly entails that either c1 is the common sub-ordinate of c2 or vice versa. For
instance if c1 is the most specific common subsumer, the following diagram holds
𝑐2 → 𝑐2′ … → 𝑐1 → 𝑐1
′ →. . . 𝑅𝑜𝑜𝑡
Figure A.2: An example of related synsets
In such case, it holds that 𝑙𝑒𝑛(𝑐1′ , 𝑐2
′ ) = 𝑙𝑒𝑛(𝑐1, 𝑐2) ⇒ 𝑆𝑖𝑚𝑝𝑎𝑡ℎ(𝑐1′ , 𝑐2
′ ) = 𝑆𝑖𝑚𝑝𝑎𝑡ℎ(𝑐1, 𝑐2).
For similar arguments, 𝑆𝑖𝑚𝑙𝑐ℎ∗ (𝑐1
′ , 𝑐2′ ) = 𝑆𝑖𝑚𝑙𝑐ℎ
∗ (𝑐1, 𝑐2) while, 𝑆𝑖𝑚𝑤𝑢𝑝(𝑐1′ , 𝑐2
′ ) =
2(𝑙−1)
𝑙𝑒𝑛(𝑐1′ ,𝑐2
′ )+2𝑙−2 ≤
2𝑙
𝑙𝑒𝑛(𝑐1,𝑐2)+2𝑙= 𝑆𝑖𝑚𝑤𝑢𝑝(𝑐1, 𝑐2). So, in both cases it holds that
𝑆𝑖𝑚∗(𝑐1, 𝑐2) ≥ 𝑆𝑖𝑚∗(𝑐1′ , 𝑐2
′ ).
c1
c2
p
q
l
Root Node
c’1 c’
2
q’ p’
c1 c2
p
q
l
Root Node
c’1
c’2
q’
p’
a) b)

212
To prove iii), it suffices to see Figure A.2 (b), where 𝑙𝑒𝑛(𝑐1′ , 𝑐2
′ ) = 𝑝′ + 𝑙 − 𝑞′ while
𝑙𝑒𝑛(𝑐1, 𝑐2) = 𝑝 + 𝑞. Since l is fully independent of q, 𝑙𝑒𝑛(𝑐1′ , 𝑐2
′ ) can be greater, equals to or
smaller than 𝑙𝑒𝑛(𝑐1, 𝑐2) so that no specific ordering can be established. Same reasoning
applies when calculating the depth of the synsets, which renders 𝑆𝑖𝑚∗(𝑐1, 𝑐2 ) and
𝑆𝑖𝑚∗(𝑐1′ , 𝑐2
′ ) not comparable.
Proof of Property 7
From the assumption that 𝑐𝑖 is a direct hyponym of 𝑐𝑗, it follows 𝑐𝑖 is also the least common
subsumer of the two sysnsets. So, if 𝑑𝑒𝑝𝑡ℎ(𝑐𝑖) = l, then 𝑑𝑒𝑝𝑡ℎ(𝑐𝑗) = 𝑙 + 1. Therefore,
𝑆𝑖𝑚𝑤𝑢𝑝(𝑐𝑖, 𝑐𝑗) =2𝑙
2𝑙+1. Noticing that the above expression is non-decreasing in l, and for
distinct synsets, the minimum value of l is 2, which, after substituting in the above
expression, yields 𝑆𝑖𝑚𝑤𝑢𝑝(𝑐𝑖, 𝑐𝑗) = 0.8. The result follows straightforwardly that if 𝑐𝑖 is a
direct hyponym of 𝑐𝑗, then len(𝑐𝑖, 𝑐𝑗 ) = 2, so after substituting in (4.1) and (4.4), the result ii)
and iii) of property 7 are trivial.
Proof of Property 8
The hyponymy relation can be represented as c1→ c2 →c3 →…cn-1 →cn →… RootNode.
Given that 𝑙𝑒𝑛(𝑐1, 𝑐2) = 2 ≤ 𝑙𝑒𝑛(𝑐1, 𝑐3) = 3 ≤ ⋯ ≤. 𝑙𝑒𝑛(𝑐1, 𝑐𝑘) = 𝑘 𝑓𝑜𝑟 𝑘 = 4, 𝑛. This
indicates that the statement in property 8 trivially holds for path and lch similarity. For WuP
similarity, assume a length l from cn till RootNode , then it holds: Sim(c1, c2) =2(l+n−1)
l+n+l+n−1=
2(l+n−1)
2(l+n−1)−1=
1
1+1
2(l+n−1)
While 𝑆𝑖𝑚(𝑐1, 𝑐𝑘) =2(𝑙+𝑛−𝑘−1)
𝑙+𝑛+𝑙+𝑛−𝑘−1 ⇒
2(𝑙+𝑛−𝑘−1)
2(𝑙+𝑛−𝑘−1)+𝑘+1⇒
1
1+𝑘+1
2(𝑙+𝑛−𝑘−1)
for k=3,n. Noticing that 1
2(𝑙+𝑛−1)<
𝑘+1
2(𝑙+𝑛−𝑘−1) since this is equivalent to

213
[2𝑙 − 2(𝑘 + 1)𝑙] + [2𝑛 − 2(𝑘 + 1)𝑛] + [−2 − 2(𝑘 + 1)] < 0 , which trivially holds since
each expression under square bracket on the left hand side of the last inequality is always
negatively valued for k greater or equal than 3. This yields 𝑚∗(𝑐1, 𝑐2) ≥ 𝑆𝑖𝑚∗(𝑐1, 𝑐𝑘)
𝑓𝑜𝑟 𝑘 = 3, 𝑛, which by a simple induction reasoning, also yields the proceeding inequality.

214
Appendix B
Publications
Published Papers
[1] Mohamed, Muhidin A., and Mourad Oussalah. "Similarity-Based Query-Focused
Multi-document Summarization Using Crowdsourced and Manually-built Lexical-Semantic
Resources." Trustcom/BigDataSE/ISPA, 2015 IEEE. Vol. 2. IEEE, 2015.
[2] Mohamed, Muhidin A., and Mourad Oussalah. "A Comparative Study of Conversion
Aided Methods for WordNet Sentence Textual Similarity.”, COLING 2014, Dublin, Ireland
23-29 August 2014: 37.
[3] Mohamed, Muhidin A., and Mourad Oussalah. “Identifying and Extracting Named-
entities from Wikipedia Database Using Entity Infoboxes.”, (IJACSA), 5(7), 2014.
Accepted Papers
[1] Mohamed, Muhidin A., and Mourad Oussalah. “Graph-based Single and Multi-
document Summarization Approach using Semantic Role Labelling with Wikipedia
Concepts”, IEEE BigdataService 2016, Oxford, UK 29 March – 01 April 2016.
[1] Mourad Oussalah, W. Zhebotian, M. Mohamed. “Analysis of Personality trait
identification and Prediction Using Twitter dataset.”, Computers in Human Behaviour, 2016.
Submitted Papers
[1] Mohamed, Muhidin A., and Mourad Oussalah. “A Hybrid Approach for Paraphrase
Identification Based on Knowledge-enriched Semantic Heuristics”, Information Processing &
Management Journal, under review, 2015.

215
[2] Mourad Oussalah, and Mohamed, Muhidin A., “Knowledge-based Sentence Semantic
Similarity Enhanced with Automatic Syntactic Category Conversion”, IEEE TKDE, under
review.

216
Appendix C
Sample Generated Summaries with the Proposed Summarisation Systems
In this section, we include sample extract summaries generated with our proposed
summarisation systems along with two model summaries created by human experts from the
same clusters and/or documents. We take an example document or cluster for each
summarisation task. Since the datasets are from standard publicly available corpora,
summarised documents and clusters are only indicated with references, such as their names
and the source corpus. For all reference summaries, we used the human summariser IDs as
assigned by the National Institute of Standards and Technology (NIST), the creator of the
summarisation datasets. The generated summaries are enforced to length limits of 100 words,
200 words, and 250 words for the generic single document, topic-focussed multi-document,
and query-focussed multi-document summarisations respectively.

217
Dataset: DUC2006
Cluster: D0618I
Title: Malaria Prevention and Treatment
Query: What efforts are being made to combat the spread of malaria and to treat
those currently affected?
Task: Query-focussed Multi-document Summarisation
Malaria prevention depends on two important measures -- taking a drug that combats the parasite
prior to infection, and avoiding bites by the Anopheles mosquito. Chloroquine has long been used to
prevent and treat malaria, and it is still used in areas where the parasite has not yet developed
resistance. An alternative, melfloquine (trade name Lariam) is extremely effective but very expensive
and has numerous incapacitating side-effects. Another effective alternative, doxycycline, has milder
side-effects than melfloquine but be taken more rigorously. A newer drug, Malarone, a combination
of atovaquone and proguanil (an old therapy), is in the process of gaining approval. It has numerous
side effects but they are less serious than those of melfloquine. Researchers are now widening their
focus to different aspects of the parasite's life cycle, and are developing a multi-pronged vaccine to
help the immune system at various stages of the disease. Protective clothing, insect repellents, and
curtains and netting (preferably insecticide-impregnated) are used for avoiding mosquito contact.
People are encouraged to destroy mosquito habitats by cleaning their surroundings and removing
stationary water ponds. Malaria is curable if detected early and treated appropriately. Fansidar is a
standby treatment, and only used in emergencies when patients develop malaria symptoms and are far
from medical care. One of the best hopes is a Chinese plant, ching hao su, which is being used in Asia
as a very effective treatment, but has yet to meet international standards. Funding is continually
sought for educational and early response programs and supplies.
Figure C.1: A summary extracted by the human summariser B for the cluster D0618I
Over the years, African health officials and leaders have met to coordinate and promote the
prevention and treatment of malaria on their continent. The African Initiative for Malaria Control
program covers all 46 countries. Organizations including the World Health Organization, World
Bank, U.N. agencies, and Western investors work to promote research into malaria prevention and
cure world-wide with campaigns such as Roll Back Malaria. These campaigns endorse the use of
insecticide-treated mosquito nets as the most effective tool for malaria prevention. Insecticide
spraying to kill mosquito larvae and educating local populations on malaria prevention and health care
awareness are other methods used to reduce the incidence of the disease. Tanzania encourages its
citizens to destroy the mosquito's habitat, clean their surroundings by cutting grass and shrubs around
houses, and destroying stationary water ponds. Anti-malaria drugs are used to prevent and treat the
disease. Chloroquine has been used effectively for decades, but the parasite has become resistant to it

218
in most areas. Mefloquine is used where the parasite is found to be chloroquine-resistent. Wherever
malaria strains are resistant to mefloquine, Doxycycline is used. Because of severe side-effects, the
drug Fansidar is used only as an emergency treatment. The new drug Malarone, a combination of
atovaquone and proguanil, has been approved for malaria prevention and treatment for adults and
children and is the first new anti-malaria option in over a decade. The ching hao su plant, which is
cultivated in China, is used there and in Vietnam as an effective malaria treatment.
Figure C.2: A summary extracted by the human summariser B for the cluster D0618I
Five Southern African Development Community SADC health ministers reached an agreement here
on Saturday on coordinating their efforts to combat malaria in the region. They established a working
group to investigate how to secure funds for malaria control plans and made recommendations on key
areas in malaria prevention, treatment and control, according to the statement. Complicating matters,
preventive measures have gotten trickier and much more costly in recent years, ever since the malaria
parasite in most areas developed resistance to chloroquine, the inexpensive and well-tolerated
medication that had long been used to prevent and treat malaria. The development of a consensus for
malaria survelliance, information systems and monitoring trends would also come under the spotlight
as well as reviewing the report of the first southern Africa malaria conference and recommending
strategies and methods for implementation and follow up. Malaria causes more than one million
deaths each year, according to WHO which coordinates the global partnership Roll Back Malaria
initiative that aims to halve the numbers of malaria deaths by the year 2020. At the end of the summit,
heads of state will issue a declaration on tackling malaria in Africa and new statistics on the crippling
effect malaria has on economic development in African countries will also be launched. The targets
adopted by the meeting included reduction of malaria mortality by 50 percent by the year 2010, and
reduce by at least half the socio-economic negatives of malaria. Malarone was approved to prevent
and treat malaria in adults and children.
Figure C.3: A summary extracted by the SRL-ESA feature based summariser in Chapter 6 for the
cluster D0618I

219
Dataset: DUC2005
Cluster: D438G
Title: Tourism in Great Britain
Query: What is the current status of tourism and the tourist industry in Great Britain?
Is it increasing or declining? How is tourism there affecting the UK economy?
Task: Query-focussed Multi-document Summarisation
Great Britain ranks sixth in the tourist destination league. Its tourist industry grew thirteen percent
between 1985 and 1992. The first quarter of 1993 was its best ever with 3.6 million visitors, up eight
percent from the same period in 1992. Tourist spending was up thirteen percent in the same period.
Overall, over nineteen million tourists visited Great Britain between 1992-1994, spending a record
Pounds 9.1 bn. A D-Day commemoration in 1994 increased tourism earnings from North America by
Pounds 73m, attracting 75,000 to 125,00 extra North American visitors. These increases were due
primarily to sterling devaluation and promotion abroad of red London busses and black cabs.
Heritage, countryside, arts and entertainment are the main attractions. Northern Scotland is getting
more attention from tourism because it is popular and golfing there is fairly cheap. Higher
expenditures by British travelers abroad, however, has led to a widening of tourism balance-of-
payment deficits. Between 1986-1993, spending on overseas tourism by UK citizens increased by
forty percent while spending by foreign tourists in Britain rose by less than five percent. The
proportion of British holiday makers taking holidays of four nights or more in the UK fell to fifty
percent compared to seventy percent in 1983. Britons tend to go abroad for sunshine and skiing,
which their own country cannot provide. Part of the problem also is that UK tourism is more
fragmented than the overseas package holiday industry. The English Tourist Board is urging travel
agencies to give more priority to domestic holidays.
Figure C.4: A summary extracted by the human summariser G for the cluster D438G
After a sharp decline during the 1991 Gulf War, tourism in the United Kingdom began a steady rise.
For example there were 3.2 millions visitors in the first quarter of 1992 and 3.6 million in the same
time in 1993. In all of 1993 overseas visits to the UK were up 4% to 19.3 million. Spending by
tourists also had a stead rise, with first quarter 1992 spending up 14% and first quarter 1993 up 13%.
In all of 1993 overseas tourists' spending was up 15% to 9.1 billion pounds. An additional rise
occurred in the summer of 1994 because of D-Day commemorations, which brought in an extra 73
million pounds. By 1994 tourism was one of the UK's leading industries. It created 5.6 % of the gross
domestic product, employed 1.4 million or 6% of the workforce, and brought in 10 billion pounds in
foreign exchange each year. Tourism jobs are less vulnerable to recession. Many farmers also found
farm tourism vital. In Scotland the tourism rise was small but steady and provided more stable jobs. In

220
northern Scotland it accounted for as much as 20% of the gross domestic product. A downside of
tourism was a decline in domestic tourism and a rise in UK citizens going abroad, which created a
travel account deficit in balance of payments of 3.7 billion pounds in 1993. The UK tourist industry
was also becoming concerned that it was losing in the battle for global tourism.
Figure C.5: A summary extracted by the human summariser J for the cluster D438G
Spending by overseas visitors to the UK rose 15 per cent to a record Pounds 9.1bn last year, but
higher expenditure by British travellers abroad led to a widening of the tourism balance-of-payments
deficit. Spending on overseas tourism increased by 40 per cent between 1986 and 1993, while the
money spent by foreign tourists in Britain rose by less than 5 per cent. For domestic travel, the
attractions of a door-to-door service helped increase spending on taxis by a third, while that on bus
fares fell by over a tenth. But global tourism growth makes it clear why the UK annual tourism
revenue growth of 5.7 per cent has caused a great deal of hand wringing within certain UK tourism
industry circles. With the government resources currently available, a growth rate of 1 per cent a year
was the maximum Scotland could achieve, with a 3 per cent rise in spending from overseas visitors
and static spending by English and Scottish tourists. But if the government were to allocate another
Pounds 5m to the Scottish Tourist Board for spending on UK marketing and another Pounds 2m for
overseas marketing, plus a substantial boost to training and capital spending, annual growth of 3 per
cent was achievable, he said, although that would still be less than the Irish republic and below the
OECD average. Although a record 19.2m foreign visitors came to the UK last year, Britain's share of
world tourism earnings fell from 6.7 per cent in 1980 to 4.3 per cent last year.
Figure C.6: A summary extracted by the Hybrid summariser in Chapter 5 for the cluster D438G

221
Dataset: DUC2005
Cluster: D068F
Task: Topic-focussed Multi-document Summarisation
Famous Allied Checkpoint Dividing East And West Berlin Removed Checkpoint Charlie, the Berlin
Wall border post that symbolized the Cold War, was hoisted into history today.With the wall being
dismantled daily in anticipation of German unification, U.S. officials decided to remove Checkpoint
Charlie with a grand flourish. Secretary of State James A. Baker III, Soviet Foreign Minister Eduard
Shevardnadze and their counterparts from France, Britain and the two Germanys presided over the
ceremony. The ceremony was closed to the public but not to the residents of the buildings that line
Friedrich Street, which had been divided by the Berlin Wall since 1961.Baker, Soviet Foreign
Minister Eduard Shevardnadze and the foreign ministers from France, Britain and the two Germanys
each heralded the end of the checkpoint as a symbol of change. The Soviet Union said today that a
united Germany can join NATO after a five-year transition period during which all Soviet and U.S.
troops would leave the country. The proposal was outlined by Soviet Foreign Minister Eduard
Shevardnadze during international talks in East Berlin on the strategic future of a united Germany. A
U.S. official, speaking on condition of anonymity, said U.S. officials objected to the five-year time
limit before Germany could join NATO.
Figure C.7: A summary extracted by the human summariser A for the cluster D068F
Checkpoint Charlie, the famed Allied border crossing on the west side of the Berlin Wall, was lifted
into the sky by a giant crane Friday, placed gently onto a flatbed truck and consigned to history.As a
brass band played and foreign ministers of the four World War II allies watched, a crane lifted the
prefabricated hut with its American, British and French flags and placed it on a flatbed truck to be
taken to a museum.The border crossing was the scene of stirring escapes and heartbreaking captures
as East Germans tried flee to the West, breaking through East German control stations just 20 yards
away from the Allied checkpoint.Secretary of State James A. Baker III, Soviet Foreign Minister
Eduard Shevardnadze and their counterparts from France, Britain and the two Germanys presided
over the ceremony.Shevardnadze, the first Soviet foreign minister to visit West Berlin, noted that the
checkpoint was vanishing on the 49th anniversary of the Nazi invasion of the Soviet Union .Former
West German Chancellor Willy Brandt, who emotionally challenged the building of the wall as mayor
of West Berlin in the early 1960s, was in the front row of an invited audience.
Figure C.8: A summary extracted by the human summariser E for the cluster D068F

222
As a brass band played and foreign ministers of the four World War II allies watched, a crane lifted
the prefabricated hut with its American, British and French flags and placed it on a flatbed truck to be
taken to a museum. Checkpoint Charlie went up in 1961 in the middle of the Friedrichstrasse
boulevard after Communist East Germany erected the Berlin Wall to choke off a flood of refugees to
the enclave of West Berlin. Checkpoint Charlie, the famed Allied border crossing by the Berlin Wall,
was to be hauled away Friday. The border crossing was the scene of stirring escapes and
heartbreaking captures as East Germans tried flee to the West, breaking through East German control
stations just 20 yards away from the Allied checkpoint. U.S. Army spokesman Sgt. Ed McCarthy said
he believes it is destined for a museum. Shevardnadze, the first Soviet foreign minister to visit West
Berlin, noted that the checkpoint was vanishing on the 49th anniversary of the Nazi invasion of the
Soviet Union. With huge sections of the Berlin Wall being ripped down daily, U.S. officials decided
two weeks ago to remove Checkpoint Charlie. Since East Germany overthrew its Communist
government last fall and the German borders were opened, Checkpoint Charlie has become as
superfluous as the crumbling Berlin Wall.
Figure C.9: A summary extracted by the SRL-ESA graph based summariser in Chapter 6 for the
cluster D068F

223
Dataset: DUC2002
Cluster: D070F
Document: AP900825-0099
Title: Honecker Unlikely To Go to Trial in East Germany
Task: Single Document Summarisation
Ousted East German leader, Erich Honecker will not stand trial in East Germany as long as the
formerly communist country exists. Honecker could be prosecuted in a united Germany, however, for
violation of property laws. Honecker is accused of using 42 million to stock a private housing estate
for leaders of the former Communist government. Since being ousted in October 1989, he remains
confined in a Soviet hospital outside Berlin in poor health. He is under investigation for abuse of
power, corruption, harboring terrorists and issuing shoot to kill orders to prevent East Germans from
escaping to West Germany.
Figure C.10: A summary extracted by the human summariser D for the document AP900825-0099
A West German newspaper reported that ousted East German leader Erich Honecker will not stand
trial in East Germany as long as the formerly Communist country exists, although he could be
prosecuted in a united Germany for violation of property laws. Honecker allegedly used $42 million
for stocking a private housing estate for Communist government leaders. However, the investigation
is not far enough along to determine whether charges would be filed against Honecker before the East
German-West German merger. He is under investigation for abuse of power, corruption, harboring
terrorists, and issuing shoot-to-kill orders against East Germans escaping to West Germany.
Figure C.11: A summary extracted by the human summariser G for the document AP900825-0099
Ousted East German leader Erich Honecker will not stand trial in East Germany as long as the
formerly Communist country exists, a West German newspaper reported. The Hamburg-based Bild
am Sonntag said Saturday that it would report in its Sunday editions that Honecker could be
prosecuted in a united Germany, however, for violation of property laws. He is under investigation on
allegations of abuse of power, corruption, harboring terrorists and issuing shoot-to-kill orders to
prevent East Germans from escaping to West Germany when he served as the country's leader. Bild
said that Erich Mielke, the ex-head of East Germany's former secret police, was also unlikely to go to
court in East Germany.
Figure C.12: A summary extracted by the SRL-ESA graph based summariser in Chapter 6 for the
document AP900825-0099

224
Appendix D
Measures of the ROUGE Package
As already pointed out (pages 36 and 136), the ROUGE is a set of metrics designed to
automatically assess the quality of a text summary. Such an evaluation counts the number of
overlapping content units, such as the n-grams, word sequences, and word pairs usually by
comparing system produced automatic summaries to human created reference summaries.
The following list briefly describes the different ROUGE measures.
ROUGE MEASURE DESCRIPTION
ROUGE-N This is the most popular metric of the ROUGE package. It
measures the n-gram (see page 33 for the definition of the n-
gram) co-occurrence statistics between automatically generated
system summary and manually created human reference
summaries. The N, at the end of the metric, stands for the length
of the n-gram. The changing length of the n-gram creates
different forms of the metric, such as the ROUGE-1 and the
ROUGE-2, which measure the unigram and bigram overlaps, in
order.
ROUGE-L The ROUGE-L is intended to compute the longest common
subsequence (LCS) shared between an automatic system
summary and a human reference summary. In other words, it
captures the common word sequence with the maximum length
that is present in both the system and the human summaries. The
measure does not differentiate between consecutive and
interrupted sequences. For example, if S1, H1, and H2 are

225
system and two human summaries with sequences ABCD,
AKBJ, ABMN, the two human summaries will have the same
ROUGE-L score because they share the same LCS (AB) with
the system summary.
ROUGE-W This measure is a weighted version of the ROUGE-L. Unlike
ROUGE-L, it distinguishes between sequences with consecutive
matches and sequences with interrupted matches by giving
preference to the former over the latter. For instance, in the case
of the previous example (the one in ROUGE-L), the ROUGE-W
assigns more weight to the LCS between S1 (ABCD) and H2
(ABMN) as the order of their common sequence is the same.
ROUGE-S The ROUGE-S counts Skip-bigram Co-occurrence Statistics
between the system and human summaries. A Skip-bigram is
any pair of words in their sentence order with any gaps in
between. For instance, if a given summary S has a sequence
ABCD, the following 6 Skip-bigrams can be formed; AB, AC,
AD, BC, BD, CD. The co-occurrence statistics is computed
after creating similar Skip-bigrams of the human reference
summary.
ROUGE-SU One major weakness of the ROUGE-S is that it only assigns
scores based on the existence of word pair co-occurrences. This
overlooks other likely n-gram overlaps. The ROUGE-SU
handles this drawback by combining the Skip-bigram with a
unigram co-occurrence counts.