Atta1
Transcript of Atta1
JASMIN SHAH et al., J.Chem.Soc.Pak., Vol. 34, No. 1, 2012 58
Adsorptive Removal of Ni (II) from Aqueous Solutions using Carbon Derived from Mulberry Wood Sawdust
JASMIN SHAH*, MUHAMMAD RASUL JAN, ATTA UL HAQ AND MARIA SADIA
Institute of Chemical Sciences, University of Peshawar, Peshawar, Pakistan. [email protected]*
(Received on 7th December 2010, accepted in revised form 29th June 2011)
Summary: Carbon derived from mulberry wood sawdust treated with sodium hydroxide was investigated through adsorption process for the removal of Ni (II) from aqueous solution. Sawdust carbon (SDC) and chemically treated sawdust carbon (CSDC) were characterized using SEM, FTIR. The effect of variables like pH, contact time, initial Ni (II) concentration, sorbent dose and temperature were studied. Maximum % uptake of Ni (II) ion (86.50 %) was achieved at pH 7. The maximum Ni (II) removed from aqueous solution in 70 min after the starting of each experiment. The batch adsorption kinetic studies have been carried out and the applicability of the Freundlich and Langmuir adsorption isotherms were conducted at room temperature for the Ni (II) in aqueous system. The adsorption data fit well in Langmuir adsorption model. The pseudo-first-order, pseudo-second-order, intraparticle diffusion and Elovich models were tested for kinetic study. The data shows that pseudo-second-order model (R2 > 0.99) was the best choice among the kinetic models for description of adsorption of Ni (II) on CSDC. The spontaneous and endothermic nature of the sorption process was revealed from thermodynamic parameters such as standard entropy, free energy and enthalpy. The effect of some common alkali and alkaline earth metal ions were also studied which showed that the presence of these ions have no effect on the sorption of Ni (II). The results showed that CSDC has the potential to be used as a low cost sorbent for the removal of Ni (II) from aqueous solutions.
Introduction
Trace elements have been the focus of attraction for researchers due to their toxicity and hazardous effects on human health as well as on the environment. Among these elements; nickel had been considered as an important metal for plants and animals, but it had not been proved that Nickel is important from biological point of view, until Zerner in 1975 discovered an enzyme called urease, which was a nickel enzyme [1].
The inhalation of nickel soluble compounds
can cause irritation of nose and sinuses due to cellular absorption and could also lead to loss of smell sense. The respiratory tract is the primary target of inhaled soluble nickel compounds and long exposure may lead to bronchitis, asthma and other respiratory diseases [2-5]. Nickel is used in electroplating, computer accessories, surgical and dental prostheses, ceramics, magnetic tapes, and pigments for paints and as a catalyst. There are different sources from which nickel enters into water bodies, e.g. biological cycles, erosion of soil and rocks, atmosphere and mostly from the industrial effluents [3, 6-9].
For the removal and pre-concentration of
various metal ions low cost and easily available sorbents have been reported in recent years like sawdust [10], peat biomass [11], vegetable sponge [12], rice polish [13], algae [14], coal fly ash [15], yeast biomass [16], rice husk [17], seaweed waste [18], bone char [19], brown marine macro algae [20]
and spent grain [21] have been used for the adsorption and separation of metal ions.
Due to the best adsorption properties and
high specific surface area, the activated carbon has been used for the treatment of industrial and household water with a purpose of removal of metal ions. The high cost of commercial activated carbon limits its use in the adsorption process for removal of metal ions and organic compounds [22-25].
The main aim of the present work is to
develop a cheap and suitable adsorbent from wood waste for removal of Ni (II) from waste water and water. Sawdust is a solid waste of saw mills produced in large amounts. An activated carbon from mulberry wood sawdust has been prepared and used for the removal of Ni (II) from aqueous solutions. The experimental results show that the carbon derived from the above mentioned source is not only low in cost and has high adsorption capacity for Ni (II) but also obtained at low temperature i.e. 250 ˚C as compared to temperatures (500-700°C) reported in literature for conversion of different biomass into carbon [26-31]. Results and Discussions Characteristics of Adsorbent
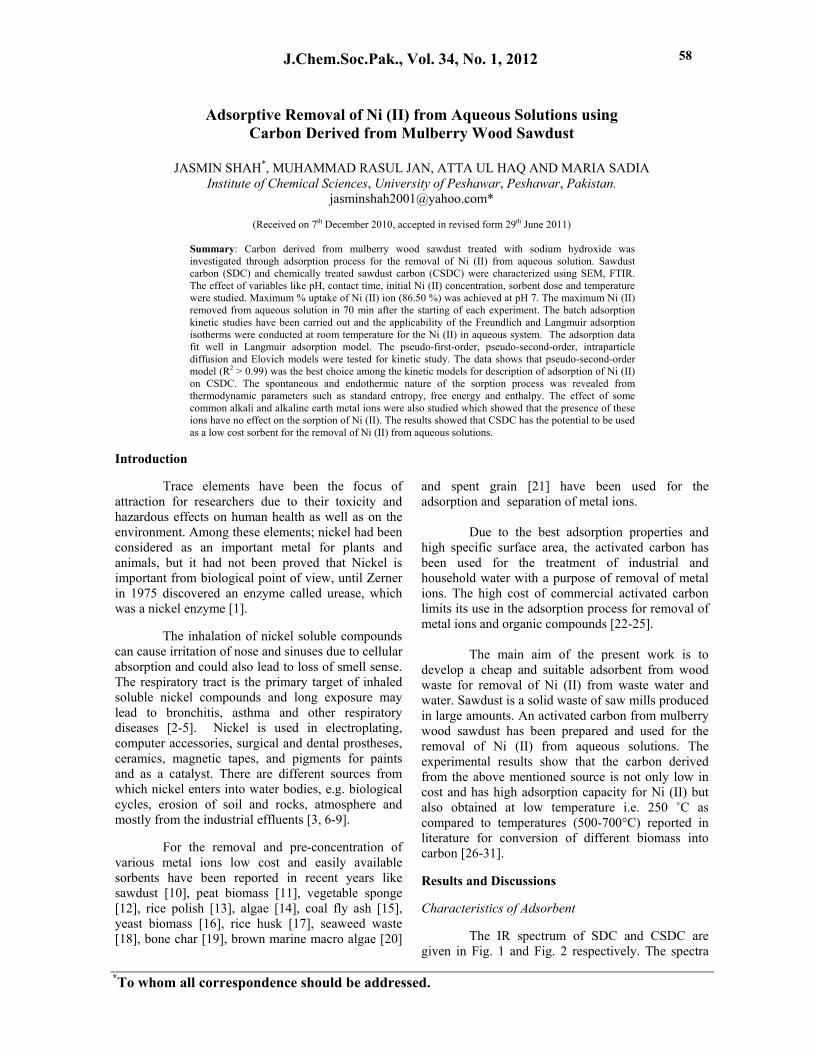
The IR spectrum of SDC and CSDC are
given in Fig. 1 and Fig. 2 respectively. The spectra
J.Chem.Soc.Pak., Vol. 34, No. 1, 2012
*To whom all correspondence should be addressed.
JASMIN SHAH et al., J.Chem.Soc.Pak., Vol. 34, No. 1, 2012 59
have been used qualitatively for the functionality of SDC and CSDC. A broad band in the region of high wave numbers (3359.24 cm-1 and 3379 cm-1) shows the presence of – OH group on the surface of both types of carbons. A strong peak at 1574.76 cm-1 in CSDC and at 1578.23 cm-1 in SDC indicates the presence of stretching vibrations of C - C of aromatic C = C group, the peaks at 1211.55 cm-1 and 1031.78 cm-1 in CSDC and 1215.10 cm-1 in SDC are due to the presence of C-O group. The surface properties of both carbon samples were determined by N2 adsorption method (Table-1). CSDC possesses the values of large surface area and average pore width as compared to SDC.
Fig. 1: IR spectrum of chemically untreated SDC.
Fig. 2: IR spectrum of chemically treated SDC.
Table-1: Characterization of chemically treated and untreated sawdust carbon.
Physical properties of SDC and CSDC Surface area DR method Sample
BET (m2/g)
Langmuir (m2/g)
Average pore width (Å)
Micropore volume (cm3/g)
SDC 6.61 36.35 38.97 0.01 CSDC 11.94 66.54 55.08 0.02
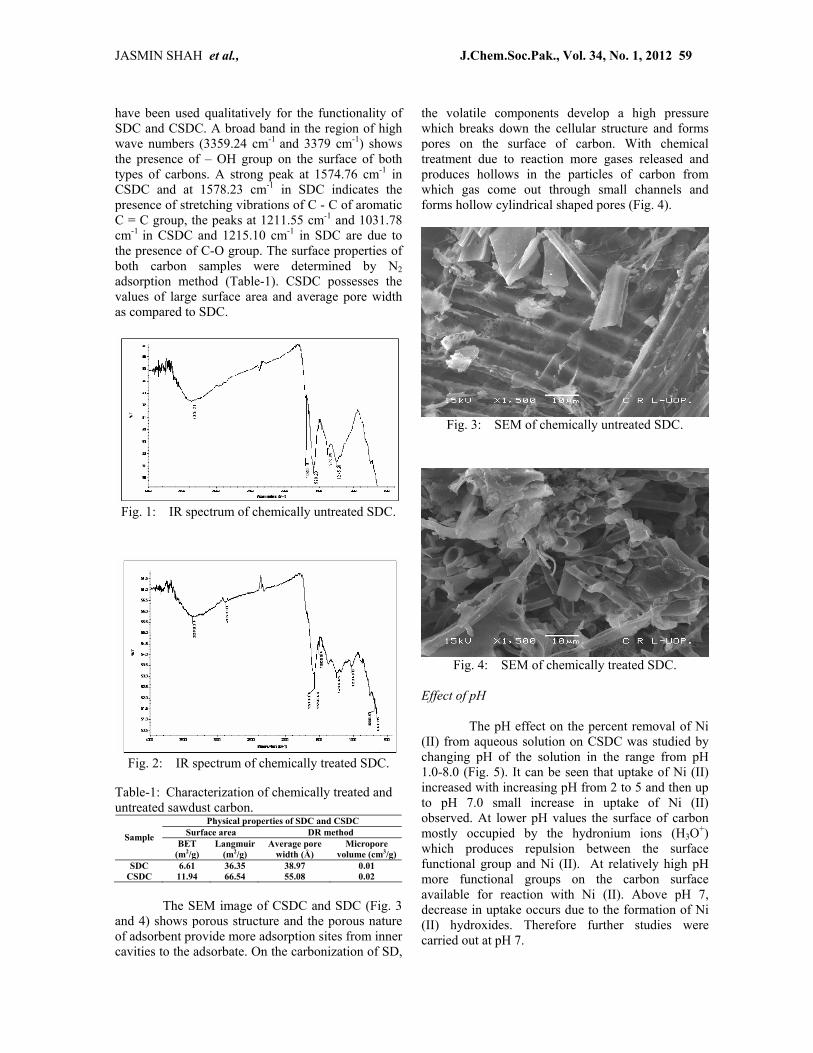
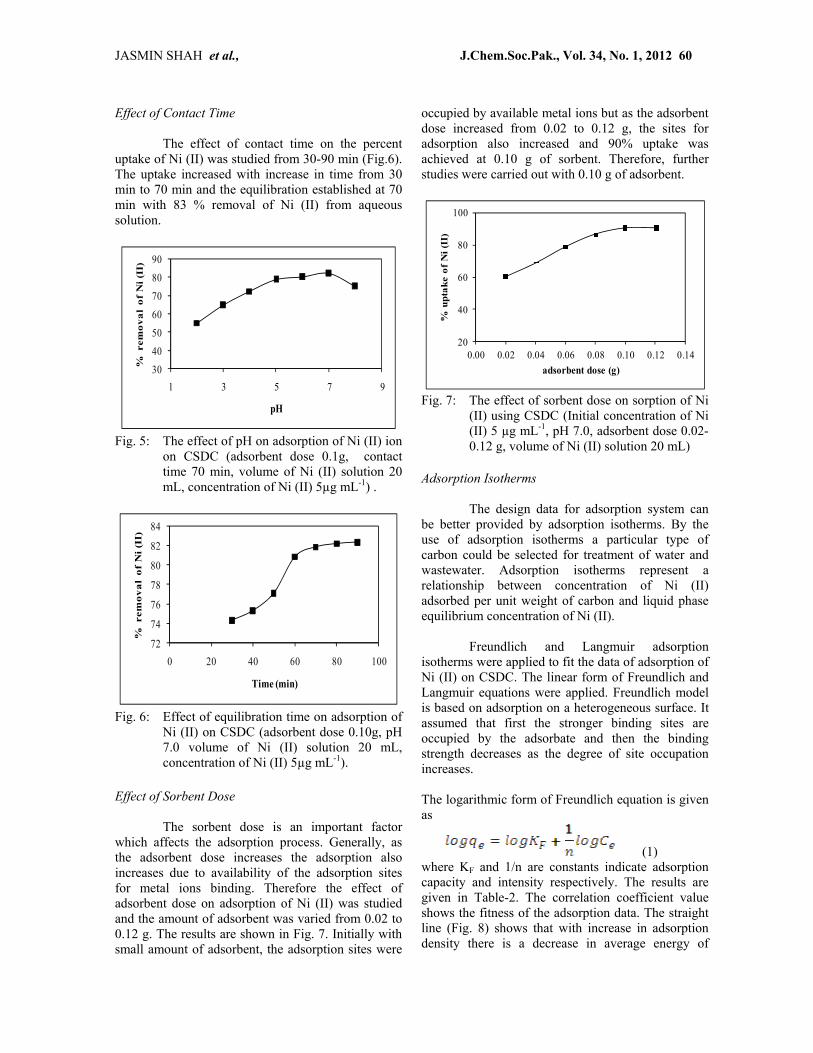
The SEM image of CSDC and SDC (Fig. 3
and 4) shows porous structure and the porous nature of adsorbent provide more adsorption sites from inner cavities to the adsorbate. On the carbonization of SD,
the volatile components develop a high pressure which breaks down the cellular structure and forms pores on the surface of carbon. With chemical treatment due to reaction more gases released and produces hollows in the particles of carbon from which gas come out through small channels and forms hollow cylindrical shaped pores (Fig. 4).
Fig. 3: SEM of chemically untreated SDC.
Fig. 4: SEM of chemically treated SDC.
Effect of pH
The pH effect on the percent removal of Ni
(II) from aqueous solution on CSDC was studied by changing pH of the solution in the range from pH 1.0-8.0 (Fig. 5). It can be seen that uptake of Ni (II) increased with increasing pH from 2 to 5 and then up to pH 7.0 small increase in uptake of Ni (II) observed. At lower pH values the surface of carbon mostly occupied by the hydronium ions (H3O+) which produces repulsion between the surface functional group and Ni (II). At relatively high pH more functional groups on the carbon surface available for reaction with Ni (II). Above pH 7, decrease in uptake occurs due to the formation of Ni (II) hydroxides. Therefore further studies were carried out at pH 7.
JASMIN SHAH et al., J.Chem.Soc.Pak., Vol. 34, No. 1, 2012 60
Effect of Contact Time
The effect of contact time on the percent uptake of Ni (II) was studied from 30-90 min (Fig.6). The uptake increased with increase in time from 30 min to 70 min and the equilibration established at 70 min with 83 % removal of Ni (II) from aqueous solution.
30
40
50
60
70
80
90
1 3 5 7 9
% r
emov
al o
f N
i (II
)
pH
Fig. 5: The effect of pH on adsorption of Ni (II) ion
on CSDC (adsorbent dose 0.1g, contact time 70 min, volume of Ni (II) solution 20 mL, concentration of Ni (II) 5µg mL-1) .
72
74
76
78
80
82
84
0 20 40 60 80 100
% r
emov
al o
f N
i (II
)
Time (min)
Fig. 6: Effect of equilibration time on adsorption of
Ni (II) on CSDC (adsorbent dose 0.10g, pH 7.0 volume of Ni (II) solution 20 mL, concentration of Ni (II) 5µg mL-1).
Effect of Sorbent Dose
The sorbent dose is an important factor
which affects the adsorption process. Generally, as the adsorbent dose increases the adsorption also increases due to availability of the adsorption sites for metal ions binding. Therefore the effect of adsorbent dose on adsorption of Ni (II) was studied and the amount of adsorbent was varied from 0.02 to 0.12 g. The results are shown in Fig. 7. Initially with small amount of adsorbent, the adsorption sites were
occupied by available metal ions but as the adsorbent dose increased from 0.02 to 0.12 g, the sites for adsorption also increased and 90% uptake was achieved at 0.10 g of sorbent. Therefore, further studies were carried out with 0.10 g of adsorbent.
20
40
60
80
100
0.00 0.02 0.04 0.06 0.08 0.10 0.12 0.14
% u
ptak
e of
Ni (
II)
adsorbent dose (g)
Fig. 7: The effect of sorbent dose on sorption of Ni
(II) using CSDC (Initial concentration of Ni (II) 5 µg mL-1, pH 7.0, adsorbent dose 0.02-0.12 g, volume of Ni (II) solution 20 mL)
Adsorption Isotherms
The design data for adsorption system can
be better provided by adsorption isotherms. By the use of adsorption isotherms a particular type of carbon could be selected for treatment of water and wastewater. Adsorption isotherms represent a relationship between concentration of Ni (II) adsorbed per unit weight of carbon and liquid phase equilibrium concentration of Ni (II).
Freundlich and Langmuir adsorption
isotherms were applied to fit the data of adsorption of Ni (II) on CSDC. The linear form of Freundlich and Langmuir equations were applied. Freundlich model is based on adsorption on a heterogeneous surface. It assumed that first the stronger binding sites are occupied by the adsorbate and then the binding strength decreases as the degree of site occupation increases. The logarithmic form of Freundlich equation is given as
(1) where KF and 1/n are constants indicate adsorption capacity and intensity respectively. The results are given in Table-2. The correlation coefficient value shows the fitness of the adsorption data. The straight line (Fig. 8) shows that with increase in adsorption density there is a decrease in average energy of

JASMIN SHAH et al., J.Chem.Soc.Pak., Vol. 34, No. 1, 2012 61
adsorption. The value of 1/n is indication of favorable adsorption process. Table-2: Freundlich and Langmuir isotherm constants for the adsorption of Ni (II) on CSDC (at room temperature, pH 7.0)
Parameter Ni (II) Freundlich isotherm
KF (L/g) 0.047 n 1.254
1/n 0.797 R2 0.9960
Langmuir isotherm aL (L/mg) 0.025 KL (L/g) 2.500
Qo (mg/g) 100.00 R2 0.9994
0.00.51.01.52.02.53.03.5
0 50 100 150 200
qe
(g/g
)
Equilibrium concentration (Ce) (µg mL-1)
Fig. 8: Freundlich isotherm for adsorption of Ni (II) ion on CSDC (adsorbent dose 0.1g, contact time 70 min, volume of Ni (II) solution 20 mL, pH 7.0; concentration of Ni (II) 5-300 µg mL-1).
The Langmuir adsorption isotherm applies
to adsorption process on homogeneous surfaces with the assumption that each site on adsorbent is capable of adsorbing one molecule. Therefore the adsorbed layer will be monolayer. The linear form of Langmuir isotherm is as follows.
(2) where Ce is the equilibrium concentration (µg mL-1), qe is the amount of solute adsorbed per gram of adsorbent; KL and aL are the Langmuir adsorption isotherm constants and are related to the maximum capacity (L g-1) and bonding strength (L mg-1) respectively. The theoretical monolayer capacity is Qo and is numerically equal to KLaL
-1 (Fig. 9).
It is shown from Table-2 that the maximum
monolayer adsorption capacity (Qo) is 100 mg g-1. The data shows that both Freundlich and Langmuir
isotherm models can be used to describe the adsorption behavior of Ni (II) on CSDC.
0.00E+00
2.00E-04
4.00E-04
6.00E-04
8.00E-04
1.00E-03
1.20E-03
0 20 40 60
Ce/
q e
Equilibrium concentration (Ce) (µg mL-1) Fig. 9: Langmuir adsorption isotherm for
adsorption of cadmium on CSDC (adsorbent dose 0.1g, contact time 70 min, volume of Ni (II) ion solution 20 mL, pH 7.0, concentration of Ni (II) 5-300 µg mL-1).
Kinetics of Adsorption
The adsorption kinetics of the Ni (II) on CSDC was studied by using Lagergren pseudo first order and pseudo second order, intraparticle diffusion and Elovich models. The equation of pseudo first order kinetic is as:
(3) where qe is the amount of Ni (II) adsorbed (mg g-1) at equilibrium, qt is the amount of Ni (II) adsorbed (mg g-1) at time t (min), K1 is the pseudo-first-order reaction rate constant for adsorption (min-1). The pseudo second order kinetic equation is as:
(4) where qe is the amount of Ni (II) adsorbed (mg g-1) at equilibrium, qt is the amount of Ni (II) adsorbed (mg g-1) at time (min), K2 is the pseudo-second-order reaction rate constant for adsorption (g/ (mg min-1)).
The constant parameters for adsorption K1
and K2 from pseudo first order and pseudo second order kinetic were calculated from the plots of log (qe-qt) versus time t, and the plot of t/qt versus time t given in Fig. 10 and Fig. 11 respectively. The correlation coefficient and constant parameters are shown in Table-3. The correlation coefficient value (R2 = 0.9980) of pseudo second order equation suggests that it best fitted to the results as compared to the pseudo first order equation (R2 = 0.9270).
The possibility of intraparticle diffusion
instead of adsorption at the surface of adsorbents was

JASMIN SHAH et al., J.Chem.Soc.Pak., Vol. 34, No. 1, 2012 62
explained by intraparticle diffusion model. The model can be described as:
(5) where qt is the amount of Ni (II) adsorbed (mg g-1) at time (t) and Kint is the intraparticle diffusion rate constant. The value of Kint (mg g-1 sec1/2) was calculated from slope of the liner plot of qt versus t1/2. The results are given in Table-3 and shown in Fig. 12. If the uptake of Ni (II) on CSDC is due to intraparticle diffusion than the plot should be linear and pass through the origin but Fig. 12 shows that different kinetic processes are involved in controlling the uptake of Ni (II) on CSDC.
Fig. 10: Pseudo-first-order kinetics of Ni (II) ion
adsorption by CSDC (adsorbent dose 0.1g, initial concentration of Ni (II) 5 µg mL-1, volume of Ni (II) solution 20 mL, pH 7.0).
Fig. 11: Pseudo-second-order kinetics of Ni (II)
adsorption by CSDC (adsorbent dose 0.1g, initial concentration of Ni (II) 5 µg mL-1, volume of Ni (II) solution 20 mL, pH 7.0).
Table-3: Kinetic parameters of Ni (II) sorption on CSDC.
Model Parameters Values Pseudo-first order kinetics k1 (min-1) 0.0806 qe (mg g-1) 40.45 R2 0.9270 Pseudo-second order kinetics k2 (g mg-1min-1) 0.0062 qe (mgg-1) 22.72 R2 0.9980 Intraparticle diffusion model Kint (mg g-1sec1/2) 0.648 R2 0.9430 Elovich model α (mg g-1 min-1) 237.46 β (g mg-1) 0.437 R2 0.9350
Fig. 12: Intraparticle diffusion model of Ni (II)
uptake by CSDC (adsorbent dose 0.1g, initial concentration of Ni (II) 5 µg mL-1, volume of Ni (II) solution 20 mL, pH 7.0).
The chemisorption kinetics study is mostly
explained by Elovich equation which is generally suitable for systems with heterogeneous adsorbing surface. The linear form of Elovich equation is as:
(6) where qt is the amount of Ni (II) adsorbed (mg g-1) at time (t), α and β are known as the Elovich coefficients, α represents the initial adsorption rate (mg g-1 min-1) and β is related to the extent of surface coverage and activation energy for chemisorption (g mg-1) respectively. The Elovich coefficients were calculated from the linear plot of qt versus ln t (Fig. 13).
The experimental data were correlated with
the above four models by each linear plot of log (qe-qt) versus t, (t/qt) versus t, qt versus t1/2 and qt versus ln t, respectively. The kinetic parameters and values
JASMIN SHAH et al., J.Chem.Soc.Pak., Vol. 34, No. 1, 2012 63
of R2 were calculated from straight line equations of the above models. These are shown in Table-3. The experimental data fitted well to the pseudo-second- order kinetic model with a high R2 value (> 0.99)
Fig. 13: Elovich model of Ni (II) ion uptake by
CSDC (adsorbent dose 0.1g, initial concentration of Ni (II) 5 µg mL-1, volume of Ni (II) solution 20 mL, pH 7.0).
Effect of Temperature
The study of thermodynamic assumes that
the energy in an isolated system cannot be lost or gained when the entropy change is the driving force. Thermodynamic parameters were calculated for determination of adsorption process, to see if the adsorption will occur spontaneously or not. The change in free energy (∆G°), enthalpy (∆H°) and entropy (∆S°) of adsorption process was calculated by following equations:
(7) (8)
(9) where KD is the distribution constant, qe is the amount of metal ion adsorbed (mg g-1) at equilibrium and Ce is the equilibrium concentration (µg mL-1).
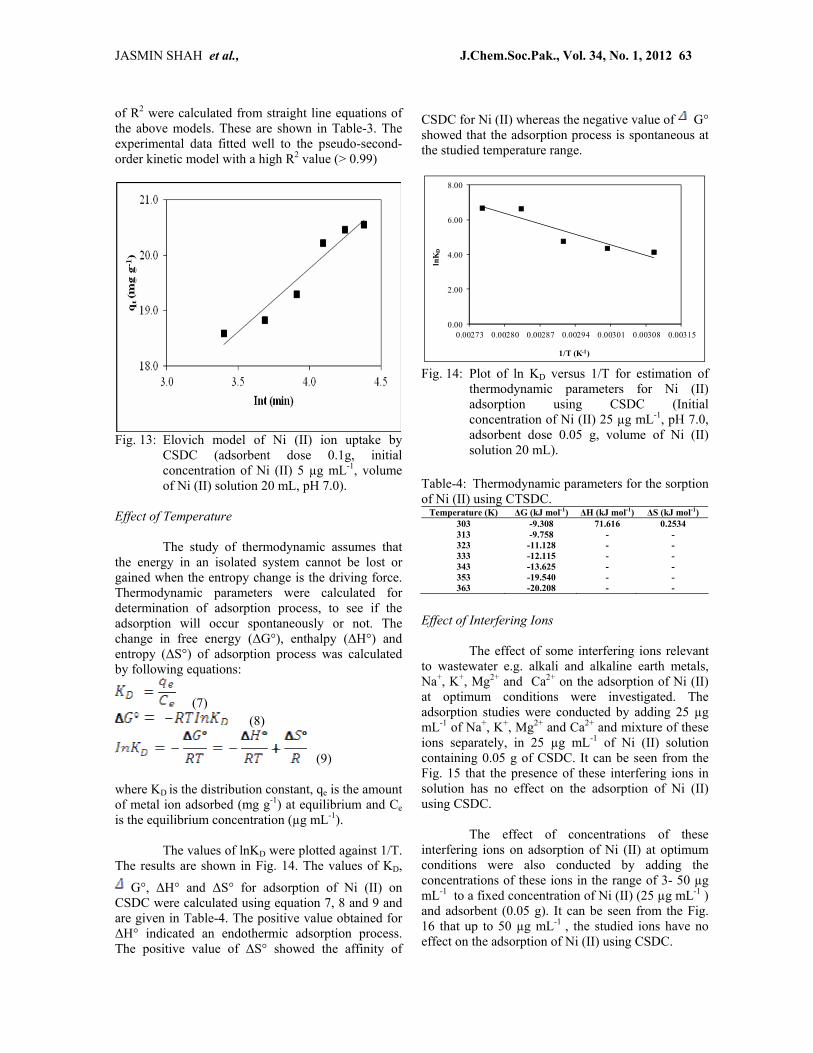
The values of lnKD were plotted against 1/T.
The results are shown in Fig. 14. The values of KD,
G°, ∆H° and ∆S° for adsorption of Ni (II) on CSDC were calculated using equation 7, 8 and 9 and are given in Table-4. The positive value obtained for ∆H° indicated an endothermic adsorption process. The positive value of ∆S° showed the affinity of
CSDC for Ni (II) whereas the negative value of G° showed that the adsorption process is spontaneous at the studied temperature range.
0.00
2.00
4.00
6.00
8.00
0.00273 0.00280 0.00287 0.00294 0.00301 0.00308 0.00315
lnK
D
1/T (K-1) Fig. 14: Plot of ln KD versus 1/T for estimation of
thermodynamic parameters for Ni (II) adsorption using CSDC (Initial concentration of Ni (II) 25 µg mL-1, pH 7.0, adsorbent dose 0.05 g, volume of Ni (II) solution 20 mL).
Table-4: Thermodynamic parameters for the sorption of Ni (II) using CTSDC.
Temperature (K) ∆G (kJ mol-1) ∆H (kJ mol-1) ∆S (kJ mol-1) 303 -9.308 71.616 0.2534 313 -9.758 - - 323 -11.128 - - 333 -12.115 - - 343 -13.625 - - 353 -19.540 - - 363 -20.208 - -
Effect of Interfering Ions
The effect of some interfering ions relevant to wastewater e.g. alkali and alkaline earth metals, Na+, K+, Mg2+ and Ca2+ on the adsorption of Ni (II) at optimum conditions were investigated. The adsorption studies were conducted by adding 25 µg mL-1 of Na+, K+, Mg2+ and Ca2+ and mixture of these ions separately, in 25 µg mL-1 of Ni (II) solution containing 0.05 g of CSDC. It can be seen from the Fig. 15 that the presence of these interfering ions in solution has no effect on the adsorption of Ni (II) using CSDC.
The effect of concentrations of these interfering ions on adsorption of Ni (II) at optimum conditions were also conducted by adding the concentrations of these ions in the range of 3- 50 µg mL-1 to a fixed concentration of Ni (II) (25 µg mL-1 ) and adsorbent (0.05 g). It can be seen from the Fig. 16 that up to 50 µg mL-1 , the studied ions have no effect on the adsorption of Ni (II) using CSDC.

JASMIN SHAH et al., J.Chem.Soc.Pak., Vol. 34, No. 1, 2012 64
0.0
20.0
40.0
60.0
80.0
100.0
120.0
Control Na K Mg Ca Mixed
upta
ke
of N
i (I
I) (
mg
g-1)
Type of interfering ions
Fig. 15: The effect of interfering ions on adsorption
of Ni (II) using CSDC (Initial concentration of Ni (II) 25 µg mL-1, concentration of interfering ions 25 µg mL-1, pH 7.0, room temperature, adsorbent dose 0.05 g).
0
20
40
60
80
100
120
3 4 5 10 20 30 40 50
Upta
ke o
f Ni (
II) (
mg
g-1)
Concentration of interfering ions (µg mL-1)
Na
K
Mg
Ca
Fig. 16: The effect of the concentration of interfering
ions on adsorption of Ni (II) using CSDC (Initial concentration of Ni (II) 25 µg mL-1, concentration of interfering ions 3-50 µg mL-1, pH 7.0, room temperature, adsorbent dose 0.05 g).
Analytical Applications
The analytical applicability of CSDC was
tested for tap water, canal and river water samples collected from Khyber Pakhtunkhwa, Pakistan. Each sample was filtered before conduction of analysis with ordinary filter paper. An aliquot of 20 mL water sample was spiked with known concentration of Ni (II) in the range of 100-500 µg at pH 7.0. The spiked samples were agitated with 0.20 g CSDC in orbital shaker for 60 min at 100 rpm. Each experiment was conducted in triplicates. The mixture was filtered and the residual concentrations of the Ni (II) were determined by flame atomic absorption spectrophotometer. The results are given in Table-5. As can be seen from the results, 100% removal takes place with CSDC.
Table-5: Determination of Ni (II) in various water samples.
Ni (II) added (µg) Ni (II) adsorbed(µg) % Removal Tap water
0.00 0.00 - 100 100.00 100 300 300.00 100 500 500.00 100
River Board bazar, Peshawar 0.00 0.00 - 100 100.00 100 300 300.00 100 500 500.00 100
River Bannu, Bannu 0.00 0.00 - 100 100.00 100 300 300.00 100 500 500.00 100
Experimental Pretreatment of Sample
Sawdust of mulberry wood (Morus Nigra)
was collected from local saw mill. The sawdust sample was washed with distilled water to remove dust particles and other waste from the surface. It was then dried in an oven at 100 °C for one hour. The derived sample was passed through a sieve of 355 µm mesh size.
Preparation of Adsorbent
The washed sawdust was loaded in a Pyrex
vertical tubular glass reactor placed in a tubular furnace and the carbonization process was carried out by increasing temperature from 40 °C to 250 °C and kept for one hour. After cooling 10 g sample of sawdust carbon (SDC) was chemically treated with NaOH, HCl, and H2SO4 (1.0 mol L-1) solutions separately for one hour. Each sample solution was them filtered, washed with distilled water and dried in oven at 100 °C till constant weight. The chemically treated sawdust carbon was grounded, sieved from 355 µm mesh size and stored for further use.
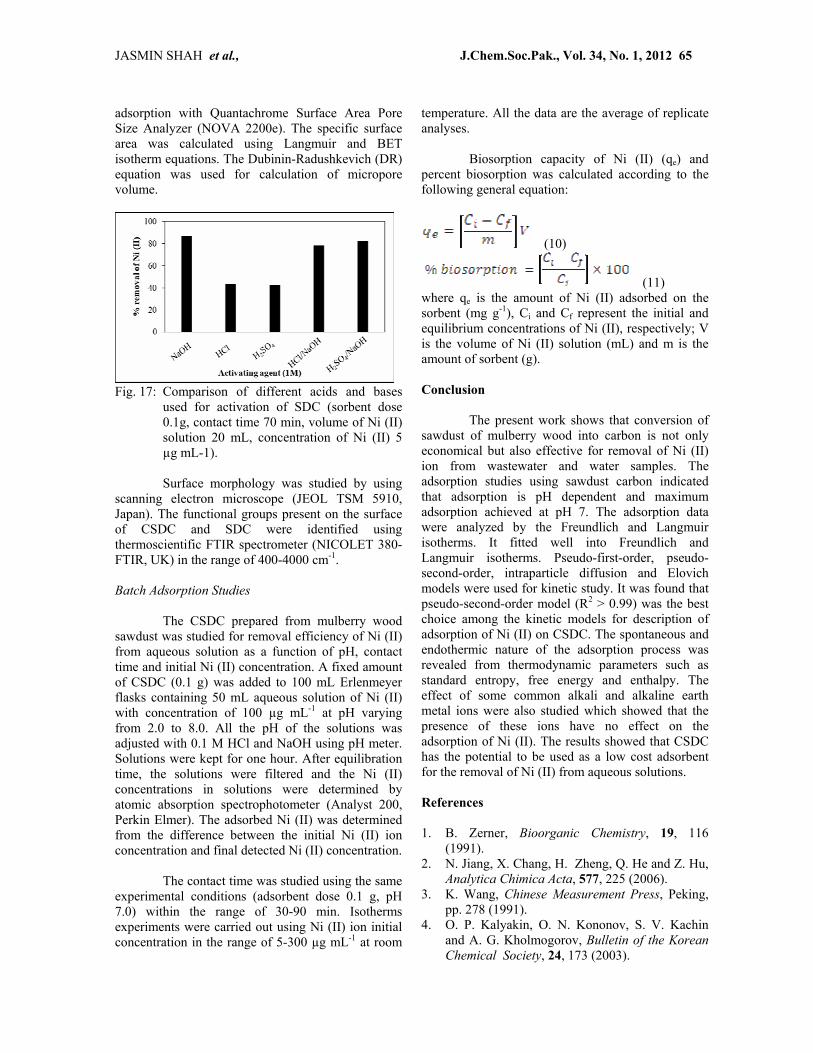
Fig. 17 shows the uptake of Ni (II) using chemically treated sawdust carbon. The results reveal that NaOH treated sawdust carbon has the highest efficiency for the uptake of Ni (II) from aqueous solutions. Therefore 1.0 mol L-1 NaOH has been selected for the chemical treatment of sawdust carbon. Methods of Characterization
The surface area of chemically treated sawdust carbon (CSDC) and untreated sawdust carbon (SDC) was measured using nitrogen
JASMIN SHAH et al., J.Chem.Soc.Pak., Vol. 34, No. 1, 2012 65
adsorption with Quantachrome Surface Area Pore Size Analyzer (NOVA 2200e). The specific surface area was calculated using Langmuir and BET isotherm equations. The Dubinin-Radushkevich (DR) equation was used for calculation of micropore volume.
Fig. 17: Comparison of different acids and bases
used for activation of SDC (sorbent dose 0.1g, contact time 70 min, volume of Ni (II) solution 20 mL, concentration of Ni (II) 5 µg mL-1).
Surface morphology was studied by using
scanning electron microscope (JEOL TSM 5910, Japan). The functional groups present on the surface of CSDC and SDC were identified using thermoscientific FTIR spectrometer (NICOLET 380-FTIR, UK) in the range of 400-4000 cm-1. Batch Adsorption Studies
The CSDC prepared from mulberry wood sawdust was studied for removal efficiency of Ni (II) from aqueous solution as a function of pH, contact time and initial Ni (II) concentration. A fixed amount of CSDC (0.1 g) was added to 100 mL Erlenmeyer flasks containing 50 mL aqueous solution of Ni (II) with concentration of 100 µg mL-1 at pH varying from 2.0 to 8.0. All the pH of the solutions was adjusted with 0.1 M HCl and NaOH using pH meter. Solutions were kept for one hour. After equilibration time, the solutions were filtered and the Ni (II) concentrations in solutions were determined by atomic absorption spectrophotometer (Analyst 200, Perkin Elmer). The adsorbed Ni (II) was determined from the difference between the initial Ni (II) ion concentration and final detected Ni (II) concentration.
The contact time was studied using the same experimental conditions (adsorbent dose 0.1 g, pH 7.0) within the range of 30-90 min. Isotherms experiments were carried out using Ni (II) ion initial concentration in the range of 5-300 µg mL-1 at room
temperature. All the data are the average of replicate analyses.
Biosorption capacity of Ni (II) (qe) and
percent biosorption was calculated according to the following general equation:
(10)
(11) where qe is the amount of Ni (II) adsorbed on the sorbent (mg g-1), Ci and Cf represent the initial and equilibrium concentrations of Ni (II), respectively; V is the volume of Ni (II) solution (mL) and m is the amount of sorbent (g). Conclusion
The present work shows that conversion of sawdust of mulberry wood into carbon is not only economical but also effective for removal of Ni (II) ion from wastewater and water samples. The adsorption studies using sawdust carbon indicated that adsorption is pH dependent and maximum adsorption achieved at pH 7. The adsorption data were analyzed by the Freundlich and Langmuir isotherms. It fitted well into Freundlich and Langmuir isotherms. Pseudo-first-order, pseudo-second-order, intraparticle diffusion and Elovich models were used for kinetic study. It was found that pseudo-second-order model (R2 > 0.99) was the best choice among the kinetic models for description of adsorption of Ni (II) on CSDC. The spontaneous and endothermic nature of the adsorption process was revealed from thermodynamic parameters such as standard entropy, free energy and enthalpy. The effect of some common alkali and alkaline earth metal ions were also studied which showed that the presence of these ions have no effect on the adsorption of Ni (II). The results showed that CSDC has the potential to be used as a low cost adsorbent for the removal of Ni (II) from aqueous solutions.
References 1. B. Zerner, Bioorganic Chemistry, 19, 116
(1991). 2. N. Jiang, X. Chang, H. Zheng, Q. He and Z. Hu,
Analytica Chimica Acta, 577, 225 (2006). 3. K. Wang, Chinese Measurement Press, Peking,
pp. 278 (1991). 4. O. P. Kalyakin, O. N. Kononov, S. V. Kachin
and A. G. Kholmogorov, Bulletin of the Korean Chemical Society, 24, 173 (2003).
JASMIN SHAH et al., J.Chem.Soc.Pak., Vol. 34, No. 1, 2012 66
5. J. Kristiansen, J.M. Christensen, T. Henriksen, N.H. Nielsen and T. Menne, Analytica Chimica Acta, 403, 265 (2000).
6. S. Baytak and A. R. Turker, Journal of Hazardous Material, 129, 130 (2006).
7. E. Merian, M. Anke, M. Ihnat and M. Stoeppler, Elements and Their Compounds in the Environment. Vol. 2, 2nd Ed., Wiley/VCH, Weinheim, pp. 659 (2004).
8. H. G. Seiler, H. Sigel and A. Sigel, Handbook on Toxicity of Inorganic Compounds, Marcel Dekker, New York, pp. 383 (1988).
9. D. Templeton, Biological Monitoring of Chemical Exposure in the Workplace. World Health Organization, Geneva (1990).
10. S. Q. Memon, N. Memon, A. R. Solangi and J. R. Memon, Chemical Engineering Journal, 140, 235 (2008).
11. M. Wei and J. M. Tobin, Water Research, 37, 3967 (2003).
12. A. Nasreen, S. Asma and I. Muhammed, Bioresource Technology, 88, 163 (2003).
13. K.K. Singh, R. Rastog and S.H. Hasan, Journal of Hazardous Materials, 121, 51 (2005).
14. S. Klimmek and H. J. Stan, Environmental Science and Technology, 35, 4283 (2001).
15. W. Jianmin, T. Xinjun, W. Hao and B. Heng, Environmental Science and Technology, 38, 6710 (2004).
16. G. Yekta, U. Sibel and G. Ulgar, Bioresource Technology, 96, 103 (2005).
17. K. Upendra and B. Manas, Bioresource Technology, 97, 104 (2006).
18. E. R. Maria, J. W. Ceri and H. E. G. Philip, Environmental Science and Technology, 35, 3025 (2001).
19. W. C. Chun, K. C. Chak, F. P. John and G. McKey, Environmental Science and Technology, 35, 1511 (2001).
20. P. Lodeiro, B. Cordero, J. L. Barriada, R. Herrero and V. M. E. Sastre, Bioresource Technology, 96, 1796 (2005).
21. K. S. Low, C. K. Lee and S. C. Liew, Process Biochemistry, 36, 59 (2000).
22. S. Y. Wang, M. H. Tsai, S. F. Lo and M. J. Tsai, Bioresource Technology, 99, 7027 (2008).
23. S. Sirianuntapiboon and O. Ungkaprasatcha, Bioresource Technology, 98, 2749 (2007).
24. Q. Cao, K. C. Xie, Y. K. Lv and W. R. Bao, Bioresource Technology, 97, 110 (2006).
25. G. Issabayev, M. K. Arou and N. M. N. Sulaiman, Bioresource Technology, 97, 2350 (2006).
26. K. H. Park, W. G. Shim, H. K. Shon, S. G. Lee, H. H. Ngo, S. Vigneswaran and H. Moon, Seperation Science and Technology, 45, 1084 (2010).
27. M. Z. Alam, S. A. Muyibi, M. F. Mansor and R. Wahid, Journal of Environmental Science, 19, 103 (2007).
28. I. A. W. Tan, A. L. Ahmad and B. H. Hameed, Journal of Hazardous Materials, 164, 473 (2009).
29. D. P. Vargas-Delgadillo, L. Giraldo and J.C. Moreno-Pirajan, E-Journal of Chemistry, 7, 531 (2010).
30. H. B. Ahmad, M. Aleem, T. Anwar, M. N. Ashiq and M. Yousaf, Journal of the Chemical Society of Pakistan, 33, 449 (2011).
31. M. R. Sohrabi, A. Marjani, S. Moradi, M. Davallo and S. Shirazian, Journal of the Chemical Society of Pakistan, 33, 464 (2011).

