Toxic activity of Bacillus Thuringiensis isolates to Aedes Aegypti (L.) (Diptera: Culicidae) larvae
Upload
portalanchietaCategory
view
0download
0
BioMed CentralBMC Evolutionary Biology
ss
Open AcceResearch articleAsymmetric introgression between sympatric molestus and pipiens forms of Culex pipiens (Diptera: Culicidae) in the Comporta region, PortugalBruno Gomes1, Carla A Sousa2, Maria T Novo2, Ferdinando B Freitas1,2, Ricardo Alves1,2, Ana R Côrte-Real1,2, Patrícia Salgueiro1, Martin J Donnelly3, António PG Almeida2 and João Pinto*1Address: 1Centro de Malária e outras Doenças Tropicais, Instituto de Higiene e Medicina Tropical, Universidade Nova de Lisboa, Rua da Junqueira 96, 1349-008 Lisboa, Portugal, 2Unidade de Entomologia Médica/Unidade de Parasitologia e Microbiologia Médicas, Instituto de Higiene e Medicina Tropical, Universidade Nova de Lisboa, Rua da Junqueira 96, 1349-008 Lisboa, Portugal and 3Vector Group, Liverpool School of Tropical Medicine, Pembroke Place L3 5QA, Liverpool, UK
Email: Bruno Gomes - [email protected]; Carla A Sousa - [email protected]; Maria T Novo - [email protected]; Ferdinando B Freitas - [email protected]; Ricardo Alves - [email protected]; Ana R Côrte-Real - [email protected]; Patrícia Salgueiro - [email protected]; Martin J Donnelly - [email protected]; António PG Almeida - [email protected]; João Pinto* - [email protected]
* Corresponding author
AbstractBackground: Culex pipiens L. is the most widespread mosquito vector in temperate regions. This species consists oftwo forms, denoted molestus and pipiens, that exhibit important behavioural and physiological differences. Theevolutionary relationships and taxonomic status of these forms remain unclear. In northern European latitudes molestusand pipiens populations occupy different habitats (underground vs. aboveground), a separation that most likely promotesgenetic isolation between forms. However, the same does not hold in southern Europe where both forms occuraboveground in sympatry. In these southern habitats, the extent of hybridisation and its impact on the extent of geneticdivergence between forms under sympatric conditions has not been clarified. For this purpose, we have used phenotypicand genetic data to characterise Cx. pipiens collected aboveground in Portugal. Our aims were to determine levels ofgenetic differentiation and the degree of hybridisation between forms occurring in sympatry, and to relate these withboth evolutionary and epidemiological tenets of this biological group.
Results: Autogeny and stenogamy was evaluated in the F1 progeny of 145 individual Cx. pipiens females. Bayesianclustering analysis based on the genotypes of 13 microsatellites revealed two distinct genetic clusters that were highlycorrelated with the alternative traits that define pipiens and molestus. Admixture analysis yielded hybrid rate estimatesof 8-10%. Higher proportions of admixture were observed in pipiens individuals suggesting that more molestus genes arebeing introgressed into the pipiens form than the opposite.
Conclusion: Both physiological/behavioural and genetic data provide evidence for the sympatric occurrence of molestusand pipiens forms of Cx. pipiens in the study area. In spite of the significant genetic differentiation between forms,hybridisation occurs at considerable levels. The observed pattern of asymmetric introgression probably relates to thedifferent mating strategies adopted by each form. Furthermore, the differential introgression of molestus genes into thepipiens form may induce a more opportunistic biting behaviour in the latter thus potentiating its capacity to act as abridge-vector for the transmission of arboviral infections.
Published: 6 November 2009
BMC Evolutionary Biology 2009, 9:262 doi:10.1186/1471-2148-9-262
Received: 9 July 2009Accepted: 6 November 2009
This article is available from: http://www.biomedcentral.com/1471-2148/9/262
© 2009 Gomes et al; licensee BioMed Central Ltd. This is an Open Access article distributed under the terms of the Creative Commons Attribution License (http://creativecommons.org/licenses/by/2.0), which permits unrestricted use, distribution, and reproduction in any medium, provided the original work is properly cited.
Page 1 of 15(page number not for citation purposes)

BMC Evolutionary Biology 2009, 9:262 http://www.biomedcentral.com/1471-2148/9/262
BackgroundThe Culex pipiens complex includes two of the most ubiq-uitous mosquito species in the world, Culex quinquefascia-tus Say, 1823 in tropical and subtropical regions, andCulex pipiens L., 1758 in temperate regions. The nominalspecies of the complex, Cx. pipiens s.s., comprises two dis-tinct forms, denoted pipiens and molestus, that are mor-phologically indistinguishable but exhibit importantbehavioural and physiological differences. The molestusform is stenogamous (mates in confined spaces, i.e. < 0.1m3 [1]), autogenous (can oviposit without a blood meal),mammophilic (prefers to feed on mammals, includinghumans) and homodynamic (remains active during win-ter). In contrast, the pipiens form is eurygamous (mates inopen spaces), anautogenous (oviposition requires ablood meal), ornithophilic (feeds predominantly onbirds) and heterodynamic (undergoes winter diapause)[2,3]. In the northern regions of Europe, Russia and USA,molestus and pipiens forms occupy different habitats,underground and aboveground, respectively [4-6].
The taxonomic status and evolutionary relationships ofthese forms remain controversial. One hypothesis is thatthe molestus form derives from surface pipiens popula-tions that have undergone local adaptation to under-ground conditions [4]. Another hypothesis is that theseforms may represent two distinct genetic entities [7].Under the latter scenario, underground populations fromnorthern Europe would have derived from southernautogenous populations that have subsequently dispersedand colonised underground habitats [7,8]. If in northernregions a physical discontinuity (underground vs. surface)is likely to significantly reduce gene flow between moles-tus and pipiens, hence promoting genetic isolation, thesame may not hold for southern regions, where bothautogenous and anautogenous populations co-occur insurface habitats [2,3,9]. Moreover, individuals withhybrid genetic signatures between molestus and pipienshave been described both in the USA and in southernEurope [6,7,10]. These results agree with reports ofhybridisation between forms that result in hybrid femaleswith intermediate physiological and behavioural traits[9,11]. Hybrids between molestus and pipiens forms areconsidered of great epidemiological importance. They canreadily feed on both avian and mammalian hosts, includ-ing humans. This opportunistic biting behaviour willpotentiate the role of Cx. pipiens as a bridge-vector for thetransmission of arboviruses such as West Nile Virus(WNV), from their amplification hosts (birds) to humans[7,12].
Despite the conspicuous behavioural and physiologicaldifferences between molestus and pipiens, analysis ofmolecular markers revealed overall shallow genetic diver-gence and a paucity of diagnostic fixed differences
between forms [8,13]. Exceptions are the contrasting dif-ferences in the degree of polymorphism found in theSH60 locus, a Cx. pipiens specific fragment originallydescribed by Crabtree and co-workers [14] to distinguishthis species from its tropical sibling Cx. quinquefasciatus,and the significant differentiation detected by analysis ofmicrosatellites [7,8]. The most promising diagnosticmarker so far obtained is a sequence difference in theflanking region of microsatellite CQ11, hereafter termedCQ11FL, that allows PCR-based discrimination of moles-tus, pipiens and putative hybrids [15].
In Portugal, Cx. pipiens is the most widespread mosquitospecies, reaching the highest densities in coastal estuarineareas during summer [16]. Some of these areas are impor-tant sanctuaries for migratory birds and hence potentialsites for the introduction of arbovirus [17]. In the summerof 2004, WNV was isolated from Cx. pipiens collected inthe southern province of the Algarve, in a mosquito surveythat followed the description of two cases of WNV feveracquired by Irish bird-watchers in the region [18,19]. InPortugal, autogenous/stenogamous Cx. pipiens, typical ofthe molestus form, have been described from the analysisof larvae collected in urban surface habitats [20]. How-ever, there is currently no information on the extent ofgenetic isolation between molestus and pipiens formswhen they co-occur sympatrically in southern Europeanaboveground habitats.
In this study, we used the CQ11FL marker and microsat-ellite loci to analyse samples of Culex pipiens collectedaboveground in the estuarine region of Comporta inorder to: i) determine levels of differentiation betweensamples displaying behavioural and physiological charac-teristics of pipiens and molestus forms; ii) assess thedegree of hybridisation between forms and relate this withthe potential for arbovirus transmission in the area.
ResultsAutogeny, stenogamy and molecular identificationA total of 145 F1 families were analysed in the insectary todetermine autogeny and stenogamy (Table 1). Of these,115 (79.3%) were able to lay a first egg batch withoutblood feeding, hence being considered autogenous. Thegreat majority of autogenous families (109 out of the 115)laid the first egg batch within two days after the emergenceof the last adult. In the remaining 30 families (20.7%),oviposition occurred only after blood feeding in 11(36.7%) and no oviposition was seen in the other 19(63.3%) during the 10 days of the experiment. For subse-quent comparisons, these families were put together intoa single group denoted as non-autogenous.
There were significant associations of autogenous familieswith complete insemination and of non-autogenous fam-
Page 2 of 15(page number not for citation purposes)
BMC Evolutionary Biology 2009, 9:262 http://www.biomedcentral.com/1471-2148/9/262
ilies with absence of insemination (χ2 = 100.7, d.f. = 2, P< 0.001; Table 1). In the autogenous group, the mean pro-portion of inseminated females was 92.9%, with 84 fam-ilies (73.0%) showing 100% of inseminated females.There was a single autogenous family in which insemina-tion was not observed. This family oviposited withoutblood feeding only after the two-days period from theemergence of the last adult, after which the family wassubdivided (see Methods). In this family, the level ofinsemination could have been too low to accurately deter-mining the insemination rate by observing the spermath-ecae, but also the possibility of a parthenogenic egg batchcannot be excluded [5]. In contrast, the non-autogenous
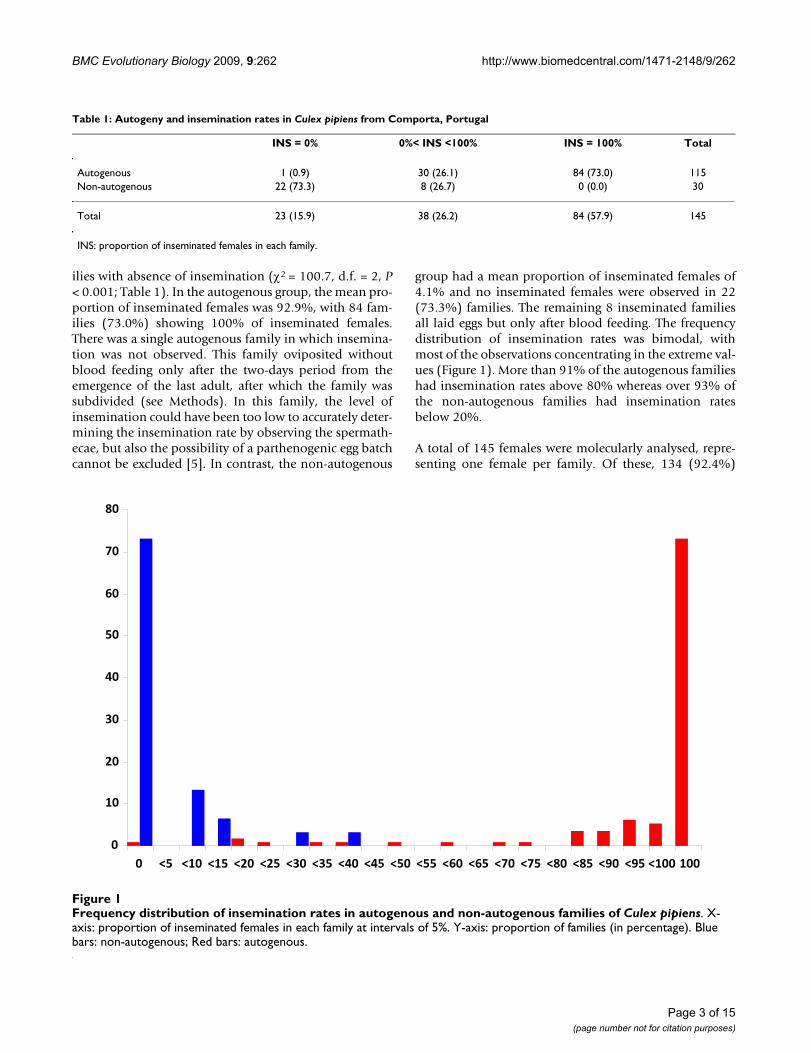
group had a mean proportion of inseminated females of4.1% and no inseminated females were observed in 22(73.3%) families. The remaining 8 inseminated familiesall laid eggs but only after blood feeding. The frequencydistribution of insemination rates was bimodal, withmost of the observations concentrating in the extreme val-ues (Figure 1). More than 91% of the autogenous familieshad insemination rates above 80% whereas over 93% ofthe non-autogenous families had insemination ratesbelow 20%.
A total of 145 females were molecularly analysed, repre-senting one female per family. Of these, 134 (92.4%)
Table 1: Autogeny and insemination rates in Culex pipiens from Comporta, Portugal
INS = 0% 0%< INS <100% INS = 100% Total
Autogenous 1 (0.9) 30 (26.1) 84 (73.0) 115Non-autogenous 22 (73.3) 8 (26.7) 0 (0.0) 30
Total 23 (15.9) 38 (26.2) 84 (57.9) 145
INS: proportion of inseminated females in each family.
Frequency distribution of insemination rates in autogenous and non-autogenous families of Culex pipiensFigure 1Frequency distribution of insemination rates in autogenous and non-autogenous families of Culex pipiens. X-axis: proportion of inseminated females in each family at intervals of 5%. Y-axis: proportion of families (in percentage). Blue bars: non-autogenous; Red bars: autogenous.
�
��
��
��
��
��
��
�
�
� �� ��� ��� ��� ��� ��� ��� ��� ��� ��� ��� ��� ��� �� �� �� �� ��� ��� ���� ����
��
��
��
��
��
��
�
�
� �� ��� ��� ��� ��� ��� ��� ��� ��� ��� ��� ��� ��� �� �� �� �� ��� ��� ���� ���
Page 3 of 15(page number not for citation purposes)

BMC Evolutionary Biology 2009, 9:262 http://www.biomedcentral.com/1471-2148/9/262
were identified as Cx. pipiens s.s. by Ace2-PCR [21]. For theremaining 11 females no amplified product was obtaineddespite several attempts changing PCR conditions, possi-bly due to alterations in the primers binding site. The fam-ilies of these specimens were identified as belonging toCx. pipiens s.s. by the observation of the genitalia of malesiblings [22].
The genotypic frequencies of the CQ11FL marker areshown in Table 2. Overall, 78 (53.8%) females werehomozygous for the 250 bp allele characteristic of themolestus form and 41 (28.3%) were homozygous for the200 bp allele associated with the pipiens form. Theremainder 26 (17.9%) females were heterozygous. Therewere significant associations between homozygous geno-types and alternative phenotypic traits. The "pipiens" gen-otype (CQ11FL200/200) predominated in non-autogenousand strictly non-stenogamous families (i.e. proportion ofinseminated females = 0%) whereas the "molestus" geno-type (CQ11FL250/250) was predominant in autogenousand strictly stenogamous families (i.e. proportion ofinseminated females = 100%).
Microsatellite analysisGenetic diversity estimates for the 14 microsatellite locianalysed are shown in Table S1, available in the Addi-tional File 1. Apart from the whole sample (N = 145), cal-culations were also made for subsamples determined bygenotypes at the CQ11FL locus. Although coincidence ofgenotypes and phenotypes was not absolute, the signifi-cant associations between CQ11FL homozygous geno-types and alternative phenotypes justified this tentativepartitioning. Diversity estimates were lower inCQ11FL250/250 homozygotes (mean AR = 6, mean He =0.600) when compared to CQ11FL200/200 homozygotes(mean AR = 11, mean He = 0.762). These differences weresignificant for both parameters (Wilcoxon signed-rankstests; AR: P = 0.001, He: P = 0.004). Microsatellite CQ11was polymorphic in CQ11FL200/200 homozygous and in
CQ11FL200/250 heterozygous groups. In contrast, this locuswas nearly fixed for a 286 bp allele (f = 0.984) in theCQ11FL250/250 homozygous group. This allele was alsothe most frequent in the heterozygous group (f = 0.480)while it was absent in CQ11FL200/200 homozygotes.
Significant departures from Hardy-Weinberg proportionswere detected in 10 loci (78.6%) when all specimens wereanalysed as a single sample (Table S1). Significant depar-tures were seen at the same loci when analysis wasrepeated with pooled CQ11FL250/250 and CQ11FL200/200homozygous specimens, i.e. when CQ11FL200/250 hetero-zygotes were excluded (data not shown). These departureswere generally associated with significant positive FIS val-ues indicative of a heterozygote deficit (Table S1). How-ever, when the sample was subdivided according toCQ11FL genotypes, significant heterozygote deficits wereobserved only in seven occasions (16.7% out of 42 tests).Of these, locus CxpGT9 exhibited heterozygote deficits inall three subsamples, possibly reflecting locus-specificeffects such as null alleles or selective pressures. There wasalso one significant departure that resulted from hetero-zygous excess, namely for locus CQ11 in the CQ11FL200/
250 heterozygous group.
Exact tests of linkage disequilibrium revealed 62 (68.1%)significant associations between pairs of loci out of 91tests performed for the whole sample. When each formwas treated in separate, significant associations werereduced to 12 in the CQ11FL250/250 homozygous group,four in CQ11FL200/200 homozygous and one inCQ11FL200/250 heterozygous. Of the total 17 significanttests detected in the subsamples nine involved locusCxpGT9, that also showed significant heterozygote defi-cits. This locus was therefore excluded from subsequentanalyses.
Bayesian clustering analysis implemented by STRUC-TURE [23] revealed two (K = 2) genetically distinct ances-
Table 2: Polymorphism at the flanking region of microsatellite CQ11 (CQ11FL) according to phenotypic groups of Culex pipiens.
Total Autogeny Insemination rates
Autogenous Non-autogenous INS = 100% 0%< INS <100% INS = 0%
CQ11FL250/250 78 77 1 60 17 1(53.8) (67.0) (3.3) (71.4) (44.7) (4.3)
CQ11FL200/250 26 22 4 16 7 3(17.9) (19.1) (13.3) (19.0) (18.4) (13.0)
CQ11FL200/200 41 16 25 8 14 19(28.3) (13.9) (83.3) (9.5) (36.8) (82.6)
Chi-square tests χ2 = 58.9, d.f. = 2, P < 0.001 χ2 = 51.7, d.f. = 4, P < 0.001
INS: proportion of inseminated females in a family. Values in parenthesis refer to the relative genotypic frequencies (in percentage) within each phenotypic group. χ2: P-values of chi-square tests of homogeneity of genotypic frequencies among phenotypes.
Page 4 of 15(page number not for citation purposes)
BMC Evolutionary Biology 2009, 9:262 http://www.biomedcentral.com/1471-2148/9/262
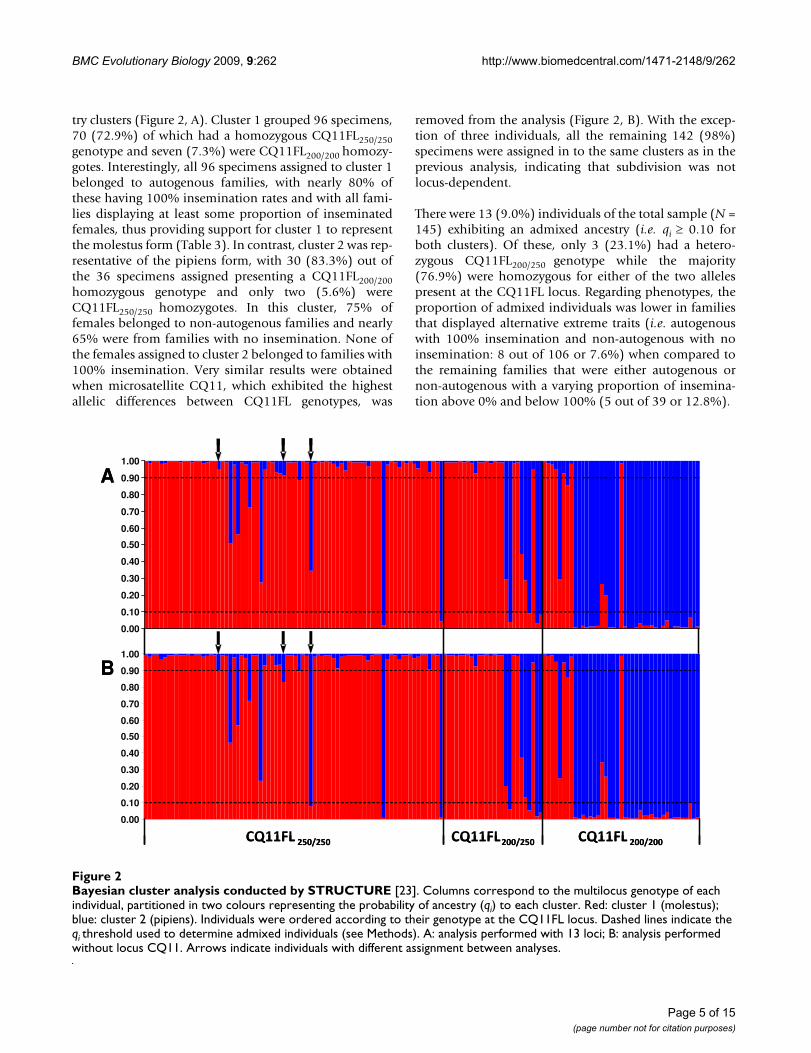
try clusters (Figure 2, A). Cluster 1 grouped 96 specimens,70 (72.9%) of which had a homozygous CQ11FL250/250genotype and seven (7.3%) were CQ11FL200/200 homozy-gotes. Interestingly, all 96 specimens assigned to cluster 1belonged to autogenous families, with nearly 80% ofthese having 100% insemination rates and with all fami-lies displaying at least some proportion of inseminatedfemales, thus providing support for cluster 1 to representthe molestus form (Table 3). In contrast, cluster 2 was rep-resentative of the pipiens form, with 30 (83.3%) out ofthe 36 specimens assigned presenting a CQ11FL200/200homozygous genotype and only two (5.6%) wereCQ11FL250/250 homozygotes. In this cluster, 75% offemales belonged to non-autogenous families and nearly65% were from families with no insemination. None ofthe females assigned to cluster 2 belonged to families with100% insemination. Very similar results were obtainedwhen microsatellite CQ11, which exhibited the highestallelic differences between CQ11FL genotypes, was
removed from the analysis (Figure 2, B). With the excep-tion of three individuals, all the remaining 142 (98%)specimens were assigned in to the same clusters as in theprevious analysis, indicating that subdivision was notlocus-dependent.
There were 13 (9.0%) individuals of the total sample (N =145) exhibiting an admixed ancestry (i.e. qi ≥ 0.10 forboth clusters). Of these, only 3 (23.1%) had a hetero-zygous CQ11FL200/250 genotype while the majority(76.9%) were homozygous for either of the two allelespresent at the CQ11FL locus. Regarding phenotypes, theproportion of admixed individuals was lower in familiesthat displayed alternative extreme traits (i.e. autogenouswith 100% insemination and non-autogenous with noinsemination: 8 out of 106 or 7.6%) when compared tothe remaining families that were either autogenous ornon-autogenous with a varying proportion of insemina-tion above 0% and below 100% (5 out of 39 or 12.8%).
Bayesian cluster analysis conducted by STRUCTURE [23]Figure 2Bayesian cluster analysis conducted by STRUCTURE [23]. Columns correspond to the multilocus genotype of each individual, partitioned in two colours representing the probability of ancestry (qi) to each cluster. Red: cluster 1 (molestus); blue: cluster 2 (pipiens). Individuals were ordered according to their genotype at the CQ11FL locus. Dashed lines indicate the qi threshold used to determine admixed individuals (see Methods). A: analysis performed with 13 loci; B: analysis performed without locus CQ11. Arrows indicate individuals with different assignment between analyses.
0.00
0.10
0.20
0.30
0.40
0.50
0.60
0.70
0.80
0.90
1.00
0.00
0.10
0.20
0.30
0.40
0.50
0.60
0.70
0.80
0.90
1.00
��� ��� ��������� ��� ������ ��� ���
A
B
������0.00
0.10
0.20
0.30
0.40
0.50
0.60
0.70
0.80
0.90
1.00
0.00
0.10
0.20
0.30
0.40
0.50
0.60
0.70
0.80
0.90
1.00
0.00
0.10
0.20
0.30
0.40
0.50
0.60
0.70
0.80
0.90
1.00
0.00
0.10
0.20
0.30
0.40
0.50
0.60
0.70
0.80
0.90
1.00
��� ��� ��������� ��� ������ ��� ���
A
B
������
Page 5 of 15(page number not for citation purposes)
BMC Evolutionary Biology 2009, 9:262 http://www.biomedcentral.com/1471-2148/9/262
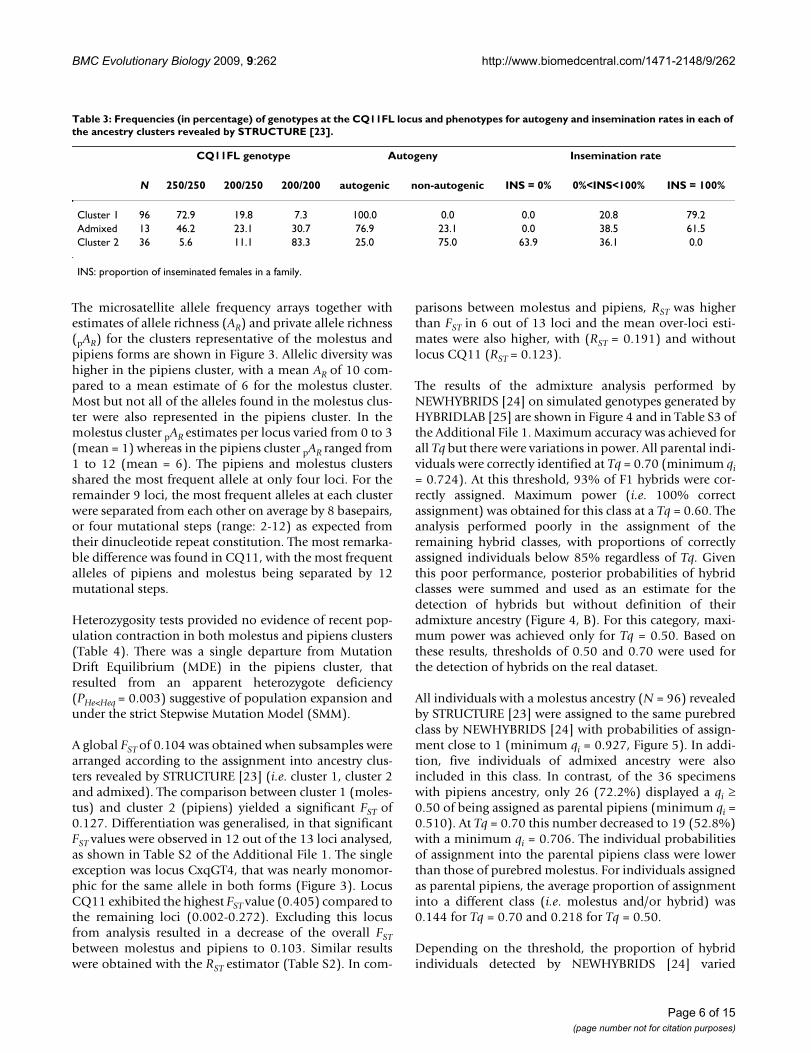
The microsatellite allele frequency arrays together withestimates of allele richness (AR) and private allele richness(pAR) for the clusters representative of the molestus andpipiens forms are shown in Figure 3. Allelic diversity washigher in the pipiens cluster, with a mean AR of 10 com-pared to a mean estimate of 6 for the molestus cluster.Most but not all of the alleles found in the molestus clus-ter were also represented in the pipiens cluster. In themolestus cluster pAR estimates per locus varied from 0 to 3(mean = 1) whereas in the pipiens cluster pAR ranged from1 to 12 (mean = 6). The pipiens and molestus clustersshared the most frequent allele at only four loci. For theremainder 9 loci, the most frequent alleles at each clusterwere separated from each other on average by 8 basepairs,or four mutational steps (range: 2-12) as expected fromtheir dinucleotide repeat constitution. The most remarka-ble difference was found in CQ11, with the most frequentalleles of pipiens and molestus being separated by 12mutational steps.
Heterozygosity tests provided no evidence of recent pop-ulation contraction in both molestus and pipiens clusters(Table 4). There was a single departure from MutationDrift Equilibrium (MDE) in the pipiens cluster, thatresulted from an apparent heterozygote deficiency(PHe<Heq = 0.003) suggestive of population expansion andunder the strict Stepwise Mutation Model (SMM).
A global FST of 0.104 was obtained when subsamples werearranged according to the assignment into ancestry clus-ters revealed by STRUCTURE [23] (i.e. cluster 1, cluster 2and admixed). The comparison between cluster 1 (moles-tus) and cluster 2 (pipiens) yielded a significant FST of0.127. Differentiation was generalised, in that significantFST values were observed in 12 out of the 13 loci analysed,as shown in Table S2 of the Additional File 1. The singleexception was locus CxqGT4, that was nearly monomor-phic for the same allele in both forms (Figure 3). LocusCQ11 exhibited the highest FST value (0.405) compared tothe remaining loci (0.002-0.272). Excluding this locusfrom analysis resulted in a decrease of the overall FSTbetween molestus and pipiens to 0.103. Similar resultswere obtained with the RST estimator (Table S2). In com-
parisons between molestus and pipiens, RST was higherthan FST in 6 out of 13 loci and the mean over-loci esti-mates were also higher, with (RST = 0.191) and withoutlocus CQ11 (RST = 0.123).
The results of the admixture analysis performed byNEWHYBRIDS [24] on simulated genotypes generated byHYBRIDLAB [25] are shown in Figure 4 and in Table S3 ofthe Additional File 1. Maximum accuracy was achieved forall Tq but there were variations in power. All parental indi-viduals were correctly identified at Tq = 0.70 (minimum qi= 0.724). At this threshold, 93% of F1 hybrids were cor-rectly assigned. Maximum power (i.e. 100% correctassignment) was obtained for this class at a Tq = 0.60. Theanalysis performed poorly in the assignment of theremaining hybrid classes, with proportions of correctlyassigned individuals below 85% regardless of Tq. Giventhis poor performance, posterior probabilities of hybridclasses were summed and used as an estimate for thedetection of hybrids but without definition of theiradmixture ancestry (Figure 4, B). For this category, maxi-mum power was achieved only for Tq = 0.50. Based onthese results, thresholds of 0.50 and 0.70 were used forthe detection of hybrids on the real dataset.
All individuals with a molestus ancestry (N = 96) revealedby STRUCTURE [23] were assigned to the same purebredclass by NEWHYBRIDS [24] with probabilities of assign-ment close to 1 (minimum qi = 0.927, Figure 5). In addi-tion, five individuals of admixed ancestry were alsoincluded in this class. In contrast, of the 36 specimenswith pipiens ancestry, only 26 (72.2%) displayed a qi ≥0.50 of being assigned as parental pipiens (minimum qi =0.510). At Tq = 0.70 this number decreased to 19 (52.8%)with a minimum qi = 0.706. The individual probabilitiesof assignment into the parental pipiens class were lowerthan those of purebred molestus. For individuals assignedas parental pipiens, the average proportion of assignmentinto a different class (i.e. molestus and/or hybrid) was0.144 for Tq = 0.70 and 0.218 for Tq = 0.50.
Depending on the threshold, the proportion of hybridindividuals detected by NEWHYBRIDS [24] varied
Table 3: Frequencies (in percentage) of genotypes at the CQ11FL locus and phenotypes for autogeny and insemination rates in each of the ancestry clusters revealed by STRUCTURE [23].
CQ11FL genotype Autogeny Insemination rate
N 250/250 200/250 200/200 autogenic non-autogenic INS = 0% 0%<INS<100% INS = 100%
Cluster 1 96 72.9 19.8 7.3 100.0 0.0 0.0 20.8 79.2Admixed 13 46.2 23.1 30.7 76.9 23.1 0.0 38.5 61.5Cluster 2 36 5.6 11.1 83.3 25.0 75.0 63.9 36.1 0.0
INS: proportion of inseminated females in a family.
Page 6 of 15(page number not for citation purposes)

BMC Evolutionary Biology 2009, 9:262 http://www.biomedcentral.com/1471-2148/9/262
Page 7 of 15(page number not for citation purposes)
Microsatellite allele richness and frequency in Culex pipiens of Comporta, PortugalFigure 3Microsatellite allele richness and frequency in Culex pipiens of Comporta, Portugal. Allele frequencies, allele richness (AR) and private alleles richness (pAR) were calculated for samples of common ancestry determined by Bayesian clustering analysis using STRUCTURE [23]. Red: molestus cluster, blue: pipiens cluster. X-axis: allele sizes in basepairs. Y-axis: allele frequency.
0.00
0.10
0.20
0.30
0.40
0.50
0.60
0.70
0.80
0.90
260 262 264 266 268 270 272 276 286
CQ11molestus:�AR/pAR=2.8/0.0pipiens:�AR/pAR=8.3/5.4
0.00
0.10
0.20
0.30
0.40
190 192 194 196 198 202 204 206 208 210 212 214
CQ26molestus:�AR/pAR=5.2/0.5pipiens:�AR/pAR=10.7/6.1
0.00
0.10
0.20
0.30
0.40
0.50
130 136 138 140 142 146 152 154 156 158 160 162 168 170 174 188
CQ41molestus:�AR/pAR=7.9/3.0pipiens:�AR/pAR=10.8/5.9
0.00
0.10
0.20
0.30
0.40
0.50
0.60
129 131 133 135 137 141 143 145 147 149 151 153 155 157 159
CxpGT4molestus:�AR/pAR=3.4/0.4pipiens:�AR/pAR=12.9/9.8
0.00
0.10
0.20
0.30
116 118 120 122 124 126 128 130 132 134 136 138 140 144 146 148 152 154 156 162 166 168
CxpGT20molestus:�AR/pAR=9.6/1.9pipiens:�AR/pAR=17.2/9.4
0.00
0.10
0.20
0.30
0.40
0.50
0.60
0.70
0.80
0.90
139 145 147 149 151 155 157 159 161
CxpGT12molestus:�AR/pAR=2.7/0.3pipiens:�AR/pAR=7.5/5.1
0.00
0.10
0.20
0.30
0.40
0.50
0.60
0.70
168 172 178 180 186 192 194 196 198 202 206 210 212 222
CxpGT40molestus:�AR/pAR=6.2/2.7pipiens:�AR/pAR=8.7/5.2
0.00
0.10
0.20
0.30
101 105 107 109 111 113 115 117 119 121 123 125 127 129 135 137 139 141 145 147 149 153 161 163 165 167
CxpGT51molestus:�AR/pAR=10.7/1.5pipiens:�AR/pAR=20.5/11.3
0.00
0.10
0.20
0.30
0.40
0.50
0.60
0.70
0.80
0.90
260 262 264 266 268 270 272 276 286
CQ11molestus:�AR/pAR=2.8/0.0pipiens:�AR/pAR=8.3/5.4
0.00
0.10
0.20
0.30
0.40
190 192 194 196 198 202 204 206 208 210 212 214
CQ26molestus:�AR/pAR=5.2/0.5pipiens:�AR/pAR=10.7/6.1
0.000.100.200.300.400.500.600.700.800.90
260 262 264 266 268 270 272 276 286
CQ11molestus:�AR/pAR=2.8/0.0pipiens:�AR/pAR=8.3/5.4
0.000.100.200.300.400.500.600.700.800.90
260 262 264 266 268 270 272 276 286
CQ11molestus:�AR/pAR=2.8/0.0pipiens:�AR/pAR=8.3/5.4
0.00
0.10
0.20
0.30
0.40
190 192 194 196 198 202 204 206 208 210 212 214
CQ26molestus:�AR/pAR=5.2/0.5pipiens:�AR/pAR=10.7/6.1
0.00
0.10
0.20
0.30
0.40
190 192 194 196 198 202 204 206 208 210 212 214
CQ26molestus:�AR/pAR=5.2/0.5pipiens:�AR/pAR=10.7/6.1
0.00
0.10
0.20
0.30
0.40
0.50
130 136 138 140 142 146 152 154 156 158 160 162 168 170 174 188
CQ41molestus:�AR/pAR=7.9/3.0pipiens:�AR/pAR=10.8/5.9
0.00
0.10
0.20
0.30
0.40
0.50
0.60
129 131 133 135 137 141 143 145 147 149 151 153 155 157 159
CxpGT4molestus:�AR/pAR=3.4/0.4pipiens:�AR/pAR=12.9/9.8
0.00
0.10
0.20
0.30
0.40
0.50
130 136 138 140 142 146 152 154 156 158 160 162 168 170 174 188
CQ41molestus:�AR/pAR=7.9/3.0pipiens:�AR/pAR=10.8/5.9
0.00
0.10
0.20
0.30
0.40
0.50
130 136 138 140 142 146 152 154 156 158 160 162 168 170 174 188
CQ41molestus:�AR/pAR=7.9/3.0pipiens:�AR/pAR=10.8/5.9
0.00
0.10
0.20
0.30
0.40
0.50
0.60
129 131 133 135 137 141 143 145 147 149 151 153 155 157 159
CxpGT4molestus:�AR/pAR=3.4/0.4pipiens:�AR/pAR=12.9/9.8
0.00
0.10
0.20
0.30
0.40
0.50
0.60
129 131 133 135 137 141 143 145 147 149 151 153 155 157 1590.00
0.10
0.20
0.30
0.40
0.50
0.60
129 131 133 135 137 141 143 145 147 149 151 153 155 157 159
CxpGT4molestus:�AR/pAR=3.4/0.4pipiens:�AR/pAR=12.9/9.8
0.00
0.10
0.20
0.30
116 118 120 122 124 126 128 130 132 134 136 138 140 144 146 148 152 154 156 162 166 168
CxpGT20molestus:�AR/pAR=9.6/1.9pipiens:�AR/pAR=17.2/9.4
0.00
0.10
0.20
0.30
116 118 120 122 124 126 128 130 132 134 136 138 140 144 146 148 152 154 156 162 166 168
CxpGT20molestus:�AR/pAR=9.6/1.9pipiens:�AR/pAR=17.2/9.4
0.00
0.10
0.20
0.30
0.40
0.50
0.60
0.70
0.80
0.90
139 145 147 149 151 155 157 159 161
CxpGT12molestus:�AR/pAR=2.7/0.3pipiens:�AR/pAR=7.5/5.1
0.00
0.10
0.20
0.30
0.40
0.50
0.60
0.70
168 172 178 180 186 192 194 196 198 202 206 210 212 222
CxpGT40molestus:�AR/pAR=6.2/2.7pipiens:�AR/pAR=8.7/5.2
0.000.100.200.300.400.500.600.700.800.90
139 145 147 149 151 155 157 159 161
CxpGT12molestus:�AR/pAR=2.7/0.3pipiens:�AR/pAR=7.5/5.1
0.000.100.200.300.400.500.600.700.800.90
139 145 147 149 151 155 157 159 161
CxpGT12molestus:�AR/pAR=2.7/0.3pipiens:�AR/pAR=7.5/5.1
0.00
0.10
0.20
0.30
0.40
0.50
0.60
0.70
168 172 178 180 186 192 194 196 198 202 206 210 212 222
CxpGT40molestus:�AR/pAR=6.2/2.7pipiens:�AR/pAR=8.7/5.2
0.00
0.10
0.20
0.30
0.40
0.50
0.60
0.70
168 172 178 180 186 192 194 196 198 202 206 210 212 222
CxpGT40molestus:�AR/pAR=6.2/2.7pipiens:�AR/pAR=8.7/5.2
0.00
0.10
0.20
0.30
101 105 107 109 111 113 115 117 119 121 123 125 127 129 135 137 139 141 145 147 149 153 161 163 165 167
CxpGT51molestus:�AR/pAR=10.7/1.5pipiens:�AR/pAR=20.5/11.3
0.00
0.10
0.20
0.30
101 105 107 109 111 113 115 117 119 121 123 125 127 129 135 137 139 141 145 147 149 153 161 163 165 167
CxpGT51molestus:�AR/pAR=10.7/1.5pipiens:�AR/pAR=20.5/11.3
0.00
0.10
0.20
0.30
0.40
0.50
0.60
0.70
0.80
0.90
260 262 264 266 268 270 272 276 286
CQ11molestus:�AR/pAR=2.8/0.0pipiens:�AR/pAR=8.3/5.4
0.00
0.10
0.20
0.30
0.40
0.50
0.60
0.70
0.80
0.90
260 262 264 266 268 270 272 276 2860.00
0.10
0.20
0.30
0.40
0.50
0.60
0.70
0.80
0.90
260 262 264 266 268 270 272 276 286
CQ11molestus:�AR/pAR=2.8/0.0pipiens:�AR/pAR=8.3/5.4
0.00
0.10
0.20
0.30
0.40
190 192 194 196 198 202 204 206 208 210 212 214
CQ26molestus:�AR/pAR=5.2/0.5pipiens:�AR/pAR=10.7/6.1
0.00
0.10
0.20
0.30
0.40
190 192 194 196 198 202 204 206 208 210 212 2140.00
0.10
0.20
0.30
0.40
190 192 194 196 198 202 204 206 208 210 212 214
CQ26molestus:�AR/pAR=5.2/0.5pipiens:�AR/pAR=10.7/6.1
0.00
0.10
0.20
0.30
0.40
0.50
130 136 138 140 142 146 152 154 156 158 160 162 168 170 174 188
CQ41molestus:�AR/pAR=7.9/3.0pipiens:�AR/pAR=10.8/5.9
0.00
0.10
0.20
0.30
0.40
0.50
130 136 138 140 142 146 152 154 156 158 160 162 168 170 174 1880.00
0.10
0.20
0.30
0.40
0.50
130 136 138 140 142 146 152 154 156 158 160 162 168 170 174 188
CQ41molestus:�AR/pAR=7.9/3.0pipiens:�AR/pAR=10.8/5.9
0.00
0.10
0.20
0.30
0.40
0.50
0.60
129 131 133 135 137 141 143 145 147 149 151 153 155 157 159
CxpGT4molestus:�AR/pAR=3.4/0.4pipiens:�AR/pAR=12.9/9.8
0.00
0.10
0.20
0.30
0.40
0.50
0.60
129 131 133 135 137 141 143 145 147 149 151 153 155 157 1590.00
0.10
0.20
0.30
0.40
0.50
0.60
129 131 133 135 137 141 143 145 147 149 151 153 155 157 159
CxpGT4molestus:�AR/pAR=3.4/0.4pipiens:�AR/pAR=12.9/9.8
0.00
0.10
0.20
0.30
116 118 120 122 124 126 128 130 132 134 136 138 140 144 146 148 152 154 156 162 166 168
0.00
0.10
0.20
0.30
116 118 120 122 124 126 128 130 132 134 136 138 140 144 146 148 152 154 156 162 166 168
CxpGT20molestus:�AR/pAR=9.6/1.9pipiens:�AR/pAR=17.2/9.4
0.00
0.10
0.20
0.30
0.40
0.50
0.60
0.70
0.80
0.90
139 145 147 149 151 155 157 159 161
CxpGT12molestus:�AR/pAR=2.7/0.3pipiens:�AR/pAR=7.5/5.1
0.00
0.10
0.20
0.30
0.40
0.50
0.60
0.70
0.80
0.90
139 145 147 149 151 155 157 159 161
0.00
0.10
0.20
0.30
0.40
0.50
0.60
0.70
0.80
0.90
139 145 147 149 151 155 157 159 161
CxpGT12molestus:�AR/pAR=2.7/0.3pipiens:�AR/pAR=7.5/5.1
0.00
0.10
0.20
0.30
0.40
0.50
0.60
0.70
168 172 178 180 186 192 194 196 198 202 206 210 212 222
CxpGT40molestus:�AR/pAR=6.2/2.7pipiens:�AR/pAR=8.7/5.2
0.00
0.10
0.20
0.30
0.40
0.50
0.60
0.70
168 172 178 180 186 192 194 196 198 202 206 210 212 2220.00
0.10
0.20
0.30
0.40
0.50
0.60
0.70
168 172 178 180 186 192 194 196 198 202 206 210 212 222
CxpGT40molestus:�AR/pAR=6.2/2.7pipiens:�AR/pAR=8.7/5.2
0.00
0.10
0.20
0.30
101 105 107 109 111 113 115 117 119 121 123 125 127 129 135 137 139 141 145 147 149 153 161 163 165 167
0.00
0.10
0.20
0.30
101 105 107 109 111 113 115 117 119 121 123 125 127 129 135 137 139 141 145 147 149 153 161 163 165 167
CxpGT51molestus:�AR/pAR=10.7/1.5pipiens:�AR/pAR=20.5/11.3
0.00
0.10
0.20
0.30
0.40
0.50
0.60
0.70
0.80
0.90
260 262 264 266 268 270 272 276 2860.00
0.10
0.20
0.30
0.40
0.50
0.60
0.70
0.80
0.90
260 262 264 266 268 270 272 276 286
CQ11molestus:�AR/pAR=2.8/0.0pipiens:�AR/pAR=8.3/5.4
0.00
0.10
0.20
0.30
0.40
190 192 194 196 198 202 204 206 208 210 212 2140.00
0.10
0.20
0.30
0.40
190 192 194 196 198 202 204 206 208 210 212 214
CQ26molestus:�AR/pAR=5.2/0.5pipiens:�AR/pAR=10.7/6.1
0.000.100.200.300.400.500.600.700.800.90
260 262 264 266 268 270 272 276 286
CQ11molestus:�AR/pAR=2.8/0.0pipiens:�AR/pAR=8.3/5.4
0.000.100.200.300.400.500.600.700.800.90
260 262 264 266 268 270 272 276 286
CQ11molestus:�AR/pAR=2.8/0.0pipiens:�AR/pAR=8.3/5.4
0.00
0.10
0.20
0.30
0.40
190 192 194 196 198 202 204 206 208 210 212 214
CQ26molestus:�AR/pAR=5.2/0.5pipiens:�AR/pAR=10.7/6.1
0.00
0.10
0.20
0.30
0.40
190 192 194 196 198 202 204 206 208 210 212 214
CQ26molestus:�AR/pAR=5.2/0.5pipiens:�AR/pAR=10.7/6.1
0.00
0.10
0.20
0.30
0.40
0.50
130 136 138 140 142 146 152 154 156 158 160 162 168 170 174 1880.00
0.10
0.20
0.30
0.40
0.50
130 136 138 140 142 146 152 154 156 158 160 162 168 170 174 188
CQ41molestus:�AR/pAR=7.9/3.0pipiens:�AR/pAR=10.8/5.9
0.00
0.10
0.20
0.30
0.40
0.50
0.60
129 131 133 135 137 141 143 145 147 149 151 153 155 157 1590.00
0.10
0.20
0.30
0.40
0.50
0.60
129 131 133 135 137 141 143 145 147 149 151 153 155 157 159
CxpGT4molestus:�AR/pAR=3.4/0.4pipiens:�AR/pAR=12.9/9.8
0.00
0.10
0.20
0.30
0.40
0.50
130 136 138 140 142 146 152 154 156 158 160 162 168 170 174 188
CQ41molestus:�AR/pAR=7.9/3.0pipiens:�AR/pAR=10.8/5.9
0.00
0.10
0.20
0.30
0.40
0.50
130 136 138 140 142 146 152 154 156 158 160 162 168 170 174 188
CQ41molestus:�AR/pAR=7.9/3.0pipiens:�AR/pAR=10.8/5.9
0.00
0.10
0.20
0.30
0.40
0.50
0.60
129 131 133 135 137 141 143 145 147 149 151 153 155 157 159
CxpGT4molestus:�AR/pAR=3.4/0.4pipiens:�AR/pAR=12.9/9.8
0.00
0.10
0.20
0.30
0.40
0.50
0.60
129 131 133 135 137 141 143 145 147 149 151 153 155 157 1590.00
0.10
0.20
0.30
0.40
0.50
0.60
129 131 133 135 137 141 143 145 147 149 151 153 155 157 159
CxpGT4molestus:�AR/pAR=3.4/0.4pipiens:�AR/pAR=12.9/9.8
0.00
0.10
0.20
0.30
116 118 120 122 124 126 128 130 132 134 136 138 140 144 146 148 152 154 156 162 166 168
CxpGT20molestus:�AR/pAR=9.6/1.9pipiens:�AR/pAR=17.2/9.4
0.00
0.10
0.20
0.30
116 118 120 122 124 126 128 130 132 134 136 138 140 144 146 148 152 154 156 162 166 168
CxpGT20molestus:�AR/pAR=9.6/1.9pipiens:�AR/pAR=17.2/9.4
0.00
0.10
0.20
0.30
0.40
0.50
0.60
0.70
0.80
0.90
139 145 147 149 151 155 157 159 161
0.00
0.10
0.20
0.30
0.40
0.50
0.60
0.70
0.80
0.90
139 145 147 149 151 155 157 159 161
CxpGT12molestus:�AR/pAR=2.7/0.3pipiens:�AR/pAR=7.5/5.1
0.00
0.10
0.20
0.30
0.40
0.50
0.60
0.70
168 172 178 180 186 192 194 196 198 202 206 210 212 2220.00
0.10
0.20
0.30
0.40
0.50
0.60
0.70
168 172 178 180 186 192 194 196 198 202 206 210 212 222
CxpGT40molestus:�AR/pAR=6.2/2.7pipiens:�AR/pAR=8.7/5.2
0.000.100.200.300.400.500.600.700.800.90
139 145 147 149 151 155 157 159 161
CxpGT12molestus:�AR/pAR=2.7/0.3pipiens:�AR/pAR=7.5/5.1
0.000.100.200.300.400.500.600.700.800.90
139 145 147 149 151 155 157 159 161
CxpGT12molestus:�AR/pAR=2.7/0.3pipiens:�AR/pAR=7.5/5.1
0.00
0.10
0.20
0.30
0.40
0.50
0.60
0.70
168 172 178 180 186 192 194 196 198 202 206 210 212 222
CxpGT40molestus:�AR/pAR=6.2/2.7pipiens:�AR/pAR=8.7/5.2
0.00
0.10
0.20
0.30
0.40
0.50
0.60
0.70
168 172 178 180 186 192 194 196 198 202 206 210 212 222
CxpGT40molestus:�AR/pAR=6.2/2.7pipiens:�AR/pAR=8.7/5.2
0.00
0.10
0.20
0.30
101 105 107 109 111 113 115 117 119 121 123 125 127 129 135 137 139 141 145 147 149 153 161 163 165 167
CxpGT51molestus:�AR/pAR=10.7/1.5pipiens:�AR/pAR=20.5/11.3
0.00
0.10
0.20
0.30
101 105 107 109 111 113 115 117 119 121 123 125 127 129 135 137 139 141 145 147 149 153 161 163 165 167
CxpGT51molestus:�AR/pAR=10.7/1.5pipiens:�AR/pAR=20.5/11.3
0.00
0.10
0.20
0.30
230 232 238 240 246 250 252 254 256 258 260 262 264 266 268 270 272 274 276 278 280 284 286 288 290 298 300 302
CxpGT53molestus:�AR/pAR=12.6/3.1pipiens:�AR/pAR=21.3/11.7
0.00
0.10
0.20
0.30
230 232 238 240 246 250 252 254 256 258 260 262 264 266 268 270 272 274 276 278 280 284 286 288 290 298 300 3020.00
0.10
0.20
0.30
230 232 238 240 246 250 252 254 256 258 260 262 264 266 268 270 272 274 276 278 280 284 286 288 290 298 300 302
CxpGT53molestus:�AR/pAR=12.6/3.1pipiens:�AR/pAR=21.3/11.7
0.00
0.10
0.20
0.30
0.40
0.50
260 262 264 266 268 270 272 274 276 278 280 282 290
CxpGT46molestus:�AR/pAR=5.4/0.2pipiens:�AR/pAR=11.5/6.4
0.00
0.10
0.20
0.30
0.40
0.50
0.60
0.70
0.80
0.90
1.00
137 149 151
CxqGT4molestus:�AR/pAR=1.6/0.1pipiens:�AR/pAR=2.5/1.0
0.00
0.10
0.20
0.30
0.40
0.50
260 262 264 266 268 270 272 274 276 278 280 282 2900.00
0.10
0.20
0.30
0.40
0.50
260 262 264 266 268 270 272 274 276 278 280 282 290
CxpGT46molestus:�AR/pAR=5.4/0.2pipiens:�AR/pAR=11.5/6.4
0.00
0.10
0.20
0.30
0.40
0.50
0.60
0.70
0.80
0.90
1.00
137 149 1510.00
0.10
0.20
0.30
0.40
0.50
0.60
0.70
0.80
0.90
1.00
137 149 151
CxqGT4molestus:�AR/pAR=1.6/0.1pipiens:�AR/pAR=2.5/1.0
0.00
0.10
0.20
0.30
0.40
0.50
124 130 132 134 136 138 140
CxqGT6bmolestus:�AR/pAR=3.5/0.3pipiens:�AR/pAR=6.2/2.9
0.00
0.10
0.20
0.30
0.40
0.50
0.60
0.70
0.80
0.90
111 114 117
CxqTri4molestus:�AR/pAR=2.0/0.0pipiens:�AR/pAR=3.0/1.0
0.00
0.10
0.20
0.30
0.40
0.50
124 130 132 134 136 138 1400.00
0.10
0.20
0.30
0.40
0.50
124 130 132 134 136 138 140
CxqGT6bmolestus:�AR/pAR=3.5/0.3pipiens:�AR/pAR=6.2/2.9
0.00
0.10
0.20
0.30
0.40
0.50
0.60
0.70
0.80
0.90
111 114 1170.00
0.10
0.20
0.30
0.40
0.50
0.60
0.70
0.80
0.90
111 114 117
CxqTri4molestus:�AR/pAR=2.0/0.0pipiens:�AR/pAR=3.0/1.0
0.00
0.10
0.20
0.30
230 232 238 240 246 250 252 254 256 258 260 262 264 266 268 270 272 274 276 278 280 284 286 288 290 298 300 3020.00
0.10
0.20
0.30
230 232 238 240 246 250 252 254 256 258 260 262 264 266 268 270 272 274 276 278 280 284 286 288 290 298 300 302
CxpGT53molestus:�AR/pAR=12.6/3.1pipiens:�AR/pAR=21.3/11.7
0.00
0.10
0.20
0.30
230 232 238 240 246 250 252 254 256 258 260 262 264 266 268 270 272 274 276 278 280 284 286 288 290 298 300 302
CxpGT53molestus:�AR/pAR=12.6/3.1pipiens:�AR/pAR=21.3/11.7
0.00
0.10
0.20
0.30
0.40
0.50
260 262 264 266 268 270 272 274 276 278 280 282 2900.00
0.10
0.20
0.30
0.40
0.50
260 262 264 266 268 270 272 274 276 278 280 282 290
CxpGT46molestus:�AR/pAR=5.4/0.2pipiens:�AR/pAR=11.5/6.4
0.00
0.10
0.20
0.30
0.40
0.50
0.60
0.70
0.80
0.90
1.00
137 149 1510.00
0.10
0.20
0.30
0.40
0.50
0.60
0.70
0.80
0.90
1.00
137 149 151
CxqGT4molestus:�AR/pAR=1.6/0.1pipiens:�AR/pAR=2.5/1.0
0.00
0.10
0.20
0.30
0.40
0.50
260 262 264 266 268 270 272 274 276 278 280 282 290
CxpGT46molestus:�AR/pAR=5.4/0.2pipiens:�AR/pAR=11.5/6.4
0.000.100.200.300.400.500.600.700.800.901.00
137 149 151
CxqGT4molestus:�AR/pAR=1.6/0.1pipiens:�AR/pAR=2.5/1.0
0.00
0.10
0.20
0.30
0.40
0.50
124 130 132 134 136 138 1400.00
0.10
0.20
0.30
0.40
0.50
124 130 132 134 136 138 140
CxqGT6bmolestus:�AR/pAR=3.5/0.3pipiens:�AR/pAR=6.2/2.9
0.00
0.10
0.20
0.30
0.40
0.50
0.60
0.70
0.80
0.90
111 114 1170.00
0.10
0.20
0.30
0.40
0.50
0.60
0.70
0.80
0.90
111 114 117
CxqTri4molestus:�AR/pAR=2.0/0.0pipiens:�AR/pAR=3.0/1.0
0.00
0.10
0.20
0.30
0.40
0.50
124 130 132 134 136 138 140
CxqGT6bmolestus:�AR/pAR=3.5/0.3pipiens:�AR/pAR=6.2/2.9
0.000.100.200.300.400.500.600.700.800.90
111 114 117
CxqTri4molestus:�AR/pAR=2.0/0.0pipiens:�AR/pAR=3.0/1.0
BMC Evolutionary Biology 2009, 9:262 http://www.biomedcentral.com/1471-2148/9/262
Page 8 of 15(page number not for citation purposes)
Table 4: Results of heterozygosity tests [52] for molestus and pipiens clusters of Cx. Pipiens
SMM TPM (10%) TPM (20%) TPM (30%)
Cluster 1(molestus)
He>Heq 4 6 8 9
PHe ≠ Heq 0.027 0.685 0.736 0.497Cluster 2(pipiens)
He>Heq 2 3 6 8
PHe ≠ Heq 0.005 0.057 0.340 0.893
He>Heq: number of loci in which expected heterozygosity estimated from allele frequencies (He) was higher than the estimate obtained from the number of alleles and sample size under MDE (Heq). PHe ≠ Heq: P-values of Wilcoxon tests to detect if He differs from Heq in a significant number of loci. SMM: stepwise mutation model. TPM: two-phase model. In bold: significant P-value after correction for multiple testing by the sequential Bonferroni procedure.
Bayesian assignment of simulated purebred and hybrid individuals obtained by HYBRIDLAB [25], as implemented by NEWHY-BRIDS [24]Figure 4Bayesian assignment of simulated purebred and hybrid individuals obtained by HYBRIDLAB [25], as imple-mented by NEWHYBRIDS [24]. Pure molestus, pure pipiens and hybrid (F1, F2 and backcrosses with each parental line) simulated individuals were generated from the genotypes of Cx. pipiens specimens that displayed by NEWHYBRIDS a qi>0.90 of being pure molestus (N = 100) and pure pipiens (N = 11). Simulations were done using HYBRIDLAB [25] to produce 100 sim-ulated individuals for each class. Each vertical line represents a simulated individual. Lines are partitioned in colours according to the probabilities of assignment to each class. A: probabilities were obtained for each of the six classes. B: the "hybrid" cate-gory is the sum of probabilities of assignment to each of the four hybrid classes originally simulated.
����
����
����
����
����
���
���
����
����
�� �
����
�������� ������� ������
Pure molestus Pure pipiens Hybrid
B
����
����
����
����
����
���
���
����
����
�� �
����
�������� ������� �� �� �� �� !
Pure molestus Pure pipiens F1 F2 Bx molestus Bx pipiens
A
����
����
����
����
����
����
����
���
���
����
����
�������� ������� ��� �!
Pure molestus Pure pipiens Hybrid
B
����
����
����
����
����
����
����
���
���
����
����
�������� ������� �� �� "# $ "# %
Pure molestus Pure pipiens F1 F2 Bx molestus Bx pipiens
A
����
����
����
����
����
���
���
����
����
�� �
����
�������� ������� ������
����
����
����
����
����
���
���
����
����
�� �
����
�������� ������� ������
Pure molestus Pure pipiens Hybrid
B
����
����
����
����
����
���
���
����
����
�� �
����
�������� ������� �� �� �� �� !
����
����
����
����
����
���
���
����
����
�� �
����
����
����
����
����
���
���
����
����
�� �
����
�������� ������� �� �� �� �� !
Pure molestus Pure pipiens F1 F2 Bx molestus Bx pipiens
A
����
����
����
����
����
����
����
���
���
����
����
�������� ������� ��� �!
Pure molestus Pure pipiens Hybrid
B
����
����
����
����
����
����
����
���
���
����
����
�������� ������� �� �� "# $ "# %
Pure molestus Pure pipiens F1 F2 Bx molestus Bx pipiens
A

BMC Evolutionary Biology 2009, 9:262 http://www.biomedcentral.com/1471-2148/9/262
between 7.6% (Tq = 0.70) and 10.3% (Tq = 0.50), valuescomparable to the 9.0% proportion obtained by STRUC-TURE [23] analysis (Table 5).
DiscussionInsectary experiments based on the progeny of field-caught Cx. pipiens females revealed strong associationsbetween alternative traits that define molestus and pipi-ens forms. The highest proportions of inseminatedfemales were seen in autogenous families. These two asso-ciated traits are expected for an autogenous/stenogamousmolestus population. Conversely, non-autogenous fami-lies exhibited the lowest insemination rates suggestingthat these families represent the anautogenous/eurygamicpipiens population. The non-autogenous group includedfamilies that oviposited after a blood meal and those inwhich no oviposition was detected throughout the exper-iment. Factors such as poor adaptation to insectary condi-tions causing gonotrophic dissociation could haveresulted in the absence of oviposition in families that oth-erwise could in fact be autogenous. On the other hand,low insemination rates could also determine the lack ofoviposition. Coincidently, no inseminated females weredetected in all the 19 families that did not oviposit afterblood feeding. Under the experimental conditions used,absence of insemination reflects the inability of mating inconfined spaces, a trait of the pipiens form.
The observed phenotypic separation was confirmed bymicrosatellite analysis. Extensive heterozygote deficits
and linkage between loci were detected when all individ-uals were treated as a single sample. These departures weregreatly reduced when the sample was tentatively subdi-vided into subsamples defined by the CQ11FL locus, asingle-locus marker available to distinguish molestus andpipiens forms [15]. The Bayesian method of Pritchard andco-workers [23] identifies clusters from multilocus geno-typic frequencies based on the minimisation of departuresfrom Hardy-Weinberg equilibrium and of linkage dise-quilibrium between loci. This analysis revealed two dis-tinct genetic clusters that were largely coincident with themolestus and pipiens forms defined by both the pheno-typic traits and the CQ11FL locus. Altogether, these resultssuggest that molestus and pipiens forms represent distinctgene pools of a subdivided Cx. pipiens population.
From the comparison with the ancestry groups revealedby STRUCTURE [23], CQ11FL was only partially effectiveas a diagnostic marker. There was a good concordancebetween alternative homozygous genotypes and eachform but heterozygous CQ11FL genotypes performed lesswell in determining admixed individuals. Under condi-tions of continued hybridisation, recombination andindependent assortment will break the linkage betweenalternative diagnostic genotypes and their respectivegenetic ancestry background. As pointed by Bahnck andFonseca [15], results from this marker should thus beinterpreted only at the population level. NeverthelessCQ11FL still served as a good indicator of the sympatric
Bayesian assignment of individuals into pure and hybrid classes as implemented by NEWHYBRIDS [24]Figure 5Bayesian assignment of individuals into pure and hybrid classes as implemented by NEWHYBRIDS [24]. Each column represents an individual analysed and it is partitioned into colours according to the probability of assignment to each of the six classes denoted in the label (pure molestus, pure pipiens, F1 hybrid, F2 hybrid, BxM: backcross with molestus, BxP: backcross with pipiens). Individuals were arranged according to their probability of ancestry obtained by STRUCTURE [23] analysis. Dashed lines highlight the two probability thresholds (Tq) used to assign individuals into classes (see Methods).
�"��
�"��
�"��
�"��
�"��
�"�
�"�
�"��
�"��
�" �
�"��
�������� ������� �� �� �� ��!
#������$�$%��������& '������ #������$�$%�������&�"��
�"��
�"��
�"��
�"��
�"�
�"�
�"��
�"��
�" �
�"��
�������� ������� �� �� �� ��!�������� ������� �� �� �� ��!
#������$�$%��������& '������ #������$�$%�������&
Page 9 of 15(page number not for citation purposes)

BMC Evolutionary Biology 2009, 9:262 http://www.biomedcentral.com/1471-2148/9/262
presence of both molestus and pipiens forms in the studyarea.
Based on the partitioning of samples according to ancestryclusters revealed by STRUCTURE [23], a global FST of0.127 was obtained between molestus and pipiens forms.This estimate is slightly lower but still comparable tothose reported in previous comparisons between under-ground molestus and aboveground pipiens populations(usually between 0.130 and 0.190) using similar micros-atellite datasets [6,26]. Although no molestus under-ground populations from the study area were available forcomparison, it appears that gene flow between molestusand pipiens forms is not significantly increased by thesympatric co-existence of both populations in the surface.This argument plays in favour of the hypothesis of at leastpartial reproductive isolation between molestus and pipi-ens forms and that the under/aboveground physical dis-continuity is not the only factor promoting geneticdivergence, as previously debated [4,7,8]. Under this par-ticular situation of sympatry, positive reinforcement mayplay a role in counteracting the effects of gene flow [27],hence maintaining isolation between forms.
Microsatellite CQ11 displayed the highest differentiationbetween molestus and pipiens, with an FST estimate ca. 2-fold greater than for the other loci. This locus was close tofixation in molestus form for a 286 bp allele, but this wasa low-frequency allele in the pipiens form (Figure 3). Thisallelic profile is not unique for the study area. High fre-quencies of a CQ11 allele in the same size range (283-285bp) have been reported for underground and above-ground molestus populations from Europe and the USA[7,8,15]. This continental-wide genetic signature is con-sistent with a single evolutionary origin of the molestusform, possibly arising in the southern latitudes of Europeor North Africa as a human-adapted commensal form,that later dispersed into northern latitudes as under-ground suitable habitats became available [7]. Further-more, this locus-specific differentiation may indicate thatCQ11 locates in a genomic region under divergent selec-tion. In these genomic regions, reduced recombinationand selection against introgression maintain differentia-
tion not only at loci associated with traits of ecologicaladaptation or reproductive isolation but also at surround-ing neutral loci through genetic hitchhiking [28,29]. Thismechanism is considered a major process of sympatric/ecological speciation and has been described in severalinsect species [30-32]. Genome-wide scans will be neces-sary to confirm the presence of such genomic regions inCx. pipiens.
Estimates of hybrid rates between molestus and pipiensforms between 7-10% were obtained by STRUCTURE [23]and NEWHYBRIDS [24] admixture analysis. These valuesare similar to the estimates obtained for southern Euro-pean aboveground populations (10%) using STRUCTURE[23], although the authors used a different Tq of 0.06 [7].Adjusting ancestry assignment to this threshold stillyielded a comparable hybrid rate of 15.2% for our sam-ple. In comparisons between underground molestus andaboveground pipiens populations from the USA hybridrates of 12% have been documented [6] but up to 40%admixed individuals have been documented in USA Cx.pipiens populations by Fonseca and co-workers [7].According to the authors, a more recent colonisation andposterior contact of separate Old World molestus and pip-iens populations may explain the higher levels of hybrid-isation found in the USA. On the other hand, the lowlevels of hybridisation in southern European Cx. pipienspopulations, even when both forms occur sympatricallyas here demonstrated, provides additional support forreproductive/ecological barriers to gene flow other thanhabitat segregation.
The degree of microsatellite differentiation in our datasetwas insufficient to identify hybrids beyond the F1 class, asrevealed by the analysis of simulated data. This was not anunexpected result as NEWHYBRIDS [24] often requires alarge number of highly diagnostic markers between pop-ulations to identify F2 and backcrossed hybrids with con-fidence [33,34]. However, this analysis revealedimportant differences in the proportions of admixturewithin forms. Individuals with molestus ancestry were allclassified as purebred molestus with probabilities ofassignment above 0.92. In contrast, individuals with pip-iens ancestry had a mean proportion of admixture of0.387 (as measured by the individual posterior probabili-ties of belonging into a non-pipiens class) and 28-48%(depending on Tq) were classified as hybrids. These differ-ences suggest a pattern of asymmetrical gene flow, inwhich higher proportions of molestus alleles are intro-gressed into the pipiens form. A similar trend has alsobeen described in a population from Chicago IL (USA), inwhich the pipiens form presented higher proportions ofmolestus and Cx. quinquefasciatus ancestry [26].
Table 5: Proportions of pure and admixed Culex pipiens individuals inferred by Bayesian assignment methods implemented by SRUCTURE [23] and NEWHYBRIDS [24]
molestus admixed pipiens
STRUCTURE 96 (66.2) 13 (9.0) 36 (24.8)NEWHYBRIDS (Tq = 0.50) 104 (71.7) 15 (10.3) 26 (17.9)NEWHYBRIDS (Tq = 0.70)* 101 (69.7) 11 (7.6) 19 (13.1)
* At this threshold, only 131 specimens were assigned to classes. The remainder 14 analysed individuals presented qi<0.70 of belonging to any of the classes and were thus undetermined.
Page 10 of 15(page number not for citation purposes)

BMC Evolutionary Biology 2009, 9:262 http://www.biomedcentral.com/1471-2148/9/262
Another hypothesis could be raised if the molestus formwould have locally evolved from the pipiens formthrough a recent founding event. Under this scenario, themicrosatellite composition of the molestus populationwould be made almost exclusively of only a subset of thealleles present in the pipiens form which might result inan apparent signal of admixture in the latter. While esti-mates of allele and private allele richness seem to supportthis view, there were considerable differences betweenforms in the microsatellite allele arrays that are not con-sistent with this hypothesis. These differences are illus-trated by the number of mutational steps separating themost frequent alleles at each locus. Size variance-basedRST values were higher than frequency-based FST values innearly half of the loci and also for the mean over-loci esti-mates. Higher RST estimates do not conciliate with a recentfounding event that would otherwise imply that geneticdrift rather than mutation would be the primary evolu-tionary force shaping genetic divergence between forms[35]. Moreover, heterozygosity tests provided no evidencefor the molestus form to have recently undergone anymajor population reduction that would be expected froma founding event. Finally, the peculiar composition of theCQ11 microsatellite in the molestus form, displaying ahigh frequency allele common to all other molestus pop-ulations regardless of geographic origin is also not consist-ent with local multiple origins of the molestus form.Altogether, these evidences render the hypothesis of themolestus population being derived from the local pipiensform unlikely. Extending the analysis to other regions ofsympatry between molestus and pipiens would provideinsights on whether the observed patterns of introgressionare a local phenomenon or a general trend for the speciesin its southern distribution.
The mechanisms underlying the patterns of asymmetricalintrogression between molestus and pipiens areunknown. One hypothesis can be drawn from the differ-ent mating strategies displayed by molestus and pipiensforms. Preferential introgression from molestus to pipienscould be expected if stenogamous molestus males matereadily with both molestus and pipiens females in above-ground habitats. On the other hand, pipiens malesrequire open spaces to mate due to swarm-based matingbehaviour [36]. This more specialised behaviour mayresult in a higher propensity to mate with pipiens females.This hypothesis relies on two main assumptions. The firstis that introgression between molestus and pipiens ismainly male-mediated and to test for this hypothesis theanalysis of sex-linked markers would be required. In arecent study analysing Asian populations of two addi-tional members of the Cx. pipiens complex, the allele spe-cific of Cx. quinquefasciatus at the sex-linked Ace-2 locuswas found to have introgressed into Culex pipiens pallensCoquillett, 1898 through the males [37]. Patterns of male-
mediated asymmetrical introgression have also beenreported in several other non-insect organisms, such astree frogs [38], warbler birds [39], mouse lemurs [40] andmacaque monkeys [41]. The second assumption is thatboth pipiens and hybrid females have a greater propensityfor seeking swarms for mating. To address this question,more studies are needed to characterise the swarming andmating behaviours in Cx. pipiens, in areas of sympatrybetween forms.
The molestus form was predominant in the study area andthis trend appeared to be maintained throughout the year(data not shown). While this factor may also contribute toa higher introgression of genes from molestus to pipiens,it may also suggest fitness differences between forms. Insouthern regions with mild winters, the inability of themolestus form to undergo diapause during winter may bea lesser disadvantage than at northern latitudes. Whenoccurring in sympatry with the pipiens form in surfacehabitats, autogeny and a more generalist mating behav-iour are likely to result in a greater fitness molestus form.
ConclusionBoth physiological/behavioural and genetic data provideevidence for the sympatric occurrence of molestus andpipiens forms of Cx. pipiens in aboveground habitats ofthe study area. In spite of the sympatric occurrence, esti-mated hybridisation rates were not much higher thanthose reported in ecological settings where both forms arephysically separated which suggests at least partial repro-ductive isolation between molestus and pipiens. Moreimportantly, hybridisation appears not to be bidirectionaland this is possibly a result of the different mating strate-gies exhibited by each form. The observed patterns ofasymmetrical introgression may have epidemiologicalrepercussions. In two recent studies covering three USAStates, pipiens form females that have fed upon mammals(humans in particular) presented significantly higher pro-portions of molestus genetic ancestry [10,26]. These find-ings suggest a genetic basis for host selection by Cx.pipiens. The introgression of molestus genes into the pipi-ens form may induce a more opportunistic biting behav-iour thus potentiating the capacity of the latter form to actas a bridge-vector for the transmission of arbovirus such asWNV [12]. Further studies focusing on the feeding habitsand population dynamics of molestus and pipiens formsare required in order to clarify the impact of hybridisationin the vectorial capacity of Cx. pipiens and, consequently,on the potential for transmission of arboviral infections.
MethodsStudy region and mosquito collectionMosquito collections took place between May 2005 andAugust 2006 in the Comporta region (38° 22' 60 N, 8°46' 60 W), District of Setubal, Portugal. Comporta is a
Page 11 of 15(page number not for citation purposes)
BMC Evolutionary Biology 2009, 9:262 http://www.biomedcentral.com/1471-2148/9/262
low-lying area (altitude <60 m) with diverse ecotypes.Residential areas are situated along a national road thatcrosses the study region from north to south. The southand east is mainly occupied by pine forest (Pinus pinasterAiton, 1789; Pinus pinea L., 1753) and semi-natural agro-forest systems of cork-oak (Quercus suber L., 1753). In thewest there are extensive areas of rice fields and a system ofsand-dunes. The north and northwest is part of a pro-tected landscape area occupied by marshland, rice fieldsand saltpans. This protected area extends northwards intothe national wildlife reserve of Estuário do Sado. Thereserve harbours over 240 bird species. These includemigratory birds such as the European starling (Sturnus vul-garis L., 1758), the mallard (Anas platyrhynchos L., 1758)and the white stork (Ciconia ciconia, L. 1758), that havebeen reported as WNV hosts [17].
The region has a warm temperate climate with a dry hotsummer and a mild winter (class Csa, Köppen Classifica-tion System [42]). Monthly averages of mean daily tem-peratures vary between 10°C and 21°C and relativehumidity between 76% and 89%. Monthly averages ofdaily rainfall fluctuate between 0.12 and 3.4 mm.
Bimonthly mosquito collections were made by indoorsresting captures and CDC light traps baited with CO2inside animal shelters (chicken, rabbit and pig). Collectedlive mosquitoes were transported to the laboratory andidentified to species or complex of sibling species usingmorphological keys [22].
Determination of autogeny and stenogamyBlood fed and gravid Cx. pipiens females were placed inindividual cages in an Insectary (25 ± 2°C; 70 ± 10% RH)until oviposition. Individual egg rafts were reared untilthe adult stage to obtain F1 families. Pupae from each F1family were transferred into cages with 20 cm side (0.008m3) for adult emergence. After emergence of the first adultthe family was kept in the cage with access to a fructose10% solution and an oviposition tray. Both pupae andoviposition trays where daily observed for the presence ofegg-rafts. If oviposition occurred until two days after theemergence of the last adult (i.e. on average 14 days afterthe emergence of the first adult of the egg batch) the fam-ily was deemed autogenous. Families that did not lay eggsduring this period were divided into two cages keepingsimilar sex ratios in each cage. In one of the cages mosqui-toes were maintained in similar conditions as previouslyin order to recover eventually autogenous families thathad delayed oviposition. In the other cage, females weregiven the opportunity to take a daily blood feed on a ver-tebrate host (mouse and chicken) for a period of 10 days.
After the end of the experiment, all F1 specimens were sac-rificed by chilling. Females had their abdomen dissected
to determine if their spermatheca was inseminated, as anindicator of the capacity to mate in confined spaces. Thehead and thorax of each female were preserved in individ-ual tubes with silica gel and kept at room temperatureuntil DNA extraction.
Molecular analysesDNA extraction from individual F1 females was per-formed by the method of Collins and co-workers [43].Specimens were identified to species of the Culex pipienscomplex by a multiplex PCR assay that targets species-spe-cific polymorphisms at the intron-2 of the acetylcho-linesterase-2 gene (Ace-2), using primers specific for Cx.pipiens s.s., Culex torrentium Martini, 1925 and Cx. quin-quefasciatus [21]. The first two species have been anno-tated for Portugal [22]. Although Cx. quinquefasciatus hasnot been found in Portugal, its subtropical distributionwith a northern limit around 36° latitude prompted us totest this additional primer. The PCR assay described byBahnck & Fonseca [15] was used to detect a size polymor-phism in the 5' flanking region of the CQ11 microsatelliteof Cx. pipiens. This marker, here denoted as CQ11FL, dif-ferentiates specimens of the pipiens form, that display aPCR product of 200 bp, from the molestus form (250 bp).Hybrids exhibit both amplicons (200 bp/250 bp).
Fourteen microsatellite loci [44-46] were analysed in thisstudy (Table S4, Additional File 1). Each locus was ampli-fied separately in a 20 μl PCR reaction that contained 1×GoTaq® Flexi Buffer (Promega, USA), 2.5 mM MgCl2, 0.20mg/ml Bovine Serum Albumin, 0.25 mM dNTPs, 0.20 μMof each primer and 0.5 U GoTaq® Flexi DNA polymerase(Promega, USA). For each locus, one of the primers wasfluorescently labelled (NED, HEX or 6-FAM; Applied Bio-systems, USA). Thermocycling conditions included an ini-tial denaturation step of 5 min at 96°C followed by 30cycles each with 96°C for 30 s, Annealing at 52°C-58°C(locus dependent, Table S4) for 30 s, and 72°C for 30 s.After a final extension step of 5 min at 72°C, reactionswere stopped at 4°C.
Amplified products were separated by capillary electro-phoresis in a genetic analyser ABI3730 (Applied Biosys-tems, USA) at the DNA Analysis Facility on Science Hill,Yale University (USA). Fragment sizes and genotypes werescored using the software GeneMarker 1.4. (Softgenetics,USA).
Data analysisPearson's Chi-square tests were used to determine associ-ations between autogeny and stenogamy phenotypic traitsand with CQ11FL genotypes.
Genetic diversity at each microsatellite locus was charac-terised by estimates of expected heterozygosity using Nei's
Page 12 of 15(page number not for citation purposes)

BMC Evolutionary Biology 2009, 9:262 http://www.biomedcentral.com/1471-2148/9/262
unbiased estimator [47] and inbreeding coefficient (FIS).Significance of FIS values was assessed by randomisationtests. These analyses were performed using FSTAT v.2.9.3.2. [48]. In addition, estimates of allele richness (AR)and private allele richness (pAR) adjusted for the lowestsample size were obtained by a rarefaction statisticalapproach implemented by the programme HP-RARE [49].
Departures from Hardy-Weinberg proportions were testedby exact tests available in ARLEQUIN v.3.11 [50]. Thesame software was used to perform exact tests of linkagedisequilibrium between pairs of loci based on the expec-tation-maximisation approach described by Slatkin andExcoffier [51]. Cornuet and Luikart's [52] heterozygositytests were used to detect recent population perturbations.This method compares two estimates of expected hetero-zygosity, based on allele frequency (He) and on thenumber of alleles and sample size (Heq), respectively. Atmutation-drift equilibrium (MDE), both estimates shouldbe similar but if a population experiences a recent bottle-neck there will be a transient state in which He>Heq due toa rapid loss of rare alleles. Conversely He<Heq is an indica-tor of a recent population expansion. Estimates of Hequnder MDE were obtained assuming a strict stepwisemutation model (SMM) and two-phase models (TPM)with proportions of indels larger than one repeat of 10%,20% and 30%. Wilcoxon tests were used to determine ifthere were a significant number of loci in which He ≠ Heqas an indication of departure from MDE. Calculationswere done using BOTTLENECK version 1.2.02 [52].
Genetic differentiation between groups was measured byestimates of the fixation index, FST, calculated accordingto Weir and Cockerham [53]. Genotypic permutationtests available in FSTAT [48] were performed to infer if theestimates differed significantly from zero. The microsatel-lites equivalent RST [35] was estimated as implemented byARLEQUIN [50].
Bayesian clustering analysis as implemented by STRUC-TURE 2.2 [23] was used to infer population substructure/ancestry from the dataset without prior information ofsampling groups (i.e. phenotypes), under the admixturemodel with correlated allele frequencies. Ten independ-ent runs with 105 burn-in steps and 105 iterations weredone for each value of K (K = 1 to 4 clusters). The methodof Evanno and co-workers [54] was used to determine themost likely number of clusters in the sample. Followingthe suggestions of Vaha and Primmer [34], individualgenetic assignment to clusters was based on a minimumposterior probability threshold (Tq) of 0.90. Individualsdisplaying 0.1 ≤ qi ≤ 0.90 were considered of admixedancestry.
The Bayesian method implemented by NEWHYBRIDS1.1. [24] was used to assign individuals into 6 classes:pure molestus, pure pipiens, and hybrids (F1, F2 andbackcrosses with molestus or pipiens). The approach ofuniform priors was used and results were based on theaverage of five independent runs each with 105 burn-insteps and 105 iterations.
The performance of NEWHYBRIDS to detect purebredand hybrid individuals with the present microsatellitedataset was assessed using simulated data generated byHYBRIDLAB [25]. From the initial NEWHYBRIDS analy-sis, pure molestus and pipiens individuals were selectedbased on a qi>0.90. From this sampling, 100 simulatedgenotypes of each parental and hybrid class were gener-ated. These artificial genotypes, without prior populationinformation, were analysed in NEWHYBRIDS. Followingthe examples of previous works [34,55], power (numberof correctly identified individuals for a class over theactual number of individuals of that class) and accuracy(number of correctly identified individuals for a class overthe total number of individuals assigned to that class)were calculated for four Tq values (0.50, 0.70, 0.80 and0.90). Analysis was based on the mean of five replicates ofsimulated datasets.
Whenever multiple testing was performed, the nominalsignificance level of rejection of the null hypothesis (α =0.05) was corrected by the sequential Bonferroni proce-dure [56].
Authors' contributionsBG, MTN, CAS, FBF, RA and APGA carried out sample col-lections and insectary experiments. Molecular analyseswere conducted by BG, PS, ARCR and FBF. BG, PS, ARCRand JP performed the genetic data analysis. MTN, CAS,APGA, MJD and JP conceived the study and designed theexperiments. BG and JP drafted the manuscript with thecontributions of PS, FBF, RA and MJD. All authors readand approved the final manuscript.
Additional material
Additional file 1Tables S1, S2, S3 and S4. Table S1. Genetic diversity at microsatellite loci of Culex pipiens from Portugal. Table S2. Estimates of FST and RST between forms of Culex pipiens identified by Bayesian clustering analysis performed in STRUCTURE [23]. Table S3. Power and accuracy of NEWHYBRIDS to detect purebred and hybrid simulated individuals. Table S4. Microsatellite loci analysed.Click here for file[http://www.biomedcentral.com/content/supplementary/1471-2148-9-262-S1.pdf]
Page 13 of 15(page number not for citation purposes)
BMC Evolutionary Biology 2009, 9:262 http://www.biomedcentral.com/1471-2148/9/262
AcknowledgementsWe thank Suraya Diaz for the technical support given to the field collec-tions and insectary experiments. We acknowledge the logistic support given by The Atlantic Company (Portugal)-Turismo e Urbanização, S.A., during the mosquito collections. This study was funded by Fundação para a Ciência e a Tecnologia/FEDER, Ministério da Ciência, Tecnologia e Ensino Superior (POCI/BIA-BDE/57650/2004 and PPCDT/BIA-BDE/57650/2004).
References1. Clements AN: The Biology of Mosquitoes: Sensory Reception and Behav-
iour Volume 2. Wallingford: CABI Publishing; 1999. 2. Harbach RE, Harrison BA, Gad AM: Culex (Culex) molestus For-
skål (Diptera, Culicidae) - neotype designation, description,variation, and taxonomic status. Proc Entomol Soc Wash 1984,86:521-542.
3. Harbach RE, Dahl C, White GB: Culex (Culex) pipiens Linnaeus(Diptera, Culicidae) - concepts, type designations, anddescription. Proc Entomol Soc Wash 1985, 87:1-24.
4. Byrne K, Nichols RA: Culex pipiens in London Undergroundtunnels: differentiation between surface and subterraneanpopulations. Heredity 1999, 82:7-15.
5. Vinogradova AN: Culex pipiens pipiens Mosquitoes: Taxonomy, Distribu-tion, Ecology, Physiology, Genetics, Applied Importance and Control Sofia:Pensoft Publishers; 2000.
6. Huang S, Molaei G, Andreadis TG: Genetic insights into the pop-ulation structure of Culex pipiens (Diptera: Culicidae) in theNortheastern United States by using microsatellite analysis.Am J Trop Med Hyg 2008, 79:518-527.
7. Fonseca DM, Keyghobadi N, Malcolm CA, Mehmet C, Schaffner F,Mogi M, Fleischer RC, Wilkerson RC: Emerging vectors in theCulex pipiens complex. Science 2004, 303:1535-1538.
8. Kent RJ, Harrington LC, Norris DE: Genetic differences betweenCulex pipiens f. molestus and Culex pipiens pipiens (Diptera:Culicidae) in New York. J Med Entomol 2007, 44:50-59.
9. Chevillon C, Eritja R, Pasteur N, Raymond M: Comensalism, adap-tation and gene flow: mosquitoes of the Culex pipiens com-plex in different habitats. Genet Res 1995, 66:147-157.
10. Kilpatrick M, Kramer LD, Jones MJ, Marra PP, Daszak P, Fonseca DM:Genetic influences on mosquito feeding behavior and theemergence of zoonotic pathogens. Am J Trop Med Hyg 2007,77:667-671.
11. Spielman A: Structure and seasonality of Nearctic Culex pipi-ens populations. Ann N Y Acad Sci 2001, 951:220-234.
12. Hamer GL, Kitron UD, Brawn JD, Loss SR, Ruiz MO, Goldberg TL,Walker ED: Culex pipiens (Diptera: Culicidae): a bridge vectorof West Niles Virus to humans. J Med Entomol 2008, 45:125-128.
13. Vinogradova EB, Shaikevich EV: Morphometric, physiological andmolecular characteristics of underground populations of theurban mosquito Culex pipiens Linnaeus f. molestus Forskål(Diptera: Culicidae) from several areas of Russia. Eur MosqBull 2007, 22:17-24.
14. Crabtree MB, Savage B, Miller BR: Development of a polymerasechain reaction assay for differentiation between Culex pipi-ens pipiens and Cx. p. quinquefasciatus (Diptera: Culicidae) inNorth America based on genomic differences identified bysubtractive hybridization. J Med Entomol 1997, 34:532-537.
15. Bahnck CM, Fonseca DM: Rapid assay to identify the twogenetic forms of Culex (Culex) pipiens L. (Diptera: Culicidae)and hybrid populations. Am J Trop Med Hyg 2006, 75:251-255.
16. Almeida APG, Galão RP, Sousa CA, Novo MT, Parreira R, Pinto J,Rodrigues JC, Piedade J, Esteves A: Potential mosquito vectors ofarboviruses in Portugal: species, distribution, abundance andarboviral infection. Trans R Soc Trop Med Hyg 2008, 102:823-832.
17. Rappole JH, Hubalek Z: Migratory birds and West Nile Virus. JAppl Microbiol 2003, 94:47S-58S.
18. Connell J, McKeown P, Garvey P, Cotter S, Conway A, O'Flanagan D,O'Herlihy BP, Morgan D, Nicoll A, Lloyd G: Two linked cases ofWest Nile virus (WNV) acquired by Irish tourists in theAlgarve, Portugal. Euro Surveill Weekly 2004, 8(32): [http://www.eurosurveillance.org/ViewArticle.aspx?ArticleId=2517].
19. Esteves A, Almeida APG, Galão RP, Parreira R, Piedade J, RodriguesJC, Sousa CA, Novo MT: West Nile Virus in Southern Portugal,2004. Vector Borne Zoonotic Dis 2005, 5:410-413.
20. Ribeiro H, Pires CA, Ramos HC, Capela RA: Research on the mos-quitoes of Portugal (Diptera, Culicicae). VIII- On the occur-rence of Culex (Culex) molestus Forskål, 1775. J Soc Cienc MedLisb 1983, 147:185-188.
21. Smith JL, Fonseca DM: Rapid assays for identification of mem-bers of the Culex (Culex) pipiens complex, their hybrids, andother sibling species (Diptera: Culicidae). Am J Trop Med Hyg2004, 70:339-345.
22. Ribeiro H, Ramos HC: Identification keys of the mosquitoes(Diptera: Culicidae) of Continental Portugal, Açores andMadeira. Eur Mosq Bull 1999, 3:1-11.
23. Pritchard JK, Stephens M, Donnelly P: Inference of populationstructure using multilocus genotype data. Genetics 2000,155:945-959.
24. Anderson EC, Thompson EA: A model-based method for identi-fying species hybrids using multilocus genetic data. Genetics2002, 160:1217-29.
25. Nielsen EE, Bach LA, Kotlicki P: Hybridlab (version 1.0): a pro-gramme for generating simulated hybrids from populationsamples. Mol Ecol Notes 2006, 6:971-973.
26. Huang S, Hamer GL, Molaei G, Walker ED, Goldberg TL, Kitron UD,Andreadis TG: Genetic variation associated with mammalianfeeding in Culex pipiens from a West Nile Virus epidemicregion in Chicago, Illinois. Vector Borne Zoonotic Dis in press.
27. Noor MA: Reinforcement and other consequences of sympa-try. Heredity 1999, 83:503-508.
28. Via S, West J: The genetic mosaic suggests a new role forhitchhiking in ecological speciation. Mol Ecol 2008,17:4334-4345.
29. Nosil P, Funk DJ, Ortiz-Barrientos D: Divergent selection andheterogeneous genomic divergence. Mol Ecol 2009,18:375-402.
30. Machado CA, Kliman RM, Markert JA, Hey J: Inferring the historyof speciation from multilocus DNA sequence data: the caseof Drosophila pseudoobscura and its close relatives. Mol BiolEvol 2002, 19:472-488.
31. Turner TL, Hahn MW, Nuzhdin SV: Genomic islands of specia-tion in Anopheles gambiae. PLoS Biol 2005, 3:e285.
32. Egan SP, Nosil P, Funk DJ: Selection and genomic differentiationduring ecological speciation: isolating the contributions ofhost association via a comparative genome scan of Neoch-lamisus bebbianae leaf beetles. Evolution 2008, 62:1162-1181.
33. Gow JL, Peichel CL, Taylor EB: Contrasting hybridization ratesbetween sympatric three-spined sticklebacks highlight thefragility of reproductive barriers between evolutionarilyyoung species. Mol Ecol 2006, 15:739-752.
34. Vähä JP, Primmer CR: Efficiency of model-based Bayesianmethods for detecting hybrid individuals under differenthybridization scenarios and with different numbers of loci.Mol Ecol 2006, 15:63-72.
35. Slatkin M: A Measure of population subdivision based on mic-rosatellite allele frequencies. Genetics 1995, 139:457-462.
36. Downes JA: The swarming and mating flight of Diptera. AnnuRev Entomol 1969, 14:271-298.
37. Fonseca DM, Smith JL, Kim HC, Mogi M: Population genetics ofthe mosquito Culex pipiens pallens reveals sex-linked asym-metric introgression by Culex quinquefasciatus. Infect GenetEvol in press.
38. Lamb T, Avise JC: Directional introgression of mitochondrialDNA in a hybrid population of tree frogs: The influence ofmating behavior. Proc Natl Acad Sci USA 1986, 83:2526-2530.
39. Bensch S, Helbig AJ, Salomon M, Seibold I: Amplified fragmentlength polymorphism analysis identifies hybrids betweentwo subspecies of warblers. Mol Ecol 2002, 11:473-481.
40. Gligor M, Ganzhorn JU, Rakotondravony D, Ramilijaona OR, Razafi-mahatratra E, Zischler H, Hapke A: Hybridization betweenmouse lemurs in an ecological transition zone in southernMadagascar. Mol Ecol 2009, 18:520-533.
41. Bonhomme M, Cuartero S, Blancher A, Crouau-Roy B: Assessingnatural introgression in 2 biomedical model species, the rhe-sus macaque (Macaca mulatta) and the long-tailed macaque(Macaca fascicularis). J Hered 2009, 100:158-169.
42. Kottek M, Grieser J, Beck C, Rudolf B, Rubel F: World map of theKöppen-Geiger climate classification updated. Meteorol Z2006, 15:259-263.
Page 14 of 15(page number not for citation purposes)
BMC Evolutionary Biology 2009, 9:262 http://www.biomedcentral.com/1471-2148/9/262
Publish with BioMed Central and every scientist can read your work free of charge
"BioMed Central will be the most significant development for disseminating the results of biomedical research in our lifetime."
Sir Paul Nurse, Cancer Research UK
Your research papers will be:
available free of charge to the entire biomedical community
peer reviewed and published immediately upon acceptance
cited in PubMed and archived on PubMed Central
yours — you keep the copyright
Submit your manuscript here:http://www.biomedcentral.com/info/publishing_adv.asp
BioMedcentral
43. Collins FH, Mendez MA, Rasmussen MO, Mehaffey PC, Besansky NJ,Finnerty V: A ribosomal RNA gene probe differentiates mem-ber species of the Anopheles gambiae complex. Am J Trop MedHyg 1987, 37:37-41.
44. Fonseca DM, Atkinson CT, Fleischer RC: Microsatellite primersfor Culex pipiens quinquefasciatus, the vector of avian malariain Hawaii. Mol Ecol 1998, 7:1617-1618.
45. Keyghobadi N, Matrone MA, Ebel GD, Kramer LD, Fonseca DM:Microsatellite loci from the northern house mosquito (Culexpipiens), a principal vector of West Nile Virus in NorthAmerica. Mol Ecol Notes 2004, 4:20-22.
46. Smith JL, Keyghobadi N, Matrone MA, Escher RL, Fonseca DM:Cross-species comparison of microsatellite loci in the Culexpipiens complex and beyond. Mol Ecol Notes 2005, 5:697-700.
47. Nei M: Molecular Evolutionary Genetics New York: Colombia UniversityPress; 1987.
48. Goudet J: FSTAT (version 1.2): A computer program to cal-culate F-statistics. J Hered 1995, 86:485-486 [http://jhered.oxfordjournals.org/cgi/reprint/86/6/485].
49. Kalinowski ST: HP-rare: A computer program performing rar-efaction on measures of allelic diversity. Mol Ecol Notes 2005,5:187-189.
50. Excoffier L, Laval G, Schneider S: Arlequin (version 3.0): an inte-grated software package for population genetics data analy-sis. Evol Bioinform Online 2005, 1:47-50.
51. Slatkin M, Excoffier L: Testing for linkage disequilibrium in gen-otypic data using the EM algorithm. Heredity 1996, 76:377-383.
52. Cornuet JM, Luikart G: Description and power analysis of twotests for detecting recent population bottlenecks from allelefrequency data. Genetics 1996, 144:2001-2014.
53. Weir BS, Cockerham CC: Estimating F-statistics for the analy-sis of population structure. Evolution 1984, 38:1358-1370.
54. Evanno G, Regnaut S, Goudet J: Detecting the number of clustersof individuals using the software STRUCTURE: a simulationstudy. Mol Ecol 2005, 14:2611-2620.
55. Burgarella C, Lorenzo Z, Jabbour-Zahab R, Lumaret R, Guichoux E,Petit RJ, Soto A, Gil L: Detection of hybrids in nature: applica-tion to oaks (Quercus suber and Q. ilex). Heredity 2009,102:442-52.
56. Holm S: A Simple Sequentially Rejective Multiple Test Proce-dure. Scand J Statist 1979, 6:65-70.
Page 15 of 15(page number not for citation purposes)
Copyright © 2022 FDOKUMEN