Infants' & Toddlers' Social Evaluations of Trustworthy and ...
Upload
independentCategory
view
5download
0
Research in Developmental Disabilities 35 (2014) 3632–3644
Contents lists available at ScienceDirect
Research in Developmental Disabilities
Assessing progress and outcome of early intensive behavioral
intervention for toddlers with autismRebecca MacDonald *, Diana Parry-Cruwys, Sally Dupere, William Ahearn
The New England Center for Children, Southborough, USA
A R T I C L E I N F O
Article history:
Received 30 April 2014
Received in revised form 22 August 2014
Accepted 28 August 2014
Available online
Keywords:
ABA
Applied behavior analysis
Autism
EIBI
Early intensive behavioral intervention
Outcome
A B S T R A C T
Intensive behavioral intervention for young children diagnosed with autism can produce
large gains in social, cognitive, and language development. Although several studies have
identified behaviors that are possible indicators of best outcome, changes in performance
are typically measured using norm-referenced standardized scores referencing overall
functioning level rather than via repeated observational measures of autism-specific
deficits (i.e., social behavior). In the current study, 83 children with autism (CWA), aged 1,
2 and 3 years, and 58 same-aged typically developing children (TDC) were directly
observed in the areas of cognitive skills, joint attention (JA), play, and stereotypic behavior
using a measure called the Early Skills Assessment Tool (ESAT; MacDonald et al., 2006).
CWA were assessed at entry into an EIBI program and again after 1 year of treatment.
Changes in performance were compared pre- and post-treatment as well as to the
normative data by age. Results indicate significant gains on the ESAT across all age groups
with the greatest gains seen in the children who entered treatment prior to their second
birthday. Increases were seen on direct measures of JA, play, imitation and language while
decreases were seen in stereotypy regardless of level of performance at entry into EIBI. The
ESAT, a direct measurement tool, served as a sensitive tool to measure changes in autism
symptomatology following EIBI treatment.
� 2014 Elsevier Ltd. All rights reserved.
1. Introduction
Early intensive behavioral intervention (EIBI) for young children diagnosed with autism (CWA) can produce large gains incognitive, language, and social development (Howlin, Magiati, & Charman, 2009). EIBI uses the principles of behavioranalysis (ABA) to increase behavior in the areas of imitation, receptive and expressive language, gross and fine motor skills,play, and JA, as well as decrease behavioral excesses, such as tantruming, aggression, self-injury, and vocal and motorstereotypic behavior (see Howard, Sparkman, Cohen, Green, & Stanislaw, 2005 for a detailed description of EIBIimplementation). When compared to other groups of CWA receiving eclectic intervention or minimal treatment, groupsreceiving EIBI achieved significantly larger gains (e.g., Eldevik, Hastings, Jahr, & Hughes, 2012).
In individual studies examining the efficacy of EIBI, standardized measures such as IQ and adaptive behavior composite(ABC) scores are often used to determine outcome. Common examples include tests of IQ (e.g., from the Stanford-Binet, the
* Corresponding author at: New England Center for Children, 33 Turnpike Road, Southborough, MA 01772, USA. Tel.: +1 508 658 7526.
E-mail address: [email protected] (R. MacDonald).
http://dx.doi.org/10.1016/j.ridd.2014.08.036
0891-4222/� 2014 Elsevier Ltd. All rights reserved.

R. MacDonald et al. / Research in Developmental Disabilities 35 (2014) 3632–3644 3633
Bayley, the Cattal, the WISC and WPPSI, the Merrill-Palmer) and measures of overall functioning (e.g., the Vineland Adaptive
Behavior Scale). Although these tests can identify improvements in functioning for CWA, changes in these scores areindicative of more global changes in functioning. Smaller-scale changes in the behavior of CWA, particularly changes insocial behavior, may be more difficult to detect using a test of overall functioning level. The current study provides animportant addition to the EIBI literature by using a measurement tool that examines changes in behavior on a micro-analyticscale, where response classes of behavior of most importance to the social functioning of CWA can be examined for changesover time. The focus of the current study is CWA who began EIBI services by the age of 3.
A small number of studies have examined or included a direct observation measure in their analysis of EIBI treatment.These measures are characterized by direct observation of specific, operationally defined behavior, with the data remainingin per-opportunity or percentage correct form versus being compiled or extrapolated into an overall score. These measuresare also not standardized to the TDC population. Smith, Buch, and Gamby (2000) used a direct observation tool titled theEarly Learning Measure (ELM) to measure skill acquisition for six CWA receiving home-based EIBI. The ELM includedfollowing directions, gross motor imitation, verbal imitation, and answering social questions. Researchers measured thenumber of correct responses and rate of skill acquisition through direct observation over the first five months of treatment.Vocal imitation skills on the ELM at intake were a predictor of best outcome. MacDonald et al. (2006) developed a directobservation tool called the ESAT to measure change in cognitive, as well as autism-specific behaviors in CWA receiving EIBI.This assessment is a variation on the ELM and incorporates adapted items from Seibert, Hogan, and Mundy’s (1982) EarlySocial Communication Scales (ESCS, used to measure JA). Direct measures such as this, which examine autism-specificbehavior change, may aid in painting a more complete picture of the types of change EIBI produces for this population.
Additional types of behavioral change, such as changes in interpersonal social skills, play behavior, or a reduction insocially stigmatizing behavior, may be harder to categorize with a test predominantly measuring changes in developmentalfunctioning (e.g., Dawson et al., 2010; MSEL, VABS). For this, pairing a repeated-measures analysis of operationally definedand observationally measured autism-specific deficits, such as eye contact, JA, imitation, and play, may be useful indetermining what type of behavior corresponds to a change in developmental functioning. The Autism Diagnostic Observation
Schedule (ADOS-2; Lord, Luyster, Gotham, & Guthrie, 2012; Lord, Rutter, et al., 2012) is currently the most widely usedassessment of social behavior for children with autism. The ADOS-2 is a semi structured assessment designed to assesscommunication and play skills, as well as repetitive behaviors. Examiners use a 3-point rating scale to evaluate overallperformance. These ratings are then applied to an algorithm which contributes to a diagnosis of autism spectrum disorder(ASD). The ESAT contributes to the overall profile of a child by providing a direct measure of a wide range of skills acrosssocial, cognitive, and play domains, resulting in a sensitive and objective assessment of treatment effects.
1.1. Potential autism-specific measures of performance
Behavioral deficits that categorize an autism diagnosis include deficits in social behavior (e.g., eye contact, JA), and playwhen compared to TDC and developmentally disabled populations (Adamson, Bakeman, Deckner, & Romski, 2009). Carefulexamination of these variables may benefit researchers in determining whether gains made by CWA reflect a reduction insymptom severity.
Deficits in JA are noted in CWA (Adamson et al., 2009; Carpenter, Pennington, & Rogers, 2002) and have been correlatedwith delays in language development (Mundy, Sigman, & Kasari, 1990). Mundy, Sigman, and Kasari (1994) discuss JA as theinitiation of a gaze shift or gesture on the part of the child to share an experience or object with an adult. JA can also refer tothe responding of a child to a bid (either a gaze shift or a gesture) for JA by the adult. MacDonald et al. (2006) used the ESAT toexamine responding to and initiating JA bids. When compared to TDC, CWA showed decreased levels of responding to jointattention (RJA), specifically following a point. CWA also showed substantial deficits in initiating joint attention (IJA;including initiating gaze shifts, gestures, and/or vocalizations) when compared with TDC.
Appropriate play is an important variable in the social development of CWA, but one that is rarely included in analyses ofEIBI (Wolery & Garfinkle, 2002). CWA often do not develop play skills beyond the repetitive manipulation of objects. Thisdeficit in functional toy manipulation prohibits them from engaging in more complex pretend play, alone or with otherchildren (Lifter, 2000; Rutherford, Young, Hepburn, & Rogers, 2007). A standard teaching target of EIBI for preschool-agedCWA is increasing the repertoire of play skills, both alone and with peers. Changes in play behavior have rarely been analyzedin relation to EIBI outcome, although increasing measurable play behavior is a socially valid outcome of treatment (Wolery &Garfinkle, 2002).
An important area of continued research is response to treatment for CWA younger than age 3. In comparison topreschool-aged CWA, studies examining the response of CWA under 3 to EIBI have been sparse (Ben Itzchak & Zachor, 2009,2011; Dawson et al., 2010). The limited research focusing exclusively on EIBI for children entering treatment before 3 years ofage has shown positive results similar to those seen for groups of children over 3 years. Examining the effects of EIBI on thisextremely young population is an important area for continued research.
When analyzing factors at intake that were correlated with functioning at follow-up, increased IQ and adaptive score atentry are the most common predictors of best outcome, as well as younger age at entry (Helt et al., 2008). Increasedperformance across imitation, social, and language skills at the onset of treatment, as measured by standardized tests todetermine age equivalence, were also found to be predictive of positive post-treatment outcome (e.g., Fewell & Glick, 1996;Liss et al., 2001). Higher language scores at follow-up have been linked to both higher RJA scores (Siller & Sigman, 2008) and

R. MacDonald et al. / Research in Developmental Disabilities 35 (2014) 3632–36443634
IJA scores at intake (Bono, Daley, & Sigman, 2004). Few studies have examined toy play or stereotypic behavior as anindicator of outcome (e.g., Toth, Munson, Meltzoff, & Dawson, 2006). Both of these behaviors are included in Lovaas’s (1987)checklist for estimated pathology, and the presence of stereotypic behavior was included in profile criteria for Sherer andSchreibman (2005), but examination of these variables individually as predictors of outcome for CWA has been very limitedin the EIBI literature.
The purpose of this research is to examine the utility of a direct observational assessment in measuring change over timefor CWA receiving EIBI treatment. This assessment focuses on measuring change in social behavior specific to an autismdiagnosis, notably JA, imitation, language, and play behavior, as well as cognitive skills and repetitive behaviors. Assessmentand outcome data are collected for 1-, 2-, and 3-year-olds diagnosed with autism, a group for who limited outcome researchhas been collected (Wise, Little, Holliman, Wise, & Wang, 2010). Comparisons were made between performance for CWA andtheir typically developing age-matched peers. Additionally, contributions were made to establishing an optimal learnerprofile, with the addition of these data for a large sample of CWA performance on common EIBI teaching targets.
2. Methods
2.1. Participants
Data were collected for 83 children diagnosed with an ASD and 58 TDC using the ESAT (MacDonald et al., 2006). CWAranged in age from 17 to 48 months at entry into the New England Center for Children (NECC) program and TDC ranged in agefrom 18 to 59 months at the time of testing (see Table 1 for sample characteristics by age). The CWA aged 17–36 months wereenrolled in a Home-based program that provided 20–30 h per week of early intensive behavioral intervention (EIBI) services,while CWA aged 36–48 months were enrolled in a Preschool program that provided 28–30 h per week of EIBI. Assessments ofCWA included both initial assessments upon entry into the EIBI program and follow-up assessments, after treatment (range,7–15 months). All CWA receiving EIBI services at NECC during the investigation period were included in this study, unlesstheir pre-post-tests were less than 7 months apart. All CWA received a diagnosis of an ASD using the DSM-IV criteria by aqualified independent psychologist from the community prior to entry into EIBI These children had no prior exposure to EIBIprogramming, and did not receive outside services during their enrollment in the study. The TDC were assessed once andtheir data were added to a normative data pool for age groups by year. The TDC were enrolled in an on-site day care,community daycare, or an on-site integrated preschool classroom. As part of the day care and preschool programs allchildren received a developmental evaluation two times a year. The children who participated in this study performedwithin the normal range for their ages.
2.2. Setting
2.2.1. Setting and materials
Assessments took place in a 3 m� 5 m room equipped with two child-sized tables, two child-sized chairs and one toyshelf with various toys on it. These toys were age appropriate and designed to promote play for children at a variety ofdevelopmental levels. All sessions were videotaped for later scoring, with the video camera in view of the child and mannedby a second experimenter. Materials present at various points throughout the assessment were books, laminated picturesplaced on the wall around the child, and toys, some of which were activated by the experimenter using a foot switch placedon the floor. During the play assessment, a variety toys, including a pretend play toy (e.g., a farm with animals), a cause-and-effect toy (e.g., a jack-in-the box), a simple play toy (e.g., an inset puzzle or a shape sorter), were presented on the floor.Available on the toy shelf were additional puzzles, books, cars, and simple cause-and-effect toys like a ball spinner or pop-uptoy.
2.3. EIBI treatment
All children with ASD were enrolled in an EIBI treatment program, based on the principles of behavior analysis (see Green,Brennan, & Fein, 2002, for a detailed description of similar EIBI services as those received by the participants). Instruction was
Table 1
Sample characteristics.
Age range (in months) Age in months
Mean/SD
N
CWA TDC CWA TDC
18–23 20.82 (2.25) 20.67 (1.89) 12 17
24–29 26.68 (1.73) 26.36 (1.82) 36 11
30–36 30.94 (1.30) 32.7 (1.35) 18 10
37–48 41.00 (3.79) 42.3 (3.27) 17 20
48–59 53.73 (3.65) 22

R. MacDonald et al. / Research in Developmental Disabilities 35 (2014) 3632–3644 3635
provided through discrete trial and naturalistic teaching in both individual and group settings (supported by a 1:1 therapist).The teaching procedures included systematic prompting and reinforcement along with best clinical practices for childrenwith autism as defined by Maurice, Green, and Luce (1996) which are consistent with the recommendations in the literatureresulting in best outcomes for children with autism (Howard et al., 2005; Lovaas, 1987). Individualized educational planswere developed for the children by a team of clinicians including a Board Certified Behavior Analyst (BCBA), a Speech andLanguage Pathologist, and an Occupational Therapist. Learning objectives were established across skill domains, includingtargets for functional language and other communication skills (e.g., receptive and expressive language, followinginstructions), discrimination skills (e.g., session behavior, attending, matching, higher order reading and math skills), socialskills (e.g., eye contact in response to name, greetings, waiting, imitation, joint attention, play skills, peer interaction), self-help skills (e.g., hand washing, dressing, safety skills), and occupational therapy (e.g., gross and fine motor skills, utensil andcup use). These skills are common teaching targets in an EIBI program, follow typical child development and arerecommended by several sources (e.g., Leaf & McEachin, 1999; Maurice et al., 1996). These skills also largely mirror those onthe NECC Core Skills Assessment, a sequence of basic skills considered critical for independence. The skills on the Core SkillsAssessment were socially validated as relevant skills for CWA to learn by a group of parents and educators of children withautism (Dickson et al., 2013).
Targeted skills were taught using the Autism Curriculum Encyclopedia�, a computer-based curriculum developed atNECC. Individual curricula prescribed the teaching procedures and daily data were used to evaluate learning. Commonprompting and reinforcement strategies as described in the behavioral literature were used to promote acquisition,generalization, and maintenance of skills, including the fading of physical, verbal, and visual prompts and the use of directand conditioned reinforcers determined through a variety of preference assessments. A generalization criterion of theperformance of skills across teachers and settings was included in acquisition, and incidental teaching was used to addressskill acquisition across the day. Data were reviewed weekly by supervisors and modifications were made in programming asneeded.
Each child received instruction from a team of 3–4 bachelor’s or master’s level professionals with 1–3 years of training inABA. These therapists were supervised daily by a master’s level BCBA (or the equivalent prior to 2003) who was supervisedweekly by a doctoral level BCBA-D. Speech and Language and Occupational Therapy services were delivered through aconsultative model. These specialty service providers trained therapists to provide instruction in communication and motorskills. Parents of children in the center-based preschool program participated in a 2-h per week home training session topromote generalization of skills to home. In addition, families met with their BCBA and therapist for 1 h per month to discussprogress on behavioral and academic programming and to discuss home concerns.
2.4. ESAT protocol
All participants were assessed using the ESAT as described in part in MacDonald et al. (2006). This direct observationalassessment measures performance on several core developmental skills using skill acquisition, eye contact, and JA subtests.Portions of the assessment battery related to RJA and IJA were modeled on the ESCS (Seibert, Hogan, & Mundy, 1982).Assessment items related to cognitive skills included imitation and expressive language similar to the ELM (Lovaas & Smith,1988).
Subtests consisted of four skill acquisition blocks (10 trials each), one 6-trial test of eye contact in response to name, threetests of joint attention initiation, three tests of responding to a point or gaze shift, and one 5-min free play sample. The orderof these tests is shown in Table 2. Three additional 3-min play breaks were offered throughout the assessment at scheduledtimes. With these breaks, the assessment took approximately 40 min to complete. At the start of each subtest, theexperimenter conducted a mini-preference assessment with three preferred food items or toys to determine a likelyreinforcer for responding. During acquisition skill trials, correct responding was reinforced on an FR-1 schedule. Correctresponding was defined as the child exhibiting the response independently and within 5 s of the cue. If the child responded
Table 2
Subtests of the ESAT.
Subtest order Type of subtest
IJA RJA Social Cognitive
1 Toy activation
2 Book
3 Eye contact
4 Free play
5 Motor imitation
6 Respond to gaze shift
7 Vocal imitation
8 Toy activation
9 Answering social questions
10 Respond to point
11 Following directions

R. MacDonald et al. / Research in Developmental Disabilities 35 (2014) 3632–36443636
incorrectly, appropriate session behavior (i.e. bottom in chair, oriented toward examiner) was reinforced on an FR-2schedule. During JA probes, a preferred item was offered at the end of the probe independent of performance.
2.4.1. Joint attention initiation
Joint attention initiation was assessed across three subtests. The child was given the opportunity to initiate joint attentionwith the experimenter in response to two activation toys and a book. In subtest 1, a mechanical toy that made noise waspresented on a table approximately 3 feet in front of the child but out of reach. The toy was activated by a foot switch for 15 s.Joint attention responses were recorded during the 15 s of activation and the 5 s following. During initiating joint attentionsubtests, the experimenter oriented her gaze toward the child and maintained a neutral expression. If the child initiated anyjoint attention behavior, the adult looked at the toy or picture, smiled, looked back at the child, and briefly commented (‘‘Ohyeah, look at that elephant!’’). In subtest 2, the child was presented with a children’s book opened to a page with animals. Theexperimenter presented the question, ‘‘What do you see?’’ and joint attention responses occurring in the 20 s following thiscue were recorded. Subtest 8 was identical to subtest 1; however, a different mechanical toy was presented on the floor nextto the child and activated for 15 s. The behaviors measured during these subtests were eye gaze shifting from the toy to theexaminer, gesturing and commenting (see MacDonald et al., 2006).
2.4.2. Responding to joint attention
Three joint attention subtests targeted RJA bids from an adult. In the first of these JA subtests, the experimenter pointed topictures in a simple book (one picture per page, six pages total). Responses were scored for following a point with their eyesto each picture within 5 s of the point cue. In the second joint attention responding subtest, six stimuli were placed aroundthe room: a toy on the floor near the child, a toy on a shelf near the child, a picture placed on the wall next to the child, apicture placed on the wall behind the child, and an item was suspended from the ceiling above the child. The secondexperimenter in the room (sitting behind the video camera) served as the sixth stimulus. The experimenter established eyecontact with the child, said ‘‘look,’’ and shifted her eye gaze toward one of the stimuli. The trial was scored as correct if thechild followed the eye gaze shift to each stimulus within 5 s of the cue. In the third joint attention subtest the six stimuli wereplaced in the same position as in the second joint attention subtest. The experimenter established eye contact with the child,said ‘‘look,’’ pointed and shifted her eye gaze toward one of the stimuli. The trial was scored as correct if the child followedthe point and gaze shift to each stimulus with his or her eyes within 5 s of the point cue.
2.4.3. Social
Social behavior was measured by assessing eye contact and levels of play. In the eye contact subtest, six trials ofresponding to name with eye contact were presented. In three trials, the experimenter called the child’s name, and in threetrials, the experimenter stated ‘‘(Child’s name), look at me.’’ Two common methods of gaining eye contact were presented inorder to maximize the child’s opportunities to respond correctly. The trial was scored as correct if the child oriented his or hereyes to the experimenter within 5 s for a duration of 2 s.
A 5-min free play session followed the eye contact subtest. During the free-play sample, several toys were presented onthe floor and the child was given free access to play or interact with them. This test was designed to measure a child’s solitaryplay, without any interaction from the experimenter. Experimenter interaction was held to a minimal and standardized levelacross participants in order to limit accidental prompting of play by experimenters. Developmentally-appropriate toysdesigned to promote play of varying complexity were presented, including a pretend play toy (e.g., a farm with figurines), acause and effect toy (e.g. a race track with cars), and structured play materials (e.g., a shape sorter and puzzles). A shelf withadditional toys such as small cars, puzzles, and simple board books was present next to the play area as well. To begin theplay session, the experimenter initially gave the cue, ‘‘We’re all done, you can go play.’’ If the child did not independently goto the play area, the experimenter led the child to the play area and sat him or her down in front of the toys. The child wasneither encouraged nor discouraged from playing with toys on the floor or on the shelf. If the child attempted to interact withthe experimenter, the experimenter acknowledged the child’s presence or request (i.e., ‘‘You can have more chips in aminute, right now it’s time to play’’) and led them back to the play space if necessary. During the play sample, the secondexperimenter filmed the session from a short distance away, focusing on keeping the child’s face and hands within frame forlater scoring of play and stereotypy.
2.4.4. Cognitive
The four cognitive subtests included motor imitation, answering social questions, vocal imitation, and followingdirections. Children were given 10 response opportunities within each subtest. All subtest questions were standardizedacross participants. In the first of these subtests, children were asked to imitate the experimenter when given the direction‘‘do this’’ and the actions of clapping hands, standing up, and touching the table, among others. The second skill assessedanswering social questions. The experimenter presented questions such as ‘‘What’s your name?,’’ ‘‘How old are you?,’’ and‘‘What’s your favorite TV show?’’ The third subtest measured vocal imitation, in which the experimenter presented soundsand words for vocal imitation with the instruction ‘‘Say. . .’’ such as ‘‘Say buh,’’ ‘‘Say dog,’’ and ‘‘Say bicycle.’’ The final cognitivesubtest assessed following 1-step instructions. The experimenter presented instructions including ‘‘stomp feet,’’ ‘‘jump,’’ and‘‘arms up.’’
R. MacDonald et al. / Research in Developmental Disabilities 35 (2014) 3632–3644 3637
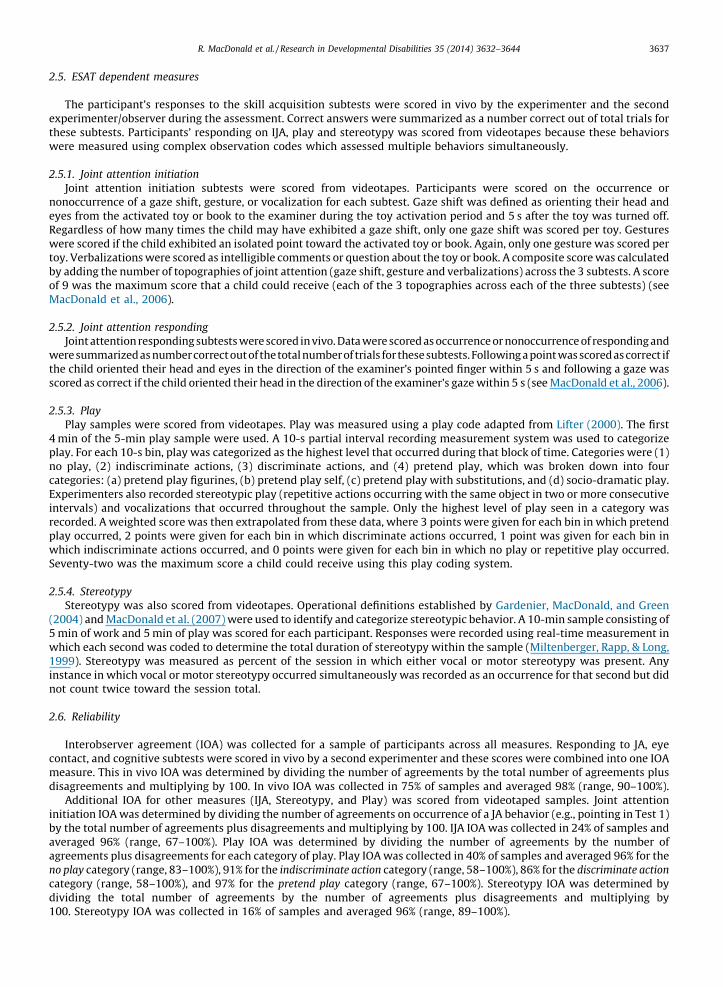
2.5. ESAT dependent measures
The participant’s responses to the skill acquisition subtests were scored in vivo by the experimenter and the secondexperimenter/observer during the assessment. Correct answers were summarized as a number correct out of total trials forthese subtests. Participants’ responding on IJA, play and stereotypy was scored from videotapes because these behaviorswere measured using complex observation codes which assessed multiple behaviors simultaneously.
2.5.1. Joint attention initiation
Joint attention initiation subtests were scored from videotapes. Participants were scored on the occurrence ornonoccurrence of a gaze shift, gesture, or vocalization for each subtest. Gaze shift was defined as orienting their head andeyes from the activated toy or book to the examiner during the toy activation period and 5 s after the toy was turned off.Regardless of how many times the child may have exhibited a gaze shift, only one gaze shift was scored per toy. Gestureswere scored if the child exhibited an isolated point toward the activated toy or book. Again, only one gesture was scored pertoy. Verbalizations were scored as intelligible comments or question about the toy or book. A composite score was calculatedby adding the number of topographies of joint attention (gaze shift, gesture and verbalizations) across the 3 subtests. A scoreof 9 was the maximum score that a child could receive (each of the 3 topographies across each of the three subtests) (seeMacDonald et al., 2006).
2.5.2. Joint attention responding
Joint attention responding subtests were scored in vivo. Data were scored as occurrence or nonoccurrence of responding andwere summarizedas numbercorrectoutof thetotalnumberof trials forthese subtests.Following a point was scoredas correct ifthe child oriented their head and eyes in the direction of the examiner’s pointed finger within 5 s and following a gaze wasscored as correct if the child oriented their head in the direction of the examiner’s gaze within 5 s (see MacDonald et al., 2006).
2.5.3. Play
Play samples were scored from videotapes. Play was measured using a play code adapted from Lifter (2000). The first4 min of the 5-min play sample were used. A 10-s partial interval recording measurement system was used to categorizeplay. For each 10-s bin, play was categorized as the highest level that occurred during that block of time. Categories were (1)no play, (2) indiscriminate actions, (3) discriminate actions, and (4) pretend play, which was broken down into fourcategories: (a) pretend play figurines, (b) pretend play self, (c) pretend play with substitutions, and (d) socio-dramatic play.Experimenters also recorded stereotypic play (repetitive actions occurring with the same object in two or more consecutiveintervals) and vocalizations that occurred throughout the sample. Only the highest level of play seen in a category wasrecorded. A weighted score was then extrapolated from these data, where 3 points were given for each bin in which pretendplay occurred, 2 points were given for each bin in which discriminate actions occurred, 1 point was given for each bin inwhich indiscriminate actions occurred, and 0 points were given for each bin in which no play or repetitive play occurred.Seventy-two was the maximum score a child could receive using this play coding system.
2.5.4. Stereotypy
Stereotypy was also scored from videotapes. Operational definitions established by Gardenier, MacDonald, and Green(2004) and MacDonald et al. (2007) were used to identify and categorize stereotypic behavior. A 10-min sample consisting of5 min of work and 5 min of play was scored for each participant. Responses were recorded using real-time measurement inwhich each second was coded to determine the total duration of stereotypy within the sample (Miltenberger, Rapp, & Long,1999). Stereotypy was measured as percent of the session in which either vocal or motor stereotypy was present. Anyinstance in which vocal or motor stereotypy occurred simultaneously was recorded as an occurrence for that second but didnot count twice toward the session total.
2.6. Reliability
Interobserver agreement (IOA) was collected for a sample of participants across all measures. Responding to JA, eyecontact, and cognitive subtests were scored in vivo by a second experimenter and these scores were combined into one IOAmeasure. This in vivo IOA was determined by dividing the number of agreements by the total number of agreements plusdisagreements and multiplying by 100. In vivo IOA was collected in 75% of samples and averaged 98% (range, 90–100%).
Additional IOA for other measures (IJA, Stereotypy, and Play) was scored from videotaped samples. Joint attentioninitiation IOA was determined by dividing the number of agreements on occurrence of a JA behavior (e.g., pointing in Test 1)by the total number of agreements plus disagreements and multiplying by 100. IJA IOA was collected in 24% of samples andaveraged 96% (range, 67–100%). Play IOA was determined by dividing the number of agreements by the number ofagreements plus disagreements for each category of play. Play IOA was collected in 40% of samples and averaged 96% for theno play category (range, 83–100%), 91% for the indiscriminate action category (range, 58–100%), 86% for the discriminate action
category (range, 58–100%), and 97% for the pretend play category (range, 67–100%). Stereotypy IOA was determined bydividing the total number of agreements by the number of agreements plus disagreements and multiplying by100. Stereotypy IOA was collected in 16% of samples and averaged 96% (range, 89–100%).

R. MacDonald et al. / Research in Developmental Disabilities 35 (2014) 3632–36443638
Procedural integrity of the experimenters running the ESAT was also collected in 1–2 samples for each of theexperimenters. To determine procedural integrity, each experimenter action (e.g., establishing child’s attending, deliveringdiscriminative stimulus, reinforcing on the appropriate schedule) was outlined for the entire ESAT. When watching the ESATsession from videotape, each experimenter action was scored as ‘‘+’’ if the experimenter completed the action correctly or‘‘�’’ if the action was omitted or performed incorrectly. A procedural integrity score was then determined by dividing thenumber of correct actions by the total number of actions and multiplying by 100. The mean procedural integrity score was97.0% (range, 95–100%).
3. Results
Table 3 displays statistics for each outcome measure (RJA Point, RJA Gaze, IJA, Cognitive, Play and Stereotypy) for all CWA.Mean scores and standard deviations at entry and follow-up were calculated separately for each age group. Percent changewas calculated for each outcome measure by dividing the difference between entry and follow-up means by the entry mean.The data indicate that children in the 18–23 month age group showed the greatest percent change across all outcomemeasures. Repeated measures t-tests were used to determine if scores on the outcome measures changed significantly fromentry to follow-up. Among 18–23 month-olds, results indicated that scores on all outcomes except stereotypy improvedsignificantly from entry to follow-up. Among 24–29-month-olds, scores significantly improved on all outcomes except playand stereotypy. For 30–36-month-olds, scores improved on RJA Point, Eye Contact, and Cognitive Performance. Among 37–48-month-olds, scores significantly improved for RJA Point, IJA, Eye Contact, and Cognitive Performance. Table 4 displaysmean scores and standard deviations for the typically developing children on each outcome measure by age group. Thesedata serve as a normative reference for each outcome measure across the four targeted age groups. The TDC data showedconsistently higher performance (P< .01) on all measures except RJA Point when compared to the performance of CWA atentry.
3.1. Age and treatment effect
A mixed-design 2 (Time)� 4 (Age at Entry) ANOVA was performed to determine if there were age differences in the effectof treatment on each of the outcome measures, as shown in Table 5. The effect of time between assessment 1 and assessment2 was controlled to account for the minor differences in elapsed time between assessments. An Alpha level of .01 was used toaccount for the number of statistical tests that were run. For RJA Point, IJA, Cognitive, and Play, the significant main effects oftime and/or age were qualified by a significant time by age interaction. Follow-up tests indicated that for RJA Point, IJA, andPlay, 18–23-month-olds improved more than all other age groups and that there were no differences between the other agegroups. For Cognitive, 18–23-month-olds improved more than all other age groups, and 24–30-month-olds improved morethan the 2.5–3-year-olds. For RJA Gaze, only the main effect of time was significant, indicating that scores improved fromtime 1 to time 2 regardless of age.
3.2. Level of change
To evaluate the overall level of change from entry to follow up, cognitive, eye contact and IJA scores were combined foreach age group. These measures were selected because they have been identified as predictors of outcome for CWA (Heltet al., 2008). Fig. 1 shows boxplots of overall score at entry and follow up for each age group. Five values are shown for eachage group, at entry (gray plots) and at exit (black plots) from EIBI programming. The 25th percentile, median, and the 75thpercentile, are shown as the horizontal lines of the boxes, the minimum and maximum are shown by the horizontal lines ofthe whiskers. Children 18–23 months old entered treatment with a mean of 10 and increased to a mean of 38 at follow up(average 13.8 months later). Children ages 24–29 months old entered treatment with a mean of 13 and increased to 31 atfollow up (average 9.72 months later), with children ages 30–36 month old group showing similar results. Children in the37–48-month-old group entered with a mean of 23 and increased to 33 at follow up (average 12.9 months later). While allgroups improved, 1-year-olds showed the most dramatic change between entry and follow up.
3.3. High responders vs. low responders
To compare CWA performance to those of typically developing peers, cognitive, eye contact and IJA scores were combinedand standard deviations (SD) were calculated for each age group. Follow-up scores were compared to TDC means for theCWA’s current age, meaning a CWA who was 1 when he entered would be compared at follow-up (1 year later) not to 1-year-old TDC, but to 2-year-old TDC. CWA performance was categorized based on these normative data. High responders werewithin 1 SD from their peers, middle responders were between 1 and 2 SD below the normative mean, and low responderswere greater than 2 SD below the normative mean. Table 5 summarizes high, middle and low scores by age group.
Using this analysis, the percent of participants who responded to treatment, which included performing within 2 SD oftypical mean scores, was calculated for each age group (see Table 6). One-sample binomial tests were conducted todetermine if the likelihood of responding within each age group was different than chance (i.e., 50%). Results indicated that18–23-month-olds and 24–29-month-olds were significantly more likely than chance to respond to treatment. Participants
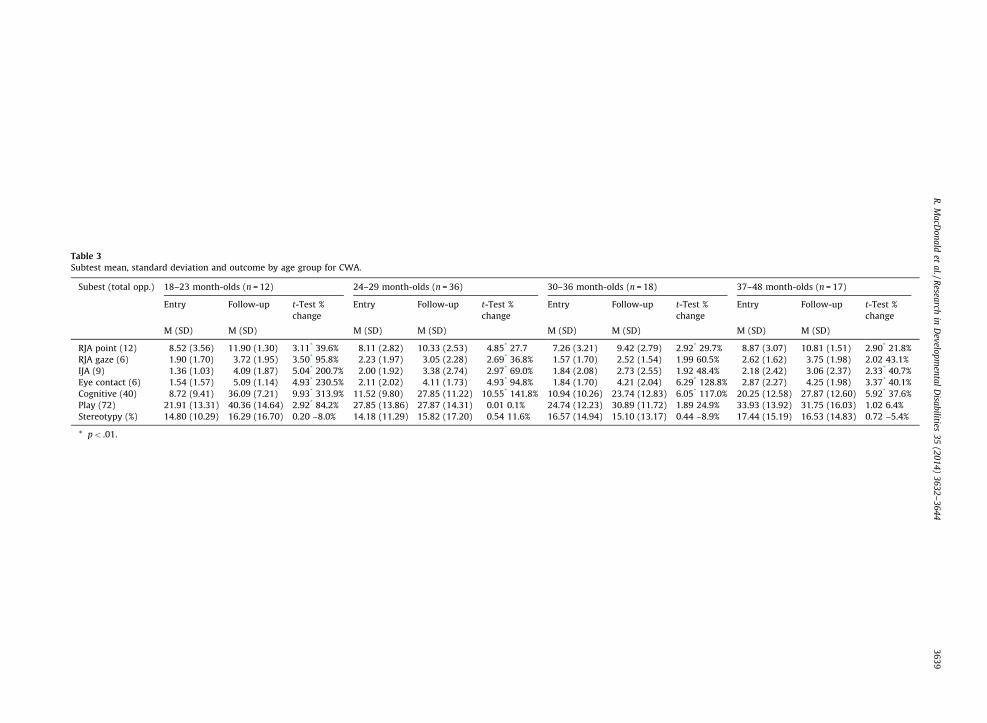
Table 3
Subtest mean, standard deviation and outcome by age group for CWA.
Subest (total opp.) 18–23 month-olds (n = 12) 24–29 month-olds (n = 36) 30–36 month-olds (n = 18) 37–48 month-olds (n = 17)
Entry Follow-up t-Test %
change
Entry Follow-up t-Test %
change
Entry Follow-up t-Test %
change
Entry Follow-up t-Test %
change
M (SD) M (SD) M (SD) M (SD) M (SD) M (SD) M (SD) M (SD)
RJA point (12) 8.52 (3.56) 11.90 (1.30) 3.11* 39.6% 8.11 (2.82) 10.33 (2.53) 4.85* 27.7 7.26 (3.21) 9.42 (2.79) 2.92* 29.7% 8.87 (3.07) 10.81 (1.51) 2.90* 21.8%
RJA gaze (6) 1.90 (1.70) 3.72 (1.95) 3.50* 95.8% 2.23 (1.97) 3.05 (2.28) 2.69* 36.8% 1.57 (1.70) 2.52 (1.54) 1.99 60.5% 2.62 (1.62) 3.75 (1.98) 2.02 43.1%
IJA (9) 1.36 (1.03) 4.09 (1.87) 5.04* 200.7% 2.00 (1.92) 3.38 (2.74) 2.97* 69.0% 1.84 (2.08) 2.73 (2.55) 1.92 48.4% 2.18 (2.42) 3.06 (2.37) 2.33* 40.7%
Eye contact (6) 1.54 (1.57) 5.09 (1.14) 4.93* 230.5% 2.11 (2.02) 4.11 (1.73) 4.93* 94.8% 1.84 (1.70) 4.21 (2.04) 6.29* 128.8% 2.87 (2.27) 4.25 (1.98) 3.37* 40.1%
Cognitive (40) 8.72 (9.41) 36.09 (7.21) 9.93* 313.9% 11.52 (9.80) 27.85 (11.22) 10.55* 141.8% 10.94 (10.26) 23.74 (12.83) 6.05* 117.0% 20.25 (12.58) 27.87 (12.60) 5.92* 37.6%
Play (72) 21.91 (13.31) 40.36 (14.64) 2.92* 84.2% 27.85 (13.86) 27.87 (14.31) 0.01 0.1% 24.74 (12.23) 30.89 (11.72) 1.89 24.9% 33.93 (13.92) 31.75 (16.03) 1.02 6.4%
Stereotypy (%) 14.80 (10.29) 16.29 (16.70) 0.20 –8.0% 14.18 (11.29) 15.82 (17.20) 0.54 11.6% 16.57 (14.94) 15.10 (13.17) 0.44 –8.9% 17.44 (15.19) 16.53 (14.83) 0.72 –5.4%
* p< .01.
R.
Ma
cDo
na
ldet
al./R
esearch
inD
evelo
pm
enta
lD
isab
ilities3
5(2
01
4)
36
32
–3
64
43
63
9

Table 4
Performance for TDC by age and outcome measure.
Subtest 18–23 month-olds (n = 17) 24–29 month-olds (n = 11) 30–36 month-olds (n = 10) 37–48 month-olds (n = 20)
Mean (SD) Mean (SD) Mean (SD) Mean (SD)
RJA point 9.93 (1.88) 11.82 (0.39) 11.90 (0.30) 11.70 (0.56)
RJA gaze 4.27 (1.44) 5.09 (0.90) 4.80 (1.17) 5.70 (0.56)
IJA 3.87 (1.89) 4.45 (1.30) 4.10 (1.87) 5.85 (1.93)
Eye contact 3.00 (2.61) 4.45 (1.83) 3.80 (1.87) 5.45 (0.97)
Cognitive 15.33 (7.60) 23.37 (6.97) 27.70 (7.67) 35.35 (2.69)
Play 34.40 (7.60) 40.18 (9.41) 36.5 (10.18) 44.95 (10.26)
Stereotypy 6.16 (4.34) 7.00 (4.11) 6.00 (5.71) 8.00 (5.39)
Table 5
Statistical comparisons across outcome measures and age groups.
RJA point RJA gaze IJA Cognitive Play
Main effect (time) F(1, 91) = 15.14, p< .01 F(1, 91) = 25.14, p< .01 F(1, 91) = 4.06, p< .01 F(1, 91) = 24.57, p< .01 F(1, 91) = 7.92,p< .01
Main effect (age) F(1, 91) = 23.12, p< .01 F(3, 91) = 3.66, p> .01 F(3, 91) = 8.50, p< .01 F(3, 91) = 1.66, p> .01 F(3, 91) = 4.36, p> .01
Interaction F(1, 91) = 12.14, p< .01 F(3, 91) = 2.54, p> .01 F(3, 91) = 7.50, p< .01 F(3,91) = 12.87, p< .01 F(3, 91) = 14.36, p< .01
Post hoc tests 18–23-month-olds
improved more than all
other age groups; no
differences between
other age groups
N/A (Scores increased
from Time 1 to Time 2)
18–23-month-olds
improved more than all
other age groups;
no differences between
other age groups
18–23-month-olds
improved more than all
other age groups,
24–30-month-olds
group improved more
than 2.5 and
3-year-olds
18–23-month-olds
improved more than all
other age groups; no
differences between
other age groups
R. MacDonald et al. / Research in Developmental Disabilities 35 (2014) 3632–36443640
between 30 and 36 months old were not more likely than chance to respond to treatment. Finally, 36–48-month-olds weresignificantly more likely than chance to be categorized as non-responders (Table 7).
For the 1-year-olds at entry, the TDC SD was very large, and inclusion in the High category was therefore easier to achievethan for older groups. As TDC age increased, the SD became much smaller, such that inclusion in the Middle or Highcategories for CWA entering at age 3 or older required a score of 29 or greater (72% correct). This may have masked increasesin score that did occur for CWA who, despite increases in Cognitive score over time, remained in the Low categorization. Thisbeing said, all the 1-year olds except one performed at or above the TDC mean upon exit.
When arranged by High/Medium and Low categorization at follow-up and collapsed across age groups as shown inTable 8, factors that point toward inclusion in the High/Medium categorization at follow-up were increased IJA and cognitivescores at entry and lower levels of stereotypic behavior at entry. However, these factors were not statistically significant aspredictive variables.
4. Discussion
This research provides a comprehensive look at CWA performance on an observational measure from pre-test to post-testfollowing EIBI intervention. Results from the ESAT show an increase in mean score for all CWA age groups (1-, 2-, 2.5-, and 3-year-olds at entry) on measures of JA, eye contact, and a cognitive battery testing imitation and language skills. Decreases instereotypy and increases in play were also seen for most groups. A statistical analysis revealed that children who begantreatment between 18 and 23 months of age improved significantly more than the other three groups. In addition, somechanges were seen for participants who demonstrated little to no independent responding at entry to the program, allowingeven small-scale changes in performance to be measured over time.
4.1. Joint attention
The JA tests included in the ESAT have been used to measure changes in JA behavior in other published research (Isaksen &Holth, 2009; MacDonald et al., 2006). The current findings add to the existing literature on this portion of the ESAT as ameasure of JA sensitive enough to detect changes over time in CWA performance as well as gradated performance by age forTDC, with older TDC scoring higher than younger TDC. Examination of performance on these skills for CWA is critical to amore complete understanding of behavioral changes that may relate to a CWA’s prognosis over time. Because a lack of JA andsocial behavior such as eye contact in response to name are deficits specifically linked to autism, increases in these skillsshould reflect a decrease in symptom severity.

[(Fig._1)TD$FIG]
Fig. 1. Boxplots of overall combined scores including cognitive and JA at entry and a follow up for each age group.
R. MacDonald et al. / Research in Developmental Disabilities 35 (2014) 3632–3644 3641
4.2. Cognitive measures
This cognitive skill measure parallels common testing areas on traditional IQ testing. It also provides a record of CWAperformance on behavior that is classified as predictive of outcome in the research literature, including imitation (e.g., Lovaas& Smith, 1988), vocal imitation (e.g., Sallows & Graupner, 2005), and language (e.g., Eldevik, Eikeseth, Jahr, & Smith, 2006).These findings confirmed previous research that CWA receiving EIBI make gains on these commonly tested skills, andadditionally identified that those changes are captured using this type of micro-analytic measurement. Although thesecognitive skills were common teaching targets in the EIBI curriculum, exact correspondence between on-the-floor curriculaand ESAT questions was not programmed for.
4.3. Play
Changes in play scores for CWA were the least robust of all measures. While some age groups saw mean increases in playscore, (1- and 2.5-year-olds), the remaining groups saw no change in mean play score or decreases in the mean over time.This finding may be due to several factors. First, the play opportunity presented in the ESAT is a solitary play opportunity,meaning the experimenter did not participate with the child in any way during the play sample other than to initially bringhim to the toys and, if necessary, redirect him away from dangerous behavior such as attempting to climb on the table. Thechild was not prompted to play with the toys beyond an initial prompt of ‘‘It’s time to play’’ and the adult did not play withtoys in an effort to entice the child’s participation. This preparation did not impede TDC from playing appropriately, otherthan two instances of reactivity in 2.5-year-olds. For CWA, however, this arrangement may not have provided enoughprompting or direction for the CWA to remain engaged with the toys for 5 min. Difficulties in producing generative orspontaneous pretend play in CWA are well documented (Jarrold, Boucher, & Smith, 1993; Luckett, Bundy, & Roberts, 2007),and when changes in play have occurred for CWA it has been under more controlled and adult-mediated conditions (e.g.,Ingersoll & Schreibman, 2006) or with only marginal success (Wong & Kwan, 2010). For CWA, moving from trained,prompted play sequences to unprompted, generative sequences of pretend play appears to be the most challenging aspect ofincreasing play behavior (Charman & Baron-Cohen, 1997).
4.4. Stereotypy
Results of changes in stereotypy scores in the ESAT probe are variable. Depending on the level and success of stereotypyredirection procedures during the student’s typical classroom day, decreases in stereotypy during ESAT probes could beviewed as successful generalization of classroom findings to a probe setting. Alternatively, increases in stereotypy during theESAT probes could result from the lack of teacher proximity as a discriminative stimulus for the availability of non-redirectedstereotypy.
Although pre- and post-tests for the ESAT clearly demonstrate change in the testing areas, it is also important todetermine if these changes are discernible on other measures. Inclusion of a standardized measure would help to ensureresults seen on the ESAT are reflective of changes in overall functioning or autism symptom severity. Another limitation ofthe current data set is the lack of a comparison group receiving limited or eclectic treatment. The inclusion of this comparisonwould strengthen these findings by providing the opportunity to demonstrate that changes in performance for the EIBI group
Table 6
TDC score ranges used to evaluate high, middle and low responders.
Age group Mean/SD High Middle Low
18–23 months 23.1 (10.9) 12+ 2–11 1 and below
24–29 months 32.36 (7.6) 25+ 17–24 16 and below
30–36 months 35.6 (8.48) 27+ 18–26 17 and below
37–47 months 46.6 (3.8) 43+ 40–42 39 and below

Table 7
Statistical summary of responsiveness to treatment across age groups.
Age (months) N Months between
assessments
% Responders
(high and middle)
% Non-responders (low) Significance
of one-sample binomial test
18–23 12 13.08 91 8 0.02
24–29 36 9.72 71 29 0.043
30–36 18 9.80 34 66 0.064
36–48 17 12.90 30 70 0.004
Note: Overall chi-square test examining if there was an overall difference in the likelihood of responding among the age groups was also significant
x2 = 25.12, p< .001.
Table 8
Mean entry and exit scores for high/medium and low categorizations at exit, collapsed across age groups.
High/medium at exit Low at exit
Entry Exit Entry Exit
Months at entry 29.71 32.92
Months between assessments 10.88 11.84
RJA point 7.99 10.36 6.73 9.08
RJA gaze 2.07 3.13 1.91 2.23
IJA 1.89 3.24 0.97 2.19
Eye contact 2.13 4.38 1.72 3.82
Cognitive 12.73 28.02 9.51 19.51
Play 28.05 31.52 26.87 26.65
Stereotypy 18.10% 16.44% 21.70% 21.21%
R. MacDonald et al. / Research in Developmental Disabilities 35 (2014) 3632–36443642
,
could be attributed to the treatment, rather than maturation over time. Additionally, although a TDC sample has beencollected and presented as a point of comparison to typical performance, this sample is not standardized and may be toosmall in size to account for typical variance in TDC performance, particularly for TDC under 3 where greater variance inscores was seen.
Although the scope and size of this study are broad, measuring change for CWA on a micro-analytic scale maycomplement traditional measures in fully capturing changes resulting from EIBI treatment. Increases in score were seen forall age groups of CWA on important developmental and social measures that are commonly included in an EIBI treatmentpackage. Many of the skills tested using the ESAT are learning deficits characteristic of and specific to autism. Changes inthese scores for CWA receiving EIBI should therefore be socially relevant for decreasing symptom severity and increasingindependent functioning for individuals in this population (Grindle et al., 2009; Matson & Wilkins, 2007).
The largest gains in all areas tested were made by the youngest participants (those starting EIBI before age 3). Inparticular, CWA entering EIBI at age 1 showed striking gains, often bringing them into (or surpassing) the performance rangeof their typically developing peers. Some children from this very early cohort were able to return to a typical educationalsetting with no additional support. Large gains were seen for this group in length and complexity of play, and consistentdecreases were seen in stereotypic behavior. These two areas, a deficit in appropriate play and an excess of stereotypicbehavior, are socially stigmatizing and often prohibitive of a CWA fully participating in an inclusive setting. Seeing thesechanges in 1-year-olds at entry is very encouraging and points to the importance of CWA receiving EIBI at the earliest agepossible.
The fact that the 1-year-olds showed the greatest changes in performance suggests that better outcomes are achievedwhen children with autism enter treatment at a younger age. This phenomenon is substantiated by only a few studies in theliterature. Ben Itzchak and Zachor (2009) followed a group of CWAs aged 18–35 months for one year during treatment andfound that 22% moved to a less severe diagnostic classification with 2% moving off the autism spectrum. Ben Itzchak andZachor (2011) found that one of the predictive factors of greater cognitive gains was younger age at entry. Dawson et al.(2010) completed a randomized controlled trial in which children with autism ages 18–30 months at entry and found thatchildren receiving EIBI showed statistically significant improvement over the control group at a 1-year follow up. Oneexplanation for this responsiveness in the youngest children with ASD is that EIBI may mitigate the effects of environmentalrisk factors on brain development (Dawson, 2008). Infants at risk for ASD spend less time engaging socially with adults.Evidence suggests that environmental enrichment can play a critical role in shaping the brain. While human models for thesechanges in brain development are in their infancy, research has shown that environmental discrimination learning canchange the brain structures in animals (Loupe, Schroeder, & Tessel, 1995). Dawson suggests that future research should focuson demonstrating the relationship between EIBI and brain development by incorporating brain-based measures to evaluateoutcome in young children with autism. Until that time, the data clearly indicate that earlier the intervention is started thebetter the likelihood of long lasting gains in children with ASD.
Although guidance has been put forward citing ABA as the empirically recommended treatment for CWA aged 0–3 (NewYork State Department of Health, EI Program, 1999), participation in an intensive, 28-h-per-week ABA-based program is notthe norm for this age group, and it may be difficult for parents seeking intensive ABA services to find them (Stahmer, Collings,

R. MacDonald et al. / Research in Developmental Disabilities 35 (2014) 3632–3644 3643
& Palinkas, 2005). Information on CWA response to EIBI treatment and comparisons across treatment types are still verylimited for this age group (Corsello, 2005). Findings such as these in the current study, demonstrating substantial gains andpositive outcome for very young children in Early Intervention using EIBI, could help to improve the availability of EIBIservices, acceptance of these services by EI providers and parents, and improved training for ABA providers in the nuances ofusing ABA with a younger population (Eikeseth, 2010).
Acknowledgments
We would like to thank the Organization for Autism Research who funded a portion of this research during their 2010 and2012 grant competitions. The title of the awarded grant was ‘‘Using a Direct Observation Assessment Battery to AssessOutcome of Early Intensive Behavioral Intervention for Children with Autism.’’ We would also like to thank the manycontributors to the development of the Early Skills Assessment Tool, including, Dr. William Holcomb, Amy Geckeler, Dr. GinaGreen, Dr. Amanda Karsten, Renee Mansfield, and Nicole Gardenier. We would like to thank Dr. Brian Ayotte and Dr. ChataDickson for their assistance with the statistical analysis. In addition, we would like to thank the many interns and graduatestudents who scored assessment samples.
References
Adamson, L. B., Bakeman, R., Deckner, D. F., & Romski, M. (2009). Joint engagement and the emergence of language in children with autism and Down syndrome.Journal of Autism and Developmental Disorders, 39(1), 84–96.
Ben Itzchak, E., & Zachor, D. A. (2009). Change in autism classification with early intervention: Predictors and outcomes. Research in Autism Spectrum Disorders,3(4), 967–976.
Ben Itzchak, E., & Zachor, D. A. (2011). Who benefits from early intervention in autism spectrum disorders? Research in Autism Spectrum Disorders, 5(1), 345–350.Bono, M. A., Daley, T., & Sigman, M. (2004). Relations among joint attention, amount of intervention and language gain in autism. Journal of Autism and
Developmental Disorders, 34(5), 495–505.Carpenter, M., Pennington, B. E., & Rogers, S. J. (2002). Interrelations among social-cognitive skills in young children with autism. Journal of Autism and
Developmental Disorders, 32(2), 91–106.Charman, T., & Baron-Cohen, S. (1997). Brief report: Prompted pretend play in autism. Journal of Autism and Developmental Disorders, 27(3), 325–332.Corsello, C. M. (2005). Early intervention in autism. Infants & Young Children, 18(2), 74–85.Dawson, G. (2008). Early behavioral intervention, brain plasticity, and the prevention of autism spectrum disorder. Development and Psychopathology, 20,
775–803.Dawson, G., Rogers, S., Munson, J., Smith, M., Winter, J., Greenson, J., et al. (2010). Randomized, controlled trial of an intervention for toddlers with autism: The
early start Denver model. Pediatrics, 125(1), e17–e23.Dickson, C. A., MacDonald, R. P. F., Mansfield, R., Guilhardi, P., Johnson, C., & Ahearn, W. H. (2013). Social validation of the New England Center for Children–Core
Skills Assessment. Journal of Autism and Developmental Disorders, 44, 65–74.Eikeseth, S. (2010). Examination of qualifications required of an EIBI professional. European Journal of Behavior Analysis, 11, 239–246.Eldevik, S., Eikeseth, S., Jahr, E., & Smith, T. (2006). Effects of low-intensity behavioral treatment for children with autism and mental retardation. Journal of Autism
and Developmental Disorders, 36(2), 211–224.Eldevik, S., Hastings, R. P., Jahr, E., & Hughes, J. C. (2012). Outcomes of behavioral intervention for children with autism in mainstream pre-school settings. Journal
of Autism and Developmental Disorders, 42(2), 210–220.Fewell, R. R., & Glick, M. P. (1996). Program evaluation findings of an intensive early intervention program. American Journal on Mental Retardation, 101(3),
233–243.Gardenier, N. C., MacDonald, R., & Green, G. (2004). Comparison of direct observational methods for measuring stereotypic behavior in children with autism
spectrum disorders. Research in Developmental Disabilities, 25(2), 99–118.Green, G., Brennan, L. C., & Fein, D. (2002). Intensive behavioral treatment for a toddler at high risk for autism. Behavior Modification, 26(1), 69–102.Grindle, C. F., Hastings, R. P., Saville, M., Carl Hughes, J., Kovshoff, H., & Huxley, K. (2009). Integrating evidence-based behavioural teaching methods into education
for children with autism. Educational and Child Psychology, 26(4), 65.Helt, M., Kelley, E., Kinsbourne, M., Pandey, J., Boorstein, H., Herbert, M., et al. (2008). Can children with autism recover? If so, how?. Neuropsychology Review,
18(4), 339–366.Howard, J. S., Sparkman, C. R., Cohen, H. G., Green, G., & Stanislaw, H. (2005). A comparison of intensive behavior analytic and eclectic treatments for young
children with autism. Research in Developmental Disabilities, 26(4), 359–383.Howlin, P., Magiati, I., & Charman, T. (2009). Systematic review of early intensive behavioral interventions for children with autism. American Journal on Intellectual
and Developmental Disabilities, 114(1), 23–41.Ingersoll, B., & Schreibman, L. (2006). Teaching reciprocal imitation skills to young children with autism using a naturalistic behavioral approach: Effects on
language, pretend play, and joint attention. Journal of Autism and Developmental Disorders, 36(4), 487–505.Isaksen, J., & Holth, P. (2009). An operant approach to teaching joint attention skills to children with autism. Behavioral Interventions, 24(4), 215–236. http://
dx.doi.org/10.1002/bin.292Jarrold, C., Boucher, J., & Smith, P. (1993). Symbolic play in autism: A review. Journal of Autism and Developmental Disorders, 23(2), 281–307.Leaf, R., & McEachin, J. (1999). A work in progress: Behavior management strategies and a curriculum for intensive behavioral treatment of autism. New York: DRL.Lifter, K. (2000). Linking assessment to intervention for children with developmental disabilities or at-risk for developmental delay: The developmental play
assessment (DPA) instrument. In K. Gitlin-Weiner, A. Sandgrund, C. Schaefer, K. Gitlin-Weiner, A. Sandgrund, & C. Schaefer (Eds.), Play diagnosis and assessment(2nd ed., pp. 228–261). Hoboken, NJ: John Wiley & Sons Inc.
Liss, M., Harel, B., Fein, D., Allen, D., Dunn, M., Feinstein, C., et al. (2001). Predictors and correlates of adaptive functioning in children with developmentaldisorders. Journal of Autism and Developmental Disorders, 31(2), 219–230.
Lord, C., Luyster, R. J., Gotham, K., & Guthrie, W. (2012). Autism diagnostic observation schedule, second edition (ADOS-2) manual part II: Toddler module. Torrance, CA:Western Psychological Services.
Lord, C., Rutter, M., DiLavore, P. C., Risi, S., Gotham, K., & Bishop, S. L. (2012). Autism diagnostic observation schedule, second edition (ADOS-2) manual part I: Modules1–4. Torrance, CA: Western Psychological Services.
Loupe, P. S., Schroeder, S. R., & Tessel, R. R. (1995). FR discrimination training effects in SHR and microencephalic rats. Pharmacology, Biochemistry and Behavior, 51,869–876.
Lovaas, O. I. (1987). Behavioral treatment and normal educational and intellectual functioning in young autistic children. Journal of Consulting and ClinicalPsychology, 55(1), 3–9.
Lovaas, O. I., & Smith, T. (1988). Intensive beahvioral treatment for young autistic children. In B. B. Lahey, & A. E. Kazdin (Eds.), Advances in clinical child psychology(Vol. 11, pp. 285–324). New York: Plenum.

R. MacDonald et al. / Research in Developmental Disabilities 35 (2014) 3632–36443644
Luckett, T., Bundy, A., & Roberts, J. (2007). Do behavioral approaches teach children with autism to play or are they pretending? Autism, 11(4), 365–388.MacDonald, R., Anderson, J., Dube, W. V., Geckeler, A., Green, G., Holcomb, W., et al. (2006). Behavioral assessment of joint attention: A methodological report.
Research in Developmental Disabilities, 27, 138–150.MacDonald, R., Green, G., Mansfield, R., Geckeler, A., Gardenier, N., Anderson, J., et al. (2007). Stereotypy in young children with autism and typically developing
children. Research in Developmental Disabilities, 28, 266–277.Matson, J. L., & Wilkins, J. (2007). A critical review of assessment targets and methods for social skills excesses and deficits for children with autism spectrum
disorders. Research in Autism Spectrum Disorders, 1(1), 28–37.Maurice, C., Green, G., & Luce, S. C. (1996). In C. Maurice, G. Green, & S. C. Luce (Eds.), Behavioral intervention for young children with autism: A manual for parents and
professionals. Austin, TX: PRO-ED.Miltenberger, R. G., Rapp, J. T., & Long, E. S. (1999). A low-tech method for conducting real-time recording. Journal of Applied Behavior Analysis, 32(1), 119–120.Mundy, P., Sigman, S., & Kasari, C. (1990). A longitudinal study of joint attention and language development in autistic children. Journal of Autism and
Developmental Disorders, 20, 115–128.Mundy, P., Sigman, S., & Kasari, C. (1994). Joint attention, developmental level, and symptom presentation in autism. Developmental and Psychopathology, 6,
389–401.Rutherford, M. D., Young, G. S., Hepburn, S., & Rogers, S. J. (2007). A longitudinal study of pretend play in autism. Journal of Autism and Developmental Disorders,
37(6), 1024–1039.Sallows, G. O., & Graupner, T. D. (2005). Intensive behavioral treatment for children with autism: Four-year outcome and predictors. American Journal on Mental
Retardation, 110(6), 417–438.Seibert, J. M., Hogan, A. E., & Mundy, P. C. (1982). Assessing interactional competencies: The early social-communication scales. Infant Mental Health Journal, 3(4),
244–258.Sherer, M. R., & Schreibman, L. (2005). Individual behavioral profiles and predictors of treatment effectiveness for children with autism. Journal of Consulting and
Clinical Psychology, 73(3), 525–538.Siller, M., & Sigman, M. (2008). Modeling longitudinal change in the language abilities of children with autism: Parent behaviors and child characteristics as
predictors of change. Developmental Psychology, 44(6), 1691–1704.Smith, T., Buch, G. A., & Gamby, T. E. (2000). Parent-directed, intensive early intervention for children with pervasive developmental disorder. Research in
Developmental Disabilities, 21(4), 297–309.Stahmer, A. C., Collings, N. M., & Palinkas, L. A. (2005). Early intervention practices for children with autism: Descriptions from community providers. Focus on
Autism and Other Developmental Disabilities, 20(2), 66–79.Toth, K., Munson, J., Meltzoff, A. N., & Dawson, G. (2006). Early predictors of communication development in young children with autism spectrum disorder: Joint
attention, imitation, and toy play. Journal of Autism and Developmental Disorders, 36(8), 993–1005.Wise, M. D., Little, A. A., Holliman, J. B., Wise, P. H., & Wang, C. J. (2010). Can state early intervention programs meet the increased demand of children suspected of
having autism spectrum disorders? Journal of Developmental and Behavioral Pediatrics, 31(6), 469–476.Wolery, M., & Garfinkle, A. N. (2002). Measures in intervention research with young children who have autism. Journal of Autism and Developmental Disorders,
32(5), 463–478.Wong, V. C. N., & Kwan, Q. K. (2010). Randomized controlled trial for early intervention for autism: A pilot study of the autism 1-2-3 project. Journal of Autism and
Developmental Disorders, 40(6), 677–688.
Copyright © 2022 FDOKUMEN