Application and validation of a consumer ethnocentrism scale ...
19
Full Terms & Conditions of access and use can be found at http://www.tandfonline.com/action/journalInformation?journalCode=rgam20 Download by: [1.55.196.166] Date: 23 January 2017, At: 19:15 Journal of Global Scholars of Marketing Science Bridging Asia and the World ISSN: 2163-9159 (Print) 2163-9167 (Online) Journal homepage: http://www.tandfonline.com/loi/rgam20 Application and validation of a consumer ethnocentrism scale in a young Vietnamese market segment Trang P. Tran, Bich Khanh Ngoc Ho, Truc Quang Le & Hung Trong Hoang To cite this article: Trang P. Tran, Bich Khanh Ngoc Ho, Truc Quang Le & Hung Trong Hoang (2017) Application and validation of a consumer ethnocentrism scale in a young Vietnamese market segment, Journal of Global Scholars of Marketing Science, 27:1, 60-77, DOI: 10.1080/21639159.2016.1265322 To link to this article: http://dx.doi.org/10.1080/21639159.2016.1265322 Published online: 13 Jan 2017. Submit your article to this journal Article views: 5 View related articles View Crossmark data
-
Upload
khangminh22 -
Category
Documents
-
view
1 -
download
0
Transcript of Application and validation of a consumer ethnocentrism scale ...
Full Terms & Conditions of access and use can be found athttp://www.tandfonline.com/action/journalInformation?journalCode=rgam20
Download by: [1.55.196.166] Date: 23 January 2017, At: 19:15
Journal of Global Scholars of Marketing ScienceBridging Asia and the World
ISSN: 2163-9159 (Print) 2163-9167 (Online) Journal homepage: http://www.tandfonline.com/loi/rgam20
Application and validation of a consumerethnocentrism scale in a young Vietnamesemarket segment
Trang P. Tran, Bich Khanh Ngoc Ho, Truc Quang Le & Hung Trong Hoang
To cite this article: Trang P. Tran, Bich Khanh Ngoc Ho, Truc Quang Le & Hung TrongHoang (2017) Application and validation of a consumer ethnocentrism scale in a youngVietnamese market segment, Journal of Global Scholars of Marketing Science, 27:1, 60-77, DOI:10.1080/21639159.2016.1265322
To link to this article: http://dx.doi.org/10.1080/21639159.2016.1265322
Published online: 13 Jan 2017.
Submit your article to this journal
Article views: 5
View related articles
View Crossmark data

JOURNAL OF GLOBAL SCHOLARS OF MARKETING SCIENCE, 2017VOL. 27, NO. 1, 60–77http://dx.doi.org/10.1080/21639159.2016.1265322
Application and validation of a consumer ethnocentrism scale in a young Vietnamese market segment
Trang P. Trana, Bich Khanh Ngoc Hob , Truc Quang Leb and Hung Trong Hoangb aDepartment of Management, Marketing, and Information Systems, State University of New York College at Oneonta, Oneonta, NY, USA; bCollege of Economics, Hue University, Hue City, Vietnam
ABSTRACTThe primary objective of this study is to validate a consumer ethnocentrism scale in Vietnam on the basis of the existing scale, CETSCALE, proposed by Shimp and Sharma. The results from a student population show that the revised scale consists of two elements: affective and behavioral. The multidimensional structure of the revised scale is supported in the exploratory factor analysis phase and confirmed in the confirmatory factor analysis phase. The findings also indicate that convergent validity, discriminant validity, and nomological validity of the revised scale are established. The paper starts with a literature review of consumer ethnocentrism, includes methodology and discussions, and concludes with theoretical and managerial implications.
越南年轻消费群体的市场细分中消费者民族中心主义量表的应用与验证研究目标---本研究的首要目标是在越南年轻消费者群体的市
场细分中对消费者民族中心主义量表进行验证,验证依据是由谢普和夏尔马(1987)提出的现有量表,消费者民族中心主义量表(CETSCALE)。本研究针对消费者民族中心主义量表的概念化和结构及其在不同文化间的兼容性进行分析。研究对象是越南市场---越南是东南亚国家联盟(东盟)成员之一,人口数量超过9000万。研究规划/方法/方式---主要包括两项研究。第一项研究是通过
对12名学生的访谈明确产品和品牌都在当地市场受到普遍欢迎的海外国家。研究主要内容是对150名学生的样本调研结果进行数据分析。研究的主要目标是以谢普和夏尔马(1987)提出的量表为基础,制定出能够专门应用于越南市场的民族中心主义衡量量表。量表中所有相关衡量标准都改编于现有文献,包括《消费者
民族中心主义,产品判断与购买意愿》(Klein等,1998),《民族中心主义概论》(Neuliep & McCroskey, 1997)。衡量范围使用李克特七点量表,1分代表“非常不同意”,7分代表“非常同意”。研究结论---本研究得出由两项衡量标准(行为与情感)构成
的调整版量表,如模型3所示。此模型优于之前的模型2(只有一个衡量因子,其中包括11项衡量标准)与初始模型,模型1(包括Klein提出的17项衡量标准)。
KEYWORDSConsumer ethnocentrism; Vietnam; CFA; EFA; construct validity
关键词消费者民族中心主义; 越南; 年轻消费者; CFA; EFA; 构建有效性
ARTICLE HISTORYReceived 25 July 2016 Revised 13 August 2016 Accepted 8 September 2016
© 2017 Korean Scholars of Marketing Science
CORRESPONDENCE TO Bich Khanh Ngoc Ho [email protected], [email protected]
JOURNAL OF GLOBAL SCHOLARS OF MARKETING SCIENCE 61
经过调整的民族中心主义量表有效可靠,研究中运用严谨的方法对量表进行了层层验证。首先,通过可靠性,克朗巴哈系数与AVE的构建能够体现出调整后量表具有良好的聚合效度。其次,通过AVE平方根与关联系数的对比可以体现出调整后量表中区分效度的有效性。根据研究结果显示,CETSCALE 与GEN是两种完全不同的衡量量表。这也再次突出了对由谢普和夏尔马(1987)提出的消费者民族中心主义理论概念化与操作化的肯定。最后,通过调整后消费者民族中心主义量表与常规民族中心
主义,购买意愿以及产品判断两个要素之间的关联性确立了调整后量表的理论有效性。调整后民族中心主义量表与常规消费者民族中心主义(Neuliep & McCroskey,1997)之间的关联性体现出两者间的一致性。但虽然两者间具有一致性,但构建理念上的区别体现了消费者民族中心主义的不同方面。研究创意/价值---本研究应用已有的CETSCALE量表,制定出一
个使用多重衡量标准并主要针对发展中国家(越南)的消费者民族中心主义量表。此外,由研究结果可知,谢普和夏尔马(1987)提出的CETSCALE可以经过调整后应用于新市场。初始量表的衡量维度是单一的,与此不同的是,本研究中的量表运用了多重衡量标准。调整后的量表不仅仅包含了初始量表中的11项衡量标准,同时也能够体现出情感与行为两项衡量标准。从管理者角度来看,目前全球化对企业的影响与日俱增,以全
球性的市场细分为依据,利用不同国家市场的相似性与差异性,制定出一套行之有效的市场战略对于跨国企业来说非常重要。消费者民族中心主义与心理和行为构建因素都是用于开发不同国家市场细分的有效变量。本研究提出的调整后量表有效可靠,有助于企业将消费者民族中心主义作为市场细分衡量标准的使用。
Introduction
The construct of consumer ethnocentrism and its scale, CETSCALE, have drawn the atten-tion of both researchers and managers because both are important in explaining customer behavior, especially in the situation when customers decide between domestically made and imported products. CETSCALE has been used extensively in several applications (Kipnis, Kubacki, Broderick, Siemieniako, & Pisarenko, 2012; Netemeyer, Durvasula, & Lichtenstein, 1991; Shimp, 1984; Shimp & Sharma, 1987). Two of the most popular applica-tions of CETSCALE are (1) it sheds light on better understanding of a product’s country of origin, and (2) it is strongly associated with a customer’s motivation that serves as a driving force for customer behavior, attitude, and purchase intention.
Under the influence of the globalization trend and Internet development, international transaction between countries has become more popular, opening the door for local cus-tomers to conveniently purchase products and merchandize from overseas. An attempt to develop research focusing on consumer ethnocentrism and its measurement scale is strongly encouraged (Luque-Martinez, Ibanez-Zapata, & del Barrio-Garcia, 2000; Shimp & Sharma, 1987). Research on consumer ethnocentrism plays an important role in explaining an underlying motivational mechanism driving individual and organizational customers to purchase domestic products over foreign products. Empirical results also provide insightful explanations about consumers’ patriotic attitudes, favoring local products over imported ones. More specifically, highly ethnocentric customers are prone to show more interest in domestic products and less interest in foreign products. In other words, they have posi-tive attitudes toward domestic products, while they underrate the values associated with imported products.
62 T. P. TRAN ET AL.
Although an increasing number of scholars are attempting to develop and validate con-sumer ethnocentrism findings in the developed world, to the best of our knowledge, the research that has been conducted to explore applicability of CETSCALE in South East Asia is not equivalent, much less in Vietnam. A few researchers have attempted to apply con-sumer ethnocentrism to this culture (Nguyen, 2011; Spillan & Harcar, 2013); however, the researchers have adopted the original construct in the Vietnamese market without testing whether construct validity is established and whether the unidimensionality of the scale is maintained. This emerging economy in Asia with a market of more than 90 million people has become a potential market for any multinational companies that want to expand their business overseas. Although a new market promises opportunities, it brings along with it challenges due to a new culture and its norms. Understanding customer behavior in a new market plays a role in developing a successful marketing strategy in a new market because that would help them not only provide suitable products and services meeting customers’ needs, but also avoid potential confusion derived from cultural disparities.
One of the most popular approaches to accomplishing that goal is to conduct mar-keting research in which the marketers collect data from local people and use the data to produce insightful results about the prospective market. This paper is developed to serve that purpose. The primary objective of this study is to revise and validate the consumer ethnocentrism scale proposed by Shimp and Sharma (1987) and apply it in the context of the Vietnamese culture. This revised scale is validated through a rigorous method including convergent validity, discriminant validity, and nomological validity. The paper starts with a literature review of consumer ethnocentrism, includes methodology and discussions, and concludes with theoretical and managerial implications.
Literature review
Consumer ethnocentrism
The concept of ethnocentrism was first introduced in 1907 by Sumner (Sharma, Shimp, & Shin, 1995). Ethnocentrism refers to people’s perspectives of their own group in which they exaggerate their race or country as a center of the world and feel they are better than others (Sumner, 1907). Each group believes that its own cultural values are the greatest and scorn others’ folkways (Sumner, 1907).
According to Sharma et al. (1995), ethnocentrism is a global scenario, which not only includes races, countries, groups, and social classes, but also expands into family pride, religious prejudice, racial discrimination, and patriotism. Levine and Campbell (1972) emphasize ethnocentrism in terms of cultural protection, union, and cooperation among community members and loyalty to the community. Their study expresses six behavioral trends of respondents: (1) discrimination between communities; (2) issue recognition based on the trend of their community; (3) their community is central and has a better living style; (4) underestimating the living style of others; (5) believing that their community is best, strong, and faithful; (6) others are weak and intricate.
Shimp and Sharma (1987) defined consumer ethnocentrism as beliefs and concep-tions about moral judiciousness and appropriateness in purchasing foreign products (Chryssochoidis, Krystallis, & Perreas, 2007; Fernández-Ferrín, Bande-Vilela, Klein, & Río-Araújo, 2015). The authors conclude that consumer ethnocentrism is a result of patriotism, and the fear of losing control in economic benefits due to negative effects of imports. Thus,

JOURNAL OF GLOBAL SCHOLARS OF MARKETING SCIENCE 63
it results in a favorable attitude toward local products over imported ones. For high-ethno-centric consumers, purchasing local products is not only related to economy (e.g. it brings benefits for their home country), but also morality. They think that consuming foreign products is blameworthy and contrary to national interests, and rejecting them means being loyal to their nation. All of those opinions, hence, lead to prejudice against imports. Ethnocentrism, therefore, leads to partial evaluation: enhancing local products, lowering foreign products, or paying premiums for home products and not being willing to buy foreign products (Klein, Ettenson, & Morris, 1998).
The scale of consumer ethnocentrism, CETSCALE, has been verified in several studies such as Ganideh (2012), Nijssen, Douglas, and Bressers (1999), and Kamaruddin, Mokhlis, and Othman (2002). Prior studies (Lantz, Nguyen, & Tang, 2002; Rosenbaum & Wong, 2009; Siemieniako, Kubacki, Gliska, & Krot, 2011) have pointed out the negative influences of ethnocentrism on customers’ attitude toward foreign goods.
In a cross-cultural study, Douglas and Nijssen (2003) indicate that ethnocentrism does not exist in isolation, but interacts with social and demographic components. Moreover, some recent research asserts that demographic characteristics impact on consumer ethno-centrism to different degrees (Josiassen, Assaf, & Karpen, 2011; Kamaruddin et al., 2002; Shah & Halim, 2011). Sharma et al. (1995) express four social psychology components of ethnocentrism in their study of factors influencing consumer attitude toward imported products in the USA. These components include (1) openness for overseas cultures; (2) patriotism; (3) conservatism; and (4) cosmopolitanism. The result shows that ethnocentrism has a negative correlation with openness, but has positive correlations with the rest of the factors. Sharma et al. (1995) also conclude that women are more ethnocentric than men, and the higher education and income, the less ethnocentrism people display.
It is controversial whether the definition of ethnocentrism is appropriately conceptualized and operationalized by the consumer ethnocentrism construct proposed by Shimp and Sharma (1987). The authors suggested that consumer ethnocentrism consists of three components: (1) love of one country and fear of losing economic control due to imports, (2) personal objection against imported products, and (3) customer preference of domestic over imported products. These three components focus on customer attitude and behavior toward “imported products”.
Consumer ethnocentrism (CE), perceived as “trait-like properties of individual person-alities” representing individual attitude and behavior toward domestic versus imported products, is possibly different from attitude and behavior. An empirical study of CETSCALE by Shimp and Sharma (1987) suggests that 17 items represent comprehensive social norms toward domestic and foreign products in the USA and their influences on the national economy. That might explain the strong correlation between CE and attitude and behavior (Durvasula, Andrews, & Netemeyer, 1997; Good & Huddleston, 1995; Jo, 1998) although there are arguments about differences among these constructs. In view of the aforementioned arguments, the current paper suggests CE to be general consumer perception about local and foreign products and services that is comprised of two key elements: affective and behavioral.
Affective elementEthnocentrism refers to the extent to which one’s own groups are differentiated from others in which people have positive feelings about their own groups while they show negative feelings about other groups. High-ethnocentric individuals generally express their favorit-ism toward domestic products and hostility toward foreign products, regardless of quality (Acharya & Elliott, 2003; Teo, Mohamad, & Ramayah, 2011).
64 T. P. TRAN ET AL.
Behavioral elementThe behavioral element is an important component of ethnocentrism (Shimp & Sharma, 1987) that represents the extent to which people like local products and hate foreign coun-terparts. Once customers develop a strong positive feeling about domestic products or services, they usually engage in a type of behavior (e.g. willingness to purchase, or positive word of mouth) toward the products or services they like.
Measuring consumer ethnocentrism
An attempt to develop a consumer ethnocentrism scale can be traced back to the early days when Adorno, Frenkel-Brunswik, Levinson, and Sanford (1950) tried to measure ethnocen-trism using the Authoritarian Personality. The scale consists of four fundamental dimensions that are designed to quantify the level of ethnocentrism of two groups: the ethnocentric and non-ethnocentric group. Two of those dimensions were employed to build a new scale called The E-Scale, geared toward minority groups. The new scale is a measure reflective of preference of people belonging to in-groups and hostility against people from out-groups.
However, the scale soon became outdated since it does not capture appropriately the dynamics of consumer ethnocentrism. In response to that, a newer construct was initiated by Shimp (1984) employing a number of criteria portraying differences between ethnocentrics and non-ethnocentrics. This proposed scale encompasses measurements of beliefs (Ajzen & Fishbein, 1977), purchase intentions (Warshaw, 1980), and related items pertaining to evaluation of purchase of automobile products from domestic versus foreign manufacturers. More recently, Shimp and Sharma (1987) proposed a new scale, CETSCALE, that captures the tendency of consumer ethnocentrism that customers have toward a purchase of foreign products versus American products. Drawing on the original consumer ethnocentrism scale, a number of researchers have found CETSCALE to be unidimensional (Caruana & Magri, 1996; Durvasula et al., 1997; Marcoux, Filiactrault, & Cheron, 1997; Mittelstaedt, Hopkins, Raymond, & Duke, 2004; Netemeyer et al., 1991; Sharma et al., 1995). But others have discovered more than one dimension in different cultures, such as Poland (Marcoux et al., 1997), Malaysia (Mavondo & Tan, 1999), the UK and China (Yu & Albaum, 2002), Netherlands (Douglas & Nijssen, 2003), India (Bawa, 2004), Canada and Russia (Saffu & Walker, 2005), and China, India, the UK, and the USA (Bawa, 2004; Hsu & Nien, 2008; Khan & Rizvi, 2008; Pereira, Hsu, & Kundu, 2002; Qing, Lobo, & Chongguang, 2012; Wei, Wright, Wang, & Yu, 2009).
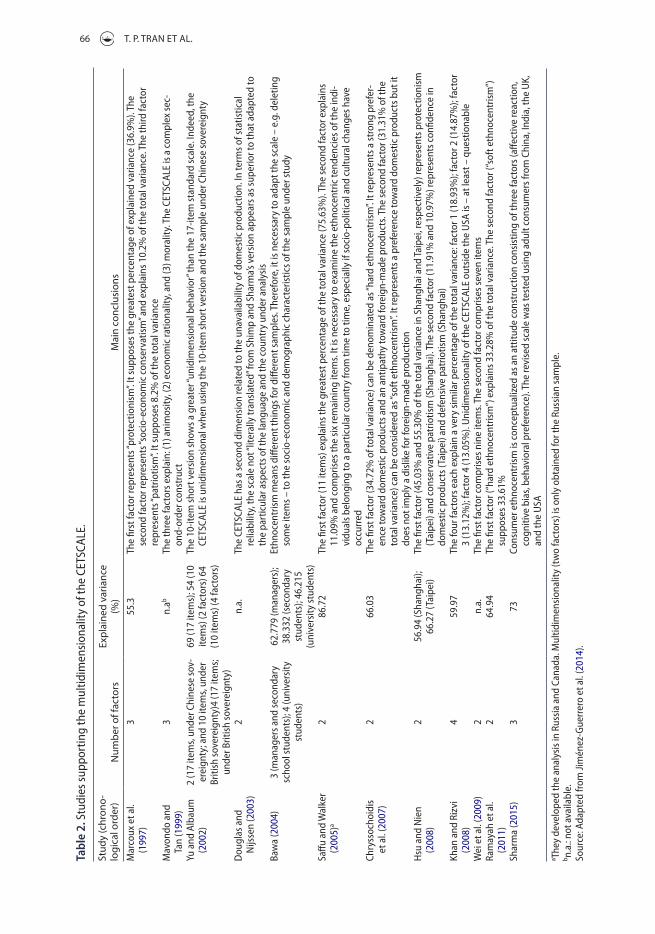
In Asia, a number of researchers have developed similar research to explore the applica-bility of CETSCALE in different societies; however, the idea of unidimensionality of the scale is split across cultures. Some researchers have confirmed CETSCALE to be unidimensional, including Sharma et al. (1995) who conducted their research in South Korea, Pereira et al. (2002) in China, (Table 1) India, and Taiwan, Kwak, Jaju, and Larsen (2006) in South Korea, the USA, and India, and Qing et al. (2012) in China. On the other hand, the unidimension-ality of CETSCALE is not confirmed in other research such as Mavondo and Tan (1999) conducted in Malaysia, Chowdhury (2013) in Bangladesh, Yu and Albaum (2002) in Hong Kong (UK) and Hong Kong (China), Bawa (2004) in India, (Table 1) Hsu and Nien (2008) in Taipei and Shanghai, and Khan and Rizvi (2008) in India. Detailed descriptions of those papers are presented in Table 2. Therefore there is no agreement on the conceptualization and structure of the consumer ethnocentrism scale and its compatibility across cultures.

JOURNAL OF GLOBAL SCHOLARS OF MARKETING SCIENCE 65
Tabl
e 1.
Stu
dies
con
duct
ed in
Asi
a fo
cusi
ng o
n CE
TSCA
LE d
imen
sion
ality
.
a SA: s
elf-
adm
inis
tere
d qu
estio
nnai
re; P
S: p
osta
l sur
vey;
PRS
: per
sona
l sur
vey;
OS:
onl
ine
Surv
ey.
b Betw
een
pare
nthe
ses,
item
s fro
m th
e st
anda
rd 1
7-ite
m S
him
p an
d Sh
arm
a (1
987)
CET
SCAL
E ve
rsio
n.
c Shim
p an
d Sh
arm
a (1
987,
p. 2
83, f
ootn
ote
4; it
ems 2
, 4, 5
, 6, 7
, 8, 1
1, 1
3, 1
6, 1
7).
d If th
e st
udy
uses
seve
ral s
ampl
es, t
his fi
gure
refle
cts t
he to
tal s
um o
f all
of th
em.
e n.a.
= n
ot a
vaila
ble.
So
urce
: Ada
pted
from
Jim
énez
-Gue
rrer
o, G
ázqu
ez-A
bad,
and
Lin
ares
-Agü
era
(201
4).
Stud
y (c
hron
olog
ical
ord
er)
Coun
try
Sam
ple
Sam
-pl
e si
zed
Met
hodo
logy
fo
r obt
aini
ng
info
rmat
iona
CETS
CALE
b ver
sion
Like
rt
scal
eU
nidi
men
sion
ality
Shar
ma
et a
l. (1
995)
Sout
h Ko
rea
Gen
eral
pop
ulat
ion
667
SA; P
S17
-item
7-po
int
Yes
Mav
ondo
and
Tan
(199
9)M
alay
sia
Gen
eral
pop
ulat
ion
186
PRS
17-it
em7-
poin
tN
oPe
reira
et a
l. (2
002)
Chin
a, In
dia,
Taiw
anSt
uden
ts29
8SA
17-it
emn.
a.Ye
sYu
and
Alb
aum
(200
2)H
ong
Kong
(UK)
, H
ong
Kong
(Chi
na)
Gen
eral
pop
ulat
ion
684
SA17
-item
/10-
item
c5-
poin
tN
o; Y
es (o
nly
usin
g th
e 10
-item
scal
e an
d un
der C
hine
se)
Baw
a (2
004)
Indi
aBu
sine
ss m
anag
ers,
univ
er-
sity
stud
ents
, sec
onda
ry
scho
ol st
uden
ts
336
SA; P
S11
-item
(2, 3
, 4, 8
, 9, 1
0, 1
1, 1
3,
14, 1
5, 1
6), 1
1-ite
m (1
, 3, 8
, 9,
11–1
7), 1
4-ite
m (1
, 3, 5
–11,
13
–17)
7-po
int
No
Kwak
et a
l. (2
006)
Sout
h Ko
rea,
USA
, In
dia
Gen
eral
pop
ulat
ion,
uni
ver-
sity
stud
ents
1410
SA; O
S5-
item
(n.a
.) an
d 17
-item
7-po
int
Yes
Hsu
and
Nie
n (2
008)
Taip
ei, S
hang
hai
Gen
eral
pop
ulat
ion
617
PRS
10-it
emc
n.a.
No
Khan
and
Riz
vi (2
008)
Indi
aU
nive
rsity
stud
ents
96SA
17-it
emn.
a.N
oW
ei e
t al.
(200
9)Ch
ina
Gen
eral
pop
ulat
ion
754
PRS
16-it
em (e
xcep
t 16)
7-po
int
No
Ram
ayah
, Moh
amad
, Che
e Yo
ung,
an
d M
ay C
huin
(201
1)M
alay
sia
Gen
eral
pop
ulat
ion
180
PRS
17-it
emn.
a.N
o
Teo
et a
l. (2
011)
Mal
aysi
aG
ener
al p
opul
atio
n39
8SA
17-it
em5-
poin
tYe
s (al
so th
e 2-
dim
en-
sion
s mod
el o
ffers
a
high
relia
bilit
y le
vel)
Qin
g et
al.
(201
2)Ch
ina
Gen
eral
pop
ulat
ion
535
PRS
3-ite
m (n
.a.)e
5-po
int
Yes
66 T. P. TRAN ET AL.
Tabl
e 2.
Stu
dies
supp
ortin
g th
e m
ultid
imen
sion
ality
of t
he C
ETSC
ALE.
a They
dev
elop
ed th
e an
alys
is in
Rus
sia
and
Cana
da. M
ultid
imen
sion
ality
(tw
o fa
ctor
s) is
onl
y ob
tain
ed fo
r the
Rus
sian
sam
ple.
b n.
a.: n
ot a
vaila
ble.
So
urce
: Ada
pted
from
Jim
énez
-Gue
rrer
o et
al.
(201
4).
Stud
y (c
hron
o-lo
gica
l ord
er)
Num
ber o
f fac
tors
Expl
aine
d va
rianc
e (%
)M
ain
conc
lusi
ons
Mar
coux
et a
l. (1
997)
355
.3Th
e fir
st fa
ctor
repr
esen
ts “p
rote
ctio
nism
”. It
supp
oses
the
grea
test
per
cent
age
of e
xpla
ined
var
ianc
e (3
6.9%
). Th
e se
cond
fact
or re
pres
ents
“soc
io-e
cono
mic
con
serv
atis
m” a
nd e
xpla
ins 1
0.2%
of t
he to
tal v
aria
nce.
The
third
fact
or
repr
esen
ts “p
atrio
tism
”. It
supp
oses
8.2
% o
f the
tota
l var
ianc
eM
avon
do a
nd
Tan
(199
9)3
n.ab
The
thre
e fa
ctor
s exp
lain
: (1)
ani
mos
ity, (
2) e
cono
mic
ratio
nalit
y, a
nd (3
) mor
ality
. The
CET
SCAL
E is
a c
ompl
ex se
c-on
d-or
der c
onst
ruct
Yu a
nd A
lbau
m
(200
2)2
(17
item
s, un
der C
hine
se so
v-er
eign
ty; a
nd 1
0 ite
ms,
unde
r Br
itish
sove
reig
nty)
4 (1
7 ite
ms;
un
der B
ritis
h so
vere
ignt
y)
69 (1
7 ite
ms)
; 54
(10
item
s) (2
fact
ors)
64
(10
item
s) (4
fact
ors)
The
10-it
em sh
ort v
ersi
on sh
ows a
gre
ater
“uni
dim
ensi
onal
beh
avio
r” th
an th
e 17
-item
stan
dard
scal
e. In
deed
, the
CE
TSCA
LE is
uni
dim
ensi
onal
whe
n us
ing
the
10-it
em sh
ort v
ersi
on a
nd th
e sa
mpl
e un
der C
hine
se so
vere
ignt
y
Dou
glas
and
N
ijsse
n (2
003)
2n.
a.Th
e CE
TSCA
LE h
as a
seco
nd d
imen
sion
rela
ted
to th
e un
avai
labi
lity
of d
omes
tic p
rodu
ctio
n. In
term
s of s
tatis
tical
re
liabi
lity,
the
scal
e no
t “lit
eral
ly tr
ansl
ated
” fro
m S
him
p an
d Sh
arm
a’s v
ersi
on a
ppea
rs a
s sup
erio
r to
that
ada
pted
to
the
part
icul
ar a
spec
ts o
f the
lang
uage
and
the
coun
try
unde
r ana
lysi
sBa
wa
(200
4)3
(man
ager
s and
seco
ndar
y sc
hool
stud
ents
); 4
(uni
vers
ity
stud
ents
)
62.7
79 (m
anag
ers)
; 38
.332
(sec
onda
ry
stud
ents
); 46
.215
(u
nive
rsity
stud
ents
)
Ethn
ocen
tris
m m
eans
diff
eren
t thi
ngs f
or d
iffer
ent s
ampl
es. T
here
fore
, it i
s nec
essa
ry to
ada
pt th
e sc
ale
– e.
g. d
elet
ing
som
e ite
ms –
to th
e so
cio-
econ
omic
and
dem
ogra
phic
cha
ract
eris
tics o
f the
sam
ple
unde
r stu
dy
Saffu
and
Wal
ker
(200
5)a
286
.72
The
first
fact
or (1
1 ite
ms)
exp
lain
s the
gre
ates
t per
cent
age
of th
e to
tal v
aria
nce
(75.
63%
). Th
e se
cond
fact
or e
xpla
ins
11.0
9% a
nd c
ompr
ises
the
six
rem
aini
ng it
ems.
It is
nec
essa
ry to
exa
min
e th
e et
hnoc
entr
ic te
nden
cies
of t
he in
di-
vidu
als b
elon
ging
to a
par
ticul
ar c
ount
ry fr
om ti
me
to ti
me,
esp
ecia
lly if
soci
o-po
litic
al a
nd c
ultu
ral c
hang
es h
ave
occu
rred
Chry
ssoc
hoid
is
et a
l. (2
007)
266
.03
The
first
fact
or (3
4.72
% o
f tot
al v
aria
nce)
can
be
deno
min
ated
as “
hard
eth
noce
ntris
m”.
It re
pres
ents
a st
rong
pre
fer-
ence
tow
ard
dom
estic
pro
duct
s and
an
antip
athy
tow
ard
fore
ign-
mad
e pr
oduc
ts. T
he se
cond
fact
or (3
1.31
% o
f the
to
tal v
aria
nce)
can
be
cons
ider
ed a
s “so
ft e
thno
cent
rism
”. It
repr
esen
ts a
pre
fere
nce
tow
ard
dom
estic
pro
duct
s but
it
does
not
impl
y a
disl
ike
for f
orei
gn-m
ade
prod
uctio
nH
su a
nd N
ien
(200
8)2
56.9
4 (S
hang
hai);
66
.27
(Tai
pei)
The
first
fact
or (4
5.03
% a
nd 5
5.30
% o
f the
tota
l var
ianc
e in
Sha
ngha
i and
Taip
ei, r
espe
ctiv
ely)
repr
esen
ts p
rote
ctio
nism
(T
aipe
i) an
d co
nser
vativ
e pa
trio
tism
(Sha
ngha
i). T
he se
cond
fact
or (1
1.91
% a
nd 1
0.97
%) r
epre
sent
s con
fiden
ce in
do
mes
tic p
rodu
cts (
Taip
ei) a
nd d
efen
sive
pat
riotis
m (S
hang
hai)
Khan
and
Riz
vi
(200
8)4
59.9
7Th
e fo
ur fa
ctor
s eac
h ex
plai
n a
very
sim
ilar p
erce
ntag
e of
the
tota
l var
ianc
e: fa
ctor
1 (1
8.93
%);
fact
or 2
(14.
87%
); fa
ctor
3
(13.
12%
); fa
ctor
4 (1
3.05
%).
Uni
dim
ensi
onal
ity o
f the
CET
SCAL
E ou
tsid
e th
e U
SA is
– a
t lea
st –
que
stio
nabl
eW
ei e
t al.
(200
9)
2n.
a.Th
e fir
st fa
ctor
com
pris
es n
ine
item
s. Th
e se
cond
fact
or c
ompr
ises
seve
n ite
ms
Ram
ayah
et a
l. (2
011)
264
.94
The
first
fact
or (“
hard
eth
noce
ntris
m”)
exp
lain
s 33.
28%
of t
he to
tal v
aria
nce.
The
seco
nd fa
ctor
(“so
ft e
thno
cent
rism
”)
supp
oses
33.
61%
Shar
ma
(201
5)3
73Co
nsum
er e
thno
cent
rism
is c
once
ptua
lized
as a
n at
titud
e co
nstr
uctio
n co
nsis
ting
of th
ree
fact
ors (
affec
tive
reac
tion,
co
gniti
ve b
ias,
beha
vior
al p
refe
renc
e). T
he re
vise
d sc
ale
was
test
ed u
sing
adu
lt co
nsum
ers f
rom
Chi
na, I
ndia
, the
UK,
an
d th
e U
SA
JOURNAL OF GLOBAL SCHOLARS OF MARKETING SCIENCE 67
Methodology
Sample collection
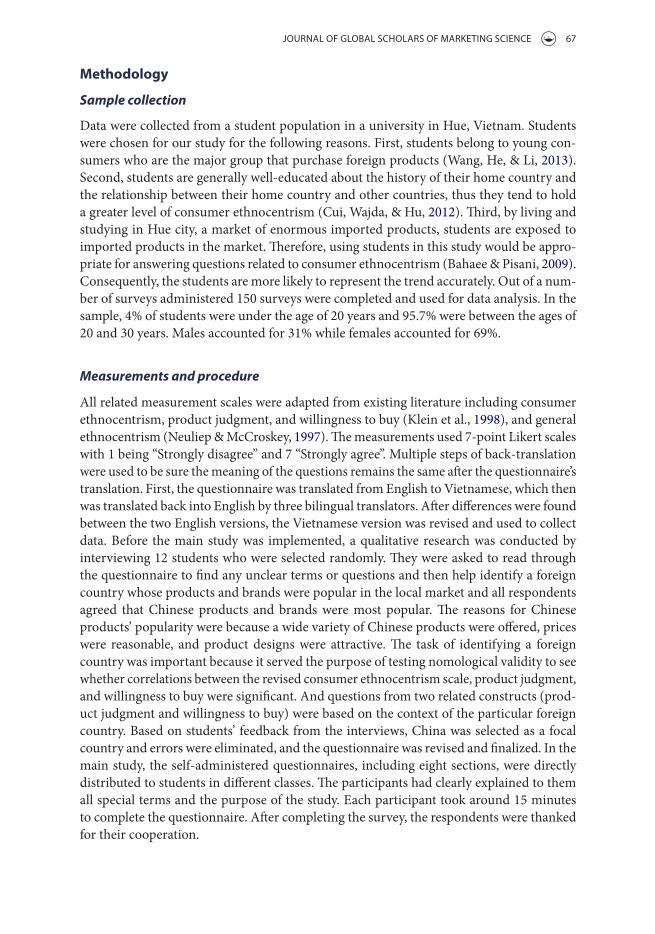
Data were collected from a student population in a university in Hue, Vietnam. Students were chosen for our study for the following reasons. First, students belong to young con-sumers who are the major group that purchase foreign products (Wang, He, & Li, 2013). Second, students are generally well-educated about the history of their home country and the relationship between their home country and other countries, thus they tend to hold a greater level of consumer ethnocentrism (Cui, Wajda, & Hu, 2012). Third, by living and studying in Hue city, a market of enormous imported products, students are exposed to imported products in the market. Therefore, using students in this study would be appro-priate for answering questions related to consumer ethnocentrism (Bahaee & Pisani, 2009). Consequently, the students are more likely to represent the trend accurately. Out of a num-ber of surveys administered 150 surveys were completed and used for data analysis. In the sample, 4% of students were under the age of 20 years and 95.7% were between the ages of 20 and 30 years. Males accounted for 31% while females accounted for 69%.
Measurements and procedure
All related measurement scales were adapted from existing literature including consumer ethnocentrism, product judgment, and willingness to buy (Klein et al., 1998), and general ethnocentrism (Neuliep & McCroskey, 1997). The measurements used 7-point Likert scales with 1 being “Strongly disagree” and 7 “Strongly agree”. Multiple steps of back-translation were used to be sure the meaning of the questions remains the same after the questionnaire’s translation. First, the questionnaire was translated from English to Vietnamese, which then was translated back into English by three bilingual translators. After differences were found between the two English versions, the Vietnamese version was revised and used to collect data. Before the main study was implemented, a qualitative research was conducted by interviewing 12 students who were selected randomly. They were asked to read through the questionnaire to find any unclear terms or questions and then help identify a foreign country whose products and brands were popular in the local market and all respondents agreed that Chinese products and brands were most popular. The reasons for Chinese products’ popularity were because a wide variety of Chinese products were offered, prices were reasonable, and product designs were attractive. The task of identifying a foreign country was important because it served the purpose of testing nomological validity to see whether correlations between the revised consumer ethnocentrism scale, product judgment, and willingness to buy were significant. And questions from two related constructs (prod-uct judgment and willingness to buy) were based on the context of the particular foreign country. Based on students’ feedback from the interviews, China was selected as a focal country and errors were eliminated, and the questionnaire was revised and finalized. In the main study, the self-administered questionnaires, including eight sections, were directly distributed to students in different classes. The participants had clearly explained to them all special terms and the purpose of the study. Each participant took around 15 minutes to complete the questionnaire. After completing the survey, the respondents were thanked for their cooperation.
68 T. P. TRAN ET AL.
Exploratory factor analysis
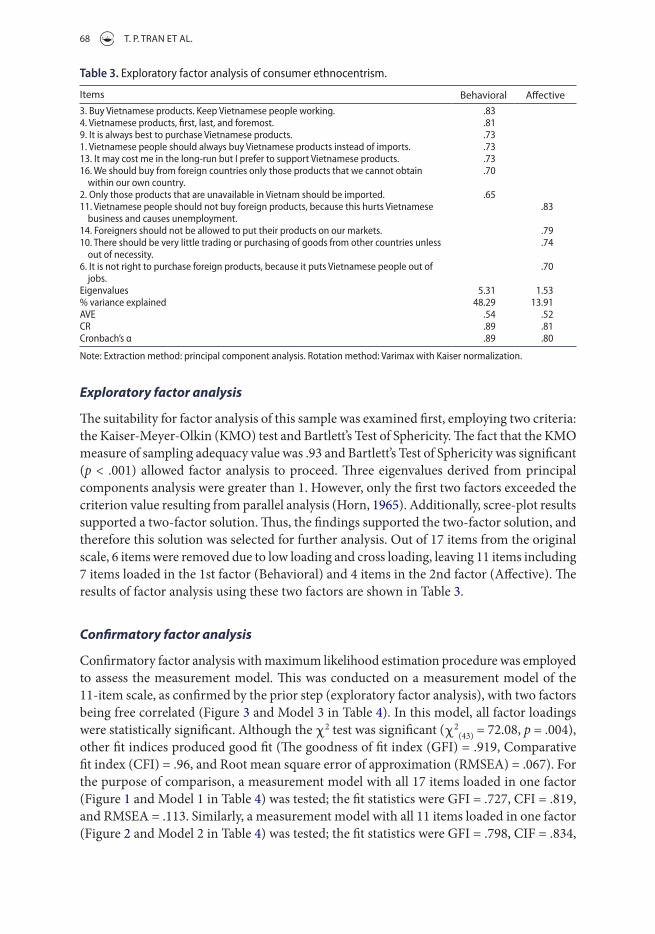
The suitability for factor analysis of this sample was examined first, employing two criteria: the Kaiser-Meyer-Olkin (KMO) test and Bartlett’s Test of Sphericity. The fact that the KMO measure of sampling adequacy value was .93 and Bartlett’s Test of Sphericity was significant (p < .001) allowed factor analysis to proceed. Three eigenvalues derived from principal components analysis were greater than 1. However, only the first two factors exceeded the criterion value resulting from parallel analysis (Horn, 1965). Additionally, scree-plot results supported a two-factor solution. Thus, the findings supported the two-factor solution, and therefore this solution was selected for further analysis. Out of 17 items from the original scale, 6 items were removed due to low loading and cross loading, leaving 11 items including 7 items loaded in the 1st factor (Behavioral) and 4 items in the 2nd factor (Affective). The results of factor analysis using these two factors are shown in Table 3.
Confirmatory factor analysis
Confirmatory factor analysis with maximum likelihood estimation procedure was employed to assess the measurement model. This was conducted on a measurement model of the 11-item scale, as confirmed by the prior step (exploratory factor analysis), with two factors being free correlated (Figure 3 and Model 3 in Table 4). In this model, all factor loadings were statistically significant. Although the χ2 test was significant (χ2
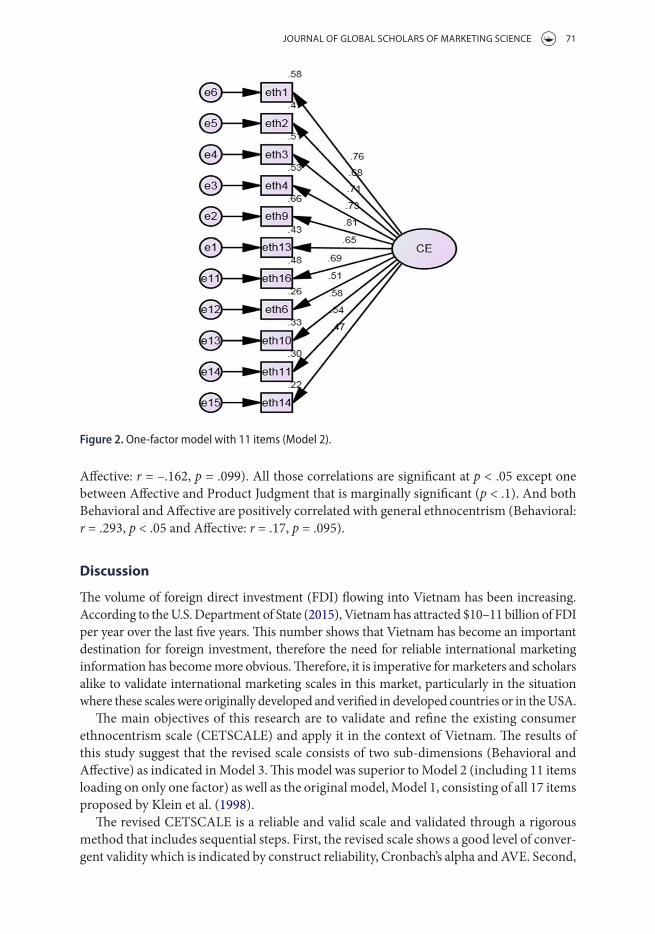
(43) = 72.08, p = .004), other fit indices produced good fit (The goodness of fit index (GFI) = .919, Comparative fit index (CFI) = .96, and Root mean square error of approximation (RMSEA) = .067). For the purpose of comparison, a measurement model with all 17 items loaded in one factor (Figure 1 and Model 1 in Table 4) was tested; the fit statistics were GFI = .727, CFI = .819, and RMSEA = .113. Similarly, a measurement model with all 11 items loaded in one factor (Figure 2 and Model 2 in Table 4) was tested; the fit statistics were GFI = .798, CIF = .834,
Table 3. Exploratory factor analysis of consumer ethnocentrism.
Note: Extraction method: principal component analysis. Rotation method: Varimax with Kaiser normalization.
Items Behavioral Affective 3. Buy Vietnamese products. Keep Vietnamese people working. .834. Vietnamese products, first, last, and foremost. .819. It is always best to purchase Vietnamese products. .731. Vietnamese people should always buy Vietnamese products instead of imports. .7313. It may cost me in the long-run but I prefer to support Vietnamese products. .7316. We should buy from foreign countries only those products that we cannot obtain
within our own country..70
2. Only those products that are unavailable in Vietnam should be imported. .6511. Vietnamese people should not buy foreign products, because this hurts Vietnamese
business and causes unemployment..83
14. Foreigners should not be allowed to put their products on our markets. .7910. There should be very little trading or purchasing of goods from other countries unless
out of necessity..74
6. It is not right to purchase foreign products, because it puts Vietnamese people out of jobs.
.70
Eigenvalues 5.31 1.53% variance explained 48.29 13.91AVE .54 .52CR .89 .81Cronbach’s α .89 .80

JOURNAL OF GLOBAL SCHOLARS OF MARKETING SCIENCE 69
and RMSEA = .136. The comparison results indicated that Model 3 provided better fit than Models 1 and 2.
It was of importance to examine the factorial structure of CE (Model 3) within each sub-dimension. In general, most of the fit statistics for the two factors were good (for Behavioral, χ2
(14) = 24.431, GFI = .953, CFI = .978, RMSEA = .071; for Affective, χ2(2)
= 4.493, GFI = .985, CFI = .987, RMSEA = .091). Among those indices, all comparative indices for the two factors were good (CIF values were greater than .90), the RMSEA for Behavioral was adequate, but for Affective it was barely adequate (.091). Lastly, the χ2 value for Behavioral was significant which did not provide a good fit while the χ2 value for Affective was non-significant implying a good fit. Since χ2 values are impacted by other fac-tors, additional fit statistics were taken into account when model fit was evaluated. Overall, these figures showed unidimensionality of the two first-order dimensions of the CE scale (Behavioral and Affective) and these dimensions are strongly correlated (r = .61).
Convergent validity
Cronbach’s α for Behavioral and Affective was .89 and .80, respectively. The construct reli-ability of Behavioral and Affective was .89 and .81, respectively, both of which were higher than the accepted value of .70 (Hair, Hult, Ringle, & Sarstedt, 2013). The average variance extracted (AVE) for Behavioral and Affective was .538 and .518, respectively, exceeding the cut-off value of .5 (Hair et al., 2013). This implied a high level of convergent validity as well as unidimensionality of the two first-order dimensions of the CE scale (see Table 3).
Discriminant validity
In addition to convergent validity, discriminant validity was tested to measure the validity of an underlying construct. If a construct shows evidence of discriminant validity, the variance shared between that construct and the block of its indicators is greater than the variance shared by that construct and other constructs with each characterizing another block of different indicators (Hulland, 1999). That is obtained by comparing between the square root of the AVE and correlation coefficients between that construct and others. If the square root of the AVE is greater than the Pearson’s correlation coefficients, the evidence of discriminant validity of a construct is confirmed (Fornell & Larcker, 1981). Results, shown in Table 5, illustrated that all constructs had acceptable levels of discriminant validity.
Nomological validity
Nomological validity was examined through correlation between two sub-dimensions of CE and other related constructs: general ethnocentrism, willingness to buy, and product
Table 4. Model comparison.
Alternative models χ2 df CFI GFI RMSEA Model 1: One-factor model with 17 items 345.435 119 .819 .727 .113Model 2: One-factor model with 11 items 165.938 44 .834 .798 .136Model 3: Two-factor model with 11 items 72.075 43 .960 .919 .067Behavioral 24.431 14 .978 .953 .071Affective 4.493 2 .987 .985 .091

70 T. P. TRAN ET AL.
judgment. The results are shown in Tables 5 and 6. As anticipated, both Behavioral and Affective are negatively correlated to willingness to buy (Behavioral: r = –.483, p < .001 and Affective: r = –.268, p < .05) and product judgment (Behavioral: r = –.189, p < .05 and
Figure 1. One-factor model with 17 items (Model 1).
JOURNAL OF GLOBAL SCHOLARS OF MARKETING SCIENCE 71
Affective: r = –.162, p = .099). All those correlations are significant at p < .05 except one between Affective and Product Judgment that is marginally significant (p < .1). And both Behavioral and Affective are positively correlated with general ethnocentrism (Behavioral: r = .293, p < .05 and Affective: r = .17, p = .095).
Discussion
The volume of foreign direct investment (FDI) flowing into Vietnam has been increasing. According to the U.S. Department of State (2015), Vietnam has attracted $10–11 billion of FDI per year over the last five years. This number shows that Vietnam has become an important destination for foreign investment, therefore the need for reliable international marketing information has become more obvious. Therefore, it is imperative for marketers and scholars alike to validate international marketing scales in this market, particularly in the situation where these scales were originally developed and verified in developed countries or in the USA.
The main objectives of this research are to validate and refine the existing consumer ethnocentrism scale (CETSCALE) and apply it in the context of Vietnam. The results of this study suggest that the revised scale consists of two sub-dimensions (Behavioral and Affective) as indicated in Model 3. This model was superior to Model 2 (including 11 items loading on only one factor) as well as the original model, Model 1, consisting of all 17 items proposed by Klein et al. (1998).
The revised CETSCALE is a reliable and valid scale and validated through a rigorous method that includes sequential steps. First, the revised scale shows a good level of conver-gent validity which is indicated by construct reliability, Cronbach’s alpha and AVE. Second,
Figure 2. One-factor model with 11 items (Model 2).
72 T. P. TRAN ET AL.
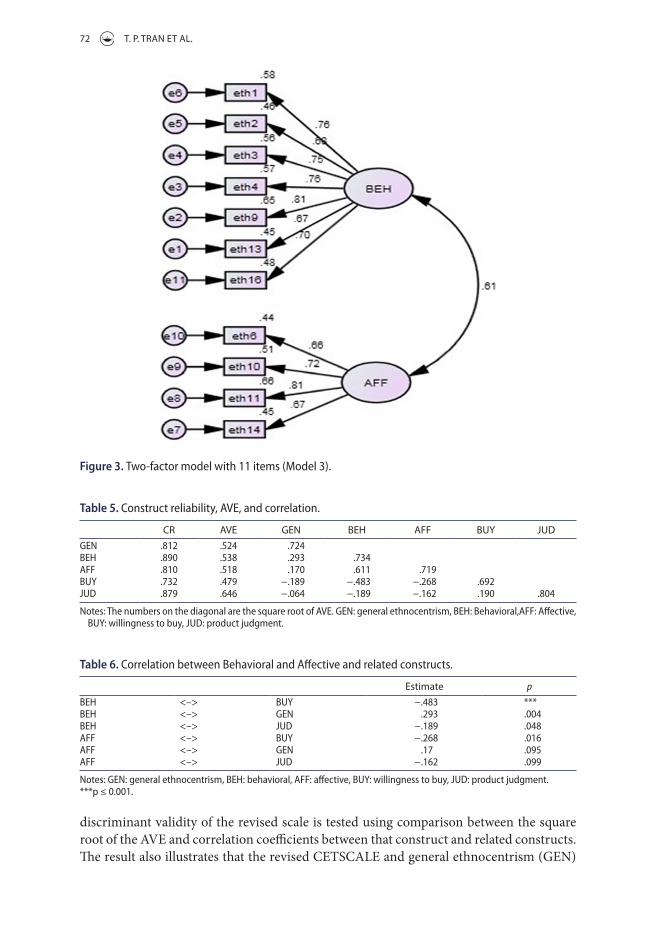
discriminant validity of the revised scale is tested using comparison between the square root of the AVE and correlation coefficients between that construct and related constructs. The result also illustrates that the revised CETSCALE and general ethnocentrism (GEN)
Figure 3. Two-factor model with 11 items (Model 3).
Table 5. Construct reliability, AVE, and correlation.
Notes: The numbers on the diagonal are the square root of AVE. GEN: general ethnocentrism, BEH: Behavioral,AFF: Affective, BUY: willingness to buy, JUD: product judgment.
CR AVE GEN BEH AFF BUY JUDGEN .812 .524 .724BEH .890 .538 .293 .734AFF .810 .518 .170 .611 .719BUY .732 .479 −.189 −.483 −.268 .692JUD .879 .646 −.064 −.189 −.162 .190 .804
Table 6. Correlation between Behavioral and Affective and related constructs.
Estimate pBEH <–> BUY −.483 ***BEH <–> GEN .293 .004BEH <–> JUD −.189 .048AFF <–> BUY −.268 .016AFF <–> GEN .17 .095AFF <–> JUD −.162 .099
Notes: GEN: general ethnocentrism, BEH: behavioral, AFF: affective, BUY: willingness to buy, JUD: product judgment.***p ≤ 0.001.

JOURNAL OF GLOBAL SCHOLARS OF MARKETING SCIENCE 73
are two different scales capturing two distinct and separate constructs. This sheds light on reaffirmation of the conceptualization and operationalization of consumer ethnocentrism by Shimp and Sharma (1987).
Finally, nomological validity was established and confirmed through the correlations between two elements of the revised CETSCALE and general ethnocentrism, willingness to buy, and product judgment. The correlation between the revised CETSCALE and general consumer ethnocentrism illustrates the consistency between the revised scale and gen-eral consumer ethnocentrism postulated by Neuliep and McCroskey (1997). However, as explained earlier in relation to discriminant validity, despite the level of consistency, both constructs are distinct, tapping into different aspects of consumer ethnocentrism.
Regarding the correlation between the revised CETSCALE and willingness to buy, the empirical findings are in line with those found in the existing literature. This lends further evidence to support the observation that the more ethnocentric the customers are, the less interested they are in purchasing foreign products. The negative disposition was seen in both behavioral and affective factors.
Theoretical and managerial implications
This research is a response to calls for research examining a more meaningful and sophis-ticated structure of consumer ethnocentrism as opposed to the unidimensional structure of CE in prior research (Verlegh, 2007). The paper has made a substantial contribution by applying a well-established CETSCALE scale and validating a multidimensional scale of CE in Vietnam. First, the paper sheds light on clarification of the conceptualization of consumer ethnocentrism by proposing a revised scale consisting of two elements: affective and behavioral. The affective element refers to the emotional feelings that customers have toward domestic and foreign products as well as manufacturing firms and service providers while the behavioral element captures the activities in which customers engage in response to their affinity for domestic products over foreign products.
Second, two elements of the revised scale would provide marketers with more insights of the unique impact of affective and behavioral components on customer perception and evaluation of domestic versus imported products and services. The fact that affection is strongly related to behavior can be observed in this paper. In general, when a customer holds a favorable feeling about a particular country, she would have a positive perception about products or services produced in that country, which is strongly associated with her behavior that can be manifested by purchase intention, repeated purchase, or positive word of mouth.
Third, the paper has provided more concrete evidence that Shimp and Sharma’s (1987) CETSCALE could be revised and applied into a new market. But different from the uni-dimensionality of the original scale, the results of the paper reconceptualize it as a multi-dimensional scale as supported by a number of researches conducted outside of the USA (see Table 2). The revised scale is not only more parsimonious, including 11 items, but it also captures two distinct aspects of the construct.
Next, the negative correlation between the two dimensions of consumer ethnocentrism and willingness to buy foreign-made products sends an important message to interna-tional marketers who strive to export their products overseas. Vietnam, a member of the Association of Southeast Asian Nations (ASEAN), offers a great opportunity for foreign investment with its population of more than 90 million (World Bank, 2015). However,
74 T. P. TRAN ET AL.
successfully investing into Vietnam requires marketers to have in-depth understanding about its culture and market. The revised scale is obviously an effective tool that enables international companies to overcome challenges.
Under the increasing influence of globalization, it is more important for multinational companies to develop an effective marketing strategy based on global market segmentation, taking advantage of similarities and differences of country-specific markets. Consumer ethnocentrism, coupled with psychographic and behavioral constructs, is considered a good variable that is effectively used to develop cross-country market segments. The proposal of the revised valid and reliable scale has paved the way to use consumer ethnocentrism as a market segmentation criterion.
Local marketers and policy makers also will find the current study helpful because if consumer ethnocentrism, in addition to nationalism, is smartly tailored in advertising campaigns, it will become a crucial tool that enables the local companies to gain competitive advantage over the overseas companies in the domestic market.
Limitations and future research
Although the study has provided a number of theoretical and managerial implications, the findings of the study should be interpreted and generalized in a cautious manner due to the following limitations. The first is the characteristics of the sample. As data were col-lected from students in Hue city of Vietnam, this may affect their representativeness of the general population. A more representative sample should be selected in future research, focusing more on higher demographic and geographic diversity. The second is the size and the approach of the sample. Only 150 respondents with a convenient sampling approach were involved in the survey process. Thus, a larger sample size and probabilistic sampling approach would provide better support for the research findings. Next, it is suggested that consumer ethnocentrism should be evaluated in relation to other consumer behavior as well as international marketing constructs to establish stronger nomological validity and predictive validity. Finally, the paper employed only one sample to test construct validity; it is advised that a second sample be collected to test relationships (instead of correlations) between consumer ethnocentrism and other related constructs.
Disclosure statement
No potential conflict of interest was reported by the authors.
ORCID
Bich Khanh Ngoc Ho http://orcid.org/0000-0001-8812-4822Truc Quang Le http://orcid.org/0000-0001-9794-0792Hung Trong Hoang http://orcid.org/0000-0001-8959-0606
References
Acharya, C., & Elliott, G. (2003). Consumer ethnocentrism, perceived product quality and choice-an empirical investigation. Journal of International Consumer Marketing, 15, 87–115.
Adorno, T. W., Frenkel-Brunswik, E., Levinson, D. J., & Sanford, R. N. (1950). The authoritarian personality. New York, NY: Harper.

JOURNAL OF GLOBAL SCHOLARS OF MARKETING SCIENCE 75
Ajzen, I., & Fishbein, M. (1977). Attitude-behavior relations: A theoretical analysis and review of empirical research. Psychological bulletin, 84, 888.
Bahaee, M., & Pisani, M. J. (2009). Iranian consumer animosity and US products: A witch’s brew or elixir? International Business Review, 18, 199–210.
Bawa, A. (2004). Consumer ethnocentrism: CETSCALE validation and measurement of extent. Vikalpa, 29, 43–58.
Caruana, A., & Magri, E. (1996). The effects of dogmatism and social class variables on consumer ethnocentrism in Malta. Marketing Inelegance and Planning, 14, 39–44.
Chowdhury, T. A. (2013). Understanding consumer ethnocentrism in developing countries: Case Bangladesh. Journal of Global Marketing, 26, 224–236.
Chryssochoidis, G., Krystallis, A., & Perreas P. (2007). Ethnocentric beliefs and country-of origin (COO) effect. Impact of country, product and product attributes on Greek consumers’ evaluation of food products. European Journal of Marketing, 41, 1518–1544.
Cui, A. P., Wajda, T. A., & Hu, M. Y. (2012). Consumer animosity and product choice: Might price make a difference? Journal of Consumer Marketing, 29, 494–506.
Douglas, S., & Nijssen, E. (2003). On the use of ‘‘borrowed’’ scales in cross-national research: a cautionary note. International Marketing Review, 20, 621–642.
Durvasula, S., Andrews, J. C., & Netemeyer, R. G. (1997). A cross-cultural comparison of consumer ethnocentrism in the United States and Russia. Journal of International Consumer Marketing, 9, 73–93.
Fernández-Ferrín, P., Bande-Vilela, B., Klein, J. G., & Río-Araújo, M. L. D. (2015). Consumer ethnocentrism and consumer animosity: Antecedents and consequences. International Journal of Emerging Markets, 10, 73–88.
Fornell, C., & Larcker, D. F. (1981). Structural equation models with unobservable variables and measurement error: Algebra and statistics. Journal of Marketing Research, 18, 382. doi: 10.2307/3150980.
Ganideh, S. A. (2012). Can consumer ethnocentrism assist the competitiveness of Jordanian local olive oil? A fuzzy logic based analysis study. Competition Forum, 10, 94–104.
Good, L. K., & Huddleston, P. (1995). Ethnocentrism of Polish and Russian consumers: Are feelings and intentions related. International Marketing Review, 12, 35–48.
Horn, J. L. (1965). A rationale and test for the number of factors in factor analysis. Psychometrika, 30, 179–185.
Hsu, J., & Nien, H. P. (2008). Who are ethnocentric? Examining consumer ethnocentrism in Chinese societies. Journal of Consumer Behaviour, 7, 436–447.
Hulland, J. (1999). Use of partial least squares (PLS) in strategic management research: A review of four recent studies. Strategic Management Journal, 20, 195–204.
Jiménez-Guerrero, J. F., Gázquez-Abad, J. C., & Linares-Agüera, E. del C. (2014). Using standard CETSCALE and other adapted versions of the scale for measuring consumers’ ethnocentric tendencies: An analysis of dimensionality. Business Research Quarterly, 17, 174–190.
Jo, M. S. (1998). Contingency and contextual issues of ethnocentrism-pitched advertisements: A cross-national comparison. International Marketing Review, 15, 447–457.
Josiassen, A., Assaf, A. G., & Karpen, I. O. (2011). Consumer ethnocentrism and willingness to buy. International Marketing Review, 28, 627–646.
Kamaruddin, A. R., Mokhlis, S., & Othman, M. N. (2002). Ethnocentrism orientation and choice decisions of Malaysian consumers: The effects of socio-cultural and demographic factors. Asia Pacific Management Review, 7, 553-572.
Khan, M., & Rizvi, S. (2008). Consumer ethnocentrism: Relevance and implications for marketers. Journal of Consumer Behavior, 3, 52-65.
Kipnis, E., Kubacki, Broderick, A. J., Siemieniako, D., & Pisarenko, N. L. (2012). They don’t want us to become them: Brand local integration and consumer ethnocentrism. Journal of Marketing Management, 28, 836–864.
Klein, J. G., Ettenson, R., & Morris, M. D. (1998). The animosity model of foreign product purchase: An empirical test in the people’s Republic of China. Journal of Marketing, 62, 89–100.
76 T. P. TRAN ET AL.
Kwak, H., Jaju, A., & Larsen, T. (2006). Consumer ethnocentrism offline and online: The mediating role of marketing efforts and personality traits in the United States, South Korea, and India. Journal of the Academy of Marketing Science, 34, 367–385.
Lantz, G., Nguyen, T. M. T., & Tang, V. K. (2002). National identity, consumer ethnocentrism and product preferences in Vietnam. Asia Pacific Advances in Consumer Research, 5, 169–173.
Levine, R. A., & Campbell, D. T. (1972). Ethnocentrism: Theories of conflict, ethnic attitudes, and group behavior. New York, NY: Wiley.
Luque-Martinez, T., Ibanez-Zapata, J. A., & del Barrio-Garcia, S. (2000). Consumer ethnocentrism measurement-An assessment of the reliability and validity of the CETSCALE in Spain. European Journal of Marketing, 34, 1353–1374.
Marcoux, J., Filiactrault, P., & Cheron, E. (1997). The attitude underlying preferences of young urban educated polish consumers towards product made in western countries. Journal of International Consumer Marketing, 9, 5–29.
Mavondo, F. T., & Tan, A. (1999). Reconceptualizing the CETSCALE (Consumer Ethnocentric Tendency Scale). Proceedings of Australia New Zealand Marketing Academy Conference 1999: Marketing in The Third Millennium. University of New South Wales, Sydney, Australia.
Mittelstaedt, J., Hopkins, C., Raymond, M. A., & Duke, C. (2004). Perceived differences among countries: Understanding relative perceptions. Journal of International Consumer Marketing, 17, 7–31.
Netemeyer, R. G., Durvasula, S., & Lichtenstein, D. R. (1991). A cross-national assessment of the reliability and validity of the CETSCALE. Journal of Marketing Research, 28, 320–327.
Neuliep, J. W., & McCroskey, J. C. (1997). The development of a U.S. and generalized ethnocentrism scale. Communication Research Reports, 14, 385–398.
Nguyen, T. L. (2011). Consumer ethnocentrism and willingness to buy foreign products: Cases of toddler milk powder, pharmaceuticals and fruits. Journal of Science and Technology Development, 14, 40–55.
Nijssen, E. J., Douglas, S. P., & Bressers, P. (1999). Attitudes toward the purchase of foreign products: Extending the model. Retrieved on November 17, 2015 from http://pages.stern.nyu.edu/~sdouglas/rpubs/attitudes.html.
Pereira, A., Hsu, C. C., & Kundu, S. (2002). A cross-cultural analysis of ethnocentrism in China, India, and Taiwan. Journal of International Consumer Marketing, 15, 77–90.
Qing, P., Lobo, A., & Chongguang, L. (2012). The impact of lifestyle and ethnocentrism on consumers’ purchase intentions of fresh fruit in China. Journal of Consumer Marketing, 29, 43–51.
Ramayah, T., Mohamad, O., Chee Young, N., & May Chuin, L. (2011). Testing dimensionality of the consumer ethnocentrism scale (CETSCALE): Assessing reliability and validity in a multicultural context. Australian Journal of Basic and Applied Sciences, 5, 325–334.
Rosenbaum, M. S., & Wong, I. A. (2009). Modeling customer equity, SERVQUAL, and ethnocentrism: A Vietnamese case study. Journal of Service Management, 20, 544–560.
Saffu, K., & Walker, J. (2005). An assessment of the consumer ethnocentric scale (CETSCALE) in an advanced and transitional country: The case of Canada and Russia. International Journal of Management, 22, 556–571.
Shah, K. A. M., & Halim, H. A. (2011). The influence of demographic profiles on consumer animosity, ethnocentrism and patriotism. International Journal of Current Research, 3, 200–208.
Sharma, P. (2015). Consumer ethnocentrism: Reconceptualization and cross-cultural validation. Journal of International Business Studies, 46, 381–389.
Sharma, P., Shimp, T. A., & Shin, J. (1995). Consumer ethnocentrism: A test of antecedents and moderators. Journal of the Academy of Marketing Science, 23, 26–37.
Shimp, T. A. (1984). Consumer ethnocentrism: The concept and a preliminary empirical test by Terence A. Shimp. Retrieved on April 30, 2015, from http://www.acrwebsite.org/volumes/6259/volumes/v11/NA-11
Shimp, T. A., & Sharma, S. (1987). Consumer ethnocentrism: Construction and validation of the CETSCALE. Journal of Marketing Research, 24, 280–289.
Siemieniako, D., Kubacki, K., Gliska, E., & Krot, K. (2011). National and regional ethnocentrism: A case study of beer consumers in Poland. British Food Journal, 113, 404–418.
JOURNAL OF GLOBAL SCHOLARS OF MARKETING SCIENCE 77
Spillan, J. E., & Harcar., T. (2013). A comparative study of patriotism, protectionism, social economic conservatism between Indian and Vietnamese consumers: The effects of these constructs on buying inclinations. Eurasian Journal of Business and Economics, 6(12), 1–26.
Sumner, W. (1907). Folkways: A study of the sociological importance of usages, manners, customs, mores, and morals. Boston, MA: Ginn and Co.
Teo, P. C., Mohamad, O., & Ramayah, T. (2011). Testing the dimensionality of consumer ethnocentrism scale (CETSCALE) among young Malaysian consumer market segment. African Journal of Business Management, 5, 2805–2816.
U.S. Department of State. (2015). Investment climate statement – Vietnam. Retrieved on April 30, 2015 from http://www.state.gov/e/eb/rls/othr/ics/2013/204760.htm
Verlegh, P. W. J. (2007). Home country bias in product evaluation: The complementary roles of economic and sociopsychological motives. Journal of International Business Studies, 38, 361–373.
Wang, W., He, H., & Li, Y. (2013). Animosity and willingness to buy foreign products: Moderating factors in decision-making of Chinese consumers. Asia Pacific Business Review, 19, 32–52.
Warshaw, P. R. (1980). A new model for predicting behavioral intentions: An alternative to Fishbein. Journal of Marketing Research, 17, 153–172.
Wei, Y., Wright, B., Wang, H., & Yu, Ch. (2009). An evaluation of the consumer ethnocentric scale (CETSCALE) among Chinese consumers. International Journal of Global Management Studies, 1, 18–31.
World Bank (2015). Vietnam data. Retrieved on April 30, 2015 from http://data.worldbank.org/country/vietnam
Yu, J., & Albaum, G. (2002). Sovereignty change influences on consumer ethnocentrism and product preferences: Hong Kong revisited one tear later. Journal of Business Research, 55, 891–899.