Annual Report 2019/20 - Goulburn Murray Water
148
Annual Report 2019/20
-
Upload
khangminh22 -
Category
Documents
-
view
0 -
download
0
Transcript of Annual Report 2019/20 - Goulburn Murray Water

Annual Report 2019/20

ISSN 2200-9469
Copyright – State of Victoria, Goulburn-Murray Water Rural Water Corporation trading as Goulburn-Murray Water, 2020. This publication is copyright. No part may be reproduced by any process except in accordance with the provisions of the Copyright Act 1968.
Disclaimer:
This publication may be of assistance to you however, Goulburn-Murray Water and its employees do not guarantee that the publication is without flaws of any kind or is wholly appropriate for your particular purposes and therefore disclaims all liability for any error, loss or consequence which may arise from you relying on any information in this publication.

2019/20 Goulburn-Murray Water Annual Report 3
Responsible Body’s DeclarationIn accordance with the Financial Management Act 1994, I am pleased to present Goulburn-Murray Rural Water Corporation’s Annual Report for the year ending 30 June 2020.
Diane James AM Chairman
Goulburn-Murray Water
3 September 2020
AcknowledgementGoulburn-Murray Water (GMW) proudly acknowledges the lands
of Yorta Yorta, Dja Dja Wurrung, Taungurung and Gunnaikurnai,
which are within the GMW region and pays respects to their
elders past and present.
GMW acknowledges Aboriginal people as Australia’s first
peoples, and as the Traditional Owners and custodians of the land
and waterways where we work and live.
We recognise and value the ongoing contribution of Aboriginal
people and communities to Victorian life, and how this enriches
us all.
We recognise that Aboriginal cultures and communities are
diverse, and the value we gain in celebrating these cultures and
communities.
We acknowledge that the land is of spiritual, cultural and
economic importance to Aboriginal people.
We recognise the intrinsic connection of Traditional Owners to
Country and acknowledge their contribution in the management
of land, water, the natural landscape and our built environments.

2019/20 Goulburn-Murray Water Annual Report 4
SECTION 1: YEAR IN REVIEW
Vision and Values
Chairman and Managing Director’s Report
Manner of Establishment and the Responsible Minister
Nature and Range of Services Provided
Purpose, Functions, Powers and Duties
Coronavirus (COVID-19)
Transformation Working Plan
Strategic Plan
Performance Reporting – Financial
Table of Contents
SECTION 2: GOVERNANCE AND ORGANISATIONAL STRUCTURE
Organisational Structure
Our Business Units
Board of Directors
Occupational Health and Safety
48
48
49
55
SECTION 3: WORKFORCE DATA
Public Administration Values and Employment Principles
Comparative Workforce Data
Workforce Inclusion Policy
People and Culture Strategy
Executive Officer Data
56
56
56
57
59
SECTION 4: OTHER DISCLOSURES
FINANCIAL STATEMENTS
Financial Statements 2019/20
Notes to the Financial Statements
75
79
APPENDICES
5
48
56
60
74
128
5
6
8
8
9
11
11
12
38

YEAR IN REVIEW GOVERNANCE AND ORGANISATIONAL STRUCTURE
2019/20 Goulburn-Murray Water Annual Report 5
WORKFORCE DATA OTHER DISCLOSURES FINANCIAL STATEMENTS
Vision and ValuesVisionGMW’s vision of ‘Delivering for our region and our future’
recognises the significant role we have in contributing to the
prosperity of our region. We do this by providing essential rural
water services to our customers at an affordable long-term
cost1. We take pride in knowing that we are custodians of the
infrastructure and services that form such an integral component
of economic activity in our region.
Our five Strategic Outcomes, listed below, reflect our corporate
aspirations.
• Safe, skilled, engaged people
• Satisfied customers, trusting partners
• Innovation, data and technology driven services
• Sustainable business, viable customers
• Water security and other water values are
recognised
ValuesCore values are essential and enduring principles of an
organisation, which underpin our culture and provide a filter for
employees to measure their actions and behaviours. Accordingly,
GMW has committed to the following organisational values that
will guide our culture:
Excellence
We pursue quality, innovation and continuous
improvement in everything we do.
Honesty We are truthful and transparent in all our
dealings and communications.
Accountability
We take responsibility and ensure we follow
through on all our commitments.
Courage
We take considered risks and step forward with
conviction into a new future.
Caring
We look out for each other and demonstrate
genuine empathy for our customers.
1. In November 2019 we submitted our Pricing Submission for 2020 – 2024 to the Essential Services Commission. Our submission captured the views of customers across all segments and relevant stakeholders and proposes A Fairer Deal for All. The ESC approved the submission in June 2020 following public consultation.

YEAR IN REVIEW GOVERNANCE AND ORGANISATIONAL STRUCTURE
2019/20 Goulburn-Murray Water Annual Report 6
WORKFORCE DATA OTHER DISCLOSURES FINANCIAL STATEMENTS
Chairman and Managing Director’s ReportWhat a year this has been for our region. Climate change has
delivered drought and raging bushfires, and the coronavirus
(COVID-19) has delivered a pandemic. These have created
significant social and economic impacts for our communities.
They have challenged GMW too. However, we are pleased to
report that based on a sound vision and strong leadership, the
business has reached a new level of achievement and a new level
of resilience. We have demonstrated the ability to persist when
our approach was right, to be agile and adapt as circumstances
changed and to transform those aspects of our business for
which transformation was the only appropriate response.
The business and our customers continue to face the challenge
of declining water availability. This year was only the second time
this decade we have fallen below 1,000 GL in Goulburn-Murray
Irrigation Disrict (GMID) deliveries, reaching record low delivery
levels that were last seen in the Millennium Drought. Our 2019/20
water deliveries were down over 50% on the year prior, which
was already a relatively poor year for water availability. Facing
a future of uncertain water availability means that GMW has
focussed on increasing efficiency of water delivery, maintaining
service levels in low flow environments and controlling costs.
GMW’s approach to designing, building and delivering
infrastructure to meet the needs of our irrigating communities
has been sound and we have persisted with that approach. The
$2 billion Connections Project remains on-track for completion
in October 2020. In 2019, the Project installed nearly 100km of
pipeline, decommissioned more than 250km of channel, and
worked with almost 1500 landowners to efficiently connect them
to the upgraded irrigation network. This has increased the water
savings total to 420 GL/year (subject to audit and verification).
This year we also delivered $3.8 million in Information and
Communication Technology enhancements, and a $11.6 million
Capital Works program across our delivery network. The
maintenance works, undertaken ahead of the irrigation season
which opened in August, keep the delivery system running
efficiently to meet irrigation demands. Persisting with this
approach to regular, important maintenance and refurbishment
work continues to ensure the adaptability of our networks. The
2019/20 works were mainly undertaken by local businesses and
regional contractors, so they also delivered a much needed boost
to our regional economy.
Our ability to adapt has been well tested by the drought, bushfires
and COVID-19. In uncertain and rapidly escalating circumstances
we had one day in March in which to run a test and operate the
business remotely. We found our system was robust and we were
well prepared. From that success we almost immediately closed
our doors and began to service our customers from our homes.
Achieving this required the rapid deployment of new approaches
and higher levels of trust and autonomy for our teams. This
success has demonstrated the willingness of our people to
embrace many new ways of working while still maintaining our
commitment to delivering outstanding customer service at every
touch point.
GMW’s 2020-24 Pricing Submission embraced the need to adapt
the way we engage with our customers. We broadened our range
of methods, strengthened our inclusiveness and raised our level
of transparency. This was well received by customers, as were
the outcomes.
We took the opportunity to go back to first principles and consider
our business model – what we do, how we achieve that and where
we can improve. A restructure of our internal resources has
delivered significant efficiencies. Through an Early Retirement
Program combined with natural attrition, our workforce has
reduced in size from 654 to 552 (total headcount). This has
enabled us to redirect our resources to the areas that matter
most.

YEAR IN REVIEW GOVERNANCE AND ORGANISATIONAL STRUCTURE
2019/20 Goulburn-Murray Water Annual Report 7
WORKFORCE DATA OTHER DISCLOSURES FINANCIAL STATEMENTS
We have aggressively reduced our future operating expenditure
and created asset management systems, such as the Channel-
by-Channel assessment, that optimise our assets. This has
enabled us to budget for a modest capital spend in the coming
four-year term of about $25 million per annum.
This organisational transformation that has been driven from
the top down and embraced from the bottom up is the strongest
driver of GMW’s resilience. The revenue requirement for our
2020-2024 Pricing Submission is $439.5 million. This is $65
million lower than that approved in the previous pricing period
and an average reduction of $16 million per year, allowing us to
deliver much needed price relief to almost all of our customers.
These achievements announce GMW as a renewed and resilient
business. We have set the foundations to deliver – for our
customers, our communities and our region. Reassured by our
strength in 2019/20, we look forward confidently to delivering the
next steps in our renewal in 2020-21.
Diane James AM
Chairman
Charmaine Quick
Managing Director

YEAR IN REVIEW GOVERNANCE AND ORGANISATIONAL STRUCTURE
2019/20 Goulburn-Murray Water Annual Report 8
WORKFORCE DATA OTHER DISCLOSURES FINANCIAL STATEMENTS
Manner of Establishment and the Responsible MinisterGMW is a statutory Corporation constituted by Ministerial Order
under the provisions of the Water Act 1989. The relevant Minister
for the period from 1 July 2019 to 30 June 2020 was The Hon. Lisa
Neville MP, Minister for Water.
Nature and Range of Services ProvidedDeliver water to our region:
• provide water storage and delivery services in northern
Victoria as the Minister’s appointed storage manager
• provide water to our customers within agreed service
standards
• manage customer accounts, including fees and charges
• monitor compliance and appropriate usage of water
allocation
• Minister’s delegate for licensing groundwater and surface
water diversions and private dams, and for functions related
to water shares, allocation and water use in regulated
systems.
Monitor the quality of our water:
• monitor salinity and algae levels for public safety and
irrigation use
• ensure developments (proposed planning applications) do
not affect the quality and/or quantity of water.
Build and maintain infrastructure:
• build, provide and maintain infrastructure to support water
storage and delivery
• deliver on the Victorian and Commonwealth Governments’
commitment to modernise and maintain water delivery
infrastructure to improve water delivery efficiency
• provide drainage services with GMW drains to remove
excess runoff.
Manage our water supply:
• allocate water to meet our region’s needs within our
delegation as the northern Victorian Resource Manager,
making the seasonal determinations for all northern
Victorian declared water systems
• provide water registry services for water trading
• plan for the future to safeguard and maximise the
diminishing water resource
• support Government policy development and
implementation regarding water resource management.
Support strong and vibrant communities:
• inform and engage the community on water resource
management, including resource availability, general
operations and emergencies, including flood safety
• educate the community in better use of water for improved
sustainability
• facilitate recreational use on and around our lakes and
reservoirs
• provide feedback to Governments on their policies and the
impacts on the diverse needs of our community.
Legislative and reporting requirements:
• comply with legislative requirements under the Act and
other relevant governing legislation
• meet reporting obligations to Government in accordance
with statutory requirements
• set prices to collect revenue for GMW’s prescribed and
non-prescribed services
• comply with the regulator’s requirements for setting water
prices.

YEAR IN REVIEW GOVERNANCE AND ORGANISATIONAL STRUCTURE
2019/20 Goulburn-Murray Water Annual Report 9
WORKFORCE DATA OTHER DISCLOSURES FINANCIAL STATEMENTS
Purpose, Functions, Powers and Duties
About usGMW is a statutory Corporation constituted by Ministerial Order
under the provisions of the Water Act 1989. An Independent Board
of Directors (the Board) governs GMW. The Board operates under
part 6 of the Act and reports annually to the Minister for Water
and the Treasurer.
We are ultimately accountable to the Minister for Water and
have functions and powers under the Act to provide, manage
and operate an irrigation district (pursuant to section 221 of the
Act), a water district (pursuant to section 163 of the Act) and a
waterway management district (pursuant to section 189 of the
Act).
We are Australia’s largest rural water corporation and manage
Australia’s largest irrigation delivery network. The irrigated
agriculture sector in northern Victoria alone generates more than
$6 billion of production value annually and directly supports over
10,000 jobs in the GMID.
GMW manages water related services in a region of 68,000
square kilometres, bordered by the Great Dividing Range in
the south and the River Murray in the north, stretching from
Corryong in the east down river to Nyah. We have more than
20,0001 customers using over 39,000 services in northern Victoria.
We manage 24 water storages that can hold approximately 11
million ML of water and also have responsibility for managing
more than 100,000 hectares of public land surrounding our
storages.
GMW is the northern Victorian Resource Manager appointed by
the Minister for Water and is responsible for making the seasonal
determination for all northern Victorian declared water systems.
GMW is a partner in the Victorian Water Register, which manages
more than $7 billion of water entitlements and over $300 million
in water share and allocation trade for Victoria.
We are Victoria’s largest inland boating authority and manage
boating and recreational activities across the majority of our
storages. In addition, we service and supply a diverse range of
Urban Water Authorities, Catchment Management Authorities
(CMAs) and the Murray-Darling Basin Authority (MDBA).
GMW maintains recreational infrastructure and services and
manages safe boating access at 15 of our 24 storages. The
non-prescribed management portfolio includes 722 houseboat
licences, 11 caravan park leases and 63 clubs. To varying
degrees, all the dams managed by GMW are available to
the public for recreational use such as boating, fishing and
swimming. The 71 recreation reserves located around GMW and
MDBA storages are funded by GMW, the MDBA and partly or fully
by local Government.
We are also delivering the $2 billion Connections Project
(the Project), funded by the Victorian and Commonwealth
governments. This is the most significant upgrade to the region’s
irrigation infrastructure in its 100-year history and is the largest
irrigation modernisation project in Australia.
The Project will automate much of the water delivery network,
replace ageing irrigation infrastructure, enhance measurement
accuracy through installing modernised meters and ensure
equitable access to maintain the true value of water. The
Project will also reduce the GMID footprint and make water
use sustainable by preparing us for future challenges and
opportunities. The project has created hundreds of jobs for
local contractors, designers, manufacturers and other irrigation
industry businesses.
Statutory PlanningIn 2019/20, 1,703 planning applications were referred to GMW
and a further 14 Planning Scheme Amendment submissions were
received. Under the Planning and Environment Act 1987, GMW is
required to respond to matters referred within 28 days or within
the time period determined by the relevant Council.
The GMW Statutory Planning Section is also involved in
developing Domestic Wastewater Management Plans (DWMP) for
Councils largely within Special Water Supply Catchments across
regional Victoria. Within GMW’s area of jurisdiction, 20 Councils
have developed DWMPs over recent years. During 2019/20, GMW
continued to work with Councils to develop and update the plans
where required.
1. Based on single customer view as at 30 June 2018.

YEAR IN REVIEW GOVERNANCE AND ORGANISATIONAL STRUCTURE
2019/20 Goulburn-Murray Water Annual Report 10
WORKFORCE DATA OTHER DISCLOSURES FINANCIAL STATEMENTS
Functions and PowersGMW has functions and powers under the Act to provide, manage and operate:
• irrigation districts
• water districts
• waterway management districts.
GMW also has responsibilities as a delegate or appointee of the Minister for Water and the Water Registrar pursuant to the Water Act 1989
and the Murray-Darling Basin Act 1993:
• for licensing activities (unregulated streams, groundwater, works on waterways, water use), and approval of water share and allocation
applications
• as storage manager and resource manager for all declared water systems in northern Victoria
• as Victoria’s relevant water authority (constructing authority) for the MDBA
• for recording of certain water share dealings.
Diagram 1: GMW’s operational area
Koondrook
Cohuna
TorrumbarryWeir
Wedderburn
Inglewood
Maryborough
Daylesford
Castlemaine
LoddonWeir
SerpentineWeir
Lake Boga
Kangaroo Lake
Lake Charm
KowSwamp
LaanecoorieReservoir
Cairn CurranReservoir
TullaroopReservoir
HepburnLagoon
NewlynReservoir
BarrCreek
PyramidCreek
BoxCreek
Mount HopeCreek
GunbowerCreek
SerpentineCreek
BullockCreek
BendigoCreek
BullabulCreek
BurntCreek
Bet BetCreek
McCallumCreek
CreswickCreek
BirchCreek
MiddleCreek
JoycesCreek
JimCrowCreek
MucklefordCreek
TullaroopCreek
NationalChannel
Mildura
BullockCreek
Kerang
Swan Hill
Nyah
Shepparton
Cobram
CattanachCanal
Waranga
Basin
Lake Mulwala River Murray
River Murray
Goulburn Weir
Lake Eildon
VioletTown
Benalla
Tatura
Kyabram
GreensLake
Seymour
Kilmore
Yea
Marysville
Alexandra
Mansfield
LochGarry
Katamatite
Nine Mile Creek
Boosey Creek
Broken Creek
Nine Mile Creek
Broken Creek
RyansCreek
HollandCreek
Lim
a Ea
st C
reek
BaddaginnieCreek
BrankeetCreek
Ford Creek
Delatite River
Howqua River
GoulburnRiver
Big River
RubiconRiver
YeaRiver
MurrindindiRiver
TaggertyRiver
AcheronRiver
King ParrotCreek
SundayCreek
Sugarloaf Creek
MajorCreek
WhiteheadsCreek
HughesCreek
HomeCreek
BurntCreek
PranjipCreek
Creightons Creek
StuartMurrayCanalWaranga
WesternChannel
SevenCreeks
CastleCreek
HoneysuckleCreek
LakeNillahcootie
Euroa
Nagambie
Echuca
Bendigo
Elmore
Rochester
Heathcote
Malmsbury
Kyneton
Woodend
LakeEppalock
Mount Pleasant Creek
ForestCreek
AxeCreek
McIvorCreekColiban River
Campaspe River
Campaspe River
PipersCreek
CampaspeWeir
Mt IdaCreek
River Murray
EastGoulburn
MainChannel
Yarrawonga
River Murray
WarangaWesternChannel
CaseysWeir
LoddonRiver
Little Murray River
YarrawongaMain Channel
Broken River
Goulburn River
MyrtleCreek
LittleColiban
River
WildDuckCreek
Trentham
Goulburn River
BeechworthWangaratta
MyrtlefordMoyhu
Bright
Ovens River
KingRiver
Buffalo River
Black Dog Creek
Diddah DiddahCreek Reedy Creek
Burgoigee Creek
BuffaloCreek
BucklandRiver
MorsesCreek
Annie River
CatherineRiver
RoseRiver
Dan
dong
adal
e R
iver
BlackRangeCreek
Hurdle Creek
BoggyCreek
FifteenMile
Creek
Rutherglen
LakeBuffalo
LakeWilliamHovell
KiewaRiver
MittaMittaRiver
Barwidgee Creek
HappyValleyCreek
KingRiver
East branch
West branch
MittaMittaRiver
CorryongTallangatta
Bellbridge
Mount Beauty
Wodonga
Omeo
DartmouthDam
LakeHume
Cudgewa Creek
CorryongCreek
ThowglaCreek
OmeoCreek
BuenbaCreek
BuckwongCreek
MorassCreek Limestone
Creek
LivingstoneCreek
KoetongCreek
TallangattaCreek
SnowyCreek
LittleSnowyCreek
SandyCreek
WombatCreek
Dart River
BigRiver
Bundarrah River
CobungraRiver
Victoria River
East branchWest branch

YEAR IN REVIEW GOVERNANCE AND ORGANISATIONAL STRUCTURE
2019/20 Goulburn-Murray Water Annual Report 11
WORKFORCE DATA OTHER DISCLOSURES FINANCIAL STATEMENTS
Coronavirus (COVID-19)The impacts of the global coronavirus (COVID-19) pandemic have
been significant and far reaching. The impacts have challenged
us all to respond and adjust to a rapidly evolving situation. GMW,
aligned with the advice of Government, has taken unprecedented
measures to maintain the Health and Safety of our people,
customers and community whilst effectively maintaining the
provision of critical services.
In the current COVID-19 situation GMW has adapted to providing
service remotely, which has been well received by both our
customers and staff. While unexpected, it has tested GMW’s
remote working capability with positive results. The specific
actions undertaken as part of GMW’s COVID-19 response have
included:
• ensuring the health and safety of our staff by actively
monitoring wellbeing
• our Customer Contact staff working remotely whilst
maintaining high levels of customer service
• temporarily closing our offices to the public and
encouraging customers to use our online services,
WaterLINE or our contact centre
• our operations teams continuing to monitor the network and
associated infrastructure by working remotely and rostering
their activities to achieve effective social distancing
• our maintenance and construction teams continuing to
perform critical works on the network and implementing
appropriate controls to ensure that social distancing
and other hygiene measures can be achieved. This has
also supported important continuation of work for local
contractors
• over 250 of our staff adapting to effectively work from home,
using our systems and online tools to remain engaged and
connected to the business
• our Board conducting several online briefings and all
scheduled Board Meetings to ensure continuity of effective
Governance.
Supporting the coordinated Government response to the
COVID-19 situation, GMW provided rent relief on leases and
licences for non-prescribed services to the value of $451,847 for
2019/2020. GMW is currently seeking reimbursement for this
from the Department of Environment, Land, Water and Planning
(DELWP).
GMW will continue monitoring the developments of the COVID-19
pandemic and adjust our operations as needed to ensure the
ongoing safety of our customers and staff, while continuing to
provide effective customer service.
Transformation Working PlanThe GMW Transformation Working Plan (TWP) was adopted
in February 2019, in response to the recommendations of the
Strategic Advisory Panel (SAP) report published in January
2018. An audit of progress against the SAP recommendations
shows that GMW has successfully completed (or addressed) 22
of the recommendations, with four scheduled for completion in
the short term and the remaining four long term actions to be
addressed through our new Strategy Framework. Development
of the TWP included extensive external and internal analysis
by GMW with a focus on delivering reliable water services to
our customers at efficient and affordable prices. At the core
of our business challenges is the need to identify a financially
sustainable pathway to finance the costs associated with
replacing, maintaining and operating our extensive network of
infrastructure.
GMW has made significant progress on implementing the TWP
throughout 2019/20. Many of the initiatives completed have
contributed to the material reduction in costs within the business,
which results in price reductions for the majority of GMW’s
customers in 2020/21. The notable achievements during the
period include:

YEAR IN REVIEW GOVERNANCE AND ORGANISATIONAL STRUCTURE
2019/20 Goulburn-Murray Water Annual Report 12
WORKFORCE DATA OTHER DISCLOSURES FINANCIAL STATEMENTS
• Culture and leadership – GMW has established a People and
Culture strategy to continually enhance our organisational
maturity, overseen by the People and Culture Committee of
the Board
• Financial – GMW, through engagement with our customers,
developed and submitted a Pricing Submission which
resulted in a landmark reduction in revenue requirement
and enabled price reductions to be realised for most
customers
• Organisational resources – GMW delivered a significant
adjustment to our business structure to align to the
strategic objectives of the business
• Asset management approach – GMW has completed
a comprehensive update of our Dams Portfolio Risk
Assessment. This process informs our future investment
plans for Water Storage Services. GMW has also further
developed a data driven Channel-by-Channel tool, which
is used to support investment decisions in the Gravity
Irrigation business
• Digital Strategy – GMW has developed a four-year Digital
Strategy that is aimed at achieving the vision that “Our
services are supported by innovative, efficient and customer
and people focused digital solutions”
• Communication and engagement – GMW has progressed
implementation of our Communication, Engagement
and Partnerships Strategy to enhance our customer and
stakeholder experience.
Strategic PlanIn 2019/20, the Board and the Executive Leadership Team worked
together to develop a strategy framework that will allow us to
meet the various expectations of GMW. These include addressing:
• the significant challenges confronting delivery of rural water
services
• the expectations of GMW made clear in the Victorian
Government’s Water for Victoria policy direction
• the imperative for business transformation as per GMW’s
Transformation Working Plan adopted in February 2019
Central to the strategy framework is GMW’s vision – ‘Delivering
for our region and our future’ - supported by five Strategic
Outcomes. The Strategic Outcomes have been developed to
express the key aspirations for our organisation.
The framework is completed by the identification of key strategies
which will progressively be presented to the Board for approval
during 2020/211. Implementing these strategies will provide clear
direction and alignment of organisational resources.
The Strategy Framework, illustrated below, demonstrates our
Vision, Values and the alignment of our Strategic Outcomes with
the Board endorsed strategies.
1. The People & Culture Strategy and the Communication, Engagement and Partnerships Strategy have already been approved by the Board.

YEAR IN REVIEW GOVERNANCE AND ORGANISATIONAL STRUCTURE
2019/20 Goulburn-Murray Water Annual Report 13
WORKFORCE DATA OTHER DISCLOSURES FINANCIAL STATEMENTS
Performance Reporting – Non-FinancialThis Annual Report evaluates our performance against our
corporate priorities and our progress towards the activities
and deliverables of the organisation as set out in our 2019/20
Corporate Plan. This report describes how GMW is delivering on
our commitments to Government and regulatory authorities, our
customers, staff and communities.
Performance against the Minister’s Letter of Expectations Key Performance IndicatorsGMW is focusing our attention on improving performance in
relation to the Minister’s Letter of Expectations. The information
on the following pages provides GMW’s performance against the
key performance indicators relevant to the priority areas as set
out in Water for Victoria. Appendix C contains detailed information
on measures and definitions as described in the Minister’s Letter
of Expectations.
Climate ChangeClimate change is a critical challenge that is affecting both
our environment and our communities. GMW is committed to
minimising our environmental impacts and mitigating climate
change through implementing adaptation strategies and actions.
Delivering for our region and our future
Diagram 2: Strategy Framework
Safe, skilled, engaged, people
People & Culture StrategySafety Strategy
OUR STRATEGIC OUTCOMES
BOARD ENDORSED STRATEGIES
Satisfied customers, trusting partners
GMW Service StrategyCommunications, Engagement & Partnership Strategy
Innovation, data and technology driven services
Digital Transformation Strategy
Sustainable business, viable customers
Asset Management StrategyFinancial Sustainability Strategy
Water security and other water values are recognised
Water Resources StrategyEnvironmental Sustainability StrategyAboriginal Water StrategyLand and On Water Strategy

YEAR IN REVIEW GOVERNANCE AND ORGANISATIONAL STRUCTURE
2019/20 Goulburn-Murray Water Annual Report 14
WORKFORCE DATA OTHER DISCLOSURES FINANCIAL STATEMENTS
Emissions Reductions
GMW currently has very low emissions when compared to most
other Victorian water corporations. GMW has a unique emissions
profile as the majority of our water supplied is delivered through
gravity irrigation systems. As we modify and upgrade our water
delivery infrastructure we will monitor changes to emissions and
identify the responses necessary to achieve our target.
GMW has a program to ensure our emissions reduce, and has
pledged to reduce CO2 emissions by 20 per cent below the five-
year average up to 2015/16 to approximately 10,400 tonnes CO2
emissions by July 2025, inclusive of MDBA assets. GMW aspires
to achieve zero Scope 2 emissions by the pledge target date of
2050 through continuous improvement and renewable energy
initiatives. In 2019/20 GMW had a target reduction to 11,799
tonnes of CO2 emissions. The total of CO2 emissions for the
year reached 9,577 tonnes. Purchase of green power, decreased
electricity usage at GMW’s staffed locations and use of video
conferencing has contributed to a lower total net greenhouse gas
emission for 2019/20.
GMW will continue to look at investing in initiatives to reduce
emissions which will include but not be limited to:
• review of our vehicle fleet to reduce vehicle numbers and
increase fuel efficiencies, including introducing hybrid
vehicles to the fleet
• modernising water delivery infrastructure (remote
operations to reduce travel)
• investigating solar array installation at GMW offices and
assets
• implementing efficiency programs across all GMW-owned
buildings, including LED lighting upgrades and auditing
buildings to identify areas to be improved.
Climate AdaptationGMW applies the recommendation from Guidelines for Assessing
the Impact of Climate Change on Water Supplies in Victoria (DELWP,
2016) for our storage inflow statistics, seasonal determination
outlooks, public engagement and longer term research planning
for surface water and groundwater resources. In 2019/20, all
outlooks for seasonal determinations used climate-adjusted data
to ensure resource availability was not overstated.
GMW began preparing our Water Resources Strategy in 2019/20
to address the challenges of climate change and more variable
water availability amid changing demand characteristics. The
strategy, to be completed in 2020/21, will outline how GMW will
ensure the resilience of our business, customers, stakeholders
and communities. The strategy will also consider how best
to update GMW’s current low-flow contingency measures
for the expected changes to future water availability. The
current contingency measures are based on the lessons of
the Millennium Drought and the Water Resources Strategy
is intended to bring greater agility to GMW service plans and
business operations. Anticipated guidelines from the DELWP
Water Resource Strategy division will aid the GMW update.
Preparation of GMW Climate Change Adaptation Action Plan,
delayed in 2019/20 due to urgent input to inter-valley trade rule
adjustments and Connections Project Stage 1 entitlements, is
another intended outcome of the Water Resources Strategy for
2020/21.
Customer and Community Customer Satisfaction
Customers and the community are centrally important at GMW,
so we aim to deliver our services in a way that best meets and
reflects our customers’ needs. GMW supports the standardised
Rural Water Corporation (RWC) Customer Satisfaction Survey as
per the Minister for Water’s Letter of Expectations. Throughout
2019, GMW provided customer data and resources to assist in the
development, proposed methodology and implementation of the
RWC survey. GMW will continue to support DELWP throughout
the implementation phase of this survey. In addition, GMW has
developed and will be carrying out our own customer satisfaction
survey which is due to be rolled out in September/October 2020.
Table 1 outlines additional customer satisfaction goals and
GMW’s achievement against these goals.

YEAR IN REVIEW GOVERNANCE AND ORGANISATIONAL STRUCTURE
2019/20 Goulburn-Murray Water Annual Report 15
WORKFORCE DATA OTHER DISCLOSURES FINANCIAL STATEMENTS
Minister’s Letter of Expectation Key Performance Indicator
Performance1
C1.4 Orders delivered at time agreed (Number of orders delivered/total number of order *100)
Pumped Districts 99% as at 30 June 2020 (target 98%)Gravity Systems 94% as at 30 June 2020 (target 93%)
C1.5 Percentage of applications completed within agreed timeframes2 (Number of applications completed/total number of applications)
99% as at 30 June 2020
C1.6 Rural Bills
C1.6.1 Total rural bill gravity irrigation1 (100 ML irrigation customer)
Shepparton: $9,212Central Goulburn, Rochester and Loddon Valley: $6,835Murray Valley and Torrumbarry: $7,086
C1.6.2 Total rural bill gravity irrigation2 (100 ML irrigation customer)
Nyah: $8,887Tresco: $8,642Woorinen: $8,273
C1.6.3 Total rural bill domestic and stock supply3 (2ML stock and domestic customer)
Normanville: $2,110Tungamah: $1,691East Loddon (South): $1,237East Loddon (North): $957West Loddon: $837
Customer and Community Engagement
The GMW Communications, Engagement and Partnerships
Strategy 2018 ensures our communication and engagement
with customers and stakeholders continually improves.
Implementation of the strategy is now well underway.
During the past year the Your Say campaign drove conversations
with our customers, stakeholders and communities throughout
our region, to gain feedback from all segments in our customer
base. In addition, we conducted an extensive engagement
program, which included a vast suite of activities such as
workshops, drop-in days, meetings, online opportunities
and a three-day, independently facilitated, customer forum.
Information gained from these campaigns was critical in
informing our Pricing Submission, which was accepted by the
Essential Services Commission, virtually without change. This
work is now guiding delivery of the organisation’s services and
prices from 2020-2024.
Water for Aboriginal Cultural, Spiritual and Economic ValuesEngaging with Aboriginal Communities
GMW values the ongoing contribution of Traditional Owners to our
region, and continues efforts to engage with these communities
to achieve mutual benefits through recognising and supporting
Aboriginal cultural values and economic inclusion in the water
sector.
Our engagement activities with Aboriginal communities
throughout the year included meetings between our Managing
Director and both the Taungurung Land and Waters Council
Aboriginal Corporation (TLWCAC) and Yorta Yorta Nation
Aboriginal Corporation (YYNAC).
In a major step forward, an experienced GMW staff member
recently commenced a funded, year-long secondment to work
1. Calculated based on a customer having one domestic and stock and one irrigation service point and using 100ML of water allocation.
2. Calculated based on a customer having one service point and using 100ML of water allocation.
3. Calculated based on based on a small typical customer.
Table 1: 2019/20 Customer satisfaction performance

YEAR IN REVIEW GOVERNANCE AND ORGANISATIONAL STRUCTURE
2019/20 Goulburn-Murray Water Annual Report 16
WORKFORCE DATA OTHER DISCLOSURES FINANCIAL STATEMENTS
with the Yorta Yorta people, strengthening our relationship and
establishing mechanisms to connect our organisations more
strongly. He is now heading the Whole of Country Unit (water,
fire, general natural resource management) and working on
YYNAC’s 10 year strategic Whole of Country Plan. Another key
aspect of his role is to coordinate projects with DELWP, Parks
Victoria, local Government, MDBA, and CMAs. Discussions on
implementing their Recognition and Settlement Agreement
have also commenced with the TLWCAC. The Hume Region’s
Environment Portfolio Group, chaired by the Regional Director of
DELWP, is facilitating the discussions.
Engagement of Traditional Owners
GMW will continue to build capability and understanding through
creating further engagement opportunities with Traditional
Owner Groups on projects to support inclusion of Aboriginal
values in water planning. GMW’s engagement throughout 2019/20
included:
• weed spraying by Djandak (Dja Dja Wurrung Clans
Aboriginal Corporation works crew)
• participating in the Murray Goldfields District Joint Fuel
Management Program Planning Committee in regards to
cultural burns
• working with YYNAC, who would like to complete a cultural
burn on GMW freehold land at Kanyapella Basin
• working on several Cultural Heritage Management Plans.
Aboriginal Inclusion Plan
GMW has developed and is implementing our Aboriginal Inclusion
Plan, with a suite of initiatives identified in areas of employment,
cultural water, procurement, natural resource management and
training.
The overarching objectives for this Aboriginal inclusion plan are
to:
• recognise and include Aboriginal values and traditional
ecological knowledge in water planning
• support Aboriginal access to water for economic
development
• build capacity to increase Aboriginal participation in water
management
• support Aboriginal contractors to realise opportunities
• provide pathways into the water sector for Aboriginal
people.
GMW is building further relationships with local community
leaders to make GMW a preferred place of employment for
Aboriginal peoples. It is further developing working relationships
in partnership with DEWLP’s Hume regions Aboriginal
Employment Group and the Rumbalara Aboriginal Co-Operative.
Recognising Recreational ValuesWhile the majority of GMW’s functions are essential rural water
services, it also performs a number of non-prescribed functions
such as providing recreational facilities across our network of
storages and waterways, for the economic and social benefit of
Victorians. GMW continually engages with local communities,
ensures consistent and reliable information is provided for
recreational sites and drives successful project deliveries to
ensure the safety, functionality and sustainability of these sites.
GMW has delivered a number of site-based projects at storages
to maximise the benefits of recreational use, including:
• following the announcement by Premier Andrews during
the 2018 election that several storages would be opened up
for recreational boating, GMW have worked closely with the
Victorian Fishing Authority and DELWP to open a second
storage (Hepburns Lagoon) to non-powered boating in
August 2019. GMW also assisted Coliban Water in preparing
four of their storages for recreational boating
• GMW partnered with DELWP through their Boosting
Recreational Water Use Initiative to replace outdated
amenity facilities at Lake Eppalock (Randells Cove) and
Lake Eildon (Jerusalem Creek). Additional works under
this scheme included boat ramp upgrades at Lake Eildon’s
Alliance boat ramp and Hutchinson’s Road boat ramp
• works commenced on extension of parking area and
provision of toilet facilities at the Majors Creek boat ramp
at Bundalong on Lake Mulwala. NSW Roads and Maritime
Services provided $150,000 towards these works, with
completion expected in early 2020/21

YEAR IN REVIEW GOVERNANCE AND ORGANISATIONAL STRUCTURE
2019/20 Goulburn-Murray Water Annual Report 17
WORKFORCE DATA OTHER DISCLOSURES FINANCIAL STATEMENTS
• GMW is partnering with Regional Development Victoria
and the Murrindindi Council to upgrade the boat ramp
access into Lake Eildon Marina. The upgrade will provide
safer facilities to launch and retrieve the new, larger
houseboats, which are now being built following changes to
the Houseboat regulations in 2013 to permit construction of
larger houseboats. Planning and design has been completed
and construction will take place over the next 12 months
• the Greens Lake Amenity block was rebuilt, with Victorian
Government ‘Pick my Project’ funding of $185,000
• stage 3 of a large foreshore restoration project (800m) at
Lake Mulwala was completed in late 2019, after stages 1
and 2 were completed in 2015 and 2018. This project was
made possible with the assistance of the MDBA, Moira Shire
Council, Lotus Living and the Commonwealth Government
‘Jobs and Investment’ funding
• the Lake Eildon Masterplan was delivered in partnership
with Regional Development Victoria, Murrindindi Shire
Council, Mansfield Shire Council and Tourism North
East,. The masterplan included detailed business plans to
prioritise projects and investment in the region. GMW will
continue to partner with regional stakeholders to implement
the projects identified in the Masterplan.
In 2019/20 and in line with Water for Victoria actions, GMW has
also:
• continued to conduct Land and On Water Implementation
Groups (LOWIG) meetings across our storages
• collaborated with the Victorian Fisheries Authority (VFA),
Transport Safety Victoria and local communities to open
Hepburns Lagoon to boating and fishing
• participated in the VicWater and DELWP working group
investigating passive boating access to Victorian storages,
which are currently closed to boating
• participated in the Better Boating Victoria study on Regional
Victoria Boating Facilities, and promoted our recreation
customers to participate in the associated survey
• worked with partner organisations to increase public
awareness and safety, most notably Maritime Safety Victoria
• commenced the development of a Land and On Water
Strategy for the business.
Through engagement with communities and stakeholders, GMW
has established a number of Land and On Water Management
Plans (LOWMPs), which consider short, medium and long-term
water resource management and define agreed future actions
for GMW storages. GMW will continue to provide public progress
reporting for these management plans. LOWMPs are currently in
place for Lake Boga, Lake Buffalo, Cairn Curran Reservoir, Lake
Eildon, Lake Eppalock, Green’s Lake, Lake Hume, Lake Mulwala,
Kow (Ghow) Swamp, Lake Nillahcootie, Nagambie Waterways,
Waranga Basin and Lake William Hovell.
Resilient and Liveable Cities and TownsIntegrated Water Management
GMW is a vital part of life in northern Victoria. Our role in
delivering reliable and affordable water drives a regional
economy underpinning our collective prosperity and improving
the wellbeing and daily lives of hundreds of thousands of people.
We understand our role in contributing to healthy communities
by supporting safe, affordable, high quality services and resilient
environments.
GMW is a partner in all the Integrated Water Management
(IWM) Forums across our region, including the Goulburn
Broken, Central Highlands, Coliban, and North East. Within the
Coliban IWM Forum, GMW is the lead agency for the Potential
for Managed Aquifer Recharge Project in the Campaspe Valley
Project. Within the Goulburn Broken IWM Forum, GMW is
contributing to the Liveable Nathalia Plan and the Seven Creeks
Flow Investigation Study. GMW is also a project partner for a
range of projects across all forums.
GMW’s ongoing participation means that we provide expertise to
optimise the outcomes of water cycle planning and management
to achieve environmental, social and economic benefits for our
communities.

YEAR IN REVIEW GOVERNANCE AND ORGANISATIONAL STRUCTURE
2019/20 Goulburn-Murray Water Annual Report 18
WORKFORCE DATA OTHER DISCLOSURES FINANCIAL STATEMENTS
Leadership and CultureThe culture of an organisation begins with effective leadership
across all levels of the organisation. GMW will continue to
invest in our capability and facilities to ensure our people have
the tools necessary to provide the transformational leadership
and collaboration required to embed our values and achieve
our strategic outcome of safe, skilled, engaged people. GMW
is striving to reflect the needs of our diverse communities and
develop strategies and goals that will increase cultural diversity
in the workforce and gender equity in executive leadership.
Diversity and Inclusion
The GMW Diversity and Inclusion Plan outlines activities to
achieve priority areas over the period up to 2020, through best
practice policies and processes driven by leadership. Specific
programs delivered to our staff included Code of Conduct and
Mental Health awareness training. We continue to support a
range of local and water industry programs, initiatives and
groups, including facilitating the secondment of one of our
employees to YYNAC.
In 2019/20 we undertook an in-depth Culture Survey. The
participation rate was 80 per cent, which is a 16 per cent
increase on the most recent survey. The survey reported positive
responses to diversity and inclusion questions, including the
ability to be your authentic self at work, leadership support for
diversity and inclusion, and equal opportunity at GMW.
GMW’s achievements towards our diversity targets during
2019/20 are on page 58.
Board Performance
GMW completes an annual Board performance review to
monitor and improve the Board’s effectiveness in leading
our organisation. GMW submitted the review for the 2019/20
reporting period to the Minister for Water in July 2020. The report
identified the strengths of the Board and actions for continuous
improvement. Completion of the previous year’s actions has had
a positive result on the Board’s ability to lead the organisation.
Our Board remains committed to achieving successful outcomes
for GMW, our customers and key stakeholders.
GMW provides services to customers in peri-urban settings
across the towns and cities in our region. Our engagement
strategy for the Essential Services Commission Pricing
Submission for 2020-2024 sought input from this customer
group. Development of this pricing submission included a range
of customer-focused workshops, drop-in days, online campaigns
and ongoing conversations with our customers and stakeholders.
Payment Management and Hardship
GMW understands that the livelihoods of many customers depend
on the water services that we provide, hence we want to ensure
we maximise our customers’ ability to pay in ways that best serve
customer needs. GMW is striving to improve communication
with our customers to reduce the number of accounts referred
to collection agencies, improving negotiation outcomes, offering
payment arrangements and offering early payment discounts.
We work with our customers on an individual basis to determine
the nature of their financial hardship. This assessment includes
consideration of whether a customer is in receipt of government
payments, the expected period of the hardship, the information
provided by financial counselling services and a range of other
matters. In additional to financial counselling service information,
information on the Plan2Farm program coordinated by the North
Central Catchment Management Authority (NCCMA) is also being
offered.
GMW is committed to ensuring transparent, fair and equitable
debt management principles for our customers, and will continue
to improve access to instalment plans and further understand
hardship trends. The table below outlines our payment
management and hardship figures.
Payment Management Number of accounts
Number of instalment plans at the end of the reporting period
4861
Number of customers awarded hardship grants
0
1. This represents 1.4% of our approximate 34,000 accounts.
Table 2: GMW’s payment management and hardship accounts for the year 2019/20

YEAR IN REVIEW GOVERNANCE AND ORGANISATIONAL STRUCTURE
2019/20 Goulburn-Murray Water Annual Report 19
WORKFORCE DATA OTHER DISCLOSURES FINANCIAL STATEMENTS
GMW’s Board Performance Assessment includes:
• a review of actions from the last assessment
• a review of attendance figures
• a self-assessment questionnaire
• the results of Board Committee self-assessments.
Health and Safety
GMW believes that our people are our greatest asset and
considers the safety and wellbeing of our staff, contractors,
customers and general public as our highest priority. In
2019/20 we have continued to build on our culture of care
and accountability by continuing to focus on developing and
implementing health and safety plans designed to improve
our safety performance. The results of our recent cultural
survey shows our people believe safety is an area where we a
performing well, which reflects the progress we have made in
both safety awareness and engagement.
GMW is currently planning the next stages of safety and
continuous improvement with the development of our 2020-2024
safety strategy. The safety strategy specifically targets both
system and behavioural programs which will further improve
accountability, engagement, system simplicity and staff
wellbeing. Our future focus areas will be around personal safety,
asset safety and safe systems and processes, which will further
enhance our safety performance and capability into the future.
Further information on GMW’s performance against health and
safety indicators is on page 55.
Financial Sustainability At GMW, we understand that our organisational stability
contributes to the success of our customers, and that we must
deliver safe and cost-effective water services in a financially
sustainable manner. Our current regulated pricing regime has
been approved by the ESC, which has a form of price control
termed ‘revenue cap’. This means there is an inherent incentive
to continue to reduce costs to remain below the four-year
revenue limit. The 2019/20 financial year marks the last year of
the 2016 Pricing Submission. As a result of transformation GMW
came in below the four-year revenue cap by $5.5m.
Additionally, GMW is putting in place various actions to reduce
our operating expenditure, including various actions identified
in our Transformation Working Plan, which has enabled GMW to
reduce prices during our Pricing Submission 2020-2024. In line
with our Transformation Working Plan, GMW’s financial objective
is to be financially sustainable in the short and long term.
Financial sustainability requires prices at a level that customers
can afford, the revenue generated is sufficient to provide the
services required, and GMW’s current and forecast debt levels
can be financed.
GMW’s performance against the eight financial indicators (F1-F7)
is within the Performance Report on page 44 and demonstrates
our financial sustainability.
Delivery Share Review
GMW completed the majority of the assigned actions arising from
the 2018 Delivery Share Review (DSR). The key achievements
included:
• integration of DSR requirements throughout the
engagement and consultation processes leading to the final
pricing submission for regulatory period 2020/21 to 2023/24
• provision of additional information to customers about
delivery shares and related topics, including the need to
seek new delivery shares through market mechanisms
• investigation and case studies on conditions to alter delivery
services to align customer requirements and strategic
infrastructure plans
• integration of data and mapping tools to align with Channel-
by-Channel investment plans, customer information
requirements and other mapping projects conducted with
partner agencies.

YEAR IN REVIEW GOVERNANCE AND ORGANISATIONAL STRUCTURE
2019/20 Goulburn-Murray Water Annual Report 20
WORKFORCE DATA OTHER DISCLOSURES FINANCIAL STATEMENTS
Environmental Water Charges
GMW contributed information on water delivery charges to
consultants working for DELWP. Draft policies on charges
for environmental water delivery and bulk water charges
for environmental entitlements were prepared, but formal
consultation during 2019/20 did not occur due to the coronavirus
(COVID-19) pandemic. GMW anticipates DELWP will commence
engagement during 2020/21 and the policies will be in place for
full integration into price determinations from 2023/24.
Share of Connections Stage 1 Water Savings
GMW supported the Irrigators’ Share Consultative Committee,
convened by DELWP and independently chaired by former MP
Paul Weller, in its assessment and evaluation of options for the
distribution of entitlements generated by Connections Project
Stage 1 water savings. The committee met on several occasions
through 2019/20.
The committee comprised Water Services Committee chairs
or representatives and members of the Victorian Farmers
Federation.
GMW supported the public consultation process for seeking
feedback on the committee’s draft recommendations.
Basin Plan
The GMW Connections Project continued to recover water
towards Victoria’s Murray Darling Basin Plan targets through
irrigation infrastructure upgrades. This has increased the water
savings total to 420 GL annually (subject to audit and verification).
Under the Sustainable Diversion Limit Adjustment Mechanism,
GMW is supporting environmental works and measures
coordinated through the $330M Victorian Murray Floodplain
Restoration Project. The project is currently progressing through
a concept development and regulatory approvals phase.
GMW supported the Victorian Government in the completion of
Victoria’s Water Resource Plans, and in the implementation of
interim changes to use of water from tagged accounts.
GMW supplied required annual information to the MDBA about
security of critical human water needs for 2020/21.
GMW was a key partner in the steps to reduce Goulburn inter-
valley trade deliveries to protect the environmental values of the
lower Goulburn River.
GMW and DELWP jointly presented to Murray-Darling Basin
Water Resources Interim Inspector-General’s review of Murray-
Darling Basin water resources management in January 2020.
GMW continued to support water recovery objectives through the
following initiatives:
• Mitiamo Domestic and Stock pipeline project
• preliminary level assessment for the Wakiti Creek Water
Loss Recovery Project.
Victoria secured $14.5 million in Commonwealth co-funding for
the construction of the Mitiamo Domestic and Stock pipeline
project in May 2020. The project, which is estimated to cost $29
million, will recover 1,000 ML for the Commonwealth while
greatly improving water security and service delivery to existing
and potential customers in the central west region of the GMW
management area.
Submission and approval of 2020-24 Pricing Submission
In November 2019 we lodged our Pricing Submission 2020-2024
with the Essential Services Commission. The ESC approved the
submission in June 2020 following public consultation.
Our Pricing Submission 2020-2024 includes significant cost
savings to ensure GMW delivers cost-effective water services.
We have done this by aggressively reducing future operating
expenditure and creating asset management systems, such as
the Channel-by-Channel assessment tool that optimises our
assets.
This has enabled a modest capital spend in the 2020-2024 period
of approximately $25 million per annum. These initiatives have
resulted in a landmark drop in our revenue requirement, from
$504.6 million (during the previous regulatory period) to $439.5
million over the next four years. We are returning these savings
as price reductions of an average of 10 per cent for most of our
customers.
YEAR IN REVIEW GOVERNANCE AND ORGANISATIONAL STRUCTURE
2019/20 Goulburn-Murray Water Annual Report 21
WORKFORCE DATA OTHER DISCLOSURES FINANCIAL STATEMENTS
Our pricing submission was based on extensive engagement with
our customers through workshops, drop-in sessions, summit
meetings and thousands of customer conversations over the past
two years.
Customers have been clear on the outcomes they’re seeking
from us, including:
• Reliable supply – we need our water to stay in the region
• Credible business – we need GMW to be transparent,
honest and trustworthy and have a stable leadership team
• Fair pricing – we need prices that fairly reflect the true use
of infrastructure by all water users (including irrigators,
investors and the environment)
• Efficient operations – we need the business to run lean
enough to deliver affordable prices that support farmers to
stay on the land
• Responsive services – we need GMW people and systems to
deliver the right flow rates in the right timeframes
• Simple systems – we need digital information and
communications systems that are fast and simple (for
customer service, water delivery and billing).
Based on what we have heard from our customer interactions, we
developed proposals that will:
• provide price reductions for almost all our customers
• drive efficiencies and cost reductions (without impacting on
levels of service)
• reprioritise expenditure into the areas that provide
customers with the best value for money
• reform customer tariffs to be simpler and more equitable.

YEAR IN REVIEW GOVERNANCE AND ORGANISATIONAL STRUCTURE
2019/20 Goulburn-Murray Water Annual Report 22
WORKFORCE DATA OTHER DISCLOSURES FINANCIAL STATEMENTS
Performance against Corporate Plan ObjectivesOur 2019/20 Corporate Plan focused on the Transformation Working Plan actions, to deliver on the goals of the organisation. Table 3 shows
how these actions align with GMW’s five Strategic Goals, and outlines the progress made throughout 2019/20. Further information on GMW’s
strategy framework can be found on pages 11-13.
Key Objectives to be achieved in 2019/20 Achievements during 2019/20 Objective met?
Culture and Leadership - Safe, skilled, engaged people
1 GMW will conduct tailored leadership training to ensure our people are equipped with the necessary skills to transform our business.
Aligned to People and Culture Strategy approved by the Board in February 2020. Framework development and modules in progress. Leadership Program module 1 currently being rolled out. Program will be delivered over 2020/21.
Yes
2 GMW will conduct a routine survey to monitor the progress of aligning our culture to a transformed GMW.
Aligned to People and Culture Strategy approved by the Board in February 2020. Delivered June 2020. Outcomes and improvement opportunities will be delivered and monitored until the next survey in April 2021.
Yes
3 GMW will undertake minor works to contemporise employee office accommodation, to promote collaboration and inclusiveness.
Consultation on office accommodation complete. Project now in implementation phase.
Yes
Financial - Sustainable business, viable customers
4 GMW will establish financial reports to monitor implementation of identified operational savings and avoidance in capital programs.
Financial reports showing operating and capital expenditure and variances have been developed for each business unit and service group. These reports are aligned with GMW’s new structure and provide greater transparency and accountability of financials for all levels of the organisation.
Yes
5 GMW will confirm the asset financing requirement in the short term for the Pumped districts of Nyah and Tresco through the Price Submission for the period 2020-2024.
The two districts were assessed at the Channel-by-Channel level. Pricing Submission 2020-2024 will see a basic level of investment in necessary meter and pump station upgrades, as a future strategy is concurrently developed to reflect the unique needs and characteristics of these stand-alone services.
Yes
6 GMW will develop a longer-term Financing Strategy by pricing entity through engagement with Government, customers and the regulator.
Combine this action with the Financial Sustainability Strategy included as part of GMW Strategic Framework.
Partially - Objective included in the Financial Sustainability Strategy
7 GMW will engage with customers on the correction to identified cost allocation methods where the prior justification is considered to have been surpassed.
During the past year the Your Say campaign and other extensive programs drove conversations with customers, stakeholders and communities throughout the region to gain feedback from segments in our customer base. This information is now guiding some major tariff reforms.
Yes
8 GMW will complete a Tariff and Pricing Review leading to the November 2019 Pricing Submission.
An extensive engagement program was conducted and information gained which was critical in informing our Pricing Submission, which was accepted by the Essential Services Commission. This work is now guiding delivery of the organisation's services and prices.
Yes

YEAR IN REVIEW GOVERNANCE AND ORGANISATIONAL STRUCTURE
2019/20 Goulburn-Murray Water Annual Report 23
WORKFORCE DATA OTHER DISCLOSURES FINANCIAL STATEMENTS
Key Objectives to be achieved in 2019/20 Achievements during 2019/20 Objective met?
Non-Prescribed services - Water security and other values recognised
9 Based on the updated financial analysis, GMW will develop individual business plans for each of the non-prescribed activities.
Combine this action with the Land and On Water Strategy included as part of GMW Strategic Framework.
Partially - Objective included in the Land and On Water Strategy
10 GMW will develop a financial distribution policy that defines how profit from non-regulated services will be distributed to parent prescribed services.
Combine this action with the Land and On Water Strategy included as part of GMW Strategic Framework.
Partially - Objective included in the Land and On Water Strategy
11 GMW will develop a position paper to advocate to Government in relation to the following:
• the level of current Regional Urban Storage Ancillary Fee (RUSAF) model for funding capital improvement in General Public Use services
• divestment of individual locations to other agencies (e.g. Greens Lake) or the operation of specific assets
• funding for activities associated with the Waterway Management role
• amendments to legislation to allow the sale of additional Houseboat licenses at Lake Eildon.
Combine this action with the Land and On Water Strategy included as part of GMW Strategic Framework.
Partially - Objective included in the Land and On Water Strategy
Organisational Resources - Sustainable business, viable customers
12 Through consultation GMW will implement a transition strategy to bring into effect organisational structural change whilst supporting our people to transition.
All staff transitioned. Yes
13 GMW will consult on options to consolidate our operations to a reduced number of locations.
Preparation of a Regionalisation Strategy and review of all GMW operational facilities to enable a business case to be developed to deliver a cost effective and operationally functional model moving forward.
Ongoing and on track
14 GMW will complete delivery of the Fleet Management Efficiency Plan, resulting in operational savings.
Review completed and new policy and procedure currently being finalised.
Ongoing and on track
GMW’s Asset Management Approach - Sustainable business, viable customers
15 GMW will develop high level investment plans for each of the 213 individual pods in the GMID to support identification of investment requirements in our next pricing submission.
Pending outcome of Action #16 below regarding the principles that apply to application of agreed service-based and asset investment options for individual pods.
On Track
16 GMW will engage with customer representatives to determine the principles that apply to application of agreed service-based and asset investment options for individual pods.
External engagement planned to commence in August/September to develop principles.
Partially - Minor delay

YEAR IN REVIEW GOVERNANCE AND ORGANISATIONAL STRUCTURE
2019/20 Goulburn-Murray Water Annual Report 24
WORKFORCE DATA OTHER DISCLOSURES FINANCIAL STATEMENTS
Key Objectives to be achieved in 2019/20 Achievements during 2019/20 Objective met?
GMW’s Asset Management Approach - Sustainable business, viable customers
17 GMW will develop a suite of innovative capital and maintenance interventions suited to the different pod categories.
Aligns with Action #16 above. To enable engagement as part of Channel-by-Channel process. Initial interventions will be identified and agreed.
Partially - Minor delay
18 GMW will update the Dam Safety Program based on the outcomes of the updated Portfolio Risk Assessment (PRA) and the newly developed Dams Strategy.
Dam Safety Program based on updated PRA approved by the Board on recommendation from the Service Planning Committee in March 2020. Price modelling to be completed as part of Service Plan development.
Ongoing and on track
19 GMW will revise and publish our dam safety policy statement, including the circumstances in which As Low As Reasonably Practical (ALARP) improvements must be funded by customers through price.
To be included in Asset Management Strategy as part of GMW Strategic Framework.
Partially - Objective included in the Asset Management Strategy
20 GMW will implement the revised asset investment framework which will allow the business to achieve optimal risk allocation and value for money.
The Investment Framework was approved in March 2020.
Yes
21 GMW will implement the identified actions to achieve Asset Management Accountability Framework (AMAF) compliance by 2019/20.
Basic AMAF compliance achieved – the Asset Management Strategy will outline further maturity opportunities.
Yes
System and Process Improvements - Innovation, data and technology driven services
22 GMW will implement a revised decision making framework to eliminate additional processes that slow decision making and are inconsistent with delegated authorities.
Policies, procedures and delegations have been revised and simplified.
Yes
23 GMW will implement a Data and Information Steering Committee (DISC) to focus on improving GMW’s data collection and management and make recommendation on steps necessary to cleanse existing data.
Establishment of DISC was deferred until completion of the Digital Strategy, which was completed in June 2020. A revised date for establishment has been set for 2 October 2020, with associated action tasks and committed dates to be agreed and rescheduled as a part of this.
Ongoing and on track
24 GMW will implement a revised Performance Management System to ensure that the organisation’s activities are clearly aligned to our strategic and operational imperatives.
Over the year, GMW developed and implemented a new Performance Framework to communicate, align and cascade strategic goals through all tiers of GMW. The framework includes a performance management system which allocates individual accountability, tracks achievement of targets and enables leaders to evaluate individual performance.
Yes

YEAR IN REVIEW GOVERNANCE AND ORGANISATIONAL STRUCTURE
2019/20 Goulburn-Murray Water Annual Report 25
WORKFORCE DATA OTHER DISCLOSURES FINANCIAL STATEMENTS
Key Objectives to be achieved in 2019/20 Achievements during 2019/20 Objective met?
Engaging with Customers, Stakeholders and Employees - Satisfied customer, trusting partners
25 GMW will implement the Communication, Engagement and Partnerships Strategy.
Implementation is underway and being monitored by the Customer and Stakeholder Board Committee.
Yes
26 GMW will develop and implement a new Customer Service Strategy that addresses identified service and communication needs of specific customer segments and demographics.
From a strategy development perspective, it was determined a Customer Experience Plan should cascade from the Service Strategy.
Ongoing and on track
27 Broaden our customer engagement - Review the current Water Services Committee (WSC) operating rules
An online engagement plan has been developed and is now being implemented. This has been strengthened by need, through the advent of the coronavirus (COVID-19) and limited opportunities for face-to-face engagement. A suite of information sessions and updates are being complemented by more interactive issue-based engagements with customers across the region.
Ongoing and on track
28 GMW will implement new policies and processes, supported by public information that will result in ‘a simple pathway for potential investors’.
Policy and Procedure in draft form. GMW participating in trial process with Goulburn-Broken CMA.
Ongoing and on track
Table 3: Progress against 2019/20 Corporate Plan Objectives
Performance in OperationsWater DeliveryGMW manages water-related services in a region of 68,000
square kilometres, bordered by the Great Dividing Range in
the south and the River Murray in the north, stretching from
Corryong in the east down river to Nyah. We have more than
20,000 customers using over 39,000 services in northern Victoria.
GMW manages both regulated and unregulated river systems
that flow into the Murray and administers groundwater within
this area.
Our Customers
Table 4 shows our diverse range of customers. GMW is currently
developing a communications plan that recognises our various
customer segments and demographics to more effectively tailor
our messaging. This will further strengthen the improvements
delivered through a suite of new engagement methods, enabling
customers to better participate in GMW decisions.

YEAR IN REVIEW GOVERNANCE AND ORGANISATIONAL STRUCTURE
2019/20 Goulburn-Murray Water Annual Report 26
WORKFORCE DATA OTHER DISCLOSURES FINANCIAL STATEMENTS
Primary Service Segment1
Example Customers Number of Customers1
Revenue as a %
Annual Water Use in GL2
Irrigation • Horticulture, dairy, mixed farming
11,680 58.8 706.1
Domestic and stock
• Rural residential• Mixed farming • Intensive animal
industries (e.g. piggeries)
6,809 2.5 15.1
Environmental watering
• Commonwealth and State environmental water holders
3 9.9 776.1
Bulk water for urban and rural water supply
• Urban water corporations
12 7.6 623.4
Water investment • Investment funds• Agriculture
corporations
1,231 2.5 12.2
Flood protection • Protection of land and property in flood protection districts
30 0.0 0.0
Recreation • Houseboat operators
• Recreation clubs
984 1.4 0.7
Commercial leasing
• Livestock graziers• Forestry
corporations• Caravan parks
17 0.3 0.0
Contract services • MDBA• Local government
and catchment management authorities
• Commercial contracts
335 13.9 1.9
Power generation • Hydroelectric power utilities
13 3.1 0.0
Other • Sundry customers 439 0.1 0.1
Total 21,541 100% 2,135.1 GL
Table 4: Customer numbers by segment
1. The customer segments have been identified using a single customer view methodology that groups customers based on their primary need. For example, if a customer accesses a gravity irrigation service and a domestic and stock service, they are classified as in the irrigation segment if their gravity irrigation charges exceed their domestic and stock charges.
2. For the 2019/20 period, as at June 2020.
3. This segment includes hydroelectric power utilities and customers with licences to divert and return water for purpose of hydro generation.

YEAR IN REVIEW GOVERNANCE AND ORGANISATIONAL STRUCTURE
2019/20 Goulburn-Murray Water Annual Report 27
WORKFORCE DATA OTHER DISCLOSURES FINANCIAL STATEMENTS
Understanding and responding to customer needs
Delivering what is important to our customers remains core
business for GMW. We derive insights from our many customer
touchpoints including our Contact Centre, local Customer Service
Centres, Waterline users and our frontline staff.
The GMW website and mobile app have seen continual
improvements throughout the year providing a better user
interface and customer experience. The MyGMW platform on
the GMW website continues to be refined, currently providing
customers with online access to their information and accounts,
the ability to make online payments and to update contact details
as required.
Well-established customer working groups continue to provide
GMW with an effective way to deliver customer engagement,
providing the forum to listen and collaborate with our customer
base on the key issues that affect them.
GMW successfully submitted our pricing submission to the
ESC this year, which was then endorsed. The success of the
pricing submission was largely due to the customer engagement
carried out with strategic working groups, a ‘Your Say’ campaign,
customer drop-in sessions and customer workshops and forums
that were held to determine fairness and equity in the prices we
charge.
GMW is committed to providing our customers, stakeholders and
community members with a meaningful way to have input into the
future of the Goulburn-Murray region.
Customer complaints
The number of complaints received in the 2019/20 financial year
increased to 66, in comparison to the 50 complaints received in
2018/19.
GMW has improved our complaints recording process, including
more categories to ensure a greater understanding of areas
requiring attention and improvement.
In 2019/20 GMW received the most complaints in relation to
fees and charges (30 per cent), administration (15 per cent) and
gravity service/supply (11 per cent). Figure 1 shows the total
number of complaints received by GMW since 2014/15.
Our management of complaints is consistent with the Australian
Standard AS ISO 10002:2006, and the ESC’s Customer Service
Code. GMW ensures that we will:
• provide sufficient resources to adequately manage and
investigate all complaints
• encourage and expect employees to actively listen to a
customer making a complaint
• resolve the complaint, or make the complainant aware of
the progress towards resolving their complaint, within 10
business days
• do our best to assist in a resolution that is to the satisfaction
of all parties within the bounds of legislative and policy
requirements.
Figure 1: GMW Water Storage and Delivery complaints since 2014/15
Delivering what is important to our customers remains core business for GMW. We derive insights from our many customer touchpoints including our Contact Centre, local Customer Service Centres, Waterline users and our frontline staff. The GMW website and mobile app have seen continual improvements throughout the year providing a better user interface and customer experience. The MyGMW platform on the GMW website continues to be refined, currently providing customers with online access to their information and accounts, the ability to make online payments and to update contact details as required. Well-established customer working groups continue to provide GMW with an effective way to deliver customer engagement, providing the forum to listen and collaborate with our customer base on the key issues that affect them. GMW successfully submitted its pricing submission to the ESC this year which was then endorsed. The success of the pricing submission was due largely due to the customer engagement carried out with strategic working groups, a ‘Your Say’ campaign, customer drop in sessions and customer workshops and forums that were held to determine fairness and equity in the prices we charge. GMW is committed to providing our customers, stakeholders and community members with a meaningful way to have input into the future of the Goulburn-Murray Region.
Customer Complaints
The number of complaints received in the 2019/20 financial year increased to 66 complaints, in comparison to the 50 complaints received in 2018/19. GMW has improved our complaints recording process, including more categories to ensure a greater understanding of areas requiring attention and improvement. In 2019/20 GMW received the most complaints in relation to Fees and Charges (30%), Administration (15%), Gravity Service/Supply (11%). Chart XX shows the total number of complaints received by GMW since 2014/15.
Chart X: GMW Water Storage & Delivery complaints since 2014/15
0
10
20
30
40
50
60
70
80
90
100
2014/15 2015/16 2016/17 2017/18 2018/19 2019/20C
ount
of C
ompl
aint
s
Financial Year
DDeelleetteedd:: call
DDeelleetteedd:: c
DDeelleetteedd:: c
DDeelleetteedd:: s
DDeelleetteedd:: c
DDeelleetteedd:: held

YEAR IN REVIEW GOVERNANCE AND ORGANISATIONAL STRUCTURE
2019/20 Goulburn-Murray Water Annual Report 28
WORKFORCE DATA OTHER DISCLOSURES FINANCIAL STATEMENTS
GMID Irrigation Deliveries
During the 2019/20 irrigation season, a total of 511,749 ML was delivered to GMW customers in the GMID, which was 555,652 ML less than
the previous season in 2018/19. The below graph shows GMW’s GMID deliveries since 2000/01. We are conscious that our customers are
struggling with declining water availability, and that GMW must hence adapt to remain resilient in the rapidly changing face of irrigation
within the GMID. GMW will persist with our approach to designing, building and delivering infrastructure to meet the changing needs of our
irrigating communities. Our annual maintenance works ensure we can keep the delivery system running efficiently, and through various
programs, such as the Connections Project, we are reinforcing the adaptability of our delivery networks. Further information on GMW’s
water deliveries based on service type is on page 34.
Percentage of orders delivered on day (regardless of notice)
Actual Target
Gravity 94% 93%
Pumped 99% 98%
Table 5: Percentage of orders delivered on day regardless of notice
Figure 2: GMID Irrigation Deliveries since 2000/01
Of the 85,443 irrigation orders received, 94.4 per cent were delivered on the day requested by the customer. Over half (66 per cent) of the
irrigation orders received were lodged via electronic means, demonstrating our customers’ appetite for self-service and online convenience.
1999/00 2000/01 2001/02 2002/03 2003/04 2004/05 2005/06 2006/07 2007/08 2008/09 2009/10 2010/11Use GMID use 1,660,111 1,929,584 2,093,300 1,463,197 1,665,370 1,635,852 1,737,785 936,920 621,607 563,004 755,972 484,681 Use Pumped 15,550 18,645 18,516 20,448 21,856 21,631 22,874 19,380 16,146 16,562 17,125 10,450 Use Groundwater 170,620 181,214 241,549 189,710 177,501 150,891 43,956
GMID forecastUse Reg Rivers 151,687 157,929 136,763 121,928 115,298 123,004 75,676 41,202 39,347 52,438 18,422 Use Unreg Streams 77,500 77,500 50,100 51,200 21,600 23,700 7,400
-
500,000
1,000,000
1,500,000
2,000,000
2,500,000
2000
/01
2001
/02
2002
/03
2003
/04
2004
/05
2005
/06
2006
/07
2007
/08
2008
/09
2009
/10
2010
/11
2011
/12
2012
/13
2013
/14
2014
/15
2015
/16
2016
/17
2017
/18
2018
/19
2019
/20
Use
GL
GMID Irrigation Deliveries
GMID use
Linear (GMID use)
-
5,000
10,000
15,000
20,000
25,000
2000/0
1
2001/0
2
2002/0
3
2003/0
4
2004/0
5
2005/0
6
2006/0
7
2007/0
8
2008/0
9
2009/1
0
2010/1
1
2011/1
2
2012/1
3
2013/1
4
2014/1
5
2015/1
6
2016/1
7
2017/1
8
Pumped
0
50,000
100,000
150,000
200,000
250,000
300,000
2004/0
5
2005/0
6
2006/0
7
2007/0
8
2008/0
9
2009/1
0
2010/1
1
2011/1
2
2012/1
3
2013/1
4
2014/1
5
2015/1
6
2016/1
7
2017/1
8
Groundwater
- 20,000 40,000 60,000 80,000
100,000 120,000 140,000 160,000 180,000
2000/0
1
2001/0
2
2002/0
3
2003/0
4
2004/0
5
2005/0
6
2006/0
7
2007/0
8
2008/0
9
2009/1
0
2010/1
1
2011/1
2
2012/1
3
2013/1
4
2014/1
5
2015/1
6
2016/1
7
2017/1
8
Regulated Rivers
- 10,000 20,000 30,000 40,000 50,000 60,000 70,000 80,000 90,000
2000/0
1
2001/0
2
2002/0
3
2003/0
4
2004/0
5
2005/0
6
2006/0
7
2007/0
8
2008/0
9
2009/1
0
2010/1
1
2011/1
2
2012/1
3
2013/1
4
2014/1
5
2015/1
6
2016/1
7
2017/1
8
Unregulated Streams

YEAR IN REVIEW GOVERNANCE AND ORGANISATIONAL STRUCTURE
2019/20 Goulburn-Murray Water Annual Report 29
WORKFORCE DATA OTHER DISCLOSURES FINANCIAL STATEMENTS
Water trading
During the 2019/20 irrigation year, 18,601 trades were processed involving 3,225,920 ML of allocation. Demand for allocation was strong –
with the price of traded water being high for most of the season, customers were looking to the water market to sell any excess water.
Customers managing allocation now have unprecedented access to the water market through online tools supplying up to date information
and the ability to transact online. Customers can also trade allocation with one of the many water brokers who are enabled to transact
online through the Broker Portal.
This has resulted in a highly active water market, allowing customers to secure allocation when required or quickly on-sell when the
individual season or market dictates. GMW continues to support development of the water market working closely with DELWP to provide
trading solutions through the Victorian Water Register platform.
Figure 3: Retail and environmental allocation trades and volumes since 1 July 2013.
GMW received 2,275 applications to transfer 120,629 ML of water share throughout the 2019/20 irrigation year, representing a decrease in
volume over last year.
Figure 4: Water share transfers and volumes since 1 July 2013.
0
2000
4000
6000
8000
10000
12000
14000
2011-16 Baseline 2016/17 2017/18 2018/19 2019/20 2020/21 2021/22 2022/23 2023/24 2024/25 Target
Net greenhouse gas emissions (tCO2-e)
Energy Vehicle Fleet Pledge target
02000400060008000100001200014000160001800020000
0
500000
1000000
1500000
2000000
2500000
3000000
3500000
2014 2015 2016 2017 2018 2019 2020
Num
ber
of A
pplic
atio
ns
Volu
me
Trad
ed (M
L)
Volume Traded (MLs) Applications
0
500
1000
1500
2000
2500
3000
3500
4000
4500
0
50000
100000
150000
200000
250000
2014 2015 2016 2017 2018 2019 2020
Num
ber
of A
pplic
atio
ns
Volu
me
Trad
ed (M
L)
Volume Traded (MLs) Applications
0
2000
4000
6000
8000
10000
12000
14000
2011-16 Baseline 2016/17 2017/18 2018/19 2019/20 2020/21 2021/22 2022/23 2023/24 2024/25 Target
Net greenhouse gas emissions (tCO2-e)
Energy Vehicle Fleet Pledge target
02000400060008000100001200014000160001800020000
0
500000
1000000
1500000
2000000
2500000
3000000
3500000
2014 2015 2016 2017 2018 2019 2020
Num
ber
of A
pplic
atio
ns
Volu
me
Trad
ed (M
L)
Volume Traded (MLs) Applications
0
500
1000
1500
2000
2500
3000
3500
4000
4500
0
50000
100000
150000
200000
250000
2014 2015 2016 2017 2018 2019 2020
Num
ber
of A
pplic
atio
ns
Volu
me
Trad
ed (M
L)
Volume Traded (MLs) Applications

YEAR IN REVIEW GOVERNANCE AND ORGANISATIONAL STRUCTURE
2019/20 Goulburn-Murray Water Annual Report 30
WORKFORCE DATA OTHER DISCLOSURES FINANCIAL STATEMENTS
Water Share Transfers and Allocation Trades
2013/14 2014/15 2015/16 2016/17 2017/18 2018/19 2019/20
Water share transfers
Volume (ML)
158,110 184,591 160,545 225,855 120,352 184,962 120,629
Number 2,724 3,130 2,777 2,741 2,739 3,859 2,275
Allocation trades
Volume (ML)
1,991,213 2,513,653 2,495,866 2,884,883 3,324,634 2,795,006 3,225,920
Number 10,531 12,321 12,608 10,860 14,232 18,211 18,601
Table 6: Water share transfers and allocation trades since 1 July 2013.
The Connections ProjectThe GMW Connections Project (the Project) is contributing to the
sustainable future of productive agriculture in the GMID. Funded
by the Commonwealth and Victorian Governments, it is the most
significant upgrade to the region’s irrigation infrastructure in its
100-year history.
The Project is an important and fundamental change for irrigated
agriculture in the GMID and contributes to Victoria’s water
savings targets as outlined in the Murray-Darling Basin Plan.
The Project is investing more than $2 billion to improve delivery
of water to irrigation businesses across the GMID. The Project
is focused on modernising infrastructure and improving service
standards while generating water savings, and is working to
provide long-term sustainability of irrigation in the region. The
Project is key to ensuring water for the environment is provided
through infrastructure upgrades. Delivering such a complex
project is not without its challenges, particularly given the many
variables that need to be managed throughout the project.
The Project is on-track for successful delivery of 429 GL of water
savings by October 2020.
Project background
The Commonwealth Government, Victorian Government and
Melbourne water retailers have provided the $2 billion of funding
for the Project. In return, the Governments, water retailers
and irrigators will receive a defined share of the water savings
achieved from improving the efficiency of the channel delivery
network. The Commonwealth and Victorian Governments’
shares of the water savings will be used to deliver environmental
benefits.
Project developments in 2019/20
Following approval of the Connections Reset Delivery Plan in
September 2016, the Project has continued to implement the
reset scope of works. The Project is on track for delivery on time
and within budget by October 2020.
As of the end of June 2020, the Project has met or exceeded
all required contractual milestones and achieved 98 per cent
of the required water savings (subject to audit and verification
processes).
Key activities completed in 2019/20 included a substantial annual
works program involving pipelining, channel automation, meter
installations and asset rationalisation including:
• delivery of 420 GL of water savings (subject to audit and
verification processes) as of 30 June 2020, with continued
water savings achievements made since this date

YEAR IN REVIEW GOVERNANCE AND ORGANISATIONAL STRUCTURE
2019/20 Goulburn-Murray Water Annual Report 31
WORKFORCE DATA OTHER DISCLOSURES FINANCIAL STATEMENTS
• continued delivery of solutions for GMID customers and as
of June 2020 had installed 9,119 modernised meter outlets
and decommissioned 1,627km of channel
• completion of a significant annual program of works
including installation of 65km of pipeline, 31 automation
sites, decommissioned over 180km of channel, installed
1,026 modernised meters, rationalised over 670 meters and
remediated 2.1km of channel. The 2019/20 works program
focused on increased on-farm works connecting to the
modernised network
• safety kept as a key focus for delivery and successfully
completed the intensive construction of the Winter Works
period with a recorded rolling Lost Time Injury Frequency
Rate (LTIFR) of 2.62 LTIs per million man hours worked,
which compares favourably to the heavy construction
industry LTIFR of 13.7
• further consolidation of the complaints management
process to provide customers with more timely and
consistent resolutions to issues raised
• continued certification of the Project’s management
systems to International and Australian Standards for
Quality, Environment and Safety (ISO 9001:2015; ISO
14001:2015 and AS 4801:2001)
• continued implementation of a revised engagement model
using statutory reconfiguration powers with remaining
works to be delivered through Reconfiguration Plans
(RPs). To the end of June 2020, a total of 140RPs have been
formally gazetted under the Water Act 1989. In total to the
end of June 2020, the Project has finalised connections with
over 7,307 landowners
• providing a stimulus to the regional GMID economy through
the Project’s annual construction program, creating an
estimated 1,541 FTEs in the region (direct and indirect
employment) and generating an estimated regional GDP
increase of $165.7 million for the 12-month reporting period
Next steps in 2020
The Connections Project team continues to respond to the
coronavirus (COVID-19) global pandemic, adhering and adapting
Project delivery in-line with protocols set by the Victorian
Government. The Project is on track for successful delivery
with completion by October 2020 amid the challenges that the
COVID-19 global pandemic present.
The Project has undertaken a robust works planning process
to ensure it can deliver on the Project aims and milestones by
October 2020. Key activities to achieve these milestones include
the construction of works associated with Reconfiguration Plans.
The Project team has finalised the required Reconfiguration
Plans and the associated engagement with landowners has
also been completed. The result of this is a refined construction
scope to finalise Project delivery and construction through to
completion by October 2020.
A large winter works program scheduled for completion in
2020 to maximise construction during the irrigation shutdown
period will achieve more than 13GL of water savings towards
project completion. These winter works include construction of
over 50km of pipeline, decommissioning over 80km of channel,
installing 20 regulators and installing or decommissioning over
540 outlets.
The Project team and GMW have been implementing the Project
Completion and Transition Plan to close out commitments and
transition Project activities into GMW business as usual activities.
A range of activities has been identified to deliver the remaining
scope, meet contractual and reporting obligations through to
the end of the contractual period and to transfer knowledge and
expertise into GMW business.
Project and GMW staff will focus on delivering activities against
this plan in parallel with the finalisation of construction through
to Project completion in 2020.

YEAR IN REVIEW GOVERNANCE AND ORGANISATIONAL STRUCTURE
2019/20 Goulburn-Murray Water Annual Report 32
WORKFORCE DATA OTHER DISCLOSURES FINANCIAL STATEMENTS
Project milestones
As of 30 June 2020, the project has achieved the following milestone targets:
Project completion
The Connections Project is on track to deliver its milestone targets by the end of October 2020. The Project team has developed a detailed scope
of works for the 2020/21 financial year that will see the Project finish on time and within budget.
A Connections Project Transition and Completion Plan has been completed and an internal Transition Team formed and tasked with
responsibility for coordinating all remaining transition and completion project activities as documented in the plan. The plan has been
implemented to ensure the successful transition of the Connections Project into GMW.
9,119
service points installed
308.6km of channel remediated
1,627.4km
of channel decommissioned
420GL
of water savings (subject to audit and
verification processed)
Key Objectives to be achieved in 2019/20 Achievements during 2019/20 Objective met?
Connections completion and transition
GMW will explore initiatives for staff retention and transfer of knowledge, including determining resource requirements for post-construction activities.
Workforce planning activities have been implemented in conjunction with the Project’s Completion and Transition Plan (C&TP). Resource planning includes post-completion activities (i.e. defects, audits, reporting, etc.) to late 2021.
Yes
GMW will close out works and defect liabilities and will deliver on legacy agreements. GMW will dispose of surplus assets.
On track for close out works and management of defect liability periods post-Project completion.
On track
GMW will transfer information into corporate management systems, and determine requirements for off-site storage. GMW will conduct reviews and seek to share the learnings gained from the information and management systems used.
Completion and Transition Plan implemented, which includes ongoing information transfer pre- and post-Project completion.
On track
GMW will undertake review of budget allowances for land dealing and completion requirements. GMW will undertake audits and finalise water share transfers as required.
Budget requirements were reviewed and funds allocated for post-completion activities.
Yes
With DELWP, GMW will agree on a definition of ‘complete’ and ongoing governance arrangements. Audits and reviews will be conducted to determine legal liabilities and to close out legal obligations in preparation for final Project reporting.
DELWP and GMW have implemented an agreed Completion Plan to oversee all aspects of Project close-out.
Yes
Table 7: Connections completion and transition actions.

YEAR IN REVIEW GOVERNANCE AND ORGANISATIONAL STRUCTURE
2019/20 Goulburn-Murray Water Annual Report 33
WORKFORCE DATA OTHER DISCLOSURES FINANCIAL STATEMENTS
Water StorageGMW manages 24 storages (including four on behalf of the MDBA
and four Victorian Mid-Murray storages) to harvest, store and
supply water for irrigation, urban/rural and environmental use in
northern Victoria. The 20 Victorian owned storages are of varying
size, capacity, reliability and consequence category across
northern Victoria, and aged between 35 and 145 years.
GMW operates these major storages in accordance with the
Australian National Committee on Large Dams (ANCOLD)
guidelines. GMW maximises harvesting opportunities, and
manages stored water efficiently for our customers.
The storages provide additional benefits including flood
mitigation, recreation and public use, support to local tourism,
environment and economies, and hydropower generation. These
are the non-prescribed services provided by GMW.
Bulk water operations and maintenance
During the 2019/20 year, GMW delivered a number of initiatives
to improve the operations and services provided at and around
our storages. Some of the highlights of the year are summarised
below:
• at Cairn Curran Reservoir, a new CCTV system has been
installed with a fully integrated digital system, which will
enhance operational safety, surveillance and asset security
• the original gantry crane at Cairn Curran Reservoir was
replaced during the year
• an access bridge to the outlet tower at Newlyn Reservoir
was constructed, which greatly improves access, safety and
efficiencies in staff accessing the outlet works
• office extensions/refurbishment at Cairn Curran, Eildon and
Goulburn Weir, which improves operational capability and
security at the sites
• new stairs and platforms were installed at Yarrawonga Weir,
Lake William Hovell and at the Eppalock outlet tower to
improve access for operations staff and reduce OH&S risks
• maintenance shed replacement on the island at Mildura
Weir was completed, providing improved working conditions,
secure storage and an OH&S compliant facility
• an environmental watering event was conducted to fill Lake
Kramen, part of the Hattah Lakes complex. The water level
reached 45.29 AHD and delivered 12.3 GL, similar to the last
event in December 2014
• GMW detected and responded to blue green algae blooms at
numerous water bodies across the region during the year,
including in Lake Mulwala and the River Murray where we
liaised with WaterNSW and other stakeholders
• close cooperation with the Goulburn Broken CMA, DELWP
and the MDBA on summer deliveries from the Goulburn
inter-valley trade account to ensure minimisation of damage
to the environment of the Goulburn River downstream of
Murchison
• full refurbishment of pump no. 4 and extensive maintenance
repairs undertaken on pump no. 7 at Hattah Lakes Pump
Station. Both pumps were successfully recommissioned
• comprehensive dam safety inspections (five-yearly) were
undertaken at Waranga Basin, Cairn Curran Reservoir and
Lake Eppalock, with no major issues identified
• desktop exercises testing the Flood Incident Management
Plans and Dam Safety Emergency Plans for all 16 dams
were undertaken during the year
• a combined Dartmouth, Hume and Yarrawonga Dam
Safety Emergency Plan exercise, including power station
owners, and representatives of the Murray-Darling Basin
Commission and Water NSW was conducted in May 2020.
The exercise was designed to test the relevant Dam Safety
Emergency Plans and communication protocols between the
agencies
• in accordance with the ANCOLD guidelines, dam safety
design reviews for Mildura Weir, Torrumbarry Weir, Lake
Buffalo and Waranga Basin commenced during the year,
which will review the design and performance of these
structures over the last 20 years, against current-day design
and construction standards
• at Dartmouth, a detailed review of the dam safety
instrumentation network and assessment of its reliability
has been completed

YEAR IN REVIEW GOVERNANCE AND ORGANISATIONAL STRUCTURE
2019/20 Goulburn-Murray Water Annual Report 34
WORKFORCE DATA OTHER DISCLOSURES FINANCIAL STATEMENTS
• a 10-yearly review and update of the Dams Portfolio Risk
Assessment, inclusive of 12 GMW owned dams and four
dams managed on behalf of MDBA, was completed during
the year. The strategy reports informed the requirements
for future dam safety-related investments, including
investigations, design reviews and upgrade projects, and
have been incorporated into our recent Pricing Submission
• detailed design was completed to address the deterioration
of concrete joints in the floor of the Eildon spillway chute,
and the work was tendered in the open market. Due to
COVID-19 and the low dam safety risk in not being able
to complete the project, the works have been deferred to
2020/21
• Stuart Murray Canal Offtake radial gate replacement
commenced in May 2019 and was completed mid-July 2019,
in time for the2019/20 irrigation season
• three bridge crossings with culverts were replaced over
the Lake Tutchewop drain. These are integral assets of the
Barr Creek Salt Interception Scheme. Further review and
assessments for bridge replacements are planned during
2020/21
• following identification and subsequent completion
of the five key projects (Tourism Strategy, Kimbolton
Foreshore Rejuvenation, Recreational Boating and Fishing
Enhancement strategy, External and Internal Signage
Upgrade and Communications strategy), the work of
the Lake Eppalock Advisory Group has been completed
and the group has been disbanded. The Land and On
Water Implementation Group will continue to support
implementation of the Land and On Water Plan at Lake
Eppalock
• decommissioning the Greens Lake pump station for
operational use continues to progress and with the
assistance of funding from Pick my Project, new toilet block
facilities have been constructed and opened
• COVID-19 response including closure and reopening of
areas and facilities, signage of recreation facilities, including
boating at 19 storages
• bushfires over the summer period affected a number of
storages, particularly Dartmouth Dam and Lake Buffalo. Our
response was implemented in collaboration with emergency
services, with storage staff enacting their fire plans to
ensure safety of all personnel and protect assets.
Water Delivery Services During the 2019/20 year, GMW delivered a number of initiatives to
improve the operations and services provided in and around our
water delivery networks. Some of the highlights of the year are
summarised below:
• following the 2020 northeast Victorian bushfires, additional
water quality sensors were installed at a number of stream
monitoring stations to improve early warning of poor water
quality to water users and help assess the environmental
effects. These upgrades were undertaken in conjunction
with other stakeholders including North East Water (NEW),
North East CMA, DELWP, MDBA and the Environment
Protection Authority.
• as part of the bushfire response, GMW was asked to
establish a temporary Domestic and Stock supply point for
the region of Tintaldra. This temporary supply point enabled
severely bushfire affected farmers access to water their
stock. The supply point was operated by GMW Infrastructure
and Delivery staff for a number of weeks during the
emergency
• coordination of environmental and inter-valley trade
deliveries (33.6 GL) to the Murray via the East Goulburn Main
Channel and lower Broken Creek
• management of qualified rights for customers in the Broken
system to ensure access to essential domestic and stock
water
• completion and implementation of the Lake Meran Local
Management Plan. Restrictions on access by users were
implemented to protect domestic and stock use and the
environment. A temporary qualification of rights was
gazetted to enforce the restrictions

YEAR IN REVIEW GOVERNANCE AND ORGANISATIONAL STRUCTURE
2019/20 Goulburn-Murray Water Annual Report 35
WORKFORCE DATA OTHER DISCLOSURES FINANCIAL STATEMENTS
• continued collaboration with NEW on the Water Security for
Wangaratta project
• partnership with northern Victoria Urban Water Authorities
with the Integrated Water Management (IWM) Forums.
Key projects from the IWM process include Water Security
for the Seven Creeks, Managed Aquifer Recharge Urban
Analysis and the Tullaroop Creek Environmental Review
• collaboration with Gippsland Water to secure water supply
for Dinner Plain through groundwater management
• the Cornella Creek Catchment Drainage Course Declaration
(DCD) was approved and obstruction removal works
program delivered successfully
• the Upper Deakin DCD obstruction removal works program
is progressing very well, and is approximately 75 per cent
complete
• the Shepparton Irrigation Region (SIR) Public Groundwater
Pump Rationalisation Project commenced, with all pump
deactivation works completed in Rochester Irrigation Area
and works close to complete in the Murray Valley Irrigation
Area by the end of 2019/20
• the Linear Program (repairing channel banks) continued
at a number of locations including; the Yarrawonga Main
Channel near Yarrawonga, the East Goulburn Number 10
and 11 Channels at Shepparton East and Taylors Creek near
Gunbower
• a number of bridge works occurred as part of our ongoing
Structures Program. These include; Swainstone Road bridge
near Shepparton, Peppertree Lane in Kyabram and Bulls
Syphon near Rochester
• work continued on structures on drains in the Murray Valley,
Shepparton and Torrumbarry areas, as well as works on the
Deakin and Coram Drains in the Central Goulburn area.
Water management
GMW is the northern Victorian Resource Manager appointed
by the Minister for Water with responsibility for making the
seasonal determination for all northern Victorian declared water
systems. GMW delivers a range of catchment and water resource
planning services to implement government surface water and
groundwater management regulations and policy.
GMW released the first water availability outlook for 2019/20 in
December 2018 when the Annual Water Outlook was published.
This document indicated that seasonal determinations in 2019/20
were unlikely to reach 100 per cent under dry inflow conditions.
Further seasonal determination outlooks for 2019/20 were
published on 15 February 2019 and 15 May 2019 which provided
an indication of water availability under various inflow scenarios.
Following the low inflows in 2018/19, 2019/20 continued with
dry conditions through winter and spring and into summer.
The cumulative impact of low inflows through 2018/19 and into
2019/20 lead to seasonal determinations less than 100 per cent
high-reliability water shares (HRWS) for most of the systems,
with only the Bullarook system reaching a final seasonal
determination of 100 per cent HRWS and low-reliability water
shares (LRWS).
Water availability in the Broken system was particular low in
2019/20 with the seasonal determination remaining on 0 per
cent HRWS until 16 March 2020 when a 2 per cent seasonal
determination was announced.
Seasonal Determinations for Northern Victorian Water Systems
Season
Murray Broken Goulburn Campaspe Loddon Bullarook Creek
HRWS% LRWS% HRWS% LRWS% HRWS% LRWS% HRWS% LRWS% HRWS% LRWS% HRWS% LRWS%
2018/19 100 0 37 0 100 0 100 0 100 0 100 100
2019/20 66 0 2 0 80 0 80 0 80 0 100 100
Table 8: Seasonal Determinations for Northern Victorian Water Systems since 1 July 2018.

YEAR IN REVIEW GOVERNANCE AND ORGANISATIONAL STRUCTURE
2019/20 Goulburn-Murray Water Annual Report 36
WORKFORCE DATA OTHER DISCLOSURES FINANCIAL STATEMENTS
The first outlook on water availability for 2020/21 was released in
December 2019 when the Annual Water Outlook was published
(www.g-mwater.com.au/water-resources/water-resource-update).
This initial outlook indicated that seasonal determinations in
2020/21 could be very low if low inflow conditions experienced in
2019/20 continued into 2020/21.
A welcome early autumn break in March 2020 increased
catchment flows and storage volumes that continued through to
the start of the 2020/21 water year. This improved the outlook for
2020/21 seasonal determinations, particularly when compared
with the previous season.
Recognising there could be supply issues in 2019/20, GMW
commenced dry inflow contingency planning activities in April
2019. This included agreements with Catchment Management
Authorities to vary passing flow arrangements in the Loddon
and Broken systems over winter in an effort to prolong supplies
during 2019/20. Broken system customers received a letter
in June 2019 outlining the possibility of supply issues during
2019/20 if inflows remained low. While seasonal determinations
were very low, carried over allocation was able to be delivered.
In December 2019, the Minister for Water temporarily qualified
rights in the Broken system to enable water to be accessed for
critical domestic and stock purposes.
Table 9 describes GMW’s water deliveries based on service type.
Carryover
Northern Victorian water entitlement holders carried over 1,027
GL into the 2019/20 season, approximately 76 GL more than the
2018/19 season.
In our role as Resource Manager, GMW declared a low risk of
spill on 1 July 2019 for all three systems where spillable water
accounts are applicable; the Goulburn, Murray and Campaspe
systems. There were no deductions from spillable water accounts
in 2019/20. The low risk of spill declarations allowed customers
to trade or use allocation held in spillable water accounts. The
volume returned from spillable water accounts was only 180 ML.
The total volume of allocation available to regulated entitlement
holders in 2019/20 was 3,099 GL.
Groundwater
Northern Victoria experienced below average rainfall for the
first half of 2019/20, which contributed to high groundwater use
across the GMW region for the second year in a row. Use was
particularly high in the Loddon Highlands, Lower Campaspe
Valley, and Katunga Water Supply Protection Areas. Entitlement
transfers were consistent with below average rainfall, with 18.7
GL transferred within the groundwater management areas. All
Groundwater Management Units across the region received a
maximum allocation in 2019/20, except for the Newlyn Zone
of the Loddon Highlands Water Supply Protection Area and
the Barnadown Zone of the Lower Campaspe Water Supply
Protection Area; each zone received a 75 per cent allocation.
System efficiency
Modernisation in GMW’s irrigation areas improves the
operational efficiency of our channel delivery networks. However,
with a reduction in deliveries of more than 50% on the year prior,
it is difficult to maintain efficiency even with an upgraded system.
Efficiency is a measure of delivery versus diversion into the
districts, where diversion is equivalent to the volume of delivery
plus the volume of loss. Due to the large portion of fixed losses
associated with running the irrigation districts, the low volume
of deliveries in 2019/20 was the primary driver behind the drop in
GMID system efficiency compared to the previous two seasons.
Service Total Delivered (ML)
Total Delivered (ML)
2018/19 2019/20
GMID (Total) 1,196,739 601,951
GMID (Irrigation) 1,067,401 511,749
GMID (Environment) 118,546 80,440
GMID (Urban) 10,793 9,762
Pumped Districts (Irrigation) 22,416 18,929
Regulated Diverters (Irrigation)
89,731 52,051
Regulated Diverters (Environment)
333,440 729,058
Regulated Diverters (Urban) 53,622 58,227
Unregulated Diverters 29,698 27,790
Groundwater1 154,514 128,637
Total 3,076,900 2,218,594
Table 9: GMW water deliveries based on service type.
1. Excludes Shepparton Irrigation Region (SIR) Groundwater Management Area (GMA) estimated usage.

YEAR IN REVIEW GOVERNANCE AND ORGANISATIONAL STRUCTURE
2019/20 Goulburn-Murray Water Annual Report 37
WORKFORCE DATA OTHER DISCLOSURES FINANCIAL STATEMENTS
The following table shows system efficiencies in 2019/20
compared with 2017/18 and 2018/19. System efficiency reflects
the percentage of water diverted into an irrigation area recorded
at customers’ service points.
The overall GMID efficiency was 76.8 per cent in the 2019/20
season. Deliveries in the GMID in the 2019/20 season were quite
low, equal to nearly half the volume of delivery as the previous
2018/19 season.
A number of other factors also influence system efficiency
including the start of season channel fill and end of season
channel drawdown, operation of local system storages, seasonal
weather conditions and local catchment inflows.
Sustainable resource management
GMW’s water resource management and monitoring programs
manage surface water and groundwater resources sustainably.
GMW delivers these programs in conjunction with partner
agencies including the MDBA, CMAs, DELWP and the Department
of Economic Development, Jobs, Transport and Resources
(DEDJTR)/Department of Jobs, Precincts and Regions (DJPR).
GMW has contributed to Integrated Water Management forums
and project development with several groups across northern
Victoria, including the urban water authorities North-East Water,
Goulburn-Valley Water and Coliban Water.
GMW undertook water quality and quantity monitoring, surface
and subsurface drainage operations and salt interception
operations to manage the environmental risks within our area of
operation.
Groundwater management plans have been implemented across
the region providing important information and clear operating
rules to our customers about the use of groundwater resources
for a range of purposes, including irrigation and domestic and
stock.
Our environment
GMW has a comprehensive process to report and monitor
compliance against legal, regulatory and Statement of
Obligations requirements. An annual attestation of compliance
against these obligations is reported to the Board and Executive
Management Team.
In the instance a breach is identified an action plan is developed
in consultation with the relevant business unit to identify
appropriate control measures to mitigate future occurrences.
As required, breaches are reported to the relevant regulatory
authorities. GMW attests that one breach of our legal, regulatory,
or Statement of Obligations requirements came to the
corporation’s notice during the 2019/20 reporting period; GMW
received an Environment Protection Agency clean up notice for
an historic waste site. Remediation works were completed and
compliance with the notice achieved.
GMW fulfilled our obligations under the Safe Drinking Water Act
2003 and Safe Drinking Water Regulations 2015. GMW undertook
monitoring of blue-green algae and other water quality
parameters at key locations to ensure effective management and
communication of risks to water users and other stakeholders.
GMW manages our interactions with the environment through
our Environmental Management System (EMS). GMW’s EMS is
certified to the International Standard for Systems AS/NZ ISO
14001 and has maintained this certification throughout 2019/20.
Performance against this standard was assessed through the
completion of external third party audits.
GMW System Efficiency within Irrigation Areas
2017/18 2018/19 2019/20
Total 84.5% 82.0% 76.8%
Shepparton 86.1% 84.9% 84.5%
Central Goulburn
84.6% 82.0% 78.5%
Rochester 90.1% 84.2% 71.4%
Loddon Valley 83.5% 82.1% 76.2%
Murray Valley 80.8% 83.5% 82.0%
Torrumbarry 84.9% 77.3% 71.3%
Table 10: GMW system efficiency within irrigation areas.

YEAR IN REVIEW GOVERNANCE AND ORGANISATIONAL STRUCTURE
2019/20 Goulburn-Murray Water Annual Report 38
WORKFORCE DATA OTHER DISCLOSURES FINANCIAL STATEMENTS
Performance Reporting – FinancialGMW Financial StructureGMW disaggregates the activities of the business into two major
components. Due to the size and impact on the consolidated
business a disaggregated note has been included in the Financial
Statements. The two major components are:
1. Water Storage and Delivery – these are the operating
activities of GMW which include harvesting, storing and
delivering water to customers.
2. Connections Project – these are the activities relating to
the delivery of the $2 billion Victorian and Commonwealth
Governments’ irrigation modernisation and renewal
program in northern Victoria to achieve water savings. The
Connections Project operates as a business unit of GMW and
results are consolidated.
Operations of the Connections Project are accounted for
separately from Water Storage and Delivery operations as
required by the Commonwealth and Victoria. This assists
delivering governance, financial and operational accountability
for the business. It also prevents cross-subsidy between either
GMW’s customers’ or the governments’ funding for the Project.
Approved financial transactions between the Water Storage and
Delivery business and the Connections Project are eliminated in
producing GMW’s financial statements, to avoid double counting
of revenue and expenses. Note 2 of the Financial Statements
disaggregated information.

YEAR IN REVIEW GOVERNANCE AND ORGANISATIONAL STRUCTURE
2019/20 Goulburn-Murray Water Annual Report 39
WORKFORCE DATA OTHER DISCLOSURES FINANCIAL STATEMENTS
Summary of Financial Results - Water Storage & Delivery and Connections Project (before internal adjustments)2019/20 2018/19 2017/18 2016/17 2015/16 2014/15
(‘$000) (‘$000) (‘$000) (‘$000) (‘$000) (‘$000)
Water Storage & Delivery
Profit & Loss
Total revenue 169,125 185,624 168,259 170,312 164,333 169,982
Expenses excluding interest, depreciation and amortisation 139,275 150,218 164,311 138,126 137,910 133,048
Earnings before interest, tax, depreciation and amortisation (EBITDA) 29,850 35,405 3,948 32,186 26,423 36,934
Depreciation and amortisation 102,676 100,084 100,231 102,759 69,381 69,691
Interest expense 7,119 6,930 7,118 7,424 7,732 7,942
Net result before tax - Water Storage & Delivery (79,945) (71,608) (103,401) (77,996) (50,690) (40,699)
Cash Flow
Net cash flow from operations 36,736 8,801 38,722 10,886 38,693 25,749
Payments for property, plant, equipment and infrastructure 13,139 23,762 35,232 37,564 36,082 21,938
Connections Project (Integrated into GMW on 1 July 2012)
Profit & Loss
Funding revenue 116,268 92,076 63,422 68,873 106,143 94,189
Project Expenditure
Project costs 106,673 100,881 60,322 66,954 49,600 50,919
Other project costs (1) 13,135 15,866 18,282 14,270 20,108 20,345
Total Project Expenditure 119,808 116,747 78,605 81,225 69,708 71,264
Net result before tax - Connections Project (3,540) (24,671) (15,181) (12,351) 36,434 22,924
Cash Flow
Net cash flow from operations (92,095) (27,247) 54,186 124,704 (31,706) 45,631
Payments for property, plant, equipment and infrastructure
89,050 118,554 96,723 80,201 96,530 61,143
(1) Includes employee expenses, other operating costs, depreciation and interest
Summary of Financial Results - Total GMW (after internal adjustments)
Profit & Loss
Total revenue 269,406 242,479 211,411 211,296 259,603 249,683
Total expenses 352,890 338,757 329,990 301,642 273,998 267,459
Net result before tax - GMW (83,485) (96,278) (118,580) (90,347) (14,395) (17,776)
Balance Sheet
Assets
Current 206,508 352,356 376,908 314,852 147,215 199,815
Non-current 4,712,121 4,727,023 4,734,348 4,765,406 4,820,608 4,185,516
Total assets 4,918,629 5,079,379 5,111,256 5,080,259 4,967,824 4,385,330
Liabilities
Current 112,161 183,423 253,915 194,920 85,456 150,672
Non-current 567,906 610,451 634,354 668,675 726,178 557,251
Total liabilities 680,067 793,874 888,268 863,595 811,634 707,923
Cash Flow
Net cash flow from operations (52,868) (18,446) 92,908 135,590 6,987 71,380
Payments for property, plant, equipment and infrastructure
102,189 142,316 131,955 117,765 132,613 83,081
Table 11: Summary of financial results since 1 July 2014.
Five Year Financial Summary

YEAR IN REVIEW GOVERNANCE AND ORGANISATIONAL STRUCTURE
2019/20 Goulburn-Murray Water Annual Report 40
WORKFORCE DATA OTHER DISCLOSURES FINANCIAL STATEMENTS
Current Year Financial ReviewIn early 2019, GMW adopted our Transformation Working Plan;
this plan supports a significant change program for GMW
reflected in favourable price paths for customers and efficiency of
operation across the business. 2019/20 completes the fourth and
final year of the four-year price regulated period (termed ‘Water
Plan 4’).
Other highlights include:
• the Annual Report sets out the operational and financial
information relating to the business as a whole this includes
the consolidated financial statements for Water Storage and
Delivery (WSD) and the Connections Project
• total Revenue of $269 million was higher than the prior year.
The Water Storage and Delivery total revenue reduced in
line with the reduction in expenditure as GMW focuses on
reducing our revenue requirement and returning savings
to our customers as price reductions. Connections Project
revenue increased against prior year in-line with increased
expenditure
• the Net Result before tax of ($83.5 million) loss was affected
mainly by asset decommissioning occurring through the
planned actions of the Connections Project, as well as
depreciation not being fully covered in the regulatory pricing
and revenue-setting regime
• the current COVID-19 pandemic has not significantly
impacted GMW’s prescribed business or the Connections
Project. Increases in remote working network and
communications costs have been offset by reduction in
general office expenses. The loss of revenue in our non-
prescribed services has been the largest single financial
impact to our business due to rent relief provided as part of
COVID-19 response as per State Government requirements
• GMW continues to support our customers offering hardship,
payment arrangements and extensions. These are available
to all customers not only those impacted by COVID-19,
bushfires and other natural disasters.
Significant Changes in Financial PositionFor significant changes in financial position please refer to the
current year financial review commentary.
Significant Changes or Factors Affecting PerformanceFor significant changes or factors affecting performance please
refer to the current year financial review commentary.
Figure 5: Revenue by source ($’000s) since 1 July 2016 Figure 6: Expenditure breakdown ($’000s) since 1 July 2016
Revenue2016/17 2017/18 2018/19 2019/20
Water Storage & Delivery (Retail & Bulk Water) 118,461 119,247 120,392 119,039 Government Funding - Connections Project 67,654 62,558 83,273 115,258 MDBA & Other External Contracts 14,475 15,325 15,163 16,447 Government Grants 2,384 5,056 4,141 9,390 Other Revenue 8,321 9,225 19,510 9,271
Total 211,296 211,411 242,479 269,406
Expenditure 2016/17 2017/18 2018/19 2019/20Operating, Maintenance & Administration 49,116 55,474 55,518 49,957 Connections Project costs 41,723 43,610 70,647 95,131 Employee Expenses 75,613 77,834 75,721 77,573 Depreciation & Amortisation 103,448 100,987 100,425 103,198 Asset Disposals 22,630 43,280 26,722 17,105 Other Expenses 9,111 8,806 9,724 9,927
Total 301,642 329,990 338,757 352,890
Capital Expenditure 2016/17 2017/18 2018/19 2019/20Water Storage & Delivery 31,260 38,762 17,051 12,188 Connections Project 80,939 98,286 100,933 92,489
Total 112,198 137,047 117,984 104,677
0
50,000
100,000
150,000
200,000
250,000
300,000
2016/17 2017/18 2018/19 2019/20
Revenue ($'000)
Other Revenue
Government Grants
MDBA & Other ExternalContracts
Government Funding -Connections Project
Water Storage & Delivery(Retail & Bulk Water)
0
20,000
40,000
60,000
80,000
100,000
120,000
140,000
160,000
2016/17 2017/18 2018/19 2019/20
Capital Expenditure ($'000)
Connections Project
Water Storage & Delivery
0
50,000
100,000
150,000
200,000
250,000
300,000
350,000
400,000
2016/17 2017/18 2018/19 2019/20
Expenditure ($'000)
Other Expenses
Asset Disposals
Depreciation & Amortisation
Employee Expenses
Connections Project costs
Revenue2016/17 2017/18 2018/19 2019/20
Water Storage & Delivery (Retail & Bulk Water) 118,461 119,247 120,392 119,039 Government Funding - Connections Project 67,654 62,558 83,273 115,258 MDBA & Other External Contracts 14,475 15,325 15,163 16,447 Government Grants 2,384 5,056 4,141 9,390 Other Revenue 8,321 9,225 19,510 9,271
Total 211,296 211,411 242,479 269,406
Expenditure 2016/17 2017/18 2018/19 2019/20Operating, Maintenance & Administration 49,116 55,474 55,518 49,957 Connections Project costs 41,723 43,610 70,647 95,131 Employee Expenses 75,613 77,834 75,721 77,573 Depreciation & Amortisation 103,448 100,987 100,425 103,198 Asset Disposals 22,630 43,280 26,722 17,105 Other Expenses 9,111 8,806 9,724 9,927
Total 301,642 329,990 338,757 352,890
Capital Expenditure 2016/17 2017/18 2018/19 2019/20Water Storage & Delivery 31,260 38,762 17,051 12,188 Connections Project 80,939 98,286 100,933 92,489
Total 112,198 137,047 117,984 104,677
0
50,000
100,000
150,000
200,000
250,000
300,000
2016/17 2017/18 2018/19 2019/20
Revenue ($'000s)
Other Revenue
Government Grants
MDBA & Other ExternalContracts
Government Funding -Connections Project
Water Storage & Delivery(Retail & Bulk Water) 0
20,000
40,000
60,000
80,000
100,000
120,000
140,000
160,000
2016/17
0
50,000
100,000
150,000
200,000
250,000
300,000
350,000
400,000
2016/17 2017/18 2018/19 2019/20
Expenditure ($'000s)
Other Expenses
Asset Disposals
Depreciation &Amortisation
Connections Project costs
Employee Expenses
Operating, Maintenance & Administration

YEAR IN REVIEW GOVERNANCE AND ORGANISATIONAL STRUCTURE
2019/20 Goulburn-Murray Water Annual Report 41
WORKFORCE DATA OTHER DISCLOSURES FINANCIAL STATEMENTS
Capital ProjectsGMW delivered capital works in two main areas: in the normal
course of our Water Storage and Delivery business, and through
the Connections Project as outlined in the sections below. The
majority of construction activity occurs while the gravity irrigation
system is non-operational and occurs in the months either side
of June 30.
Capital Projects – Water Storage and Delivery During 2019/20 GMW delivered $12.2M of customer funded
capital projects, upgrading many water delivery and water
storage infrastructure assets. GMW delivers our works through
a mix of direct management with internal resources and
outsourcing to regionally-based contractors or Melbourne-based
specialist contractors.
Some of the major projects or programs undertaken were:
Water delivery:
• $2.3 million irrigation structure replacements at 33 sites
• $1.6 million irrigation channel refurbishment projects at
12 sites
• $0.5 million irrigation meter replacements at 19 sites.
Water storages
• $1 million intake tower access upgrades at Newlyn
Reservoir, Lake Nillahcootie and Lake William Hovell
• $500,000 Cairn Curran spillway gantry crane upgrade
• $450,000 Stuart Murray Canal offtake radial gates
replacements
• $400,000 new amenity blocks for public recreation areas at
Lake Eildon (Jerusalem Creek) and Lake Eppalock (Randells
Cove)
• $330,000 new amenity blocks for public recreation areas at
Greens Lake.
MDBA assets (GMW is the State Construction Authority for
MDBA)
• $750,000 Barr Creek; replacement of three bridge
structures
• $720,000 Torrumbarry Weir; new residence for storage
staff, depot upgrade works including drainage and asphalt
surfacing; and upgrade to the gantry crane lay down area
• $700,000 Hattah Lakes; improvements works at the pump
station, including pump set refurbishment and preparations
(design etc.) for replacement of a section of the main high
voltage supply cable to the pump station.
Project delivery services for other government entitiesGMW provides project delivery services, including planning and
design, construction, commissioning and handover to local
government agencies and catchment management authorities
within the GMID. Some of the major projects delivered this year
include:
• $1.8 million Upper Deakin Drainage program to upgrade 43
structures on behalf of GBCMA
• $1.6 million Lake Mulwala foreshore improvement works
for the Yarrawonga Tourism Trail on behalf of Moira Shire
Council
• $330,000 Koondrook Weir Fishway design phase on behalf of
the North Central CMA
• $235,000 Cornella Creek Drainage program to upgrade
seven structures on behalf of GBCMA
Figure 7: Capital expenditure breakdown between business units ($’000s) since 1 July 2016
Revenue2016/17 2017/18 2018/19 2019/20
Water Storage & Delivery (Retail & Bulk Water) 118,461 119,247 120,392 119,039 Government Funding - Connections Project 67,654 62,558 83,273 115,258 MDBA & Other External Contracts 14,475 15,325 15,163 16,447 Government Grants 2,384 5,056 4,141 9,390 Other Revenue 8,321 9,225 19,510 9,271
Total 211,296 211,411 242,479 269,406
Expenditure 2016/17 2017/18 2018/19 2019/20Operating, Maintenance & Administration 49,116 55,474 55,518 49,957 Connections Project costs 41,723 43,610 70,647 95,131 Employee Expenses 75,613 77,834 75,721 77,573 Depreciation & Amortisation 103,448 100,987 100,425 103,198 Asset Disposals 22,630 43,280 26,722 17,105 Other Expenses 9,111 8,806 9,724 9,927
Total 301,642 329,990 338,757 352,890
Capital Expenditure 2016/17 2017/18 2018/19 2019/20Water Storage & Delivery 31,260 38,762 17,051 12,188 Connections Project 80,939 98,286 100,933 92,489
Total 112,198 137,047 117,984 104,677
0
50,000
100,000
150,000
200,000
250,000
300,000
2016/17 2017/18 2018/19 2019/20
Revenue ($'000)
Other Revenue
Government Grants
MDBA & Other ExternalContracts
Government Funding -Connections Project
Water Storage & Delivery(Retail & Bulk Water)
0
20,000
40,000
60,000
80,000
100,000
120,000
140,000
160,000
2016/17 2017/18 2018/19 2019/20
Capital Expenditure ($'000)
Connections Project
Water Storage & Delivery
0
50,000
100,000
150,000
200,000
250,000
300,000
350,000
400,000
2016/17 2017/18 2018/19 2019/20
Expenditure ($'000)
Other Expenses
Asset Disposals
Depreciation & Amortisation
Employee Expenses
Connections Project costs

YEAR IN REVIEW GOVERNANCE AND ORGANISATIONAL STRUCTURE
2019/20 Goulburn-Murray Water Annual Report 42
WORKFORCE DATA OTHER DISCLOSURES FINANCIAL STATEMENTS
Capital Projects – The Connections ProjectThe intensive construction period occurred predominantly during
the winter works period between May and August when the
channel systems were largely dewatered, although works are
now being delivered year-round without interrupting irrigation
supply.
Some of the infrastructure projects undertaken were:
• channel automation, including automation of structures of
varying types and sizes
• a small length of channel remediation, consisting of
remediation types High-Density Polyethylene plastic, clay
lining and outer bank remodelling
• continuation of the meter installation program
• a number of pipelines were constructed during the year
and a number of pipelines were under construction and
scheduled for completion early in the new financial year.
These major capital programs are part of the overall Connections
Project with a completion date of October 2020.
Performance – Water Storage & DeliveryThe 2019/20 financial year for Water Storage and Delivery was
one where water deliveries were lower than the prior year and
recent year average volumes. Continued focus on expenditure
control ensured another strong financial performance. This
year’s net result, of ($79.9 million) loss was $8.3 million higher
than the prior year ($71.6 million) due to lower asset disposals
from decommissioning activity completed by the Connections
Project and transferred to Water Storage & Delivery.
The main drivers of the operating result for 2019/20 were revenue
in line with budget combined with lower ‘controllable’ operating
costs. Controllable operating costs exclude depreciation, asset
write-down expenses through the Connections Project asset
rationalisation, and other expenditure that is funded by external
parties and offset by increased revenue.
The Water Storage and Delivery business achieved an EBITDA
result of $27.4 million compared to 2018/19 of $35.4 million.
The main factor was the increased revenue for the Connections
Project, which is eliminated in the consolidated accounts.
Positive operational cash flows of $36.7 million were achieved
compared to $8.8 million in 2018/19. As detailed above, several
‘one off’ factors can impact the operating results and present a
timing variance year by year, although it is important to note the
underlying EBITDA and operating cash performance remains
strong.
Performance – The Connections ProjectThe Connections Project received government funding of $115
million during 2019/20. Overall the Project entered the 2019/20
year with a strong cash position due to the funding received
ahead of the intensive construction period between May and
August. Cash holdings at 30 June 2020 were $143.8 million.
Subsequent EventsThere were no events after 30 June 2020 likely to affect GMW’s
financial performance in a material way.

YEAR IN REVIEW GOVERNANCE AND ORGANISATIONAL STRUCTURE
2019/20 Goulburn-Murray Water Annual Report 43
WORKFORCE DATA OTHER DISCLOSURES FINANCIAL STATEMENTS
Certification of Performance Report for 2019/20We certify that the accompanying Performance Report of
Goulburn-Murray Rural Water Corporation in respect of the
2019/20 financial year is presented fairly in accordance with the
Financial Management Act 1994.
The Performance Report outlines the relevant performance
indicators for the financial year as determined by the Minister for
Water and as set out in the 2019/20 Corporate Plan, the actual
and comparative results achieved for the financial year against
predetermined performance targets and these indicators, and an
explanation of any significant variance between the actual results
and performance targets and/or between the actual results in the
current year and the previous year.
As at the date of signing, we are not aware of any circumstances
which would render any particulars in the Performance Report to
be misleading or inaccurate.
Diane James AM
Chairman
3 September 2020
Charmaine Quick
Managing Director
3 September 2020
Michael Gomez
General Manager Business & Finance
3 September 2020

YEAR IN REVIEW GOVERNANCE AND ORGANISATIONAL STRUCTURE
2019/20 Goulburn-Murray Water Annual Report 44
WORKFORCE DATA OTHER DISCLOSURES FINANCIAL STATEMENTS
Performance Report
Financial IndicatorsKPI Number
Key Performance Indicator 2018/19 Result
2019/20 Result
2019/20 Target
Variance to prior
year
Variance to target
Notes
F1 Cash Interest CoverNet operating cash flows before net interest and tax/net interest payments
-2.2 -7.7 -6.0 250.0% 28.3% 1
F2 Gearing RatioTotal debt/total assets*100
2.2% 2.3% 2.3% 3.0% -0.8% 2
F3 Internal Financing RatioNet Operating cash flow less dividends/ net capital expenditure*100
-13.0% -51.9% -20.0% 299.7% 159.6% 3
F4 Current RatioCurrent assets/current liabilities (excluding long term employee provisions and revenue in advance)
8.2 times
2.6 times
2.1 times -68.3% 23.8% 4
F5 Return on AssetsEarnings before net interest and tax/average assets*100
-1.8% -1.6% -2.5% -12.9% -37.9% 5
F6 Return on EquityNet profit after tax/average total equity*100
-1.6% -1.4% -2.2% -13.2% -37.7% 6
F7 EBITDA MarginEarnings before Interest, Tax, Depreciation and Amortisation/total revenue*100
4.3% 9.5% -9.6% 120.6% -198.8% 7
Notes:
1. 1. Cash Interest Cover results year on year and against target are significantly impacted by timing of receipts and payments relating to the Connections Project. The result is negative in the current year due to the Connections Project receiving minimal grant funding for operations and instead reducing the unearned revenue balance
2. The Gearing Ratio in line with 2018/19. Borrowing and total debt have decreased while total assets have decreased in 2019/203. The Internal Financing Ratio is negative in the current year due to negative operating cash flows. This is due to timing of cash receipts relating to the
Connections Project as per Note 1.4. The Current Ratio has reduced from 8.2 in 2018/19 to 2.6 in 2019/20 due to a reduction in Connections Project Funding received. The ratio is favourable to
budget due to lower current liabilities offsetting the lower cash holdings for the Connections Project. 5. Return on Assets is favourable due to significantly lower loss before interest and tax than 2018/19 and budget. Return on Assets is negative as GMW reports
a net loss before net interest and tax due to the annual depreciation expense which was $103m in 2019/20 (2018/19 $100m and target $108m). GMW is regulated and pricing principles restrict GMW from pricing to fully recover statutory depreciation.
6. Return on Equity is unfavourable overall due to the net loss but favourable to the prior year and target due to lower loss after tax. Net profit after tax is negative for the same reasons as reported in Note 5 above.
7. EBITDA Margin is favourable in 2019/20 due to Connections funding revenue and lower asset disposals expenses resulting in a higher EBITDA 2019/20 ($25.6m) vs 2018/19 ($9.5m). The EBITDA margin target was negative due the Corporate Plan assumption of higher asset disposals.
Table 12: Results against financial performance indicators

YEAR IN REVIEW GOVERNANCE AND ORGANISATIONAL STRUCTURE
2019/20 Goulburn-Murray Water Annual Report 45
WORKFORCE DATA OTHER DISCLOSURES FINANCIAL STATEMENTS
Water Service Performance
KPI Number
Key Performance Indicator 2018/19 Result
2019/20 Result
2019/20 Target
Variance to prior
year
Variance to target
Notes
WSR1 Gravity: Rural water supply deliveriesNumber of orders delivered/total number of orders *100
92.9% 94% 93% 1.2% 1.1%
WSR1 Pumped: Rural water supply deliveriesNumber of orders delivered/total number of orders *100
98.9% 99.2% 98% 0.3% 1.2%
WSR2 Unavailability of Domestic and Stock supplyDuration that domestic and stock service is unavailable in excess of on-property storage
0% 0% 1.5% 0% -100% 1
WSR3 Groundwater supplyNumber of transfers processed within target period/total number of transfers processed *100
85.7% 81.3% 73% -5.1% 11.4% 2
Table 13: Performance against Water Performance Indicators
Notes:
1. Despite being shown as a negative variance; the 2019/20 result is a positive result with no unavailability during 2019/20.2. GMW achieved the target during the 19/20 season despite trending down from the 18/19 result. The variance between seasons was due to the high number
and nature of transactions coupled with resourcing constraints throughout transformation.
Customer ResponsivenessKPI Number
Key Performance Indicator 2018/19 Result
2019/20 Result
2019/20 Target
Variance to prior
year
Variance to target
Notes
CR4 Billing ComplaintsNumber of complaints per 1,000 customers
0.01 0.0 0.02 -100% -100% 1
Table 14: Performance against customer responsiveness performance indicators
Notes:
1. GMW continues to engage with customers and improve services and processes to minimise customer complaints. Customer billing is a function of the business that has not received a complaint this year, further improving on last year’s result.
Environmental PerformanceKPI Number
Key Performance Indicator 2018/19 Result
2019/20 Result
2019/20 Target
Variance to prior
year
Variance to target
Notes
E2 Net tonnes CO2 equivalent 11,977tonnes
9,577 tonnes
11,799 tonnes
-20.0% -18.8% 1, 2
Table 15: Performance against environmental performance indicators
Notes:
1. The purchase of green power and the decrease in electricity usage at GMWs staffed locations has contributed to lower total net greenhouse gas emissions for 2019/20.
2. GMW’s emissions target was incorrectly reflected in the 2019/20 Corporate Plan. The 2019/20 has been corrected and is reflected in this table.

YEAR IN REVIEW GOVERNANCE AND ORGANISATIONAL STRUCTURE
2019/20 Goulburn-Murray Water Annual Report 46
WORKFORCE DATA OTHER DISCLOSURES FINANCIAL STATEMENTS
Independent Auditor’s Report To the Board of the Goulburn-Murray Rural Water Corporation
Opinion I have audited the accompanying performance report of the Goulburn-Murray Rural Water Corporation (the corporation) for the year ended 30 June 2020, which comprises the:
• financial performance indicators • water service performance indicators • customer responsiveness performance indicators • environmental performance indicators • certification of performance report.
In my opinion, the performance report of the Goulburn-Murray Rural Water Corporation in respect of the year ended 30 June 2020, presents fairly, in all material respects, in accordance with the performance reporting requirements of Part 7 of the Financial Management Act 1994.
Basis for Opinion I have conducted my audit in accordance with the Audit Act 1994 which incorporates the Australian Standards on Assurance Engagements. I further describe my responsibilities under that Act and those standards in the Auditor’s Responsibilities for the Audit of the performance report section of my report.
My independence is established by the Constitution Act 1975. My staff and I are independent of the corporation in accordance with the ethical requirements of the Accounting Professional and Ethical Standards Board’s APES 110 Code of Ethics for Professional Accountants (the Code) that are relevant to my audit of the performance report in Victoria and have also fulfilled our other ethical responsibilities in accordance with the Code.
I believe that the audit evidence I have obtained is sufficient and appropriate to provide a basis for my opinion.
Board's responsibilities for the performance report
The Board is responsible for the preparation and fair presentation of the performance report in accordance with the performance reporting requirements of the Financial Management Act 1994, and for such internal control as the Board determines is necessary to enable the preparation and fair presentation of the performance report that is free from material misstatement, whether due to fraud or error.

YEAR IN REVIEW GOVERNANCE AND ORGANISATIONAL STRUCTURE
2019/20 Goulburn-Murray Water Annual Report 47
WORKFORCE DATA OTHER DISCLOSURES FINANCIAL STATEMENTS
2
Auditor’s responsibilities for the audit of the performance report
As required by the Audit Act 1994, my responsibility is to express an opinion on the performance report based on the audit. My objectives for the audit are to obtain reasonable assurance about whether the performance report as a whole is free from material misstatement, whether due to fraud or error, and to issue an auditor’s report that includes my opinion. Reasonable assurance is a high level of assurance but is not a guarantee that an audit conducted in accordance with the Australian Standards on Assurance Engagements will always detect a material misstatement when it exists. Misstatements can arise from fraud or error and are considered material if, individually or in the aggregate, they could reasonably be expected to influence the decisions of users taken on the basis of this performance report.
As part of an audit in accordance with the Australian Standards on Assurance Engagements, I exercise professional judgement and maintain professional scepticism throughout the audit. I also:
• identify and assess the risks of material misstatement of the performance report, whether due to fraud or error, design and perform audit procedures responsive to those risks, and obtain audit evidence that is sufficient and appropriate to provide a basis for my opinion. The risk of not detecting a material misstatement resulting from fraud is higher than for one resulting from error, as fraud may involve collusion, forgery, intentional omissions, misrepresentations, or the override of internal control.
• obtain an understanding of internal control relevant to the audit in order to design audit procedures that are appropriate in the circumstances, but not for the purpose of expressing an opinion on the effectiveness of the corporation’s internal control
• evaluate the overall presentation, structure and content of the performance report, including the disclosures, and whether the performance report represents the underlying events and results in a manner that achieves fair presentation.
I communicate with the Board regarding, among other matters, the planned scope and timing of the audit and significant audit findings, including any significant deficiencies in internal control that I identify during my audit.
MELBOURNE 10 September 2020
Paul Martin as delegate for the Auditor-General of Victoria

YEAR IN REVIEW GOVERNANCE AND ORGANISATIONAL STRUCTURE
2019/20 Goulburn-Murray Water Annual Report 48
WORKFORCE DATA OTHER DISCLOSURES FINANCIAL STATEMENTS
General Manager Strategy & Services Planning
Daniel Irwin
General Manager Water Delivery
Services Warren Blyth
General Manager Infrastructure
Delivery ServicesWarren Jose
General Manager Business and
FinanceMichael Gomez
General Manager Water Storage
ServicesMartina Cusack
General ManagerPeople, Culture
& SafetyGlenda Smith
General Manager Customers & Stakeholders
Ann Telford
Organisational Structure
Our business unitsOn a practical level, the employees of GMW are divided within
functionally separated division and business units, which work
collaboratively to achieve our strategic and operational business
objectives. GMW’s divisions for the 2019/20 financial year are as
follows:
Water Storage Services and Water Delivery Services are are
accountable for delivering services to our diverse customer base.
The focus is on delivering efficient and affordable water services
and being accountable for transparency in cost allocation. They
are responsible for providing customer service, retail, wholesale
and construction related operations. This includes, but is not
limited to, continual improvements in delivery of our customer
experience, implementation of lean business processes, and in
doing so reducing costs for customers, operation and monitoring
of key infrastructure including dams, channels, drains, pipelines
and associated assets, and engineering and technical support.
Infrastructure Delivery Services is responsible for providing
construction and maintenance services for the two operational
divisions, Water Delivery and Water Storages, as well as providing
services to external agencies.
Strategy and Service Planning works across GMW to support
the development of informed and effective business strategies
and plans, respond to sector policy matters, implement asset
management plans that align to GMW’s strategic service needs,
manage technical standards and provide accessible business
intelligence and data and information governance services.
Corporate Secretary
Chris Dalton
Board of Directors
Connections ProjectFrank Fisseler
Project Control Group
MinisterLisa Neville
Managing DirectorCharmaine Quick
Connections Project Stakeholder Committee
Diagram 3: Governance and organisational structure as at 30 June 2020

YEAR IN REVIEW GOVERNANCE AND ORGANISATIONAL STRUCTURE
2019/20 Goulburn-Murray Water Annual Report 49
WORKFORCE DATA OTHER DISCLOSURES FINANCIAL STATEMENTS
Corporate Secretariat provides support services to GMW in
the areas of strategic and operational corporate governance,
business integrity, regulatory and statutory compliance, and
corporate legal matters for the Board, Executive Team and the
overall business.
Business and Finance is comprised of three teams: Finance,
Information Technology and Commercial. The Finance team
supports the business with financial and regulatory accounting,
finance business partnering, accounts payable and revenue and
financial analysis. The Information Technology team supports
GMW with business systems administration, service desk
and infrastructure support, digital strategy and information
technology architecture, project delivery and security support.
The Commercial team includes the functions of procurement
and contracts, business improvement, facilities management,
statutory planning support, property and fleet management.
People, Culture and Safety supports GMW with human
resource and safety business partnering support, bringing to
life our strategic outcome of safe, skilled, engaged people. HR
functions include payroll services, change management, talent
development, management and acquisition. Our Safety, Wellbeing
and Environment team also manages our return to work function
and environmental support across the organisation.
Customers and Stakeholders is comprised of two teams, the
Communications and Engagement team and the Customer
Experience team. The Communications and Engagement team
provides support to GMW in the areas of internal and external
communications, education and awareness, customer and
stakeholder engagement, media, online management, events and
partnerships. The Customer Experience team provides support
to our external customers with water administration, customer
enquiries and support, accounts receivable, water trading and
land and licensing.
Managing Director’s Office includes the services of the Executive
Business Support team that provides high value business support
to the GMW divisions.
The Connections Project is responsible for the delivery of the
$2 billion Connections Project. The Project is the single most
important upgrade of the GMID in its 100-year history. The
Project improves farm productivity, reduces the GMID footprint
and benefits the health of the local environment and the Murray-
Darling Basin by generating water savings through infrastructure
upgrades.
Board of DirectorsIndependent directorsThe independent non-executive directors for the financial year
were:
Diane James AM, Chairman
Diane James AM is a business consultant and company director.
Her career includes establishing two start-up companies and
serving on numerous state and national boards. She is Chairman
of Southern Rural Water and a former director of Barwon Water.
Diane was a founding director of GenU, a national disability,
ageing and lifestyle services organisation and was Chairman
of the Victorian Coastal Council for 12 years. In recognition
of her contribution to the environment and natural resource
management, Diane was awarded a Member of the Order of
Australia (AM) in 2011.
She is an accredited leadership coach, holds a Graduate
Certificate in Innovation and Entrepreneurship and is a Fellow of
the Australian Institute of Company Directors.

YEAR IN REVIEW GOVERNANCE AND ORGANISATIONAL STRUCTURE
2019/20 Goulburn-Murray Water Annual Report 50
WORKFORCE DATA OTHER DISCLOSURES FINANCIAL STATEMENTS
Margot Henty
Margot Henty has been an irrigation dairy farmer at Cohuna
for 30 years and has strong understanding of water use and
management in the Goulburn Murray region.
She is a director of the board of Water Partners Australia, a water
trading business operating not-for-profit. Margot has contributed
extensively to regional resource management plans over the
last thirty years of changing times, including the Torrumbarry
Reconfiguration and Asset Modernisation Strategy and the Barr
Creek Salinity Management Plan.
Ms Henty has a Bachelor of Arts and Graduate Diploma in
Education (Geography). MAICD.
Alana Johnson AM
Alana Johnson AM is a rural development specialist and principal
of Lurg Cattle Co.
She is Acting Chair of the Victorian Catchment Management
Council, Chair of the Victorian Women’s Trust, past President
of Voices for Indi and founding member of Australian Women in
Agriculture.
Alana has served on a range of Ministerial advisory committees
and statutory and not-for-profit boards. She was named in the
inaugural 100 Women of Influence in Australia by the Australian
Financial Review and the inaugural 100 Women in Australian
Agribusiness by Rural Press and was the Rural Women’s Award
Victorian winner and Australian runner up in 2010. Alana was
inducted onto the Victorian Honour Roll of Women in 2018.
Alana is a graduate of the Australian Rural Leadership Program
and the Australian Institute of Company Directors and holds a BA
and BSW.
In recognition of her service to women through leadership and
advisory roles, Alana was awarded an Order of Australia (AM) in
2020.
Patrick McNamara, Deputy Chairman
Patrick McNamara was formerly a member of the Victorian
Legislative Assembly representing Benalla. He was Deputy
Premier of Victoria from 1992 to 1999 and held several ministerial
positions, including Minister for Agriculture and Resources
(including water), Minister for Tourism, Minister for Police and
Emergency Services and Minister for Corrections.
Patrick was appointed Chair of the Victorian Bushfire Appeal
Advisory Panel in early 2020, after chairing the 2009 Bushfire
Appeal. He is the Chair of the Connections Project Control Group.
Jonathan Koop
Jonathan Koop was appointed a Goulburn-Murray Water director
in October 2017, having previously served as director with North
East Water.
Jonathan owns and manages a 700-hectare grazing and cropping
property in north east Victoria (part-time 12 years, full-time
since 2010). Previously Jonathan had a career in senior finance
positions with Murdoch Books Pty Ltd (2008 to 2011), where he
was also Company Secretary, Fairfax Media Ltd (2003 to 2007),
and TNT Express (2001 to 2003).
Jonathan has a Bachelor of Economics and is a Chartered
Accountant and Graduate of the Australian Institute of Company
Directors.

YEAR IN REVIEW GOVERNANCE AND ORGANISATIONAL STRUCTURE
2019/20 Goulburn-Murray Water Annual Report 51
WORKFORCE DATA OTHER DISCLOSURES FINANCIAL STATEMENTS
Margaret O’Rourke
Margaret O’Rourke is a former General Manager of Telstra.
Margaret’s leadership roles in Telstra involved working
extensively in regional, rural and remote communities
throughout Australia. These roles also included infrastructure,
sales and customer experience.
Margaret is a consultant to industry using her specialist
skills in digital economy strategies, community facilitation,
telecommunications infrastructure and leadership consultancy;
which has taken a back seat since becoming a Councillor at the
City of Greater Bendigo (CoGB) in 2016.
She is currently Mayor of CoGB and Deputy Chair of Bendigo
Kangan Institute.
Margaret is also a Fellow of the Australian Institute of Company
Directors.
Dennis Quinn
Dennis Quinn has a background in engineering, marketing and
sales management. He operates a small beef farm in North East
Victoria.
Dennis’s previous roles have included CEO at Engenco Ltd and
Managing Director and General Manager of Cummins South
Pacific. Dennis has also spent many years in senior positions
in large multi-national industrial businesses. These businesses
operated both in Australia and the USA in the agricultural and
construction sectors.
Dennis has a Master of Arts (Marketing) from Macquarie
University, a Bachelor of Engineering (Agr) from Melbourne
University and is a graduate member of Australian Institute of
Company Directors.
Ari Suss
Ari Suss is CEO of Fox Special Projects, part of the private family
investment arm of the Linfox Group, joining the company in 2004.
Ari is also a Board Member of Avalon Airport Australia.
Between 1999 and 2004, Ari was a senior adviser to former
Premier Steve Bracks. During this time, he specialised in policy
and advice in the areas of infrastructure development, transport,
ports, major projects, multicultural affairs and parliamentary
strategy.
In 2011, Ari also commenced in his role as General Manager of
the Linfox-owned Australian Automotive Research Centre, an
1100-hectare vehicle test facility in Anglesea, Victoria.
In 2018, Ari was appointed a director of Fed Square Pty Ltd.
Ari has a Master’s degree in Public Policy and Management
from Monash University, is a graduate member of the Australian
Institute of Company Directors, and has completed leadership
studies at Harvard Business School.
David McKenzie
David McKenzie is a property valuer based in Shepparton,
specializing in the valuation of agricultural supply chain assets
and water assets. He is regarded as one of the foremost experts
in Australia in the analysis of water markets and valuation of
water assets.
David has a long history in the Victorian water sector, having
served as a director of Goulburn Valley Water for five years,
and Chair of North East Water for six years, before joining GMW
in 2018. David co-Chairs the GMID Water Leadership Forum,
a water policy think tank. David was the inaugural Chair of the
Committee for Greater Shepparton.
David also chairs the Goulburn Regional Partnership and the
Regional Development Advisory Committee, reporting directly to
the Victorian Minister for Regional Development.
David has also served as a member of the Commonwealth Water
Minister’s independent socio-economic advisory panel, exploring
the impact of water reform on the communities and industries of
the Murray-Darling Basin.

YEAR IN REVIEW GOVERNANCE AND ORGANISATIONAL STRUCTURE
2019/20 Goulburn-Murray Water Annual Report 52
WORKFORCE DATA OTHER DISCLOSURES FINANCIAL STATEMENTS
Executive DirectorCharmaine Quick (Managing Director)
Charmaine Quick joined GMW with more than two decades of
experience in the water industry and a strong history in leading
change.
Prior to her appointment at GMW, Charmaine was the Executive
General Manager, Service Delivery at Melbourne Water. She
is known for her ability to influence and drive change at an
organisation level, nationally and internationally for asset
management, relationship contract management and customer
service.
Charmaine is a long-time Shepparton resident and grew
up on the family farm in the Wimmera, which helped her
understand the value of water and its importance to the region’s
communities.
Charmaine’s qualifications include Bachelor of Civil Engineering
(Melbourne University), and Master Environmental Science
(Monash University), and she is also a graduate of the Australian
Institute of Company Directors.
Conflicts of interestsGMW’s directors and committee members declare their potential
and/or actual conflicts of interest (including pecuniary interests):
• in their declaration of interests: directors complete their
declarations upon appointment and then review them at
least annually
• in a list of standing declarations that is included in the
Meeting papers for each Board and Committee meeting
• whenever a matter arises at a Board meeting that would
constitute an actual conflict of interest: the director is then
excluded from the meeting when that matter is discussed
and decided upon.
Directors Dennis Quinn, Margot Henty, Patrick McNamara and
Jonathan Koop are customers of GMW. Section 110(2)(a) of the
Water Act 1989 provides that being a customer of GMW is not a
pecuniary interest (conflict of interest) if the director is receiving
a service in common with other customers.
Board meetings Directors attended the following scheduled meetings:
Names Board Risk, Audit & Finance
People & Culture
Customer & Stakeholder
Service Planning
Ordinary Special
Margot Henty 9/9 3/4 1/2 2/3 2/2
Diane James AM1 9/9 3/4 2/3 3/4 3/3 2/2
Alana Johnson AM 8/9 3/4 2/2 3/3
Jonathan Koop 9/9 3/4 3/3 2/2
Patrick McNamara 9/9 3/4 1/1
David McKenzie 8/9 3/4 2/2 1/2 2/2
Marg O’Rourke 9/9 3/4 2/3 1/1
Charmaine Quick 8/9 3/4 3/3 4/4 2/3 2/2
Dennis Quinn 7/9 3/4 3/3 4/4 2/2
Ari Suss 8/9 3/4 4/4 2/3
Number attended/eligible to attend
Table 16: Board member attendance and eligibility from 1 July 2019.
1. The Chairman is an ex-officio member of all Committees. She is not required to attend the committee meetings, but if she does, she is able to vote.

YEAR IN REVIEW GOVERNANCE AND ORGANISATIONAL STRUCTURE
2019/20 Goulburn-Murray Water Annual Report 53
WORKFORCE DATA OTHER DISCLOSURES FINANCIAL STATEMENTS
Board Committees The Board establishes committees with specific objectives in order to use directors’ time more efficiently. These committees make
recommendations to the Board. The Board retains collective responsibility for decision making. The membership of these committees
consists of directors.
From 1 July 2019 to 30 June 2020 the following Board committees operated:
Committee Purpose
People and Culture
Chair: Dennis Quinn
Oversees GMW’s:
• remuneration policy
• management remuneration
• diversity policies and initiatives
• culture
• management and mitigation of health, safety and wellbeing risks
Customer and Engagement
Chair: Alana Johnson AM
Oversees GMW’s:
• strategic engagement with its customers and stakeholders
• performance against its customer service standards
Risk, Audit and Finance
Chair: Jonathan Koop
Oversees GMW’s:
• financial reporting
• internal and external audit function
• risk management and compliance
• annual budget
• annual financial statements
Service Planning
Chair: David McKenzie
Oversees GMW’s:
• development, implementation and review of innovative strategies/programs
• contribution of strategic asset management planning
• capital works program and research program
• development of capital expenditure measures, targets and benchmarks
• implementation of the Asset Management Accountability Framework (AMAF)
Table 17: GMW Board committees and purpose.

YEAR IN REVIEW GOVERNANCE AND ORGANISATIONAL STRUCTURE
2019/20 Goulburn-Murray Water Annual Report 54
WORKFORCE DATA OTHER DISCLOSURES FINANCIAL STATEMENTS
Audit Committee Membership and Roles GMW during 2019/20 had a Risk, Audit and Finance Committee. The key responsibilities of this Committee are shown above.
Membership of this Committee consisted of independent members appointed by the Board. The following persons were the independent
members of the Committee in 2019/20:
Jonathan Koop Member (Chair)
Margot Henty Member (to 30 December 2020)
Marg O’Rourke Member
Dennis Quinn Member
Patrick McNamara Member (from 1 January 2020)
Diane James AM Ex-officio member
Meetings of the Committee were held quarterly and at any other time on
request of a committee member. In 2019/20, the Risk, Audit and Finance
Committee met three times.
Table 18: Membership of GMW’s Audit Committee.
Connections Project Control GroupThe role of the Connections Project Control Group (PCG) is to:
• oversee, monitor and be responsible for the management
and delivery of the Connections Project
• ensure effective project governance
• ensure appropriate use of government funds in accordance
with funding agreements
• ensure key stakeholder requirements are met during the
implementation of the project
• notify the GMW Board and governments of any material
variations to the project.
• The Connections PCG has a direct reporting line to both the
GMW Board and the Minister for Water.
Membership of the Connections PCG during 2018/19 consisted of:
• Peter McManamon (Chair until 7 August 2020)
• Patrick McNamara (Chair from 8 August 2020
• Campbell Fitzpatrick
• Frank Fisseler (non-voting member)
• Richard Anderson (non-voting member)
• Charmaine Quick (non-voting member)
Water Services CommitteesWater Services Committees are advisory committees to the
Board, created under section 122(c) of the Water Act 1989. The
committees are comprised of customers proposed or voted
for and appointed by the Board. There are six gravity irrigation
committees, four regional committees and one water district
committee.

YEAR IN REVIEW GOVERNANCE AND ORGANISATIONAL STRUCTURE
2019/20 Goulburn-Murray Water Annual Report 55
WORKFORCE DATA OTHER DISCLOSURES FINANCIAL STATEMENTS
Occupational Health and Safety The 2019/20 period saw GMW successfully transition our accredited OHS Management System from AS/NZS 4801 and OHSAS 18001 to the
new ISO45001 standard.
The Safety, Wellbeing and Environment team has reviewed its current Safety Management System (SMS) and has identified a number of
opportunities to make it simpler and easier to apply in the field. This review, combined with the 2020-2024 Safety Strategy will introduce
simplicity and accountability in safety over the next 12 to 18 months.
Key Performance Indicators
2013/14 2014/15 2015/16 2016/17 2017/18 2018/19 2019/20
Number of health and safety employee representative committees
9 8 3 4 8 7 5
Number of lost time injuries for the year 16 16 16 16 11 10 9
Lost Time Injury Frequency Rate (lost time injuries per million hours worked)
13.1 13.2 11.2 12.8 9.1 9.4 7.08
Average Lost Time Rate (average number of days lost per lost time injury)
10.1 22.8 25.7 6.9 26.1 4.2 43.33
Number of reported hazards/incidents for the year per 100 full-time equivalent staff members
25.6 17.8 15.4 13.5 11.1 20.5 52.5
Number of lost time standard claims for the year per 100 full-time equivalent staff members
0.94 1.19 1.16 0.67 1.72 0.61 0.023
Average cost per claim for the year (including payments to date and an estimate of outstanding claim costs as advised by WorkSafe)
$4,469 $52,215 $73,860 $15,655 $34,449 $5,020 $51,221
Updated: Average cost per claim for the year (including payments to date and an estimate of outstanding claim costs as advised by WorkSafe)
$105,722 $112,796 $61,420 $28,400 $26,588 $51,221
Table 19: Results against occupational health and safety key performance indicators.
Rehabilitation and Return to WorkIn 2019/20 GMW has focused on working with staff and management to make sure staff have access to rehabilitation services to ensure they
make a sustainable, early and safe return to work. With changes to positions and roles as part of transformation, a focus has been placed
on making sure staff physical capabilities are matched to the new or altered positions.
Injuries sustained 2019/20 average cost claim figure has increased due to the type of injury sustained and delay in treatment via specialist
medical consultations due to COVID-19. Three of the nine lost time injuries recorded this financial year averaged 98 days of lost time. These
three claims relating to back injuries from manual handling tasks, have significantly inflated GMW’s safety statistics, overshadowing all the
good work done in 2019/20.
Manual handling and body stressing dominated the types of injuries sustained this financial year as well as mental health, slip, trips and
falls.

YEAR IN REVIEW GOVERNANCE AND ORGANISATIONAL STRUCTURE
2019/20 Goulburn-Murray Water Annual Report 56
WORKFORCE DATA OTHER DISCLOSURES FINANCIAL STATEMENTS
Public Administration Values and Employment PrinciplesGMW has continued to comply with all employment obligations
relevant to its business including those within the Equal
Employment Opportunity Act 2010, the Public Administration Act
2004 and the Disability Act 2006.
Consistent with these obligations and in support of GMW’s
commitment to be a high performing organisation, a number of
initiatives have taken place over 19/20. These have included a
whole of organisation realignment and restructure, a retirement
program, development of a new People and Culture Strategy and
implementation of a five-year program of work as part of that
strategy to develop our leadership and improve our culture.
GMW continues to celebrate major diversity and inclusion dates
and is an active member of many community working groups to
enhance diversity and inclusion not only for our own employees
but also our wider community.
Celebrating our diverse workforce and working closely with our
wider community sends an important message from our business
that everyone should feel included and valued. Our 2020 Culture
Survey outcomes confirm that our employees do feel valued and
that they can be their authentic selves at work.
Comparative workforce dataThrough our restructure, GMW has seen some significant
changes to the workforce make up and numbers. This has
resulted in customer savings through reducing labour spend.
Even without the need for increased working from home due to
COVID-19, GMW has seen an increase year on year for accessing
flexible working arrangements with work life blend being the
highest scoring culture outcome.
GMW employs a total of 552 staff (figures include full time,
part time, casual employees and exclude Directors and Chair)
equivalent to 534.4 FTE.
The demographic data for GMW’s workforce for the period 1 July
2019 – 30 June 2020 is listed below:
Employee Demographic
Ongoing employees Fixed term and casual Total
Number (headcount)
Full time (headcount)
Part time (headcount)
FTE Headcount FTE Number(Headcount)
June 2020 463 434 29 451.4 89 83.0 552
June 2019 507 468 39 495.4 147 132.5 654
Table 20: GMW’s workforce data by classification.

YEAR IN REVIEW GOVERNANCE AND ORGANISATIONAL STRUCTURE
2019/20 Goulburn-Murray Water Annual Report 57
WORKFORCE DATA OTHER DISCLOSURES FINANCIAL STATEMENTS
Employee Demographics
June 20 June 19
Ongoing Fixed term and casual Ongoing Fixed term and casual
Number (headcount)
FTE Number headcount
FTE Number headcount
FTE Number (headcount)
FTE
Gender
Male 347 346.0 52 50.4 391 388.2 96 84.9
Female 116 105.4 37 32.7 116 107.2 51 47.6
Age
< 25 7 6.6 3 2.3 1 1.0 11 7.1
25 – 34 82 76.8 18 16.5 73 69.6 34 32.6
35 – 44 120 116.8 23 21.3 131 128.2 32 29.6
45 – 54 146 144.8 18 17.7 147 145.2 28 27.7
55 – 64 95 93.7 23 22.4 132 129.8 37 33.2
65> 13 12.7 4 2.8 23 21.7 5 2.3
Classification
Band A 78 75.6 9 7.3 99 97.2 22 16.0
Band B 151 147.0 7 6.8 165 161.4 19 18.8
Band C 104 101.4 26 23.2 117 113.7 42 38.9
Band D 81 78.5 17 16.9 73 70.7 28 26.0
Band E 26 26.0 14 12.8 35 34.6 13 12.4
Band F 23 23.0 7 7.0 18 17.8 15 15.0
EO 0 0.0 9 9.0 0 0.0 8 5.3
Table 21: GMW’s workforce data by classification, gender and age demographics.
GMW has implemented and actively promotes to our staff the
following strategies, procedures and policies that demonstrate
we are working towards achieving a balanced workforce:
• GMW People and Culture Strategy
• GMW Gifts, Benefits and Hospitality Policy framework
• GMW Conflict of Interest Policy.
• Victorian Public Sector Code of Conduct
• Victorian Charter of Human Rights.
• Family Violence Policy
GMW continues to grow our extensive online course library
along with scheduled classroom-style training to ensure
that all policies and expected employee workplace practices
are explained to all new and existing employees to ensure
compliance and adherence.
Any employee or candidate can voice any grievance, dispute any
decision or give feedback. GMW’s dispute resolution processes
through the Human Resources Department allow for escalation
points to the General Manager of People Culture and Safety to
ensure that all issues are dealt with in a timely manner.
GMW also provides an Employee Assistance Program (EAP)
through Career Money Life (CML), which has a range of quality
psychologists and counsellors across northern Victoria as well
as a telephone and online counselling services. The service is
completely confidential and no identifiable information is passed
onto the business. It is also available for the family members of
our employees.
Workforce Inclusion Policy
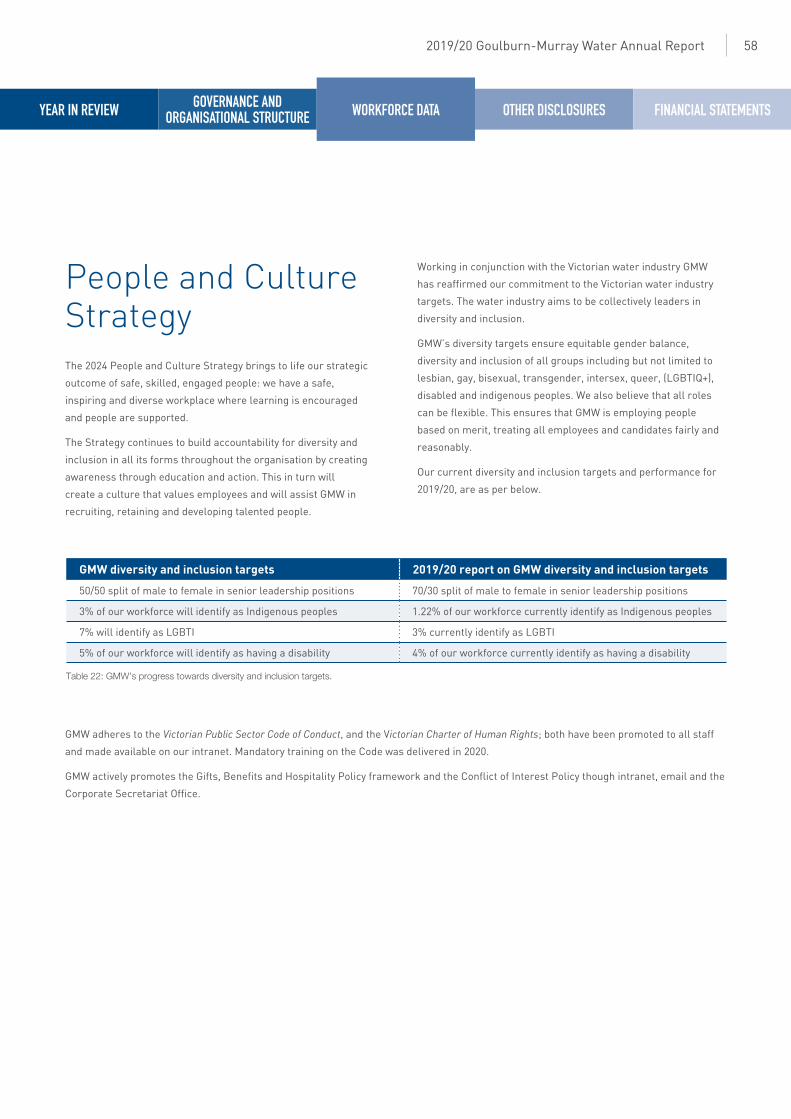
YEAR IN REVIEW GOVERNANCE AND ORGANISATIONAL STRUCTURE
2019/20 Goulburn-Murray Water Annual Report 58
WORKFORCE DATA OTHER DISCLOSURES FINANCIAL STATEMENTS
People and Culture StrategyThe 2024 People and Culture Strategy brings to life our strategic
outcome of safe, skilled, engaged people: we have a safe,
inspiring and diverse workplace where learning is encouraged
and people are supported.
The Strategy continues to build accountability for diversity and
inclusion in all its forms throughout the organisation by creating
awareness through education and action. This in turn will
create a culture that values employees and will assist GMW in
recruiting, retaining and developing talented people.
Working in conjunction with the Victorian water industry GMW
has reaffirmed our commitment to the Victorian water industry
targets. The water industry aims to be collectively leaders in
diversity and inclusion.
GMW’s diversity targets ensure equitable gender balance,
diversity and inclusion of all groups including but not limited to
lesbian, gay, bisexual, transgender, intersex, queer, (LGBTIQ+),
disabled and indigenous peoples. We also believe that all roles
can be flexible. This ensures that GMW is employing people
based on merit, treating all employees and candidates fairly and
reasonably.
Our current diversity and inclusion targets and performance for
2019/20, are as per below.
GMW diversity and inclusion targets 2019/20 report on GMW diversity and inclusion targets
50/50 split of male to female in senior leadership positions 70/30 split of male to female in senior leadership positions
3% of our workforce will identify as Indigenous peoples 1.22% of our workforce currently identify as Indigenous peoples
7% will identify as LGBTI 3% currently identify as LGBTI
5% of our workforce will identify as having a disability 4% of our workforce currently identify as having a disability
Table 22: GMW’s progress towards diversity and inclusion targets.
GMW adheres to the Victorian Public Sector Code of Conduct, and the Victorian Charter of Human Rights; both have been promoted to all staff
and made available on our intranet. Mandatory training on the Code was delivered in 2020.
GMW actively promotes the Gifts, Benefits and Hospitality Policy framework and the Conflict of Interest Policy though intranet, email and the
Corporate Secretariat Office.

YEAR IN REVIEW GOVERNANCE AND ORGANISATIONAL STRUCTURE
2019/20 Goulburn-Murray Water Annual Report 59
WORKFORCE DATA OTHER DISCLOSURES FINANCIAL STATEMENTS
Executive Officer dataAn Executive Officer (EO) is defined as a person employed as an EO at an annual remuneration rate not less than an EO employed by a
department.
The following tables disclose the EOs of GMW for 2019/20:
• Table 23 discloses the number of EOs for GMW broken down by gender
• Table 24 provides a reconciliation of EO numbers presented between the report of operations and Note 10.3 in the financial statements
• Both tables also disclose the variations, denoted by ‘var’, between the current and previous reporting periods
Executive Officers
All Male Female Self-described
Class No. Var. No. Var. No. Var. No. Var.
EO 1 2 (1) 1 (1) 1 0 0 N/A
EO 2 7 2 4 0 3 2 0 N/A
EO 3 0 (1) 0 (1) 0 0 0 N/A
Total 9 0 5 (2) 4 2 0 N/A
The number of executives in the report of operations is based on the number of executive positions that are occupied at the end of the
financial year. Note 10.3 in the Financial Statements lists the actual number of and amount of remuneration paid to EOs over the course
of the reporting period. The Financial Statements note does not include the Accountable Officer, distinguish between executive levels or
disclose separations. Separations are those executives who have left GMW during this year. To assist readers, these two disclosures are
reconciled below.
Executive Officers
Indicator 2020 2019
Executive 9 8
Accountable Officer 1
Less Separations 2
Total Executives at June 30 9 7
The total number of executives stated above represents EOs who were employed under Victorian Government Sector Executive contracts,
but does not include employees acting in EO positions employed under the GMW 2018 Enterprise Agreement.
Table 23: Breakdown of EOs into gender.
Table 24: Reconciliation of executive numbers.

YEAR IN REVIEW GOVERNANCE AND ORGANISATIONAL STRUCTURE
2019/20 Goulburn-Murray Water Annual Report 60
WORKFORCE DATA OTHER DISCLOSURES FINANCIAL STATEMENTS
Local Jobs First The Victorian Industry Participation Policy Act 2003 requires
government departments and agencies to report on
commitments and outcomes against the Victorian Industry
Participation Policy (VIPP) under the VIPP Act, relating to
procurement activities that meet or exceed $1 million in regional
Victoria.
DEDJTR is responsible for implementing the VIPP across the
Victorian Government on behalf of the Minister for Regional
Development and Minister for Industry and Employment.
GMW has submitted our annual return which forms part of the
department’s annual report.
Disclosure of major contracts During 2019/20 GMW commenced one contract valued at
$1,460,000 (inclusive of GST) in value, to which the VIPP was
applied. This contract covers regional projects.
Government Advertising Expenditure GMW’s expenditure on government campaign expenditure in the
2019/20 reporting period did not exceed $100,000 (excl. GST).
Consultancy Expenditure In 2019/20, there were five consultancies, all in excess of
$10,000, related to the Water Storage and Delivery business. The
total expenditure incurred during 2019/20 in relation to these
consultancies is $835,985 (excl. GST).
In 2019/20, there were 12 consultancies in excess of $10,000,
and two consultancies below $10,000 related to the Connections
Project. The total expenditure incurred during 2019/20 in relation
to these consultancies is $221,185.60 (excl. GST).
Please note that the number of consultants refers to the number
of consultants GMW used, not the number of times GMW used
consultants.
Details of individual consultancies can be viewed at
www.gmwater.com.au under the annual reports section and in
Appendix D of this Report.
Project Division Tender # Value (incl gst)
Internal Audit Services
GMW 2069 $1,460,000
Table 25: Major contracts
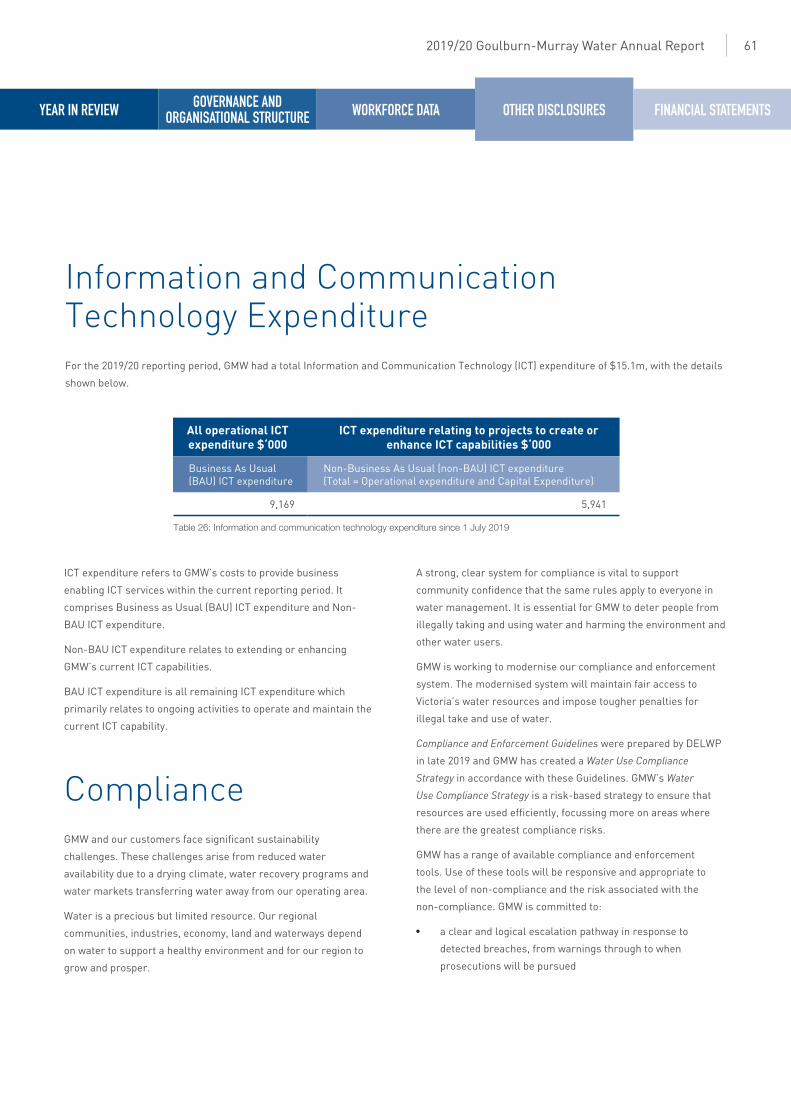
YEAR IN REVIEW GOVERNANCE AND ORGANISATIONAL STRUCTURE
2019/20 Goulburn-Murray Water Annual Report 61
WORKFORCE DATA OTHER DISCLOSURES FINANCIAL STATEMENTS
ICT expenditure refers to GMW’s costs to provide business
enabling ICT services within the current reporting period. It
comprises Business as Usual (BAU) ICT expenditure and Non-
BAU ICT expenditure.
Non-BAU ICT expenditure relates to extending or enhancing
GMW’s current ICT capabilities.
BAU ICT expenditure is all remaining ICT expenditure which
primarily relates to ongoing activities to operate and maintain the
current ICT capability.
Compliance GMW and our customers face significant sustainability
challenges. These challenges arise from reduced water
availability due to a drying climate, water recovery programs and
water markets transferring water away from our operating area.
Water is a precious but limited resource. Our regional
communities, industries, economy, land and waterways depend
on water to support a healthy environment and for our region to
grow and prosper.
A strong, clear system for compliance is vital to support
community confidence that the same rules apply to everyone in
water management. It is essential for GMW to deter people from
illegally taking and using water and harming the environment and
other water users.
GMW is working to modernise our compliance and enforcement
system. The modernised system will maintain fair access to
Victoria’s water resources and impose tougher penalties for
illegal take and use of water.
Compliance and Enforcement Guidelines were prepared by DELWP
in late 2019 and GMW has created a Water Use Compliance
Strategy in accordance with these Guidelines. GMW’s Water
Use Compliance Strategy is a risk-based strategy to ensure that
resources are used efficiently, focussing more on areas where
there are the greatest compliance risks.
GMW has a range of available compliance and enforcement
tools. Use of these tools will be responsive and appropriate to
the level of non-compliance and the risk associated with the
non-compliance. GMW is committed to:
• a clear and logical escalation pathway in response to
detected breaches, from warnings through to when
prosecutions will be pursued
All operational ICT expenditure $‘000
ICT expenditure relating to projects to create or enhance ICT capabilities $‘000
Business As Usual (BAU) ICT expenditure
Non-Business As Usual (non-BAU) ICT expenditure (Total = Operational expenditure and Capital Expenditure)
9,169 5,941
Table 26: Information and communication technology expenditure since 1 July 2019
Information and Communication Technology Expenditure For the 2019/20 reporting period, GMW had a total Information and Communication Technology (ICT) expenditure of $15.1m, with the details
shown below.

YEAR IN REVIEW GOVERNANCE AND ORGANISATIONAL STRUCTURE
2019/20 Goulburn-Murray Water Annual Report 62
WORKFORCE DATA OTHER DISCLOSURES FINANCIAL STATEMENTS
• an emphasis on engagement, education and awareness
raising
• working in good faith with all parties and use our
enforcement powers only when needed.
GMW will be transparent about our water use compliance
strategies, protocols and compliance and enforcement activities.
Compliance priorities for the 2019/20 year included:
• development of GMW’s Water Use Compliance Strategy
• development of GMW’s Water Use Compliance Policy and
Procedure
• regular desktop audits of water users to ensure water use
does not exceed allocation allowance
• inspections to detect unauthorised users and/or uses of
water
• actively pursuing complaints in relation to alleged breaches
of compliance
• inspecting properties with irregular water trading and
water-use activity patterns over the irrigation season
• reading meters outside scheduled meter reads
• spot checks for illegal infrastructure or tampering with
meters
• reviewing licences to ensure correct details and authorised
pumping location
• educating customers regarding their obligations when
taking and using water
• cautioning and, where necessary, prosecuting offences
under the Act
• 766 advisory and 128 caution letters sent to customers
advising they had exceeded their water allocation and
advising of potential prosecution
• investigating complaints received alleging breaches of the
Act and issuing notices of contravention
• additional meter readings where overuse has been detected
or previous unauthorised use has been identified
• commencing 19 prosecutions in the Magistrates’ Court
of Victoria for unauthorised take and use of water and/or
unauthorised works
• licensing unit reviewing licences and revoking licences
where necessary.
Minister for Water Lisa Neville appointed Des Pearson as an
independent advisor to lead an independent review of systems
and processes of Water Corporations with non-urban customers,
ensuring adequate compliance measures are in place to meet the
Ministers expectations of zero tolerance of unauthorised take.
GMW has worked with Mr Pearson in undertaking this review and
supports the recommendations arising from the review. GMW has
incorporated these recommendations into the development of its
Compliance and Enforcement Plan. GMW is developing this Plan
as part of the Strategic Framework approved by the GMW Board
in February 2020.
Freedom of Information The Freedom of Information Act 1982 (the FOI Act) allows the
public a right of access to documents held by GMW. The
purpose of the FOI Act is to extend as far as possible the right
of the community to access information held by government
departments, local councils, Ministers and other bodies subject
to the FOI Act.
An applicant has a right to apply for access to documents held
by GMW. This comprises documents both created by GMW or
supplied to GMW by an external organisation or individual, and
may also include maps, films, microfiche, photographs, computer
printouts, computer discs, tape recordings and videotapes.
The FOI Act allows GMW to refuse access, either fully or partially,
to certain documents or information. Examples of documents
that may not be accessed include: some internal working
documents; law enforcement documents; documents covered
by legal professional privilege, such as legal advice; personal
information about other people; and information provided to GMW
in-confidence.

YEAR IN REVIEW GOVERNANCE AND ORGANISATIONAL STRUCTURE
2019/20 Goulburn-Murray Water Annual Report 63
WORKFORCE DATA OTHER DISCLOSURES FINANCIAL STATEMENTS
From 1 September 2017, the FOI Act has been amended to reduce
the Freedom of Information (FOI) processing time for requests
received from 45 to 30 days. However, when external consultation
is required under section and subsection 29, 29A, 31, 31A, 33,
34 or 35, the processing time automatically reverts to 45 days.
Processing time may also be extended by periods of 30 days, in
consultation with the applicant. With the applicant’s agreement
this may occur any number of times. However, obtaining an
applicant’s agreement for an extension cannot occur after the
expiry of the timeframe for deciding a request.
If an applicant is not satisfied by a decision made by GMW, under
section 49A of the FOI Act, they have the right to seek a review
by the Office of the Victorian Information Commissioner (OVIC)
within 28 days of receiving a decision letter.
Making a requestAccess to documents can be obtained through a written request
to GMW’s Freedom of Information Officer, as detailed in s 17 of
the FOI Act.
Requests must be made in writing, provide necessary information
to identify the documents sought and be accompanied by a $29.60
application fee. If payment of the application fee would cause
hardship, it may be waived or reduced. Additional access charges
may also apply.
An FOI Application Form can be found on GMW’s website at
www.gmwater.com.au/about/foi.
Requests for documents in the possession of GMW should be
addressed to:
Freedom of Information Officer
Goulburn-Murray Water
PO Box 165
TATURA VIC 3616
Or, by email to [email protected]
FOI statistics/timelinesDuring 2019/20, GMW received 16 new FOI requests. Of those,
13 requests related to Water Storage and Delivery, and three
requests related to the Connections Project. Requests were
received from various sections of the community including
individuals, community groups, solicitors and organisations.
GMW made 11 FOI decisions during the 12 months ended 30 June
2020.
Ten decisions were made within the statutory 30 day time period;
and one decision was made within 46 to 90 days.
During 2019/20, one request was subject to review by OVIC, and
OVIC received two complaints concerning FOI requests handled
by GMW.
There were no applications made to the Victorian Civil and
Administrative Tribunal to review an FOI decision.
Further informationFurther information regarding the operation and scope of FOI can
be obtained from the FOI Act; regulations made under the FOI
Act; and www.ovic.vic.gov.au
Energy and Water Ombudsman (Victoria) Limited GMW is a member of the Energy and Water Ombudsman
(Victoria) (EWOV) Dispute Resolution Scheme, which provides
an independent third-party reconciliation process for resolving
complaints by customers of electricity, gas and water service
providers in Victoria.

YEAR IN REVIEW GOVERNANCE AND ORGANISATIONAL STRUCTURE
2019/20 Goulburn-Murray Water Annual Report 64
WORKFORCE DATA OTHER DISCLOSURES FINANCIAL STATEMENTS
During the 2019/20 financial year, EWOV referred 78 matters to
GMW. The nature of these complaints is outlined as follows:
As at 30 June 2020, there were three outstanding complaints
against GMW being investigated by EWOV.
The Energy and Water Ombudsman (Victoria) may be contacted
by writing to:
The Energy and Water Ombudsman (Victoria)
Replay Paid 469
MELBOURNE VIC 8060
Or, by telephone on 1800 500 509
Compliance with the Building Act 1993GMW owns or controls premises at Tatura, Shepparton,
Cobram, Wangaratta, Lake Hume Village, Dartmouth, Buffalo
River, Eildon, Kyabram, Rochester, Cohuna, Kerang, Swan Hill,
Pyramid Hill, Mildura, Cairn Curran, Laanecoorie, Tullaroop,
Eppalock, Waranga, Yarrawonga, Goulburn Weir, Torrumbarry,
Lake Nillahcootie and Lake William Hovell, and consequently
is required to include a statement on its compliance with the
building and maintenance provisions of the Building Act 1993 in
relation to those buildings.
GMW requires appropriately qualified consultants and
contractors to be engaged for all proposed works on land
controlled by GMW and that their work and services comply with
current building standards. All such consultants and contractors
are expected to have appropriate mechanisms in place to ensure
compliance with the building and maintenance provisions of the
Building Act 1993.
In relation to existing buildings, the Asset Maintenance Unit is
responsible for mandatory testing of emergency and exit lighting
and lift equipment in accordance with relevant standards,
monthly, quarterly and bi-annual inspection and preventive
maintenance routine of mechanical services and monthly
and annual fire service audits. These inspections inform the
works program, which is delivered annually through existing
maintenance contracts.
2019/20 Building Matters
Number
Number of building permits, occupancy permits or certifcate of final inspection issued in relation to buildings owned by the entity
Four:• Goulburn Weir office upgrade• Eildon office upgrade• Cairn Curran office upgrade• 40 Casey Street office upgrade (includes replacing carpets, internal painting and plastering, reducing partition heights, acoustics, air conditioning modifications, electrical works, some new office furniture and disability access to rear of building $948,000)
Number of building permits, occupancy permits or certificate of final inspection issued in relation to buildings owned by the entity
Four building permits were issued for works commencing in 2019/20
Number of emergency orders and building orders issued in relation to buildings
0
Number of buildings that have been brought into conformity with building standards during the reporting period:
65%
Table 28: Building matters in 2019/20.
Type of EWOV complaint Number
Enquiry 1
Unassisted Referral 11
Assisted Referral 38
Investigation 28
Total 78
Table 27: EWOV complaints, including Connections.

YEAR IN REVIEW GOVERNANCE AND ORGANISATIONAL STRUCTURE
2019/20 Goulburn-Murray Water Annual Report 65
WORKFORCE DATA OTHER DISCLOSURES FINANCIAL STATEMENTS
Based on the findings of the recent building audit it was found
that 52 per cent of the buildings are currently compliant with
building standards. This has now been upgraded to 65 per cent of
buildings complying as at 30 June 2020 through the schedule of
works being implemented by GMW. With these works scheduled,
we anticipate that all buildings will be brought into conformity
with building standards by June 2022.
There are other buildings at premises that have not been
assessed as part of the original audit including, but not limited to,
public toilets, BBQ shelters, viewing platforms, pump buildings
and enclosures. GMW also owns land with houses which have
not yet been assessed. These other buildings and dwellings
are scheduled to be audited in future years to establish their
compliance with the Building Act 1993 and building regulations.
Any shortcomings identified will be prioritised accordingly and
included in our schedule of rectification works.
Competitive Neutrality Policy Competitive neutrality seeks to enable fair competition between
government and private sector businesses. Any advantages or
disadvantages that government businesses may experience,
simply as a result of government ownership, should be
neutralised. GMW continues to implement and apply this
principle in our business undertakings.
Compliance with the Public Interest Disclosures Act 2012 The Public Interest Disclosures Act 2012 (Public Interest
Disclosures Act) enables people to make a disclosure about
corrupt or improper conduct by a public officer or a public body.
GMW is a public body for the purposes of the Public Interest
Disclosures Act.
What is a Public Interest Disclosure? A public interest disclosure is a complaint of corrupt or improper
conduct by a public officer or a public body.
‘Improper or corrupt conduct’ involves substantial
mismanagement of public resources, risk to public health or
safety or the environment, or corruption.
GMW does not tolerate improper conduct by employees, or taking
reprisals against those who come forward to disclose such
conduct. GMW:
• is committed to ensuring transparency and accountability in
our administrative and management practices
• supports making disclosures that reveal corrupt conduct,
conduct involving a substantial mismanagement of public
resources, or conduct involving a substantial risk to public
health and safety or the environment.
Making a public interest disclosureYou can make a public interest disclosure about GMW or our
Board members, officers or employees by contacting IBAC
(details below).
GMW is not able to receive public interest disclosure.
GMW has established a procedure for protecting persons from
detrimental action in reprisal for making a public interest
disclosure about GMW, our Board members, officers or
employees. You can access GMW’s procedure on our website at
www.gmwater.com.au.
The Independent Broad-Based Anti-Corruption Commission
(IBAC) Victoria may be contacted by writing to:
Independent Broad-Based Anti-Corruption Commission (IBAC)
Victoria
GPO Box 24234
MELBOURNE VIC 3001
Or, by telephone on 1300 735 135
Or, online at www.ibac.vic.gov.au

YEAR IN REVIEW GOVERNANCE AND ORGANISATIONAL STRUCTURE
2019/20 Goulburn-Murray Water Annual Report 66
WORKFORCE DATA OTHER DISCLOSURES FINANCIAL STATEMENTS
Compliance with the Disability Act 2006GMW actively promotes our diversity and inclusion across all minority groups. GMW’s is aligned with Absolutely everyone: state disability plan
for 2017-2020, which is the Victorian Government’s framework for enabling people with a disability to participate and contribute to the social,
economic and civic life of their community, and we work collectively to ensure no employee is disadvantaged in any way.
We continue to assist employees with modified workstations and equipment to assist with height, back and general accessibility issues.
GMW continues to modify our site offices to be compliant for disability access. GMW actively promotes all diversity and inclusion sectors
through recruitment, on boarding and corporate induction programs. Unconscious bias training provides all hiring managers with the skills
to look at the overall capability and not the disability of any employee within GMW.
Compliance with the Water Act 1989 There are no additional disclosures required to be made in this Annual Report under the Water Act 1989.
Office-based environmental impacts GMW recorded a 2,400 tonne decrease in Greenhouse Gas (GHG) emissions over the 2019/20 period compared with 2018/19. The result
includes MDBA assets.
Greenhouse Emissions by Source
CO2e by source (Tonnes) 2013/14 2014/15 2015/16 2016/17 2017/18 2018/19 2019/20
Energy1 8,634 8,851 8,375 8,233 7,819 8,651 6,501
Vehicle Fleet2 4,223 3,822 4,026 3,724 3,720 3,326 3,076
Total 12,857 12,673 12,401 11,957 11,539 11,977 9,577
Table 29: Greenhouse emissions by source since 1/7/2013.
Notes:
1. Electricity and gas to run offices and depot and deliver water to customers including MDBA assets. Previously MDBA assets had been excluded from GMW’s emission, however these assets are included in GMW’s pledge.
2. Fuel consumed by the vehicle fleet.

YEAR IN REVIEW GOVERNANCE AND ORGANISATIONAL STRUCTURE
2019/20 Goulburn-Murray Water Annual Report 67
WORKFORCE DATA OTHER DISCLOSURES FINANCIAL STATEMENTS
Figure 8: Total greenhouse gas emissions vs target emissions since 2011-16 baseline.
Notes:
1. GMW’s pledge target includes both GMW and MDBA assets. An internal GMW pledge target excluding MDBA assets had been identified in previous years, however the 2011-16 baseline of which GMW pledge is calculated includes MDBA assets.
0
2000
4000
6000
8000
10000
12000
14000
2011-16Baseline
2016/17 2017/18 2018/19 2019/20 2020/21 2021/22 2022/23 2023/24 2024/25 Target
Net greenhouse gas emissions (tCO2-e)
Energy Vehicle Fleet Pledge target
02000400060008000100001200014000160001800020000
0
500000
1000000
1500000
2000000
2500000
3000000
3500000
2014 2015 2016 2017 2018 2019 2020
Volume Traded (MLs) Applications
0
500
1000
1500
2000
2500
3000
3500
4000
4500
0
50000
100000
150000
200000
250000
2014 2015 2016 2017 2018 2019 2020
Volume Traded (MLs) Applications
Greenhouse gas and energy reporting
Performance Indicator
Greenhouse gas emission (Tonnes CO2-e)
Variance (%)
Commentary
2019-20Projected Emissions
2019-20 Result
Scope 1 emissions
Scope 2 emissions
Total emissions1
Water Treatment and Supply
6,504 4,947 4,947 -23.9 The purchase of green power has also contributed to the lower total greenhouse gas emissions.
Wastewater Collection, Treatment and Recycling
0 0 0 0 0 GMW does not treat or manage any wastewater.
Transport 3,250 3,076 3,076 -5.4 GMW’s ongoing fleet management processes, use of videoconferencing facilities and decrease in electricity usage at GMW’s staffed locations due to Covid-19 restrictions have contributed to lower emissions.
Other (offices, depots and recreational facilities)
1,948 1,554 1,554 -20.3 Continued efficiency gains at our staffed locations and the purchase of green power have contributed to the lower total greenhouse gas emissions.
Total 11,702 3,076 6,501 9,577 -18.2
Table 30: Greenhouse gas emissions by source.
Notes:
1. Sum of scope 1 and 2 emissions.

YEAR IN REVIEW GOVERNANCE AND ORGANISATIONAL STRUCTURE
2019/20 Goulburn-Murray Water Annual Report 68
WORKFORCE DATA OTHER DISCLOSURES FINANCIAL STATEMENTS
Performance indicator 2018-19 Re-newable electricity
used (MWh)
2019-20 Renewable electricity
used (MWh)
Commentary
Solar 10 133 Figure now includes four GMW pump sites which have a solar array. This is an increase of three sites from last year’s figure.
Hydroelectric 0 0
Wind 0 0
Biogas 0 0
Green power 0 914 One-off green power purchase in April 2020.
Other 0 0
TOTAL 10 1,047
Percentage renewable electricity
0.12% 14.38%
Table 32: Energy consumption.
Corporate water consumption Corporate water consumption at GMW’s 15 major office locations was 19,426 kilolitres (KL) in 2019/20 equating to an office water
consumption of 36.35 KL per FTE.
Corporate Water Consumption
2013/14 2014/15 2015/16 2016/17 2017/18 2018/19 2019/20
Water Consumption (KL) 16,017 19,704 22,503 24,314 13,351 19,263 19,426
Consumption per FTE 24 26 29 33 20 31 36
Table 33: Total water consumption in kilolitres and kilolitre consumption per FTE across major offices.
Energy Consumption ReportingTotal electricity use 2018-19
Result (MWh)2019-20
Result (MWh)Commentary
Water treatment and supply 6,221 5,460 2019/20 was a lower water use year across the irrigation districts
resulting in less intensive pumping events.
Sewerage Collection, Treatment and Recycling
0 0 GMW does not treat any or manage any sewerage.
Other (office, workshops, depots, etc)
1,861 1,826 GMW continues to make efficiency gains at its staffed locations.
TOTAL 8,082 7,286
Table 31: Energy consumption by source.

YEAR IN REVIEW GOVERNANCE AND ORGANISATIONAL STRUCTURE
2019/20 Goulburn-Murray Water Annual Report 69
WORKFORCE DATA OTHER DISCLOSURES FINANCIAL STATEMENTS
Value of Community Service Obligations During 2019/20, GMW granted $314,233in pension concessions
compared to $340,014 in 2018/198, and $292,085 in 2017/18.
Regional Catchment Strategies GMW is actively involved in review, development and
implementation of the Regional Catchment Strategies for each
of the three catchment management regions within our area of
operations.
GMW contributed to the Goulburn Broken and North Central
Regional Catchment Strategy update projects through steering
committee membership, workshop participation and community
and stakeholder briefings. GMW also continued to play a key role
in review and implementation of various sub-strategies, including
floodplain, drainage and waterway strategies as well as land and
water management plans. For example, during 2019/20 GMW
provided input to the renewal of the North Central Catchment
Management Authority’s Loddon Campaspe Irrigation Region
Land and Water Management Plan.
This year GMW participated in several catchment partner forums,
as well as workshops and discussions on how to involve northern
Victorian Aboriginal communities in catchment and water
management. GMW continued discussions with the YYNAC on
Kow (Ghow) Swamp operational management, and the TLWCAC
about future operations at Greens Lake following the removal
of the storage from the Goulburn distribution system as a water
savings measure.
GMW has completed the final year of the Shepparton Irrigation
Region (SIR) Surface Water Management Program (SWMP) in
partnership with Goulburn Broken Catchment Management
Authority. This four-year program, funded by the Victorian
Government and which commenced in late 2016, targeted
projects in irrigated catchments across the SIR where drainage
improvement opportunities exist, where there is clear community
and GMW customer support to undertake drainage works and
where productive agriculture has a sound future.
The primary focus of the SWMP was implementing a more
cost-effective and unique ‘hybrid’ drainage approach based on
improving linkages to, and increasing effectiveness of, natural
drainage courses. This involved establishing Drainage Course
Declarations (DCDs) in priority catchments, enabling GMW to
remove obstructions to natural drainage flows.
Significant progress was made on developing and implementing
three hybrid drainage priority projects in 2019/20. A large
obstruction removal works program in Upper Deakin DCD is now
about 80 per cent complete and all Cornella Creek Catchment
DCD obstruction removal works were finished by May. A concept
design and draft Guilfus Congupna DCD proposal were consulted
with GMW customers and submitted for approval. Obstruction
removal works to restore drainage flows in the Guilfus Congupna
catchment are being planned in consultation with customers.
Funding is now being sought to extend the (SIR) SWMP for a
further four years to deliver further DCD-based drainage projects
and build on the significant successes and strong customer
support achieved in the current program.
Victorian Waterway Management Strategy Regional Waterway Strategies are single planning documents
for river, estuary and wetland management in each catchment
management region and drive implementation of the
management approach outlined in the Victorian Waterway
Management Strategy.
GMW is involved in implementation activities associated with
the Regional Waterway Strategies for the North East, Goulburn
Broken and North Central catchment management regions,
which all fall within GMW’s region. Activities undertaken by GMW
have included:

YEAR IN REVIEW GOVERNANCE AND ORGANISATIONAL STRUCTURE
2019/20 Goulburn-Murray Water Annual Report 70
WORKFORCE DATA OTHER DISCLOSURES FINANCIAL STATEMENTS
• participating in project groups
• funding and implementing water quality monitoring
programs
• information and data sharing with CMAs and water
corporations
• responding to environmental incidents
• facilitating delivery of environmental water.
GMW also carries out activities complementary to waterway
health at our storages, such as erosion control works, fencing to
protect native vegetation and facility upgrades.
Together with the North East CMA and MDBA, GMW will continue
to implement the Lower Mitta Mitta Waterway works program,
with a focus on fencing, revegetation and addressing erosion as a
result of water transfers from Dartmouth to Hume Dam.
The 2019/20 program saw 600m of riparian zone fenced off from
stock to reduce erosion and vegetation damage. Over 5,400
trees have been planted across the fenced riparian land, along
with removal of willow trees and 560Ha of weed control. Bank
stabilisation works have consisted of timber brushing and in
excess of 2800m3 of rock armouring of eroded sites. Engagement
with landholders was critical to address these works, with 12 site
assessments undertaken and 18 works sites completed.
GMW and NECMA are continuing to work with the Australian
Trout Foundation and the Victorian Fishing Authority to place
instream habitat in the form of rock seeding and lunkers, timber
structures that provide habitat and refuge during high flow
events.
GMW, in collaboration with Moira Shire, completed stage 3 of the
River Road erosion works on Lake Mulwala. This project involved
another 800 metres of steel sheet piling retaining wall installed
for bank stabilisation, protection of roadway infrastructure and
to provide improved access to the foreshore. The works involved
removal of willow trees, bank reshaping, provision of walkways
and establishment of landscaping with native vegetation. These
works were critical to stop the undermining of the banks,
reducing turbidity and the large scale slumping that presented
risks to the public. This project was supported by Moira Shire
Council, MDBA, and the Commonwealth Government’s Regional
Jobs and Investment Packages funding.
GMW continues to work with the MDBA and NSW Roads and
Maritime Services on delivery of the Murray River Erosion
Management Plan, concentrating on a 50km stretch of river
between Bundalong and Corowa. This began with the public
consultation period and submissions are now being collated
for consideration by the committee, on which GMW sits. GMW
has received further funding in anticipation of a ruling, initiating
works to expand the vehicle/trailer parking area and provide
toilet facilities at Majors Creek to enhance the upgrade works
recently completed at the boat ramp.
GMW continues to revegetate and address erosion along the
foreshore of Lake Mulwala on NSW and Victorian shorelines.
Considerable effort has been made in establishing Phragmites
(aquatic species) and installation of coir logs to address erosion.
Fencing of foreshore land is also undertaken to reduce impacts
from stock and unauthorised entry, and these areas are
enhanced with plantings of native vegetation.
GMW completed the Dartmouth Land and On-Water Management
Plan and will establish an implementation group to assist with
meeting the guidelines and outcomes of the plan, as soon as
practical in the current COVID-19 environment. This has involved
extensive consultation with the community, agencies and
Traditional Owners Dhuduroa-Waywarru Nations.
GMW is working with the traditional owners, YYNAC, and
Aboriginal Victoria to finalise a Conservation Management Plan
for Kow (Ghow) Swamp that will set priorities for management
and support the proposed ‘Protection Declaration Area’
submission to the Minister for Aboriginal Affairs.
GMW has been active in our efforts to manage erosion and
sites of cultural heritage significance at Kow Swamp. GMW is
implementing trapping, baiting and surveillance activities to
control feral pigs at Kow Swamp, and baiting and fumigation
programs to control rabbits. GMW continues to support the
Gunbower Landcare Group to revegetate perimeter lands at
the swamp under the 20 Million Trees Program, funded by the
Commonwealth Government through the National Landcare
Program.
Following the devastating bushfires over summer 2019/20, GMW
worked with regional stakeholders to assess the impacts on
waterways and catchments. This included increased water quality
monitoring, data sharing and regular liaison with North East
Water, North East CMA, EPA, MDBA and other agencies.

YEAR IN REVIEW GOVERNANCE AND ORGANISATIONAL STRUCTURE
2019/20 Goulburn-Murray Water Annual Report 71
WORKFORCE DATA OTHER DISCLOSURES FINANCIAL STATEMENTS
State Environment Protection Policy (Waters) GMW has continued to work with community and agency
stakeholders on a range of activities related to the SEPP
including:
• implementing land and water management plans
• programs for improved irrigation, drainage and salinity
mitigation practices
• improved recreation and waterway management
• comparing water quality monitoring results to SEPP
objectives.
Statement of availability of other information Information held by GMW and available on request subject to the
FOI Act includes:
a. a statement that declarations of pecuniary interests have
been duly completed by all relevant officers
b. details of shares held by a senior officer as nominee or held
beneficially in a statutory authority or subsidiary
c. details of publications produced by GMW about itself, and
how these can be obtained
d. details of changes in prices, fees, charges, rates and levies
charged by GMW
e. details of any major external reviews carried out on GMW
f. details of major research and development activities
undertaken by GMW
g. details of overseas visits undertaken, including a summary
of the objectives and outcomes of each visit
h. details of major promotional, public relations and marketing
activities undertaken by GMW to develop community
awareness of the entity and our services
i. details of assessments and measures undertaken to
improve the OH&S of employees
j. a general statement on industrial relations within GMW and
details of time lost through industrial accidents and disputes
k. a list of major committees sponsored by GMW, the purposes
of each committee and the extent to which the purposes
have been achieved
l. details of all consultancies and contractors including:
i. consultants/contractors engaged
ii. services provided
iii. expenditure committed to for each engagement.
Requests for access to GMW documents under the FOI Act can be
sent to:
Freedom of Information Officer
Goulburn-Murray Water
PO Box 165
TATURA VIC 3616
Compliance with the DataVic Access Policy Consistent with the DataVic Access Policy issued by the Victorian
Government in 2012, the information (all data tables and
financials) included in this Annual Report will be available at
www.data.vic.gov.au in electronic readable format.
YEAR IN REVIEW GOVERNANCE AND ORGANISATIONAL STRUCTURE
2019/20 Goulburn-Murray Water Annual Report 72
WORKFORCE DATA OTHER DISCLOSURES FINANCIAL STATEMENTS
Independent Auditor’s Report To the Board of the Goulburn-Murray Rural Water Corporation
Opinion I have audited the financial report of the Goulburn-Murray Rural Water Corporation (the corporation) which comprises the:
• balance sheet as at 30 June 2020 • statement of comprehensive income for the year then ended • statement of changes in equity for the year then ended • cash flow statement for the year then ended • notes to the financial statements, including significant accounting policies • statutory certification.
In my opinion, the financial report presents fairly, in all material respects, the financial position of the corporation as at 30 June 2020 and its financial performance and cash flows for the year then ended in accordance with the financial reporting requirements of Part 7 of the Financial Management Act 1994 and applicable Australian Accounting Standards.
Basis for Opinion
I have conducted my audit in accordance with the Audit Act 1994 which incorporates the Australian Auditing Standards. I further describe my responsibilities under that Act and those standards in the Auditor’s Responsibilities for the Audit of the Financial Report section of my report.
My independence is established by the Constitution Act 1975. My staff and I are independent of the corporation in accordance with the ethical requirements of the Accounting Professional and Ethical Standards Board’s APES 110 Code of Ethics for Professional Accountants (the Code) that are relevant to my audit of the financial report in Victoria. My staff and I have also fulfilled our other ethical responsibilities in accordance with the Code.
I believe that the audit evidence I have obtained is sufficient and appropriate to provide a basis for my opinion.
Board’s responsibilities for the financial report
The Board of the corporation is responsible for the preparation and fair presentation of the financial report in accordance with Australian Accounting Standards and the Financial Management Act 1994, and for such internal control as the Board determines is necessary to enable the preparation and fair presentation of a financial report that is free from material misstatement, whether due to fraud or error.
In preparing the financial report, the Board is responsible for assessing the corporation’s ability to continue as a going concern, disclosing, as applicable, matters related to going concern and using the going concern basis of accounting unless it is inappropriate to do so.

YEAR IN REVIEW GOVERNANCE AND ORGANISATIONAL STRUCTURE
2019/20 Goulburn-Murray Water Annual Report 73
WORKFORCE DATA OTHER DISCLOSURES FINANCIAL STATEMENTS
2
Auditor’s responsibilities for the audit of the financial report
As required by the Audit Act 1994, my responsibility is to express an opinion on the financial report based on the audit. My objectives for the audit are to obtain reasonable assurance about whether the financial report as a whole is free from material misstatement, whether due to fraud or error, and to issue an auditor’s report that includes my opinion. Reasonable assurance is a high level of assurance but is not a guarantee that an audit conducted in accordance with the Australian Auditing Standards will always detect a material misstatement when it exists. Misstatements can arise from fraud or error and are considered material if, individually or in the aggregate, they could reasonably be expected to influence the economic decisions of users taken on the basis of this financial report.
As part of an audit in accordance with the Australian Auditing Standards, I exercise professional judgement and maintain professional scepticism throughout the audit. I also:
• identify and assess the risks of material misstatement of the financial report, whether due to fraud or error, design and perform audit procedures responsive to those risks, and obtain audit evidence that is sufficient and appropriate to provide a basis for my opinion. The risk of not detecting a material misstatement resulting from fraud is higher than for one resulting from error, as fraud may involve collusion, forgery, intentional omissions, misrepresentations, or the override of internal control.
• obtain an understanding of internal control relevant to the audit in order to design audit procedures that are appropriate in the circumstances, but not for the purpose of expressing an opinion on the effectiveness of the corporation’s internal control
• evaluate the appropriateness of accounting policies used and the reasonableness of accounting estimates and related disclosures made by the Board
• conclude on the appropriateness of the Board’s use of the going concern basis of accounting and, based on the audit evidence obtained, whether a material uncertainty exists related to events or conditions that may cast significant doubt on the corporation’s ability to continue as a going concern. If I conclude that a material uncertainty exists, I am required to draw attention in my auditor’s report to the related disclosures in the financial report or, if such disclosures are inadequate, to modify my opinion. My conclusions are based on the audit evidence obtained up to the date of my auditor’s report. However, future events or conditions may cause the corporation to cease to continue as a going concern.
• evaluate the overall presentation, structure and content of the financial report, including the disclosures, and whether the financial report represents the underlying transactions and events in a manner that achieves fair presentation.
I communicate with the Board regarding, among other matters, the planned scope and timing of the audit and significant audit findings, including any significant deficiencies in internal control that I identify during my audit.
MELBOURNE 10 September 2020
Paul Martin as delegate for the Auditor-General of Victoria

YEAR IN REVIEW GOVERNANCE AND ORGANISATIONAL STRUCTURE
2019/20 Goulburn-Murray Water Annual Report 74
WORKFORCE DATA OTHER DISCLOSURES FINANCIAL STATEMENTS
Certification of Financial Management Compliance for 2019/20I, Diane James, on behalf of the Responsible Body, certify that
Goulburn-Murray Rural Water Corporation has no Material
Compliance Deficiency with respect to the applicable Standing
Directions under the Financial Management Act 1994 and
Instructions.
Diane James
Chairman
Goulburn-Murray Water 3 September 2020
Financial Management Compliance
Corporation Statutory CertificationThe attached financial statements for Goulburn-Murray
Rural Water Corporation have been prepared in accordance
with Direction 5.2 of the Standing Directions of the Assistant
Treasurer under the Financial Management Act 1994, applicable
Financial Reporting Directions (FRDs), Australian Accounting
Standards (AASs) including interpretations, and other mandatory
professional reporting requirements.
We further state that, in our opinion, the information set out
in the statement of comprehensive income, balance sheet,
statements of changes in equity, cash flow statements and
accompanying notes, presents fairly the financial transactions
during the year ended 30 June 2020 and financial position of
Goulburn-Murray Rural Water Corporation at 30 June 2020.
At the time of signing, we are not aware of any circumstance
which would render any particulars included in the financial
statements to be misleading or inaccurate.
We authorise the attached financial statement for issue on
3 September 2020.
Diane James
Chairman
3 September 2020
Charmaine Quick
Managing Director
3 September 2020
Michael Gomez
General Manager Business & Finance
3 September 2020
Financial Statements 2019/20

YEAR IN REVIEW GOVERNANCE AND ORGANISATIONAL STRUCTURE
2019/20 Goulburn-Murray Water Annual Report 75
WORKFORCE DATA OTHER DISCLOSURES FINANCIAL STATEMENTS
CCoommpprreehheennssiivvee OOppeerraattiinngg SSttaatteemmeenntt ffoorr tthhee ppeerriioodd eennddeedd 3300 JJuunnee 22002200
CCoommpprreehheennssiivvee OOppeerraattiinngg SSttaatteemmeenntt ffoorr tthhee ppeerriioodd eennddeedd 3300 JJuunnee 22002200 22001199//2200 22001188//1199 NNootteess $$000000 $$000000 RReevveennuuee ffrroomm ooppeerraattiinngg aaccttiivviittiieess Revenue from service and usage charges 3.1.1 119,039 120,392 Government grants 3.2 9,390 4,141 Connections funding 3.3.1 115,258 83,273 Contracting services 3.1.2 16,447 15,163 Other income 3.1.3 9,271 19,510 TToottaall rreevveennuuee 226699,,440066 224422,,447799 EExxppeennsseess ffrroomm ooppeerraattiinngg aaccttiivviittiieess Operations, maintenance and administration expense Water Storage & Delivery 4.1.1 49,957 55,518 Connections Project costs 4.1.2 95,131 70,647 Employee expenses 4.2.1 77,573 75,721 Depreciation and amortisation 5.1.2 103,198 100,425 Environmental contribution 9.2 2,793 2,793 Interest expense 7.1.2 7,134 6,931 Loss on disposal 5.1.3 17,105 26,722 TToottaall eexxppeennsseess 335522,,889900 333388,,775577 NNeett rreessuulltt bbeeffoorree ttaaxx ((8833,,448855)) ((9966,,227799)) Income tax expense/(benefit) 9.1.1 (25,026) (29,059) NNeett rreessuulltt ffoorr tthhee yyeeaarr ((5588,,445588)) ((6677,,222200)) OOtthheerr ccoommpprreehheennssiivvee iinnccoommee Items that will not be reclassified to net result Change in asset revaluation reserve (3,549) (595) Income tax related to this change 9.1.2 1,065 179 OOtthheerr CCoommpprreehheennssiivvee iinnccoommee,, nneett ooff iinnccoommee ttaaxx 5.1.5 ((22,,448844)) ((441177)) TToottaall ccoommpprreehheennssiivvee rreessuulltt ((6600,,994433)) ((6677,,663366))
The above Comprehensive Operating Statement should be read in conjunction with the accompanying notes
Comprehensive Operating Statement for the period ended 30 June 2020

YEAR IN REVIEW GOVERNANCE AND ORGANISATIONAL STRUCTURE
2019/20 Goulburn-Murray Water Annual Report 76
WORKFORCE DATA OTHER DISCLOSURES FINANCIAL STATEMENTS
BBaallaannccee SShheeeett aass aatt 3300 JJuunnee 22002200
BBaallaannccee SShheeeett aass aatt 3300 JJuunnee 22002200 22001199//2200 22001188//1199 NNootteess $$000000 $$000000 AASSSSEETTSS CCuurrrreenntt aasssseettss Cash and cash equivalents 7.2 174,315 319,641 Receivables 6.1 28,059 28,317 Inventories 2,550 2,580 Prepayments 1,585 1,818 TToottaall ccuurrrreenntt aasssseettss 220066,,550088 335522,,335566 NNoonn--ccuurrrreenntt aasssseettss Receivables 6.1 109 110 Intangible assets 5.2 9,147 9,274 Right-of-use assets 6.3 1,879 - Infrastructure, property, plant and equipment 5.1.1 4,700,986 4,717,639 TToottaall nnoonn--ccuurrrreenntt aasssseettss 44,,771122,,112211 44,,772277,,002233 TTOOTTAALL AASSSSEETTSS 44,,991188,,662299 55,,007799,,337799 LLIIAABBIILLIITTIIEESS CCuurrrreenntt lliiaabbiilliittiieess Payables 6.2 53,288 32,144 Employee benefits 4.2.2 21,008 22,932 Lease Liabilities 6.3 1,353 - Borrowings 7.1 17,299 2,163 Unearned revenue 3.4 19,214 126,184 TToottaall ccuurrrreenntt lliiaabbiilliittiieess 111122,,116611 118833,,442233 NNoonn--ccuurrrreenntt lliiaabbiilliittiieess Employee benefits 4.2.2 2,615 2,340 Lease Liabilities 6.3 571 - Borrowings 7.1 92,946 110,246 Deferred tax liabilities 9.1.2 471,773 497,865 TToottaall nnoonn--ccuurrrreenntt lliiaabbiilliittiieess 556677,,990066 661100,,445511 TTOOTTAALL LLIIAABBIILLIITTIIEESS 668800,,006677 779933,,887744 NNEETT AASSSSEETTSS 44,,223388,,556622 44,,228855,,550055 EEQQUUIITTYY Contributed capital 7.3.1 3,016,955 3,002,955 Asset revaluation reserve 5.1.5 1,577,091 1,579,576 Accumulated surplus / (deficit) (355,484) (297,026) TTOOTTAALL EEQQUUIITTYY 44,,223388,,556622 44,,228855,,550055 The above Balance Sheet should be read in conjunction with the accompanying notes
Balance Sheet as at 30 June 2020
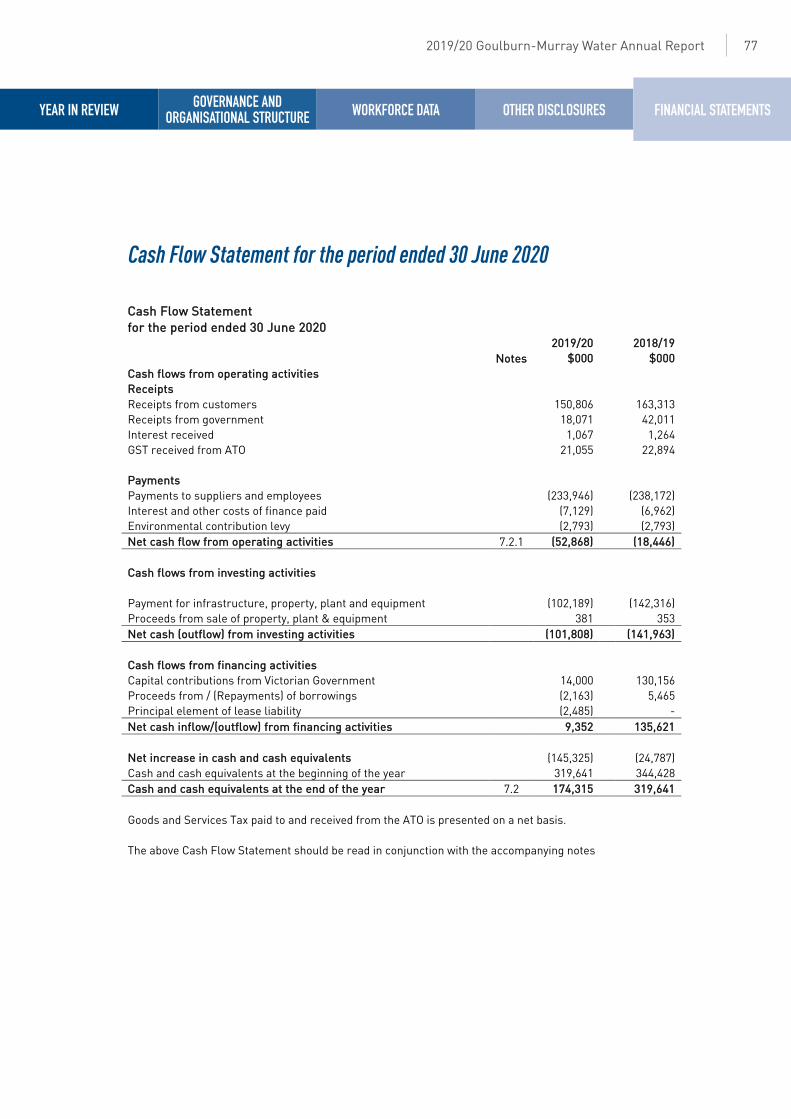
YEAR IN REVIEW GOVERNANCE AND ORGANISATIONAL STRUCTURE
2019/20 Goulburn-Murray Water Annual Report 77
WORKFORCE DATA OTHER DISCLOSURES FINANCIAL STATEMENTS
CCaasshh FFllooww SSttaatteemmeenntt ffoorr tthhee ppeerriioodd eennddeedd 3300 JJuunnee 22002200
CCaasshh FFllooww SSttaatteemmeenntt ffoorr tthhee ppeerriioodd eennddeedd 3300 JJuunnee 22002200 22001199//2200 22001188//1199 NNootteess $$000000 $$000000 CCaasshh fflloowwss ffrroomm ooppeerraattiinngg aaccttiivviittiieess RReecceeiippttss Receipts from customers 150,806 163,313 Receipts from government 18,071 42,011 Interest received 1,067 1,264 GST received from ATO 21,055 22,894 PPaayymmeennttss Payments to suppliers and employees (233,946) (238,172) Interest and other costs of finance paid (7,129) (6,962) Environmental contribution levy (2,793) (2,793) NNeett ccaasshh ffllooww ffrroomm ooppeerraattiinngg aaccttiivviittiieess 7.2.1 ((5522,,886688)) ((1188,,444466)) CCaasshh fflloowwss ffrroomm iinnvveessttiinngg aaccttiivviittiieess
Payment for infrastructure, property, plant and equipment
(102,189) (142,316) Proceeds from sale of property, plant & equipment 381 353 NNeett ccaasshh ((oouuttffllooww)) ffrroomm iinnvveessttiinngg aaccttiivviittiieess ((110011,,880088)) ((114411,,996633)) CCaasshh fflloowwss ffrroomm ffiinnaanncciinngg aaccttiivviittiieess Capital contributions from Victorian Government 14,000 130,156 Proceeds from / (Repayments) of borrowings (2,163) 5,465 Principal element of lease liability (2,485) - NNeett ccaasshh iinnffllooww//((oouuttffllooww)) ffrroomm ffiinnaanncciinngg aaccttiivviittiieess 99,,335522 113355,,662211 NNeett iinnccrreeaassee iinn ccaasshh aanndd ccaasshh eeqquuiivvaalleennttss (145,325) (24,787) Cash and cash equivalents at the beginning of the year 319,641 344,428 CCaasshh aanndd ccaasshh eeqquuiivvaalleennttss aatt tthhee eenndd ooff tthhee yyeeaarr 7.2 117744,,331155 331199,,664411 Goods and Services Tax paid to and received from the ATO is presented on a net basis. The above Cash Flow Statement should be read in conjunction with the accompanying notes
Cash Flow Statement for the period ended 30 June 2020

YEAR IN REVIEW GOVERNANCE AND ORGANISATIONAL STRUCTURE
2019/20 Goulburn-Murray Water Annual Report 78
WORKFORCE DATA OTHER DISCLOSURES FINANCIAL STATEMENTS
Statement for Changes in Equity for the period ended 30 June 2020
SSttaatteemmeenntt ooff CChhaannggeess iinn EEqquuiittyy
ffoorr tthhee ppeerriioodd eennddeedd 3300 JJuunnee 22002200
CCoonnttrriibbuutteedd CCaappiittaall
AAsssseett RReevvaalluuaattiioonn
RReesseerrvvee
AAccccuummuullaatteedd SSuurrpplluuss
//((DDeeffiicciitt))
TToottaall
NNootteess $$000000 $$000000 $$000000 $$000000
BBaallaannccee aatt 11 JJuullyy 22001188 22,,887722,,779988 11,,557799,,999933 ((222299,,880066)) 44,,222222,,998855
Total comprehensive income/(loss) for the year 5.1.5 - (417) (67,220) (67,637)
TTrraannssaaccttiioonnss wwiitthh SSttaattee iinn iittss ccaappaacciittyy aass OOwwnneerr
Contributions by owner 7.3.1 130,157 - - 130,157
BBaallaannccee aatt 3300 JJuunnee 22001199 33,,000022,,995555 11,,557799,,557766 ((229977,,002266)) 44,,228855,,550055
Total comprehensive income/(loss) for the year 5.1.5 - (2,484) (58,458) (60,943)
TTrraannssaaccttiioonnss wwiitthh SSttaattee iinn iittss ccaappaacciittyy aass OOwwnneerr
Contributions by owner 7.3.1 14,000 - - 14,000
BBaallaannccee aatt 3300 JJuunnee 22002200 33,,001166,,995555 11,,557777,,009911 ((335555,,448844)) 44,,223388,,556622
The above Statement of Changes in Equity should be read in conjunction with the accompanying notes
Statement for changes in Equity for the period ended 30 June 2020

YEAR IN REVIEW GOVERNANCE AND ORGANISATIONAL STRUCTURE
2019/20 Goulburn-Murray Water Annual Report 79
WORKFORCE DATA OTHER DISCLOSURES FINANCIAL STATEMENTS
11.. AAbboouutt tthhiiss RReeppoorrtt
BBaassiiss ooff AAccccoouunnttiinngg The financial report includes separate financial statements for Goulburn Murray Rural Water Corporation (the Corporation or GMW) as an individual reporting entity. This financial report is a general purpose financial report, that consists of a Comprehensive Operating Statement, Balance Sheet, Statement of Changes in Equity, Cash Flow Statement and notes accompanying these statements for the period ending 30 June 2020. The general purpose financial report has been prepared in accordance with Australian Accounting Standards (AAS), Interpretations and other authoritative pronouncements of the Australian Accounting Standards Board, and the requirements of the Financial Management Act 1994 and applicable Ministerial Directions. GMW is a not for-profit entity for the purpose of preparing the financial statements. GMW is a statutory Corporation constituted by Ministerial Order under the provisions of the Water Act 1989. The principal address is: Goulburn Murray Water 40 Casey Street Tatura Vic 3616 Where applicable, those AAS paragraphs applicable to not-for-profit entities have been applied. The accrual basis of accounting has been applied in the preparation of these financial statements whereby assets, liabilities, equity, income and expenses are recognised in the reporting period to which they relate, regardless of when cash is received or paid. The annual financial statements were authorised for issue by the Board on 3 September 2020.
AAccccoouunnttiinngg PPoolliicciieess Accounting policies are selected and applied in a manner which ensures that the resulting financial information satisfies the concepts of relevance and reliability, thereby ensuring that the substance of the underlying transactions or other events is reported.
Unless otherwise stated, all accounting policies applied are consistent with those of the prior year.
The following standard has been adopted by GMW:
•• AAAASSBB 1155 RReevveennuuee ffrroomm CCoonnttrraaccttss wwiitthh CCuussttoommeerrssAASB 15 Revenue from Contracts with Customers, which replaces AASB 118, Revenue AASB 111 Construction Contracts and related interpretations requires GMW to recognise revenue when it satisfies a performance obligation by transferring a promised good or service to a customer. GMW has adopted AASB 15 as at 1 July 2019 and has applied the new rules on a modified retrospective basis as mandated by the DTF through FRD 121 Transitional requirements on the application of AASB 15 Revenue from Contracts with Customers. As a result, comparatives for 2018/19 in our 30 June 2020 accounts have not been restated. No transition adjustment was required to retained earnings. Further disclosures relating to AASB 15 are at Note 3.1, 3.3 and 10.7 of this report.
•• AAAASSBB 11005588 IInnccoommee ffoorr NNoott--ffoorr--PPrrooffiittssAASB 1058 Income for Not-for-Profits replaces requirements of income transactions previously accounted for under AASB 1004 Contributions. It establishes principles for not-for-profit entities that apply to (a) transactions where the consideration to acquire an asset is significantly less than fair value principally to enable a not-for-profit Corporation to further its objectives; and (b) the receipt of volunteer services. It will apply to capital grants from government and grants with no sufficiently specific performance obligation. GMW is required to determine whether a transaction falls under AASB 1058 or actually a contract with a customer under AASB 15. GMW has adopted AASB 1058 as at 1 July 2019 and has applied the new rules on a modified retrospective basis as mandated by the DTF through FRD 122
1. About this Report

YEAR IN REVIEW GOVERNANCE AND ORGANISATIONAL STRUCTURE
2019/20 Goulburn-Murray Water Annual Report 80
WORKFORCE DATA OTHER DISCLOSURES FINANCIAL STATEMENTS
Transitional requirements on the application of AASB 1058 Income of Not-for-Profit Entities. As a result, comparatives for 2018/19 in our 30 June 2020 accounts have not been restated.
No transition adjustment was required to retained earnings. Further disclosures relating to AASB are at Note 3.3, 3.4 and 10.7 of this report.
•• AAAASSBB 1166 LLeeaasseess AASB 16 Leases was issued in February 2016 and replaces AASB 117 Leases. It will result in almost all leases being recognised on the balance sheet, as the distinction between operating and finance leases is removed for lessees. Under the new standard, an asset (the right to use the leased item) and a financial liability to pay the obligation for lease payments are recognised. GMW has adopted AASB 16 as at 1 July 2019 and has applied the new rules on a modified retrospective basis as mandated by the DTF through FRD 123 Transitional requirements on the application of AASB 16 Leases. As a result, comparatives for 2018/19 in our 30 June 2020 accounts have not been restated. No transition adjustment was required to retained earnings. Further disclosures in relation to AASB 16 are at Note 6.3 and 10.7 of this report. FFuunnccttiioonnaall aanndd pprreesseennttaattiioonn ccuurrrreennccyy The financial statements are presented in Australian dollars, which is GMW's functional and presentation currency. CCllaassssiiffiiccaattiioonn bbeettwweeeenn ccuurrrreenntt aanndd nnoonn--ccuurrrreenntt To determine if an asset or liability is current or non-current, GMW considers the time when the asset or liability is expected to be realised or paid. The asset or liability is classified as current if it is expected to be realised or paid within the next twelve months - see 4.2.2 for a variation in relation to employee benefits. RRoouunnddiinngg Unless otherwise stated, amounts in the report have been rounded to the nearest thousand dollars. Figures in the financial statements may not equate due to rounding. HHiissttoorriiccaall ccoosstt ccoonnvveennttiioonn These financial statements have been prepared under the historical cost convention, except for the revaluation of land, buildings and infrastructure. AAccccoouunnttiinngg eessttiimmaatteess GMW makes judgements, estimates and assumptions about financial information where required. The significant judgements made in the preparation of these financial statements are disclosed in the notes. Estimates and associated assumptions are based on professional judgements based on historical experience and other relevant factors. Actual results may differ from these estimates. Revisions to accounting estimates are made in the period in which the estimate is adjusted. Judgements and assumptions made by management in applying Australian Accounting Standards that have significant effects on the financial statements and estimates relate to:
• the fair value of land, buildings, infrastructure, plant and equipment (note 8.3.2) • estimation of useful lives (note 5.1.2) • impairment of assets (note 5.1.1) • employee benefit provisions and actuarial assumptions on likely leave patterns and tenure (4.2.2) • superannuation (note 4.2.3) • accruals (note 6.2) • deferred tax liability (note 9.1.2) • for leases, determining whether an arrangement is in substance short-term arrangement (note
6.3)

YEAR IN REVIEW GOVERNANCE AND ORGANISATIONAL STRUCTURE
2019/20 Goulburn-Murray Water Annual Report 81
WORKFORCE DATA OTHER DISCLOSURES FINANCIAL STATEMENTS
IImmppaacctt ooff CCOOVVIIDD--1199 oonn tthhee 22001199--2200 FFiinnaanncciiaall RReeppoorrtt On 16 March 2020, an initial state of emergency was declared in Victoria to deal with the spread of coronavirus (COVID-19). The State Government has implemented a number of measures to reduce the spread of the virus. These measures included bans on public gatherings, rule of social distancing and unnecessary personal travel and instructions for individuals to work from home where possible. While the initial state of emergency was lifted and certain restrictions eased, in July 2020 the State Government reintroduced stricter measures as cases of coronavirus began to increase.
•• IImmppaacctt oonn ccuussttoommeerrss Given that GMW's core focus is the provision of water storage and delivery to irrigation customers the impact of customers has been minimal. The measures imposed to reduce the spread of the virus have impacted our leasing and licencing customers for which rent relief has been provided.
•• IImmppaacctt oonn tthhee ffiinnaanncciiaall rreeppoorrtt
Management have assessed the impact of COVID-19 on this financial report including the ability of customers to settle amounts due to GMW. Based on management's assessment no significant impact was expected. Assets and liabilities reported in the statement of financial position have not been impacted by COVID-19 and are concluded to be reported at fair value.
•• GGooiinngg ccoonncceerrnn
No impact is expected on GMW's ability to continue as a going concern.

YEAR IN REVIEW GOVERNANCE AND ORGANISATIONAL STRUCTURE
2019/20 Goulburn-Murray Water Annual Report 82
WORKFORCE DATA OTHER DISCLOSURES FINANCIAL STATEMENTS
22.. DDiissaaggggrreeggaatteedd iinnffoorrmmaattiioonn
IInnttrroodduuccttiioonn This section provides high level information separating the Water Storage & Delivery business (WSD) from the Connections Project (CP). This is due to the need to segregate the impacts of a limited term project from the ongoing activities of GMW. These business segments are functionally segregated due to the requirement to effectively ring fence CP funding receipts and project expenditure. The Connections Project is funded by the Australian and Victorian Governments. It is a limited term project with the target to achieve 429GL of water savings annually. This is being achieved through modernisation of GMW's aging infrastructure and on-farm modifications. SSttrruuccttuurree 2.1 Disaggregated Revenues & Results 2.2 Disaggregated Assets & Liabilities 22..11 DDiissaaggggrreeggaatteedd rreevveennuueess aanndd rreessuullttss RReevveennuuee NNeett rreessuulltt 22001199//2200 22001188//1199 22001199//2200 22001188//1199 $$000000 $$000000 $$000000 $$000000 Water Storage & Delivery 169,125 185,624 (79,945) (71,608) Connections Project 116,268 92,076 (3,540) (24,671) Elimination of internal transactions (15,988) (35,220) - - TToottaall 226699,,440066 224422,,447799 ((8833,,448855)) ((9966,,227799)) NNeett rreessuulltt bbeeffoorree ttaaxx ((8833,,448855)) ((9966,,227799))
Fixed charges
60%
Variable charges
3%
Bulk water 8%
Other Revenue
29%
Water Storage & Delivery Revenue
CP costs89%
Employees11%
Depreciation0%
Connections Project Expenditure
Ops, Maint & Admin
21%
Depreciation42%
Interest expense3%
Employees27%
Asset disposals
7%
Water Storage & Delivery Expenditure
Government funding99%
Other Revenue1%
Connections Project Revenue
Fixed charges
60%
Variable charges
3%
Bulk water 8%
Other Revenue
29%
Water Storage & Delivery Revenue
CP costs89%
Employees11%
Connections Project Expenditure
Ops, Maint & Admin
29%
Depreciation61%
Asset disposals10%
Water Storage & Delivery Expenditure
Government funding99%
Other Revenue1%
CCoonnnneeccttiioonnss PPrroojjeecctt RReevveennuuee
2. Disaggregated information

YEAR IN REVIEW GOVERNANCE AND ORGANISATIONAL STRUCTURE
2019/20 Goulburn-Murray Water Annual Report 83
WORKFORCE DATA OTHER DISCLOSURES FINANCIAL STATEMENTS
Disaggregated revenue is generated from customers both within and external to GMW. Revenue generated between WSD and CP in the current year was $16m (2019: $35.2m). These transactions are eliminated in the consolidated result to ensure that revenues and expenses are not artificially inflated. Net result represents the earnings before tax after all administrative costs are allocated between the business divisions. Profits recognised by CP are due to timing differences and will be offset by losses over the life of the project to result in a breakeven position on completion. 22..22 DDiissaaggggrreeggaatteedd aasssseettss aanndd lliiaabbiilliittiieess AAsssseettss LLiiaabbiilliittiieess 22001199//2200 22001188//1199 22001199//2200 22001188//1199 $$000000 $$000000 $$000000 $$000000 Water Storage & Delivery 4,615,085 4,593,150 165,288 157,148 Connections Project 307,242 490,251 46,702 142,881 TToottaall 44,,992222,,332266 55,,008833,,440022 221111,,999900 330000,,002299 Deferred Tax Liability 471,773 497,865 Elimination of internal transactions (3,693) (4,022) (3,693) (4,022) TToottaall aass ppeerr bbaallaannccee sshheeeett 44,,991188,,662299 55,,007799,,338800 668800,,006677 779933,,887722 Assets and liabilities for WSD and CP are ring fenced. Allocations are based on the nature of the underlying transactions with the exception of the deferred tax liability, as GMW is a single entity for income tax purposes and lodges a consolidated return. Disaggregated assets and liabilities reported above include receivables and payables between WSD and CP that result from internal transactions. These have been excluded in the elimination of internal transactions to calculate total assets and liabilities.

YEAR IN REVIEW GOVERNANCE AND ORGANISATIONAL STRUCTURE
2019/20 Goulburn-Murray Water Annual Report 84
WORKFORCE DATA OTHER DISCLOSURES FINANCIAL STATEMENTS
33.. FFuunnddiinngg ddeelliivveerryy ooff oouurr sseerrvviicceess
IInnttrroodduuccttiioonn
This section provides additional information about how GMW is funded and the relevant accounting policies.
GMW's core focus is the provision of water storage and delivery for irrigation customers using its network of infrastructure. Irrigation revenue is generated through prices that are regulated by the ESC. Revenue is also generated through activities such as; Government funding of the Connections Project, construction contracts, leases & licences, power generation and boating licences.
SSttrruuccttuurree 3.1 Revenue from contracts with customers
3.1.1 Revenue from service and usage charges 3.1.2 Contracting services 3.1.3 Other revenue 3.1.4 Revenue commitments - lessor
3.2 Government grants and contributions 3.3 Connections Project
3.3.1 Government funding 3.3.2 Funding commitments
3.4 Unearned Revenue
33..11 RReevveennuuee ffrroomm ccoonnttrraaccttss wwiitthh ccuussttoommeerrss GMW derives revenue from the provision of water storage and delivery for irrigation customers over time and at a point in time in the following revenue streams. Revenue is recognised when, or as, the performance obligations to the customer are satisfied.
33..11..11 RReevveennuuee ffrroomm sseerrvviiccee aanndd uussaaggee cchhaarrggeess 22001199//2200 22001188//1199
WWaatteerr ssttoorraaggee && ddeelliivveerryy $$000000 $$000000
Fixed charges 100,114 98,081 Variable charges 5,462 9,689 Bulk water sales 13,463 12,622 TToottaall SSeerrvviiccee aanndd UUssaaggee cchhaarrggeess 111199,,003399 112200,,339922
GMW has an ongoing obligation to supply water to its customers within its service region, with customers simultaineously receiving and consuming the benefit in line with GMW performing its obligations. Service and usage charges are recognised progressively throughout the year. Fixed charges are billed annually in July and recognised over time as the customer simultaneously receives and consumes the services provided by GMW. Variable charges for water delivered are billed progressively, with the final billing in June after GMW has performed its obligations and all usage has been determined. Bulk water revenue is recognised over time based on the agreed entitlement volumes with each customer. 33..11..22 CCoonnttrraaccttiinngg SSeerrvviicceess Murray-Darling Basin Authority 15,874 14,702 Other external clients 573 460 TToottaall CCoonnttrraaccttiinngg sseerrvviicceess 1166,,444477 1155,,116633
3. Funding delivery of our services

YEAR IN REVIEW GOVERNANCE AND ORGANISATIONAL STRUCTURE
2019/20 Goulburn-Murray Water Annual Report 85
WORKFORCE DATA OTHER DISCLOSURES FINANCIAL STATEMENTS
GMW is the Victorian constructing authority for the Murray Darling Basin Authority (MDBA) and performs contracted works on a cost recovery basis for MDBA and other clients. Revenue is recognised when or as performance obligations are satisfied. 22001199//2200 22001188//1199 $$000000 $$000000 33..11..33 OOtthheerr RReevveennuuee Interest 1,288 1,539 Leasing and licences 2,092 1,865 Boating licences 1,542 1,508 Power generation 1,023 2,447 Connections Project - sale of water - 7,289 Fees for services 734 751 Sale of water shares and water allocation 1,139 2,010 Other 1,451 2,101 TToottaall OOtthheerr RReevveennuuee 99,,227711 1199,,551100
Interest revenue includes interest charged to customers on overdue debts and interest received on bank deposits. Interest from customers is recognised when it is charged and interest from bank deposits is recognised when it is earned.
Sale of water shares and trades of water allocations relate to fees charged to customers for these transactions. Revenue is recognised when the service is provided to the customer.
Other revenue includes income from property leases and licences, grazing and occupational licences, boating licences and power generation. This income is recognised over the period of the relevant lease or licence or when it is earned. The measures imposed to reduce the spread of the virus COVID-19 have impacted some leasing and licencing customers for which rent relief has been provided. 22001199//2200 22001188//1199 33..11..44 RReevveennuuee ccoommmmiittmmeennttss -- lleessssoorr $$000000 $$000000 Nagambie Caravan Park No later than 1 year 440 438 Later than 1 year and not later than 5 years 1,895 1,887 Later than 5 years 24,253 25,385 TToottaall NNoonn--ccaanncceellllaabbllee ooppeerraattiinngg lleeaassee rreevveennuuee ccoommmmiittmmeennttss ((GGSSTT iinncclluussiivvee)) 2266,,558888 2277,,771100 Less GST payable to the Australian Tax Office ((22,,441177)) ((22,,551199))
TToottaall NNoonn--ccaanncceellllaabbllee ooppeerraattiinngg lleeaassee rreevveennuuee ccoommmmiittmmeennttss ((GGSSTT eexxcclluussiivvee)) 2244,,117711 2255,,119911
GMW has rental income from property leases which are recognised on a straight line basis over the term of the lease.
Other commitments can be found in section 4.3 (Operating expenditure commitments), section 5.1.4 (Capital expenditure commitments) and section 9.2.1 (Environmental contribution commitments). 22001199//2200 22001188//1199 33..22 GGoovveerrnnmmeenntt ggrraannttss aanndd ccoonnttrriibbuuttiioonnss $$000000 $$000000 Salinity works 4,834 3,339 Other 4,556 802 TToottaall GGoovveerrnnmmeenntt GGrraannttss WWSSDD 99,,339900 44,,114411

YEAR IN REVIEW GOVERNANCE AND ORGANISATIONAL STRUCTURE
2019/20 Goulburn-Murray Water Annual Report 86
WORKFORCE DATA OTHER DISCLOSURES FINANCIAL STATEMENTS
Income from grants (other than contribution by owners) is for contracted works on a cost recovery basis. GMW applies AASB 1058 when the grants received by GMW are not enforeable and doesn't have sufficiently specific performance obligations. GMW also applies AASB 1058 to capital grants that are controlled by GMW. Under AASB 15 income will only be recognised when or as the performance obligations under the contract are satisfied, potentially resulting in a deferral of income as compared to accounting under AASB 1004. The adoption of the new accounting standards have not had any impact of the 2019-20 results, compared to if the old standard was still in place. Therefore, no opening balance adjustment was required to opening retained income, based on a restrospective assessment of the impact of the new standard. 33..33..11 CCoonnnneeccttiioonnss PPrroojjeecctt 22001199//2200 22001188//1199 $$000000 $$000000 CCoonnnneeccttiioonnss ffuunnddiinngg 111155,,225588 8833,,227733
After the restructure of administrative arrangements (1 July 2012), the Northern Irrigation Renewal Project (NVIRP) was integrated into GMW and renamed as the Connections Project – a division of GMW.
The Connections Project (the Project) objective is to deliver water savings. This is achieved through planning, designing and delivering a program to modernise the irrigation system throughout the Goulburn Murray Irrigation District (GMID).
Funding revenue received by the Project is recognised under the percentage of completion methodology in accordance with AASB 15. Any funding received that is not recognised as revenue in the current period is recognised as an unearned revenue liability on the balance sheet. 33..33..22 FFuunnddiinngg CCoommmmiittmmeennttss -- CCoonnnneeccttiioonnss PPrroojjeecctt
The Connections Project has two discrete funding streams for Stage 1 and Stage 2 of the project. In September 2016, the Minister for Water, the Hon Lisa Neville MP, approved the re-set of the Connections Project. The Stage 2 Reset Plan Funding Deed was approved in January 2017 followed by the Stage 1 Completion Plan in November 2017.
(i) Stage 1 funding of $1,004m is being provided by the State Government via the Department of Environment, Land, Water and Planning (DELWP). Funding commenced in 2007-08.
(ii) Stage 2 funding of $1,059m is being provided by the Federal Government (via the State Government) and the Department of Environment, Land, Water and Planning (DELWP). (iii) Funding is received for each stage as follows: • Output – funding which is received to meet direct operating costs and the cost of reconnecting landowners to the irrigation network is recognised as revenue on a percentage of completion basis in accordance with AASB 15 Revenue from Contracts with Customers.
• Capital – which will predominantly fund the construction of assets or the enhancement of existing assets owned by GMW, is recognised as a transfer through contributed capital in accordance with FRD 119A Transfers Through Contributed Capital.
• External - Funding received from stakeholders outside the funding agreements for Stage 1 and 2 with the State and Federal Government. This funding is received for projects that are independent of and/or supplement Stage 1 and 2.
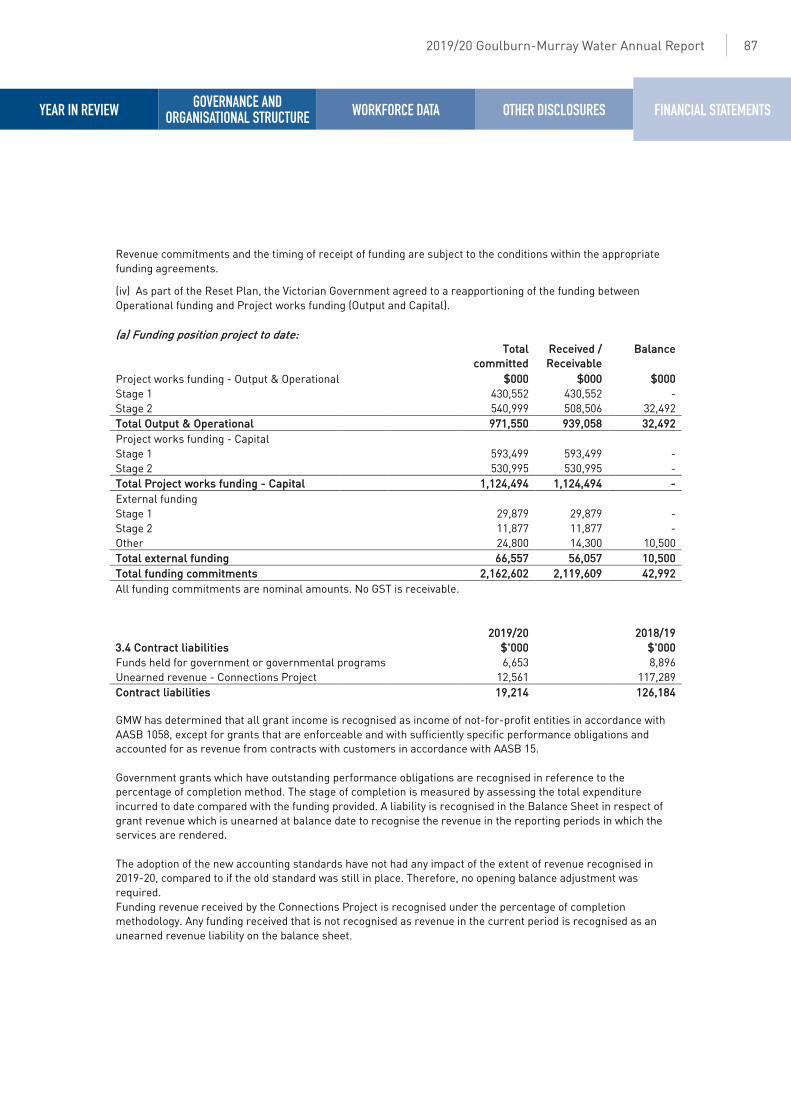
YEAR IN REVIEW GOVERNANCE AND ORGANISATIONAL STRUCTURE
2019/20 Goulburn-Murray Water Annual Report 87
WORKFORCE DATA OTHER DISCLOSURES FINANCIAL STATEMENTS
Revenue commitments and the timing of receipt of funding are subject to the conditions within the appropriate funding agreements.
(iv) As part of the Reset Plan, the Victorian Government agreed to a reapportioning of the funding between Operational funding and Project works funding (Output and Capital). ((aa)) FFuunnddiinngg ppoossiittiioonn pprroojjeecctt ttoo ddaattee::
TToottaall
ccoommmmiitttteedd RReecceeiivveedd // RReecceeiivvaabbllee
BBaallaannccee
Project works funding - Output & Operational $$000000 $$000000 $$000000 Stage 1 430,552 430,552 - Stage 2 540,999 508,506 32,492 TToottaall OOuuttppuutt && OOppeerraattiioonnaall 997711,,555500 993399,,005588 3322,,449922 Project works funding - Capital Stage 1 593,499 593,499 - Stage 2 530,995 530,995 - TToottaall PPrroojjeecctt wwoorrkkss ffuunnddiinngg -- CCaappiittaall 11,,112244,,449944 11,,112244,,449944 -- External funding Stage 1 29,879 29,879 - Stage 2 11,877 11,877 - Other 24,800 14,300 10,500 TToottaall eexxtteerrnnaall ffuunnddiinngg 6666,,555577 5566,,005577 1100,,550000 TToottaall ffuunnddiinngg ccoommmmiittmmeennttss 22,,116622,,660022 22,,111199,,660099 4422,,999922 All funding commitments are nominal amounts. No GST is receivable. 22001199//2200 22001188//1199 33..44 CCoonnttrraacctt lliiaabbiilliittiieess $$''000000 $$''000000 Funds held for government or governmental programs 6,653 8,896 Unearned revenue - Connections Project 12,561 117,289 CCoonnttrraacctt lliiaabbiilliittiieess 1199,,221144 112266,,118844
GMW has determined that all grant income is recognised as income of not-for-profit entities in accordance with AASB 1058, except for grants that are enforceable and with sufficiently specific performance obligations and accounted for as revenue from contracts with customers in accordance with AASB 15. Government grants which have outstanding performance obligations are recognised in reference to the percentage of completion method. The stage of completion is measured by assessing the total expenditure incurred to date compared with the funding provided. A liability is recognised in the Balance Sheet in respect of grant revenue which is unearned at balance date to recognise the revenue in the reporting periods in which the services are rendered. The adoption of the new accounting standards have not had any impact of the extent of revenue recognised in 2019-20, compared to if the old standard was still in place. Therefore, no opening balance adjustment was required. Funding revenue received by the Connections Project is recognised under the percentage of completion methodology. Any funding received that is not recognised as revenue in the current period is recognised as an unearned revenue liability on the balance sheet. Note 22001199//2200

YEAR IN REVIEW GOVERNANCE AND ORGANISATIONAL STRUCTURE
2019/20 Goulburn-Murray Water Annual Report 88
WORKFORCE DATA OTHER DISCLOSURES FINANCIAL STATEMENTS
((aa)) RReeccoonncciilliiaattiioonn ooff rreevveennuuee -- CCoonnnneeccttiioonnss PPrroojjeecctt $$''000000
Contract liability at 1 July 2019 (117,289)
Funding received/receivable during the year:
Project works funding - Operational & Output (10,716) Interest revenue 185
TToottaall PPrroojjeecctt sseerrvviicceess ppeerrffoorrmmeedd rreeccooggnniisseedd aass rreevveennuuee dduurriinngg tthhee yyeeaarr::
Operational services 15,002 Project works services 100,256 CCoonnttrraacctt lliiaabbiilliittyy aatt 3300 JJuunnee 22002200 33..44 ((1122,,556611))
Capital Contributions received for the Connections Project during the year have been accounted for in accordance with the requirements of FRD 119A 'Transfers Though Contributed Capital'. Refer Note 7.3 for details.
Revenue commitments and the timing of receipt of funding are subject to the conditions within the appropriate funding agreements.
(iv) As part of the Reset Plan, the Victorian Government agreed to a reapportioning of the funding between Operational funding and Project works funding (Output and Capital). ((aa)) FFuunnddiinngg ppoossiittiioonn pprroojjeecctt ttoo ddaattee::
TToottaall
ccoommmmiitttteedd RReecceeiivveedd // RReecceeiivvaabbllee
BBaallaannccee
Project works funding - Output & Operational $$000000 $$000000 $$000000 Stage 1 430,552 430,552 - Stage 2 540,999 508,506 32,492 TToottaall OOuuttppuutt && OOppeerraattiioonnaall 997711,,555500 993399,,005588 3322,,449922 Project works funding - Capital Stage 1 593,499 593,499 - Stage 2 530,995 530,995 - TToottaall PPrroojjeecctt wwoorrkkss ffuunnddiinngg -- CCaappiittaall 11,,112244,,449944 11,,112244,,449944 -- External funding Stage 1 29,879 29,879 - Stage 2 11,877 11,877 - Other 24,800 14,300 10,500 TToottaall eexxtteerrnnaall ffuunnddiinngg 6666,,555577 5566,,005577 1100,,550000 TToottaall ffuunnddiinngg ccoommmmiittmmeennttss 22,,116622,,660022 22,,111199,,660099 4422,,999922 All funding commitments are nominal amounts. No GST is receivable. 22001199//2200 22001188//1199 33..44 CCoonnttrraacctt lliiaabbiilliittiieess $$''000000 $$''000000 Funds held for government or governmental programs 6,653 8,896 Unearned revenue - Connections Project 12,561 117,289 CCoonnttrraacctt lliiaabbiilliittiieess 1199,,221144 112266,,118844
GMW has determined that all grant income is recognised as income of not-for-profit entities in accordance with AASB 1058, except for grants that are enforceable and with sufficiently specific performance obligations and accounted for as revenue from contracts with customers in accordance with AASB 15. Government grants which have outstanding performance obligations are recognised in reference to the percentage of completion method. The stage of completion is measured by assessing the total expenditure incurred to date compared with the funding provided. A liability is recognised in the Balance Sheet in respect of grant revenue which is unearned at balance date to recognise the revenue in the reporting periods in which the services are rendered. The adoption of the new accounting standards have not had any impact of the extent of revenue recognised in 2019-20, compared to if the old standard was still in place. Therefore, no opening balance adjustment was required. Funding revenue received by the Connections Project is recognised under the percentage of completion methodology. Any funding received that is not recognised as revenue in the current period is recognised as an unearned revenue liability on the balance sheet. Note 22001199//2200

YEAR IN REVIEW GOVERNANCE AND ORGANISATIONAL STRUCTURE
2019/20 Goulburn-Murray Water Annual Report 89
WORKFORCE DATA OTHER DISCLOSURES FINANCIAL STATEMENTS
44.. TThhee ccoosstt ooff ddeelliivveerriinngg oouurr sseerrvviicceess
IInnttrroodduuccttiioonn
This section provides additional information about how GMW's funding is applied and the accounting policies that are relevant for an understanding of the items recognised in the financial statements.
GMW's core focus is the provision of water storage and delivery for irrigation customers using its network of infrastructure. Expenditure is incurred for operations, maintenance and administration activities to ensure that agreed customer service levels are met. Along with delivering the Connections Project and providing services for construction contracts, leases & licences, power generation and boating licences.
SSttrruuccttuurree 4.1 Expenses incurred in delivery of services
4.1.1 Operations, maintenance and administration expenses WSD 4.1.2 Connections Project costs
4.2 Our People 4.2.1 Employee benefits - comprehensive operating statement 4.2.2 Employee benefits - balance sheet 4.2.3 Superannuation
4.3 Operating expenditure commitments
44..11 EExxppeennsseess iinnccuurrrreedd iinn ddeelliivveerryy ooff sseerrvviicceess
Expenses from transactions are recognised as they are incurred, and reported in the relevant financial year.
44..11..11 OOppeerraattiioonnss,, mmaaiinntteennaannccee aanndd aaddmmiinniissttrraattiioonn eexxppeennsseess WWaatteerr SSttoorraaggee && DDeelliivveerryy 22001199//2200 22001188//1199 $$000000 $$000000
Contracted services 14,135 13,890 GMW Contribution to the MDBA programme 11,348 14,400 Electricity 1,713 1,939 Insurances 1,340 1,231 Labour hire 545 1,305 Materials 2,516 2,508 MDBA and Government Services Contract 14,220 11,515 Plant and motor vehicles 585 3,437 Plant hire 1,265 1,767 Other (i) 2,290 3,526
TToottaall OOppeerraattiioonnss mmaaiinntteennaannccee aanndd aaddmmiinniissttrraattiioonn eexxppeennsseess 4499,,995577 5555,,551188 (i) Other expenses includes other miscellaneous expenses and ex-gratia expenses. Refer 10.6.
Operations, maintenance and administration costs are expensed as incurred. Costs are capitalised and depreciated when maintenance activities relate to the replacement of an asset with an expected useful life longer than one year and if the cost exceeds the capitalisation threshold. 44..11..22 CCoonnnneeccttiioonnss PPrroojjeecctt ccoossttss
4. The cost of delivering our services

YEAR IN REVIEW GOVERNANCE AND ORGANISATIONAL STRUCTURE
2019/20 Goulburn-Murray Water Annual Report 90
WORKFORCE DATA OTHER DISCLOSURES FINANCIAL STATEMENTS
Connections Project - operations, maintenance & administration 999 1,063 Connections Project - project delivery costs 94,132 69,584 TToottaall CCoonnnneeccttiioonnss PPrroojjeecctt ccoossttss 9955,,113311 7700,,664477
Project costs are costs associated with the delivery of a modernised irrigation system which will not result in an asset or enhance a fixed asset held by GMW. These generally relate to planning and on-farm modernisation works. Project costs are expensed as they are incurred. 44..22 OOuurr PPeeooppllee 22001199//2200 22001188//1199 $$000000 $$000000 44..22..11 EEmmppllooyyeeee bbeenneeffiittss -- ccoommpprreehheennssiivvee ooppeerraattiinngg ssttaatteemmeenntt SSaallaarryy,, wwaaggeess aanndd ootthheerr ccoossttss Water Storage & Delivery 52,336 56,980 Connections Project 10,985 12,444 SSuuppeerraannnnuuaattiioonn - Defined contribution plans Water Storage & Delivery 4,031 4,255 Connections Project 728 867 - Defined benefit plans Water Storage & Delivery 660 776 Connections Project 41 49 TTeerrmmiinnaattiioonn bbeenneeffiittss Water Storage & Delivery 8,792 350 TToottaall EEmmppllooyyeeee eexxppeennsseess 7777,,557733 7755,,772211
Employee benefits include all costs relating to employment including wages and salaries, leave entitlements, fringe benefits tax, work cover premiums, payroll tax and superannuation contributions. These are recognised as an expense when they are incurred.
The amount charged to the Comprehensive Operating Statement for superannuation represents contributions paid or payable by GMW to the relevant superannuation fund. Superannuation contributions are made to the funds based on the relevant fund rules and compulsory superannuation requirements.
Termination benefits are payable when employment is terminated before normal retirement date or when an employee accepts a redundancy offer. Termination benefits are recognised when GMW is committed to terminating the employment of current employees. The increase in termination benefits paid is due to a significant adjustment to the GMW business structure to align to the strategic objectives of the business. This has been part of the GMW Transformation Working Plan which was adopted in February 2019, in response to the recommendations of the Stategic Advisory Panel (SAP) report published in January 2018. 44..22..22 EEmmppllooyyeeee bbeenneeffiittss -- bbaallaannccee sshheeeett
44.. TThhee ccoosstt ooff ddeelliivveerriinngg oouurr sseerrvviicceess
IInnttrroodduuccttiioonn
This section provides additional information about how GMW's funding is applied and the accounting policies that are relevant for an understanding of the items recognised in the financial statements.
GMW's core focus is the provision of water storage and delivery for irrigation customers using its network of infrastructure. Expenditure is incurred for operations, maintenance and administration activities to ensure that agreed customer service levels are met. Along with delivering the Connections Project and providing services for construction contracts, leases & licences, power generation and boating licences.
SSttrruuccttuurree 4.1 Expenses incurred in delivery of services
4.1.1 Operations, maintenance and administration expenses WSD 4.1.2 Connections Project costs
4.2 Our People 4.2.1 Employee benefits - comprehensive operating statement 4.2.2 Employee benefits - balance sheet 4.2.3 Superannuation
4.3 Operating expenditure commitments
44..11 EExxppeennsseess iinnccuurrrreedd iinn ddeelliivveerryy ooff sseerrvviicceess
Expenses from transactions are recognised as they are incurred, and reported in the relevant financial year.
44..11..11 OOppeerraattiioonnss,, mmaaiinntteennaannccee aanndd aaddmmiinniissttrraattiioonn eexxppeennsseess WWaatteerr SSttoorraaggee && DDeelliivveerryy 22001199//2200 22001188//1199 $$000000 $$000000
Contracted services 14,135 13,890 GMW Contribution to the MDBA programme 11,348 14,400 Electricity 1,713 1,939 Insurances 1,340 1,231 Labour hire 545 1,305 Materials 2,516 2,508 MDBA and Government Services Contract 14,220 11,515 Plant and motor vehicles 585 3,437 Plant hire 1,265 1,767 Other (i) 2,290 3,526
TToottaall OOppeerraattiioonnss mmaaiinntteennaannccee aanndd aaddmmiinniissttrraattiioonn eexxppeennsseess 4499,,995577 5555,,551188 (i) Other expenses includes other miscellaneous expenses and ex-gratia expenses. Refer 10.6.
Operations, maintenance and administration costs are expensed as incurred. Costs are capitalised and depreciated when maintenance activities relate to the replacement of an asset with an expected useful life longer than one year and if the cost exceeds the capitalisation threshold. 44..11..22 CCoonnnneeccttiioonnss PPrroojjeecctt ccoossttss

YEAR IN REVIEW GOVERNANCE AND ORGANISATIONAL STRUCTURE
2019/20 Goulburn-Murray Water Annual Report 91
WORKFORCE DATA OTHER DISCLOSURES FINANCIAL STATEMENTS
Wages, salaries, annual leave and long service leave are accrued for services rendered to 30 June. Current 22001199//2200 22001188//1199 AAnnnnuuaall lleeaavvee $$000000 $$000000 Unconditional, settlement expected within 12 months 6,427 6,485 LLoonngg sseerrvviiccee lleeaavvee Unconditional, settlement expected within 12 months 1,323 2,198 Unconditional, settlement not expected within 12 months 11,539 12,189 OOnnccoossttss Unconditional, settlement expected within 12 months 176 237 Unconditional, settlement not expected within 12 months 1,543 1,823 TToottaall ccuurrrreenntt eemmppllooyyeeee bbeenneeffiittss 2211,,000088 2222,,993322 Non-current Conditional long service leave 2,244 2,050 Oncosts 372 290 TToottaall nnoonn--ccuurrrreenntt eemmppllooyyeeee bbeenneeffiittss 22,,661155 22,,334400 TToottaall eemmppllooyyeeee bbeenneeffiittss 2233,,662233 2255,,227711 RReeccoonncciilliiaattiioonn ooff mmoovveemmeenntt iinn oonn--ccoosstt pprroovviissiioonn 22001199//2200 $$000000 Opening balance 2,350 Additional provisions recognised 155 Amounts utilised during period (520) Effect of changes in the discount rate 106 CClloossiinngg bbaallaannccee 22,,009911 Current 1,719 Non-current 372
Liabilities for annual leave and other relevant entitlements are recognised in the provision for employee benefits as ‘current liabilities’, and must be settled by employee request.
The settlement of liabilities for wages, salaries, annual leave and other leave are measured at: - Nominal value – if GMW expects to settle within 12 months; or - Present value – if GMW does not expect to settle within 12 months.
Long service leave (LSL) liability is recognised in the provision for employee benefits. GMW recognises LSL entitlement as a current liability as it must be settled at the employee request, even when GMW does not expect to settle the liability within 12 months.
The current LSL liability is measured at: - Nominal value – if GMW expects to settle within 12 months; and - Present value – if GMW does not expect to settle within 12 months.
Accrued LSL is disclosed as a non-current liability. There is no obligation to settle the accrual until the employee has completed the required years of service. This is measured at present value.
Employee benefit on-costs provision includes payroll tax, workers compensation and superannuation. Employee bonuses are performance based, calculated on a percentage of the annual salary. A liability is recognised for the expected payment to eligible employees. The accrual is classified as a current liability as payment is expected to occur within 12 months. 44..22..33 SSuuppeerraannnnuuaattiioonn
Connections Project - operations, maintenance & administration 999 1,063 Connections Project - project delivery costs 94,132 69,584 TToottaall CCoonnnneeccttiioonnss PPrroojjeecctt ccoossttss 9955,,113311 7700,,664477
Project costs are costs associated with the delivery of a modernised irrigation system which will not result in an asset or enhance a fixed asset held by GMW. These generally relate to planning and on-farm modernisation works. Project costs are expensed as they are incurred. 44..22 OOuurr PPeeooppllee 22001199//2200 22001188//1199 $$000000 $$000000 44..22..11 EEmmppllooyyeeee bbeenneeffiittss -- ccoommpprreehheennssiivvee ooppeerraattiinngg ssttaatteemmeenntt SSaallaarryy,, wwaaggeess aanndd ootthheerr ccoossttss Water Storage & Delivery 52,336 56,980 Connections Project 10,985 12,444 SSuuppeerraannnnuuaattiioonn - Defined contribution plans Water Storage & Delivery 4,031 4,255 Connections Project 728 867 - Defined benefit plans Water Storage & Delivery 660 776 Connections Project 41 49 TTeerrmmiinnaattiioonn bbeenneeffiittss Water Storage & Delivery 8,792 350 TToottaall EEmmppllooyyeeee eexxppeennsseess 7777,,557733 7755,,772211
Employee benefits include all costs relating to employment including wages and salaries, leave entitlements, fringe benefits tax, work cover premiums, payroll tax and superannuation contributions. These are recognised as an expense when they are incurred.
The amount charged to the Comprehensive Operating Statement for superannuation represents contributions paid or payable by GMW to the relevant superannuation fund. Superannuation contributions are made to the funds based on the relevant fund rules and compulsory superannuation requirements.
Termination benefits are payable when employment is terminated before normal retirement date or when an employee accepts a redundancy offer. Termination benefits are recognised when GMW is committed to terminating the employment of current employees. The increase in termination benefits paid is due to a significant adjustment to the GMW business structure to align to the strategic objectives of the business. This has been part of the GMW Transformation Working Plan which was adopted in February 2019, in response to the recommendations of the Stategic Advisory Panel (SAP) report published in January 2018. 44..22..22 EEmmppllooyyeeee bbeenneeffiittss -- bbaallaannccee sshheeeett

YEAR IN REVIEW GOVERNANCE AND ORGANISATIONAL STRUCTURE
2019/20 Goulburn-Murray Water Annual Report 92
WORKFORCE DATA OTHER DISCLOSURES FINANCIAL STATEMENTS
GMW makes the majority of its employer superannuation contributions to Vision Superannuation Fund (the Fund). This Fund has two categories of membership, accumulation and defined benefit, with each funded differently. Obligations for contributions to the Fund are recognised as a liability or prepayment and expensed in the period they relate.
AAccccuummuullaattiioonn The Fund's accumulation categories, Vision MySuper/Vision Super Saver, receives both employer and employee contributions on a progressive basis. Employer contributions are normally based on a fixed percentage of employee earnings (9.5% required under Superannuation Guarantee legislation).
DDeeffiinneedd BBeenneeffiitt GMW does not use defined benefit accounting for its obligations under the Fund's Defined Benefit category because it is a pooled multi-employer sponsored plan. There is no proportional split of the defined benefit liabilities, assets or costs between the participating employers as this is a floating obligation. The only time that the aggregate obligation is allocated to specific employers is when a call is made. GMW's participation in the Fund cannot be measured as a percentage of other participating employers. The Actuary is unable to allocate benefit liabilities, assets and costs between employers for the purpose of AASB 119 Employee Benefits.
Contributions by GMW to superannuation plans of 9.5% for the financial year ended 30 June 2020 are detailed below:
PPaaiidd ccoonnttrriibbuuttiioonn ffoorr tthhee
yyeeaarr CCoonnttrriibbuuttiioonn oouuttssttaannddiinngg
aatt yyeeaarr eenndd
22001199//2200 22001188//1199 22001199//2200 22001188//1199 $$000000 $$000000 $$000000 $$000000 DDeeffiinneedd BBeenneeffiitt PPllaannss State Employee Retirement Benefits Board 70 72 2 2 Vision Super 60 85 - - Emergency Services and State Superannuation Fund 570 664 10 13 AAccccuummuullaattiioonn FFuunnddss Vision Super Saver & Other accumulation funds 4,965 5,421 335 320 TToottaall 55,,666655 66,,224411 334466 333355 SSttaattee SSuuppeerraannnnuuaattiioonn SScchheemmeess -- DDeeffiinneedd BBeenneeffiitt FFuunnddss
The amount recognised in the comprehensive operating statement in relation to superannuation is employer contributions for members of both defined benefit and defined contribution superannuation plans that are paid or payable during the reporting period. GMW does not recognise any defined benefit liabilities because it has no legal or constructive obligation to pay future benefits relating to its employees. Instead, the Department of Treasury and Finance (DTF) discloses in its annual financial statements the net defined benefit cost related to the members of these plans as an administered liability (on behalf of the State as the sponsoring employer).
44..33 OOtthheerr eexxppeennddiittuurree ccoommmmiittmmeennttss 22001199//2200 22001188//1199 Connections Project 26,186 43,715 Nagambie Caravan Park 13,294 13,855 Other 23,156 13,010 TToottaall OOtthheerr eexxppeennddiittuurree ccoommmmiittmmeennttss ((GGSSTT iinncclluussiivvee)) 6622,,663355 7700,,558800 Less GST recoverable from the Australian Tax Office (5,694) (6,416) TToottaall OOtthheerr eexxppeennddiittuurree ccoommmmiittmmeennttss ((GGSSTT eexxcclluussiivvee)) 5566,,994411 6644,,116644
Wages, salaries, annual leave and long service leave are accrued for services rendered to 30 June. Current 22001199//2200 22001188//1199 AAnnnnuuaall lleeaavvee $$000000 $$000000 Unconditional, settlement expected within 12 months 6,427 6,485 LLoonngg sseerrvviiccee lleeaavvee Unconditional, settlement expected within 12 months 1,323 2,198 Unconditional, settlement not expected within 12 months 11,539 12,189 OOnnccoossttss Unconditional, settlement expected within 12 months 176 237 Unconditional, settlement not expected within 12 months 1,543 1,823 TToottaall ccuurrrreenntt eemmppllooyyeeee bbeenneeffiittss 2211,,000088 2222,,993322 Non-current Conditional long service leave 2,244 2,050 Oncosts 372 290 TToottaall nnoonn--ccuurrrreenntt eemmppllooyyeeee bbeenneeffiittss 22,,661155 22,,334400 TToottaall eemmppllooyyeeee bbeenneeffiittss 2233,,662233 2255,,227711 RReeccoonncciilliiaattiioonn ooff mmoovveemmeenntt iinn oonn--ccoosstt pprroovviissiioonn 22001199//2200 $$000000 Opening balance 2,350 Additional provisions recognised 155 Amounts utilised during period (520) Effect of changes in the discount rate 106 CClloossiinngg bbaallaannccee 22,,009911 Current 1,719 Non-current 372
Liabilities for annual leave and other relevant entitlements are recognised in the provision for employee benefits as ‘current liabilities’, and must be settled by employee request.
The settlement of liabilities for wages, salaries, annual leave and other leave are measured at: - Nominal value – if GMW expects to settle within 12 months; or - Present value – if GMW does not expect to settle within 12 months.
Long service leave (LSL) liability is recognised in the provision for employee benefits. GMW recognises LSL entitlement as a current liability as it must be settled at the employee request, even when GMW does not expect to settle the liability within 12 months.
The current LSL liability is measured at: - Nominal value – if GMW expects to settle within 12 months; and - Present value – if GMW does not expect to settle within 12 months.
Accrued LSL is disclosed as a non-current liability. There is no obligation to settle the accrual until the employee has completed the required years of service. This is measured at present value.
Employee benefit on-costs provision includes payroll tax, workers compensation and superannuation. Employee bonuses are performance based, calculated on a percentage of the annual salary. A liability is recognised for the expected payment to eligible employees. The accrual is classified as a current liability as payment is expected to occur within 12 months. 44..22..33 SSuuppeerraannnnuuaattiioonn

YEAR IN REVIEW GOVERNANCE AND ORGANISATIONAL STRUCTURE
2019/20 Goulburn-Murray Water Annual Report 93
WORKFORCE DATA OTHER DISCLOSURES FINANCIAL STATEMENTS
Commitments for future operating expenditure include those arising from contracts. These are disclosed at their nominal value and inclusive of GST. Future expenditures cease to be disclosed as commitments once the related liabilities are recognised in the balance sheet. These commitments are likely to fall within: No later than 1 year 41,822 56,944 Later than 1 year and not later than 5 years 8,686 943 Later than 5 years 12,127 12,693 TToottaall OOtthheerr eexxppeennddiittuurree ccoommmmiittmmeennttss ((GGSSTT iinncclluussiivvee)) 6622,,663355 7700,,558800 Other commitments can be found in section 3.1.4 (Revenue commitments), section 5.1.4 (Capital expenditure commitments) and section 9.2.1 (Environmental contribution commitments). 55.. KKeeyy aasssseettss aavvaaiillaabbllee ttoo ssuuppppoorrtt oouuttppuutt ddeelliivveerryy
IInnttrroodduuccttiioonn This section provides additional information about how GMW manages its infrastructure, other assets and capital commitments along with the material accounting policies. The majority of GMW controlled infrastructure and other assets are used for storing and delivering water to customers. SSttrruuccttuurree 5.1 Infrastructure, Property, Plant and Equipment: Carrying amount
5.1.1 Reconciliation of movement in carrying value 5.1.2 Depreciation and amortisation 5.1.3 Other expenses 5.1.4 Capital commitments 5.1.5 Asset revaluation reserve
5.2 Intangible assets Significant judgements: Fair value measurement Where the assets included in this section are carried at fair value, additional information on how those fair values were determined is disclosed in note 8.3. 55..11 IInnffrraassttrruuccttuurree,, PPrrooppeerrttyy,, PPllaanntt aanndd EEqquuiippmmeenntt:: CCaarrrryyiinngg aammoouunntt 22001199//2200 22001188//1199 $$000000 $$000000 LLaanndd at Fair Value 54,077 54,073 BBuuiillddiinnggss at Fair Value 19,940 19,105 Less: Accumulated Depreciation (2,806) (2,139) 17,134 16,966 PPllaanntt && EEqquuiippmmeenntt at Fair Value 35,644 36,509 Less: Accumulated Depreciation (25,850) (23,252) 9,794 13,257 IInnffrraassttrruuccttuurree at Fair Value 4,802,744 4,688,344 Less: Accumulated Depreciation (357,481) (269,122) 4,445,263 4,419,222

YEAR IN REVIEW GOVERNANCE AND ORGANISATIONAL STRUCTURE
2019/20 Goulburn-Murray Water Annual Report 94
WORKFORCE DATA OTHER DISCLOSURES FINANCIAL STATEMENTS
5. Key assets available to support output delivery
Commitments for future operating expenditure include those arising from contracts. These are disclosed at their nominal value and inclusive of GST. Future expenditures cease to be disclosed as commitments once the related liabilities are recognised in the balance sheet. These commitments are likely to fall within: No later than 1 year 41,822 56,944 Later than 1 year and not later than 5 years 8,686 943 Later than 5 years 12,127 12,693 TToottaall OOtthheerr eexxppeennddiittuurree ccoommmmiittmmeennttss ((GGSSTT iinncclluussiivvee)) 6622,,663355 7700,,558800 Other commitments can be found in section 3.1.4 (Revenue commitments), section 5.1.4 (Capital expenditure commitments) and section 9.2.1 (Environmental contribution commitments). 55.. KKeeyy aasssseettss aavvaaiillaabbllee ttoo ssuuppppoorrtt oouuttppuutt ddeelliivveerryy
IInnttrroodduuccttiioonn This section provides additional information about how GMW manages its infrastructure, other assets and capital commitments along with the material accounting policies. The majority of GMW controlled infrastructure and other assets are used for storing and delivering water to customers. SSttrruuccttuurree 5.1 Infrastructure, Property, Plant and Equipment: Carrying amount
5.1.1 Reconciliation of movement in carrying value 5.1.2 Depreciation and amortisation 5.1.3 Other expenses 5.1.4 Capital commitments 5.1.5 Asset revaluation reserve
5.2 Intangible assets Significant judgements: Fair value measurement Where the assets included in this section are carried at fair value, additional information on how those fair values were determined is disclosed in note 8.3. 55..11 IInnffrraassttrruuccttuurree,, PPrrooppeerrttyy,, PPllaanntt aanndd EEqquuiippmmeenntt:: CCaarrrryyiinngg aammoouunntt 22001199//2200 22001188//1199 $$000000 $$000000 LLaanndd at Fair Value 54,077 54,073 BBuuiillddiinnggss at Fair Value 19,940 19,105 Less: Accumulated Depreciation (2,806) (2,139) 17,134 16,966 PPllaanntt && EEqquuiippmmeenntt at Fair Value 35,644 36,509 Less: Accumulated Depreciation (25,850) (23,252) 9,794 13,257 IInnffrraassttrruuccttuurree at Fair Value 4,802,744 4,688,344 Less: Accumulated Depreciation (357,481) (269,122) 4,445,263 4,419,222 WWoorrkk iinn PPrrooggrreessss at Cost 174,718 214,122 TToottaall IInnffrraassttrruuccttuurree PPrrooppeerrttyy PPllaanntt && EEqquuiippmmeenntt 44,,770000,,998855 44,,771177,,663399 All infrastructure, property, plant & equipment are initially recognised at cost and subsequently revalued to fair value less accumulated depreciation and impairment. This is in accordance with the requirements of Financial Reporting Direction (FRD) 103H Non-Current Physical Assets. Where an asset is acquired for no or nominal cost, the cost is its fair value at the date of acquisition. Carrying value is considered to be a reasonable approximation of fair value for infrastructure, property, plant and equipment. In estimating the fair value of an asset GMW uses observable market data to the extent it is available. Information about the valuation techniques and inputs used in determining the fair value of Infrastructure, Property, Plant and Equipment is disclosed in Note 8.3.2. Items with a cost greater than $2,000 and a useful life of more than one year are recognised as an asset. Groups of items with an individual cost less than $2,000 but with a value greater than $2,000 as a group (i.e. computer equipment) are capitalised. All other items less than $2,000 are expensed. Capital works in progress (WIP) are carried at cost, less any recognised impairment loss. Fixed assets are subject to fair valuation every five years by an independent assessor in accordance with the requirements of FRD 103H Non-Financial Physical Assets. This may occur more frequently if management assessments indicate material changes in asset values. A movement in carrying value greater than 10 percent requires a management revaluation. A movement greater than 40 percent will require the Valuer General Victoria (VGV) to perform a detailed fair value assessment. Where movement is less than or equal to 10 percent, no change is made to carrying amounts. Formal infrastructure assets revaluations (every five years) use specialised advisors. Revaluation increases or decreases arise from differences between an asset’s carrying value and fair value. A full valuation of Land, Buildings and Infrastructure was undertaken in 2016. There has been no indication of material changes to asset values in 2020. Revaluation decrements are recognised immediately as an expense, except if there is an asset revaluation reserve for the same class of assets, where they reduce the asset revaluation reserve. Net revaluation increases are recognised in other comprehensive income and accumulated in equity as an asset revaluation surplus. Where the net revaluation increase reverses a previously recognised decrease for the same class of assets, the previously recognised expense is reversed. Revaluation increases and decreases relating to individual assets within a class (i.e. Infrastructure, property, plant and equipment) are offset. Revaluation movements are not offset between classes. Asset revaluation reserves are not transferred to accumulated funds on disposal of an asset.

YEAR IN REVIEW GOVERNANCE AND ORGANISATIONAL STRUCTURE
2019/20 Goulburn-Murray Water Annual Report 95
WORKFORCE DATA OTHER DISCLOSURES FINANCIAL STATEMENTS
WWoorrkk iinn PPrrooggrreessss at Cost 174,718 214,122 TToottaall IInnffrraassttrruuccttuurree PPrrooppeerrttyy PPllaanntt && EEqquuiippmmeenntt 44,,770000,,998855 44,,771177,,663399 All infrastructure, property, plant & equipment are initially recognised at cost and subsequently revalued to fair value less accumulated depreciation and impairment. This is in accordance with the requirements of Financial Reporting Direction (FRD) 103H Non-Current Physical Assets. Where an asset is acquired for no or nominal cost, the cost is its fair value at the date of acquisition. Carrying value is considered to be a reasonable approximation of fair value for infrastructure, property, plant and equipment. In estimating the fair value of an asset GMW uses observable market data to the extent it is available. Information about the valuation techniques and inputs used in determining the fair value of Infrastructure, Property, Plant and Equipment is disclosed in Note 8.3.2. Items with a cost greater than $2,000 and a useful life of more than one year are recognised as an asset. Groups of items with an individual cost less than $2,000 but with a value greater than $2,000 as a group (i.e. computer equipment) are capitalised. All other items less than $2,000 are expensed. Capital works in progress (WIP) are carried at cost, less any recognised impairment loss. Fixed assets are subject to fair valuation every five years by an independent assessor in accordance with the requirements of FRD 103H Non-Financial Physical Assets. This may occur more frequently if management assessments indicate material changes in asset values. A movement in carrying value greater than 10 percent requires a management revaluation. A movement greater than 40 percent will require the Valuer General Victoria (VGV) to perform a detailed fair value assessment. Where movement is less than or equal to 10 percent, no change is made to carrying amounts. Formal infrastructure assets revaluations (every five years) use specialised advisors. Revaluation increases or decreases arise from differences between an asset’s carrying value and fair value. A full valuation of Land, Buildings and Infrastructure was undertaken in 2016. There has been no indication of material changes to asset values in 2020. Revaluation decrements are recognised immediately as an expense, except if there is an asset revaluation reserve for the same class of assets, where they reduce the asset revaluation reserve. Net revaluation increases are recognised in other comprehensive income and accumulated in equity as an asset revaluation surplus. Where the net revaluation increase reverses a previously recognised decrease for the same class of assets, the previously recognised expense is reversed. Revaluation increases and decreases relating to individual assets within a class (i.e. Infrastructure, property, plant and equipment) are offset. Revaluation movements are not offset between classes. Asset revaluation reserves are not transferred to accumulated funds on disposal of an asset.

YEAR IN REVIEW GOVERNANCE AND ORGANISATIONAL STRUCTURE
2019/20 Goulburn-Murray Water Annual Report 96
WORKFORCE DATA OTHER DISCLOSURES FINANCIAL STATEMENTS
55..11..11 RReeccoonncciilliiaattiioonn ooff mmoovveemmeenntt iinn ccaarrrryyiinngg vvaalluuee LLaanndd BBuuiillddiinnggss
PPllaanntt && EEqquuiippmmeenntt IInnffrraassttrruuccttuurree WWIIPP ((aa)) TToottaall
$$000000 $$000000 $$000000 $$000000 $$000000 $$000000 22001199//2200 Opening WDV 54,073 16,966 13,257 4,419,222 214,122 4,717,639 Additions - - 413 - 103,585 103,998 Transfers in/(out) of WIP 3 892 624 141,460 (142,978) - Disposals - (52) (416) (17,394) (9) (17,871)
Impairment 2 - - - (3,549) - (3,549) Depreciation - (672) (4,083) (94,476) - (99,231) CClloossiinngg WWDDVV 5544,,007766 1177,,113344 99,,779955 44,,444455,,226633 117744,,771199 44,,770000,,998866 22001188//1199 Opening WDV 54,040 17,033 13,401 4,372,796 269,504 4,726,775 Additions - - 753 - 117,231 117,984 Transfers in/(out) of WIP 33 610 4,596 167,375 (172,614) -
Other Transfers 1 - - - - - - Disposals - (1) (1,025) (26,607) - (27,633)
Impairment 2 - - - (595) - (595) Depreciation - (676) (4,469) (93,747) - (98,892) CClloossiinngg WWDDVV 5544,,007733 1166,,996666 1133,,225577 44,,441199,,222222 221144,,112222 44,,771177,,663399
1 Other transfers relate to transfers between asset classes including transfers between WIP and intangibles (see Note 5.2).
2 The Connections Project may impair previously capitalised infrastructure assets as a result of modernisation activities. If an asset is decommissioned then it is accounted for as a ‘disposal’ of infrastructure assets.

YEAR IN REVIEW GOVERNANCE AND ORGANISATIONAL STRUCTURE
2019/20 Goulburn-Murray Water Annual Report 97
WORKFORCE DATA OTHER DISCLOSURES FINANCIAL STATEMENTS
((aa)) WWoorrkk iinn pprrooggrreessss
CCoonnnneeccttiioonnss PPrroojjeecctt
$$000000
WWaatteerr SSttoorraaggee
&& DDeelliivveerryy $$000000
TToottaall
$$000000
OOppeenniinngg BBaallaannccee 117711,,886600 4422,,226622 221144,,112222 MMoovveemmeenntt 22001199//2200 Additions 92,076 11,508 103,585
Transfers (109,076) (33,903) (142,97
9) Total movement 2019/20 (17,000) (22,404) (39,404) BBaallaannccee aatt 3300 JJuunnee 22002200 115544,,886600 1199,,885588 117744,,771199 CCoonnnneeccttiioonnss PPrroojjeecctt Costs associated with the delivery of a modernised irrigation system which result in a new asset or enhance an existing asset are recorded as work in progress. WIP is transferred to Water Storage & Delivery when assets are operational. WWaatteerr SSttoorraaggee aanndd DDeelliivveerryy WIP is valued at cost plus an appropriate share of overheads. Assets are transferred from work in progress when the asset is operational.
55..11..22 DDeepprreecciiaattiioonn aanndd aammoorrttiissaattiioonn 22001199//2200 22001188//11
99 $$000000 $$000000 Depreciation of buildings 672 676 Depreciation of plant, equipment, furniture & fittings 4,083 4,464 Depreciation of infrastructure assets 94,476 93,747 Depreciation of right-of-use-assets 2,532 - Amortisation of intangibles 1,435 1,538 TToottaall DDeepprreecciiaattiioonn aanndd AAmmoorrttiissaattiioonn 110033,,119999 110000,,442255 All infrastructure and other non-current assets that have a limited useful life are depreciated. Depreciation rates are calculated on the asset’s value, less any estimated residual value, over its estimated useful life. Leasehold improvements are depreciated over the period of lease or estimated useful life, whichever is shorter. Depreciation is calculated on a straight-line basis. The estimated useful lives, residual values and depreciation method are reviewed at the end of each year, adjustments are made where appropriate. Generally useful lives are within the following ranges:
CCllaassss ooff aasssseettss EEssttiimmaatteedd lliiffee ((yyeeaarrss))

YEAR IN REVIEW GOVERNANCE AND ORGANISATIONAL STRUCTURE
2019/20 Goulburn-Murray Water Annual Report 98
WORKFORCE DATA OTHER DISCLOSURES FINANCIAL STATEMENTS
Buildings 5 to 50
Plant & Equipment 2 to 10
Right-of-use-assets 2 to 10
Intangibles 3 to 10
Infrastructure Systems:
- Non Backbone 1 to 3
- Channels and Structures 5 to 200
- Dams & Drains 5 to 200
- Electronic Equipment 5 to 40 The component of channels and drains which are under water are considered to have an indefinite life and are not depreciated. The fair value of these components is $456.5m (2019: $468m). Depreciation is not recognised for these assets because their service potential has not diminished during the report period. Intangible assets with finite useful lives such as computer software are amortised on a straight line basis and assessed for impairment annually. The useful life is reviewed at the end of each reporting period. Changes in the expected useful life are treated as changes in accounting estimates. Intangible assets with indefinite useful lives such as water shares and entitlements are not amortised, but are tested for impairment annually. The useful life assessment is reviewed annually to determine whether the indefinite life continues to be supportable. If not, the change in useful life from indefinite to finite is made on a prospective basis.
22001199//2200 22001188//11
99 55..11..33 LLoossss oonn ddiissppoossaall $$000000 $$000000 Loss on disposal of infrastructure, property, plant and equipment 17,105 26,722 TToottaall LLoossss oonn ddiissppoossaall 1177,,110055 2266,,772222 Each year GMW negotiates with customers to rationalise parts of the irrigation infrastructure. Where assets are no longer in use, the book value of these assets is written off. The write off is recognised in the Statement of Comprehensive Income as a loss on disposal.
Any gain or loss on the disposal of fixed assets is recognised at the date of disposal and is determined after deducting the proceeds from the carrying value of the asset.
((aa)) WWoorrkk iinn pprrooggrreessss
CCoonnnneeccttiioonnss PPrroojjeecctt
$$000000
WWaatteerr SSttoorraaggee
&& DDeelliivveerryy $$000000
TToottaall
$$000000
OOppeenniinngg BBaallaannccee 117711,,886600 4422,,226622 221144,,112222 MMoovveemmeenntt 22001199//2200 Additions 92,076 11,508 103,585
Transfers (109,076) (33,903) (142,97
9) Total movement 2019/20 (17,000) (22,404) (39,404) BBaallaannccee aatt 3300 JJuunnee 22002200 115544,,886600 1199,,885588 117744,,771199 CCoonnnneeccttiioonnss PPrroojjeecctt Costs associated with the delivery of a modernised irrigation system which result in a new asset or enhance an existing asset are recorded as work in progress. WIP is transferred to Water Storage & Delivery when assets are operational. WWaatteerr SSttoorraaggee aanndd DDeelliivveerryy WIP is valued at cost plus an appropriate share of overheads. Assets are transferred from work in progress when the asset is operational.
55..11..22 DDeepprreecciiaattiioonn aanndd aammoorrttiissaattiioonn 22001199//2200 22001188//11
99 $$000000 $$000000 Depreciation of buildings 672 676 Depreciation of plant, equipment, furniture & fittings 4,083 4,464 Depreciation of infrastructure assets 94,476 93,747 Depreciation of right-of-use-assets 2,532 - Amortisation of intangibles 1,435 1,538 TToottaall DDeepprreecciiaattiioonn aanndd AAmmoorrttiissaattiioonn 110033,,119999 110000,,442255 All infrastructure and other non-current assets that have a limited useful life are depreciated. Depreciation rates are calculated on the asset’s value, less any estimated residual value, over its estimated useful life. Leasehold improvements are depreciated over the period of lease or estimated useful life, whichever is shorter. Depreciation is calculated on a straight-line basis. The estimated useful lives, residual values and depreciation method are reviewed at the end of each year, adjustments are made where appropriate. Generally useful lives are within the following ranges:
CCllaassss ooff aasssseettss EEssttiimmaatteedd lliiffee ((yyeeaarrss))

YEAR IN REVIEW GOVERNANCE AND ORGANISATIONAL STRUCTURE
2019/20 Goulburn-Murray Water Annual Report 99
WORKFORCE DATA OTHER DISCLOSURES FINANCIAL STATEMENTS
IImmppaaiirrmmeenntt eexxppeennsseess Fixed assets are assessed annually for indicators of impairment. If impairment indicators exist, the assets carrying value is compared to its recoverable amount. The recoverable amount is measured at the higher of depreciated replacement cost and fair value less costs to sell. Where an asset’s book value exceeds its recoverable amount, the asset is considered impaired and is written down accordingly. The difference is written-off in the Statement of Comprehensive Income except when an asset has a revaluation reserve. The impairment is then recognised in other comprehensive income up to the amount of any asset revaluation reserve. The reversal of an impairment loss on a revalued asset is recognised in equity as an asset revaluation increment except when an impairment loss on the same class of asset was previously recognised in the Statement of Comprehensive Income. A corresponding reversal of that impairment loss is also recognised in the Statement of Comprehensive Income.
22001199//2200 22001188//11
99 55..11..44 CCaappiittaall ccoommmmiittmmeennttss $$000000 $$000000 WWaatteerr SSttoorraaggee && DDeelliivveerryy Dams and Dam Safety Projects 307 422 Bridge Renewal and Upgrade Projects 2,524 2,746 Channel, Pipeline & Drain Upgrades 1,574 2,545 Outlet and Meter Upgrades 260 789 Information Technology Hardware & Software Upgrades 12 99 Other 1,796 2,731 TToottaall WWaatteerr SSttoorraaggee && DDeelliivveerryy ((iinncclluussiivvee ooff GGSSTT)) 66,,447733 99,,333322 CCoonnnneeccttiioonnss PPrroojjeecctt Project works 34,586 28,569 TToottaall CCoonnnneeccttiioonnss PPrroojjeecctt ((iinncclluussiivvee ooff GGSSTT)) 3344,,558866 2288,,556699 TToottaall CCaappiittaall ccoommmmiittmmeennttss ((iinncclluussiivvee ooff GGSSTT)) 4411,,005599 3377,,990011 Less GST recoverable from the Australian Tax Office (3,733) (3,446) TToottaall CCaappiittaall ccoommmmiittmmeennttss ((eexxcclluussiivvee ooff GGSSTT)) 3377,,332277 3344,,445566 These commitments are likely to fall within: No later than 1 year 41,059 37,901 TToottaall CCaappiittaall ccoommmmiittmmeennttss ((iinncclluussiivvee ooff GGSSTT)) 4411,,005599 3377,,990011 Commitments for future expenditure include capital commitments arising from contracts. These commitments are disclosed at their nominal value and inclusive of the GST payable. These future expenditures cease to be disclosed as commitments once the related liabilities are recognised in the balance sheet. Other commitments can be found in section 3.1.4 (Revenue commitments), section 4.3 (Operating expenditure commitments) and section 9.2.1 (Environmental contribution commitments).
22001199//2200 22001188//11
99 55..11..55 AAsssseett rreevvaalluuaattiioonn rreesseerrvvee $$000000 $$000000 Land 29,287 29,287 Buildings 3,374 3,374
Infrastructure 1,544,430 1,546,9
15

YEAR IN REVIEW GOVERNANCE AND ORGANISATIONAL STRUCTURE
2019/20 Goulburn-Murray Water Annual Report 100
WORKFORCE DATA OTHER DISCLOSURES FINANCIAL STATEMENTS
BBaallaannccee 3300 JJuunnee 11,,557777,,009911 11,,557799,,55
7766
LLaanndd BBuuiillddiinnggss IInnffrraassttrruucctt
uurree TToottaall MMoovveemmeennttss dduurriinngg tthhee rreeppoorrttiinngg ppeerriioodd $$000000 $$000000 $$000000 $$000000
Opening balance 29,287 3,374 1,546,915 1,579,5
76 Revaluation increment/(decrement) - - (2,484) (2,484)
CClloossiinngg bbaallaannccee 2299,,228877 33,,337744 11,,554444,,443300 11,,557777,,00
9911
55..22 IInnttaannggiibbllee aasssseettss
Intangible assets represent identifiable non-monetary assets without physical substance. Intangible assets are initially recognised at cost. Intangible assets with finite useful lives are carried at cost less any accumulated amortisation and impairment losses. Costs incurred subsequent to initial acquisition are capitalised when it is expected that additional future economic benefits will flow to GMW.
Gains or losses arising from disposal of an intangible asset are measured as the difference between the net disposal proceeds and the carrying amount of the asset. These are recognised as revenue or an expense in the Statement of Comprehensive Income.
22001199//2200 22001188//11
99 $$000000 $$000000 CCoommppuutteerr ssooffttwwaarree at cost 28,528 27,397 Less: Accumulated Amortisation (24,753) (23,358) 3,776 4,039 NNaattiivvee vveeggeettaattiioonn ooffffsseettss ((NNVVOO)) ((aa)) at cost 533 396 WWaatteerr sshhaarreess ((bb)) at cost 4,839 4,839
TToottaall IInnttaannggiibbllee aasssseettss 99,,114477 99,,227744
(a) From 1 January 2014, GMW must comply with the new Native Vegetation Permitted Clearing Regulations. Construction work that results in the loss of native vegetation creates an obligation for GMW. This requires GMW to purchase Native Vegetation Credits which are recognised as intangible assets. These credits are not amortised but are expensed as the offset is established and the consumption is then recorded. The balance of NVO's at 30 June 2020 represents the credits purchased which have not been formally offset against these obligations.
(b) GMW holds water shares both as part of the Water Storage & Delivery business and the Connections Project. The Intangible Assets include water shares that have been converted to bulk entitlements and water shares acquired from landowners, held by the Connections Project. Water shares have an indefinite life and are not amortised. Water shares held at year end for future sale are recorded as assets classified as held for sale. Where a decision has not been made regarding sale they are classified as Intangible Assets.
IImmppaaiirrmmeenntt eexxppeennsseess Fixed assets are assessed annually for indicators of impairment. If impairment indicators exist, the assets carrying value is compared to its recoverable amount. The recoverable amount is measured at the higher of depreciated replacement cost and fair value less costs to sell. Where an asset’s book value exceeds its recoverable amount, the asset is considered impaired and is written down accordingly. The difference is written-off in the Statement of Comprehensive Income except when an asset has a revaluation reserve. The impairment is then recognised in other comprehensive income up to the amount of any asset revaluation reserve. The reversal of an impairment loss on a revalued asset is recognised in equity as an asset revaluation increment except when an impairment loss on the same class of asset was previously recognised in the Statement of Comprehensive Income. A corresponding reversal of that impairment loss is also recognised in the Statement of Comprehensive Income.
22001199//2200 22001188//11
99 55..11..44 CCaappiittaall ccoommmmiittmmeennttss $$000000 $$000000 WWaatteerr SSttoorraaggee && DDeelliivveerryy Dams and Dam Safety Projects 307 422 Bridge Renewal and Upgrade Projects 2,524 2,746 Channel, Pipeline & Drain Upgrades 1,574 2,545 Outlet and Meter Upgrades 260 789 Information Technology Hardware & Software Upgrades 12 99 Other 1,796 2,731 TToottaall WWaatteerr SSttoorraaggee && DDeelliivveerryy ((iinncclluussiivvee ooff GGSSTT)) 66,,447733 99,,333322 CCoonnnneeccttiioonnss PPrroojjeecctt Project works 34,586 28,569 TToottaall CCoonnnneeccttiioonnss PPrroojjeecctt ((iinncclluussiivvee ooff GGSSTT)) 3344,,558866 2288,,556699 TToottaall CCaappiittaall ccoommmmiittmmeennttss ((iinncclluussiivvee ooff GGSSTT)) 4411,,005599 3377,,990011 Less GST recoverable from the Australian Tax Office (3,733) (3,446) TToottaall CCaappiittaall ccoommmmiittmmeennttss ((eexxcclluussiivvee ooff GGSSTT)) 3377,,332277 3344,,445566 These commitments are likely to fall within: No later than 1 year 41,059 37,901 TToottaall CCaappiittaall ccoommmmiittmmeennttss ((iinncclluussiivvee ooff GGSSTT)) 4411,,005599 3377,,990011 Commitments for future expenditure include capital commitments arising from contracts. These commitments are disclosed at their nominal value and inclusive of the GST payable. These future expenditures cease to be disclosed as commitments once the related liabilities are recognised in the balance sheet. Other commitments can be found in section 3.1.4 (Revenue commitments), section 4.3 (Operating expenditure commitments) and section 9.2.1 (Environmental contribution commitments).
22001199//2200 22001188//11
99 55..11..55 AAsssseett rreevvaalluuaattiioonn rreesseerrvvee $$000000 $$000000 Land 29,287 29,287 Buildings 3,374 3,374
Infrastructure 1,544,430 1,546,9
15

YEAR IN REVIEW GOVERNANCE AND ORGANISATIONAL STRUCTURE
2019/20 Goulburn-Murray Water Annual Report 101
WORKFORCE DATA OTHER DISCLOSURES FINANCIAL STATEMENTS
MMoovveemmeennttss dduurriinngg tthhee rreeppoorrttiinngg ppeerriioodd
CCoommppuutteerr
SSooffttwwaarree
NNaattiivvee VVeeggeettaattiioonn OOffffsseettss
WWaatteerr SShhaarreess
TToottaall
22001199//2200 $$000000 $$000000 $$000000 $$000000 Opening WDV 4,039 396 4,839 9,274 Additions 1,172 556 - 1,728 Consumption - (419) - (419) Amortisation (1,435) - - (1,435) CClloossiinngg WWDDVV 33,,777766 553333 44,,883399 99,,114488 22001188//1199 Opening WDV 2,152 452 4,839 7,443 Additions 3,425 302 - 3,727 Consumption - (358) - (358) Amortisation (1,538) - - (1,538) CClloossiinngg WWDDVV 44,,003399 339966 44,,883399 99,,227744 GMW holds water shares both as part of its normal operations, the Water Storage & Delivery business, and for the Connections Project. Water shares have an indefinite useful life and are not amortised. The two paragraphs below outline their use and classification: (i) Water shares are held by the Water Storage & Delivery business. They are held as bulk entitlements and water shares for operational use and are classified as Intangible assets. (ii) Water shares are acquired by the Connections Project during the course of the project. They are accounted for as assets in the reporting period in which they are acquired and an assessment made as to their carrying value based on their expected ultimate disposition. If it is expected that the water shares will ultimately be transferred as part of the project’s obligations rather than sold, then they are treated as a cost of the project. Water shares held at year end for future sale are recorded as assets classified as held for sale. Where a decision has not been made regarding sale they are classified as Intangible Assets.
Native vegetation offsets are acquired by the Connections Project during the course of the project. An offset makes an equivalent contribution to Victoria’s biodiversity for any native vegetation that is removed. They are accounted for as intangible assets in the reporting period in which they are acquired and when native vegetation is removed in the normal course of the project they are classed as consumed. Native vegetation offsets are measured at cost in accordance with the requirements of AASB 138 Intangible Assets and FRD109 Intangible Assets.
BBaallaannccee 3300 JJuunnee 11,,557777,,009911 11,,557799,,55
7766
LLaanndd BBuuiillddiinnggss IInnffrraassttrruucctt
uurree TToottaall MMoovveemmeennttss dduurriinngg tthhee rreeppoorrttiinngg ppeerriioodd $$000000 $$000000 $$000000 $$000000
Opening balance 29,287 3,374 1,546,915 1,579,5
76 Revaluation increment/(decrement) - - (2,484) (2,484)
CClloossiinngg bbaallaannccee 2299,,228877 33,,337744 11,,554444,,443300 11,,557777,,00
9911
55..22 IInnttaannggiibbllee aasssseettss
Intangible assets represent identifiable non-monetary assets without physical substance. Intangible assets are initially recognised at cost. Intangible assets with finite useful lives are carried at cost less any accumulated amortisation and impairment losses. Costs incurred subsequent to initial acquisition are capitalised when it is expected that additional future economic benefits will flow to GMW.
Gains or losses arising from disposal of an intangible asset are measured as the difference between the net disposal proceeds and the carrying amount of the asset. These are recognised as revenue or an expense in the Statement of Comprehensive Income.
22001199//2200 22001188//11
99 $$000000 $$000000 CCoommppuutteerr ssooffttwwaarree at cost 28,528 27,397 Less: Accumulated Amortisation (24,753) (23,358) 3,776 4,039 NNaattiivvee vveeggeettaattiioonn ooffffsseettss ((NNVVOO)) ((aa)) at cost 533 396 WWaatteerr sshhaarreess ((bb)) at cost 4,839 4,839
TToottaall IInnttaannggiibbllee aasssseettss 99,,114477 99,,227744
(a) From 1 January 2014, GMW must comply with the new Native Vegetation Permitted Clearing Regulations. Construction work that results in the loss of native vegetation creates an obligation for GMW. This requires GMW to purchase Native Vegetation Credits which are recognised as intangible assets. These credits are not amortised but are expensed as the offset is established and the consumption is then recorded. The balance of NVO's at 30 June 2020 represents the credits purchased which have not been formally offset against these obligations.
(b) GMW holds water shares both as part of the Water Storage & Delivery business and the Connections Project. The Intangible Assets include water shares that have been converted to bulk entitlements and water shares acquired from landowners, held by the Connections Project. Water shares have an indefinite life and are not amortised. Water shares held at year end for future sale are recorded as assets classified as held for sale. Where a decision has not been made regarding sale they are classified as Intangible Assets.

YEAR IN REVIEW GOVERNANCE AND ORGANISATIONAL STRUCTURE
2019/20 Goulburn-Murray Water Annual Report 102
WORKFORCE DATA OTHER DISCLOSURES FINANCIAL STATEMENTS
66.. OOtthheerr aasssseettss aanndd lliiaabbiilliittiieess
IInnttrroodduuccttiioonn This section sets out assets and liabilities incurred by GMW in the natural course of operations.
SSttrruuccttuurree 6.1 Receivables
6.1.1 Ageing analysis of contractual receivables 6.2 Payables
6.2.1 Ageing analysis of contractual payables 6.3 Right-of-use-assets and lease liabilities 66..11 RReecceeiivvaabblleess 22001199//2200 22001188//1199 CCuurrrreenntt -- CCoonnttrraaccttuuaall $$000000 $$000000 Trade debtors - Water Storage & Delivery 22,728 23,620 Trade debtors - Connections Project 202 534 Expected credit loss allowance (742) (641) CCuurrrreenntt -- SSttaattuuttoorryy GST 5,872 4,804 TToottaall CCuurrrreenntt rreecceeiivvaabblleess 2288,,005599 2288,,331177 NNoonn--CCuurrrreenntt -- CCoonnttrraaccttuuaall Trade debtors - Water Storage & Delivery 109 110 TToottaall NNoonn--CCuurrrreenntt rreecceeiivvaabblleess 110099 111100 TToottaall RReecceeiivvaabblleess 2288,,116688 2288,,442266 Receivables consist of: • Contractual receivables relating to debts for water rates, water consumption and contracting services provided. They are initially recognised at fair value and subsequently measured at amortised cost less any accumulated impairment. • Statutory receivables, such as Goods and Services Tax (GST) input tax credits recoverable. They are recognised and measured similarly but separately from contractual receivables because they do not arise from a contract.
6. Other assets and liabilities

YEAR IN REVIEW GOVERNANCE AND ORGANISATIONAL STRUCTURE
2019/20 Goulburn-Murray Water Annual Report 103
WORKFORCE DATA OTHER DISCLOSURES FINANCIAL STATEMENTS
66..11..11 AAggeeiinngg aannaallyyssiiss ooff ccoonnttrraaccttuuaall rreecceeiivvaabblleess
GMW applies the AASB 9 simplified approach to measuring expected credit losses which uses a lifetime expected loss allowance for contractual receivables. On that basis, the loss allowance as at 30 June 2020 was determined as follows:
CCaarrrryyiinngg
VVaalluuee NNoott ppaasstt
dduuee <<11
MMoonntthh 11 -- 33
MMoonntthhss 33 ++
MMoonntthhss 22002200 $$''000000 $$''000000 $$''000000 $$''000000 $$''000000 Trade debtors - WSD 22,836 7,917 44 583 14,292 Trade debtors - CP 202 25 - - 177 TToottaall 2233,,003388 77,,994422 4444 558833 1144,,446699 LLoossss AAlllloowwaannccee 774422 -- -- -- 774422 Expected loss rate 3% 0% 0% 0% 5% 22001199 Trade debtors - WSD 23,730 8,416 1,502 1,315 12,497 Trade debtors - CP 534 468 33 - 33 TToottaall 2244,,226644 88,,888844 11,,553355 11,,331155 1122,,553300 LLoossss AAlllloowwaannccee 664422 -- -- -- 664422 Expected loss rate 3% 0% 0% 0% 5% Receivables from service and usage charges are written off when there is no reasonable expectation of recovery. Indicators of this include failure to engage in a repayment plan and failure to engage with debt recovery agencies. Loss allowances are presented in other operational expenses within the comprehensive operating statement. Long outstanding debt is for owner-occupied irrigation properties. These debt are secured against the respective property. This is established through the Water Act 1989 s274 (4), (4A) and (5). Once the property is sold or ownership changes, the debt is legally required to be repaid to GMW. Given these circumstances there was no impact on the impairment of trade debtors based on an assessment of expected credit losses given first time adoption of AASB 9 in 2018-19. Recoverability of debt is assessed on a case by case basis. 66..22 PPaayyaabblleess 22001199//2200 22001188//1199 CCuurrrreenntt -- CCoonnttrraaccttuuaall $$000000 $$000000 Trade creditors - Water Storage & Delivery 15,524 3,940 Trade creditors - Connections Project 1,979 2,074 Accrued expenses 35,519 26,016 CCuurrrreenntt -- SSttaattuuttoorryy Accrued expenses 266 114 TToottaall PPaayyaabblleess 5533,,228888 3322,,114444 Payables consist of: • Contractual payables are liabilities for goods and services provided to GMW, which remain unpaid at year end. They are measured at amortised cost. • Statutory payables include goods and services tax and fringe benefits tax payables. They are recognised and measured similarly but separately from contractual payables because they do not arise from a contract.

YEAR IN REVIEW GOVERNANCE AND ORGANISATIONAL STRUCTURE
2019/20 Goulburn-Murray Water Annual Report 104
WORKFORCE DATA OTHER DISCLOSURES FINANCIAL STATEMENTS
66..22..11 AAggeeiinngg aannaallyyssiiss ooff ccoonnttrraaccttuuaall ppaayyaabblleess
CCaarrrryyiinngg
VVaalluuee NNoott ppaasstt
dduuee <<11
MMoonntthh 11 -- 33
MMoonntthhss 33 ++
MMoonntthhss 22002200 $$''000000 $$''000000 $$''000000 $$''000000 $$''000000 Trade creditors - WSD 24,124 23,826 224 72 2 Trade creditors - CP 28,898 28,379 221 265 33 TToottaall 5533,,002222 5522,,220055 444455 333377 3355 22001199 Trade creditors - WSD 11,833 11,529 246 11 47 Trade creditors - CP 20,197 19,787 219 73 118 TToottaall 3322,,003300 3311,,331166 446655 8844 116655 66..33 LLeeaasseess This note provides information for leases where GMW is a lessee. ((ii)) AAmmoouunnttss rreeccooggnniisseedd iinn tthhee bbaallaannccee sshheeeett The balance sheet shows the following amounts relating to leases: 22001199//2200 22001188//1199** $$000000 $$000000 RRiigghhtt--ooff--uussee aasssseettss Building 187 - Equipment - - Vehicles 1,638 - Others 52 - TToottaall lleeaassee aasssseettss 11,,887788 - Finance lease asset - -
Lease liabilities Current 1,354 - Non - Current 572 - TToottaall lleeaassee lliiaabbiilliittiieess 11,,992266 -
Additions to the right-of-use assets during the 2020 financial year were $679,122 ((iiii)) AAmmoouunnttss rreeccooggnniisseedd iinn tthhee ssttaatteemmeenntt ooff pprrooffiitt oorr lloossss The statement of profit or loss shows the following amounts relating to leases: 22001199//2200 22001188//1199 $$000000 $$000000 DDeepprreecciiaattiioonn cchhaarrggee ooff rriigghhtt--ooff--uussee aasssseettss Building 189 - Equipment - - Vehicles 2,200 - Others 144 - TToottaall 22,,553322 -

YEAR IN REVIEW GOVERNANCE AND ORGANISATIONAL STRUCTURE
2019/20 Goulburn-Murray Water Annual Report 105
WORKFORCE DATA OTHER DISCLOSURES FINANCIAL STATEMENTS
22001199//2200 22001188//1199 $$000000 $$000000 Interest expense (included in finance cost) 175 - Expense relating to short-term leases (included in administrative and other operating expenses) 68
-
Expense relating to leases of low-value assets that are not short-term leases (included in administrative and other operating expenses 3
-
Expense relating to variable lease payments not included in lease liabilities (included in administrative and other operating expenses) -
-
TToottaall 224466 - The total cash outflow for leases in 2020 was $3,010,096 ((iiiiii)) GGMMWW''ss lleeaassiinngg aaccttiivviittiieess aanndd hhooww tthheessee aarree aaccccoouunntteedd ffoorr GMW leases various properties, equipment and vehicles. Rental contracts are typically made for fixed periods of 1 to 5 years, but may have extension options as described below. Contracts may contain both lease and non-lease components. GMW allocates the consideration in the contract to the lease and non-lease components based on their relative stand-alone price. Lease terms are negotiated on an individual basis and contain a wide range of different terms and conditions. The lease agreements do not impose any covenants, but lease assets may not be used as security for borrowing purposes. From 1 July 2019 leases are recognised as a right-of-use asset and a corresponding liability at the date at which the leased asset is available for use by GMW. Assets and liabilities arising from a lease are initially measured on a present value basis. Lease liabilities include the net present value of the following lease payments: • fixed payments (including in-substance fixed payments), less any lease incentives receivable • variable lease payments that are based on an index or a rate • amounts expected to be payable by the lessee under residual value guarantees • the exercise price of a purchase option if the lessee is reasonably certain to exercise that option, and • payments of penalties for terminating the lease, if the lease term reflects the lessee exercising that option. Each lease payment is allocated between the liability and finance cost. The finance cost is charged to comprehensive operating statement over the lease period to produce a constant periodic rate of interest on the remaining balance of the liability for each period. The right-of-use asset is depreciated over the shorter of the asset's useful life and the lease term on a straight-line basis. Lease payments to be made under reasonably certain extension options are also included in the measurement of the liability. The lease payments are discounted using the interest rate implicit in the lease or GMW's incremental borrowing rate. Treasury Corporation of Victoria (TCV) / Department of Treasury's (DTF) calculator is used to determine incremental borriwng rate.

YEAR IN REVIEW GOVERNANCE AND ORGANISATIONAL STRUCTURE
2019/20 Goulburn-Murray Water Annual Report 106
WORKFORCE DATA OTHER DISCLOSURES FINANCIAL STATEMENTS
Right-of-use assets are initially measured at cost comprising the following: • the amount of the initial measurement of lease liability • any lease payments made at or before the commencement date, less any lease incentives received • any initial direct costs, and • restoration costs. Right-of-use assets are generally depreciated over the shorter of the asset's useful life and the lease term on a straight-line basis. If GMW is reasonably certain to exercise a purchase option, the right-of-use asset is depreciated over the underlying asset's useful life. While GMW revalues its land and buildings that are presented within property, plant and equipment, it has chosen not to do so for the right-of-use building held by GMW. Subsequently the right-of-use assets are measured by applying a fair value model. GMW applies the revaluation model in AASB 116 to right-of-use assets that relate to the class of property, plant and equipment. The revaluation model is applied to all of the right-of-use assets that relate to that class or property, plant and equipment. Payments associated with short-term leases and leases of low-value assets are recognised on a straight-line basis as an expense in profit or loss. Short-term leases are leases with a lease term of 12 months or less. Low-value assets comprise IT-equipment and photo copiers with individual values less than $10,000 when new. GMW is exposed to future cash outflows to which the lessee is potentially exposed that are not reflected in the measurement of lease liabilities. This includes exposure arising from: • variable lease payments • extension options and termination options • residual value guarantees • leases not yet commenced to which the lessee is committed, and • expected impact of COVID-19 on lease receivables.
77.. FFiinnaanncciinngg oouurr ooppeerraattiioonnss
IInnttrroodduuccttiioonn
This section provides information on the funding sources used by GMW, along with interest expenses and other information related to GMW's financing activities.
SSttrruuccttuurree 7.1 Interest bearing liabilities
7.1.1 Maturity analysis 7.1.2 Interest expense
7.2 Cash flow information 7.2.1 Reconciliation of net result to cash flow from operating activities 7.2.2 Cash balances with restrictions over use 7.2.3 Financing facilities
7.3 Equity 7.3.1 Contributed capital

YEAR IN REVIEW GOVERNANCE AND ORGANISATIONAL STRUCTURE
2019/20 Goulburn-Murray Water Annual Report 107
WORKFORCE DATA OTHER DISCLOSURES FINANCIAL STATEMENTS
7. Financing our operations
Right-of-use assets are initially measured at cost comprising the following: • the amount of the initial measurement of lease liability • any lease payments made at or before the commencement date, less any lease incentives received • any initial direct costs, and • restoration costs. Right-of-use assets are generally depreciated over the shorter of the asset's useful life and the lease term on a straight-line basis. If GMW is reasonably certain to exercise a purchase option, the right-of-use asset is depreciated over the underlying asset's useful life. While GMW revalues its land and buildings that are presented within property, plant and equipment, it has chosen not to do so for the right-of-use building held by GMW. Subsequently the right-of-use assets are measured by applying a fair value model. GMW applies the revaluation model in AASB 116 to right-of-use assets that relate to the class of property, plant and equipment. The revaluation model is applied to all of the right-of-use assets that relate to that class or property, plant and equipment. Payments associated with short-term leases and leases of low-value assets are recognised on a straight-line basis as an expense in profit or loss. Short-term leases are leases with a lease term of 12 months or less. Low-value assets comprise IT-equipment and photo copiers with individual values less than $10,000 when new. GMW is exposed to future cash outflows to which the lessee is potentially exposed that are not reflected in the measurement of lease liabilities. This includes exposure arising from: • variable lease payments • extension options and termination options • residual value guarantees • leases not yet commenced to which the lessee is committed, and • expected impact of COVID-19 on lease receivables.
77.. FFiinnaanncciinngg oouurr ooppeerraattiioonnss
IInnttrroodduuccttiioonn
This section provides information on the funding sources used by GMW, along with interest expenses and other information related to GMW's financing activities.
SSttrruuccttuurree 7.1 Interest bearing liabilities
7.1.1 Maturity analysis 7.1.2 Interest expense
7.2 Cash flow information 7.2.1 Reconciliation of net result to cash flow from operating activities 7.2.2 Cash balances with restrictions over use 7.2.3 Financing facilities
7.3 Equity 7.3.1 Contributed capital
77..11 IInntteerreesstt bbeeaarriinngg lliiaabbiilliittiieess 22001199//2200 22001188//1199 $$000000 $$000000 CCuurrrreenntt Lease liabilities - WSD 1,202 - Lease liabilities - CP 152 - Loans from TCV - WSD 17,299 2,163 TToottaall ccuurrrreenntt bboorrrroowwiinnggss 1188,,665533 22,,116633 NNoonn--ccuurrrreenntt Lease liabilities - WSD 527 - Lease liabilities - CP 45 - Loans from TCV - WSD 92,947 110,246 TToottaall NNoonn--ccuurrrreenntt bboorrrroowwiinnggss 9933,,551199 111100,,224466 TToottaall BBoorrrroowwiinnggss 111122,,117711 111122,,440099
All interest bearing liabilities are initially recognised at the fair value of the liability, less directly attributable transaction costs. Interest bearing liabilities are subsequently measured at amortised cost.
Interest bearing liabilities are classified as current liabilities unless GMW has an unconditional right to defer settlement of the liabilitie for at least 12 months after the balance sheet date. GMW's credit rating is A (2019: A) 77..11..11 MMaattuurriittyy aannaallyyssiiss 22001199//2200 22001188//1199 LLeeaasseess LLooaannss LLeeaasseess LLooaannss
Less than 1 year 1,354 17,299 - 2,163 1-2 years 419 4,943 - 17,299 2-3 years 130 10,097 - 2,443 3-4 years 17 5,260 - 7,597 4-5 years 6 6,579 - 10,260 > 5 years - 66,067 - 72,647
TToottaall CCaarrrryyiinngg AAmmoouunntt 11,,992266 111100,,224455 -- 111122,,440099
77..11..22 IInntteerreesstt eexxppeennssee
Interest expense 5,729 5,758 Interest on finance leases under AASB 16 175 - Financial accommodation levy 1,230 1,172 TToottaall IInntteerreesstt EExxppeennssee 77,,113344 66,,993311
Interest expense represents costs incurred from borrowings, recognised in the period they are incurred. Interest expenses relate to interest on short and long term borrowings including the Financial Accommodation Levy and lease charges.
77..22 CCaasshh ffllooww iinnffoorrmmaattiioonn
Cash and cash equivalents on the balance sheet comprise of cash on hand, cash at bank and deposits at call. These are held for the purpose of meeting short term cash commitments rather than for investment purposes. Cash and deposits are measured at nominal value. 22001199//2200 22001188//1199 CCaasshh aanndd ccaasshh eeqquuiivvaalleennttss $$000000 $$000000 Cash at bank 34,363 141,447 Cash on deposit 139,952 178,194 TToottaall CCaasshh aanndd ccaasshh eeqquuiivvaalleennttss 117744,,331155 331199,,664411
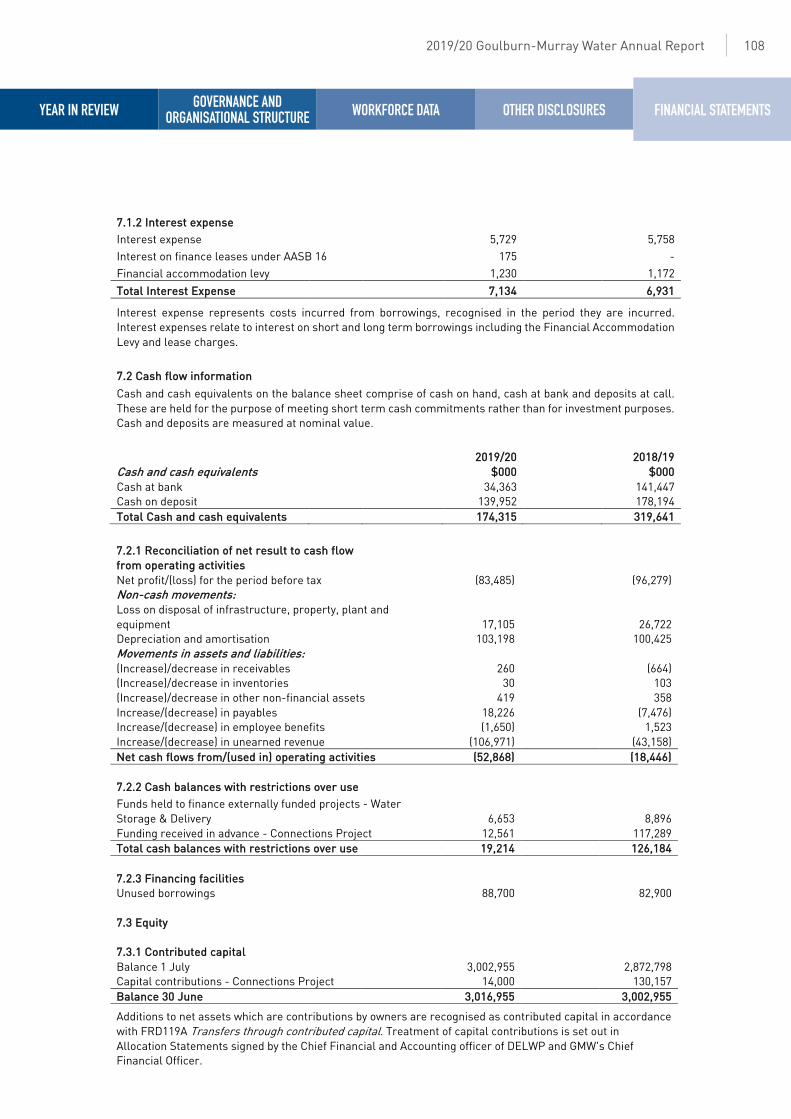
YEAR IN REVIEW GOVERNANCE AND ORGANISATIONAL STRUCTURE
2019/20 Goulburn-Murray Water Annual Report 108
WORKFORCE DATA OTHER DISCLOSURES FINANCIAL STATEMENTS
77..22..11 RReeccoonncciilliiaattiioonn ooff nneett rreessuulltt ttoo ccaasshh ffllooww ffrroomm ooppeerraattiinngg aaccttiivviittiieess Net profit/(loss) for the period before tax (83,485) (96,279) NNoonn--ccaasshh mmoovveemmeennttss:: Loss on disposal of infrastructure, property, plant and equipment 17,105 26,722 Depreciation and amortisation 103,198 100,425 MMoovveemmeennttss iinn aasssseettss aanndd lliiaabbiilliittiieess:: (Increase)/decrease in receivables 260 (664) (Increase)/decrease in inventories 30 103 (Increase)/decrease in other non-financial assets 419 358 Increase/(decrease) in payables 18,226 (7,476) Increase/(decrease) in employee benefits (1,650) 1,523 Increase/(decrease) in unearned revenue (106,971) (43,158) NNeett ccaasshh fflloowwss ffrroomm//((uusseedd iinn)) ooppeerraattiinngg aaccttiivviittiieess ((5522,,886688)) ((1188,,444466)) 77..22..22 CCaasshh bbaallaanncceess wwiitthh rreessttrriiccttiioonnss oovveerr uussee Funds held to finance externally funded projects - Water Storage & Delivery 6,653 8,896 Funding received in advance - Connections Project 12,561 117,289 TToottaall ccaasshh bbaallaanncceess wwiitthh rreessttrriiccttiioonnss oovveerr uussee 1199,,221144 112266,,118844 77..22..33 FFiinnaanncciinngg ffaacciilliittiieess Unused borrowings 88,700 82,900 77..33 EEqquuiittyy 77..33..11 CCoonnttrriibbuutteedd ccaappiittaall Balance 1 July 3,002,955 2,872,798 Capital contributions - Connections Project 14,000 130,157 BBaallaannccee 3300 JJuunnee 33,,001166,,995555 33,,000022,,995555
Additions to net assets which are contributions by owners are recognised as contributed capital in accordance with FRD119A Transfers through contributed capital. Treatment of capital contributions is set out in Allocation Statements signed by the Chief Financial and Accounting officer of DELWP and GMW's Chief Financial Officer.
77..11 IInntteerreesstt bbeeaarriinngg lliiaabbiilliittiieess 22001199//2200 22001188//1199 $$000000 $$000000 CCuurrrreenntt Lease liabilities - WSD 1,202 - Lease liabilities - CP 152 - Loans from TCV - WSD 17,299 2,163 TToottaall ccuurrrreenntt bboorrrroowwiinnggss 1188,,665533 22,,116633 NNoonn--ccuurrrreenntt Lease liabilities - WSD 527 - Lease liabilities - CP 45 - Loans from TCV - WSD 92,947 110,246 TToottaall NNoonn--ccuurrrreenntt bboorrrroowwiinnggss 9933,,551199 111100,,224466 TToottaall BBoorrrroowwiinnggss 111122,,117711 111122,,440099
All interest bearing liabilities are initially recognised at the fair value of the liability, less directly attributable transaction costs. Interest bearing liabilities are subsequently measured at amortised cost.
Interest bearing liabilities are classified as current liabilities unless GMW has an unconditional right to defer settlement of the liabilitie for at least 12 months after the balance sheet date. GMW's credit rating is A (2019: A) 77..11..11 MMaattuurriittyy aannaallyyssiiss 22001199//2200 22001188//1199 LLeeaasseess LLooaannss LLeeaasseess LLooaannss
Less than 1 year 1,354 17,299 - 2,163 1-2 years 419 4,943 - 17,299 2-3 years 130 10,097 - 2,443 3-4 years 17 5,260 - 7,597 4-5 years 6 6,579 - 10,260 > 5 years - 66,067 - 72,647
TToottaall CCaarrrryyiinngg AAmmoouunntt 11,,992266 111100,,224455 -- 111122,,440099
77..11..22 IInntteerreesstt eexxppeennssee
Interest expense 5,729 5,758 Interest on finance leases under AASB 16 175 - Financial accommodation levy 1,230 1,172 TToottaall IInntteerreesstt EExxppeennssee 77,,113344 66,,993311
Interest expense represents costs incurred from borrowings, recognised in the period they are incurred. Interest expenses relate to interest on short and long term borrowings including the Financial Accommodation Levy and lease charges.
77..22 CCaasshh ffllooww iinnffoorrmmaattiioonn
Cash and cash equivalents on the balance sheet comprise of cash on hand, cash at bank and deposits at call. These are held for the purpose of meeting short term cash commitments rather than for investment purposes. Cash and deposits are measured at nominal value. 22001199//2200 22001188//1199 CCaasshh aanndd ccaasshh eeqquuiivvaalleennttss $$000000 $$000000 Cash at bank 34,363 141,447 Cash on deposit 139,952 178,194 TToottaall CCaasshh aanndd ccaasshh eeqquuiivvaalleennttss 117744,,331155 331199,,664411

YEAR IN REVIEW GOVERNANCE AND ORGANISATIONAL STRUCTURE
2019/20 Goulburn-Murray Water Annual Report 109
WORKFORCE DATA OTHER DISCLOSURES FINANCIAL STATEMENTS
88.. RRiisskkss,, ccoonnttiinnggeenncciieess aanndd vvaalluuaattiioonn jjuuddggeemmeennttss
IInnttrroodduuccttiioonn
This section sets out financial instrument specific information, including items that are contingent or require a higher level of judgement to be applied. GMW applies fair value determination where possible. GMW is exposed to risk from its activities and outside factors. It is often necessary to make accounting judgements and estimates for items in the financial statements.
SSttrruuccttuurree 8.1 Financial instrument specific disclosures
8.1.1 Financial instruments: categorisation 8.1.2 Financial risk management objectives and policies
8.2 Contingent assets and contingent liabilities 8.3 Fair value determination
8.3.1 Fair value determination: financial assets and liabilities 8.3.2 Fair value determination: Non- financial physical assets
88..11 FFiinnaanncciiaall iinnssttrruummeenntt ssppeecciiffiicc ddiisscclloossuurreess
Financial assets and liabilities are recognised when GMW enters contractual provisions of a financial instrument.
Loans, receivables and cash are financial instruments with fixed and determinable payments. These assets and liabilities are initially recognised at fair value plus any direct costs. Subsequent to initial measurement, loans and receivables are measured at amortised cost using the effective interest rate method.
The following financial instruments are recognised in this way; - cash assets; - receivables (excluding statutory receivables); - payables (excluding statutory payables); and - borrowings.
22001199//2200 22001188//1199 88..11..11 FFiinnaanncciiaall iinnssttrruummeennttss:: ccaatteeggoorriissaattiioonn $$000000 $$000000 FFiinnaanncciiaall aasssseettss aatt aammoorrttiisseedd ccoosstt Cash and cash equivalents 174,314 319,640 Receivables 23,038 24,264 TToottaall 119977,,335522 334433,,990044 Financial liabilities at amortised cost Contractual payables (53,281) (32,026) Borrowings (112,171) (112,409) TToottaall ((116655,,445522)) ((114444,,443355)) 88..11..22 FFiinnaanncciiaall rriisskk mmaannaaggeemmeenntt oobbjjeeccttiivveess aanndd ppoolliicciieess
The main financial risks include credit risk, liquidity risk and interest rate risk. GMW seeks to manage these risks and the associated volatility of its financial performance within government policy parameters. Primary responsibility for the identification and management of financial risks rests with the Board of GMW.
8. Risks, contingencies and valuation judgements

YEAR IN REVIEW GOVERNANCE AND ORGANISATIONAL STRUCTURE
2019/20 Goulburn-Murray Water Annual Report 110
WORKFORCE DATA OTHER DISCLOSURES FINANCIAL STATEMENTS
((aa)) CCrreeddiitt rriisskk GMW’s exposure to credit risk arises from the potential default of a customer resulting in financial loss. This is influenced by the individual characteristics of each customer. The receivables balance primarily consists of unpaid rates and variable charges. Levels of debt are closely managed with interest charged and supply withheld if scheduled payments are not made. The Water Act 1989 fixes this debt as a charge on the property and gives GMW priority on the proceeds of sale. There is credit risk exposure to receivables due from rent of land for grazing and commercial purposes which are not protected under the Act. An analysis of the ageing of receivables at reporting date has been provided in Note 6.1.1
6.1.1 ((bb)) LLiiqquuiiddiittyy rriisskk
Liquidity risk is the risk that GMW would be unable to meet its obligations as and when they fall due. GMW operates under the Government fair payments policy of settling financial obligations in 30 days and in the event of dispute, making payments within 30 days of the date of resolution. The maximum exposure to liquidity risk is the carrying amount of financial liabilities as disclosed on the balance sheet. Liquidity risk is managed by maintaining adequate banking and borrowing facilities, monitoring forecasts and actual cash flows and managing maturity profiles.
((cc)) MMaarrkkeett rriisskk FFoorreeiiggnn ccuurrrreennccyy rriisskk There is no exposure to foreign currency risk. IInntteerreesstt rraattee rriisskk Interest rate risk is the risk of changes in interest rates. GMW has exposure to interest rate risks through its cash and deposits which are at a floating rate.
IInntteerreesstt rraattee eexxppoossuurree ooff ffiinnaanncciiaall iinnssttrruummeennttss
WWeeiigghhtteedd aavveerraaggee %%
iinntteerreesstt rraattee
CCaarrrryyiinngg AAmmoouunntt
FFiixxeedd iinntteerreesstt
rraattee VVaarriiaabbllee
iinntteerreesstt rraattee
NNoonn--iinntteerreesstt bbeeaarriinngg
22002200 %% $$000000 %% %% $$000000 Cash 0.8% 174,314 - 0.8% - Contractual receivables 4.0% 23,038 4.0% - 7,256 Contractual payables 0.0% (53,281) - - (53,281)
Borrowings 6.2% (112,171) 2.5% to
7.2% - - TToottaall 3311,,889999 ((4466,,002255)) 22001199 Cash 1.5% 319,640 - 1.5% - Contractual receivables 5.0% 24,264 5.0% - 8,367 Contractual payables 0.0% (32,026) - - (32,026)
Borrowings 6.2% (112,409) 2.5% to
7.2% - - TToottaall 119999,,446699 ((2233,,665599)) Contractual receivables and payables balances above do not include statutory amounts.

YEAR IN REVIEW GOVERNANCE AND ORGANISATIONAL STRUCTURE
2019/20 Goulburn-Murray Water Annual Report 111
WORKFORCE DATA OTHER DISCLOSURES FINANCIAL STATEMENTS
((dd)) SSeennssiittiivviittyy ddiisscclloossuurree aannaallyyssiiss aanndd aassssuummppttiioonnss
GMW's sensitivity to interest rate risk is determined by data over the last 12 months and existing market conditions, with all other variables held constant. Management cannot be expected to predict movements in market rates and prices. Sensitivity analysis shown is for illustrative purposes only. The following movements are possible over the next 12 months: - An interest rate movement of 50 basis points up and down. The following table shows the impact on the net result and equity for each category of financial instrument held at the end of the reporting period if the above movement were to occur. IInntteerreesstt rraattee rriisskk
22002200
TToottaall ++5500 bbaassiiss ppooiinnttss
NNeett RReessuulltt
++5500 bbaassiiss ppooiinnttss EEqquuiittyy
--5500 bbaassiiss ppooiinnttss
NNeett RReessuulltt
--5500 bbaassiiss ppooiinnttss EEqquuiittyy
FFiinnaanncciiaall AAsssseettss $000 $000 $000 $000 $000 Cash 174,314 872 872 (872) (872) Contractual receivables 23,038 - - - - TToottaall FFiinnaanncciiaall AAsssseettss 119977,,335522 887722 887722 ((887722)) ((887722)) FFiinnaanncciiaall LLiiaabbiilliittiieess Contractual Payables (53,281) - - - - Borrowings (112,171) - - - - TToottaall FFiinnaanncciiaall LLiiaabbiilliittiieess ((116655,,445533)) -- -- -- -- TToottaall iinnccrreeaassee aanndd ddeeccrreeaassee 3311,,889999 887722 887722 ((887722)) ((887722)) 22001199 FFiinnaanncciiaall AAsssseettss Cash 319,640 1,598 1,598 (1,598) (1,598) Contractual receivables 24,264 - - - - TToottaall FFiinnaanncciiaall AAsssseettss 334433,,990033 11,,559988 11,,559988 ((11,,559988)) ((11,,559988)) FFiinnaanncciiaall LLiiaabbiilliittiieess Contractual payables (32,026) - - - - Borrowings (112,409) - - - - TToottaall FFiinnaanncciiaall LLiiaabbiilliittiieess ((114444,,443355)) -- -- -- -- TToottaall iinnccrreeaassee aanndd ddeeccrreeaassee 119999,,446688 11,,559988 11,,559988 ((11,,559988)) ((11,,559988)) 88..22 CCoonnttiinnggeenntt aasssseettss aanndd ccoonnttiinnggeenntt lliiaabbiilliittiieess
Contingent assets and liabilities are not recognised on the balance sheet but are disclosed and, if quantifiable, are measured at nominal value. Contingent assets and liabilities are presented inclusive of GST receivable or payable. 22001199//2200 22001188//1199 CCoonnttiinnggeenntt aasssseettss:: $$000000 $$000000 Other - 696 TToottaall CCoonnttiinnggeenntt AAsssseettss -- 669966
As part of the Milestone 9a, DELWP reduced the payment by $696k. This was in accordance with the funding agreement between the State and GMW. During the 2019/20 financial year this amount was paid by DELWP to the Project.

YEAR IN REVIEW GOVERNANCE AND ORGANISATIONAL STRUCTURE
2019/20 Goulburn-Murray Water Annual Report 112
WORKFORCE DATA OTHER DISCLOSURES FINANCIAL STATEMENTS
Contingent liabilities generally arise through legal actions against GMW as a result of damages claims primarily relating to flooding events and channel overtopping. In many of these matters GMW has disclaimed liability and is defending the actions. Any liability that may arise from these claims will be immaterial. 22001199//2200 22001188//1199 CCoonnttiinnggeenntt lliiaabbiilliittiieess:: $$000000 $$000000 Potential labour disbursements (i) - 193 Connections Project - verbal agreements with irrigators (ii) 4,262 22,799 TToottaall CCoonnttiinnggeenntt LLiiaabbiilliittiieess 44,,226622 2222,,999922 (i) A potential issue was identified in relation to a small number of employees. During the 2018/19 financial year this error was rectified to the benefit of most identified employees with the remaining employees impacted being rectified during the 2019/20 financial year.
(ii) All amounts included in contingent liabilities are GST inclusive. The amount disclosed in relation to verbally agreed contracts / agreements with landholders represents the Connections Project's expected liability for incentives to be paid or delivery shares and water shares to be purchased. The extent of the economic outflow is contingent upon formal execution of the contracts. In the case of water shares, the final settlement of the transactions.
88..33 FFaaiirr vvaalluuee ddeetteerrmmiinnaattiioonn
Significant judgements: Fair value measurement Fair value determination requires judgement and the use of assumptions. Changes to significant assumptions could have a material impact on the results and financial position of GMW. Land held by GMW is predominately around storages with management assessing that there has been no impact on land valuations as a result of COVID.
All assets measured at fair value are categorised within the fair value hierarchy. The hierarchy has 3 levels. Starting at Level 1 the first appropriate valuation is applied. • Level 1 – Quoted (unadjusted) market prices in active markets for identical assets or liabilities • Level 2 – Valuation techniques for which the lowest level input that is significant to the fair value measurement is directly or indirectly observable; and • Level 3 – Valuation techniques for which the lowest level input that is significant to the fair value measurement is unobservable.
GMW has determined asset classes based on the nature and characteristics of assets. The level of the fair value hierarchy is applied to asset classes. Transfers between levels are assessed at the end of each reporting period. The Valuer-General Victoria (VGV) is GMW’s independent valuation agency. GMW, in conjunction with VGV and other external valuers, monitor changes in the fair value of each asset through relevant data sources to determine whether revaluation is required. Management considers a range of indicators to assess any changes in fair value measurements from period to period, including valuation movements in relevant indices, market factors and asset use. 88..33..11 FFaaiirr vvaalluuee ddeetteerrmmiinnaattiioonn:: ffiinnaanncciiaall aasssseettss aanndd lliiaabbiilliittiieess
GMW currently holds financial instruments where the carrying amounts are approximately fair value. This is generally due to their short term nature or the expectation they will be paid in full by the end of the reporting period. These financial instruments include:

YEAR IN REVIEW GOVERNANCE AND ORGANISATIONAL STRUCTURE
2019/20 Goulburn-Murray Water Annual Report 113
WORKFORCE DATA OTHER DISCLOSURES FINANCIAL STATEMENTS
FFiinnaanncciiaall aasssseettss FFiinnaanncciiaall lliiaabbiilliittiieess Cash and deposits Payables Receivables 3300 JJuunnee 22002200 3300 JJuunnee 22001199
CCaarrrryyiinngg AAmmoouunntt
FFaaiirr VVaalluuee CCaarrrryyiinngg AAmmoouunntt
FFaaiirr VVaalluuee
FFiinnaanncciiaall lliiaabbiilliittiieess $$''000000 $$''000000 $$''000000 $$''000000 Borrowings (112,171) (140,249) (112,409) (141,625) TToottaall FFiinnaanncciiaall lliiaabbiilliittiieess ((111122,,117711)) ((114400,,224499)) ((111122,,440099)) ((114411,,662255)) The fair value of interest bearing financial liabilities is determined by discounting the expected future cash flows against current interest rates 88..33..22 FFaaiirr vvaalluuee ddeetteerrmmiinnaattiioonn:: NNoonn--ffiinnaanncciiaall pphhyyssiiccaall aasssseettss NNoonn--ssppeecciiaalliisseedd llaanndd
Non-specialised land is valued using the market approach. Under this valuation method, the assets are compared to recent comparable sales or sales of comparable assets which are considered to have nominal or no added improvement value. Non-specialised land is classified as Level 3 where it contains significant, unobservable adjustments.
For non-specialised land, an independent valuation was performed as at 30 June 2016 by independent valuers Egans Valuers on behalf of the Valuer General Victoria to determine the fair value using the market approach. Since then, no material movements have been identified. SSppeecciiaalliisseedd llaanndd aanndd ssppeecciiaalliisseedd bbuuiillddiinnggss
The market approach is used for specialised land, although it is adjusted for the Community Service Obligation (CSO) to reflect the specialised nature of the land being valued. The current use is considered to be highest and best use.
The highest and best use takes into account all feasible and legal asset uses. As adjustments of CSO are considered as significant unobservable inputs, specialised land is classified as Level 3 fair value measurements.
For GMW’s specialised buildings, the depreciated replacement cost method is used. As depreciation adjustments are considered as significant, unobservable inputs in nature, specialised buildings are classified as Level 3 fair value measurements.
An independent valuation of GMW's specialised land and specialised buildings was performed by Egans Valuers. The effective date of the valuation was 30 June 2016. No material movements have been identified. IInnffrraassttrruuccttuurree aasssseettss
Infrastructure assets are valued using depreciated replacement cost. This represents the replacement cost of the asset after applying depreciation rates on a useful life basis. Replacement costs relate to replacing the current service capacity of the asset. Infrastructure assets are classified as Level 3 as depreciation adjustments are considered significant unobservable inputs.
An independent valuation of GMW’s infrastructure assets was performed by Jacobs Valuers on behalf of the Valuer General Victoria. The valuation was performed based on the depreciated replacement cost of the assets. The effective date of the valuation was 30 June 2016 and no material movements have been identified. PPllaanntt aanndd eeqquuiippmmeenntt
Plant and equipment is held at fair value. These assets are classified as level 3. When plant and equipment is specialised in use, fair value is determined using the depreciated replacement cost.

YEAR IN REVIEW GOVERNANCE AND ORGANISATIONAL STRUCTURE
2019/20 Goulburn-Murray Water Annual Report 114
WORKFORCE DATA OTHER DISCLOSURES FINANCIAL STATEMENTS
There were no changes in valuation techniques throughout the period to 30 June 2020. DDeettaaiillss ooff GGMMWW’’ss llaanndd,, bbuuiillddiinnggss aanndd iinnffrraassttrruuccttuurree aasssseettss aanndd ppllaanntt && eeqquuiippmmeenntt ffaaiirr vvaalluuee hhiieerraarrcchhyy aass aatt 3300 JJuunnee 22002200::
There have been no transfers between levels in the current financial year.
22001199//2200 LLeevveell 11 LLeevveell 22 LLeevveell 33 CCaarrrryyiinngg
aammoouunntt $$000000 $$000000 $$000000 $$000000 Land - 3,579 50,497 54,076 Buildings - - 17,134 17,134 Infrastructure - - 4,445,263 4,445,263 Plant & equipment - - 9,795 9,795
TToottaall IInnffrraassttrruuccttuurree aasssseettss,, pprrooppeerrttyy,, ppllaanntt && eeqquuiippmmeenntt -- 33,,557799 44,,552222,,668888 44,,552266,,226677 22001188//1199 Land - 3,579 50,495 54,074 Buildings - - 16,965 16,965 Infrastructure - - 4,419,222 4,419,222 Plant & equipment - - 13,257 13,257
TToottaall IInnffrraassttrruuccttuurree aasssseettss,, pprrooppeerrttyy,, ppllaanntt && eeqquuiippmmeenntt -- 33,,557799 44,,449999,,994400 44,,550033,,551199
RReeccoonncciilliiaattiioonn ooff LLeevveell 33 ffaaiirr vvaalluuee LLaanndd BBuuiillddiinnggss IInnffrraassttrruuccttuurree PPllaanntt &&
eeqquuiippmmeenntt 22001199//2200 $$000000 $$000000 $$000000 $$000000 Opening Balance 50,495 16,966 4,419,222 13,258 Purchases/(sales) and asset class transfers 2 840 124,066 621 Revaluation increment / (decrement) - - - - Gains/(losses) recognised in net result Impairment - - (3,549) - Depreciation - (672) (94,476) (4,083) CClloossiinngg BBaallaannccee 5500,,449977 1177,,113344 44,,444455,,226633 99,,779966 22001188//1199 Opening Balance 50,462 17,032 4,372,796 13,402 Purchases/(sales) and asset class transfers 33 610 140,768 4,324 Revaluation increment / (decrement) - - 1 - Gains/(losses) recognised in net result Impairment - - (595) - Depreciation - (676) (93,747) (4,469) CClloossiinngg BBaallaannccee 5500,,449955 1166,,996666 44,,441199,,222222 1133,,225588 DDeessccrriippttiioonn ooff ssiiggnniiffiiccaanntt uunnoobbsseerrvvaabbllee iinnppuuttss ttoo LLeevveell 33 vvaalluuaattiioonnss

YEAR IN REVIEW GOVERNANCE AND ORGANISATIONAL STRUCTURE
2019/20 Goulburn-Murray Water Annual Report 115
WORKFORCE DATA OTHER DISCLOSURES FINANCIAL STATEMENTS
AAsssseett TTyyppee VVaalluuaattiioonn tteecchhnniiqquuee SSiiggnniiffiiccaanntt uunnoobbsseerrvvaabbllee iinnppuuttss SSppeecciiaalliisseedd llaanndd
Land Market Evidence
Community Service Obligation (CSO) $ per hectare
(Based on Egans Valuers Valuation 2016)
SSppeecciiaalliisseedd bbuuiillddiinnggss
Buildings
Depreciated replacement cost (Based on Egans Valuers Valuation 2016)
$ per m2
Useful life of specialised buildings IInnffrraassttrruuccttuurree AAsssseettss Dams
Depreciated replacement cost (Based on Jacobs Valuation 2016)
$ per m3 • Foundation Works $ per m3 • Embankments $ per m3 • Spillways $ per tonne $ per m3 • Outlet Works $ per tonne Useful life of the Infrastructure CChhaannnneellss ((eexxcclluuddiinngg bbaannkkss)) Depreciated replacement
cost (Based on Jacobs Valuation 2016). Unit rate will vary based on nominal flow (ML/day)
• Earthen Channels $ per metre • HDPE Lined Channels $ per metre • Concrete Lined Channels $ per metre Useful life of the Infrastructure SSttrruuccttuurreess
Depreciated replacement cost (Based on Jacobs Valuation 2016)
$ per m2
• Bridges $ per metre • Culverts Useful life of the Infrastructure MMeetteerrss Depreciated replacement
cost (Based on Jacobs Valuation 2016)
Cost per unit
Useful life of the Infrastructure
PPiippeelliinneess Depreciated replacement
cost (Based on Jacobs Valuation 2016)
Cost per unit
Useful life of the Infrastructure
PPllaanntt,, EEqquuiippmmeenntt,, FFuurrnniittuurree && FFiittttiinnggss
Plant, Equipment, Furniture & Fittings Depreciated replacement cost
Cost per unit Useful life of assets
There were no changes in valuation techniques throughout the period to 30 June 2020. DDeettaaiillss ooff GGMMWW’’ss llaanndd,, bbuuiillddiinnggss aanndd iinnffrraassttrruuccttuurree aasssseettss aanndd ppllaanntt && eeqquuiippmmeenntt ffaaiirr vvaalluuee hhiieerraarrcchhyy aass aatt 3300 JJuunnee 22002200::
There have been no transfers between levels in the current financial year.
22001199//2200 LLeevveell 11 LLeevveell 22 LLeevveell 33 CCaarrrryyiinngg
aammoouunntt $$000000 $$000000 $$000000 $$000000 Land - 3,579 50,497 54,076 Buildings - - 17,134 17,134 Infrastructure - - 4,445,263 4,445,263 Plant & equipment - - 9,795 9,795
TToottaall IInnffrraassttrruuccttuurree aasssseettss,, pprrooppeerrttyy,, ppllaanntt && eeqquuiippmmeenntt -- 33,,557799 44,,552222,,668888 44,,552266,,226677 22001188//1199 Land - 3,579 50,495 54,074 Buildings - - 16,965 16,965 Infrastructure - - 4,419,222 4,419,222 Plant & equipment - - 13,257 13,257
TToottaall IInnffrraassttrruuccttuurree aasssseettss,, pprrooppeerrttyy,, ppllaanntt && eeqquuiippmmeenntt -- 33,,557799 44,,449999,,994400 44,,550033,,551199
RReeccoonncciilliiaattiioonn ooff LLeevveell 33 ffaaiirr vvaalluuee LLaanndd BBuuiillddiinnggss IInnffrraassttrruuccttuurree PPllaanntt &&
eeqquuiippmmeenntt 22001199//2200 $$000000 $$000000 $$000000 $$000000 Opening Balance 50,495 16,966 4,419,222 13,258 Purchases/(sales) and asset class transfers 2 840 124,066 621 Revaluation increment / (decrement) - - - - Gains/(losses) recognised in net result Impairment - - (3,549) - Depreciation - (672) (94,476) (4,083) CClloossiinngg BBaallaannccee 5500,,449977 1177,,113344 44,,444455,,226633 99,,779966 22001188//1199 Opening Balance 50,462 17,032 4,372,796 13,402 Purchases/(sales) and asset class transfers 33 610 140,768 4,324 Revaluation increment / (decrement) - - 1 - Gains/(losses) recognised in net result Impairment - - (595) - Depreciation - (676) (93,747) (4,469) CClloossiinngg BBaallaannccee 5500,,449955 1166,,996666 44,,441199,,222222 1133,,225588 DDeessccrriippttiioonn ooff ssiiggnniiffiiccaanntt uunnoobbsseerrvvaabbllee iinnppuuttss ttoo LLeevveell 33 vvaalluuaattiioonnss

YEAR IN REVIEW GOVERNANCE AND ORGANISATIONAL STRUCTURE
2019/20 Goulburn-Murray Water Annual Report 116
WORKFORCE DATA OTHER DISCLOSURES FINANCIAL STATEMENTS
99.. SSttaattuuttoorryy oobblliiggaattiioonnss
IInnttrroodduuccttiioonn
This section includes disclosures in relation to GMW's statutory obligations.
SSttrruuccttuurree 9.1 Tax
9.1.1 Income tax 9.1.2 Deferred tax assets and liabilities
9.2 Environmental contribution 9.2.1 Environmental contribution commitments
99..11 TTaaxx GMW is subject to the National Tax Equivalent Regime (NTER), which is administered by the Australian Tax Office. The income tax expense or revenue for the period is calculated based on the current period's taxable income at the corporate tax rate of 30%, adjusted by changes in deferred tax balances.
Current and deferred tax is recognised in profit or loss, except to the extent that it relates to items recognised in other comprehensive income or directly in equity. 99..11..11 IInnccoommee ttaaxx The income tax expense for the financial year differs from the amount calculated on the net result. Reconciled as follows: 22001199//2200 22001188//1199 CCuurrrreenntt ttaaxx $$000000 $$000000 Current tax expense/(benefit) in respect of current year (2,211) (6,420) Adjustments recognised in the current year in relation to the current tax of prior years
16 (186)
(2,195) (6,605) DDeeffeerrrreedd ttaaxx Deferred tax expense recognised in the current year (22,832) (22,453) TToottaall IInnccoommee ttaaxx eexxppeennssee//((bbeenneeffiitt)) rreeccooggnniisseedd iinn tthhee ccuurrrreenntt yyeeaarr rreellaattiinngg ttoo ccoonnttiinnuuiinngg ooppeerraattiioonnss
((2255,,002266)) ((2299,,005599))
((bb)) RReeccoonncciilliiaattiioonn ooff iinnccoommee ttaaxx ttoo pprriimmaa ffaacciiee ttaaxx ppaayyaabbllee The Income tax for the year can be reconciled to the accounting profit as follows:
Profit / (loss) before tax from continuing operations (83,485) (96,279) Income tax calculated at 30% (2019: 30%) (25,045) (28,884) Provision for impairment of receivables 30 40 Accrued expenses 2,603 (2,237) Employee benefits (494) 457 Depreciation - Infrastructure assets, property, plant & equipment 20,696 24,205 TTaaxx eeffffeecctt ooff ccuurrrreenntt yyeeaarr lloosssseess ((22,,221100)) ((66,,441199)) Deferred income tax expense (22,832) (22,453) Adjustments recognised in the current year in relation to the current tax of prior years
16 (186)
TToottaall iinnccoommee ttaaxx eexxppeennssee//((bbeenneeffiitt)) ((2255,,002266)) ((2299,,005599)) 99..11..22 DDeeffeerrrreedd ttaaxx aasssseettss aanndd lliiaabbiilliittiieess
9. Statutory obligations

YEAR IN REVIEW GOVERNANCE AND ORGANISATIONAL STRUCTURE
2019/20 Goulburn-Murray Water Annual Report 117
WORKFORCE DATA OTHER DISCLOSURES FINANCIAL STATEMENTS
Deferred tax assets and liabilities are recognised for temporary differences at the tax rates expected to apply when the assets are recovered or liabilities are settled. No deferred tax asset or liability is recognised in relation to temporary differences if they arose in a transaction, that at the time of the transaction did not affect either accounting profit or taxable profit or loss. Deferred tax assets are recognised for deductible temporary differences and unused tax losses on the basis of there being sufficient taxable temporary differences relating to the same taxation authority and the expectation of future taxable profits. 22001199//2200 22001188//1199 DDeeffeerrrreedd ttaaxx aasssseett // ((lliiaabbiilliittyy)) ccoommpprriissiinngg:: $$000000 $$000000 Infrastructure assets, property, plant and equipment (968,167) (989,955) OOffffsseett bbyy ddeeffeerrrreedd ttaaxx aasssseett ccoommpprriissiinngg:: Tax losses 477,746 475,556 Provision for impairment of receivables 223 192 Accrued expenses 11,337 8,761 Employee benefits 7,087 7,581 NNeett ddeeffeerrrreedd ttaaxx aasssseett // ((lliiaabbiilliittyy)) ((447711,,777733)) ((449977,,886655)) MMoovveemmeenntt iinn nneett ddeeffeerrrreedd ttaaxx aasssseett // ((lliiaabbiilliittyy)) Opening balance (497,865) (527,103) Tax effect of current year tax losses 2,212 6,420 Movement charged to operating profit / (loss) 22,832 22,453 Movement charged to equity 1,065 179 Under / (over) provision for income tax (16) 186 CClloossiinngg bbaallaannccee ((447711,,777733)) ((449977,,886655)) 99..22 EEnnvviirroonnmmeennttaall ccoonnttrriibbuuttiioonn Environmental contribution 2,793 2,793
The Water Industry (Environmental Contributions) Act 2004 amended the Water Industry Act 1994 to require environmental contributions to be paid by water supply authorities. GMW is obliged to pay annual contributions into the Department of Environment, Land, Water and Planning consolidated fund. The purpose of the environmental contribution is to fund initiatives that promote the sustainable management of water or address water-related initiatives. GMW recognises the environmental contribution as an expense during the reporting period it is incurred. In accordance with the Ministerial Order the Environmental Contributions Tranche 5 has been set to commence on 1 July 2020 till 30 June 2024. GMWs annual commitment during the four years is $2.6m. 99..22..11 EEnnvviirroonnmmeennttaall ccoonnttrriibbuuttiioonn ccoommmmiittmmeennttss Environmental contribution 10,309 2,793 Total Other expenditure commitments (inclusive of GST) 10,309 2,793 Less GST recoverable from the Australian Tax Office - - Total Other expenditure commitments (exclusive of GST) 10,309 2,793 These commitments are likely to fall within: No later than 1 year 2,577 2,793 Later than 1 year and not later than 5 years 7,732 - Total Other expenditure commitments (inclusive of GST) 10,309 2,793
Other commitments can be found in section 3.1.4 (Revenue commitments), section 4.3 (Operating expenditure commitments) and section 5.1.4 (Capital expenditure commitments).
99.. SSttaattuuttoorryy oobblliiggaattiioonnss
IInnttrroodduuccttiioonn
This section includes disclosures in relation to GMW's statutory obligations.
SSttrruuccttuurree 9.1 Tax
9.1.1 Income tax 9.1.2 Deferred tax assets and liabilities
9.2 Environmental contribution 9.2.1 Environmental contribution commitments
99..11 TTaaxx GMW is subject to the National Tax Equivalent Regime (NTER), which is administered by the Australian Tax Office. The income tax expense or revenue for the period is calculated based on the current period's taxable income at the corporate tax rate of 30%, adjusted by changes in deferred tax balances.
Current and deferred tax is recognised in profit or loss, except to the extent that it relates to items recognised in other comprehensive income or directly in equity. 99..11..11 IInnccoommee ttaaxx The income tax expense for the financial year differs from the amount calculated on the net result. Reconciled as follows: 22001199//2200 22001188//1199 CCuurrrreenntt ttaaxx $$000000 $$000000 Current tax expense/(benefit) in respect of current year (2,211) (6,420) Adjustments recognised in the current year in relation to the current tax of prior years
16 (186)
(2,195) (6,605) DDeeffeerrrreedd ttaaxx Deferred tax expense recognised in the current year (22,832) (22,453) TToottaall IInnccoommee ttaaxx eexxppeennssee//((bbeenneeffiitt)) rreeccooggnniisseedd iinn tthhee ccuurrrreenntt yyeeaarr rreellaattiinngg ttoo ccoonnttiinnuuiinngg ooppeerraattiioonnss
((2255,,002266)) ((2299,,005599))
((bb)) RReeccoonncciilliiaattiioonn ooff iinnccoommee ttaaxx ttoo pprriimmaa ffaacciiee ttaaxx ppaayyaabbllee The Income tax for the year can be reconciled to the accounting profit as follows:
Profit / (loss) before tax from continuing operations (83,485) (96,279) Income tax calculated at 30% (2019: 30%) (25,045) (28,884) Provision for impairment of receivables 30 40 Accrued expenses 2,603 (2,237) Employee benefits (494) 457 Depreciation - Infrastructure assets, property, plant & equipment 20,696 24,205 TTaaxx eeffffeecctt ooff ccuurrrreenntt yyeeaarr lloosssseess ((22,,221100)) ((66,,441199)) Deferred income tax expense (22,832) (22,453) Adjustments recognised in the current year in relation to the current tax of prior years
16 (186)
TToottaall iinnccoommee ttaaxx eexxppeennssee//((bbeenneeffiitt)) ((2255,,002266)) ((2299,,005599)) 99..11..22 DDeeffeerrrreedd ttaaxx aasssseettss aanndd lliiaabbiilliittiieess

YEAR IN REVIEW GOVERNANCE AND ORGANISATIONAL STRUCTURE
2019/20 Goulburn-Murray Water Annual Report 118
WORKFORCE DATA OTHER DISCLOSURES FINANCIAL STATEMENTS
1100.. OOtthheerr ddiisscclloossuurreess
IInnttrroodduuccttiioonn
This section includes additional material disclosures required by accounting standards or otherwise, for the understanding of this financial report.
SSttrruuccttuurree 10.1 Events happening after balance date 10.2 Responsible persons 10.3 Remuneration of executives and other personnel 10.4 Related Parties 10.5 Remuneration of auditors 10.6 Exgratia expenses 10.7 Changes in accounting policies 10.8 Australian Accounting Standards issued that are not yet effective 1100..11 EEvveennttss hhaappppeenniinngg aafftteerr bbaallaannccee ddaattee CCOOVVIIDD ddeevveellooppmmeennttss ssuubbsseeqquueenntt ttoo bbaallaannccee ddaattee While the initial state of emergency was lifted and certain restrictions eased in response to the coronavirus, in July 2020 the State Government reintroduced stricter measures as cases of coronavirus began to increase and in August 2020 declared a state of disaster with further restrictions introduced. Regional Victoria was placed under a Stage 3 lockdown protocol, while metropolitan Melbourne was placed under more stringent Stage 4 measures. At the time of certification of the financial report an easing of restrictions was planned, commencing on 14 September 2020. 1100..22 RReessppoonnssiibbllee ppeerrssoonnss The names of the responsible persons at any time during the financial year were: MMiinniisstteerr:: PPeerriioodd ooff ppoossiittiioonn hheelldd The Hon Lisa Neville MLA, Minister for Water
1 July 2019 to 30 June 2020
DDiirreeccttoorrss ooff GGMMWW:: Diane James AM (Chair) 1 July 2019 to 30 June 2020 Charmaine Quick (Managing Director) 1 July 2019 to 30 June 2020 David McKenzie (Board Member) 1 July 2019 to 30 June 2020 Margot Henty (Board Member) 1 July 2019 to 30 June 2020 Alana Johnson AM (Board Member) 1 July 2019 to 30 June 2020 Jonathon Koop (Board Member) 1 July 2019 to 30 June 2020 Patrick McNamara (Deputy Chair) 1 July 2019 to 30 June 2020 Margaret O'Rourke (Board Member) 1 July 2019 to 30 June 2020 Dennis Quinn (Board Member) 1 July 2019 to 30 June 2020 Ari Suss (Board Member) 1 July 2019 to 30 June 2020 RReemmuunneerraattiioonn RReemmuunneerraattiioonn ooff rreessppoonnssiibbllee ppeerrssoonnss
10. Other disclosures

YEAR IN REVIEW GOVERNANCE AND ORGANISATIONAL STRUCTURE
2019/20 Goulburn-Murray Water Annual Report 119
WORKFORCE DATA OTHER DISCLOSURES FINANCIAL STATEMENTS
Remuneration paid to Minister is reported in the Annual Report of the Department of Parliamentary Services. Other relevant interests are declared in the Register of Members Interests which each member of Parliament completes. The remuneration received or receivable from GMW by responsible persons during the reporting period was in the range:
NNuummbbeerr ooff DDiirreeccttoorrss ((TToottaall RReemmuunneerraattiioonn))
RReemmuunneerraattiioonn BBaanndd 22001199//2200 22001188//1199 $0 to $9,999 - 2 $30,000 to $39,999 - 1 $40,000 to $49,999 7 6 $50,000 to $59,999 1 $60,000 to $69,999 - 1 $90,000 to $99,999 - 1 $110,000 to $119,999 1 - $180,000 to $189,999 - 1 $190,000 to $199,999 - 1 $240,000 to $249,999 - 1 $410,000 to $419,999 1 - TToottaall aammoouunntt (($$)) $$992200,,887788 $$11,,009933,,445566 TToottaall nnuummbbeerrss 1100 1144
1100..33 RReemmuunneerraattiioonn ooff eexxeeccuuttiivveess The table below shows the number of executive officers, other than ministers and accountable officers, and their total remuneration during the reporting period. Total annualised employee equivalents provides a measure of full time equivalent executive officers over the reporting period. Remuneration comprises employee benefits in all forms of consideration paid, payable or provided by or on behalf of GMW, in exchange for services rendered, and is disclosed in the following categories. SShhoorrtt--tteerrmm eemmppllooyyeeee bbeenneeffiittss include amounts such as wages, salaries, annual leave or sick leave that are usually paid or payable on a regular basis, as well as non-monetary benefits. PPoosstt--eemmppllooyymmeenntt bbeenneeffiittss include pensions and other retirement benefits paid or payable on a discrete basis when employment has ceased.
OOtthheerr lloonngg--tteerrmm bbeenneeffiittss include long service leave, other long service benefits or deferred compensation.
Termination benefits include termination of employment payments, such as severance packages. RReemmuunneerraattiioonn ooff eexxeeccuuttiivvee ooffffiicceerrss (including Key Management Personnel disclosed in Note 10.4) 22001199//2200 22001188//1199 $$000000 $$000000 Short-term employee benefits 2,527 1,744 Post-employment benefits 252 167 Other long-term benefits 17 24 Termination benefits 431 - TToottaall rreemmuunneerraattiioonn 33,,222277 11,,993355 TToottaall nnuummbbeerr ooff eexxeeccuuttiivveess 1144 1100 TToottaall aannnnuuaalliisseedd eemmppllooyyeeee eeqquuiivvaalleennttss 1100 77
1100.. OOtthheerr ddiisscclloossuurreess
IInnttrroodduuccttiioonn
This section includes additional material disclosures required by accounting standards or otherwise, for the understanding of this financial report.
SSttrruuccttuurree 10.1 Events happening after balance date 10.2 Responsible persons 10.3 Remuneration of executives and other personnel 10.4 Related Parties 10.5 Remuneration of auditors 10.6 Exgratia expenses 10.7 Changes in accounting policies 10.8 Australian Accounting Standards issued that are not yet effective 1100..11 EEvveennttss hhaappppeenniinngg aafftteerr bbaallaannccee ddaattee CCOOVVIIDD ddeevveellooppmmeennttss ssuubbsseeqquueenntt ttoo bbaallaannccee ddaattee While the initial state of emergency was lifted and certain restrictions eased in response to the coronavirus, in July 2020 the State Government reintroduced stricter measures as cases of coronavirus began to increase and in August 2020 declared a state of disaster with further restrictions introduced. Regional Victoria was placed under a Stage 3 lockdown protocol, while metropolitan Melbourne was placed under more stringent Stage 4 measures. At the time of certification of the financial report an easing of restrictions was planned, commencing on 14 September 2020. 1100..22 RReessppoonnssiibbllee ppeerrssoonnss The names of the responsible persons at any time during the financial year were: MMiinniisstteerr:: PPeerriioodd ooff ppoossiittiioonn hheelldd The Hon Lisa Neville MLA, Minister for Water
1 July 2019 to 30 June 2020
DDiirreeccttoorrss ooff GGMMWW:: Diane James AM (Chair) 1 July 2019 to 30 June 2020 Charmaine Quick (Managing Director) 1 July 2019 to 30 June 2020 David McKenzie (Board Member) 1 July 2019 to 30 June 2020 Margot Henty (Board Member) 1 July 2019 to 30 June 2020 Alana Johnson AM (Board Member) 1 July 2019 to 30 June 2020 Jonathon Koop (Board Member) 1 July 2019 to 30 June 2020 Patrick McNamara (Deputy Chair) 1 July 2019 to 30 June 2020 Margaret O'Rourke (Board Member) 1 July 2019 to 30 June 2020 Dennis Quinn (Board Member) 1 July 2019 to 30 June 2020 Ari Suss (Board Member) 1 July 2019 to 30 June 2020 RReemmuunneerraattiioonn RReemmuunneerraattiioonn ooff rreessppoonnssiibbllee ppeerrssoonnss

YEAR IN REVIEW GOVERNANCE AND ORGANISATIONAL STRUCTURE
2019/20 Goulburn-Murray Water Annual Report 120
WORKFORCE DATA OTHER DISCLOSURES FINANCIAL STATEMENTS
1100..44 RReellaatteedd PPaarrttiieess GMW is a wholly owned and controlled entity of the State of Victoria. Related parties of GMW include: - All key management personnel and their close family members and other personal business interests (controlled entities, joint ventures and entities they have significant influence over); - All cabinet members and their close family members; - All public sector entities that are controlled and consolidated into the whole of state consolidated financial statements. All related party transactions have been entered into on an arm's length basis. KKeeyy mmaannaaggeemmeenntt ppeerrssoonnnneell of GMW includes the Portfolio Minister and Board members noted in Note 10.2, voting members of the Project Control Group (independent to GMW) and members of the executive team, which includes: KKeeyy MMaannaaggeemmeenntt PPeerrssoonnnneell ooff GGMMWW:: PPeerriioodd ooff ppoossiittiioonn hheelldd - PCG Chair, Peter McManamon 1 July 2019 to 8 August 2019 - PCG Chair / PCG voting member, Pat McNamara 1 July 2019 to 30 June 2020 - PCG voting member, Campbell Fitzpatrick 1 July 2019 to 30 June 2020 - GM Business and Finance, Michael Gomez 26 August 2019 to 30 June 2020 - GM Water Delivery Services, Warren Blyth 30 September 2019 to 30 June 2020 - GM Water Delivery Services, Mark Bailey 15 July 2019 to 2 October 2019 - GM Water Storage Services, Martina Cusack 1 July 2019 to 30 June 2020 - GM Infrastructure Delivery Services, Warren Jose 12 August 2019 to 30 June 2020 - GM Strategy & Services Planning, Daniel Irwin 15 July 2019 to 30 June 2020 - GM Customer and Stakeholders, Ann Telford 1 July 2019 to 30 June 2020 - GM People Culture and Safety, Glenda Smith 15 July 2019 to 30 June 2020 - Chief Financial Officer, Tracey Hood 1 July 2019 to 19 January 2020 - GM Water Delivery, Peter Clydesdale 1 July 2019 to 14 July 2019 - GM Corporate Services, Alan Arthur 1 July 2019 to 5 July 2019 - GM Infrastructure & Assets, Marc Lon Ho Kee 1 July 2019 to 27 January 2020 - Project Director, Frank Fisseler (Connections Project) 1 July 2019 to 30 June 2020 The compensation detailed below excludes the salaries and benefits the Portfolio Minister receives, and any payments to the Project Control Group. The minister's remuneration and allowances is set by the Parliamentary Salaries and Superannuation Act 1968 and is reported within the Department of Parliamentary Services' Financial Report. Remuneration of the Project Control Group is set and paid by DELWP. 22001199//2200 22001188//1199 CCoommppeennssaattiioonn ooff KKMMPP''ss $$000000 $$000000 Short-term employee benefits (i) 3,195 2,602 Post-employment benefits 292 199 Other long-term benefits 11 (7) Termination benefits 431 153 TToottaall ((iiii)) 33,,992288 22,,994477 (i) Total remuneration paid to KMPs through an external service provider have been reported under short-term employee benefits.
(ii) Note that some KMPs are also reported in the disclosure of remuneration of executives (Note 10.3) and Responsible persons (Note 10.2).

YEAR IN REVIEW GOVERNANCE AND ORGANISATIONAL STRUCTURE
2019/20 Goulburn-Murray Water Annual Report 121
WORKFORCE DATA OTHER DISCLOSURES FINANCIAL STATEMENTS
TTrraannssaaccttiioonnss wwiitthh KKeeyy MMaannaaggeemmeenntt PPeerrssoonnnneell GMW's related parties transact with the Victorian public sector in a manner consistent with other members of the public e.g. stamp duty, and other government fees and charges. Processes within the Victorian public sector occur on terms and conditions consistent with the Public Administration Act 2004 and Codes of Conduct and Standards issued by the Victorian Public Sector Commission. Outside of normal citizen type transactions with the department, there were no related party transactions that involved key management personnel and their close family members. No doubtful debt provision or bad debt expense has been recognised for related parties. TTrraannssaaccttiioonnss wwiitthh ootthheerr rreellaatteedd ppaarrttiieess 22001199//2200 22001188//1199 DDeeppaarrttmmeenntt ooff EEnnvviirroonnmmeenntt,, LLaanndd,, WWaatteerr aanndd PPllaannnniinngg $$000000
$$000000
GMW receives contributions from DELWP and from the Commonwealth through DELWP as funding for the Connections Project. These receipts are in the form of revenue or equity contributions based on the nature of expenditure by the project.
In addition, GMW received funding from DELWP for water allocation trading and public amenities upgrades. Payments made to DELWP relate to MBDA contributions, regional water monitoring, environmental contributions, water share and bulk entitlement costs.
RReecceeiippttss ffrroomm DDEELLWWPP Revenue Funding (Connections Project) 9,334 34,136 Revenue Funding (Other) 1,523 1,216 Capital Funding (Connections Project) 14,000 130,156 Other 425 - RReecceeiivvaabbllee ffrroomm DDEELLWWPP Revenue Funding (Other) - - PPaayymmeennttss ttoo DDEELLWWPP GMW Contribution to the MDBA programme - 29,887 Environmental Contributions 2,793 2,793 Regional Water Monitoring 1,715 975 Water shares & Bulk entitlements 536 750 Native Vegetation Offsets 556 - Other 875 100 PPaayyaabbllee ttoo DDEELLWWPP GMW Contribution to the MDBA programme 11,348 -
TTrreeaassuurryy CCoorrppoorraattiioonn ooff VViiccttoorriiaa GMW borrows from and invests with the Treasury Corporation of Victoria.
Aggregate amount of borrowings 112,171 112,409 Interest expense 5,729 5,758
DDeeppaarrttmmeenntt ooff TTrreeaassuurryy aanndd FFiinnaannccee GMW pays amounts to the State Government of Victoria, via the Department of Treasury and Finance.
PPaayymmeennttss ttoo DDTTFF
Financial Accommodation Levy 1,230 1,172 VViiccttoorriiaann EEnnvviirroonnmmeennttaall WWaatteerr HHoollddeerr

YEAR IN REVIEW GOVERNANCE AND ORGANISATIONAL STRUCTURE
2019/20 Goulburn-Murray Water Annual Report 122
WORKFORCE DATA OTHER DISCLOSURES FINANCIAL STATEMENTS
GMW invoices the Victorian Environmental Water Holder for water use charges in line with Essential Services Commission approved pricing.
RReecceeiippttss ffrroomm VVEEWWHH
Revenue from water use 5,430 3,811 LLoowweerr MMuurrrraayy UUrrbbaann aanndd RRuurraall WWaatteerr CCoorrppoorraattiioonn GMW invoices Lower Murray Urban and Rural Water Corporation for water use charges and regional storage fees in line with Essential Services Commission approved pricing.
RReecceeiippttss ffrroomm LLoowweerr MMuurrrraayy UUrrbbaann aanndd RRuurraall WWaatteerr CCoorrppoorraattiioonn
Revenue from water use 112 148 CCoolliibbaann RReeggiioonn WWaatteerr CCoorrppoorraattiioonn GMW invoices Coliban Region Water Corporation for water use charges and regional storage fees in line with Essential Services Commission approved pricing.
RReecceeiippttss ffrroomm CCoolliibbaann RReeggiioonn WWaatteerr CCoorrppoorraattiioonn
Revenue from water use 1,267 1,707
22001199//2200 22001188//1199
GGoouullbbuurrnn VVaalllleeyy RReeggiioonn WWaatteerr CCoorrppoorraattiioonn $$000000 $$000000 GMW invoices Goulburn Valley Region Water Corporation for water use charges and regional storage fees in line with Essential Services Commission approved pricing.
RReecceeiippttss ffrroomm GGoouullbbuurrnn VVaalllleeyy RReeggiioonn WWaatteerr CCoorrppoorraattiioonn
Revenue from water use 1,017 1,053 NNoorrtthh EEaasstt WWaatteerr GMW invoices North East Water for water use charges and regional storage fees in line with Essential Services Commission approved pricing.
RReecceeiippttss ffrroomm NNoorrtthh EEaasstt WWaatteerr
Revenue from water use 959 898 CCeennttrraall HHiigghhllaannddss WWaatteerr GMW invoices Central Highlands Water for water use charges and regional storage fees in line with Essential Services Commission approved pricing.
RReecceeiippttss ffrroomm CCeennttrraall HHiigghhllaannddss WWaatteerr
Revenue from water use 325 324 GGoouullbbuurrnn BBrrookkeenn CCMMAA GMW invoices Goulburn Broken CMA for works carried out under the Sustainable Irrigation Program agreement.
RReecceeiippttss ffrroomm GGoouullbbuurrnn BBrrookkeenn CCMMAA
Sustainable Irrigation Program 3,814 3,555 Other receipts 12 370
1100..55 RReemmuunneerraattiioonn ooff aauuddiittoorrss
TTrraannssaaccttiioonnss wwiitthh KKeeyy MMaannaaggeemmeenntt PPeerrssoonnnneell GMW's related parties transact with the Victorian public sector in a manner consistent with other members of the public e.g. stamp duty, and other government fees and charges. Processes within the Victorian public sector occur on terms and conditions consistent with the Public Administration Act 2004 and Codes of Conduct and Standards issued by the Victorian Public Sector Commission. Outside of normal citizen type transactions with the department, there were no related party transactions that involved key management personnel and their close family members. No doubtful debt provision or bad debt expense has been recognised for related parties. TTrraannssaaccttiioonnss wwiitthh ootthheerr rreellaatteedd ppaarrttiieess 22001199//2200 22001188//1199 DDeeppaarrttmmeenntt ooff EEnnvviirroonnmmeenntt,, LLaanndd,, WWaatteerr aanndd PPllaannnniinngg $$000000
$$000000
GMW receives contributions from DELWP and from the Commonwealth through DELWP as funding for the Connections Project. These receipts are in the form of revenue or equity contributions based on the nature of expenditure by the project.
In addition, GMW received funding from DELWP for water allocation trading and public amenities upgrades. Payments made to DELWP relate to MBDA contributions, regional water monitoring, environmental contributions, water share and bulk entitlement costs.
RReecceeiippttss ffrroomm DDEELLWWPP Revenue Funding (Connections Project) 9,334 34,136 Revenue Funding (Other) 1,523 1,216 Capital Funding (Connections Project) 14,000 130,156 Other 425 - RReecceeiivvaabbllee ffrroomm DDEELLWWPP Revenue Funding (Other) - - PPaayymmeennttss ttoo DDEELLWWPP GMW Contribution to the MDBA programme - 29,887 Environmental Contributions 2,793 2,793 Regional Water Monitoring 1,715 975 Water shares & Bulk entitlements 536 750 Native Vegetation Offsets 556 - Other 875 100 PPaayyaabbllee ttoo DDEELLWWPP GMW Contribution to the MDBA programme 11,348 -
TTrreeaassuurryy CCoorrppoorraattiioonn ooff VViiccttoorriiaa GMW borrows from and invests with the Treasury Corporation of Victoria.
Aggregate amount of borrowings 112,171 112,409 Interest expense 5,729 5,758
DDeeppaarrttmmeenntt ooff TTrreeaassuurryy aanndd FFiinnaannccee GMW pays amounts to the State Government of Victoria, via the Department of Treasury and Finance.
PPaayymmeennttss ttoo DDTTFF
Financial Accommodation Levy 1,230 1,172 VViiccttoorriiaann EEnnvviirroonnmmeennttaall WWaatteerr HHoollddeerr

YEAR IN REVIEW GOVERNANCE AND ORGANISATIONAL STRUCTURE
2019/20 Goulburn-Murray Water Annual Report 123
WORKFORCE DATA OTHER DISCLOSURES FINANCIAL STATEMENTS
External Audit - Victorian Auditor General's Office 197 182 Internal Audit 233 176 TToottaall AAuuddiitt ffeeeess 443300 335588 1100..66 EExxggrraattiiaa eexxppeennsseess Forgiveness or waiver of debt 13 53 ((iiii)) TToottaall eexx ggrraattiiaa eexxppeennsseess 1133 5533 (ii) Ex gratia expenses for both individual items and in aggregate that are greater than or equal to $5,000. The total for ex-gratia expenses are also reported in 'other operating expenses' in Note 4.1.1 Expenses from operating activities.
1100..77 CChhaannggeess iinn aaccccoouunnttiinngg ppoolliicciieess
GMW invoices the Victorian Environmental Water Holder for water use charges in line with Essential Services Commission approved pricing.
RReecceeiippttss ffrroomm VVEEWWHH
Revenue from water use 5,430 3,811 LLoowweerr MMuurrrraayy UUrrbbaann aanndd RRuurraall WWaatteerr CCoorrppoorraattiioonn GMW invoices Lower Murray Urban and Rural Water Corporation for water use charges and regional storage fees in line with Essential Services Commission approved pricing.
RReecceeiippttss ffrroomm LLoowweerr MMuurrrraayy UUrrbbaann aanndd RRuurraall WWaatteerr CCoorrppoorraattiioonn
Revenue from water use 112 148 CCoolliibbaann RReeggiioonn WWaatteerr CCoorrppoorraattiioonn GMW invoices Coliban Region Water Corporation for water use charges and regional storage fees in line with Essential Services Commission approved pricing.
RReecceeiippttss ffrroomm CCoolliibbaann RReeggiioonn WWaatteerr CCoorrppoorraattiioonn
Revenue from water use 1,267 1,707
22001199//2200 22001188//1199
GGoouullbbuurrnn VVaalllleeyy RReeggiioonn WWaatteerr CCoorrppoorraattiioonn $$000000 $$000000 GMW invoices Goulburn Valley Region Water Corporation for water use charges and regional storage fees in line with Essential Services Commission approved pricing.
RReecceeiippttss ffrroomm GGoouullbbuurrnn VVaalllleeyy RReeggiioonn WWaatteerr CCoorrppoorraattiioonn
Revenue from water use 1,017 1,053 NNoorrtthh EEaasstt WWaatteerr GMW invoices North East Water for water use charges and regional storage fees in line with Essential Services Commission approved pricing.
RReecceeiippttss ffrroomm NNoorrtthh EEaasstt WWaatteerr
Revenue from water use 959 898 CCeennttrraall HHiigghhllaannddss WWaatteerr GMW invoices Central Highlands Water for water use charges and regional storage fees in line with Essential Services Commission approved pricing.
RReecceeiippttss ffrroomm CCeennttrraall HHiigghhllaannddss WWaatteerr
Revenue from water use 325 324 GGoouullbbuurrnn BBrrookkeenn CCMMAA GMW invoices Goulburn Broken CMA for works carried out under the Sustainable Irrigation Program agreement.
RReecceeiippttss ffrroomm GGoouullbbuurrnn BBrrookkeenn CCMMAA
Sustainable Irrigation Program 3,814 3,555 Other receipts 12 370
1100..55 RReemmuunneerraattiioonn ooff aauuddiittoorrss

YEAR IN REVIEW GOVERNANCE AND ORGANISATIONAL STRUCTURE
2019/20 Goulburn-Murray Water Annual Report 124
WORKFORCE DATA OTHER DISCLOSURES FINANCIAL STATEMENTS
AAAASSBB 1155 RReevveennuuee ffrroomm CCoonnttrraaccttss wwiitthh CCuussttoommeerrss GMW has transitioned to AASB 15 Revenue from Contracts with Customers from 1 July 2019 (date of initial application). In accordance with the transition provisions in AASB 15 and as mandated by FRD 121 Transitional requirements on the application of AASB 15 Revenue from Contracts with Customers, this new standard has been adopted retrospectively (under the modified retrospective method). Comparatives for the 2019 financial year have not been restated. The reclassifications and the adjustments arising from this new standard are therefore recognised in the opening balance of retained earnings on 1 July 2019 only for contracts that are not ‘completed contracts’ at the date of initial application. Additionally, as mandated by the DTF, GMW applied the practical expedient described in AASB16.C5 (c), for contracts that were modified before the date of initial application. In applying this practical expedient, GMW did not retrospectively restate the contract for those modifications in accordance with AASB15.20-21. Instead, it reflected the aggregate effect of all of the modifications that occur before the date of initial application when: • Identifying the satisfied and unsatisfied performance obligations • Determining the transaction price • Allocating the transaction price to the satisfied and unsatisfied performance obligation GMW has applied this practical expedient consistently to all contracts within the current reporting period. AASB 15 accounting policies are disclosed in Note 3.1. There has been no transition adjustment made directly to retained earnings as a result of adopting this change in accounting policy. AAAASSBB 11005588 IInnccoommee ffoorr nnoott--ffoorr--pprrooffiittss GMW has transitioned to AASB 1058 Income for not-for-profits from 1 July 2019. In accordance with the transition provisions in AASB 1058 and as mandated by FRD 122 Transitional requirements on the application of AASB 1058 Income of Not-for-Profit Entities, this new standard has been adopted retrospectively (under the modified retrospective method). Under this transition method, the entity has elected to apply this standard retrospectively only to contracts and transactions that are not completed contracts at the date of initial application. A completed contract is a contract or transaction for which the entity has recognised all of the income in accordance with AASB 1004 Contributions. Comparatives for the 2019 financial year have not been restated. The reclassifications and the adjustments arising from this new standard are therefore recognised in the opening balance of retained earnings on 1 July 2019. GMW has not applied the fair value measurement requirements for right-of-use assets arising from leases with significantly below-market terms and conditions principally to enable the entity to further its objectives as allowed under temporary option under AASB 16 and as mandated by FRD 122. AASB 1058 accounting policies are disclosed in Note 3.3.1 and 3.4. There has been no transition adjustment made directly to retained earnings as a result of adopting this change in accounting policy. AAAASSBB 1166 LLeeaasseess GMW has transitioned to AASB 16 Leases from 1 July 2019. In accordance with the transition provisions in AASB 16 and as mandated by FRD 123 Transitional requirements on the application of AASB 16 Leases, the new rules have been adopted retrospectively (under the modified retrospective method). Comparatives for the 2019 financial year have not been restated. GMW has applied this approach to transition consistently to all of its leases for which it is a lessee.

YEAR IN REVIEW GOVERNANCE AND ORGANISATIONAL STRUCTURE
2019/20 Goulburn-Murray Water Annual Report 125
WORKFORCE DATA OTHER DISCLOSURES FINANCIAL STATEMENTS
On adoption of AASB 16, GMW recognised lease liabilities in relation to leases which had previously been classified as ‘operating leases’ under the principles of AASB 117 Leases. These liabilities were measured at the present value of the remaining lease payments, discounted using the lessee’s incremental borrowing rate as of 1 July 2019. The weighted average lessee’s incremental borrowing rate applied to the lease liabilities on 1 July 2019 was 6.1%. On transition, DTF mandates measurement of ROU assets at the amount equal to the lease liability, adjusted by the amount of any prepaid or accrued lease payments relating to that lease recognised in the balance sheet as at 30 June 2019. There were no leases previously classified as 'finance leases'. AASB 16 accounting policies are disclosed in Note 6.3. ((ii)) PPrraaccttiiccaall eexxppeeddiieennttss aapppplliieedd In applying AASB 16 for the first time, GMW has used the following practical expedients to all its contracts as permitted by the standard and as mandated by the DTF: • applying a single discount rate to a portfolio of leases with reasonably similar characteristics • relying on previous assessments on whether leases are onerous as an alternative to performing an impairment review – there were no onerous contracts as at 1 July 2019 • accounting for leases with a remaining lease term of less than 12 months as at 1 July 2019 as short-term leases • excluding initial direct costs from the measurement of the right-of-use asset at the date of initial application • using hindsight in determining the lease term where the contract contains options to extend or terminate the lease, and • accounting for low value leases. GMW has also elected not to reassess whether a contract is or contains a lease at the date of initial application. Instead, for contracts entered into before the transition date GMW relied on its assessment made applying AASB 117 and Interpretation 4 Determining Whether an arrangement contains a lease. ((iiii)) RReeccoonncciilliiaattiioonn ooff ooppeerraattiinngg lleeaassee ccoommmmiittmmeenntt ttoo lleeaassee lliiaabbiilliittyy $$000000 Operating lease commitments disclosed as at 30 June 2019 3,065 Discounted using the lessee's incremental borrowing rate at date of initial application (179) Add: finance lease liabilities recognised at 30 June 2019 - (Less): short-term leases not recognised as a liability (11) (Less): low-value leases not recognised as a liability (1) Add/(less): contracts reassessed as lease contracts - Add/(less): adjustments from a different treatment of options (extend/terminate) 857 Add/(less): adjustments from changes in the index or rate affecting variable payments - LLeeaassee lliiaabbiilliittyy rreeccooggnniisseedd aass aatt 11 JJuullyy 22001199 3,731 Current lease liabilities 2,371 Non-current lease liabilities 1,360 ((iiiiii)) LLooww vvaalluuee lleeaasseess GMW is not required to make any adjustments on transition for leases for which the underlying asset is of low value. GMW shall recognise the lease payments associated with those leases as an expense on either a straight-line basis over the lease term or another systematic basis. GMW shall apply another systematic basis if that basis is more representative of the pattern of GMW’s benefit. GMW shall account for those leases applying this Standard from the date of initial application.

YEAR IN REVIEW GOVERNANCE AND ORGANISATIONAL STRUCTURE
2019/20 Goulburn-Murray Water Annual Report 126
WORKFORCE DATA OTHER DISCLOSURES FINANCIAL STATEMENTS
((iivv)) AAddjjuussttmmeennttss rreeccooggnniisseedd iinn tthhee bbaallaannccee sshheeeett oonn 11 JJuullyy 22001199 The change in accounting policy affected the following items in the balance sheet on 1 July 2019:
• right-of-use assets – increase by $3,731,468 • lease liabilities – increase by $3,731,468
There was no impact on retained earnings on 1 July 2019. ((vv)) LLeessssoorr aanndd IInntteerrmmeeddiiaattee lleessssoorr GMW as a lessor is not required to make any adjustments on transition for leases in which it is a lessor and accounts for those leases applying this Standard from the date of initial application.

YEAR IN REVIEW GOVERNANCE AND ORGANISATIONAL STRUCTURE
2019/20 Goulburn-Murray Water Annual Report 127
WORKFORCE DATA OTHER DISCLOSURES FINANCIAL STATEMENTS
1100..88 AAuussttrraalliiaann AAccccoouunnttiinngg SSttaannddaarrddss iissssuueedd tthhaatt aarree nnoott yyeett eeffffeeccttiivvee SSttaannddaarrdd // IInntteerrpprreettaattiioonn
SSuummmmaarryy AApppplliiccaabbllee ffoorr aannnnuuaall rreeppoorrttiinngg ppeerriiooddss bbeeggiinnnniinngg oonn
IImmppaacctt oonn CCoorrppoorraattiioonn''ss ffiinnaanncciiaall rreeppoorrtt
AASB 2018-7 Amendments to Australian Accounting Standards - Definition of Material
This Standard principally amends AASB 101 Presentation of Financial Statements and AASB 108 Accounting Policies, Changes in Accounting Estimates and Errors. The amendments refine and clarify the definition of material in AASB 101 and its application by improving the wording and aligning the definition across AASB Standards and other publications. The amendments also include some supporting requirements in AASB 101 in the definition to give it more prominence and clarify the explanation accompanying the definition of material.
1 Jan 2020 GMW is in the process of analysing the impacts on this Standard. However, it is not anticipated to have a material impact.
AASB 2020-1 Amendments to Australian Accounting Standards - Classification of Liabilities as Current or Non-Current
This Standard amends AASB 101 to clarify requirements for the presentation of liabilities in the statement of financial position as current or non-current. It initially applied to annual reporting periods beginning on or after 1 January 2022 with earlier adoption permitted however the AASB has recently issued ED 301 Classification of Liabilities as Current or Non-Current - Deferral of Effective Date with the intention to defer the application by one year to periods on or after 1 January 2023.
1 Jan 2022 GMW is in the process of analysing the impacts on this Standard. However, it is not anticipated to have a material impact.

2019/20 Goulburn-Murray Water Annual Report 128
AAppppeennddiicceess AAppppeennddiixx AA –– DDiisscclloossuurree IInnddeexx The Annual Report of Goulburn-Murray Water is prepared in accordance with all relevant Victorian legislations and pronouncements. This index has been prepared to facilitate identification of Goulburn-Murray Water’s compliance with statutory disclosure requirements.
LLeeggiissllaattiioonn RReeqquuiirreemmeennttss PPaaggee RReeffeerreennccee RREEPPOORRTT OOFF OOPPEERRAATTIIOONNSS FRD 30D Standard requirements for the design and print of annual
reports Entire report
SD 5.2.3 Declaration in the report of operations 3 SSeeccttiioonn 11:: YYeeaarr iinn RReevviieeww FRD 8D Performance against objectives (financial) 38-42 FRD 8D Performance against objectives (non-financial) 13-37 FRD 22H Manner of establishment and the relevant Minister 8 FRD 22H Purpose, functions, powers and duties 9-10 FRD 22H Nature and range of services provided 8 FRD 22H Five year financial summary 39 FRD 22H Current year financial review 40 FRD 22H Significant changes in financial position 40 FRD 22H Significant changes or factors affecting performance 40 FRD 22H Subsequent events 42 MRO Chairman and Managing Director’s Report 6-7 MRO Vision and values 5 MRO Capital projects 41-42 SSeeccttiioonn 22:: GGoovveerrnnaannccee aanndd OOrrggaanniissaattiioonnaall SSttrruuccttuurree FRD 22H Organisational structure and corporate governance 48-54 FRD 22H Occupational health and safety 55 SD 3.2.1.1 Audit Committee membership and roles 54 SSeeccttiioonn 33:: WWoorrkkffoorrccee DDaattaa FRD 21C Executive officer disclosures 59 FRD 22H Public Administration values and employment principles 56 FRD 29C Comparative workforce data 56-57 FRD 22H Workforce Inclusion Policy 57 SSeeccttiioonn 44:: OOtthheerr DDiisscclloossuurreess FRD 12B Major contracts 60 FRD 22H Consultancy expenditure 60 FRD 22H Government advertising expenditure 60 FRD 22H ICT expenditure 61 FRD 22H Freedom of Information Act 1982 62-63 FRD 22H Building Act 1993 64-65 FRD 22H Public Interest Disclosures Act 2012 65 FRD 22H Competitive Neutrality Policy Victoria 65 FRD 22H Statement of availability of other information 71 FRD 22H Summary of environmental performance 45, 67-68 FRD 24D Office-based environmental impacts 66 FRD 25D Local Jobs First – Victorian Industry Participation Policy 60 MRO Compliance with DataVic Access Policy 71 SD 3.7.1 Attestation for compliance with Ministerial Standing
Direction 74
Appendix A - Disclosure Index

2019/20 Goulburn-Murray Water Annual Report 129
FFIINNAANNCCIIAALL RREEPPOORRTT Audit Act 1994 Auditor-General’s Report 46-47, 72-73 SD 5.2.1 Comprehensive operating statement 75 SD 5.2.1 Balance sheet 76 SD 5.2.1 Cash flow statement 77 SD 5.2.1 Statement of changes in equity 78 SD 5.2.1 Notes to the Financial Statements 79-127 SD 5.2.2 Declaration in the financial statements 74 OOtthheerr rreeqquuiirreemmeennttss uunnddeerr SSttaannddiinngg DDiirreeccttiioonnss 55..22 SD 5.2.1(a) Compliance with Australian accounting standards and
other authoritative pronouncements 74
SD 5.2.1(a) Compliance with Standing Directions 74 SD 5.2.1(b) Compliance with Model Financial Report 74-127 OOtthheerr ddiisscclloossuurreess aarree rreeqquuiirreedd bbyy FFRRDDss iinn nnootteedd ttoo tthhee ffiinnaanncciiaall ssttaatteemmeennttss MMiinniisstteerriiaall RReeppoorrttiinngg DDiirreeccttiioonnss MRD 01 Performance reporting 13-37 MRD 02 Water consumption 68 MRD 03 Environmental and social sustainability reporting 37, 69-71 MRD 04 Disclosure of information on bulk entitlements 130-144 MRD 06 Greenhouse gas and energy reporting 45, 67-68 MRD 07 Disclosure of information on the Letter of Expectations 13-21 LLeeggiissllaattiioonn Building Act 1993 64-65 Building Regulations 2006 64-65 Disability Act 2006 66 Equal Employment Opportunity Act 2010 56 Financial Management Act 1994 3, 43, 74, 79 Freedom of Information Act 1982 62-63 Murray-Darling Basin Act 1993 10 Planning and Environment Act 1987 9 Public Interest Disclosures Act 2012 65 Public Administration Act 2004 56, 121 Safe Drinking Water Act 2003 37 Victorian Industry Participation Policy Act 2003 60 Water Act 1989 66 AAppppeennddiicceess FRD 10A Appendix A: Disclosure Index 128-129 MRD 04 Appendix B: Bulk Entitlements 130-144 MRD 07 Appendix C: Minister’s Letter of Expectations 145-146 Appendix D: Schedule of Consultancies 147 Appendix E: Abbreviations 148

2019/20 Goulburn-Murray Water Annual Report 130
AAppppeennddiixx BB –– BBuullkk EEnnttiittlleemmeennttss
AAppppeennddiixx BB11 BBuullkk EEnnttiittlleemmeenntt ((EEiillddoonn -- GGoouullbbuurrnn WWeeiirr)) RReeppoorrttiinngg
This appendix is included in the Goulburn-Murray Water 2019/20 Annual Report in compliance with the requirements of clause 17.3 of the Bulk Entitlement (Eildon - Goulburn Weir) Conversion Order 1995 ("BE"), which obliges the Authority to report on certain matters as specified in clause 17.1 of the same Order. The period of reporting is 1 July 2019 to 30 June 2020. Hydrographic data has been used where available, operational data has been used where hydrographic data was not available.
BBEE CCllaauussee
IItteemm RReeppoorrtt NNootteess
17.1(d) AAnnnnuuaall aammoouunntt ttaakkeenn ffrroomm wwaatteerrwwaayy aatt GGoouullbbuurrnn WWeeiirr ooffffttaakkee cchhaannnneellss::
Cattanach Canal 171,626 ML Stuart Murray Canal 446,831 ML East Goulburn Main Channel 149,699 ML
TToottaall GGoouullbbuurrnn WWeeiirr ooffffttaakkee ddiivveerrssiioonn:: 776688,,115566 MMLL 17.1(da) AAnnnnuuaall aammoouunntt ooff ddiissttrriibbuuttiioonn lloossss iinn GGoouullbbuurrnn IIrrrriiggaattiioonn DDiissttrriiccttss::
Shepparton 21,256 ML Central Goulburn 39,337 ML Rochester/ Pyramid Hill- Boort 48,226 ML
TToottaall ddiissttrriibbuuttiioonn lloossss:: 110088,,881199 MMLL 17.1(e)(i) DDiivveerrssiioonn bbyy pprriimmaarryy eennttiittlleemmeenntt hhoollddeerrss ttaakkeenn ddiirreeccttllyy ffrroomm wwaatteerrwwaayy::
Private river diverters water shares 13,268 ML 17.1(e)(ii) DDiivveerrssiioonn bbyy ootthheerr aauutthhoorriittiieess wwiitthh BBuullkk EEnnttiittlleemmeennttss ttaakkeenn ddiirreeccttllyy
ffrroomm wwaatteerrwwaayy:: See Note 1
Urban Bulk entitlements 18,109 ML Victorian Environmental Water Holder 621 ML
17.1(g) AAmmoouunntt ooff wwaatteerr hheelldd iinn ssttoorraaggee:: Volume at 30 June 2020
Lake Eildon 1,623,395 ML Goulburn Weir 20,370 ML
Waranga Basin 370,301 ML 17.1(h) Additional releases from Lake Eildon as per
Schedule 5 0 ML See Note
2 17.1(i) Credits granted as per Clause 14 No
17.1(j) Temporary or permanent transfers of this BE None
17.1(k) Transfer of entitlement or allocation under the Act None 17.1(l) Regulated releases for Inter Valley Trade, Murray
Supplement or the Water Quality Reserve 198,643 ML See Note
3
17.1(n) Details of transfers of primary entitlements See Victorian Water Register Entitlements,
Allocation and Use Annual Report.
17.1(o) SSuuppppllyy ttoo pprriimmaarryy eennttiittlleemmeennttss::
Appendix B - Bulk Entitlements

2019/20 Goulburn-Murray Water Annual Report 131
Water Shares in Irrigation Areas 335,623 ML Water Shares of Private River Diverters As for 17.1(e)(i) Urban Bulk entitlements See Appendix B2 Melbourne Water Authorities See Appendix B2
Victorian Environmental Water Holder See Appendix B2 plus 396,187 ML See Note
4 Water allowances in Water Works Districts 1,462 ML
TToottaall ssuuppppllyy ttoo pprriimmaarryy eennttiittlleemmeennttss:: 779955,,996688 MMLL 17.1(p) Amendments to this BE No 17.1(q) New BE granted for supply of primary
entitlements in this BE No
17.1(r) Environmental Management and Metering programs
Programs implemented
See Note 5
17.1(s) BE compliance failures Minor 17.1(t) BE compliance difficulties and responses Yes See Note
6
NNootteess
1. This is the usage against Bulk Entitlements held by other Authorities which is taken
directly from waterways, excluding supplies from channel systems and in-stream environmental deliveries.
2. There were no releases from Lake Eildon under target filling arrangements or spills from storage in 2019/20.
3. This is the delivery of the Goulburn Inter-Valley Trade Account from the Goulburn system. This excludes the volume delivered to the Murray from the Campaspe Inter-Valley Trade Account. There were no releases made for the Water Quality Reserve or for Murray supplement in season 2019/20.
4. The volume supplied to the Victorian Environmental Water Holder includes carryover and water traded from other entitlements.
5. Environmental Management: Programs are coordinated with Goulburn-Murray Water's Environmental Management System (ISO 14001 certified).
The Minister for Water approved the Metering Program for all Bulk Entitlements held by GMW in 2011.
6. The Normanville Water Works District (WWD) was 7.5 ML over its annual loss allowance of 109.1 ML. East Loddon South WWD was 57 ML over its annual allowed loss volume, due to a delay in filling the pipeline storage due to Blue Green algae in 2018/19. East Loddon North WWD exceeded the allowed maximum diversion volume allowed in 2019/20 of 430 ML, by 175 ML partially due to high losses on delivery spurs.

2019/20 Goulburn-Murray Water Annual Report 132
AAppppeennddiixx BB22 BBuullkk EEnnttiittlleemmeenntt ((EEiillddoonn -- GGoouullbbuurrnn WWeeiirr)) RReeppoorrttiinngg
SSuuppppllyy ttoo pprriimmaarryy eennttiittlleemmeennttss ooff OOtthheerr AAuutthhoorriittiieess BBuullkk EEnnttiittlleemmeennttss This is the supply to other authorities prescribed in Schedule 2 of the Bulk Entitlement AAuutthhoorriittyy DDiivveerrssiioonn ((MMLL)) NNootteess
Goulburn Valley Water
Channel System Zone 1A 5,425 River Supply Zone 1A 3,921 River Supply Zone 3 14,175
TToottaall ddiivveerrssiioonn:: 2233,,552211 Coliban Water Channel system Zone 1A 728
Channel system Zone 1B 231 TToottaall ddiivveerrssiioonn:: 995599
Grampians Wimmera Mallee Water
Quambatook 51 TToottaall ddiivveerrssiioonn:: 5511
Melbourne Bulk Entitlements
City West Water, South East Water and Yarra Valley Water
12
TToottaall ddiivveerrssiioonn:: 1122 Victorian Environmental Water Holder
Snowy Environmental Reserve 0 See Note 1 The Living Murray Entitlements 24,885
Goulburn River Environmental Entitlement 0 Environmental Entitlement NVIRP savings 0
TToottaall ddiivveerrssiioonn:: 2244,,888855 TToottaall AAuutthhoorriittiieess ((MMLL)):: 4499,,442299
NNootteess
1. These figures only include deliveries against Bulk Entitlements, deliveries against other entitlements are shown in Appendix B1 17.1(o).

2019/20 Goulburn-Murray Water Annual Report 133
AAppppeennddiixx BB33 BBuullkk EEnnttiittlleemmeenntt ((RRiivveerr MMuurrrraayy -- GGoouullbbuurrnn MMuurrrraayy WWaatteerr)) RReeppoorrttiinngg This appendix is included in the Goulburn-Murray Water 2019/20 Annual Report in compliance with the requirements of clause 22.3 of the Bulk Entitlement (River Murray - Goulburn Murray Water) Conversion Order 1999 ("BE"), which obliges the Authority to report on certain matters as specified in clause 22.1 of the same Order. The period of reporting is 1 July 2019 to 30 June 2020. Hydrographic data has been used where available, operational data has been used where hydrographic data was not available.
BBEE CCllaauussee
IItteemm RReeppoorrtt NNootteess
22.1(b) AAnnnnuuaall aammoouunntt ttaakkeenn aatt tthhee ffoolllloowwiinngg ooffff--ttaakkee ppooiinnttss aass ssppeecciiffiieedd iinn ccllaauussee 1166..11::
Cobram pump station 3,134 ML See Note 1
Yarrawonga Main Channel 133,054 ML National Channel 456,850 ML Ashwin's pump 0 ML Pental Island pumps 0 ML Swan Hill No 9 channel off-take from Little
Murray 3,280 ML
Swan Hill pumps 5,790 ML Nyah pumps 5,188 ML Woorinen pumps 11,838 ML See Note
1 PPrriivvaattee DDiivveerrssiioonn PPooiinnttss aalloonngg tthhee RRiivveerr MMuurrrraayy ttoo NNyyaahh PPuummppss:: Environmental diversion 5,538 ML Urban River diversion 19,925 ML Private River diversions; Dartmouth to
Nyah 17,514 ML
TToottaall ddiivveerrssiioonnss aatt ooffff--ttaakkee ppooiinnttss:: 666622,,111100 MMLL 22.1(c) Any new agreed upon off-take points? No 22.1(d) AAnnnnuuaall aammoouunntt rreettuurrnneedd aatt tthhee ffoolllloowwiinngg ppooiinnttss aass ssppeecciiffiieedd iinn ccllaauussee
1166..22::
Broken Creek bypass and tributary flow 20,684 ML Yarrawonga Main Channel outfall 9,307 ML Koondrook spillway 132,986 ML Loddon River at Kerang Weir 108,328 ML Sheepwash Creek Weir 0 ML 6/7 channel outfall 2,130 ML Lake Boga outfall channel 263 ML Barr Creek at Capel’s Crossing 364 ML Lake Charm outfall channel 0 ML Chainman's Bend 0 ML See Note
1 TToottaall rreettuurrnnss:: 227744,,006622 MMLL 22.1(e) GGMMWW ssuupppplliieess ttoo bbuullkk eennttiittlleemmeennttss hheelldd bbyy ootthheerr aauutthhoorriittiieess:: See Note
3 Coliban Water 3,820 ML Lower Murray Water 5,152 ML North East Water 10,015 ML Grampians Wimmera Mallee Water 3,921 ML

2019/20 Goulburn-Murray Water Annual Report 134
Goulburn Valley Water 4,448 ML Victorian Environmental Water Holder 257,721 ML Flora and Fauna 31,618 ML The Living Murray 7,860 ML Snowy Environmental Reserve 0 ML TToottaall ssuupppplliieess ttoo BBuullkk EEnnttiittlleemmeennttss:: 332244,,555544 MMLL 22.1(f) GGMMWW ssuupppplliieess ttoo pprriimmaarryy eennttiittlleemmeenntt hhoollddeerrss eexxcclluuddiinngg bbuullkk
eennttiittlleemmeennttss iinn ((ee))::
Murray Valley Irrigation Area 67,915 ML Torrumbarry Irrigation Area (including
Tresco and Woorinen) 116,575 ML
Nyah Irrigation District 4,758 ML Private River Diverters As for 22.1(b) Lower Broken Creek 5,808 ML Environmental Water Holders (non BE
water) 1 ML
TToottaall ssuupppplliieess ttoo pprriimmaarryy eennttiittlleemmeenntt hhoollddeerrss eexxcclluuddiinngg bbuullkk eennttiittlleemmeennttss::
220066,,776633 MMLL
22.1(g) Metering program Program implemented See Note 4
22.1(h) Temporary or permanent transfers of this BE or primary entitlements
See Victorian Water Register Entitlements,
Allocation and Use Annual Report.
See Note 5
22.1(i) Transfer of entitlement or allocation under the Act to GMW or primary entitlement holders
As for 22.1(h)
22.1(j) Amendment to this BE No 22.1(k) New BE granted to GMW for River Murray No
22.1(l) BE compliance failures No See Note 6
22.1(m) BE compliance difficulties and actions Minor See Note 6
22.1(n) Murray Valley Losses 19,141 ML Torrumbarry Losses (as per BE including
Woorinen and Tresco) 63,789 ML
Victoria Mid Murray Storage losses 48,161 ML 22.1(o) Victoria Mid Murray Storage annual operating
plan Implemented See Note
7 NNootteess
1. Cobram and Woorinen pump station have not yet been recognised as an off-take points in the BE. Chainman's Bend is a recognised return point in the MDBA diversion formula. These sites will be added to Schedule 4 of the BE.
2. Volume includes water supplied through GMW's channel distribution system, rivers and wetlands. Includes the Environmental and Urban diversion volumes reported in 22.1(b) and environmental water diverted from unregulated entitlements. It only includes supplies from the River Murray to sites upstream of Nyah. Volumes may be higher than entitlement volumes due to delivery of carryover, trade or water recredited from other systems.

2019/20 Goulburn-Murray Water Annual Report 135
3. This volume includes water credited into the Murray from other systems and the delivery of traded volumes such as the water shares held by Victorian Environmental Water Holder and Commonwealth Environmental Water Office which were traded into ABAs linked to Environmental Bulk Entitlements. The majority of the environmental water delivered, was credited as return flows from Victorian tributaries for further use downstream. Only supplies deemed upstream of Nyah are included.
4. The Minister for Water approved the Metering Program for all Bulk Entitlements held by GMW in 2011.
5. There was no temporary or permanent transfer of this BE, only the trade of primary entitlements.
6. The losses attributed to the operation of the VMMS are based on the fixed distribution loss and the net evaporation from Kow Swamp, Kangaroo Lake, Lake Charm and Lake Boga. The losses for the Murray Valley and Torrumbarry Irrigation Areas are based on water balance calculations of the irrigation areas, using diversions, deliveries and returns. The loss incurred by Torrumbarry was 37.3 GL above the annually allowed loss volume, but was within the permitted annual tolerances once the dry season loss volume and additional annual loss allowances are included.
7. The 2019/20 Victorian Mid-Murray Storages Annual Operating Plan was endorsed in July 2019.

2019/20 Goulburn-Murray Water Annual Report 136
AAppppeennddiixx BB44 BBuullkk EEnnttiittlleemmeenntt ((CCaammppaassppee SSyysstteemm -- GGoouullbbuurrnn--MMuurrrraayy WWaatteerr)) RReeppoorrttiinngg
This appendix is included in the Goulburn-Murray Water 2019/20 Annual Report in compliance with the requirements of clause 18.3 of the Bulk Entitlement (Campaspe System - Goulburn-Murray Water) Conversion Order 2000 ("BE"), which obliges the Authority to report on certain matters as specified in clause 18.1 of the same Order. The period of reporting is 1 July 2019 to 30 June 2020. Hydrographic data has been used where available, operational data has been used where hydrographic data was not available.
BBEE CCllaauussee IItteemm RReeppoorrtt NNootteess 18.1(e) GMW share of Lake Eppalock annual inflow 51,668 ML 18.1(f) AAnnnnuuaall aammoouunnttss ttaakkeenn ffrroomm tthhee ssyysstteemm wwaatteerrwwaayy ffoorr pprriimmaarryy
eennttiittlleemmeennttss lliisstteedd iinn SScchheedduulleess 11 aanndd 22:: See Note 1
Water shares (excluding water shares held by other authorities)
4,019 ML
Supplement to Goulburn system 0 ML Victorian Environmental Water Holder 0 ML Coliban Water 3,391 ML Central Highlands Water 0 ML
TToottaall ddiivveerrssiioonn:: 77,,441100 MMLL Campaspe Inter Valley Trade Account
delivery 7,073 ML
18.1(g) Annual evaporation losses to GMW share of Lake Eppalock
12,893 ML See Note 2
18.1(h) Internal spills to or from GMW’s share of Lake Eppalock
0 ML
18.1(i) Minimum passing flows Minimum passing flows were
calculated as required by Clause
11
18.1(j) Credits granted as per Clause 14 No 18.1(k) Temporary or permanent transfers of this BE None 18.1(l) Transfer of entitlement or allocation under the Act None 18.1(m) Seasonal determination 1 Apr 2019 - 80%
HRWS & 0% LRWS
18.1(n) Alterations to Schedule 1 and 2 entitlements as per Clause 8:
See Victorian Water Register
Entitlements, Allocation and Use
Annual Report. See 18.1(q)
18.1(o) Details of transfers of primary entitlements See Victorian Water Register
Entitlements, Allocation and Use
Annual Report.
18.1(p) AAnnnnuuaall vvoolluummee ssuupppplliieedd ttoo pprriimmaarryy eennttiittlleemmeennttss:: As for 18.1 (f) excluding the
Goulburn
See Note 3

2019/20 Goulburn-Murray Water Annual Report 137
supplement diversion plus
Victorian Environmental Water Holder 20,438 ML Living Murray 0 ML
TToottaall ssuuppppllyy ttoo pprriimmaarryy eennttiittlleemmeennttss:: 2277,,884488 MMLL 18.1(q) Amendments to this BE No 18.1(r) New BE granted for supply of primary entitlements
in this BE No
18.1(s) Environmental Management and Metering programs
Programs implemented
See Note 4
18.1(t) BE compliance failures No See Note 5 18.1(u) BE compliance difficulties and response No 18.1(v) Details of interruptions to minimum passing flows Yes See Note 6 NNootteess
1. This figure only includes diversions from the waterway, instream deliveries are included in 18.1(p). Water from the Campaspe Inter Valley Trade account was delivered to the Murray system and incorporated as a delivery from the Goulburn Inter-Valley Trade account.
2. Gross evaporation based on measured evaporation at Lake Eppalock.
3. As there are no irrigation areas or districts in the Campaspe system the volume of diversion and delivery are the same, with the exception of environmental water delivered instream and the supplement provided to the Goulburn System.
4. Environmental Management: Programs are coordinated with Goulburn-Murray Water's Environmental Management System (ISO 14001 certified)
5. The Minister for Water approved the Metering Program for all Bulk Entitlements held by GMW in 2011.
6. There were three days when the minimum flow was not provided in July due to an outage for maintenance works at Lake Eppalock. The minimum passing flows not provided were credited to the passing flow account and delivered at a later date as advised by the North Central Catchment Management Authority.

2019/20 Goulburn-Murray Water Annual Report 138
AAppppeennddiixx BB55 BBuullkk EEnnttiittlleemmeenntt ((BBrrookkeenn SSyysstteemm -- GGoouullbbuurrnn--MMuurrrraayy WWaatteerr)) RReeppoorrttiinngg
This appendix is included in the Goulburn-Murray Water 2019/20 Annual Report in compliance with the requirements of clause 20.3 of the Bulk Entitlement (Broken System - Goulburn-Murray Water) Conversion Order 2004 ("BE"), which obliges the Authority to report on certain matters as specified in clause 20.1 of the same Order. The period of reporting is 1 July 2019 to 30 June 2020. Hydrographic data has been used where available, operational data has been used where hydrographic data was not available. BBEE CCllaauussee
IItteemm RReeppoorrtt NNootteess
20.1(e) Annual amounts taken from the system waterway as listed in Schedules 1 and 2:
Water shares (excluding Broken Creek and water shares held by other authorities)
1,345 ML
North East Water 85 ML Supplement to Goulburn or
Murray systems 0 ML
Total flow to Broken Creek 3,246 ML TToottaall ddiivveerrssiioonnss:: 44,,667766 MMLL
Broken Inter Valley Trade Account delivery
0 ML
20.1(f) Annual evaporation losses from Lake Nillahcootie
2,352 ML See Note 1
20.1(g) Environmental minimum and maximum flows
Environmental flows were provided as specified in
clause 12
20.1(h) Credits granted as per Clause 15 No 20.1(i) Temporary or permanent transfers of
this BE None
20.1(j) Transfer of entitlement or allocation
under the Act None
20.1(k) Alterations to Schedule 1 and 2
entitlements as per Clause 9: See Victorian Water Register Entitlements, Allocation and Use Annual Report. See 20.1 (n)
20.1(l) Details of transfers of primary entitlements
See Victorian Water Register Entitlements,
Allocation and Use Annual Report.
20.1(m) AAnnnnuuaall vvoolluummee ssuupppplliieedd ttoo pprriimmaarryy eennttiittlleemmeennttss::
As for water shares and North East Water diversions
in 20.1 (e) plus
See Note 2
Broken Creek water shares 96 ML Broken Creek environmental
delivery 597 ML
Broken Creek losses 1,997 ML Broken River environmental
delivery 0 ML See Note
3

2019/20 Goulburn-Murray Water Annual Report 139
TToottaall ssuuppppllyy ttoo pprriimmaarryy eennttiittlleemmeennttss:: 44,,112200 MMLL 20.1(n) Amendments to this BE No 20.1(o) New BE granted for supply of primary
entitlements in this BE No
20.1(p) Environmental Management and Metering programs
Programs implemented See Note 4
20.1(q) BE compliance failures Yes 20.1(r) BE compliance difficulties and response Minor See Note
5 and Note 6
20.1(s) Details of interruptions to environmental minimum and maximum flow limits
Minor See Note 6
NNootteess
1. Gross evaporation based on measured evaporation at Lake Nillahcootie.
2. The volume of diversion and delivery are the same, with the exception of diversions to Broken Creek from the Broken system.
3. This was an in-stream delivery of water that was traded into the Broken system to meet environmental objectives.
4. The Minister for Water approved the Metering Program for all Bulk Entitlements held by GMW in 2011. Environmental Management: Programs are coordinated with Goulburn-Murray Water's Environmental Management System (ISO 14001 certified).
5. During regulated conditions, the losses in Broken Creek were 147 ML above the annual allowance of 1,850 ML specified in schedule 2, clause 3 in the Broken BE. GMW are working with DELWP and have identified actions to attempt to rectify the ongoing issues with the Broken Creek loss allowance. The accuracy of the offtake measurement is an issue and improvement works are planned.
6. Environmental minimum flows were reduced in winter and spring in agreement with the Goulburn Broken Catchment Management Authority. The flows not provided were banked and were available to the Goulburn Broken Catchment Management Authority for release.

2019/20 Goulburn-Murray Water Annual Report 140
AAppppeennddiixx BB66 BBuullkk EEnnttiittlleemmeenntt ((OOvveennss SSyysstteemm -- GGoouullbbuurrnn--MMuurrrraayy WWaatteerr)) RReeppoorrttiinngg
This appendix is included in the Goulburn-Murray Water 2019/20 Annual Report in compliance with the requirements of clause 19.3 of the Bulk Entitlement (Ovens System - Goulburn-Murray Water) Conversion Order 2004 ("BE"), which obliges the Authority to report on certain matters as specified in clause 19.1 of the same Order. The period of reporting is 1 July 2019 to 30 June 2020. Hydrographic data has been used where available, operational data has been used where hydrographic data was not available.
BBEE CCllaauussee
IItteemm RReeppoorrtt NNootteess
19.1(e) AAnnnnuuaall aammoouunnttss ttaakkeenn ffrroomm ssyysstteemm wwaatteerrwwaayy aass lliisstteedd SScchheedduullee 11 aanndd 22::
Water shares (excluding water shares held by other authorities)
10,454 ML
North East Water 3,245 ML Environmental water holders 20 ML See Note
1 19.1(f) AAnnnnuuaall ssttoorraaggee eevvaappoorraattiioonn lloosssseess:: See Note
2 Lake Buffalo 3,170 ML Lake William Hovell 781 ML
19.1(g) Environmental minimum flows Environmental minimum flows were calculated and
provided in accordance with clause 12 and
Schedule 5
19.1(h) Credits granted as per Clause 15 No 19.1(i) Temporary or permanent transfers of this
BE None
19.1(j) Transfer of entitlement or allocation under the Act
None
19.1(k) Alterations to Schedule 1 and 2 entitlements as per Clause 9:
See Victorian Water Register Entitlements,
Allocation and Use Annual Report. See 19.1 (n)
19.1(l) Details of transfers of primary entitlements
See Victorian Water Register Entitlements,
Allocation and Use Annual Report.
19.1(m) AAnnnnuuaall vvoolluummee ssuupppplliieedd ttoo pprriimmaarryy eennttiittlleemmeennttss::
As for 19.1 (e) plus See Note 3
Environmental water holders delivery
142 ML
TToottaall ssuuppppllyy ttoo pprriimmaarryy eennttiittlleemmeennttss:: 1133,,886611 MMLL 19.1(n) Amendments to this BE No 19.1(o) New BE granted for supply of primary
entitlements in this BE No
19.1(p) Environmental Management and Metering programs
Programs implemented See Note 4
19.1(q) BE compliance failures No

2019/20 Goulburn-Murray Water Annual Report 141
19.1(r) BE compliance difficulties and response No 19.1(s) Details of interruptions to minimum
passing flows No
NNootteess
1. 20 ML was delivered to Mullinmur wetland. 2. Gross evaporation based on measured evaporation at each storage. 3. As there are no irrigation areas or districts in the Ovens system the volume taken and
supplied are the same, with the exception of the environmental water which was delivered in stream to the Buffalo and King Rivers. Environmental Management: Programs are coordinated with Goulburn-Murray Water's Environmental Management System (ISO 14001 certified).
4. The Minister for Water approved the Metering Program for all Bulk Entitlements held by GMW in 2011.

2019/20 Goulburn-Murray Water Annual Report 142
AAppppeennddiixx BB77 BBuullkk EEnnttiittlleemmeenntt ((LLooddddoonn SSyysstteemm -- GGoouullbbuurrnn--MMuurrrraayy WWaatteerr)) RReeppoorrttiinngg
This appendix is included in the Goulburn-Murray Water 2019/20 Annual Report in compliance with the requirements of clause 21.3 of the Bulk Entitlement (Loddon System - Goulburn-Murray Water) Conversion Order 2005 ("BE"), which obliges the Authority to report on certain matters as specified in clause 21.1 of the same Order. The period of reporting is 1 July 2019 to 30 June 2020. Hydrographic data has been used where available, operational data has been used where hydrographic data was not available. BBEE CCllaauussee IItteemm RReeppoorrtt NNootteess 21.1(f) AAnnnnuuaall aammoouunnttss ttaakkeenn ffrroomm tthhee ssyysstteemm wwaatteerrwwaayy ffoorr pprriimmaarryy
eennttiittlleemmeennttss aanndd aaddddiittiioonnaall ssuupppplliieess iinn SScchheedduulleess 11 aanndd 22:: See Note 1
Water shares (excluding Serpentine Creek, and water shares held by other authorities)
4,210 ML
Total flow to Serpentine Creek 5,307 ML Coliban Water 241 ML Central Highlands Water 465 ML Victorian Environmental Water Holder
(for delivery to Boort district wetlands) 1,612 ML
TToottaall ddiivveerrssiioonnss:: 1111,,883344 MMLL Supplement to Goulburn system 0 ML Loddon Inter Valley Trade Account
delivery 6,234 ML
21.1(g) AAnnnnuuaall ssttoorraaggee eevvaappoorraattiioonn lloosssseess:: See Note 2 Cairn Curran Reservoir 11,808 ML Tullaroop Reservoir 6,822 ML
21.1(h) Credits granted as per Clause 15 No 21.1(i) Temporary or permanent transfers of this
BE None
21.1(j) Transfer of entitlement or allocation to GMW None 21.1(l) Details of transfers of primary entitlements See Victorian Water
Register Entitlements,
Allocation and Use Annual Report.
21.1(m) AAnnnnuuaall vvoolluummee ssuupppplliieedd ttoo pprriimmaarryy eennttiittlleemmeennttss::
As for 21.1 (f) excluding the
Serpentine Creek diversion plus
See Note 3
Serpentine Creek (excludes environmental supply)
457 ML
Victorian Environmental Water Holder 3,259 ML TToottaall ssuuppppllyy ttoo pprriimmaarryy eennttiittlleemmeennttss:: 1100,,224433 MMLL
21.1(n) Amendments to this BE No 21.1(o) New BE granted for this system No 21.1(p) Environmental Management and Metering
programs Programs
implemented See Note 4
21.1(q) BE compliance failures No

2019/20 Goulburn-Murray Water Annual Report 143
21.1(r) BE compliance difficulties and response No
NNootteess
1. Environmental water delivered to wetlands in Loddon Valley irrigation area is
included, while instream deliveries are excluded (see 21.1(m)).
2. Gross evaporation based on measured evaporation at Cairn Curran. 3. There are no irrigation areas or districts in the Loddon system. The volumes taken
and supplied are the same, with the exception of diversions to Serpentine Creek and environmental water delivered in stream (Loddon River and Serpentine Creek). The volume supplied to the VEWH includes carryover and water traded from other entitlements.
4. Environmental Management: Programs are coordinated with Goulburn-Murray Water's Environmental Management System (ISO 14001 certified) and the Regional Water Monitoring Partnership. The Minister for Water approved the Metering Program for all Bulk Entitlements held by GMW in 2011.

2019/20 Goulburn-Murray Water Annual Report 144
AAppppeennddiixx BB88 BBuullkk EEnnttiittlleemmeenntt ((BBuullllaarrooookk SSyysstteemm -- GGoouullbbuurrnn--MMuurrrraayy WWaatteerr)) RReeppoorrttiinngg
This appendix is included in the Goulburn-Murray Water 2019/20 Annual Report in compliance with the requirements of clause 17.2 of the Bulk Entitlement (Bullarook System - Goulburn-Murray Water) Conversion Order 2009 ("BE"), which obliges the Authority to report on certain matters as specified in clause 17.1 of the same Order. The period of reporting is 1 July 2019 to 30 June 2020. Hydrographic data has been used where available, operational data has been used where hydrographic data was not available. BBEE CCllaauussee
IItteemm RReeppoorrtt NNootteess
17.1 (d) AAnnnnuuaall aammoouunnttss ooff wwaatteerr ttaakkeenn ffrroomm tthhee ssyysstteemm bbyy pprriimmaarryy eennttiittlleemmeenntt hhoollddeerrss::
Water shares 690 ML Central Highlands Water 222 ML Victorian Environmental Water Holder 0 ML
17.1(e) Temporary or permanent transfers of this BE None 17.1(f) BE temporarily or permanently transferred to GMW None 17.1 (g) Details of transfers of primary entitlements See Victorian
Water Register
Entitlements, Allocation
and Use Annual Report.
17.1 (h) AAnnnnuuaall ssuuppppllyy ttoo pprriimmaarryy eennttiittlleemmeennttss:: As for 17.1 (d) plus
See Note 1
Victorian Environmental Water Holder 0 ML 17.1 (i) Amendments to this BE No 17.1 (j) New BE granted for this system No 17.1 (k) Environmental Management and Metering programs Programs
implemented See Note 2
17.1 (l) BE compliance failures No 17.1 (m) BE compliance difficulties and responses No
NNootteess
1. As there are no irrigation areas or districts in the Bullarook system the volumes taken
and supplied are the same, with the exception of environmental water which is delivered in stream.
2. Environmental Management: Programs are coordinated with Goulburn-Murray Water's Environmental Management System (ISO 14001 certified)
The Minister for Water approved the Metering Program for all Bulk Entitlements held by GMW in 2011.

2019/20 Goulburn-Murray Water Annual Report 145
Priority Area Key Performance Indicator Page Reference CClliimmaattee CChhaannggee Provide services that minimise environmental impacts, mitigate climate change and put in place adaptation strategies and actions
EE22 EEmmiissssiioonnss rreedduuccttiioonnss Demonstrate reasonable progress toward achievement of the entity’s emission reduction target specified in the Statement of Obligations (Emissions Reduction).
14, 45
EE33 CClliimmaattee aaddaappttaattiioonn a) Apply the Guidelines for Assessing the Impact of Climate Change on Water Suppliers in Victoria and demonstrate adaptation by: • developing low flow contingency plans that include an appropriate range of climate scenarios. b) Integrate climate change adaptation into decision-making across the business (all sources of water, wastewater, and where relevant drainage and flood management) including: • source waters and demand • built assets • natural environment • people and workplace • interdependencies • customer and product delivery. c) Contribute to development of the DELWP Water Sector Climate Change Adaptation Action Plan, which will commence preparation in July 2019. Optional participation in delivery of the Pilot Water Sector Climate Change Adaptation Action Plan (published October 2018).
14
CCuussttoommeerr aanndd CCoommmmuunniittyy OOuuttccoommeess All aspects of service delivery will be customer and community centred
CC11 CCuussttoommeerr ssaattiissffaaccttiioonn Overall, reporting on measures identified for this indicator should demonstrate high or improving levels of customer satisfaction over time.
14-15
CC22 CCuussttoommeerr aanndd ccoommmmuunniittyy eennggaaggeemmeenntt Stakeholder engagement based on best practice that demonstrates approaches to engagement that are open, honest and occur frequently. The DELWP Community Charter or IAP2 framework could be considered as a guide.
15
WWaatteerr ffoorr AAbboorriiggiinnaall ccuullttuurraall,, ssppiirriittuuaall aanndd eeccoonnoommiicc vvaalluueess Recognise and support Aboriginal cultural values and economic inclusion in the water sector.
AACC11 EEnnggaaggeemmeenntt ooff AAbboorriiggiinnaall ccoommmmuunniittiieess Effective and genuine engagement of Aboriginal communities for involvement in business opportunities and access to water for economic development. Measures related to this indicator will not be considered in isolation. Rather, reported information will be used to help build a broad picture of engagement, taking into account the relevant local context.
15-16
AACC22 EEnnggaaggeemmeenntt ooff TTrraaddiittiioonnaall OOwwnneerrss Effective and genuine engagement of Traditional Owners for inclusion of Aboriginal values in water planning. Measures related to this indicator will not be considered in isolation. Rather, reported information will be used to help build a broad picture of engagement, taking into account the relevant local context.
16
AACC33 AAbboorriiggiinnaall IInncclluussiioonn PPllaann// RReeccoonncciilliiaattiioonn AAccttiioonn PPllaann To be considered in conjunction with AC1 and AC2, taking into account the relevant local context.
16
Appendix C - Minister’s Letter of Expectations

2019/20 Goulburn-Murray Water Annual Report 146
RReessiilliieenntt aanndd lliivveeaabbllee cciittiieess aanndd ttoowwnnss Contribute to healthy communities by supporting safe, affordable, high quality services and resilient environments.
LL44 PPaayymmeenntt mmaannaaggeemmeenntt aanndd hhaarrddsshhiipp Overall improved access to instalment plans for management of payments. Understand year on year trends in hardship grants.
18
RReeccooggnniissiinngg rreeccrreeaattiioonnaall vvaalluueess Support the wellbeing of rural and regional communities by considering recreational values in water management.
RReecc11 RReeccrreeaattiioonnaall vvaalluueess Consideration of recreational values in carrying out functions and providing services
16-17
LLeeaaddeerrsshhiipp aanndd CCuullttuurree Water corporations reflect the needs of our diverse communities.
GG11 DDiivveerrssiittyy aanndd iinncclluussiioonn Improve gender and cultural diversity in workforce including gender equity in executive leadership. Diversity Inclusion plans to be based on best practice. The approach of the DELWP Diversity and Inclusion Strategy 2016-2020 could be considered as a guide.
18
GG22 BBooaarrdd ppeerrffoorrmmaannccee rreevviieeww Annual Board performance review to help monitor and improve the Board’s effectiveness in leading the organisation.
18-19
GG33 HHeeaalltthh aanndd SSaaffeettyy Sustained annual improvement against H&S performance benchmarks (AS/NZS standard 4801).
19
FFiinnaanncciiaall SSuussttaaiinnaabbiilliittyy Delivering safe and cost-effective water and wastewater services in a financially sustainable way.
FF11--FF77 FFiinnaanncciiaall IInnddiiccaattoorrss Overall reporting on these measures should demonstrate financial sustainability and provide a positive picture of a corporations’ financial sustainability over time.
19, 44

2019/20 Goulburn-Murray Water Annual Report 147
AAppppeennddiixx DD –– SScchheedduullee ooff CCoonnssuullttaanncciieess
GGMMWW CCoonnssuullttaanncciieess ffoorr WWaatteerr SSttoorraaggee aanndd DDeelliivveerryy aabboovvee $$1100,,000000
SSuupppplliieerr AApppprroovveedd RReecceeiivveedd OOuuttssttaannddiinngg Marsden Jacob Associates Pty Ltd $39,950 $26,840 $13,110 Deloitte Consulting Pty Ltd $129,100 $0 $129,100 Ernst & Young $249,022 $233,250 $15,772 Feehan Consulting Pty Ltd $142,500 $39,750 $102,750 Jacobs Group Australia Pty Ltd $274,413 $189,101 $85,311
CCoonnnneeccttiioonnss CCoonnssuullttaanncciieess aabboovvee $$1100,,000000
SSuupppplliieerr AApppprroovveedd RReecceeiivveedd OOuuttssttaannddiinngg
O'Connor Marsden & Associates $35,000 $19,247 $15,753
Corporate Scorecard $30,000 $5,402 $17,515
Jacobs Group (Australia) Pty Ltd T/A Sinclair Knight Merz
$69,070 $17,072 $0
Clayton Utz $11,818 $9,488 $0
Jacobs Group (Australia) Pty Ltd T/A Sinclair Knight Merz
$23,480 $23,480 $0
Jacobs Group (Australia) Pty Ltd T/A Sinclair Knight Merz
$36,870 $25,769 $11,100
GHD Pty Ltd $40,000 $14,368 $25,631
GHD Pty Ltd $18,494 $224 $0
GHD Pty Ltd $54,892 $969 $0
DMT Services Pty Ltd ATF Munro Family Discretionary Trust T/A Ian K Munro Advisory Services
$23,000 $20,110 $2,889
Infrastructure Advisory Partners Pty Ltd $37,092 $22,054 $15,038
Jacobs Group (Australia) Pty Ltd T/A Sinclair Knight Merz
$64,720 $53,100 $11,620
CCoonnnneeccttiioonnss CCoonnssuullttaanncciieess bbeellooww $$1100,,000000
SSuupppplliieerr AApppprroovveedd RReecceeiivveedd OOuuttssttaannddiinngg
Currie & Brown (Australia) Pty Ltd $7,200 $7,200 $0
Currie & Brown (Australia) Pty Ltd $2,700 $2,700 $0
Appendix D - Schedule of Consultancies

2019/20 Goulburn-Murray Water Annual Report 148
AAppppeennddiixx EE –– AAbbbbrreevviiaattiioonnss
The following abbreviations are referenced throughout this report:
• AAAASSss – Australian Accounting Standards • BBAAUU – Business As Usual • CCMMAA – Catchment Management Authority • CCPP – Connections Project • CCSSOO – Community Service Obligations • DDWWMMPP – Domestic Wastewater Management Plans • DDEEDDJJTTRR – Department of Economic Development, Jobs, Transport and Resources • DDEELLWWPP – Department of Environment, Land, Water and Planning • EEBBIITTDDAA – Earnings before Interest, Tax, Depreciation and Amortisation • EEMMSS – Environmental Management System • EESSCC – Essential Services Commission • FFOOII – Freedom of Information • FFRRDD – Financial Reporting Direction • FFTTEE – Full Time Equivalent employees • GGBBCCMMAA – Goulburn Broken Catchment Management Authority • GGHHGG – Greenhouse Gases • GGLL – Gigalitres of water (one billion litres) • GGMMAA – Groundwater Management Area • GGMMIIDD – Goulburn Murray Irrigation District, Australia’s largest irrigation delivery network • GGMMUU – Groundwater Management Units • GGMMWW – Goulburn-Murray Rural Water Corporation (trading as Goulburn-Murray Water) • GGSSTT – Goods and Services Tax • HHRRWWSS – High-Reliability Water Shares • HHSSEE - Health, Safety, Environment and Sustainability • IICCTT – Information, Communications and Technology • KKLL – Kilolitres of water (one thousand litres) • KKMMPP – Key Management Personnel • LLGGBBTTII – Lesbian, gay, bisexual, transgender and intersex • LLOOWWIIGG - Land and On-Water Implementation Group • LLOOWWMMPP - Land and On-Water Management Plan • LLRRWWSS – Low-reliability Water Shares • LLSSLL – Long service Leave • MMDDBBAA – Murray Darling Basin Authority • MMLL – Megalitres of water (one million litres) • MMRRDD – Ministerial Reporting Direction • NNTTEERR – National Tax Equivalent Regime • NNVVIIRRPP – Northern Victoria Irrigation Renewal Project • OOHH&&SS – Occupational Health & Safety • PPCCGG – Connections Project Control Group • RRWWCC – Rural Water Corporation • SSCCCC – Stakeholder Consultative Committee • SSDD – Standing Direction • SSIIRR – Shepparton Irrigation Region • SSOO – Strategic Outcomes • TThhee BBooaarrdd – Independent Board of Directors appointed by the Minister for Water • TTLLWWCCAACC – Taungurung Land and Waters Council Aboriginal Corporation • TTWWPP – Transformation Working Plan • VVGGVV – Valuer General Victoria • VVPPSSCC – Victorian Public Sector Commission • WWSSDD – Water Storage and Delivery • WWSSPPAA – Water Supply Protection Area • YYYYNNAACC – Yorta Yorta Nation Aboriginal Corporation
Appendix E - Abbreviations


![[Schaum - Murray R.Spiegel] Mecanica Teorica](https://static.fdokumen.com/doc/165x107/6316b839c5ccb9e1fb03d12d/schaum-murray-rspiegel-mecanica-teorica.jpg)