Angel Operations Environment Plan Summary - NOPSEMA
175
Angel Operations Environment Plan Summary This document is protected by copyright. No part of this document may be reproduced, adapted, transmitted, or stored in any form by any process (electronic or otherwise) without the specific written consent of Woodside. All rights are reserved. Controlled Ref No: XX Revision: 0 Native file DRIMS No: 1400947213 Page i Uncontrolled when printed. Refer to electronic version for most up to date information. Angel Operations Environment Plan Summary Production Division December 2018 Revision 0
-
Upload
khangminh22 -
Category
Documents
-
view
0 -
download
0
Transcript of Angel Operations Environment Plan Summary - NOPSEMA

Angel Operations Environment Plan Summary
This document is protected by copyright. No part of this document may be reproduced, adapted, transmitted, or stored in any form by any process (electronic or otherwise) without the specific written consent of Woodside. All rights are reserved.
Controlled Ref No: XX Revision: 0 Native file DRIMS No: 1400947213 Page i
Uncontrolled when printed. Refer to electronic version for most up to date information.
Angel Operations Environment Plan
Summary
Production Division
December 2018
Revision 0

Angel Operations Environment Plan Summary
This document is protected by copyright. No part of this document may be reproduced, adapted, transmitted, or stored in any form by any process (electronic or otherwise) without the specific written consent of Woodside. All rights are reserved.
Controlled Ref No: XX Revision: 0 Native file DRIMS No: 1400947213 Page ii
Uncontrolled when printed. Refer to electronic version for most up to date information.
Table of Contents 1. INTRODUCTION..................................................................................................... 6 1.1 Defining the Activity ........................................................................................................... 6
2. LOCATION OF THE ACTIVITY .............................................................................. 7
3. DESCRIPTION OF THE ACTIVITY ........................................................................ 9 3.1 Overview ........................................................................................................................... 9 3.2 Operational Area ............................................................................................................... 9 3.3 Timing of the Activities ...................................................................................................... 9 3.4 Facility Layout and Description ........................................................................................ 10 3.4.1 Topsides ......................................................................................................................... 10 3.4.2 Wells and Reservoirs ...................................................................................................... 10 3.4.3 Pipeline and Riser System .............................................................................................. 10 3.4.4 Subsea Infrastructure ...................................................................................................... 10 3.5 Operational Details .......................................................................................................... 11 3.5.1 Manning and Modes of Operation ................................................................................... 11 3.5.2 Process Description ........................................................................................................ 12 3.5.3 Produced Water System ................................................................................................. 13 3.5.4 Drainage Systems ........................................................................................................... 13 3.5.5 Utility Systems................................................................................................................. 14 3.5.6 Operational Flaring .......................................................................................................... 14 3.5.7 Lifting Operations ............................................................................................................ 15 3.5.8 Safety Features and Emergency Systems ....................................................................... 15 3.5.9 Vessels ........................................................................................................................... 16 3.5.10 Helicopter Operations...................................................................................................... 16 3.6 Hydrocarbon and Chemical Inventories and Selection .................................................... 16 3.6.1 Hydrocarbons .................................................................................................................. 16 3.6.2 Chemical Usage .............................................................................................................. 16 3.7 Subsea Inspection, Maintenance and Repair Activities ................................................... 17 3.7.1 IMR Activities .................................................................................................................. 17 3.7.2 Well Management and Maintenance Activities ................................................................ 18
4. DESCRIPTION OF THE RECEIVING ENVIRONMENT ....................................... 19 4.1 Regional Setting .............................................................................................................. 19 4.2 Physical Environment ...................................................................................................... 19 4.3 Biological Environment .................................................................................................... 20 4.3.1 Benthic Communities ...................................................................................................... 20 4.3.2 Pelagic and Demersal Fish Populations .......................................................................... 21 4.3.3 Plankton .......................................................................................................................... 21 4.3.4 Species ........................................................................................................................... 22 4.4 Socio-Economic and Cultural .......................................................................................... 27 4.5 Values and Sensitivities .................................................................................................. 29

Angel Operations Environment Plan Summary
This document is protected by copyright. No part of this document may be reproduced, adapted, transmitted, or stored in any form by any process (electronic or otherwise) without the specific written consent of Woodside. All rights are reserved.
Controlled Ref No: XX Revision: 0 Native file DRIMS No: 1400947213 Page iii
Uncontrolled when printed. Refer to electronic version for most up to date information.
5. ENVIRONMENTAL IMPACTS AND RISKS ......................................................... 33 5.1 Risk and Impact Identification and Evaluation ................................................................. 33 5.1.1 Establish the Context ...................................................................................................... 34 5.1.2 Impact and Risk Identification .......................................................................................... 34 5.1.3 Risk Analysis ................................................................................................................... 34 5.1.3.1 Decision Support Framework ...................................................................................... 34 5.1.3.2 Identification of Control Measures ............................................................................... 35 5.1.3.3 Risk Rating Process .................................................................................................... 35 5.2 Classification and Analysis of Major Environment Events ................................................ 37 5.2.1 MEE Identification ........................................................................................................... 37 5.2.2 MEE Classification .......................................................................................................... 37 5.2.3 Safety and Environment Critical Elements (SCE) and Performance Standards ............... 37 5.3 Impact and Risk Evaluation ............................................................................................. 38 5.3.1 Demonstration of ALARP ................................................................................................ 39 5.3.2 Demonstration of Acceptability ........................................................................................ 39 5.4 Hydrocarbon Spill Risk Assessment Methodology ........................................................... 40 5.4.1 ZoC and Hydrocarbon Contact Thresholds ..................................................................... 40 5.4.2 Surface Hydrocarbon Threshold Concentrations ............................................................. 40 5.4.3 Entrained Hydrocarbon Threshold Concentrations .......................................................... 41 5.4.4 Dissolved Aromatic Hydrocarbon Threshold Concentrations ........................................... 41 5.4.5 Accumulated Hydrocarbon Threshold Concentrations ..................................................... 43 5.5 Potential Environment Risks Not Included Within the Scope of the Environment Plan .... 43
6. ENVIRONMENTAL RISK AND IMPACTS SUMMARY ........................................ 44
7. ONGOING MONITORING OF ENVIRONMENTAL PERFORMANCE ................. 49 7.1 Environment Plan Revisions and Management of Change .............................................. 49
8. OIL POLLUTION EMERGENCY RESPONSE ARRANGEMENTS ...................... 51 8.1 Oil Pollution Emergency Arrangements (Australia) .......................................................... 51 8.2 Angel Oil Pollution First Strike Plan ................................................................................. 52 8.3 Oil Spill Preparedness and Response Mitigation Assessment ......................................... 52
9. CONSULTATION .................................................................................................. 54 9.1 Ongoing Consultation ...................................................................................................... 55 9.2 Non-Routine Events ........................................................................................................ 55
10. TITLEHOLDER NOMINATED LIAISON PERSON ............................................... 56
11. ABBREVIATIONS ................................................................................................ 57
12. REFERENCES ..................................................................................................... 62
APPENDIX A: ENVIRONMENTAL IMPACTS AND RISKS .............................................. 79
APPENDIX B: CONTROL MITIGATION MEASURES FOR POTENTIAL ENVIRONMENTAL IMPACTS ASSOCIATED WITH SPILL RESPONSE ACTIVITIES ........................................................................................................ 166
APPENDIX C: SUMMARY OF STAKEHOLDER FEEDBACK AND WOODSIDE’S RESPONSE ........................................................................................................ 170
Angel Operations Environment Plan Summary
This document is protected by copyright. No part of this document may be reproduced, adapted, transmitted, or stored in any form by any process (electronic or otherwise) without the specific written consent of Woodside. All rights are reserved.
Controlled Ref No: XX Revision: 0 Native file DRIMS No: 1400947213 Page iv
Uncontrolled when printed. Refer to electronic version for most up to date information.
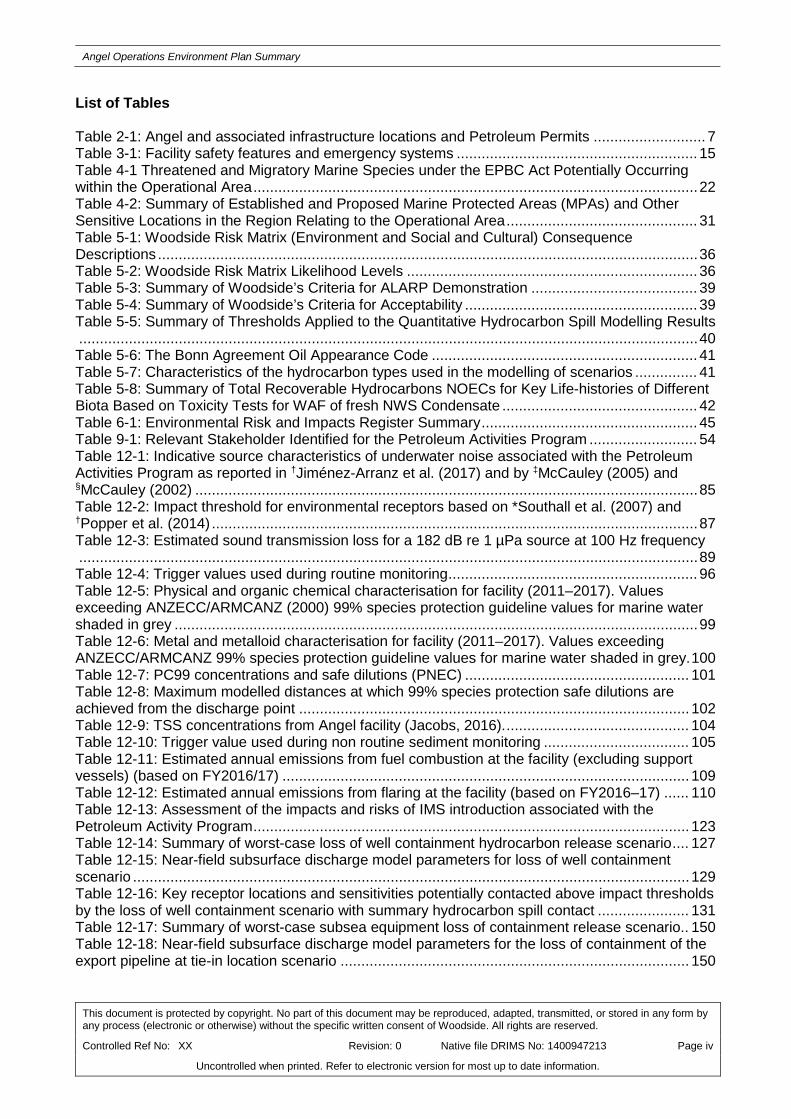
List of Tables Table 2-1: Angel and associated infrastructure locations and Petroleum Permits ........................... 7 Table 3-1: Facility safety features and emergency systems .......................................................... 15 Table 4-1 Threatened and Migratory Marine Species under the EPBC Act Potentially Occurring within the Operational Area ........................................................................................................... 22 Table 4-2: Summary of Established and Proposed Marine Protected Areas (MPAs) and Other Sensitive Locations in the Region Relating to the Operational Area .............................................. 31 Table 5-1: Woodside Risk Matrix (Environment and Social and Cultural) Consequence Descriptions .................................................................................................................................. 36 Table 5-2: Woodside Risk Matrix Likelihood Levels ...................................................................... 36 Table 5-3: Summary of Woodside’s Criteria for ALARP Demonstration ........................................ 39 Table 5-4: Summary of Woodside’s Criteria for Acceptability ........................................................ 39 Table 5-5: Summary of Thresholds Applied to the Quantitative Hydrocarbon Spill Modelling Results ..................................................................................................................................................... 40 Table 5-6: The Bonn Agreement Oil Appearance Code ................................................................ 41 Table 5-7: Characteristics of the hydrocarbon types used in the modelling of scenarios ............... 41 Table 5-8: Summary of Total Recoverable Hydrocarbons NOECs for Key Life-histories of Different Biota Based on Toxicity Tests for WAF of fresh NWS Condensate ............................................... 42 Table 6-1: Environmental Risk and Impacts Register Summary .................................................... 45 Table 9-1: Relevant Stakeholder Identified for the Petroleum Activities Program .......................... 54 Table 12-1: Indicative source characteristics of underwater noise associated with the Petroleum Activities Program as reported in †Jiménez-Arranz et al. (2017) and by ‡McCauley (2005) and §McCauley (2002) ......................................................................................................................... 85 Table 12-2: Impact threshold for environmental receptors based on *Southall et al. (2007) and †Popper et al. (2014) ..................................................................................................................... 87 Table 12-3: Estimated sound transmission loss for a 182 dB re 1 µPa source at 100 Hz frequency ..................................................................................................................................................... 89 Table 12-4: Trigger values used during routine monitoring ............................................................ 96 Table 12-5: Physical and organic chemical characterisation for facility (2011–2017). Values exceeding ANZECC/ARMCANZ (2000) 99% species protection guideline values for marine water shaded in grey .............................................................................................................................. 99 Table 12-6: Metal and metalloid characterisation for facility (2011–2017). Values exceeding ANZECC/ARMCANZ 99% species protection guideline values for marine water shaded in grey. 100 Table 12-7: PC99 concentrations and safe dilutions (PNEC) ...................................................... 101 Table 12-8: Maximum modelled distances at which 99% species protection safe dilutions are achieved from the discharge point .............................................................................................. 102 Table 12-9: TSS concentrations from Angel facility (Jacobs, 2016). ............................................ 104 Table 12-10: Trigger value used during non routine sediment monitoring ................................... 105 Table 12-11: Estimated annual emissions from fuel combustion at the facility (excluding support vessels) (based on FY2016/17) .................................................................................................. 109 Table 12-12: Estimated annual emissions from flaring at the facility (based on FY2016–17) ...... 110 Table 12-13: Assessment of the impacts and risks of IMS introduction associated with the Petroleum Activity Program ......................................................................................................... 123 Table 12-14: Summary of worst-case loss of well containment hydrocarbon release scenario .... 127 Table 12-15: Near-field subsurface discharge model parameters for loss of well containment scenario ...................................................................................................................................... 129 Table 12-16: Key receptor locations and sensitivities potentially contacted above impact thresholds by the loss of well containment scenario with summary hydrocarbon spill contact ...................... 131 Table 12-17: Summary of worst-case subsea equipment loss of containment release scenario.. 150 Table 12-18: Near-field subsurface discharge model parameters for the loss of containment of the export pipeline at tie-in location scenario .................................................................................... 150

Angel Operations Environment Plan Summary
This document is protected by copyright. No part of this document may be reproduced, adapted, transmitted, or stored in any form by any process (electronic or otherwise) without the specific written consent of Woodside. All rights are reserved.
Controlled Ref No: XX Revision: 0 Native file DRIMS No: 1400947213 Page v
Uncontrolled when printed. Refer to electronic version for most up to date information.
Table 12-19: Key receptor locations and sensitivities potentially contacted above impact thresholds by the export pipeline (EP) and riser (R) loss of containment scenarios with summary hydrocarbon spill contact ................................................................................................................................. 152 Table 12-20: Summary of worst-case support vessel fuel tank loss of containment scenario ...... 159 Table 12-21: Analysis of risks and impacts ................................................................................. 167
List of Figures Figure 2-1: Angel facility and Operational Area ............................................................................... 7 Figure 4-1: Vessel density map in the vicinity of Operational Area from 2016, derived from AMSA satellite tracking system data (vessels include cargo, LNG tanker, ore carriers passenger vessels, support vessels and other vessels) ............................................................................................... 29 Figure 4-2: Established and proposed Commonwealth and State Marine Protected Areas in Relation to the Operational Area ................................................................................................... 30 Figure 5-1: Key steps in Woodside’s Risk Management Process .................................................. 33 Figure 5-2: Woodside Risk Matrix: Risk Level ............................................................................... 37 Figure 12-1: Ecosystem integrity and monitoring .......................................................................... 96 Figure 12-2: Routine monitoring and adaptive management framework for produced water ......... 97 Figure 12-3: PEC/PNEC for PW discharge at Angel during the transitional period (grey range ring represents 1 km radius; red range ring represents 200 m radius)- 2017 ..................................... 103 Figure 12-4: Proportional mass balance plot representing the weathering of Angel condensate spilled onto the water surface as a one-off release (50 m3 over 1 hour) and subject to variable wind at 27 °C water temperature and 25 °C air temperature ............................................................... 129

Angel Operations Environment Plan Summary
This document is protected by copyright. No part of this document may be reproduced, adapted, transmitted, or stored in any form by any process (electronic or otherwise) without the specific written consent of Woodside. All rights are reserved.
Controlled Ref No: XX Revision: 0 Native file DRIMS No: 1400947213 Page 6 of 175
Uncontrolled when printed. Refer to electronic version for most up to date information.
1. INTRODUCTION Woodside Energy Limited (Woodside), as Titleholder, under the Offshore Petroleum and Greenhouse Gas Storage (Environment) Regulations 2009 (referred to as the Environment Regulations), prepared an Environment Plan (EP) for the operation of the Angel Offshore Production Facility (the facility), hereafter referred to as the Petroleum Activities Program. The Angel Operations EP was accepted by National Offshore Petroleum Safety and Environmental Management Authority (NOPSEMA) on the 10 December 2018.
This EP Summary has been prepared to meet the requirements of Regulations 11(3) and 11(4) under the Environment Regulations, as administered by NOPSEMA. This document summarises the Angel Operations EP, accepted by NOPSEMA under Regulation 10A of the Environment Regulations.
1.1 Defining the Activity The Petroleum Activities Program constitutes a petroleum activity, as defined in Regulation 4 of the Environment Regulations. As such, an EP is required.

Angel Operations Environment Plan Summary
This document is protected by copyright. No part of this document may be reproduced, adapted, transmitted, or stored in any form by any process (electronic or otherwise) without the specific written consent of Woodside. All rights are reserved.
Controlled Ref No: XX Revision: 0 Native file DRIMS No: 1400947213 Page 7 of 175
Uncontrolled when printed. Refer to electronic version for most up to date information.
2. LOCATION OF THE ACTIVITY The facility is located in Commonwealth waters on the North West Shelf (NWS) of Western Australia (WA), in Production Licence Area WA-3-L. It is located approximately 49 km east of the North Rankin Complex (NRC) and 123 km north west of the Karratha Gas Plant (KGP) (Figure 2-1). Gas and condensate produced from the facility are exported via the 49 km long export 30 inch pipeline, which ties into the NRC first trunkline (1TL). The facility is marked on nautical maps surrounded by a 500 m petroleum safety zone. The export pipeline is marked on nautical charts.
Figure 2-1: Angel facility and Operational Area The coordinates and permit areas of the facility and associated infrastructure are presented in Table 2-1. Table 2-1: Angel and associated infrastructure locations and Petroleum Permits
Structure Water Depth (~Lowest
Astronomical Tide (LAT))
Latitude Longitude Production Permits
Riser platform 80 m 19° 29' 55.11246” S 116° 35' 53.07795” E WA-3-L
AP2 well 80 m 19° 28' 59.74330” S 116° 36' 37.40834” E WA-3-L
AP3 well 80 m 19° 30' 38.51265” S 116° 36' 18.57264” E WA-3-L
AP4 well 85 m 19° 31' 18.10976” S 116° 35' 13.43468” E WA-3-L

Angel Operations Environment Plan Summary
This document is protected by copyright. No part of this document may be reproduced, adapted, transmitted, or stored in any form by any process (electronic or otherwise) without the specific written consent of Woodside. All rights are reserved.
Controlled Ref No: XX Revision: 0 Native file DRIMS No: 1400947213 Page 8 of 175
Uncontrolled when printed. Refer to electronic version for most up to date information.
Structure Water Depth (~Lowest
Astronomical Tide (LAT))
Latitude Longitude Production Permits
East end of export pipeline (riser platform)
80 m 19° 29' 54.72169” S 116° 35' 52.90738” E WA-14-PL
West end of export pipeline (NRC)
125 m 19° 35' 11.11086” S 116 ° 8 ' 23.99840” E WA-14-PL

Angel Operations Environment Plan Summary
This document is protected by copyright. No part of this document may be reproduced, adapted, transmitted, or stored in any form by any process (electronic or otherwise) without the specific written consent of Woodside. All rights are reserved.
Controlled Ref No: XX Revision: 0 Native file DRIMS No: 1400947213 Page 9 of 175
Uncontrolled when printed. Refer to electronic version for most up to date information.
3. DESCRIPTION OF THE ACTIVITY
3.1 Overview The facility is owned by the NWS Joint Venture. Woodside is the nominated operator of the petroleum titles for the facility ( Table 2-1 and Figure 2-1).
The facility was commissioned as an integrated production, utilities and accommodation platform. The facility operates as a Not Normally Manned (NNM) platform, with remote operation from the NRC or from the KGP when NRC is down-manned. Electrical power is provided via a subsea power cable from the NRC, which eliminates the requirements for a separate power generation system to be located on Angel.
The facility produces dry gas and condensate from the Angel reservoir and has been in operation since 2008. The riser platform consists of a single processing train, which processes the production fluids via cooling, separation, compression and dehydration. The condensate and gas are then comingled for export, and transported along an export pipeline into the 1TL to the KGP for processing (the operation of 1TL is beyond the scope of this EP).
The facility has three subsea satellite wells, with a maximum daily production capacity of 21,500 tonnes of raw gas and 5270 tonnes of condensate. The current production rate is 12,000 tonnes of raw gas and 3000 tonnes of condensate.
The infrastructure covered by this EP includes the:
• gas anfd condensate production platform (the riser platform);
• subsea infrastructure tied back to the riser platform;
• export pipeline from the riser platform to the downstream flange of the tie-in with 1TL near NRC; and
• support vessels assisting with the activities defined above.
3.2 Operational Area The Operational Area defines the spatial boundary of the Petroleum Activities Program. The area includes (Figure 2-1):
• The riser platform and the area within a 500 m petroleum safety zone around the facility;
• The export pipeline from Angel to NRC covered by pipeline licence WA-14-PL and an area encompassing 1500 m around the infrastructure; and
• Angel subsea facilities including wells and flowlines, and an area within 1500 m around the subsea infrastructure.
Vessel related activities within the Operational Area will comply with the EP. Vessels supporting the Petroleum Activities Program when outside the Operational Area will adhere to all applicable maritime regulations and other requirements.
3.3 Timing of the Activities The facility commenced production in 2008. The facility is designed to operate 24 hours per day, 365 days per year.
Any future decommissioning or drilling will be subject to a separate EP.

Angel Operations Environment Plan Summary
This document is protected by copyright. No part of this document may be reproduced, adapted, transmitted, or stored in any form by any process (electronic or otherwise) without the specific written consent of Woodside. All rights are reserved.
Controlled Ref No: XX Revision: 0 Native file DRIMS No: 1400947213 Page 10 of 175
Uncontrolled when printed. Refer to electronic version for most up to date information.
3.4 Facility Layout and Description This section provides an overview of the facility and associated infrastructure, as relevant to consideration of the environmental risks and impacts of the Petroleum Activities Program.
3.4.1 Topsides The Angel topsides comprise two decks of approximate dimensions 37 m by 67 m. The decks are separated by two major vertical trusses oriented in the north-south direction and extending 46 m between supports. Stair-towers on the topsides provide personnel access between the decks and the accommodation facilities. A pedestal crane is located on the east side of the deck and a boom rest on the west. A flare boom projects northward from the north face of the topside. A helideck is provided above the south west corner. The Angel export riser is located at the base of the riser platform.
Although the riser platform is NNM, permanently installed accommodation facilities are provided on the southern end of the topside to accommodate personnel required for campaign maintenance and shutdown activities. Additional temporary living quarters can be provided by installing modular accommodation.
3.4.2 Wells and Reservoirs
Angel There are three subsea satellite wells that produce from the Angel reservoir currently tied back to the riser platform. Surface controlled sub surface safety valves (SCSSV) are installed on each well as the primary down hole safety system.
The Angel field is a gas condensate reservoir, approximately 6 km wide and 10 km long. Production rates from the facility are expected to fluctuate due to NWS demand, ranging between 0 and 960 Million standard cubic feet per day (MMscfd) over the remainder of the field life.
3.4.3 Pipeline and Riser System Dehydrated export gas and condensate is metered at the outlet of the production train on the riser platform, prior to recombination and subsequent export via the export pipeline.
The pipeline route commences at the flange connecting the riser to the riser platform, and runs 49 km westwards to the NRC facility. The pipeline ties into 1TL at the downstream flange of the tie-in assembly to 1TL.
3.4.4 Subsea Infrastructure The main components of subsea infrastructure include wells, Xmas trees, umbilicals, jumpers, valve skids, flowlines, risers and export pipeline.
The subsea system is typically controlled from NRC via an integrated power and control cable through the following components:
• umbilicals, which provide hydraulic and electric power, communication and chemical supplies between the platform and subsea components through a number of cables and tubes; umbilicals runs between the platform and Umbilical Termination Assemblies (UTA);
• valves, which control subsea operations and processes;
• chokes, which control pressure and flow rates of hydrocarbons; and
• Subsea Control Modules (SCM), which are sealed and pressure compensated electro-hydraulic units (typically found on Xmas trees) and link the surface and subsea controls.
A number of subsea valves may also be overridden manually from a Remote Operated Vehicle (ROV) or by divers.

Angel Operations Environment Plan Summary
This document is protected by copyright. No part of this document may be reproduced, adapted, transmitted, or stored in any form by any process (electronic or otherwise) without the specific written consent of Woodside. All rights are reserved.
Controlled Ref No: XX Revision: 0 Native file DRIMS No: 1400947213 Page 11 of 175
Uncontrolled when printed. Refer to electronic version for most up to date information.
3.5 Operational Details This section provides a description of the main operations associated with the facility. It includes key elements in relation to interaction between the activity and the environment.
3.5.1 Manning and Modes of Operation The facility is designed to operate without operator intervention. Normal operations are controlled remotely via a fibre optic link cable by two dedicated operating consoles in the NRC Central Control Room (CCR).
The permanently installed accommodation on the facility can cater for up to 24 personnel on board (POB) and additional temporary accommodation modules can be installed to accommodate a further 24 POB. Activities which require manning levels are:
• engineering projects;
• campaign maintenance;
• unplanned corrective (breakdown) maintenance;
• inspections/audits; and
• planned facility shutdowns.
The main facility modes of operation are discussed in more detail below.
Production Remote Operations The facility operates as a NNM facility and may be operated, monitored, controlled, restarted and diagnosed from the riser platform or remotely from NRC or KGP if NRC is down manned.
The Process Control System (PCS) for the facility provides the following monitoring and control functions:
• basic monitoring of all key performance indicators;
• adjustment of devices on the facility, such as control valves, pumps and variable speed drives, to maintain process variables within design limits;
• alarm signals to the Human–Machine Interface located on the NRC; and
• automatically managing duty/standby and lead/lag equipment.
Major Projects Major projects involve refurbishment, modification or major maintenance on the facility. The Projects function is responsible for undertaking these projects.
Maintenance Inspection, maintenance and repairs, including those undertaken subsea, are undertaken to maintain production within the platform and subsea infrastructure design constraints. Maintenance teams routinely visit the facility for:
• nominally 14 days, with teams of up to 24 POB;
• unplanned corrective (breakdown) maintenance, executed by a team of up to ten POB as required; and
• shutdown maintenance conducted by a team of up to 48 personnel.

Angel Operations Environment Plan Summary
This document is protected by copyright. No part of this document may be reproduced, adapted, transmitted, or stored in any form by any process (electronic or otherwise) without the specific written consent of Woodside. All rights are reserved.
Controlled Ref No: XX Revision: 0 Native file DRIMS No: 1400947213 Page 12 of 175
Uncontrolled when printed. Refer to electronic version for most up to date information.
When the facility is manned, primary control is retained by NRC, with personnel on Angel communicating with NRC via the radio communication links. Operational control of equipment is handed to ‘local control’ on the facility on an as-required basis.
Suspension The suspension mode of operations is the default state once all wells reach the end of field life. This is expected to last for approximately one year, before the implementation of future tie-backs or a full preservation (e.g. spading, depressurisation, purging and inerting) of the facility occurs. Suspension may also be implemented for reservoir management purposes.
In suspension mode, the facility’s process systems are maintained at a positive pressure, flaring is maintained at purge rates and the produced water (PW) overboard isolated.
Implementation for suspension requires minimal intervention, as it is predominantly achieved through the existing control systems and valves. Implementation activities are summarised as follows:
• Shut in the wells and open the choke intermittently to ensure the high pressure (HP) and low pressure (LP) flare system remains operational. Close the Riser Emergency Shutdown Valves (RESDV) on the non-flowing flowlines.
• Minimise topsides liquid inventories, as required.
• Segregate systems through existing valves.
• Place non-critical equipment (e.g. fans, coolers, motors) offline.
• Keep control, Safety Instrumented System and fire and gas live and reconfigured to fit the system requirements.
Facility operations during suspension (post implementation) is as follows:
• Facility operations and associated activities as described in this EP are retained.
• Manual operation of the well production system ensures the HP and LP flares remain operational.
• Life support, lifesaving equipment, temporary refuge and Safety Instrumented System remain operational and available
3.5.2 Process Description The facility receives well fluids (gas, condensate and associated PW) from the production wells for topside processing via cooling, separation, compression and dehydration. The facility then exports the comingled gas and condensate into the 1TL to KGP.
The facility has a single processing train with an operating capacity of 21.5 kT dry gas per day (kt/day) plus associated condensate.
Flare Systems The riser platform has two flare systems, the high pressure flare and the low pressure flare. The main purpose of the flare systems is to safely discharge gas streams during an emergency depressurisation. However, there are also a number of process streams which continuously pass gas to the flare, such as gas flashed from the PW, and stripping gas used in the glycol regeneration process. Other streams intermittently flow to the flare, such as during maintenance activities and when vessels are depressurised and purged.
In line with the facility NNM design philosophy, flare gas recovery is not provided and the system is designed for minimum maintenance. Both the HP and LP systems have knockout drums that collect and remove liquids that condense during emergency relief and blowdown. Liquid recovery pumps return the accumulated liquids to the process via production flowlines.
Angel Operations Environment Plan Summary
This document is protected by copyright. No part of this document may be reproduced, adapted, transmitted, or stored in any form by any process (electronic or otherwise) without the specific written consent of Woodside. All rights are reserved.
Controlled Ref No: XX Revision: 0 Native file DRIMS No: 1400947213 Page 13 of 175
Uncontrolled when printed. Refer to electronic version for most up to date information.
HP and LP flare pipework is continuously purged with hydrocarbon gas to prevent the possibility of an explosive mixture developing within the system. Both the LP and HP flare flow rates are monitored and alarmed to warn of purge loss. There is no planned venting of hydrocarbons from the facility during normal operations.
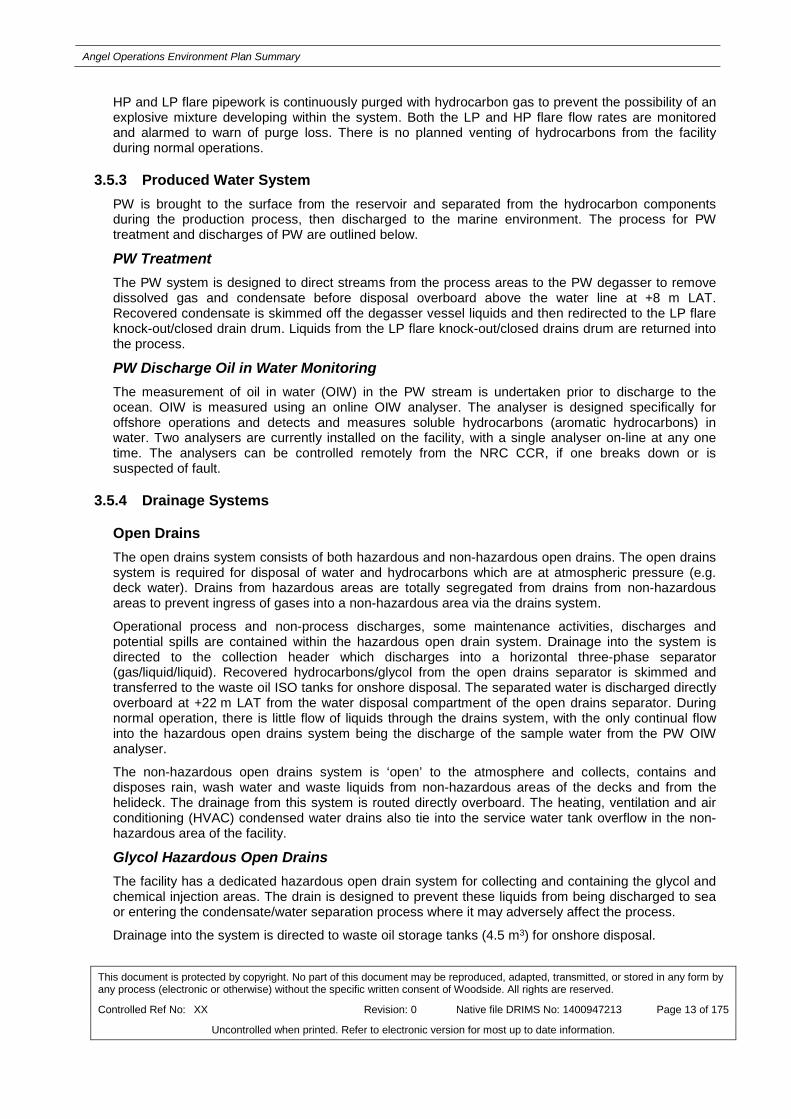
3.5.3 Produced Water System PW is brought to the surface from the reservoir and separated from the hydrocarbon components during the production process, then discharged to the marine environment. The process for PW treatment and discharges of PW are outlined below.
PW Treatment The PW system is designed to direct streams from the process areas to the PW degasser to remove dissolved gas and condensate before disposal overboard above the water line at +8 m LAT. Recovered condensate is skimmed off the degasser vessel liquids and then redirected to the LP flare knock-out/closed drain drum. Liquids from the LP flare knock-out/closed drains drum are returned into the process.
PW Discharge Oil in Water Monitoring The measurement of oil in water (OIW) in the PW stream is undertaken prior to discharge to the ocean. OIW is measured using an online OIW analyser. The analyser is designed specifically for offshore operations and detects and measures soluble hydrocarbons (aromatic hydrocarbons) in water. Two analysers are currently installed on the facility, with a single analyser on-line at any one time. The analysers can be controlled remotely from the NRC CCR, if one breaks down or is suspected of fault.
3.5.4 Drainage Systems
Open Drains The open drains system consists of both hazardous and non-hazardous open drains. The open drains system is required for disposal of water and hydrocarbons which are at atmospheric pressure (e.g. deck water). Drains from hazardous areas are totally segregated from drains from non-hazardous areas to prevent ingress of gases into a non-hazardous area via the drains system.
Operational process and non-process discharges, some maintenance activities, discharges and potential spills are contained within the hazardous open drain system. Drainage into the system is directed to the collection header which discharges into a horizontal three-phase separator (gas/liquid/liquid). Recovered hydrocarbons/glycol from the open drains separator is skimmed and transferred to the waste oil ISO tanks for onshore disposal. The separated water is discharged directly overboard at +22 m LAT from the water disposal compartment of the open drains separator. During normal operation, there is little flow of liquids through the drains system, with the only continual flow into the hazardous open drains system being the discharge of the sample water from the PW OIW analyser.
The non-hazardous open drains system is ‘open’ to the atmosphere and collects, contains and disposes rain, wash water and waste liquids from non-hazardous areas of the decks and from the helideck. The drainage from this system is routed directly overboard. The heating, ventilation and air conditioning (HVAC) condensed water drains also tie into the service water tank overflow in the non-hazardous area of the facility.
Glycol Hazardous Open Drains The facility has a dedicated hazardous open drain system for collecting and containing the glycol and chemical injection areas. The drain is designed to prevent these liquids from being discharged to sea or entering the condensate/water separation process where it may adversely affect the process.
Drainage into the system is directed to waste oil storage tanks (4.5 m3) for onshore disposal.

Angel Operations Environment Plan Summary
This document is protected by copyright. No part of this document may be reproduced, adapted, transmitted, or stored in any form by any process (electronic or otherwise) without the specific written consent of Woodside. All rights are reserved.
Controlled Ref No: XX Revision: 0 Native file DRIMS No: 1400947213 Page 14 of 175
Uncontrolled when printed. Refer to electronic version for most up to date information.
Closed Drains The process closed drains system is used for draining liquids process equipment for maintenance purposes. The drained liquids are routed to the LP flare knock-out/closed drains drum, and from there the recovered liquids may be recycled back to the process.
3.5.5 Utility Systems The facility has a range of utility systems to support operations including;
• Platform lighting;
• HVAC System;
• Potable Water;
• Power Generation;
• Utility Gas System;
• Sewage and Putrescible Wastes;
• Sand Management; and
• Diesel fuel system.
3.5.6 Operational Flaring Flaring is expected to occur during a range of operational circumstances; key operational flaring events are explained in further detail in the following sections. Annual internal facility flare targets are set based on operational activities planned for the year. This target is used to assess facility flare performance.
Normal Operations A relatively small quantity of gas is required to be continuously flared associated with purge and pilot of the flare system and disposal of waste streams which are not recovered to the process.
The continuous flows to the LP flare are:
• flare pilot;
• LP flare header and storage tank purges;
• glycol regeneration process, including still column overheads and flash drum;
• flash gas from PW degasser;
• gas used to blanket the Monoethylene glycol (MEG) storage vessel; and
• flash gas from scrubber vessels, and the glycol contactor integral suction scrubbers (under on/off level control).
The continuous flows to the HP flare are:
• flare pilot;
• HP flare header purges; and
• leakage past flare header valves such as pressure safety valves (PSVs) and blowdown valves (BDVs).
Estimated Flare Volumes

Angel Operations Environment Plan Summary
This document is protected by copyright. No part of this document may be reproduced, adapted, transmitted, or stored in any form by any process (electronic or otherwise) without the specific written consent of Woodside. All rights are reserved.
Controlled Ref No: XX Revision: 0 Native file DRIMS No: 1400947213 Page 15 of 175
Uncontrolled when printed. Refer to electronic version for most up to date information.
The amount of gas that may be flared on an annual basis is a dependent of continuous and intermittent process sources, planned activities requiring flaring, and unplanned process upsets. The estimated annual amount of gas flared ranges between 5,000 and 6,000 tonnes.
3.5.7 Lifting Operations Lifting operations on the facility include:
• Lifting from platform support vessels; and
• Lifting around the facility.
A pedestal crane is located on the east side of the riser platform at the main deck. The crane is powered by diesel.
3.5.8 Safety Features and Emergency Systems A range of safety features and emergency systems have been integrated into the design and operation of the facility to manage safety risk. Based on Woodside’s Health and Safety Design Premises for Hydrocarbon Facilities, risk management measures have been grouped into the categories of:
• prevention
• detection
• control
• mitigation
The safety features and emergency measures in place of the facility are listed in Table 3-1.
Table 3-1: Facility safety features and emergency systems
Category Description
Prevention
Inherently safe design (leak minimisation, layout) Dropped object/impact protection (including vessel collision avoidance) Structural design Material selection and corrosion control
Detection Fire, gas and smoke detection (including manual alarm callpoints (MACs))
Control
Process control system Ignition control Depressurisation systems Passive fire protection Heating, ventilation and air conditioning
Mitigation
Escape and evacuation routes Safety critical buildings Emergency power and UPS Emergency and escape lighting Critical communications systems Evacuation and rescue facilities and equipment

Angel Operations Environment Plan Summary
This document is protected by copyright. No part of this document may be reproduced, adapted, transmitted, or stored in any form by any process (electronic or otherwise) without the specific written consent of Woodside. All rights are reserved.
Controlled Ref No: XX Revision: 0 Native file DRIMS No: 1400947213 Page 16 of 175
Uncontrolled when printed. Refer to electronic version for most up to date information.
3.5.9 Vessels Platform support vessels and subsea support vessels are used in support of the facility. Platform support vessels are used to transport personnel, material and equipment to and from the facility when manned. The normally scheduled support vessel is the Siem Thiima. Vessels supporting the facility may vary depending on vessel schedules and availability. While in the field, the vessel also backloads materials and segregated waste for transportation back to the King Bay Supply Facility (KBSF) in Karratha, as well as carrying out standby duties including during working over the side activities while in the field.
Subsea support vessels are also used for field work such as subsea inspection, maintenance and repair activities. Vessels supporting offshore activities may vary depending on operational requirements, vessel schedules, capability and availability.
Typical support vessels use a Dynamic Positioning (DP) system to allow manoeuvrability and avoid anchoring when undertaking works, due to the close proximity of subsea infrastructure. However, vessels are equipped with anchors which may be deployed in an emergency.
3.5.10 Helicopter Operations Helicopters are the primary means of transporting passengers and/or urgent freight to/from the facility and support vessels. They are also the preferred means of evacuating personnel in an emergency. Helicopter support is principally supplied from Karratha Airport, and transports workers from Karratha for planned maintenance or from the NRC for breakdown maintenance.
3.6 Hydrocarbon and Chemical Inventories and Selection
3.6.1 Hydrocarbons The main process hydrocarbon inventories associated with major topside process equipment used on the facility include:
• Inlet cooler;
• Production separator;
• Condensate cooler;
• Primary water condensate separator;
• Glycol contactor;
• Condensate filters; and
• Condensate coalescers (A and B).
Non-process inventories of hydrocarbons used on the facility are diesel and lube oil / hydraulic fluid.
3.6.2 Chemical Usage Chemicals are used on the facility for a variety of purposes and can be divided into two broad categories (operational and facility maintenance).
Operational Chemicals Operational chemicals include chemicals added to a process or system, or which may be needed for operational reasons. Operational chemicals used may include corrosion inhibitors, biocides, scale inhibitors, demulsifiers, glycols and hydrate inhibitors, subsea control fluids and dyes. These chemicals may be present in routine or non-routine discharge systems, may be intermittently discharged or have the potential to be discharged.
Maintenance Chemicals

Angel Operations Environment Plan Summary
This document is protected by copyright. No part of this document may be reproduced, adapted, transmitted, or stored in any form by any process (electronic or otherwise) without the specific written consent of Woodside. All rights are reserved.
Controlled Ref No: XX Revision: 0 Native file DRIMS No: 1400947213 Page 17 of 175
Uncontrolled when printed. Refer to electronic version for most up to date information.
Maintenance chemicals include chemicals which are required for general maintenance or ‘housekeeping’ activities and are critical for overall maintenance of the facility and its equipment. These may include paints, degreasers, greases, lubricants and domestic cleaning products. They may also include chemicals required for specialty tasks, such as laboratory testing and analysis.
Environmental Consideration During Selection, Assessment and Approval of Chemicals As part of Woodside's chemical approval process, operational chemicals required by the Petroleum Activities Program are selected and approved in accordance with the Woodside Chemical Selection and Assessment Environment Guideline.
The chemical assessment process follows the principles outlined in the Offshore Chemical Notification Scheme (OCNS) which manages chemical use and discharge in the United Kingdom (UK) and the Netherlands (background on the OCNS scheme provided is below), specifically:
• Where operational chemicals with an OCNS rating of Gold/Silver/E/D and no OCNS substitution or product warning are selected, or a substance is considered to pose little or no risk to the environment (PLONOR), no further control is required. (Such chemicals do not represent a significant impact on the environment under standard use scenarios and therefore, are considered ALARP and acceptable).
• If other OCNS rated or non-OCNS rated operational chemicals are selected, the chemical will be assessed further.
If no environmental data is available for a chemical or if the environmental data does not meet the acceptability criteria outlined above, potential alternatives for the chemical will be investigated, with preference for options with an HQ band of Gold or Silver or which are OCNS Group E or D with no substitution or product warnings.
If no more environmentally suitable alternatives are available, further risk reduction measures (e.g. controls related to use and discharge) will be considered for the specific context and implemented where relevant to ensure the risk is ALARP and acceptable.
Once the further assessment/ALARP justification has been completed, concurrence from the relevant manager that the environmental risk as results of chemical use is ALARP and acceptable is obtained.
3.7 Subsea Inspection, Maintenance and Repair Activities
3.7.1 IMR Activities A range of subsea inspection, monitoring, maintenance and repair activities (referred to as IMR) may be undertaken during the operations of the facility. Subsea IMR activities are typically undertaken from a diving or support vessel via one or more ROVs and/or divers. Typical support vessels use DP systems to allow manoeuvrability and avoid anchoring when undertaking works due to the proximity of subsea infrastructure. IMR activities may include:
• Inspections;
• Chemical usage;
• Intervention isolation;
• Pipeline pigging operations;
• Pressure and leak testing;
• Flushing;
• Marine growth removal;
• Sediment relocation;

Angel Operations Environment Plan Summary
This document is protected by copyright. No part of this document may be reproduced, adapted, transmitted, or stored in any form by any process (electronic or otherwise) without the specific written consent of Woodside. All rights are reserved.
Controlled Ref No: XX Revision: 0 Native file DRIMS No: 1400947213 Page 18 of 175
Uncontrolled when printed. Refer to electronic version for most up to date information.
• Hotstab interventions;
• Repair / replacement of corrosion protection;
• Span rectification of grout bags, mattresses and rock dump;
• Cycling of valves;
• Choke module change out;
• Subsea Control Module (SCM) change out;
• Jumper and umbilical replacement;
• Tree cap change out;
• Logic plate/cap change out;
• Spool repair, replacement and recovery; and
• Suspension and preservation of redundant equipment.
3.7.2 Well Management and Maintenance Activities The facility has three subsea wells. Well interventions, workovers and well kills require a suitable vessel or drill rig to accommodate and support intervention packages. Therefore, these activities do not form part of the scope of this EP. Unloading and clean-up from subsea wells via the riser platform may be required infrequently, via the process facilities to be cleaned up of any remaining chemicals and fluids in the wellbore or reservoir.
Angel Operations Environment Plan Summary
This document is protected by copyright. No part of this document may be reproduced, adapted, transmitted, or stored in any form by any process (electronic or otherwise) without the specific written consent of Woodside. All rights are reserved.
Controlled Ref No: XX Revision: 0 Native file DRIMS No: 1400947213 Page 19 of 175
Uncontrolled when printed. Refer to electronic version for most up to date information.
4. DESCRIPTION OF THE RECEIVING ENVIRONMENT The existing environment characteristics are described in terms of the Operational Area and Zone of Consequence (ZoC). The Operational Area is located within offshore waters approximately 125 km north of Dampier, and the wider ZoC has been identified by hydrocarbon spill modelling of the credible worst case scenario (loss of well containment described in Appendix A).
4.1 Regional Setting The Operational Area is located in Commonwealth waters within the NWS Province, in water depths of approximately 65 to 125 m. The NWS Province is part of the wider North West Marine Region (NWMR) as defined under the Integrated Marine and Coastal Regionalisation of Australia (National Oceans Office and Geoscience Australia 2005). The NWS Province encompasses the continental shelf between North West Cape and Cape Bougainville, and varies in width from approximately 50 km at Exmouth Gulf to greater than 250 km off Cape Leveque and includes water depths of 0–200 m (Department of Sustainability, Environment, Water, Population and Communities (DSEWPaC) 2012a).
4.2 Physical Environment The Operational Area experiences a tropical monsoon climate, with distinct wet (October to April) and dry (May to September) seasons (Pearce et al. 2003). Rainfall in the region typically occurs during the wet season, with highest falls observed during late summer (Bureau of Meteorology (BoM) n.d.) and is often associated with the passage of tropical low pressure systems and cyclones (Pearce et al. 2003). Rainfall outside this period is typically low.
Winds vary seasonally, with a tendency for winds from the south-westerly quadrant during summer months (October–January) and the south-easterly quadrant in winter (April–August). The summer south-westerly winds are driven by high pressure cells that pass from west to east over the Australian continent. During winter months, the relative position of the high pressure cells moves further north, leading to prevailing easterly winds blowing from the mainland (Pearce et al. 2003). Winds typically weaken and are more variable during the transitional period between the summer and winter regimes, typically April and August.
Cyclones are a relatively frequent event in the region, with the Pilbara coast experiencing more cyclonic activity than any other region of the Australian mainland coast (BoM n.d). The cyclone season officially runs from November to April each year, although cyclones also occur outside this period (BoM n.d). Significant storm surge is associated with the passage of a cyclone, which can result in very high tides and coastal flooding (BoM n.d, Pearce et al. 2003).
The large-scale ocean circulation of the NWMR is primarily influenced by the Indonesian Throughflow (Meyers et al. 1995, Potemra et al. 2003), and the Leeuwin Current (Batteen et al. 1992, Godfrey and Ridgway 1985, Holloway and Nye 1985, James et al. 2004, Potemra et al. 2003). Both of these currents are significant drivers of the NWMR ecosystems. The currents are driven by pressure differences between the equator and the higher density cooler and more saline waters of the Southern Ocean, strongly influenced by seasonal change and El Niño and La Niña episodes.
Tides in the NWMR are semi-diurnal and have a pronounced spring-neap cycle, with tidal currents flooding towards the south-east and ebbing towards the north-west (Pearce et al. 2003). The NWMR exhibits a considerable range in tidal height, from microtidal ranges (< 2 m) south-west of Barrow Island to macrotidal (> 6 m) north of Broome (Brewer et al. 2007, Holloway 1983). Storm surges and cyclonic events can also significantly raise sea levels above predicted tidal heights (Pearce et al. 2003).
The Operational Area lies in waters approximately 65 to 125 m deep on the continental shelf. The bathymetry within the Operational Area is generally flat, which is consistent with the broader NWS Province shelf region (Baker et al. 2008). The seabed has a gentle (0.05 °) seaward gradient, extending to a relatively steep outer slope approximately 200 to 300 km offshore in water depths of

Angel Operations Environment Plan Summary
This document is protected by copyright. No part of this document may be reproduced, adapted, transmitted, or stored in any form by any process (electronic or otherwise) without the specific written consent of Woodside. All rights are reserved.
Controlled Ref No: XX Revision: 0 Native file DRIMS No: 1400947213 Page 20 of 175
Uncontrolled when printed. Refer to electronic version for most up to date information.
around 200 m (Dix et al. 2005). The continental slope then descends more rapidly from the shelf edge to depths greater than 1000 m to the north-west (James et al. 2004). Glomar Shoals are a shallow sedimentary bank comprised of coarser biogenic material than the surrounding seabed, and have been defined as a Key Ecological Feature (KEF) within the NWMR. A small portion of the Glomar Shoals KEF overlaps the Operational Area (approximately 0.015% of the Glomar Shoals KEF). The shoals reach to within 26 m of the sea surface, however, within the Operational Area minimum water depth is 65 m and seabed is relatively flat (Falkner et al. 2009). The Glomar Shoals KEF is approximately 2.8 km from the riser platform and 1.47 m from the nearest well. A section of the Ancient Coastline at 125 m Depth Contour KEF also overlaps the Operational Area. Areas of this KEF comprise rocky hard substrate, which may occur within the Operational Area; however, the portion of the KEF that overlaps the Operational Area is predominantly made up of soft sediment. The KEF overlaps the export pipeline section of the Operational Area.
Sediments in the Operational Area are expected to be broadly consistent with those in the NWS Province, and can be inferred from Woodside sampling programs undertaken at Glomar Shoals and the Goodwyn A (GWA) platform (Australian Institute of Marine Science (AIMS) 2014a, BMT Oceanica 2015a). Sediments in the outer NWS Province are relatively homogenous and are typically dominated by sands and a small portion of gravel (Baker et al. 2008). Fine sediment size classes (e.g. muds) increase with proximity to the shoreline and the shelf break, but are less prominent in the intervening continental shelf (Baker et al. 2008). Carbonate sediments typically account for the bulk of sediment composition, with both biogenic and precipitated sediments present on the outer shelf (Dix et al. 2005). Beyond the shelf break, the proportion of fine sediments increases along the continental slope towards the Exmouth Plateau and the abyssal plain (Baker et al. 2008).
The majority of sediments in the Operational Area are expected to be comprised primarily of fine sands, very fine sands and silt, similar to those analysed at Glomar Shoals (which partially overlaps the Operational Area) and GWA, approximately 22 km south-west of the Operational Area (AIMS 2014a, BMT Oceanica 2015a).
4.3 Biological Environment No Critical Habitats or Threatened Ecological Communities as listed under the Environmental Protection and Biodiversity Conservation Act 1999 (EPBC Act) are known to occur within the Operational Area or wider ZoC.
4.3.1 Benthic Communities Sea floor communities in deeper shelf waters receive insufficient light to sustain ecologically sensitive primary producers such as seagrasses, macroalgae or zooxanthellate corals. Given the depth of water in the Operational Area (between approximately 65 and 125 m), these benthic primary producer groups will not occur in the Operational Area but are widespread within the ZoC in relatively shallow waters (typically < 30 m water depth), such as the mainland, offshore islands, reefs and sedimentary banks.
Benthic Communities in the Wider Region Coral reef habitats are an integral part of the marine environment, having a high diversity of corals, associated fish and other species of both commercial and conservation importance. Coral reefs are known to occur within the wider ZoC, but are unlikely to occur within the Operational Area. Notable coral habitat within the wider ZoC includes, but is not limited to (approximate distance and direction from the closest point of the Operational Area in brackets):
• Glomar Shoals (a small portion of this KEF overlaps the Operational Area; the overlapping portion is considered too deep to support significant coral reef communities. Structurally complex biodiverse benthic habitats are mainly found within the north-eastern portion of Glomar Shoals approximately 5.4 km from the Operational Area (AIMS 2014, Wahab 2018).
• Rankin Bank (54 km west)

Angel Operations Environment Plan Summary
This document is protected by copyright. No part of this document may be reproduced, adapted, transmitted, or stored in any form by any process (electronic or otherwise) without the specific written consent of Woodside. All rights are reserved.
Controlled Ref No: XX Revision: 0 Native file DRIMS No: 1400947213 Page 21 of 175
Uncontrolled when printed. Refer to electronic version for most up to date information.
• Montebello Island group (105 km south-west)
• Lowendal Island group (124 km south-west)
• Barrow Island (138 km south-west)
• Ningaloo Coast World Heritage Area (WHA) (incl. Muiron Islands) (284 km south-west).
No seagrass beds or macroalgae occur in the Operational Area, as the seabed depth receives insufficient photosynthetically active radiation (PAR) to support such communities. However, seagrass beds and macroalgae habitats are widespread in shallow waters in the wider ZoC, and are widely distributed in shallow coastal waters that receive sufficient light to support seagrasses and macroalgae. Shark Bay hosts significant seagrass beds, which support a significant population of dugong.
Mangroves provide complex structural habitats that act as nurseries for many marine species as well as nesting and feeding sites for many birds, reptiles and insects (Robertson and Duke 1987). Mangroves also maintain sediment, nutrients and water quality within coastal environments, and reduce coastal erosion. These coastal habitats are not found within the offshore setting of the NWS, nor within or adjacent to the Operational Area. Mangroves are located on offshore islands (Montebello Islands, Barrow Island) and sections of the coastline including large extents of the Pilbara mainland coast, Shark Bay and isolated sections of the Ningaloo Coast.
4.3.2 Pelagic and Demersal Fish Populations The presence of subsea infrastructure associated with the facility has resulted in the development of demersal fish communities that would otherwise not occur in the Operational Area (McLean et al. 2017). Given the continental shelf waters of the Operational Area, pelagic species will also be present. The Ancient Coastline at 125 m Depth Contour KEF overlaps the Operational Area, which includes areas of hard substrate that may support relatively diverse demersal fish assemblages. Glomar Shoals KEF and Rankin Bank (overlapping and 54 km west of the Operational Area respectively) have also been identified as supporting high demersal fish richness and abundance (Wahab et al. 2018). The Continental Slope Demersal Fish Communities is a KEF in the vicinity of the Operational Area (approximately 67 km west at the closest point).
Fish species in the NWMR (including the Operational Area and the ZoC) comprise small and large pelagic and demersal species. Small pelagic fish inhabit a range of marine habitats, including inshore and continental shelf waters. They feed on pelagic phytoplankton and zooplankton, and represent a food source for a wide variety of predators including large pelagic fish, sharks, seabirds and marine mammals (Mackie et al. 2007). Large pelagic fish in the NWMR include commercially targeted species such as mackerel, wahoo, tuna, swordfish and marlin. Large pelagic fish are typically widespread, found mainly in offshore waters (occasionally on the shelf) and often travel extensively.
4.3.3 Plankton Plankton within the Operational Area and ZoC is expected to reflect the conditions of the NWMR. Primary productivity of the NWMR appears to be largely driven by offshore influences (Brewer et al. 2007), with periodic upwelling events and cyclonic influences driving coastal productivity with nutrient recycling and advection. There is a tendency for offshore phytoplankton communities in the NWMR to be characterised by smaller taxa (e.g. bacteria), whereas shelf waters are dominated by larger taxa such as diatoms (Hanson et al. 2007).
Within the wider ZoC, peak primary productivity occurs in late summer/early autumn, along the shelf edge of the Ningaloo Reef. It also links to a larger biologically productive period in the area that includes mass coral spawning events, peaks in zooplankton and fish larvae abundance (Department of Conservation and Land Management 2005), with periodic upwelling throughout the year.
Angel Operations Environment Plan Summary
This document is protected by copyright. No part of this document may be reproduced, adapted, transmitted, or stored in any form by any process (electronic or otherwise) without the specific written consent of Woodside. All rights are reserved.
Controlled Ref No: XX Revision: 0 Native file DRIMS No: 1400947213 Page 22 of 175
Uncontrolled when printed. Refer to electronic version for most up to date information.
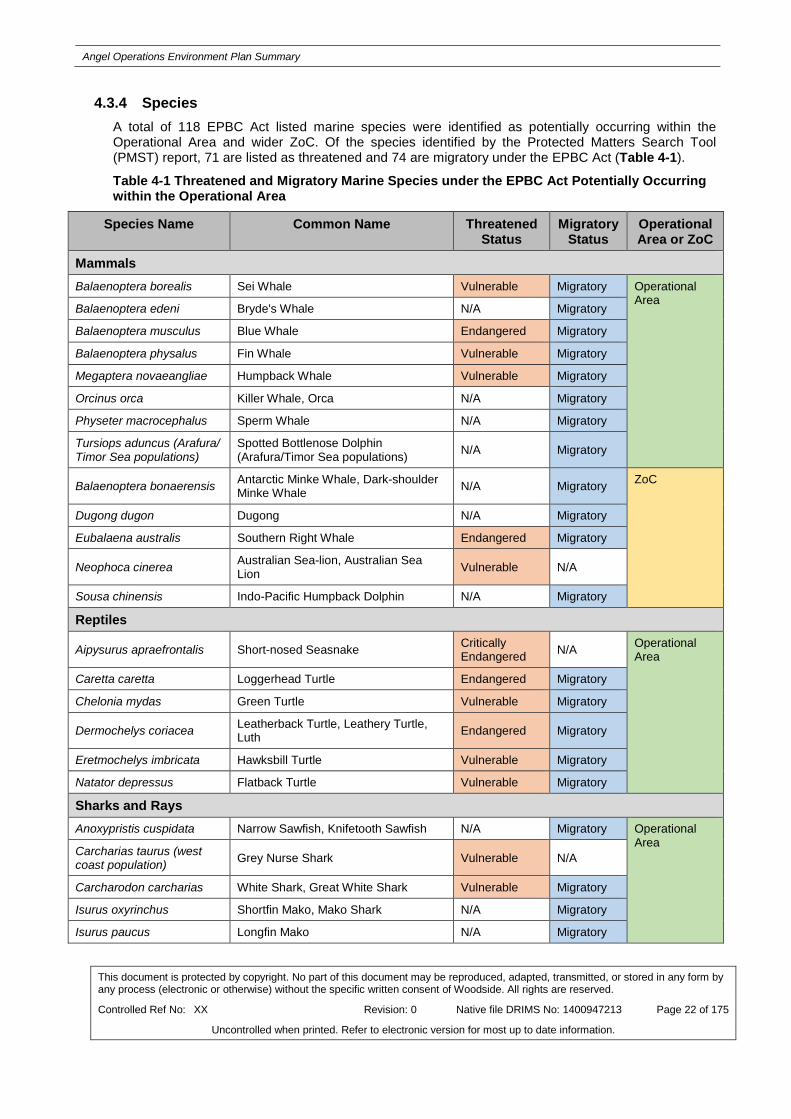
4.3.4 Species A total of 118 EPBC Act listed marine species were identified as potentially occurring within the Operational Area and wider ZoC. Of the species identified by the Protected Matters Search Tool (PMST) report, 71 are listed as threatened and 74 are migratory under the EPBC Act (Table 4-1).
Table 4-1 Threatened and Migratory Marine Species under the EPBC Act Potentially Occurring within the Operational Area
Species Name Common Name Threatened Status
Migratory Status
Operational Area or ZoC
Mammals Balaenoptera borealis Sei Whale Vulnerable Migratory Operational
Area Balaenoptera edeni Bryde's Whale N/A Migratory
Balaenoptera musculus Blue Whale Endangered Migratory
Balaenoptera physalus Fin Whale Vulnerable Migratory
Megaptera novaeangliae Humpback Whale Vulnerable Migratory
Orcinus orca Killer Whale, Orca N/A Migratory
Physeter macrocephalus Sperm Whale N/A Migratory
Tursiops aduncus (Arafura/ Timor Sea populations)
Spotted Bottlenose Dolphin (Arafura/Timor Sea populations) N/A Migratory
Balaenoptera bonaerensis Antarctic Minke Whale, Dark-shoulder Minke Whale N/A Migratory ZoC
Dugong dugon Dugong N/A Migratory
Eubalaena australis Southern Right Whale Endangered Migratory
Neophoca cinerea Australian Sea-lion, Australian Sea Lion Vulnerable N/A
Sousa chinensis Indo-Pacific Humpback Dolphin N/A Migratory
Reptiles
Aipysurus apraefrontalis Short-nosed Seasnake Critically Endangered N/A Operational
Area
Caretta caretta Loggerhead Turtle Endangered Migratory
Chelonia mydas Green Turtle Vulnerable Migratory
Dermochelys coriacea Leatherback Turtle, Leathery Turtle, Luth Endangered Migratory
Eretmochelys imbricata Hawksbill Turtle Vulnerable Migratory
Natator depressus Flatback Turtle Vulnerable Migratory
Sharks and Rays Anoxypristis cuspidata Narrow Sawfish, Knifetooth Sawfish N/A Migratory Operational
Area Carcharias taurus (west coast population) Grey Nurse Shark Vulnerable N/A
Carcharodon carcharias White Shark, Great White Shark Vulnerable Migratory
Isurus oxyrinchus Shortfin Mako, Mako Shark N/A Migratory
Isurus paucus Longfin Mako N/A Migratory

Angel Operations Environment Plan Summary
This document is protected by copyright. No part of this document may be reproduced, adapted, transmitted, or stored in any form by any process (electronic or otherwise) without the specific written consent of Woodside. All rights are reserved.
Controlled Ref No: XX Revision: 0 Native file DRIMS No: 1400947213 Page 23 of 175
Uncontrolled when printed. Refer to electronic version for most up to date information.
Species Name Common Name Threatened Status
Migratory Status
Operational Area or ZoC
Manta alfredi Reef Manta Ray, Coastal Manta Ray, Inshore Manta Ray, Prince Alfred's Ray, Resident Manta Ray
N/A Migratory
Manta birostris Giant Manta Ray, Chevron Manta Ray, Pacific Manta Ray, Pelagic Manta Ray, Oceanic Manta Ray
N/A Migratory
Pristis zijsron Green Sawfish, Dindagubba, Narrowsnout Sawfish Vulnerable Migratory
Rhincodon typus Whale Shark Vulnerable Migratory
Lamna nasus Porbeagle, Mackerel Shark N/A Migratory ZoC
Pristis clavata Dwarf Sawfish, Queensland Sawfish Vulnerable Migratory
Pristis pristis Freshwater Sawfish, Largetooth Sawfish, River Sawfish, Leichhardt's Sawfish, Northern Sawfish
Vulnerable Migratory
Birds Actitis hypoleucos Common Sandpiper N/A Migratory Operational
Area Anous stolidus Common Noddy N/A Migratory
Calidris acuminata Sharp-tailed Sandpiper N/A Migratory
Calidris canutus Red Knot, Knot Endangered Migratory
Calidris melanotos Pectoral Sandpiper N/A Migratory
Calonectris leucomelas Streaked Shearwater N/A Migratory
Fregata ariel Lesser Frigatebird, Least Frigatebird N/A Migratory
Fregata minor Great Frigatebird, Greater Frigatebird N/A Migratory
Numenius madagascariensis Eastern Curlew, Far Eastern Curlew Critically
Endangered Migratory
Pandion haliaetus Osprey N/A Migratory
Anous tenuirostris melanops Australian Lesser Noddy Vulnerable N/A ZoC
Ardenna carneipes Flesh-footed Shearwater, Fleshy-footed Shearwater N/A Migratory
Ardenna pacifica Wedge-tailed Shearwater N/A Migratory
Arenaria interpres Ruddy Turnstone N/A Migratory
Calidris alba Sanderling N/A Migratory
Calidris ferruginea Curlew Sandpiper Critically Endangered Migratory
Calidris ruficollis Red-necked Stint N/A Migratory
Calidris tenuirostris Great Knot Critically Endangered Migratory
Charadrius leschenaultii Greater Sand Plover, Large Sand Plover Vulnerable Migratory
Charadrius veredus Oriental Plover, Oriental Dotterel N/A Migratory

Angel Operations Environment Plan Summary
This document is protected by copyright. No part of this document may be reproduced, adapted, transmitted, or stored in any form by any process (electronic or otherwise) without the specific written consent of Woodside. All rights are reserved.
Controlled Ref No: XX Revision: 0 Native file DRIMS No: 1400947213 Page 24 of 175
Uncontrolled when printed. Refer to electronic version for most up to date information.
Species Name Common Name Threatened Status
Migratory Status
Operational Area or ZoC
Diomedea amsterdamensis Amsterdam Albatross Endangered Migratory
Diomedea epomophora Southern Royal Albatross Vulnerable Migratory
Diomedea exulans Wandering Albatross Vulnerable Migratory
Thalassarche carteri Indian yellow nosed Albatross Vulnerable N/A
Thalassarche impavida Campbell Albatross, Campbell black-browed Albatross Vulnerable N/A
Thalassarche steadi White-capped Albatross Vulnerable N/A
Glareola maldivarum Oriental Pratincole N/A Migratory
Hydroprogne caspia Caspian Tern N/A Migratory
Limosa lapponica Bar-tailed Godwit N/A Migratory
Limosa lapponica baueri Bar-tailed Godwit (baueri), Western Alaskan Bar-tailed Godwit Vulnerable N/A
Limosa lapponica menzbieri
Northern Siberian Bar-tailed Godwit, Bar-tailed Godwit (menzbieri)
Critically Endangered N/A
Limosa limosa Black-tailed Godwit N/A Migratory
Macronectes giganteus Southern Giant-Petrel, Southern Giant Petrel Endangered Migratory
Macronectes halli Northern Giant Petrel Vulnerable Migratory
Numenius phaeopus Whimbrel N/A Migratory
Onychoprion anaethetus Bridled Tern N/A Migratory
Papasula abbotti Abbott's Booby Endangered N/A
Phaethon lepturus White-tailed Tropicbird N/A Migratory
Pluvialis squatarola Grey Plover N/A Migratory
Pterodroma mollis Soft-plumaged Petrel Vulnerable N/A
Rostratula australis Australian Painted Snipe Endangered N/A
Sterna dougallii Roseate Tern N/A Migratory
Sternula albifrons Little Tern N/A Migratory
Sternula nereis nereis Australian Fairy Tern Vulnerable N/A
Sula leucogaster Brown Booby N/A Migratory
Thalassarche cauta cauta Shy Albatross, Tasmanian Shy Albatross Vulnerable Migratory
Thalassarche melanophris Black-browed Albatross Vulnerable Migratory
Thalasseus bergii Crested Tern N/A Migratory
Tringa brevipes Grey-tailed Tattler N/A Migratory
Tringa glareola Wood Sandpiper N/A Migratory
Tringa nebularia Common Greenshank, Greenshank N/A Migratory
Xenus cinereus Terek Sandpiper N/A Migratory

Angel Operations Environment Plan Summary
This document is protected by copyright. No part of this document may be reproduced, adapted, transmitted, or stored in any form by any process (electronic or otherwise) without the specific written consent of Woodside. All rights are reserved.
Controlled Ref No: XX Revision: 0 Native file DRIMS No: 1400947213 Page 25 of 175
Uncontrolled when printed. Refer to electronic version for most up to date information.
Seabirds The Operational Area may be occasionally visited by migratory and oceanic birds, but does not contain any emergent land that could be used as roosting or nesting habitat (and contains no known critical habitats (including feeding) for any species. Several species of birds considered to be Matters of National Environmental Significance (MNES) were identified as potentially occurring within the Operational Area including the common sandpiper, common noddy, sharp-tailed sandpiper, red knot, pectoral sandpiper, lesser frigatebird, great frigatebird, eastern curlew, and osprey.
A Biologically Important Area (BIA) for the migratory wedge-tailed shearwater overlaps the Operational Area, which is related to breeding between mid-August and April in the Pilbara; note the PMST report did not identify wedge-tailed shearwaters within the Operational Area, although the PMST did identify the species may occur in the wider ZoC.
Based on the results of two survey cruises and other unpublished records, Dunlop et al. (1988) recorded the occurrence of 18 species of seabirds over the NWS Province. These included a number of species of petrel, shearwater, tropicbird, frigatebird, booby and tern, as well as the silver gull. Of these, eight species occur year round, and the remaining ten are seasonal visitors. From these surveys, it was noted that seabird distributions in tropical waters were generally patchy, except near islands.
Migratory shorebirds may be present in or fly through the region between July and December and again between March and April as they complete migrations between Australia and offshore locations (Bamford et al. 2008, Commonwealth of Australia 2015c).
Marine Mammals Blue whales were identified as potentially occurring within the Operational Area and wider ZoC. The pygmy blue whale migration BIA off the coast of WA lies approximately 44 km north-west of the Operational Area at the closest point, and lies within the wider ZoC. Based on pygmy blue whale migration timing, the species may occur in the wider ZoC between April and August (north-bound migration) and October to January (south-bound migration). A foraging BIA lies off the Ningaloo Coast (approximately 336 km south-west of the Operational Area at the closest point, but within the wider ZoC), within which pygmy blue whales may feed (Double et al. 2014).
Humpback whales were identified as occurring within the Operational Area and wider ZoC. The species regularly migrates seasonally between feeding grounds in the Southern Ocean and breeding and calving grounds off northern WA, particularly Camden Sound (Jenner et al. 2001). Calving typically occurs at the northern extent of the migration corridor (beyond the wider ZoC). The humpback whale migration BIA and a resting BIA situated in Exmouth Gulf lie approximately 35 km south and 288 km east from the Operational Area at its closest point respectively. Noise loggers deployed near Woodside’s GWA facility (22 km south-west of the Operational Area) detected humpback whales present at the end of September, likely migrating south, and from June to mid-August in deeper water, nearer to the continental shelf, likely migrating north (RPS Environment and Planning 2012). The southward migration of cow/calf pairs is slightly later during October (extending into November and December). During the southbound migration, it is likely that most individuals, particularly cow/calf pairs, stay closer to the coast than the northern migratory path. Humpback whales may occur within the Operational Area and wider ZoC during these migration periods.
There is the potential for seven species of cetaceans, including, Sei whale, Bryde’s whale, Fin whale, Sperm whale, Antarctic Minke whale, Killer whale, Spotted Bottlenose dolphin and Indo-pacific humpback dolphin to infrequently transit the Operational Area.
The dugong may be present in the wider ZoC, although was not identified as occurring within the Operational Area. Dugong distribution is correlated with seagrass habitats in which dugong feed, although water temperature has also been correlated with dugong movements and distribution (Preen et al. 1997, Preen 2004). Dugongs are known to migrate between seagrass habitats (hundreds of kilometres) (Sheppard et al. 2006). However, given the Operational Area is located offshore in deep water which does not support seagrass habitat and does not contain any critical dugong habitat, the

Angel Operations Environment Plan Summary
This document is protected by copyright. No part of this document may be reproduced, adapted, transmitted, or stored in any form by any process (electronic or otherwise) without the specific written consent of Woodside. All rights are reserved.
Controlled Ref No: XX Revision: 0 Native file DRIMS No: 1400947213 Page 26 of 175
Uncontrolled when printed. Refer to electronic version for most up to date information.
occurrence of dugongs in the area is considered very unlikely. Dugongs may occur along the Ningaloo Coast and around islands of the Pilbara Coast, within the wider ZoC. Several dugong BIAs for breeding, calving, foraging and nursing lies within the wider ZoC, approximately 284 km from the Operational Area at its closest point.
Australian sea lions are unlikely to occur in the Operational Area, although were identified as potentially occurring in the wider ZoC. The nearest known significant colony is situated at the Abrolhos Islands, which lie beyond the wider ZoC.
Marine Reptiles Five of the six marine turtle species recorded for the NWMR have the potential to occur within the Operational Area; the loggerhead turtle, green turtle, leatherback turtle, hawksbill turtle and the flatback turtle. Four of the turtle species (green, loggerhead, flatback and hawksbill) have significant nesting rookeries on beaches along the mainland coast and islands in the wider ZoC. No turtle critical habitats1 overlap the Operational Area, and a number of BIAs/critical habitats2 have been identified in the wider ZoC, including:
• Green turtle: Internesting, nesting, mating, foraging, aggregation and basking BIAs (the nearest of which is approximately 74 km from the Operational Area at the closest point);
• Hawksbill turtle: Internesting, nesting, foraging and mating BIAs (the nearest of which is approximately 74 km from the Operational Area at the closest point);
• Flatback turtle: Internesting, nesting, foraging, mating and aggregation BIAs (the nearest of which is approximately 17 km from the Operational Area at the closest point); and
• Loggerhead turtle: Internesting and nesting BIAs (the nearest of which is approximately 74 km from the Operational Area at the closest point).
Eighteen species of sea snakes were identified as potentially occurring within the wider ZoC. One of these species, the short-nosed sea snake, is listed as Critically Endangered and identified as potentially occurring within the Operational Area. This species has primarily been recorded on the Sahul Shelf at Ashmore Reef and Hibernia Reef. Given the water depth of the Operational Area, sea snake sightings will be infrequent and likely comprise few individuals within the Operational Area.
Sharks, Rays and Fishes The whale shark was identified as potentially occurring within the Operational Area. Whale sharks aggregate annually to feed in the waters of the Ningaloo Coast (this feeding BIA lies approximately 328 km south-west of the Operational Area, within the wider ZoC) from March to July, with the largest numbers recorded in April and May (Sleeman et al. 2010). However, seasonal aggregation can be variable, with individual whale sharks recorded at other times of the year. The population (comprised of individuals that visit the reef at some point during their lifetime) has been estimated to range between 300 and 500 individuals; the number visiting Ningaloo Reef in any given year is expected to be somewhat smaller (Meekan et al. 2006). Timing of the whale shark migration to and from Ningaloo coincides with the coral mass spawning period, when there is an abundance of food (krill, planktonic larvae and schools of small fish) in the waters adjacent to Ningaloo Reef. At Ningaloo Reef, whale sharks stay within a few kilometres of the shore and in waters approximately 30–50 m deep (Wilson et al. 2006).
Several shark/ray species including the great white shark, shortfin mako, longfin mako, giant manta ray, grey nurse shark, green sawfish, porbeagle shark, dwarf sawfish, freshwater sawfish, reef manta ray and narrow sawfish may be present within the Operational Area, for short durations when individuals transit the area.
1 Critical habitat identified in the Recovery Plan for Marine Turtles in Australia 2017–2027 (Commonwealth of Australia 2017)
Angel Operations Environment Plan Summary
This document is protected by copyright. No part of this document may be reproduced, adapted, transmitted, or stored in any form by any process (electronic or otherwise) without the specific written consent of Woodside. All rights are reserved.
Controlled Ref No: XX Revision: 0 Native file DRIMS No: 1400947213 Page 27 of 175
Uncontrolled when printed. Refer to electronic version for most up to date information.
Of the fish species identified as potentially occurring within the Operational Area, 57 are species of pipefish and seahorse. However, bycatch data indicates they are uncommon in deeper continental shelf waters (50–200 m) and therefore, are unlikely to occur within the Operational Area. Within the wider ZoC, seahorses and pipefish may be encountered in a wide variety of shallow habitats, including seagrass meadows, reefs and sandy substrates.
4.4 Socio-Economic and Cultural There are no known sites of Indigenous or European cultural heritage significance within the vicinity of the Operational Area.
A search of the National Shipwreck Database indicated that there are no known shipwrecks recorded within the Operational Area. There are three shipwrecks within 100 km of the Operational Area recorded in the National Shipwreck Database, the nearest are the McDermott Derrick Barge No 20 and the McCormack, both lie approximately 62 km from the Operational Area at the closest point.
There are no heritage listed sites within the Operational Area; however, there are a number of gazetted and proposed National and Commonwealth heritage places in the wider ZoC, including the Ningaloo Coast World Heritage Area, Shark Bay World Heritage Area, Barrow Island and the Montebello-Barrow Islands Marine Conservation Reserves Nominated Heritage Place, Dampier Archipelago (including Burrup Peninsula) Indigenous Heritage Place, the Ningaloo Coast Natural Heritage Place, Shark Bay, Western Australia Natural Heritage Place, the Dirk Hartog Landing Site 1616 - Cape Inscription Area Historic Heritage Place, and Ningaloo Marine Area (Commonwealth Waters) Commonwealth Heritage Place,
No Ramsar wetlands overlap the Operational Area or wider ZoC.
A number of Commonwealth and State fisheries are located within the Operational Area and/or wider ZoC including the following:
• Mackerel Managed Fishery;
• Marine Aquarium Fish managed Fishery;
• Onslow Prawn managed Fishery;
• Pearl Oyster Managed Fishery
• Pilbara Demersal Scalefish Fishery;
• North West Slope trawl Fishery;
• Western Deepwater Trawl Fishery
• Southern Bluefin Tuna Fishery;
• South West Coast Salmon Managed Fishery
• Specimen Shell Fishery;
• West Coast Deep Sea Crustacean Managed Fishery;
• Western Abalone Fishery;
• Western Skipjack Tuna Fishery; and
• Western Tuna and Billfish Fishery.
State fisheries designated management areas within the Operational Area or ZoC include the following:
• Albrolhos Islands and Mid-West Trawl Managed Fishery;
• Broome Prawn Managed Fishery;

Angel Operations Environment Plan Summary
This document is protected by copyright. No part of this document may be reproduced, adapted, transmitted, or stored in any form by any process (electronic or otherwise) without the specific written consent of Woodside. All rights are reserved.
Controlled Ref No: XX Revision: 0 Native file DRIMS No: 1400947213 Page 28 of 175
Uncontrolled when printed. Refer to electronic version for most up to date information.
• Exmouth Gulf Managed Prawn Fishery;
• Gascoyne Demersal Scalefish Managed Fishery;
• Nickol Bay Prawn Managed Fishery;
• Northern Demersal Scalefish Managed Fishery;
• Shark Bay Scallop Managed Fishery;
• Shark Bay Prawn Managed Fishery;
• Shark Bay Crab Managed Fishery;
• Shark Bay Beach Seine and Mesh Net Managed Fishery;
• West Coast Demersal Gillnet and Demersal Longline (Interim) Managed Fishery;
• West Coat Demersal Scalefish Interim Managed Fishery; and
• West Coast Rock Lobster Fishery.
There are no aquaculture operations within or adjacent to the Operational Area as these operations are typically restricted to shallow coastal waters.
There are no traditional or customary fisheries within the Operational Area, as these are typically restricted to shallow coastal waters and/or areas with structure such as reef. However, it is recognised that Barrow Island, Montebello Islands and Ningaloo Reef, all within the wider ZoC, have a known history of fishing when areas were occupied (as from historical records).
Tourism and Recreation No tourist activities take place specifically within the Operational Area; however, it is acknowledged that there are growing tourism and recreational sectors in WA which have expanded over the last couple of decades. Growth and the potential for further expansion in tourism and recreational activities is recognised for the Pilbara and Gascoyne regions, with the development of regional centres and a workforce associated with the resources sector (SGS Economics & Planning 2012).
Tourism is one of the major industries of the Gascoyne region and contributes significantly to the local economy in terms of both income and employment. The main marine nature-based tourist activities are concentrated around and within the Ningaloo World Heritage Area (approximately 284 km south-west of the Operational Area) and North West Cape area, including recreational fishing, snorkelling and scuba diving, whale shark (April to August) and manta ray (year round) encounters, whale watching (July to October), whale encounters (August and November) and turtle watching (all year round) (Schianetz et al. 2009). The Dampier Archipelago and Montebello Islands, approximately 94 km and 105 km from the Operational Area respectively, are the closest locations for tourism, with some charter boat operators taking visitors to these islands (Department of Environment and Conservation 2007).
Shipping The NWMR supports significant commercial shipping activity, the majority of which is associated with the mining and oil and gas industries. The Australian Maritime Safety Authority (AMSA) has introduced a network of marine fairways across the NWMR of WA to reduce the risk of vessel collisions with offshore infrastructure. The fairways are not mandatory but AMSA strongly recommends commercial vessels remain within the fairway when transiting the region. It is noted that none of these fairways intersect with the Operational Area; the nearest fairway is approximately 24 km east of the Operational Area at the closest point. Vessel tracking data suggests shipping within the fairway is concentrated to the east of the Operational Area (Figure 4-1).

Angel Operations Environment Plan Summary
This document is protected by copyright. No part of this document may be reproduced, adapted, transmitted, or stored in any form by any process (electronic or otherwise) without the specific written consent of Woodside. All rights are reserved.
Controlled Ref No: XX Revision: 0 Native file DRIMS No: 1400947213 Page 29 of 175
Uncontrolled when printed. Refer to electronic version for most up to date information.
Figure 4-1: Vessel density map in the vicinity of Operational Area from 2016, derived from AMSA satellite tracking system data (vessels include cargo, LNG tanker, ore carriers passenger vessels, support vessels and other vessels)
Oil and Gas Infrastructure The Operational Area is located within an area of established oil and gas operations in the broader NWMR. Several facilities are located in proximity to the Operational Area. Several FPSOs and platforms are currently in operation in the vicinity of the Operational Area.
Defence There are designated defence practice areas in the offshore marine waters off Ningaloo and the North West Cape, beyond the Operational Area. A Royal Australian Air Force base located at Learmonth, on North West Cape, lies approximately 370 km south-west of the Operational Area.
4.5 Values and Sensitivities The offshore environment of the NWMR contains environmental assets (such as habitat and species) of high value or sensitivity including Commonwealth offshore waters, as well as the wider regional context including coastal waters and habitats such as the Montebello/Barrow/Lowendal Island Group and the Ningaloo World Heritage Area, and the associated resident, temporary or migratory marine life including species such as marine mammals, turtles and birds.
Many sensitive receptor locations are protected as part of Commonwealth and State managed areas, and have been allocated conservation objectives (International Union for Conservation of Nature (IUCN) Protected Area Category) based on the Australian IUCN reserve management principles in Schedule 8 of the EPBC Regulations 2000. These principles determine what activities are acceptable
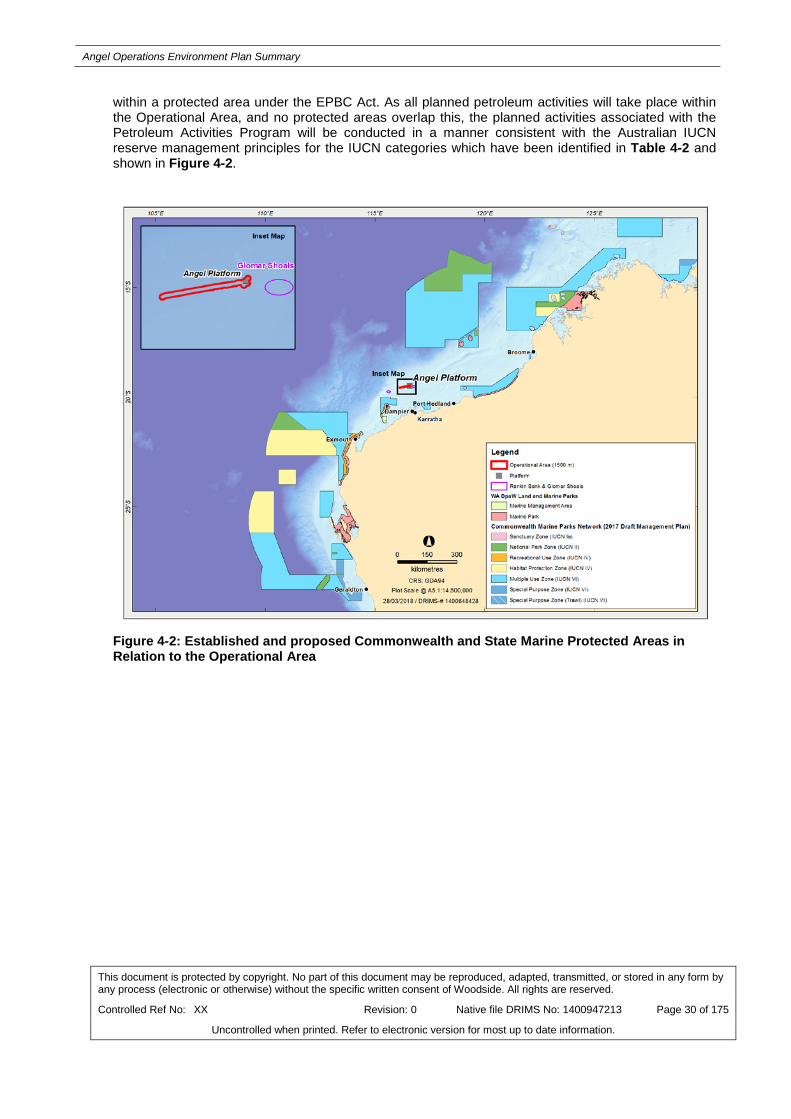
Angel Operations Environment Plan Summary
This document is protected by copyright. No part of this document may be reproduced, adapted, transmitted, or stored in any form by any process (electronic or otherwise) without the specific written consent of Woodside. All rights are reserved.
Controlled Ref No: XX Revision: 0 Native file DRIMS No: 1400947213 Page 30 of 175
Uncontrolled when printed. Refer to electronic version for most up to date information.
within a protected area under the EPBC Act. As all planned petroleum activities will take place within the Operational Area, and no protected areas overlap this, the planned activities associated with the Petroleum Activities Program will be conducted in a manner consistent with the Australian IUCN reserve management principles for the IUCN categories which have been identified in Table 4-2 and shown in Figure 4-2.
Figure 4-2: Established and proposed Commonwealth and State Marine Protected Areas in Relation to the Operational Area

Angel Operations Environment Plan Summary
This document is protected by copyright. No part of this document may be reproduced, adapted, transmitted, or stored in any form by any process (electronic or otherwise) without the specific written consent of Woodside. All rights are reserved.
Controlled Ref No: XX Revision: 0 Native file DRIMS No: 1400947213 Page 31 of 175
Uncontrolled when printed. Refer to electronic version for most up to date information.
Table 4-2: Summary of Established and Proposed Marine Protected Areas (MPAs) and Other Sensitive Locations in the Region Relating to the Operational Area
Distance from
Operational Area to Values/Sensitivity boundaries (km)
UCN Protected Area Category*
Australian Marine Parks (AMP) (formerly Commonwealth Marine Reserves)
Montebello† 55 VI
Dampier† 88 II, IV
Argo-Rowley Terrace† 190 II, VI
Eighty Mile Beach† 239 VI
Gascoyne† 277 II, IV, VI
Ningaloo† 303 IV
Shark Bay† 607 VI
Abrolhos‡ 834 II, VI
State Marine Parks and Nature Reserves Marine Parks
Montebello Islands 99 IA, II, IV, VI
Barrow Island 119 IA, IV, VI
Ningaloo 304 IA, II, IV
Rowley Shoals 309 II
Shark Bay 691 IA, II
Marine Management Areas
Barrow Island 119 IA, IV, VI
Muiron Islands 284 IA, VI
Fish Habitat Protection Areas
Point Quobba 610 IV
Abrolhos Island 991 IV
Heritage World Heritage Areas
The Ningaloo Coast 284 Not applicable
Shark Bay, Western Australia 637 Not applicable
National Heritage Areas
Dampier Archipelago (including Burrup Peninsula) 95 Not applicable
Barrow Island and the Montebello-Barrow Islands Marine Conservation Reserves 99 Not applicable

Angel Operations Environment Plan Summary
This document is protected by copyright. No part of this document may be reproduced, adapted, transmitted, or stored in any form by any process (electronic or otherwise) without the specific written consent of Woodside. All rights are reserved.
Controlled Ref No: XX Revision: 0 Native file DRIMS No: 1400947213 Page 32 of 175
Uncontrolled when printed. Refer to electronic version for most up to date information.
Distance from Operational Area to Values/Sensitivity boundaries (km)
UCN Protected Area Category*
The Ningaloo Coast 284 Not applicable
Shark Bay, Western Australia 637 Not applicable
Dirk Hartog Landing Site 1616 – Cape Inscription Area 727 Not applicable
Commonwealth Heritage Areas
Ningaloo Marine Area - Commonwealth Waters 303 Not applicable
Key Ecological Features
Glomar Shoals Overlaps Operational Area Not applicable
Ancient coastline at 125 m depth contour Overlaps Operational Area Not applicable
Continental Slope Demersal Fish Communities 67 Not applicable
Exmouth Plateau 180 Not applicable
Canyons linking the Cuvier Abyssal Plain and the Cape Range Peninsula 257 Not applicable
Mermaid Reef and Commonwealth waters surrounding Rowley Shoals 300 Not applicable
Commonwealth waters adjacent to Ningaloo Reef 303 Not applicable
Western demersal slope and associated fish communities 767 Not applicable
Western rock lobster 937 Not applicable
Ancient coastline at 90-120m depth 940 Not applicable
Commonwealth marine environment surrounding the Houtman Abrolhos Islands 974 Not applicable

Angel Operations Environment Plan Summary
This document is protected by copyright. No part of this document may be reproduced, adapted, transmitted, or stored in any form by any process (electronic or otherwise) without the specific written consent of Woodside. All rights are reserved.
Controlled Ref No: XX Revision: 0 Native file DRIMS No: 1400947213 Page 33 of 175
Uncontrolled when printed. Refer to electronic version for most up to date information.
5. ENVIRONMENTAL IMPACTS AND RISKS
5.1 Risk and Impact Identification and Evaluation Woodside undertook an environmental risk assessment (with outputs applicable to the EP provided in Appendix A) to identify the potential environmental impacts and risks associated with the operation of the facility and the control measures to manage the identified environmental impacts and risks to as low as reasonably practicable (ALARP) and an acceptable level. This risk assessment and evaluation was undertaken using Woodside’s Risk Management Framework.
Environmental impacts and risks include those directly and indirectly associated with the Petroleum Activities Program, and includes potential emergency and accidental events. Planned activities have the potential for inherent environmental impacts. An environmental risk is an unplanned event with the potential for impact (termed risk ‘consequence’).
Herein, potential impact from planned activities are termed ‘impacts’, and ‘risks’ are associated with unplanned events with the potential for impact (should the risk be realised), with such impact termed potential ’consequence’.
The key steps of Woodside’s Risk Management Processes are shown in Figure 5-1. A summary of each step and how it is applied to the proposed Program is provided below.
Figure 5-1: Key steps in Woodside’s Risk Management Process

Angel Operations Environment Plan Summary
This document is protected by copyright. No part of this document may be reproduced, adapted, transmitted, or stored in any form by any process (electronic or otherwise) without the specific written consent of Woodside. All rights are reserved.
Controlled Ref No: XX Revision: 0 Native file DRIMS No: 1400947213 Page 34 of 175
Uncontrolled when printed. Refer to electronic version for most up to date information.
5.1.1 Establish the Context The objective of a risk assessment is to assess identified risks and apply appropriate control measures to eliminate, control or mitigate the risk to ALARP and to determine if the risk is acceptable.
Hazard identification workshops aligned with NOPSEMA’s Hazard Identification Guidance Note were undertaken by multidisciplinary teams made up of relevant personnel with sufficient breadth of knowledge, training and experience to reasonably assure that risks and associated impacts were identified and assessed.
5.1.2 Impact and Risk Identification An Environmental Hazard Identification (ENVID) was undertaken by multidisciplinary teams consisting of relevant engineering and environmental personnel with sufficient breadth of knowledge, training and experience to reasonably assure that risks were identified and their potential environmental impacts assessed.
Impacts and risks were identified during the ENVID for both planned (routine and non-routine) activities and unplanned (accidents/incidents/emergency conditions) events.
5.1.3 Risk Analysis Risk analysis further develops the understanding of a risk by defining the impacts and assessing appropriate controls. Risk analysis considered previous risk assessments for similar activities, review of relevant studies, review of past performance, external stakeholder consultation feedback and review of the existing environment.
The following key steps were undertaken for each identified risk during the risk assessment:
• Identification of decision type in accordance with the decision support framework;
• Identification of appropriate control measures (preventative and mitigation) aligned with the decision type; and
• Assessment of the risk rating.
5.1.3.1 Decision Support Framework To support the risk assessment process and Woodside’s determination of acceptability, Woodside’s HSE risk management procedures include the use of decision support framework based on principles set out in the Guidance on Risk Related Decision Making (Oil and Gas UK 2014). This concept has been applied during the ENVID or equivalent preceding processes during historical design decisions to determine the level of supporting evidence that may be required to draw sound conclusions regarding risk level and whether the risk or impacts is acceptable and ALARP. This is to confirm:
• Activities do not pose an unacceptable environmental risk;
• Appropriate focus is placed on activities where the impact or risk is anticipated to be acceptable and demonstrated to be ALARP; and
• Appropriate effort is applied to the management of risks and impacts based on the uncertainty of the risk, the complexity and risk rating (i.e. potential higher order environmental impacts are subject to further evaluation assessment).
The framework provides appropriate tools, commensurate to the level of uncertainty or novelty (referred to as the decision type A, B or C). The decision type is selected based on an informed discussion around the uncertainty and documented in ENVID worksheets.
This framework enables Woodside to appropriately understand a risk, determine if the risk or impact is acceptable and can be demonstrated to be ALARP.
Decision Type A
Angel Operations Environment Plan Summary
This document is protected by copyright. No part of this document may be reproduced, adapted, transmitted, or stored in any form by any process (electronic or otherwise) without the specific written consent of Woodside. All rights are reserved.
Controlled Ref No: XX Revision: 0 Native file DRIMS No: 1400947213 Page 35 of 175
Uncontrolled when printed. Refer to electronic version for most up to date information.
Decision Type A are well understood and established practice, they generally consider recognised good industry practice which is often embodied in legislation, codes and standards and use professional judgment.
Decision Type B
Decision Type B typically involves greater uncertainty and complexity (and can include potential higher order impacts/risks). These risks may deviate from established practice or have some lifecycle implications and therefore require further engineering risk assessment in order to support the decision and ensure that the risk is ALARP. Engineering risk assessment tools may include:
• Risk-based tools such as cost based analysis or modelling;
• Consequence modelling;
• Reliability analysis; and
• Company values.
Decision Type C
Decision Type C typically has significant risks related to environmental performance. Such risks typically involve greater complexity and uncertainty, therefore requiring adoption of the precautionary approach. The risks may result in significant environmental impact; significant project risk/exposure or may elicit negative stakeholder concerns. For these risks or impacts, in addition to Decision Type A and B tools, company and societal values need to be considered by undertaking broader internal and external stakeholder consultation as part of the risk assessment process.
5.1.3.2 Identification of Control Measures Woodside applies a hierarchy of control measures when considering Good Practice and Professional Judgement. The hierarchy of control is applied in order of importance as follows; elimination, substitution, engineering control measures, administrative control measures and mitigation of consequences/impacts.
5.1.3.3 Risk Rating Process The current risk rating process is undertaken to assign a level of risk to each impact measured in terms of consequence and likelihood. The assigned risk level is the current risk (i.e. risk with controls in place) and is therefore determined following the identification of the decision type and appropriate control measures.
The risk rating process considers the environmental impacts and where applicable, the social and cultural impacts of the risk. The risk ratings are assigned using the Woodside Risk Matrix (refer to Figure 5-2).
The risk rating process is performed using the following steps:
Select the Consequence Level Determine the most credible impacts associated with the selected event assuming all controls (prevention and mitigation) are absent or have failed (refer to Table 5-1). Where more than one potential consequence applies, the highest severity consequence is selected.

Angel Operations Environment Plan Summary
This document is protected by copyright. No part of this document may be reproduced, adapted, transmitted, or stored in any form by any process (electronic or otherwise) without the specific written consent of Woodside. All rights are reserved.
Controlled Ref No: XX Revision: 0 Native file DRIMS No: 1400947213 Page 36 of 175
Uncontrolled when printed. Refer to electronic version for most up to date information.
Table 5-1: Woodside Risk Matrix (Environment and Social and Cultural) Consequence Descriptions
Environment Social & Cultural Consequence Level
Catastrophic, long-term impact (> 50 years) on highly valued ecosystems, species, habitat or physical or biological attributes
Catastrophic, long-term impact (>20 years) to a community, social infrastructure or highly valued areas/items of international cultural significance
A
Major, long term impact (10-50 years) on highly valued ecosystems, species, habitat or physical or biological attributes
Major, long-term impact (5-20 years) to a community, social infrastructure or highly valued areas/items of national cultural significance
B
Moderate, medium-term impact (2-10 years) on ecosystems, species, habitat or physical or biological attributes
Moderate, medium term Impact (2-5 years) to a community, social infrastructure or highly valued areas/items of national cultural significance
C
Minor, short-term impact (1-2 years) on species, habitat (but not affecting ecosystems function), physical or biological attributes
Minor, short-term impact (1-2 years) to a community or highly valued areas/items of cultural significance D
Slight, short-term impact (<1 year) on species, habitat (but not affecting ecosystems function), physical or biological attributes
Slight, short-term impact (<1 year) to a community or areas/items of cultural significance E
No lasting effect (<1 month). Localised impact not significant to environmental receptors
No lasting effect (<1 month). Localised impact not significant to areas/items of cultural significance F
Select the Likelihood Level Select the likelihood level from the description that best fits the chance of the selected consequence actually occurring, assuming reasonable effectiveness of the prevention and mitigation controls (refer to Table 5-2).
Table 5-2: Woodside Risk Matrix Likelihood Levels
Likelihood Description
Frequency 1 in 100,000 – 1,000,000 years
1 in 10,000 – 100,000 years
1 in 1,000 – 10,000 years
1 in 100 – 1,000 years 1 in 10-100 years >1 in 10 years
Experience Remote: Unheard of in the industry
Highly Unlikely: Has occurred once or twice in the industry
Unlikely: Has occurred many times in the industry but not at Woodside
Possible: Has occurred once or twice in Woodside or may possibly occur
Likely: Has occurred frequently at Woodside or is likely to occur
Highly Likely: Has occurred frequently at the location or is expected to occur
Likelihood Level 0 1 2 3 4 5
Calculate the Risk Rating A likelihood and risk rating is only applied to environmental risks using the Woodside Risk Matrix. This risk level is used as an input into the risk evaluation process and ultimately for the prioritisation of further risk reduction measures. Once each risk is treated to ALARP, the risk rating articulates the ALARP baseline risk as an output of the ENVID studies.

Angel Operations Environment Plan Summary
This document is protected by copyright. No part of this document may be reproduced, adapted, transmitted, or stored in any form by any process (electronic or otherwise) without the specific written consent of Woodside. All rights are reserved.
Controlled Ref No: XX Revision: 0 Native file DRIMS No: 1400947213 Page 37 of 175
Uncontrolled when printed. Refer to electronic version for most up to date information.
Figure 5-2: Woodside Risk Matrix: Risk Level The risk analysis and evaluation for the Petroleum Activities Program indicate that all of the current environmental risks and impacts associated with the activity are reduced to ALARP and are of an acceptable level (refer to Figure 5-2)
5.2 Classification and Analysis of Major Environment Events For Woodside’s offshore production facilities, a further level of analysis is undertaken to identify, classify and analyse Major Environment Events (MEEs). This extra level of rigour is applied to ensure sufficient controls are in place for risks with potential Major and above consequences. In the health and safety area Major Accident Events (MAE) are identified using a similar process which supports consistency in management of key risks within Woodside in accordance with Process Safety Risk Management Procedures.
MEEs are defined by Woodside as:
• An event with potential environment, reputation (pertaining to environment events), social or cultural consequences of category B or higher as per Woodside Risk Matrix (Figure 5-2), which are evaluated against credible worst case scenarios which may occur when all controls are absent or have failed.
5.2.1 MEE Identification The ENVID and risk rating process results in the generation of numerous sources of risk with differing consequence levels. Not all of these risks meet the MEE definition and are therefore screened out at this stage of the MEE process.
Although these risks are screened out, all risks identified in this EP (including MEEs), are evaluated for ALARP and acceptability using the methodology described in Section 5.3.
5.2.2 MEE Classification A standard naming convention has been established for MEEs; this is based around ensuring the MEE titles reflect the cause of the event e.g. ‘subsea system loss of containment’, rather than the event itself e.g. significant hydrocarbon spill to the marine environment. The MEEs are assigned a unique identification code e.g. MEE-01, MEE-02 etc.
5.2.3 Safety and Environment Critical Elements (SCE) and Performance Standards Woodside identifies and manages Safety Critical Elements (SCE) technical performance standards and management system performance standards (MSPS) in accordance with Process Safety Management Procedures, Risk Management Procedure, and Change Management Procedures.
Angel Operations Environment Plan Summary
This document is protected by copyright. No part of this document may be reproduced, adapted, transmitted, or stored in any form by any process (electronic or otherwise) without the specific written consent of Woodside. All rights are reserved.
Controlled Ref No: XX Revision: 0 Native file DRIMS No: 1400947213 Page 38 of 175
Uncontrolled when printed. Refer to electronic version for most up to date information.
SCEs are identified for MAE and MEEs. An SCE is a hardware control, the failure of which could cause or contribute substantially to, or the purpose of which is to prevent or limit the effect of a MAE, MEE or Process Safety Event. In addition, Woodside defines Safety and Environment Critical Equipment (SCE) as an item of equipment or structure forming part of a hardware SCE that supports the SCE in achieving the safety function2.
Once each SCE is selected, technical performance requirements are developed in accordance with Safety and Environment Critical Element (SCE) Management Procedure which form the SCE technical Performance Standards. These standards are a statement of the performance required of a SCE (e.g. functionality, availability, reliability, survivability), which is used as the basis for establishing agreed assurance tasks for each SCE and therefore support the management of operations within acceptable safety and/or environment risks levels, and ensure continuous management of risk to ALARP. An assurance task is an activity carried out by the operator to confirm that the SCE meets, or will meet its SCE Performance Standard. Examples of assurance tasks include inspection routines, test routines, instrumentation calibration and reliability monitoring.
SCE technical Performance Standards are not inherently aligned directly to Environment Performance Standards (EPS), and are used in conjunction with Woodside’s management system to identify and treat potential step-outs from expected controls performance or integrity envelopes, and ensure SCE performance can be optimised. Woodside’s HSE Event Reporting Guideline describes the identification of ‘Damage to SCEs’ which is an SCE failure presenting a risk level which requires that Immediate Control Actions must be put in place to manage increased current risk. For applicable SCEs, ‘Damage to SCE’ failures represent scenarios which may fail to achieve an EPS presented in this EP.
Safety Critical Management System Barriers For each MEE, Safety Critical Management System specific measures are also identified. These are management system components (generally Woodside Management System (WMS) processes) that are key barriers in the management of MEEs.
5.3 Impact and Risk Evaluation Environmental impacts and risks, as opposed to safety risks, cover a wider range of issues, differing species, persistence, reversibility, resilience, cumulative effects and variability in severity. Determining the degree of environmental risk and the corresponding threshold for whether a risk/impact has been reduced to ALARP and is acceptable is evaluated to a level appropriate to the nature and scale of each impact or risk. Evaluation includes consideration of the following evaluation criteria:
• The Decision Type;
• Principles of Ecologically Sustainable Development as defined under the EPBC Act;
• Internal context - the proposed controls and risk level are consistent with Woodside policies, procedures and standards;
• External context – consideration of the environment consequence and stakeholder acceptability; and
• Other requirements – the proposed controls and risk level are consistent with national and international industry standards, laws and policies.
In accordance with Regulation 10A(a), 10A(b) and 10A(c), and 13(5)(b) of the Environmental Regulations, Woodside applies the following process to demonstrate ALARP and acceptability for environmental impacts and risks appropriate to the nature and scale of each impact or risk.
2 Note: not all individual equipment items which make up SCE are safety critical.

Angel Operations Environment Plan Summary
This document is protected by copyright. No part of this document may be reproduced, adapted, transmitted, or stored in any form by any process (electronic or otherwise) without the specific written consent of Woodside. All rights are reserved.
Controlled Ref No: XX Revision: 0 Native file DRIMS No: 1400947213 Page 39 of 175
Uncontrolled when printed. Refer to electronic version for most up to date information.
5.3.1 Demonstration of ALARP Descriptions have been provided below (Table 5-3) to articulate how Woodside demonstrates different risks, impacts and Decision Types identified within the EP are ALARP.
Table 5-3: Summary of Woodside’s Criteria for ALARP Demonstration
Risk Impact Decision Type
Low and Moderate Negligible, Slight or Minor (D, E or F)
A
Woodside demonstrates these Risks, Impacts and Decision Types are reduced to ALARP: • If controls identified meet legislative requirements, industry codes and standards, applicable
company requirements and industry guidelines. • Further effort towards impact/risk reduction (beyond employing opportunistic measures) is not
reasonably practicable without sacrifices grossly disproportionate to the benefit gained.
High, Very High or Severe Moderate and above (A, B, or C) B and C
Woodside demonstrates these higher order Risks, Impacts and Decision Types are reduced to ALARP (where it can be demonstrated using good industry practice and risk based analysis) that;
• Legislative requirements, applicable company requirements and industry codes and standards are met;
• Societal concerns are accounted for; and • The alternative control measures are grossly disproportionate to the benefit gained.
5.3.2 Demonstration of Acceptability Descriptions have been provided below (Table 5-4) to articulate how Woodside demonstrates how different risks, impacts and Decision Types identified within the EP are Acceptable.
Table 5-4: Summary of Woodside’s Criteria for Acceptability
Risk Impact Decision Type Low and Moderate (below C level consequence)
Negligible, Slight or Minor A
Woodside demonstrates these Risks, Impacts and Decision Types are 'Broadly Acceptable', if they meet legislative requirements, industry codes and standards, applicable company requirements and industry guidelines. Further effort towards risk reduction (beyond employing opportunistic measures) is not reasonably practicable without sacrifices grossly disproportionate to the benefit gained.
High, Very High or Severe (C+ consequence risks)
Moderate and above B and C
Woodside demonstrates these higher order Risks, Impacts and Decision are ‘Acceptable if ALARP’ can be demonstrated using good industry practice and risk based analysis, if legislative requirements are met and societal concerns are accounted for and the alternative control measures are grossly disproportionate to the benefit gained. In undertaking this process for moderate and high current risks, Woodside evaluates the following criteria:
• Principles of Ecological Sustainable Development (ESD) as defined under the EPBC Act; • Internal context - the proposed controls and consequence/ risk level are consistent with Woodside
policies, procedures and standards; • External context – consideration of the environment consequence and stakeholder acceptability; and • Other requirements – the proposed controls and consequence/ risk level are consistent with national
and international industry standards, laws and policies.
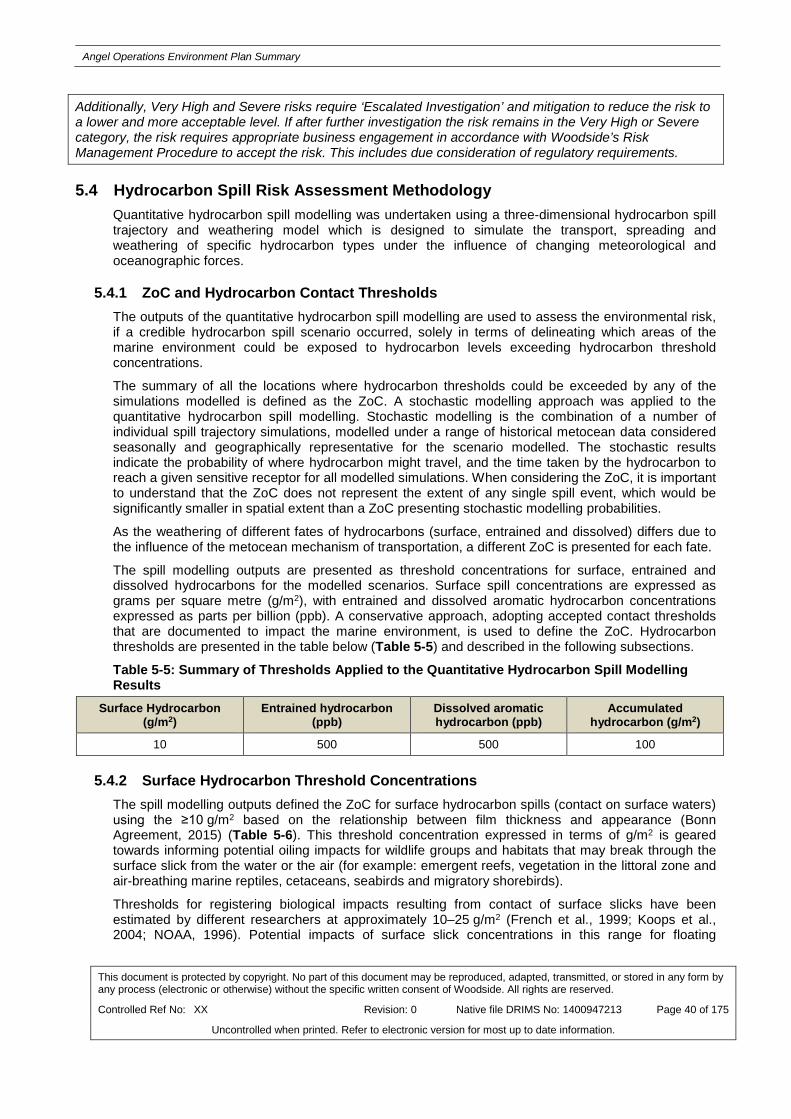
Angel Operations Environment Plan Summary
This document is protected by copyright. No part of this document may be reproduced, adapted, transmitted, or stored in any form by any process (electronic or otherwise) without the specific written consent of Woodside. All rights are reserved.
Controlled Ref No: XX Revision: 0 Native file DRIMS No: 1400947213 Page 40 of 175
Uncontrolled when printed. Refer to electronic version for most up to date information.
Additionally, Very High and Severe risks require ‘Escalated Investigation’ and mitigation to reduce the risk to a lower and more acceptable level. If after further investigation the risk remains in the Very High or Severe category, the risk requires appropriate business engagement in accordance with Woodside’s Risk Management Procedure to accept the risk. This includes due consideration of regulatory requirements.
5.4 Hydrocarbon Spill Risk Assessment Methodology Quantitative hydrocarbon spill modelling was undertaken using a three-dimensional hydrocarbon spill trajectory and weathering model which is designed to simulate the transport, spreading and weathering of specific hydrocarbon types under the influence of changing meteorological and oceanographic forces.
5.4.1 ZoC and Hydrocarbon Contact Thresholds The outputs of the quantitative hydrocarbon spill modelling are used to assess the environmental risk, if a credible hydrocarbon spill scenario occurred, solely in terms of delineating which areas of the marine environment could be exposed to hydrocarbon levels exceeding hydrocarbon threshold concentrations.
The summary of all the locations where hydrocarbon thresholds could be exceeded by any of the simulations modelled is defined as the ZoC. A stochastic modelling approach was applied to the quantitative hydrocarbon spill modelling. Stochastic modelling is the combination of a number of individual spill trajectory simulations, modelled under a range of historical metocean data considered seasonally and geographically representative for the scenario modelled. The stochastic results indicate the probability of where hydrocarbon might travel, and the time taken by the hydrocarbon to reach a given sensitive receptor for all modelled simulations. When considering the ZoC, it is important to understand that the ZoC does not represent the extent of any single spill event, which would be significantly smaller in spatial extent than a ZoC presenting stochastic modelling probabilities.
As the weathering of different fates of hydrocarbons (surface, entrained and dissolved) differs due to the influence of the metocean mechanism of transportation, a different ZoC is presented for each fate.
The spill modelling outputs are presented as threshold concentrations for surface, entrained and dissolved hydrocarbons for the modelled scenarios. Surface spill concentrations are expressed as grams per square metre (g/m2), with entrained and dissolved aromatic hydrocarbon concentrations expressed as parts per billion (ppb). A conservative approach, adopting accepted contact thresholds that are documented to impact the marine environment, is used to define the ZoC. Hydrocarbon thresholds are presented in the table below (Table 5-5) and described in the following subsections.
Table 5-5: Summary of Thresholds Applied to the Quantitative Hydrocarbon Spill Modelling Results
Surface Hydrocarbon (g/m2)
Entrained hydrocarbon (ppb)
Dissolved aromatic hydrocarbon (ppb)
Accumulated hydrocarbon (g/m2)
10 500 500 100
5.4.2 Surface Hydrocarbon Threshold Concentrations The spill modelling outputs defined the ZoC for surface hydrocarbon spills (contact on surface waters) using the ≥10 g/m2 based on the relationship between film thickness and appearance (Bonn Agreement, 2015) (Table 5-6). This threshold concentration expressed in terms of g/m2 is geared towards informing potential oiling impacts for wildlife groups and habitats that may break through the surface slick from the water or the air (for example: emergent reefs, vegetation in the littoral zone and air-breathing marine reptiles, cetaceans, seabirds and migratory shorebirds).
Thresholds for registering biological impacts resulting from contact of surface slicks have been estimated by different researchers at approximately 10–25 g/m2 (French et al., 1999; Koops et al., 2004; NOAA, 1996). Potential impacts of surface slick concentrations in this range for floating

Angel Operations Environment Plan Summary
This document is protected by copyright. No part of this document may be reproduced, adapted, transmitted, or stored in any form by any process (electronic or otherwise) without the specific written consent of Woodside. All rights are reserved.
Controlled Ref No: XX Revision: 0 Native file DRIMS No: 1400947213 Page 41 of 175
Uncontrolled when printed. Refer to electronic version for most up to date information.
hydrocarbons may include harm to seabirds through ingestion from preening of contaminated feathers or the loss of the thermal protection of their feathers. The 10 g/m2 threshold is the reported level of oiling to instigate impacts to seabirds and is also applied to other wildlife though it is recognised that ‘unfurred’ animals where hydrocarbon adherence is less, may be less vulnerable. ‘Oiling’ at this threshold is taken to be of a magnitude that can cause a response to the most vulnerable wildlife such as seabirds. Due to weathering processes, surface hydrocarbons will have a lower toxicity due to change in their composition over time. Potential impacts to shoreline sensitive receptors may be markedly reduced in instances where there is extended duration until contact.
Table 5-6: The Bonn Agreement Oil Appearance Code Appearance (following Bonn visibility descriptors)
Mass per area (g/m2) Thickness (µm) Volume per area (L/Km2)
Discontinuous true oil colours
50 to 200 50 to 200 50,000 to 200,000
Dull metallic colours 5 to 50 5 to 50 5,000 to 50,000
Rainbow sheen 0.30 to 5.00 0.30 to 5.00 300 to 5,000
Silver sheen 0.04 to 0.30 0.04 to 0.30 40 to 300
5.4.3 Entrained Hydrocarbon Threshold Concentrations The spill modelling outputs are used to define the ZoC by defining the spatial variability of entrained hydrocarbons above a set concentration threshold contacting sensitive receptors (expressed in ppb).
Entrained hydrocarbons present a number of possible mechanisms for harmful exposure to marine organisms. The entrained hydrocarbon droplets may contain soluble compounds, hence have the potential for generating elevated concentrations of dissolved aromatic hydrocarbons (e.g. if mixed by breaking waves against a shoreline). Physical and chemical effects of the entrained hydrocarbon droplets have also been demonstrated through direct contact with organisms, for example through physical coating of gills and body surfaces, and accidental ingestion (National Research Council 2005).
The threshold concentration of entrained hydrocarbons that could result in a biological impact cannot be determined directly using available ecotoxicity data for water accommodated fraction (WAF) of oil hydrocarbons. However, it is likely this data specific to dissolved oil hydrocarbon represents a worst-case scenario. This is owing to the fact that entrained oil hydrocarbons are less biologically available to organisms through absorption into their tissues than dissolved oil hydrocarbons. It is therefore expected that the entrained threshold concentration of 500 ppb will represent a potential impact substantially lower than the ‘no observed effect’ concentrations (NOEC) presented in Table 5-8.
5.4.4 Dissolved Aromatic Hydrocarbon Threshold Concentrations To confirm the appropriate threshold for dissolved hydrocarbon impacts associated with the Petroleum Activities Program, Woodside examined various ecotoxicology data available. NWS condensate is the closest hydrocarbon Woodside has ecotoxological testing data for, based on the similarity of the percentage of volatile and aromatic components to the hydrocarbons that may credibly be released during the Petroleum Activities Program. Note that all condensates considered in the modelling studies have a low asphaltene (< 0.1%) and wax (~ 0.2–0.9%) content. Based on this comparison, NWS condensate is considered to be a reasonable analogue for Angel condensate for the basis of ecotoxological testing, confirming a dissolved hydrocarbon threshold. A summary of the characteristics of the hydrocarbons used as a basis for the modelling studies used to inform the assessment of MEEs is provided in Table 5-7. Table 5-7: Characteristics of the hydrocarbon types used in the modelling of scenarios
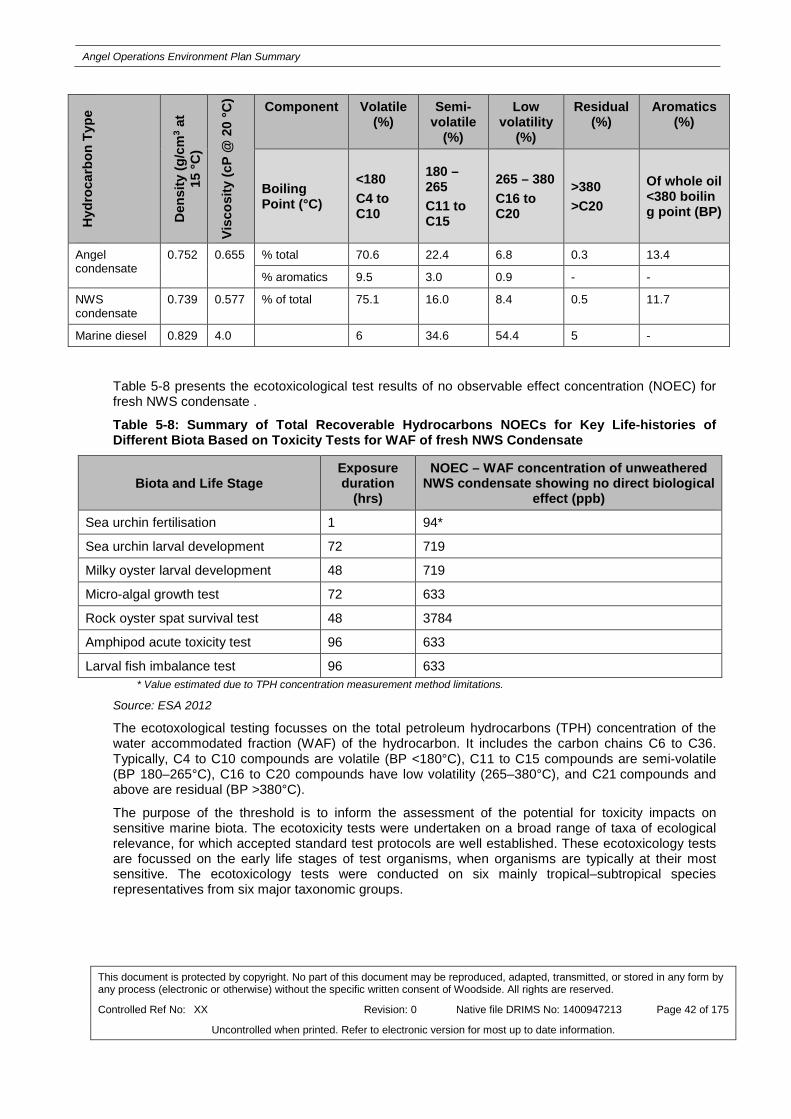
Angel Operations Environment Plan Summary
This document is protected by copyright. No part of this document may be reproduced, adapted, transmitted, or stored in any form by any process (electronic or otherwise) without the specific written consent of Woodside. All rights are reserved.
Controlled Ref No: XX Revision: 0 Native file DRIMS No: 1400947213 Page 42 of 175
Uncontrolled when printed. Refer to electronic version for most up to date information.
Hyd
roca
rbon
Typ
e
Den
sity
(g/c
m3 a
t 15
°C)
Visc
osity
(cP
@ 2
0 °C
) Component Volatile (%)
Semi-volatile
(%)
Low volatility
(%)
Residual (%)
Aromatics (%)
Boiling Point (°C)
<180 C4 to C10
180 – 265 C11 to C15
265 – 380 C16 to C20
>380 >C20
Of whole oil <380 boiling point (BP)
Angel condensate
0.752 0.655 % total 70.6 22.4 6.8 0.3 13.4
% aromatics 9.5 3.0 0.9 - -
NWS condensate
0.739 0.577 % of total 75.1 16.0 8.4 0.5 11.7
Marine diesel 0.829 4.0 6 34.6 54.4 5 -
Table 5-8 presents the ecotoxicological test results of no observable effect concentration (NOEC) for fresh NWS condensate .
Table 5-8: Summary of Total Recoverable Hydrocarbons NOECs for Key Life-histories of Different Biota Based on Toxicity Tests for WAF of fresh NWS Condensate
Biota and Life Stage Exposure duration
(hrs)
NOEC – WAF concentration of unweathered NWS condensate showing no direct biological
effect (ppb)
Sea urchin fertilisation 1 94*
Sea urchin larval development 72 719
Milky oyster larval development 48 719
Micro-algal growth test 72 633
Rock oyster spat survival test 48 3784
Amphipod acute toxicity test 96 633
Larval fish imbalance test 96 633 * Value estimated due to TPH concentration measurement method limitations.
Source: ESA 2012
The ecotoxological testing focusses on the total petroleum hydrocarbons (TPH) concentration of the water accommodated fraction (WAF) of the hydrocarbon. It includes the carbon chains C6 to C36. Typically, C4 to C10 compounds are volatile (BP <180°C), C11 to C15 compounds are semi‐volatile (BP 180–265°C), C16 to C20 compounds have low volatility (265–380°C), and C21 compounds and above are residual (BP >380°C).
The purpose of the threshold is to inform the assessment of the potential for toxicity impacts on sensitive marine biota. The ecotoxicity tests were undertaken on a broad range of taxa of ecological relevance, for which accepted standard test protocols are well established. These ecotoxicology tests are focussed on the early life stages of test organisms, when organisms are typically at their most sensitive. The ecotoxicology tests were conducted on six mainly tropical–subtropical species representatives from six major taxonomic groups.

Angel Operations Environment Plan Summary
This document is protected by copyright. No part of this document may be reproduced, adapted, transmitted, or stored in any form by any process (electronic or otherwise) without the specific written consent of Woodside. All rights are reserved.
Controlled Ref No: XX Revision: 0 Native file DRIMS No: 1400947213 Page 43 of 175
Uncontrolled when printed. Refer to electronic version for most up to date information.
The laboratory‐based ecotoxicology tests used a range of WAF concentrations to expose the different test organisms. For each ecotoxicity test, samples of the WAF were analysed to determine the TPH concentration of the solution.
Table 5-8 presents the results of NOEC for NWS condensate. The NOECs for the organisms tested ranged from 96 ppb to 3784 ppb. Based on these ecotoxicology tests, a dissolved aromatic hydrocarbon threshold of 500 ppb has been adopted. Based on these ecotoxicology tests, the selected dissolved aromatic hydrocarbon threshold of 500 ppb has been adopted. This 500 ppb threshold is below the NOEC values for six out of the seven sensitive organisms tested
5.4.5 Accumulated Hydrocarbon Threshold Concentrations Owens et al. (1994) define accumulated hydrocarbon < 100 g/m2 to have an appearance of a stain on shorelines. French-McKay (2009) defines accumulated hydrocarbons ≥ 100 g/m2 to be the threshold that could impact the survival and reproductive capacity of benthic epifaunal invertebrates living in intertidal habitat; therefore, ≥ 100 g/m2 has been adopted as the threshold for shoreline accumulation.
5.5 Potential Environment Risks Not Included Within the Scope of the Environment Plan The ENVID identified a number of sources of environmental risk/impact as a result of the Petroleum Activities Program, that were assessed as not being applicable (not credible) within or outside the Operational Area and therefore, were determined to not form part of this EP. This is described in the following section for information only.
Shallow/Near-shore Activities
The Petroleum Activities Program is located in water depths of approximately between 80 and 125 m and at a distance approximately 94 km from nearest landfall (Dampier Archipelago), consequently risks/impacts associated with shallow/near-shore activities such as anchoring and vessel grounding were assessed as not credible. Glomar Shoals, a relatively shallow feature that partially overlaps the Operational Area, will not credibly be impacted by shallow/near-shore activities.

Angel Operations Environment Plan Summary
This document is protected by copyright. No part of this document may be reproduced, adapted, transmitted, or stored in any form by any process (electronic or otherwise) without the specific written consent of Woodside. All rights are reserved.
Controlled Ref No: XX Revision: 0 Native file DRIMS No: 1400947213 Page 44 of 175
Uncontrolled when printed. Refer to electronic version for most up to date information.
6. ENVIRONMENTAL RISK AND IMPACTS SUMMARY Table 6-1 presents a summary of the sources of impact/risk, analysis and evaluation for the Petroleum Activities program. The risks identified during the ENVID (including decision type, current risk level, acceptability of risk and tools used in the demonstration of acceptability and ALARP) have been divided into two broad categories:
• Planned (routine and non-routine) activities; and
• Unplanned events (accidents, incidents or emergency situations).
Within these categories, impact assessment groupings are based on stressor type e.g. emissions, physical presence etc. In all cases the worst credible consequence was assumed.
The analysis and evaluation for the Petroleum Activities Program indicate that all of the current environmental risks and impacts associated with the activity are reduced to ALARP and are of an acceptable level.

Angel Operations Environment Plan Summary
This document is protected by copyright. No part of this document may be reproduced, adapted, transmitted, or stored in any form by any process (electronic or otherwise) without the specific written consent of Woodside. All rights are reserved.
Controlled Ref No: XX Revision: B Native file DRIMS No: 1400947213 Page 45 of 175
Uncontrolled when printed. Refer to electronic version for most up to date information.
Table 6-1: Environmental Risk and Impacts Register Summary
Aspect
App
endi
x
refe
renc
e
Source of Impact Key Potential Environmental Impacts
(Refer to relevant EP section for details)
Con
trol
led
Impa
ct
Cla
ssifi
catio
n
Residual Impact Level (ALARP controls in place)
Acceptability of Impact
Planned Activities (Routine and Non-routine)
Physical Presence: Disturbance to Marine Users A
Presence of facility excluding and/or displacing other users from Petroleum Safety Zone and Operational Area respectively.
Potential isolated social impact resulting from interference with other sea users (e.g. commercial and recreational fishing, and shipping).
F Social and Cultural – No lasting effect (< 1 month). Localised impact not significant to areas/items of cultural significance.
Broadly Acceptable
Physical Presence: Disturbance to Seabed
A
Presence of facility and subsea infrastructure modifying marine habitats.
Localised modification of seabed habitat (formation of artificial reef) within Operational Area.
F Environment – No lasting effect (< 1 month). Localised impact not significant to environmental receptors.
Broadly Acceptable
Subsea operations, inspection, maintenance and repair activities resulting in disturbance to seabed.
Localised modification of seabed habitat within Operational Area with potential for impacts to water quality and benthic communities of no lasting effect.
E Environment – Slight, short-term impact (< 1 year) on species, habitat (but not affecting ecosystem function), physical or biological attributes.
Broadly Acceptable
Routine Acoustic Emissions: Generation of Noise during Routine Operations A
Noise generated within the Operational Area from: • facility and associated infrastructure • vessel and subsea IMR activities • helicopters.
Potential localised behavioural impacts to marine fauna around and within the Operational Area.
F Environment – No lasting effect (< 1 month). Localised impact not significant to environmental receptors. Broadly
Acceptable
Routine and Non-Routine Discharges: Discharge of Hydrocarbons and Chemicals during Subsea Operations and Activities
A
Discharge of subsea control fluids. Localised decrease in water quality around subsea system within Operational Area with no lasting effect.
F Environment – No lasting effect (< 1 month). Localised impact not significant to environmental receptors.
Broadly Acceptable
Discharge of hydrocarbons remaining in subsea pipeworks and equipment as a result of subsea intervention works.
Slight short term decrease in water quality at release location during IMR activities.
E Environment – Slight, short-term impact (< 1 year) on species, habitat (but not affecting ecosystems function), physical or biological attributes.
Broadly Acceptable
Discharge of chemicals remaining in subsea pipeworks and equipment or the use of chemicals for subsea IMR activities.
Localised decrease in water quality at release location during IMR activities.
F Environment – No lasting effect (< 1 month). Localised impact not significant to environmental receptors.
Broadly Acceptable
Discharge of minor fugitive hydrocarbon from subsea equipment.
Potential slight short-term, localised decrease in water quality around subsea system within Operational Area with no lasting effect.
F Environment – No lasting effect (< 1 month). Localised impact not significant to environmental receptors.
Broadly Acceptable
Routine and Non-Routine Discharges: Produced Water A
Discharge of PW from riser platform. Potential slight short-term, localised decrease in water quality (increased hydrocarbon and chemical concentrations) at discharge location and within mixing zone, with potential impacts to marine fauna (toxicity).
E Environment – Slight, short-term impact (< 1 year) on species, habitat (but not affecting ecosystem function), physical or biological attributes.
Broadly Acceptable
Routine and Non-Routine Discharges: Discharges from Utility Systems and Drains A
Discharge of sewage, grey water and putrescible waste from vessels and riser platform to the marine environment.
Potential localised, short-term decrease in water quality (increased nutrients and biological oxygen demand) at the discharge location.
F
Environment – No lasting effect (< 1 month). Localised impact not significant to environmental receptors.
Broadly Acceptable
Discharge of deck, bilge and drain water from vessels and facility to the marine environment.
Potential localised, short-term decrease in water quality (increased hydrocarbon and chemical concentrations) at
F
Environment – No lasting effect (< 1 month). Localised impact not significant to
Broadly Acceptable
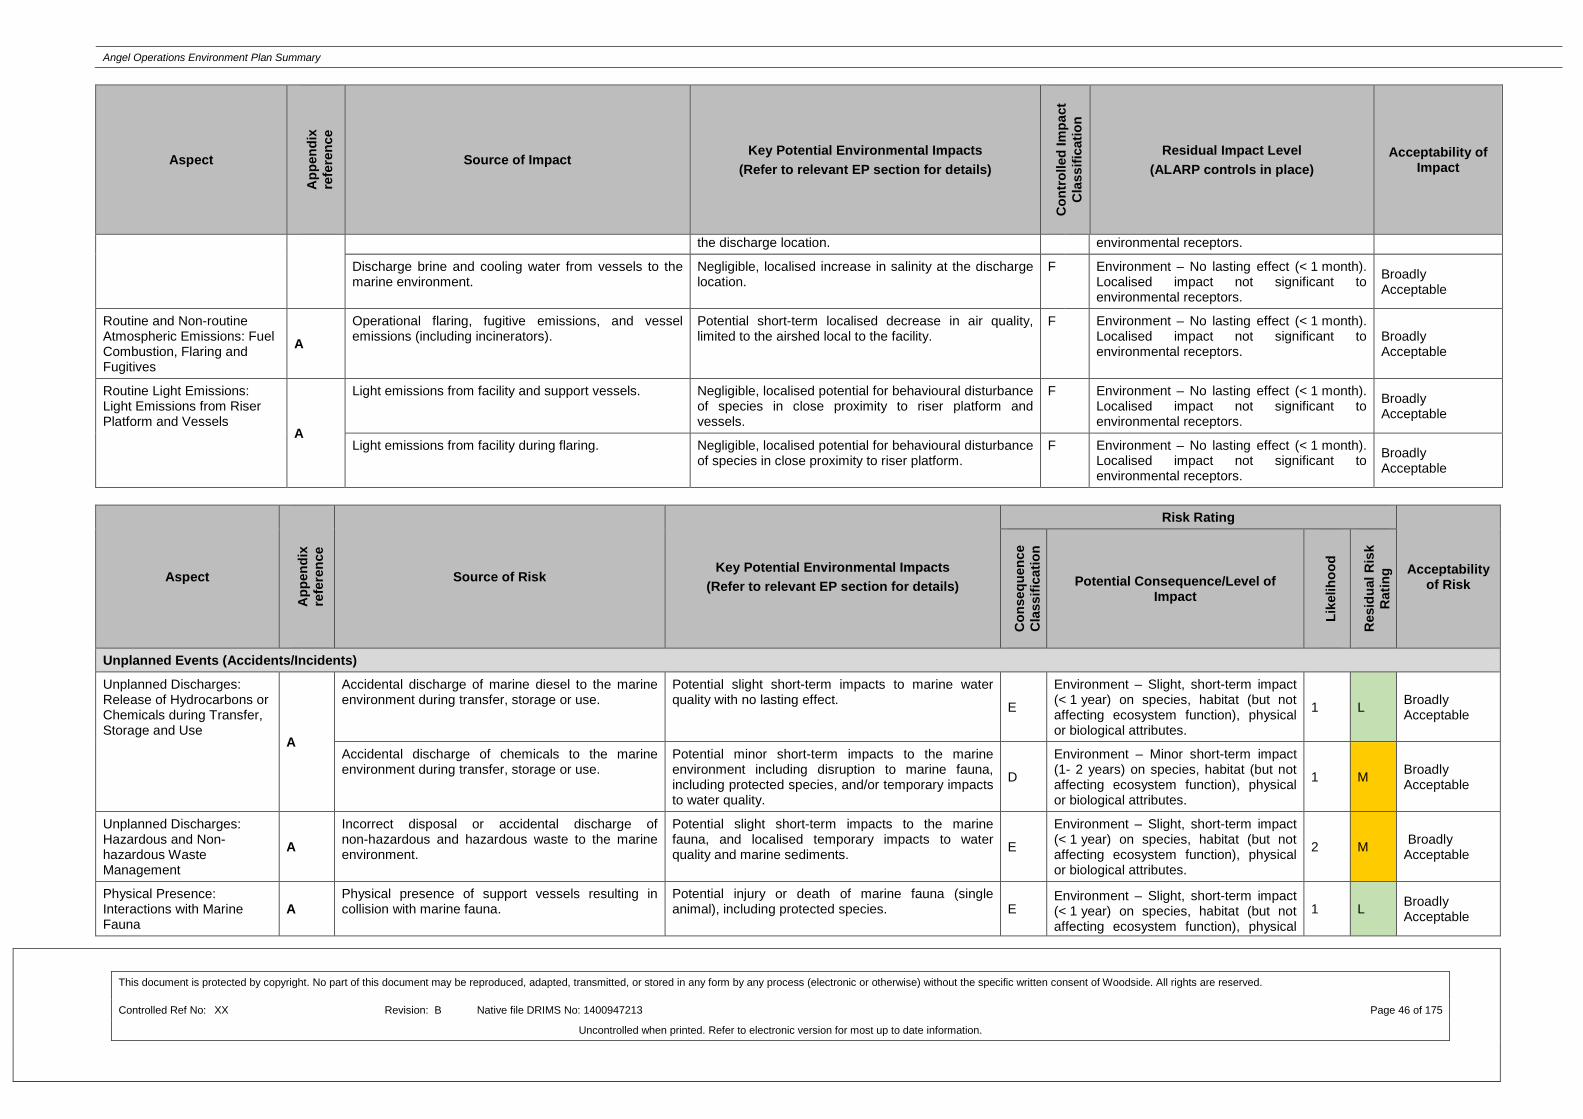
Angel Operations Environment Plan Summary
This document is protected by copyright. No part of this document may be reproduced, adapted, transmitted, or stored in any form by any process (electronic or otherwise) without the specific written consent of Woodside. All rights are reserved.
Controlled Ref No: XX Revision: B Native file DRIMS No: 1400947213 Page 46 of 175
Uncontrolled when printed. Refer to electronic version for most up to date information.
Aspect
App
endi
x
refe
renc
e
Source of Impact Key Potential Environmental Impacts
(Refer to relevant EP section for details)
Con
trol
led
Impa
ct
Cla
ssifi
catio
n
Residual Impact Level (ALARP controls in place)
Acceptability of Impact
the discharge location. environmental receptors.
Discharge brine and cooling water from vessels to the marine environment.
Negligible, localised increase in salinity at the discharge location.
F Environment – No lasting effect (< 1 month). Localised impact not significant to environmental receptors.
Broadly Acceptable
Routine and Non-routine Atmospheric Emissions: Fuel Combustion, Flaring and Fugitives
A Operational flaring, fugitive emissions, and vessel emissions (including incinerators).
Potential short-term localised decrease in air quality, limited to the airshed local to the facility.
F Environment – No lasting effect (< 1 month). Localised impact not significant to environmental receptors.
Broadly Acceptable
Routine Light Emissions: Light Emissions from Riser Platform and Vessels
A
Light emissions from facility and support vessels. Negligible, localised potential for behavioural disturbance of species in close proximity to riser platform and vessels.
F Environment – No lasting effect (< 1 month). Localised impact not significant to environmental receptors.
Broadly Acceptable
Light emissions from facility during flaring. Negligible, localised potential for behavioural disturbance of species in close proximity to riser platform.
F Environment – No lasting effect (< 1 month). Localised impact not significant to environmental receptors.
Broadly Acceptable
Aspect
App
endi
x
refe
renc
e
Source of Risk Key Potential Environmental Impacts
(Refer to relevant EP section for details)
Risk Rating
Acceptability of Risk
Con
sequ
ence
C
lass
ifica
tion
Potential Consequence/Level of Impact
Like
lihoo
d
Res
idua
l Ris
k R
atin
g
Unplanned Events (Accidents/Incidents)
Unplanned Discharges: Release of Hydrocarbons or Chemicals during Transfer, Storage and Use
A
Accidental discharge of marine diesel to the marine environment during transfer, storage or use.
Potential slight short-term impacts to marine water quality with no lasting effect. E
Environment – Slight, short-term impact (< 1 year) on species, habitat (but not affecting ecosystem function), physical or biological attributes.
1 L Broadly Acceptable
Accidental discharge of chemicals to the marine environment during transfer, storage or use.
Potential minor short-term impacts to the marine environment including disruption to marine fauna, including protected species, and/or temporary impacts to water quality.
D
Environment – Minor short-term impact (1- 2 years) on species, habitat (but not affecting ecosystem function), physical or biological attributes.
1 M Broadly Acceptable
Unplanned Discharges: Hazardous and Non-hazardous Waste Management
A Incorrect disposal or accidental discharge of non-hazardous and hazardous waste to the marine environment.
Potential slight short-term impacts to the marine fauna, and localised temporary impacts to water quality and marine sediments. E
Environment – Slight, short-term impact (< 1 year) on species, habitat (but not affecting ecosystem function), physical or biological attributes.
2 M Broadly Acceptable
Physical Presence: Interactions with Marine Fauna
A Physical presence of support vessels resulting in collision with marine fauna.
Potential injury or death of marine fauna (single animal), including protected species. E
Environment – Slight, short-term impact (< 1 year) on species, habitat (but not affecting ecosystem function), physical
1 L Broadly Acceptable

Angel Operations Environment Plan Summary
This document is protected by copyright. No part of this document may be reproduced, adapted, transmitted, or stored in any form by any process (electronic or otherwise) without the specific written consent of Woodside. All rights are reserved.
Controlled Ref No: XX Revision: B Native file DRIMS No: 1400947213 Page 47 of 175
Uncontrolled when printed. Refer to electronic version for most up to date information.
Aspect
App
endi
x
refe
renc
e
Source of Risk Key Potential Environmental Impacts
(Refer to relevant EP section for details)
Risk Rating
Acceptability of Risk
Con
sequ
ence
C
lass
ifica
tion
Potential Consequence/Level of Impact
Like
lihoo
d
Res
idua
l Ris
k R
atin
g
or biological attributes.
Physical Presence: Introduction of Invasive Marine Species A
Invasive species in vessel ballast tanks or on vessels/submersible equipment.
Potential introduction of invasive marine species possibly resulting in an alteration of the localised environment. E
Environment – Slight, short-term impact (< 1 year) on species, habitat (but not affecting ecosystem function), physical or biological attributes.
1 L Broadly Acceptable
Unplanned Hydrocarbon Release: Topsides Loss of Containment A
Hydrocarbon release from topsides process equipment to the marine environment and atmosphere.
Potential minor short-term impacts to the marine environment including disruption to marine fauna, including protected species, and/or temporary impacts to water quality.
D
Environment – Minor short-term impact (1–2 years) on species, habitat (but not affecting ecosystem function), physical or biological attributes.
1 M Broadly Acceptable
Unplanned Events (Accidents/Incidents) – MEEs
Unplanned Hydrocarbon Release: Loss of Well Containment (MEE-01)
A
Release of hydrocarbons resulting from loss of subsea well containment.
Potential significant impacts to the marine environment:
• long-term impacts to sensitive nearshore areas of offshore islands and coastal shorelines
• disruption to marine fauna, including protected species
• potential short-term interference with or displacement of other sea users.
A
Environment – Catastrophic, long-term impact (> 50 years) on highly valued ecosystems, species, habitats or physical or biological attributes.
1 H Acceptable if ALARP
Unplanned Hydrocarbon Release: Pipeline and Riser Loss of Containment (MEE-02)
A
Release of hydrocarbons resulting from loss of export pipeline containment (Angel Export Pipeline (AEP), including 1TL inventory).
Potential significant impacts to the marine environment:
• medium-term impacts to sensitive offshore and nearshore areas
• disruption to marine fauna, including protected species
• potential short-term interference with or displacement of other sea users.
B
Environment – Major, long-term impact (10–50 years) on highly valued ecosystems, species, habitat or physical or biological attributes.
0 M Acceptable if ALARP
Release of hydrocarbons resulting from loss of containment of subsea flowlines and infrastructure.
D
Environment – Minor short-term impact (1–2 years) on species, habitat (but not affecting ecosystem function), physical or biological attributes.
2 M Broadly Acceptable
Unplanned Hydrocarbon Release: Loss of Structural Integrity (MEE-03)
A
Surface or subsea release from flowline, pipeline and riser to the marine environment and atmosphere (MEE-02).
Potential significant impacts to the marine environment:
• medium-term impacts to sensitive offshore and nearshore areas
• disruption to marine fauna, including protected species
• potential short-term interference with or displacement of other sea users.
B
Environment – Major, long-term impact (10–50 years) on highly valued ecosystems, species, habitat or physical or biological attributes.
0 M Acceptable if ALARP
Hydrocarbon release from topsides equipment to the marine environment and atmosphere. D
Environment – Minor short-term impact (1–2 years) on species, habitat (but not affecting ecosystem function), physical or biological attributes.
1 M Broadly Acceptable
Marine environment footprint and associated hydrocarbon and chemical release associated with structural collapse of riser platform. B
Environment – Major, long-term impact (10–50 years) on highly valued ecosystems, species, habitat or physical or biological attributes.
0 M Acceptable if ALARP
Unplanned Hydrocarbon Release: Loss of Marine
A Surface or subsea release from flowline, pipeline and riser to the marine environment and atmosphere
Potential significant impacts to the marine B Environment – Major, long-term impact (10–50 years) on highly valued
0 M Acceptable if

Angel Operations Environment Plan Summary
This document is protected by copyright. No part of this document may be reproduced, adapted, transmitted, or stored in any form by any process (electronic or otherwise) without the specific written consent of Woodside. All rights are reserved.
Controlled Ref No: XX Revision: B Native file DRIMS No: 1400947213 Page 48 of 175
Uncontrolled when printed. Refer to electronic version for most up to date information.
Aspect
App
endi
x
refe
renc
e
Source of Risk Key Potential Environmental Impacts
(Refer to relevant EP section for details)
Risk Rating
Acceptability of Risk
Con
sequ
ence
C
lass
ifica
tion
Potential Consequence/Level of Impact
Like
lihoo
d
Res
idua
l Ris
k R
atin
g
Vessel Separation (MEE-04) (MEE-02). environment: • medium-term impacts to sensitive offshore and
nearshore areas • disruption to marine fauna, including protected
species • potential short-term interference with or
displacement of other sea users.
ecosystems, species, habitat or physical or biological attributes.
ALARP
Hydrocarbon release from topsides equipment to the marine environment and atmosphere. C
Environment – Moderate, medium-term impact (2–10 years) on ecosystems, species, habitat or physical or biological attributes.
1 M Acceptable if ALARP
Marine environment footprint and associated hydrocarbon and chemical release associated with structural collapse of riser platform. B
Environment – Major, long-term impact (10–50 years) on highly valued ecosystems, species, habitat or physical or biological attributes.
0 M Acceptable if ALARP
Surface release from support vessel diesel tank.
D
Environment – Minor short-term impact (1–2 years) on species, habitat (but not affecting ecosystem function), physical or biological attributes.
1 M Broadly Acceptable
Unplanned Hydrocarbon Release: Loss of Control of Suspended Load from Platform (MEE-05)
A
Surface or subsea release from flowline, pipeline and riser to the marine environment and atmosphere (MEE-02).
Potential significant impacts to the marine environment:
• medium-term impacts to sensitive offshore and nearshore areas
• disruption to marine fauna, including protected species
• potential short-term interference with or displacement of other sea users.
B
Environment – Major, long-term impact (10–50 years) on highly valued ecosystems, species, habitat or physical or biological attributes.
0 M Acceptable if ALARP
Hydrocarbon release from topsides process equipment to the marine environment and atmosphere. D
Environment – Minor short-term impact (1–2 years) on species, habitat (but not affecting ecosystem function), physical or biological attributes.
0 L Broadly acceptable

Angel Operations Environment Plan Summary
This document is protected by copyright. No part of this document may be reproduced, adapted, transmitted, or stored in any form by any process (electronic or otherwise) without the specific written consent of Woodside. All rights are reserved.
Controlled Ref No: XX Revision: B Native file DRIMS No: 1400947213 Page 49 of 175
Uncontrolled when printed. Refer to electronic version for most up to date information.
7. ONGOING MONITORING OF ENVIRONMENTAL PERFORMANCE The Petroleum Activities Program will be managed in compliance with the Angel Operations EP accepted by NOPSEMA under the Environment Regulations, other relevant environmental legislation and Woodside’s Management System (e.g. Woodside Environment Policy).
The objective of the EP is to identify, mitigate and manage potentially adverse environmental impacts associated with the Petroleum Activities Program, during both planned and unplanned operations, to ALARP and an acceptable level.
For each environmental aspect (risk) and associated environmental impact (identified and assessed in the Environmental Risk Assessment of the EP) a specific environmental performance outcome, environmental performance standards and measurement criteria have been developed. The performance standards are control measures (available in Appendix A) that will be implemented (consistent with the performance standards) to achieve the environmental performance outcomes. The specific measurement criteria provide the evidence base to demonstrate that the performance standards (control measures) and outcomes are achieved.
The implementation strategy detailed in the Angel Operations EP identifies the roles/responsibilities and training/competency requirements for personnel (Woodside and its contractors) in relation to implementing controls, managing non-conformance, emergency response and meeting monitoring, auditing, and reporting requirements during the activity.
Woodside and its Contractors will undertake a program of periodic monitoring during the Petroleum Activities Program using a number of tools and systems. The tools and systems collect, as a minimum, the data (evidence) referred to in the measurement criteria. The collection of this data (and assessment against the measurement criteria) forms part of the permanent record of compliance maintained by Woodside and the basis for demonstrating that the environmental performance outcomes and standards are met.
Monitoring of environmental performance is undertaken as part of the following:
• External annual performance reporting to NOPSEMA verify compliance with the environmental performance objectives, standards and measurement criteria outlined in the EP;
• Internal inspection and assurance activities; and
• Environmental emissions/discharge recording systems.
Woodside employees and Contractors are required to report all environmental incidents and non-conformances with environmental performance outcomes and standards in the EP. Incidents will be reported using an Incident and Hazard Report Form, which includes details of the event, immediate action taken to control the situation, and corrective actions to prevent reoccurrence. An internal computerised database is used for the recording and reporting of these incidents.
7.1 Environment Plan Revisions and Management of Change Revision of the Angel Operations EP will be undertaken in accordance with the requirements outlined in Regulations 17, Regulation 18 and Regulation 19 of the Environment Regulations. Woodside will submit a proposed revision of the Angel Operations EP to NOPSEMA including as a result of the following:
• When any significant modification or new stage of the activity that is not provided for in the EP is proposed;
• Before, or as soon as practicable after, the occurrence of any significant new or significant increase in environmental risk or impact not provided for in the EP;

Angel Operations Environment Plan Summary
This document is protected by copyright. No part of this document may be reproduced, adapted, transmitted, or stored in any form by any process (electronic or otherwise) without the specific written consent of Woodside. All rights are reserved.
Controlled Ref No: XX Revision: B Native file DRIMS No: 1400947213 Page 50 of 175
Uncontrolled when printed. Refer to electronic version for most up to date information.
• At least 14 days before the end of each period of five years commencing on the day in which the original and subsequent revisions of the EP is accepted under Regulation 11 of the Environment Regulations; and
• As requested by NOPSEMA.
Management of changes relevant to the Angel Operations EP, concerning the scope of the activity description, changes in understanding of the environment, including advice on species protected under EPBC Act and potential new advice from external stakeholders, will be managed in accordance with internal procedures for management of change. These provide guidance on the Environment Regulations that may trigger a revision and resubmission of the Angel Operations EP to NOPSEMA. They also provide guidance on what constitutes a significant new risk or increase in risk. A risk assessment will be conducted in accordance with Woodside’s Environmental Risk Management Methodology to determine the significance of any potential new environmental impacts or risks not provided for in the Angel Operations EP. Risk assessment outcomes are reviewed in compliance with Regulation 17 of the Environment Regulations.
Minor changes where a review of the activity and the environmental risks and impacts of the activity do not trigger a requirement for a revision, under Regulation 17 of the Environment Regulations, will be considered a ‘minor revision’. Minor administrative changes to the Angel Operations EP, where an assessment of the environmental risks and impacts is not required (e.g. document references, phone numbers, etc.), will also be considered a ‘minor revision’. Minor revisions and administrative changes as defined above will be made to the Angel Operations EP using Woodside’s document control process. Minor revisions will be tracked and incorporated during scheduled internal reviews.

Angel Operations Environment Plan Summary
This document is protected by copyright. No part of this document may be reproduced, adapted, transmitted, or stored in any form by any process (electronic or otherwise) without the specific written consent of Woodside. All rights are reserved.
Controlled Ref No: XX Revision: B Native file DRIMS No: 1400947213 Page 51 of 175
Uncontrolled when printed. Refer to electronic version for most up to date information.
8. OIL POLLUTION EMERGENCY RESPONSE ARRANGEMENTS The documents listed below, meet the requirements of the Offshore Petroleum and Greenhouse Gas Storage (Environment) Regulations 2009 (Environment Regulations) relating to hydrocarbon spill response arrangements.
• Oil Pollution Emergency Arrangements (OPEA) (Australia);
• The Angel Oil Pollution First Strike Plan;
• Oil Spill Preparedness and Response Strategy Selection and Evaluation;
• Operational Plans; and
• Tactical Response Plans.
8.1 Oil Pollution Emergency Arrangements (Australia) This document outlines the emergency and crisis management incident command structure (ICS) and Woodside’s response arrangements to competently respond to and escalate a hydrocarbon spill event. The document interfaces externally with Commonwealth, State and industry response plans and internally with Woodside’s ICS.
Woodside’s Oil Pollution Emergency Arrangements (Australia) details the following support arrangements:
• Access to MODU to drill intervention well via Memorandum of Understanding (MoU) with other industry participants;
• Master services agreement with Australian Marine Oil Spill Centre (AMOSC) for the supply of experienced personnel and equipment;
• Other support services such as 24/7 hydrocarbon spill trajectory modelling and satellite monitoring services as well as aerial, marine, logistics and waste management support; and
• Mutual Aid Agreements with other oil and gas operators in the region for the provision of assistance in a hydrocarbon spill response.
All operations personnel involved in crisis and emergency management are required to commit to ongoing training, process improvement and participation in emergency and crisis response (both real and simulated), including emergency drills specific to potential incidents at the Angel Facility. Training includes task specific training and role-based training and ‘on the job’ experience (i.e. participation in crisis or emergency management exercises).
The Corporate Incident Communication Centre (CICC) based in Woodside’s head office in Perth, is the onshore coordination point for an offshore emergency. The CICC is staffed by an appropriately skilled team available on call 24 hours a day. The purpose of the team is to coordinate rescues, minimise damage to the environment and facilities and to liaise with external agencies.
There are a number of arrangements which in the event of a spill will underpin Woodside’s ability to implement a response across its petroleum activities. To ensure each of these arrangements are adequately tested tests are conducted in alignment with the Hydrocarbon Spill Arrangements Testing Schedule which aligns with international good practice for spill preparedness & response management. The schedule identifies the type of test which will be conducted annually for each arrangement, and how this type will vary over a five-year rolling schedule. Testing methods may include (but are not limited to): audits, drills, field exercises, functional workshops, assurance reporting, assurance monitoring and reviews of key external dependencies.
Angel Operations Environment Plan Summary
This document is protected by copyright. No part of this document may be reproduced, adapted, transmitted, or stored in any form by any process (electronic or otherwise) without the specific written consent of Woodside. All rights are reserved.
Controlled Ref No: XX Revision: B Native file DRIMS No: 1400947213 Page 52 of 175
Uncontrolled when printed. Refer to electronic version for most up to date information.
8.2 Angel Oil Pollution First Strike Plan The Angel Oil Pollution First Strike Plan is an activity-specific document which provides details on the tasks required to mobilise a first strike response for the first 24 hours of a hydrocarbon spill event. These tasks include key response actions and regulatory notifications. The intent of the document is to provide immediate oil spill response guidance to the Incident Management Team until a full Incident Action Plan specific to the oil spill event is developed.
The facility and subsea support vessels will have Ship Oil Pollution Emergency Plans (SOPEPs) in accordance with the requirements of International Convention for the Prevention of Pollution from Ships (MARPOL) 73/78 Annex I. These plans outline responsibilities, specify procedures and identify resources available in the event of a hydrocarbon or chemical spill from vessel activities. The Angel Oil Pollution First Strike Plan is intended to work in conjunction with the SOPEPs.
Woodside’s oil spill arrangements are tested by conducting periodic exercises. These exercises are conducted to test the response arrangements outlined in the Angel Oil Pollution First Strike Plan and Oil Spill Preparedness and Response Mitigation Assessment to ensure that personnel are familiar with spill response procedures, in particular, individual roles and responsibilities and reporting requirements.
8.3 Oil Spill Preparedness and Response Mitigation Assessment Woodside has developed an oil spill preparedness and response position in order to demonstrate that risks and impacts associated with loss of hydrocarbons from the Petroleum Activities Program would be mitigated and managed to ALARP and would be of an acceptable level.
The following oil spill response strategies were evaluated and subsequently pre-selected for a significant oil spill event (level 2 or 3 under the National Plan) from the Petroleum Activities Program:
• Monitor and Evaluate (Operational Monitoring) – Operational Monitoring commences immediately following a spill and includes the gathering and evaluation of data to inform the oil spill response planning and operations. It includes fate and trajectory modelling, spill tracking, weather updates and field observations. The following operational monitoring programs are available for implementation:
- Predictive modelling of hydrocarbons to assess resources at risk;
- Surveillance and reconnaissance to detect hydrocarbons and resources at risk;
- Monitoring of hydrocarbon presence, properties, behaviour and weathering in water;
- Pre-emptive assessment of sensitive receptors at risk; and
- Monitoring of contaminated resources and the effectiveness of response and clean-up operations.
The following response strategies may be applied based on the outcomes of the implemented Operational Monitoring Programs:
• Source control - A loss of well control is the identified worst case spill scenario. Woodside’s primary mitigation strategy is to minimise the volume of hydrocarbons released. Woodside pre-operational NEBA evaluation has identified relief well drilling as the primary source control strategy.
• Containment and recovery- the aim of this response strategy is to reduced damage to sensitive receptors by the physical removal of hydrocarbons from the marine environment.
• Wildlife response - An oiled wildlife response would be undertaken in accordance with Woodside’s Health, Safety, Environment and Quality Policy and values and recognition of societal expectations. The response would involve reconnaissance from vessels, aircraft and shoreline surveys, the capture, transport, rehabilitation and release of oiled wildlife.
• Scientific monitoring - A scientific monitoring program (SMP) would be activated following a Level 2 or 3 hydrocarbon release, or any release event with the potential to contact sensitive environmental
Angel Operations Environment Plan Summary
This document is protected by copyright. No part of this document may be reproduced, adapted, transmitted, or stored in any form by any process (electronic or otherwise) without the specific written consent of Woodside. All rights are reserved.
Controlled Ref No: XX Revision: B Native file DRIMS No: 1400947213 Page 53 of 175
Uncontrolled when printed. Refer to electronic version for most up to date information.
receptors. This would consider receptors at risk (ecological and socio-economic) for the entire predicted ZoC and in particular, the identified Pre-emptive Baseline Areas (PBAs) in the event of a loss of well control from the PAP drilling activities (refer to response planning assumptions). The SMP would be informed by the operational monitoring programs, but differs from the operational monitoring program in being a long-term program independent of, and not directing, the operational oil spill response. Key objectives of the Woodside oil spill scientific monitoring program are:
- Assess the extent, severity and persistence of the environmental impacts from the spill event; and
- Monitor subsequent recovery of impacted key species, habitats and ecosystems.
• Waste management - Waste management is considered a support strategy to the response strategies examined above.
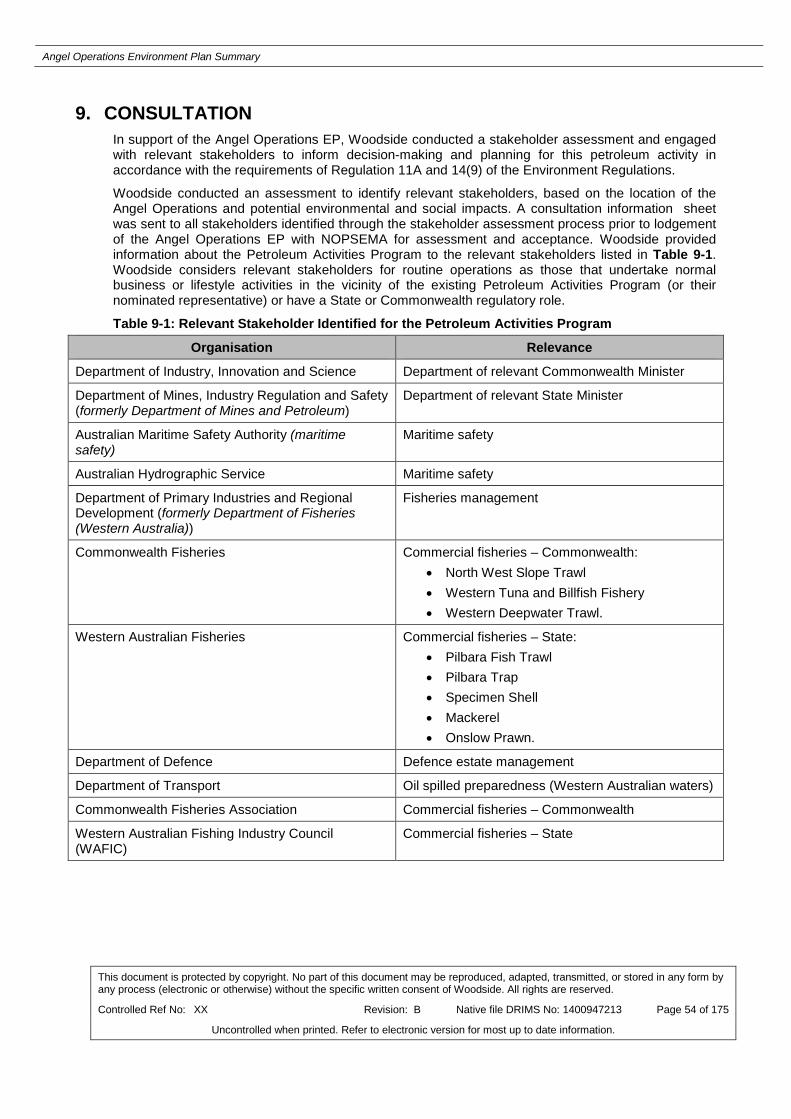
Angel Operations Environment Plan Summary
This document is protected by copyright. No part of this document may be reproduced, adapted, transmitted, or stored in any form by any process (electronic or otherwise) without the specific written consent of Woodside. All rights are reserved.
Controlled Ref No: XX Revision: B Native file DRIMS No: 1400947213 Page 54 of 175
Uncontrolled when printed. Refer to electronic version for most up to date information.
9. CONSULTATION In support of the Angel Operations EP, Woodside conducted a stakeholder assessment and engaged with relevant stakeholders to inform decision-making and planning for this petroleum activity in accordance with the requirements of Regulation 11A and 14(9) of the Environment Regulations.
Woodside conducted an assessment to identify relevant stakeholders, based on the location of the Angel Operations and potential environmental and social impacts. A consultation information sheet was sent to all stakeholders identified through the stakeholder assessment process prior to lodgement of the Angel Operations EP with NOPSEMA for assessment and acceptance. Woodside provided information about the Petroleum Activities Program to the relevant stakeholders listed in Table 9-1. Woodside considers relevant stakeholders for routine operations as those that undertake normal business or lifestyle activities in the vicinity of the existing Petroleum Activities Program (or their nominated representative) or have a State or Commonwealth regulatory role.
Table 9-1: Relevant Stakeholder Identified for the Petroleum Activities Program
Organisation Relevance
Department of Industry, Innovation and Science Department of relevant Commonwealth Minister
Department of Mines, Industry Regulation and Safety (formerly Department of Mines and Petroleum)
Department of relevant State Minister
Australian Maritime Safety Authority (maritime safety)
Maritime safety
Australian Hydrographic Service Maritime safety
Department of Primary Industries and Regional Development (formerly Department of Fisheries (Western Australia))
Fisheries management
Commonwealth Fisheries Commercial fisheries – Commonwealth: • North West Slope Trawl • Western Tuna and Billfish Fishery • Western Deepwater Trawl.
Western Australian Fisheries Commercial fisheries – State: • Pilbara Fish Trawl • Pilbara Trap • Specimen Shell • Mackerel • Onslow Prawn.
Department of Defence Defence estate management
Department of Transport Oil spilled preparedness (Western Australian waters)
Commonwealth Fisheries Association Commercial fisheries – Commonwealth
Western Australian Fishing Industry Council (WAFIC)
Commercial fisheries – State

Angel Operations Environment Plan Summary
This document is protected by copyright. No part of this document may be reproduced, adapted, transmitted, or stored in any form by any process (electronic or otherwise) without the specific written consent of Woodside. All rights are reserved.
Controlled Ref No: XX Revision: B Native file DRIMS No: 1400947213 Page 55 of 175
Uncontrolled when printed. Refer to electronic version for most up to date information.
9.1 Ongoing Consultation Woodside continue to engage and consult with relevant stakeholders throughout the Petroleum Activities Program by implementing its established approach to stakeholder engagement that includes;
• Direct stakeholder and community engagement providing advice to community stakeholders on progress in execution of activities;
• Provision of updated activity factsheets prior to the commencement of activities; and
• Toll free number provided on activity factsheets.
Woodside will continue to accept feedback from all stakeholders throughout the duration of the accepted Angel Operations EP. Stakeholder feedback should be made to the nominated liaison person.
Feedback received through community engagement and consultation will be captured in Woodside’s stakeholder database and actioned where appropriate through the Petroleum Activities Program Project Manager. Implementation of ongoing engagement and consultation activities for the Petroleum Activities Program will be undertaken by Woodside Corporate Affairs consistent with Woodside’s External Stakeholder Engagement Operating Standard.
9.2 Non-Routine Events Woodside recognises that the relevance of stakeholders identified in the EP to the activity may change in the occurrence of a non-routine event or emergency. Woodside also acknowledges that other stakeholders not identified in the EP may be affected.
Stakeholder groups include:
• Government Ministers;
• Government agencies;
• Local governments, including representation local communities (Exmouth and Coral Bay);
• Emergency response organisations;
• Border protection and defence;
• Fisheries;
• Charter boat operators;
• Marine and terrestrial tourism operators;
• Other petroleum operators;
• Other industry;
• Development commissions and industry associations;
• Aboriginal claimant groups;
• Community representative organisations; and
• Non-Government Organisations.
Angel Operations Environment Plan Summary
This document is protected by copyright. No part of this document may be reproduced, adapted, transmitted, or stored in any form by any process (electronic or otherwise) without the specific written consent of Woodside. All rights are reserved.
Controlled Ref No: XX Revision: B Native file DRIMS No: 1400947213 Page 56 of 175
Uncontrolled when printed. Refer to electronic version for most up to date information.
10. TITLEHOLDER NOMINATED LIAISON PERSON For further information about this activity, please contact:
Andrew Winter
Woodside Energy Ltd
11 Mount Street
Perth
WA 6000
T: 9348 4000
Toll free: 1800 442 977

Angel Operations Environment Plan Summary
This document is protected by copyright. No part of this document may be reproduced, adapted, transmitted, or stored in any form by any process (electronic or otherwise) without the specific written consent of Woodside. All rights are reserved.
Controlled Ref No: XX Revision: B Native file DRIMS No: 1400947213 Page 57 of 175
Uncontrolled when printed. Refer to electronic version for most up to date information.
11. ABBREVIATIONS
Acronym Description
AFMA Australian Fisheries Management Authority
AIMS Australian Institute of Marine Science
ALARP As low as reasonably practicable
AMOSC Australian Marine Oil Spill Centre
AMSA Australian Maritime Safety Authority
ANZECC Australian and New Zealand Environment and Conservation Council
APPEA Australian Petroleum Production and Exploration Association
AUSREP Australian Ship Reporting System
BDV Blowdown valve
BIA Biologically Important Area
BoM Bureau of Meteorology
BTEX Benzene, toluene, ethylbenzene and xylenes
CCR Central Control Room
CICC Corporate Incident Communication Centre
CP Cathodic protection
dB Decibels
DCS NRC control system
DEHP di (2-ethylhexyl) phthalate
DoEE Department of the Environment and Energy
DMIRS Department of Mining, Industry Regulation and Safety
DP Dynamic positioning
DSEWPaC Department of Sustainability, Environment, Water, Population and Communities
EET Emission Estimation Techniques
EEZ Exclusive Economic Zone
EP Environment Plan
EPBC Act Environment Protection and Biodiversity Conservation Act
EPOs Environmental performance outcomes
EPS Environment Performance Standards
ESD Ecological Sustainable Development
ERP Emergency Response Plan
FPSO Floating production storage and offloading
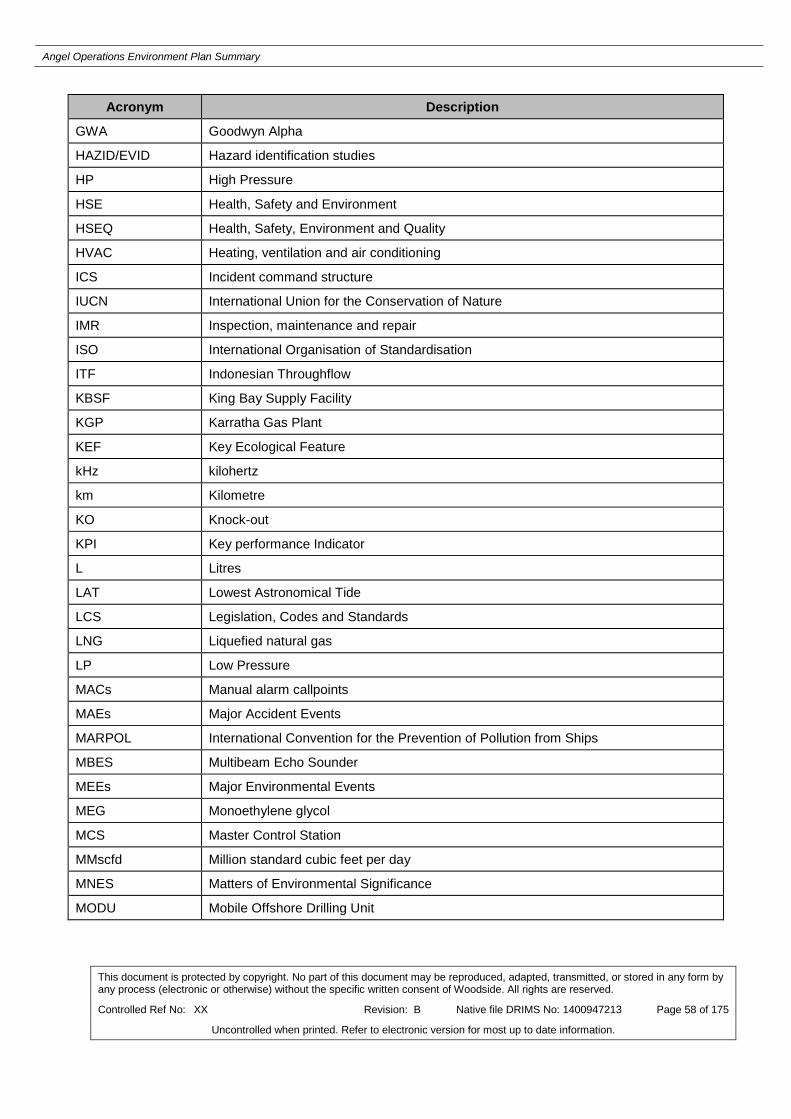
Angel Operations Environment Plan Summary
This document is protected by copyright. No part of this document may be reproduced, adapted, transmitted, or stored in any form by any process (electronic or otherwise) without the specific written consent of Woodside. All rights are reserved.
Controlled Ref No: XX Revision: B Native file DRIMS No: 1400947213 Page 58 of 175
Uncontrolled when printed. Refer to electronic version for most up to date information.
Acronym Description
GWA Goodwyn Alpha
HAZID/EVID Hazard identification studies
HP High Pressure
HSE Health, Safety and Environment
HSEQ Health, Safety, Environment and Quality
HVAC Heating, ventilation and air conditioning
ICS Incident command structure
IUCN International Union for the Conservation of Nature
IMR Inspection, maintenance and repair
ISO International Organisation of Standardisation
ITF Indonesian Throughflow
KBSF King Bay Supply Facility
KGP Karratha Gas Plant
KEF Key Ecological Feature
kHz kilohertz
km Kilometre
KO Knock-out
KPI Key performance Indicator
L Litres
LAT Lowest Astronomical Tide
LCS Legislation, Codes and Standards
LNG Liquefied natural gas
LP Low Pressure
MACs Manual alarm callpoints
MAEs Major Accident Events
MARPOL International Convention for the Prevention of Pollution from Ships
MBES Multibeam Echo Sounder
MEEs Major Environmental Events
MEG Monoethylene glycol
MCS Master Control Station
MMscfd Million standard cubic feet per day
MNES Matters of Environmental Significance
MODU Mobile Offshore Drilling Unit

Angel Operations Environment Plan Summary
This document is protected by copyright. No part of this document may be reproduced, adapted, transmitted, or stored in any form by any process (electronic or otherwise) without the specific written consent of Woodside. All rights are reserved.
Controlled Ref No: XX Revision: B Native file DRIMS No: 1400947213 Page 59 of 175
Uncontrolled when printed. Refer to electronic version for most up to date information.
Acronym Description
MoU Memorandum of Understanding
MPA Marine Protected Area
MSPS Management System Performance Standards
NEPM National Environmental Protection Measure
NGERS National Greenhouse and Energy Reporting
NIMS Non-indigenous Marine Species
NNM Not Manually Manned
NOAA National Oceanic and Atmospheric Administration
NOEC No observed effect concentrations
NOPSEMA National Offshore Petroleum Safety and Environmental Management Authority
NORM Naturally occurring radioactive material
NPI National Pollutant Inventory
NRC North Rankin Complex
NT Northern Territory
NWMR North West Marine Region
NWS North West Shelf
OCNS Offshore Chemical Notification Scheme
OIW Oil in water
OMDAMP Offshore Marine Discharges Adaptive Management Plan
OPEP Oil Pollution Emergency Plan
OPGGS Act Offshore Petroleum and Greenhouse Gas Storage
OVID Offshore Vessel Inspection Database
PAH Polycyclic aromatic hydrocarbon
PAR Photosynthetically active radiation
PCS Process Control System
PFW Produced formation water
PHD Process historian database
PJ Professional Judgement
PLONOR Pose little or no risk
PMST Protected Matters Search Tool
PNEC Predicted No-effect concentration
POB Personnel on board
PSU Practical salinity units

Angel Operations Environment Plan Summary
This document is protected by copyright. No part of this document may be reproduced, adapted, transmitted, or stored in any form by any process (electronic or otherwise) without the specific written consent of Woodside. All rights are reserved.
Controlled Ref No: XX Revision: B Native file DRIMS No: 1400947213 Page 60 of 175
Uncontrolled when printed. Refer to electronic version for most up to date information.
Acronym Description
PSV Pressure safety Valves
PTS Permanent threshold shift
PW Produced Water
RBA Risk Based Analysis
RESDV Riser Emergency Shutdown Valve
ROV Remotely operated vehicle
SBP Sub-bottom profiler
SCE Safety and Environmental Critical Element
SCEW Standing Council on Environment and Water
SCM Subsea Control Module
SCQ Safety and Environmental Critical Equipment
SCSSV Surface controlled sub-surface safety valves
SEL Sound exposure level
SOPEP Ship Oil Pollution Emergency Plan
SPL Sound pressure level
SSS Side Scan Sonar
SV Societal Values
SVOC Semi-volatile organic chemicals
TEG Triethylene glycol
TL Transmission loss
TPH Total petroleum hydrocarbon
TRH Total recoverable hydrocarbon
TTS Temporary threshold shift
UK United Kingdom
UPS Battery power system
USEPA U.S. Environmental Protection Agency
UTA Umbilical Termination Assemblies
UV Ultra violet
VOC Volatile organic compound
WA Western Australia
WAF Water accommodated fraction
WAFIC Western Australian Fishing Industry council
WET Whole effluent Toxicity

Angel Operations Environment Plan Summary
This document is protected by copyright. No part of this document may be reproduced, adapted, transmitted, or stored in any form by any process (electronic or otherwise) without the specific written consent of Woodside. All rights are reserved.
Controlled Ref No: XX Revision: B Native file DRIMS No: 1400947213 Page 61 of 175
Uncontrolled when printed. Refer to electronic version for most up to date information.
Acronym Description
WHA World Heritage Area
WMS Woodside Management System
WOMP Well Operations Management Plan
ZoC Zone of Consequence

Angel Operations Environment Plan Summary
This document is protected by copyright. No part of this document may be reproduced, adapted, transmitted, or stored in any form by any process (electronic or otherwise) without the specific written consent of Woodside. All rights are reserved.
Controlled Ref No: XX Revision: B Native file DRIMS No: 1400947213 Page 62 of 175
Uncontrolled when printed. Refer to electronic version for most up to date information.
12. REFERENCES Abascal, F.J., Quintans, M., Ramos-Cartelle, A., Mejuto, J., 2011. Movements and environmental preferences of the shortfin mako, Isurus oxyrinchus, in the southeastern Pacific Ocean. Marine Biology 158: 1175–1184.
Aichinger Dias, L., Litz, J., Garrison, L., Martinez, A., Barry, K., Speakman, T., 2017. Exposure of cetaceans to petroleum products following the Deepwater Horizon oil spill in the Gulf of Mexico. Endangered Species Research 33: 119–125. doi:10.3354/esr00770
APASA. 2012. Angel Spill Risk Assessment. Report prepared for Woodside Energy. Revision 0, 12
December 2012. Perth, WA.
Australian Institute of Marine Science, 2014a. AIMS 2013 biodiversity survey of Glomar Shoal and Rankin Bank (Report prepared by the Australian Institute of Marine Science for Woodside Energy Ltd.). Australian Institute of Marine Science, Townsville.
Australian Institute of Marine Science, 2014b. AIMS 2013 biodiversity survey of Glomar Shoal and Rankin Bank (Report prepared by the Australian Institute of Marine Science for Woodside Energy Ltd.). Australian Institute of Marine Science, Townsville.
Australian Institute of Marine Science, 2014c. Extended benthic models and habitat maps of Rankin Bank (Report prepared by the Australian Institute of Marine Science for Woodside Energy Ltd.). Australian Institute of Marine Science, Townsville.
Australian Radiation Protection and Nuclear Safety Agency, 2008. Management of naturally occurring radioactive material (NORM) (Radiation Protection Series No. 15). Australian Radiation Protection and Nuclear Safety Agency, Canberra.
Baker, C., Potter, A., Tran, M., Heap, A.D., 2008. Sedimentology and geomorphology of the northwest marine region: a spatial analysis (Geoscience Australia Record No. 2008/07). Geoscience Australia, Canberra.
Bamford, M., Watkins, D., Bancroft, W., Tischler, G., Wahl, J., 2008. Migratory shorebirds of the East Asian-Australasian flyway: population estimates and internationally important sites. Wetlands International - Oceania, Canberra.
Bannister, J., Kemper, C.M., Warneke, R.M., 1996. The action plan for Australian cetaceans. Australian Nature Conservation Agency, Canberra.
Batteen, M.L., Rutherford, M.J., Bayler, E.J., 1992. A numerical study of wind-and thermal-forcing effects on the ocean circulation off Western Australia. Journal of Physical Oceanography 22: 1406–1433.
Batten, S., Allen, R., Wotton, C., 1998. The effects of the Sea Empress oil spill on the plankton of the southern Irish Sea. Marine Pollution Bulletin 36: 764–774.
Bishop, S., Francis, M., Duffy, C., Montgomery, J., 2006. Age, growth, maturity, longevity and natural mortality of the shortfin mako shark (Isurus oxyrinchus) in New Zealand waters. Marine and Freshwater Research 57: 143–154.
BMT Oceanica, 2015a. Offshore water quality monitoring verification and sediment quality study - Goodwyn A survey report (No. 1178_003/1 Rev 0). BMT Oceanica Pty Ltd, Perth.
BMT Oceanica, 2015b. Offshore water quality monitoring verification and sediment quality study - Goodwyn A survey report (No. 1178_003/1 Rev 0). BMT Oceanica Pty Ltd, Perth.
Bonn Agreement, 2015. Bonn Agreement Counter Pollution Manual, December 2015. ed. Bonn Agreement Secretariat, London.
Braccini, M., O’Malley, J., 2017. Temperate demersal gillnet and demersal longline resource status report 2016, in: Fletcher, W., Mumme, M., Webster, F. (Eds.), Status Reports of the Fisheries and
Angel Operations Environment Plan Summary
This document is protected by copyright. No part of this document may be reproduced, adapted, transmitted, or stored in any form by any process (electronic or otherwise) without the specific written consent of Woodside. All rights are reserved.
Controlled Ref No: XX Revision: B Native file DRIMS No: 1400947213 Page 63 of 175
Uncontrolled when printed. Refer to electronic version for most up to date information.
Aquatic Resources of Western Australia 2015/2016: State of the Fisheries. Department of Fisheries, Perth, pp. 202–206.
Brewer, D., Lyne, V., Skewes, T., Rothlisberg, P., 2007. Trophic systems of the North-west Marine Region. CSIRO Marine and Atmospheric Research, Cleveland.
Bruce, B., 2013. Shark futures: a synthesis of available data on mako and porbeagle sharks in Australiasian waters. Current and future directions (Tactical Research Fund No. FRDC 2011/045). Fisheries Research and Development Corporation, Canberra.
Bruce, B.D., 2008. The biology and ecology of the white shark, Carcharodon carcharias, in: Camhi, M.D., Pikitch, E.K., Babcock, E.A. (Eds.), Sharks of the Open Ocean : Biology, Fisheries and Conservation. Blackwell Publishing Limited, Oxford, pp. 69–81.
Bruce, B.D., Stevens, J.D., Malcolm, H., 2006. Movements and swimming behaviour of white sharks (Carcharodon carcharias) in Australian waters. Marine Biology 150: 161–172.
Burbidge, A.A., Fuller, P.J., 1989. Numbers of breeding seabirds on Pelsaert Island, Houtman Abrolhos, Western Australia. Corella 13: 57–61.
Bureau of Meteorology, n.d. Tropical Cyclones Affecting the Karratha/Dampier/Roebourne region [WWW Document]. Tropical Cyclones Affecting the Karratha/Dampier/Roebourne region. URL http://www.bom.gov.au/cyclone/history/wa/roebourne.shtml (accessed 1.23.18).
Bureau of Meteorology, n.d. Karratha Aero [WWW Document]. Climate data online. URL http://www.bom.gov.au/climate/averages/tables/cw_004083.shtml (accessed 7.7.17).
Campana, S.E., Marks, L., Joyce, W., 2005. The biology and fishery of shortfin mako sharks (Isurus oxyrinchus) in Atlantic Canadian waters. Fisheries Research 73: 341–352. doi:10.1016/j.fishres.2005.01.009
Campbell, R., 2005. Historical distribution and abundance of the Australian sea lion (Neophoca cinerea) on the west coast of Australia (Fisheries Research Report No. 148). Department of Fisheries, North Beach.
Campbell, R.., Gales, N.., Lento, G.., Baker, C.., 2008. Islands in the sea: extreme female natal site fidelity in the Australian sea lion, Neophoca cinerea. Biology Letters 4: 139–142. doi:10.1098/rsbl.2007.0487
Cassata, L., Collins, L.B., 2008. Coral reef communities, habitats, and substrates in and near sanctuary zones of Ningaloo Marine Park. Journal of Coastal Research 139–151.
Cavanagh, R.D., Kyne, P.M., Fowler, S.L., Musick, J.A., Bennett, M.B. (Eds.), 2003. The conservation status of Australasian chondrichthyans: report of the IUCN Shark Specialist Group Australia and Oceanica Regional Red List Group. Presented at the IUCN Shark Specialist Group. Australia and Oceania Regional Red List Workshop, University of Queensland, Brisbane, p. 170.
Chandrapavan, A., Sporer, E., Oliver, R., Cavalli, P., 2017. Shark Bay blue swimmer crab resource status report 2016, in: Fletcher, W., Mumme, M., Webster, F. (Eds.), Status Reports of the Fisheries and Aquatic Resources of Western Australia 2015/2016: State of the Fisheries. Department of Fisheries, Perth, pp. 95–98.
Chevron Australia Pty Ltd, 2010. Draft Environmental Impact Statement/Environmental Review and Management Programme for the proposed Wheatstone Project (Environmental Impact Statement). Chevron Australia Pty Ltd, Perth.
Chevron Australia Pty Ltd, 2014. Wheatstone project conservation significant marine fauna interaction management plan (No. WS0–0000–HES–PLN–CVX–000–00037–000 Rev 5). Chevron Australia Pty Ltd, Perth.
Chevron Australia Pty Ltd, 2015. Gorgon gas development and Jansz feed gas pipeline: Long-term marine turtle management plan (No. G1- NT-PLNX0000296). Chevron Australia Pty Ltd, Perth.

Angel Operations Environment Plan Summary
This document is protected by copyright. No part of this document may be reproduced, adapted, transmitted, or stored in any form by any process (electronic or otherwise) without the specific written consent of Woodside. All rights are reserved.
Controlled Ref No: XX Revision: B Native file DRIMS No: 1400947213 Page 64 of 175
Uncontrolled when printed. Refer to electronic version for most up to date information.
Chidlow, J., Gaughan, D., McAuley, R., 2006. Identification of Western Australian grey nurse shark aggregation sites: final report to the Australian Government, Department of Environment and Heritage (Fisheries Research Report No. 155). Department of Fisheries, Perth.
Clancy, G.P., 2005. Feeding behaviour of the osprey (Pandion haliaetus) on the north coast of New South Wales. Corella 29: 91–96.
Cohen, A., Gagnon, M.M., Nugegoda, D., 2005. Alterations of metabolic enzymes in Australian bass, Macquaria novemaculeata, after exposure to petroleum hydrocarbons. Archives of Environmental Contamination and Toxicology 49: 200–205. doi:10.1007/s00244-004-0174-1
Commonwealth of Australia, 2015a. Conservation management plan for the blue whale: A recovery plan under the Environment Protection and Biodiversity Conservation Act 1999 2015-2025. Department of the Environment, Canberra.
Commonwealth of Australia, 2015b. Sawfish and river shark multispecies recovery plan (Recovery Plan). Department of the Environment, Canberra.
Commonwealth of Australia, 2015c. Wildlife conservation plan for migratory shorebirds. Department of the Environment, Canberra.
Commonwealth of Australia, 2017. Recovery plan for marine turtles in Australia 2017-2027. Department of the Environment and Energy, Canberra.
Condie, S., Andrewartha, J., Mansbridge, J., Waring, J., 2006. Modelling circulation and connectivity on Australia’s North West (Technical Report No. 6), North West Shelf Joint Environmental Management Study. CSIRO Marine and Atmospheric Research, Perth.
Corkeron, P.J., Morissette, N.M., Porter, L., Marsh, H., 1997. Distribution and status of hump-backed dolphins Sousa chinensis in Australian waters. Asian Marine Biology 14: 49–59.
Couturier, L.I.E. Jaine, F.R.A., Townsend, K.A., Weeks, S.J., Richardson, A.J., Bennett, M.B., 2011. Distribution, site affinity and regional movements of the manta ray, Manta alfredi (Krefft, 1868), along the east coast of Australia. Marine and Freshwater Research 62: 628. doi:10.1071/MF10148
Craig, P.D., 1988. A numerical model study of internal tides on the Australian Northwest Shelf. Journal of Marine Research 46: 59–76.
Cresswell, G., 1991. The Leeuwin Current - observations and recent models. Journal of the Royal Society of Western Australia 74: 1–14.
Dall, W., Hill, B., Rothlisberg, P., Sharples, D., 1990. The biology of the Penaeidae., in: Blaxter, J., Southward, A. (Eds.), Advances in Marine Biology. Academic Press, London, p. 504.
D’Anastasi, B., Simpfendorfer, C., van Herwerden, L., 2013. Anoxypristis cuspidata (Knifetooth Sawfish, Narrow Sawfish, Pointed Sawfish) [WWW Document]. The IUCN Red List of Threatened Species. URL http://www.iucnredlist.org/details/39389/0 (accessed 7.25.17).
Davis, T.L., Jenkins, G.P., Young, J.W., 1990. Diel patterns of vertical distribution in larvae of southern bluefin Thunnus maccoyii, and other tuna in the East Indian Ocean. Marine Ecology Progress Series 59: 63–74.
de Lestang, S., Rossbach, M., 2017. West coast rock lobster resource status report 2016, in: Fletcher, W., Mumme, M., Webster, F. (Eds.), Status Reports of the Fisheries and Aquatic Resources of Western Australia 2015/2016: State of the Fisheries. Department of Fisheries, Perth, pp. 34–38.
Deakos, M., Baker, J., Bejder, L., 2011. Characteristics of a manta ray Manta alfredi -population off Maui, Hawaii, and implications for management. Marine Ecology Progress Series 429: 245–260. doi:10.3354/meps09085
Dean, T.A., Stekoll, M.S., Jewett, S.C., Smith, R.O., Hose, J.E., 1998. Eelgrass (Zostera marina L.) in Prince William Sound, Alaska: Effects of the Exxon Valdez oil spill. Marine Pollution Bulletin 36: 201–210.
Angel Operations Environment Plan Summary
This document is protected by copyright. No part of this document may be reproduced, adapted, transmitted, or stored in any form by any process (electronic or otherwise) without the specific written consent of Woodside. All rights are reserved.
Controlled Ref No: XX Revision: B Native file DRIMS No: 1400947213 Page 65 of 175
Uncontrolled when printed. Refer to electronic version for most up to date information.
Deepwater Horizon Natural Resource Damage Assessment Trustees, 2016. Deepwater Horizon oil spill: final programmatic damage assessment and restoration plan and final programmatic environmental impact statement. National Oceanic and Atmospheric Administration, Silver Spring.
Department of Conservation and Land Management, 1996. Shark Bay Marine Reserves. Management Plan. 1996-2006 (No. 34), Marine Conservation Branch, Management Plan.
Department of Conservation and Land Management, 2005. Management Plan for the Ningaloo Marine Park and Muiron Islands Marine Management Area 2005 - 2015 (Management Plan No. 52). Department of Conservation and Land Management, Perth.
Department of Environment and Conservation, 2007. Management plan for the Montebello/Barrow Islands Marine Conservation Reserves. Marine Parks and Reserves Authority, Perth.
Department of Environmental Protection, 2001. Shark Bay World Heritage Property: Environmental values, cultural uses and potential petroleum industry impacts. Department of Environmental Protection, Perth.
Department of Fisheries, 2004. Plan of Management for the Point Quobba Fish Habitat Protection Area (185), Fisheries Management Paper.
Department of Fisheries, 2010. A bycatch action plan for the Pilbara fish trawl interim managed fishery (Fisheries Management Paper No. 244). Department of Fisheries, Perth.
Department of Fisheries, 2012. The Houtman Abrolhos Islands management plan (Fisheries Management Paper No. 260), Fisheries Management Paper. Department of Fisheries, Perth.
Department of Fisheries, 2015a. Point Quobba Fish Habitat Protection Area (FHPA).
Department of Fisheries, 2015b. The Abrolhos Islands Information Guide.
Department of Primary Industries and Regional Development, 2013. Abrolhos Islands [WWW Document]. Fisheries. URL http://www.fish.wa.gov.au/Sustainability-and-Environment/Abrolhos-Islands/Pages/default.aspx (accessed 2.22.18).
Department of Sustainability, Environment, Water, Population and Communities, 2011. National recovery plan for threatened albatrosses and giant petrels. Department of Sustainability, Environment, Water, Population and Communities, Canberra.
Department of Sustainability, Environment, Water, Population and Communities, 2012a. Marine bioregional plan for the North-west Marine Region: prepared under the Environment Protection and Biodiversity Conservation Act 1999. Department of Sustainability, Environment, Water, Population and Communities, Canberra.
Department of Sustainability, Environment, Water, Population and Communities, 2012b. Conservation management plan for the southern right whale: a recovery plan under the Environment Protection and Biodiversity Conservation Act 1999 2011-2021. Department of Sustainability, Environment, Water, Population and Communities, Canberra.
Department of Sustainability, Environment, Water, Population and Communities, 2012c. Species group report card - seabirds and migratory shorebirds. Supporting the marine bioregional plan for the North-west Marine Region prepared under the Environment Protection and Biodiversity Conservation Act 1999. Department of Sustainability, Environment, Water, Population and Communities, Canberra.
Department of Sustainability, Environment, Water, Population and Communities, 2012d. Marine bioregional plan for the South-west Marine Region: prepared under the Environment Protection and Biodiversity Conservation Act 1999. Department of Sustainability, Environment, Water, Population and Communities, Canberra.
Department of Sustainability, Environment, Water, Population and Communities, 2013a. Recovery plan for the Australian sea lion (Neophoca cinerea). Department of Sustainability, Environment, Water, Population and Communities, Canberra.
Angel Operations Environment Plan Summary
This document is protected by copyright. No part of this document may be reproduced, adapted, transmitted, or stored in any form by any process (electronic or otherwise) without the specific written consent of Woodside. All rights are reserved.
Controlled Ref No: XX Revision: B Native file DRIMS No: 1400947213 Page 66 of 175
Uncontrolled when printed. Refer to electronic version for most up to date information.
Department of Sustainability, Environment, Water, Population and Communities, 2013b. Recovery plan for the white shark (Carcharodon carcharias). Department of Sustainability, Environment, Water, Population and Communities, Canberra.
Department of the Enviroment and Energy, 2017. Balaenoptera borealis — Sei Whale [WWW Document]. Species Profile and Threats Database. URL http://www.environment.gov.au/cgi-bin/sprat/public/publicspecies.pl?taxon_id=34 (accessed 7.10.17).
Department of the Environment, 2013. Aipysurus apraefrontalis — Short-nosed Seasnake [WWW Document]. Species Profile and Threats Database. URL http://www.environment.gov.au/cgi-bin/sprat/public/publicspecies.pl?taxon_id=1115 (accessed 11.15.13).
Department of the Environment, 2014. Recovery plan for the grey nurse shark (Carcharias taurus). Department of the Environment, Canberra.
Department of the Environment, 2016. Pandion cristatus — Eastern Osprey [WWW Document]. Species Profile and Threats Database. URL http://www.environment.gov.au/cgi-bin/sprat/public/publicspecies.pl?taxon_id=952 (accessed 8.16.16).
Department of the Environment, n.d. Abrolhos Commonwealth Marine Reserve - Overview [WWW Document]. Abrolhos Commonwealth Marine Reserve. URL https://www.environment.gov.au/topics/marine/marine-reserves/south-west/abrolhos-maps (accessed 1.6.16).
Department of the Environment and Energy, n.d. Australian National Shipwreck Database [WWW Document]. Australian National Shipwreck Database. URL http://www.environment.gov.au/heritage/historic-shipwrecks/australian-national-shipwreck-database (accessed 8.17.16a).
Department of the Environment and Energy, n.d. Montebello Commonwealth Marine Reserve - Overview [WWW Document]. Montebello Commonwealth Marine Reserve. URL https://www.environment.gov.au/topics/marine/marine-reserves/north-west/montebello (accessed 8.30.16b).
Department of the Environment and Energy, n.d. Ningaloo Commonwealth Marine Reserve (renamed) - Home page [WWW Document]. Ningaloo Commonwealth Marine Reserve. URL https://www.environment.gov.au/topics/marine/marine-reserves/north-west/ningaloo (accessed 8.30.16c).
Department of the Environment and Energy, n.d. Gascoyne Commonwealth Marine Reserve - Overview [WWW Document]. Gascoyne Commonwealth Marine Reserve. URL https://www.environment.gov.au/topics/marine/marine-reserves/north-west/gascoyne (accessed 8.30.16d).
Department of the Environment and Energy, n.d. Dampier Commonwealth Marine Reserve - Overview [WWW Document]. Dampier Commonwealth Marine Reserve. URL http://www.environment.gov.au/topics/marine/marine-reserves/north-west/dampier (accessed 2.22.18e).
Department of the Environment and Energy, n.d. Eighty Mile Beach Commonwealth Marine Reserve - Overview [WWW Document]. Eighty Mile Beach Commonwealth Marine Reserve. URL http://www.environment.gov.au/topics/marine/marine-reserves/north-west/eighty-mile-beach (accessed 2.22.18f).
Department of the Environment and Energy, n.d. Argo-Rowley Terrace Commonwealth Marine Reserve - Overview [WWW Document]. Argo-Rowley Terrace Commonwealth Marine Reserve. URL https://www.environment.gov.au/topics/marine/marine-reserves/north-west/argo-rowley-terrace (accessed 8.30.16g).
Department of the Environment and Energy, n.d. Shark Bay Commonwealth Marine Reserve - Overview [WWW Document]. Shark Bay Commonwealth Marine Reserve. URL

Angel Operations Environment Plan Summary
This document is protected by copyright. No part of this document may be reproduced, adapted, transmitted, or stored in any form by any process (electronic or otherwise) without the specific written consent of Woodside. All rights are reserved.
Controlled Ref No: XX Revision: B Native file DRIMS No: 1400947213 Page 67 of 175
Uncontrolled when printed. Refer to electronic version for most up to date information.
https://www.environment.gov.au/topics/marine/marine-reserves/north-west/shark-bay (accessed 8.30.16h).
Department of the Environment and Energy, n.d. Canyons linking the Cuvier Abyssal Plain and the Cape Range Peninsula [WWW Document]. Key Ecological Features. URL https://www.environment.gov.au/sprat-public/action/kef/view/13;jsessionid=CEF7F8BE82BB2801CBCE6CB1BD24AB12 (accessed 2.5.17i).
Department of the Environment and Heritage, 2005a. Whale shark (Rhyncodon typus) recovery plan 2005-2010. Department of the Environment and Heritage, Canberra.
Department of the Environment and Heritage, 2005b. Blue, fin and sei whale recovery plan 2005 - 2010 (Recovery Plan). Department of the Environment and Heritage, Canberra.
Department of the Environment, Water, Heritage and the Arts, 2009. Threat abatement plan for the impacts of marine debris on vertebrate marine life. Department of the Environment, Water, Heritage and the Arts, Canberra.
Department of the Environment, Water, Heritage and the Arts, 2010. Legislative changes for recreational fishing of three shark species. Department of the Environment, Water, Heritage and the Arts, Canberra.
Department of the Environment, Water, Heritage and the Arts, 2008. The north-west marine bioregional plan: bioregional profile. Department of the Environment, Water, Heritage and the Arts, Canberra.
Director of National Parks, 2017a. Draft North-west Commonwealth Marine Reserves Network Management Plan. Director of National Parks, Canberra.
Director of National Parks, 2017b. DRAFT North Commonwealth Marine Reserves Network Management Plan. Director of National Parks, Canberra.
Dix, G.R., James, N.P., Kyser, T.K., Bone, Y., Collins, L.B., 2005. Genesis and dispersal of carbonate mud relative to late quaternary sea-level change along a distally-steepened carbonate ramp (Northwestern Shelf, Western Australia). Journal of Sedimentary Research 75: 665–678.
Double, M., Gales, N., Jenner, K., Jenner, M., 2010. Satellite tracking of south-bound female humpback whales in the Kimberley region of Western Australia. Australian Marine Mammal Centre, Hobart.
Double, M., Jenner, K., Jenner, M., Ball, I., Childerhouse, S., Loverick, S., Gales, N., 2012a. Satellite tracking of northbound humpback whales (Megaptera novaeangliae) off Western Australia. Australian Marine Mammal Centre, Hobart.
Double, M., Jenner, K., Jenner, M.-N., Ball, I., Laverick, S., Gales, N., 2012b. Satellite tracking of pygmy blue whales (Balaenoptera musculus brevicauda) off Western Australia. Australian Marine Mammal Centre, Hobart.
Double, M.C., Andrews-Goff, V., Jenner, K.C.S., Jenner, M.-N., Laverick, S.M., Branch, T.A., Gales, N.J., 2014. Migratory movements of pygmy blue whales (Balaenoptera musculus brevicauda) between Australia and Indonesia as revealed by satellite telemetry. PloS one 9: e93578.
Dunlop, J., Wooller, R., Cheshire, N., 1988. Distribution and abundance of marine birds in the Eastern Indian Ocean. Marine and Freshwater Research 39: 661–669.
Ecotox Services Australia, 2012. Toxicity assessment of a fresh and weathered condensate and crude oil. Ecotox Services Australia, Lane Cove.
Environment Australia, 2002. Ningaloo marine park (Commonwealth waters) management plan. Environment Australia, Canberra.
EPI Group, 2017. Sperm Whale Detections 3rd Dec 2016 - 27th April 2017.
Angel Operations Environment Plan Summary
This document is protected by copyright. No part of this document may be reproduced, adapted, transmitted, or stored in any form by any process (electronic or otherwise) without the specific written consent of Woodside. All rights are reserved.
Controlled Ref No: XX Revision: B Native file DRIMS No: 1400947213 Page 68 of 175
Uncontrolled when printed. Refer to electronic version for most up to date information.
Exon, N., Willcox, J., 1980. The Exmouth Plateau: Stratigraphy, structure and petroleum potential (BMR Bulletin No. 199). Department of National Development and Energy, Canberra.
Fairclough, D., Holtz, M., Fletcher, W., Mumme, MD, Webster, F., 2017. West coast demersal scalefish resource status report 2016, in: Status Reports of the Fisheries and Aquatic Resources of Western Australia 2015/2016: State of the Fisheries. Department of Fisheries, Perth, pp. 66–71.
Falkner, I., Whiteway, T., Przeslawski, R., Heap, A.D., 2009. Review of Ten Key Ecological Features (KEFs) in the Northwest Marine Region: a report to the Department of the Environment, Water, Heritage and the Arts by Geoscience Australia, Geoscience Australia Record. Geoscience Australia, Canberra.
Fletcher, W., Friedman, K., Weir, V., McCrea, J., Clark, R., 2006. Pearl oyster fishery, ESD Report Series. Department of Fisheries, North Beach.
Fletcher, W., Mumme, M., Webster, F., 2017. Status reports of the fisheries and aquatic resources of Western Australia 2015/2016: State of the fisheries. Department of Fisheries, Perth.
Fodrie, F.J., Heck, K.L., 2011. Response of coastal fishes to the Gulf of Mexico oil disaster. PLoS ONE 6: e21609. doi:10.1371/journal.pone.0021609
French, D.P., Schuttenberg, H.Z., Isaji, T., 1999. Probabilities of oil exceeding thresholds of concern: examples from an evaluation for Florida Power and Light. Presented at the Arctic and Marine Oilspill Program Technical Seminar, Ministry of Supply and Services, Ottawa, pp. 243–270.
French-McCay, D., 2009. State-of-the-art and research needs for oil spill impact assessment modeling, in: Proceedings of the 32nd AMOP Technical Seminar on Environmental Contamination and Response. Presented at the 32nd AMOP Technical Seminar on Environmental Contamination and Response, Environment Canada, Ottawa, pp. 601–653.
Furnas, M., Mitchell, A., 1999. Wintertime carbon and nitrogen fluxes on Australia’s Northwest Shelf. Estuarine, Coastal and Shelf Science 49: 165–175.
Gagnon, M.M., Rawson, C., 2010. Montara well release: Report on necropsies from a Timor Sea green turtle. Curtin University, Perth.
Geraci, J., 1988. Physiologic and toxicologic effects of cetaceans, in: Geraci, J., St Aubin, D. (Eds.), Synthesis of Effects of Oil on Marine Mammals, OCS Study. Department of Interior, Ventura, pp. 168–202.
Gilmour, J., Smith, L., Pincock, S., Cook, K., 2013. Discovering Scott Reef: 20 years of exploration and research. Australian Institute of Marine Science, Townsville.
Godfrey, J., Ridgway, K., 1985. The large-scale environment of the poleward-flowing Leeuwin Current, Western Australia: longshore steric height gradients, wind stresses and geostrophic flow. Journal of Physical Oceanography 15: 481–495.
Goldsworthy, S., McKenzie, J., Shaughnessy, P., McIntosh, R., Page, B., Campbell, R., 2009. An update of the report: Understanding the impediments to the growth of Australian sea lion populations (SARDI Research Report Series No. 356). South Australian Reserach and Development Institute, Adelaide.
Gratwicke, B., Speight, M.R., 2005. The relationship between fish species richness, abundance and habitat complexity in a range of shallow tropical marine habitats. Journal of Fish Biology 66: 650–667.
Guinea, M., Limpus, C., Whiting, S., 2004. Marine snakes, in: Description of Key Species Groups in the Northern Planning Area. National Oceans Office, Hobart, pp. 137–146.
Hanson, C.E., Waite, A.M., Thompson, P.A., Pattiaratchi, C.B., 2007. Phytoplankton community structure and nitrogen nutrition in Leeuwin Current and coastal waters off the Gascoyne region of Western Australia. Deep Sea Research Part II: Topical Studies in Oceanography 54: 902–924.

Angel Operations Environment Plan Summary
This document is protected by copyright. No part of this document may be reproduced, adapted, transmitted, or stored in any form by any process (electronic or otherwise) without the specific written consent of Woodside. All rights are reserved.
Controlled Ref No: XX Revision: B Native file DRIMS No: 1400947213 Page 69 of 175
Uncontrolled when printed. Refer to electronic version for most up to date information.
Hart, A., Crowe, K., 2015. Specimen shell managed fishery status report, in: Fletcher, W., Santoro, K. (Eds.), Status Reports of the Fisheries and Aquatic Resources of Western Australia 2014/15: The State of the Fisheries. Department of Fisheries, Perth, pp. 306–308.
Hart, A., Murphy, D., Jones, R., 2017. North coast pearl oyster resource status report 2016, in: Fletcher, W., Mumme, M., Webster, F. (Eds.), Status Reports of the Fisheries and Aquatic Resources of Western Australia 2015/2016: State of the Fisheries. Department of Fisheries, Perth, pp. 158–161.
Hassan, A., Javed, H., 2011. Effects of Tasman Spirit oil spill on coastal birds at Clifton, Karachi coast, Pakistan. Journal of Animal and Plant Sciences 21: 333–339.
Hazel, J., Lawler, I.R., Marsh, H., Robson, S., 2007. Vessel speed increases collision risk for the green turtle Chelonia mydas. Endangered Species Research 3: 105–113.
Heap, A.D., Harris, P.T., Hinde, A., Woods, M., 2005. Benthic marine bioregionalisation of Australia’s Exclusive Economic Zone (Geoscience Australia). Geoscience Australia, Canberra.
Heatwole, H., Cogger, H.G., 1993. Chapter 36: Family Hydrophiidae, in: Fauna of Australia. Australian Government Publishing Service, Canberra.
Heck Jr., K.L., Hays, G., Orth, R.J., 2003. Critical evaluation of the nursery role hypothesis for seagrass meadows. Marine Ecology Progress Series 253: 123–136.
Heintz, R.A., Rice, S.D., Wertheimer, A.C., Bradshaw, R.F., Thrower, F.P., Joyce, J.E., Short, J.W., 2000. Delayed effects on growth and marine survival of pink salmon Oncorhynchus gorbuscha after exposure to crude oil during embryonic development. Marine Ecology Progress Series 208: 205–216.
Helm, R.C., Costa, D.P., DeBruyn, T.D., O’Shea, T.J., Wells, R.S., Williams, T.M., 2015. Overview of effects of oil spills on marine mammals, in: Fingas, M. (Ed.), Handbook of Oil Spill Science and Technology. Wiley, pp. 455–475.
Henkel, J.R., Sigel, B.J., Taylor, C.M., 2012. Large-scale impacts of the Deepwater Horizon oil spill: Can local disturbance affect distant ecosystems through migratory shorebirds? BioScience 62: 676–685. doi:10.1525/bio.2012.62.7.10
Heyward, A., Jones, R., Meeuwig, J., Burns, K., Radford, B., Colquhoun, J., Cappo, M., Case, M., O’Leary, R., Fisher, R., Meekan, M., Stowar, M., 2012. Montara: 2011 offshore banks assessment survey (Monitoring Study No. S5 Banks & Shoals). Australian Institute of Marine Science, Townsville.
Heyward, A., Rees, M., Wolff, C., Smith, L., 2001. Exploration of biodiversity - data report on benthic habitats and biological collections from an initial benthic survey conducted in the region of WA-271-P. Australian Institute of Marine Science, Perth.
Hjermann, D.Ø., Melsom, A., Dingsør, G.E., Durant, J.M., Eikeset, A.M., Røed, L.P., Ottersen, G., Storvik, G., Stenseth, N.C., 2007. Fish and oil in the Lofoten–Barents Sea system: synoptic review of the effect of oil spills on fish populations. Marine Ecology Progress Series 339: 283–299.
Holloway, P., 1983. Tides on the Australian north-west shelf. Marine and Freshwater Research 34: 213–230.
Holloway, P., Nye, H., 1985. Leeuwin Current and wind distributions on the southern part of the Australian North West Shelf between January 1982 and July 1983. Marine and Freshwater Research 36: 123–137.
Holloway, P.E., Chatwin, P.G., Craig, P., 2001. Internal tide observations from the Australian north west shelf in summer 1995. Journal of Physical Oceanography 31: 1182–1199.
How, J., Yerman, M., 2017. West coast deep sea crab resource status report 2016, in: Fletcher, W., Mumme, M., Webster, F. (Eds.), Status Reports of the Fisheries and Aquatic Resources of Western Australia 2015/2016: State of the Fisheries. Department of Fisheries, Perth, pp. 105–108.

Angel Operations Environment Plan Summary
This document is protected by copyright. No part of this document may be reproduced, adapted, transmitted, or stored in any form by any process (electronic or otherwise) without the specific written consent of Woodside. All rights are reserved.
Controlled Ref No: XX Revision: B Native file DRIMS No: 1400947213 Page 70 of 175
Uncontrolled when printed. Refer to electronic version for most up to date information.
International Petroleum Industry Environmental Conservation Association, 2000. Biological impacts of oil pollution: Sedimentary shores (IPIECA Report Series No. 9). International Petroleum Industry Environmental Conservation Association, London.
International Petroleum Industry Environmental Conservation Association, 2004. A guide to oiled wildlife response planning (IPIECA Report Series No. 13). International Petroleum Industry Environmental Conservation Association, London.
International Tanker Owners Pollution Federation, 2011a. Effects of oil pollution on the marine environment (Technical Information Paper No. 13). International Tanker Owners Pollution Federation Limited, London.
International Tanker Owners Pollution Federation, 2011b. Effects of oil pollution on fisheries and mariculture (Technical Information Paper No. 11). International Tanker Owners Pollution Federation Limited, London.
Jackson, G., Zilles, H., Brown, J., Turner, S., 2017a. Gascoyne inner Shark Bay scalefish resource status report 2016, in: Fletcher, W., Mumme, M., Webster, F. (Eds.), Status Reports of the Fisheries and Aquatic Resources of Western Australia 2015/2016: State of the Fisheries. Department of Fisheries, Perth, pp. 115–120.
Jackson, G., Zilles, H., Turner, S., 2017b. Gascoyne demersal scalefish resource status report 2016, in: Fletcher, W., Mumme, M., Webster, F. (Eds.), Status Reports of the Fisheries and Aquatic Resources of Western Australia 2015/2016: State of the Fisheries. Department of Fisheries, Perth, pp. 109–114.
James, N.P., Bone, Y., Kyser, T.K., Dix, G.R., Collins, L.B., 2004. The importance of changing oceanography in controlling late Quaternary carbonate sedimentation on a high-energy, tropical, oceanic ramp: north-western Australia. Sedimentology 51: 1179–1205. doi:10.1111/j.1365-3091.2004.00666.x
Jarman, S., Wilson, S., 2004. DNA‐based species identification of krill consumed by whale sharks. Journal of Fish Biology 65: 586–591.
Jefferson, T.A., 2000. Population biology of the Indo-Pacific hump-back dolphin in Hong Kong waters. Wildlife Monographs 144: 1–65.
Jefferson, T.A., Rosenbaum, H.C., 2014. Taxonomic revision of the humpback dolphins (Sousa spp.), and description of a new species from Australia. Marine Mammal Science 30: 1494–1541.
Jenner, K., Jenner, M., McCabe, K., 2001. Geographical and temporal movements of humpback whales in Western Australian waters. APPEA Journal 41: 692–707.
Jensen, A., Silber, G., 2004. Large whale ship strike database (NOAA Technical Memorandum No. NMFS-OPR). National Marine Fisheries Service, Silver Spring.
Johansen, J.L., Allan, B.J., Rummer, J.L., Esbaugh, A.J., 2017. Oil exposure disrupts early life-history stages of coral reef fishes via behavioural impairments. Nature Ecology & Evolution 1: 1146–1152. doi:10.1038/s41559-017-0232-5
Joint Carnarvon Basin Operators, 2012. Draft Joint Carnarvon Basin Operators North West Cape Sensitivity Mapping. Apache Energy Ltd, Woodside Energy Ltd, BHP Billiton and Australian Marine Oil Spill Centre, Perth.
Jones, T., Hughes, M., Woods, D., Lewis, A., Chandler, P., 2009. Ningaloo Coast region visitor statistics: collected for the Ningaloo destination modelling project. CRC for Sustainable Tourism, Gold Coast.
Kangas, M., Sporer, E., Wilkin, S., Cavalli, P., Oliver, R., 2017a. Saucer scallop resource status report 2016, in: Fletcher, W., Mumme, M., Webster, F. (Eds.), Status Reports of the Fisheries and Aquatic Resources of Western Australia 2015/2016: State of the Fisheries. Department of Fisheries, Perth, pp. 90–94.

Angel Operations Environment Plan Summary
This document is protected by copyright. No part of this document may be reproduced, adapted, transmitted, or stored in any form by any process (electronic or otherwise) without the specific written consent of Woodside. All rights are reserved.
Controlled Ref No: XX Revision: B Native file DRIMS No: 1400947213 Page 71 of 175
Uncontrolled when printed. Refer to electronic version for most up to date information.
Kangas, M., Sporer, E., Wilkin, S., Cavalli, P., Oliver, R., 2017b. Gascoyne Shark Bay prawn resource status report 2016, in: Fletcher, W., Mumme, M., Webster, F. (Eds.), Status Reports of the Fisheries and Aquatic Resources of Western Australia 2015/2016: State of the Fisheries. Department of Fisheries, Perth, pp. 84–89.
Kangas, M., Sporer, E., Wilkin, S., Koefoed, P., Cavalli, P., Pickles, L., 2017c. Gascoyne Exmouth Gulf prawn resource status report 2016, in: Fletcher, W., Mumme, M., Webster, F. (Eds.), Status Reports of the Fisheries and Aquatic Resources of Western Australia 2015/2016: State of the Fisheries. Department of Fisheries, Perth, pp. 99–104.
King, D., Lyne, R., Girling, A., Peterson, D., Stephenson, R., Short, D., 1996. Environmental risk assessment of petroleum substances: The hydrocarbon block method (CONCAWE No. 96/52). CONCAWE, Brussels.
Kobryn, H.T., Wouters, K., Beckley, L.E., Heege, T., 2013. Ningaloo Reef: Shallow marine habitats mapped using a hyperspectral sensor. PLoS ONE 8: e70105. doi:10.1371/journal.pone.0070105
Koops, W., Jak, R., van der Veen, D., 2004. Use of dispersants in oil spill response to minimize environmental damage to birds and aquatic organisms. Interspill 2004.
Kyne, P., Rigby, C., Simpfendorfer, C., 2013. Pristis clavata (Dwarf Sawfish, Queensland Sawfish) [WWW Document]. Pristis clavata (Dwarf Sawfish, Queensland Sawfish). URL http://www.iucnredlist.org/details/39390/0 (accessed 11.26.13).
Laist, D.W., Knowlton, A.R., Mead, J.G., Collet, A.S., Podesta, M., 2001. Collisions between ships and whales. Marine Mammal Science 17: 35–75.
Last, P.R., Lyne, V., Yearsley, G., Gledhill, D., Gomon, M., Rees, T., White, W., 2005. Validation of national demersal fish datasets for the regionalisation of the Australian continental slope and outer shelf (>40m depth). National Oceans Office, Hobart.
LeProvost Dames & Moore, 2000. Ningaloo Marine Park (Commonwealth Waters) literature review (Report No. R726). LeProvost Dames & Moore, East Perth.
Lewis, P., Jones, R., 2017. Statewide large pelagic finfish resource status report 2016, in: Fletcher, W., Mumme, M., Webster, F. (Eds.), Status Reports of the Fisheries and Aquatic Resources of Western Australia 2015/2016: State of the Fisheries. Department of Fisheries, Perth, pp. 153–157.
Limpus, C.J., 2007. A biological review of Australian marine turtles. 5. Flatback turtle, Natator depressus (Garman), A biological review of Australian marine turtles. Queensland Government Environmental Protection Agency, Brisbane.
Limpus, C.J., 2008a. A biological review of Australian marine turtles. 1. Loggerhead turtle, Caretta caretta (Linnaeus), A biological review of Australian marine turtles. Queensland Government Environmental Protection Agency, Brisbane.
Limpus, C.J., 2008b. A biological review of Australian marine turtles. 2. Green turtle, Chelonia mydas (Linnaeus), A biological review of Australian marine turtles. Queensland Government Environmental Protection Agency, Brisbane.
Limpus, C.J., 2009. A biological review of Australian marine turtles. 3. Hawksbill turtle, Eretmochelys imbricata (Linnaeus), A biological review of Australian marine turtles. Queensland Government Environmental Protection Agency, Brisbane.
Lutcavage, M., Lutz, P., Bossart, G., Hudson, D., 1995. Physiologic and clinicopathologic effects of crude oil on loggerhead sea turtles. Archives of Environmental Contamination and Toxicology 28: 417–422.
MacArthur, L., Hyndes, G., Babcock, R., 2007. Western rock lobster in ecosystem processes of south-western Australia (Report No. 2007–12). Department of the Environment, Water, Heritage and the Arts, Canberra.

Angel Operations Environment Plan Summary
This document is protected by copyright. No part of this document may be reproduced, adapted, transmitted, or stored in any form by any process (electronic or otherwise) without the specific written consent of Woodside. All rights are reserved.
Controlled Ref No: XX Revision: B Native file DRIMS No: 1400947213 Page 72 of 175
Uncontrolled when printed. Refer to electronic version for most up to date information.
Mackie, M., Buckworth, R.C., Gaughan, D.J., 2003. Stock assessment of narrow-barred Spanish mackerel (Scomberomorus commerson) in Western Australia (FRDC Report No. 1999/151). Department of Fisheries, Perth.
Mackie, M., Nardi, A., Lewis, P., Newman, S., 2007. Small pelagic fishes of the north-west marine region. Department of Fisheries, Perth.
Marine Parks and Reserves Authority, Department of Conservation and Land Management, 2005. Management plan for the Ningaloo Marine Park and Muiron Islands Marine Management Area 2005-2015 (Management Plan No. 52). Marine Parks and Reserves Authority, Perth.
Marine Parks and Reserves Authority, Department of Environment and Conservation, 2007. Rowley Shoals Marine Park Management Plan 2007-2017 (Management Plan No. 56). Marine Parks and Reserves Authority, Perth.
Marsh, H., Penrose, H., Eros, C., Hughes, J., 2002. Dugong: status report and action plans for countries and territories, Early warning and assessment report series. United Nations Environment Programme, Nairobi.
Marshall, A., Bennett, M., Kodja, G., Hinojosa-Alvarez, S., Galvan-Magana, F., Harding, M., Stevens, G., Kashiwaga, T., 2011. Manta birostris (Chevron Manta Ray, Giant Manta Ray, Oceanic Manta Ray, Pacific Manta Ray, Pelagic Manta Ray) [WWW Document]. The IUCN Red List of Threatened Species. URL http://www.iucnredlist.org/details/198921/0 (accessed 10.12.15).
Marshall, A.D., Compagno, L.J., Bennett, M.B., 2009. Redescription of the genus Manta with resurrection of Manta alfredi (Krefft, 1868)(Chondrichthyes; Myliobatoidei; Mobulidae). Zootaxa 2301: 1–28.
Masel, J., Smallwood, D., 2000. Habitat usage by postlarval and juvenile prawns in Moreton Bay, Queensland, Australia. The Proceedings of the Royal Society of Queensland 109: 107–117.
Matkin, C.O., Saulitis, E.L., Ellis, G.M., Olesiuk, P., Rice, S.D., 2008. Ongoing population-level impacts on killer whales Orcinus orca following the ‘Exxon Valdez’oil spill in Prince William Sound, Alaska. Marine Ecology Progress Series 356: 269–281.
Matsuura, H., Sugimoto, T., Nakai, M., Tsuji, S., 1997. Oceanographic conditions near the spawning ground of southern bluefin tuna; northeastern Indian Ocean. Journal of Oceanography 53: 421–434.
McCauley, R., Duncan, A., 2011. Sea noise logger deployment, Wheatstone and Onslow, April 2009 to November 2010 (Technical Report No. R2011-23). Centre for Marine Science and Technology, Curtin University of Technology, Perth.
McCauley, R., Jenner, C., 2010. Migratory patterns and estimated population size of pygmy blue whales (Balaenoptera musculus brevicauda) traversing the Western Australian coast based on passive acoustics (International Whaling Commission Report No. SC/62/SH26). International Whaling Commission.
McCauley, R.D., 2011. Woodside Kimberley sea noise logger program, Septemer 2006 to June 2009: whales, fish and man made noise (Report No. R2010–50_3). Curtin University, Perth.
McGregor, F., n.d. The foraging and population ecology of manta rays within Ningaloo Marine Park. Western Australian Marine Science Institution, Perth.
McLean, D.L., Partridge, J.C., Bond, T., Birt, M.J., Bornt, K.R., Langlois, T.J., 2017. Using industry ROV videos to assess fish associations with subsea pipelines. Continental Shelf Research 141: 76–97. doi:10.1016/j.csr.2017.05.006
Meekan, M., Radford, B., 2010. Migration patterns of whale sharks: A summary of 15 satellite tag tracks from 2005 to 2008. Australian Institute of Marine Science, Perth.
Meekan, M.G., Bradshaw, C.J., Press, M., McLean, C., Richards, A., Quasnichka, S., Taylor, J.G., 2006. Population size and structure of whale sharks Rhincodon typus at Ningaloo Reef, Western Australia. Marine Ecology Progress Series 319: 275–285.

Angel Operations Environment Plan Summary
This document is protected by copyright. No part of this document may be reproduced, adapted, transmitted, or stored in any form by any process (electronic or otherwise) without the specific written consent of Woodside. All rights are reserved.
Controlled Ref No: XX Revision: B Native file DRIMS No: 1400947213 Page 73 of 175
Uncontrolled when printed. Refer to electronic version for most up to date information.
Meyers, G., Bailey, R., Worby, A., 1995. Geostrophic transport of Indonesian throughflow. Deep Sea Research Part I: Oceanographic Research Papers 42: 1163–1174.
Milton, S.L., Lutz, P.L., 2003. Physiological and genetic responses to environmental stress, in: Lutz, P.L., Musick, J.A., Wyneken, J. (Eds.), The Biology of Sea Turtles. CRC Press, Boca Raton, pp. 164–198.
Miyazaki, S., Stagg, H., 2013. Exmouth Plateau [WWW Document]. Geoscience Australia: National Geological Provinces Online Database. URL http://www.ga.gov.au/provexplorer/provinceDetails.do?eno=30351 (accessed 8.30.16).
Mollet, H., Cliff, G., Pratt Jr, H., Stevens, J., 2000. Reproductive biology of the female shortfin mako, Isurus oxyrinchus Rafinesque, 1810, with comments on the embryonic development of lamnoids. Fishery Bulletin 98.
Molony, B., Bruce, C., Syers, C., Kalinowski, P., 2017. Statewide marine aquarium fish and hermit crab resources status report 2016, in: Fletcher, W., Mumme, M., Webster, F. (Eds.), Status Reports of the Fisheries and Aquatic Resources of Western Australia 2015/2016: State of the Fisheries. Department of Fisheries, Perth, pp. 228–230.
Molony, B., Lai, E., Jones, R., 2015. Mackerel managed fishery report: Statistics only, in: Fletcher, W., Santoro, K. (Eds.), Status Reports of the Fisheries and Aquatic Resources of Western Australia 2014/2015: The State of the Fisheries. Department of Fisheries, Perth, pp. 207–210.
Morgan, D., Whitty, J., Phillips, N., 2010. Endangered sawfishes and river sharks in Western Australia. Centre for Fish and Fisheries Research, Murdoch University, Perth.
Morrice, M.G., Gill, P.C., Hughes, J., Levings, A.H., 2004. Summary of aerial surveys conducted for the Santos Ltd EPP32 seismic survey, 2 - 13 December 2003. Deakin University, Warnambool.
National Oceanic and Atmospheric Administration, 1996. Aerial observations of oil at sea (HAZMAT Report No. 96–7). National Oceanic and Atmospheric Administration, Seattle.
National Oceanic and Atmospheric Administration, 2006. Fact Sheet: Small Diesel Spills (500-5000 gallons).
National Oceanic and Atmospheric Administration, 2010. Oil and sea turtles: Biology, planning and response. National Oceanic and Atmospheric Administration, Washington.
National Oceanic and Atmospheric Administration, 2014. Oil spills in mangroves: Planning & response considerations. National Oceanic and Atmospheric Administration, Washington.
National Oceans Office, Geoscience Australia, 2005. 2005 National Marine Bioregionalisation of Australia. Geoscience Australia, Canberra.
National Research Council, 2005. Oil spill dispersants: efficacy and effects. The National Academies Press, Washington, D.C.
Neff, J., Lee, K., DeBlois, E.M., 2011. Produced water: overview of composition, fates, and effects, in: Lee, K., Neff, J. (Eds.), Produced Water. Springer, New York, pp. 3–54.
Negri, A.P., Heyward, A.J., 2000. Inhibition of fertilization and larval metamorphosis of the coral Acropora millepora (Ehrenberg, 1834) by petroleum products. Marine Pollution Bulletin 41: 420–427.
Newman, S., Wakefield, C., Skepper, C., Boddington, D., Jones, R., Dobson, P., 2017. North coast demersal resource status report 2016, in: Fletcher, W., Mumme, M., Webster, F. (Eds.), Status Reports of the Fisheries and Aquatic Resources of Western Australia 2015/2016: State of the Fisheries. Department of Fisheries, Perth, pp. 144–152.
Oil and Gas UK, 2014. Guidance on risk related decision making (Issue No. 2). United Kingdom Offshore Operators Association, London.
Olsen, P., Marples, T.G., 1993. Geographic variation in egg size, clutch size and date of laying of Australian raptors (Falconiformes and Strigiformes). Emu 93: 167–179.

Angel Operations Environment Plan Summary
This document is protected by copyright. No part of this document may be reproduced, adapted, transmitted, or stored in any form by any process (electronic or otherwise) without the specific written consent of Woodside. All rights are reserved.
Controlled Ref No: XX Revision: B Native file DRIMS No: 1400947213 Page 74 of 175
Uncontrolled when printed. Refer to electronic version for most up to date information.
Owens, E.H., Humphrey, B., Sergy, G.A., 1994. Natural cleaning of oiled coarse sediment shorelines in Arctic and Atlantic Canada. Spill Science & Technology Bulletin 1: 37–52.
Oxford Economics, 2010. Potential impact of the Gulf oil spill on tourism. Oxford Economics, Oxford.
Patterson, H., Bath, A., 2017. Skipjack tuna fishery, in: Patterson, H., Noriega, R., Georgeson, L., Larcombe, J., Curtotti, R. (Eds.), Fishery Status Reports 2017. Australian Bureau of Agricultural and Resource Economics and Sciences, Canberra, pp. 385–393.
Patterson, H., Nicol, S., Curtotti, R., 2017. Southern bluefin tuna fishery, in: Patterson, H., Noriega, R., Georgeson, L., Larcombe, J., Curtotti, R. (Eds.), Fishery Status Reports 2017. Australian Bureau of Agricultural and Resource Economics and Sciences, Canberra, pp. 394–405.
Pearce, A., Buchan, S., Chiffings, T., D’Adamo, N., Fandry, C., Fearns, P., Mills, D., Phillips, R., Simpson, C., 2003. A review of the oceanography of the Dampier Archipelago, Western Australia, in: Wells, F., Walker, D., Jones, D. (Eds.), The Marine Flora and Fauna of Dampier, Western Australia. Western Australian Museum, Perth, pp. 13–50.
Potemra, J.T., Hautala, S.L., Sprintall, J., 2003. Vertical structure of Indonesian throughflow in a large-scale model. Deep Sea Research Part II: Topical Studies in Oceanography 50: 2143–2161. doi:10.1016/S0967-0645(03)00050-X
Preen, A., 2004. Distribution, abundance and conservation status of dugongs and dolphins in the southern and western Arabian Gulf. Biological Conservation 118: 205–218.
Preen, A., Marsh, H., Lawler, I., Prince, R., Shepherd, R., 1997. Distribution and abundance of dugongs, turtles, dolphins and other megafauna in Shark Bay, Ningaloo Reef and Exmouth Gulf, Western Australia. Wildlife Research 24: 185–208.
Prieto, R., Janiger, D., Silva, M.A., Waring, G.T., GonçAlves, J.M., 2012. The forgotten whale: a bibliometric analysis and literature review of the North Atlantic sei whale Balaenoptera borealis. Mammal Review 42: 235–272. doi:10.1111/j.1365-2907.2011.00195.x
Rainer, S., 1991. High species diversity in demersal polychaetes of the North West Shelf of Australia. Ophelia 5: 497–505.
Rees, M., Heyward, A., Cappo, M., Speare, P., Smith, L., 2004. Ningaloo Marine Park - initial survey of seabed biodiversity in intermediate and deep waters (March 2004). Australian Institute of Marine Science, Townsville.
Robertson, A., Duke, N., 1987. Mangroves as nursery sites: comparisons of the abundance and species composition of fish and crustaceans in mangroves and other nearshore habitats in tropical Australia. Marine Biology 96: 193–205.
Romero, I.C., Schwing, P.T., Brooks, G.R., Larson, R.A., Hastings, D.W., Ellis, G., Goddard, E.A., Hollander, D.J., 2015. Hydrocarbons in deep-sea sediments following the 2010 Deepwater Horizon blowout in the northeast Gulf of Mexico. PLOS ONE 10: e0128371. doi:10.1371/journal.pone.0128371
Rosser, N., Gilmour, J., 2008. New insights into patterns of coral spawning on Western Australian reefs. Coral Reefs 27: 345–349.
RPS, 2010. Satellite telemetry of nesting flatback turtles from Ashburton Island - Wheatstone Project EIS/ERMP (No. M10604). RPS Environment and Planning Pty Ltd, Perth.
RPS, 2012. Sediment Quality Surveys March-April 2011. Greater Western Flank Marine Environmental Baseline Studies. RPS Environment and Planning Pty Ltd, Perth.
RPS, 2018. Angel Operations EP quantitative spill risk assessment (Report No. MAW0676J). RPS, West Perth.
RPS Bowman Bishaw Gorham, 2007. Gorgon development on Barrow Island: Intertidal habitats (Report No. R03208). RPS Bowman Bishaw Gorham, Subiaco.
Angel Operations Environment Plan Summary
This document is protected by copyright. No part of this document may be reproduced, adapted, transmitted, or stored in any form by any process (electronic or otherwise) without the specific written consent of Woodside. All rights are reserved.
Controlled Ref No: XX Revision: B Native file DRIMS No: 1400947213 Page 75 of 175
Uncontrolled when printed. Refer to electronic version for most up to date information.
RPS Environment and Planning, 2010a. Humpback whale monitoring survey, North West Cape (No. M10357). RPS Environment and Planning Pty Ltd, Subiaco.
RPS Environment and Planning, 2010b. Marine megafauna report, Browse marine megafauna study. RPS Environment and Planning Pty Ltd, Perth.
RPS Environment and Planning, 2012. Analysis of sea noise in the Greater Western Flank survey area, September 2010 to August 2011. RPS Environment and Planning Pty Ltd, Perth.
Runcie, J., Macinnis-Ng, C., Ralph, P., 2010. The toxic effects of petrochemicals on seagrassess - literature review. Institute for Water and Environmental Resource Management, University of Technology Sydney, Sydney.
Saunders, R.A., Royer, F., Clarke, M.W., 2011. Winter migration and diving behaviour of porbeagle shark, Lamna nasus, in the Northeast Atlantic. ICES Journal of Marine Science 68: 166–174. doi:10.1093/icesjms/fsq145
Schianetz, K., Jones, T., Kavanagh, L., Walker, P.A., Lockington, D., Wood, D., 2009. The practicalities of a Learning Tourism Destination: a case study of the Ningaloo Coast. International Journal of Tourism Research 11: 567–581. doi:10.1002/jtr.729
Sepulveda, C., Kohin, S., Chan, C., Vetter, R., Graham, J., 2004. Movement patterns, depth preferences, and stomach temperatures of free-swimming juvenile mako sharks, Isurus oxyrinchus, in the Southern California Bight. Marine Biology 145: 191–199.
SGS Economics & Planning, 2012. Economic development opportunities for the Gascoyne region associated with resource sector investment and expansion. Gascoyne Development Commission, Fortitude Valley.
Sheppard, J.K., Preen, A.R., Marsh, H., Lawler, I.R., Whiting, S.D., Jones, R.E., 2006. Movement heterogeneity of dugongs, Dugong dugon (Müller), over large spatial scales. Journal of Experimental Marine Biology and Ecology 334: 64–83.
Shigenaka, G., 2001. Toxicity of oil to reef building corals: a spill response perspective (NOAA Technical Memorandum No. NOS OR&R 8). National Oceanic and Atmospheric Administration, Seattle.
Simpson, C.J., Cary, J.L., Masini, R.J., 1993. Destruction of corals and other reef animals by coral spawn slicks on Ningaloo Reef, Western Australia. Coral Reefs 12: 185–191. doi:10.1007/BF00334478
Sinclair Knight Merz, 2007. North West Shelf Venture Cumulative Environmental Impact Study - cumulative environmental assessment report. Sinclair Knight Merz, Perth.
SINTEF, 2017. SINTEF Offshore Blowout Database - SINTEF [WWW Document]. SINTEF Offshore Blowout Database. URL https://www.sintef.no/en/projects/sintef-offshore-blowout-database/ (accessed 8.17.17).
Sleeman, J.C., Meekan, M.G., Wilson, S.G., Jenner, C.K.S., Jenner, M.N., Boggs, G.S., Steinberg, C.C., Bradshaw, C.J.A., 2007. Biophysical correlates of relative abundances of marine megafauna at Ningaloo Reef, Western Australia. Marine and Freshwater Research 58: 608. doi:10.1071/MF06213
Sleeman, J.C., Meekan, M.G., Wilson, S.G., Polovina, J.J., Stevens, J.D., Boggs, G.S., Bradshaw, C.J.A., 2010. To go or not to go with the flow: Environmental influences on whale shark movement patterns. Journal of Experimental Marine Biology and Ecology 390: 84–98. doi:10.1016/j.jembe.2010.05.009
Smallwood, C.B., Beckley, L.E., Moore, S.A., Kobryn, H.T., 2011. Assessing patterns of recreational use in large marine parks: A case study from Ningaloo Marine Park, Australia. Ocean & Coastal Management 54: 330–340. doi:10.1016/j.ocecoaman.2010.11.007
Sporer, E., Kangas, M., Wilkin, S., Blay, N., 2015a. Exmouth Gulf prawn managed fishery status report, in: Fletcher, W., Santoro, K. (Eds.), Status Report of the Fisheries and Aquatic Resources of
Angel Operations Environment Plan Summary
This document is protected by copyright. No part of this document may be reproduced, adapted, transmitted, or stored in any form by any process (electronic or otherwise) without the specific written consent of Woodside. All rights are reserved.
Controlled Ref No: XX Revision: B Native file DRIMS No: 1400947213 Page 76 of 175
Uncontrolled when printed. Refer to electronic version for most up to date information.
Western Australia 2014/2015: The State of the Fisheries. Department of Fisheries, Perth, pp. 123–129.
Sporer, E., Kangas, M., Wilkin, S., Cavalli, P., 2015b. Shark Bay Prawn and Scallop Managed Fisheries Status, in: Fletcher, W., Santoro, K. (Eds.), Status Report of the Fisheries and Aquatic Resources of Western Australia 2014/2015: The State of the Fisheries. Department of Fisheries, Perth, pp. 116–123.
Sporer, E., Kangas, M., Wilkin, S., Koefoed, P., Cavalli, P., Pickles, L., 2017. North coast prawn resources status report 2016, in: Fletcher, W., Mumme, M., Webster, F. (Eds.), Status Reports of the Fisheries and Aquatic Resources of Western Australia 2015/2016: State of the Fisheries. Department of Fisheries, Perth, pp. 135–19.
Stevens, J., McAuley, R., Simpfendorfer, C., Pillans, R., 2008. Spatial distribution and habitat utilisation of sawfish (Pristis spp.) in relation to fishing in northern Australia. CSIRO Marine and Atmospheric Research, Hobart.
Stevens, J., Pillans, R., Salini, J., 2005. Conservation assessment of Glyphis sp. A (speartooth shark), Glyphis sp. C (northern river shark), Pristis microdon (freshwater sawfish) and Pristis zijsron (green sawfish). CSIRO Marine Research, Hobart.
Stevens, J.D., Bradford, R.W., West, G.J., 2010. Satellite tagging of blue sharks (Prionace glauca) and other pelagic sharks off eastern Australia: depth behaviour, temperature experience and movements. Marine Biology 157: 575–591.
Strain, L., Brown, J., Walters, S., 2017. West coast Roe’s abalone resource status report 2016, in: Fletcher, W., Mumme, M., Webster, F. (Eds.), Status Reports of the Fisheries and Aquatic Resources of Western Australia 2015/2016: State of the Fisheries. Department of Fisheries, Perth, pp. 39–43.
Taylor, J.G., 2007. Ram filter-feeding and nocturnal feeding of whale sharks (Rhincodon typus) at Ningaloo Reef, Western Australia. Fisheries Research 84: 65–70.
Taylor, J.G., Pearce, A.F., 1999. Ningaloo Reef currents: implications for coral spawn dispersal, zooplankton and whale shark abundance. Journal of the Royal Society of Western Australia 82: 57–65.
Thorburn, D.C., Morgan, D.L., Rowland, A.J., Gill, H.S., Paling, E., 2008. Life history notes of the critically endangered dwarf sawfish, Pristis clavata, Garman 1906 from the Kimberley region of Western Australia. Environmental Biology of Fishes 83: 139–145.
Threatened Species Scientific Committee, 2008a. Approved conservation advice for Dermochelys coriacea (Leatherback Turtle). Department of Sustainability, Environment, Water, Population and Communities, Canberra.
Threatened Species Scientific Committee, 2008b. Approved conservation advice for green sawfish. Department of Sustainability, Environment, Water, Population and Communities, Canberra.
Threatened Species Scientific Committee, 2009. Approved conservation advice for Pristis clavata (dwarf sawfish). Department of Sustainability, Environment, Water, Population and Communities, Canberra.
Threatened Species Scientific Committee, 2011. Conservation advice for Sterna nereis nereis (Fairy tern). Department of Sustainability, Environment, Water, Population and Communities, Canberra.
Threatened Species Scientific Committee, 2013. Approved conservation advice for Rostratula australis (Australian painted snipe). Threatened Species Scientific Committee, Canberra.
Threatened Species Scientific Committee, 2014. Approved conservation advice for Pristis pristis (largetooth sawfish). Threatened Species Scientific Committee, Canberra.
Threatened Species Scientific Committee, 2015a. Conservation advice Balaenoptera borealis sei whale. Threatened Species Scientific Committee, Canberra.
Angel Operations Environment Plan Summary
This document is protected by copyright. No part of this document may be reproduced, adapted, transmitted, or stored in any form by any process (electronic or otherwise) without the specific written consent of Woodside. All rights are reserved.
Controlled Ref No: XX Revision: B Native file DRIMS No: 1400947213 Page 77 of 175
Uncontrolled when printed. Refer to electronic version for most up to date information.
Threatened Species Scientific Committee, 2015b. Conservation advice Balaenoptera physalus fin whale. Threatened Species Scientific Committee, Canberra.
Threatened Species Scientific Committee, 2015c. Conservation advice Megaptera novaeangliae humpback whale. Department of the Environment, Canberra.
Threatened Species Scientific Committee, 2015d. Conservation advice Rhincodon typus whale shark. Department of the Environment, Canberra.
Threatened Species Scientific Committee, 2015e. Conservation advice Anous tenuirostris melanops Australian lesser noddy. Department of the Environment, Canberra.
Threatened Species Scientific Committee, 2015f. Conservation advice Calidris ferruginea curlew sandpiper. Threatened Species Scientific Committee, Canberra.
Threatened Species Scientific Committee, 2015g. Conservation advice Numenius madagascariensis eastern curlew. Threatened Species Scientific Committee, Canberra.
Threatened Species Scientific Committee, 2015h. Conservation advice Papasula abbotti Abbott’s booby. Threatened Species Scientific Committee, Canberra.
Threatened Species Scientific Committee, 2015i. Conservation advice Pterodroma mollis soft-plumage petrel. Threatened Species Scientific Committee, Canberra.
Threatened Species Scientific Committee, 2016a. Conservation advice Calidris canutus red knot. Threatened Species Scientific Committee, Canberra.
Threatened Species Scientific Committee, 2016b. Conservation advice Calidris tenuirostris great knot. Threatened Species Scientific Committee, Canb.
Threatened Species Scientific Committee, 2016c. Conservation advice Charadrius leschenaultii greater sand plover. Threatened Species Scientific Committee, Canberra.
Threatened Species Scientific Committee, 2016d. Conservation advice Limosa lapponica baueri bar-tailed godwit (western Alaskan). Threatened Species Scientific Committee, Canberra.
Threatened Species Scientific Committee, 2016e. Conservation advice Limosa lapponica menzbieri bar-tailed godwit (northern Siberian). Threatened Species Scientific Committee, Canberra.
Tomajka, J., 1985. The influence of petroleum hydrocarbons on the primary production of the Danube River plankton. Acta Hydrochimica et Hydrobiologica 13: 615–618.
Underwood, J.N., 2009. Genetic diversity and divergence among coastal and offshore reefs in a hard coral depend on geographic discontinuity and oceanic currents. Evolutionary Applications 2: 222–233. doi:10.1111/j.1752-4571.2008.00065.x
URS, 2010. Wheatstone Project: deepwater habitat survey. URS Australia Pty Ltd, Perth.
Vanderlaan, A.S.M., Taggart, C.T., 2007. Vessel collisions with whales: the probability of lethal injury based on vessel speed. Marine Mammal Science 23: 144–156. doi:10.1111/j.1748-7692.2006.00098.x
Vetter, E.W., Dayton, P.K., 1999. Organic enrichment by macrophyte detritus, and abundance patterns of megafaunal populations in submarine canyons. Marine Ecology Progress Series 186: 137–148.
Waayers, D., Smith, L., Malseed, B., 2011. Internesting distribution of green turtles (Chelonia mydas) and flatback turtles (Natator depressus) at the Lacepede Islands, Western Australia. Journal of the Royal Society of Western Australia 94: 359–364.
Wahab, M.A.A., Radford, B., Cappo, M., Colquhoun, J., Stowar, M., Depczynski, M., Miller, K., Heyward, A., 2018. Biodiversity and spatial patterns of benthic habitat and associated demersal fish communities at two tropical submerged reef ecosystems. Coral Reefs 1–17. doi:https://doi.org/10.1007/s00338-017-1655-9

Angel Operations Environment Plan Summary
This document is protected by copyright. No part of this document may be reproduced, adapted, transmitted, or stored in any form by any process (electronic or otherwise) without the specific written consent of Woodside. All rights are reserved.
Controlled Ref No: XX Revision: B Native file DRIMS No: 1400947213 Page 78 of 175
Uncontrolled when printed. Refer to electronic version for most up to date information.
Weng, K.C., Boustany, A.M., Pyle, P., Anderson, S.D., Brown, A., Block, B.A., 2007a. Migration and habitat of white sharks (Carcharodon carcharias) in the eastern Pacific Ocean. Marine Biology 152: 877–894. doi:10.1007/s00227-007-0739-4
Weng, K.C., O’Sullivan, J.B., Lowe, C.G., Winkler, C.E., Dewar, H., Block, B.A., 2007b. Movements, behavior and habitat preferences of juvenile white sharks Carcharodon carcharias in the eastern Pacific. Marine Ecology Progress Series 338: 211–224.
Whittock, P., Pendoley, K., Hamann, M., 2014. Internesting distribution of flatback turtles Natator depressus and industrial development in Western Australia. Endangered Species Research 26: 25–38. doi:10.3354/esr00628
Williams, A., Koslow, J.A., Last, P.R., 2001. Diversity, density and community structure of the demersal fish fauna of the continental slope off Western Australia (20 to 35°S). Marine Ecology Progress Series 212: 247–263.
Williams, A., Patterson, H., Bath, A., 2017. Western tuna and billfish fishery, in: Patterson, H., Noriega, R., Georgeson, L., Larcombe, J., Curtotti, R. (Eds.), Fishery Status Reports 2017. Australian Bureau of Agricultural and Resource Economics and Sciences, Canberra, pp. 406–423.
Wilson, S., Carleton, J., Meekan, M., 2003. Spatial and temporal patterns in the distribution and abundance of macrozooplankton on the southern North West Shelf, Western Australia. Estuarine, Coastal and Shelf Science 56: 897–908.
Wilson, S., Polovina, J., Stewart, B., Meekan, M., 2006. Movements of whale sharks (Rhincodon typus) tagged at Ningaloo Reef, Western Australia. Marine Biology 148: 1157–1166.
Wilson, S.K., Depczynski, M., Fisher, R., Holmes, T.H., O’Leary, R.A., Tinkler, P., 2010. Habitat associations of juvenile fish at Ningaloo Reef, Western Australia: The importance of coral and algae. PLoS ONE 5: e15185. doi:10.1371/journal.pone.0015185
Wink, M., Sauer-Gürth, H., Witt, H.-H., 2004. Phylogenetic differentiation of the Osprey Pandion haliaetus inferred from nucleotide sequences of the mitochondrial cytochrome b gene, in: Chancellor, R., Meyburg (Eds.), Raptors Worldwide. Berlin, pp. 511–516.
Woo, M., Pattiaratchi, C., Schroeder, W., 2006. Dynamics of the Ningaloo Current off Point Cloates, Western Australia. Marine and Freshwater Research 57: 291. doi:10.1071/MF05106
Woodhams, J., Bath, A., 2017a. North west slope trawl fishery, in: Patterson, H., Noriega, R., Georgeson, L., Larcombe, J., Curtotti, R. (Eds.), Fishery Status Reports 2017. Australian Bureau of Agricultural and Resource Economics and Sciences, Canberra, pp. 85–91.
Woodhams, J., Bath, A., 2017b. Western deepwater trawl fishery, in: Patterson, H., Noriega, R., Georgeson, L., Larcombe, J., Curtotti, R. (Eds.), Fishery Status Reports 2017. Australian Bureau of Agricultural and Resource Economics and Sciences, Canberra, pp. 294–301.
Woodside Energy, 2005. Environmental impacts of drill cuttings at North Rankin A and Goodwyn A (No. ENV-646 Rev 0). Woodside Energy Limited, Perth.
Woodside Energy Limited, 2006. Pluto LNG development draft Public Environment Report/Public Environment Review (EPBC Act Referral No. 2006/2968). Woodside Energy Limited, Perth.
Yender, R., Michel, J., Lord, C., 2002. Managing seafood safety after and oil spill. National Oceanic and Atmospheric Administration, Seattle.
Zieman, J.C., Orth, R., Phillips, R.C., Thayer, G., Thorhaug, A., 1984. Effects of oil on seagrass ecosystems, in: Cairns Jr., J., Buikema, A.L. (Eds.), Restoration of Habitats Impacted by Oil Spills. Butterworth-Heinemann, Boston, pp. 37–64.

Angel Operations Environment Plan Summary
This document is protected by copyright. No part of this document may be reproduced, adapted, transmitted, or stored in any form by any process (electronic or otherwise) without the specific written consent of Woodside. All rights are reserved.
Controlled Ref No: XX Revision: B Native file DRIMS No: 1400947213 Page 79 of 175
Uncontrolled when printed. Refer to electronic version for most up to date information.
APPENDIX A: ENVIRONMENTAL IMPACTS AND RISKS
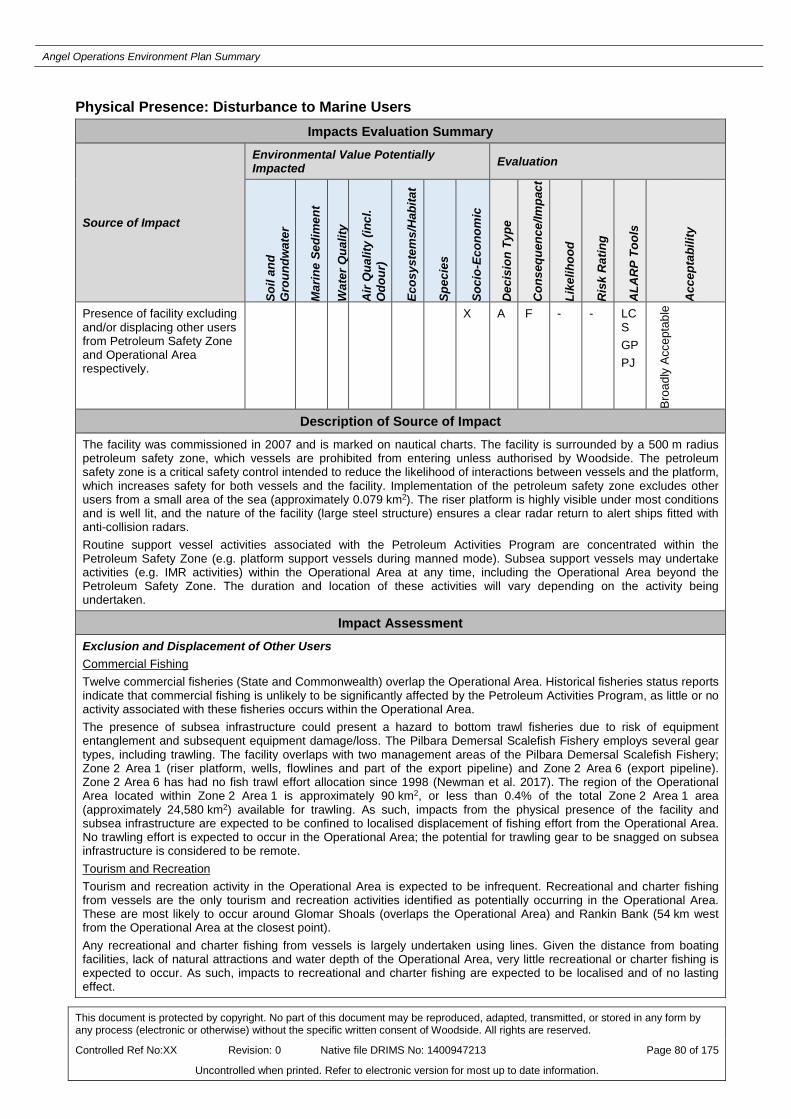
Angel Operations Environment Plan Summary
This document is protected by copyright. No part of this document may be reproduced, adapted, transmitted, or stored in any form by any process (electronic or otherwise) without the specific written consent of Woodside. All rights are reserved.
Controlled Ref No:XX Revision: 0 Native file DRIMS No: 1400947213 Page 80 of 175
Uncontrolled when printed. Refer to electronic version for most up to date information.
Physical Presence: Disturbance to Marine Users Impacts Evaluation Summary
Source of Impact
Environmental Value Potentially Impacted Evaluation
Soil
and
Gro
undw
ater
Mar
ine
Sedi
men
t
Wat
er Q
ualit
y
Air
Qua
lity
(incl
. O
dour
)
Ecos
yste
ms/
Hab
itat
Spec
ies
Soci
o-Ec
onom
ic
Dec
isio
n Ty
pe
Con
sequ
ence
/Impa
ct
Like
lihoo
d
Ris
k R
atin
g
ALA
RP
Tool
s
Acc
epta
bilit
y
Presence of facility excluding and/or displacing other users from Petroleum Safety Zone and Operational Area respectively.
X A F - - LCS GP PJ
Broa
dly
Acce
ptab
le
Description of Source of Impact The facility was commissioned in 2007 and is marked on nautical charts. The facility is surrounded by a 500 m radius petroleum safety zone, which vessels are prohibited from entering unless authorised by Woodside. The petroleum safety zone is a critical safety control intended to reduce the likelihood of interactions between vessels and the platform, which increases safety for both vessels and the facility. Implementation of the petroleum safety zone excludes other users from a small area of the sea (approximately 0.079 km2). The riser platform is highly visible under most conditions and is well lit, and the nature of the facility (large steel structure) ensures a clear radar return to alert ships fitted with anti-collision radars. Routine support vessel activities associated with the Petroleum Activities Program are concentrated within the Petroleum Safety Zone (e.g. platform support vessels during manned mode). Subsea support vessels may undertake activities (e.g. IMR activities) within the Operational Area at any time, including the Operational Area beyond the Petroleum Safety Zone. The duration and location of these activities will vary depending on the activity being undertaken.
Impact Assessment Exclusion and Displacement of Other Users Commercial Fishing Twelve commercial fisheries (State and Commonwealth) overlap the Operational Area. Historical fisheries status reports indicate that commercial fishing is unlikely to be significantly affected by the Petroleum Activities Program, as little or no activity associated with these fisheries occurs within the Operational Area. The presence of subsea infrastructure could present a hazard to bottom trawl fisheries due to risk of equipment entanglement and subsequent equipment damage/loss. The Pilbara Demersal Scalefish Fishery employs several gear types, including trawling. The facility overlaps with two management areas of the Pilbara Demersal Scalefish Fishery; Zone 2 Area 1 (riser platform, wells, flowlines and part of the export pipeline) and Zone 2 Area 6 (export pipeline). Zone 2 Area 6 has had no fish trawl effort allocation since 1998 (Newman et al. 2017). The region of the Operational Area located within Zone 2 Area 1 is approximately 90 km2, or less than 0.4% of the total Zone 2 Area 1 area (approximately 24,580 km2) available for trawling. As such, impacts from the physical presence of the facility and subsea infrastructure are expected to be confined to localised displacement of fishing effort from the Operational Area. No trawling effort is expected to occur in the Operational Area; the potential for trawling gear to be snagged on subsea infrastructure is considered to be remote. Tourism and Recreation Tourism and recreation activity in the Operational Area is expected to be infrequent. Recreational and charter fishing from vessels are the only tourism and recreation activities identified as potentially occurring in the Operational Area. These are most likely to occur around Glomar Shoals (overlaps the Operational Area) and Rankin Bank (54 km west from the Operational Area at the closest point). Any recreational and charter fishing from vessels is largely undertaken using lines. Given the distance from boating facilities, lack of natural attractions and water depth of the Operational Area, very little recreational or charter fishing is expected to occur. As such, impacts to recreational and charter fishing are expected to be localised and of no lasting effect.

Angel Operations Environment Plan Summary
This document is protected by copyright. No part of this document may be reproduced, adapted, transmitted, or stored in any form by any process (electronic or otherwise) without the specific written consent of Woodside. All rights are reserved.
Controlled Ref No:XX Revision: 0 Native file DRIMS No: 1400947213 Page 81 of 175
Uncontrolled when printed. Refer to electronic version for most up to date information.
Shipping To reduce the likelihood of interactions between commercial vessels and offshore facilities, AMSA has introduced a series of shipping fairways, within which commercial vessels are advised to navigate. The fairways are not mandatory, but AMSA strongly recommends commercial vessels remain within the fairway when transiting the region. While no shipping fairways overlap the Operational Area, several fairways are located within the vicinity. The closest shipping fairway is approximately 24 km east of the Operational Area. The use of shipping fairways is considered to be good seafaring practice, with Australian Ship Reporting System (AUSREP) data from AMSA indicating cargo ships and tankers routinely navigate within the established fairways. As the facility has been operational since 2007, is marked on nautical charts and the riser platform is surrounded by a 500 m Petroleum Safety Zone, the likelihood of interactions between commercial vessels and the facility is inherently low. The presence of the facility and support vessels will not result in impacts to commercial shipping beyond a localised exclusion of shipping traffic from the Petroleum Safety Zone, and the temporary displacement of commercial shipping from subsea support vessels as a result of vessels undertaking activities in the Operational Area. This is considered to be a localised impact, and of no lasting effect. Oil and Gas The nearest other oil and gas platform is the NRC. NRC is operated by Woodside; impacts from the Petroleum Activities Program to NRC will not affect third parties. The nearest facility not operated by Woodside is the Quadrant-owned Reindeer platform, which lies approximately 50 km south-east of the Operational Area. Given the distance between the Operational Area and petroleum activities undertaken by other operators, no impacts to other operators will occur as a result of the presence of the riser platform, vessels or subsea infrastructure.
Summary of Control Measures • Contract vessels complying with Marine orders for safe vessel operations:
o Marine Order 21 (Safety of navigation and emergency procedures) o Marine order 30 (prevention of Collisions)
• Implementation of a 500 m Petroleum Safety Zone around riser platform • Notifying AHS of locations of new permanent infrastructure to enable AHS to update maritime charts • Undertaking consultation program to advise relevant persons of the Petroleum Activities Program and provide
opportunity to raise objections or claims • Angel’s collision prevention system implemented to alert maritime vessels of the facility location. Integrity will
be managed in accordance with Performance Standard(s) and Safety Critical Element Management Procedure to prevent environment risk related damage to SCEs:
o P34 Ship Intrusion Detection Systems to:
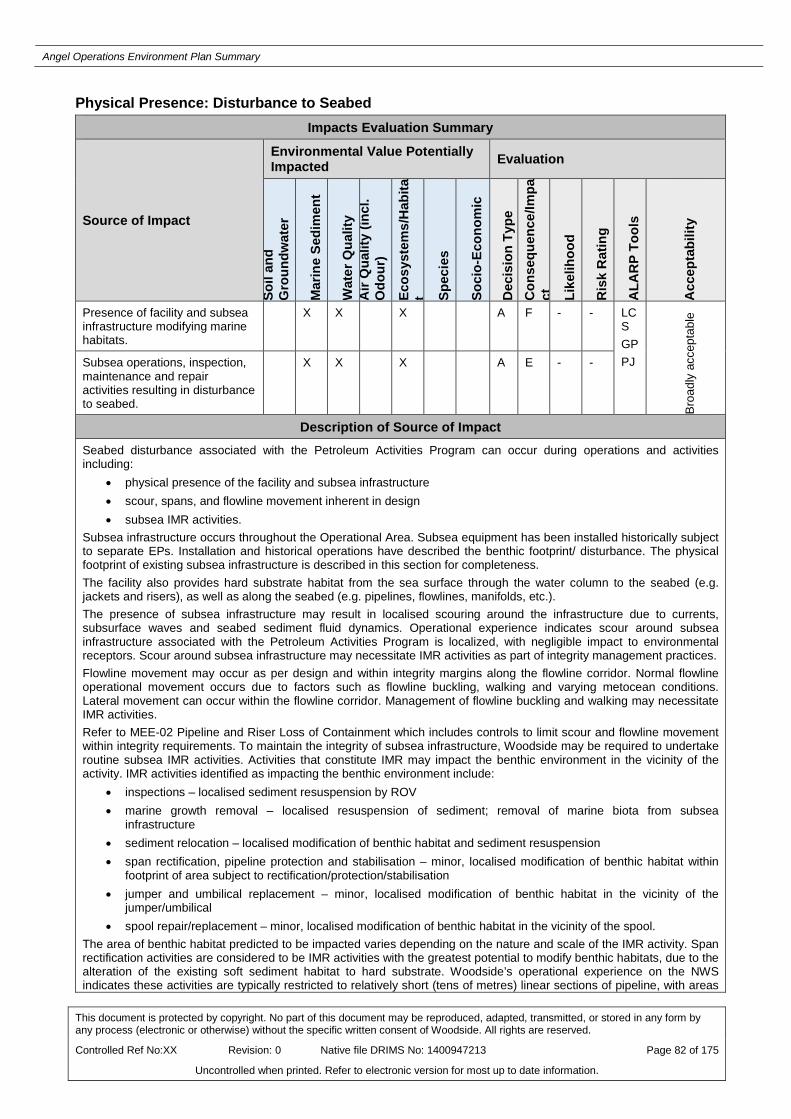
Angel Operations Environment Plan Summary
This document is protected by copyright. No part of this document may be reproduced, adapted, transmitted, or stored in any form by any process (electronic or otherwise) without the specific written consent of Woodside. All rights are reserved.
Controlled Ref No:XX Revision: 0 Native file DRIMS No: 1400947213 Page 82 of 175
Uncontrolled when printed. Refer to electronic version for most up to date information.
Physical Presence: Disturbance to Seabed Impacts Evaluation Summary
Source of Impact
Environmental Value Potentially Impacted Evaluation
Soil
and
Gro
undw
ater
Mar
ine
Sedi
men
t
Wat
er Q
ualit
y A
ir Q
ualit
y (in
cl.
Odo
ur)
Ecos
yste
ms/
Hab
itat Sp
ecie
s
Soci
o-Ec
onom
ic
Dec
isio
n Ty
pe
Con
sequ
ence
/Impa
ct
Like
lihoo
d
Ris
k R
atin
g
ALA
RP
Tool
s
Acc
epta
bilit
y
Presence of facility and subsea infrastructure modifying marine habitats.
X X X A F - - LCS GP PJ
Broa
dly
acce
ptab
le
Subsea operations, inspection, maintenance and repair activities resulting in disturbance to seabed.
X X X A E - -
Description of Source of Impact Seabed disturbance associated with the Petroleum Activities Program can occur during operations and activities including:
• physical presence of the facility and subsea infrastructure • scour, spans, and flowline movement inherent in design • subsea IMR activities.
Subsea infrastructure occurs throughout the Operational Area. Subsea equipment has been installed historically subject to separate EPs. Installation and historical operations have described the benthic footprint/ disturbance. The physical footprint of existing subsea infrastructure is described in this section for completeness. The facility also provides hard substrate habitat from the sea surface through the water column to the seabed (e.g. jackets and risers), as well as along the seabed (e.g. pipelines, flowlines, manifolds, etc.). The presence of subsea infrastructure may result in localised scouring around the infrastructure due to currents, subsurface waves and seabed sediment fluid dynamics. Operational experience indicates scour around subsea infrastructure associated with the Petroleum Activities Program is localized, with negligible impact to environmental receptors. Scour around subsea infrastructure may necessitate IMR activities as part of integrity management practices. Flowline movement may occur as per design and within integrity margins along the flowline corridor. Normal flowline operational movement occurs due to factors such as flowline buckling, walking and varying metocean conditions. Lateral movement can occur within the flowline corridor. Management of flowline buckling and walking may necessitate IMR activities. Refer to MEE-02 Pipeline and Riser Loss of Containment which includes controls to limit scour and flowline movement within integrity requirements. To maintain the integrity of subsea infrastructure, Woodside may be required to undertake routine subsea IMR activities. Activities that constitute IMR may impact the benthic environment in the vicinity of the activity. IMR activities identified as impacting the benthic environment include:
• inspections – localised sediment resuspension by ROV • marine growth removal – localised resuspension of sediment; removal of marine biota from subsea
infrastructure • sediment relocation – localised modification of benthic habitat and sediment resuspension • span rectification, pipeline protection and stabilisation – minor, localised modification of benthic habitat within
footprint of area subject to rectification/protection/stabilisation • jumper and umbilical replacement – minor, localised modification of benthic habitat in the vicinity of the
jumper/umbilical • spool repair/replacement – minor, localised modification of benthic habitat in the vicinity of the spool.
The area of benthic habitat predicted to be impacted varies depending on the nature and scale of the IMR activity. Span rectification activities are considered to be IMR activities with the greatest potential to modify benthic habitats, due to the alteration of the existing soft sediment habitat to hard substrate. Woodside’s operational experience on the NWS indicates these activities are typically restricted to relatively short (tens of metres) linear sections of pipeline, with areas
Angel Operations Environment Plan Summary
This document is protected by copyright. No part of this document may be reproduced, adapted, transmitted, or stored in any form by any process (electronic or otherwise) without the specific written consent of Woodside. All rights are reserved.
Controlled Ref No:XX Revision: 0 Native file DRIMS No: 1400947213 Page 83 of 175
Uncontrolled when printed. Refer to electronic version for most up to date information.
of up to approximately 100 m2 impacted.
Impact Assessment Scour may result in localised impact to soft sediment benthic habitats, typically on the scales of metres to tens of metres. Soft sediment benthic habitats are very widely represented in the Operational Area and NWS Province more broadly. Impacts to the environment from scour around subsea infrastructure are expected to be localised, with no significant impact to benthic habitats in the Operational Area. Flowline movement is limited to within design and integrity envelopes, and may result in slight, localised impact to soft sediment benthic habitats, typically on the scales varying between metres to tens of metres laterally along the flowline corridors. IMR activities can be categorised into two potential impacts:
• direct physical disturbance of benthic habitat • indirect disturbance to benthic habitats from sedimentation.
Water and Sediment Quality Indirect seabed disturbance may include localised and temporary decline in water quality due to increased suspended sediment concentrations and increased sediment deposition caused by IMR activities. However, sediment loads are not expected to be significant due to the relatively small footprint for each IMR activity (described above). Each discrete IMR activity near the seabed is likely to cause a single brief disturbance resulting in a transient plume of suspended sediment. This plume will subsequently be deposited down-current as particles resettle. Such localised and short-term events may affect small areas of the seabed and consequently impact the associated biota (typically sparsely distributed infauna and sessile fauna). Given the expected nature and scale of resuspension resulting from IMR activities, impacts such as smothering or burial are not expected. Rather, impacts are likely to be restricted to increased ingestion of inedible sediments by filter feeders. Biota in the region are well adapted to periodic turbidity events caused by cyclones and tidal movements. As such, impacts from turbidity caused by IMR activities are not expected to have any lasting effect on benthic biota. Benthic Habitats The benthic habitat within the Operational Area is predominantly soft sediment with sparsely associated epifauna, which is broadly represented throughout the NWS Province (Section 4.3). Benthic communities of the soft sediment seabed are characterised by burrowing infauna such as polychaetes, with biota such as sessile filter feeders occurring on areas of hard substrate (such as subsea infrastructure). The infauna communities are representative of the NWS Province being of low abundance. Direct seabed disturbance, including permanent modification of benthic communities, may result as a consequence of IMR activities such as span rectification, pipeline protection and stabilisation. These activities may disturb a small area (typically < 100 m2) of soft sediment habitat, which is broadly represented in the Operational Area and wider NWS Province. This habitat will be replaced by hard substrate (e.g. concrete mattresses, rocks, etc.), which is generally uncommon in the middle and outer NWS Province. Over time, this hard substrate is expected to be colonised by sessile benthic biota (e.g. sponges, gorgonians, etc.), which may support higher biodiversity than soft sediment habitats. The estimated overall extent of such direct seabed disturbance is extremely small in relation to the extent of the soft sediment habitats which are broadly represented within the Operational Area and the wider NWS Province. Filter Feeders (including outcropping cemented sediments with epifauna) Filter feeder habitat has been widely observed in surveyed benthic habitats in the Operational Area, hosting low to moderate densities of filter feeding organisms. Additionally, subsea infrastructure such as pipelines can host sessile filter feeding communities comprised of organisms such as sponges; these communities support relatively diverse demersal fish assemblages (McLean et al. 2017). IMR activities may result in minor loss of filter feeder habitat as a result of seabed disturbance. Although impacts to filter feeding communities resulting from IMR activities may result in permanent loss, this is expected to be restricted to a very small portion of filter feeder habitat, which is broadly represented in the wider NWS Province. Where the IMR activity creates hard substrate habitat (e.g. span rectification, pipeline protection and stabilisation), this habitat may be suitable for recruitment of filter feeding communities. As such, impacts to filter feeders due to IMR activities are expected to be localised and not significant. Artificial Habitat The presence of the riser platform and subsea infrastructure provides hard substrate for the settlement of marine organisms; the availability of hard substrate is often a limiting factor in benthic communities. As such, the presence of the facility and subsea infrastructure has led to the development of ecological communities which would not have existed otherwise. For example, pipeline infrastructure has been shown to support more diverse fish assemblages and benthic biota (McLean et al. 2017). These communities are relatively diverse compared to the open water and soft sediment habitats in the broader Operational Area. The provision of artificial habitat associated with the facility and subsea infrastructure will have either no adverse environmental impact or a low level of positive environmental impact through increasing biological diversity. Values and Sensitivities

Angel Operations Environment Plan Summary
This document is protected by copyright. No part of this document may be reproduced, adapted, transmitted, or stored in any form by any process (electronic or otherwise) without the specific written consent of Woodside. All rights are reserved.
Controlled Ref No:XX Revision: 0 Native file DRIMS No: 1400947213 Page 84 of 175
Uncontrolled when printed. Refer to electronic version for most up to date information.
Glomar Shoals Benthic habitats of Glomar Shoals (overlaps with eastern extent of Operational Area) are characterised by sand/silt substrate and low epibenthic cover (approximately 53% total cover), with soft corals and sponges the most abundant fauna (AIMS 2014a). While the Operational Area overlaps Glomar Shoals (approximately 0.015% of the Glomar Shoals KEF lies within the Operational Area), the nearest subsea infrastructure/wells are approximately 1.47 km away (i.e. there is no infrastructure within the Glomar Shoals KEF). The majority of resuspended sediments from IMR activities are expected to remain localised (i.e. depositing in a small area of the Glomar Shoals). The NWS Province experiences naturally high episodic sediment resuspension due to events such as tidal movements and cyclones, and the biota in the region are adapted to such conditions. Thus, impacts to Glomar Shoals due to seabed disturbance are not expected to occur. Ancient Coastline at 125 m Depth Contour Benthic habitat surveys in the region (including within the Ancient Coastline at 125 m Depth Contour KEF) indicate that benthic habitats within the KEF are characterised by sand interspersed with areas of rubble and outcroppings of limestone pavement (AIMS 2014b). Such habitats are widely distributed in the NWS Province. No significant escarpments, species of conservation significance, emergent features or areas of high biological productivity characteristically associated with the Ancient Coastline at 125 m KEF have been observed in the Operational Area. These impacts are discussed in relation to filter feeders above. The geomorphic feature the KEF is associated with is represented worldwide and represents the coastline during a previous glacial period. The area of the KEF overlapped by the Operational Area constitutes approximately 0.18% of the total area of the KEF. The footprint of the export pipeline within the Ancient Coastline at 125 m depth contour KEF is considerably smaller. Therefore, potential impacts to this regional-scale KEF are expected to be negligible.
Summary of Control Measures • All support vessels used for IMR activities will be DP capable. • Monitoring and maintenance of subsea infrastructure to manage scour and flowline movement within integrity
envelope.

Angel Operations Environment Plan Summary
This document is protected by copyright. No part of this document may be reproduced, adapted, transmitted, or stored in any form by any process (electronic or otherwise) without the specific written consent of Woodside. All rights are reserved.
Controlled Ref No:XX Revision: 0 Native file DRIMS No: 1400947213 Page 85 of 175
Uncontrolled when printed. Refer to electronic version for most up to date information.
Routine Acoustic Emissions: Generation of Noise during Routine Operations
Impacts Evaluation Summary
Source of Impact
Environmental Value Potentially Impacted Evaluation
Soil
and
Gro
undw
ater
Mar
ine
Sedi
men
t
Wat
er Q
ualit
y
Air
Qua
lity
(incl
. O
dour
)
Ecos
yste
ms/
Hab
itat
Spec
ies
Soci
o-Ec
onom
ic
Dec
isio
n Ty
pe
Con
sequ
ence
/Impa
ct
Like
lihoo
d
Ris
k R
atin
g
ALA
RP
Tool
s
Acc
epta
bilit
y
Noise generated within the Operational Area from: • facility and associated
infrastructure • vessels and subsea IMR
activities • helicopters.
X A F - - LCS GP PJ
Broa
dly
acce
ptab
le
Description of Source of Impact The facility, support vessels and helicopters will generate noise both in the air and underwater, due to the operation of machinery noise, propeller movement, etc. Typical noise levels for these sources are provided in Table 12-1, with more detailed descriptions provided below. These noises will contribute to, and can exceed, ambient noise levels which range from around 90 dB re 1 μPa (root square mean sound pressure level (SPL)) under very calm, low wind conditions, to 120 dB re 1 μPa (SPL) under windy conditions (McCauley 2005).
Table 12-1: Indicative source characteristics of underwater noise associated with the Petroleum Activities Program as reported in †Jiménez-Arranz et al. (2017) and by ‡McCauley (2005) and §McCauley (2002)
Acoustic Noise Sources Estimated SPL (dB re 1 µPa SPL) @1 m unless otherwise stated
Frequency Range (kHz)
Vessels (Continuous)
Support vessels using DP‡ 182 Broadband
Subsea IMR Activities (Impulsive)
Multibeam Echo Sounder (MBES)† 210–247 12–675
Side Scan Sonar (SSS)† 200–234 9–675
Sub-bottom Profiler (SBP) (Pinger)† 167–212 4–12
SBP (Chirp)† 161–205 2–23
SBP (Boomer)† 205–225 0.3–6
Wellhead, Flowlines and Subsea Infrastructure (Continuous)
Wellhead§ 113 Broadband
Choke valve§ 155 Broadband
Production platforms
Riser platform† 110–130 @100 m Broadband (mainly < 100 Hz)
* range provided was not measured at the noise source; therefore, this should be used as an indicative estimate only and cannot be used to estimate exposure thresholds closer to the source

Angel Operations Environment Plan Summary
This document is protected by copyright. No part of this document may be reproduced, adapted, transmitted, or stored in any form by any process (electronic or otherwise) without the specific written consent of Woodside. All rights are reserved.
Controlled Ref No:XX Revision: 0 Native file DRIMS No: 1400947213 Page 86 of 175
Uncontrolled when printed. Refer to electronic version for most up to date information.
Acoustic Noise Sources Estimated Sound Pressure Level (SPL) (dB re 1 µPa SPL)
Frequency Range (kHz)
Vessels (Continuous)
Support vessels using DP 182 Broadband
Subsea IMR Activities (Pulsed)
Multibeam echo sounder 214 200–300
Side scan sonar 226 120–410
Sub-bottom profiler (CHIRP) 205 1–12
Sub-bottom profiler (Pinger) 214 2–12
Sub-bottom profiler (Boomer) 212 0.5–5
Wellhead, Flowlines and Subsea Infrastructure (Continuous)
Wellhead 113 Broadband
Choke valve 155 Broadband
Vessels The main source of noise from support vessels (both platform support and subsea support vessels) relates to the use of DP thrusters (i.e. cavitation from thruster propellers). Thruster noise is typically high intensity and broadband in nature. Sound levels of up to 137 dB re 1 µPa at 405 m across frequency spectra ranging from < 100 Hz to > 1 KHz were recorded from a typical offshore support vessel holding station in strong currents (McCauley 1998). It is expected underwater noise levels up to this may be generated by vessels within the Operational Area during the Petroleum Activities Program. Note that vessels undertaking the Petroleum Activities Program inherently minimise the use of DP, and there is little potential to reduce DP use further. Vessels may emit noise through the hull acting as a transducer (e.g. machinery vibration being converted to underwater noise), as well as through cavitation from fast moving surfaces such as propellers and thrusters. Thruster noise is typically the most significant noise source for vessels holding station, with other noise sources typically relatively minor (McCauley 1998). As an unmanned facility, routine vessel activity is typically limited to:
• routine intervention maintenance visits of the facility (approximately eight times per year) involving platform support vessels transporting equipment, supplies and waste
• stand-by helicopter and support vessel operations • radar coverage of the facility during manned mode • subsea inspection, maintenance and repair activities.
All vessels are required to comply with EPBC Regulation 2000 – Part 8 Interacting with Cetaceans to reduce the likelihood of collisions with cetaceans. Implementing this control may incidentally reduce the noise generated by vessels in proximity to cetaceans, as vessels will be travelling slower; slower vessel speeds may reduce underwater noise from machinery (main engines) and propeller cavitation. Subsea IMR Activities Acoustic survey may be undertaken as part of IMR activities, including SSS and MBES surveys. These methods are typically used infrequently (e.g. SSS generally used for up to five days every four years); these acoustic sources are not constantly active during these infrequent IMR activities. Indicative source characteristics for typical acoustic survey equipment are provided in Table 12-1. Helicopters Helicopter engines and rotor blades are recognised as a source of noise emissions, which may constitute a source of environmental risk resulting in behavioural disturbance to marine fauna. Activities relevant to the Operational Area will relate to the landing and take-off of helicopters on the riser platform (which coincides with routine intervention maintenance visits) and potentially support vessels. During these critical stages of helicopter operations, safety takes precedence. Helicopter flights are at their lowest (i.e. closest point to the sea surface) during these periods of take-off and landing from heli-decks, which constitutes a relatively short phase of routine flight operations. Wellhead, Pipelines and Subsea infrastructure The noise produced by an operational wellhead was measured by McCauley (2002). The broadband noise level was very low, 113 dB re 1 µPa, which is only marginally above rough sea condition ambient noise. For a number of nearby wellheads, the sources would have to be in very close proximity (< 50 m apart) before their signals summed to increase
Angel Operations Environment Plan Summary
This document is protected by copyright. No part of this document may be reproduced, adapted, transmitted, or stored in any form by any process (electronic or otherwise) without the specific written consent of Woodside. All rights are reserved.
Controlled Ref No:XX Revision: 0 Native file DRIMS No: 1400947213 Page 87 of 175
Uncontrolled when printed. Refer to electronic version for most up to date information.
the total noise field (with two adjacent sources only increasing the total noise field by three dB). Hence for multiple wellheads in an area, the broadband noise level in the vicinity of the wellheads would be expected to be of the order of 113 dB re 1 µPa. This would drop very quickly to ambient conditions on moving away from the wellhead, falling to background levels within < 200 m from the wellhead. Based on the measurements of wellhead noise discussed in McCauley (2002), which included flow noise in pipelines, noise produced along a pipeline may be expected to be similar to that described for wellheads, with the radiated noise field falling to ambient levels within a hundred metres of the pipeline. Woodside has undertaken acoustic measurements on the noise generated by operating choke valves associated with the facility (JASCO Applied Sciences 2015). These measurements indicated choke valve noise is continuous, and the frequency and intensity of noise emitted is dependent on the rate of production from the well. Noise intensity at low production rates (16% and 30% choke positions) were approximately 154–155 dB re 1 µPa, with higher production rates (85% and 74% choke positions) resulting in lower noise levels (141–144 dB re 1 µPa). Noise from choke valve operation was broadband in nature, with the majority of noise energy concentrated above 1 kHz. Noise from choke valve operation was considered minor compared to noise generated by vessels using thrusters in the area. Note, during the suspension mode of operation, wells will be shut in and choke valves will only be intermittently open to ensure the HP and LP flare systems remain operational. Riser Platform Machinery Production platforms have machinery mounted on decks raised above the sea; hence, most noise is transmitted to the marine environment from air. Machinery noise onboard the riser platform may be radiated into the underwater environment via the jacket legs and risers, which may act as transducers. Noise generated from the facility and associated infrastructure is comparably lower than other production facilities in Australia and internationally. This is due to its NNM status, smaller facility size, lower production capacity and therefore less platform machinery, and lower number of wells. Underwater noise generated by the facility is expected to be minimal, with monitoring programs indicating that underwater noise from platforms is typically very low or not detectable (McCauley 2002). The HP and LP flare systems will generate noise from combustion. Noise from flaring represents a health and safety risk to personnel, and noise from flaring was considered in the design of the facility to manage the occupational health and safety risks associated with noise (e.g. height specification of flare tower). Noise from flaring is emitted at the top of the flare tower, which is approximately 90 m above the riser platform. Noise from the tip of the flare is not constrained and will spread spherically in all directions.
Impact Assessment Underwater Noise The Operational Area of the Petroleum Activities Program is located in waters between approximately 80 and 125 m deep. The fauna associated with this area will be predominantly pelagic species of fish, with migratory species such as turtles, whale sharks and cetaceans present in the area seasonally. While the Ancient Coastline KEF may be associated with outcroppings of hard substrate, no evidence of significant reefs associated with such outcroppings has been found in the Operational Area. Note some demersal fish are likely to be associated with subsea infrastructure such as pipelines (McLean et al. 2017). Glomar Shoals (overlaps Operational Area) hosts marine fauna such as fishes which may be impacted upon by noise emissions, with the boundary of the Glomar Shoals KEF approximately1.47 km from the nearest well and approximately 2.8 km from the riser platform. Elevated underwater noise can affect marine fauna, including cetaceans, fish, turtles, sharks and rays in three main ways (Richardson et al. 1995):
1. by causing direct physical effects on hearing or other organs, including: a. mortality/potential mortal injury resulting from exposure to noise b. permanent threshold shift (PTS) – permanent reduction in the ability to perceive sound following
exposure to noise c. temporary threshold shift (TTS) – temporary reduction in the ability to perceive sound following
exposure to noise, with hearing returning to normal. 2. by masking or interfering with other biologically important sounds (including vocal communication,
echolocation, signals and sounds produced by predators or prey) 3. through disturbance leading to behavioural changes or displacement from important areas.
The potential impacts of anthropogenic noise on marine mammals have been the subject of considerable research; reviews are provided by Richardson et al. (1995), Nowacek et al. (2007), Southall et al. (2007), Weilgart (2007) and Wright et al. (2007). To inform the assessment, the impact thresholds provided in Table 12-2 were considered in relation to the credible sources of acoustic emissions.
Table 12-2: Impact threshold for environmental receptors based on *Southall et al. (2007) and †Popper et al. (2014)
Receptor Mortality and Impairment Behaviour

Angel Operations Environment Plan Summary
This document is protected by copyright. No part of this document may be reproduced, adapted, transmitted, or stored in any form by any process (electronic or otherwise) without the specific written consent of Woodside. All rights are reserved.
Controlled Ref No:XX Revision: 0 Native file DRIMS No: 1400947213 Page 88 of 175
Uncontrolled when printed. Refer to electronic version for most up to date information.
potential mortal injury
PTS TTS Masking
Low-frequency cetaceans*
192 dB re 1 µPa2s M-weighted SEL
198 dB re 1 µPa2s M-weighted SEL
183 dB re 1 µPa2s M-weighted SEL
- 120-160 dB re 1 µPa SPL
Mid-frequency cetaceans*
198 dB re 1 µPa2s M-weighted SEL
198 dB re 1 µPa2s M-weighted SEL
183 dB re 1 µPa2s M-weighted SEL
- 90-170 dB re 1 µPa SPL
High-frequency cetaceans*
179 dB re 1 µPa2s M-weighted SEL
198 dB re 1 µPa2s M-weighted SEL
183 dB re 1 µPa2s M-weighted SEL
- 90-140 dB re 1 µPa SPL
Fish: no swim bladder†
(N) Low (I) Low (F) Low
(N) Low (I) Low (F) Low
(N) Moderate (I) Low (F) Low
(N) High (I) High (F) Moderate
(N) Moderate (I) Moderate (F) Low
Fish: swim bladder not involved in hearing†
(N) Low (I) Low (F) Low
(N) Low (I) Low (F) Low
(N) Moderate (I) Low (F) Low
(N) High (I) High (F) Moderate
(N) Moderate (I) Moderate (F) Low
Fish: swim bladder involved in hearing†
(N) Low (I) Low (F) Low
170 dB SPL for 48 hrs
158 dB SPL for 12 hrs
(N) High (I) High (F) High
(N) High (I) Moderate (F) Low
Sea turtles† (N) Low (I) Low (F) Low
(N) Low (I) Low (F) Low
(N) Moderate (I) Low (F) Low
(N) High (I) High (F) Moderate
(N) High (I) Moderate (F) Low
Note: a range of sound units are provided in the table above, reflecting the range of studies from which this data has been derived. The difference in units presents difficulty in reliably comparing threshold values. Where practicable, the threshold values have been compared with indicative sound sources levels of the same sound unit types to facilitate comparison. The sound units provided in the table above include:
• M-weighted sound exposure level (SEL): a weighted sound metric that emphasises the audible frequency bands for the receptor groups – low, mid and high frequency cetaceans. SEL units are time integrated and best suited for continuous noise sources, such as vessels holding station or continuous machinery noise.
• Root mean square (rms) sound pressure level (SPL): root mean square of time-series pressure level, useful for quantifying continuous noise sources (as per SEL point above).
• Relative risk (high, medium and low) is given for fish (all types), turtles, eggs and larvae at three distances from the source defined in relative terms as near (N), intermediate (I) and far (F) (Popper et al. 2014).
Vessel Noise Using the thruster noise measured by McCauley (1998) as an indicative value for the potential thruster noise generated by vessels during the Petroleum Activities Program, and the thresholds presented in Table 12-2, the potential for noise-induced mortality of cetaceans, fish, sea turtles and eggs/larvae is not considered credible. However, other impacts such as PTS, TTS, masking and behavioural impacts may occur. Using a simple cylindrical geometric spreading equation3 to estimate transmission loss (TL) of thruster noise at 182 dB re 1 µPa at 100 Hz (Table 12-3), potential impacts may include:
• cetaceans: potential behavioural disturbance out to approximately 1 km for low frequency cetaceans (e.g. humpback whales) and 10 km for mid and high frequency cetaceans (e.g. coastal dolphins)
• fish: potential masking and behavioural disturbance at near and intermediate range; likelihood of TTS is considered to be not credible, given fish would move away from the source; site attached fish (e.g. at Glomar Shoals) are not expected to be exposed to underwater noise above impact thresholds
• turtles: potential masking and behavioural disturbance at intermediate and far range. Note the estimates in Table 12-3 are considered to underestimate transmission loss, and are, hence, inherently
3 TL = 20log10(R) + αR where:
TL is transmission loss (in dB), R is the range between source and receptor, and α is the frequency-specific absorption coefficient (0.001 at 100 Hz) (Fisher and Simmons 1977) for typical seawater on the NWS (temperate 25 °C, salinity of 35 PSU and pH of 8).

Angel Operations Environment Plan Summary
This document is protected by copyright. No part of this document may be reproduced, adapted, transmitted, or stored in any form by any process (electronic or otherwise) without the specific written consent of Woodside. All rights are reserved.
Controlled Ref No:XX Revision: 0 Native file DRIMS No: 1400947213 Page 89 of 175
Uncontrolled when printed. Refer to electronic version for most up to date information.
conservative, due to: • use of low frequency (100 Hz) component of thruster noise signature; note, thruster noise is typically broadband
in nature, with much of the noise energy at frequencies > 100 Hz, which are absorbed more rapidly in seawater • use of high intensity thruster noise (i.e. thruster operating at full power); most times using thrusters is at lower
than full power, with concomitant reduction in cavitation noise intensity. Table 12-3: Estimated sound transmission loss for a 182 dB re 1 µPa source at 100 Hz frequency
Range Transmission Lost Received Noise (dB re µPa)
100 40.1 141.9
500 54.5 127.5
1000 61.0 121.0
2000 68.0 114.0
5000 79.0 103.0
10,000 90.0 92.0
Fauna such as cetaceans, fish, and turtles are capable of moving away from potential noise sources, and there are no constraints to the movement of these fauna within the Operational Area. In addition, since the facility is a NNM facility, vessel activities and thus noise emitted from vessels is limited to short, durations. Cetaceans Given the migration corridor BIAs for pygmy blue whale (approximately 44 km from Operational Area at closest point) and humpback whales (approximately 35 km from Operational Area at closest point) lie beyond the range at which behavioural disturbances are expected to occur, no significant impacts (e.g. PTS, TTS) to these species are expected to occur during their seasonal migrations through the region. Behavioural impacts would be restricted to a small number of animals in relatively close (< 1 km) proximity to vessels. Mid and high frequency cetaceans are known to show behavioural disturbance at a range of received noise levels (Southall et al. 2007). Mid and high frequency cetaceans may exhibit short-term behavioural responses to increased levels of underwater noise, such as avoidance or attraction. Fishes Demersal and pelagic fish species are present in the Operational Area, including fish communities associated with the Ancient Coastline at 125 m Depth Contour and Glomar Shoals KEFs (which overlap the Operational Area), and the existing subsea infrastructure. Potential impacts to fish (including whale sharks) are expected to be restricted to masking and behavioural disturbance. Fish may temporarily be displaced from the immediate vicinity of a noise source; however, they would be expected to behave normally once the noise emissions ceased. Note that a foraging BIA for whale sharks overlaps the Operational Area, and the species may be seasonally present (particularly between March and July) during their annual migration to and from the aggregation area off Ningaloo Reef. Note that whale sharks are not considered to be particularly vulnerable to underwater noise, and they do not have a swim bladder (considered to increase the vulnerability of a fish to noise related impacts). Potential impacts to whale sharks are expected to consist of no more than a short-term temporary displacement from noise sources while transiting the Operational Area. Given the expected duration and characteristics of noise emissions during the Petroleum Activities Program, impacts to fish are expected to be restricted to localised, short-term behavioural impacts, from which full recovery is expected to occur. Turtles Turtles may occur in the Operational Area, although it does not contain known foraging habitat, with the exception of Glomar Shoals on the eastern extent of the Operational Area. Turtles may exhibit behavioural responses when exposed to underwater noise, such as diving. Such disturbances are not expected to have any significant effect on individual turtles. As such, no significant impacts to marine turtles from underwater noise are expected. Subsea IMR Activities Underwater noise from MBES and SSS will attenuate rapidly in the water column due to the relatively high frequency of noise emissions from these sources. No impacts to sensitive fauna are expected to occur as a result of these sources. SBP are typically lower frequency than MBES or SSS, and acoustic emissions from SPBs may propagate further in the water column. Based on typical source levels and frequencies for SBPs and the geometric spreading equation present in vessel noise above, noise energy from an SBP will reach 160 dB re 1 μPa rms SPL within approximately 250 m of the source, and 120 dB re 1 μPa rms SPL within approximately 1250 m of the source. This is comparable to the noise potentially produced by thrusters (refer to Vessel Noise section above for a discussion of potential impacts), although SBP emissions are pulsed rather than continuous. Helicopter Noise Water has a very high acoustic impedance contrast compared to air, and the sea surface is a strong reflector of noise

Angel Operations Environment Plan Summary
This document is protected by copyright. No part of this document may be reproduced, adapted, transmitted, or stored in any form by any process (electronic or otherwise) without the specific written consent of Woodside. All rights are reserved.
Controlled Ref No:XX Revision: 0 Native file DRIMS No: 1400947213 Page 90 of 175
Uncontrolled when printed. Refer to electronic version for most up to date information.
energy (i.e. very little noise energy generated above the sea surface crosses into and propagates below the sea surface (and vice versa) – the majority of the noise energy is reflected). The angle at which the sound path meets the surface influences the transmission of noise energy from the atmosphere through the sea surface; angles ±> 13° from vertical being almost entirely reflected (Richardson et al. 1995). Given this, and the typical characteristics of helicopter flights within the Operational Area (duration, frequency, altitude and air speed), the opportunity for underwater noise levels that may result in behavioural disturbance to marine fauna are not considered to be credible. Wellheads, Pipelines and Riser Platform Machinery Noise Given the low levels of noise emitted by subsea infrastructure such as wellheads, choke valves, pipelines and the riser platform jacket legs, no impacts to marine fauna from these noise sources are expected during either operation or suspension mode. Measurements of noise generated by choke valves indicated it is relatively high frequency (> 1 kHz) and hence, will attenuate over relatively short distances in the water column. Flare noise, like helicopter noise, is generated in the atmosphere and has limited potential to propagate in the sea due to the high acoustic impedance of water. Additionally, the height of the flare tower and the unconstrained propagation of noise from the flare in the atmosphere means the potential for impacts to fauna at or near the sea surface is inherently highly unlikely, with no lasting effect and will be highly localised.
Summary of Control Measures • Maintaining helicopter separation from cetaceans as per EPBC Regulations 2000 – Part 8 Division 8.3
(Regulation 8.07), which includes the following measure: o Helicopters shall not operate lower than 1650 feet or within a horizontal radius of 500 m of a cetacean
known to be present in the area, except for takeoff and landing
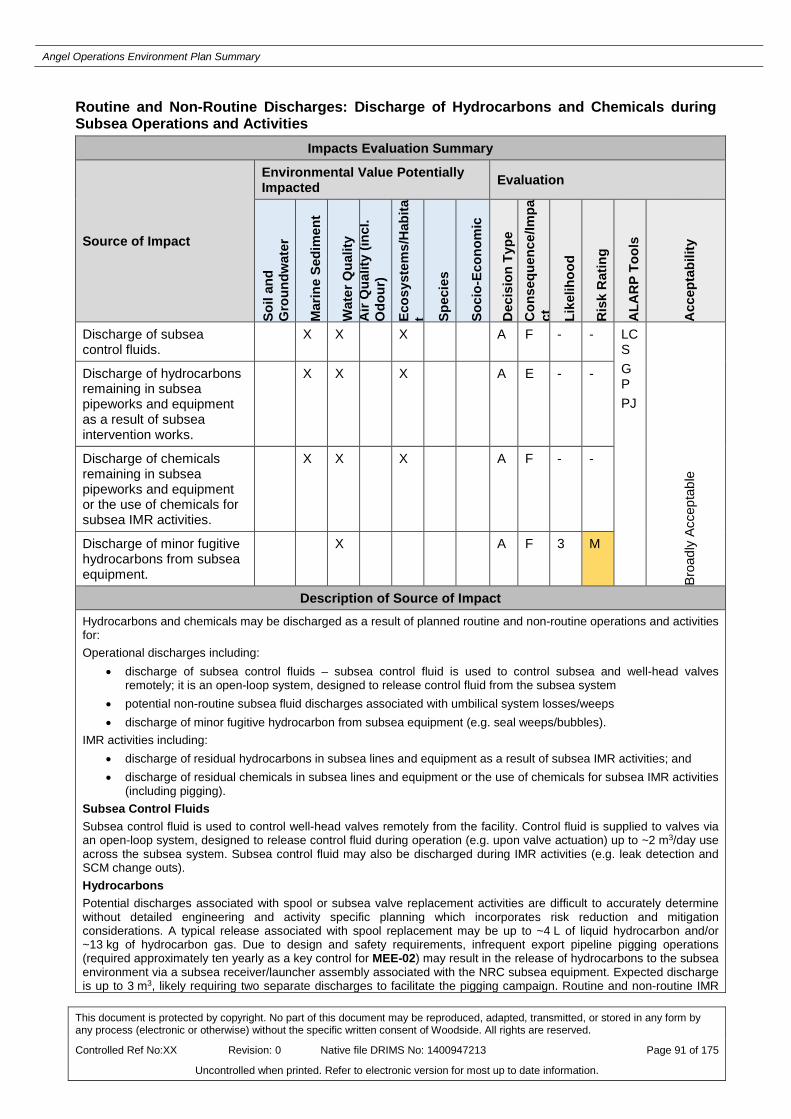
Angel Operations Environment Plan Summary
This document is protected by copyright. No part of this document may be reproduced, adapted, transmitted, or stored in any form by any process (electronic or otherwise) without the specific written consent of Woodside. All rights are reserved.
Controlled Ref No:XX Revision: 0 Native file DRIMS No: 1400947213 Page 91 of 175
Uncontrolled when printed. Refer to electronic version for most up to date information.
Routine and Non-Routine Discharges: Discharge of Hydrocarbons and Chemicals during Subsea Operations and Activities
Impacts Evaluation Summary
Source of Impact
Environmental Value Potentially Impacted Evaluation
Soil
and
Gro
undw
ater
Mar
ine
Sedi
men
t
Wat
er Q
ualit
y A
ir Q
ualit
y (in
cl.
Odo
ur)
Ecos
yste
ms/
Hab
itat Sp
ecie
s
Soci
o-Ec
onom
ic
Dec
isio
n Ty
pe
Con
sequ
ence
/Impa
ct
Like
lihoo
d
Ris
k R
atin
g
ALA
RP
Tool
s
Acc
epta
bilit
y
Discharge of subsea control fluids.
X X X A F - - LCS GP PJ
Broa
dly
Acce
ptab
le
Discharge of hydrocarbons remaining in subsea pipeworks and equipment as a result of subsea intervention works.
X X X A E - -
Discharge of chemicals remaining in subsea pipeworks and equipment or the use of chemicals for subsea IMR activities.
X X X A F - -
Discharge of minor fugitive hydrocarbons from subsea equipment.
X A F 3 M
Description of Source of Impact Hydrocarbons and chemicals may be discharged as a result of planned routine and non-routine operations and activities for: Operational discharges including:
• discharge of subsea control fluids – subsea control fluid is used to control subsea and well-head valves remotely; it is an open-loop system, designed to release control fluid from the subsea system
• potential non-routine subsea fluid discharges associated with umbilical system losses/weeps • discharge of minor fugitive hydrocarbon from subsea equipment (e.g. seal weeps/bubbles).
IMR activities including: • discharge of residual hydrocarbons in subsea lines and equipment as a result of subsea IMR activities; and • discharge of residual chemicals in subsea lines and equipment or the use of chemicals for subsea IMR activities
(including pigging). Subsea Control Fluids Subsea control fluid is used to control well-head valves remotely from the facility. Control fluid is supplied to valves via an open-loop system, designed to release control fluid during operation (e.g. upon valve actuation) up to ~2 m3/day use across the subsea system. Subsea control fluid may also be discharged during IMR activities (e.g. leak detection and SCM change outs). Hydrocarbons Potential discharges associated with spool or subsea valve replacement activities are difficult to accurately determine without detailed engineering and activity specific planning which incorporates risk reduction and mitigation considerations. A typical release associated with spool replacement may be up to ~4 L of liquid hydrocarbon and/or ~13 kg of hydrocarbon gas. Due to design and safety requirements, infrequent export pipeline pigging operations (required approximately ten yearly as a key control for MEE-02) may result in the release of hydrocarbons to the subsea environment via a subsea receiver/launcher assembly associated with the NRC subsea equipment. Expected discharge is up to 3 m3, likely requiring two separate discharges to facilitate the pigging campaign. Routine and non-routine IMR
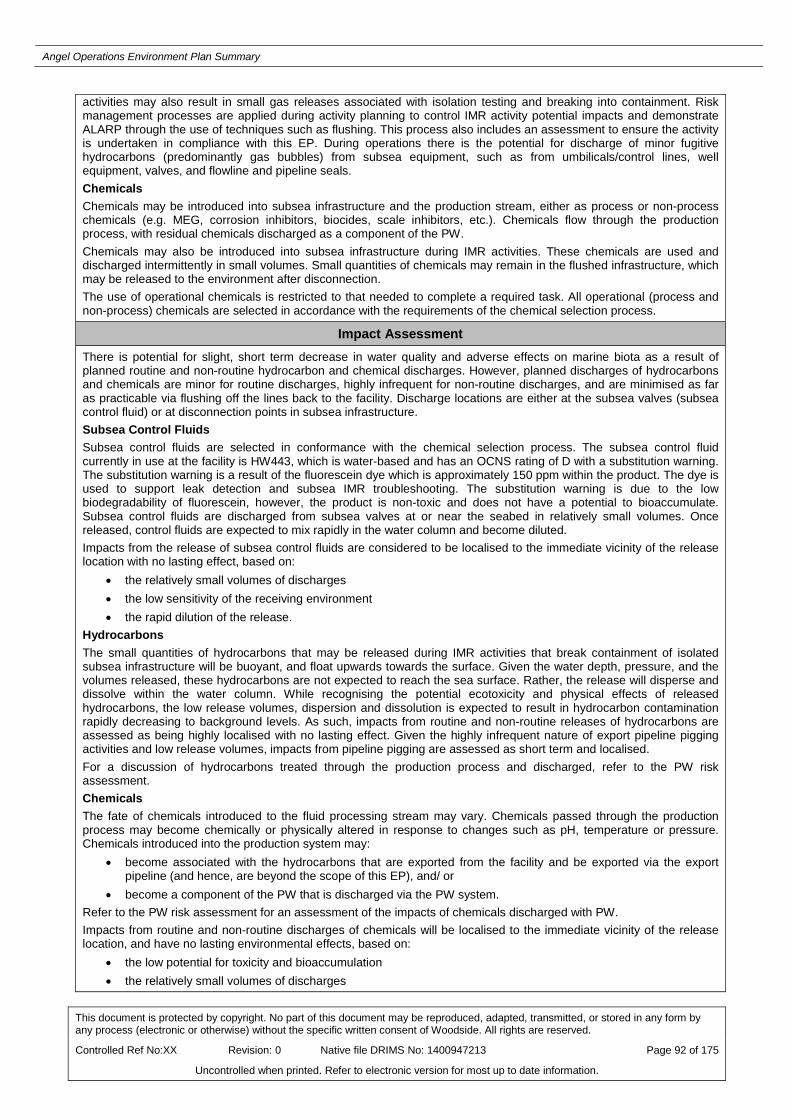
Angel Operations Environment Plan Summary
This document is protected by copyright. No part of this document may be reproduced, adapted, transmitted, or stored in any form by any process (electronic or otherwise) without the specific written consent of Woodside. All rights are reserved.
Controlled Ref No:XX Revision: 0 Native file DRIMS No: 1400947213 Page 92 of 175
Uncontrolled when printed. Refer to electronic version for most up to date information.
activities may also result in small gas releases associated with isolation testing and breaking into containment. Risk management processes are applied during activity planning to control IMR activity potential impacts and demonstrate ALARP through the use of techniques such as flushing. This process also includes an assessment to ensure the activity is undertaken in compliance with this EP. During operations there is the potential for discharge of minor fugitive hydrocarbons (predominantly gas bubbles) from subsea equipment, such as from umbilicals/control lines, well equipment, valves, and flowline and pipeline seals. Chemicals Chemicals may be introduced into subsea infrastructure and the production stream, either as process or non-process chemicals (e.g. MEG, corrosion inhibitors, biocides, scale inhibitors, etc.). Chemicals flow through the production process, with residual chemicals discharged as a component of the PW. Chemicals may also be introduced into subsea infrastructure during IMR activities. These chemicals are used and discharged intermittently in small volumes. Small quantities of chemicals may remain in the flushed infrastructure, which may be released to the environment after disconnection. The use of operational chemicals is restricted to that needed to complete a required task. All operational (process and non-process) chemicals are selected in accordance with the requirements of the chemical selection process.
Impact Assessment There is potential for slight, short term decrease in water quality and adverse effects on marine biota as a result of planned routine and non-routine hydrocarbon and chemical discharges. However, planned discharges of hydrocarbons and chemicals are minor for routine discharges, highly infrequent for non-routine discharges, and are minimised as far as practicable via flushing off the lines back to the facility. Discharge locations are either at the subsea valves (subsea control fluid) or at disconnection points in subsea infrastructure. Subsea Control Fluids Subsea control fluids are selected in conformance with the chemical selection process. The subsea control fluid currently in use at the facility is HW443, which is water-based and has an OCNS rating of D with a substitution warning. The substitution warning is a result of the fluorescein dye which is approximately 150 ppm within the product. The dye is used to support leak detection and subsea IMR troubleshooting. The substitution warning is due to the low biodegradability of fluorescein, however, the product is non-toxic and does not have a potential to bioaccumulate. Subsea control fluids are discharged from subsea valves at or near the seabed in relatively small volumes. Once released, control fluids are expected to mix rapidly in the water column and become diluted. Impacts from the release of subsea control fluids are considered to be localised to the immediate vicinity of the release location with no lasting effect, based on:
• the relatively small volumes of discharges • the low sensitivity of the receiving environment • the rapid dilution of the release.
Hydrocarbons The small quantities of hydrocarbons that may be released during IMR activities that break containment of isolated subsea infrastructure will be buoyant, and float upwards towards the surface. Given the water depth, pressure, and the volumes released, these hydrocarbons are not expected to reach the sea surface. Rather, the release will disperse and dissolve within the water column. While recognising the potential ecotoxicity and physical effects of released hydrocarbons, the low release volumes, dispersion and dissolution is expected to result in hydrocarbon contamination rapidly decreasing to background levels. As such, impacts from routine and non-routine releases of hydrocarbons are assessed as being highly localised with no lasting effect. Given the highly infrequent nature of export pipeline pigging activities and low release volumes, impacts from pipeline pigging are assessed as short term and localised. For a discussion of hydrocarbons treated through the production process and discharged, refer to the PW risk assessment. Chemicals The fate of chemicals introduced to the fluid processing stream may vary. Chemicals passed through the production process may become chemically or physically altered in response to changes such as pH, temperature or pressure. Chemicals introduced into the production system may:
• become associated with the hydrocarbons that are exported from the facility and be exported via the export pipeline (and hence, are beyond the scope of this EP), and/ or
• become a component of the PW that is discharged via the PW system. Refer to the PW risk assessment for an assessment of the impacts of chemicals discharged with PW. Impacts from routine and non-routine discharges of chemicals will be localised to the immediate vicinity of the release location, and have no lasting environmental effects, based on:
• the low potential for toxicity and bioaccumulation • the relatively small volumes of discharges

Angel Operations Environment Plan Summary
This document is protected by copyright. No part of this document may be reproduced, adapted, transmitted, or stored in any form by any process (electronic or otherwise) without the specific written consent of Woodside. All rights are reserved.
Controlled Ref No:XX Revision: 0 Native file DRIMS No: 1400947213 Page 93 of 175
Uncontrolled when printed. Refer to electronic version for most up to date information.
• the low sensitivity of the receiving environment • the rapid dilution of the release.
Values and Sensitivities KEFs Two KEFs overlap the Operational Area, being the Ancient Coastline at 125 m Depth Contour and Glomar Shoals. Glomar Shoals is more than 1.4 km from any subsea infrastructure; therefore, any subsea releases will not impact on the KEF. Pigging discharges will be from NRC subsea equipment, located approximately 55 km from the Ancient Coastline at 125 m Depth Contour and Glomar Shoals. No significant escarpments, species of conservation significance, emergent features or areas of high biological productivity characteristically associated with the Ancient Coastline at 125 m KEF have been observed in the Operational Area. Therefore, potential impacts to these regional-scale KEFs are not expected.
Summary of Control Measures • Chemical Selection and Assessment Environment Guideline:
o Where Gold/Silver/E/D OCNS rating (and no OCNS substitution or product warning), chemicals are selected, no further control required.
o If chemicals with a different OCNS rating, sub-warning or non OCNS rated chemicals are require, chemicals will be assessed in accordance with the procedure prior to use
• Subsea infrastructure flushed where practicable during IMR disconnection activities to reduce volume/ concentration of hydrocarbons released to the environment
• Monitoring subsea control fluid use, investigating material discrepancies, and using control fluid with dye marker to support identification of potential integrity failures
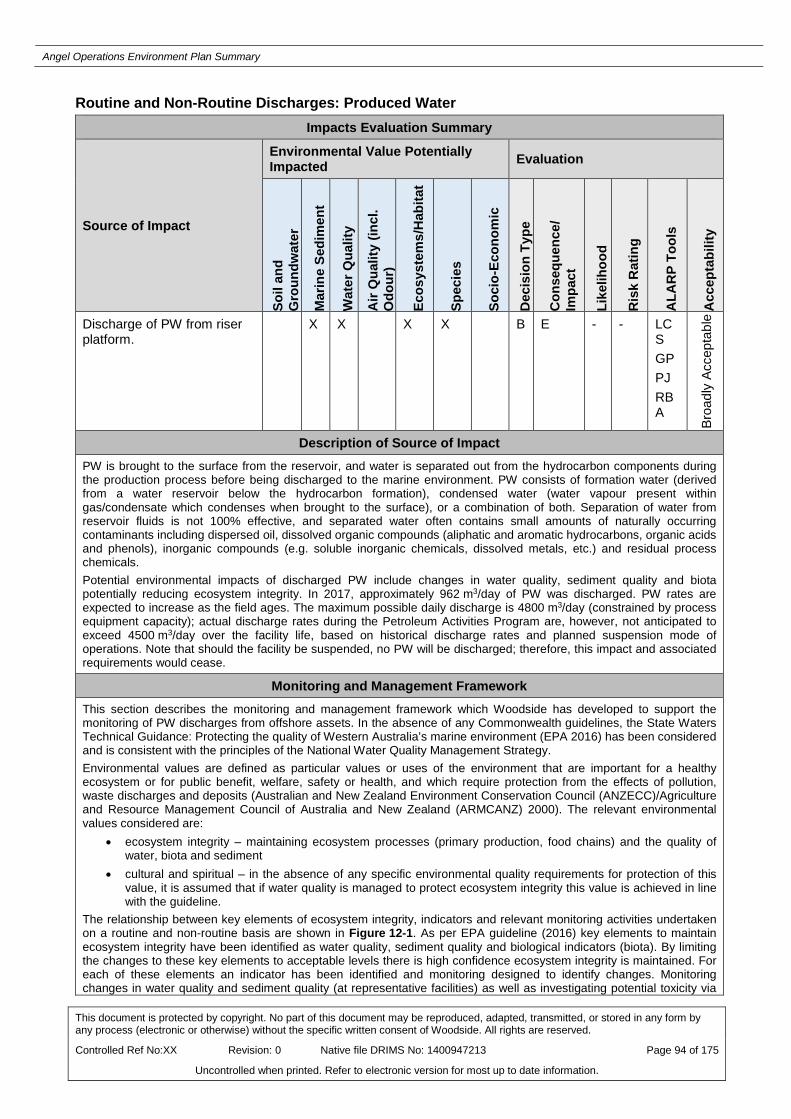
Angel Operations Environment Plan Summary
This document is protected by copyright. No part of this document may be reproduced, adapted, transmitted, or stored in any form by any process (electronic or otherwise) without the specific written consent of Woodside. All rights are reserved.
Controlled Ref No:XX Revision: 0 Native file DRIMS No: 1400947213 Page 94 of 175
Uncontrolled when printed. Refer to electronic version for most up to date information.
Routine and Non-Routine Discharges: Produced Water Impacts Evaluation Summary
Source of Impact
Environmental Value Potentially Impacted Evaluation
Soil
and
Gro
undw
ater
Mar
ine
Sedi
men
t
Wat
er Q
ualit
y
Air
Qua
lity
(incl
. O
dour
)
Ecos
yste
ms/
Hab
itat
Spec
ies
Soci
o-Ec
onom
ic
Dec
isio
n Ty
pe
Con
sequ
ence
/ Im
pact
Like
lihoo
d
Ris
k R
atin
g
ALA
RP
Tool
s
Acc
epta
bilit
y
Discharge of PW from riser platform.
X X X X B E - - LCS GP PJ RBA
Broa
dly
Acce
ptab
le
Description of Source of Impact PW is brought to the surface from the reservoir, and water is separated out from the hydrocarbon components during the production process before being discharged to the marine environment. PW consists of formation water (derived from a water reservoir below the hydrocarbon formation), condensed water (water vapour present within gas/condensate which condenses when brought to the surface), or a combination of both. Separation of water from reservoir fluids is not 100% effective, and separated water often contains small amounts of naturally occurring contaminants including dispersed oil, dissolved organic compounds (aliphatic and aromatic hydrocarbons, organic acids and phenols), inorganic compounds (e.g. soluble inorganic chemicals, dissolved metals, etc.) and residual process chemicals. Potential environmental impacts of discharged PW include changes in water quality, sediment quality and biota potentially reducing ecosystem integrity. In 2017, approximately 962 m3/day of PW was discharged. PW rates are expected to increase as the field ages. The maximum possible daily discharge is 4800 m3/day (constrained by process equipment capacity); actual discharge rates during the Petroleum Activities Program are, however, not anticipated to exceed 4500 m3/day over the facility life, based on historical discharge rates and planned suspension mode of operations. Note that should the facility be suspended, no PW will be discharged; therefore, this impact and associated requirements would cease.
Monitoring and Management Framework This section describes the monitoring and management framework which Woodside has developed to support the monitoring of PW discharges from offshore assets. In the absence of any Commonwealth guidelines, the State Waters Technical Guidance: Protecting the quality of Western Australia’s marine environment (EPA 2016) has been considered and is consistent with the principles of the National Water Quality Management Strategy. Environmental values are defined as particular values or uses of the environment that are important for a healthy ecosystem or for public benefit, welfare, safety or health, and which require protection from the effects of pollution, waste discharges and deposits (Australian and New Zealand Environment Conservation Council (ANZECC)/Agriculture and Resource Management Council of Australia and New Zealand (ARMCANZ) 2000). The relevant environmental values considered are:
• ecosystem integrity – maintaining ecosystem processes (primary production, food chains) and the quality of water, biota and sediment
• cultural and spiritual – in the absence of any specific environmental quality requirements for protection of this value, it is assumed that if water quality is managed to protect ecosystem integrity this value is achieved in line with the guideline.
The relationship between key elements of ecosystem integrity, indicators and relevant monitoring activities undertaken on a routine and non-routine basis are shown in Figure 12-1. As per EPA guideline (2016) key elements to maintain ecosystem integrity have been identified as water quality, sediment quality and biological indicators (biota). By limiting the changes to these key elements to acceptable levels there is high confidence ecosystem integrity is maintained. For each of these elements an indicator has been identified and monitoring designed to identify changes. Monitoring changes in water quality and sediment quality (at representative facilities) as well as investigating potential toxicity via
Angel Operations Environment Plan Summary
This document is protected by copyright. No part of this document may be reproduced, adapted, transmitted, or stored in any form by any process (electronic or otherwise) without the specific written consent of Woodside. All rights are reserved.
Controlled Ref No:XX Revision: 0 Native file DRIMS No: 1400947213 Page 95 of 175
Uncontrolled when printed. Refer to electronic version for most up to date information.
WET testing and implementing management to maintain acceptable levels of changes is standard industry practice in Commonwealth and State waters. The relevant indicators to understand changes in key elements and, therefore, potential for impact to ecosystem integrity, are physio-chemical stressors, toxicants in water, biological indicators and toxicants in sediment. A number of trigger values for each indicator have been defined and are monitored to detect changes. Trigger values serve as an early warning that potential changes beyond the acceptable limits may occur. The acceptable limits of change are no impacts from PW beyond the approved mixing zone: To determine if acceptable limits have been exceeded routine monitoring of trigger values is undertaken. An approved mixing zone protects 99% of species, as calculated using the ANZECC/ARMCANZ (2000) statistical distribution methodology on the results of direct toxicity assessment using sub-lethal chronic endpoints. The protection of 99% of species maintains a high level of ecological protection and represents no detectable change from natural variation (as per ANZECC/ARMCANZ (2000); The approved mixing zone boundary for Angel is 500 m. The justification for these limits of change being ‘acceptable’ is provided in the impact assessment section below. Operational Monitoring OIW is monitored during routine operations via an online analyser. Online analyser information is sent via transmitter and reported to the NRC control system (DCS), and is also captured within the process historian database (PHD). The DCS facilitates visibility in the NRC control room, for manual or automated process control changes to be made, and/or alarms annunciated (e.g. high OIW specification). PHD information is available onshore for analysis and trending. During each intervention visit approximately 6-weekly basis or eight times per year, operators manually sample PW and send onshore via helicopter at the start of each planned intervention visit for manual analyser QC checks at the onshore lab. The results are sent back to the operator to allow calibration of both analysers during the same intervention visit. Two analysers are installed on the Angel facility, with a single analyser online at any one time. The analysers can be operated remotely if one is suspected of fault or breaks down. Any anomalies that are identified are investigated to determine the cause, and may be addressed by corrective maintenance during the next planned maintenance campaign. Loss of Signal Management If there is a loss of signal from both OIW analysers, operators will attempt to reset analysers remotely and monitor process stability for changes with the potential to result in an increase in the OIW concentration. If analysers cannot be restored and there are no observable changes to a stable operating process, low water cut, and proof of reliable results below 30 mg/L, the next intervention visit will include restart of the analyser if the next planned intervention is within seven days. If the next planned intervention is greater than seven days away, a ‘react’ visit will take place. If there is a lack of certainty around results risking OIW measurements exceeding 30 mg/L for more than six consecutive hours, and a risk of OIW exceedance (24-hour rolling average) is anticipated, the asset may undertake a ‘react’ visit via helicopter to verify results. The helicopter will be deployed to the platform for the visit within 12 hours, weather and time-of-day permitting. High OIW Management If the analyser is online and the OIW measurement exceeds 30 mg/L for more than six consecutive hours, and risk of OIW exceedance (24-hour rolling average) is anticipated, the asset may undertake a ‘react’ visit via helicopter to verify results. The helicopter will be deployed to the platform for the visit within 12 hours, weather and time-of-day permitting. Routine Monitoring PW is monitored and managed in accordance with the Offshore Marine Discharges Adaptive Management Plan (OMDAMP)4. The OMDAMP details trigger values, routine monitoring assessment against trigger values, analytical methods, and actions when a trigger value is exceeded.
4 The OMDAMP is reviewed annually. As such, it is important to note the OMDAMP information presented in this EP is subject to update to reflect new methodologies and adaptive management. . Any changes in the OMDAMP are subject to the Change Management requirements.

Angel Operations Environment Plan Summary
This document is protected by copyright. No part of this document may be reproduced, adapted, transmitted, or stored in any form by any process (electronic or otherwise) without the specific written consent of Woodside. All rights are reserved.
Controlled Ref No:XX Revision: 0 Native file DRIMS No: 1400947213 Page 96 of 175
Uncontrolled when printed. Refer to electronic version for most up to date information.
Figure 12-1: Ecosystem integrity and monitoring The trigger values are applied through a risk-based approach that is intended to capture any uncertainty around the level of impact, by staging monitoring and management responses according to the degree of risk to ecosystem integrity. The approach provides a level of confidence that management responses are not triggered too early (i.e. when there is no actual impact), or too late after significant or irreversible damage to the surrounding ecosystem (EPA 2016). Routine monitoring applicable to the facility, to compare against trigger values, is described in Table 12-4. Unacceptable changes in water quality and raw PW toxicity are able to be detected early and can indicate the potential for an impact prior to an impact occurring. WET testing confirms if there is a potential for impact on biota. It is not appropriate to monitor for changes in species composition, diversity etc. as there are limited receptors in the direct impact zone (a surface buoyant plume) and such changes may be detected after an impact occurs and therefore are not considered appropriate for early detection. PW samples should represent normal operations, so sampling should only be undertaken during periods of normal production for the facility. Where possible samples are taken at a time when all PW-producing wells are online (or as many as reasonably possible). The WET tests are undertaken on a broad range of taxa of ecological relevance for which accepted standard test protocols are well-established. WET tests are mainly focused on the early life stages of test organisms, when organisms are typically at their most sensitive to contaminants are designed to represent local trophic level receptors. The dilutions required to protect 99% of species, is calculated using the ANZECC/ARMCANZ (2000) statistical distribution methodology on the results of direct toxicity assessment using sub-lethal chronic endpoints. The protection of 99% of species maintains a high level of ecological protection at the boundary of the approved mixing zone.
Table 12-4: Trigger values used during routine monitoring
Parameter Monitoring Summary Frequency*
Chemical characterisation: end of pipe sample – toxicants
Results that are predicted to be higher than the 99% species protection trigger value at approved mixing zone boundary, and are above the results from the earlier toxicity year or above the toxicity year when no trigger was available.
Annual timed to consider if sample is representative.
Chemical characterisation: end of pipe sample – physio chemical
Results that are predicted to be higher than the 99% species protection trigger value at approved mixing zone boundary, and are above the results from the earlier toxicity year or above the toxicity year when no trigger was available.
Annual
Increase in TSS exceeds parameters described in existing sedimentation studies.
Annual
Whole effluent toxicity (WET)
The 99% species protection safe dilutions derived from the WET testing species sensitivity distributions are not predicted to be
Three yearly. Conducted in parallel

Angel Operations Environment Plan Summary
This document is protected by copyright. No part of this document may be reproduced, adapted, transmitted, or stored in any form by any process (electronic or otherwise) without the specific written consent of Woodside. All rights are reserved.
Controlled Ref No:XX Revision: 0 Native file DRIMS No: 1400947213 Page 97 of 175
Uncontrolled when printed. Refer to electronic version for most up to date information.
testing1 achieved at boundary of approved mixing zone and are higher than previous years.
with annual chemical characterisation where feasible.
Review of continuous operational monitoring results
Increases in the average monthly OIW concentration by 5 mg/L for more than six consecutive months or by 10 mg/L for two consecutive months.
Monthly
Discharge volume Monthly mean discharge volume exceeds modelled discharge at which approved mixing zone is met.
Monthly review
Note: 1 Earlier toxicity year means the year in which the most recent WET test occurred. 2 Where no guideline is specified for a contaminant of concern, derive a value on the basis of natural background (reference) concentration multiplied by an appropriate factor (2–3) as described by the ANZECC guidelines. If a trigger value is met, it triggers uncertainty around whether the environmental value is being protected, and further investigation is required (Figure 12-2).
Figure 12-2: Routine monitoring and adaptive management framework for produced water Further Investigations Detectable exceedances in trigger values may occur without impacting ecosystem integrity. To provide confidence that ecosystem integrity has been achieved, further investigation is required in the form of a desktop study to initially assess the exceedance in the context of available data (multiple lines of evidence) and confirm if there is potential for impact to the environmental value. A desktop assessment is necessary before undertaking any additional infield monitoring. This ensures monitoring programs are designed and implemented to provide robust findings based on good survey design. A range of methods can be used to detect trigger value exceedances (e.g. relative percentage difference, control charts, multivariate analysis, etc.), depending on the dataset available. An appropriate method is selected as described in the OMDAMP due to the variable nature of environmental data. If critical data is not available, the desktop study will identify potential data gaps and may recommend additional non-routine studies and/or monitoring to ensure the assessment is appropriately undertaken. The purpose of the further investigations is to provide certainty that the EPS has been achieved, if a trigger value has been exceeded. The key investigation steps are described below:
1. Confirm the trigger value has been exceeded – Review quality assurance and quality control, methodology and possible sources of contamination to determine if the results are reliable, or if any factors

Angel Operations Environment Plan Summary
This document is protected by copyright. No part of this document may be reproduced, adapted, transmitted, or stored in any form by any process (electronic or otherwise) without the specific written consent of Woodside. All rights are reserved.
Controlled Ref No:XX Revision: 0 Native file DRIMS No: 1400947213 Page 98 of 175
Uncontrolled when printed. Refer to electronic version for most up to date information.
have occurred that may compromise the integrity of the monitoring or data. 2. Complete a desktop assessment to understand whether the EPS is at risk – If a trigger value is
confirmed to be exceeded, multiple lines of evidence are considered including historical and current data from routine and non-routine monitoring and studies. This assessment shall consider whether there is adequate evidence to demonstrate that acceptability criteria have been met and ecological integrity is not at risk (EPS not breached). If the desktop assessment determines the existing body of evidence is insufficient, it shall outline what additional monitoring or studies are required. The desktop assessment is needed before undertaking all additional infield monitoring. It ensures monitoring programs are designed and implemented to provide robust findings based on good survey design. Potential additional monitoring/studies may include but are not limited to:
• single species test (collected annually in parallel with routine chemical characterisation should further investigation be required)
• dilution modelling and/or studies • settling velocity analysis • metal bioavailability • scanning electron microscopy and particle size distribution analyses • in-situ water quality chemical characterisation.
Routine monitoring activities may be required ahead of schedule; additional monitoring not listed may be undertaken as appropriate. Field monitoring (routine and non-routine) is undertaken in accordance with a plan that details timing, locations and objectives of monitoring.
3. Conduct additional studies to confirm the EPS is not at risk – Monitoring results provide additional lines of evidence to determine whether there is a risk to ecosystem integrity due to unacceptable changes in water quality sediment, or biological indicators. Given the significant health, safety and technical risks, monitoring of the receiving environment is typically only considered when all other sources of evidence are insufficient to demonstrate that ecological integrity is not at risk. The OMDAMP provides detailed guidance on the steps and actions to be undertaken if a trigger value is exceeded, and this may include additional non-routine monitoring to verify that ecological integrity is maintained.
If environmental impact is deemed to be within acceptable limits of change, the desktop assessment may consider a review of trigger values to ensure they are appropriate. If potential impacts to ecosystem integrity outside of the acceptable limits are identified, there is potential to impact ecosystem integrity; an ALARP/Acceptability study is required to determine what additional controls can be implemented to ensure the impacts are not realised. ALARP/Acceptability Study An ALARP/Acceptability study is conducted once it has been determined, as a result of further investigations, that there is potential for an impact which exceeds the acceptable limits of change. The ALARP/Acceptability study shall be conducted in accordance with the ALARP Demonstration Procedure (Woodside Reference WM1040PF9258835), to determine additional controls that may be necessary to reduce the potential impacts. Additional controls may include technology or process upgrades, reservoir management. Woodside will implement the additional controls identified in the ALARP/Acceptability study, which are required to give confidence that the acceptable limits on environmental impact can be achieved. Field validation of model assumptions, and additional monitoring to assess whether impacts have been realised, will be considered.
Impact Assessment Potential impacts of PW discharge include:
• Changes to Water Quality • Toxicity to biota • Changes to Sediment Quality.
In order to understand potential impacts from PW discharges, Woodside has undertaken a suite of comprehensive in-situ testing and sampling related to PW discharges representing long-term operational periods from its offshore production facilities. The details of this testing and resultant understanding of potential environmental impacts are outlined below. Potential Impacts to Water Quality Potential impacts to water quality have been assessed through chemical characterisation of PW and monitoring of ongoing discharge volumes. Variability is managed via the Monitoring and Management Framework. Chemical Characterisation of PW (Physio-chemical Parameters) PW is discharged from the riser platform above the water line at +8 m above LAT. The plume will initially plunge and then rise to the surface as positively buoyant plume. Samples of undiluted PW sampled annually from the end of pipe were analysed from 2011 to 2017 for key physio-chemical parameters (Table 12-5). The results were compared to the trigger values and further investigation was undertaken when required. In most cases, results are below trigger values, or similar to the results of chemical characterisation in the previous year’s WET testing was undertaken (i.e. previous toxicity year).

Angel Operations Environment Plan Summary
This document is protected by copyright. No part of this document may be reproduced, adapted, transmitted, or stored in any form by any process (electronic or otherwise) without the specific written consent of Woodside. All rights are reserved.
Controlled Ref No:XX Revision: 0 Native file DRIMS No: 1400947213 Page 99 of 175
Uncontrolled when printed. Refer to electronic version for most up to date information.
It should be acknowledged that although exceedances of ANZECC/ARMCANZ (2000) guideline values are highlighted in the tables below, PW does not need to achieve 99% species protection guideline values at the end of pipe to meet the acceptable limits of change. The increase in TSS seen from 2016 to 2017 was considered further in terms of potential impacts to sediment quality. Chemical characterisation of the undiluted PW indicated ammonia, naphthalene, benzene and phenols were present at levels above the ANZECC/ARMCANZ (2000) guideline values at the end of the pipe. To achieve the 99% species protection guideline values, the maximum dilution required was 7.2 (ammonia). Modelling predicts 116 dilutions will be achieved within 20 m and at the boundary of the approved mixing zone more than 2000 dilutions are predicted, pproviding high confidence that impacts from physico-chemical parameters measured in the PW discharge are considered to be highly localised and pose negligible effects to environmental receptors.
Table 12-5: Physical and organic chemical characterisation for facility (2011–2017). Values exceeding ANZECC/ARMCANZ (2000) 99% species protection guideline values for marine water shaded in grey
Analyte ANZECC Trigger Valuea
2011 2014 2015 2016 2017
pH -c 4.2 6.1 4.5 4.6 6.3
Salinity (PSU) -c 0.1 23 0.1 0.6 29
Ammonia (NH3-N mg/L) pH adjusted (where pH is between 6.0 and 9.0
3.9 4.5 17 4.2 5.1 28
TSS (mg/L) -c - 8 < 2 10 35
BTEX (mg/L) Benzene 0.50 (mod) 2 2.2 2.4 2.1 2.3
Toluene f 4 3.4 3.8 3.2 3.1
Ethylbenzene f 0.34 0.13 0.16 0.13 0.1
m and p-Xylene f 3.2 1 1.5 1.2 1
o-Xylene f 1.1 0.37 0.47 0.38 0.29
Xylenes c 4.3 1.37 1.47 1.58 1.29
Total petroleum hydrocarbons (TPHs) (mg/L)
C6–C9 c 11 9 8.3 7 6.8
C10–C14 c 11 8.7 3.9 4 17
C15–C28 c 0.99 18 1.4 1.5 0.38
C29–C36 c < 0.1 0.14 < 0.1 < 0.1 < 0.1
National Environmental Protection Measure (NEPM) total recoverable hydrocarbons (TRHs) (mg/L)
C6–C10 c - 9.1 8.3 7 6.8
C6–C10 (no BTEX)
c - 2.1 < 0.25
< 0.25
< 0.25
>C10–C16 c - 15 4.1 4.4 1.5
>C10–C16 (no Naphthalene)
c - 15 3.9 4.4 1.4
>C16–C34 c - 12 0.78 0.66 0.22
>C34–C40 c - < 0.1 < 0.1 < 0.1 < 0.1
PAH (µg/L) Naphthalene 50 (high) 260 170 150 210 80
Acenaphthylene c < 5 1.4 < 0.5 2.9 < 0.5
Acenaphthene c < 5 0.86 < 0.5 <0.5 < 0.5
Fluorene c 15 22 8.3 12 3.4
Phenathrene f 8.1 29 5.8 7.3 2.5
Anthracene f < 5 2.5 < 0.5 6.8 < 0.5
Fluoranthene f < 5 3 < 0.5 < 0.5 < 0.5
Pyrene c < 5 1.7 < 0.5 < 0.5 < 0.5
Chrysene c - 1.5 < 0.5 < 0.5 < 0.5
Benzo(a)pyrene f - < 0.5 < 0.5 < 0.5 < 0.5

Angel Operations Environment Plan Summary
This document is protected by copyright. No part of this document may be reproduced, adapted, transmitted, or stored in any form by any process (electronic or otherwise) without the specific written consent of Woodside. All rights are reserved.
Controlled Ref No:XX Revision: 0 Native file DRIMS No: 1400947213 Page 100 of 175
Uncontrolled when printed. Refer to electronic version for most up to date information.
a 99% species protection guideline value (ANZECC/ARMCANZ 2000) guideline ranking of moderate and high reliability is shown in parenthesis. c No guideline value. f Low reliability guideline trigger values have been derived in the absence of a dataset of sufficient quantity, using larger assessment factors to account for greater uncertainty. Values are not used as default guidelines but are compared with PW characterisation values. Chemical Characterisation of PW (Toxicants in Water) Samples of undiluted PW sampled annually from the end of pipe were analysed from 2011 to 2017 for key toxicants (Table 12-6). The results were compared to the trigger values, and further investigation undertaken if required. In most cases, values are below trigger values or similar to previous years’ when WET testing was undertaken (relative percentage difference). It should be acknowledged that, although exceedances of ANZECC/ARMCANZ (2000) guideline values are highlighted in the tables below, PW does not need to achieve 99% species protection guideline values at the end of pipe. In instances where ANZECC/ARMCANZ (2000) guideline values were exceeded, no cases required confirmation to ensure a significant change had not occurred (i.e. with possible consequences to PW toxicity and/or potential change to the extent of the mixing zone). Levels of cobalt, copper, manganese and zinc were above the ANZECC/ARMCANZ (2000) 99% species protection guideline values at the end of pipe have been observed. To achieve the guideline values a maximum of 2.5 dilutions (for zinc) would be required however both metals are expected to achieve ANZECC/ARMCANZ (2000) 99% species protection guideline values within 20 m based on 116 dilutions predicted by modelling. This is supported by recent insitu monitoring at GWA in 2015. The highest metal in the GWA PW, at end of pipe, was barium with a concentration of 33,250 ± 500 µg/L. In the receiving water, the barium concentrations were consistent with background levels at all sites (including the closest site 25 m away for the discharge), indicating very high dilutions within a short distance from the discharge. Results provide high confidence that impacts from toxicants measured in the PW discharge are considered to be highly localised and pose negligible effects to environmental receptors. Continued annual chemical characterisation of the discharge stream is proposed to detect changes in water quality.
Table 12-6: Metal and metalloid characterisation for facility (2011–2017). Values exceeding ANZECC/ARMCANZ 99% species protection guideline values for marine water shaded in grey.
Metal and Metalloid
ANZECC trigger
value (µg/L) a
2011 2014 2015 2016 2017
Dis
solv
ed
(µg/
L)b
Tota
l (µg
/L)
Dis
solv
edb
Tota
l
Dis
solv
edb
Tota
l
Dis
solv
edb
Tota
l
Dis
solv
edb
Tota
l
Silver 0.8 (high) < 0.3 < 0.3 < 0.2 < 0.2 < 0.2 < 0.2 < 0.03 < 0.03 0.02 0.12
Aluminium 24d - - 1 18 6 7 < 5 < 5 < 10 < 10
Arsenic f 0.4 < 0.2 - - - - - - 1.3 1.6
Barium c 411 407 231 215 1200 1200 310 320 275 275
Cadmium 0.7 (high) - - 0.02 0.02 < 0.02 < 0.02 < 0.02 < 0.02 0.01 0.02
Chromium 8 (III) (moderate) 1.4 (V) (high)
0.7 0.9 < 1 < 1 1 1 0.8 0.7 < 0.1 0.3
Phenols (mg/L) Phenol 0.27 (high) 4.5 2.7 4.9 3.8 1.8
2-Methylphenol c 0.54 0.4 0.97 0.53 0.26
3- and 4-Methylphenol
c 1.1 0.81 1.6 1.1 0.53
2- and 4-Dimethylphenol
f 0.92 0.05 0.52 0.02 0.02
Organic acids (mg/L) Acetic Acid c 63 55 62 68 55
Butyric Acid c < 1 < 5 5.4 5.4 5
Isobutyric Acid c < 5 < 5
Propionic Acid c 13 11 26 23 9.2

Angel Operations Environment Plan Summary
This document is protected by copyright. No part of this document may be reproduced, adapted, transmitted, or stored in any form by any process (electronic or otherwise) without the specific written consent of Woodside. All rights are reserved.
Controlled Ref No:XX Revision: 0 Native file DRIMS No: 1400947213 Page 101 of 175
Uncontrolled when printed. Refer to electronic version for most up to date information.
Cobalt 1 (high) - - 0.34 0.36 1 1 1.1 1.1 0.21 0.23
Copper 0.3 (high) < 1 < 1 0.3 0.3 < 0.01 0.01 < 0.04 < 0.04 < 0.1 < 0.1
Iron c 8,300 8,320 8,600 8,600 7,800 7,800 7,800 7,900 8,300 9,500
Manganese 140e 42 44 225 218 43 43 45 45 38 38
Nickel 7 (high) 4.2 4.1 1.7 1.8 5 5 4.5 4.4 1.1 1.3
Lead 2.2 (high) < 0.1 < 0.1 0.1 0.2 < 1 < 1 0.07 0.07 < 0.02 0.14
Zinc 7 (high) 2 3 18 17 2 2 2 2 4 6
Mercury 0.1 (high) - < 0.01 - 0.046 - 0.006 - 0.022 - 0.019
a 99% species protection guideline value (ANZECC/ARMCANZ 2000) ranking of moderate and high reliability is shown in parenthesis. b Dissolved fraction (0.45 µg/L). c No guideline value. d Golding et al. (2015) and draft submission paper to the Council of Australian Government’s Standing Council on Environment and Water (SCEW). e Draft submission paper to the Council of Australian Government’s Standing Council on Environment and Water (SCEW 2014). f Low reliability guideline trigger values have been derived in the absence of a dataset of sufficient quantity, using larger assessment factors to account for greater uncertainty. Values are not used as default guidelines but are compared with PW characterisation values. Discharge Volumes The average volume of PW currently discharged from the facility (962 m3/day in 2017) is lower than the maximum capacity modelled (4,800 m3/day). However, the actual discharges are expected to be significantly lower than this maximum, based on historical discharge rates and the potential suspension mode of operation.
Potential Impacts to Biota
Potential impacts of PW to biological indicators have been assessed through WET testing and dilution modelling to ensure the approved mixing zone is achieved. WET Testing Most treated PW has low to moderate toxicity (Neff et al. 2011), with actual toxicity of discharge dependant on the chemical constituents of the PW and any added process chemicals, the level of treatment and dilution with condensed water prior to release, and the dilution of the discharge as it mixes with sea water. Most hydrocarbons in PW are considered non-specific narcotic toxins with additive toxicities; therefore, the toxicity of a PW will, in part, depend on the total concentration and range of bioavailable hydrocarbons (Neff 2002). WET testing was undertaken to allow for interactions between toxicants and take into account toxicants which cannot readily be measured, or are not known to be present in the sample. For the WET testing, a total of eight bioassays were carried out (Jacobs 2018). A range of tropical and temperate Australian marine species were selected based on their ecological relevance, known sensitivity to contaminants, availability of robust test protocols, and known reproducibility and sensitivity as test species. The results were combined by plotting a species sensitivity distribution to derive 99% species protection safe dilutions (50% confidence), which were calculated from the species protection triggers following the Warne et al. (2015) revised method for deriving ANZECC guideline values for toxicants, to obtain estimates of safe dilution. Routine WET testing was completed as required by the previous EP in 2017, 2014 and 2011 (Table 12-7). The safe dilution estimates for 2017 were lower than the previous two years of testing.
Table 12-7: PC99 concentrations and safe dilutions (PNEC)
Species Protection Level
PNEC concentrations
PCx 2011 2014 2017
PC99 (50) 0.38 (1 in 260) 0.053 (1 in 1900) 0.61 (1 in 164)
Determination of Approved Mixing Zone To determine the potential impact of the PW to the marine environment, modelling was conducted to predict the distance at which 99% species protection safe dilutions are achieved, using the most recent WET testing results (2017) available at the time to reflect the current potential toxicity. The Predicted Environmental Concentration (PEC) values

Angel Operations Environment Plan Summary
This document is protected by copyright. No part of this document may be reproduced, adapted, transmitted, or stored in any form by any process (electronic or otherwise) without the specific written consent of Woodside. All rights are reserved.
Controlled Ref No:XX Revision: 0 Native file DRIMS No: 1400947213 Page 102 of 175
Uncontrolled when printed. Refer to electronic version for most up to date information.
are based on four-day averaged PW dilution estimates, to match exposure concentrations to effect concentrations (Winton et al. 2008) for each modelled location under worst-case seasonal (summer, winter and transitional) conditions. Distances from the discharge point where predicted dilutions exceed those required for 99% species protection safe dilution under different seasonal conditions, are assessed with reference to a previous 3D plume model for the facility. The latest modelling study was carried out in 2018 (Jacobs 2018). Model simulations of dilutions were undertaken for three main seasons prevalent on the NWS, based on measured current and wind data supplied by Woodside. Ocean current data was collected at multiple depths through the water column at NRC. Conditions at NRC are considered representative of Angel due to their proximity to each other (approximately 49 km) and open ocean conditions. As the modelling of ocean current speed and direction varies substantially within each season, the full current records were analysed to select periods typical of the three seasons on the NWS, but erring on the side of low current speeds to give conservative model results (Jacobs 2016). Further to these hydrodynamic inputs, the Rob Phillips Consulting produced formation water discharge model was validated in 2006 using the results from a dye dispersion study (Oceanic Field Services 2006) undertaken from the North Rankin A platform. The predicted plume dilutions reasonably matched those measured. The results from the WET testing undertaken in 2017 were used to develop PNEC values that were inputs to the model. The four-day averaged PW concentrations provide estimates of the mean in-situ exposure concentration. The four-day PEC value is used to determine the PEC/PNEC ratios and the distances from the discharge point at which 99% species protection safe dilutions (PC99) are achieved (Table 12-8), based on the 2017 discharge rate (962 m3/day) and maximum discharge rate (4,800 m3/day). The modelling shows a surface buoyant plume that is readily diluted to 99% species protection safe dilution within 20 m of the discharge location under worst-case conditions at actual and maximum discharge rates (Figure 12-3). Winton et al. (2008) ran discharge scenarios to test the sensitivity of the time averaging approach, and determined that the four-day averaging period was appropriate for interpreting the environmental hazard of PW discharges, and it matches the median exposure period of WET tests used to derive 99% species protection safe dilutions. The approved mixing zone boundary was derived using 2014 WET testing results as the worst case. At 4,500 m3 /day flow rates the 99% species protection safe dilutions will be met at 400 m. A 500 m mixing zone is proposed as the integrity flow rate has been revised to 4,800 m3 from 4,500 m3 /day. To allow for changing reservoir conditions flexibility is required to ensure that approved mixing zone continues to be met at the increased the flow rate. Although 99% species protection safe dilutions are currently easily met at modelled discharge rates, it is not appropriate to reduce the mixing zone boundary. Historical monitoring has shown higher toxicity and increase flow rates may result in larger mixing zone. As demonstrated WET testing results are variable (Table 12-7) which impacts the mixing zone (Table 12-8). Therefore, for operational flexibility, it is proposed to maintain a 500 m approved mixing zone to reflect 99% species protection safe dilutions at maximum expected discharge 4,800 m3/day.
Table 12-8: Maximum modelled distances at which 99% species protection safe dilutions are achieved from the discharge point
Scenarios Discharge rate (m3/day)
Maximum distance at which PC99 PNEC achieved (i.e. PEC:PNEC = 1)
2014 Wet Testing 1,500 200 m
4,500 400 m
2017 Wet Testing 962 < 20 m
4,800 < 20 m
Figure 12-3 shows the spatial distribution of the four-day average PEC/PNEC ratios. Presented are the most recent results from 2017 which show the PW discharge would be diluted to safe concentrations for the protection 99% of species within 20 m of the discharge point. The 2014, 99% species protection safe dilutions (worst case) , are also presented and show that under highest predicted discharge volume, the PW discharge would be diluted to safe concentrations (to meet PNEC 0.01%) for 99% species protection value is achieved within 400 m of the facility, where there are no KEFs or other sensitive environmental receptors. The nearest sensitive receptors are Glomar Shoals KEF and the Montebello Marine Park approximately 2.8 km and 90 km from the discharge point respectively. As PW forms a buoyant plume which does not reach the KEF depth, no contact and therefore no change in water quality at the KEF is expected from the plume. There is potential for toxicants to settle out of the water column and impact sediment quality however given the dilutions achieved by the approved mixing zone and previous information from sedimentation studies this is not deemed credible at Glomar Shoals. The Montebello Marine Park is located over 90 km from the discharge source. Given the distance from the discharge source no impacts to the Montebellos Marine Park are anticipated. Routine monitoring (end of pipe chemical characterisation and WET testing) detects changes at the approved mixing zone boundary. If trigger values are predicted to be exceeded at this distance further investigation will be required as described above. This may include a review of single species toxicity test results, additional WET testing or in situ monitoring. If trigger values at 500 m are not exceeded there can be high confidence that maximum ecological protection is achieved by the nearest sensitive receptor.

Angel Operations Environment Plan Summary
This document is protected by copyright. No part of this document may be reproduced, adapted, transmitted, or stored in any form by any process (electronic or otherwise) without the specific written consent of Woodside. All rights are reserved.
Controlled Ref No:XX Revision: 0 Native file DRIMS No: 1400947213 Page 103 of 175
Uncontrolled when printed. Refer to electronic version for most up to date information.
Figure 12-3: PEC/PNEC for PW discharge at Angel during the transitional period (grey range ring represents 1 km radius; red range ring represents 200 m radius)- 2017 Bioaccumulation Bioaccumulation refers to the amount of a substance taken up by an organism through all routes of exposure (water, diet, inhalation, epidermal). The Bioaccumulation Factor is the ratio of the steady-state tissue concentration and the steady-state environmental concentration (assuming uptake is from food and water). The test developed to measure the ability of a substance to bioaccumulate, namely, the octanol-water partition (pow), is based on the preferential partitioning of lipophilic organic compounds into the octanol phase. Partitioning into octanol can be correlated with the attraction for such compounds to the fatty tissue (lipid) of organisms. The average concentration of BTEX in PW discharged from the facility is approximately 6.8 mg/L (Table 12-5). Bioaccumulation of BTEX compounds has been observed to occur in the laboratory, but only at concentrations far in excess of that discharged from the facility (for example refer to Berry 1980); hence, it is unlikely BTEX would bioaccumulate at the exposure concentrations that may be experienced by biota around the facility. In contrast to BTEX compounds, PAH compounds have high log pow values indicative of the potential for bioaccumulation (Vik et al. 1996). Neff and Sauer (1996) reviewed the available literature for laboratory and field studies investigating the bioaccumulation of PAHs. The bioaccumulation values for PAHs in marine organisms collected near PW discharges in the Gulf of Mexico, reported by Neff and Saur (1996), indicate that the highest bioaccumulation factor were in the tissues of bivalve molluscs and the lowest in the muscle tissue of fish. The most comprehensive field study assessing bioaccumulation of hydrocarbons and metals from PW discharged into offshore waters is that by Neff et al. (2011). At the request of the U.S. Environmental Protection Agency (USEPA), the
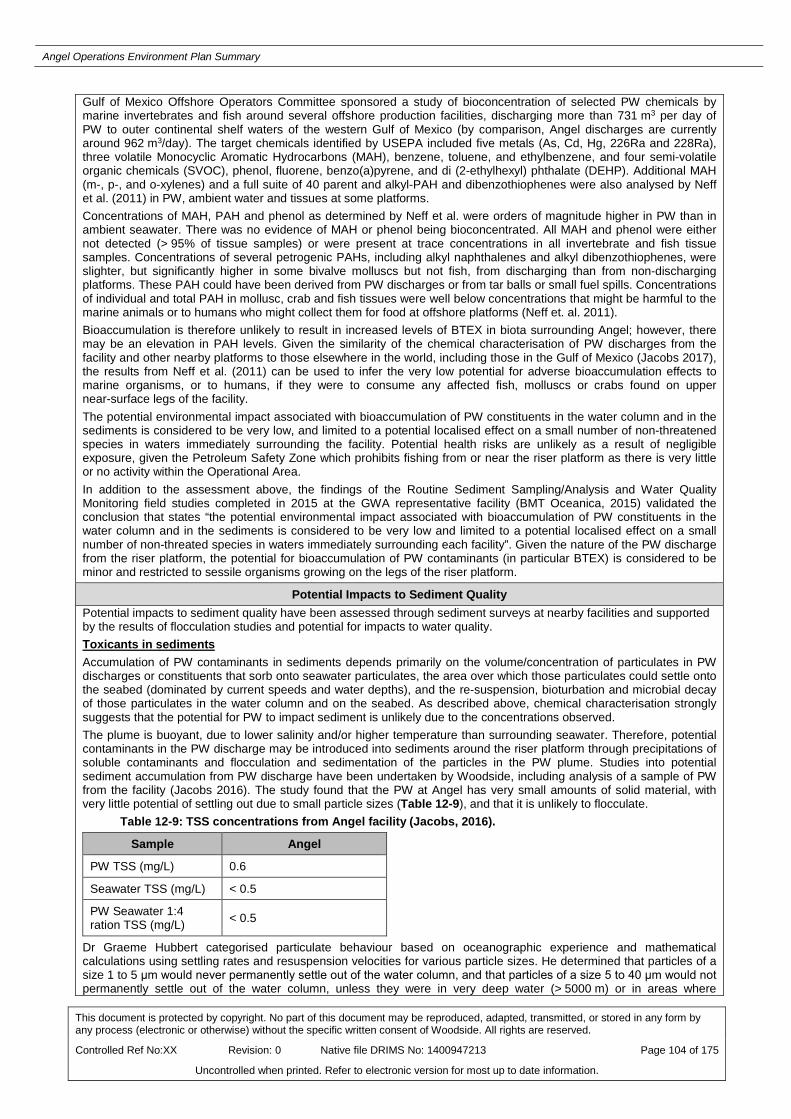
Angel Operations Environment Plan Summary
This document is protected by copyright. No part of this document may be reproduced, adapted, transmitted, or stored in any form by any process (electronic or otherwise) without the specific written consent of Woodside. All rights are reserved.
Controlled Ref No:XX Revision: 0 Native file DRIMS No: 1400947213 Page 104 of 175
Uncontrolled when printed. Refer to electronic version for most up to date information.
Gulf of Mexico Offshore Operators Committee sponsored a study of bioconcentration of selected PW chemicals by marine invertebrates and fish around several offshore production facilities, discharging more than 731 m3 per day of PW to outer continental shelf waters of the western Gulf of Mexico (by comparison, Angel discharges are currently around 962 m3/day). The target chemicals identified by USEPA included five metals (As, Cd, Hg, 226Ra and 228Ra), three volatile Monocyclic Aromatic Hydrocarbons (MAH), benzene, toluene, and ethylbenzene, and four semi-volatile organic chemicals (SVOC), phenol, fluorene, benzo(a)pyrene, and di (2-ethylhexyl) phthalate (DEHP). Additional MAH (m-, p-, and o-xylenes) and a full suite of 40 parent and alkyl-PAH and dibenzothiophenes were also analysed by Neff et al. (2011) in PW, ambient water and tissues at some platforms. Concentrations of MAH, PAH and phenol as determined by Neff et al. were orders of magnitude higher in PW than in ambient seawater. There was no evidence of MAH or phenol being bioconcentrated. All MAH and phenol were either not detected (> 95% of tissue samples) or were present at trace concentrations in all invertebrate and fish tissue samples. Concentrations of several petrogenic PAHs, including alkyl naphthalenes and alkyl dibenzothiophenes, were slighter, but significantly higher in some bivalve molluscs but not fish, from discharging than from non-discharging platforms. These PAH could have been derived from PW discharges or from tar balls or small fuel spills. Concentrations of individual and total PAH in mollusc, crab and fish tissues were well below concentrations that might be harmful to the marine animals or to humans who might collect them for food at offshore platforms (Neff et. al. 2011). Bioaccumulation is therefore unlikely to result in increased levels of BTEX in biota surrounding Angel; however, there may be an elevation in PAH levels. Given the similarity of the chemical characterisation of PW discharges from the facility and other nearby platforms to those elsewhere in the world, including those in the Gulf of Mexico (Jacobs 2017), the results from Neff et al. (2011) can be used to infer the very low potential for adverse bioaccumulation effects to marine organisms, or to humans, if they were to consume any affected fish, molluscs or crabs found on upper near-surface legs of the facility. The potential environmental impact associated with bioaccumulation of PW constituents in the water column and in the sediments is considered to be very low, and limited to a potential localised effect on a small number of non-threatened species in waters immediately surrounding the facility. Potential health risks are unlikely as a result of negligible exposure, given the Petroleum Safety Zone which prohibits fishing from or near the riser platform as there is very little or no activity within the Operational Area. In addition to the assessment above, the findings of the Routine Sediment Sampling/Analysis and Water Quality Monitoring field studies completed in 2015 at the GWA representative facility (BMT Oceanica, 2015) validated the conclusion that states “the potential environmental impact associated with bioaccumulation of PW constituents in the water column and in the sediments is considered to be very low and limited to a potential localised effect on a small number of non-threated species in waters immediately surrounding each facility”. Given the nature of the PW discharge from the riser platform, the potential for bioaccumulation of PW contaminants (in particular BTEX) is considered to be minor and restricted to sessile organisms growing on the legs of the riser platform.
Potential Impacts to Sediment Quality Potential impacts to sediment quality have been assessed through sediment surveys at nearby facilities and supported by the results of flocculation studies and potential for impacts to water quality. Toxicants in sediments Accumulation of PW contaminants in sediments depends primarily on the volume/concentration of particulates in PW discharges or constituents that sorb onto seawater particulates, the area over which those particulates could settle onto the seabed (dominated by current speeds and water depths), and the re-suspension, bioturbation and microbial decay of those particulates in the water column and on the seabed. As described above, chemical characterisation strongly suggests that the potential for PW to impact sediment is unlikely due to the concentrations observed. The plume is buoyant, due to lower salinity and/or higher temperature than surrounding seawater. Therefore, potential contaminants in the PW discharge may be introduced into sediments around the riser platform through precipitations of soluble contaminants and flocculation and sedimentation of the particles in the PW plume. Studies into potential sediment accumulation from PW discharge have been undertaken by Woodside, including analysis of a sample of PW from the facility (Jacobs 2016). The study found that the PW at Angel has very small amounts of solid material, with very little potential of settling out due to small particle sizes (Table 12-9), and that it is unlikely to flocculate.
Table 12-9: TSS concentrations from Angel facility (Jacobs, 2016).
Sample Angel
PW TSS (mg/L) 0.6
Seawater TSS (mg/L) < 0.5
PW Seawater 1:4 ration TSS (mg/L) < 0.5
Dr Graeme Hubbert categorised particulate behaviour based on oceanographic experience and mathematical calculations using settling rates and resuspension velocities for various particle sizes. He determined that particles of a size 1 to 5 μm would never permanently settle out of the water column, and that particles of a size 5 to 40 μm would not permanently settle out of the water column, unless they were in very deep water (> 5000 m) or in areas where
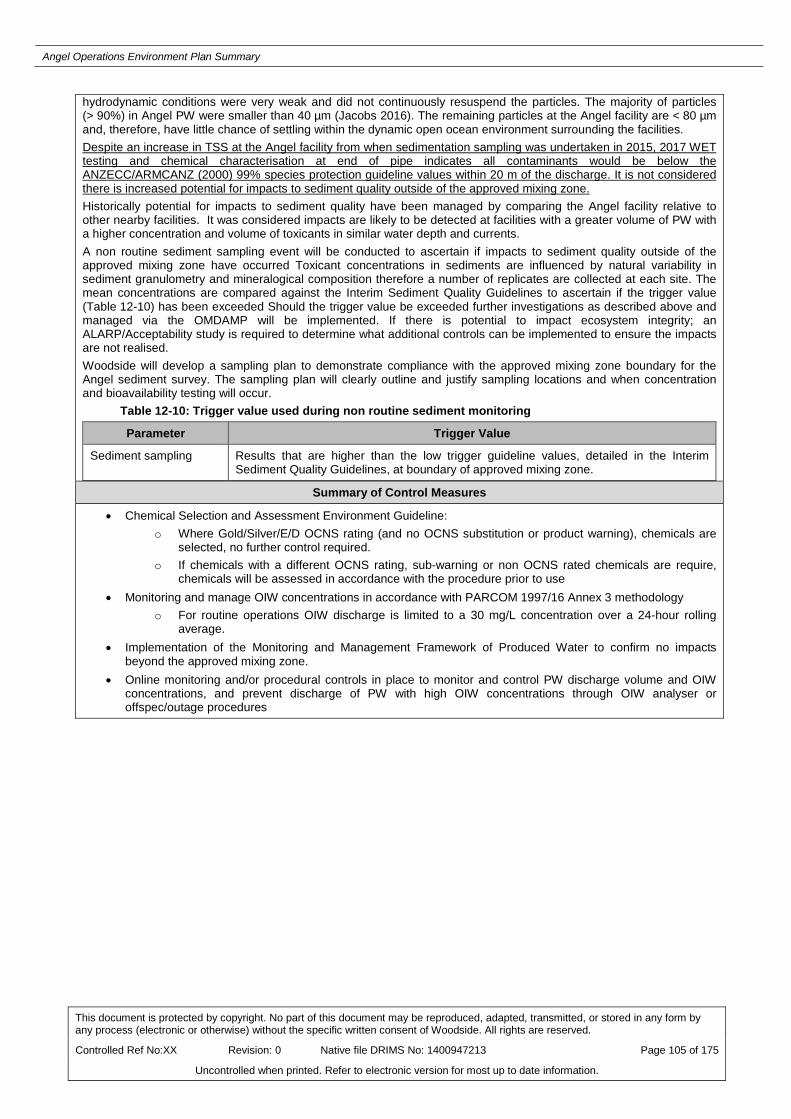
Angel Operations Environment Plan Summary
This document is protected by copyright. No part of this document may be reproduced, adapted, transmitted, or stored in any form by any process (electronic or otherwise) without the specific written consent of Woodside. All rights are reserved.
Controlled Ref No:XX Revision: 0 Native file DRIMS No: 1400947213 Page 105 of 175
Uncontrolled when printed. Refer to electronic version for most up to date information.
hydrodynamic conditions were very weak and did not continuously resuspend the particles. The majority of particles (> 90%) in Angel PW were smaller than 40 µm (Jacobs 2016). The remaining particles at the Angel facility are < 80 µm and, therefore, have little chance of settling within the dynamic open ocean environment surrounding the facilities. Despite an increase in TSS at the Angel facility from when sedimentation sampling was undertaken in 2015, 2017 WET testing and chemical characterisation at end of pipe indicates all contaminants would be below the ANZECC/ARMCANZ (2000) 99% species protection guideline values within 20 m of the discharge. It is not considered there is increased potential for impacts to sediment quality outside of the approved mixing zone. Historically potential for impacts to sediment quality have been managed by comparing the Angel facility relative to other nearby facilities. It was considered impacts are likely to be detected at facilities with a greater volume of PW with a higher concentration and volume of toxicants in similar water depth and currents. A non routine sediment sampling event will be conducted to ascertain if impacts to sediment quality outside of the approved mixing zone have occurred Toxicant concentrations in sediments are influenced by natural variability in sediment granulometry and mineralogical composition therefore a number of replicates are collected at each site. The mean concentrations are compared against the Interim Sediment Quality Guidelines to ascertain if the trigger value (Table 12-10) has been exceeded Should the trigger value be exceeded further investigations as described above and managed via the OMDAMP will be implemented. If there is potential to impact ecosystem integrity; an ALARP/Acceptability study is required to determine what additional controls can be implemented to ensure the impacts are not realised. Woodside will develop a sampling plan to demonstrate compliance with the approved mixing zone boundary for the Angel sediment survey. The sampling plan will clearly outline and justify sampling locations and when concentration and bioavailability testing will occur.
Table 12-10: Trigger value used during non routine sediment monitoring
Parameter Trigger Value
Sediment sampling Results that are higher than the low trigger guideline values, detailed in the Interim Sediment Quality Guidelines, at boundary of approved mixing zone.
Summary of Control Measures
• Chemical Selection and Assessment Environment Guideline: o Where Gold/Silver/E/D OCNS rating (and no OCNS substitution or product warning), chemicals are
selected, no further control required. o If chemicals with a different OCNS rating, sub-warning or non OCNS rated chemicals are require,
chemicals will be assessed in accordance with the procedure prior to use • Monitoring and manage OIW concentrations in accordance with PARCOM 1997/16 Annex 3 methodology
o For routine operations OIW discharge is limited to a 30 mg/L concentration over a 24-hour rolling average.
• Implementation of the Monitoring and Management Framework of Produced Water to confirm no impacts beyond the approved mixing zone.
• Online monitoring and/or procedural controls in place to monitor and control PW discharge volume and OIW concentrations, and prevent discharge of PW with high OIW concentrations through OIW analyser or offspec/outage procedures
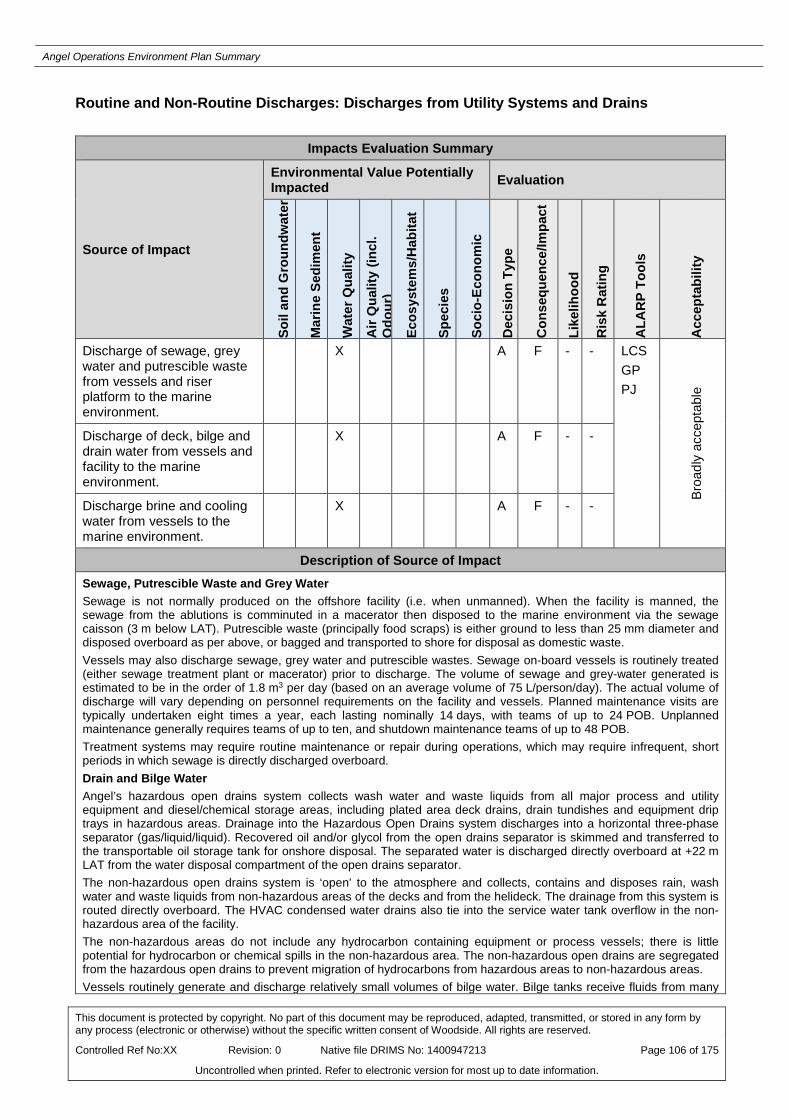
Angel Operations Environment Plan Summary
This document is protected by copyright. No part of this document may be reproduced, adapted, transmitted, or stored in any form by any process (electronic or otherwise) without the specific written consent of Woodside. All rights are reserved.
Controlled Ref No:XX Revision: 0 Native file DRIMS No: 1400947213 Page 106 of 175
Uncontrolled when printed. Refer to electronic version for most up to date information.
Routine and Non-Routine Discharges: Discharges from Utility Systems and Drains
Impacts Evaluation Summary
Source of Impact
Environmental Value Potentially Impacted Evaluation
Soil
and
Gro
undw
ater
Mar
ine
Sedi
men
t
Wat
er Q
ualit
y
Air
Qua
lity
(incl
. O
dour
)
Ecos
yste
ms/
Hab
itat
Spec
ies
Soci
o-Ec
onom
ic
Dec
isio
n Ty
pe
Con
sequ
ence
/Impa
ct
Like
lihoo
d
Ris
k R
atin
g
ALA
RP
Tool
s
Acc
epta
bilit
y
Discharge of sewage, grey water and putrescible waste from vessels and riser platform to the marine environment.
X A F - - LCS GP PJ
Broa
dly
acce
ptab
le
Discharge of deck, bilge and drain water from vessels and facility to the marine environment.
X A F - -
Discharge brine and cooling water from vessels to the marine environment.
X A F - -
Description of Source of Impact Sewage, Putrescible Waste and Grey Water Sewage is not normally produced on the offshore facility (i.e. when unmanned). When the facility is manned, the sewage from the ablutions is comminuted in a macerator then disposed to the marine environment via the sewage caisson (3 m below LAT). Putrescible waste (principally food scraps) is either ground to less than 25 mm diameter and disposed overboard as per above, or bagged and transported to shore for disposal as domestic waste. Vessels may also discharge sewage, grey water and putrescible wastes. Sewage on-board vessels is routinely treated (either sewage treatment plant or macerator) prior to discharge. The volume of sewage and grey-water generated is estimated to be in the order of 1.8 m3 per day (based on an average volume of 75 L/person/day). The actual volume of discharge will vary depending on personnel requirements on the facility and vessels. Planned maintenance visits are typically undertaken eight times a year, each lasting nominally 14 days, with teams of up to 24 POB. Unplanned maintenance generally requires teams of up to ten, and shutdown maintenance teams of up to 48 POB. Treatment systems may require routine maintenance or repair during operations, which may require infrequent, short periods in which sewage is directly discharged overboard. Drain and Bilge Water Angel’s hazardous open drains system collects wash water and waste liquids from all major process and utility equipment and diesel/chemical storage areas, including plated area deck drains, drain tundishes and equipment drip trays in hazardous areas. Drainage into the Hazardous Open Drains system discharges into a horizontal three-phase separator (gas/liquid/liquid). Recovered oil and/or glycol from the open drains separator is skimmed and transferred to the transportable oil storage tank for onshore disposal. The separated water is discharged directly overboard at +22 m LAT from the water disposal compartment of the open drains separator. The non-hazardous open drains system is ‘open’ to the atmosphere and collects, contains and disposes rain, wash water and waste liquids from non-hazardous areas of the decks and from the helideck. The drainage from this system is routed directly overboard. The HVAC condensed water drains also tie into the service water tank overflow in the non-hazardous area of the facility. The non-hazardous areas do not include any hydrocarbon containing equipment or process vessels; there is little potential for hydrocarbon or chemical spills in the non-hazardous area. The non-hazardous open drains are segregated from the hazardous open drains to prevent migration of hydrocarbons from hazardous areas to non-hazardous areas. Vessels routinely generate and discharge relatively small volumes of bilge water. Bilge tanks receive fluids from many

Angel Operations Environment Plan Summary
This document is protected by copyright. No part of this document may be reproduced, adapted, transmitted, or stored in any form by any process (electronic or otherwise) without the specific written consent of Woodside. All rights are reserved.
Controlled Ref No:XX Revision: 0 Native file DRIMS No: 1400947213 Page 107 of 175
Uncontrolled when printed. Refer to electronic version for most up to date information.
parts of the vessel, including machinery spaces. Bilge water can contain water, oil, detergents, solvents, chemicals, particles and other liquids, solids or chemicals. Vessels may also discharge drainage water from decks directly overboard or via deck drainage systems; deck drainage may also contain traces of chemicals. Water sources could include rainfall events and/or from deck activities such as cleaning/wash-down of equipment/decks. Cooling Water and Brine No brine water is produced on the facility as potable water is supplied from onshore. Additionally, no seawater cooling is undertaken on the facility. Cooling water and brine water may be produced by marine vessels in small quantities.
Impact Assessment Sewage, Putrescible Waste and Grey Water The environmental impact associated with ocean disposal of sewage, grey water and putrescible waste is eutrophication. Eutrophication occurs when the addition of nutrients, such as nitrates and phosphates, causes adverse changes to the ecosystem, such as oxygen depletion and phytoplankton blooms. No significant impacts from the planned (routine and non-routine) discharges to the marine environment are anticipated, given the minor volumes involved, the expected localised mixing zone (as indicated by dilution modelling at the facility) and high level of dilution into the open water marine environment of the Operational Area. This is supported by monitoring undertaken by Woodside around the nearby GWA platform as well as directly monitoring sewage discharges. Water quality monitoring around the GWA platform (which is a manned platform) indicates there was no detectable decrease in oxygen saturation, nutrients or increase in oxygen demand at the GWA platform (BMT Oceanica 2015a). In addition, monitoring of sewage discharges has demonstrated that a 10 m3 sewage discharge reduces to approximately 1% of its original concentration within 50 m of the discharge location (Woodside, 2008). Although the NWS Province is characterised as a low nutrient environment (DEWHA 2008), studies of adjacent shelf water have found the area to be “a highly productive ecosystem in which nutrients and organic matter are rapidly recycled” (Furnas and Mitchell 1999). The estimated daily loading from sewage and putrescible waste (1.8 m3 per day) is not significant in comparison to the daily turnover of nutrients in the area. Furthermore, vessels are typically moving when in the Operational Area, which facilitates the mixing of sewage, putrescible wastes and grey water from vessels. The impact of nutrients associated with discharge of sewage, grey-water and putrescible waste is considered to have a localised impact with no lasting effect due to the small mass, relative to daily turnover, and the assimilative capacity of the receiving environment. Drain and Bilge Water Drain water from the facility and bilge and deck drainage water from vessels is expected to mix rapidly in the marine environment upon discharge. Given the rapid mixing, relatively small typical bilge and deck drainage water, and expected low levels of potential contaminants, impacts from bilge and deck drainage water from vessels and the facility are assessed as highly localised with no lasting effect. Cumulative Impacts Given the activities that may be conducted during the Petroleum Activities Program, there is the potential for cumulative impacts from routine discharges of sewage, putrescible waste, grey water, bilge water or drain water, due to:
• periodic, repeated discharges at the same location (the facility) over the course of the Petroleum Activities Program
• cumulative discharges from differing point sources (facility and vessels) during manned operations. Given the nature of these routine discharges, unmanned normal operations (i.e. limited sewage, putrescible waste and grey water discharges), the localised spatial extent of impacts and the well mixed receiving environment, the cumulative impacts from these discharges are expected to be localised, and not considered to result in impacts greater than slight, short-term contamination above background levels outside a localised mixing zone. Given the highly localised nature of the impacts of routine discharges, no cumulative impacts from similar discharges from other production facilities or support vessels (e.g. NRC) are expected.
Summary of Control Measures • Contract vessels complying with Marine Orders for safe vessel operations:
o Marine Order 91 (Oil) o Marine Order 95 (Pollution prevention – garbage) o Marine order 96 (Pollution prevention – sewage)
• Chemical Selection and Assessment Environment Guideline: o Where Gold/Silver/E/D OCNS rating (and no OCNS substitution or product warning), chemicals are
selected, no further control required. o If chemicals with a different OCNS rating, sub-warning or non OCNS rated chemicals are require,
chemicals will be assessed in accordance with the procedure prior to use

Angel Operations Environment Plan Summary
This document is protected by copyright. No part of this document may be reproduced, adapted, transmitted, or stored in any form by any process (electronic or otherwise) without the specific written consent of Woodside. All rights are reserved.
Controlled Ref No:XX Revision: 0 Native file DRIMS No: 1400947213 Page 108 of 175
Uncontrolled when printed. Refer to electronic version for most up to date information.
• Sewage system macerator maintained • Facility open hazard drain system integrity maintained as far as practicable. Integrity will be managed in
accordance with SCE Management Procedure and SCE Technical Performance Standard(s) to prevent environment risk related damage to SCEs for:
o F22 - Open Hazardous Drains

Angel Operations Environment Plan Summary
This document is protected by copyright. No part of this document may be reproduced, adapted, transmitted, or stored in any form by any process (electronic or otherwise) without the specific written consent of Woodside. All rights are reserved.
Controlled Ref No:XX Revision: 0 Native file DRIMS No: 1400947213 Page 109 of 175
Uncontrolled when printed. Refer to electronic version for most up to date information.
Routine and Non-Routine Atmospheric Emissions: Fuel Combustion, Flaring and Fugitives
Impacts Evaluation Summary
Source of Impact
Environmental Value Potentially Impacted Evaluation
Soil
and
Gro
undw
ater
Mar
ine
Sedi
men
t
Wat
er Q
ualit
y
Air
Qua
lity
(incl
. O
dour
)
Ecos
yste
ms/
Hab
itat
Spec
ies
Soci
o-Ec
onom
ic
Dec
isio
n Ty
pe
Con
sequ
ence
/Impa
ct
Like
lihoo
d
Ris
k R
atin
g
ALA
RP
Tool
s
Acc
epta
bilit
y
Operational flaring, fugitive emissions and vessel emissions (including incinerators).
X A F - - LCS GP PJ
Broa
dly
Acce
ptab
le
Description of Source of Impact Atmospheric emissions will be generated predominantly from the facility during the Petroleum Activities Program. Sources include emissions from internal combustion engines (including all equipment and generators), flares, fugitives and process vents. Vessel emissions include those from internal combustion engines, fugitives and on-board incinerators. Emissions and combustion products typically include CO2, water vapour, NOx, SO2, methane, refrigerant gases (including ozone depleting substances), particulates and Volatile Organic Compounds (VOCs). Ozone depleting substances are includes as they may form part of vessel emissions, they are not used on the facility. While the facility is powered by electrical generation on NRC (which is beyond the scope of this EP), Woodside is actively pursuing opportunities to increase energy efficiency associated with Woodside facilities such as the use of LNG as a fuel alternative for support vessels. Fuel Emissions: Internal Combustion Engines No fuel gas is used on the riser platform for the generation of power, since electricity is supplied from NRC via a submarine cable. During manned operations, diesel is used on the riser platform for the operation of the crane and survival craft. Diesel usage on the facility (excluding support vessels) in 2017 was 7.6 m3, the combustion of which equated to the emission of 21 tonnes of CO2 equivalents. Diesel usage is not expected to significantly increase over the period in which this EP is in force. The forecast annual emissions from fuel combustion on the facility has been estimated using emissions factors (as per National Pollutant Inventory (NPI) Emission Estimation Techniques (EET)) and are presented in Table 12-11. Incinerators may be used on-board vessels to dispose of flammable domestic wastes such as cardboard. Incinerators are typically used infrequently, with wastes generally segregated and transported to King Bay Supply Facility in Karratha for disposal.
Table 12-11: Estimated annual emissions from fuel combustion at the facility (excluding support vessels) (based on FY2016/17)
Emission Type Estimated annual emissions from diesel combustion (tonnes)1
CO2 21
CH4 0
N2O 0
CO2 eq 21
NOx 0.4
SOx 0 1 Based on combustion of 7.6 m3 of diesel during 2016–17. Operational Flaring

Angel Operations Environment Plan Summary
This document is protected by copyright. No part of this document may be reproduced, adapted, transmitted, or stored in any form by any process (electronic or otherwise) without the specific written consent of Woodside. All rights are reserved.
Controlled Ref No:XX Revision: 0 Native file DRIMS No: 1400947213 Page 110 of 175
Uncontrolled when printed. Refer to electronic version for most up to date information.
Gas flaring has the potential to increase the volumes of greenhouse gases emitted to the atmosphere. Flaring also consumes natural gas, a non-renewable resource. Emissions and combustion products include CO2, NOx, SO2, methane, particulates, and VOCs. Incomplete combustion under certain scenarios may also generate dark smoke. The release of hydrocarbon gas to atmosphere by flaring is an essential practice, primarily for safety requirements. Operational flaring is comprised of two elements:
• normal operational flaring associated with flare system purge and pilot, process flows and glycol regeneration • non-routine flaring that may result from activities such as planned shutdowns and ESD testing, and unplanned
shutdowns and ESDs, production restarts, equipment outage/failures, and subsea flowline depressurisation. During flaring, the burnt gas generates mainly water vapour and CO2. From 2018 to 2022, it is estimated that approximately 6000 tonnes of gas will be flared per year (Table 12-12). Flaring volumes will vary as a result of production rates and non-routine activities, outages and shutdowns. Flaring will continue to occur during suspension. The forecast annual atmospheric emissions from flaring have been estimated using the NPI EET.
Table 12-12: Estimated annual emissions from flaring at the facility (based on FY2016–17)
Component Estimated upper flaring emissions (tonnes)
Qty 6000
CO2 16,200.00
CH4 24.00
N2O 0.60
CO2eq 16,980.00
NOx 9.00
SOx 0.00
CO 52.20
Reference: NPI EET Manual for Oil and Gas v2.0 2013, Table 8. Non-routine Venting of Process Hydrocarbons via Flare System During normal operations, hydrocarbon gas is flared via the HP and LP flare systems. During suspension, HP flaring will remain unchanged; however, LP flaring will reduce. These systems are maintained to effectively combust hydrocarbons as a critical component for the safe operation of the facility. In the unlikely event the flares are extinguished or unavailable (such as after a major shutdown prior to system ramp-up), the hydrocarbon gas discharged via the flare system may initially not be combusted during the period required to purge the flare system and re-establish flare ignition. This may result in the short-term (days) low-rate release of hydrocarbon gas to the atmosphere. Intermittent venting from the facility represents only a minor source of atmospheric emissions, and is not considered to pose a risk beyond the routine air emissions described in this section. Fugitive Emissions Fugitive emissions can occur from pressurised equipment, and are inherent in design, required for infrequent operational activities, or can be caused by unintentional equipment leaks. Sources can include from valves, flanges, pump seals, compressor seals, relief valves, vents, sampling connections, process drains, open-ended lines, casing, tanks and other potential leakage sources from pressurised equipment. Fugitive emissions are, by their nature, difficult to quantify and, the normal approach, as accepted by the National Greenhouse and Energy Reporting Scheme (NGERS), is to indirectly estimate amount of emissions based on product throughput. As much of the safe operation of the facility relies on the effective containment of hydrocarbons, the volumes of routine and non-routine fugitive emissions are considered to be small. The Department of the Environment and Energy (DoEE) has released technical guidelines for estimating greenhouse gas emissions by facilities in Australia, including from fugitive emissions. Using these estimation techniques, the facility reported 473 tonnes of gas lost through fugitive emissions in 2017, which included 331 tonnes of methane and 142 tonnes of non-methane. This equates to approximately 6951 tonnes of CO2 equivalents. Discrete relatively small volumes of packed gases and charged systems, including refrigerant gases, are used across the facility and vessels which have potential for small volume leaks (typically less than 100 kg per isolatable inventory). HVAC systems on the facility use refrigerant R407C, which has no ozone depleting potential and a moderate global warming potential. The facility is fitted with several portable fire extinguishing units utilising CO2. The facility does not have any gaseous fire extinguishing systems containing synthetic greenhouse gases or ozone depleting substances.
Impact Assessment Facility and vessel routine and non-routine emissions, predominantly routine flaring, have the potential to result in localised, temporary reduction in air quality, generation of dark smoke and contribution to greenhouse gas emissions.
Angel Operations Environment Plan Summary
This document is protected by copyright. No part of this document may be reproduced, adapted, transmitted, or stored in any form by any process (electronic or otherwise) without the specific written consent of Woodside. All rights are reserved.
Controlled Ref No:XX Revision: 0 Native file DRIMS No: 1400947213 Page 111 of 175
Uncontrolled when printed. Refer to electronic version for most up to date information.
Potential impacts of emissions depend on the nature of the emissions, as well as the location and nature of the receiving environment. Riser platform design (including the rapidly dispersive characteristics of the gas turbine exhausts, flare and other emissions), the estimated level of pollutants in the emissions, and the absence of elevated background ambient levels have been considered in estimating the potential for interaction with human and environmental sensitivities. The Operational Area is in a remote offshore location, with no expected adverse interaction with populated areas or sensitive environmental receptors associated with air emissions. There is a foraging BIA for the wedge-tailed shearwater overlapping the Operational Area; as such, wedge-tailed shearwaters may occur near to the facility airshed. Birds (including migratory birds) are known to opportunistically roost on the riser platform. Given the highly dispersed nature of facility air emissions, no adverse impacts to birds are anticipated due to air emissions. Potential impacts are expected to be short-term, localised air quality changes, limited to the airshed local to the riser platform. Air emission impacts are not expected to have direct or cumulative impacts on sensitive environmental receptors, or above National Environmental Protection (Ambient Air Quality) measures. The flare and potential black smoke resulting from emissions may impact visual amenity. The offshore location of the Petroleum Activities Program is not directly visible from the nearest landfall (Dampier Archipelago, 94 km south of the Operational Area at the closest point). Hence, no impacts to visual amenity for residential communities are expected. Visual amenity impairment to tourism activities is not expected.
Summary of Control Measures • Contract vessels complying with Marine Order 97 (Marine Pollution Prevention – Air Pollution) • National Greenhouse and Energy Reporting Scheme (NGERS) and National Pollutant Inventory (NPI) reporting • Regularly monitoring, estimating and reporting facility fuel and flare emissions (in accordance with NGERS/NPI)
to inform optimisation management practices • Maintaining flare to maximise efficiency of combustion and minimise venting

Angel Operations Environment Plan Summary
This document is protected by copyright. No part of this document may be reproduced, adapted, transmitted, or stored in any form by any process (electronic or otherwise) without the specific written consent of Woodside. All rights are reserved.
Controlled Ref No:XX Revision: 0 Native file DRIMS No: 1400947213 Page 112 of 175
Uncontrolled when printed. Refer to electronic version for most up to date information.
Routine Light Emissions: Light Emissions from Riser Platform and Vessels
Impacts Evaluation Summary
Source of Impact
Environmental Value Potentially Impacted Evaluation
Soil
and
Gro
undw
ater
Mar
ine
Sedi
men
t
Wat
er Q
ualit
y
Air
Qua
lity
(incl
. O
dour
) Ec
osys
tem
s/H
abita
t Spec
ies
Soci
o-Ec
onom
ic
Dec
isio
n Ty
pe
Con
sequ
ence
/Impa
ct
Like
lihoo
d
Ris
k R
atin
g
ALA
RP
Tool
s
Acc
epta
bilit
y
Light emissions from facility and support vessels.
X A F - - LCS GP PJ
Broa
dly
Acce
ptab
le
Light emissions from facility during flaring.
X A F - -
Description of Source of Impact When manned (about 14 days/eight times a year for planned maintenance visits), appropriate lighting is used to ensure a safe working environment during night hours as well as to communicate the presence of the facility and vessels to other marine users (i.e. navigation lights). Lighting is required for safe operation and cannot reasonably be eliminated. External lighting is located over the entire facility, as well as vessels, with most external lighting directed towards working areas such as the production deck of the facility, or the back deck of support vessels. This limits the light spill to the marine environment. The production deck of the facility is approximately 25 m above sea level, with the highest point of the facility (the top of the flare tower) reaching approximately 115 m above sea level. The distance to the horizon at which components of the riser platform will be directly visible can be estimated using the formula below:
Where ‘horizon distance’ is the distance to the horizon at sea level in kilometres, and ‘height’ is the height above sea level of the light source in metres. Using this formula, the approximate distances at which the production deck and flare tower top will be visible at sea level are:
• production deck: approximately 18 km from riser platform • flare tower tip: approximately 38 km from riser platform.
During IMR activities, underwater lighting is generated over short periods of time while ROVs are in use, as well as from deck lighting. Given the typical intensity of ROV lights and the attenuation of light in seawater, light from ROVs will be localised to the vicinity of the ROV and vessels.
Impact Assessment Light emissions can affect fauna in two main ways:
• Behaviour: many organisms are adapted to natural levels of lighting and the natural changes associated with the day and night cycle as well as the night time phase of the moon. Artificial lighting has the potential to create a constant level of light at night that can override these natural levels and cycles.
• Orientation: organisms such as marine turtles and birds may also use lighting from natural sources to orient themselves in a certain direction at night. In instances where an artificial light source is brighter than a natural source, the artificial light may act to override natural cues, leading to disorientation.
The fauna within the Operational Area are predominantly pelagic fish and zooplankton, with a low abundance of transient species such as marine turtles, whale sharks and large whales transiting through the Area. Additionally, there is no known critical habitat within the Operational Area for EPBC listed species, although there are BIAs that overlap the Operational Area. Given the lack of significant fauna populations expected to occur within the Operational Area, impacts from light emissions are considered to be highly unlikely. Seabirds

Angel Operations Environment Plan Summary
This document is protected by copyright. No part of this document may be reproduced, adapted, transmitted, or stored in any form by any process (electronic or otherwise) without the specific written consent of Woodside. All rights are reserved.
Controlled Ref No:XX Revision: 0 Native file DRIMS No: 1400947213 Page 113 of 175
Uncontrolled when printed. Refer to electronic version for most up to date information.
There is a foraging BIA for the wedge-tailed shearwater overlapping the Operational Area; as such, wedge-tailed shearwaters may occur within the Operational Area. Foraging wedge-tailed shearwaters may be attracted to sources of light emission to feed upon fish drawn to the light; however, the species feeds predominantly during the day in association with pelagic predators (Catry et al. 2009, Whittow 1997). The majority of foraging trips are short, with single day foraging trips significantly more common than any other length trip, with birds returning to nesting/roosting sites between trips (Congdon et al. 2005). As such, the number of wedge-tailed shearwaters present in the Operational Area at night is expected to be low relative to daylight hours, and any potential changes to behaviour would only affect a relatively low number of birds. Given the species’ global distribution and primarily diurnal foraging behaviour, impacts to wedge-tailed shearwaters from artificial lighting are considered to be highly unlikely. Wiese et al. (2001) presented a literature review relating to the effect of light from platforms in the North Sea on seabirds. They noted seabirds are strongly visually orientated and that large attractions of birds, and in some cases mortality of birds, have often been documented by lighthouses, communication towers, buildings and oil platforms. Injuries can occur through direct collisions. The rate of collision is (they inferred from literature) related to the cross-sectional area of the obstacle, amount of light and number of birds present. Black (2005) reported on two cases of mass seabird mortalities from striking of ships in the Southern Ocean. In both cases, mortalities occurred when the vessel was at anchor near seabird colonies and conducting night deck operations during periods of reduced visibility. As such, impacts from the presence of vessels on seabirds is expected to be a localised behavioural disturbance to a small number of birds, with no lasting effect. Note, significant seabird mortality in relation to fishing vessel operations has been documented (e.g. Sullivan et al. 2006), with interactions with fishing gear (e.g. trawl nets) the primary source of mortality; however, birds are strongly attracted to by-catch/baits from fishing vessels. Hence, comparisons of bird mortality between fishing vessels and vessels undertaking the Petroleum Activities Program are not reasonable, due to the difference in the nature and scale of the impacts. In a study of offshore oil platforms in the North Sea, Poot et al. (2008) observed that migrating seabirds can be attracted to the lights and flares of offshore oil platforms, particularly on cloudy nights and in between the hours of midnight and dawn. Migratory shorebirds travelling the East Asian-Australasian Flyway transit through the Operational Area en-route to staging areas, before moving onto the mainland south in the spring or Indonesia in the north in the autumn. Migratory birds, have been observed opportunistically roosting on the platform in large numbers. Migrating birds in the region are at, or near, the end of their migration (or staging area), and if attracted will not be facing long-distance journeys directly upon leaving the riser platform. Large numbers of migratory birds have been observed opportunistically roosting on the facility, if maintenance, process safety and/or health risks are identified associated with the presence of birds, it may be necessary to deter them from roosting on the riser platform by installing bird proofing/exclusion devices. The installation of bird proofing poses the potential risk of entanglement for individual birds. There have been no reported bird injuries or deaths at the facility, and consequently future adverse interactions are considered highly unlikely with no lasting effects on populations, or impacts to critical habitat anticipated. If deterrents are installed birds will likely to relocate to previous ranges (i.e. rather than landing on the Angel platform), therefore no lasting effect is anticipated. Marine Turtles – Hatchlings Light emissions reaching turtle nesting beaches is widely considered detrimental, owing to interference with important nocturnal activities including choice of nesting sites and orientation/navigation to the sea by post-nesting females and hatchlings (Lorne and Salmon 2007, Salmon 2003, Tuxbury and Salmon 2005). Hatchling turtles use light as a visual cue to orientate themselves towards the sea during the post-hatching dash after emerging from the nest, orientating themselves towards the relatively bright horizon above the sea and away from the relatively dark dunes (Salmon et al. 1995b, Salmon and Witherington 1995). Once hatchling turtles reach the sea, the primary cue for hatchling turtle orientation is water movement, with hatchlings swimming directly towards oncoming waves (Lohmann et al. 1990, Lohmann and Lohmann 1992). Hatchling and adult turtles may also use the Earth’s magnetic field for larger scale navigation (Lohmann and Lohmann 1996). As such, hatchling turtles are only likely to be disorientated by artificial light between leaving the nest and reaching the sea. The nearest potential nesting site in relation to the Operational Area is the Dampier Archipelago, approximately 94 km from the Operational Area. Lighting and the tip of the flare tower will not be visible from this potential nesting site; therefore, impacts to hatchling turtles emerging from nests will not credibly occur. Marine Turtles – Adults Artificial lighting may affect the location that turtles emerge to the beach, the success of nest construction, whether nesting is abandoned, and even the seaward return of adults (Salmon et al. 1995a, 1995b, Salmon and Witherington 1995). Such lighting is typically from residential and industrial development overlapping the coastline, rather than offshore from nesting beaches. The Operational Area does not contain any known critical habitat for any species of marine turtle, with the nearest internesting buffer (flatback turtles) approximately 17 km from the Operational Area. Whilst no BIAs overlap the Operational Area, it is acknowledged that marine turtles may be present in the Operational Area in low densities, despite there being no marine turtle BIAs overlapping the Operational Area. No impacts to marine turtle nesting due to light generated during the Petroleum Activities Program are expected. Fish Lighting from activities in the Operational Area may result in the localised aggregation of fish below the source of light. Note, fish may also be aggregating around the riser platform due to the habitat provided by the facility and subsea infrastructure. These aggregations of fish would be confined to a small area. Any long term changes to fish species

Angel Operations Environment Plan Summary
This document is protected by copyright. No part of this document may be reproduced, adapted, transmitted, or stored in any form by any process (electronic or otherwise) without the specific written consent of Woodside. All rights are reserved.
Controlled Ref No:XX Revision: 0 Native file DRIMS No: 1400947213 Page 114 of 175
Uncontrolled when printed. Refer to electronic version for most up to date information.
composition or abundance is highly unlikely.
Summary of Control Measures The potential impacts and risks from light emissions is deemed to be ALARP in its risk state. No reasonable additional/alternative controls were identified that would further reduce the impacts without grossly disproportionate sacrifice.

Angel Operations Environment Plan Summary
This document is protected by copyright. No part of this document may be reproduced, adapted, transmitted, or stored in any form by any process (electronic or otherwise) without the specific written consent of Woodside. All rights are reserved.
Controlled Ref No:XX Revision: 0 Native file DRIMS No: 1400947213 Page 115 of 175
Uncontrolled when printed. Refer to electronic version for most up to date information.
Unplanned Discharge: Release of Hydrocarbons or Chemicals during Transfer, Storage and Use
Risks Evaluation Summary
Source of Risk
Environmental Value Potentially Impacted Evaluation
Soil
and
Gro
undw
ater
Mar
ine
Sedi
men
t
Wat
er Q
ualit
y
Air
Qua
lity
(incl
. O
dour
)
Ecos
yste
ms/
Hab
itat
Spec
ies
Soci
o-Ec
onom
ic
Dec
isio
n Ty
pe
Con
sequ
ence
/Impa
ct
Like
lihoo
d
Ris
k R
atin
g
ALA
RP
Tool
s
Acc
epta
bilit
y
Accidental discharge of marine diesel to the marine environment during transfer, storage or use.
X X A E 1 L LCS GP PJ ER
Broa
dly
Acce
ptab
le
Accidental discharge of chemicals to the marine environment during transfer, storage or use.
X X A D 1 M
Description of Source of Risk Marine Diesel Transfer, Storage and Use Marine diesel is transferred to the riser platform via containers (e.g. ISO tanks); no bunkering of marine diesel (either vessel to vessel, or vessel to riser platform) will occur during the Petroleum Activities Program. Transfer of diesel from the storage area to the crane diesel tank is by hose; transfer from the storage area to the lifeboat is by jerry can. The crane and lifeboat are refilled as required when the riser platform is manned. Marine diesel containers are stored in the bunded marine diesel storage area on the riser platform. The bund drains to the hazardous open drains system, which features hydrocarbon separation and recovery. Drain water is discharged to the sea following hydrocarbon recovery. Diesel storage volumes beyond the bund are small and associated with equipment on the riser platform, such as the lifeboat (0.2 m3) and crane diesel tank (1.2 m3). Small volumes of diesel may also be used on platform and subsea support vessels to fuel equipment on deck (typically < 0.2 m3). The worst-case credible loss of marine diesel during transfer, storage and use is the loss of a single ISO container during transfer operations (e.g. via lifting equipment failure). The volume of marine diesel transferred in ISO containers is 4.5 m3. Chemical Transfer, Storage and Use Chemicals will be used during the Petroleum Activities Program for a variety of purposes. Transfer Bulk transfer of Triethylene glycol (TEG) via hose between platform support vessels and the riser platform occurs as required during the Petroleum Activities Program. Typical glycol spill volumes during transfer are less than 0.2 m3, based on the volume of the transfer hose and the immediate shut-off of the pumps by personnel involved in the bulk transfer process. However, the worst-case credible TEG spill scenario during transfer could result in up to 8 m3 of glycol being discharged. This unlikely scenario represents a complete failure of the bulk transfer hose combined with a failure to follow procedures (which require transfer activities to be monitored), coupled with a failure to immediately shut off pumps (i.e. pumping continues for up to five minutes). Other chemicals (e.g. corrosion inhibitor, hydraulic oil, control fluid, facility maintenance chemicals, etc.) are transferred to the riser platform in containers of various volume (e.g. ISO tanks, drums, etc.). The typical largest chemical transfer container is approximately 4.5 m3 ISO tanks (used for transferring MEG and corrosion inhibitor). Storage and Use Spills can originate from stored chemicals or equipment on the riser platform, vessel decks or subsea. Selection of operational chemicals is undertaken in accordance with the Woodside Chemical Selection and Assessment Environment Guideline.

Angel Operations Environment Plan Summary
This document is protected by copyright. No part of this document may be reproduced, adapted, transmitted, or stored in any form by any process (electronic or otherwise) without the specific written consent of Woodside. All rights are reserved.
Controlled Ref No:XX Revision: 0 Native file DRIMS No: 1400947213 Page 116 of 175
Uncontrolled when printed. Refer to electronic version for most up to date information.
Operational process chemicals on the Angel facility which are kept in larger quantities are typically stored in dedicated vessels which have similar controls to those related to mitigating hydrocarbon releases (e.g. dedicated tanks, permanent piping to the process, isolatable by valves, etc.). The chemicals stored in the largest volumes on the riser platform are TEG (40 m3), corrosion inhibitor (30 m3) and MEG (25 m3), all of which are operational process chemicals. The MEG, TEG and corrosion inhibitor tanks are classified as pressure vessels. These vessels are considered SCEs (primarily for MAE), as the MEG and TEG are provided with a hydrocarbon gas blanket from the LP gas system inherent to the nature of explosion/gas loss of containment risks, and as such are covered under P01 – Pressure Vessels technical performance standard. The design of the vessel and associated integrity SCE assurance provides a robust prevention regime associated with the potential loss of containment to sea risk, along with safe-guarding under the accepted facility Safety Case (topside hydrocarbon loss of containment). However, the worst-case credible chemical spill scenario could result in up to 30 m3 of corrosion inhibitor being discharged. Chemical storage areas are typically set up in cabinets or bunded storage areas to contain any releases to deck from transportable containers (e.g. IBCs, barrels, drums, pails, etc.). Releases from equipment are predominantly from the failure of hydraulic hoses or minor leaks from process components, or spills during refuelling of equipment, which can either be located within bunded/drained areas or outside of bunded/drained areas (e.g. over grating on cranes). All chemical storage areas for transportable chemical containers drain to the hazardous open drains system, which features hydrocarbon separation and recovery. The riser platform and support vessels also store other non-process chemicals and hydrocarbons, in various volumes. Operational non-process chemicals and maintenance chemicals present on the riser platform and support vessels are generally held in low quantities (usually less than 50 L isolatable volumes). Subsea support vessels undertaking IMR activities may also store chemicals for subsea use. Subsea operational chemicals are subject to the chemical selection process out. Accidental releases of small quantities of subsea chemicals may occur (e.g. deck spills). Operational experience indicates potential volumes of such spills is small (< 20 L). ROV hydraulic fluid is supplied through hoses containing approximately 20 L of fluid. Hydraulic lines to the ROV arms and other tooling may become caught, resulting in minor leaks to the marine environment. Small volume hydraulic leaks may occur from equipment operating via hydraulic controls subsea (subsea control fluid). These include the diamond wire cutter, bolt tensioning equipment, ROV tooling, etc. Quantitative Spill Risk Assessment Small diesel spills will rapidly spread on the water surface, with the diesel expected to evaporate and disperse rapidly (National Oceanic and Atmospheric Administration (NOAA) 2006). Woodside has commissioned RPS APASA to model several small marine diesel spills, including surface spill volumes of 8 m3 in the offshore waters of northwest WA. The results of these models have indicated that exposure to surface hydrocarbons above the 10 g/m2 threshold is limited to the immediate vicinity of the release site, with little potential to extend beyond 1 km. Based on these modelling results, the potential impacts of the credible marine diesel and chemical spill scenarios described above are reasonably expected to occur within 1 km of the release location. The impact assessment assumes this release location to be the riser platform, as this is where all platform-based and most vessel-based spills will potentially occur. Given the nature and scale of the risk, along with the relatively low sensitivity of the receiving environment, no additional modelling studies were considered necessary to inform the impact assessment of unplanned discharges of hydrocarbons or chemicals during transfer, storage and use. Hydrocarbon Characteristics Refer to the Quantitative Spill Risk Assessment Methodology for a description of the characteristics of marine diesel, including detail on the predicted fate and weathering of a spill to the marine environment.
Consequence Assessment Marine Diesel Given the low viscosity of marine diesel, along with the high portion of volatile components, a spill of up 4.5 m3 of marine diesel during transfer, storage or use would spread and weather rapidly. Environmental receptors at risk would be restricted to those in the vicinity (< 1 km from the release location) and may include:
• marine fauna, particularly fauna associated with the sea surface (e.g. seabirds, air breathing vertebrates) • plankton.
Given the relatively small worst-case credible release volume, the non-persistent nature of marine diesel and the low sensitivity of the receiving environment within the Operational Area (i.e. offshore open water environment), potential impacts are expected to be short term (< 1 year) and confined to less than 1 km from the release location. Such impacts may include:
• localised decrease in water quality • acute toxic effects to planktonic organisms in the immediate area of the spill.
Impacts to plankton may include acute toxicity resulting in mortality of planktonic organisms. Given the rapid turnover of plankton communities, these impacts will be short-lived (hours to days). Impacts to fish are expected to be of no lasting effect, as fish species are mobile and expected to avoid the area affected by a marine diesel spill. Impacts to larger fauna such as cetaceans and marine turtles are expected to be light

Angel Operations Environment Plan Summary
This document is protected by copyright. No part of this document may be reproduced, adapted, transmitted, or stored in any form by any process (electronic or otherwise) without the specific written consent of Woodside. All rights are reserved.
Controlled Ref No:XX Revision: 0 Native file DRIMS No: 1400947213 Page 117 of 175
Uncontrolled when printed. Refer to electronic version for most up to date information.
fouling, potentially resulting in irritation of sensitive membranes such as the eyes, mouth and digestive system (Helm et al. 2015). Mortality of larger fauna is not expected to occur. No impacts to ecosystem function are expected. No impacts are predicted to Glomar Shoals or the Ancient Coastline KEF. Although, they do overlap the operational area, they are outside the predicted spill impact zone. Minor, short term impacts may occur to other marine users (e.g. commercial fisheries); however, as the worst-case marine diesel spill is only 4.5 m3, and there is already no fishing within the Operational Area, it is unlikely there would be any significant impact to commercial fishers. Chemicals and Non-Process Hydrocarbons MEG and TEG are miscible in water; both are rated OCNS Group E and MEG is considered PLONOR. A maximum credible spill of MEG or TEG is expected to mix with the receiving environment with no lasting environmental impact. Accidental releases of chemicals (including corrosion inhibitor) or non-process hydrocarbons decrease the water quality in the immediate area of the release. The consequence is expected to be a minor short-term impact given the open ocean mixing environment, distance from sensitive receptors and relatively low credible release volumes. Depending on the chemical released, the toxicity and/or potential to bioaccumulate may potentially result in localised impacts to water quality, sediment quality, pelagic fish or other marine species in the vicinity of the discharge. Potential impacts to plankton from an accidental chemical spill may include acute toxicity, resulting in mortality of planktonic organisms. Given the rapid turnover of plankton communities and nature and scale of the credible releases, these impacts will be short-lived (hours to days). Impacts to fish are expected to be of no lasting effect, as fish species are mobile and expected to avoid the area affected by an accidental chemical spill. Impacts to air-breathing fauna such as cetaceans, birds and marine turtles are expected to be restricted to irritation of sensitive membranes, such as the eyes, mouth and digestive system. Minor short-term impacts may occur to other marine users (e.g. commercial fisheries); however, as there is already no fishing within the Operational Area, it is unlikely there would be any significant impact to commercial fishers.
Summary of Control Measures • Contract vessels complying with Marine Order 91 (Marine Pollution prevention – oil) for safe vessel operations • Chemical Selection and Assessment Environment Guideline:
o Where Gold/Silver/E/D OCNS rating (and no OCNS substitution or product warning), chemicals are selected, no further control required.
o If chemicals with a different OCNS rating, sub-warning or non OCNS rated chemicals are require, chemicals will be assessed in accordance with the procedure prior to use
• Safely storing chemicals/diesel to prevent the release to the marine environment • Incident reports are raised for unplanned releases within event reporting system • Mitigation – hydrocarbon spill response

Angel Operations Environment Plan Summary
This document is protected by copyright. No part of this document may be reproduced, adapted, transmitted, or stored in any form by any process (electronic or otherwise) without the specific written consent of Woodside. All rights are reserved.
Controlled Ref No:XX Revision: 0 Native file DRIMS No: 1400947213 Page 118 of 175
Uncontrolled when printed. Refer to electronic version for most up to date information.
Unplanned Discharges: Hazardous and Non-hazardous Waste Management
Risks Evaluation Summary
Source of Risk
Environmental Value Potentially Impacted Evaluation
Soil
and
Gro
undw
ater
Mar
ine
Sedi
men
t
Wat
er Q
ualit
y
Air
Qua
lity
(incl
. O
dour
)
Ecos
yste
ms/
Hab
itat
Spec
ies
Soci
o-Ec
onom
ic
Dec
isio
n Ty
pe
Con
sequ
ence
/Impa
ct
Like
lihoo
d
Ris
k R
atin
g
ALA
RP
Tool
s
Acc
epta
bilit
y
Incorrect disposal or accidental discharge of non-hazardous and hazardous waste to the marine environment.
X X X A E 2 M LCS GP PJ
Broa
dly
Acce
ptab
le
Description of Source of Risk Non-hazardous and Hazardous Waste Normal operations on the facility and support vessels result in a variety of hazardous and non-hazardous wastes. These materials could potentially impact the marine environment, if incorrectly disposed of, lost overboard or discharged in significant quantities. Non-hazardous wastes include domestic and industrial wastes such as paper and cardboard, aluminium cans, bottles and scrap steel. Hazardous wastes include recovered solvents, excess or spent chemicals, oil contaminated materials (e.g. sorbents, filters and rags), batteries, used lubricating oils and potentially material containing Naturally Occurring Radioactive Material (NORMs). Sand and sludges may also be periodically generated during process and vessel maintenance. The reservoir produced by the Angel Facility has historically produced very low levels of sand, and removal of sand or sludge from process equipment has not been required; hence, there is little potential for build-up of NORMs in produced sand. Given the facility is NNM, many of these waste streams are only generated on the riser platform and support vessels during deployment of personnel to the facility for IMR activities. All waste materials not suitable for discharge to the environment, including hazardous wastes (i.e. liquid and solid wastes), generated during the Petroleum Activities Program are transported to shore for disposal or recycling by Woodside’s licensed waste contractor.
Consequence Assessment Non-hazardous and Hazardous Waste The potential impacts of non-hazardous and hazardous wastes accidentally discharged to the marine environment include direct pollution and contamination of the marine environment, potentially resulting in slight localised decreased water or sediment quality. Secondary impacts relate to potential contact of marine fauna with wastes resulting in entanglement or ingestion, leading to injury or death of individual animals. The temporary or permanent loss of waste materials into the marine environment is not likely to have a significant environmental impact, based on the nature and scale of activities that may generate wastes, the location of the Operational Area, the types, size and frequency of wastes that could occur, and species present.
Summary of Control Measures • Contract vessels complying with Marine Orders for safe vessel operations:
o Marine Order 94 (Marine pollution prevention – packaged harmful substances) o Marine Order 95 (Pollution prevention – garbage)

Angel Operations Environment Plan Summary
This document is protected by copyright. No part of this document may be reproduced, adapted, transmitted, or stored in any form by any process (electronic or otherwise) without the specific written consent of Woodside. All rights are reserved.
Controlled Ref No:XX Revision: 0 Native file DRIMS No: 1400947213 Page 119 of 175
Uncontrolled when printed. Refer to electronic version for most up to date information.
• Implementing Waste Management Plan for Offshore Facilities • If safe and practicable to do so, using vessel ROV or crane to attempt recovery of material5 environmentally
hazardous or non-hazardous solid object/waste container lost overboard. • Incident reports are raised for unplanned releases within event reporting system • Mitigation – hydrocarbon spill response
5 For the purposes of this control/performance standard, “material” is defined as unplanned releases of environmentally hazardous or non-hazardous solid object/waste events with an environmental concequence of > F.

Angel Operations Environment Plan Summary
This document is protected by copyright. No part of this document may be reproduced, adapted, transmitted, or stored in any form by any process (electronic or otherwise) without the specific written consent of Woodside. All rights are reserved.
Controlled Ref No:XX Revision: 0 Native file DRIMS No: 1400947213 Page 120 of 175
Uncontrolled when printed. Refer to electronic version for most up to date information.
Physical Presence: Interactions with Marine Fauna
Risks Evaluation Summary
Source of Risk
Environmental Value Potentially Impacted Evaluation
Soil
and
Gro
undw
ater
Mar
ine
Sedi
men
t
Wat
er Q
ualit
y
Air
Qua
lity
(incl
. O
dour
)
Ecos
yste
ms/
Hab
itat
Spec
ies
Soci
o-Ec
onom
ic
Dec
isio
n Ty
pe
Con
sequ
ence
/Impa
ct
Like
lihoo
d
Ris
k R
atin
g
ALA
RP
Tool
s
Acc
epta
bilit
y
Physical presence of support vessels resulting in collision with marine fauna.
X A E 1 L LCS GP PJ
Broa
dly
Acce
ptab
le
Description of Source of Risk Support vessels operating in and around the Operational Area may present a potential hazard to cetaceans and other protected marine fauna such as whale sharks and marine reptiles. Vessel movements can result in collisions between the vessel (hull and propellers) and marine fauna, potentially resulting in superficial injury, serious injury that may affect life functions (e.g. movement and reproduction) and mortality. The frequency and severity of impacts due to collisions vary greatly due to vessel type, vessel operation (specific activity, speed), physical environment (e.g. water depth), and the type of marine fauna potentially present and their behaviours.
Consequence Assessment The likelihood of vessel/whale collision being lethal is influenced by vessel speed; the greater the speed at impact, the greater the risk of mortality (Jensen and Silber 2004, Laist et al. 2001). Vanderlaan and Taggart (2007) found that the chance of lethal injury to a large whale as a result of a vessel strike increases from about 20% at 8.6 knots to 80% at 15 knots. According to the data of Vanderlaan and Taggart (2007), it is estimated that the risk is less than 10% at a speed of four knots. Vessel–whale collisions at this speed are uncommon and, based on reported data contained in the US NOAA database (Jensen and Silber 2004), there only two known instances of collisions when the vessel was travelling at less than six knots. Both of these were from whale-watching vessels that were deliberately placed among whales. Support vessels undertaking the Petroleum Activities Program within the Operational Area are likely to be travelling less than eight knots; much of the time vessels are holding station. Therefore, the risk of a vessel collision with protected species resulting in death is inherently low. No known key aggregation areas (resting, breeding or feeding) are located within or immediately adjacent to the Operational Area. The nearest recognised BIAs for cetaceans (considered to be at risk due to relatively slow movement and proportion of time spent at or near the sea surface) is the humpback whale migration BIA, which lies approximately 35 km south of the Operational Area. The pygmy blue whale migration BIA also lies beyond the Operational Area (approximately 44 km north-west). Adverse interactions between vessels and humpback or pygmy blue whales are considered to be unlikely. Both humpback whales and pygmy blue whales are only expected to be present during their seasonal migrations. Whale sharks are at risk from vessel strikes when feeding at the surface or in shallow waters (where there is limited option to dive). Whale sharks may traverse offshore NWS waters including the Operational Area during their migrations to and from Ningaloo Reef, and a BIA for foraging whale sharks overlaps the Operational Area. However, it is expected that whale shark presence within the Operational Area would not comprise significant numbers, given there is no main aggregation area within the vicinity of the Operational Area, and their presence would be transitory and of a short duration. There are no constraints preventing whale sharks from moving away from vessels (e.g. shallow water or shorelines). The Operational Area is unlikely to represent important habitat for marine turtles, given the absence of potential nesting or foraging habitat (i.e. no emergent islands, reef habitat or shallow shoals) and the water depth (approximately 80–125 m in the Operational Area). The closest identified marine turtle BIA or critical habitat to the Operational Area is an internesting buffer for flatback turtles, which lies approximately 17 km from the Operational Area. The nearest potential

Angel Operations Environment Plan Summary
This document is protected by copyright. No part of this document may be reproduced, adapted, transmitted, or stored in any form by any process (electronic or otherwise) without the specific written consent of Woodside. All rights are reserved.
Controlled Ref No:XX Revision: 0 Native file DRIMS No: 1400947213 Page 121 of 175
Uncontrolled when printed. Refer to electronic version for most up to date information.
turtle nesting habitats are the islands of the Dampier Archipelago (approximately 94 km south of the Operational Area at the closest point). As such, the presence of marine turtles within the Operational Area is likely to be restricted to individual turtles infrequently transiting the area. It is acknowledged that there are significant nesting sites along the mainland coast and islands of the region. As with cetaceans, the risk of collisions between turtles and vessels increases with vessel speed (Hazel et al. 2007). The typical response from turtles on the surface to the presence of vessels is to dive (a potential ‘startle’ response), which decreases the risk of collisions (Hazel et al. 2007). Given the low speeds of vessels undertaking the Petroleum Activities Program, along with the expected low numbers of turtles within the Operational Area, interactions between vessels and turtles are considered to be highly unlikely. It is not deemed credible that vessel movement associated with the Petroleum Activities Program could have a significant impact on marine fauna populations given (1) the low presence of transiting individuals, (2) avoidance behaviour commonly displayed by marine fauna, and (3) low operating speed of the activity support vessels (generally less than eight knots or stationary, unless operating in an emergency). Activities are considered unlikely to result in a consequence greater than slight, short-term disruption to individuals or a small proportion of the population, and no impact on critical habitat or fauna activity.
Summary of Control Measures • EPBC Regulations 2000 – Part 8 Division 8.1 Interacting with cetaceans
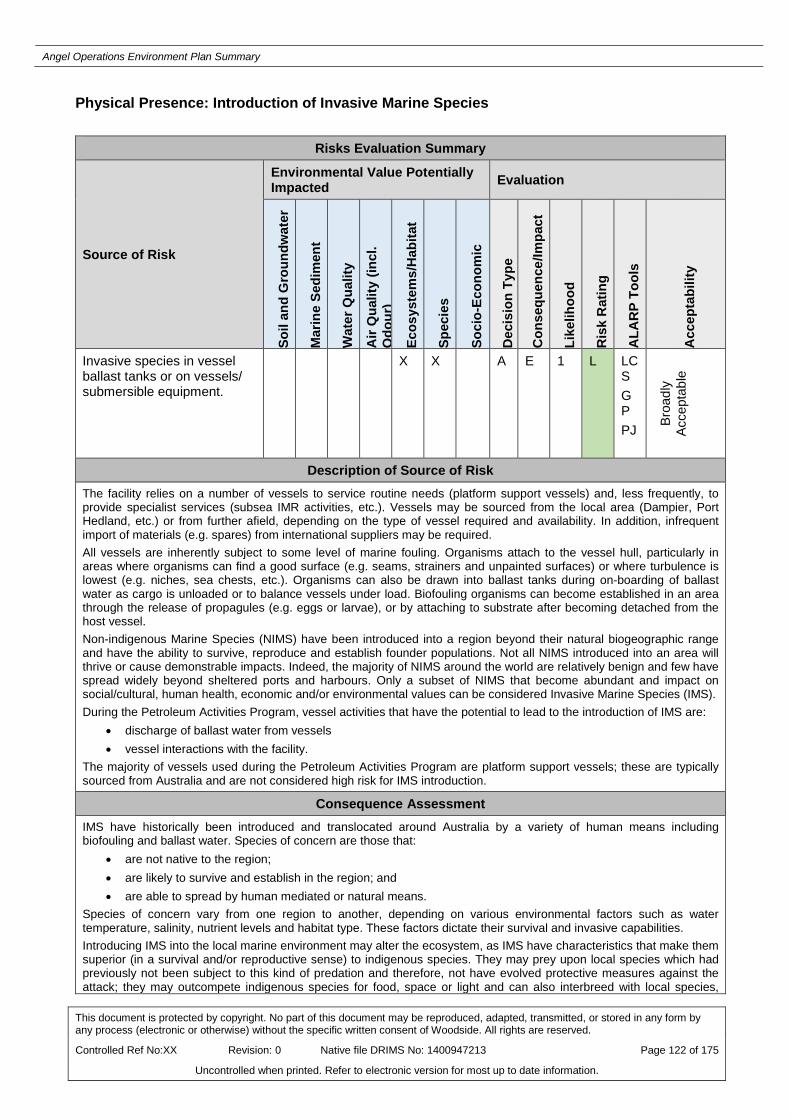
Angel Operations Environment Plan Summary
This document is protected by copyright. No part of this document may be reproduced, adapted, transmitted, or stored in any form by any process (electronic or otherwise) without the specific written consent of Woodside. All rights are reserved.
Controlled Ref No:XX Revision: 0 Native file DRIMS No: 1400947213 Page 122 of 175
Uncontrolled when printed. Refer to electronic version for most up to date information.
Physical Presence: Introduction of Invasive Marine Species
Risks Evaluation Summary
Source of Risk
Environmental Value Potentially Impacted Evaluation
Soil
and
Gro
undw
ater
Mar
ine
Sedi
men
t
Wat
er Q
ualit
y
Air
Qua
lity
(incl
. O
dour
)
Ecos
yste
ms/
Hab
itat
Spec
ies
Soci
o-Ec
onom
ic
Dec
isio
n Ty
pe
Con
sequ
ence
/Impa
ct
Like
lihoo
d
Ris
k R
atin
g
ALA
RP
Tool
s
Acc
epta
bilit
y
Invasive species in vessel ballast tanks or on vessels/ submersible equipment.
X X A E 1 L LCS GP PJ Br
oadl
y Ac
cept
able
Description of Source of Risk The facility relies on a number of vessels to service routine needs (platform support vessels) and, less frequently, to provide specialist services (subsea IMR activities, etc.). Vessels may be sourced from the local area (Dampier, Port Hedland, etc.) or from further afield, depending on the type of vessel required and availability. In addition, infrequent import of materials (e.g. spares) from international suppliers may be required. All vessels are inherently subject to some level of marine fouling. Organisms attach to the vessel hull, particularly in areas where organisms can find a good surface (e.g. seams, strainers and unpainted surfaces) or where turbulence is lowest (e.g. niches, sea chests, etc.). Organisms can also be drawn into ballast tanks during on-boarding of ballast water as cargo is unloaded or to balance vessels under load. Biofouling organisms can become established in an area through the release of propagules (e.g. eggs or larvae), or by attaching to substrate after becoming detached from the host vessel. Non-indigenous Marine Species (NIMS) have been introduced into a region beyond their natural biogeographic range and have the ability to survive, reproduce and establish founder populations. Not all NIMS introduced into an area will thrive or cause demonstrable impacts. Indeed, the majority of NIMS around the world are relatively benign and few have spread widely beyond sheltered ports and harbours. Only a subset of NIMS that become abundant and impact on social/cultural, human health, economic and/or environmental values can be considered Invasive Marine Species (IMS). During the Petroleum Activities Program, vessel activities that have the potential to lead to the introduction of IMS are:
• discharge of ballast water from vessels • vessel interactions with the facility.
The majority of vessels used during the Petroleum Activities Program are platform support vessels; these are typically sourced from Australia and are not considered high risk for IMS introduction.
Consequence Assessment IMS have historically been introduced and translocated around Australia by a variety of human means including biofouling and ballast water. Species of concern are those that:
• are not native to the region; • are likely to survive and establish in the region; and • are able to spread by human mediated or natural means.
Species of concern vary from one region to another, depending on various environmental factors such as water temperature, salinity, nutrient levels and habitat type. These factors dictate their survival and invasive capabilities. Introducing IMS into the local marine environment may alter the ecosystem, as IMS have characteristics that make them superior (in a survival and/or reproductive sense) to indigenous species. They may prey upon local species which had previously not been subject to this kind of predation and therefore, not have evolved protective measures against the attack; they may outcompete indigenous species for food, space or light and can also interbreed with local species,

Angel Operations Environment Plan Summary
This document is protected by copyright. No part of this document may be reproduced, adapted, transmitted, or stored in any form by any process (electronic or otherwise) without the specific written consent of Woodside. All rights are reserved.
Controlled Ref No:XX Revision: 0 Native file DRIMS No: 1400947213 Page 123 of 175
Uncontrolled when printed. Refer to electronic version for most up to date information.
creating hybrids such that the endemic species is lost. IMS have also proven economically damaging to areas where they have been introduced and established. Such impacts include direct damage to assets (fouling of vessel hulls and infrastructure) and depletion of commercially harvested marine life (e.g. shellfish stocks). IMS have proven particularly difficult to eradicate from areas, once established. If the introduction is captured early, eradication may be effective but is likely to be expensive, disruptive and, depending on the method of eradication, harmful to other local marine life. Despite the potential high consequence of the establishment of a marine pest within a high value environment as a result of introduction, like coastal or sheltered nearshore waters, the deep offshore open waters of the Operational Area are not conducive to the settlement and establishment of IMS (Geiling 2016), due to the lack of light or suitable habitat to sustain growth or survival. The Petroleum Activities Program will be undertaken in an offshore continental shelf location more than 12 nm from shorelines and/or critical habitat and in waters approximately 65 to 125 m deep. When considering potential impacts from translocation of marine pests to the facility itself, it is worth noting that interactions with the facility and any support vessels (most likely Australian sourced) will be limited. Time spent by vessels within the 500 m Petroleum Safety Zone around the facility will typically be limited to vessel transfers/bunkering. The likelihood of transfer of IMS between vessels and the riser platform is considered remote, given ballast water and biofouling controls which will be implemented for the Petroleum Activities Program and the limited opportunities for transfer of IMS between support vessels and the platform.
Summary of Potential Impacts to Environment Values In support of Woodside’s assessment of the impacts and risks of IMS introduction associated with the Petroleum Activity Program, Woodside conducted a risk and impact evaluation of the different aspects of marine pest translocation associated with the activity. The results of this assessment are presented in Table 12-13. As a result of this assessment, Woodside has presented the highest potential environment consequence as Slight (E) and likelihood as Highly Unlikely (1), resulting in an overall Low risk following the implementation of identified controls.
Table 12-13: Assessment of the impacts and risks of IMS introduction associated with the Petroleum Activity Program
IMS Introduction Aspect Credibility of Introduction
Consequence of Introduction
Likelihood
Transfer of IMS from infected vessel to Operational Area and establishment on the seafloor or subsea infrastructure.
Not Credible The deep offshore open waters of the Operational Area, away from shorelines and/or critical habitat, more than 12 nm from a shore and in waters 65–125 m deep, are not conducive to the settlement and establishment of IMS.
Transfer of IMS from infected vessel to and subsequent establishment on the riser platform.
Credible There is potential for the transfer of marine pests to occur.
Slight (E) – Environment Minor (D) – Reputation and Brand If IMS were to establish, this would potentially result in fouling of intakes (depending on the pest introduced), and would likely result in quarantine of the facility until eradication could occur (through cleaning and treatment of infected areas), which would be costly to undertake. Such introduction would be expected to have Minor (D) impact to Woodside’s reputation and brand, and close scrutiny of asset level operations or future proposals.
Highly Unlikely (1) Interactions between the facility and support vessels will be limited during the Petroleum Activity Program, with a 500 m Petroleum Safety Zone being adhered to. Spread of marine pests via ballast water or spawning in these open ocean environments is considered Highly Unlikely (1).
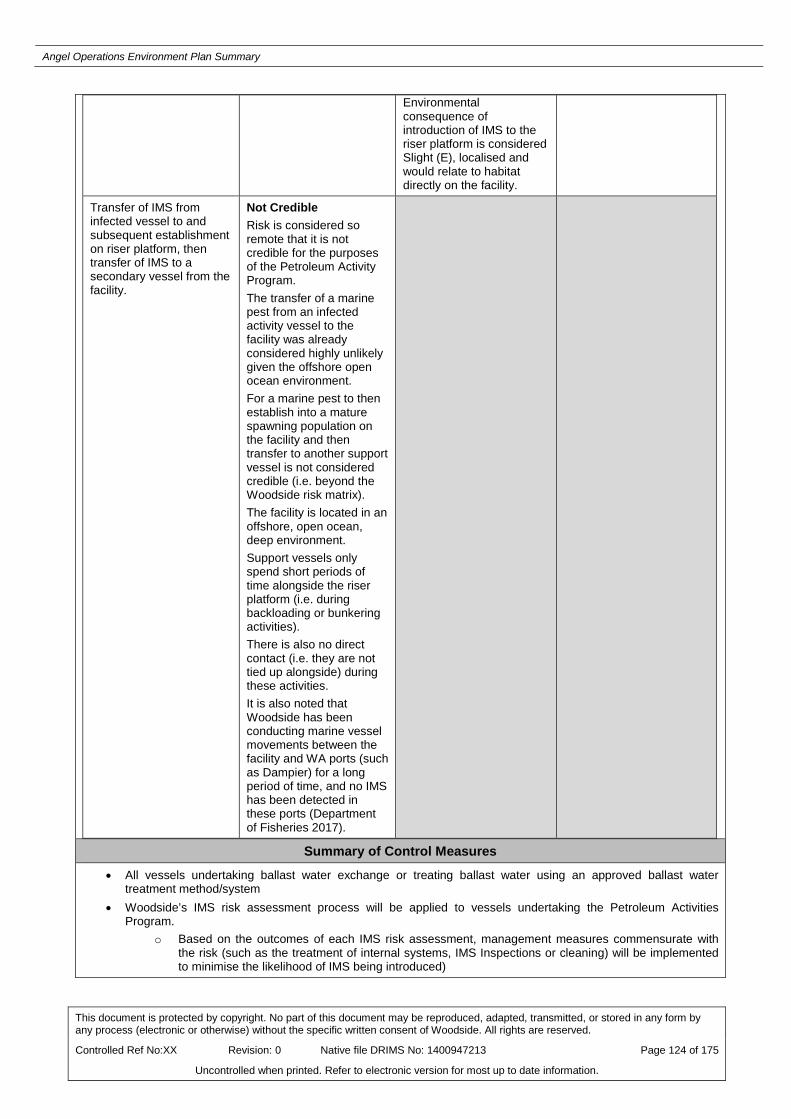
Angel Operations Environment Plan Summary
This document is protected by copyright. No part of this document may be reproduced, adapted, transmitted, or stored in any form by any process (electronic or otherwise) without the specific written consent of Woodside. All rights are reserved.
Controlled Ref No:XX Revision: 0 Native file DRIMS No: 1400947213 Page 124 of 175
Uncontrolled when printed. Refer to electronic version for most up to date information.
Environmental consequence of introduction of IMS to the riser platform is considered Slight (E), localised and would relate to habitat directly on the facility.
Transfer of IMS from infected vessel to and subsequent establishment on riser platform, then transfer of IMS to a secondary vessel from the facility.
Not Credible Risk is considered so remote that it is not credible for the purposes of the Petroleum Activity Program. The transfer of a marine pest from an infected activity vessel to the facility was already considered highly unlikely given the offshore open ocean environment. For a marine pest to then establish into a mature spawning population on the facility and then transfer to another support vessel is not considered credible (i.e. beyond the Woodside risk matrix). The facility is located in an offshore, open ocean, deep environment. Support vessels only spend short periods of time alongside the riser platform (i.e. during backloading or bunkering activities). There is also no direct contact (i.e. they are not tied up alongside) during these activities. It is also noted that Woodside has been conducting marine vessel movements between the facility and WA ports (such as Dampier) for a long period of time, and no IMS has been detected in these ports (Department of Fisheries 2017).
Summary of Control Measures • All vessels undertaking ballast water exchange or treating ballast water using an approved ballast water
treatment method/system • Woodside’s IMS risk assessment process will be applied to vessels undertaking the Petroleum Activities
Program. o Based on the outcomes of each IMS risk assessment, management measures commensurate with
the risk (such as the treatment of internal systems, IMS Inspections or cleaning) will be implemented to minimise the likelihood of IMS being introduced)

Angel Operations Environment Plan Summary
This document is protected by copyright. No part of this document may be reproduced, adapted, transmitted, or stored in any form by any process (electronic or otherwise) without the specific written consent of Woodside. All rights are reserved.
Controlled Ref No:XX Revision: 0 Native file DRIMS No: 1400947213 Page 125 of 175
Uncontrolled when printed. Refer to electronic version for most up to date information.
Unplanned Hydrocarbon Release: Topsides Loss of Containment
Risks Evaluation Summary
Source of Risk
Environmental Value Potentially Impacted Evaluation
Soil
and
Gro
undw
ater
Mar
ine
Sedi
men
t
Wat
er Q
ualit
y
Air
Qua
lity
(incl
. O
dour
)
Ecos
yste
ms/
Hab
itat
Spec
ies
Soci
o-Ec
onom
ic
Dec
isio
n Ty
pe
Con
sequ
ence
/Impa
ct
Like
lihoo
d
Ris
k R
atin
g
ALA
RP
Tool
s
Acc
epta
bilit
y
Hydrocarbon release from topsides process equipment to the marine environment and atmosphere.
X X X A D 1 M CLS GP PJ
Acce
ptab
le if
AL
ARP
Description of Source of Risk The facility has a range of topsides process and non-process equipment on the riser platform. A loss of containment from the topsides includes hydrocarbon inventories that could be released to the environment from high pressure process gas equipment and piping manifolds, and non-process hydrocarbon and chemical inventories. Hazards that could lead to loss of containment from the topsides are:
• corrosion • erosion • material defect • welding defect • piping/equipment repair/defect • vibration fatigue failure • equipment overpressure.
Escalation from MEEs can cause topsides loss of containment: • Loss of Structural Integrity (MEE-03) • Loss of Marine Vessel Separation (MEE-04) • Loss of Control of Suspended Load from facility lifting operations (MEE-05).
A number of common failure causes due to human error and SCQ failures are presented in the generic Human Error and SCE Failure section below. Topsides Loss of Containment – Credible Scenarios Topsides process and non-process hydrocarbon inventories, and therefore, worst-case credible spill scenarios, are relatively low for the riser platform in comparison to other facilities on the NWS. This is due to the lower number of wells and production rate from Angel, the provision of a remote power supply from NRC, and the facility’s NNM status. The worst credible hydrocarbon release volume is 21 m3 condensate from coalescers, although there are several smaller condensate inventories also present on the topsides. Small volumes of diesel, hydraulic oil and waste oil may also be released. While a number of hydrocarbon release scenarios were determined to constitute MEEs, the consequence assessment for a topsides loss of containment determined this source of risk is not an MEE.
Consequence Assessment Once released to the open offshore setting around the riser, Angel condensate is expected to weather rapidly. As a consequence, the potential for impacts to environmental receptors is limited to those in the immediate vicinity of the riser platform. Hydrocarbon weathering modelling indicates approximately 90% of spilled Angel Condensate will evaporate within 12 hours (RPS 2018).
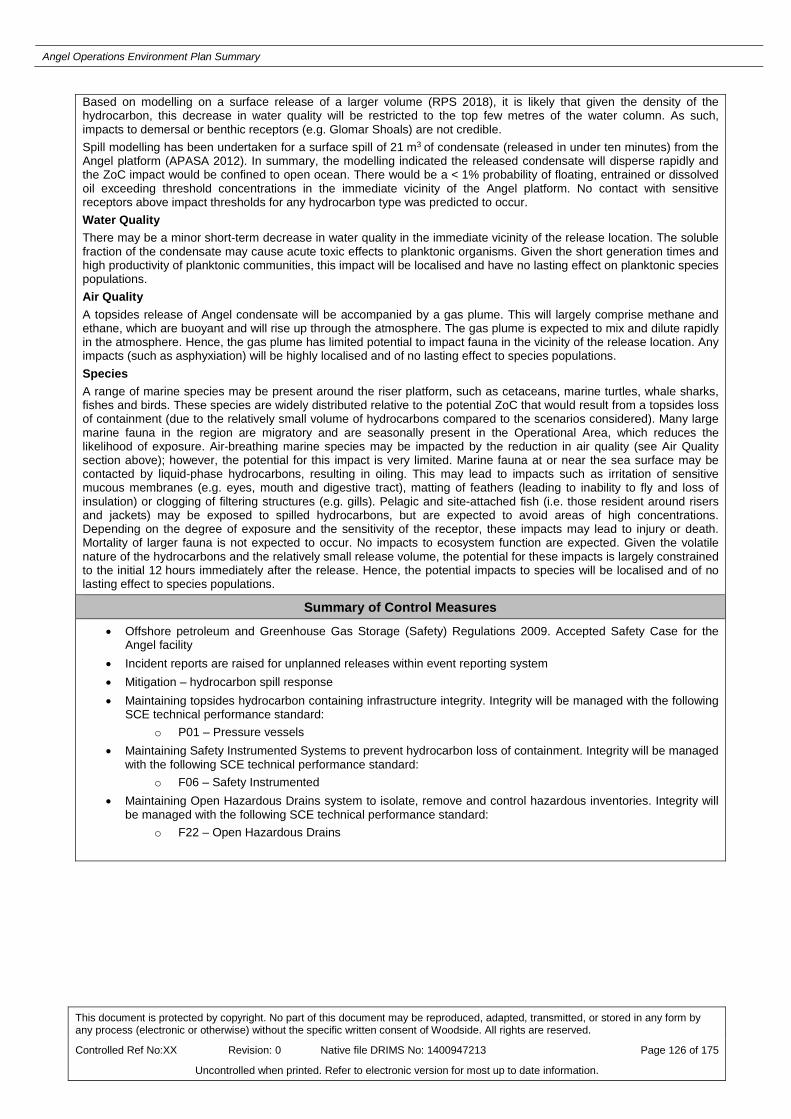
Angel Operations Environment Plan Summary
This document is protected by copyright. No part of this document may be reproduced, adapted, transmitted, or stored in any form by any process (electronic or otherwise) without the specific written consent of Woodside. All rights are reserved.
Controlled Ref No:XX Revision: 0 Native file DRIMS No: 1400947213 Page 126 of 175
Uncontrolled when printed. Refer to electronic version for most up to date information.
Based on modelling on a surface release of a larger volume (RPS 2018), it is likely that given the density of the hydrocarbon, this decrease in water quality will be restricted to the top few metres of the water column. As such, impacts to demersal or benthic receptors (e.g. Glomar Shoals) are not credible. Spill modelling has been undertaken for a surface spill of 21 m3 of condensate (released in under ten minutes) from the Angel platform (APASA 2012). In summary, the modelling indicated the released condensate will disperse rapidly and the ZoC impact would be confined to open ocean. There would be a < 1% probability of floating, entrained or dissolved oil exceeding threshold concentrations in the immediate vicinity of the Angel platform. No contact with sensitive receptors above impact thresholds for any hydrocarbon type was predicted to occur. Water Quality There may be a minor short-term decrease in water quality in the immediate vicinity of the release location. The soluble fraction of the condensate may cause acute toxic effects to planktonic organisms. Given the short generation times and high productivity of planktonic communities, this impact will be localised and have no lasting effect on planktonic species populations. Air Quality A topsides release of Angel condensate will be accompanied by a gas plume. This will largely comprise methane and ethane, which are buoyant and will rise up through the atmosphere. The gas plume is expected to mix and dilute rapidly in the atmosphere. Hence, the gas plume has limited potential to impact fauna in the vicinity of the release location. Any impacts (such as asphyxiation) will be highly localised and of no lasting effect to species populations. Species A range of marine species may be present around the riser platform, such as cetaceans, marine turtles, whale sharks, fishes and birds. These species are widely distributed relative to the potential ZoC that would result from a topsides loss of containment (due to the relatively small volume of hydrocarbons compared to the scenarios considered). Many large marine fauna in the region are migratory and are seasonally present in the Operational Area, which reduces the likelihood of exposure. Air-breathing marine species may be impacted by the reduction in air quality (see Air Quality section above); however, the potential for this impact is very limited. Marine fauna at or near the sea surface may be contacted by liquid-phase hydrocarbons, resulting in oiling. This may lead to impacts such as irritation of sensitive mucous membranes (e.g. eyes, mouth and digestive tract), matting of feathers (leading to inability to fly and loss of insulation) or clogging of filtering structures (e.g. gills). Pelagic and site-attached fish (i.e. those resident around risers and jackets) may be exposed to spilled hydrocarbons, but are expected to avoid areas of high concentrations. Depending on the degree of exposure and the sensitivity of the receptor, these impacts may lead to injury or death. Mortality of larger fauna is not expected to occur. No impacts to ecosystem function are expected. Given the volatile nature of the hydrocarbons and the relatively small release volume, the potential for these impacts is largely constrained to the initial 12 hours immediately after the release. Hence, the potential impacts to species will be localised and of no lasting effect to species populations.
Summary of Control Measures • Offshore petroleum and Greenhouse Gas Storage (Safety) Regulations 2009. Accepted Safety Case for the
Angel facility • Incident reports are raised for unplanned releases within event reporting system • Mitigation – hydrocarbon spill response • Maintaining topsides hydrocarbon containing infrastructure integrity. Integrity will be managed with the following
SCE technical performance standard: o P01 – Pressure vessels
• Maintaining Safety Instrumented Systems to prevent hydrocarbon loss of containment. Integrity will be managed with the following SCE technical performance standard:
o F06 – Safety Instrumented • Maintaining Open Hazardous Drains system to isolate, remove and control hazardous inventories. Integrity will
be managed with the following SCE technical performance standard: o F22 – Open Hazardous Drains

Angel Operations Environment Plan Summary
This document is protected by copyright. No part of this document may be reproduced, adapted, transmitted, or stored in any form by any process (electronic or otherwise) without the specific written consent of Woodside. All rights are reserved.
Controlled Ref No:XX Revision: 0 Native file DRIMS No: 1400947213 Page 127 of 175
Uncontrolled when printed. Refer to electronic version for most up to date information.
Unplanned Hydrocarbon Release: Loss of Well Containment (MEE-01) Impacts and Risks Evaluation Summary
Source of Risk
Environmental Value Potentially Impacted Evaluation
Soil
and
Gro
undw
ater
Mar
ine
Sedi
men
t
Wat
er Q
ualit
y
Air
Qua
lity
(incl
. O
dour
)
Ecos
yste
ms/
Hab
itat
Spec
ies
Soci
o-Ec
onom
ic
Dec
isio
n Ty
pe
Con
sequ
ence
/Impa
ct
Like
lihoo
d
Ris
k R
atin
g
ALA
RP
Tool
s
Acc
epta
bilit
y
Release of hydrocarbons resulting from loss of subsea well containment.
X X X X X X B A 1 H LCS GP PJ RBA CV SV
Acce
ptab
le if
AL
ARP
Description of Source of Risk The facility receives hydrocarbons via three subsea satellite wells. A loss of well containment can lead to an uncontrolled release of reservoir hydrocarbons or other well fluids to the environment (well blowout). Woodside has identified a well blowout as the scenario with the worst-case credible environmental outcome as a result of this event. Due to the potential consequences, a loss of well containment is considered to be an MEE (MEE-01). A loss of well containment could occur due to a variety of causes including:
• internal corrosion • external corrosion • erosion • overpressure of the annuli • fatigue • loss of control of suspended load from vessel (operating near subsea wells) (MEE-04).
A number of common failure causes due to human error and SCQ failures are presented in the generic Human Error and SCE Failure section below. Loss of Well Control – Credible Scenario The credible worst-case loss of well containment scenario identified for the Petroleum Activities Program is a well blowout of the AP3 well. This well is considered the worst case of the three wells tied back to the facility, as it has the highest production rate and lowest water cut, and hence would release the greatest volume of hydrocarbons. The loss of well containment scenario was assumed to have a release duration of 77 days. This duration is based on the estimated time required to successfully drill an intervention well. The characteristics of the release scenario are summarised in Table 12-14.
Table 12-14: Summary of worst-case loss of well containment hydrocarbon release scenario
Scenario Hydrocarbon Rate (m3/day)
Duration (days)
Depth (m)
Latitude/ Longitude (D°M’S’’ S)
Total Condensate Release Volume (m3)
Well blowout at seabed
Angel Condensate
3363 77 78.8 19° 30’ 38.52” S 116° 36’ 18.72” E
258,923
Decision Type, Risk Analysis and ALARP Tools Woodside has a good history of implementing industry standard practice in well design and construction. In the company’s recent history, it has not experienced any well integrity events that have resulted in significant releases or significant environmental impacts. The facility has never experienced a worst-case loss of well containment in its operational history.
Angel Operations Environment Plan Summary
This document is protected by copyright. No part of this document may be reproduced, adapted, transmitted, or stored in any form by any process (electronic or otherwise) without the specific written consent of Woodside. All rights are reserved.
Controlled Ref No:XX Revision: 0 Native file DRIMS No: 1400947213 Page 128 of 175
Uncontrolled when printed. Refer to electronic version for most up to date information.
Decision Type Decision Type B has been applied to this risk under the Guidance on Risk Related Decision Making (Oil and Gas UK 2014). This reflects the complexity of the risk, the higher potential consequence and stakeholder implications should the event be realised. To align with this decision type, a further level of analysis has been applied using risk based tools including the bowtie methodology and hydrocarbon spill trajectory modelling. Company and societal values were also considered in the demonstration of ALARP and acceptability, through peer review, benchmarking and stakeholder consultation. The release of hydrocarbons as a result of well loss of containment is considered a Major Environment Event (MEE-01). The hazard associated with this MEE is hydrocarbons in reservoirs, wells, wellheads and xmas trees tied back to the facility. Quantitative Spill Risk Assessment Spill modelling of each of the worst case credible loss of well containment spill scenarios was undertaken by RPS APASA, on behalf of Woodside, to determine the fate of hydrocarbons released in each scenario. Modelling was undertaken over all seasons to address year-round operations. This is considered to provide a conservative estimate of the ZoC and the potential impacts from the identified worst-case credible release volumes for all loss of well containment scenarios. Hydrocarbon Characteristics Angel condensate (API 56.5) contains a low proportion (~0.3% by mass) of hydrocarbon compounds that will not evaporate at atmospheric temperatures. These compounds will persist in the marine environment. The unweathered mixture has a dynamic viscosity of 0.655 cP. The pour point of the condensate (< -36 °C) ensures it will remain in a liquid state over the annual temperature range observed on the NWS. Angel condensate is composed of hydrocarbons that have a wide range of boiling points and volatilities at atmospheric temperatures, and which will begin to evaporate at different rates on exposure to the atmosphere. Evaporation rates will increase with temperature, but in general about 70.6% of the oil mass should evaporate within the first 12 hours (BP < 180 °C), a further 22.4% should evaporate within the first 24 hours (180 °C < BP < 265 °C), and a further 6.8% should evaporate over several days (265 °C < BP < 380 °C). Selective evaporation of the lower boiling-point components will lead to a shift in the physical properties of the remaining mixture, including an increase in the viscosity and pour point. No information has been made available to allow judgement as to whether Angel condensate will eventually solidify or sink as it weathers. The condensate has low asphaltene content (< 0.5%), indicating a low propensity to take up water to form water-in-oil emulsion over the weathering cycle. Soluble aromatic hydrocarbons contribute approximately 13.4% by mass of the condensate, with a large proportion (9.5%) in the C4–C10 range of hydrocarbons. These compounds will evaporate rapidly, reducing the potential for dissolution of a proportion of them into the water. Angel condensate is expected to evaporate rapidly once exposed to the atmosphere. Weathering modelling of variable-strength wind fields (considered to be representative of the release location), indicated that entrainment of Angel condensate into the water column will occur. Approximately 48 hours after the spill, around 6% of the oil mass is forecast to have entrained, leaving only a small proportion of the oil floating on the water surface (< 1%).

Angel Operations Environment Plan Summary
This document is protected by copyright. No part of this document may be reproduced, adapted, transmitted, or stored in any form by any process (electronic or otherwise) without the specific written consent of Woodside. All rights are reserved.
Controlled Ref No:XX Revision: 0 Native file DRIMS No: 1400947213 Page 129 of 175
Uncontrolled when printed. Refer to electronic version for most up to date information.
Figure 12-4: Proportional mass balance plot representing the weathering of Angel condensate spilled onto the water surface as a one-off release (50 m3 over 1 hour) and subject to variable wind at 27 °C water temperature and 25 °C air temperature
Subsea Plume Dynamics The subsea loss of well containment scenario will result in a buoyant plume of hydrocarbons, which has been modelled using the OILMAP-Deep numerical model (summarised in Table 12-15).
Table 12-15: Near-field subsurface discharge model parameters for loss of well containment scenario
Parameter Value
Inputs Release depth 78.8
Oil density (g/cm3) (at 15 °C) 0.752
Oil viscosity (cP) (at 20 °C) 0.655
Oil temperature (°C) 109
Hole diameter (m) [in] 0.22 [8.68]
Gas:oil ratio (m3/m3) [scf/bbl] 3363 [21,150]
Oil flow rate (m3/d) [bbl/d] 3363 [21,150]
Outputs Plume diameter (m) 10.2
Plume height above sea bed (m) 78.8 (surface)
Plume initial rise velocity (m/s) 17.5
Plume terminal rise velocity (m/s) 14.3
Predicted oil droplet size distribution
21.4% droplets of size (μm) 1.3
31.1% droplets of size (μm) 2.7
24.7% droplets of size (μm) 4.0
15.1% droplets of size (ìm) 5.4
7.7% droplets of size (ìm) 6.7
Angel Operations Environment Plan Summary
This document is protected by copyright. No part of this document may be reproduced, adapted, transmitted, or stored in any form by any process (electronic or otherwise) without the specific written consent of Woodside. All rights are reserved.
Controlled Ref No:XX Revision: 0 Native file DRIMS No: 1400947213 Page 130 of 175
Uncontrolled when printed. Refer to electronic version for most up to date information.
Likelihood In accordance with the Woodside Risk Matrix, a worst-case loss of well containment has been defined as a ‘highly unlikely’ event as it ‘has occurred once or twice in the industry’ (experience based likelihood) and aligns with a frequency of a ‘1 in 10,000 to 1 in 100,000 year’ event. Information to support this likelihood determination is outlined below. Review of industry statistics indicates the probability of a loss of well containment for production wells is low (10.6% of blowouts) relative to other activities in other hydrocarbon provinces (Gulf of Mexico and the North Sea), such as exploration drilling (31.5% of blowouts), development drilling (23.6% of blowouts) and well workovers (20.5% of blowouts) (SINTEF 2017). Consequence The spatial extent and fate (including weathering) of the spilled hydrocarbon were considered during the impact assessment for a worst-case loss of well containment (presented in the following section). These considerations were informed primarily by the outputs from the numerical modelling studies undertaken by APASA, available information on environmental sensitivities that may credibly be impacted in the event of a worst-case spill, and relevant literature and studies considering the effects of hydrocarbon exposure.
Consequence Assessment Environmental Value/s Potentially Impacted
Zone of Consequence Surface Hydrocarbons Quantitative hydrocarbon spill modelling undertaken predicts floating oil concentrations equal to or greater than the 10 g/m2 in the immediate vicinity of the release location. Entrained Hydrocarbons Modelling results indicated a number of environmental sensitivities may be contacted by entrained hydrocarbons above impact thresholds, with time to contact ranging from 0.7 days (Glomar Shoals) to 93 days (Pilbara Middle Island Group). If a worst-case loss of well containment scenario occurs, entrained hydrocarbons at or above 500 ppb are forecast to potentially extend up to 1200 km from the release site. The most likely direction of drift is south-westerly around the Ningaloo Coast and then southwards, reflecting the prevailing current patterns. Results also indicate entrained oil may also be likely to drift towards the northeast and in the offshore directions at lower probabilities. Cross-sectional transects of maximum entrained oil concentrations in the vicinity of the release site show that concentrations above 25,000 ppb are expected to extend from the sea surface to depths of around 25 m. Dissolved Hydrocarbons If a loss of well containment scenario occurs, dissolved hydrocarbons at or above 500 ppb (environmental impact threshold) are forecast to potentially occur up to 800 km from the release site . Accumulated Hydrocarbons Potential for accumulation of oil on shorelines is predicted to be low, with a maximum accumulated volume of < 1 m3 forecast at several receptors and a maximum local accumulated concentration on shorelines of 36 g/m2 forecast at Dampier Archipelago.

Angel Operations Environment Plan Summary
This document is protected by copyright. No part of this document may be reproduced, adapted, transmitted, or stored in any form by any process (electronic or otherwise) without the specific written consent of Woodside. All rights are reserved.
Controlled Ref No: XX Revision: B Native file DRIMS No: 1400947213 Page 131 of 175
Uncontrolled when printed. Refer to electronic version for most up to date information.
Table 12-16: Key receptor locations and sensitivities potentially contacted above impact thresholds by the loss of well containment scenario with summary hydrocarbon spill contact
Envi
ronm
enta
l Set
ting
Loca
tion/
Nam
e
Environmental, Social, Cultural, Heritage and Economic Aspects presented as per the Environmental Risk Definitions (Woodside’s Risk Management Procedure (WM0000PG10055394))
Hydrocarbon contact and fate
Physical Biological Socio-economic and Cultural
Wat
er Q
ualit
y
Sedi
men
t Q
ualit
y
Marine Primary Producers
Other Communities/Habitats
Protected Species Other Species
Fish
erie
s –
com
mer
cial
Fish
erie
s –
trad
ition
al
Tour
ism
and
recr
eatio
n
Prot
ecte
d A
reas
/Her
itage
– E
urop
ean
and
Indi
geno
us/s
hipw
reck
s
Offs
hore
oil
& g
as in
fras
truc
ture
(top
side
and
sub
sea)
Ope
n w
ater
(pris
tine)
Mar
ine
sedi
men
t (pr
istin
e)
Cor
al re
ef
Seag
rass
bed
s/m
acro
alga
e
Man
grov
es
Spaw
ning
/nur
sery
are
as
Ope
n w
ater
– p
rodu
ctiv
ity/u
pwel
ling
Non
-bio
geni
c co
ral r
eefs
Offs
hore
filte
r fee
ders
and
/or d
eepw
ater
be
nthi
c co
mm
uniti
es
Nea
rsho
re fi
lter f
eede
rs
Sand
y sh
ores
Estu
arie
s/tr
ibut
arie
s/cr
eeks
/lago
ons
(incl
udin
g m
udfla
ts)
Roc
ky s
hore
s
Cet
acea
ns –
mig
rato
ry w
hale
s
Cet
acea
ns –
dol
phin
s an
d po
rpoi
ses
Dug
ongs
Pinn
iped
s (s
ea li
ons
and
fur s
eals
)
Mar
ine
turt
les
(incl
udin
g fo
ragi
ng a
nd
inte
rnes
ting
area
s an
d si
gnifi
cant
nes
ting
beac
hes)
Seas
nake
s
Wha
le s
hark
s
Shar
ks a
nd ra
ys
Sea
bird
s an
d/or
mig
rato
ry s
hore
bird
s
Pela
gic
fish
popu
latio
ns
Res
iden
t/dem
ersa
l fis
h
Surf
ace
hydr
ocar
bon
(≥ 1
0 g/
m2 )
Entr
aine
d hy
droc
arbo
n (≥
500
ppb
)
Dis
solv
ed a
rom
atic
hyd
roca
rbon
(≥ 5
00 p
pb)
Acc
umul
ated
hyd
roca
rbon
s (>
100
g/m
2 )
Offs
hore
6
Commonwealth Waters
Argo-Rowley Terrace Australian Marine Park
Kimberley Australian Marine Park
Shark Bay Open Ocean (including Australian Marine Park)
Abrolhos Australian Marine Park
Gascoyne Australian Marine Park
Montebello Australian Marine Park
6 Note: hydrocarbons cannot accumulate on open ocean, submerged receptors, or receptors not fully emergent.

Angel Operations Environment Plan Summary
This document is protected by copyright. No part of this document may be reproduced, adapted, transmitted, or stored in any form by any process (electronic or otherwise) without the specific written consent of Woodside. All rights are reserved.
Controlled Ref No: XX Revision: B Native file DRIMS No: 1400947213 Page 132 of 175
Uncontrolled when printed. Refer to electronic version for most up to date information.
Envi
ronm
enta
l Set
ting
Loca
tion/
Nam
e
Environmental, Social, Cultural, Heritage and Economic Aspects presented as per the Environmental Risk Definitions (Woodside’s Risk Management Procedure (WM0000PG10055394))
Hydrocarbon contact and fate
Physical Biological Socio-economic and Cultural
Wat
er Q
ualit
y
Sedi
men
t Q
ualit
y
Marine Primary Producers
Other Communities/Habitats
Protected Species Other Species
Fish
erie
s –
com
mer
cial
Fish
erie
s –
trad
ition
al
Tour
ism
and
recr
eatio
n
Prot
ecte
d A
reas
/Her
itage
– E
urop
ean
and
Indi
geno
us/s
hipw
reck
s
Offs
hore
oil
& g
as in
fras
truc
ture
(top
side
and
sub
sea)
Ope
n w
ater
(pris
tine)
Mar
ine
sedi
men
t (pr
istin
e)
Cor
al re
ef
Seag
rass
bed
s/m
acro
alga
e
Man
grov
es
Spaw
ning
/nur
sery
are
as
Ope
n w
ater
– p
rodu
ctiv
ity/u
pwel
ling
Non
-bio
geni
c co
ral r
eefs
Offs
hore
filte
r fee
ders
and
/or d
eepw
ater
be
nthi
c co
mm
uniti
es
Nea
rsho
re fi
lter f
eede
rs
Sand
y sh
ores
Estu
arie
s/tr
ibut
arie
s/cr
eeks
/lago
ons
(incl
udin
g m
udfla
ts)
Roc
ky s
hore
s
Cet
acea
ns –
mig
rato
ry w
hale
s
Cet
acea
ns –
dol
phin
s an
d po
rpoi
ses
Dug
ongs
Pinn
iped
s (s
ea li
ons
and
fur s
eals
)
Mar
ine
turt
les
(incl
udin
g fo
ragi
ng a
nd
inte
rnes
ting
area
s an
d si
gnifi
cant
nes
ting
beac
hes)
Seas
nake
s
Wha
le s
hark
s
Shar
ks a
nd ra
ys
Sea
bird
s an
d/or
mig
rato
ry s
hore
bird
s
Pela
gic
fish
popu
latio
ns
Res
iden
t/dem
ersa
l fis
h
Surf
ace
hydr
ocar
bon
(≥ 1
0 g/
m2 )
Entr
aine
d hy
droc
arbo
n (≥
500
ppb
)
Dis
solv
ed a
rom
atic
hyd
roca
rbon
(≥ 5
00 p
pb)
Acc
umul
ated
hyd
roca
rbon
s (>
100
g/m
2 )
Subm
erge
d Sh
oals
an
d ba
nks
Rankin Bank
Glomar Shoals
Rowley Shoals (including Sate Maine Park)
Isla
nds
Montebello Islands (including State Marine Park)
Lowendal Islands (including State Nature Reserve)
Barrow Island (including State Nature Reserves, State Marine Park and Marine Management Area)
Muiron Islands (WHA, State Marine Park)
Pilbara Islands – Southern Island Group (Serrurier, Thevenard and

Angel Operations Environment Plan Summary
This document is protected by copyright. No part of this document may be reproduced, adapted, transmitted, or stored in any form by any process (electronic or otherwise) without the specific written consent of Woodside. All rights are reserved.
Controlled Ref No: XX Revision: B Native file DRIMS No: 1400947213 Page 133 of 175
Uncontrolled when printed. Refer to electronic version for most up to date information.
Envi
ronm
enta
l Set
ting
Loca
tion/
Nam
e
Environmental, Social, Cultural, Heritage and Economic Aspects presented as per the Environmental Risk Definitions (Woodside’s Risk Management Procedure (WM0000PG10055394))
Hydrocarbon contact and fate
Physical Biological Socio-economic and Cultural
Wat
er Q
ualit
y
Sedi
men
t Q
ualit
y
Marine Primary Producers
Other Communities/Habitats
Protected Species Other Species
Fish
erie
s –
com
mer
cial
Fish
erie
s –
trad
ition
al
Tour
ism
and
recr
eatio
n
Prot
ecte
d A
reas
/Her
itage
– E
urop
ean
and
Indi
geno
us/s
hipw
reck
s
Offs
hore
oil
& g
as in
fras
truc
ture
(top
side
and
sub
sea)
Ope
n w
ater
(pris
tine)
Mar
ine
sedi
men
t (pr
istin
e)
Cor
al re
ef
Seag
rass
bed
s/m
acro
alga
e
Man
grov
es
Spaw
ning
/nur
sery
are
as
Ope
n w
ater
– p
rodu
ctiv
ity/u
pwel
ling
Non
-bio
geni
c co
ral r
eefs
Offs
hore
filte
r fee
ders
and
/or d
eepw
ater
be
nthi
c co
mm
uniti
es
Nea
rsho
re fi
lter f
eede
rs
Sand
y sh
ores
Estu
arie
s/tr
ibut
arie
s/cr
eeks
/lago
ons
(incl
udin
g m
udfla
ts)
Roc
ky s
hore
s
Cet
acea
ns –
mig
rato
ry w
hale
s
Cet
acea
ns –
dol
phin
s an
d po
rpoi
ses
Dug
ongs
Pinn
iped
s (s
ea li
ons
and
fur s
eals
)
Mar
ine
turt
les
(incl
udin
g fo
ragi
ng a
nd
inte
rnes
ting
area
s an
d si
gnifi
cant
nes
ting
beac
hes)
Seas
nake
s
Wha
le s
hark
s
Shar
ks a
nd ra
ys
Sea
bird
s an
d/or
mig
rato
ry s
hore
bird
s
Pela
gic
fish
popu
latio
ns
Res
iden
t/dem
ersa
l fis
h
Surf
ace
hydr
ocar
bon
(≥ 1
0 g/
m2 )
Entr
aine
d hy
droc
arbo
n (≥
500
ppb
)
Dis
solv
ed a
rom
atic
hyd
roca
rbon
(≥ 5
00 p
pb)
Acc
umul
ated
hyd
roca
rbon
s (>
100
g/m
2 )
Bessieres Islands – State Nature Reserves)
Pilbara Islands – Middle Island Group
Pilbara Islands – Northern Island Group (Sandy Island Passage Islands – State Nature Reserves)
Bernier and Dorre Islands
Abrolhos Islands
Mai
nlan
d (n
ears
hore
w
ater
s)
Southern Pilbara Shoreline
Middle Pilbara Shoreline
Northern Pilbara Shoreline
Ningaloo Coast (North, Middle and South WHA)

Angel Operations Environment Plan Summary
This document is protected by copyright. No part of this document may be reproduced, adapted, transmitted, or stored in any form by any process (electronic or otherwise) without the specific written consent of Woodside. All rights are reserved.
Controlled Ref No: XX Revision: B Native file DRIMS No: 1400947213 Page 134 of 175
Uncontrolled when printed. Refer to electronic version for most up to date information.
Envi
ronm
enta
l Set
ting
Loca
tion/
Nam
e
Environmental, Social, Cultural, Heritage and Economic Aspects presented as per the Environmental Risk Definitions (Woodside’s Risk Management Procedure (WM0000PG10055394))
Hydrocarbon contact and fate
Physical Biological Socio-economic and Cultural
Wat
er Q
ualit
y
Sedi
men
t Q
ualit
y
Marine Primary Producers
Other Communities/Habitats
Protected Species Other Species
Fish
erie
s –
com
mer
cial
Fish
erie
s –
trad
ition
al
Tour
ism
and
recr
eatio
n
Prot
ecte
d A
reas
/Her
itage
– E
urop
ean
and
Indi
geno
us/s
hipw
reck
s
Offs
hore
oil
& g
as in
fras
truc
ture
(top
side
and
sub
sea)
Ope
n w
ater
(pris
tine)
Mar
ine
sedi
men
t (pr
istin
e)
Cor
al re
ef
Seag
rass
bed
s/m
acro
alga
e
Man
grov
es
Spaw
ning
/nur
sery
are
as
Ope
n w
ater
– p
rodu
ctiv
ity/u
pwel
ling
Non
-bio
geni
c co
ral r
eefs
Offs
hore
filte
r fee
ders
and
/or d
eepw
ater
be
nthi
c co
mm
uniti
es
Nea
rsho
re fi
lter f
eede
rs
Sand
y sh
ores
Estu
arie
s/tr
ibut
arie
s/cr
eeks
/lago
ons
(incl
udin
g m
udfla
ts)
Roc
ky s
hore
s
Cet
acea
ns –
mig
rato
ry w
hale
s
Cet
acea
ns –
dol
phin
s an
d po
rpoi
ses
Dug
ongs
Pinn
iped
s (s
ea li
ons
and
fur s
eals
)
Mar
ine
turt
les
(incl
udin
g fo
ragi
ng a
nd
inte
rnes
ting
area
s an
d si
gnifi
cant
nes
ting
beac
hes)
Seas
nake
s
Wha
le s
hark
s
Shar
ks a
nd ra
ys
Sea
bird
s an
d/or
mig
rato
ry s
hore
bird
s
Pela
gic
fish
popu
latio
ns
Res
iden
t/dem
ersa
l fis
h
Surf
ace
hydr
ocar
bon
(≥ 1
0 g/
m2 )
Entr
aine
d hy
droc
arbo
n (≥
500
ppb
)
Dis
solv
ed a
rom
atic
hyd
roca
rbon
(≥ 5
00 p
pb)
Acc
umul
ated
hyd
roca
rbon
s (>
100
g/m
2 )
Exmouth Gulf
Shark Bay – Open Ocean Coast
Shark Bay – WHA and Marine Park

Angel Operations Environment Plan Summary
This document is protected by copyright. No part of this document may be reproduced, adapted, transmitted, or stored in any form by any process (electronic or otherwise) without the specific written consent of Woodside. All rights are reserved.
Controlled Ref No: XX Revision: B Native file DRIMS No: 1400947213 Page 135 of 175
Uncontrolled when printed. Refer to electronic version for most up to date information.
Summary of Potential Impacts to Environmental Values
Summary of Potential Impacts to protected species
Setting Receptor Group Offshore, Oceanic Reefs and Islands
Cetaceans A range of cetaceans were identified as potentially occurring within the Operational Area and wider ZoC. In the event of a loss of well containment, surface, entrained and dissolved hydrocarbons exceeding environmental impact threshold concentrations may drift across habitat for oceanic cetacean species and the migratory routes and BIAs of cetaceans considered to be MNES, including humpback whales and pygmy blue whales (north- and southbound migrations). Cetaceans that have direct physical contact with surface, entrained or dissolved aromatic hydrocarbons may suffer surface fouling, ingestion of hydrocarbons (from prey, water and sediments), aspiration of oily water or droplets and inhalation of toxic vapours (Deepwater Horizon Natural Resource Damage Assessment Trustees 2016). This may result in the irritation of sensitive membranes such as the eyes, mouth, digestive and respiratory tracts and organs, impairment of the immune system, neurological damage (Helm et al. 2015), reproductive failure, adverse health effects (e.g. lung disease, poor body condition) and potentially mortality (Deepwater Horizon Natural Resource Damage Assessment Trustees 2016). Given the non-persistent nature of the hydrocarbons and the relatively small floating hydrocarbon ZoC, the area where potential impacts from inhalation may occur is localised around the release location. In a review of cetacean observations in relation to large scale hydrocarbon spills, it was concluded that exposure to oil from the Deepwater Horizon resulted in increased mortality to cetaceans in the Gulf of Mexico (Deepwater Horizon Natural Resource Damage Assessment Trustees 2016), and long-term population level impacts to killer whales have been linked to the Exxon Valdez tanker spill (Matkin et al. 2008). It is worth noting that the Deepwater Horizon and Exxon Valdez spills, two well-studied large-scale hydrocarbon releases, were both crude oil spills. Crude oil is much more persistent in the environment than condensate that may be released during the Petroleum Activities Program, and also more amenable to the formation of surface slicks, which cetaceans may be exposed to when breathing. Geraci (1988) has identified behavioural disturbance (i.e. avoiding spilled hydrocarbons) in some instances for several species of cetacean, suggesting cetaceans have the ability to detect and avoid surface slicks. However, observations during spills have recorded larger whales (both mysticetes and odontocetes) and smaller delphinids travelling through and feeding in oil slicks. During the Deepwater Horizon spill, cetaceans were routinely seen swimming in surface slicks offshore (and nearshore) (Aichinger Dias et al. 2017). Cetacean populations resident within the ZoC may be susceptible to impacts from spilled hydrocarbons if they interact with an area affected by a spill. Such species are more likely to occupy coastal waters (refer to the mainland and islands section below for additional information). Suitable habitat for oceanic toothed whales (e.g. sperm whales) and dolphins (e.g. spinner dolphin) is broadly distributed throughout the region. As such, impacts are unlikely to affect an entire population. Other species identified in Section 4.3.4 may also have possible transient interactions with the ZoC (refer to Table 12-14 for the list of receptor locations important for cetaceans). Physical contact with hydrocarbons to these species is likely to have biological consequences; however, it is unlikely to affect an entire population and not predicted to impact on the overall population viability. Given the nature of the hydrocarbon, it is expected to weather rapidly and remain entrained in the water column; cetaceans that may interact with spilled hydrocarbons are most likely to be subject to physical impacts. Given cetaceans maintain thick skin and blubber, external exposure to hydrocarbons may result in irritation to skin and eyes. Entrained hydrocarbons may also be ingested, particularly by baleen whales which feed by filtering large volumes of water. Fresh hydrocarbons (i.e. typically in the vicinity of the release location) may have a higher potential to cause toxic effects when ingested, while weathered hydrocarbons are considered to be less likely to result in toxic effects. Pygmy blue whales and humpback whales are known to migrate seasonally through the wider ZoC, although the migration BIAs in the region for both species do not overlap the Operational Area. A major spill in May to November would coincide with humpback whale migration through the waters off the Pilbara, North West Cape and Shark Bay. A major spill in April to August or October to January would coincide with pygmy blue whale migration. Double et al. (2014) suggest pygmy blue whales migrate in offshore waters west of the Operational Area in approximately 200–1000 m of water. Both pygmy blue and humpback whales are baleen whales, and hence are most likely to be significantly impacted by toxic effects when feeding. However, feeding during migrations is low level and opportunistic, with most feeding for both species in the Southern Ocean. As such, the risk of ingestion of hydrocarbons is low. Migrations of both pygmy blue whales and humpback whales are protracted through time and space (i.e. the whole population will not be within the ZoC), and as such, a spill from the loss of well containment is unlikely to affect an entire population. The humpback whale resting area in Exmouth Gulf and the calving area in Camden Sound are not predicted to be contacted by surface, entrained or dissolved

Angel Operations Environment Plan Summary
This document is protected by copyright. No part of this document may be reproduced, adapted, transmitted, or stored in any form by any process (electronic or otherwise) without the specific written consent of Woodside. All rights are reserved.
Controlled Ref No: XX Revision: B Native file DRIMS No: 1400947213 Page 136 of 175
Uncontrolled when printed. Refer to electronic version for most up to date information.
hydrocarbons above threshold concentrations. A loss of well containment resulting in a well blowout could result in a disruption to a significant portion of the humpback or pygmy blue whale populations, if the event occurred during the seasonal migration periods during which these species are present in the ZoC. Such disruption could include behavioural impacts (e.g. avoidance of impacted areas), sub-lethal biological effects (e.g. skin irritation, irritation from ingestion or inhalation, reproductive failure) and, in rare circumstances, death. However, such disruptions or impacts are not predicted to impact on the overall population viability.
Pinnipeds Australian sea lions are found on and around the Abrolhos Islands, distant from the Operational Area but within the wider ZoC (Table 12-14). Given the considerable distance from the Operational Area to these receptors and the lengthy time for entrained hydrocarbons to contact (minimum 85 days for the Abrolhos Islands), entrained hydrocarbons that do reach this area are likely to be heavily weathered and are expected to have minor or no impacts on sea lions.
Marine Turtles Adult sea turtles exhibit no avoidance behaviour when they encounter hydrocarbon spills (NOAA 2010). Contact with entrained (or floating) hydrocarbon can result in hydrocarbon adherence to body surfaces (Gagnon and Rawson 2010), causing irritation of mucous membranes in the nose, throat and eyes leading to inflammation and infection (NOAA 2010). Given the modelling results indicated concentrations of floating hydrocarbons are not expected to exceed impact thresholds, the potential for contact with this hydrocarbon phase is very low. Oiling can also irritate and injure skin, which is most evident on pliable areas such as the neck and flippers (Lutcavage et al. 1995). A stress response associated with this exposure pathway includes an increase in the production of white blood cells, and even a short exposure to hydrocarbons may affect the functioning of their salt gland (Lutcavage et al. 1995). Hydrocarbons in surface waters may also impact turtles when they surface to breathe and inhale toxic vapours. Their breathing pattern, involving large ‘tidal’ volumes and rapid inhalation before diving, results in direct exposure to petroleum vapours which are the most toxic component of the hydrocarbon spill (Milton and Lutz 2003). This can lead to lung damage and congestion, interstitial emphysema, inhalant pneumonia and neurological impairment (NOAA 2010). Given the non-persistent nature of the hydrocarbons and the relatively small floating hydrocarbon ZoC, the area where potential impacts from inhalation may occur is localised around the release location. Contact with entrained hydrocarbons can result in hydrocarbon adherence to body surfaces (Gagnon and Rawson 2010), causing irritation of mucous membranes in the nose, throat and eyes leading to inflammation and infection (Gagnon and Rawson 2010). Given the hydrocarbon is expected to weather rapidly when released to the environment, relatively fresh entrained hydrocarbons (which are typically relatively close to the release location) are considered to have the greatest potential for impact. Due to the absence of potential nesting habitat and offshore location, the Operational Area is unlikely to represent important habitat for marine turtles. It is, however, acknowledged that marine turtles may be present foraging within the ZoC, and the ZoC would overlap with the BIAs identified in Section 4.3.4, in particular, the internesting BIAs for flatback turtles which extend for ~80 km from known nesting locations. It is noted that the Petroleum Activities Program will coincide with nesting season for marine turtles in the region. In the event of a loss of well containment, there is potential that entrained and dissolved hydrocarbons exceeding environmental impact threshold concentrations will be present in offshore waters. Therefore, a hydrocarbon spill may disrupt a portion of the population; however, there is no threat to overall population viability, given the non-persistent nature of predicted hydrocarbons. Potential impacts to nesting and internesting marine turtles are discussed in the Mainland and Islands (nearshore) impacts discussion.
Seasnakes Impacts to seasnakes from direct contact with hydrocarbons are likely to result in similar physical effects to those recorded for marine turtles, and may include potential damage to the dermis and irritation to mucus membranes of the eyes, nose and throat (International Tanker Owners Pollution Federation 2011a). They may also be impacted when they return to the surface to breathe and inhale the toxic vapours associated with the hydrocarbons, resulting in damage to their respiratory system. Given modelling indicated floating hydrocarbons are not expected to exceed impact thresholds, the potential for seasnakes to be exposed to floating hydrocarbons is considered to be very low. In general, seasnakes frequent the waters of the continental shelf area around offshore islands and potentially submerged shoals (water depths < 100 m; see Submerged Shoals below). It is acknowledged that seasnakes will be present in the Operational Area and wider ZoC (refer to Table 12-14); however, their abundance is not expected to be high in the deepwater and offshore environment. Therefore, a hydrocarbon spill may have a minor disruption to a portion of the population, but there is not considered
Angel Operations Environment Plan Summary
This document is protected by copyright. No part of this document may be reproduced, adapted, transmitted, or stored in any form by any process (electronic or otherwise) without the specific written consent of Woodside. All rights are reserved.
Controlled Ref No: XX Revision: B Native file DRIMS No: 1400947213 Page 137 of 175
Uncontrolled when printed. Refer to electronic version for most up to date information.
to be a threat to overall population viability, given the non-persistent nature of hydrocarbons predicted.
Sharks and Rays Hydrocarbon contact may affect whale sharks through ingestion (entrained/dissolved hydrocarbons), particularly if feeding. Whale sharks may transit offshore open waters when migrating to and from Ningaloo Reef, where they aggregate for feeding from March to July. A whale shark foraging BIAs overlaps the Operational Area, and a foraging (high prey density) BIA lies approximately 328 km south-west of the Operational Area (off the Ningaloo Coast and within the wider ZoC) (Section 4.3.4). Whale sharks are versatile feeders, filtering large amounts of water over their gills, catching planktonic and nektonic organisms (Jarman and Wilson 2004). Therefore, individual whale sharks that have direct contact with hydrocarbons within the spill-affected area may be impacted. Impacts to sharks and rays may occur through direct contact with hydrocarbons and contaminate the tissues and internal organs, either through direct contact or via the food chain (consumption of prey). As gill breathing organisms, sharks and rays may be vulnerable to toxic effects of dissolved hydrocarbons (entering the body via the gills) and entrained hydrocarbons (coating of the gills inhibiting gas exchange). In the offshore environment, it is probable that pelagic shark species are able to detect and avoid surface waters underneath hydrocarbon spills by swimming into deeper water or away from the affected areas. Therefore, any impact on sharks and rays is predicted to be minor and localised.
Seabirds and Migratory Shorebirds Seabirds and migratory birds are particularly vulnerable to contact with floating hydrocarbons, which may mat feathers. This may lead to hypothermia from loss of insulation and ingestion of hydrocarbons when preening to remove hydrocarbons; both impacts may result in mortality (Hassan and Javed 2011). The credible loss of well containment scenario results in highly localised floating hydrocarbons below impact thresholds centred around the release location; hence, the potential for seabird exposure to floating hydrocarbons is considered to be low. Migratory shorebirds are unlikely to interact with spilled hydrocarbons; refer to the sections on Islands and Mainland Coast below for a discussion on the potential impacts to migratory shorebirds. Offshore waters are potential foraging grounds for seabirds associated with the coastal roosting and nesting habitat, which includes the numerous islands along the Pilbara coast. There are a number of BIAs for seabirds and migratory shorebirds that overlap with the wider ZoC, as provided in Section 4.3.4, including the wedge-tail shearwater foraging BIA which overlaps the Operational Area. Given the relatively low likelihood of encounters between seabirds and floating hydrocarbons, impacts to seabirds in offshore waters are expected to consist of ecosystem-scale effects, such as reduced prey abundance. Impacts from a loss of well containment to prey such as small pelagic fish (prey for the birds) are not expected to be significant; hence, subsequent impacts to a significant portion of seabirds are not expected.
Submerged Shoals and Banks7
Marine Turtles There is the potential for marine turtles to be present at submerged shoals such as Rankin Bank, Glomar Shoals and Rowley Shoals. These shoals and banks may, at times, be foraging habitat for marine turtles, given the coral and filter feeding biota associated with these areas. However, these areas are not known foraging locations. Tagging studies of green turtles did not indicate any overlap of the tracked post-nesting migratory routes and the Operational Area. It is, however, acknowledged that individual marine turtles may be present at Glomar Shoals, Rankin Bank, Rowley Shoals and the surrounding areas. Therefore, a hydrocarbon spill may have a minor disruption to a portion of the population (see Offshore description above); however, there is no threat to overall population viability.
Seasnakes There is the potential for seasnakes to be present at submerged shoals such as Rankin Bank, Glomar Shoals and Rowley Shoals. The potential impacts of exposure are as discussed previously in Offshore – Seasnakes. A hydrocarbon spill may have a minor disruption to a portion of the population, but there is no threat to overall population viability. Seasnake species in Australia generally show strong habitat preferences (Heatwole and Cogger 1993); species that have preferred habitats associated with submerged shoals and oceanic atolls may be disproportionately affected by a hydrocarbon spill affecting such habitat.
7 The preceding discussion of protected species in the offshore environment is considered to be relevant to protected species associated with submerged shoals and banks. The text in this section is intended to provide
additional context and impact assessment for protected species in relation to submerged banks and shoals.

Angel Operations Environment Plan Summary
This document is protected by copyright. No part of this document may be reproduced, adapted, transmitted, or stored in any form by any process (electronic or otherwise) without the specific written consent of Woodside. All rights are reserved.
Controlled Ref No: XX Revision: B Native file DRIMS No: 1400947213 Page 138 of 175
Uncontrolled when printed. Refer to electronic version for most up to date information.
Sharks and Rays There is the potential for resident shark and ray populations to be impacted directly from hydrocarbon contact or indirectly through contaminated prey or loss of habitat. Spill model results indicate potential impacts to the benthic communities of Glomar Shoals and Rankin Bank, which may host shark and ray populations. Note, Glomar Shoals overlaps the Operational Area, and the minimum time to contact above entrained impact thresholds from the modelling studies is < one day. Sharks and rays present at Glomar Shoals may be exposed to fresh, unweathered hydrocarbons, which may have greater potential for toxic impacts. Any direct impacts are expected to be sub-lethal; however, no impacts at the population level. Pelagic sharks and rays are expected to move away from areas affected by spilled hydrocarbons. Impacts to such species are expected to be limited to behavioural responses/displacement. Shark and ray species that have associations with submerged shoals and oceanic atolls may not move in response to such habitat being contacted by spilled hydrocarbons. Such species may be more susceptible to a reduction in habitat quality resulting from a hydrocarbon spill. Impacts to sharks and rays at Rankin Bank and Glomar Shoals are likely to be localised, as they are comparable to other Australian reefs and the NWMR submerged shoals and banks. It is expected that there will be no impacts at the population level.
Islands and Mainland (nearshore waters)
All Species The information provided on protected species in this section is in addition to that provided in the preceding Offshore and Oceanic Reefs and Submerged Banks and Shoals sections. Refer to these preceding sections for additional discussion of protected species.
Cetaceans and Dugongs In addition to a number of whale species that may occur in nearshore waters (such as spotted bottlenose dolphins, Indo-Pacific humpback dolphins and snubfin dolphins, refer to Section 4.3.4 for the full list of MNES cetacean species identified by the PMST search with potential to occur within the ZoC), coastal populations of small cetaceans and dugongs are known to reside or frequent nearshore waters, including the Ningaloo Coast, Muiron Islands, Montebello/Barrow/Lowendal Islands Group, Pilbara Southern and Northern Island Groups, Shark Bay, and a number of other nearshore and coastal locations (see Table 12-14) which may be potentially impacted by entrained and dissolved hydrocarbons exceeding threshold concentrations in the event of a loss of well containment. The loss of well containment scenarios' ZoCs for entrained and dissolved hydrocarbons extend past Shark Bay. This area is a known humpback whale resting area during their annual southern migration; therefore, humpbacks moving into these aggregations areas may be exposed to hydrocarbons above thresholds levels. Shark Bay is also known as critical dugong habitat. Hydrocarbons reaching the Shark Bay region are expected to be highly weathered (minimum time to entrained contact for Shark Bay WHA is 48.7 days), and only contact the outer reaches of the Shark Bay WHA (i.e. beyond known dugong habitat). The potential impacts of exposure are as discussed previously in Offshore – Cetaceans. However, nearshore populations of cetaceans and dugongs are known to exhibit site fidelity and are often resident populations. Therefore, avoidance behaviour may have greater impacts to population functioning. Nearshore dolphin species (e.g. spotted bottlenose dolphins) may exhibit higher site fidelity than oceanic species, although Geraci (1988) observed relatively little impacts beyond behavioural disturbance. Additional potential environment impacts may also include the potential for dugongs to ingest hydrocarbons when feeding on oiled seagrass stands, or indirect impacts to dugongs due to loss of this food source due to dieback in worse affected areas. Therefore, a hydrocarbon spill may have an impact on feeding habitats and result in a disruption to a significant portion of the local population, but due to the non-persistent nature of the hydrocarbon, it is not predicted to result in impacts on overall population viability of either dugongs or coastal cetaceans.
Marine Turtles Several marine turtle species utilise nearshore waters and shorelines for foraging and breeding (including internesting), with significant nesting beaches along the mainland coast and islands in potentially impacted locations such as the Ningaloo Coast, Muiron Islands, Montebello/Barrow/Lowendal Islands Group, Pilbara Islands (Northern and Southern Island Groups) and Shark Bay. There are distinct breeding seasons as detailed in Section 4.3.4. The nearshore waters of these turtle habitat areas may be exposed to entrained or dissolved hydrocarbons exceeding threshold concentrations, and accumulated hydrocarbons above threshold concentrations. The potential impacts of exposure are as discussed previously in Offshore – Marine Turtles. In the nearshore environment, turtles can ingest hydrocarbons when feeding or can be indirectly affected by loss of food source (e.g. seagrass due to dieback from hydrocarbon exposure) (Gagnon and Rawson 2010). Given shoreline accumulation of hydrocarbons above impact thresholds was not predicted to occur, oiling of nesting females on shorelines is not considered credible. During the breeding season, turtle aggregations near nesting beaches within the wider ZoC are most

Angel Operations Environment Plan Summary
This document is protected by copyright. No part of this document may be reproduced, adapted, transmitted, or stored in any form by any process (electronic or otherwise) without the specific written consent of Woodside. All rights are reserved.
Controlled Ref No: XX Revision: B Native file DRIMS No: 1400947213 Page 139 of 175
Uncontrolled when printed. Refer to electronic version for most up to date information.
vulnerable due to greater turtle densities, and potential impacts may occur at the population level and may impact on overall population viability of some marine turtle species. However, given the volatile nature of the hydrocarbons and low levels of shoreline accumulation predicted, population level impacts will not occur.
Sharks and Rays Whale sharks and manta rays are known to frequent the Ningaloo Reef system and the Muiron Islands (forming feeding aggregations in late summer/autumn). Whale sharks and manta rays generally transit along the nearshore coastline and are vulnerable to surface, entrained and dissolved aromatic hydrocarbon spill impacts, with both taxa having similar modes of feeding. Whale sharks are versatile feeders, filtering large amounts of water over their gills, catching planktonic and nektonic organisms (Jarman and Wilson 2004). Whale sharks at Ningaloo Reef have been observed using two different feeding strategies, including passive sub-surface ram-feeding and active surface feeding (Taylor 2007). Passive feeding consists of swimming slowly at the surface with the mouth wide open. During active feeding, sharks swim high in the water with the upper part of the body above the surface and the mouth partially open (Taylor 2007). These feeding methods would result in the potential for individuals that are present in worse affected spill areas to ingest potentially toxic amounts of entrained or dissolved aromatic hydrocarbons into their body. Large amounts of ingested hydrocarbons may affect their endocrine and immune system in the longer term. The presence of hydrocarbons may cause displacement of whale sharks from the area where they normally feed and rest, and potentially disrupt migration and aggregations to these areas in subsequent seasons. Whale sharks may also be affected indirectly by entrained or dissolved aromatic hydrocarbons through the contamination of their prey. The preferred food of whale sharks is planktonic organisms which are abundant in the coastal waters of Ningaloo Reef in late summer/autumn, driving the annual arrival and aggregation of whale sharks in this area. If the spill event were to occur during the spawning season, this important food supply (in worse spill affected areas of the reef) may be diminished or contaminated. The contamination of their food supply and the subsequent ingestion of this prey by the whale shark may also result in long term impacts as a result of bioaccumulation. There is the potential for other resident shark and ray (e.g. sawfish species identified in Section 4.3.4) populations to be impacted directly from hydrocarbon contact or indirectly through contaminated prey or loss of habitat. However, it is probable that shark species will move away from the affected areas, although sawfish may exhibit high habitat fidelity. Table 12-14 indicates the receptor locations predicted to be impacted from entrained and/or dissolved aromatic hydrocarbons to the benthic communities of nearshore, subtidal communities, and it is considered that there is the potential for habitat loss to occur. Shark populations displaced or no longer supported due to habitat loss would be expected to redistribute to other locations. Therefore, the consequences to resident shark and ray populations (if present) from loss of habitat may result in a disruption to a significant portion of the population; however, it is not expected to impact on the overall viability of the population.
Seabirds and/or Migratory Shorebirds In the event of a loss of well containment, there is the potential for seabirds, and resident/non-breeding overwintering shorebirds that use the nearshore waters for foraging and resting, to be exposed to entrained and dissolved hydrocarbons. This could result in lethal or sub-lethal effects. Although breeding oceanic seabird species can travel long distances to forage in offshore waters, most breeding seabirds tend to forage in nearshore waters near their breeding colony, resulting in intensive feeding by higher seabird densities in these areas during the breeding season and making these areas particularly sensitive in the event of a spill. Pathways of biological exposure that can result in impact may occur through ingestion of contaminated fish (nearshore waters) or invertebrates (intertidal foraging grounds such as beaches, mudflats and reefs). Ingestion can also lead to internal injury to sensitive membranes and organs (International Petroleum Industry Environmental Conservation Association (IPIECA) 2004). Whether the toxicity of ingested hydrocarbons is lethal or sub-lethal will depend on the weathering stage and its inherent toxicity (note the shortest entrained hydrocarbon time to contact with a shoreline is 12.8 days (Barrow Island)). Exposure to hydrocarbons may have longer term effects, with impacts to population numbers due to decline in reproductive performance and malformed eggs and chicks, affecting survivorship and loss of adult birds. Migratory shorebirds may be exposed to stranded hydrocarbon when foraging or resting in intertidal habitats; however, direct oiling is typically restricted to a relatively small portion of birds, and such oiling is typically restricted to the birds’ feet. Given the modelling results indicated shoreline accumulation above impact thresholds is not predicted to occur, the potential for impacts to migratory shorebirds by accumulated hydrocarbons on shorelines is considered to be very low. Important areas for foraging seabirds and migratory shorebirds are identified in Section 4.3.4. Refer to Table 12-14 for locations within the predicted extent of the ZoC that are identified as habitat for seabirds/migratory shorebirds.

Angel Operations Environment Plan Summary
This document is protected by copyright. No part of this document may be reproduced, adapted, transmitted, or stored in any form by any process (electronic or otherwise) without the specific written consent of Woodside. All rights are reserved.
Controlled Ref No: XX Revision: B Native file DRIMS No: 1400947213 Page 140 of 175
Uncontrolled when printed. Refer to electronic version for most up to date information.
Suitable habitat or seabirds and shorebirds are broadly distributed along the mainland and nearshore island coasts within the ZoC. Of note are important nesting areas, including:
• Muiron Islands • Ningaloo Coast • North West Cape • Montebello/Barrow/Lowendal Islands Group (including known nesting habitats on Boodie, Double
and Middle Islands) • Pilbara Islands North, Middle and South Island Group • Shark Bay • Abrolhos Islands.
Therefore, a hydrocarbon spill may result in impacts on key feeding habitat and a disruption to a significant portion of the habitat; however, this is not expected to result in a threat to the overall population viability of seabirds or shorebirds.
Summary of potential impacts to other species
Setting Receptor Group All Settings Pelagic and Demersal Fish
Fish mortalities are rarely observed to occur as a result of hydrocarbon spills (International Tanker Owners Pollution Federation 2011b). This has generally been attributed to the possibility that pelagic fish are able to detect and avoid surface waters underneath hydrocarbon spills by swimming into deeper water or away from the affected areas. Fish that have been exposed to dissolved aromatic hydrocarbons are capable of eliminating the toxicants once placed in clean water, hence individuals exposed to a spill are likely to recover (King et al. 1996). Where fish mortalities have been recorded, the spills (resulting from the groundings of the tankers Amoco Cadiz in 1978 and the Florida in 1969) have occurred in sheltered bays. Laboratory studies have shown that adult fish are able to detect hydrocarbons in water at very low concentrations, and large numbers of dead fish have rarely been reported after oil spills (Hjermann et al. 2007). This suggests juvenile and adult fish are capable of avoiding water contaminated with high concentrations of hydrocarbons. However, sub-lethal impacts to adult and juvenile fish may be possible, given long-term exposure (days to weeks) to PAH concentrations (Hjermann et al. 2007). While modelling of the loss of well containment indicates the potential ZoC for dissolved hydrocarbons is extensive, no time-integrated exposure metrics were modelled; given the oceanographic environment within the wider ZoC, PAH exposures in the order of weeks for pelagic fish are not considered credible. The effects of exposure to oil on the metabolism of fish appear to vary according to the organs involved, exposure concentrations and route of exposure (waterborne or food intake). Oil reduces the aerobic capacity of fish exposed to aromatics in the water, and to a lesser extent affects fish consuming contaminated food (Cohen et al. 2005). The liver, a major detoxification organ, appears to be the organ where anaerobic activity is most impacted, probably increasing anaerobic activity to facilitate the elimination of ingested oil from the fish (Cohen et al. 2005). Fish are perhaps most susceptible to the effects of spilled oil in their early life stages, particularly during egg and planktonic larval stages, which can become entrained in spilled oil. Contact with oil droplets can mechanically damage feeding and breathing apparatus of embryos and larvae (Fodrie and Heck 2011). The toxic hydrocarbons in water can result in genetic damage, physical deformities and altered developmental timing for larvae and eggs exposed to even low concentrations over prolonged timeframes (days to weeks) (Fodrie and Heck 2011).More subtle, chronic effects on the life history of fish as a result of exposure of early life stages to hydrocarbons include disruption to complex behaviours such as predator avoidance, reproductive and social behaviour (Hjermann et al. 2007). Prolonged exposure of eggs and larvae to weathered concentrations of hydrocarbons in water has also been shown to cause immunosuppression and allows expression of viral diseases (Hjermann et al. 2007). PAHs have also been linked to increased mortality and stunted growth rates of early life history (pre-settlement) of reef fishes, as well as behavioural impacts that may increase predation of post-settlement larvae (Johansen et al. 2017). However, the effect of a hydrocarbon spill on a population of fish in an area with fish larvae and/or eggs, and the extent to which any of the adverse impacts may occur, depends greatly on prevailing oceanographic and ecological conditions at the time of the spill and its contact with fish eggs or larvae. Demersal fish species are associated with both the Glomar Shoals and Ancient Coastline at 125 m Depth Contour KEFs which overlap the Operational Area and provide habitat for demersal fish species. Rankin Bank (approximately 54 km from the Operational Area) also hosts a diverse demersal fish assemblage. In addition, the ZoC extends over the Continental Slope Demersal Fish Communities KEF. Fish associated with these features may be exposed to dissolved and entrained hydrocarbons above
Angel Operations Environment Plan Summary
This document is protected by copyright. No part of this document may be reproduced, adapted, transmitted, or stored in any form by any process (electronic or otherwise) without the specific written consent of Woodside. All rights are reserved.
Controlled Ref No: XX Revision: B Native file DRIMS No: 1400947213 Page 141 of 175
Uncontrolled when printed. Refer to electronic version for most up to date information.
impact thresholds. Mortality and sub-lethal effects may impact populations located close to the well blowout and within the ZoC for entrained/dissolved aromatic hydrocarbons (≥ 500 ppb). Additionally, if prey (infauna and epifauna) surrounding the well location and within the ZoC is contaminated, this can result in the absorption of toxic components of the hydrocarbons (PAHs) potentially impacting fish populations that feed on these. These impacts may result in localised medium/long term impacts on demersal fish habitat (e.g. seafloor).
Summary of Potential Impacts to Marine Primary Producers
Setting Receptor Group Oceanic Reef and Offshore Islands Submerged Shoals
The waters overlying Glomar Shoals have the potential to be exposed to entrained and dissolved hydrocarbons above threshold concentrations (> 500 ppb) within a relatively short space of time after a loss of well containment (< one day). This permanently submerged habitat represents sensitive oceanic reef benthic community receptors, extending from deep depths to relatively shallow water. Given the depth of Glomar Shoals, it is likely the potential for biological impact is reduced when compared to the upper water column layers. However, contact at or above entrained and dissolved thresholds is predicted based on modelling resulting in potential biological impacts including sub-lethal stress, and in some instances total or partial mortality of sensitive benthic organisms such as corals and the early life stages of resident fish and invertebrate species. Other submerged shoals and banks within the wider ZoC (e.g. Rankin Bank) are also predicted to be exposed to entrained or dissolved hydrocarbons above threshold concentrations, but with longer times to contact (and hence, greater potential for hydrocarbon weathering) and therefore impacts are expected to be less.
Mainland and Islands (nearshore waters)
Coral Reef The quantitative spill risk assessment and ZoC indicate there would be potential for coral reef habitat to be exposed to dissolved and entrained hydrocarbons. There would be potential for entrained and dissolved hydrocarbons above threshold concentrations to reach reef habitat along the Ningaloo Coast and at identified offshore islands and coastline (see Table 12-14) such as the Muiron Islands, Montebello/Barrow/Lowendal Islands Group, Pilbara Islands (North, Middle and Southern), Shark Bay and Abrolhos Islands. The shallow coral habitats are most vulnerable to hydrocarbon coating by direct contact with surface slicks during periods when corals are tidally-exposed at spring low tides; such slicks are not expected to form in the event of a loss of well containment for the Petroleum Activities Program due to the nature of the hydrocarbon. Water soluble hydrocarbon fractions associated with surface slicks are also known to cause high coral mortality (Shigenaka 2001) via direct physical contact of hydrocarbon droplets to sensitive coral species (such as the branching coral species). Note, the dissolved ZoC for a loss of well containment may reach a number of coral receptors (Table 12-14). There is significant potential for lethal impacts due to the physical hydrocarbon coating of sessile benthos (e.g. by entrained hydrocarbons), with likely significant mortality of corals (adults, juveniles and established recruits) at the small spill affected areas. This particularly applies to branching corals which are reported to be more sensitive than massive corals (Shigenaka 2001). Exposure to entrained hydrocarbons/dissolved aromatic hydrocarbons (≥ 500 ppb) has the potential to result in lethal or sub-lethal toxic effects to corals and other sensitive sessile benthos within the upper water column, including upper reef slopes (subtidal corals), reef flat (intertidal corals) and lagoonal (back reef) coral communities (with reference to Ningaloo Coast). Mortality in a number of coral species is possible, and would result in the reduction of coral cover and change in the composition of coral communities. Sub-lethal effects to corals may include polyp retraction, changes in feeding, bleaching (loss of zooxanthellae) and increased mucous production, resulting in reduced growth rates and impaired reproduction (Negri and Heyward 2000). This could result in impacts to the shallow water fringing coral communities/reefs of the offshore islands (e.g. Muiron Islands, Barrow/Montebello/Lowendal Islands, Pilbara Southern and Northern Island Groups and Abrolhos Islands) and also the mainland coast (e.g. Ningaloo Coast and Shark Bay). With reference to Ningaloo Reef, wave-induced water circulation flushes the lagoon and may promote removal of entrained and dissolved hydrocarbons from this particular reef habitat. Under typical conditions, breaking waves on the reef crest induce a rise in water level in the lagoon creating a pressure gradient that drives water in a strong outward flow through channels. In the unlikely event of a spill occurring at the time of coral spawning at potentially affected coral locations, or in the general peak period of biological productivity, there is the potential for a significant reduction in successful fertilisation and coral larval survival due to the sensitivity of coral early life stages to hydrocarbons (Negri and Heyward 2000). Such impacts are likely to result in the failure of recruitment and settlement of new population cohorts. In addition, some non-coral species may be affected via direct contact with entrained and dissolved aromatic hydrocarbons, resulting in sub-lethal impacts and in some cases mortality. This is with particular reference to the early lifestages of coral reef animals (reef attached fishes and reef invertebrates), which can be relatively sensitive to hydrocarbon exposure. Coral

Angel Operations Environment Plan Summary
This document is protected by copyright. No part of this document may be reproduced, adapted, transmitted, or stored in any form by any process (electronic or otherwise) without the specific written consent of Woodside. All rights are reserved.
Controlled Ref No: XX Revision: B Native file DRIMS No: 1400947213 Page 142 of 175
Uncontrolled when printed. Refer to electronic version for most up to date information.
reef fish are site-attached, have small home ranges, and as reef residents they are at higher risk from hydrocarbon exposure than non-resident, more wide-ranging fish species. The exact impact on resident coral communities (which may include fringing reefs of the offshore islands and/or the Ningaloo Reef system) will be entirely dependent on actual hydrocarbon concentration, duration of exposure and water depth of the affected communities. Over the worst affected sections of reef habitat, coral community live cover, structure and composition is predicted to reduce, manifested by loss of corals and associated sessile biota. Recovery of these impacted reef areas typically relies on coral larvae from neighbouring coral communities that have either not been affected or only partially impacted. For example, there is evidence that Ningaloo Reef corals and fish are partly self-seeding (Underwood 2009), with the supply of larvae from locations within Ningaloo Reef of critical importance to the healthy maintenance of the coral communities. Recovery at other coral reef areas, may not be aided by a large supply of larvae from other reefs, with levels of recruits after a disturbance event only returning to previous levels after the numbers of reproductive corals had also recovered (Gilmour et al. 2013). Therefore, a hydrocarbon spill may result in large-scale impacts to coral reefs, particularly Ningaloo Reef, with long-term effects (recovery > ten years) likely.
Seagrass Beds/Macroalgae and Mangroves Spill modelling has predicted entrained and dissolved hydrocarbons above threshold concentrations have the potential to contact a number of shoreline sensitive receptors, such as those supporting biologically diverse, shallow subtidal and intertidal communities. The variety of habitat and community types, from the upper subtidal to the intertidal zones, support a high diversity of marine life and are utilised as important foraging and nursery grounds by a range of invertebrate and vertebrate species. Depending on the trajectory of the entrained and dissolved hydrocarbon plume, macroalgal/seagrass communities including the Ningaloo Coast (patchy and low cover associated with the shallow limestone lagoonal platforms), Muiron Islands (associated with limestone pavements), the Barrow/Montebello/Lowendal Islands, Shark Bay, the Pilbara Island Groups and the Abrolhos Islands have the potential to be exposed (see Table 12-14 for a full list of receptors within the ZoC). Seagrass in the subtidal and intertidal zones have different degrees of exposure to hydrocarbon spills. Subtidal seagrass is generally considered much less vulnerable to hydrocarbon spills than intertidal seagrass, primarily because freshly spilled hydrocarbons, including crude oil, float under most circumstances. Dean et al. (1998) found that oil mainly affects flowering; therefore, species that are able to spread through apical meristem growth are not as affected (such as Zostera, Halodule and Halophila species). Seagrass and macroalgal beds occurring in the intertidal and subtidal zone may be susceptible to impacts from entrained hydrocarbons. Toxicity effects can also occur due to absorption of soluble fractions of hydrocarbons into tissues (Runcie et al. 2010). The potential for toxicity effects of entrained hydrocarbons may be reduced by weathering processes that should serve to lower the content of soluble aromatic components before contact occurs. Minimum time to contact with receptors that may host seagrasses is 12.8 days (Barrow Island); minimum time to contact with Shark Bay (which hosts ecologically significant seagrass communities) is 48.7 days. As such, hydrocarbons released in the event of a loss of well containment are expected to be weathered prior to any credible contact with seagrasses. Exposure to entrained aromatic hydrocarbons may result in mortality, depending on actual entrained aromatic hydrocarbon concentration received and duration of exposure. Physical contact with entrained hydrocarbon droplets could cause sub-lethal stress, causing reduced growth rates and a reduction in tolerance to other stress factors (Zieman et al. 1984). Impacts on seagrass and macroalgal communities are likely to occur in areas where hydrocarbon threshold concentrations are exceeded. Mangroves and associated mud flats and salt marsh at Ningaloo Coast (small habitat areas) and the Montebello Islands have the potential to be exposed to entrained hydrocarbons (see Table 12-14 for the full list of receptors). Hydrocarbons coating prop roots of mangroves can occur from entrained hydrocarbons, when hydrocarbons are deposited on the aerial roots. Hydrocarbons deposited on the aerial roots can block the pores used to breathe or interfere with the trees’ salt balance, resulting in sub-lethal and potentially lethal effects. Mangroves can also be impacted by entrained/dissolved aromatic hydrocarbons that may adhere to the sediment particles. In low energy environments, such as in mangroves, deposited sediment-bound hydrocarbons are unlikely to be removed naturally by wave action and may be deposited in layers by successive tides (NOAA 2014). Given the non-persistent nature of the hydrocarbons, no significant effects to mangroves are expected to occur. Entrained/dissolved hydrocarbon impacts may include sub-lethal stress and mortality to certain sensitive biota in these habitats, including infauna and epifauna. Larval and juvenile fish, and invertebrates that depend on these shallow subtidal and intertidal habitats as nursery areas, may be directly impacted due to the loss of habitats and/or lethal and sub-lethal in-water toxic effects. This may result in mortality or impairment of growth, survival and reproduction (Heintz et al. 2000). In addition, there is the potential for secondary impacts on shorebirds, fish, sea turtles, rays and crustaceans that utilise these intertidal

Angel Operations Environment Plan Summary
This document is protected by copyright. No part of this document may be reproduced, adapted, transmitted, or stored in any form by any process (electronic or otherwise) without the specific written consent of Woodside. All rights are reserved.
Controlled Ref No: XX Revision: B Native file DRIMS No: 1400947213 Page 143 of 175
Uncontrolled when printed. Refer to electronic version for most up to date information.
habitat areas for breeding, feeding and nursery habitat purposes.
Summary of Potential Impacts to other Habitats and Communities
Setting Receptor Group Offshore Benthic Fauna Communities
In a loss of well containment at the seabed, the stochastic spill model predicted hydrocarbons droplets would be entrained in a gas plume, transporting them to the water column and sea surface. As a result, the low sensitivity benthic communities associated with the unconsolidated, soft sediment habitat and any epifauna (filter feeders) within and outside the Operational Area are not expected to be exposed to released hydrocarbons. A localised area relating to the hydrocarbon plume at the point of release is predicted, which would result in a small area of seabed and associated epifauna and infauna exposed to hydrocarbons.
Open Water – Productivity/Upwelling Primary production by plankton (supported by sporadic upwelling events in the offshore waters of the NWS) is an important component of the primary marine food web. Planktonic communities are generally mixed, including phytoplankton (cyanobacteria and other microalgae) and secondary consuming zooplankton, such as crustaceans (e.g. copepods), and the eggs and larvae of fish and invertebrates (meroplankton). Exposure to hydrocarbons in the water column can result in changes in species composition, with declines or increases in one or more species or taxonomic groups (Batten et al. 1998). Phytoplankton may also experience decreased rates of photosynthesis (Tomajka 1985). For zooplankton, direct effects of contamination may include toxicity, suffocation, changes in behaviour, or environmental changes that make them more susceptible to predation. Impacts on plankton communities are likely to occur in areas where entrained or dissolved aromatic hydrocarbon threshold concentrations are exceeded, but communities are expected to recover relatively quickly (within weeks or months). This is due to high population turnover with copious production within short generation times that also buffers the potential for long-term (i.e. years) population declines (International Tanker Owners Pollution Federation 2011a). Therefore, impacts on exposed planktonic communities present in the ZoC are likely to be short-term.
Islands and Mainland (Nearshore Waters)
Open Water – Productivity/Upwelling Nearshore waters and adjacent offshore waters surrounding the offshore islands (e.g. Barrow and Montebello Islands) and to the west of the Ningaloo Reef system are known locations of seasonal upwelling events and productivity. The seasonal productivity events are critical to krill production, which supports megafauna aggregations such as whale sharks and manta rays in the region. This has the potential to result in lethal and sub-lethal impacts to a certain portion of plankton in affected areas, depending on concentration and duration of exposure and the inherent toxicity of the hydrocarbon. However, recovery would occur (see Offshore description above). Therefore, any impacts are likely to be on exposed planktonic communities present in the ZoC, and temporary in nature.
Spawning/Nursery Areas Fish (and other commercially targeted taxa) in their early life stages (eggs, larvae and juveniles) are at their most vulnerable to lethal and sub-lethal impacts from exposure to hydrocarbons, particularly if a spill coincides with spawning seasons or if a spill reaches nursery areas close to the shore (e.g. seagrass and mangroves) (International Tanker Owners Pollution Federation 2011b). Fish spawning (including for commercially targeted species) occurs in nearshore waters at certain times of the year; nearshore waters are also inhabited by higher numbers of juvenile fishes than offshore waters. Modelling indicated that in the unlikely event of a major spill, there is potential for entrained hydrocarbons to occur in the surface water layers above threshold concentrations in nearshore waters, including but not limited to the Ningaloo Coast and Shark Bay. This, and the potential for possible lower concentration exposure for dissolved aromatic hydrocarbons, has the potential to result in lethal and sub-lethal impacts to a certain portion of fish larvae in affected areas, depending on concentration and duration of exposure and the inherent toxicity of the hydrocarbon. Although there is the potential for spawning/nursery habitat to be impacted (e.g. mangroves and seagrass beds, discussed above), losses of fish larvae in worst affected areas are unlikely to be of major consequence to fish stocks compared with significantly larger losses through natural predation, and the likelihood that most nearshore areas would be exposed is low (i.e. not all areas in the region would be affected). This is consistent with a recent study in the Gulf of Mexico which used juvenile abundance data, from shallow-water seagrass meadows, as indices of the acute, population-level responses of young fishes to the Deepwater Horizon spill (Fodrie and Heck 2011). Results indicated there was no change to the juvenile cohorts following the Deepwater Horizon spill. Additionally, there were no significant post-spill shifts in community composition and structure, nor were there changes in biodiversity measures (Fodrie and Heck 2011). Any impacts to spawning and nursery areas are expected to be minor and short term, as would flow-on effects to adult fish stocks into

Angel Operations Environment Plan Summary
This document is protected by copyright. No part of this document may be reproduced, adapted, transmitted, or stored in any form by any process (electronic or otherwise) without the specific written consent of Woodside. All rights are reserved.
Controlled Ref No: XX Revision: B Native file DRIMS No: 1400947213 Page 144 of 175
Uncontrolled when printed. Refer to electronic version for most up to date information.
which larvae are recruited.
Reefs The reef communities fringing the offshore Ningaloo Coast region may be exposed to entrained hydrocarbons (> 500 ppb) and consequently exhibit lethal or sub-lethal impacts resulting in partial or total mortality of keystone sessile benthos, particularly hard corals, thus potential community structural changes to these shallow, nearshore benthic communities may occur. In the event these reefs are exposed to entrained hydrocarbons, impacts are expected to result in localised long-term effects.
Filter Feeders Hydrocarbon exposure to offshore, filter-feeding communities (e.g. deepwater communities of Ningaloo Coast in 20–200 m) may occur depending on the depth of the entrained and dissolved aromatic hydrocarbons. See discussion above on potential impacts.
Sandy Shores/Estuaries/Tributaries/Creeks (including Mudflats)/Rocky Shores Shoreline exposure for the upper and lower areas differ; the shore has the potential to be exposed to dissolved or entrained hydrocarbon. Potential impacts may occur due to hydrocarbon contact with intertidal areas, including sandy shores, mudflats and rocky shores, listed in Table 12-14. Hydrocarbon at sandy shores is incorporated into fine sediments through mixing in the surface layers from wave energy, penetration down worm burrows and root pores. Hydrocarbon in the intertidal zone can adhere to sand particles; however, high tide may remove some or most of the hydrocarbon back out of the sediments. Typically, hydrocarbon is only incorporated into the surface layers to a maximum of 10 cm. As described earlier, accumulated hydrocarbons ≥ 100 g/m2 could impact the survival and reproductive capacity of benthic epifaunal invertebrates living in intertidal habitat (French-McCay 2009). Note that shoreline accumulation above impact thresholds was identified as potentially occurring at Barrow/Montebello/Lowendal Islands Group. Given the hydrocarbons are non-persistent, long-term impacts to shores are not expected. The impact of hydrocarbon on rocky shores will be largely dependent on the incline and energy environment. On steep/vertical rock faces on wave exposed coasts, there is likely to be no impact from a spill event. However, a gradually sloping boulder shore in calm water can potentially trap large amounts of hydrocarbon (IPIECA 2000). The impact of the spill on marine organisms along the rocky coast will be dependent on the toxicity and weathering of the hydrocarbon. Similar to sandy shores, accumulated hydrocarbons ≥ 100 g/m2 could coat the epifauna along rocky coasts and impact the reproductive capacity and survival. The location of rocky shores where impacts are predicted are at Barrow/Montebello/Lowendal Islands Group. Intertidal mudflats are susceptible to potential impacts from hydrocarbons, as they are typically low energy environments and therefore trap hydrocarbons. The extent of oiling is influenced by the neap and spring tidal cycle and seasonal highs and lows affecting mean sea level. Potential impacts to tidal flats include heavy accumulations covering the flat at low tide; however, it is unlikely hydrocarbon will penetrate the water-saturated sediments. However, hydrocarbon can penetrate sediments through animal burrows and root pores. It has been demonstrated that infaunal burrows allow hydrocarbon to contaminate subsurface sediments where it can be retained for months. Potential impacts may occur due to entrained contact with shallow, subtidal and intertidal zones of the Ningaloo Coast, and shoreline accumulation at Barrow Island, Montebello Islands and the Muiron Islands. In-water toxicity of the dissolved and entrained hydrocarbons reaching these shores will determine impacts to the marine biota such as sessile barnacle species and/or mobile gastropods and crustaceans such as amphipods. Lethal and sub-lethal impacts may be expected where the entrained hydrocarbon concentration threshold is > 500 ppb. Impacts may result in localised changes to the community structure of these shoreline habitats, which would be expected to recover in the medium term (two to five years).
Key Ecological Features
Key Ecological Features The KEFs potentially impacted by the hydrocarbon spill from a loss of well containment event are:
• Glomar Shoals • Ancient Coastline at 125 m Depth Contour • Continental Slope Demersal Fish Communities • Exmouth Plateau • Canyons linking the Cuvier Abyssal Plain and the Cape Range Peninsula • Mermaid Reef and Commonwealth waters surrounding Rowley Shoals • Commonwealth waters adjacent to Ningaloo Reef

Angel Operations Environment Plan Summary
This document is protected by copyright. No part of this document may be reproduced, adapted, transmitted, or stored in any form by any process (electronic or otherwise) without the specific written consent of Woodside. All rights are reserved.
Controlled Ref No: XX Revision: B Native file DRIMS No: 1400947213 Page 145 of 175
Uncontrolled when printed. Refer to electronic version for most up to date information.
• Western Demersal Slope and associated fish communities • Western Rock Lobster • Ancient Coastline at 90-120 m depth • Commonwealth marine environment surrounding the Houtman Abrolhos Islands.
Although these KEFs are primarily defined by seabed geomorphological features, they are described to identify the potential for increased biological productivity and, therefore, ecological significance. The consequences of a hydrocarbon spill from a loss of well containment may impact the values of the KEFs affected. Potential impacts include the contamination of sediments, impacts to benthic fauna/habitats, and associated impacts to demersal fish populations and reduced biodiversity as described above and below. Most of the KEFs within the ZoC have relatively broad-scale distributions and are unlikely to be significantly impacted.
Summary of Potential Impacts to Water Quality
Setting Aspect Offshore and Mainland and Islands (Nearshore waters)
Open Water – Water Quality Water quality would be affected due to hydrocarbon contamination which is described in terms of the biological effect concentrations. These are defined by the ZoC descriptions for each of the entrained and dissolved hydrocarbon fates and their predicted extent. Furthermore, water quality is predicted to have minor long term and/or significant short term hydrocarbon contamination compared to background water quality.
Summary of Potential Impacts to Marine Sediment Quality
Setting Receptor Group Offshore Marine Sediment Quality
Studies of hydrocarbon concentrations in deep sea sediments in the vicinity of a catastrophic well blowout indicated hydrocarbon from the blowouts can be incorporated into sediments (Romero et al. 2015). Proposed mechanisms for hydrocarbon contamination of sediments include sedimentation of hydrocarbons and direct contact between submerged plumes and the seabed (Romero et al. 2015). In the event of a major hydrocarbon release at the seabed, modelling indicates a pressurised release of condensate would atomise into droplets that would be transported into the water column to the surface. As a result, the extent of potential impacts to the seabed area at and surrounding the release site would be confined to a localised footprint. Marine sediment quality would be reduced as a consequence of hydrocarbon contamination for a small area within the immediate release site for a long to medium term.
Mainland and Islands (Nearshore waters)
Marine Sediment Quality Entrained and dissolved hydrocarbons (at or above the defined thresholds) are predicted to potentially contact shallow, nearshore waters of identified islands and mainland coastlines, and hydrocarbons may accumulate (at or above the ecological threshold) at a range of nearshore receptors (refer to Table 12-14). Such hydrocarbon contact may lead to reduced marine sediment quality by several processes, such as adherence to sediment and deposition shores or seabed habitat.
Summary of Potential Impacts to Air Quality A hydrocarbon release during a loss of well containment has the potential to result in localised, temporary reduction in air quality, and contribution of greenhouse gases to the global concentration of these gases in the atmosphere. Potential impacts are expected to be minor and short-term, predominantly localised adverse effects to air quality in the area. There is potential for human health effects for workers in the immediate vicinity of atmospheric emissions. The ambient concentrations of methane and VOCs released from diffuse sources are difficult to accurately quantify, although their behaviour and fate are predictable in open offshore environments as they are dispersed rapidly by meteorological factors such as wind and temperature. Methane and VOC emissions from a hydrocarbon release in such environments are rapidly degraded in the atmosphere by reaction with photochemically-produced hydroxyl radicals. Due to the unlikely occurrence of a loss of well containment; the temporary nature of any methane or VOC emissions (from either gas surfacing or weathering of liquid hydrocarbons from a loss of well containment), the predicted behaviour and fate of methane and VOCs in open offshore environments, and the significant distance from the Operational Area to the nearest sensitive air shed (town of Dampier approximately 125 km away), the potential impacts are expected to be minor and short-term.
Summary of Potential Impacts to Protected Areas The quantitative spill risk assessment results indicate that the open water environment protected within the Commonwealth marine parks listed in Table 12-14 may be affected by the released hydrocarbons. In the unlikely event

Angel Operations Environment Plan Summary
This document is protected by copyright. No part of this document may be reproduced, adapted, transmitted, or stored in any form by any process (electronic or otherwise) without the specific written consent of Woodside. All rights are reserved.
Controlled Ref No: XX Revision: B Native file DRIMS No: 1400947213 Page 146 of 175
Uncontrolled when printed. Refer to electronic version for most up to date information.
of a major spill, entrained hydrocarbons and/or dissolved hydrocarbons may contact the identified key receptor locations of islands and mainland coastlines, resulting in the actual or perceived contamination of protected areas as identified for the ZoC (refer to Table 12-14). Objectives in the Ningaloo Marine Park (Commonwealth Waters) Management Plan and the Management Plan for the Ningaloo Marine Park and Muiron Islands Marine Management Area require considerations to a number of physical, ecological and social values identified in these areas. Impact on the values of this protected area is discussed in the relevant sections above for ecological and physical (water quality) values, and below for social (socio-economic) values. Impact on the protected areas is discussed in the sections above for the ecological values and sensitivities, and below for socio-economic values. Additionally, such hydrocarbon contact may alter stakeholder understanding and/or perception of the protected marine environment, given it represents areas largely unaffected by anthropogenic influences and contains biologically diverse environments.
Summary of Potential Impacts to Socio-economic Values
Setting Receptor Group Offshore Fisheries – Commercial
Spill scenarios modelled are unlikely to cause significant direct impacts on the target species of Commonwealth and offshore State fisheries within the defined ZoC. Further details are provided below (impact assessment relating to spawning is discussed above under ‘Summary of potential impacts to other habitats and communities’). Fish exposure to hydrocarbon can result in ‘tainting’ of their tissues. Even very low levels of hydrocarbons can impart a taint or ‘off’ flavour or smell in seafood. Tainting is reversible through the process of depuration which removes hydrocarbons from tissues by metabolic processes, although it is dependent upon the magnitude of the hydrocarbon contamination. Fish have a high capacity to metabolise these hydrocarbons, while crustaceans (such as prawns) have a reduced ability (Yender et al. 2002). Seafood safety is a major concern associated with spill incidents. Therefore, actual or potential contamination of seafood can affect commercial and recreational fishing, and can impact seafood markets long after any actual risk to seafood from a spill has subsided (Yender et al. 2002). A major spill would result in the establishment of a Petroleum Safety Zone around the spill-affected area. There would be a temporary prohibition on fishing activities for a period of time, and subsequent potential for economic impacts to affected commercial fishing operators. Additionally, hydrocarbon can foul fishing equipment such as traps and trawl nets, requiring cleaning or replacement.
Tourism including Recreational Activities Recreational fishers predominantly target tropical species, such as emperor, snapper, grouper, mackerel, trevally and other game fish. Recreational angling activities include shore-based fishing, private boat and charter boat fishing, with the peak in activity between April and October (Smallwood et al. 2011). Limited recreational fishing takes place in the offshore waters of the Operational Area due to the distance from shore; however, fishing may take place at Rankin Bank and Glomar Shoals. Impacts on species that are recreationally fished are described above and under ‘Summary of potential impacts to other species’ above. A major loss of hydrocarbon from the Petroleum Activities Program may lead to exclusion of marine nature-based tourist activities, resulting in a loss of revenue for operators.
Offshore Oil and Gas Infrastructure In the unlikely event of a major spill, surface hydrocarbons may affect production from existing petroleum facilities (platforms and FPSOs). For example, facility water intakes for cooling and fire hydrants could be shut off, which could in turn lead to the temporary cessation of production activities. Spill exclusion zones established to manage the spill could also prohibit activity support vessel access as well as tankers approaching facilities on the NWS. The impact on ongoing operations of regional production facilities would be determined by the nature and scale of the spill and metocean conditions. Furthermore, decisions on the operation of production facilities in the event of a spill would be based primarily on health and safety considerations. The closest oil and gas operation is the NRC platform (operated by Woodside), which lies within the Operational Area. Other nearby facilities include the Modec Venture 11 FPSO and GWA platform. Operation of these facilities is likely to be affected in the event of a worst-case loss of well containment.
Mainland and Islands (Nearshore Waters)
Fisheries – Commercial Nearshore Fisheries and Aquaculture In the unlikely event of a loss of well containment, there is the possibility that target species in some areas utilised by a number of state fisheries in nearshore waters of the Ningaloo Coast and Shark Bay, and aquarium fisheries and aquaculture activities in the nearshore waters that are within the ZoC, could be affected. Targeted fish resources could experience sub-lethal stress, or in some instances, mortality

Angel Operations Environment Plan Summary
This document is protected by copyright. No part of this document may be reproduced, adapted, transmitted, or stored in any form by any process (electronic or otherwise) without the specific written consent of Woodside. All rights are reserved.
Controlled Ref No: XX Revision: B Native file DRIMS No: 1400947213 Page 147 of 175
Uncontrolled when printed. Refer to electronic version for most up to date information.
depending on the concentration and duration of hydrocarbon exposure and its inherent toxicity. Prawn Managed Fisheries In the event of a major spill, the modelling indicated the entrained ZoC may extend to nearshore waters closest to the mainland coasts, including the actively fished areas of the designated Shark Bay Prawn and Scallop Managed Fishery. Prawn habitat utilisation differs between species in the post-larval, juvenile and adult stages (Dall et al. 1990), and direct impacts to benthic habitat due to a major spill hace the potential to impact prawn stocks. For example, juvenile banana prawns are found almost exclusively in mangrove-lined creeks, whereas juvenile tiger prawns are most abundant in areas of seagrass (Masel and Smallwood 2000). Adult prawns also inhabit coastline areas but tend to move to deeper waters to spawn. In the event of a major spill, the model predicted shallow subtidal and intertidal habitats at the Ningaloo Coast, and mangrove and seagrass habitats of the Ningaloo Coast are located within the ZoC and could be exposed to hydrocarbon concentrations above threshold concentrations, depending on the trajectory of the plume. Localised loss of juvenile prawns in worse spill affected areas is possible. Whether lethal or sub-lethal effects occur will depend on duration of exposure, hydrocarbon concentration, weathering stage of the hydrocarbon and its inherent toxicity. Furthermore, seafood consumption safety concerns and a temporary prohibition on fishing activities may lead to subsequent potential for economic impacts to affected commercial fishing operators.
Fisheries – Traditional Although no designated traditional fisheries have been identified it is recognised that Indigenous communities fish in the shallow coastal and nearshore waters of Ningaloo Reef, and therefore, may be potentially impacted if a hydrocarbon spill from a loss of well containment were to occur. Impacts would be similar to those identified for commercial fishing in the form of a potential Petroleum Safety Zone and contamination/tainting of fish stocks.
Tourism and Recreation In the unlikely event of a major spill, the nearshore waters of the Ningaloo Coast could be reached by entrained hydrocarbon, depending on prevailing wind and current conditions. This location offers a number of amenities such as fishing, swimming and utilisation of beaches and surrounds, which have a recreational value for local residents and visitors (regional, national and international). If a major spill resulted in hydrocarbon contact, there could be restricted access to beaches for a period of days to weeks, until natural weathering or tides and currents remove the hydrocarbons. In the event of a major spill, tourists and recreational users may also avoid areas due to perceived impacts, including after the hydrocarbon spill has dispersed. There is potential for stakeholder perception that this remote environment will be contaminated over a large area and for the longer term, resulting in a prolonged period of tourism decline. Oxford Economics (2010) assessed the duration of hydrocarbon spill related tourism impacts and found that, on average, it took 12 to 28 months to return to baseline visitor spending. There is likely to be significant impacts to the tourism industry, wider service industry (hotels, restaurants and their supply chain) and local communities in terms of economic loss as a result of spill impacts to tourism. Recovery and return of tourism to pre-spill levels will depend on the size of the spill, effectiveness of the spill clean-up, and change in any public misconceptions regarding the spill (Oxford Economics 2010).
Cultural Heritage There are a number of historic shipwrecks identified in the vicinity of the Operational Area. Shipwrecks occurring in the subtidal zone will be exposed to entrained and dissolved hydrocarbons, and marine life that shelter and take refuge in and around these wrecks may be affected by in-water toxicity of dispersed hydrocarbons. The consequences of such hydrocarbon exposure may include all or some of the following:
• large fish species moving away, and/or • resident fish species and sessile benthos such as hard corals exhibiting sub-lethal and lethal
impacts (which may range from physiological issues to mortality). Entrained hydrocarbons above threshold concentrations (> 500 g/m2) are predicted at Ningaloo Coast. It is acknowledged that the area contains numerous Aboriginal sites such as burial grounds, middens and fish traps that provide a historical account of the early habitation of the area, and a tangible part of the culture of local Aboriginal groups. Additionally, artefacts, scatter and rock shelter are contained on Barrow and Montebello islands (no contact by surface hydrocarbons or accumulated hydrocarbons predicted for these areas). Within the wider ZoC a number of places are designated World, National and Commonwealth Heritage places (Section 4.4. These places are also covered by other designations such as WHA, marine parks and listed shipwrecks. Potential impacts have therefore been discussed in the sections above.

Angel Operations Environment Plan Summary
This document is protected by copyright. No part of this document may be reproduced, adapted, transmitted, or stored in any form by any process (electronic or otherwise) without the specific written consent of Woodside. All rights are reserved.
Controlled Ref No: XX Revision: B Native file DRIMS No: 1400947213 Page 148 of 175
Uncontrolled when printed. Refer to electronic version for most up to date information.
Summary of Control Measures • Maintaining well and hydrocarbon-containing infrastructure integrity to contain reservoir fluids within the well
envelope to avoid an MEE. Integrity will be managed in accordance with SCE Management Procedure and SCE technical Performance Standards to prevent environment risk related damage to SCEs for:
o P10 – Wells; o P28 – Sand Management System
• Maintaining availability of external and internal communication systems to facilitate response to accidents and emergencies. Integrity will be managed in accordance with SCE Management Procedure and SCE technical Performance Standards to prevent environment risk related damage to SCEs for:
o E04 – Safety Critical Communication Systems • Maintaining Safety Instrumented System (Safety Instrumented Functions and ESD actions) to detect and
respond to pre-defined initiating conditions, and/or initiating responses that put the process plant, equipment, and the wells in a safe condition to prevent or mitigate the effects of an MEE. Integrity will be managed in accordance with SCE Management Procedure and SCE technical Performance Standards to prevent environment risk related damage to SCEs for:
o P10 – Wells; o F06 – Safety Instrumented System
• Maintaining environmental incident response equipment to implement initial response to enact the Angel First Strike Plan. Integrity will be managed in accordance with SCE Management Procedure and SCE technical Performance Standards to prevent environment risk related damage to SCEs for:
o E05 – Environmental incident response equipment • OPGGS (Resource Management and Administration) Regulations 2011: Accepted WOMP • Incident reports are raised for unplanned releases within event reporting system • Mitigation – hydrocarbon spill response

Angel Operations Environment Plan Summary
This document is protected by copyright. No part of this document may be reproduced, adapted, transmitted, or stored in any form by any process (electronic or otherwise) without the specific written consent of Woodside. All rights are reserved.
Controlled Ref No: XX Revision: B Native file DRIMS No: 1400947213 Page 149 of 175
Uncontrolled when printed. Refer to electronic version for most up to date information.
Unplanned Hydrocarbon Release: Subsea Equipment Loss of Containment (MEE-02)
Impacts and Risks Evaluation Summary
Source of Risk
Environmental Value Potentially Impacted Evaluation
Soil
and
Gro
undw
ater
Mar
ine
Sedi
men
t
Wat
er Q
ualit
y A
ir Q
ualit
y (in
cl.
Odo
ur)
Ecos
yste
ms/
Hab
itat Sp
ecie
s
Soci
o-Ec
onom
ic
Dec
isio
n Ty
pe
Con
sequ
ence
/Impa
ct
Like
lihoo
d
Ris
k R
atin
g
ALA
RP
Tool
s
Acc
epta
bilit
y
Release of hydrocarbons resulting from loss of export pipeline containment (Angel Export Pipeline (AEP), including 1TL inventory).
X X X X X X B B 0 M LCS GP PJ RBA CV SV
Acce
ptab
le if
ALA
RP
Release of hydrocarbons resulting from loss of containment of subsea flowlines and infrastructure.
X X X X X X B D 2 M
Description of Source of Risk Hydrocarbons are transported from the wells to the riser platform via a series of subsea flowlines and risers. Hydrocarbons are exported from the riser platform to 1TL via the 49 km export pipeline. A loss of containment from subsea equipment, riser or the export pipeline may result in the release of large volumes of hydrocarbon inventory to the environment. Due to the potential consequence of a worst-case subsea equipment loss of containment, this risk is considered to be an MEE (MEE-02). This is with the exception of a loss of containment from the subsea flowlines and infrastructure; the consequence of this scenario is not considered to be an MEE. For an Angel subsea flowline, the worst-case subsea condensate loss of containment scenario is an instantaneous release of approximately 5 m3. The potential hazard sources that could instigate a loss of containment from the risers or export pipeline are:
• internal corrosion • external corrosion • erosion (for flowlines) • overpressure • equipment fatigue (risers and structural supports) • pipeline stability and freespans • anchor impact/dragging • loss of control of suspended load from visiting vessel.
Although anchor impact and dragging are potential hazard sources, the risk of pipeline loss of containment as a result of commercial trawling practice is not considered credible according to design risk based analysis, as structural protection frames are in place for key subsea infrastructure. Maintenance of subsea infrastructure structural protection frames are included in mechanical integrity controls set out for pipeline integrity performance standard P09 – Pipeline system. Escalation from other MEEs can cause subsea equipment loss of containment:
• Loss of Structural Integrity (MEE-03) • Loss of Marine Vessel Separation (MEE-04) • Loss of Control of Suspended Load from facility lifting operations (MEE-05)
Subsea Equipment Loss of Containment – Credible Scenarios The credible worst-case hydrocarbon release caused by subsea loss of containment is a release from the AEP, including its full inventory as well as backflow of the inventory of 1TL. The isolatable inventory of other subsea risers and flowlines (other than the export pipeline riser) are considerably smaller, with the AP4 flowline total volume of 240 m3 comprising of gas and liquid, with approximately 5.4 m3 of associated condensate. The location of a loss of containment of the export pipeline and associated riser will influence the potential environmental consequence. Woodside has evaluated two locations for a pipeline and riser loss of containment:

Angel Operations Environment Plan Summary
This document is protected by copyright. No part of this document may be reproduced, adapted, transmitted, or stored in any form by any process (electronic or otherwise) without the specific written consent of Woodside. All rights are reserved.
Controlled Ref No: XX Revision: B Native file DRIMS No: 1400947213 Page 150 of 175
Uncontrolled when printed. Refer to electronic version for most up to date information.
• The subsea tie-in point of the export pipeline with 1TL: this location is the nearest point to a number of sensitive receptors (e.g. Montebello Islands, Barrow Island).
• A surface release of the export pipeline riser: this location would result in a greater portion of floating hydrocarbons as the release point is above the water; a subsea release is likely to result in much of the liquid-phase hydrocarbons becoming entrained in the water column. The characteristics of the release scenario are summarised in Table 12-17.
Table 12-17: Summary of worst-case subsea equipment loss of containment release scenario
Scenario Hydrocarbon Duration (hours)
Depth (m) Latitude/ Longitude (D°M’S’’ S)
Total Condensate Release Volume (m3)
Loss of containment of the export pipeline at tie-in location
Angel Condensate
12 125.5 19° 35’ 09’’ S 116° 08’ 22’’ E
9000
Loss of containment of the export pipeline riser at the surface
Angel Condensate
36 0 (surface) 19° 29’ 54’’ S 116° 35’ 52’’ E
7000
Decision Type, Risk Analysis and ALARP Tools Woodside has a good history of implementing industry standard practice in subsea system design and construction. In the company’s recent history, it has not experienced any pipeline and riser integrity events that have resulted in significant releases or significant environmental impacts. The facility has never experienced a worst-case loss of pipeline and riser containment in its operational history. Decision Type Decision Type B has been applied to this risk under the Guidance on Risk Related Decision Making (Oil and Gas UK 2014). This reflects the complexity of the risk, the higher potential consequence and stakeholder implications should the event be realised. To align with this decision type, a further level of analysis has been applied using risk based tools including the bowtie methodology and hydrocarbon spill trajectory modelling. Company and societal values were also considered in the demonstration of ALARP and acceptability, through peer review, benchmarking and stakeholder consultation. The release of hydrocarbons as a result of subsea equipment loss of containment is considered a Major Environment Event (MEE-02). The hazard associated with this MEE is hydrocarbons in subsea infrastructure (pipelines, flowlines, risers, etc.) tied to or originating from the facility. Quantitative Spill Risk Assessment Spill modelling of each of the subsea loss of containment credible spill scenarios was undertaken by RPS APASA, on behalf of Woodside, to determine the fate of hydrocarbon released in each scenario based on the assumptions in Section 5.4and Table 12-17. Modelling was undertaken over all seasons to address year-round operations. This is considered to provide a conservative estimate of the ZoC, and the potential impacts from the identified worst-case credible release volumes for all subsea loss containment scenarios. Hydrocarbon Characteristics Refer to Section 5.4 and MEE-01 for a discussion of Angel condensate characteristics. Subsea Plume Dynamics The loss of subsea containment scenario will result in a buoyant plume of hydrocarbons, which has been modelled using the OILMAP-Deep numerical model (summarised in Table 12-18).
Table 12-18: Near-field subsurface discharge model parameters for the loss of containment of the export pipeline at tie-in location scenario
Parameter Value
Inputs Release depth 125.5
Oil density (g/cm3) (at 15 °C) 0.752
Oil viscosity (cP) (at 20 °C) 0.655
Oil temperature (°C) 25
Hole diameter (m) [in] 0.76 [30]

Angel Operations Environment Plan Summary
This document is protected by copyright. No part of this document may be reproduced, adapted, transmitted, or stored in any form by any process (electronic or otherwise) without the specific written consent of Woodside. All rights are reserved.
Controlled Ref No: XX Revision: B Native file DRIMS No: 1400947213 Page 151 of 175
Uncontrolled when printed. Refer to electronic version for most up to date information.
Gas:oil ratio (m3/m3) [scf/bbl] 5442 [30,554]
Oil flow rate (m3/12 hr) 9000
Outputs Plume diameter (m) 16.2
Plume height above sea bed (m) 125.5 (surface)
Plume initial rise velocity (m/s) 25.0
Plume terminal rise velocity (m/s) 20.4
Predicted oil droplet size distribution
21.4% droplets of size (μm) 2.7
31.1% droplets of size (μm) 5.5
24.7% droplets of size (μm) 8.2
15.1% droplets of size (μm) 10.9
7.7% droplets of size (μm) 13.7
Likelihood In accordance with the Woodside Risk Matrix, given prevention and mitigation measures in place (i.e. design, inspection and maintenance, pipeline marked on marine charts), the likelihood has been taken as 0 (Remote). Within the riser platform 500 m Petroleum Safety Zone, dropped object protection is applied to the pipeline, and as such the risk of dropped object impact leading to a release has also been assessed as 0 (Remote). Consequence The spatial extent and fate (including weathering) of the spilled hydrocarbon were considered during the impact assessment for a worst-case subsea or riser loss of containment (presented in the following section). These considerations were informed primarily by the outputs from the numerical modelling studies undertaken by APASA, available information on environmental sensitivities that may credibly be impacted in the event of a worst-case spill, and relevant literature and studies considering the effects of hydrocarbon exposure.
Consequence Assessment
Environmental Value/s Potentially Impacted Zone of Consequence Surface Hydrocarbons Floating oil concentrations equal to or greater than the 10 g/m2 were predicted in the immediate vicinity of the release locations. No contact with sensitive receptors above impact thresholds was predicted to occur. Entrained Hydrocarbons Modelling results indicated a number of environmental sensitivities may be contacted by entrained hydrocarbons above impact thresholds, with time to contact ranging from a minimum of 1.8 days (Glomar Shoals in the riser loss of containment scenario) to a maximum of 40 days (Ningaloo Coast WHA in the export pipeline loss of containment scenario). Entrained hydrocarbons at or above 500 ppb are forecast to potentially extend up to 600 km from the release sites (offshore Shark Bay). The most likely direction of drift is south-westerly around the Ningaloo Coast and then southwards, reflecting the prevailing current patterns. Cross-sectional transects of maximum entrained oil concentrations in the vicinity of the release site show that concentrations above 25,000 ppb are expected to extend from the sea surface to depths of around 20 m. Dissolved Hydrocarbons In the event of an export pipeline loss of containment scenario occurring, dissolved hydrocarbons at or above 500 ppb (environmental impact threshold) are forecast to potentially occur up to 350 km from the release site. No dissolved hydrocarbons above impact thresholds were predicted for the riser loss of containment scenario. Accumulated Hydrocarbons Potential for accumulation of oil on shorelines is predicted to be very low, with a maximum local accumulated concentration on shorelines of < 0.1 g/m2 forecast at the Pilbara Northern, Middle and Southern Island Groups and Barrow Island (below impact thresholds provided in Section 5.4).

Angel Operations Environment Plan Summary
This document is protected by copyright. No part of this document may be reproduced, adapted, transmitted, or stored in any form by any process (electronic or otherwise) without the specific written consent of Woodside. All rights are reserved.
Controlled Ref No: XX Revision: 0 Native file DRIMS No: 1400947213 Page 152 of 175
Uncontrolled when printed. Refer to electronic version for most up to date information.
Table 12-19: Key receptor locations and sensitivities potentially contacted above impact thresholds by the export pipeline (EP) and riser (R) loss of containment scenarios with summary hydrocarbon spill contact
Envi
ronm
enta
l set
ting
Loca
tion/
nam
e
Environmental, Social, Cultural, Heritage and Economic Aspects presented as per the Environmental Risk Definitions (Woodside’s Risk Management Procedure (WM0000PG10055394))
Hydrocarbon contact and fate
Physical Biological Socio-economic and Cultural
Wat
er Q
ualit
y
Sedi
men
t Q
ualit
y
Marine Primary Producers
Other Communities/Habitats
Protected Species Other Species
Fish
erie
s –
com
mer
cial
Fish
erie
s –
trad
ition
al
Tour
ism
and
recr
eatio
n
Prot
ecte
d A
reas
/Her
itage
– E
urop
ean
and
Indi
geno
us/s
hipw
reck
s
Offs
hore
oil
& g
as in
fras
truc
ture
(top
side
and
sub
sea)
Ope
n w
ater
(pris
tine)
Mar
ine
sedi
men
t (pr
istin
e)
Cor
al re
ef
Seag
rass
bed
s/m
acro
alga
e
Man
grov
es
Spaw
ning
/nur
sery
are
as
Ope
n w
ater
– p
rodu
ctiv
ity/u
pwel
ling
Non
-bio
geni
c co
ral r
eefs
Offs
hore
filte
r fee
ders
and
/or d
eepw
ater
be
nthi
c co
mm
uniti
es
Nea
rsho
re fi
lter f
eede
rs
Sand
y sh
ores
Estu
arie
s/tr
ibut
arie
s/cr
eeks
/lago
ons
(incl
udin
g m
udfla
ts)
Roc
ky s
hore
s
Cet
acea
ns –
mig
rato
ry w
hale
s
Cet
acea
ns –
dol
phin
s an
d po
rpoi
ses
Dug
ongs
Pinn
iped
s (s
ea li
ons
and
fur s
eals
)
Mar
ine
turt
les
(incl
udin
g fo
ragi
ng a
nd
inte
rnes
ting
area
s an
d si
gnifi
cant
nes
ting
beac
hes)
Seas
nake
s
Wha
le s
hark
s
Shar
ks a
nd ra
ys
Sea
bird
s an
d/or
mig
rato
ry s
hore
bird
s
Pela
gic
fish
popu
latio
ns
Res
iden
t/dem
ersa
l fis
h
Surf
ace
hydr
ocar
bon
(≥ 1
0 g/
m2 )
Entr
aine
d hy
droc
arbo
n (≥
500
ppb
)
Dis
solv
ed a
rom
atic
hyd
roca
rbon
(≥
500
ppb
)
Acc
umul
ated
hyd
roca
rbon
s (>
100
g/m
2 )
Offs
hore
8
Commonwealth waters
EP, R
EP, R EP,
R EP, R EP,
R EP, R EP,
R EP, R
EP, R
EP, R
EP, R EP,
R EP, R EP,
R EP, R
EP.R R
Subm
erge
d Sh
oals
and
B
anks
Rankin Bank EP EP EP EP EP EP EP EP EP EP EP EP EP EP EP
Glomar Shoals EP EP EP EP EP EP EP EP EP EP EP EP EP EP
Isla
nds
Montebello Islands (including State Marine Park)
EP, R
EP, R
EP, R
EP, R
EP, R
EP, R
EP, R EP,
R EP, R
EP, R
EP, R
EP, R EP, R EP,
R EP, R
EP, R
EP, R
EP, R
EP, R
EP, R EP,
R EP, R EP,
R
Lowendal Islands (including State Nature Reserve)
EP EP EP EP EP EP EP EP EP EP EP EP EP EP EP EP EP EP EP EP EP EP
Barrow Island (including State Nature Reserves, State Marine Park and Marine Management Area)
EP, R
EP, R
EP, R
EP, R EP,
R EP, R EP,
R EP, R
EP, R
EP, R
EP, R EP, R EP,
R EP, R
EP, R
EP, R
EP, R
EP, R
EP, R EP,
R EP, R
EP, R EP,
R
8 Note: hydrocarbons cannot accumulate on open ocean, submerged receptors, or receptors not fully emergent

Angel Operations Environment Plan Summary
This document is protected by copyright. No part of this document may be reproduced, adapted, transmitted, or stored in any form by any process (electronic or otherwise) without the specific written consent of Woodside. All rights are reserved.
Controlled Ref No: XX Revision: 0 Native file DRIMS No: 1400947213 Page 153 of 175
Uncontrolled when printed. Refer to electronic version for most up to date information.
Envi
ronm
enta
l set
ting
Loca
tion/
nam
e
Environmental, Social, Cultural, Heritage and Economic Aspects presented as per the Environmental Risk Definitions (Woodside’s Risk Management Procedure (WM0000PG10055394))
Hydrocarbon contact and fate
Physical Biological Socio-economic and Cultural
Wat
er Q
ualit
y
Sedi
men
t Q
ualit
y
Marine Primary Producers
Other Communities/Habitats
Protected Species Other Species
Fish
erie
s –
com
mer
cial
Fish
erie
s –
trad
ition
al
Tour
ism
and
recr
eatio
n
Prot
ecte
d A
reas
/Her
itage
– E
urop
ean
and
Indi
geno
us/s
hipw
reck
s
Offs
hore
oil
& g
as in
fras
truc
ture
(top
side
and
sub
sea)
Ope
n w
ater
(pris
tine)
Mar
ine
sedi
men
t (pr
istin
e)
Cor
al re
ef
Seag
rass
bed
s/m
acro
alga
e
Man
grov
es
Spaw
ning
/nur
sery
are
as
Ope
n w
ater
– p
rodu
ctiv
ity/u
pwel
ling
Non
-bio
geni
c co
ral r
eefs
Offs
hore
filte
r fee
ders
and
/or d
eepw
ater
be
nthi
c co
mm
uniti
es
Nea
rsho
re fi
lter f
eede
rs
Sand
y sh
ores
Estu
arie
s/tr
ibut
arie
s/cr
eeks
/lago
ons
(incl
udin
g m
udfla
ts)
Roc
ky s
hore
s
Cet
acea
ns –
mig
rato
ry w
hale
s
Cet
acea
ns –
dol
phin
s an
d po
rpoi
ses
Dug
ongs
Pinn
iped
s (s
ea li
ons
and
fur s
eals
)
Mar
ine
turt
les
(incl
udin
g fo
ragi
ng a
nd
inte
rnes
ting
area
s an
d si
gnifi
cant
nes
ting
beac
hes)
Seas
nake
s
Wha
le s
hark
s
Shar
ks a
nd ra
ys
Sea
bird
s an
d/or
mig
rato
ry s
hore
bird
s
Pela
gic
fish
popu
latio
ns
Res
iden
t/dem
ersa
l fis
h
Surf
ace
hydr
ocar
bon
(≥ 1
0 g/
m2 )
Entr
aine
d hy
droc
arbo
n (≥
500
ppb
)
Dis
solv
ed a
rom
atic
hyd
roca
rbon
(≥
500
ppb
)
Acc
umul
ated
hyd
roca
rbon
s (>
100
g/m
2 )
Muiron Islands (WHA, State Marine Park) EP EP EP EP EP EP EP EP EP EP EP EP EP EP EP EP EP EP EP EP EP EP
Pilbara Islands – Southern Island Group (Serrurier, Thevenard and Bessieres Islands – State Nature Reserves)
EP, R
EP, R EP,
R EP, R EP,
R EP, R EP,
R EP, R
EP, R EP, R EP,
R EP, R
EP, R
EP, R
EP, R
EP, R EP,
R EP, R EP,
R
Mai
nlan
d (n
ears
hore
wat
ers)
Ningaloo Coast (North, Middle and South WHA)
EP, R
EP, R
EP, R
EP, R
EP, R
EP, R
EP, R EP,
R EP, R
EP, R
EP, R
EP, R
EP, R
EP, R EP, R EP,
R EP, R
EP, R
EP, R
EP, R
EP, R EP,
R EP, R EP,
R EP

Angel Operations Environment Plan Summary
This document is protected by copyright. No part of this document may be reproduced, adapted, transmitted, or stored in any form by any process (electronic or otherwise) without the specific written consent of Woodside. All rights are reserved.
Controlled Ref No: XX Revision: 0 Native file DRIMS No: 1400947213 Page 154 of 175
Uncontrolled when printed. Refer to electronic version for most up to date information.
Consequence Assessment
Consequence Assessment Summary The credible worst-case hydrocarbon spill scenario that may arise from MEE-02 may impact upon a range of environmental receptors; refer to Table 12-19 for a summary of receptors identified by the stochastic spill modelling studies. Potential impacts of a hydrocarbon spill to these receptors are considered in MEE-01. The credible worst-case hydrocarbon volumes that can credibly be released by MEE-02 are significantly smaller than the credible worst-case loss of well containment volumes considered in MEE-01. Additionally, the credible release durations are significantly shorter.
Summary of Control Measures
• Maintain pipeline, riser and hydrocarbon-containing infrastructure integrity to avoid a MEE. Integrity will be managed in accordance with SCE Management Procedure and SCE technical Performance Standard(s) to prevent environment risk related Damage to SCEs for:
o F06 – Safety instrumented system o P09 – Pipeline Systems o P21 - Substructures o P28 – Sand management system
• Maintain Fire and Gas Detection and Alarm Systems on the facility to facilitate prevention and response to fire or gas hazards. Integrity will be managed in accordance with SCE Management Procedure and SCE technical Performance Standard to prevent environment risk related Damage to SCEs for:
o F01- Fire and Gas Detection and Alarm Systems • Maintain availability of external and internal communication systems to facilitate response to accidents and
emergencies. Integrity will be managed in accordance with SCE Management Procedure and SCE technical Performance Standard to prevent environment risk related Damage to SCEs for:
o E04 – Safety Critical Communication Systems • Maintain Safety Instrumented System (Safety Instrumented Functions and ESD actions) to detect and
respond to pre-defined initiating conditions and/or initiate responses that put the process plant, equipment, and the wells in a safe condition (e.g through appropriate isolation of hazardous inventories) so as to prevent or mitigate the effects of a MEE. Integrity will be managed in accordance with SCE Management Procedure and SCE technical Performance Standard(s) to prevent environment risk related Damage to SCEs for:
o F06 – Safety instrumented system o P09 – Pipeline systems o P10 – Wells (for flowlines)
• Maintaining environmental incident response equipment to implement initial response to enact the Angel First Strike Plan. Integrity will be managed in accordance with SCE Management Procedure and SCE technical Performance Standards to prevent environment risk related damage to SCEs for:
o E05 – Environmental incident response equipment • Incident reports are raised for unplanned releases within event reporting system • Offshore Petroleum and Greenhouse Gas Storage (Safety) regulations 2009 Accepted Safety Case for the
Angel facility • Offshore Petroleum and Greenhouse Gas Storage (Safety) regulations 2009 Accepted Safety Case for the
Pipeline • Mitigation – hydrocarbon spill response

Angel Operations Environment Plan Summary
This document is protected by copyright. No part of this document may be reproduced, adapted, transmitted, or stored in any form by any process (electronic or otherwise) without the specific written consent of Woodside. All rights are reserved.
Controlled Ref No: XX Revision: 0 Native file DRIMS No: 1400947213 Page 155 of 175
Uncontrolled when printed. Refer to electronic version for most up to date information.
Unplanned Hydrocarbon Release: Loss of Structural Integrity (MEE-03)
Impacts and Risks Evaluation Summary
Source of Risk
Environmental Value Potentially Impacted Evaluation
Soil
and
Gro
undw
ater
Mar
ine
Sedi
men
t
Wat
er Q
ualit
y
Air
Qua
lity
(incl
. O
dour
) Ec
osys
tem
s/H
abita
t Spec
ies
Soci
o-Ec
onom
ic
Dec
isio
n Ty
pe
Con
sequ
ence
/Impa
ct
Like
lihoo
d
Ris
k R
atin
g
ALA
RP
Tool
s
Acc
epta
bilit
y
Surface or subsea release from flowline, pipeline and riser to the marine environment and atmosphere (MEE-02).
X X X X X X B B 0 M LCS GP PJ RBA
Acce
ptab
le if
ALA
RP
Hydrocarbon release from topsides equipment to the marine environment and atmosphere.
X X X A D 1 M
Marine environment footprint and associated hydrocarbon and chemical release associated with structural collapse of riser platform.
X X X X X B B 0 M
Description of Source of Risk Extreme environmental conditions or other causes which result in an exceedance of the design criteria and a catastrophic failure of the facility and individual equipment (e.g. cranes, flare tower, etc.) has been identified as a potential MEE (MEE-03). Catastrophic structural failure of the facility could lead to the release of hydrocarbons to the environment. The identified causes, including escalation from other MEEs, include:
• internal corrosion • external corrosion • fatigue • extreme weather (cyclone, high waves) • seismic events/seabed instability • fire/overpressure event.
Escalation from other MEEs can cause loss of structural integrity: • well and subsea equipment hydrocarbon loss of containment (refer to MEE-01, MEE-02) • loss of marine vessel separation (refer to MEE-04) • loss of control of suspended load from facility lifting operations (refer to MEE-05).
There is a possibility of riser platform collapse (‘slow’ or ‘rapid’) caused by the extreme loads induced by strong winds and extreme waves. A number of common failure causes due to human error and SCQ failures are presented in the generic Human Error and SCE Failure section below. Loss of Structural Integrity – Credible Scenarios A loss of structural integrity could result in a significant release of hydrocarbons. A loss of structural integrity may result in credible hydrocarbon spill scenarios consistent with:
• subsea equipment loss of containment (MEE-02)
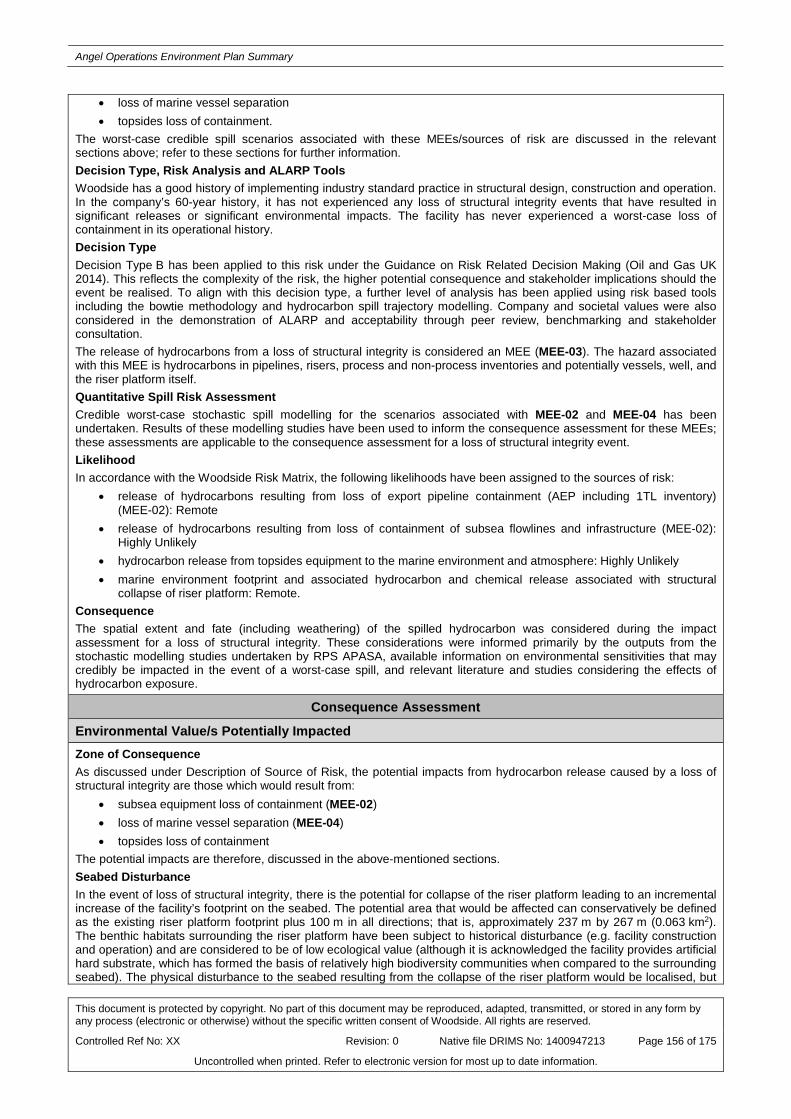
Angel Operations Environment Plan Summary
This document is protected by copyright. No part of this document may be reproduced, adapted, transmitted, or stored in any form by any process (electronic or otherwise) without the specific written consent of Woodside. All rights are reserved.
Controlled Ref No: XX Revision: 0 Native file DRIMS No: 1400947213 Page 156 of 175
Uncontrolled when printed. Refer to electronic version for most up to date information.
• loss of marine vessel separation • topsides loss of containment.
The worst-case credible spill scenarios associated with these MEEs/sources of risk are discussed in the relevant sections above; refer to these sections for further information. Decision Type, Risk Analysis and ALARP Tools Woodside has a good history of implementing industry standard practice in structural design, construction and operation. In the company’s 60-year history, it has not experienced any loss of structural integrity events that have resulted in significant releases or significant environmental impacts. The facility has never experienced a worst-case loss of containment in its operational history. Decision Type Decision Type B has been applied to this risk under the Guidance on Risk Related Decision Making (Oil and Gas UK 2014). This reflects the complexity of the risk, the higher potential consequence and stakeholder implications should the event be realised. To align with this decision type, a further level of analysis has been applied using risk based tools including the bowtie methodology and hydrocarbon spill trajectory modelling. Company and societal values were also considered in the demonstration of ALARP and acceptability through peer review, benchmarking and stakeholder consultation. The release of hydrocarbons from a loss of structural integrity is considered an MEE (MEE-03). The hazard associated with this MEE is hydrocarbons in pipelines, risers, process and non-process inventories and potentially vessels, well, and the riser platform itself. Quantitative Spill Risk Assessment Credible worst-case stochastic spill modelling for the scenarios associated with MEE-02 and MEE-04 has been undertaken. Results of these modelling studies have been used to inform the consequence assessment for these MEEs; these assessments are applicable to the consequence assessment for a loss of structural integrity event. Likelihood In accordance with the Woodside Risk Matrix, the following likelihoods have been assigned to the sources of risk:
• release of hydrocarbons resulting from loss of export pipeline containment (AEP including 1TL inventory) (MEE-02): Remote
• release of hydrocarbons resulting from loss of containment of subsea flowlines and infrastructure (MEE-02): Highly Unlikely
• hydrocarbon release from topsides equipment to the marine environment and atmosphere: Highly Unlikely • marine environment footprint and associated hydrocarbon and chemical release associated with structural
collapse of riser platform: Remote. Consequence The spatial extent and fate (including weathering) of the spilled hydrocarbon was considered during the impact assessment for a loss of structural integrity. These considerations were informed primarily by the outputs from the stochastic modelling studies undertaken by RPS APASA, available information on environmental sensitivities that may credibly be impacted in the event of a worst-case spill, and relevant literature and studies considering the effects of hydrocarbon exposure.
Consequence Assessment
Environmental Value/s Potentially Impacted Zone of Consequence As discussed under Description of Source of Risk, the potential impacts from hydrocarbon release caused by a loss of structural integrity are those which would result from:
• subsea equipment loss of containment (MEE-02) • loss of marine vessel separation (MEE-04) • topsides loss of containment
The potential impacts are therefore, discussed in the above-mentioned sections. Seabed Disturbance In the event of loss of structural integrity, there is the potential for collapse of the riser platform leading to an incremental increase of the facility’s footprint on the seabed. The potential area that would be affected can conservatively be defined as the existing riser platform footprint plus 100 m in all directions; that is, approximately 237 m by 267 m (0.063 km2). The benthic habitats surrounding the riser platform have been subject to historical disturbance (e.g. facility construction and operation) and are considered to be of low ecological value (although it is acknowledged the facility provides artificial hard substrate, which has formed the basis of relatively high biodiversity communities when compared to the surrounding seabed). The physical disturbance to the seabed resulting from the collapse of the riser platform would be localised, but

Angel Operations Environment Plan Summary
This document is protected by copyright. No part of this document may be reproduced, adapted, transmitted, or stored in any form by any process (electronic or otherwise) without the specific written consent of Woodside. All rights are reserved.
Controlled Ref No: XX Revision: 0 Native file DRIMS No: 1400947213 Page 157 of 175
Uncontrolled when printed. Refer to electronic version for most up to date information.
result in long-term disturbance to benthic communities. The riser platform could act as a source of environmental contaminants due to material on-board the platform (e.g. chemical/hydrocarbon inventories, corrosion of structural materials, debris, etc.). The potential for contamination will diminish over time, as the structure degrades. Depending on the nature of the loss of structural integrity, complete or partial salvage of the riser platform may not be feasible. Any structures not able to be recovered will be left on the seabed indefinitely. These structures are expected to be colonised by marine organisms, and a reef habitat will develop over time on the structures. While the Operational Area overlaps the Glomar Shoals and Ancient Coastline at 125 m Depth Contour KEFs, neither of these are in close proximity to the riser platform; the closest (Glomar Shoals) lies approximately 2.8 km from the riser platform.
Summary of Control Measures • Maintaining structural integrity to ensure availability of critical systems during a major accident or environment
event, and prevent structural failures from contributing to escalation of an MEE. Integrity will be managed in accordance with SCE Management Procedure and SCE technical Performance Standard(s) to prevent environment risk related Damage to SCEs for:
o P07 – Topside / surface structures o P21 - Substructures
• Maintain control of ignition sources and fire protection to prevent loss of structural integrity. Integrity will be managed in accordance with SCE Management Procedure and SCE technical Performance Standard to prevent environment risk related Damage to SCEs for:
o F27 – Control of Ignition Sources o F20 – Passive Fire and Explosion Protection
• Maintaining fire and gas detection and alarm systems on the facility to facilitate prevention and response to fire or gas hazards. Integrity will be managed in accordance with SCE Management Procedure and SCE technical Performance Standard to prevent environment risk related Damage to SCEs for:
o F01 – Fire and Gas Detection Alarm Systems • Maintain availability of external and internal communication systems to facilitate response to accidents and
emergencies. Integrity will be managed in accordance with SCE Management Procedure and SCE technical Performance Standard to prevent environment risk related Damage to SCEs for:
o E04 – Safety Critical Communication Systems • Maintain Safety Instrumented System (Safety Instrumented Functions and ESD actions) to detect and respond
to pre-defined initiating conditions and/or initiate responses that put the process plant, equipment, and the wells in a safe condition (e.g through appropriate isolation of hazardous inventories) so as to prevent or mitigate the effects of a MEE. Integrity will be managed in accordance with SCE Management Procedure and SCE technical Performance Standard(s) to prevent environment risk related Damage to SCEs for:
o F06 – Safety instrumented system o P09 – Pipeline systems o P10 – Wells (for flowlines)
• Maintaining Open Hazardous Drains system to isolate, remove and control hazardous inventories. Integrity will be managed in accordance with SCE Management Procedure and SCE technical Performance Standards to prevent environment risk related damage to SCEs for:
o F22 – Open Hazardous Drains • Maintaining environmental incident response equipment to implement initial response to enact the Angel First
Strike Plan. Integrity will be managed in accordance with SCE Management Procedure and SCE technical Performance Standards to prevent environment risk related damage to SCEs for:
o E05 – Environmental incident response equipment • OPGGS (Safety) Regulations 2009. Angel Safety Case for the Angel facility. • OPGGS (Safety) Regulations 2009. Accepted Safety Case for the Pipeline • Incident reports are raised for unplanned releases within event reporting system • Mitigation – hydrocarbon spill response

Angel Operations Environment Plan Summary
This document is protected by copyright. No part of this document may be reproduced, adapted, transmitted, or stored in any form by any process (electronic or otherwise) without the specific written consent of Woodside. All rights are reserved.
Controlled Ref No: XX Revision: 0 Native file DRIMS No: 1400947213 Page 158 of 175
Uncontrolled when printed. Refer to electronic version for most up to date information.
Unplanned Hydrocarbon Release: Loss of Marine Vessel Separation (MEE-04)
Impacts and Risks Evaluation Summary
Source of Risk
Environmental Value Potentially Impacted Evaluation
Soil
and
Gro
undw
ater
Mar
ine
Sedi
men
t
Wat
er Q
ualit
y
Air
Qua
lity
(incl
. O
dour
) Ec
osys
tem
s/H
abita
t Spec
ies
Soci
o-Ec
onom
ic
Dec
isio
n Ty
pe
Con
sequ
ence
/Impa
ct
Like
lihoo
d
Ris
k R
atin
g
ALA
RP
Tool
s
Acc
epta
bilit
y
Surface or subsea release from flowline, pipeline and riser to the marine environment and atmosphere (MEE-02).
X X X X X X B B 0 M LCS GP PJ RBA
Acce
ptab
le if
ALA
RP
Hydrocarbon release from topsides equipment to the marine environment and atmosphere.
X X X A C 1 M
Marine environment footprint and associated hydrocarbon and chemical release associated with structural collapse of riser platform.
X X X X X B B 0 M
Surface release from support vessel diesel tank.
X X X A D 1 M
Description of Source of Risk A loss of marine vessel separation between a vessel and the riser platform may result in a loss of hydrocarbon containment from the Angel facility and/or the release of fuel from the vessel. A loss of marine vessel separation has been identified as a potential MEE (MEE-04). Loss of marine vessel separations can arise from:
• visiting vessel collisions associated with platform support vessels – ships which are visiting the riser platform can accidentally collide with the platform during approach to, or manoeuvring alongside, the platform
• errant passing vessel collision – ships which are not visiting the riser platform (i.e. passing vessels) can, for one reason or another, move off-course and collide with the platform.
The different collision hazards involve significantly different sized vessels and collision speeds; hence, differing impact energies and consequences have been assessed. Visiting Vessels Visiting vessels are defined as those which are routinely used to service the facility. Operating procedures will dictate how vessels are operated, loaded and unloaded, but it will generally occur so that the prevailing winds move the vessel away from the facility. The primary causes of visiting vessel collisions are failure to follow safe procedures and communication errors between the marine vessels and riser platform operations. These errors could be worsened by:
• vessel station keeping failures, or • vessel operations in adverse weather conditions.
Given the facility is NNM, the frequency of visits by vessels is inherently lower than those for a manned facility. Errant Passing Vessels Errant passing vessels are defined as third party vessels that enter the riser platform’s 500 m Petroleum Safety Zone, but do not call at the facility (i.e. not support vessels). The collision can be powered or drifting. Either has the potential to cause significant damage to the riser platform. The causes of errant passing vessel collisions include:
• failure of propulsion or steering systems • adverse weather conditions resulting in poor visibility

Angel Operations Environment Plan Summary
This document is protected by copyright. No part of this document may be reproduced, adapted, transmitted, or stored in any form by any process (electronic or otherwise) without the specific written consent of Woodside. All rights are reserved.
Controlled Ref No: XX Revision: 0 Native file DRIMS No: 1400947213 Page 159 of 175
Uncontrolled when printed. Refer to electronic version for most up to date information.
• rough seas • human error.
Woodside implements a range of control measures to mitigate the risk of errant vessel collision. The riser platform is not normally manned, so monitoring and control (and isolation) of the platform and associated flowlines and export pipeline takes place from NRC. Woodside implements a range of control measures to mitigate the risk of errant vessel collision. A number of common failure causes due to human error and SCQ failures are presented in the generic Human Error and SCE Failure bowties. Loss of Vessel Separation – Credible Hydrocarbon Spill Scenario The loss of marine vessel separation is considered a Major Environment Event (MEE-04). A loss of structural integrity could result in a significant release of hydrocarbons. A loss of structural integrity may result in credible spill scenarios consistent with:
• subsea equipment loss of containment (MEE-02) • topsides loss of containment.
In addition, vessel cargo, including diesel inventory, could be spilled if the cause of the loss of platform integrity was a collision from a support vessel. Worst-case hydrocarbon release scenarios for subsea equipment loss of containment (MEE-02) that could result from loss of marine vessel separation are discussed in the relevant sections referenced above. Relevant trajectory modelling, as applicable to these scenarios, is also discussed above. A loss of vessel separation may lead to the accidental release of marine diesel from the fuel tanks on the vessel(s) involved. For a vessel collision to result in the worst-case scenario of a hydrocarbon spill potentially impacting an environmental receptor, several factors must align as follows:
• Vessel interaction must result in a collision. • The collision must have enough force to penetrate the vessel hull. • The collision must be in the exact location of the fuel tank. • The fuel tank must be full, or at least of volume which is higher than the point of penetration.
The probability of the chain of events described above aligning, to result in a breach of fuel tanks resulting in a spill that could potentially affect the marine environment, is considered highly unlikely. Given the offshore location of the Operational Area, vessel grounding in relation to the Petroleum Activities Program is not considered a credible risk. A collision between a support vessel with a third-party vessel (i.e. commercial shipping, other petroleum related vessels and commercial fishing vessels) was considered the only credible event that could release a significant quantity of marine diesel to the environment. This was assessed as being credible, but highly unlikely, given:
• the platform support vessels typically operate in the Operational Area • the presence of subsea vessels in the Operational Area is typically temporary (e.g. while undertaking IMR
activities) • vessels undertaking the Petroleum Activities Program typically operate at low speeds or are stationary • the standard vessel operations and equipment in place to prevent collision at sea • the construction and placement of storage tanks.
The largest tank of a platform support vessel or subsea support vessel is unlikely to exceed 105 m3. As such, the worst-case credible spill of marine diesel from a vessel is considered to be an instantaneous loss of the content of a 105 m3 tank. Release characteristics for cargo tank loss of containment scenario are summarised in (Table 12-20).
Table 12-20: Summary of worst-case support vessel fuel tank loss of containment scenario
Scenario Hydrocarbon Duration (minutes)
Depth (m)
Latitude (D°M’S’’)
Longitude (D°M’S’’)
Total Hydrocarbon
Release Volume (m3)
Support vessel fuel tank loss of containment
Marine diesel < 10 Surface 19° 29’ 54.60” S 116° 35’ 52.80” E
105
Decision Type, Risk Analysis and ALARP Tools Woodside has not experienced any loss of marine vessel separation events that have resulted in significant environmental impacts. The facility has never experienced a worst-case loss of containment due to loss of vessel separation in its operational history. Decision Type
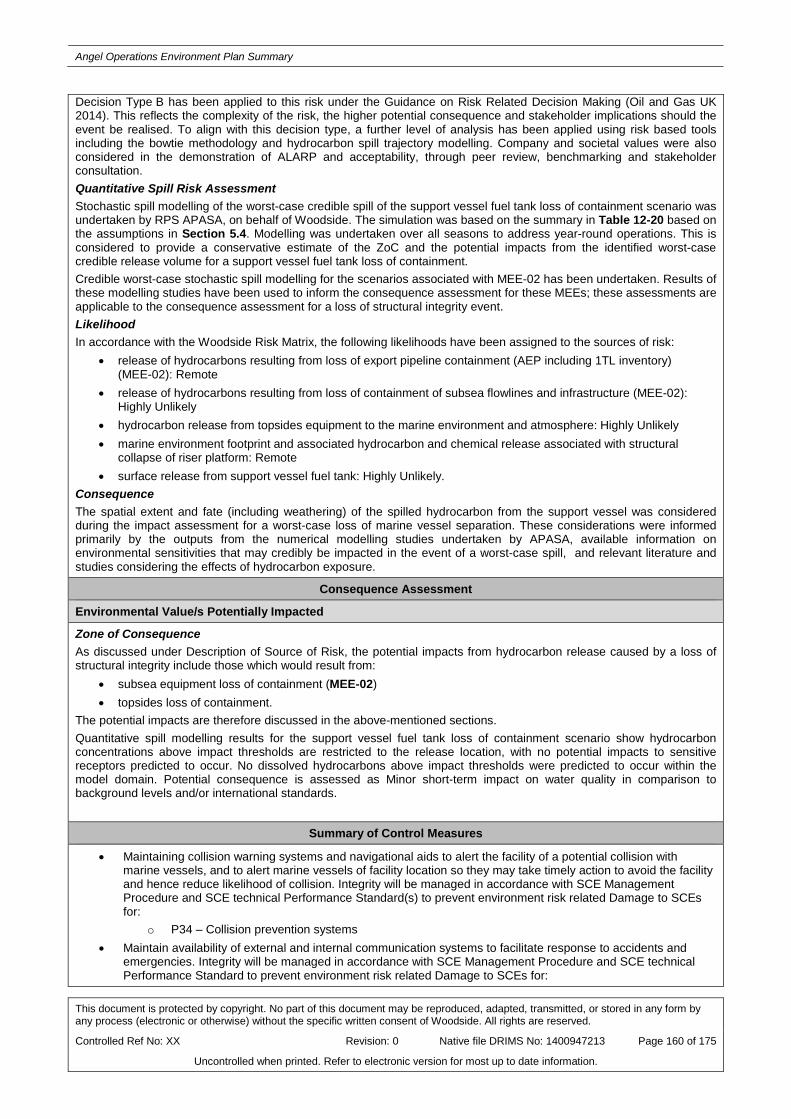
Angel Operations Environment Plan Summary
This document is protected by copyright. No part of this document may be reproduced, adapted, transmitted, or stored in any form by any process (electronic or otherwise) without the specific written consent of Woodside. All rights are reserved.
Controlled Ref No: XX Revision: 0 Native file DRIMS No: 1400947213 Page 160 of 175
Uncontrolled when printed. Refer to electronic version for most up to date information.
Decision Type B has been applied to this risk under the Guidance on Risk Related Decision Making (Oil and Gas UK 2014). This reflects the complexity of the risk, the higher potential consequence and stakeholder implications should the event be realised. To align with this decision type, a further level of analysis has been applied using risk based tools including the bowtie methodology and hydrocarbon spill trajectory modelling. Company and societal values were also considered in the demonstration of ALARP and acceptability, through peer review, benchmarking and stakeholder consultation. Quantitative Spill Risk Assessment Stochastic spill modelling of the worst-case credible spill of the support vessel fuel tank loss of containment scenario was undertaken by RPS APASA, on behalf of Woodside. The simulation was based on the summary in Table 12-20 based on the assumptions in Section 5.4. Modelling was undertaken over all seasons to address year-round operations. This is considered to provide a conservative estimate of the ZoC and the potential impacts from the identified worst-case credible release volume for a support vessel fuel tank loss of containment. Credible worst-case stochastic spill modelling for the scenarios associated with MEE-02 has been undertaken. Results of these modelling studies have been used to inform the consequence assessment for these MEEs; these assessments are applicable to the consequence assessment for a loss of structural integrity event. Likelihood In accordance with the Woodside Risk Matrix, the following likelihoods have been assigned to the sources of risk:
• release of hydrocarbons resulting from loss of export pipeline containment (AEP including 1TL inventory) (MEE-02): Remote
• release of hydrocarbons resulting from loss of containment of subsea flowlines and infrastructure (MEE-02): Highly Unlikely
• hydrocarbon release from topsides equipment to the marine environment and atmosphere: Highly Unlikely • marine environment footprint and associated hydrocarbon and chemical release associated with structural
collapse of riser platform: Remote • surface release from support vessel fuel tank: Highly Unlikely.
Consequence The spatial extent and fate (including weathering) of the spilled hydrocarbon from the support vessel was considered during the impact assessment for a worst-case loss of marine vessel separation. These considerations were informed primarily by the outputs from the numerical modelling studies undertaken by APASA, available information on environmental sensitivities that may credibly be impacted in the event of a worst-case spill, and relevant literature and studies considering the effects of hydrocarbon exposure.
Consequence Assessment
Environmental Value/s Potentially Impacted
Zone of Consequence As discussed under Description of Source of Risk, the potential impacts from hydrocarbon release caused by a loss of structural integrity include those which would result from:
• subsea equipment loss of containment (MEE-02) • topsides loss of containment.
The potential impacts are therefore discussed in the above-mentioned sections. Quantitative spill modelling results for the support vessel fuel tank loss of containment scenario show hydrocarbon concentrations above impact thresholds are restricted to the release location, with no potential impacts to sensitive receptors predicted to occur. No dissolved hydrocarbons above impact thresholds were predicted to occur within the model domain. Potential consequence is assessed as Minor short-term impact on water quality in comparison to background levels and/or international standards.
Summary of Control Measures
• Maintaining collision warning systems and navigational aids to alert the facility of a potential collision with marine vessels, and to alert marine vessels of facility location so they may take timely action to avoid the facility and hence reduce likelihood of collision. Integrity will be managed in accordance with SCE Management Procedure and SCE technical Performance Standard(s) to prevent environment risk related Damage to SCEs for:
o P34 – Collision prevention systems • Maintain availability of external and internal communication systems to facilitate response to accidents and
emergencies. Integrity will be managed in accordance with SCE Management Procedure and SCE technical Performance Standard to prevent environment risk related Damage to SCEs for:

Angel Operations Environment Plan Summary
This document is protected by copyright. No part of this document may be reproduced, adapted, transmitted, or stored in any form by any process (electronic or otherwise) without the specific written consent of Woodside. All rights are reserved.
Controlled Ref No: XX Revision: 0 Native file DRIMS No: 1400947213 Page 161 of 175
Uncontrolled when printed. Refer to electronic version for most up to date information.
o E04 – Safety Critical Communication Systems • Maintaining environmental incident response equipment to implement initial response to enact the Angel First
Strike Plan. Integrity will be managed in accordance with SCE Management Procedure and SCE technical Performance Standards to prevent environment risk related damage to SCEs for:
o E05 – Environmental incident response equipment • Maintaining Fire and Gas Detection and Alarm Systems on the facility to facilitate prevention and response to
fire or gas hazards. Integrity will be managed in accordance with SCE Management Procedure and SCE technical Performance Standards to prevent environment risk related damage to SCEs for:
o F01 – Fire and Gas Detection and Alarm Systems • Maintaining Safety instrumented Systems ( e.g. ESD and safety instrumented functions) system, Blow down
and Open Hazardous Drains system to isolate, remove and control hazardous inventories so as to mitigate the effects of a MEE/prevent escalation to a MEE. Integrity will be managed in accordance with SCE Management Procedure and SCE technical Performance Standards to prevent environment risk related damage to SCEs for:
o F06 – Safety Instrumented Systems o F09 – Depressurisation (Blowdown) o F22 – Open Hazardous Drains
• OPGGS (Safety) Regulations 2009. Angel Safety Case for the Angel facility. • OPGGS (Safety) Regulations 2009. Accepted Safety Case for the Pipeline • Incident reports are raised for unplanned releases within event reporting system • Mitigation – hydrocarbon spill response

Angel Operations Environment Plan Summary
This document is protected by copyright. No part of this document may be reproduced, adapted, transmitted, or stored in any form by any process (electronic or otherwise) without the specific written consent of Woodside. All rights are reserved.
Controlled Ref No: XX Revision: 0 Native file DRIMS No: 1400947213 Page 162 of 175
Uncontrolled when printed. Refer to electronic version for most up to date information.
Unplanned Hydrocarbon Release: Loss of Control of Suspended Load from Platform (MEE-05)
Impacts and Risks Evaluation Summary
Source of Risk
Environmental Value Potentially Impacted Evaluation
Soil
and
Gro
undw
ater
Mar
ine
Sedi
men
t
Wat
er Q
ualit
y
Air
Qua
lity
(incl
. O
dour
) Ec
osys
tem
s/H
abita
t Spec
ies
Soci
o-Ec
onom
ic
Dec
isio
n Ty
pe
Con
sequ
ence
/Impa
ct
Like
lihoo
d
Ris
k R
atin
g
ALA
RP
Tool
s
Acc
epta
bilit
y
Out
com
e
Surface or subsea release from flowline, pipeline and riser to the marine environment and atmosphere (MEE-02).
X X X X X X B B 0 M LCS GP PJ RBA CV SV
Acce
ptab
le if
ALA
RP EPO
17
Hydrocarbon release from topsides process equipment to the marine environment and atmosphere.
X X X A D 0 L
Description of Source of Risk Lifting activities on the riser platform can take place from the pedestal crane on the east side of the platform. Lifts may occur between supply vessels and laydown areas, primarily to transfer stores and equipment to or from the riser platform. Lifting operations could potentially lead to dropped objects impacting assets (topsides equipment, subsea infrastructure) inside the Petroleum Safety Zone. This may lead to a hydrocarbon loss of containment from topsides or subsea infrastructure. Loss of suspended load has been identified as an MEE (MEE-05). A loss of suspended load may arise from:
• lifting equipment failure, or • facility lifting operations.
A number of common failure causes due to human error and SCQ failures are presented in the generic Human Error and SCE Failure bowties . Loss of Control of Suspended Load – Credible Scenarios The potential outcome of a loss of control of a suspended load is a topsides and/or subsea flowlines and riser loss of containment. Refer to MEE-02 and Unplanned Hydrocarbon Release: Topsides Loss of Containment for a description of subsea and topsides loss of containments scenarios, respectively. Decision Type, Risk Analysis and ALARP Tools Woodside has a good history of implementing industry standard practice in subsea system design and construction. In the company’s recent history, it has not experienced any loss of suspended load events that have resulted in significant releases or significant environmental impacts. Decision Type Decision Type B has been applied to this risk under the Guidance on Risk Related Decision Making (Oil and Gas UK 2014). This reflects the complexity of the risk, the higher potential consequence and stakeholder implications should the event be realised. To align with this decision type, a further level of analysis has been applied using risk based tools including the bowtie methodology and hydrocarbon spill trajectory modelling. Company values were also considered in the demonstration of ALARP and acceptability through peer review, benchmarking and stakeholder consultation. A loss of control of a suspended load is considered an MEE (MEE-05). The hazard associated with this MEE is the hydrocarbon inventory of flowlines and risers, or topsides process and non-process hydrocarbons. Quantitative Spill Risk Assessment The credible worst-case hydrocarbon scenario for MEE-02 is considered to apply to a loss of control of suspended load, as they may credibly arise from damage to hydrocarbon containing subsea infrastructure within the 500 m Petroleum Safety Zone. A quantitative spill risk assessment was not conducted for the topsides loss of containment scenario due to the relatively small credible release volume.

Angel Operations Environment Plan Summary
This document is protected by copyright. No part of this document may be reproduced, adapted, transmitted, or stored in any form by any process (electronic or otherwise) without the specific written consent of Woodside. All rights are reserved.
Controlled Ref No: XX Revision: 0 Native file DRIMS No: 1400947213 Page 163 of 175
Uncontrolled when printed. Refer to electronic version for most up to date information.
Likelihood In accordance with the Woodside Risk Matrix, given prevention and mitigation measures in place (i.e. design, inspection and maintenance), the likelihood assigned to the worst-case risk events are considered 0 (Remote). Consequence The spatial extent and fate (incl. weathering) of the spilled hydrocarbons were considered during the impact assessment for a loss of control of suspended load. These considerations were informed primarily by the outputs from the numerical modelling studies undertaken by RPS APASA, available information on environmental sensitivities that may credibly be impacted in the event of a worst-case spill, and relevant literature and studies considering the effects of hydrocarbon exposure.
Summary of Control Measures • Maintaining platform lifting equipment to prevent platform lifting equipment failure or dropped/swinging loads
that could result in an MEE. Integrity will be managed in accordance with SCE Management Procedure and SCE technical Performance Standard(s) to prevent environment risk related Damage to SCEs for:
o P20 – Lifting equipment • Maintaining structural integrity to ensure availability of critical systems during a major accident or environment
event, and prevent structural failures from contributing to escalation of an MEE. Integrity will be managed in accordance with SCE Management Procedure and SCE technical Performance Standard(s) to prevent environment risk related Damage to SCEs for:
o P07 – Topside/surface structures o P21 - Substructures
• Offshore Petroleum and Greenhouse Gas Storage (Safety) Regulations 2009: Accepted Safety Case for the Angel facility.
• Incident reports are raised for unplanned releases within event reporting system. • Mitigation – hydrocarbon spill response

Angel Operations Environment Plan Summary
This document is protected by copyright. No part of this document may be reproduced, adapted, transmitted, or stored in any form by any process (electronic or otherwise) without the specific written consent of Woodside. All rights are reserved.
Controlled Ref No: XX Revision: 0 Native file DRIMS No: 1400947213 Page 164 of 175
Uncontrolled when printed. Refer to electronic version for most up to date information.
MEE Common Cause Event failure mechanisms: SCE Failure CCE-01 and Human Error CCE-02 This section presents common mode failure causes and controls applicable across MEEs, which are also observed within the bowties of the MEEs discussed within sections above. Controls, EPSs and MCs presented within this section are also considered relevant to MEE 01 to MEE-05.
Angel: Major Environmental Event Datasheet
MEE Number ALL
Hazard Description
Generic Safety Critical Equipment failure (CCE-01)
HAZARD DESCRIPTION
Hazard Overview and Scope
There are a number of causes which contribute to failures of SCEs and other systems which might protect against an MEE. These include:
• maintenance errors; • defects; • electrical supply failure; • hydraulic supply failure; and • adverse environmental conditions.
The generic SCE failure bowties illustrates the causes, outcomes and the controls in place to manage these failure mechanisms. Summary of Control Measures
• Maintain hydraulic supplies (e.g. to support Safety Instrumented Systems and actuation of SCE valve/isolations). Integrity will be managed in accordance with SCE Management Procedures and SCE technical Performance Standard(s) to prevent environment risk related Damage to SCEs for:
o F06 – Safety Instrumented System • Maintain protection from environmental conditions. Integrity will be managed in accordance with SCE
Management Procedures and SCE technical Performance Standard(s) to prevent environment risk related Damage to SCEs for:
o P07 – Topsides / Surface Structures o P08 – Piping Systems o P09 – Pipeline Systems o P10 – Wells o P21 - Substructures
• Maintain UPS / emergency power systems to supply Essential safety systems. Integrity will be managed in accordance with SCE Management Procedures and SCE technical Performance Standard(s) to prevent environment risk related Damage to SCEs for:
o F25 – UPS / Emergency Power • Maintain climate controlled enclosures to protect essential equipment from adverse environmental conditions.
Integrity will be managed in accordance with SCE Management Procedures and SCE technical Performance Standard(s) to prevent environment risk related Damage to SCEs for:
o E02 – Safety Critical Buildings • Offshore Petroleum and Greenhouse Gas Storage (Safety) Regulations 2009: Accepted Safety Case for the
Angel facility.
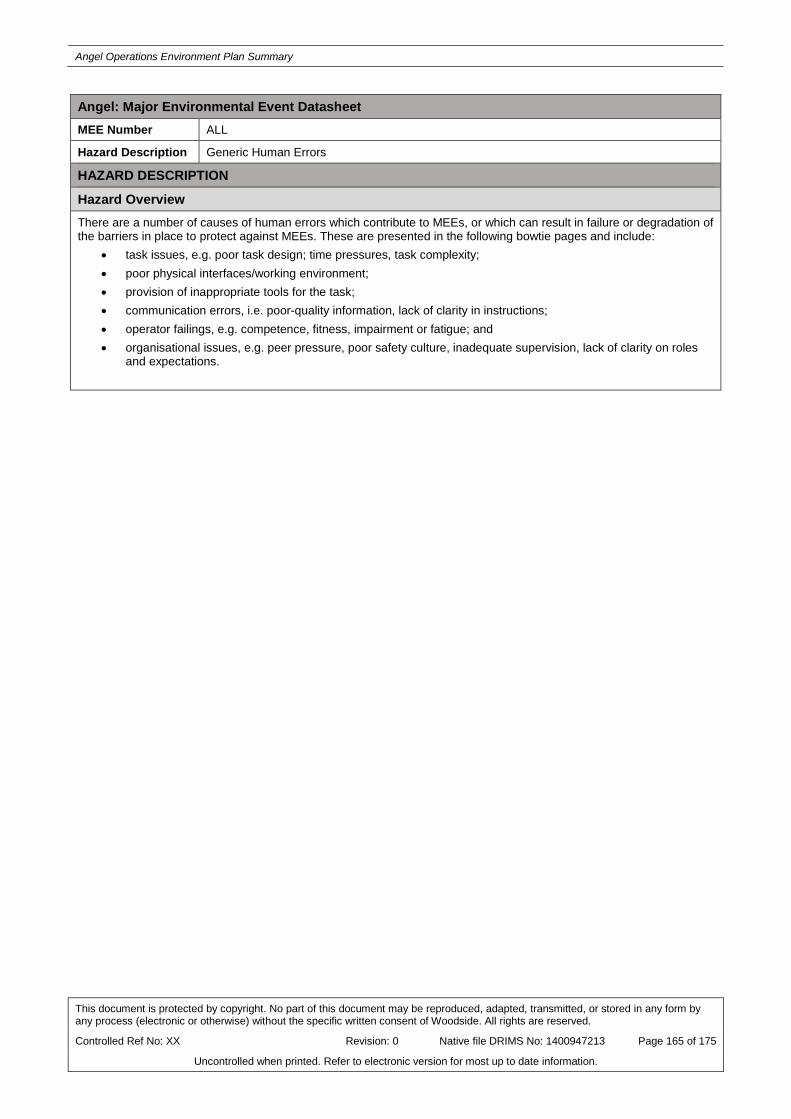
Angel Operations Environment Plan Summary
This document is protected by copyright. No part of this document may be reproduced, adapted, transmitted, or stored in any form by any process (electronic or otherwise) without the specific written consent of Woodside. All rights are reserved.
Controlled Ref No: XX Revision: 0 Native file DRIMS No: 1400947213 Page 165 of 175
Uncontrolled when printed. Refer to electronic version for most up to date information.
Angel: Major Environmental Event Datasheet MEE Number ALL
Hazard Description Generic Human Errors
HAZARD DESCRIPTION
Hazard Overview There are a number of causes of human errors which contribute to MEEs, or which can result in failure or degradation of the barriers in place to protect against MEEs. These are presented in the following bowtie pages and include:
• task issues, e.g. poor task design; time pressures, task complexity; • poor physical interfaces/working environment; • provision of inappropriate tools for the task; • communication errors, i.e. poor-quality information, lack of clarity in instructions; • operator failings, e.g. competence, fitness, impairment or fatigue; and • organisational issues, e.g. peer pressure, poor safety culture, inadequate supervision, lack of clarity on roles
and expectations.

Angel Operations Environment Plan Summary
This document is protected by copyright. No part of this document may be reproduced, adapted, transmitted, or stored in any form by any process (electronic or otherwise) without the specific written consent of Woodside. All rights are reserved.
Controlled Ref No: XX Revision: 0 Native file DRIMS No: 1400947213 Page 166 of 175
Uncontrolled when printed. Refer to electronic version for most up to date information.
APPENDIX B: CONTROL MITIGATION MEASURES FOR POTENTIAL ENVIRONMENTAL IMPACTS ASSOCIATED WITH SPILL RESPONSE
ACTIVITIES
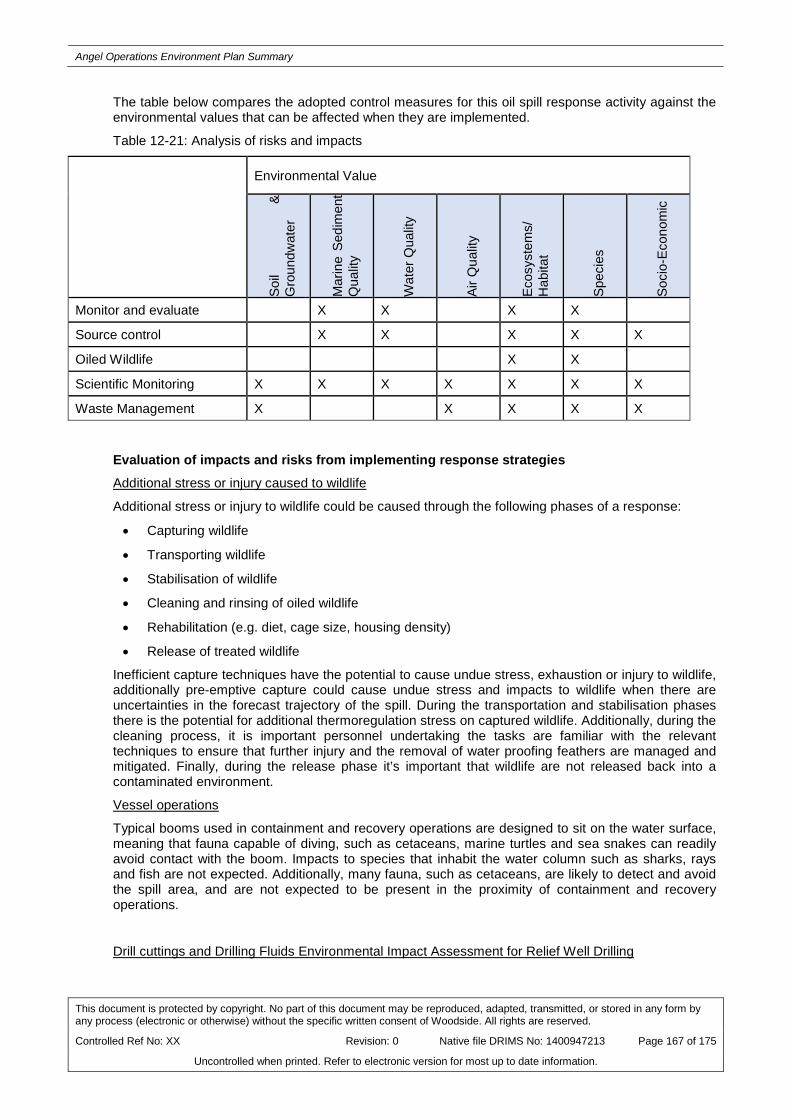
Angel Operations Environment Plan Summary
This document is protected by copyright. No part of this document may be reproduced, adapted, transmitted, or stored in any form by any process (electronic or otherwise) without the specific written consent of Woodside. All rights are reserved.
Controlled Ref No: XX Revision: 0 Native file DRIMS No: 1400947213 Page 167 of 175
Uncontrolled when printed. Refer to electronic version for most up to date information.
The table below compares the adopted control measures for this oil spill response activity against the environmental values that can be affected when they are implemented.
Table 12-21: Analysis of risks and impacts
Environmental Value
Soil
& G
roun
dwat
er
Mar
ine
Sedi
men
t Q
ualit
y
Wat
er Q
ualit
y
Air Q
ualit
y
Ecos
yste
ms/
H
abita
t
Spec
ies
Soci
o-Ec
onom
ic
Monitor and evaluate X X
X X
Source control X X X X X
Oiled Wildlife X X
Scientific Monitoring X X X X X X X
Waste Management X X X X X
Evaluation of impacts and risks from implementing response strategies Additional stress or injury caused to wildlife
Additional stress or injury to wildlife could be caused through the following phases of a response:
• Capturing wildlife
• Transporting wildlife
• Stabilisation of wildlife
• Cleaning and rinsing of oiled wildlife
• Rehabilitation (e.g. diet, cage size, housing density)
• Release of treated wildlife
Inefficient capture techniques have the potential to cause undue stress, exhaustion or injury to wildlife, additionally pre-emptive capture could cause undue stress and impacts to wildlife when there are uncertainties in the forecast trajectory of the spill. During the transportation and stabilisation phases there is the potential for additional thermoregulation stress on captured wildlife. Additionally, during the cleaning process, it is important personnel undertaking the tasks are familiar with the relevant techniques to ensure that further injury and the removal of water proofing feathers are managed and mitigated. Finally, during the release phase it’s important that wildlife are not released back into a contaminated environment.
Vessel operations
Typical booms used in containment and recovery operations are designed to sit on the water surface, meaning that fauna capable of diving, such as cetaceans, marine turtles and sea snakes can readily avoid contact with the boom. Impacts to species that inhabit the water column such as sharks, rays and fish are not expected. Additionally, many fauna, such as cetaceans, are likely to detect and avoid the spill area, and are not expected to be present in the proximity of containment and recovery operations.
Drill cuttings and Drilling Fluids Environmental Impact Assessment for Relief Well Drilling

Angel Operations Environment Plan Summary
This document is protected by copyright. No part of this document may be reproduced, adapted, transmitted, or stored in any form by any process (electronic or otherwise) without the specific written consent of Woodside. All rights are reserved.
Controlled Ref No: XX Revision: 0 Native file DRIMS No: 1400947213 Page 168 of 175
Uncontrolled when printed. Refer to electronic version for most up to date information.
The identified potential impacts associated with the discharge of drill cuttings and fluids during a relief well drilling activity include a localised reduction in water and seabed sediment quality, and potential localised changes to benthic biota (habitats and communities).
A number of direct and indirect ecological impact pathways are identified for drill cuttings and drilling fluids as follows:
• Temporary increase in Total Suspended Solids (TSS) in the water column;
• Attenuation of light penetration as an indirect consequence of the elevation of TSS and the rate of sedimentation;
• Sediment deposition to the seabed leading to the alteration of the physico-chemical composition of sediments, and burial and potential smothering effects to sessile benthic biota; and
• Potential contamination and toxicity effects to benthic and in-water biota from drilling fluids.
Potential impacts from the discharge of cuttings range from the complete burial of benthic biota in the immediate vicinity of the well site due to sediment deposition, smothering effects from raised sedimentation concentrations as a result of elevated TSS, changes to the physico-chemical properties of the seabed sediments (particle size distribution and potential for reduction in oxygen levels within the surface sediments due to organic matter degradation by aerobic bacteria) and subsequent changes to the composition of infauna communities to minor sediment loading above background and no associated ecological effects. Predicted impacts are generally confined to within a few hundred metres of the discharge point (International Association of Oil and Gas Producers 2016) (ie within the ZoC for a hydrocarbon spill event).
The discharge of drill cuttings and unrecoverable fluids from relief well drilling is expected to increase turbidity and TSS levels in the water column, leading to an increased sedimentation rate above ambient levels associated with the settlement of suspended sediment particles in close proximity to the seabed or below sea surface, depending on location of discharge. Cuttings with retained (unrecoverable) drilling fluids are discharged below the water line at the MODU location, resulting in drill cuttings and drilling fluids rapidly diluting, as they disperse and settle through the water column. The dispersion and fate of the cuttings is determined by particle size and density of the retained (unrecoverable) drilling fluids, therefore, the sediment particles will primarily settle in proximity to the well locations with potential for localised spread downstream (depending on the speed of currents throughout the water column and seabed) (IOGP 2016). The finer particles will remain in suspension and will be transported further before settling on the seabed.
The low sensitivity of the deepwater benthic communities/habitats within and in the vicinity of relief well locations, combined with the relatively low toxicity of WBM and NWBMs, no bulk discharges of NWBM and the highly localised nature and scale of predicted physical impacts to seabed biota indicate that any localised impact would likely be of a slight magnitude (especially when considering the broader consequence of the LOC event a relief well drilling activity would be responding too).
Treatment of impacts and risks from implementing response strategies The following control measures and monitoring have been adopted for the identified impacts and risks. The treatment measures identified in this assessment will be captured in Operational Plans, Tactical Response Plans, and/or First Strike Response Plans, to ensure an ALARP level is achieved.
Additional stress or injury caused to wildlife
Operations conducted with advice from the DBCA Oiled Wildlife Advisor and in accordance with the processes and methodologies described in the WA OWRP and the relevant regional plan (PS 17.3).
Vessel operations
The boom will be monitored and maintained to ensure trapped fauna are released as early as possible, with CAR activities occuring in daylight hours only (PS 15.1).
Drill Cuttings and Drilling Fluids
The low sensitivity of the deepwater benthic communities/habitats within and in the vicinity of relief well locations, combined with the relatively low toxicity of WBM and NWBMs, no bulk discharges of

Angel Operations Environment Plan Summary
This document is protected by copyright. No part of this document may be reproduced, adapted, transmitted, or stored in any form by any process (electronic or otherwise) without the specific written consent of Woodside. All rights are reserved.
Controlled Ref No: XX Revision: 0 Native file DRIMS No: 1400947213 Page 169 of 175
Uncontrolled when printed. Refer to electronic version for most up to date information.
NWBM and the highly localised nature and scale of predicted physical impacts to seabed biota indicate that any localised impact would likely be of a slight magnitude (especially when considering the broader consequence of the LOC event a relief well drilling activity would be responding too).
Monitoring of Environmental Impacts from a Response Potential impacts from an oiled wildlife operation would be monitored by the DBCA Oiled Wildlife Advisor who would advise the Incident Management Team in an OWR response. Part of the role of the OWR Advisor is to ensure that the minimum standards for OWR are being monitored and adhered to, whilst providing expert advice for critical decision making.
The risk of secondary contamination from waste management operations will be managed through appropriate zoning. This will be monitored through the submission of daily reports, detailing operations and reporting on any potential environmental impacts associated with shoreline operations.

Angel Operations Environment Plan Summary
This document is protected by copyright. No part of this document may be reproduced, adapted, transmitted, or stored in any form by any process (electronic or otherwise) without the specific written consent of Woodside. All rights are reserved.
Controlled Ref No: XX Revision: 0 Native file DRIMS No: 1400947213 Page 170 of 175
Uncontrolled when printed. Refer to electronic version for most up to date information.
APPENDIX C: SUMMARY OF STAKEHOLDER FEEDBACK AND WOODSIDE’S RESPONSE

Angel Operations Environment Plan Summary
This document is protected by copyright. No part of this document may be reproduced, adapted, transmitted, or stored in any form by any process (electronic or otherwise) without the specific written consent of Woodside. All rights are reserved.
Controlled Ref No: XX Revision: 0 Native file DRIMS No: 1400947213 Page 171 of 175
Uncontrolled when printed. Refer to electronic version for most up to date information.
Relevant Stakeholder feedback for the Petroleum Activities Program
Organisation Method Feedback Woodside Assessment Woodside’s Response Department of Industry, Innovation and Science
Email with fact sheet Date: 2 February 2018 Feedback summary: No response at the time of submission.
Woodside will accept and assess feedback from stakeholder post EP submission to NOPSEMA.
Response/Action: No further action required.
Department of Mines, Industry Regulation and Safety
Email with fact sheet Date: 2 February 2018 Feedback summary: No response at the time of submission.
Woodside will accept and assess feedback from stakeholder post EP submission to NOPSEMA.
Response/Action: No further action required.
AMSA (maritime safety) Email with fact sheet Date: 2 February 2018 Feedback summary: The Authority advised that it had no comments to provide about the EP revision.
The stakeholder raised no claims or objections.
Response/Action: No further action required. Attached: Appendix F
Australian Hydrographic Service
Email with fact sheet Date: 5 February 2018 Feedback summary: The Service acknowledged that it had received consultation information for the EP.
The stakeholder raised no claims or objections.
Response/Action: No further action required. Attached: Appendix F
Department of Primary Industries and Regional Development
Email with fact sheet and fishery map
Date: 9 February 2018 Feedback summary: The Department acknowledged that no major changes were proposed in the EP and that it had no comments to provide at this time.
The stakeholder raised no claims or objections.
Response/Action: No further action required. Attached: Appendix F
Commonwealth fisheries • North West Slope
Trawl • Western Tuna and
Billfish Fishery • Western Deepwater
Trawl.
Email with fact sheet and fishery map
Date: 2 February 2018 Feedback summary: No response at the time of submission.
Woodside will accept and assess feedback from stakeholder post EP submission to NOPSEMA.
Response/Action: No further action required.

Angel Operations Environment Plan Summary
This document is protected by copyright. No part of this document may be reproduced, adapted, transmitted, or stored in any form by any process (electronic or otherwise) without the specific written consent of Woodside. All rights are reserved.
Controlled Ref No: XX Revision: 0 Native file DRIMS No: 1400947213 Page 172 of 175
Uncontrolled when printed. Refer to electronic version for most up to date information.
Organisation Method Feedback Woodside Assessment Woodside’s Response Western Australian Fisheries
• Pilbara Fish Trawl • Pilbara Trap • Specimen Shell • Mackerel • Onslow Prawn.
Letter with fact sheet and fishery map
Date: 2 February 2018 Feedback summary: No response at the time of submission.
Woodside will accept and assess feedback from stakeholder post EP submission to NOPSEMA.
Response/Action: No further action required.
Department of Defence Email with fact sheet and map of defence zones
Date: 2 February 2018 Feedback summary: No response at the time of submission.
Woodside will accept and assess feedback from stakeholder post EP submission to NOPSEMA.
Response/Action: No further action required.
Department of Transport Email with fact sheet Date: 9 February 2018 Feedback summary: The Department advised that changes to the OPEP need to be consulted in accordance with the Offshore Petroleum Industry Guidance Note – Marine Oil Pollution: Response and Consultation Arrangements (December 2017).
Woodside acknowledges the advice and guidance note provided by the Department.
Response/Action: No further action required. Attached: Appendix F
Email with draft Oil Pollution First Strike Plan
Date 7 May 2018 Feedback summary: The Department advised it would review the draft Angel Oil Pollution First Strike Plan and advise of any queries.
Woodside will accept and assess feedback from stakeholder.
Response/Action: No further action required. Attached: Appendix F
Date 6 June 2018 Feedback summary: The Department advised that the Angel Oil Pollution First Strike Plan contained a reference to the old Industry Guidance Notes (January 2017 version) and requested an updated First Strike Plan.
Woodside provided the Angel Oil Pollution First Strike Plan with reference updated.
Response/Action: No further action required. Attached: Appendix F
Commonwealth Fisheries Association
Email with fact sheet and fishery map
Date: 2 February 2018 Feedback summary: No response at the time of submission.
Woodside will accept and assess feedback from stakeholder post EP submission to NOPSEMA.
Response/Action: No further action required.
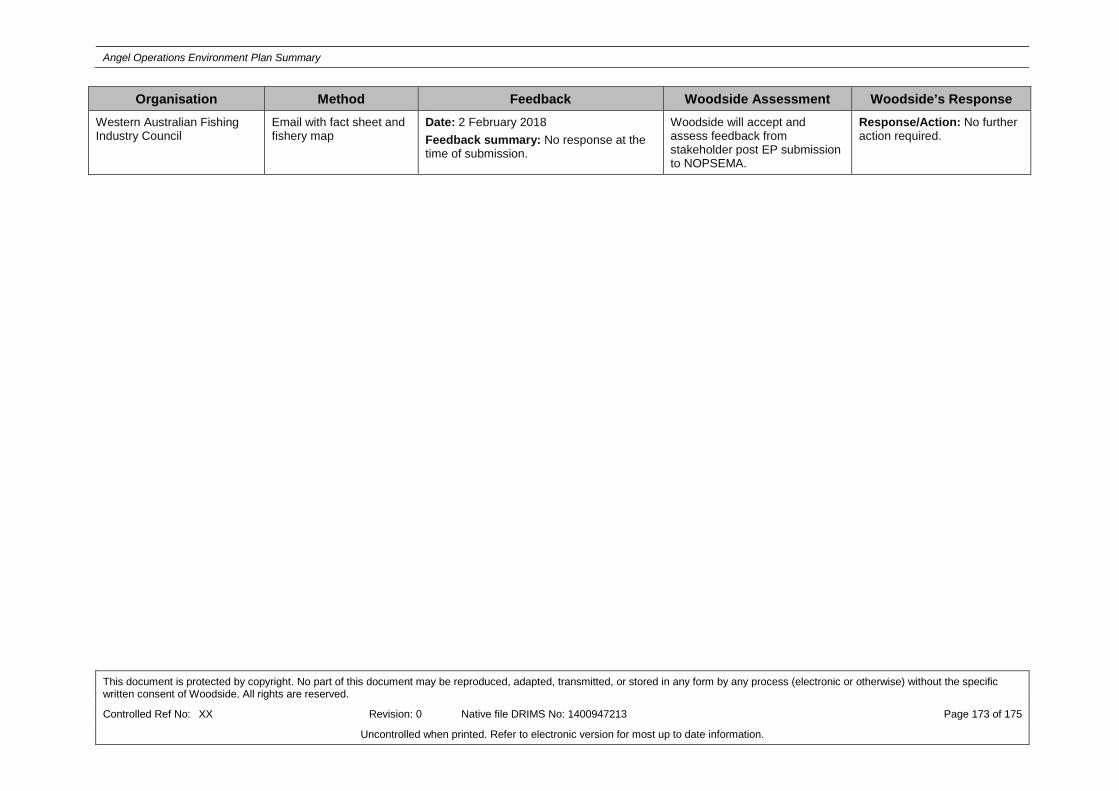
Angel Operations Environment Plan Summary
This document is protected by copyright. No part of this document may be reproduced, adapted, transmitted, or stored in any form by any process (electronic or otherwise) without the specific written consent of Woodside. All rights are reserved.
Controlled Ref No: XX Revision: 0 Native file DRIMS No: 1400947213 Page 173 of 175
Uncontrolled when printed. Refer to electronic version for most up to date information.
Organisation Method Feedback Woodside Assessment Woodside’s Response Western Australian Fishing Industry Council
Email with fact sheet and fishery map
Date: 2 February 2018 Feedback summary: No response at the time of submission.
Woodside will accept and assess feedback from stakeholder post EP submission to NOPSEMA.
Response/Action: No further action required.

Angel Operations Environment Plan Summary
This document is protected by copyright. No part of this document may be reproduced, adapted, transmitted, or stored in any form by any process (electronic or otherwise) without the specific written consent of Woodside. All rights are reserved.
Controlled Ref No: XX Revision: 0 Native file DRIMS No: 1400947213 Page 174 of 175
Uncontrolled when printed. Refer to electronic version for most up to date information.
Feedback from Interested Stakeholders on the Petroleum Activities Program
Organisation Method Feedback Woodside assessment Woodside’s Response AFMA Email with fact sheet and
fishery map Date: 2 February 2018 Feedback summary: No response at the time of submission.
Woodside will accept and assess feedback from stakeholder post EP submission to NOPSEMA.
Response/Action: No further action required.
AMSA (marine pollution) Email with fact sheet Date: 2 February 2018 Feedback summary: No response at the time of submission.
Woodside will accept and assess feedback from stakeholder post EP submission to NOPSEMA.
Response/Action: No further action required.
Australian Conservation Foundation
Email with fact sheet Date: 2 February 2018 Feedback summary: No response at the time of submission.
Woodside will accept and assess feedback from stakeholder post EP submission to NOPSEMA.
Response/Action: No further action required.
AMOSC Email with fact sheet Date: 2 February 2018 Feedback summary: No response at the time of submission.
Woodside will accept and assess feedback from stakeholder post EP submission to NOPSEMA.
Response/Action: No further action required.
APPEA Email with fact sheet Date: 2 February 2018 Feedback summary: No response at the time of submission.
Woodside will accept and assess feedback from stakeholder post EP submission to NOPSEMA.
Response/Action: No further action required.
Pearl Producers Association Email with fact sheet and fishery map
Date: 2 February 2018 Feedback summary: No response at the time of submission.
Woodside will accept and assess feedback from stakeholder post EP submission to NOPSEMA.
Response/Action: No further action required.
RecfishWest Email with fact sheet Date: 2 February 2018 Feedback summary: No response at the time of submission.
Woodside will accept and assess feedback from stakeholder post EP submission to NOPSEMA.
Response/Action: No further action required.
World Wildlife Foundation Email with fact sheet Date: 2 February 2018 Feedback summary: No response at the time of submission.
Woodside will accept and assess feedback from stakeholder post EP submission
Response/Action: No further action required.
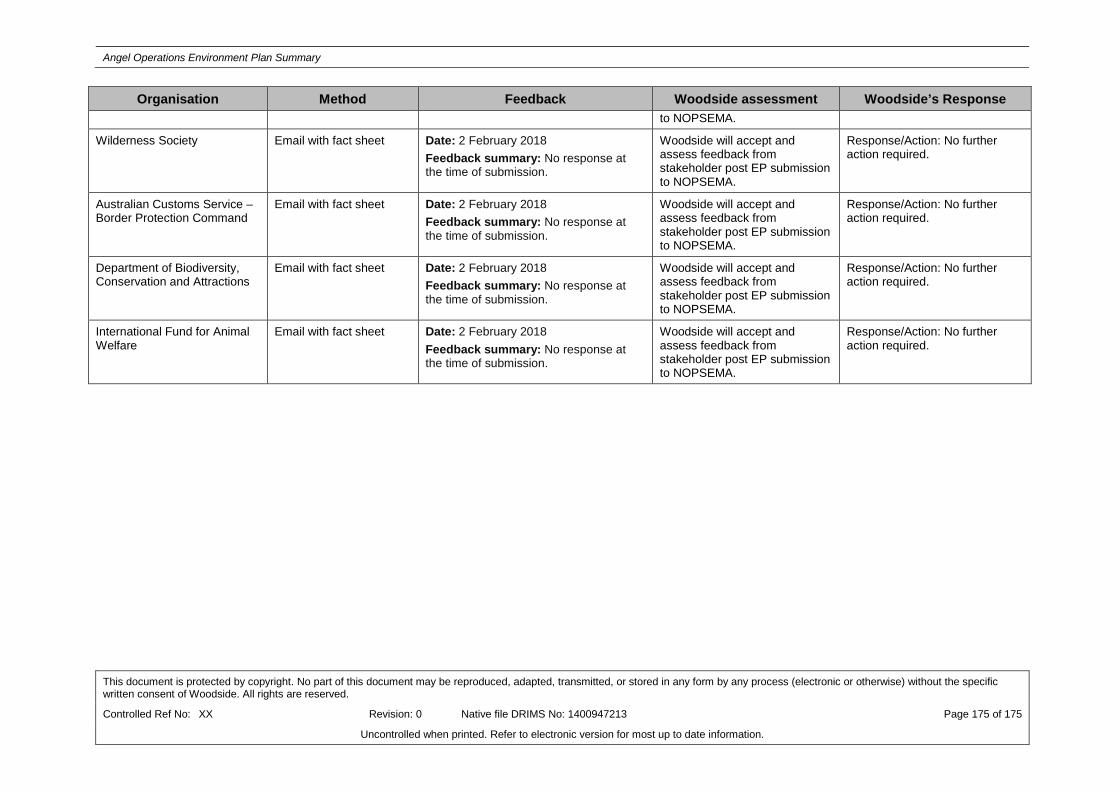
Angel Operations Environment Plan Summary
This document is protected by copyright. No part of this document may be reproduced, adapted, transmitted, or stored in any form by any process (electronic or otherwise) without the specific written consent of Woodside. All rights are reserved.
Controlled Ref No: XX Revision: 0 Native file DRIMS No: 1400947213 Page 175 of 175
Uncontrolled when printed. Refer to electronic version for most up to date information.
Organisation Method Feedback Woodside assessment Woodside’s Response to NOPSEMA.
Wilderness Society Email with fact sheet Date: 2 February 2018 Feedback summary: No response at the time of submission.
Woodside will accept and assess feedback from stakeholder post EP submission to NOPSEMA.
Response/Action: No further action required.
Australian Customs Service – Border Protection Command
Email with fact sheet Date: 2 February 2018 Feedback summary: No response at the time of submission.
Woodside will accept and assess feedback from stakeholder post EP submission to NOPSEMA.
Response/Action: No further action required.
Department of Biodiversity, Conservation and Attractions
Email with fact sheet Date: 2 February 2018 Feedback summary: No response at the time of submission.
Woodside will accept and assess feedback from stakeholder post EP submission to NOPSEMA.
Response/Action: No further action required.
International Fund for Animal Welfare
Email with fact sheet Date: 2 February 2018 Feedback summary: No response at the time of submission.
Woodside will accept and assess feedback from stakeholder post EP submission to NOPSEMA.
Response/Action: No further action required.