An Investigation of secondary student perceptions of fairness ...
153
Edith Cowan University Research Online eses: Doctorates and Masters eses 2019 An Investigation of secondary student perceptions of fairness about assessment processes implemented by their teachers Tania Blazevic Edith Cowan University is esis is posted at Research Online. hps://ro.ecu.edu.au/theses/2188 Recommended Citation Blazevic, T. (2019). An Investigation of secondary student perceptions of fairness about assessment processes implemented by their teachers. Retrieved from hps://ro.ecu.edu.au/theses/2188
-
Upload
khangminh22 -
Category
Documents
-
view
1 -
download
0
Transcript of An Investigation of secondary student perceptions of fairness ...

Edith Cowan UniversityResearch Online
Theses: Doctorates and Masters Theses
2019
An Investigation of secondary student perceptionsof fairness about assessment processesimplemented by their teachersTania BlazevicEdith Cowan University
This Thesis is posted at Research Online.https://ro.ecu.edu.au/theses/2188
Recommended CitationBlazevic, T. (2019). An Investigation of secondary student perceptions of fairness about assessment processes implemented by their teachers.Retrieved from https://ro.ecu.edu.au/theses/2188
Edith Cowan University
Copyright Warning
You may print or download ONE copy of this document for the purpose
of your own research or study.
The University does not authorize you to copy, communicate or
otherwise make available electronically to any other person any
copyright material contained on this site.
You are reminded of the following:
Copyright owners are entitled to take legal action against persons
who infringe their copyright.
A reproduction of material that is protected by copyright may be a
copyright infringement. Where the reproduction of such material is
done without attribution of authorship, with false attribution of
authorship or the authorship is treated in a derogatory manner,
this may be a breach of the author’s moral rights contained in Part
IX of the Copyright Act 1968 (Cth).
Courts have the power to impose a wide range of civil and criminal
sanctions for infringement of copyright, infringement of moral
rights and other offences under the Copyright Act 1968 (Cth).
Higher penalties may apply, and higher damages may be awarded,
for offences and infringements involving the conversion of material
into digital or electronic form.
AnInvestigationofSecondaryStudentPerceptionsofFairnessaboutAssessmentProcessesImplementedbytheirTeachers
TaniaBlazevic
ThisthesisispresentedinfulfilmentoftherequirementsofthedegreeofDoctorofPhilosophy
School ofEducationEdithCowanUniversity
2018

USE OF THESIS
The Use of Thesis statement is not included in this version of the thesis.
ii
Abstract
This research investigated the effects of secondary school teachers’ assessment
practices on students’ perceptions of fairness in Croatia. It focused on the extent to which
teachers implemented consistent assessment practices and made judgements of student
achievements, and how this affected students’ perceptions.
The need for assessment influences its creation and implementation, which in turn
influences the outcomes. Teachers’ assessment of students is an ongoing practice in
schools in Croatia, both officially and unofficially, and questions about consistent
application have persisted. This research was motivated by a confrontation with a
disgruntled student and set in motion an examination of teachers’ application of assessment
criteria to determine whether the end result was judged to be fair.
The research design was both empirical and quasi-ethnographic in interpreting
teachers’ and students’ perceptions to fully understand the context. Student questionnaires,
teacher interviews and teacher assessment documents were used to collect data and analyse
the case studies, each represented by a teacher and two classrooms of students studying
either Biology, Croatian or English. The participants comprised secondary school students
from two respective high schools in Split.
Students completed a questionnaire comprised of statements with Likert-scale
responses modelled on the Student Perception of Assessment Questionnaire (SPAQ), and
open-ended questions based on a questionnaire developed at the Centre for Schooling and
Learning Technologies (CSaLT). The SPAQ items were ranked according to five scales.
At their interviews, teachers were asked to provide documents illustrating their assessment
of students in their subjects. The documents were analysed to assist with interpreting the
survey and interview data, and interestingly, not only revealed differences in responses
between teachers and subjects, but also differences between the responses of students in
two classes who were taught the same subject by the same teacher.
Despite a positive assessment rating by students, the findings showed several
inconsistencies compromised the fairness of teacher assessments, particularly in oral
examinations, a substantial form of assessment for all subjects in Croatia. This research is
the first of its kind and suggests that oral examination should be reviewed, and additional
steps taken to improve consistency in teacher application of assessment. In the meantime,
for as long as it continues, consistency can and should be enhanced to ensure fairer
iii
outcomes for students, since positive learning experiences are known to holistically
inculcate enthusiastic and affirmative attitudes towards education.
v
Acknowledgements
To my children and my supervisors both living and deceased. They represent
sources of inspiration, tribulation and resolution.
vi
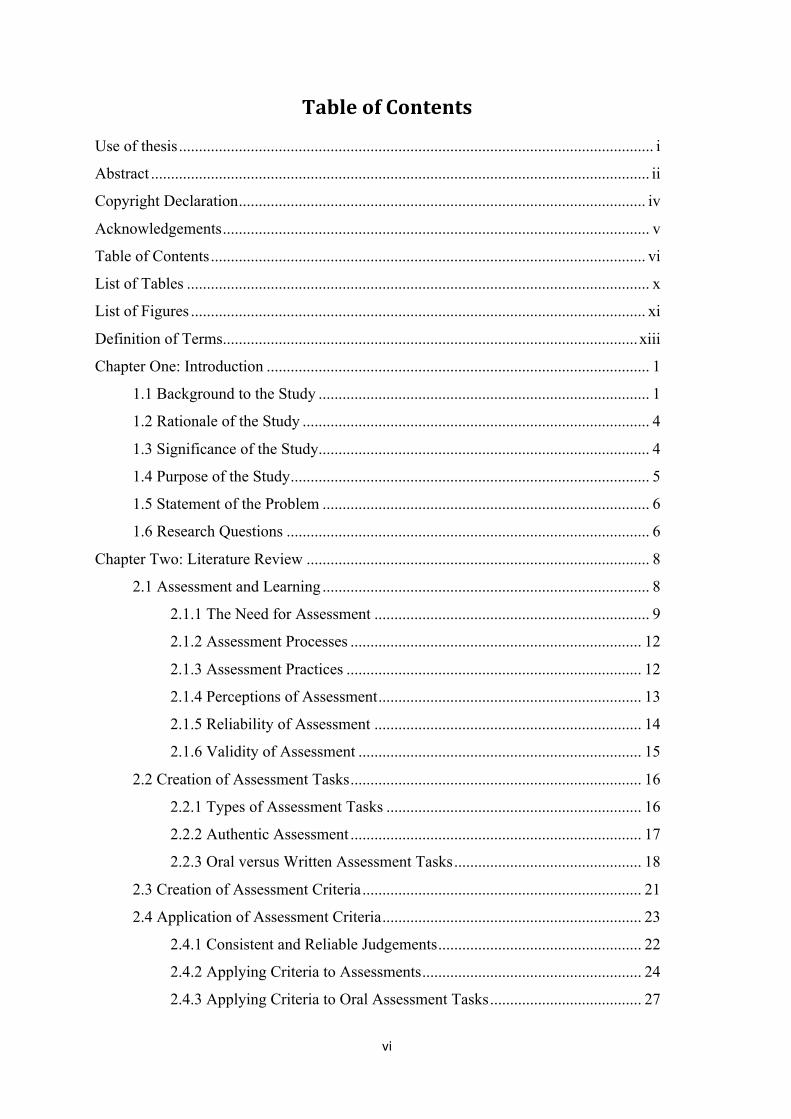
TableofContents
Use of thesis ....................................................................................................................... i
Abstract ............................................................................................................................. ii
Copyright Declaration ...................................................................................................... iv
Acknowledgements ........................................................................................................... v
Table of Contents ............................................................................................................. vi
List of Tables .................................................................................................................... x
List of Figures .................................................................................................................. xi
Definition of Terms ........................................................................................................ xiii
Chapter One: Introduction ................................................................................................ 1
1.1 Background to the Study ................................................................................... 1
1.2 Rationale of the Study ....................................................................................... 4
1.3 Significance of the Study ................................................................................... 4
1.4 Purpose of the Study .......................................................................................... 5
1.5 Statement of the Problem .................................................................................. 6
1.6 Research Questions ........................................................................................... 6
Chapter Two: Literature Review ...................................................................................... 8
2.1 Assessment and Learning .................................................................................. 8
2.1.1 The Need for Assessment ..................................................................... 9
2.1.2 Assessment Processes ......................................................................... 12
2.1.3 Assessment Practices .......................................................................... 12
2.1.4 Perceptions of Assessment .................................................................. 13
2.1.5 Reliability of Assessment ................................................................... 14
2.1.6 Validity of Assessment ....................................................................... 15
2.2 Creation of Assessment Tasks ......................................................................... 16
2.2.1 Types of Assessment Tasks ................................................................ 16
2.2.2 Authentic Assessment ......................................................................... 17
2.2.3 Oral versus Written Assessment Tasks ............................................... 18
2.3 Creation of Assessment Criteria ...................................................................... 21
2.4 Application of Assessment Criteria ................................................................. 23
2.4.1 Consistent and Reliable Judgements ................................................... 22
2.4.2 Applying Criteria to Assessments ....................................................... 24
2.4.3 Applying Criteria to Oral Assessment Tasks ...................................... 27
vii
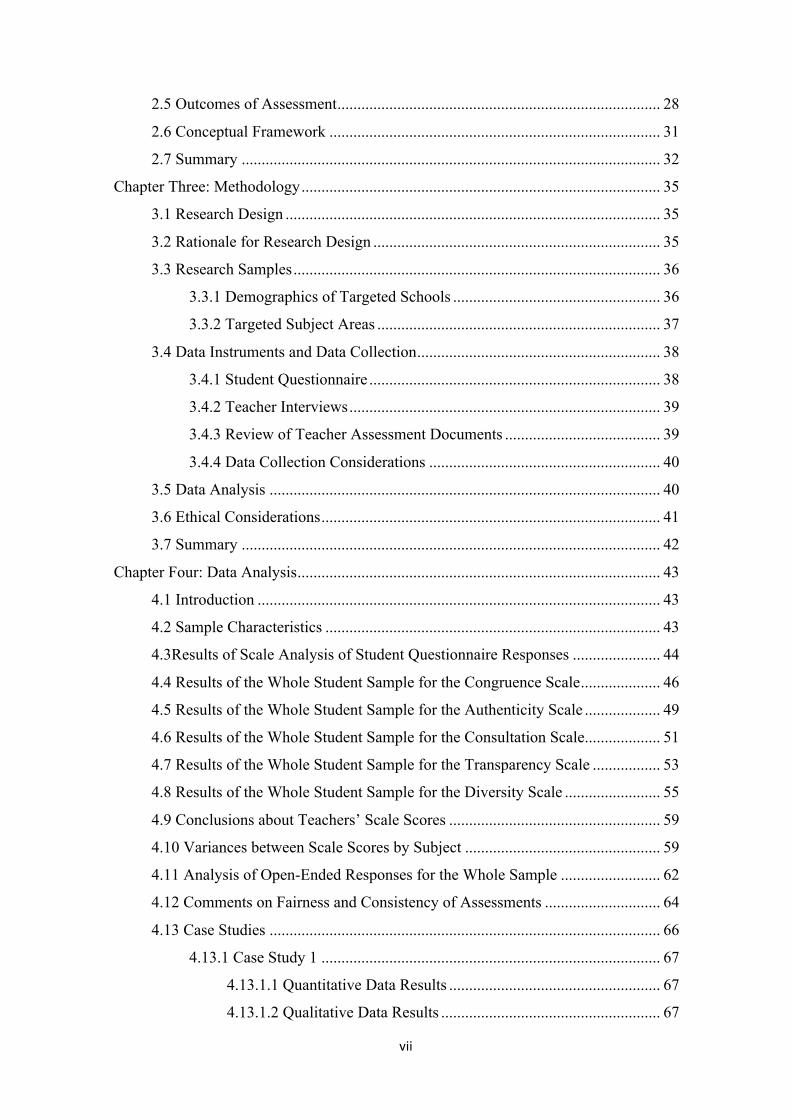
2.5 Outcomes of Assessment ................................................................................. 28
2.6 Conceptual Framework ................................................................................... 31
2.7 Summary ......................................................................................................... 32
Chapter Three: Methodology .......................................................................................... 35
3.1 Research Design .............................................................................................. 35
3.2 Rationale for Research Design ........................................................................ 35
3.3 Research Samples ............................................................................................ 36
3.3.1 Demographics of Targeted Schools .................................................... 36
3.3.2 Targeted Subject Areas ....................................................................... 37
3.4 Data Instruments and Data Collection ............................................................. 38
3.4.1 Student Questionnaire ......................................................................... 38
3.4.2 Teacher Interviews .............................................................................. 39
3.4.3 Review of Teacher Assessment Documents ....................................... 39
3.4.4 Data Collection Considerations .......................................................... 40
3.5 Data Analysis .................................................................................................. 40
3.6 Ethical Considerations ..................................................................................... 41
3.7 Summary ......................................................................................................... 42
Chapter Four: Data Analysis ........................................................................................... 43
4.1 Introduction ..................................................................................................... 43
4.2 Sample Characteristics .................................................................................... 43
4.3Results of Scale Analysis of Student Questionnaire Responses ...................... 44
4.4 Results of the Whole Student Sample for the Congruence Scale .................... 46
4.5 Results of the Whole Student Sample for the Authenticity Scale ................... 49
4.6 Results of the Whole Student Sample for the Consultation Scale ................... 51
4.7 Results of the Whole Student Sample for the Transparency Scale ................. 53
4.8 Results of the Whole Student Sample for the Diversity Scale ........................ 55
4.9 Conclusions about Teachers’ Scale Scores ..................................................... 59
4.10 Variances between Scale Scores by Subject ................................................. 59
4.11 Analysis of Open-Ended Responses for the Whole Sample ......................... 62
4.12 Comments on Fairness and Consistency of Assessments ............................. 64
4.13 Case Studies .................................................................................................. 66
4.13.1 Case Study 1 ..................................................................................... 67
4.13.1.1 Quantitative Data Results ..................................................... 67
4.13.1.2 Qualitative Data Results ....................................................... 67
viii
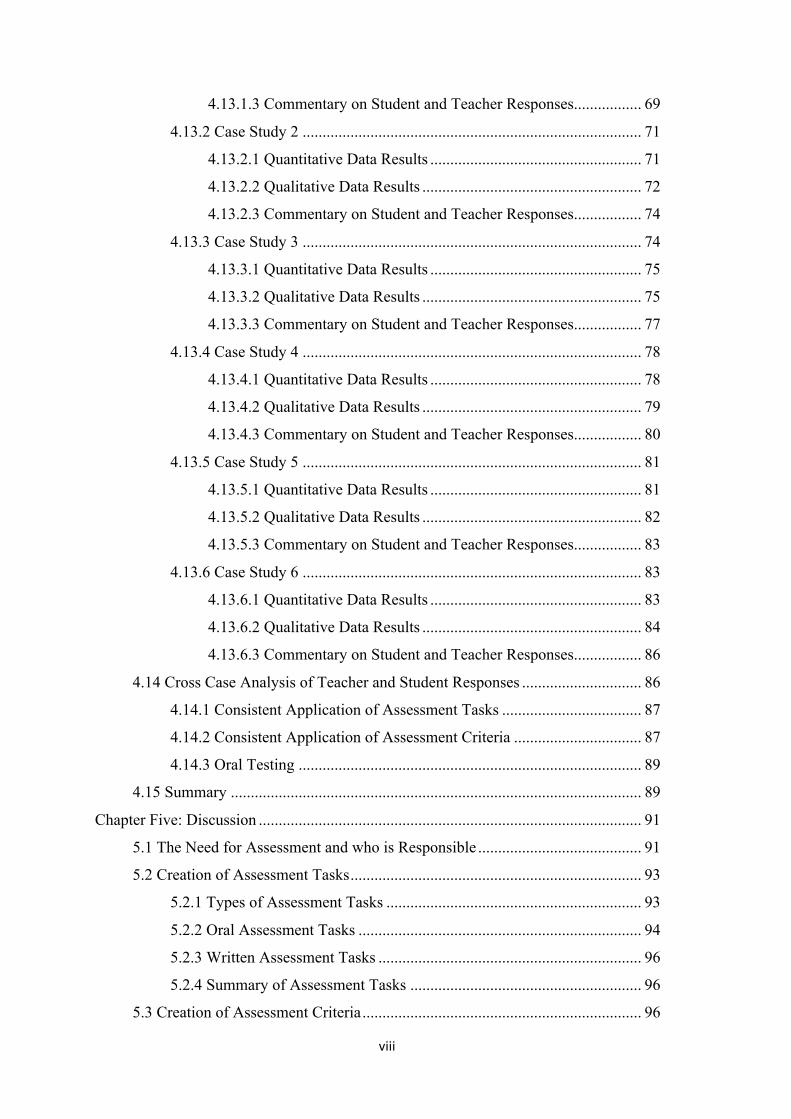
4.13.1.3 Commentary on Student and Teacher Responses ................. 69
4.13.2 Case Study 2 ..................................................................................... 71
4.13.2.1 Quantitative Data Results ..................................................... 71
4.13.2.2 Qualitative Data Results ....................................................... 72
4.13.2.3 Commentary on Student and Teacher Responses ................. 74
4.13.3 Case Study 3 ..................................................................................... 74
4.13.3.1 Quantitative Data Results ..................................................... 75
4.13.3.2 Qualitative Data Results ....................................................... 75
4.13.3.3 Commentary on Student and Teacher Responses ................. 77
4.13.4 Case Study 4 ..................................................................................... 78
4.13.4.1 Quantitative Data Results ..................................................... 78
4.13.4.2 Qualitative Data Results ....................................................... 79
4.13.4.3 Commentary on Student and Teacher Responses ................. 80
4.13.5 Case Study 5 ..................................................................................... 81
4.13.5.1 Quantitative Data Results ..................................................... 81
4.13.5.2 Qualitative Data Results ....................................................... 82
4.13.5.3 Commentary on Student and Teacher Responses ................. 83
4.13.6 Case Study 6 ..................................................................................... 83
4.13.6.1 Quantitative Data Results ..................................................... 83
4.13.6.2 Qualitative Data Results ....................................................... 84
4.13.6.3 Commentary on Student and Teacher Responses ................. 86
4.14 Cross Case Analysis of Teacher and Student Responses .............................. 86
4.14.1 Consistent Application of Assessment Tasks ................................... 87
4.14.2 Consistent Application of Assessment Criteria ................................ 87
4.14.3 Oral Testing ...................................................................................... 89
4.15 Summary ....................................................................................................... 89
Chapter Five: Discussion ................................................................................................ 91
5.1 The Need for Assessment and who is Responsible ......................................... 91
5.2 Creation of Assessment Tasks ......................................................................... 93
5.2.1 Types of Assessment Tasks ................................................................ 93
5.2.2 Oral Assessment Tasks ....................................................................... 94
5.2.3 Written Assessment Tasks .................................................................. 96
5.2.4 Summary of Assessment Tasks .......................................................... 96
5.3 Creation of Assessment Criteria ...................................................................... 96

ix
5.3.1 Criteria for Oral Assessment ............................................................... 97
5.3.2 Selection of Criteria ........................................................................... 97
5.3.3 Student Access to Criteria ................................................................... 98
5.3.4 Student Acceptance of Assessment Tasks and Criteria ...................... 99
5.4 Application of Assessment Tasks and Criteria ................................................ 99
5.4.1 Validity, Fairness and Reliability ..................................................... 101
5.4.2 Differences between Subjects ........................................................... 102
5.4.3 Student Acceptance of Assessment ................................................... 103
5.5 Outcomes Based on Assessment ................................................................... 104
5.6 Impact on Student Perceptions of Assessment .............................................. 105
5.7 Summary ....................................................................................................... 106
Chapter Six: Conclusions and Recommendations ........................................................ 108
6.1 Response to Research Questions ................................................................... 108
6.2 Recommendations for Policy and Practice .................................................... 109
6.3 Limitations of the Research ........................................................................... 110
6.4 Directions for Future Research ...................................................................... 111
6.5 Concluding Comments .................................................................................. 111
References ..................................................................................................................... 113
Appendices .................................................................................................................... 123
Appendix A: Student Questionnaire ............................................................................. 123
Appendix B: Translation of Student Questionnaire into Croatian ................................ 127
Appendix C: Teacher Interview Questions ................................................................... 131
Appendix D: Translation of Teacher Interview Questions into Croatian ..................... 132
Appendix E: Letter of Informed Consent ..................................................................... 133
Appendix F: Information Sheets for Teachers and Students ........................................ 134
x
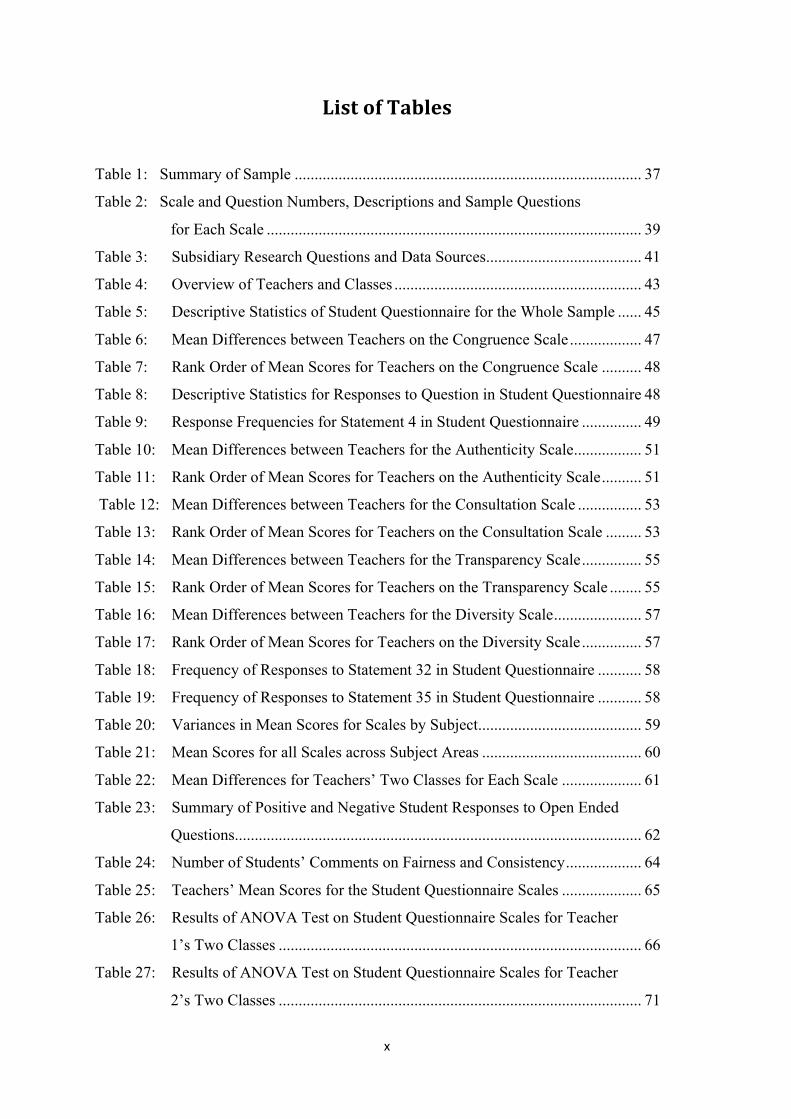
ListofTablesTable 1: Summary of Sample ....................................................................................... 37
Table 2: Scale and Question Numbers, Descriptions and Sample Questions
for Each Scale .............................................................................................. 39
Table 3: Subsidiary Research Questions and Data Sources ....................................... 41
Table 4: Overview of Teachers and Classes .............................................................. 43
Table 5: Descriptive Statistics of Student Questionnaire for the Whole Sample ...... 45
Table 6: Mean Differences between Teachers on the Congruence Scale .................. 47
Table 7: Rank Order of Mean Scores for Teachers on the Congruence Scale .......... 48
Table 8: Descriptive Statistics for Responses to Question in Student Questionnaire 48
Table 9: Response Frequencies for Statement 4 in Student Questionnaire ............... 49
Table 10: Mean Differences between Teachers for the Authenticity Scale ................. 51
Table 11: Rank Order of Mean Scores for Teachers on the Authenticity Scale .......... 51
Table 12: Mean Differences between Teachers for the Consultation Scale ................ 53
Table 13: Rank Order of Mean Scores for Teachers on the Consultation Scale ......... 53
Table 14: Mean Differences between Teachers for the Transparency Scale ............... 55
Table 15: Rank Order of Mean Scores for Teachers on the Transparency Scale ........ 55
Table 16: Mean Differences between Teachers for the Diversity Scale ...................... 57
Table 17: Rank Order of Mean Scores for Teachers on the Diversity Scale ............... 57
Table 18: Frequency of Responses to Statement 32 in Student Questionnaire ........... 58
Table 19: Frequency of Responses to Statement 35 in Student Questionnaire ........... 58
Table 20: Variances in Mean Scores for Scales by Subject ......................................... 59
Table 21: Mean Scores for all Scales across Subject Areas ........................................ 60
Table 22: Mean Differences for Teachers’ Two Classes for Each Scale .................... 61
Table 23: Summary of Positive and Negative Student Responses to Open Ended
Questions...................................................................................................... 62
Table 24: Number of Students’ Comments on Fairness and Consistency ................... 64
Table 25: Teachers’ Mean Scores for the Student Questionnaire Scales .................... 65
Table 26: Results of ANOVA Test on Student Questionnaire Scales for Teacher
1’s Two Classes ........................................................................................... 66
Table 27: Results of ANOVA Test on Student Questionnaire Scales for Teacher
2’s Two Classes ........................................................................................... 71

xi
Table 28: Results of ANOVA Test on Student Questionnaire Scales for Teacher
3’s Two Classes ........................................................................................... 74
Table 29: Results of ANOVA Test on Student Questionnaire Scales for Teacher
4’s Two Classes ........................................................................................... 78
Table 30: Results of ANOVA Test on Student Questionnaire Scales for Teacher
5’s Two Classes ........................................................................................... 81
Table 31: Results of ANOVA Test on Student Questionnaire Scales for Teacher
6’s Two Classes ........................................................................................... 84
xii
ListofFigures
Figure 1: Conceptual Framework ................................................................................ 32
Figure 2: Histogram of the Whole Sample for the Congruence Scale ......................... 46
Figure 3: Mean Score for Each Teacher on the Congruence Scale ............................. 47
Figure 4: Histogram of the Whole Sample for the Authenticity Scale ........................ 49
Figure 5: Mean Score for Each Teacher on the Authenticity Scale ............................. 50
Figure 6: Histogram of the Whole Sample for the Consultation Scale ........................ 52
Figure 7: Mean Score for Each Teacher on the Consultation Scale ............................ 52
Figure 8: Histogram of the Whole Sample for the Transparency Scale ...................... 54
Figure 9: Mean Score for Each Teacher on the Transparency Scale ........................... 54
Figure 10: Histogram of the whole Sample for the Diversity Scale ............................ 56
Figure 11: Mean Score for Each Teacher on the Diversity Scale ................................ 57
Figure 12: Mean of Students’ Responses by Subject and Scale in Graphical Form .... 60
Figure 13: Female Students’ Comments on Fairness and Consistency ....................... 63
Figure 14: Male Students’ Comments on Fairness and Consistency ........................... 64
Figure 15: Mean Score for Each Teacher for the Student Questionnaire Scales ......... 65
xiii
DefinitionofTerms
Educational Assessment: The process of documenting knowledge, performance, skills,
attitudes and perceptions of students within an education establishment (Wright,
2008). In this research, assessment focused on implementation of the assessment
process by teachers with individual learners, i.e. students.
Assessment Criteria: Specifications of what must be achieved in a particular task (Fastre,
G.M., van der Klink, M.R.,& van Merrienboer, J.J., 2010).
Fairness: Treating people equally or in a way that is right and reasonable (Cole & Ziecky,
2001, Cambridge Advanced Learner’s Dictionary, 2013).
Consistency: Refers to someone always behaving or performing in a similar way (Cole &
Zieky, 2001; Cambridge Advanced Learner’s Dictionary, 2013),
Student Perception of Assessment: The act of the student perceiving the assessment (van
de Watering,G.A., Gijbels, D., Dochy,F., & van der Rijt, J., 2008).
Judgement: The ability to form value opinions and make good decisions (Cambridge
Dictionary, 2015).
Student = assessee = stakeholder (Short & Greer, 2002): The student being assessed by
the teacher.
Teacher = assessor = stake determiner: The teacher in charge of assessing the student
(Furman, 2009).
Validity of Assessment: The accuracy of assessment (Masters, 2013).
Reliability of Assessment: The consistency of assessment (Masters, 2013).

1
ChapterOne:Introduction
1.1 BackgroundtotheStudy
Perception is in the eye of the beholder. I was certainly convinced of that during my
teaching career both in Australia and overseas, but it was especially highlighted for me
while teaching English as a second language and legal English at the University of Split in
Croatia.
Formerly a part of Yugoslavia, Croatia is a European country in transition from
communism to a democratic system of government. Democracy was achieved after a
majority referendum vote and an ensuing four-year long Homeland War for Independence.
Split is an ancient city nestled on the Mediterranean. It is a melting pot of many historical
influences, including the remnants of Austro-Hungarian rule.
That same sense of acceptance people had become accustomed to in their daily
lives was not reflected in the Croatian education system. Students frequently complained
about the inconsistency of teachers’ assessment of their work and the unfairness of the
education system. Many claimed they had been awarded poor grades as payback for
behaviour their teacher disapproved of or forgetting to bring items to class, and believed
they were in fact assessed on how much the teacher liked them. In their opinion, students
who were “liked” by teachers and complied with their agendas received better grades than
others, as did students who were able to regurgitate curriculum content without learning
anything. Those who did not conform were punished, often in the form of poor grades.
Students’ bags were filled with books; the limited contents of which formed the
basis of all subject assessments. Oral assessments were common. Students were observed
flaunting their unpreparedness when it was their turn to present in oral examination or oral
assessment. Also, I gradually became aware that students believed teachers’ attitudes
towards them were negative when it came to assessment, that teachers wanted to focus on
what students did not know, and of the stress students were under when they had to orally
answer assessment questions in front of the class.
These circumstances led me to investigate teachers’ assessments of secondary
students’ work and students’ perceptions of fairness. Assessment is a critical component of
curriculum and pedagogy that influences the behaviour of both students and teachers. This
is particularly crucial in secondary school where the outcomes have far-reaching
2
consequences and the stakes are high, since students’ results impact on their career options,
educational opportunities and employment prospects, how they are perceived by others and
how they perceive themselves. As a result, students have persistently raised questions
about the fairness of assessment processes and practices, highlighting the need for
consistency and equitable opportunities for students to be evaluated on their knowledge
and skills (Cole & Ziecky, 2001). Two secondary schools were used for the purposes of
this research. These schools were both grammar schools or gymnasia. Secondary schools
in Croatia require students’ primary school grade average for admission. Students’ grade
average is ranked. Grammar schools require the highest grade averages from students,
followed by vocational schools, and then trade schools which students, statically speaking,
with the lowest grade average attended.
Croatia, since entry into the European Union, is undergoing curricular reform. Its
education system is under review in an effort to improve the system. Assessment is just
one aspect of the education system in need of reform. Assessment is an underexplored area
in Croatia. It is hope that this research will assist in identifying issues in need of reform as
well as uncovering strategies to assist this process.
In Croatia, students must gain at least a grade average of 3 on a scale of passing
grades from 2 to 5, in addition to successful matura completion to gain a place at
university. Furthermore, they must pass all 17 secondary school subjects in the
matriculation year to sit the matura, otherwise they must wait until they have passed any
failed subject/s before being permitted to do so. This is not in the students’ interests
because university places are mostly full after the first matura session and before the
second matura session takes place. There are two matura sessions, one taking place in June
and one in September for students who have failed in June. Alternatively, students can wait
until the following year’s session to pass the relevant subject/s before taking the matura.
This also applies to students who pass all their subjects, but only in the second matura
session in any year.
There has been limited research into fairness as an ongoing interactive process
between assessee and assessor; in this case, students and teachers. Delandshere (2002)
noted that fairness can be viewed from a simply technical perspective, such as correctly
adding up test marks. The very nature of assessment implies an imbalance of power, where
students are at the behest of teachers who make decisions about their performance
(Pellegrino, Chudowsky, & Glaser, 2001). Since it is the student whose performance is
3
being assessed and the teacher who carries out the assessment there are likely to be factors
that affect the process, some related to the assessment itself and others to the student and/or
teacher.
In assessing student performance, teachers make an evaluation or judgement within
a particular context against some form of criteria or in comparison with the performance of
others. Typically, the context includes an assessment task and evidence of performance in
the form of a piece of writing, a selection of responses to questions or an audio-visual
recording. Performance can be judged against implicit and/or explicit criteria and
communicated in a number of ways, often presented as a numerical score or grade (Grgin,
2001). It is also possible for teachers’ personal judgements to influence student results
(Strahinić, 2011) and for this reason it is vital for all forms of educational assessment to
adhere to strict values, stringent assessment criteria and consistent standards of fairness
(Gordon & Fay, 2010).
The ways in which decisions about assessment criteria are made and applied to
student performance have been widely acknowledged to affect perceptions of fairness
(Canal, Bonini, Micciolo, & Tentori, 2012). Currently, explicitly stated criteria assist
teachers in making judgements by specifying what students must achieve in particular
assessment tasks and usually indicate how judgements will be presented, as in a particular
set of scores or grades representing achievement against prescribed criteria (Fastre, van der
Klink, & van Merrienboer, 2010).
Fairness in assessment is not only affected by factors related to the context and the
task, but also issues associated with judging performance, particularly assessment criteria.
The nature of criteria, how they relate to the assessment task and the manner in which they
are implemented are all likely to affect students’ perceptions of fairness. Brookhart (2013)
recommended teachers refrain from referring to aspects of “non-achievement” and avoid
negative feedback on student performance. Brookhart also advocated for criteria to relate
only to performance of the task under assessment in order to mitigate against bias and be a
true and accurate evaluation of student performance. These are some of the possible
negative effects of poorly implemented teacher assessment.
In Croatia, students frequently question consistency in the application of
assessment criteria. Grgin (2001) argued that criteria must be applied consistently for them
to be considered fair and to refute perceptions of unfairness and favouritism. In their study,
4
Gordon and Faye (2010) found perceptions of unfairness manifested in a sense of injustice,
potentially leading students to disengage more broadly from educational processes and
endeavours. It is clear that a reputation for fairness and fostering education rests largely on
assessments being viewed as a consistent and equitable process. This research was aimed
at enhancing outcomes for secondary school students in Croatia by uncovering the reasons
for inconsistencies in teachers’ assessment practices and making recommendations for
improvements.
1.2RationaleoftheStudy
In Croatia, judgements of performance are frequently perceived by students as
inaccurate and unfair, leading to feelings of injustice (Brown 2011; Strahinić, 2011) and
raising questions about consistency in assessment practices.
This research examined teacher-controlled assessment because this form of
assessment is believed to impact more significantly on student perceptions of fairness than
external assessments (Bandalos, 2004). It underpins a belief that education is not merely
about reporting to authorities, as believed by some to be the purpose of mandated external
assessment. On the other hand, teacher-controlled assessments present an opportunity for
teachers to promote positive perceptions by adhering to fair and relevant assessment
practices and supporting the true goals of education. While external assessments are
claimed to be fair, there are likely to be discrepancies between what authorities expect and
what they actually achieve (Brookhart, 2004). Teacher-controlled assessments can address
that discrepancy.
Fairness and equity are fundamental in education and quality assessment practices,
such as setting appropriate tasks and applying relevant criteria, are prerequisites (Canal,
2012). This research examined the reasons for perceptions of unfairness amongst
secondary students in Croatia.
1.3SignificanceofStudy
In Australia there are processes in place for ensuring consistent assessments.
Moderation is one procedure used by teachers to ensure consistency and comparability.
However, in light of teachers’ varying assessment practices and attitudes, even the fairness
of moderation can be challenged (Wyatt-Smith, Klenovski,& Gunn, 2010). Therefore,
study undertaken in this area needed to be examined.
5
The objective of the current research was to investigate how Croatian teachers
ascribed value to their students’ work and made judgements for assessment purposes. In
doing so, it considered the nature of cognitive and social practices in the application of
assessment criteria. The study was undertaken on the premise that assessments do not only
have a metric or numerical value, but also psychological, pedagogical, sociological and
legal effects (Grgin, 2001).
As adopted in this study, Grgin recommended a docimological approach for
analysing the factors hindering achievement of a grade in school assessment. The term
docimology consists of two Greek words: dokimos meaning tested or proven, and logos
meaning truth or scientific (Grgin, 2001). The author proposed two docimological
approaches to assessment: a) identify the negative factors that influence assessment and
grading by compromising impartiality and invalidating the results; and b) remove negative
factors through increased consistency in the application of assessment criteria and
procedures.
It can be concluded that hindrances to consistent teacher assessment of students
exist. These include teacher bias in judgement. Furthermore, analysing these hindrances
can cause the emergence of processes, for example moderation and criteria application,
which can be implemented to improve consistency in this teacher assessment.
1.4PurposeoftheStudy
The purpose of this study was to examine the impact of teacher assessments on
students’ performance and their perceptions, with the aim of promoting fairer and more
accurate outcomes. Grgin (2001) argued that pleasing the teacher exerts a negative
influence on assessment processes and practices and is wholly unrelated to demonstration
of knowledge. In this study there was evidence of students espousing opinions and
exhibiting behaviours to please their teachers; and being awarded high marks in return.
Such practices sparked anger and frustration (Canal, 2012), not to mention randomly
applied and inappropriate criteria that exacerbated student dissatisfaction in not just
assessments, but school education in general (Strahinić, 2011). Teachers can implement
practices which jeopardise the fairness and accuracy of teacher assessment of students.
Fairness in assessments can be achieved by consistent and uniform application of
criteria, appropriately aligned with what they are describing. The extent of deviation from
criteria was also measured in this study, as was the extent to which not explicitly stated
6
criteria were applied. In addition, clarification was sought about the degree to which
external factors influenced teachers’ judgements.
Finally, an understanding of students’ perceptions of assessment in terms of
consistency and uniformity was gained, since perceptions can have far-reaching
implications for learning and other aspects of self. As described by van de Watering,
Gijbels, Dochy, and van de Rijt (2008), students are all members of society, affected by
processes imposed on them.
1.5StatementoftheProblem
This research investigated the effects of teacher assessment practices on students’
perceptions of fairness in Croatian secondary schools. In secondary education students are
continually assessed by teachers and consistent practices are critical for mitigating against
negative perceptions, since they are likely to permeate other aspects of their learning.
There is an acknowledged obligation for teachers to assess students. In the first
instance, assessments are imposed by external authorities like the Croatian Education
Department, who demand regular assessment for student ranking. Whether formally or
informally, teachers are constantly assessing their students and have almost become
programmed to reach some form of judgement about their students’ performance. This
pervasive need for assessment influences the creation and implementation of criteria and
tasks, and in turn, influences assessment outcomes.
It is hoped that this research will improve the fairness and accuracy of evaluations
and foster positive perceptions, not only of assessments, but learning in general for all
stakeholders. Given that assessments are considered high stakes, this study has the
potential to change practice in constructive and affirmative ways, and form the foundation
of improved outcomes for all stakeholders.
1.6ResearchQuestions
The main research question of the study was:
How do assessment practices and processes, including the consistency of
teacher judgements in secondary school assessments, influence student
perceptionsoffairnessinCroatia?
The following subsidiary questions supported the main question:
7
1. What perceptions do Croatian secondary school students hold about the
fairnessofassessments?
2. TowhatextentareCroatianteachersconsistentintheirimplementationof
assessment processes and application of assessment criteria to students’
work in secondary school subjects, and how do these influence students’
perceptionsoffairness?
3. WhatpracticesareusedbyCroatianteachersinsecondaryschoolsubject/s
to improve their consistency in applying assessment criteria, and how do
theseinfluencestudentperceptionsoffairness?
The literature review in the next chapter outlines the relevant research aligned with
the research questions as the basis for investigating the consistency with which teachers
carried out assessments in Croatia.
8
ChapterTwo:LiteratureReview
This chapter reviews the relevant literature related to assessments and learning,
teacher assessment practices and students’ perceptions of assessment practices. The
relationship between assessment and learning is discussed, in particular the need for
assessments, as well as associated processes, practices and perceptions, including
reliability and validity. This is followed by an overview of oral versus written assessment
tasks and authentic assessment. The creation and application of assessment criteria are
outlined, as is the importance of adhering to consistent and reliable judgements for
equitable outcomes. Finally, the literature review formed the basis of a conceptual
framework reflecting the issues underlying student perceptions of teacher assessments,
consistency of teacher assessment practices and the extent to which teachers used these
practices.
2.1AssessmentandLearning
Assessment is a ubiquitous concept in education and indeed in life in general.
Assessment is the action of evaluating someone or something to determine amount, quality
or value (Cambridge Advanced Learner’s Dictionary, 2017). Stang and Pearson (2006)
viewed assessments as a significant and valuable means of examining student teachers’
evaluations and outcomes of educational programs. Assessments are also useful for
investigating beliefs and guiding actions, and have been largely responsible for steering
educational reform (Masters, 2013). Masters noted that international examinations such as
PISA (Programme for International Student Assessment) assess students’ competence in
various subjects around the world, and many countries use these results to determine
further action and/or change in their educational systems.
Some researchers expressed the view that assessment is so closely related to
learning that negative outcomes can be dangerous when they impact on students’
motivations to learn (Furman, 2009; King & Olleddick, 1989; Strahinić, 2011). From the
perspective of teachers, an aspect of learning to be considered is increasing their own
knowledge of how students learn best and identifying areas that need improvements.
Assessment in education has received much attention (Darling-Hammond, 2014)
because they are subject to teachers’ and students’ judgements of what is most important

9
(McGaw, 2006). Assessments themselves can be good or bad depending on the factors
they are based on (Norcini et al., 2011).
2.1.1TheNeedforAssessment
Human beings have always made assessments; in particular, educational
assessments have been concerned with making decisions, formulating information and
judgements about students. Educational assessment involves collecting and interpreting
evidence to make decisions about student performance. From the collected evidence,
judgements are made and communicated, and result in certain outcomes (Harlen, 2007).
Carmines and Zeller (1979) contended good measurement is an essential part of life on the
premise that accurate measurement leads to accurate conclusions. All of the afore
mentioned authors focused on issues of reliability and identified three types of validity:
criterion, content and construct validity. They used factor analysis for assessing reliability
and determining the relationship between personality traits and political attitudes of high
school students, and recommended theoretical guidance for interpreting the results.
In Croatia and Australia we are accustomed to assessment as being a requirement of
the educational system. The Organisation for Economic Cooperation and Development or
OECD, of which Australia is a member (2005), reported that assessments are a
quintessential part of the educational process, capable of promoting high levels of student
performance, equitable outcomes and learning skills. Assessments also inform teachers
about their work practices and can be used to judge the effects of local and/or national
education initiatives and for comparing education outcomes between nations.
Assessment outcomes can be communicated by way of student report cards,
external examinations or talking to colleagues and parents about students. Assessment is a
systematic approach to gathering information in order to make further decisions (Yukon
Department of Education, 2016). Processes include questioning, discussions, interviews,
student reflections, teacher and education department tests and examinations, portfolios
and observations. All these facilitate judging the performance of students for a range of
purposes, including decisions on educational pathways and placement of students. In his
interviews with Croatian teachers, Strahinić (2011) pointed out that not one teacher
expressed any opposition to grading and accepted assessments as an intrinsic part of their
role.
10
The Education Department in Croatia is responsible for overseeing education, so
one would expect them to recruit relevant experts in the field. Strahinić (2011) was of the
view that official bodies, like the Croatian Education Department, introduced grading in
schools, and in turn, this has held the institution of schooling together. None of the
Croatian teachers interviewed for this research expressed resistance to grading and viewed
assessment as a disciplinary measure for both teachers and students. In contrast, Strahinić
(2011) believed grading did not promote any positive benefits and advocated for its
abolition if schools are to become institutions of learning. He urged that assessments not be
used as a disciplinary measure, often the case in the Croatian school system, nor to punish
inappropriate student behaviour or reward desired behaviour. Instead, they should respect
the dignity of both students and their parents (Scott, Webber, Lupart, Aitken,& Scott,
2014).
The role of assessments has been of increasing interest to official bodies and
professionals (Klenowski, 2011), particularly in view of the high stakes for students. In
Australia, assessments form a critical component of education programs. For example,
Program for International Student Assessment or PISA (Thomson & De Bortoli, 2008),
was first conducted in 2000 and repeated every subsequent three years with a view to
improving education policies and outcomes. The data have increasingly been used to
assess the impact of education quality on incomes and growth, and for understanding
differences in achievements across nations. Test design, implementation and data analysis
were delegated to an international consortium of educational research institutions led by
ACER to develop and implement sampling procedures and assist with monitoring
outcomes across countries (PISA 2009 Technical Report, 2012).
Furthermore, institutions such as the Australian Curriculum Assessment and
Reporting Authority (ACARA) are very much concerned with a variety of educational
issues, including assessment (Klenowski, 2011). ACARA was responsible for devising a
national curriculum for all students in Australia that would introduce uniformity and
consistency to student learning. This body also introduced the National Assessment
Program– Literacy and Numeracy (NAPLAN), an annual assessment for students in Years
3, 5, 7 and 9, and an accepted part of the school calendar since 2008 (Perso, 2009). The
inclusion of mandated assessments by ACARA and their nationwide application infer that
they should be uniform and consistent for all students.
11
Further to the introduction of a national school curriculum in Australia, ACARA
foreshadowed a more comprehensive national assessment program (Klenowski, 2011).
The National Assessment Program (NAP) includes tests endorsed by the Ministerial
Council for Education and Early Childhood Development and Youth Affairs
(MCEECDYA) that include three annual sample assessments in science literacy, civics and
citizenship, and ICT literacy. The national results of student performance in these subjects
are used for comparing schools.
In Croatia, national curriculum reforms are taking place to align education with
current European Union trends. The Ministry of Education is attempting to reform several
aspects of education, including assessments (Agencija za odgoj i obrazovanje, 2017,).
Under review are a reduction in the number of subjects, currently over 20 in certain years
of secondary school, and the assignment of textbooks, in some cases burdening students
unnecessarily and encouraging rote learning. There is a dire need for assessments to
generate more efficient educational outcomes, and curricula reforms are still being written
to bring about improvements. The results of this research provide insights that can inform
educational reforms and improvements.
National education institutions are charged with monitoring student achievement
and ensuring schools meet their obligations. Several researchers have investigated
assessment processes, practices and their outcomes in various countries to gain a better
understanding of assessment in education (Dayal & Lingham, 2015; DeLuca et al., 2013;
MacMahone & Jones, 2015). McGaw (2006) examined the relationship between the
various purposes of assessments and their outcomes. These authors are among many in
different parts of the world who researched assessment in education and drew comparisons
between countries to deepen our understanding of the issues.
Stobart (2010) talked about assessments of the future rather than assessments of the
past, believing that they went beyond the mere task at hand and prepared students for the
future. The author proposed carrying out assessments in a forward direction, with a view to
the future challenges students are likely to encounter. Rather than focusing on
regurgitation, he claimed, teaching should promote critical thinking and develop problem-
solving skills.
Barnes, Fives, and Dacey (2017; 2015) recommended an assessment structure
comprised of three factors: a) assessment as valid for accountability; b) assessment for

12
teaching and learning; and c) assessment as irrelevant. The first two factors referred to
awarding grades, placing students into specific groups and the obligation of educational
institutions to demonstrate student achievement that qualified them for entry into careers
and other areas of society. In theirclassification of assessment as irrelevant, Barnes et al.
were alluding to the purpose of assessment in providing instructional improvement for
teachers who lacked confidence.
Implicit in these aims is an expectation for assessment practices to be fair and
equitable. Anecdotally however, this was not the case, and ultimately led to the current
study that includes an inventory of what is in place and what is needed to improve practice
and promote positive student perceptions.
2.1.2AssessmentProcesses
Assessment involves a number of processes: determining what is going to be
assessed, what form the assessment will take, creating the task, implementing the task,
judging the performance of the task and reporting on the evidence. Since conclusions are
drawn from the outcomes and form the basis of educational decisions with far-reaching
effects, it is important for all aspects of assessment to adhere to principles of fairness and
equity.
Processes are generally organised and facilitated by teachers (Brookhart, 2015;
Strahinic, 2011), often to comply with the requirements of education authorities or school
leaders. Both teachers and students accept this as an intrinsic part of formal education and
understand the transformation of their respective roles into assessor and assessee
(Domovic, 2004).
Furman (2009) talked about the negative effects of formal assessment on students,
despite which teachers are obliged to comply with their teaching requirements. Even in the
face of negative reaction, the entire school community accepts the role of formal
assessment and it continues to take place. This is also true of Croatia, where teachers are
viewed as the sole assessors of knowledge, rather than facilitators of student learning and
self-assessment (Pivac, 2009).
2.1.3AssessmentPractices
Assessment practices are different from processes in that the latter encompasses
sets of activities, whereas the former refers to the specific actions taken. Scott, Webber,
Lupart, Aitken, and Scott (2014) believed assessment methods must be accurate and align
13
with purpose and context, scoring procedures must be appropriate, interpretation of the
results must be accurate, and communication of the results must be clear. In a study of
assessments using student questionnaires and interviews, Scott et al. identified examples of
fairness and equity, and recommended improvements in teachers’ professional abilities to
conduct assessments. The authors also proposed knowledge and understanding of student
diversity in order to achieve optimal results, and for training to continue throughout
teachers’ careers.
According to Scott et al. (2014), equitable assessment practices must be promoted
at all levels. They believed assessments should be fair, non-discriminatory and reflected in
education policy and practice, and called upon the entire school community to strive for
fairness and equity. Klenowski (2013) defined the concept of fairness in assessment as
equal opportunities for students to demonstrate their acquisition of knowledge and skills,
while taking into consideration the social context. The literature claims affording all
students the same chance to demonstrate their abilities under the same conditions were key
factors in fairness and students’ perceptions pf fairness (Alm and Colnerud, 2015;
Brookhart, 2015; & Scott et al., 2014). In addition to considering the consequences of
assessment, they suggested taking into account resources and access to resources leading
up to assessments. In another examination of student perceptions of assessments,
McMillan and Workman (1988) (cited by Alkharusi, 2015) observed a tendency for
teachers to individualise assessments, leading to varied and inconsistent practices.
2.1.4PerceptionsofAssessment
For the purposes of this research, teacher assessment means assessment of students
by the teacher. Assessment practices have been shown to lead to widely differing student
perceptions of teacher assessment. The findings of a study by Alkaharusi (2015) showed
there was a commonly shared experience about assessment and common student
perceptions about assessment practices within the same class. Accordingly, the author
proposed not only taking into account individual student perceptions of teacher
assessments, but also the average perceptions of all students in the classroom. He took the
view that the classroom is an objective environment, believed to be real. In other words, as
assessment environments, classrooms could be viewed at a collective level as well as an
individual one. Alkharusi concluded that differences in teachers’ assessment practices
based on gender weighting of the classroom needed more precise measurement.
14
Where an individual student’s perception of teacher assessment practices is
different to that of the whole class, the individual’s perception may be diminished or
considered less relevant. Also known as “majority rules”, this phenomenon may have
manifested in the current study as the dominant view of teachers’ assessment practices. In
such a scenario, the student experience becomes a group one and variations between
classes and teacher assessment practices affect this group experience (Alkharusi, 2008).
The student experience is better interpreted as a collective rather than an individual
response. Alkarahusi (2008) also observed a more positive perception of the classroom
environment where there was better student-teacher communication about assessments.
The study revealed students’ perceptions of assessment tasks resulted in a positive
influence on their self-efficiency and motivation levels. Although better classroom
communication between teacher and student had no real influence on student achievement,
it resulted in more positive student perceptions of classroom practices.
Dayal and Lingham (2015) discussed the different conceptual understandings and
perceptions of assessment held by teachers. They ranged from assessments for improving
teaching, learning and accountability for both students and institutions to recommendations
for dismissing assessments as irrelevant because they generate negative outcomes. There is
no longer any doubt that teachers’ perceptions influence their practice. Dayal and Lingham
interviewed more than 70 Fijian teachers in their investigation of assessment and found
most teachers who viewed assessments as a learning tool believed formative assessment
enhanced learning by allowing students to take control and make meaning of the feedback.
Perceptions of assessment are influenced by their validity and reliability. Alm and
Colnerud (2015) observed disappointment on the part of both teachers and studentswho
believed assessments were unjust. These authors examined teachers’ views about unfair
grading, while students’ perceptions of assessments as a fair measure of their work was
investigated via student questionnaires by Dhindsa, Omar, and Waldrip (2007); Dorman
and Knightley (2006); Dorman, Waldrip, and Fisher (2008). The following sections discuss
validity and reliability in relation to perceptions of assessment as an accurate measure of
performance.
2.1.5ReliabilityofAssessment
In assessment, reliability refers to the extent to which a particular test produces the
same results (Camines & Zeller, 1979; Joughin, 2010), thereby confirming it as a
consistent measure. School assessments can have far-reaching consequences in terms of
15
entry into university and requires students to maintain consistently high achievement
during school years. Masters (2013) equated the reliability of educational assessments to
precision, in other words, a high level of confidence in the conclusions. Accurate recording
and reporting of students’ learning progress are fundamental for reliable assessment,
together with sound justification for using a particular assessment and its appropriateness
for measuring what it’s supposed to.
For assessment conclusions to be reliable, confidence in assessment outcomes must
be high, in recognition of their suitability for demonstrating relevant knowledge and skills
(Masters, 2013). The author also proposed that tasks not be too easy or too difficult for
students to verify their knowledge and understanding.
2.1.6ValidityofAssessment
The terms reliability and validity are often used synonymously (Golfashami, 2003;
Joughin, 2010; Merriam, 1998, Miller et al., 2009), especially in education, where there is
an expectation for school assessments to be both valid and reliable in order to generate
consistent outcomes.
Validity in assessment concerns the degree of accuracy with which a procedure or
some kind of assessment measures what it is intended to measure (Carmines & Zeller,
1979), that is, the appropriateness of the measuring procedures used. It is possible for a
measure to be highly reliable but inappropriate for measuring what it is intended to
measure. In the case of school assessments, where the results can hinder students’ entry
into university, concerns about gauging the performance of students’ mastery of skills and
knowledge have been justified and highlighted a need to take into account the purpose of
assessments in setting assessment tasks.
Validity can be measured in various ways. According to McGaw (2006) construct
validity overrides the relationship of measures related to assessments. An example of this
is where students’ academic achievements are measured by both external examination and
teachers’ assessment of school tasks, and the results, usually in the form of grades,
determine the student’s eligibility for entry into university. Construct validity relates to the
basic theoretical construct the assessment was supposed to measure. Assessments vary for
different subjects because they measure different basic constructs. For example, writing a
“for or against” essay requires arguments for and against a particular issue – how
convincingly these arguments are presented and expressed determines success. In a foreign
16
language subject, answering a question in that language measures grammatical accuracy,
while accurately applying mathematical formulae determines success in solving equations.
In this way, criteria are carefully chosen to produce valid information about achievement.
Consequential validity (Messick, 1996) is concerned with the consequences of
assessment (Sambell, K., McDowell, L. & Brown, S., 1997), including a propensity for
assessments to encourage rote learning of prescribed contents for students to achieve high
grades (Sambell et al., 1997). This is where assessments and teaching become inextricably
linked. In high-stakes assessments, such as compulsory matriculation exams, teaching and
assessment become focused on relevant and appropriate content (Messick, 1989, cited in
McGaw, 2006), and the outcomes of a singular event have significant consequences for
students.
In this thesis, reliability refers to the accuracy of the conclusions about students’
progress (Masters, 2015). Masters argued the more precise the conclusions are, the more
confident one can be in those conclusions and the less uncertainty in assessment measures.
Confidence equates to evidence, and for assessment tasks to generate unquestionable
results, they must be appropriate.
2.2CreationofAssessmentTasks
The way in which assessment tasks are constructed and what they entail are critical
factors for high levels of validity and reliability in assessment outcomes. The development
of assessment tasks should include who, as in who designs the assessment task, who
implements it and who is the subject of the task. The next section discusses types of
assessment tasks, particularly oral assessment versus written assessment, followed by a
discussion of authentic assessment.
2.2.1TypesofAssessmentTasks
Assessment tasks come in various forms; they can be verbal/written,
external/internal or formal/informal. Within these broad classifications there are numerous
types of tasks, such as teacher-marked essays, exercises, class tests, standardised tests,
periodic school examinations, public examinations, standard assessment tasks, portfolios,
group work, journals and projects (McLaughlin, 2010). Assessment tasks form the basis of
reporting by way of school records, reports to parents, testimonials, references, profiles and
formal evaluations by external agents such as psychologists (McLaughlin, 2010). Teachers
choose tasks from the abovementioned options to assess the extent of mastery and
knowledge students have attained.
17
The chosen task depends on what has been taught or practised. For example, an
essay might be used to demonstrate whether students have mastered paraphrasing
techniques, or students may be subjected to oral questions to test their pronunciation in a
foreign language, or they may be asked to play a piece of music to test their mastery of
playing the piano with both hands. Students also give presentations to assess whether they
can present a topic logically, or take an arithmetic test to assess their ability to add and
subtract correctly. In all these ways, tasks for testing achievement vary from subject to
subject (Brookhart, 2015).
Assessment tasks also allow students to practice their knowledge (Trškan, 2005).
Trškan claimed assessment tasks can motivate learning and self-education by helping
students to formulate personal goals, not just in education, but life in general. Using history
as an example, Trškan argued that assessments should include more open-ended, short-
answer and essay tasks, and fewer multiple-choice tasks in order to test different thought
processes.
The frequent use of different types of assessment tasks (Darling-Hammond (1994)
meant that teachers individually determined which tasks took precedence over others to
accurately and appropriately reflect the assessment criteria. Amongst others, a particular
choice of task may reflect teachers’ educational goals or what is valued most in the
education system and society, or the assessment could reflect something else (Grgin,
2001). It is the “something else” that this study attempted to identify.
Teachers’ personal beliefs about validity are not always consistent with the rules of
assessment and accountabilities imposed by external authorities. Black et al. (2003)
proposed teachers reconcile their beliefs about valid assessment with the summative
requirements of external education authorities. These authors suggested teachers who
believe certain assessment tasks are not valid should introduce other tasks, such as a
portfolio, and within this, introduce practices commensurate with their beliefs on what
constitutes valid assessment.
2.2.2AuthenticAssessment
Authentic assessment differentiates itself in that students are asked to demonstrate
real-life meaning of tasks, including pertinent application of skills and knowledge (Muller,
2016). Asking students to demonstrate what they know reflects the real world, but it should
also be noted that authentic assessment has not been unequivocally defined (Swaffeld,
18
2011; Thuy & Dall’Alba, 2014). Swaffeld equated authentic assessment with genuineness,
claiming it follows on from formative assessment, used to evaluate student learning,
understanding and identifying areas in need of progress (Harlen & James, 1997). Other
researchers talked about the tendency for authentic assessments to be subjective, and
stressed the importance of positive student perceptions for effectiveness (Thuy &
Dall’Alba, 2011).
Authentic tasks refer to issues and situations that may be encountered by students
for life after school (Muller, 2016). Authentic assessment supports the aim of education by
preparing students for real life and moves away from traditional school tests, designed to
grade and measure mastery of learning in the form of unit tests and multiple-choice tasks.
While summative assessments provide numerical grades but little feedback (Harlen &
James, 1997) to promote student learning by practical application, the aim of authentic
assessment is to make an impact on learning and not merely to serve as a semblance of
requirements being covered.
2.2.3OralversusWrittenAssessmentTasks
Assessments in Croatia mainly include written and oral tasks. In Croatia, oral
assessment is a common form of student assessment characterised by verbs such as “ispitaj
me” and “ispitat će me”, often used by Croatian students to mean “question me” and “I am
going to be questioned”. This refers to someone posing oral questions to test students’
knowledge of a particular subject in the Croatian curriculum (Bjedov et al., 2010), and is
used in all levels of education in Croatia - primary, secondary and tertiary.
Written examinations require students to possess appropriately developed writing
skills, which naturally disadvantages weaker students. The purpose of both oral and written
examinations in the first instance is to test students’ knowledge - written and verbal skills
are secondary. More recently, written exams have become the predominant form of
assessment, despite the fact that they may be disadvantageous to some students (Ahmed,
Pollit, & Rose, 1999). The written form seems to be preferred because students are still
developing oral skills at the age of 16, and written tasks exert less pressure on them than
oral exams (Ahmed at al., 1999). Several drawbacks have been associated with oral
examination: one factor is the lengthy periods required for oral exams with numerous
students, and another is providing evidence of oral exams (Huxham, M., Campbell, F. &
Westwood, J., 2012). By comparison, paper examinations are cheaper and provide a
relatively permanent record.

19
Consensus has not been reached on the best way of testing students’ knowledge.
Ahmed et al. (1999) argued that testing knowledge and oral skills only coincide in foreign
language oral examinations. The argument that written examinations are cheaper to
administer because less technology is required for retaining the evidence favours written
examinations over oral ones (Luoma, 2004). In addition, oral exams frequently require the
presence of more than one examiner, for example an interlocutor asking the questions and
an assessor who reaches the final assessment. This is not the case in Croatian schools
where the one teacher posed the examination questions and assessed at the same time.
Luoma believes that the benefit of an oral format is that testing and assessment of students’
performance occur simultaneously saving teacher out of class time. However, for accurate
assessment, this should not be left to one examiner as it cannot be performed adequately
with one person. Overcoming this inadequacy of one person orally examining is to record
the examination and to review the recording during the process of providing an assessment
of the oral examination. Again, this is not the case in Croatian schools where the
examining is not recorded and consequently not reviewed, leaving opportunities for
inconsistencies. Once the oral examination is carried out in Croatian, it cannot be re-
accessed.
Oral exams are used mainly in foreign language learning for direct testing of oral
skills (Kellermeier, 2010). Kellermeier examined foreign language pedagogy in a random
survey of foreign language teachers in Florida and found oral testing useful for students
with writing difficulties and for tests that don’t require a grade. Issues identified with oral
testing were lack of time, poor technology, student resistance and large classes. Sayre
(2014) concluded oral examinations are a feasible alternative to written exams, but only in
a small-class environment, otherwise it is too time consuming.
Huxham, Campbell, and Westwood (2012) compared the achievements of groups
of students in a written and then oral (viva voce) assessment task in the subject of biology,
involving an initial formative test designed to review knowledge, followed by some
students taking an oral version of the test and others a written one. The resulting means
varied considerably with students demonstrating better performance in oral assessment
tasks. In their study, students regarded oral examinations more positively than written
ones, believing that oral exams were more useful, inclusive and administered more
professionally. Consequently, students prepared more for oral exams because they
considered them to be a better reflection of their knowledge and assisted in creating a
20
professional identity. Importantly, the need for training students for oral examinations was
raised.
Oral assessment entails students using the spoken word to reflect their own work
(Joughin, 2010), and since fairness and reliability can impact the outcomes, it is vital to
ensure validity. One example raised by Ahmed et al. (1999) related to posing questions and
prompting in oral testing. These authors observed examiners prompting students in
different ways and using different language, thereby causing students to be advantaged or
disadvantaged.
Oral assessment tasks also pose other disadvantages (Ahmed et al., 1999).
Assessors can make subconscious judgements about students in the knowledge of certain
information about them, or they could be influenced by personality, race or dress. Even
distractions and the physical presence of the teacher during oral interviews can create bias
and influence the grade awarded (Luoma, 2004). Other disadvantages include a lack of
anonymity, student anxiety, speech and hearing impairments (Joughin, 1998), all of which
can jeopardise the consistency of assessments and fail to fairly reflect students’ acquisition
of knowledge. Furthermore, oral examinations tend to favour confident students and
disadvantage more reserved students (Huxham et al., 2012). For all these reasons it is
important to strictly apply assessment criteria and set consistent questions and time
allocations to avoid prejudice (Ahmed et al., 1999; Luoma, 2004).
Newhouse (2013) gave an example of the variety of assessment tasks in his report
on the use of digital forms of assessment in four different senior secondary courses:
Applied Information Technology, Engineering, Italian and Physical Education. Two forms
of assessment included a written and oral exam as well as face-to-face interviews, the two
most common forms of assessment in Croatia used in equal measure. Newhouse referred to
written exams as pen and paper or ancient paper-based technology methods that were
replaceable by other means (p. 431) and advocated for assessment tasks to move away
from mere replication and memorisation. To combat the potential inconsistency of oral
exams, Newhouse recommended recording oral interviews to produce a record of
assessments that could be checked for adherence to assessment criteria.
In the IGSO (international GCSE) level exams, oral examinations are recorded for
English and sent to a centralised location to check that assessment criteria have
consistently been applied in interviews (About GCSE exams, 2017). Examiners are also
21
checked for deviating from set exam questions and prompting to ensure a fair outcome for
all students (Ahmed et al., 1999).
Munoz and Alvarez (2010) prescribed nine oral assessment guidelines, including
clear and understandable assessment criteria. These authors suggested grammar is only one
aspect of assessment and grammatical accuracy is not necessarily the dominant indicator of
language competence. They recommended tasks be varied, authentic, meaningful, cater for
all learning styles, and that these objectives be reflected in teaching practices. In addition,
they called for grouping techniques in oral assessment to be varied and promote student-
student and teacher-student interaction, and encouraged self-assessment following
extensive feedback. The authors also argued for continued assessments and providing
students with ongoing opportunities to demonstrate their acquisition of knowledge and
competence (Munoz & Alvarez, 2004, p. 34). This approach covers many aspects of
assessment with regard to type, criteria, outcomes and perceptions, and there is evidence to
show that adhering to these recommendations can contribute greatly to student learning.
They also provide a framework for developing assessment criteria, discussed in further
detail below.
Jorghin (2010) recommended special preparation for oral exams, believing students
are not experienced in oral assessment. He proposed ascertaining their previous experience
and debriefing them about oral tasks, so that they know what is expected of them. The
author advised students to view examples and practice in class in front of others. He cited
an example of occupational therapy students tasked with working through law cases and
legal presentations to enhance their authentic real-life learning.
2.3CreationofAssessmentCriteria
In education, once assessment tasks have been created, assessment criteria are
typically formulated to judge or score students’ performance. These criteria can either be
conveyed to students in verbal or written form, merely exist in teachers’ minds or comprise
a combination (Canal, Bonini, Micciolo & Tentori, 2012). Formulating assessment criteria
is common practice. Sadler (2009) strongly encouraged implementing criteria for the
benefit of students and increased objectivity, and argued for using multiple criteria, broken
down into single criteria, for enhancing objectivity. The author cautioned against
inadequate representation of the full complexity of criteria that can result in
misunderstandings and distort grading decisions.
22
Trškan (2005) asserted criteria make assessing humanistic subjects like history
more objective, and that subjective topics can also be assessed in an objective way with
carefully formulated and applied assessment criteria. However, it is crucial to ascertain
exactly what teachers are basing their judgements on when assessing student performance.
Strahinić (2011) concluded the tendency for students to think of assessment criteria as
determined by professionals, i.e. teachers or the Education Department, often elicited
negative reactions and could influence their views on teachers’ judgements of their
performance. Subjectivity in applying assessment criteria requires scrutiny, since criteria
may not always align with those officially stated for a specific task. Amongst others,
Strahinić defined subjective non-task related criteria as teachers like or dislike of a student,
the student's social status, students’ personality traits and their physical appearance. Scott
et al. (2014) opposed the use of grades to punish or reward student behaviour. Further
research is needed into the extent to which such factors influence scoring and grading,
particularly when assessments represent high stakes and have significant consequences for
all aspects of students’ lives (Strahinić, 2011).
The literature revealed a lack of clarity around assessment criteria impeded self-
assessment by secondary students (Broadfoot et al., 1998). Clarity and transparency were
emphasised for their importance in establishing links between explicit criteria, learning and
student self-assessment (Kirton et al., 2007). Certain cases also brought to light the barriers
imposed by a language deficit in understanding assessment terminology and standards of
formative assessments.
In their research with Chinese students, Sun and Chen (2013) articulated two
concepts in their assessment of English as a second language class. One related to
judgement of effort or fulfilment of a task, and the other to non-achievement factors, such
as habit, attitude and motivation. In this case, the teacher’s judgement was a crucial and
inevitable part of assigning grades.
It is widely understood that criteria must be created with equity in mind to establish
a fair and level playing field (Saunders & Davis, 1998). Moreover, students should be
allowed equal opportunities to perform in assessments and applying the same rules in the
same way (Kane, 2010). Darling-Hammond (1994) claimed assessment reforms are
unlikely to improve equity unless they specifically focus on equity and increase awareness
of fair assessment amongst students, theorists and practitioners alike. This entails
determining explicit assessment criteria and identifying who decides what they are.
23
The relationship between validity and fairness needs to be considered. Volante
(2006) defined a valid assessment as an accurate measure of students’ knowledge. Kane,
(2010) stated that validity and fairness are loosely connected; the overlap between them is
dependent on what the assessment is defining. Therefore, how criteria and their application
has an effect on fairness and follows in the next section.
2.4ApplicationofAssessmentCriteria
An overview of the relevant literature on the application of assessment criteria
follows, together with an outline of consistent and reliable judgements in assessments.
2.4.1ConsistentandReliableJudgements
Judgements or the ability to reach conclusions (Cambridge Advanced Learner’s
Dictionary, 2017) are an intrinsic part of teacher assessments (Allal, 2013; Brookhart,
2013). Meissel et al. (2017) investigated teachers’ subjectivity in assessment judgements
and found that certain students received lower grades than others for the same
achievement, highlighting discrepancies and inaccuracies between teacher judgements and
their measures of student performance. Sun and Cheng (2013) also questioned the types of
value judgements teachers made when giving grades for a questionnaire, pointing to a
misalignment of judgements, and as a result, inaccurate conclusions.
In Croatia and Australia, judgements are often made on the basis of a national
exam, as in final year matriculation, a prerequisite for university entry. Some researchers
proposed moving away from external examinations to internal assessment by teachers
(McMahone & Jones, 2015). In Croatia, teacher assessments are particularly important,
because although the final-year external matriculation or matura exam determines
university entry, it is also 40% dependent on grades awarded in secondary school.
Furthermore, entry into certain secondary schools depends solely on students’ grades in
primary school (Nacionalni Centar za vajnsko vrednovanje (National Centre for External
Assessment 2016/2017). How teachers make judgements and reach decisions about student
performance is therefore of crucial importance.
For all these reasons, explicit criteria are vital for making consistent and reliable
judgements (Dargusch, 2014) when measuring the extent to which students’ achievement
of assessment tasks meets the stated criteria. On the other hand, consistency is vital for
supporting valid and reliable assessment. Brookhart (2012) observed a lack of validity in
teacher judgements and assessment practices, while Dixon and Williams (2003) concluded

24
teachers had difficulty justifying their assessment decisions. Little is known about the
factors impacting the fairness of grading, with sometimes lasting consequences for students
(Gordon & Fay, 2010). Since teachers draw on various sources of knowledge and evidence
when making judgments (Connolly, Klenowski, & Wyatt-Smith, 2011), perceptions of
uncertainty can prevail even when criteria are in place.
Rust, Price, and O’Donovan (2003) likened assessment criteria to having rules.
However, these authors pointed out that criteria can sometimes appear to be precise and
clearly defined, but turn out to be fuzzier when applied, possibly due to teachers’
interpretation of the criteria affecting their application and consistency. Woolf (2005)
termed this “subsidiarity”, derived from European Union member states applying the
principles of European Union policy in their own countries according to their own national
needs. Woolf (2005) questioned how much subsidiarity or deviation and interpretation
should be tolerated, and the same applies to teacher assessments of student performance
and perceptions of fairness. While deviation may be inevitable, consistency and fairness in
assessment can be maintained.
2.4.2ApplyingCriteriatoAssessments
Norcini et al. (2011) believed criteria provide the foundation for making decisions
and reaching judgements. The authors reiterated the importance of good criteria for good
assessment outcomes and recommended making known the purpose of criteria. They
proposed students be included in assessment processes in order to instil confidence that
quality standards are being adhered to, and that feedback be provided to students to
promote ongoing learning.
Nazor (1999) also argued for consistency in the application of assessment criteria
for assessments to be as fair as possible. A Western Australian project titled Making
Consistent Judgements (Education Department of WA, 1995) provided teachers with
additional training by the Education Department of WA in an effort to achieve fairer and
more effective assessments of student performance. In this project, teacher education was
ongoing and supported them in creating tasks that could be applied consistently to generate
fairer outcomes.
Initiatives like consistency seminars and moderations compare the work of students
across various schools. The process of moderation was historically implemented to achieve
consistent assessments in Australian schools. In a study by Connolly, Klenowski, and
Wyatt-Smith (2011), teachers viewed moderation as positively contributing to consistency,
25
however, the authors cautioned that teachers could nevertheless subvert the process.
Connolly et al. described teachers turning to tacit factors or non-stated personal factors in
their moderation, potentially undermining the stated or formal criteria and compromising
consistency and objectivity. Internal and external factors (Bandalos, 2004) will inevitably
create differences in the way teachers apply explicit assessment criteria.
Training in the application of assessment criteria is just one of many factors that
can improve the rating of students’ work (Huang, 2001). Others include assessors’
backgrounds, previous experience, prior training, methods, criteria, tolerance, perceptions
and expectations. Student-related factors also affect performance outcomes, such as how
difficult or interesting the subject is or students’ dislike of the subject (Nazor, 1999). In
these ways, assessments can be directly or indirectly influenced by numerous factors.
Despite an environment of enormous change and increasing calls for teacher
accountability, Dargusch (2014) expressed the view that the Australian Curriculum does
not provide teachers with guidance for assessment. Her paper investigated the formative
practice of English teachers, focused in particular on teachers’ use of assessment criteria
and standards. Dargusch concluded that language barriers impeded teachers’ and students’
interpretation of criteria and resulted in insufficient transparency in relation to assessment
criteria and standards. She stressed the importance of language clarity for ensuring students
perceive assessment processes as fair and consistent.
Darling-Hammond (1994) was in favour of assessment criteria for high-stakes
assessments taking into account the degree of subjectivity in judgements. Determining the
criteria and exactly what will be assessed crystallises the assessment process and
contributes to understanding the outcomes. Inaccurate teacher judgements (Finkelstein,
2010) date back to the early 20th century and still persist today (Delanshere, 2002). A study
by Brookhart (2012) described how varied results in teacher judgements over a period of
time led to a loss of confidence in teacher judgements.
Canal, Bonini, Micciolo, and Tentori (2012) gave a concrete example of teachers’
lack of consistency in applying assessment criteria. The study took place in Italy, and for
typical students, showed overall teacher evaluation was consistent with the criteria.
However, results were highly inconsistent for atypical students, from which the researchers
concluded teachers were allowing unrelated factors to influence their marking by inventing
26
their own definitions of assessment criteria depending on the student and ignoring the
prescribed criteria to justify their own impressions.
Teacher judgements influence all areas of teachers' practice, including lesson
preparation, lesson implementation and interaction with students (Allal, 2012). Allal found
grading practices reflected personal choice and social context, including previous
interactions with students and other colleagues as well as the influence of institutional
factors. Allal (2012) observed teachers were subconsciously influenced by their social
interactions with students that may or may not have been embedded in the criteria and
concluded their professional judgement was both an individual cognitive act as well as a
socially situated one. Teachers who are unsure about what grade to award will usually seek
additional information to tip the outcome one way or another, especially for final end-of-
year grades. In doing so, they introduce their own point of view, influenced by the
educational construct they find themselves in. Although collaboration exists in terms of
assessment and criteria constructs, teachers also make individual decisions, and it is
therefore essential to adhere to criteria to prevent other elements from clouding their focus.
Brookhart (2013) advocated analysing teachers’ thoughts when making judgements
about student performance, since there was a dearth of research in this area. She examined
standard testing as opposed to teacher judgements and proposed further research to
pinpoint the reasons for variations in teacher judgements, believing this would explain half
the differences in student achievement.
The language used for constructing criteria has also raised concerns. For subjects
like English, assessment criteria cannot always be identified in advance and are sometimes
undefinable until the task is over (Grgin, 2001). The author cited essay writing as an
example, where he believes assessment criteria can only be determined after the task has
been completed. In other words, only once students have written about a topic can
assessment criteria can be determined. This supports the concept that results can identify
criteria and represents a reverse process, commencing with task completion, followed by
teacher application of prescribed criteria for the task.
Grgin (2001) believed criteria cannot be quantified for subjects like mathematics,
where most answers are either right or wrong, as opposed to a creative literature
interpretation. Teachers develop criteria through practice (Dargusch, 2014), implying that
they are amended over time. There is also the risk that defined criteria are prone to a wide

27
spectrum of teachers’ interpretation (Wyatt-Smith & Klenovski, 2013), such as “relevant
ideas” for an essay. Wyatt-Smith and Klenovski cautioned that staunchly addressing
consistency can lead to superficial assessment processes.
Connolly et al. (2011) found teachers drew on sources and knowledge beyond
merely the task, and in setting criteria for judging students’ work may call into question the
validity of assessments. Brookhart (2015) used an argument-based approach and analytical
framework to examine grades that showed significant variations in tested achievements.
The study showed teachers were influenced by characteristics such as socio-economic
status, personality, gender, ethnicity, effort, behaviour, classroom citizenship and context.
Gordon and Fay (2010) acknowledged that little is known about teacher assessment
practices, highlighting the value and relevance of the current study.
Consistent application of appropriate criteria supports grade integrity (Sadler,
2009), meaning that the grade awarded is strictly commensurate with the quality of the
student’s performance of a particular task. The meaning and value of grades is of prime
importance for valid conclusions based on evidence of students’ cognitive factors
(Brookhart, 2015; Brookhart et al., 2016). In Croatia, grades are an important determinant
for entry into high school and university for which fair and accurate grading is essential,
yet successful creation and implementation of consistent criteria has remained a problem
(Hopfenbeck et al., 2017).
2.4.3ApplyingCriteriatoOralAssessmentTasks
All the above factors, related to the application of assessment criteria, require
special consideration in oral assessments. Generally speaking, written tasks culminate in a
written record of students’ performance against set criteria, while oral tasks do not, unless
they are recorded (Luoma, 2004). Justifying the application of criteria is therefore easier
with written tasks. Consistency is reduced in the absence of recorded oral exams, because
once spoken the words disappear and teachers are left to rely on their recollections and
impressions (Ahmed at al., 1999). These authors argued this resulted in a lack of
objectivity, a major criticism of oral exams, especially in cases where the examiner is
familiar with or known to the student under examination. The problem of making on-the-
spot judgements solely on the task at hand is unique to oral exams, and coupled with a lack
of consistency, represent some of the major causes of unfairness and lack of objectivity
jeopardising assessment validity.
28
Joughin (2010) espoused the value of criteria in oral exams when used in the form
of a rubric as a guide, claiming this provides examiners with a common base and reduces
the possibility of non-task related factors from impinging on grades. Other issues
associated with oral assessments, such as time constraints, class size and inadequate
technology for recording also make consistent application of criteria more difficult than for
written assessments (Kellermeier, 2010).
2.5OutcomesofAssessment
As outlined above, the outcomes of assessments can be influenced by several
factors. For example, grading can impact on the material taught (Darling-Hammond,
1994). Faull (2010) was of the view that in addition to parent and student attitudes towards
the school, the policies and practices of ACARA in regard to assessment also influence
student learning. ACARA documents purport parents and students gain a better idea of
students’ capabilities from testing, applied across the board in all Australian schools
(Klenovski, 2011). As a precursor to positive perceptions, it would not be unreasonable for
students to expect consistency in assessments to include documented statements or reports
of their performance.
Stobart (2010) emphasised accurate interpretation of assessment data. He talked
about the “double duty” (p. 12) of assessment in not only assessing the task at hand, but
also generating lifelong skills. Given current assessment practices, he warned of
undesirable consequences and questioned the value of assessments in raising educational
standards, improving teaching and learning, and encouraging unwanted practices.
Mitigating against the impact of teacher assessment practices on individuals and
their families is an important aim of educational assessment according to Scott, Webber,
Lupart, Aitken, and Scott (2013). Their study found heightened awareness amongst
educators in attending to the learning needs of all parties in the education process, at the
same time heeding the demands of society and institutions. Assessments have become
entrenched in almost all areas of life, be it in learning or making choices about people for
further education or jobs.
In the same way that teachers assign value to the assessments enforced upon
students, students assign meaning and value to the assessments imposed on them. Sun and
Cheng (2013) argued that being aware of these values, particularly in relation to non-task
achievements, will contribute to validity of teacher assessments. In their research of
29
Chinese students, Sun and Cheng concluded that the meaning and value attributed to
teacher assessments by students were common issues around the world and required
further attention.
Students’ attitudes to testing predominantly relate to relevance. Chu, Guo, and
Leighton’s 2013 research in schools investigated the relationship between students’
interpersonal trust and attitudes towards standardised testing. They found a connection
between emotion and assessment, and concluded the relationship needed further
consideration and analysis.
The way students perceive teacher behaviour is often a result of the process of
education, including assessments, and can ultimately manifest in their attitudes, be it
positive or negative. Charalampous and Kokkinos (2014) proposed the Model of
Reciprocal Causation for examining the relationship between student personality factors,
student-teacher interpersonal behaviour and student achievements. Using this model, they
analysed teacher personality traits and their effects on students, and accordingly, students’
perceptions of their teachers. Variances in teacher behaviour were observed while teaching
the same subject to different class groups despite adhering to assessment criteria.
Importantly, Charalampous and Kokkinos examined the influence of students’ perceptions
on their achievements, and in turn, the effect on teachers’ assessments. Personal factors,
behaviour and environment were all found to be influencing factors, and together with
student perceptions of their teachers, signalled areas for potential improvement and more
effective outcomes (Wubbels & Brekelmans, 2005).
Strahinić (2011) claimed from experience that there was a high level of student
dissatisfaction with grading and allocation of grades. The author reported that students in
Croatia truanted from school when they knew they would be assessed, and observed grades
being scaled up when students were obedient and down when they misbehaved. Strahinić
went on to say that students colluded and cheated as a sign of protest against unfair
grading, and cited an instance of parental violence towards a teacher for what was
perceived as an unfair assessment outcome. The author called for the abolition of grades,
claiming that grading encompassed unrelated motives when teachers used assessments to
outwit and punish students rather than fairly evaluating their performance. Negative
consequences from school assessment processes were also evidenced by King (1989) in the
form of anxiety and phobic disorders amongst students.
30
In their assessment framework, Barnes et al. (2017) included the item “assessment
is irrelevant” (p. 14) from the teacher’s perspective. The item acknowledged assessments
can be imprecise and manifest negatively in students’ perceptions. Brown (2011) claimed
students develop certain beliefs as a result of assessment, stemming from their perceptions
of how assessments are undertaken (van de Watering, Gijbels, Dochy,& van de Rijt, 2008).
Exactly what kinds of beliefs and perceptions they adopt was the focus of this study, since
very little research exists on the subject (Dorman & Knightley, 2006). Documenting and
analysing students’ viewpoints shed light on how students’ beliefs impact their
achievements, and the findings identify opportunities for enhancing current teaching
practices to improve student outcomes.
Furman (2009) described the traumatic consequences of assessment for her students
who were outwardly confident until they were asked to complete a formal assessment. The
subsequent emotional upset, involving the parents and the principal, highlighted the
stressful nature and undesirable consequences of formal assessment for students and
teachers. Furman argued that anxiety associated with assessment is firmly embedded in
children from a young age and every effort should be made to alleviate negative
associations.
In a Croatian context, it is not uncommon for grades to be used as a form of
punishment for students (Brkić-Devčić, 2002; Stahinic 2011). Both these authors alluded
to a repressive education system where students are expected to learn subject matter
according to the wishes of teachers, and “punished” with poor grades if they failed to meet
teachers’ expectations. They commented on the intrusion of teachers’ personal attitudes in
their assessment of students’ performance, referring to the “mystery” of what constitutes
an A, B, C, D or F (5, 4, 3, 2 or 1 in the Croatian system) and explains the variations in
teachers’ grading.
Students’ conceptions of assessment have been linked to a range of outcomes
(Brown & Hirschfield, 2008) and educational experiences; the more positive the former,
the more positive the latter. Since factors span achievement, learning, accountability,
relevance and enjoyability, it is logical to conclude that maximising these aspects will
create improved social and educational environments.
Students’ beliefs and perceptions have also been shown to have far-reaching
implications, affecting learning behaviours and academic achievement (Brown, 2011; van
31
de Watering et al., 2008). Patti (2011) concluded students’ beliefs were directly related to
their attitudes, expressed in the form of positive or negative feelings about subjects, and
reported more positive attitudes increased student learning. The author investigated student
beliefs towards chemistry in secondary school using a Likert-response questionnaire.
Responses revealed a wide range of both positive and negative student perceptions of
teacher assessment. depending on the individual student.
There is also the issue of interpersonal trust. Chu et al. (2013) claimed the level of
students’ interpersonal trust is likely to affect the amount of effort they put into tests. These
authors examined the influence of interpersonal trust on student attitudes and the value
they placed on tests and used a survey with an interpersonal trust scale to examine
attitudes. Their findings showed the effort students put into tests correlated with their
levels of interpersonal trust, but also depended on the value placed on tests by all
participants in the assessment process.
There could be a relationship between assessment practices and other elements. For
example, Alkahrusi (2015) investigated the relationship between assessment practices and
students’ achievement goals and concluded that the type of testing used may influence
student motivation and the goals they pursue. Alkahrusi was of the firm belief that
assessments can enhance students’ learning practices. Brookharts’ model of students’
perceptions and their influence on motivation and beliefs about achievement supported this
view (Brookhart, 1997). According to the model, the classroom environment is perceived
as a context for students’ experiences, where the teacher determines the purpose of
assessment, sets assessment tasks, assessment criteria and standards, provides feedback
and monitors the outcomes.
2.6ConceptualFramework
Figure 1 represents the conceptual framework for this research, informed by key
issues that emerged from the literature. The literature review indicated many and varied
reasons for assessments, including the demands of educational institutions tasked with
teaching students who aspire to enter tertiary education and/or the workplace. Like
assessment criteria, assessment tasks are created for assessing student performance and
explicitly describe the tasks and criteria and how they are included, while at the same time
taking into consideration factors that may influence the application of criteria.
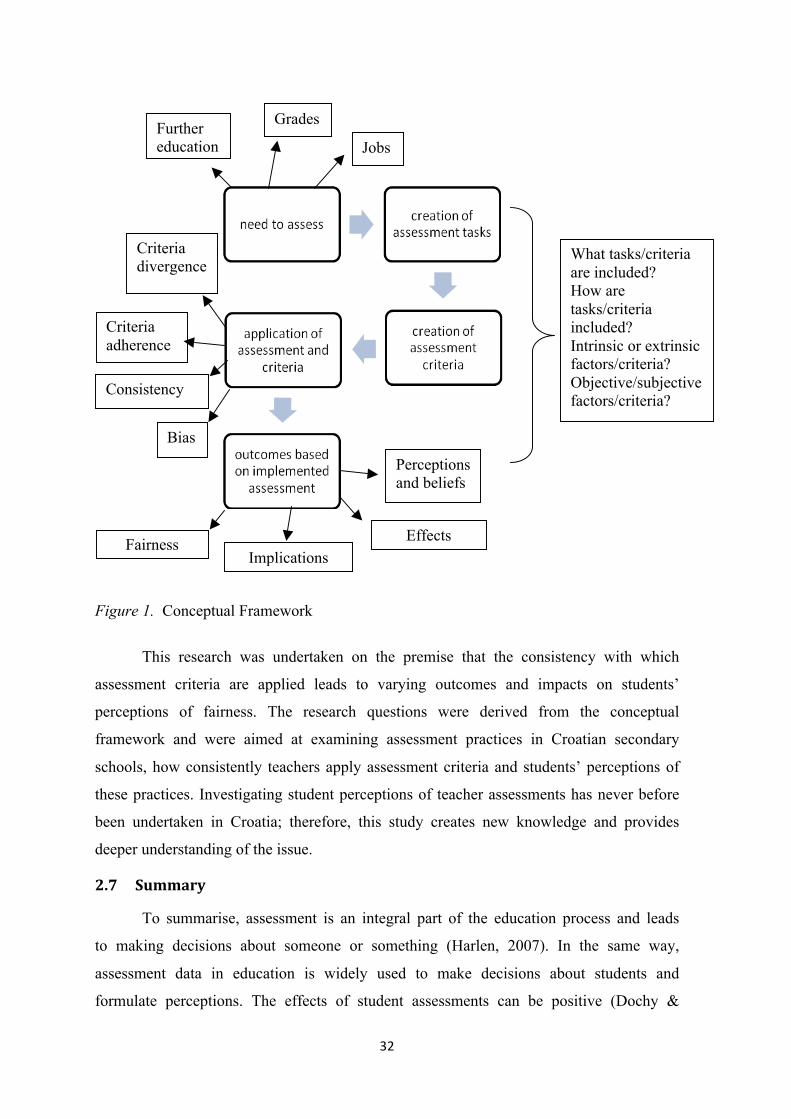
32
Figure 1. Conceptual Framework
This research was undertaken on the premise that the consistency with which
assessment criteria are applied leads to varying outcomes and impacts on students’
perceptions of fairness. The research questions were derived from the conceptual
framework and were aimed at examining assessment practices in Croatian secondary
schools, how consistently teachers apply assessment criteria and students’ perceptions of
these practices. Investigating student perceptions of teacher assessments has never before
been undertaken in Croatia; therefore, this study creates new knowledge and provides
deeper understanding of the issue.
2.7Summary
To summarise, assessment is an integral part of the education process and leads
to making decisions about someone or something (Harlen, 2007). In the same way,
assessment data in education is widely used to make decisions about students and
formulate perceptions. The effects of student assessments can be positive (Dochy &
What tasks/criteria are included? How are tasks/criteria included? Intrinsic or extrinsic factors/criteria? Objective/subjective factors/criteria?
Jobs
Grades Further education
Criteria divergence
Criteria adherenceeee Consistency
Bias
Perceptions and beliefs
Fairness Implications
Effects
33
McDowell, 1997) or negative (Brookhart, 2012) for student learning, yet many would
question whether its potential benefits are realised (Strahinić, 2011; Furman, 2009). The
demand for educational assessment stems from many sources, particularly institutions and
education departments, and are mainly driven by official education bodies. Examples
include the Programme for International Student Assessment or PISA (Thomson & De
Bortoli, 2008), the Australian Curriculum Assessment and Reporting Authority (ACARA)
and the National Assessment Programme or NAPLAN.
Assessments come in many shapes and forms (MacLaughlin, 2010) and researchers
have long recognised the potential threat to consistency and fairness in both written and
oral assessments (Ahmed et al., 1999; Huxham et al., 2012; Kellermeier, 2010; Munoz,
2014). Hammond (1994) was a strong supporter of appropriate criteria and applying them
consistently in assessments to ensure fairness. While there is general consensus about the
importance of validity and reliability in assessments (Masters 2013; McGaw, 2006), the
literature highlighted a widespread lack of validity in assessments (Dixon & Williams,
2003). Little is known about how teachers’ grading decisions and motivations can
endanger fairness (Gordon & Fay, 2010) and the literature indicates a lack of consistency
in the application of assessment criteria (Bandalos, 2004). Brookhart (2013) recognised the
absence of knowledge and understanding of teachers’ thoughts when making judgements
about student performance, and Allal (2012) observed teacher judgements and biases were
not confined to assessments and seemed to influence all areas of practice.
As previously mentioned, the language used to describe criteria can result in
varying interpretations and diminish consistency (Dargusch, 2014). There is also the issue
of teachers’ personal beliefs influencing their views on what assessments should comprise.
Additionally, differences between oral and written forms of assessment (Huxam et al.,
2012; Joughin, 2012) raise issues of fairness in relation to logistics, time, personality and
evidence of performance (Kellermeier, 2010; Munoz & Alvarez, 2010).
Two key concepts uncovered in the literature review with particular relevance to
the current study were: consequential validity that deals with the consequences ensuing
from assessment, both good and bad; and authentic assessment that entails real, genuine
evaluation and promotes positive student perceptions (Alkahrusi et al., 2015; Swaffeld,
2011; Thuy & Dall’Alba, 2014). Questionnaires were used to assess student perceptions of
teacher assessments by Dorman and Knightley (2006) and Barnes et al. (2017) and
uncovered regret on the part of many teachers for having awarded certain grades in
34
hindsight, despite their efforts to be as fair as possible (Alm & Colnerud, 2015). Just as
teachers’ assessment practices affect students’ achievement of goals, the environment in
which assessments take place also influences students’ motivational beliefs and
achievement outcomes (Brookhart, 1997; Alkhararusi, 2015).
In Croatia, reforms to assessment and education are currently taking place and
policies are being written (Kurikularna reforma, 2017) to improve educational outcomes.
The link between student perceptions (van de Watering, et al., 2008) and assessment
outcomes (Brown & Hirschfield, 2008) requires further research in order to maximise the
benefits of positive attitudes and reduce negativity towards teachers and assessments
(Dorman & Knightley, 2006).
The following chapter focuses on the research methodology and design of the
study. The literature review informed the methods chosen to answer the research questions
in the context of Croatian secondary school education from the perspectives of teachers
and students in the system.
35
ChapterThree:Methodology
The research questions in this study, the literature and proposed conceptual
framework dictated the use of methodology. In this chapter, the methodology is discussed
in detail, starting with the overall design and its rationale, and is followed by descriptions
of the samples, instruments, data collection and data analysis. Each research question is
linked to a source of data connected to a response. Finally, an overview of data collection
issues and ethical considerations are presented.
3.1ResearchDesign
Research design depends on the reality under examination. This study investigated
teachers’ application of assessment processes and students’ reactions to the fairness of
these processes. Since the phenomenon under study entailed teachers’ and students’
subjective experiences of the world, an inter-subjective or interactional epistemological
approach was adopted. This required the use of interviews to glean information from the
targeted sample (Blanche & Durrheim, 1999) in the form of an interpretative approach to
explain the reasons and significance of teachers’ actions in assessing student performance
and the resulting perceptions of students.
This study employed mixed methods in that it was empirical because it attempted to
measure perceptions, but also qualitative in that it was concerned with students and
teachers as people within a particular context. Hence, the research design drew on a quasi-
ethnographic approach to align with an interest in what distinguishes people. The objective
was to make meaning of teachers’ and students’ thoughts and opinions of secondary school
assessments in Croatian secondary schools. The study attempted to understand how
teachers and students interpreted specific aspects of the world they inhabited, to which they
contributed and in which they functioned (Goldbart & Hustler, 2005). Questions were
specifically aimed at gauging what students and teachers viewed as appropriate and
inappropriate practices and behaviours; with sharpened questions concerning teacher
assessments in the interviews with students and teachers (Barbour & Shostak, 2005).
3.2RationaleforResearchDesign
In order to collect information about teacher assessments of student performance
and student perceptions of assessments it was necessary to use empirical social science
research methods (Somekeh & Lewin, 2009). However, this research entailed gathering
36
data about people and drawing conclusions about their behaviours and perceptions, in an
attempt to give those reading it the feeling of being there (Geertz, 1973 cited in Somekeh
& Lewin, 2009). Educational research frequently draws on aligned disciplines such as
sociology, psychology and philosophy. In this study, the objective was to change practice,
reduce bias and improve the school experience for students, and heuristically, to influence
society as a whole around concepts of education.
3.3ResearchSamples
This research placed a spotlight on teacher assessment practices in terms of fairness
and consistency, and the resultant student perceptions of assessment practices. Data were
collected in Croatia, a country in transition from communism to democracy, where
problems are known to exist with regard to fairness and consistency in teachers’
assessments and students’ perceptions.
This study entailed interviewing selected teachers and their students about the
fairness of assessment practices. Subject areas and schools were chosen on the basis of the
researcher’s acquaintance with a former colleague and staff member who was able to allow
access. The focus was on teachers and students in two secondary schools and three specific
secondary school subjects.
Students in Croatia complete twelve years of school education culminating in
secondary school, of which there are two types offering four-year programs. One type is a
gimnazija or grammar school, primarily for students aspiring to enter university. The other
is vocational schools, offering more practical subjects related to specialisations in tourism,
administration, economics, surveying, architecture, building and electrical trades. Students
attending either school choose level A or B in all subjects; level A being more difficult.
Students enrolled in vocational schools are not excluded from university entry, but their
eligibility is dependent on the level of their subjects in the final examination or matura,
which is also a requirement for further education. They usually decide to sit for level A or
B exams towards the end of year twelve. Students must take three compulsory subjects to
pass matura or matriculate, namely Croatian, English and Mathematics. In other words,
these subjects are prerequisites for continuing on to tertiary studies.
3.3.1DemographicsofTargetedSchools
This research included teachers and students in three different subject areas from
two secondary schools, both gimnazija. In Croatia, students are enrolled in secondary
school according to their grade point average in primary school. Gimnazija offer the most
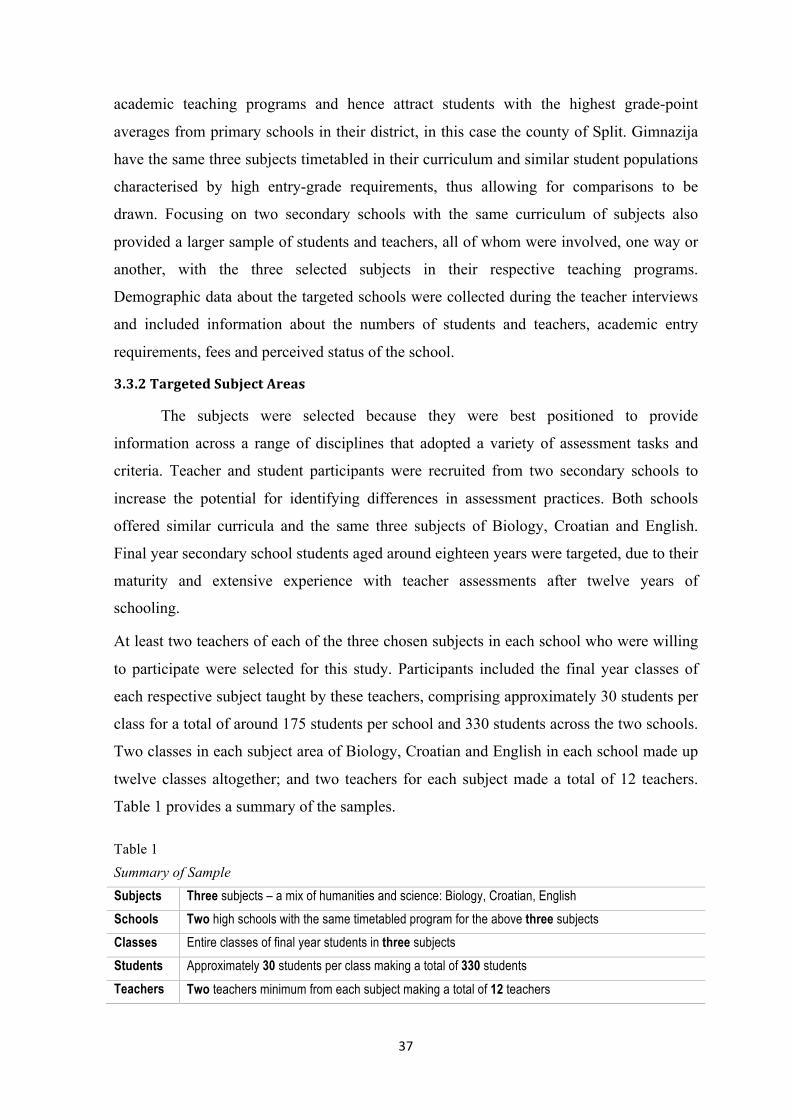
37
academic teaching programs and hence attract students with the highest grade-point
averages from primary schools in their district, in this case the county of Split. Gimnazija
have the same three subjects timetabled in their curriculum and similar student populations
characterised by high entry-grade requirements, thus allowing for comparisons to be
drawn. Focusing on two secondary schools with the same curriculum of subjects also
provided a larger sample of students and teachers, all of whom were involved, one way or
another, with the three selected subjects in their respective teaching programs.
Demographic data about the targeted schools were collected during the teacher interviews
and included information about the numbers of students and teachers, academic entry
requirements, fees and perceived status of the school.
3.3.2TargetedSubjectAreas
The subjects were selected because they were best positioned to provide
information across a range of disciplines that adopted a variety of assessment tasks and
criteria. Teacher and student participants were recruited from two secondary schools to
increase the potential for identifying differences in assessment practices. Both schools
offered similar curricula and the same three subjects of Biology, Croatian and English.
Final year secondary school students aged around eighteen years were targeted, due to their
maturity and extensive experience with teacher assessments after twelve years of
schooling.
At least two teachers of each of the three chosen subjects in each school who were willing
to participate were selected for this study. Participants included the final year classes of
each respective subject taught by these teachers, comprising approximately 30 students per
class for a total of around 175 students per school and 330 students across the two schools.
Two classes in each subject area of Biology, Croatian and English in each school made up
twelve classes altogether; and two teachers for each subject made a total of 12 teachers.
Table 1 provides a summary of the samples.
Table 1 Summary of Sample Subjects Three subjects – a mix of humanities and science: Biology, Croatian, English Schools Two high schools with the same timetabled program for the above three subjects
Classes Entire classes of final year students in three subjects Students Approximately 30 students per class making a total of 330 students Teachers Two teachers minimum from each subject making a total of 12 teachers
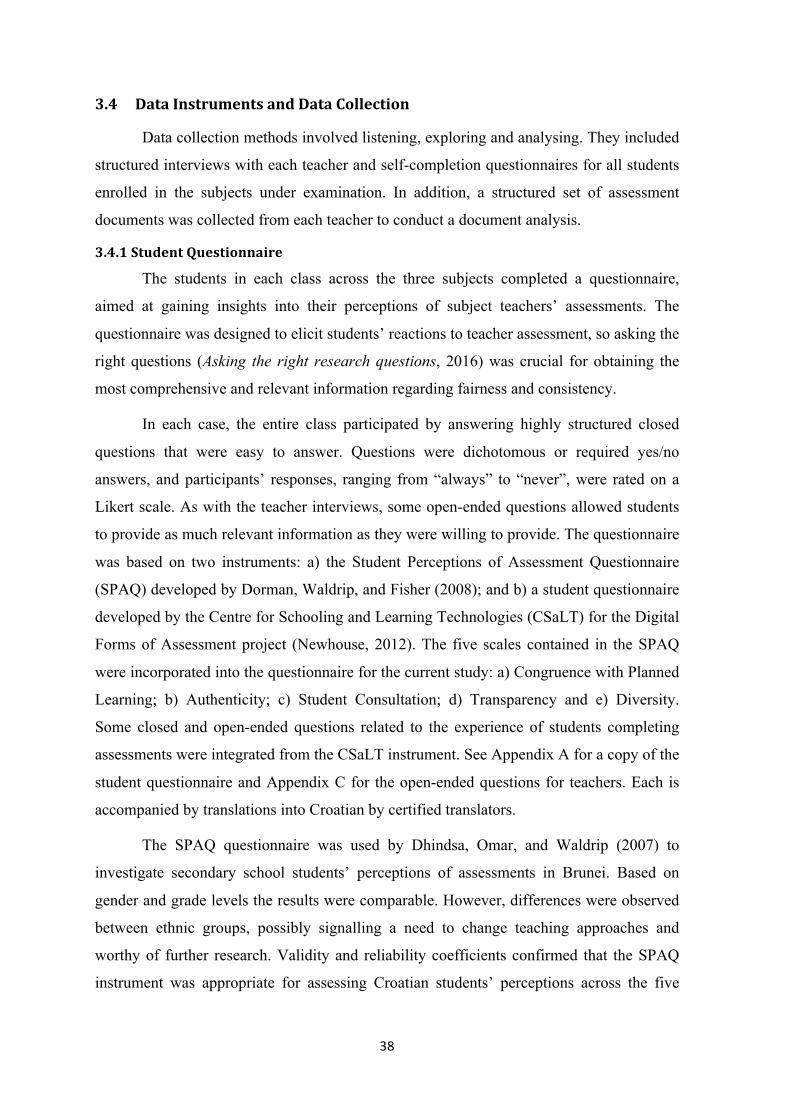
38
3.4DataInstrumentsandDataCollection
Data collection methods involved listening, exploring and analysing. They included
structured interviews with each teacher and self-completion questionnaires for all students
enrolled in the subjects under examination. In addition, a structured set of assessment
documents was collected from each teacher to conduct a document analysis.
3.4.1StudentQuestionnaire
The students in each class across the three subjects completed a questionnaire,
aimed at gaining insights into their perceptions of subject teachers’ assessments. The
questionnaire was designed to elicit students’ reactions to teacher assessment, so asking the
right questions (Asking the right research questions, 2016) was crucial for obtaining the
most comprehensive and relevant information regarding fairness and consistency.
In each case, the entire class participated by answering highly structured closed
questions that were easy to answer. Questions were dichotomous or required yes/no
answers, and participants’ responses, ranging from “always” to “never”, were rated on a
Likert scale. As with the teacher interviews, some open-ended questions allowed students
to provide as much relevant information as they were willing to provide. The questionnaire
was based on two instruments: a) the Student Perceptions of Assessment Questionnaire
(SPAQ) developed by Dorman, Waldrip, and Fisher (2008); and b) a student questionnaire
developed by the Centre for Schooling and Learning Technologies (CSaLT) for the Digital
Forms of Assessment project (Newhouse, 2012). The five scales contained in the SPAQ
were incorporated into the questionnaire for the current study: a) Congruence with Planned
Learning; b) Authenticity; c) Student Consultation; d) Transparency and e) Diversity.
Some closed and open-ended questions related to the experience of students completing
assessments were integrated from the CSaLT instrument. See Appendix A for a copy of the
student questionnaire and Appendix C for the open-ended questions for teachers. Each is
accompanied by translations into Croatian by certified translators.
The SPAQ questionnaire was used by Dhindsa, Omar, and Waldrip (2007) to
investigate secondary school students’ perceptions of assessments in Brunei. Based on
gender and grade levels the results were comparable. However, differences were observed
between ethnic groups, possibly signalling a need to change teaching approaches and
worthy of further research. Validity and reliability coefficients confirmed that the SPAQ
instrument was appropriate for assessing Croatian students’ perceptions across the five
39
assessment dimensions. The questions in the student questionnaire were categorised
according to the five scales as shown in Table 2.
Table 2 Scale and Question Numbers, Descriptions and Sample Question for Each Scale Scale and Question Numbers 1. Congruence with planned learning: Questions 1-7 2. Authenticity: Questions 8-14 3. Student consultation: Questions 15-21 4. Transparency: Questions 22-28 5. Diversity: Questions 29-35 Scale Description 1. Congruence: Extent to which tasks align with learning program goals 2. Authenticity: Extent to which tasks reflect relevant real-life situations 3. Student consultation: Extent to which students are consulted about tasks employed 4. Transparency: Extent to which tasks are clear to learner 5. Diversity: Extent to which all students have equal chance to complete tasks Sample Question to Describe Scale 1. Congruence: My assessment is a fair indication of my work 2. Authenticity: I have answered questions on topics that have been covered in class 3. Student Consultation: I am clear about the forms of assessment being used 4. Transparency: I know what is needed to successfully accomplish an assessment task 5. Diversity: I do work that is different from other students’ work *Note: Adapted from Dorman, J. P., & Knightley, W. M. (2006). Initial use of the Perceptions of Assessment Tasks Inventory (PATI) in English secondary schools. Alberta Journal of Educational Research, 52(3), 196-199.
3.4.2TeacherInterviews
Each teacher participant was interviewed individually about his/her assessment
practices. Questions were designed to uncover information about teacher assessment
practices, whilst simultaneously eliciting the truth and reducing the possible effects of
suspicion and lack of commitment (Barbour & Shostak, 2005). Teachers were questioned
about assessment tasks, methods of scoring, communicating expectations and results to
students, and the strategies they used to enhance fairness and consistency. Interviews were
audio recorded as a reliable record of the conversation.
3.4.3ReviewofTeacherAssessmentDocuments
Document analysis provided an additional source of data for this research. Teachers
were asked to provide documents that showed the details of their assessment of student
performance and the assessment criteria upon which they based their grading. Other
documents included assessment schedules and copies of criteria scales provided to
students. Teachers brought the documents with them to the interview and used them to
explain their assessment practices. Copies of the documents were retained by the
researcher.
40
3.4.4DataCollectionConsiderations
Both data collection instruments, namely the student questionnaire and structured
interviews, involved careful construction to ensure they were clear, unambiguous and did
not lead respondents to answer in a certain way. The questions were simple, sought clear,
truthful answers and considered the context of the research, in this case, Croatia. They
were designed to avoid antagonising, offending or threatening respondents, particularly in
view of the sensitivity around fairness and consistency of assessment practices.
Participants were assured their responses would have no negative consequences.
Anonymity in the student questionnaire was particularly crucial to avoid student anxiety
about future grades or assessments. The potential for hidden agendas to skew interview
responses and completion of the questionnaires needed consideration, as well as ensuring
truthful responses from interviewees, particularly in the knowledge that their feedback was
being used for a doctorate. Heavy workloads were also a deterrent to answering questions
comprehensively. Furthermore, the reliance of students on teachers’ attitudes towards them
for their grades may have hindered honest responses.
The questionnaire and interview questions required translation from Croatian to
English and vice versa. The interview responses also needed to be translated in such a way
that the original meaning was not lost in translation (Gotti & Sarcevic, 2006), since this
becomes an ethical issue when it results in distorted feedback and misrepresentation.
Participants were made to clearly understand what they were being asked in order for their
responses to be appropriate.
Back translation is a means of improving accuracy and effectiveness of instruments,
whereby a translator interprets a document previously translated into another language
back into the original language. The translation is then checked to see whether it has the
same meaning as the original. In this study, the questions required re-translation to capture
the original meaning and was carried out by certified translators to ensure accuracy.
3.5DataAnalysis
After collecting the data, it had to be organised and analysed so that conclusions
could be drawn. Analytical methods of SPSS were used on the information gleaned.
Interview data were scrutinised for themes, according to which relevant information was
categorised. The results of the Likert-scale questionnaire provided scores for the SPAQ
scales– they are presented in graphical form in Figure 12 and descriptive statistics are
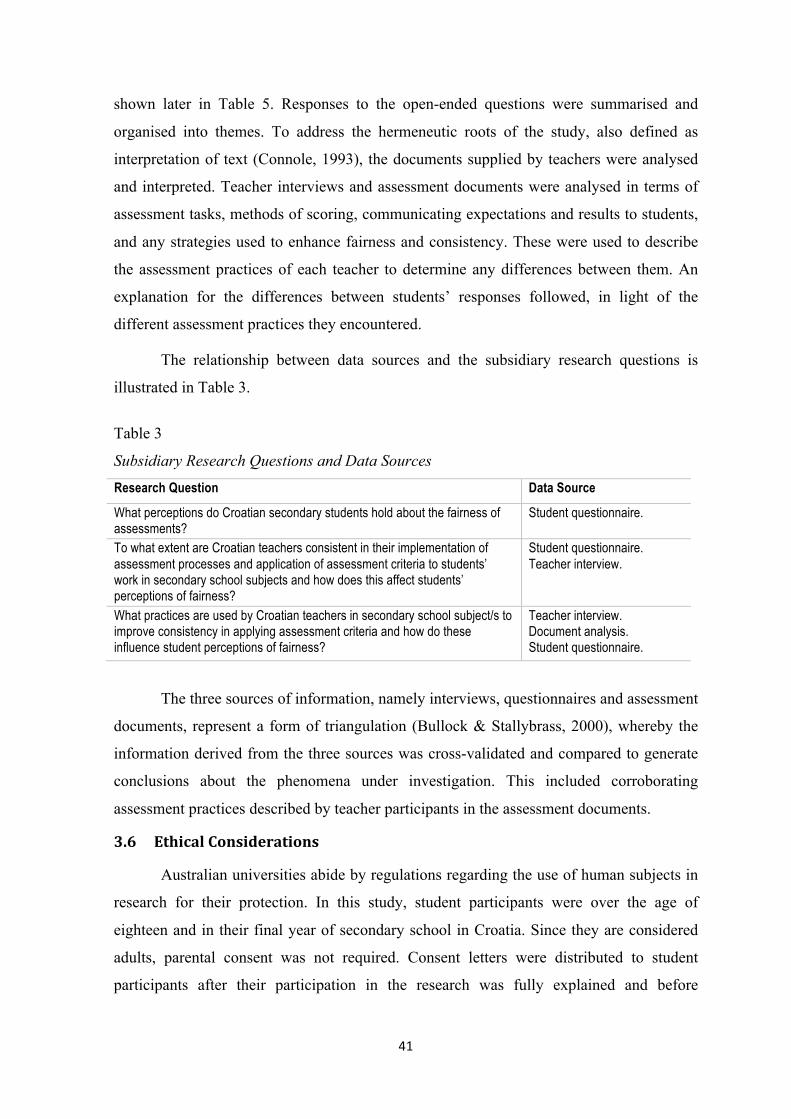
41
shown later in Table 5. Responses to the open-ended questions were summarised and
organised into themes. To address the hermeneutic roots of the study, also defined as
interpretation of text (Connole, 1993), the documents supplied by teachers were analysed
and interpreted. Teacher interviews and assessment documents were analysed in terms of
assessment tasks, methods of scoring, communicating expectations and results to students,
and any strategies used to enhance fairness and consistency. These were used to describe
the assessment practices of each teacher to determine any differences between them. An
explanation for the differences between students’ responses followed, in light of the
different assessment practices they encountered.
The relationship between data sources and the subsidiary research questions is
illustrated in Table 3.
Table 3
Subsidiary Research Questions and Data Sources
Research Question Data Source
What perceptions do Croatian secondary students hold about the fairness of assessments?
Student questionnaire.
To what extent are Croatian teachers consistent in their implementation of assessment processes and application of assessment criteria to students’ work in secondary school subjects and how does this affect students’ perceptions of fairness?
Student questionnaire. Teacher interview.
What practices are used by Croatian teachers in secondary school subject/s to improve consistency in applying assessment criteria and how do these influence student perceptions of fairness?
Teacher interview. Document analysis. Student questionnaire.
The three sources of information, namely interviews, questionnaires and assessment
documents, represent a form of triangulation (Bullock & Stallybrass, 2000), whereby the
information derived from the three sources was cross-validated and compared to generate
conclusions about the phenomena under investigation. This included corroborating
assessment practices described by teacher participants in the assessment documents.
3.6EthicalConsiderations
Australian universities abide by regulations regarding the use of human subjects in
research for their protection. In this study, student participants were over the age of
eighteen and in their final year of secondary school in Croatia. Since they are considered
adults, parental consent was not required. Consent letters were distributed to student
participants after their participation in the research was fully explained and before
42
completing the questionnaire. Teachers also signed a consent form indicating their
willingness to participate in the research before being interviewed.
3.7Summary
This chapter dealt with the methodology and research design and described how
data were collection. The subjects of Biology, Croatian and English in two secondary
schools in Croatia formed the context of the study. Two teachers of each of the three
subjects in two secondary schools were interviewed, comprising a total of twelve teachers.
The semi-structured teacher interview consisted of seven open-ended questions.
A total of 330 students, drawn from the two classes taught by the above teachers,
each completed thirty-five open-ended questions using a four-point Likert response scale.
In addition, assessment documents that described the assessment criteria for each subject
are aware collected from teachers, as determined by subject teachers at a national level and
by decree of the Croatian Ministry of Education. The collected data were analysed in order
to provide answers to the three subsidiary research questions. The results of this analysis
follow in the next chapter.
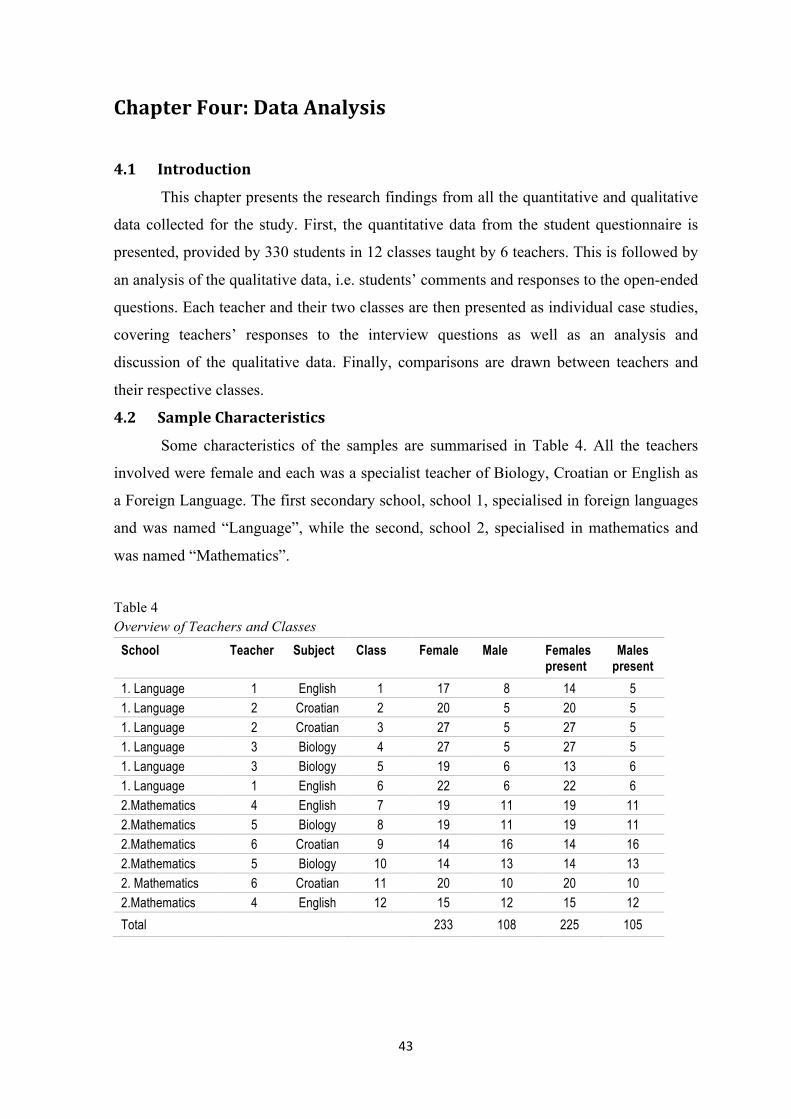
43
ChapterFour:DataAnalysis
4.1Introduction
This chapter presents the research findings from all the quantitative and qualitative
data collected for the study. First, the quantitative data from the student questionnaire is
presented, provided by 330 students in 12 classes taught by 6 teachers. This is followed by
an analysis of the qualitative data, i.e. students’ comments and responses to the open-ended
questions. Each teacher and their two classes are then presented as individual case studies,
covering teachers’ responses to the interview questions as well as an analysis and
discussion of the qualitative data. Finally, comparisons are drawn between teachers and
their respective classes.
4.2SampleCharacteristics
Some characteristics of the samples are summarised in Table 4. All the teachers
involved were female and each was a specialist teacher of Biology, Croatian or English as
a Foreign Language. The first secondary school, school 1, specialised in foreign languages
and was named “Language”, while the second, school 2, specialised in mathematics and
was named “Mathematics”.
Table 4 Overview of Teachers and Classes
School Teacher Subject Class Female Male Females present
Males present
1. Language 1 English 1 17 8 14 5 1. Language 2 Croatian 2 20 5 20 5 1. Language 2 Croatian 3 27 5 27 5 1. Language 3 Biology 4 27 5 27 5 1. Language 3 Biology 5 19 6 13 6 1. Language 1 English 6 22 6 22 6 2.Mathematics 4 English 7 19 11 19 11 2.Mathematics 5 Biology 8 19 11 19 11 2.Mathematics 6 Croatian 9 14 16 14 16 2.Mathematics 5 Biology 10 14 13 14 13 2. Mathematics 6 Croatian 11 20 10 20 10 2.Mathematics 4 English 12 15 12 15 12 Total 233 108 225 105
44
Table 4 shows the six different teachers numbered from one to six in the three
subject areas of Biology, Croatian and English. Two classes taught by the same teacher
were sampled in each school, resulting in a total sample of three subjects, six teachers and
twelve classes. Table 4 shows the number of students in each class as well as the number
of male and female students present on the day the questionnaire was administered.
The two schools were homogenous in that they were grammar schools or
gimnazija; the only criterion for entry being students’ grade averages in primary school. In
Croatia, grade averages in schools are expressed numerically for all subjects. The grading
system ranges from 1 to 5 where 5 is equivalent to an A and signifies “excellent”; 4 is
equivalent to a B and signifies “very good”; 3 is equivalent to a C and signifies “good”, 2
is equivalent to a D and signifies “poor” (a passing grade in Croatia); and 1 is equivalent to
a F or “fail”. Students were enrolled according to a ranked list based on their grade
averages in primary school. Those who participated in this research were all enrolled in
gimnazija, the most sought after secondary schools and most difficult for gaining entry, so
all students had achieved an A-grade average in primary school.
Places in Croatian secondary schools are limited. This means that students with
lower grade averages in primary school attend less popular, vocational and trade secondary
schools. The system does not preclude students’ with a higher grade average from
attending one of the latter schools, but this is the exception rather than the rule.
All six teachers interviewed were female. The students were predominantly female,
particularly in the Language school. Most students were present when the questionnaire
was administered; only six students were absent from two classes 1 and 5. School 1 had a
higher ratio of girls to boys – this prevalence of females to males may have contributed to
significant differences, but was not specifically investigated due to the scope of the study.
4.3ResultsofScaleAnalysisofStudentQuestionnaireResponses
In this section, an analysis of the scale results are presented, constructed from
students’ responses to the questionnaire. Students’ responses to each of the 35 closed
questions were measured on a four-point Likert-response scale offering a choice of4 =
Often; 3 = Sometimes; 2 = Rarely; and 1 = Never. Questions and responses were aligned
with the same five scales used by Dorman, Waldrip, and Fisher (2008), namely:
Congruence, Authenticity, Consultation, Transparency and Diversity (see Table 2 for a
description), each containing seven statements. Two of these: 1 – “My assessment in
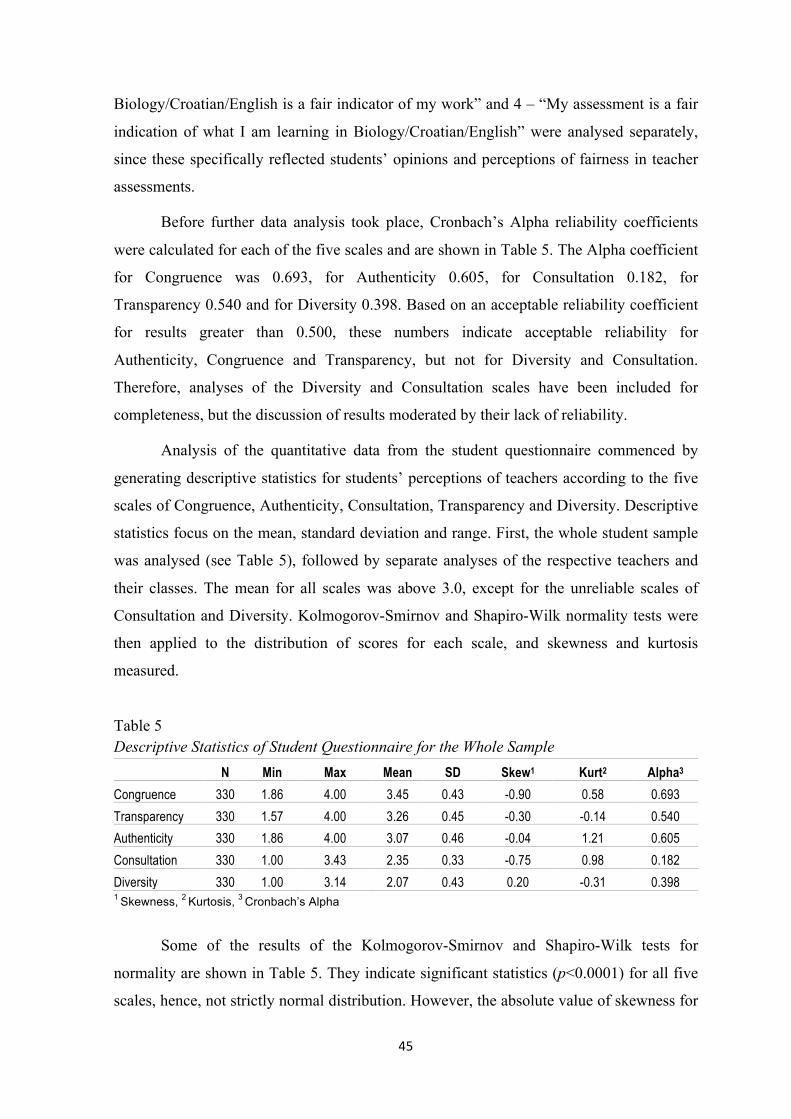
45
Biology/Croatian/English is a fair indicator of my work” and 4 – “My assessment is a fair
indication of what I am learning in Biology/Croatian/English” were analysed separately,
since these specifically reflected students’ opinions and perceptions of fairness in teacher
assessments.
Before further data analysis took place, Cronbach’s Alpha reliability coefficients
were calculated for each of the five scales and are shown in Table 5. The Alpha coefficient
for Congruence was 0.693, for Authenticity 0.605, for Consultation 0.182, for
Transparency 0.540 and for Diversity 0.398. Based on an acceptable reliability coefficient
for results greater than 0.500, these numbers indicate acceptable reliability for
Authenticity, Congruence and Transparency, but not for Diversity and Consultation.
Therefore, analyses of the Diversity and Consultation scales have been included for
completeness, but the discussion of results moderated by their lack of reliability.
Analysis of the quantitative data from the student questionnaire commenced by
generating descriptive statistics for students’ perceptions of teachers according to the five
scales of Congruence, Authenticity, Consultation, Transparency and Diversity. Descriptive
statistics focus on the mean, standard deviation and range. First, the whole student sample
was analysed (see Table 5), followed by separate analyses of the respective teachers and
their classes. The mean for all scales was above 3.0, except for the unreliable scales of
Consultation and Diversity. Kolmogorov-Smirnov and Shapiro-Wilk normality tests were
then applied to the distribution of scores for each scale, and skewness and kurtosis
measured.
Table 5 Descriptive Statistics of Student Questionnaire for the Whole Sample N Min Max Mean SD Skew1 Kurt2 Alpha3 Congruence 330 1.86 4.00 3.45 0.43 -0.90 0.58 0.693 Transparency 330 1.57 4.00 3.26 0.45 -0.30 -0.14 0.540 Authenticity 330 1.86 4.00 3.07 0.46 -0.04 1.21 0.605 Consultation 330 1.00 3.43 2.35 0.33 -0.75 0.98 0.182 Diversity 330 1.00 3.14 2.07 0.43 0.20 -0.31 0.398 1 Skewness, 2 Kurtosis, 3 Cronbach’s Alpha
Some of the results of the Kolmogorov-Smirnov and Shapiro-Wilk tests for
normality are shown in Table 5. They indicate significant statistics (p<0.0001) for all five
scales, hence, not strictly normal distribution. However, the absolute value of skewness for
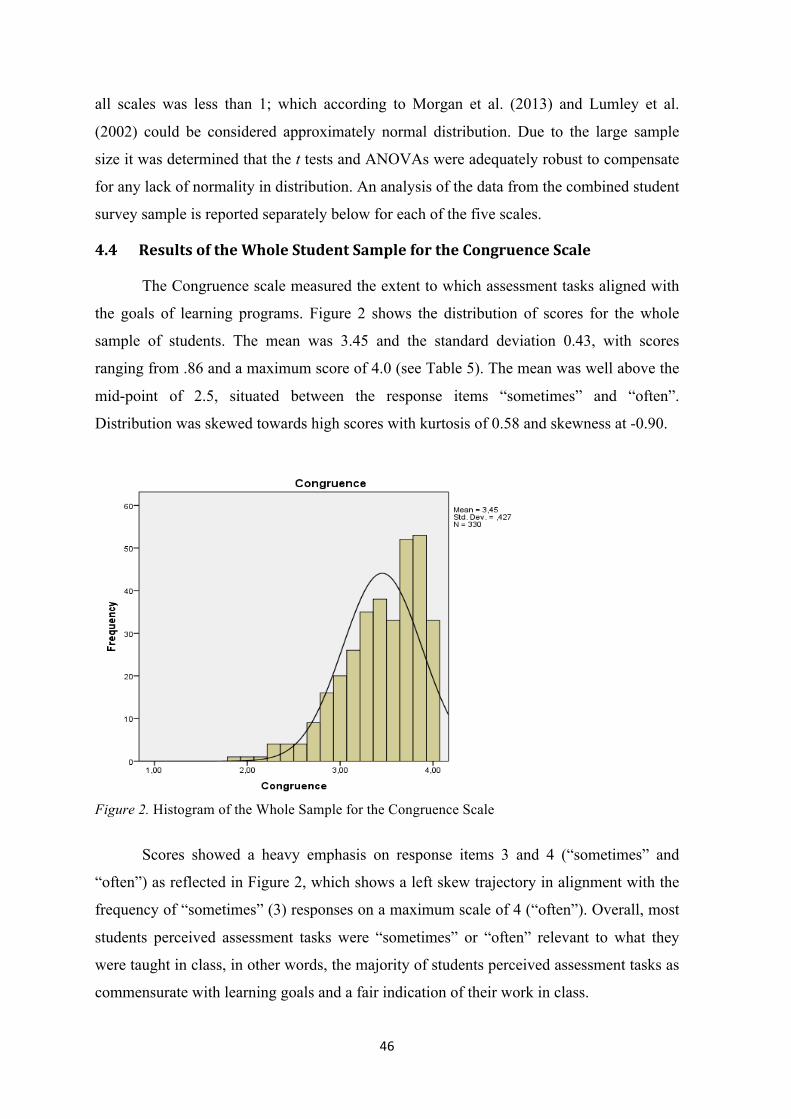
46
all scales was less than 1; which according to Morgan et al. (2013) and Lumley et al.
(2002) could be considered approximately normal distribution. Due to the large sample
size it was determined that the t tests and ANOVAs were adequately robust to compensate
for any lack of normality in distribution. An analysis of the data from the combined student
survey sample is reported separately below for each of the five scales.
4.4ResultsoftheWholeStudentSamplefortheCongruenceScale
The Congruence scale measured the extent to which assessment tasks aligned with
the goals of learning programs. Figure 2 shows the distribution of scores for the whole
sample of students. The mean was 3.45 and the standard deviation 0.43, with scores
ranging from .86 and a maximum score of 4.0 (see Table 5). The mean was well above the
mid-point of 2.5, situated between the response items “sometimes” and “often”.
Distribution was skewed towards high scores with kurtosis of 0.58 and skewness at -0.90.
Figure 2. Histogram of the Whole Sample for the Congruence Scale
Scores showed a heavy emphasis on response items 3 and 4 (“sometimes” and
“often”) as reflected in Figure 2, which shows a left skew trajectory in alignment with the
frequency of “sometimes” (3) responses on a maximum scale of 4 (“often”). Overall, most
students perceived assessment tasks were “sometimes” or “often” relevant to what they
were taught in class, in other words, the majority of students perceived assessment tasks as
commensurate with learning goals and a fair indication of their work in class.
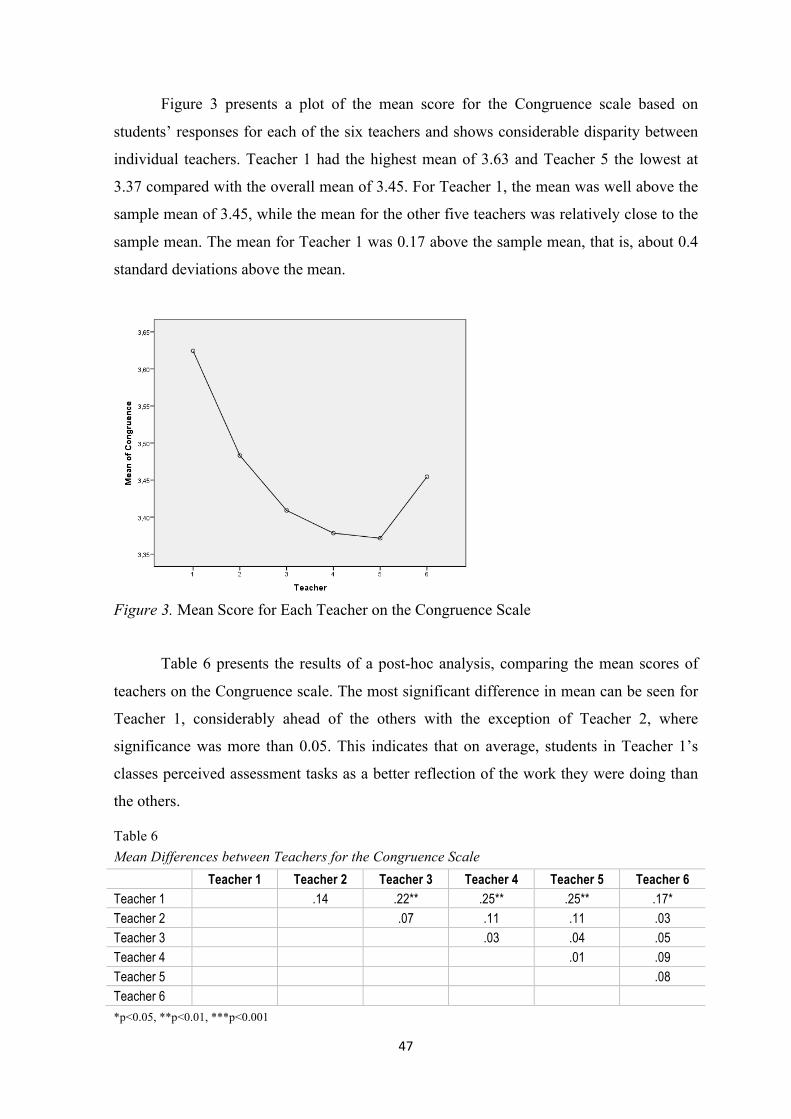
47
Figure 3 presents a plot of the mean score for the Congruence scale based on
students’ responses for each of the six teachers and shows considerable disparity between
individual teachers. Teacher 1 had the highest mean of 3.63 and Teacher 5 the lowest at
3.37 compared with the overall mean of 3.45. For Teacher 1, the mean was well above the
sample mean of 3.45, while the mean for the other five teachers was relatively close to the
sample mean. The mean for Teacher 1 was 0.17 above the sample mean, that is, about 0.4
standard deviations above the mean.
Figure 3. Mean Score for Each Teacher on the Congruence Scale
Table 6 presents the results of a post-hoc analysis, comparing the mean scores of
teachers on the Congruence scale. The most significant difference in mean can be seen for
Teacher 1, considerably ahead of the others with the exception of Teacher 2, where
significance was more than 0.05. This indicates that on average, students in Teacher 1’s
classes perceived assessment tasks as a better reflection of the work they were doing than
the others.
Table 6 Mean Differences between Teachers for the Congruence Scale Teacher 1 Teacher 2 Teacher 3 Teacher 4 Teacher 5 Teacher 6 Teacher 1 .14 .22** .25** .25** .17* Teacher 2 .07 .11 .11 .03 Teacher 3 .03 .04 .05 Teacher 4 .01 .09 Teacher 5 .08 Teacher 6 *p<0.05, **p<0.01, ***p<0.001
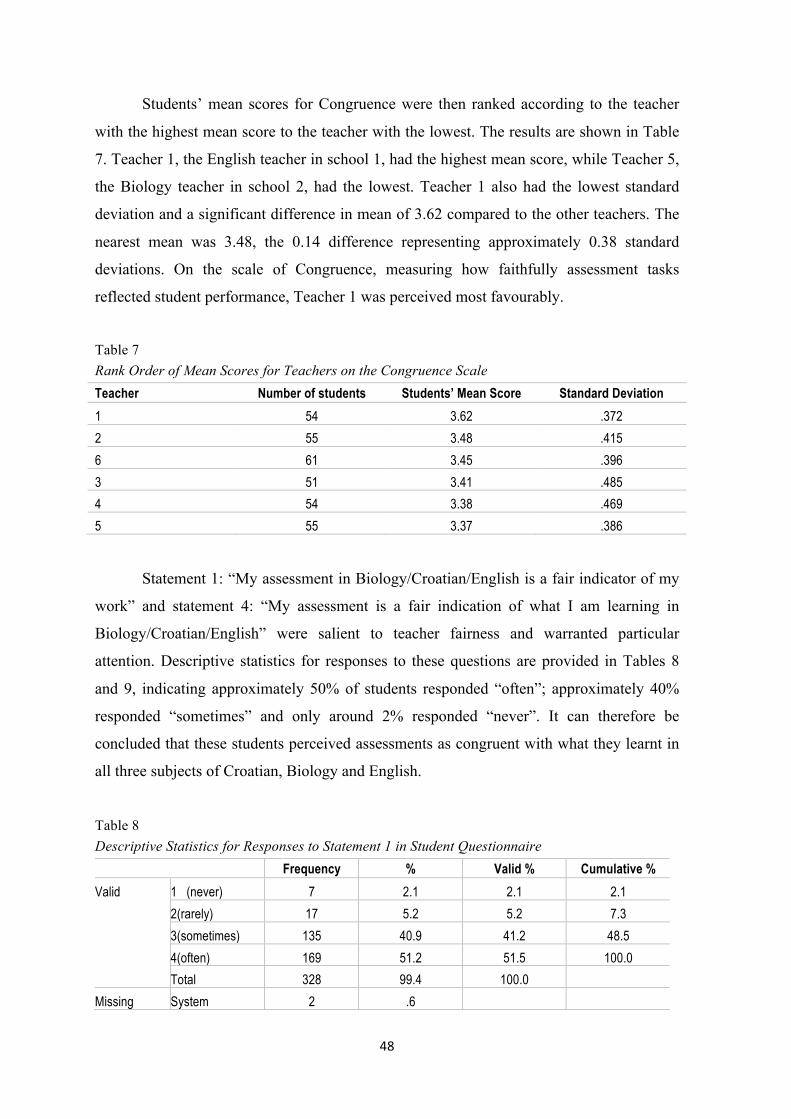
48
Students’ mean scores for Congruence were then ranked according to the teacher
with the highest mean score to the teacher with the lowest. The results are shown in Table
7. Teacher 1, the English teacher in school 1, had the highest mean score, while Teacher 5,
the Biology teacher in school 2, had the lowest. Teacher 1 also had the lowest standard
deviation and a significant difference in mean of 3.62 compared to the other teachers. The
nearest mean was 3.48, the 0.14 difference representing approximately 0.38 standard
deviations. On the scale of Congruence, measuring how faithfully assessment tasks
reflected student performance, Teacher 1 was perceived most favourably.
Table 7 Rank Order of Mean Scores for Teachers on the Congruence Scale Teacher Number of students Students’ Mean Score Standard Deviation 1 54 3.62 .372 2 55 3.48 .415 6 61 3.45 .396 3 51 3.41 .485 4 54 3.38 .469 5 55 3.37 .386
Statement 1: “My assessment in Biology/Croatian/English is a fair indicator of my
work” and statement 4: “My assessment is a fair indication of what I am learning in
Biology/Croatian/English” were salient to teacher fairness and warranted particular
attention. Descriptive statistics for responses to these questions are provided in Tables 8
and 9, indicating approximately 50% of students responded “often”; approximately 40%
responded “sometimes” and only around 2% responded “never”. It can therefore be
concluded that these students perceived assessments as congruent with what they learnt in
all three subjects of Croatian, Biology and English.
Table 8 Descriptive Statistics for Responses to Statement 1 in Student Questionnaire
Frequency % Valid % Cumulative % Valid 1 (never) 7 2.1 2.1 2.1
2(rarely) 17 5.2 5.2 7.3 3(sometimes) 135 40.9 41.2 48.5 4(often) 169 51.2 51.5 100.0 Total 328 99.4 100.0
Missing System 2 .6
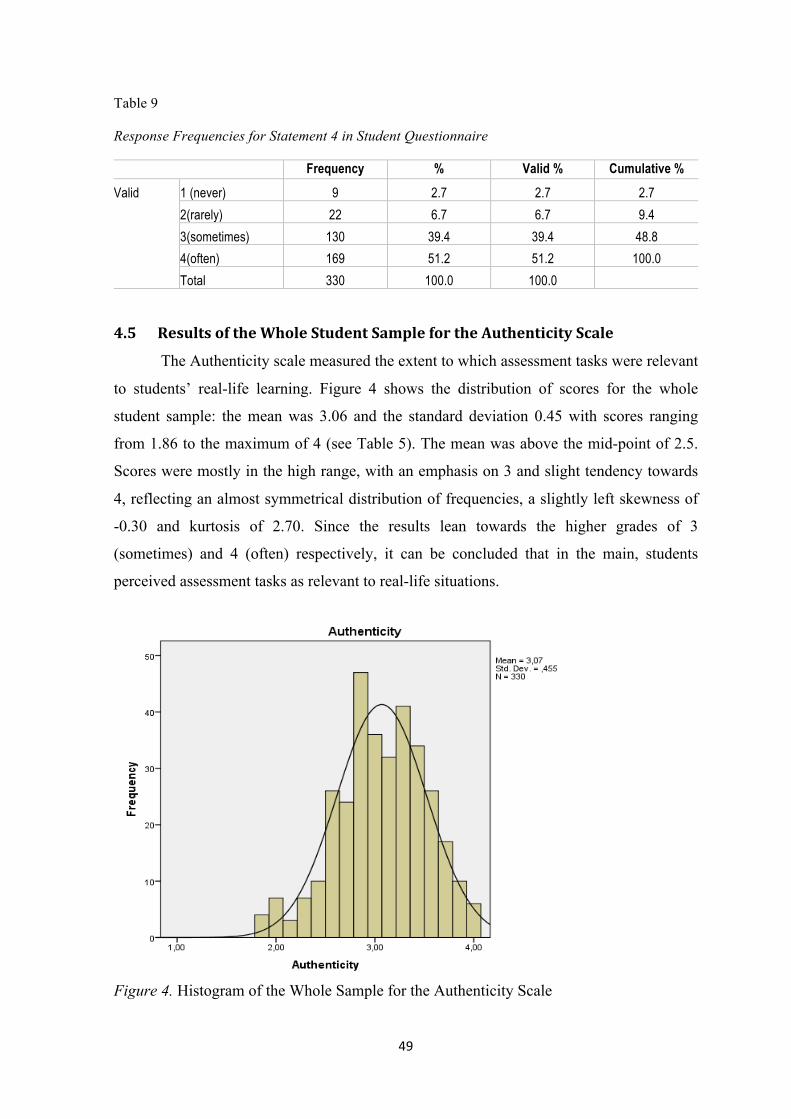
49
Table 9
Response Frequencies for Statement 4 in Student Questionnaire
Frequency % Valid % Cumulative % Valid 1 (never) 9 2.7 2.7 2.7
2(rarely) 22 6.7 6.7 9.4 3(sometimes) 130 39.4 39.4 48.8 4(often) 169 51.2 51.2 100.0 Total 330 100.0 100.0
4.5ResultsoftheWholeStudentSamplefortheAuthenticityScale
The Authenticity scale measured the extent to which assessment tasks were relevant
to students’ real-life learning. Figure 4 shows the distribution of scores for the whole
student sample: the mean was 3.06 and the standard deviation 0.45 with scores ranging
from 1.86 to the maximum of 4 (see Table 5). The mean was above the mid-point of 2.5.
Scores were mostly in the high range, with an emphasis on 3 and slight tendency towards
4, reflecting an almost symmetrical distribution of frequencies, a slightly left skewness of
-0.30 and kurtosis of 2.70. Since the results lean towards the higher grades of 3
(sometimes) and 4 (often) respectively, it can be concluded that in the main, students
perceived assessment tasks as relevant to real-life situations.
Figure 4. Histogram of the Whole Sample for the Authenticity Scale
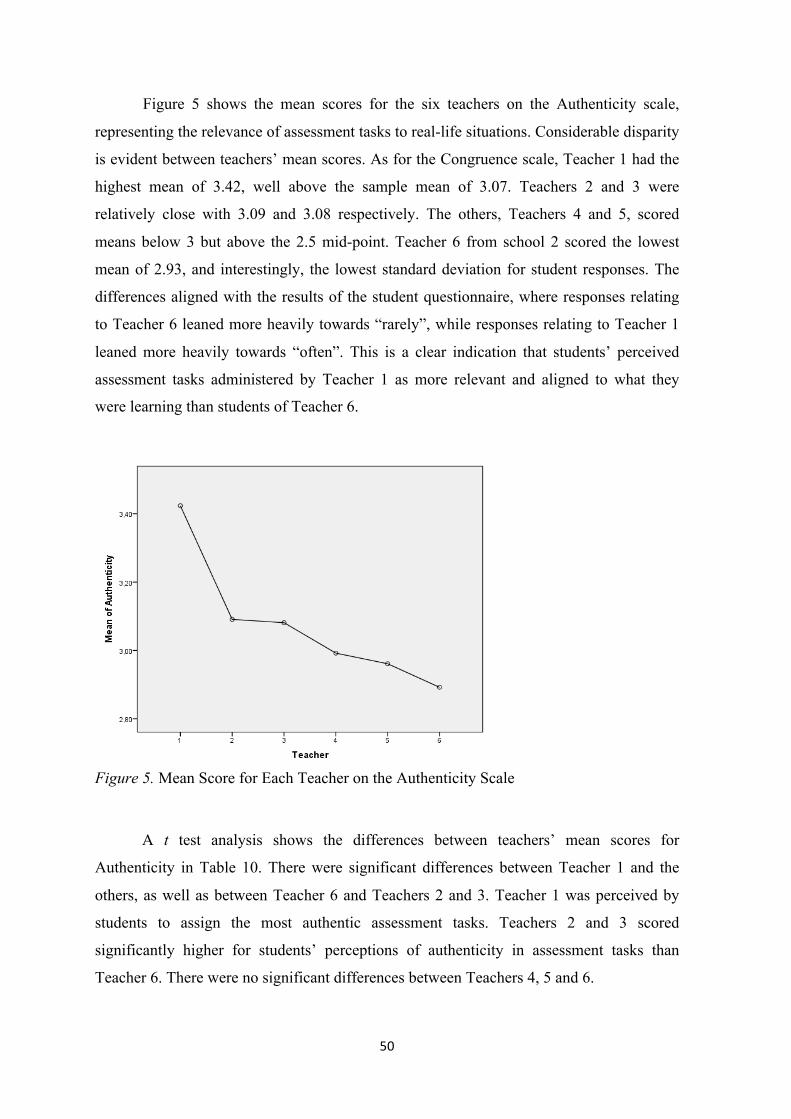
50
Figure 5 shows the mean scores for the six teachers on the Authenticity scale,
representing the relevance of assessment tasks to real-life situations. Considerable disparity
is evident between teachers’ mean scores. As for the Congruence scale, Teacher 1 had the
highest mean of 3.42, well above the sample mean of 3.07. Teachers 2 and 3 were
relatively close with 3.09 and 3.08 respectively. The others, Teachers 4 and 5, scored
means below 3 but above the 2.5 mid-point. Teacher 6 from school 2 scored the lowest
mean of 2.93, and interestingly, the lowest standard deviation for student responses. The
differences aligned with the results of the student questionnaire, where responses relating
to Teacher 6 leaned more heavily towards “rarely”, while responses relating to Teacher 1
leaned more heavily towards “often”. This is a clear indication that students’ perceived
assessment tasks administered by Teacher 1 as more relevant and aligned to what they
were learning than students of Teacher 6.
Figure 5. Mean Score for Each Teacher on the Authenticity Scale
A t test analysis shows the differences between teachers’ mean scores for
Authenticity in Table 10. There were significant differences between Teacher 1 and the
others, as well as between Teacher 6 and Teachers 2 and 3. Teacher 1 was perceived by
students to assign the most authentic assessment tasks. Teachers 2 and 3 scored
significantly higher for students’ perceptions of authenticity in assessment tasks than
Teacher 6. There were no significant differences between Teachers 4, 5 and 6.
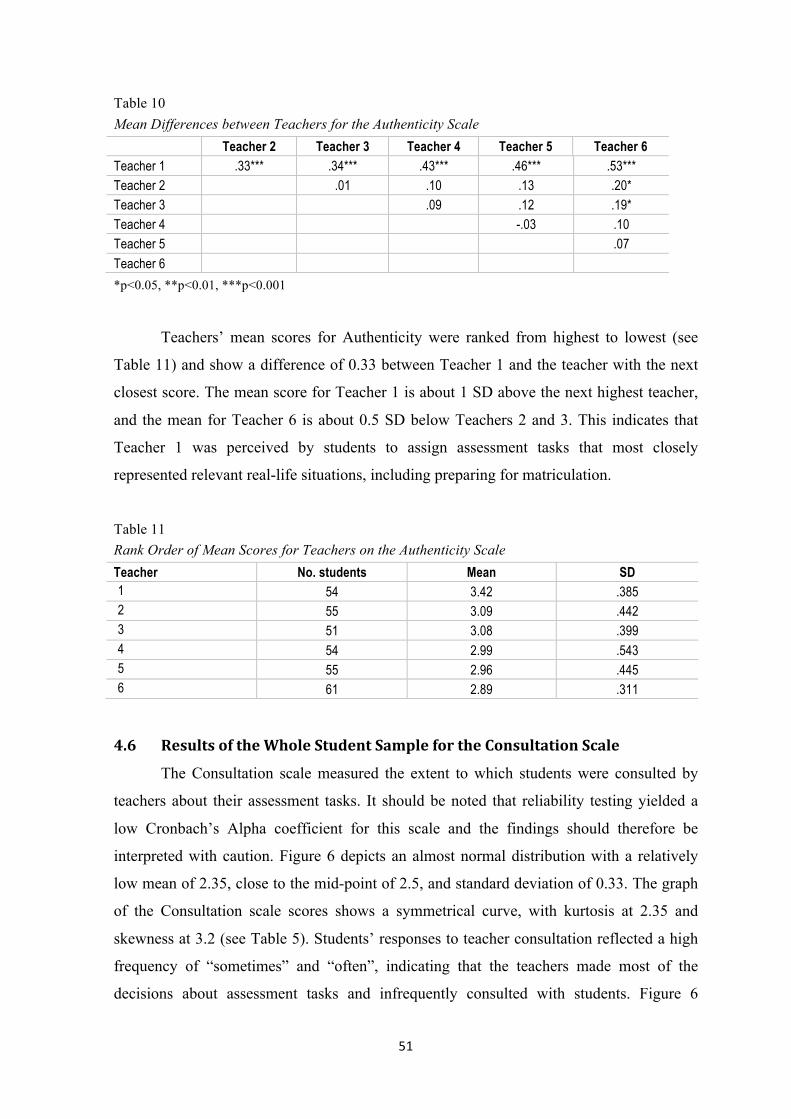
51
Table 10 Mean Differences between Teachers for the Authenticity Scale Teacher 2 Teacher 3 Teacher 4 Teacher 5 Teacher 6 Teacher 1 .33*** .34*** .43*** .46*** .53*** Teacher 2 .01 .10 .13 .20* Teacher 3 .09 .12 .19* Teacher 4 -.03 .10 Teacher 5 .07 Teacher 6 *p<0.05, **p<0.01, ***p<0.001
Teachers’ mean scores for Authenticity were ranked from highest to lowest (see
Table 11) and show a difference of 0.33 between Teacher 1 and the teacher with the next
closest score. The mean score for Teacher 1 is about 1 SD above the next highest teacher,
and the mean for Teacher 6 is about 0.5 SD below Teachers 2 and 3. This indicates that
Teacher 1 was perceived by students to assign assessment tasks that most closely
represented relevant real-life situations, including preparing for matriculation.
Table 11 Rank Order of Mean Scores for Teachers on the Authenticity Scale Teacher No. students Mean SD 1 54 3.42 .385 2 55 3.09 .442 3 51 3.08 .399 4 54 2.99 .543 5 55 2.96 .445 6 61 2.89 .311
4.6ResultsoftheWholeStudentSamplefortheConsultationScale
The Consultation scale measured the extent to which students were consulted by
teachers about their assessment tasks. It should be noted that reliability testing yielded a
low Cronbach’s Alpha coefficient for this scale and the findings should therefore be
interpreted with caution. Figure 6 depicts an almost normal distribution with a relatively
low mean of 2.35, close to the mid-point of 2.5, and standard deviation of 0.33. The graph
of the Consultation scale scores shows a symmetrical curve, with kurtosis at 2.35 and
skewness at 3.2 (see Table 5). Students’ responses to teacher consultation reflected a high
frequency of “sometimes” and “often”, indicating that the teachers made most of the
decisions about assessment tasks and infrequently consulted with students. Figure 6
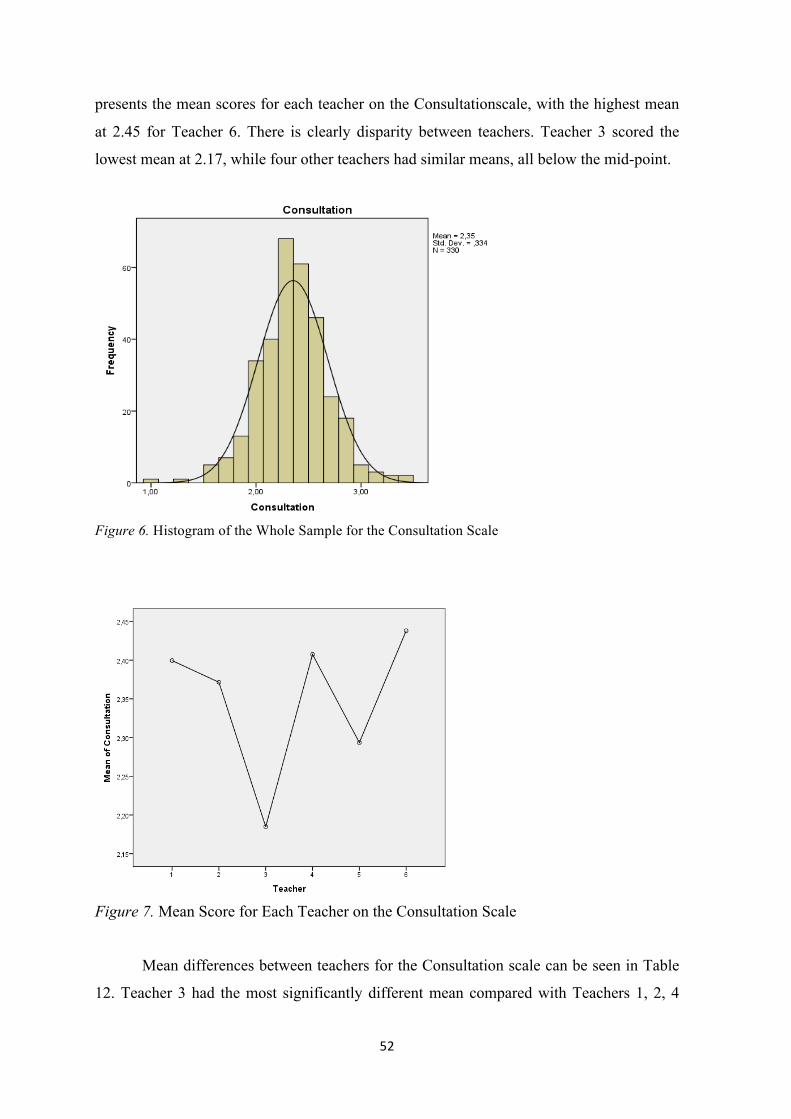
52
presents the mean scores for each teacher on the Consultationscale, with the highest mean
at 2.45 for Teacher 6. There is clearly disparity between teachers. Teacher 3 scored the
lowest mean at 2.17, while four other teachers had similar means, all below the mid-point.
Figure 6. Histogram of the Whole Sample for the Consultation Scale
Figure 7. Mean Score for Each Teacher on the Consultation Scale
Mean differences between teachers for the Consultation scale can be seen in Table
12. Teacher 3 had the most significantly different mean compared with Teachers 1, 2, 4
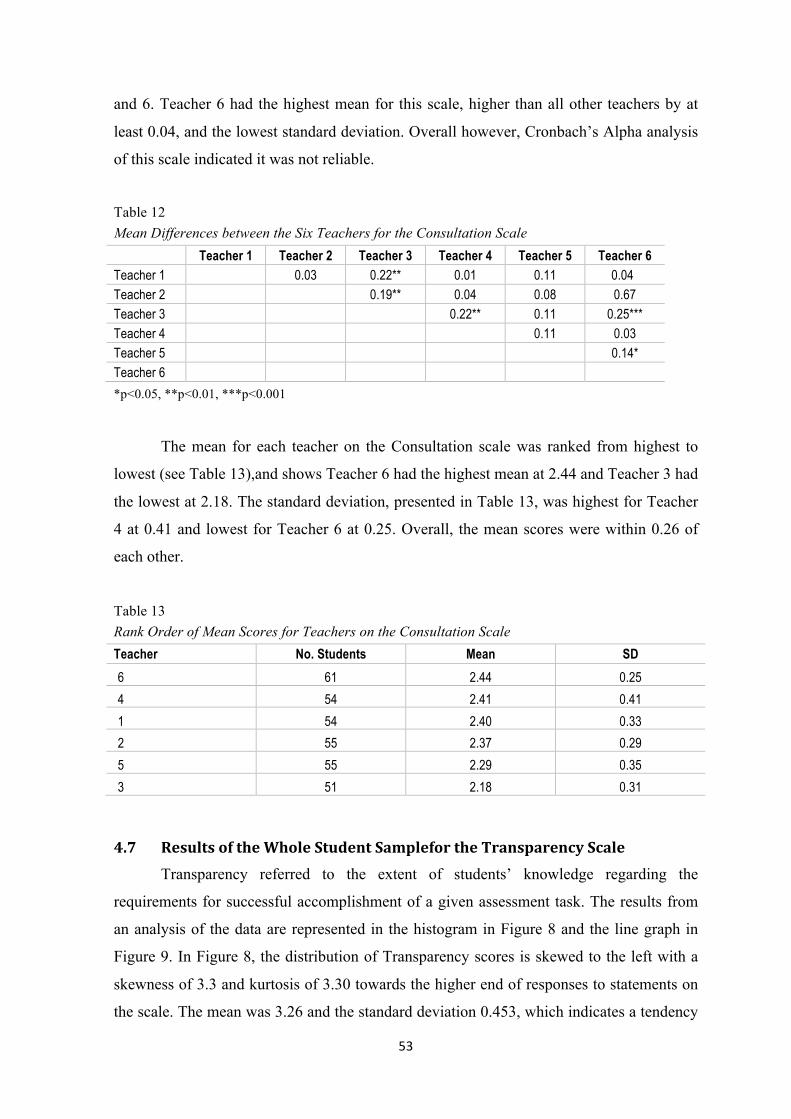
53
and 6. Teacher 6 had the highest mean for this scale, higher than all other teachers by at
least 0.04, and the lowest standard deviation. Overall however, Cronbach’s Alpha analysis
of this scale indicated it was not reliable.
Table 12 Mean Differences between the Six Teachers for the Consultation Scale Teacher 1 Teacher 2 Teacher 3 Teacher 4 Teacher 5 Teacher 6 Teacher 1 0.03 0.22** 0.01 0.11 0.04 Teacher 2 0.19** 0.04 0.08 0.67 Teacher 3 0.22** 0.11 0.25*** Teacher 4 0.11 0.03 Teacher 5 0.14* Teacher 6 *p<0.05, **p<0.01, ***p<0.001
The mean for each teacher on the Consultation scale was ranked from highest to
lowest (see Table 13),and shows Teacher 6 had the highest mean at 2.44 and Teacher 3 had
the lowest at 2.18. The standard deviation, presented in Table 13, was highest for Teacher
4 at 0.41 and lowest for Teacher 6 at 0.25. Overall, the mean scores were within 0.26 of
each other.
Table 13 Rank Order of Mean Scores for Teachers on the Consultation Scale Teacher No. Students Mean SD 6 61 2.44 0.25 4 54 2.41 0.41 1 54 2.40 0.33 2 55 2.37 0.29 5 55 2.29 0.35 3 51 2.18 0.31
4.7ResultsoftheWholeStudentSamplefortheTransparencyScaleTransparency referred to the extent of students’ knowledge regarding the
requirements for successful accomplishment of a given assessment task. The results from
an analysis of the data are represented in the histogram in Figure 8 and the line graph in
Figure 9. In Figure 8, the distribution of Transparency scores is skewed to the left with a
skewness of 3.3 and kurtosis of 3.30 towards the higher end of responses to statements on
the scale. The mean was 3.26 and the standard deviation 0.453, which indicates a tendency
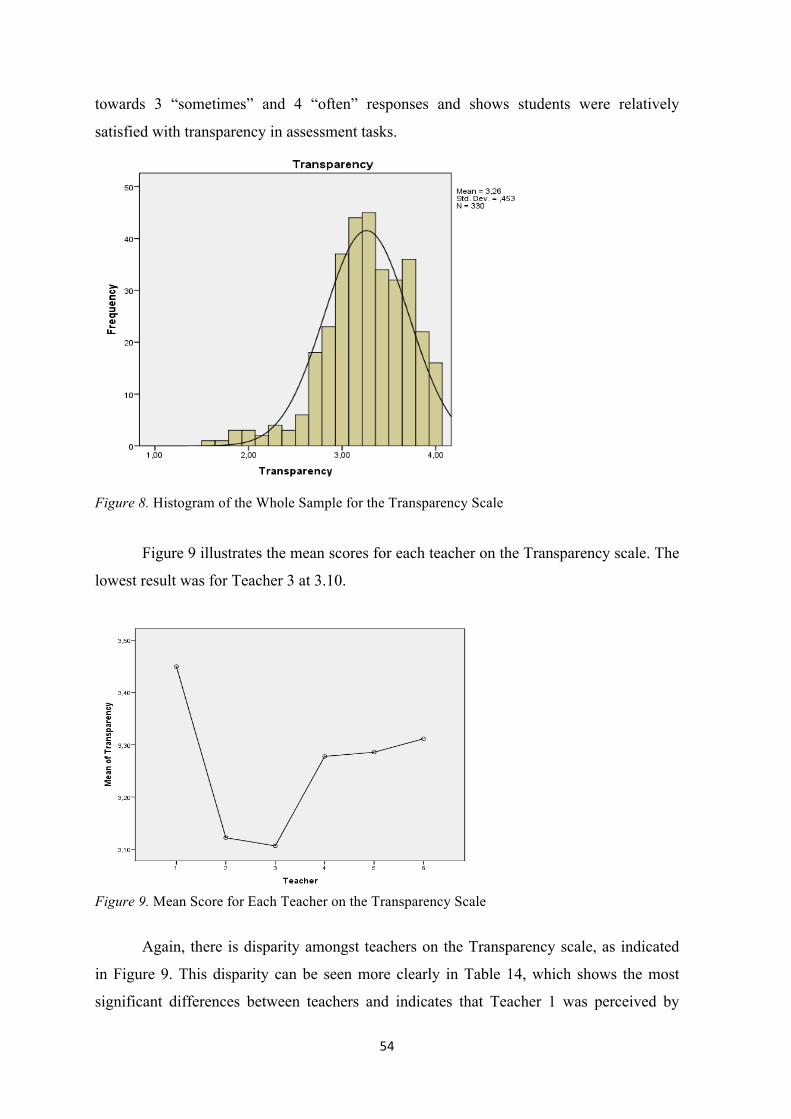
54
towards 3 “sometimes” and 4 “often” responses and shows students were relatively
satisfied with transparency in assessment tasks.
Figure 8. Histogram of the Whole Sample for the Transparency Scale
Figure 9 illustrates the mean scores for each teacher on the Transparency scale. The
lowest result was for Teacher 3 at 3.10.
Figure 9. Mean Score for Each Teacher on the Transparency Scale
Again, there is disparity amongst teachers on the Transparency scale, as indicated
in Figure 9. This disparity can be seen more clearly in Table 14, which shows the most
significant differences between teachers and indicates that Teacher 1 was perceived by
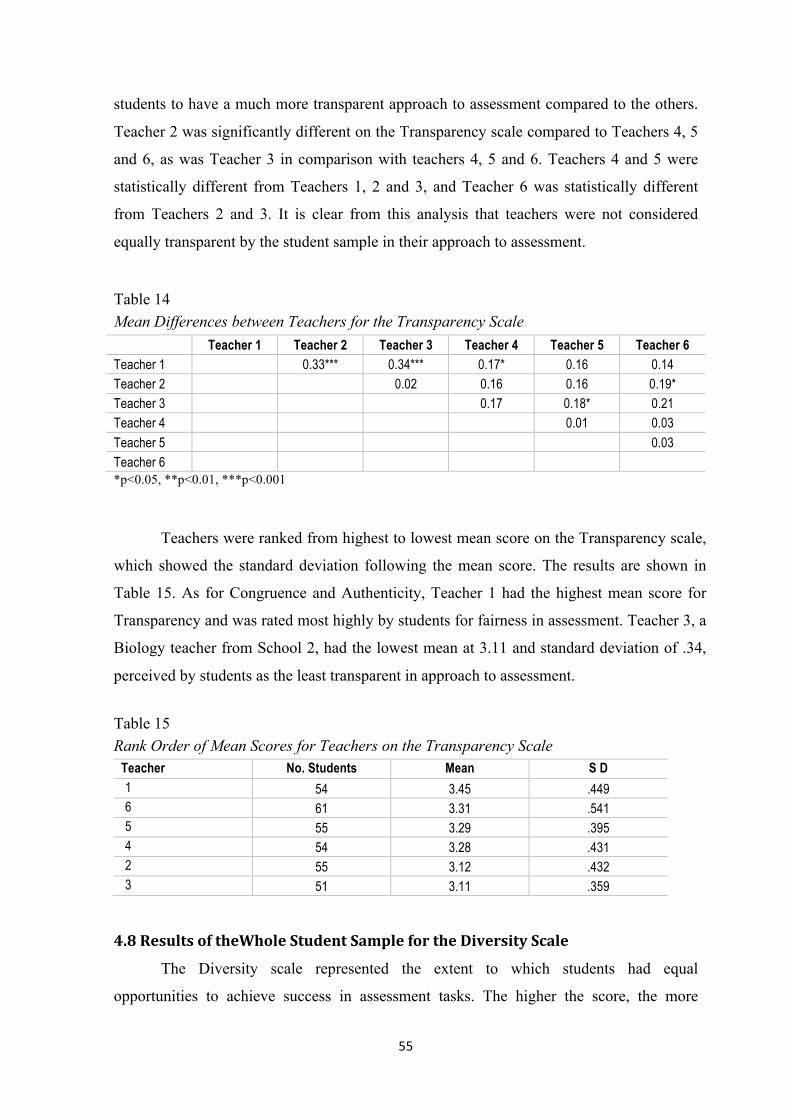
55
students to have a much more transparent approach to assessment compared to the others.
Teacher 2 was significantly different on the Transparency scale compared to Teachers 4, 5
and 6, as was Teacher 3 in comparison with teachers 4, 5 and 6. Teachers 4 and 5 were
statistically different from Teachers 1, 2 and 3, and Teacher 6 was statistically different
from Teachers 2 and 3. It is clear from this analysis that teachers were not considered
equally transparent by the student sample in their approach to assessment.
Table 14 Mean Differences between Teachers for the Transparency Scale Teacher 1 Teacher 2 Teacher 3 Teacher 4 Teacher 5 Teacher 6 Teacher 1 0.33*** 0.34*** 0.17* 0.16 0.14 Teacher 2 0.02 0.16 0.16 0.19* Teacher 3 0.17 0.18* 0.21 Teacher 4 0.01 0.03 Teacher 5 0.03 Teacher 6 *p<0.05, **p<0.01, ***p<0.001
Teachers were ranked from highest to lowest mean score on the Transparency scale,
which showed the standard deviation following the mean score. The results are shown in
Table 15. As for Congruence and Authenticity, Teacher 1 had the highest mean score for
Transparency and was rated most highly by students for fairness in assessment. Teacher 3, a
Biology teacher from School 2, had the lowest mean at 3.11 and standard deviation of .34,
perceived by students as the least transparent in approach to assessment.
Table 15 Rank Order of Mean Scores for Teachers on the Transparency Scale
Teacher No. Students Mean S D 1 54 3.45 .449 6 61 3.31 .541 5 55 3.29 .395 4 54 3.28 .431 2 55 3.12 .432 3 51 3.11 .359
4.8ResultsoftheWholeStudentSamplefortheDiversityScale
The Diversity scale represented the extent to which students had equal
opportunities to achieve success in assessment tasks. The higher the score, the more
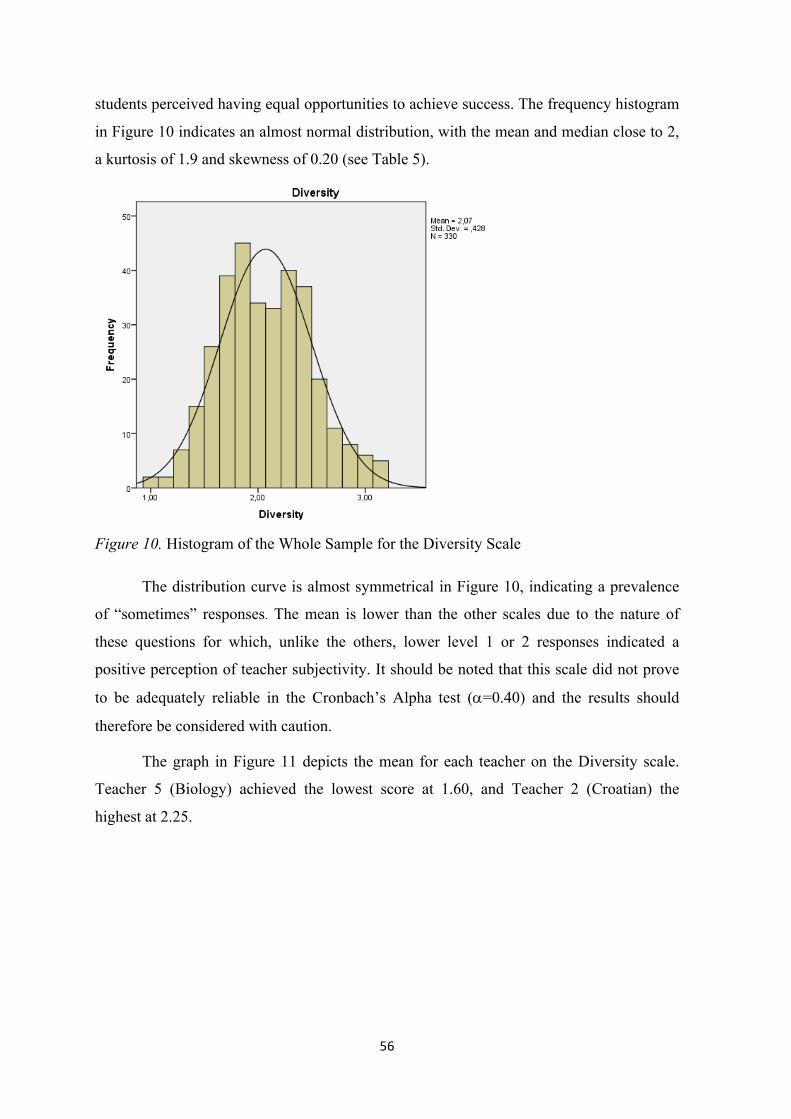
56
students perceived having equal opportunities to achieve success. The frequency histogram
in Figure 10 indicates an almost normal distribution, with the mean and median close to 2,
a kurtosis of 1.9 and skewness of 0.20 (see Table 5).
Figure 10. Histogram of the Whole Sample for the Diversity Scale
The distribution curve is almost symmetrical in Figure 10, indicating a prevalence
of “sometimes” responses. The mean is lower than the other scales due to the nature of
these questions for which, unlike the others, lower level 1 or 2 responses indicated a
positive perception of teacher subjectivity. It should be noted that this scale did not prove
to be adequately reliable in the Cronbach’s Alpha test (a=0.40) and the results should
therefore be considered with caution.
The graph in Figure 11 depicts the mean for each teacher on the Diversity scale.
Teacher 5 (Biology) achieved the lowest score at 1.60, and Teacher 2 (Croatian) the
highest at 2.25.
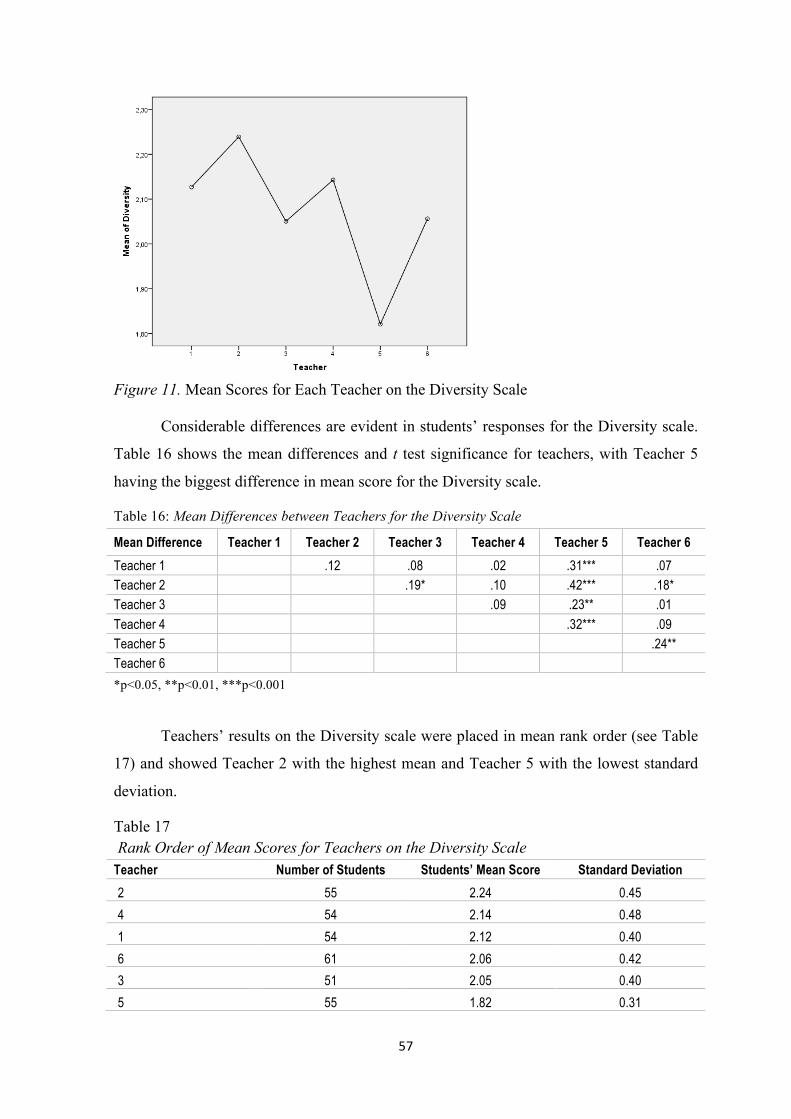
57
Figure 11. Mean Scores for Each Teacher on the Diversity Scale
Considerable differences are evident in students’ responses for the Diversity scale.
Table 16 shows the mean differences and t test significance for teachers, with Teacher 5
having the biggest difference in mean score for the Diversity scale.
Table 16: Mean Differences between Teachers for the Diversity Scale
Mean Difference Teacher 1 Teacher 2 Teacher 3 Teacher 4 Teacher 5 Teacher 6 Teacher 1 .12 .08 .02 .31*** .07 Teacher 2 .19* .10 .42*** .18* Teacher 3 .09 .23** .01 Teacher 4 .32*** .09 Teacher 5 .24** Teacher 6 *p<0.05, **p<0.01, ***p<0.001
Teachers’ results on the Diversity scale were placed in mean rank order (see Table
17) and showed Teacher 2 with the highest mean and Teacher 5 with the lowest standard
deviation.
Table 17 Rank Order of Mean Scores for Teachers on the Diversity Scale Teacher Number of Students Students’ Mean Score Standard Deviation 2 55 2.24 0.45
4 54 2.14 0.48
1 54 2.12 0.40
6 61 2.06 0.42
3 51 2.05 0.40
5 55 1.82 0.31
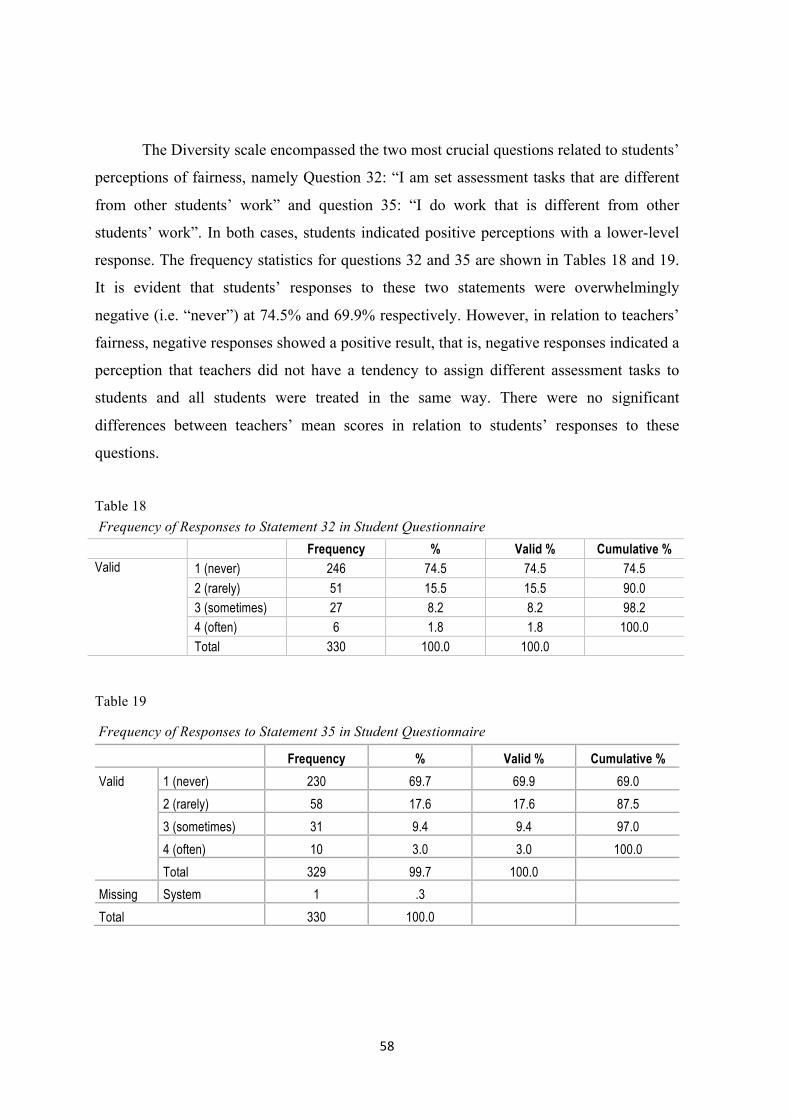
58
The Diversity scale encompassed the two most crucial questions related to students’
perceptions of fairness, namely Question 32: “I am set assessment tasks that are different
from other students’ work” and question 35: “I do work that is different from other
students’ work”. In both cases, students indicated positive perceptions with a lower-level
response. The frequency statistics for questions 32 and 35 are shown in Tables 18 and 19.
It is evident that students’ responses to these two statements were overwhelmingly
negative (i.e. “never”) at 74.5% and 69.9% respectively. However, in relation to teachers’
fairness, negative responses showed a positive result, that is, negative responses indicated a
perception that teachers did not have a tendency to assign different assessment tasks to
students and all students were treated in the same way. There were no significant
differences between teachers’ mean scores in relation to students’ responses to these
questions.
Table 18 Frequency of Responses to Statement 32 in Student Questionnaire Frequency % Valid % Cumulative % Valid 1 (never) 246 74.5 74.5 74.5
2 (rarely) 51 15.5 15.5 90.0 3 (sometimes) 27 8.2 8.2 98.2 4 (often) 6 1.8 1.8 100.0 Total 330 100.0 100.0
Table 19
Frequency of Responses to Statement 35 in Student Questionnaire
Frequency % Valid % Cumulative % Valid 1 (never) 230 69.7 69.9 69.0
2 (rarely) 58 17.6 17.6 87.5 3 (sometimes) 31 9.4 9.4 97.0 4 (often) 10 3.0 3.0 100.0 Total 329 99.7 100.0
Missing System 1 .3
Total 330 100.0
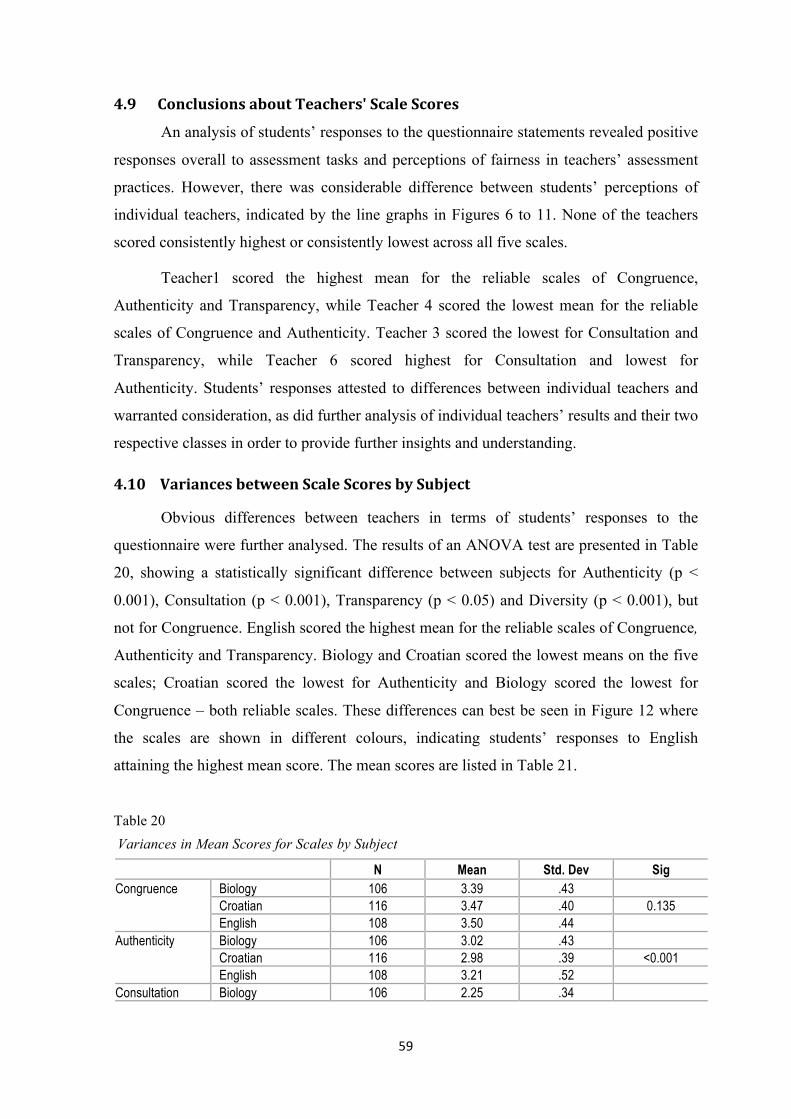
59
4.9ConclusionsaboutTeachers'ScaleScores
An analysis of students’ responses to the questionnaire statements revealed positive
responses overall to assessment tasks and perceptions of fairness in teachers’ assessment
practices. However, there was considerable difference between students’ perceptions of
individual teachers, indicated by the line graphs in Figures 6 to 11. None of the teachers
scored consistently highest or consistently lowest across all five scales.
Teacher1 scored the highest mean for the reliable scales of Congruence,
Authenticity and Transparency, while Teacher 4 scored the lowest mean for the reliable
scales of Congruence and Authenticity. Teacher 3 scored the lowest for Consultation and
Transparency, while Teacher 6 scored highest for Consultation and lowest for
Authenticity. Students’ responses attested to differences between individual teachers and
warranted consideration, as did further analysis of individual teachers’ results and their two
respective classes in order to provide further insights and understanding.
4.10VariancesbetweenScaleScoresbySubject
Obvious differences between teachers in terms of students’ responses to the
questionnaire were further analysed. The results of an ANOVA test are presented in Table
20, showing a statistically significant difference between subjects for Authenticity (p <
0.001), Consultation (p < 0.001), Transparency (p < 0.05) and Diversity (p < 0.001), but
not for Congruence. English scored the highest mean for the reliable scales of Congruence,
Authenticity and Transparency. Biology and Croatian scored the lowest means on the five
scales; Croatian scored the lowest for Authenticity and Biology scored the lowest for
Congruence – both reliable scales. These differences can best be seen in Figure 12 where
the scales are shown in different colours, indicating students’ responses to English
attaining the highest mean score. The mean scores are listed in Table 21.
Table 20 Variances in Mean Scores for Scales by Subject
N Mean Std. Dev Sig Congruence Biology 106 3.39 .43
Croatian 116 3.47 .40 0.135 English 108 3.50 .44
Authenticity Biology 106 3.02 .43 Croatian 116 2.98 .39 <0.001 English 108 3.21 .52
Consultation Biology 106 2.25 .34
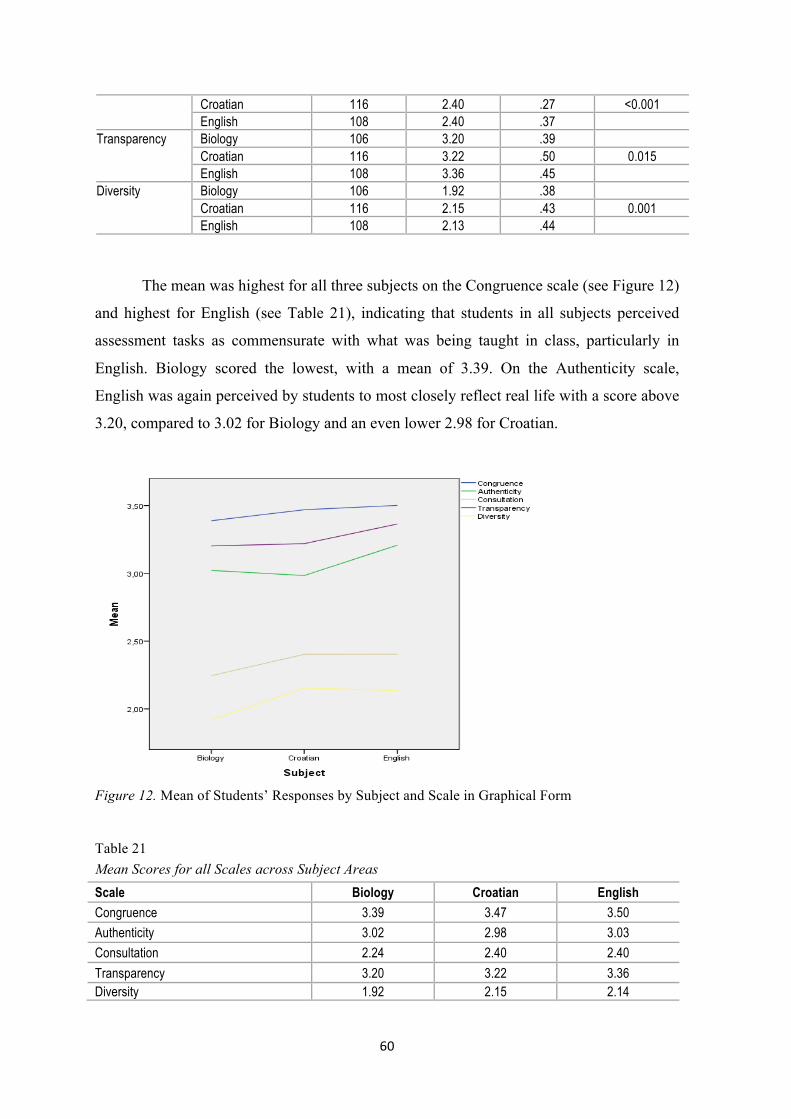
60
Croatian 116 2.40 .27 <0.001 English 108 2.40 .37
Transparency Biology 106 3.20 .39 Croatian 116 3.22 .50 0.015 English 108 3.36 .45
Diversity Biology 106 1.92 .38 Croatian 116 2.15 .43 0.001 English 108 2.13 .44
The mean was highest for all three subjects on the Congruence scale (see Figure 12)
and highest for English (see Table 21), indicating that students in all subjects perceived
assessment tasks as commensurate with what was being taught in class, particularly in
English. Biology scored the lowest, with a mean of 3.39. On the Authenticity scale,
English was again perceived by students to most closely reflect real life with a score above
3.20, compared to 3.02 for Biology and an even lower 2.98 for Croatian.
Figure 12. Mean of Students’ Responses by Subject and Scale in Graphical Form Table 21 Mean Scores for all Scales across Subject Areas Scale Biology Croatian English Congruence 3.39 3.47 3.50 Authenticity 3.02 2.98 3.03 Consultation 2.24 2.40 2.40 Transparency 3.20 3.22 3.36 Diversity 1.92 2.15 2.14
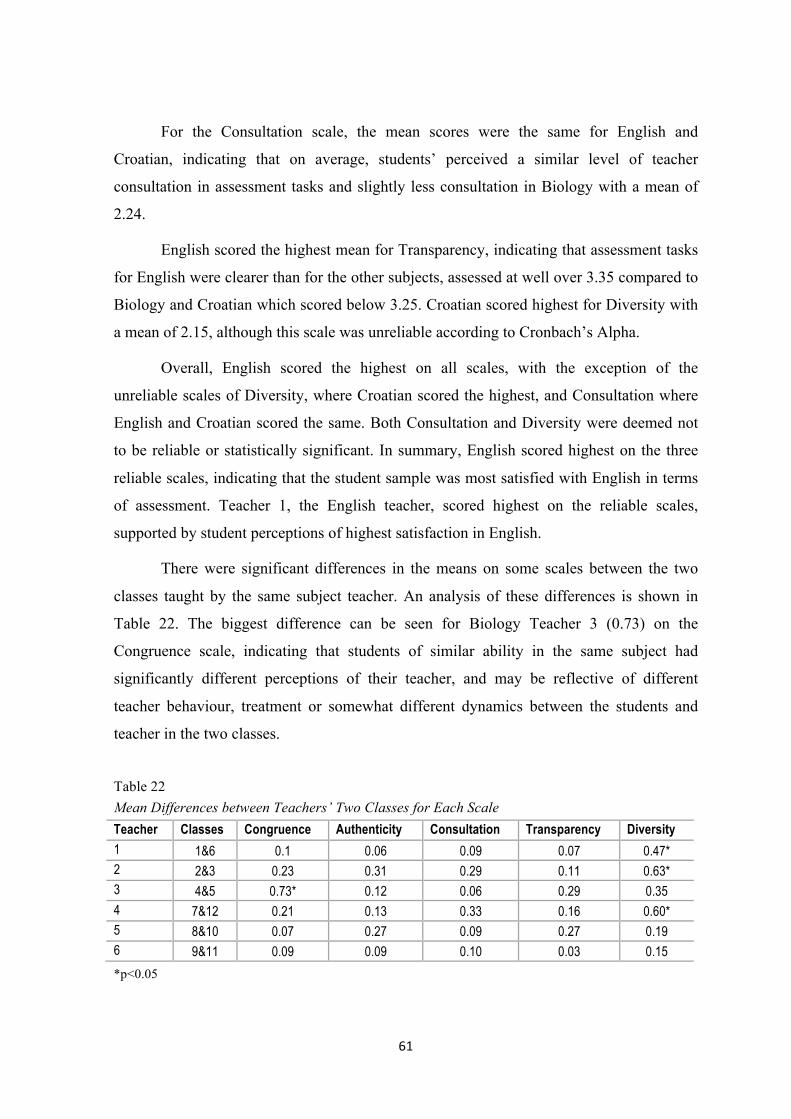
61
For the Consultation scale, the mean scores were the same for English and
Croatian, indicating that on average, students’ perceived a similar level of teacher
consultation in assessment tasks and slightly less consultation in Biology with a mean of
2.24.
English scored the highest mean for Transparency, indicating that assessment tasks
for English were clearer than for the other subjects, assessed at well over 3.35 compared to
Biology and Croatian which scored below 3.25. Croatian scored highest for Diversity with
a mean of 2.15, although this scale was unreliable according to Cronbach’s Alpha.
Overall, English scored the highest on all scales, with the exception of the
unreliable scales of Diversity, where Croatian scored the highest, and Consultation where
English and Croatian scored the same. Both Consultation and Diversity were deemed not
to be reliable or statistically significant. In summary, English scored highest on the three
reliable scales, indicating that the student sample was most satisfied with English in terms
of assessment. Teacher 1, the English teacher, scored highest on the reliable scales,
supported by student perceptions of highest satisfaction in English.
There were significant differences in the means on some scales between the two
classes taught by the same subject teacher. An analysis of these differences is shown in
Table 22. The biggest difference can be seen for Biology Teacher 3 (0.73) on the
Congruence scale, indicating that students of similar ability in the same subject had
significantly different perceptions of their teacher, and may be reflective of different
teacher behaviour, treatment or somewhat different dynamics between the students and
teacher in the two classes.
Table 22 Mean Differences between Teachers’ Two Classes for Each Scale Teacher Classes Congruence Authenticity Consultation Transparency Diversity 1 1&6 0.1 0.06 0.09 0.07 0.47* 2 2&3 0.23 0.31 0.29 0.11 0.63* 3 4&5 0.73* 0.12 0.06 0.29 0.35 4 7&12 0.21 0.13 0.33 0.16 0.60* 5 8&10 0.07 0.27 0.09 0.27 0.19 6 9&11 0.09 0.09 0.10 0.03 0.15 *p<0.05
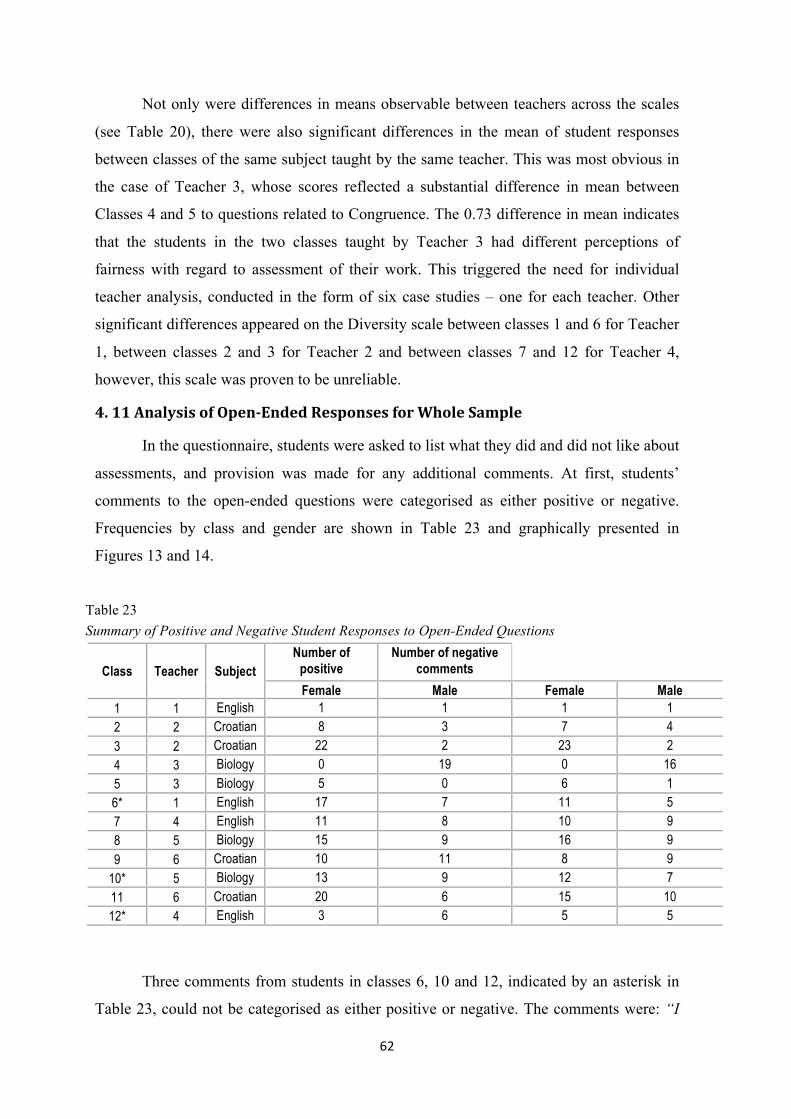
62
Not only were differences in means observable between teachers across the scales
(see Table 20), there were also significant differences in the mean of student responses
between classes of the same subject taught by the same teacher. This was most obvious in
the case of Teacher 3, whose scores reflected a substantial difference in mean between
Classes 4 and 5 to questions related to Congruence. The 0.73 difference in mean indicates
that the students in the two classes taught by Teacher 3 had different perceptions of
fairness with regard to assessment of their work. This triggered the need for individual
teacher analysis, conducted in the form of six case studies – one for each teacher. Other
significant differences appeared on the Diversity scale between classes 1 and 6 for Teacher
1, between classes 2 and 3 for Teacher 2 and between classes 7 and 12 for Teacher 4,
however, this scale was proven to be unreliable.
4.11AnalysisofOpen-EndedResponsesforWholeSample
In the questionnaire, students were asked to list what they did and did not like about
assessments, and provision was made for any additional comments. At first, students’
comments to the open-ended questions were categorised as either positive or negative.
Frequencies by class and gender are shown in Table 23 and graphically presented in
Figures 13 and 14.
Table 23 Summary of Positive and Negative Student Responses to Open-Ended Questions
Class Teacher Subject Number of
positive comments
Number of negative comments
Female Male Female Male 1 1 English 1 1 1 1 2 2 Croatian 8 3 7 4 3 2 Croatian 22 2 23 2 4 3 Biology 0 19 0 16 5 3 Biology 5 0 6 1 6* 1 English 17 7 11 5 7 4 English 11 8 10 9 8 5 Biology 15 9 16 9 9 6 Croatian 10 11 8 9
10* 5 Biology 13 9 12 7 11 6 Croatian 20 6 15 10 12* 4 English 3 6 5 5
Three comments from students in classes 6, 10 and 12, indicated by an asterisk in
Table 23, could not be categorised as either positive or negative. The comments were: “I
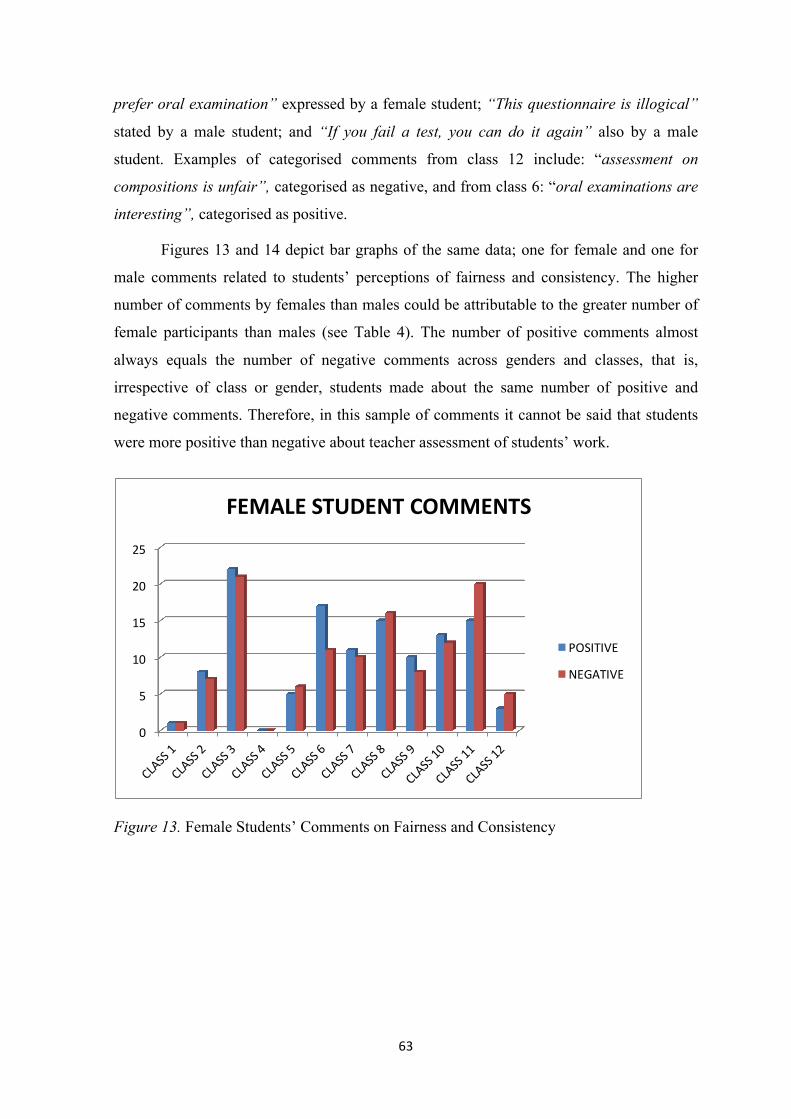
63
prefer oral examination” expressed by a female student; “This questionnaire is illogical”
stated by a male student; and “If you fail a test, you can do it again” also by a male
student. Examples of categorised comments from class 12 include: “assessment on
compositions is unfair”, categorised as negative, and from class 6: “oral examinations are
interesting”, categorised as positive.
Figures 13 and 14 depict bar graphs of the same data; one for female and one for
male comments related to students’ perceptions of fairness and consistency. The higher
number of comments by females than males could be attributable to the greater number of
female participants than males (see Table 4). The number of positive comments almost
always equals the number of negative comments across genders and classes, that is,
irrespective of class or gender, students made about the same number of positive and
negative comments. Therefore, in this sample of comments it cannot be said that students
were more positive than negative about teacher assessment of students’ work.
Figure 13. Female Students’ Comments on Fairness and Consistency
0
5
10
15
20
25
FEMALESTUDENTCOMMENTS
POSITIVE
NEGATIVE
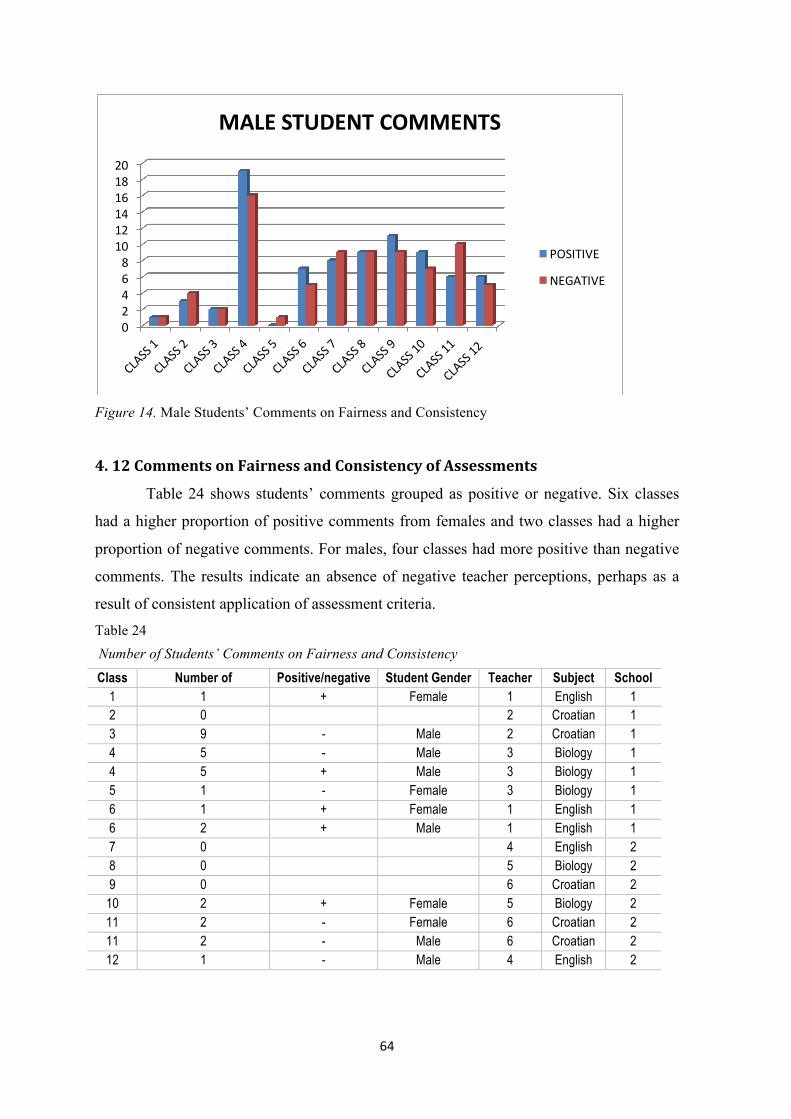
64
Figure 14. Male Students’ Comments on Fairness and Consistency
4.12CommentsonFairnessandConsistencyofAssessments
Table 24 shows students’ comments grouped as positive or negative. Six classes
had a higher proportion of positive comments from females and two classes had a higher
proportion of negative comments. For males, four classes had more positive than negative
comments. The results indicate an absence of negative teacher perceptions, perhaps as a
result of consistent application of assessment criteria. Table 24 Number of Students’ Comments on Fairness and Consistency
Class Number of Comments
Positive/negative Student Gender
Teacher Subject School 1 1 + Female 1 English 1 2 0 2 Croatian 1 3 9 - Male 2 Croatian 1 4 5 - Male 3 Biology 1 4 5 + Male 3 Biology 1 5 1 - Female 3 Biology 1 6 1 + Female 1 English 1 6 2 + Male 1 English 1 7 0 4 English 2 8 0 5 Biology 2 9 0 6 Croatian 2
10 2 + Female 5 Biology 2 11 2 - Female 6 Croatian 2 11 2 - Male 6 Croatian 2 12 1 - Male 4 English 2
02468
101214161820
MALESTUDENTCOMMENTS
POSITIVE
NEGATIVE
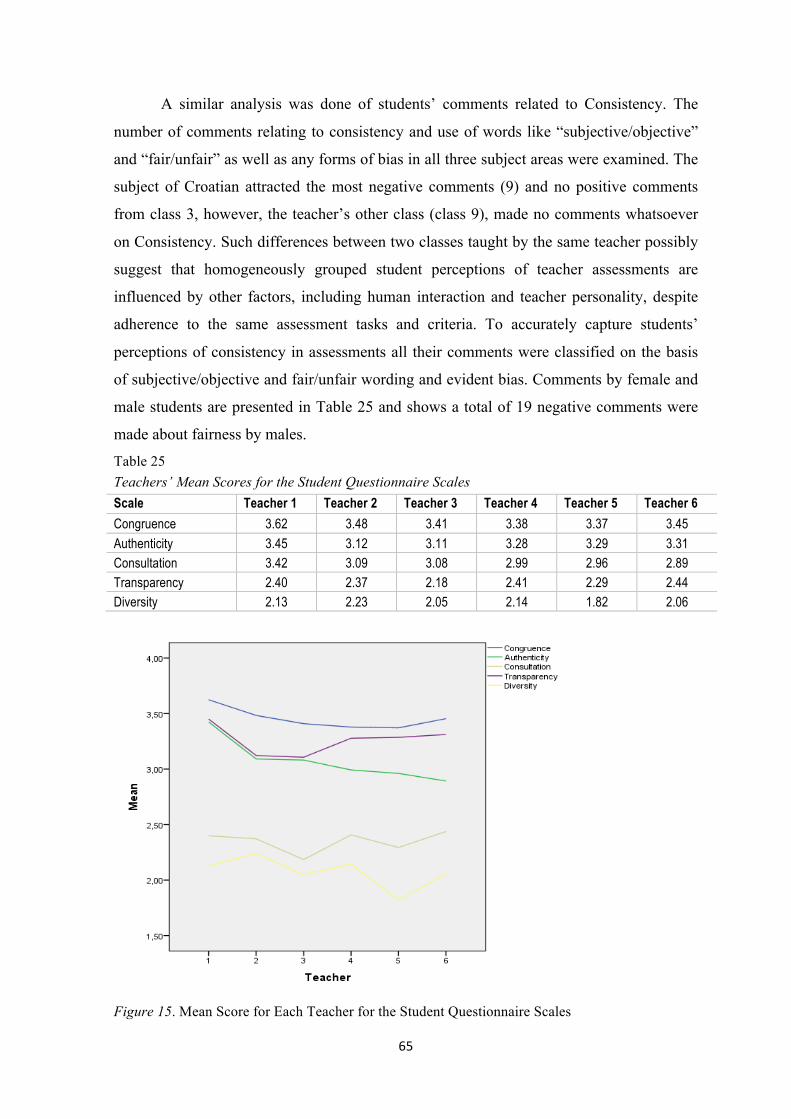
65
A similar analysis was done of students’ comments related to Consistency. The
number of comments relating to consistency and use of words like “subjective/objective”
and “fair/unfair” as well as any forms of bias in all three subject areas were examined. The
subject of Croatian attracted the most negative comments (9) and no positive comments
from class 3, however, the teacher’s other class (class 9), made no comments whatsoever
on Consistency. Such differences between two classes taught by the same teacher possibly
suggest that homogeneously grouped student perceptions of teacher assessments are
influenced by other factors, including human interaction and teacher personality, despite
adherence to the same assessment tasks and criteria. To accurately capture students’
perceptions of consistency in assessments all their comments were classified on the basis
of subjective/objective and fair/unfair wording and evident bias. Comments by female and
male students are presented in Table 25 and shows a total of 19 negative comments were
made about fairness by males.
Table 25 Teachers’ Mean Scores for the Student Questionnaire Scales Scale Teacher 1 Teacher 2 Teacher 3 Teacher 4 Teacher 5 Teacher 6 Congruence 3.62 3.48 3.41 3.38 3.37 3.45 Authenticity 3.45 3.12 3.11 3.28 3.29 3.31 Consultation 3.42 3.09 3.08 2.99 2.96 2.89 Transparency 2.40 2.37 2.18 2.41 2.29 2.44 Diversity 2.13 2.23 2.05 2.14 1.82 2.06
Figure 15. Mean Score for Each Teacher for the Student Questionnaire Scales
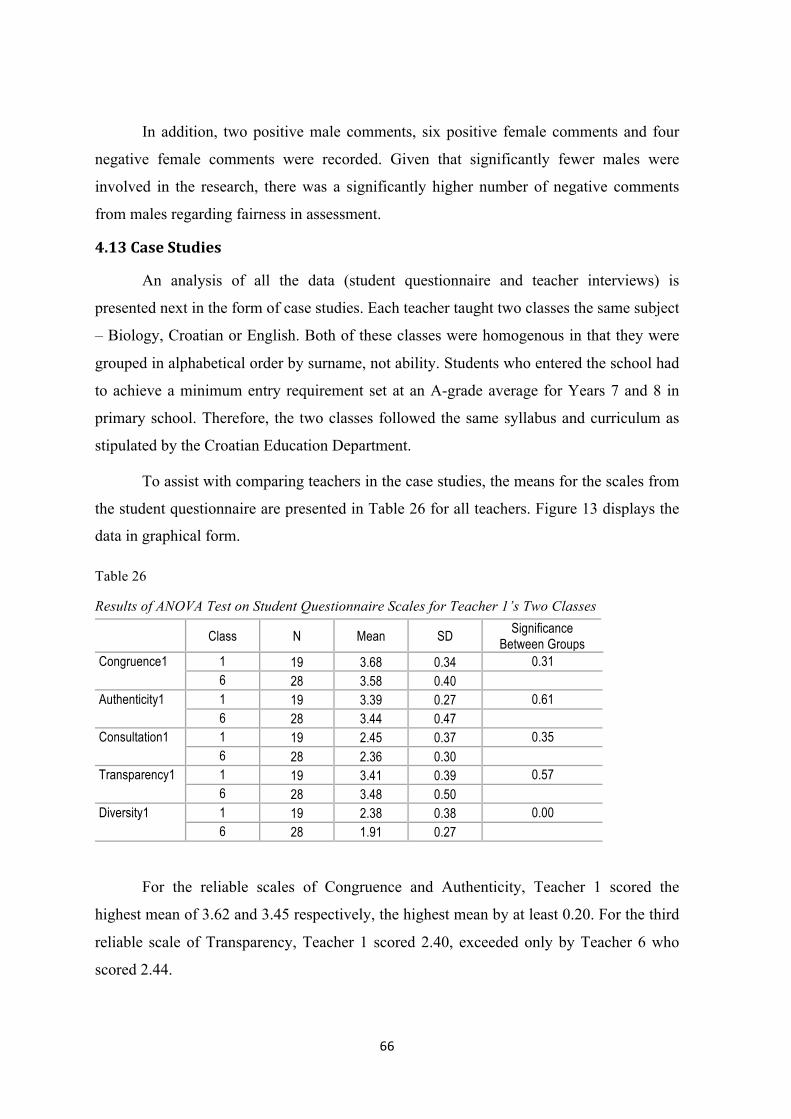
66
In addition, two positive male comments, six positive female comments and four
negative female comments were recorded. Given that significantly fewer males were
involved in the research, there was a significantly higher number of negative comments
from males regarding fairness in assessment.
4.13CaseStudies
An analysis of all the data (student questionnaire and teacher interviews) is
presented next in the form of case studies. Each teacher taught two classes the same subject
– Biology, Croatian or English. Both of these classes were homogenous in that they were
grouped in alphabetical order by surname, not ability. Students who entered the school had
to achieve a minimum entry requirement set at an A-grade average for Years 7 and 8 in
primary school. Therefore, the two classes followed the same syllabus and curriculum as
stipulated by the Croatian Education Department.
To assist with comparing teachers in the case studies, the means for the scales from
the student questionnaire are presented in Table 26 for all teachers. Figure 13 displays the
data in graphical form.
Table 26
Results of ANOVA Test on Student Questionnaire Scales for Teacher 1’s Two Classes
Class N Mean SD Significance Between Groups
Congruence1 1 19 3.68 0.34 0.31 6 28 3.58 0.40
Authenticity1 1 19 3.39 0.27 0.61 6 28 3.44 0.47
Consultation1 1 19 2.45 0.37 0.35 6 28 2.36 0.30
Transparency1 1 19 3.41 0.39 0.57 6 28 3.48 0.50
Diversity1 1 19 2.38 0.38 0.00 6 28 1.91 0.27
For the reliable scales of Congruence and Authenticity, Teacher 1 scored the
highest mean of 3.62 and 3.45 respectively, the highest mean by at least 0.20. For the third
reliable scale of Transparency, Teacher 1 scored 2.40, exceeded only by Teacher 6 who
scored 2.44.
67
For the unreliable scale of Consultation Teachers 1, 2 and 3 scored a mean response
above 3 (“often”) with Teacher 1 the highest at 3.42. In the other unreliable scale of
Diversity, Teacher 1 scored third highest at 2.13, Teacher 4 scored second highest at 2.14
and Teacher 2 scored the highest at 2.23.
The next sections present an analysis of each teacher. The results of the quantitative
survey data are provided for each teacher, followed by an analysis of the qualitative data
from the interviews and open-ended survey questions.
4.13.1CaseStudy1
Teacher 1 from School 1 taught English as a second language to classes 1 and 6,
comprised of 19 and 28 students respectively. The former was made up of 14 females and
5 males, and the latter, 22 females and 6 males for a total of 47 students in the two classes
combined (see Table 4).
4.13.1.1QuantitativeDataResults
As discussed earlier, the mean scores of the student questionnaire responses were
highest for Teacher 1 (see Table 23) and significantly higher than the other teachers for the
reliable scales of Congruence, Authenticity and Transparency. On average, this indicates
that students perceived Teacher 1s assessments to be a more commensurate measure of
their abilities than the others. The only reliable scale for which Teacher 1 did not achieve
the highest mean score was Transparency, suggesting this teacher’s assessments were not
viewed by students as the most coherent of all. Scores for all scales were then analysed by
means of an ANOVA test to detect differences and similarities between classes 1 and 6
taught by Teacher 1. The results are shown in Table 26.
A significant difference (p<0001) in mean scores can be seen for the unreliable
Diversity scale. For the three reliable scales, Congruence, Authenticity and Transparency,
no significant differences emerged between the teacher’s two classes. It can therefore be
reasonably concluded that students’ perceptions of assessments were similar for these
measures in both of Teacher 1’s classes.
4.13.1.2QualitativeDataResults
Teacher 1 was asked the standard interview questions. A summary follows,
together with explanations about each question in turn. Student responses from both
classes to the open-ended questions supplemented the discussion. This procedure was
repeated for each teacher and her two classes. Since they taught the same subject to both
68
classes, teachers were interviewed once – their responses are paraphrased and discussed in
further detail below.
Question1:Whatassessmenttoolsdoyouuse?
Teacher 1 used both oral and written tasks for tests and assessments. The specific
ratio of oral to written tasks was not stated, but it is common practice in Croatia to use both
in equal measure. She also used essay and grammar tasks, and endeavoured to assess all
four foreign-language skills: reading, writing, listening and speaking. Assessment tasks
included learning texts off by heart from textbooks and reproducing them orally, as well as
grammar tests requiring rewriting of sentences, filling in gaps with correct verbs or
prepositions. Other tasks could be found in matriculation examination papers, such as cloze
(gapped text for students to provide missing words), word formation, multiple-choice,
reading, comprehension and composition.
Question2:Howoftendoyouusetheseassessmenttools?
This teacher orally assessed each student three times a year and conducted written
tests (English writing tasks given to the whole class under test conditions) four to five
times a year, representing the obligatory number of assessments as stipulated by the state
education department. Between two and four assessments took place per semester.
Students were required to write an essay twice a year, in addition to two grammar and two
vocabulary tests. Oral examinations were undertaken twice a year.
While written assessments were carried out with the whole class under test
conditions, oral assessments did not involve all the students at the same time. This form of
assessment is prevalent in Croatia, but unlike written tests, students are not all examined at
the same time, nor asked the same questions under the same conditions. In oral
assessments, teachers typically ask questions of students one at a time while the others
listen, so the process is lengthy, drawn out and lacking in rigour and consistency.
Question3:Doyougivethestudentsassessmentcriteria?
Teacher 1 clearly explained what she expected from her students without providing
specific information on how assessments would be scored. She firmly believed that
students were clear about assessment requirements.
Question4:Ifso,inwhatform?
Teacher 1 stated her students had to write down the assessment criteria after she
clearly explained them and copied the county grids provided by the Croatian Education

69
Department. She believed it was important for students to be aware of the assessment
criteria because they explained the marks, how they were allocated and their meanings.
Teacher 1 informed the researcher that it was the responsibility of the subject teachers in
each county to decide the criteria for assessments, write them up and make them available
in the school. It should be noted that all schools, by decree of the Croatian Education
Department, were required to draw up assessment criteria for all their subjects at a county
level. This was usually done by the subject teachers who got together and formulated the
assessment criteria.
Question5:Howconsistentlydoyouapplythem?
This teacher claimed emphatically that she applied the criteria consistently, but later
admitted that she did not always do so fully. To some extent her consistency depended on
the task, and she did not always apply all criteria to the same task, possibly deeming some
criteria not as important as others. She explained that students’ grades for written tasks
were sometimes erratic, and claimed not to place students into categories after just one test,
a frequent practice in Croatia whereby teachers continue to award some students the same
mark awarded for their first assessment task.
Question6:Whatdoyoubaseyourassessmentmoston?
In Teacher 1’s opinion, thoroughness, hard work, diligence, and depth were the
most important features of students’ work. She also considered grammatical accuracy,
vocabulary, word choice, and sentence construction important aspects for assessing a
foreign language.
Question7:Whatdoyouthinkstudentsthinkabouthowfairyourassessmentis?
Teacher 1 thought many students’ first impression of her was that she was too
strict, but as they got used to her and the way she assessed them, their perceptions changed
and they became more positive. She believed students were satisfied with her assessments
because they knew what she expected.
4.13.1.3CommentaryonStudentandTeacherResponses
In her interview, Teacher 1 said she applied the assessment criteria very
consistently, but acknowledged there were sometimes inconsistencies, because in her view,
not all assessment criteria applied to every task in the same way. Her seemingly conflicting
statements could be construed as evidence of inconsistency, yet the students’ comments
appear to indicate high levels of satisfaction with this teacher’s assessment practices and
70
procedures. Students in both classes 1 and 6 indicated in their open-ended comments
section of the questionnaire that assessments were fair. One student in class 6 corroborated
Teacher 1’s remark about some students who undeservedly continued to receive
consistently high grades for assessment tasks. The most frequently mentioned negative
issues associated with assessments were concerned with stress, and in some cases,
inappropriate assessment tasks for evaluating students’ capability. For example, some
students perceived literature as unimportant for learning a language. Nevertheless, students
in this particular English class were evidently satisfied overall, especially in comparison
with the others.
Amongst the very few negative responses were claims from three students in one
class that the topics/textbooks were boring, one student even questioned the relevance of
the contents. The remainder of the student responses (15) were overwhelmingly positive
regarding assessments and content. Responses about teacher involvement and notifications
of upcoming assessments were positive, and students spoke affirmatively about their
participation with the teacher. This was consistent with the results of the survey scales,
showing high positivity for Teacher 1 compared to other teachers, and the highest mean
score of all teacher participants in this research (see Table 23). It is possible there was a
particular connection between this group of students and the teacher that may have
influenced their generally positive perception of the subject. A typical comment from
students in classes 1 and 6 was “the teacher is understanding and involved”. The majority
of students (7) found that assessments reflected real life and were useful.
The only significant difference between Teacher 1’s two classes was noted in the
unreliable scale of Diversity. In all other respects, the students in her two classes had
similar views in relation to the other four scales, so it can reasonably be concluded that the
students’ perceptions of this teacher’s assessments were similar for classes 1 and 6 in the
subject of English.
Teacher 1 scored the highest for the Transparency, Authenticity and Consultation
scales, consistent with students’ mostly positive comments. Other comments on what
students liked and disliked about assessments in this subject were all positive and dispute
any belief that assessment was a negative experience for students. Some comments about
lack of objectivity were clarified by students to mean the task’s lack of objectivity (e.g.
literature not relevant to foreign language learning), not the teacher’s.
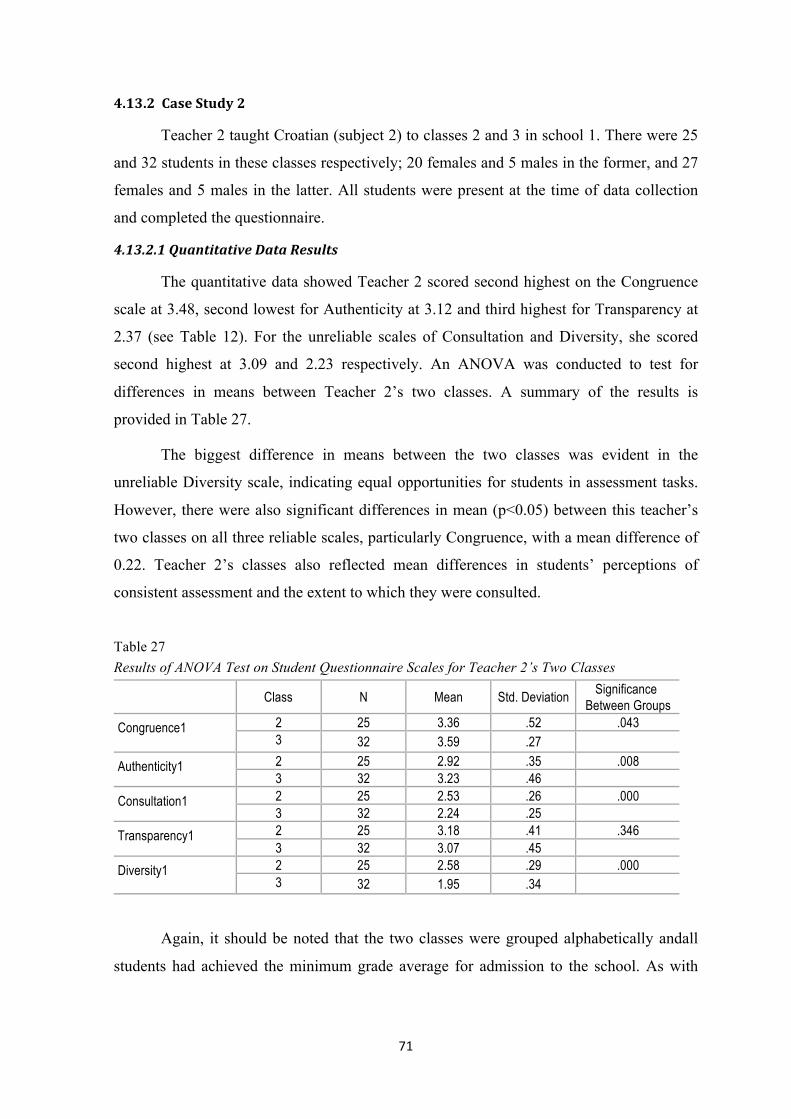
71
4.13.2CaseStudy2
Teacher 2 taught Croatian (subject 2) to classes 2 and 3 in school 1. There were 25
and 32 students in these classes respectively; 20 females and 5 males in the former, and 27
females and 5 males in the latter. All students were present at the time of data collection
and completed the questionnaire.
4.13.2.1QuantitativeDataResults
The quantitative data showed Teacher 2 scored second highest on the Congruence
scale at 3.48, second lowest for Authenticity at 3.12 and third highest for Transparency at
2.37 (see Table 12). For the unreliable scales of Consultation and Diversity, she scored
second highest at 3.09 and 2.23 respectively. An ANOVA was conducted to test for
differences in means between Teacher 2’s two classes. A summary of the results is
provided in Table 27.
The biggest difference in means between the two classes was evident in the
unreliable Diversity scale, indicating equal opportunities for students in assessment tasks.
However, there were also significant differences in mean (p<0.05) between this teacher’s
two classes on all three reliable scales, particularly Congruence, with a mean difference of
0.22. Teacher 2’s classes also reflected mean differences in students’ perceptions of
consistent assessment and the extent to which they were consulted.
Table 27 Results of ANOVA Test on Student Questionnaire Scales for Teacher 2’s Two Classes
Class N Mean Std. Deviation Significance Between Groups
Congruence1
2 25 3.36 .52 .043 3 32 3.59 .27
Authenticity1 2 25 2.92 .35 .008 3 32 3.23 .46
Consultation1 2 25 2.53 .26 .000 3 32 2.24 .25
Transparency1 2 25 3.18 .41 .346 3 32 3.07 .45
Diversity1 2 25 2.58 .29 .000 3 32 1.95 .34
Again, it should be noted that the two classes were grouped alphabetically andall
students had achieved the minimum grade average for admission to the school. As with
72
Teacher 1, there was a significant difference between classes for the unreliable Diversity
scale.
4.13.2.2QualitativeDataResults
Teacher 2 was from school 1 and taught two classes of Croatian (subject 2). Class 2
comprised 25 students: 20 female and 5 male, and class 3 was made up of 32 students; 27
female and 5 male. The teacher was interviewed once for both classes. Her responses are
paraphrased and discussed in detail below, supplemented by her students’ responses to the
open-ended questions.
Q1:Whatassessmenttoolsdoyouuse?
Teacher 2 claimed to use descriptive and numerical feedback for both oral and
written assessment tasks, including essays, reading the prescribed literature, written and
oral book reports. This means grades were awarded both numerically and by way of
comments. While feedback in oral examinations was provided orally, teachers also
recorded the marks in a marks book, together with any additional comments she wished to
record about students.
Q2:Howoftendoyouusetheseassessmenttools?
This teacher’s annual assessment tasks for her students included four grammar
tasks, two composition tasks and three oral tasks. This equated to roughly two written
assessment tasks each semester and the three oral examinations spread out over the year,
with at least one in the first semester. Over and above book reports, students were required
to know the prescribed literature texts in detail for the state matriculation examination, so
literature assessments comprised four tasks a year. Teacher 2 examined her students orally
on a daily basis, and advised that her students were assigned 10 assessment items annually,
spread out as equally as possible throughout the year. She undertook oral examinations
with students individually, and all students had to complete the same exam before the next
examination was set. It should be mentioned that the maximum number of oral exams were
at the teacher’s discretion, provided they accounted for the required number of grades for
each student.
Q3:Doyougivethestudentsassessmentcriteria?
Teacher 2 provided her students with the assessment criteria determined at school
level both orally and in tabular form on paper. Each criterion was accompanied by a
descriptor explaining in detail how marks were allocated.
73
Q4:Ifso,inwhatform?
Students received the assessment criteria orally and in written form from Teacher 2,
who also explained them to her students. She claimed to apply the criteria that were jointly
determined by all Croatian subject teachers in the school, in accordance with a recent move
to introduce unified criteria at a school level.
Q5:Howconsistentlydoyouapplythem?
According to Teacher 2, every effort was made to apply the criteria as closely and
consistently as possible. However, there was some disparity in her initial claims of
consistency and subsequent admission that this wasn’t always the case, since she was
inclined to apply them more strictly to written than oral tasks. Teacher 2 was of the view
that strict application of criteria was easiest in grammar because the answers were either
right or wrong. She also implemented peer assessments in her classes, whereby students
assessed each other, but the results were not recorded in the teacher’s marks book.
Teachers evidently enjoyed a great deal of freedom in their timing of examinations.
They were restricted to a certain number of examinations allowed by law at any one time,
and had to notify students in advance of written examinations. More than the legally
specified number of examinations could only be held if the teacher had time available.
Q6:Whatdoyoubaseyourassessmentmoston?
This teacher believed assessments should evaluate how well the student was able to
apply and compare the subject matter without repetition. She regarded the ability of
students to analyse, synthesise, draw conclusions and reproduce knowledge as key
indicators of performance. Despite the legal specifications, Teacher 2 was inclined to
emphasise some criteria over others depending on the circumstances. This was confirmed
when she explained that oral exams took place at different times for students, and while the
topic was the same the questions were different, alluding to a lack of consistency.
Students in this teacher’s two classes referred to subject content as a majorhurdlein
assessments, claiming there was too much. They also mentioned a disregard for creativity
in the subject of Croatian and teachers’ subjectivity in assessments.
Q7:Whatdoyouthinkstudentsthinkabouthowfairyourassessmentis?
The initial response to this question was: “Don’t know. You will have to ask them
that”. Teacher 2 then went on to say she believed that students were very clear about what
was expected of them and understood what was needed to achieve each and every grade
74
for essay writing. While variations were possible in her application of specified criteria, it
appears that Teacher 2’s instructions to her students were consistent, at least for written
assessments.
4.13.2.3CommentaryonStudentandTeacherResponses
Teacher 2 appeared to have all the “right” answers to the questions, and according
to her, there was no justification for perceptions of unfairness and inconsistency. However,
equal numbers of negative and positive comments were forthcoming about her assessments
from the students in her two classes. For example, some students viewed grammar
positively and relevant to real life, while others did not. Teacher 2’s responses indicated
consistency and adherence to uniform criteria, but a considerable number of student
comments (13) alluded to assessments being subjective. Therefore, despite the teacher’s
claims that she adhered to criteria, the students in her classes perceived an element of
subjectivity. Students’ comments were varied and difficult to group, perhaps reflective of
the interpretative nature of Croatian as a subject and its associated language and literature.
Students articulated a disregard for creativity and a concentrated focus on content in
assessments.
A student in each of classes 2 and 3 made the comment: “I know I can’t cheat so I
have to study”. The majority of students’ comments implied they had learned new,
interesting and useful content with real-life application (15 students), and indicated that
oral examination was subjective, biased and unfair (13 students).
Quantitatively, there was a significant difference between students’ perceptions in
this teacher’s two classes in relation to Congruence, Authenticity and Transparency, as
well as the unreliable scales of Consultation and Diversity, with Likert-scale responses
indicating that students felt they were treated differently in assessments. The number of
negative comments was more or less evenly spread across the two classes and there were
no apparent differences between them, which explains why the differences between the
two classes were not reflected qualitatively.
4.13.3CaseStudy3
Teacher 3 from school 1 taught two classes of Biology (subject 1). Class 4
comprised 32 students; 5 males and 27 females; and class 5 comprised 19 students; 13
females and 6 males, making up a combined total of 51 students in classes 4 and 5 who
completed the questionnaire.
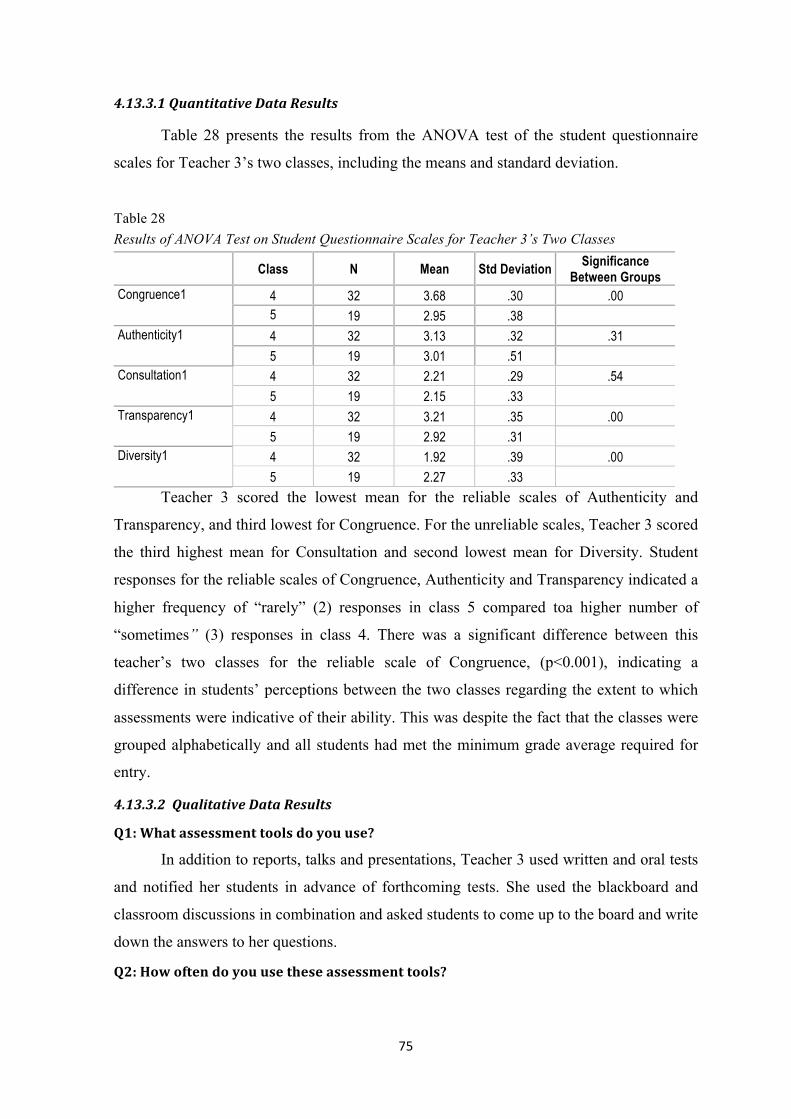
75
4.13.3.1QuantitativeDataResults
Table 28 presents the results from the ANOVA test of the student questionnaire
scales for Teacher 3’s two classes, including the means and standard deviation.
Table 28 Results of ANOVA Test on Student Questionnaire Scales for Teacher 3’s Two Classes
Class N Mean Std Deviation Significance Between Groups
Congruence1 4 32 3.68 .30 .00 5 19 2.95 .38
Authenticity1 4 32 3.13 .32 .31 5 19 3.01 .51
Consultation1 4 32 2.21 .29 .54 5 19 2.15 .33
Transparency1 4 32 3.21 .35 .00 5 19 2.92 .31
Diversity1 4 32 1.92 .39 .00 5 19 2.27 .33
Teacher 3 scored the lowest mean for the reliable scales of Authenticity and
Transparency, and third lowest for Congruence. For the unreliable scales, Teacher 3 scored
the third highest mean for Consultation and second lowest mean for Diversity. Student
responses for the reliable scales of Congruence, Authenticity and Transparency indicated a
higher frequency of “rarely” (2) responses in class 5 compared toa higher number of
“sometimes” (3) responses in class 4. There was a significant difference between this
teacher’s two classes for the reliable scale of Congruence, (p<0.001), indicating a
difference in students’ perceptions between the two classes regarding the extent to which
assessments were indicative of their ability. This was despite the fact that the classes were
grouped alphabetically and all students had met the minimum grade average required for
entry.
4.13.3.2QualitativeDataResults
Q1:Whatassessmenttoolsdoyouuse?
In addition to reports, talks and presentations, Teacher 3 used written and oral tests
and notified her students in advance of forthcoming tests. She used the blackboard and
classroom discussions in combination and asked students to come up to the board and write
down the answers to her questions.
Q2:Howoftendoyouusetheseassessmenttools?
76
Teacher 3 reported that classes were large, students had to acquire two grades per
semester and there wasn’t time to do much more. She administered written tests twice a
semester, i.e. four times a year, and students undertook at least one oral exam where they
were required to answer questions on a particular topic. While the number of assessments
was specified, the timing was different for each student due to the nature of oral
examinations.
Q3:Doyougivethestudentsassessmentcriteria?
Teacher 3 explained to her students what each task would be assessed on and the
depth and breadth of knowledge required to achieve each grade. According to her, the
criteria had already been determined, so students knew what each grade and/or percentage
signified.
Q4:Ifso,inwhatform?
Teacher 3 verbally related information about the criteria to her students at the
beginning of the year. The criteria were available in written form, and both oral and written
assessments followed the same standards and measures.
Q5:Howconsistentlydoyouapplythem?
This teacher claimed to always apply assessment criteria in the same way,
emphasising the words “very consistent”. Written tasks were always awarded a percentage
mark. On the other hand, oral criteria were applied more flexibly, especially in cases where
students wavered. Teacher 3 acknowledged this could be interpreted as subjective when
she was kinder than she ought to be.
Q6.Whatdoyoubaseyourassessmentmoston?
Teacher 3 believed students’ attitudes towards the subject was most important.
Their abilities with regard to cognitive thinking, critical thinking, drawing comparisons,
identifying differences and making conclusions were also deemed important. She
attributed her viewpoint to a recent seminar she had attended on critical thinking. Teacher
3emphasised the importance of students’ attitudes to their work, their work history, past
behaviour and diligence when it came to awarding grades.
Q7.Whatdoyouthinkstudentsthinkabouthowfairyourassessmentis?
In response to this question, Teacher 3 stated she did not know and “you have to
ask them”, believing that she might be looked upon as too strict to her students. She tried
to always be consistent, but tended to round up grades where this could be justified as a
77
reward for students’ general knowledge. She claimed students had a tendency to view
teachers according to the grades they were awarded and was not concerned about this,
because in her opinion, students were only motivated to attain good grades for entry into
university. According to Teacher 3, only a handful of students had a genuine desire to
acquire knowledge and be committed to learning the subject, but this was not the norm.
4.13.3.3CommentaryonStudentandTeacherResponses
Teacher 3 placed a heavy emphasis on oral questioning and tended to be flexible in
her application of criteria. Despite what appears to be subjective, inconsistent application
of criteria the students had an overwhelmingly positive view of this teacher’s fairness in
assessments. According to their comments, the teacher always included content that had
been taught in class, and while some viewed this as repetitive, the majority of students
considered this to be good preparation for matriculation.
This teacher admitted non-task related elements may unwittingly enter into her
decisions about grades. However, the students made no comment about this and there was
no evidence to suggest they perceived it as a hindrance. It is possible that students’
perceptions of fairness were influenced by the perceptions of other students and general
acceptance of their levels of performance. Nevertheless, no issues were raised about this
teacher’s fairness.
To a large extent, positive comments in relation to subject relevance, teacher
fairness and objectivity, practicality, and usefulness of subject matter outweighed
comments to the contrary. However, there was a clear emphasis on oral questioning and
flexible application of criteria, which seemed to indicate that unless students received the
grade they felt they deserved, strict and consistent application of criteria was not
significant. It may also be that adherence to set criteria was not important to students
because the teacher clearly informed them of her expectations.
Validity of examinations was of great importance to these students, so it is
reasonable to conclude that their perceptions will be positive if they perceived external
high-stakes examinations covered the work they did in the classroom. Only one student in
each of classes 4 and 5 commented: “Not all students get the same tasks”, in contrast with
the most frequent response confirming that assessments aligned with students’ knowledge
and previous learning.
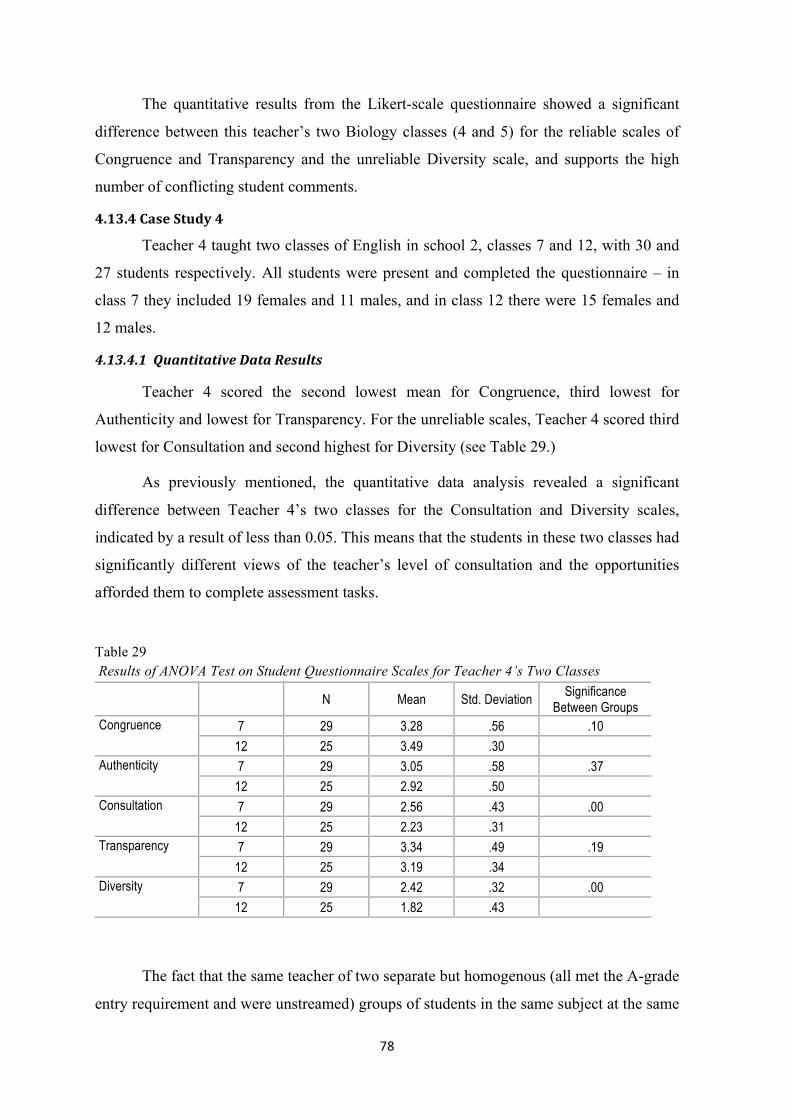
78
The quantitative results from the Likert-scale questionnaire showed a significant
difference between this teacher’s two Biology classes (4 and 5) for the reliable scales of
Congruence and Transparency and the unreliable Diversity scale, and supports the high
number of conflicting student comments.
4.13.4CaseStudy4
Teacher 4 taught two classes of English in school 2, classes 7 and 12, with 30 and
27 students respectively. All students were present and completed the questionnaire – in
class 7 they included 19 females and 11 males, and in class 12 there were 15 females and
12 males.
4.13.4.1QuantitativeDataResults
Teacher 4 scored the second lowest mean for Congruence, third lowest for
Authenticity and lowest for Transparency. For the unreliable scales, Teacher 4 scored third
lowest for Consultation and second highest for Diversity (see Table 29.)
As previously mentioned, the quantitative data analysis revealed a significant
difference between Teacher 4’s two classes for the Consultation and Diversity scales,
indicated by a result of less than 0.05. This means that the students in these two classes had
significantly different views of the teacher’s level of consultation and the opportunities
afforded them to complete assessment tasks.
Table 29 Results of ANOVA Test on Student Questionnaire Scales for Teacher 4’s Two Classes N Mean Std. Deviation Significance
Between Groups Congruence 7 29 3.28 .56 .10
12 25 3.49 .30 Authenticity 7 29 3.05 .58 .37
12 25 2.92 .50 Consultation 7 29 2.56 .43 .00
12 25 2.23 .31 Transparency 7 29 3.34 .49 .19
12 25 3.19 .34 Diversity 7 29 2.42 .32 .00
12 25 1.82 .43
The fact that the same teacher of two separate but homogenous (all met the A-grade
entry requirement and were unstreamed) groups of students in the same subject at the same
79
school drew such diverse responses raises questions about what other factors might have
been at play. Diversity is particularly salient, because this research focused on fairness in
teachers’ assessment practices and was concerned with the extent to which students had
fair and equal prospects for successfully completing assessment tasks. The results may
have been influenced by different approaches and applications of assessment in the two
classes. Interestingly, there was no statistically significant difference for Congruence
between the two classes, i.e. the extent to which assessment tasks aligned with what had
been taught in class. These students therefore concurred insofar as clarity and relevance are
concerned, however, there was some evidence of unfairness in equal opportunities to
achieve task successfully.
4.13.4.2QualitativeDataResults
Teacher 4’s responses to the interview questions are summarised below. They
include students’ open-ended responses to questions about various aspects of assessments.
to the open-ended questions:
Q1.Whatassessmenttoolsdoyouuse?
Teacher 4 believed there were too many assessments too often, comprised of eight
tests per student per year in addition to oral assessments.
Q2.Howoftendoyouusetheseassessmenttools?
This teacher assigned two grades: one for spoken language (speaking skills) and
one for vocabulary, reading and listening (understanding). Written tasks took the form of
essays, compositions and grammar tests. Students were tested on what they had learnt at
the conclusion of a particular grammar unit or activity. Teacher 4 placed special emphasis
on tenses and found it more difficult to grade oral tests because they occurred on the spot.
Oral tests could also include projects, persuasive speech and research.
Q3.Doyougivethestudentsassessmentcriteria?
Teacher 4 claimed she explained to students what they were going to be assessed on
in advance and clearly outlined her expectations. She also discussed students’ grades with
them after they had been marked to clarify and explain. Teacher 4 claimed she did not have
a set of assessment criteria written down.
Q4.Ifso,inwhatform?
This teacher said she provided students with the criteria in both oral and written
form prior to assessments. However, she’d previously stated that she did not have the

80
criteria written down, which was in breach of the Croatian Ministry of Education
stipulations. Teacher 4 claimed she instructed her students to write down the assessment
criteria and requirements for each grade, but they were in all likelihood applied randomly.
Subsequently, this teacher admitted that she only instructed her students verbally because
she knew the assessment criteria off by heart and how to assess students according to their
performance of tasks.
It should be noted that this teacher denied any knowledge of official criteria, yet
they were provided to the researcher by the school. One lead teacher explained that
teachers were responsible for reaching consensus on assessment criteria, they had to be
applied to their respective subjects and the school was required to provide them to parents
and students on request.
Q5.Howconsistentlydoyouapplythem?
Teacher 4 believed strict was fair. She stated she adhered to assessment criteria as
consistently as possible, also providing students with written comments on their work. For
her, the most difficult aspect was assessing creativity. Although not stated in the criteria,
she took into consideration the age of the student, the topic and what she believed
creativity encompassed. All students were assigned the same tasks and were assessed by
this teacher depending on the nature of the task or topic at hand.
Q6.Whatdoyoubaseyourassessmentmoston?
Teacher 4 assessed her students depending on the skill or task they were being
assessed on. She made mention of students who made a special effort and asked how one
should evaluate effort since it wasn’t a stipulated criterion. According to this teacher,
students were rarely awarded a 1 (Fail) in her subject.
Q7.Whatdoyouthinkstudentsthinkabouthowfairyourassessmentis?
Teacher 4 believed there were too many grades and too much testing throughout the
year. In general, she felt students didn’t mind assessments; it depended on the student.
Some found it stressful, while others learnt in rote fashion. In her opinion, some students
liked assessments and others just liked getting good grades.
4.13.4.3CommentaryonStudentandTeacherResponses
Teacher and student comments indicate that assessment criteria were not
characterised by consultation or known in advance by either the teacher or the students. As
reflected by Teacher 4’s statements, it appears that oral assessments were undertaken
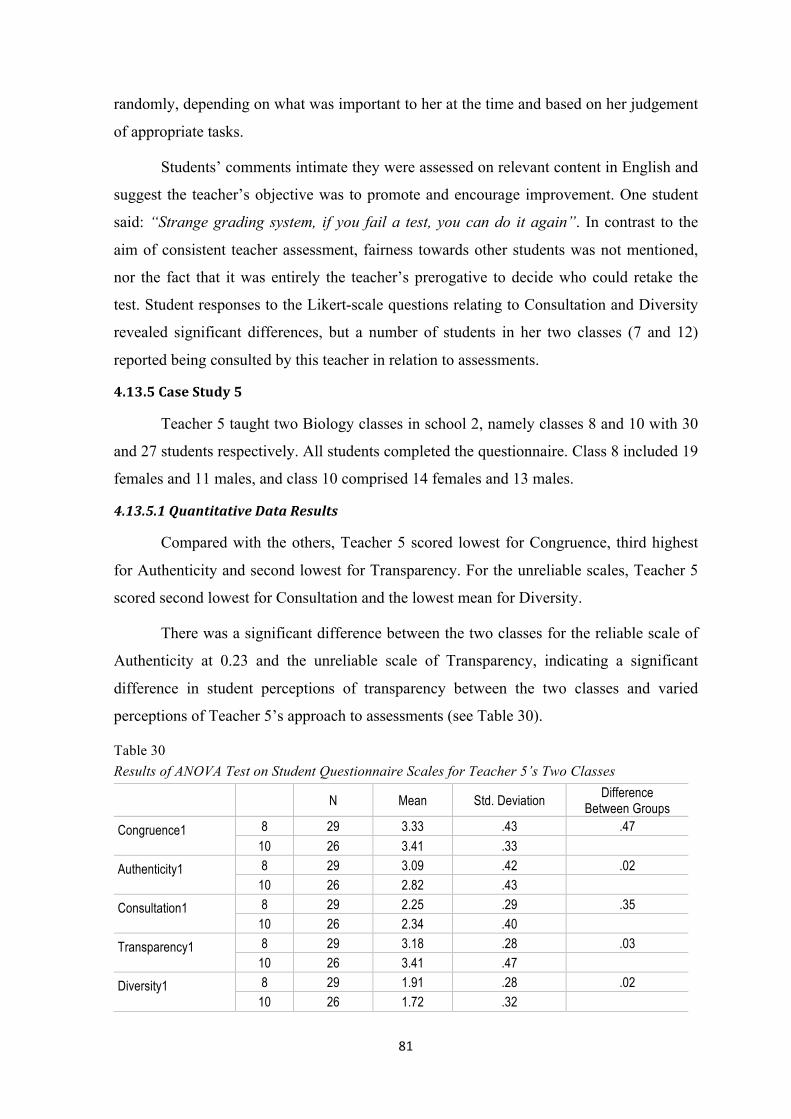
81
randomly, depending on what was important to her at the time and based on her judgement
of appropriate tasks.
Students’ comments intimate they were assessed on relevant content in English and
suggest the teacher’s objective was to promote and encourage improvement. One student
said: “Strange grading system, if you fail a test, you can do it again”. In contrast to the
aim of consistent teacher assessment, fairness towards other students was not mentioned,
nor the fact that it was entirely the teacher’s prerogative to decide who could retake the
test. Student responses to the Likert-scale questions relating to Consultation and Diversity
revealed significant differences, but a number of students in her two classes (7 and 12)
reported being consulted by this teacher in relation to assessments.
4.13.5CaseStudy5
Teacher 5 taught two Biology classes in school 2, namely classes 8 and 10 with 30
and 27 students respectively. All students completed the questionnaire. Class 8 included 19
females and 11 males, and class 10 comprised 14 females and 13 males.
4.13.5.1QuantitativeDataResults
Compared with the others, Teacher 5 scored lowest for Congruence, third highest
for Authenticity and second lowest for Transparency. For the unreliable scales, Teacher 5
scored second lowest for Consultation and the lowest mean for Diversity.
There was a significant difference between the two classes for the reliable scale of
Authenticity at 0.23 and the unreliable scale of Transparency, indicating a significant
difference in student perceptions of transparency between the two classes and varied
perceptions of Teacher 5’s approach to assessments (see Table 30).
Table 30 Results of ANOVA Test on Student Questionnaire Scales for Teacher 5’s Two Classes
N Mean Std. Deviation Difference Between Groups
Congruence1 8 29 3.33 .43 .47 10 26 3.41 .33
Authenticity1 8 29 3.09 .42 .02 10 26 2.82 .43
Consultation1 8 29 2.25 .29 .35 10 26 2.34 .40
Transparency1 8 29 3.18 .28 .03 10 26 3.41 .47
Diversity1 8 29 1.91 .28 .02 10 26 1.72 .32
82
4.13.5.2QualitativeDataResults
Teacher 5’s responses are provided below, supplemented with students’ comments
to the open-ended questions.
Q1.Whatassessmenttoolsdoyouuse?
Teacher 5 used both oral and written assessment tasks. In addition, a project
assessment task was assigned to some students to improve their grade average in the
subject.
Q2.Howoftendoyouusetheseassessmenttools?
Teacher 5 conducted oral and written assessment tasks four times annually with
each student.
Q3.Doyougivethestudentsassessmentcriteria?
Teacher 5 claimed to have access to the written assessment criteria set at school
level. However, for oral assessments, she believed the criteria could be applied more
flexibly. Assessments were carried out at the conclusion of each unit.
Q4.Ifso,inwhatform?
This teacher stated she applied the assessment criteria 100% of the time since the
students had open access to them, and believed this enforced a certain measure of
transparency and protection for teachers. She made every effort to be as consistent as
possible to motivate her students and never used grades to discipline or punish them. She
again referred to the project assessment task she assigned to students who wanted to
improve their grades.
Q5.Howconsistentlydoyouapplythem?
Unlike other teachers who used marks books, Teacher 5 maintained a
comprehensive record of student assessments on computer. She believed her assessment
system was transparent and accessible to all relevant parties, namely the student, his or her
parents and the principal.
Q6.Whatdoyoubaseyourassessmentmoston?
Teacher 5 mainly based her assessments on critical thinking, comparing and
contrasting texts and drawing conclusions.

83
Q7.Whatdoyouthinkstudentsthinkabouthowfairyourassessmentis?
This teacher believed her students considered her grading to be strict at first
because they simply wanted to achieve good grades. She claimed students would do
anything to outwit teachers to achieve their goal.
4.13.5.3CommentaryonStudentandTeacherResponses
It was apparent from her comments that this teacher believed she was consistent.
However, she admitted being flexible with certain types of assessments, even giving some
students bonus tasks to improve or maintain good grades. Students’ comments in relation
to bonus tasks were positive in all cases and indicated they accepted the additional
opportunity given to some and not others to improve their grades. Whilst appearing
resigned to this practice, the absence of negative comments may also reflect a lack of
competitiveness among students.
Students’ comments reflected a mix of perceptions, ranging from assessment tasks
being useful to irrelevant. Positive and negative views were expressed in relation to
students knowing or not knowing what they would be assessed on. One student placed this
in the negative section and one in the positive section. The majority of students’ comments
related to oral testing, which was mainly viewed in a negative light.
Significant differences between classes 8 and 10 were observable for the reliable
scale of Authenticity and the unreliable Transparency and Diversity scales. Student
comments reflected a lack of relevance of assessment tasks in the subject of Biology.
4.13.6CaseStudy6
Teacher 6 from school 2 taught two classes of Croatian (subject 2). Class 9
numbered 30 students comprised of 14 females and 16 males; and class 11 numbered 30
students comprised of 20 females and 10 males. All were present at the time of data
collection and completed the questionnaire.
4.13.6.1QuantitativeDataResults
Teacher 6 scored the third highest mean for Congruence, the second highest for
Authenticity and the highest for Transparency at 2.44 (see Table 31). For the unreliable
scales she scored the lowest mean for Consultation and the third lowest for Diversity.
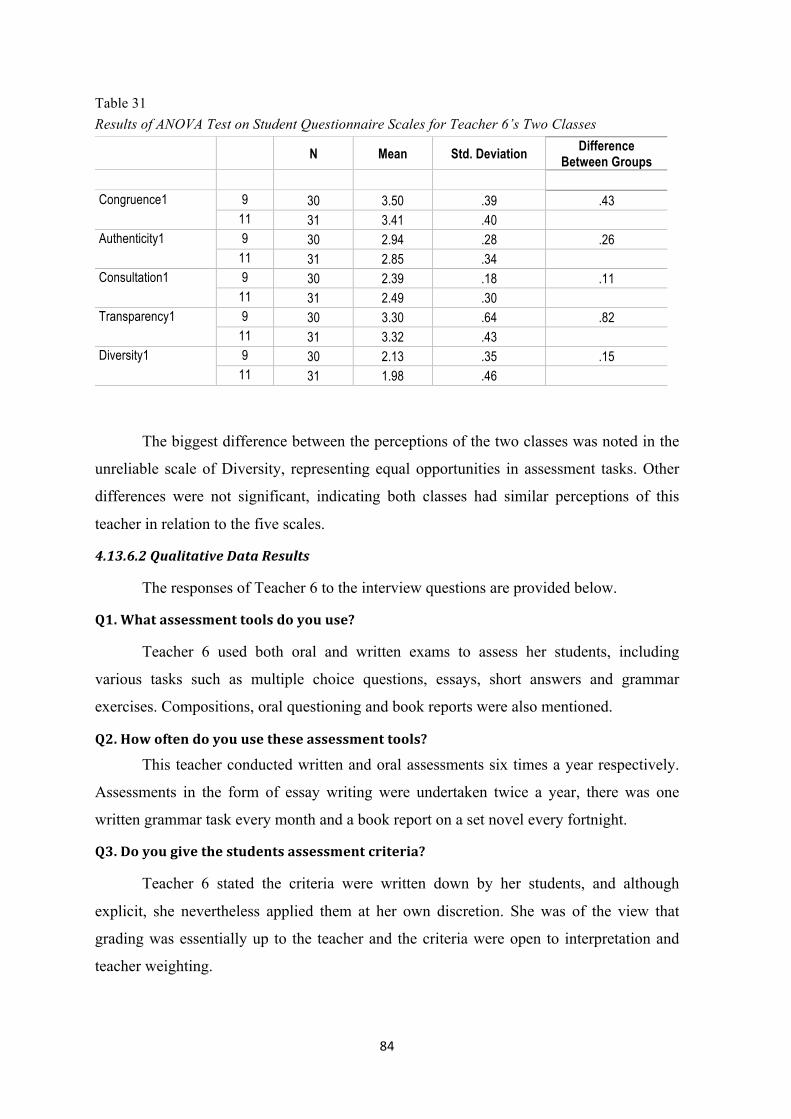
84
Table 31 Results of ANOVA Test on Student Questionnaire Scales for Teacher 6’s Two Classes
N Mean Std. Deviation Difference Between Groups
Congruence1 9 30 3.50 .39 .43
11 31 3.41 .40 Authenticity1 9 30 2.94 .28 .26
11 31 2.85 .34 Consultation1 9 30 2.39 .18 .11
11 31 2.49 .30 Transparency1 9 30 3.30 .64 .82
11 31 3.32 .43 Diversity1 9 30 2.13 .35 .15
11 31 1.98 .46
The biggest difference between the perceptions of the two classes was noted in the
unreliable scale of Diversity, representing equal opportunities in assessment tasks. Other
differences were not significant, indicating both classes had similar perceptions of this
teacher in relation to the five scales.
4.13.6.2QualitativeDataResults
The responses of Teacher 6 to the interview questions are provided below.
Q1.Whatassessmenttoolsdoyouuse?
Teacher 6 used both oral and written exams to assess her students, including
various tasks such as multiple choice questions, essays, short answers and grammar
exercises. Compositions, oral questioning and book reports were also mentioned.
Q2.Howoftendoyouusetheseassessmenttools?
This teacher conducted written and oral assessments six times a year respectively.
Assessments in the form of essay writing were undertaken twice a year, there was one
written grammar task every month and a book report on a set novel every fortnight.
Q3.Doyougivethestudentsassessmentcriteria?
Teacher 6 stated the criteria were written down by her students, and although
explicit, she nevertheless applied them at her own discretion. She was of the view that
grading was essentially up to the teacher and the criteria were open to interpretation and
teacher weighting.
85
Q4.Ifso,inwhatform?
This was answered above.
Q5.Howconsistentlydoyouapplythem?
Teacher 6 stated she consistently applied assessment criteria 100% of the time, but
was more flexible in oral examinations and used her own interpretation and judgement to
decide on grades, particularly when students didn’t follow all the requirements or fulfil all
the criteria. Oral exams were a frequent occurrence, yet strict criteria were evidently not
applied consistently and the grade was awarded at the teacher’s discretion.
Q6.Whatdoyoubaseyourassessmentmoston?
For this teacher, critical thinking was most important and involved comparing,
contrasting, applying and interpreting texts. Teacher 6 assessed students on the breadth of
their interpretation and reiterated the importance of this aspect. She articulated a tendency
to weight the criteria, thereby influencing the grade awarded.
As far as oral examinations were concerned, this teacher rated factual knowledge
most highly, especially when it came to literature, and students were required to know the
content in detail. This contradicts her previous response indicating that critical thinking
was most important, so one could conclude that an ability to regurgitate details was also
somewhat important.
Q7.Whatdoyouthinkstudentsthinkabouthowfairyourassessmentis?
Teacher 6 believed her students’ perceived her assessments as tough and the subject
difficult. All they wanted, in her opinion, was good grades. She claimed they viewed
grammar as objective, i.e. right or wrong, and literature as subjective, some students
finding the latter criteria difficult to define because they all had their own interpretation.
This teacher was of the view that students would do anything to outwit teachers in order to
attain better grades or maintain high grades.
Teacher 6 reported that students frequently questioned the relevance of certain
tasks: “Why did they have these tasks”. They frequently asked why she assessed in a
particular way, seeking justification and explanation. Students wanted to know what she
based her assessment criteria on, so she continually found herself in the difficult situation
of having to explain. This teacher had previously administered a questionnaire with her
students that included a question about assessments; however, many were unwilling to
express negative views for fear of reprisals and punishment in the form of poor grades.
86
4.13.6.3CommentaryonStudentandTeacherResponses
The students’ comments collected from the open-ended questions in the student
questionnaire showed similar numbers of positive and negative responses. No one single
comment stood out as extraordinary and the responses appeared logical. For example,
comments like “if you don’t know the answers you fail” indicated a positive view of
subjectivity and “assessment tasks make students revise completed units for tests indicated
a negative view. One student commented negatively that he didn’t like assessments and
they weren’t useful, while another student commented positively, saying he liked
assessments and it helped him learn. The teacher’s emphatic claims that criteria were
always provided and adhered to seemed somewhat rehearsed to convey a positive
impression.
The qualitative data concurred with the quantitative data in that students in the two
classes were united in their responses to assessment, confirmed by the fact that there were
no significant differences between this teacher’s two classes for any of the scales.
Students’ perceptions of Teacher 6’s assessments tended towards the mid to high range, i.e.
mostly position 3, compared to the other teachers. She scored the lowest only for
Authenticity. Students’ comments on the importance of getting good grades to get into
university were mentioned in both negative and positive contexts. Eight students from
class 9 and six students from class 11 stated that paying attention in class and writing
things down helped to know what they would be assessed on. One student commented:
“we are not assessed on applying, but on reproducing information”.
Quantitatively, there were no significant differences between classes 9 and 11 for
all the scales, reflecting a similar distribution of positive and negative comments from
these two classes, although the comment made by Teacher 6 regarding the reluctance of
some students to express an honest opinion for fear of repercussions should be borne in
mind.
4.14Cross-CaseAnalysisofTeacherandStudentResponses
In this section the results of the cross-case analysis of teacher and student responses
to the open-ended questions are presented, together with the similarities and differences
that emerged between teachers’ responses to the interview questions and students’
responses to the open-ended questions in the survey.
87
4.14.1ConsistentApplicationofAssessmentTasks
Most teachers claimed to set prescribed assessment tasks to all students equally.
Only Teacher 5 used an additional assessment task for certain students to improve their
grade average in her subject. It can therefore be concluded that, in general, the teachers
were consistent in their application of assessment tasks. However, when it came to oral
examinations, used in all subjects, assessment criteria appeared to be applied more loosely,
thereby lacking consistency in practice.
The Diversity scale reflected the extent to which students perceived they were fairly
and equally treated in assessment tasks. Teacher 5’s selective assignment of additional
project tasks was not reflected in students’ responses for the Diversity scale. However, it
should be noted that unlike the other scales, a lower level response for this scale indicated
a positive reply, asa response of never or rarely to questions about whether students did
different assessment tasks from others supported the principle of consistent assessment.
Teacher 5 was not viewed negatively by students. She scored second lowest for the
unreliable scale of Diversity, where a lower mean reflected a more positive view by
students (see Tables 18 and 19). Furthermore, student dissatisfaction in this area was not
supported by their comments. In fact, Table 25 shows there were no negative comments
from students with regard to Teacher 5’s fairness and consistency.
4.14.2ConsistentApplicationofAssessmentCriteria
Criteria were determined collectively by subject teachers at a county level and used
in all schools. Only one teacher (Teacher 4) claimed not to have any criteria, even though
they existed for her subject (English) as they did for all others. The existence and
availability of criteria were aimed at improving consistency in teacher assessments, yet the
prescribed criteria themselves, written up and approved by all subject teachers in the
county, permit a degree of divergence in practice. This was evident in county criteria
statements, such as this one below for English in secondary schools:
2. The assessment for grammar tests, dictations and essaysis accepted in full
by the county group of English teachers, while for oral questioning/
examination the teachers reserve the right to their own application of their
own criteria, but always in keeping with the specific contents. Students will
be informed about this at the first class.
And from the criteria for Croatian:
88
In determining final grades, given the division of content (70% literature,
grammar 30%) the rubric for literature represents the most important part
(oral and written) are the first component in the marks book (literature,
language, oral and written expression, literature and school tasks).
The guidelines accompanying the criteria for the subject of Croatian state:
Students will at the beginning be made aware the final grade does not
consist only of an arithmetic mean, but also takes into account student
class participation, behaviour, attendance and regular completion of tasks
and duties.
It is highly likely that these statements from official documents, allowing teachers a
measure of freedom to implement their own assessment criteria, had an influence on them
using their personal impressions in making judgements and decisions. Nor do they uphold
the principle of consistent application as teachers claimed to be doing. The statement: “the
final grade does not consist only of an arithmetic mean” but also other factors that are not
regulated in any way and left to teachers’ discretion, attests to the likelihood of
inconsistencies. Furthermore, Teachers 5 and 6 acknowledged including subjective factors
like students’ conscientiousness.
Oral questioning was used by all teachers as an assessment tool. Some teachers’
responses overtly indicated the inclusion of non-task related or subjective criteria in their
judgements of student performance, such as students’ diligence, conscientiousness and past
performance. All six teachers administered the required number of assessment tasks
stipulated by law to yield a grade average for each student in their particular subject. All
but one teacher reported the existence and availability of criteria within the school, and all
claimed to apply them consistently. Even Teacher 4, who stated she didn’t have the criteria
written down, said she had them “in her head” and applied them consistently, signalling an
awareness amongst teachers of the importance of setting and applying assessment criteria
consistently. The students in Teacher 4’s class made several comments about the lack of
consistency in assessments; one student in class 12 expressed the view that the teacher’s
grading system was not good enough. Another student in the same class said if you failed a
test you could take it again, while yet another described the grading system as “strange”.
These comments seem to indicate a certain amount of student dissatisfaction with
consistency, perhaps as a result of the teacher not having the criteria written down.
89
4.14.3OralTesting
Oral testing was a constant issue for these teachers because the mandated
requirements did not support consistency and fairness, as evidenced by some of their
responses. Allowing for broad interpretation and teachers’ own judgements do not
constitute the basis of fair and consistent assessment. Documents outlining subject
assessment requirements, as created by teachers at county level and demanded by the
Croatian Ministry of Education, confirmed the inclusion of oral questioning assessment
tasks for all subjects. The guidelines for Biology state:
Answers in oral form are the major form of testing student achievement.
During the year, student achievement can be checked in this way in every
class without prior announcement and at a minimum of three times: once in
the first and twice in the second semester (due to the difference in semester
durations).
The likelihood of inconsistencies was also increased by oral testing not being
applied under the same conditions for all students and the absence of records in oral
testing. Students were questioned orally numerous times a year for each subject, based on
textbooks chosen by subject teachers from a list authorised by the Croatian Education
Department. In all subjects, teachers selected a chapter for examination and formulated the
questions, but despite covering the same units of learning, the questions themselves varied
in number and complexity, since they weren’t ordered in any way and were administered
randomly without any semblance of uniformity. They were not stratified to ensure the
same level of difficulty of question for each student. This indicates that oral examinations
in Croatian schools, although an accepted form of assessment and supported by the
Education Department, were open to a high degree of inconsistency in practice.
4.15Summary
The data provided by 330 students who completed a 35-item questionnaire and six
teachers who participated in a seven-question interview were analysed in this chapter. An
analysis was also undertaken of the documents provided by the schools, stipulating the
required assessment criteria for each of the three subjects of Biology, Croatian and
English.
The questionnaire included 35 closed-response items with seven possible responses
for each of five scales, viz., Congruence, Authenticity, Consultation, Transparency and
90
Diversity. Analysis of each scale included Cronbach’s Alpha for reliability. Acceptable
results emerged for the scales of Authenticity and Congruence, and to a lesser extent for
Transparency, indicating that in general, students perceived teacher assessments positively.
This concurred with teachers’ responses; only one teacher disclosed assigning an
additional project task to certain students to boost their grade average. The Likert scale
responses implied that, in general, students viewed their teachers and assessment
procedures positively.
Analysis of student comments about assessments showed an almost equal
distribution of positive and negative responses, irrespective of class or gender. Questions
about fairness and consistency appeared to attract more male comments and a higher
number of negative comments from males, despite a predominance of females in the
sample groups.
All but one teacher (Teacher 4) reported possessing assessment criteria and
applying them consistently. Assessment tasks prescribed by the Croatian Ministry of
Education were assigned to all students, with the exception of Teacher 5, who also
assigned an additional task to certain students. Oral testing, approved by the Ministry of
Education, were most vulnerable to inconsistent application of assessment criteria, as
confirmed by the assessment documents, and students’ and teachers’ comments. The
documents contained the assessment criteria determined by teachers at a county level and
prescribed by the Ministry of Education; however, some teachers acknowledged they
included other criteria unrelated to students’ task achievement.
In comparing teachers, English teacher (Teacher 1) scored most favourably despite
some discrepancies in the perceptions of students in her two classes. Students in this
teacher’s two classes perceived her differently in relation to assessments being a fair
indication of their work. Teacher 3, who taught Biology, showed the biggest discrepancy
between student responses in her two classes. As a subject, English was viewed most
favourably by the students.
The next chapter includes an interpretation of the results from these analyses with
reference to the conceptual framework and the research questions. Possible meanings and
reasons are provided, informed by the data and correlations with the literature.
91
ChapterFive:Discussion
In this chapter, the findings have been organised in accordance with the Conceptual
Framework (Figure 1) that guided the research questions for the study. It begins with the
perceptions of participants regarding the need and purpose of assessments and who is
responsible, followed by a discussion of how assessment tasks and criteria were created,
how consistently they were applied and the resulting outcomes for students.
5.1TheNeedforAssessmentandwhoisResponsible
Teacher assessments have received much attention in recent years because they
play such an integral part in education (Darling-Hammond, 2014; Perso, 2009). In general,
the students and teachers involved in this research agreed that assessments were necessary.
In their opinion, the main purpose of assessments was to attain eligible grades for
university entrance and fulfil teachers’ legal requirements towards their students. All the
teachers interviewed stated they mainly implemented assessments because it was a
requirement of their job (Harlem, 2005; Strahinić, 2011). In response to questions about
what assessment tasks they used and how often, all teachers confirmed using oral and
written assessment tasks a set number of times during the year as stipulated by the Croatian
Ministry of Education. The literature review uncovered several research studies on
culturally influenced and country-specific assessment practices (Dayal & Lingham, 2015;
DeLuca et al., 2013 McMahon & Jones, 2015) in an attempt to improve overall assessment
practices in education, and it was clear that the high usage of oral examination is
characteristic of the Croatian education system.
In this study, comments from both students and teachers indicated a perception of
assessments as being mainly the business of the teacher (Barnes et al., 2017), despite the
fact that the Croatian Ministry of Education set the final matriculation examination which
is marked by external examiners. The matriculation exam is classified as a high-stakes
exam, instigated by an official body (Klenovski, 2011). Examiners comprise subject
teachers from different schools throughout the country, organised by the Croatian Ministry
of Education. The perception of assessments as mainly the teachers’ business could be
attributed to the significant impact of subject teachers’ grades throughout students’
schooling on their successful entry into university. The perception of assessments as
mainly teachers’ business was described by Rust et al. (2003) as teacher controlled or
teacher dominated assessment, meaning that teachers are responsible for activating and
92
implementing them. This perhaps explains why the comments of 14 students on
assessments included the word “teacher” and only two included the word “matriculation”.
All the teachers interviewed stated that they alone were responsible for assessing
students and awarding grades. Other than the Ministry of Education’s requirements for a
certain number of assessments, no-one else was mentioned as a participant in the
assessment process. The numerical grades awarded to students formed a significant part of
their reports, accounting for up to 30% or more towards university entry. In this way, every
numerical grade had consequences for university entry, with almost the same high stakes
as the matura or matriculation itself (McMahon & Jones, 2015). Students did not view the
purpose of assessment as a vehicle for learning or developing skills for life (McGaw, 2006;
Stobart, 2010), but rather as a means to an end, that is, to achieve the highest possible
grades. Students who fail three subjects in one year have to repeat the year, so to a large
extent teachers are the creators of students’ destinies and the only provider of what needs
to be learned (Domovic, 2004; Pivac, 2009; Strahinić, 2011).
The open-ended questions in the student questionnaire made no mention of
students’ self-assessment or peer assessment of one another. This is not unusual in the
Croatian education system, where teachers are considered the sole providers and assessors
of knowledge, rather than as facilitators for students to create and assess knowledge (Pivac,
2009). In the case of assessments, teachers appear to be the foremost designers and
implementers, that is, they create and assign assessments from the top down and students
accept what teachers decide.
All teachers claimed to only use assessment tasks set by the teachers themselves.
Furman (2009) reinforced the notion that assessment processes are generally carried out by
teachers and accepted by students who carry out the assessment tasks. This study confirms
that subjecting Croatian students to teacher-driven assessments is in accordance with the
expectations of both students and teachers. No student or teacher made any comments to
refute the teachers’ unilateral role in assigning assessment tasks to students, who carried
them out accordingly.
5.2CreationofAssessmentTasks
Most teachers regarded assessment tasks as summative, required to award students
a numerical grade (Canal et al., 2012; Dargusch, 2014; Sadler, 2009). All teachers
responded to questions about the assessment tasks they used in reference to the
93
expectations of the Croatian Education Department. In particular, they mentioned the
mandated number of oral and written assessment tasks for each course per semester. Even
though teachers were responsible for imposing tasks on students and grading them,
assessments were fundamentally determined by the national curriculum and the Croatian
Education Department through allocating textbooks and specifying the topics to be
covered.
5.2.1TypesofAssessmentTasks
Assessment tasks can be various (Darling-Hammond, 1994; McLaughlin, 2010). In
this research, teachers mainly used summative assessment tasks, both written and oral in
equal measure, as required by the Croatian Ministry of Education, in order to award
students with a numerical grade average for a subject.
Only Teacher 5, who taught Biology in school 2, assigned additional projects to
certain students that were not prescribed by the Education Department, giving these
students an unfair advantage to boost their grade averages. According to this teacher,
grades awarded for these projects were used solely to improve students’ overall grades and
facilitate positive outcomes. No negative consequences were reported. However, she did
not explain how consistency was achieved in light of the above situation, that is, she didn’t
address the inequality of this practice, which calls into question consistency in the
assignment of assessment tasks.
The inclusion of Biology as a type of formative assessment assisted Teacher 5 in
making judgements, which in turn, built up a cumulative record of student achievement.
Apart from the additional project task assigned by Teacher 5, summative assessment tasks
predominated for the other teachers (Black et al., 2010). Contrary to summative tasks
designed to make judgements about student achievements at certain points in the unit of
study, this additional project task is an example of a formative assessment task created by
the teacher. Assessment tasks provided numerical grades that ultimately contributed to the
student’s final grade average, and was used for reporting and determining entry into
university. The selective nature of offering certain students an opportunity to complete or
improve their grades in a particular subject contradicts fair and equal assessment practices
(Alm & Colnerud, 2015; Brookhart, 2015, Scott et al., 2013).
Students’ comments about assessments referred to oral examinations as well as
written tasks. For example, this comment from a Biology student in class 8: “most of the
94
time we are examined on things we have learnt in class” does not specify the type of
assessment task or whether it was oral or written. However, comments such as this one
from a Biology student in class 10: “stress caused by oral examination every lesson”
clearly refers to oral examination. Specific comments about written assessments included
only two negative responses: a) “essays are assessed too strictly” and b) “too many written
and oral exams” (class 4, male Biology student). The word “unfair” was specifically used
in relation to oral examinations by a male student of Croatian in class 3 (“unfair oral
exams”), but not specifically to written tasks. Other negative comments made reference to
assessments in general, but it was unclear whether they pertained to oral or written tasks.
5.2.2OralAssessmentTasks
In contrast to Australia, where oral assessments are typically used in the study of
foreign languages, they are a common form of assessment in all subjects in Croatia. In
Australia, an oral interview usually assesses students’ speaking skills, in addition to pen-
and-paper testing of reading, writing and listening, so the unique nature of oral
questioning/examination in Croatia as an assessment task required special attention in this
thesis. The documents provided by the teachers were created collectively by groups of
teachers at county level, as demanded by the Croatian Ministry of Education, and included
oral assessment tasks for all subjects.
Croatian secondary students are questioned orally a number of times per
semester/year for each subject. The textbooks used by the school are chosen by the
teachers at that school from a list of possible options authorised by the Croatian Education
Department. Typically, teachers chose a chapter of the book for examination and
formulated questions for a particular class or classes. Although the questioning focused on
the same units of learning for all students, the questions themselves varied and meant that
some students were asked more numerous and more complex questions than others. The
questions weren’t categorised, even though they were based on and used to test the same
content covered in class. The extent to which oral questioning aligned with instructions
remains vague since there is no record of oral testing (Kellermeier, 2010), and once
completed, there is no record of the examination.
Questions for oral exams were not provided to students in advance; only the subject
matter, e.g., the particular chapter/s in a prescribed textbook. Neither did they know
exactly when they would be called upon to be examined. Since there were approximately
30 students in each class, oral assessments were held at different times over several weeks
95
in front of the class, so it was unlikely that the teacher asked all students the same
questions. Students were only excused from examinations a limited number of times, so it
could be speculated that teacher practices may have encouraged some students to truant if
they were not adequately prepared or feared failing the examination (Strahinić, 2011).
Teacher prejudice may also have manifested in the formulation of questions, over which
teachers had complete freedom.
Moreover, oral examinations raised issues with regard to productive use of class
time because they were time consuming and held several times a year (Sayre, 2014). Sayre
argued that oral examining is only suitable for small groups because they are time
consuming. However, this is not the case in Croatia, where large classes with up to 32
students per class (see Table 4) are the order of the day. None of the student participants
mentioned receiving any training from teachers in oral questioning.
All these practices in oral testing call into question the fairness and consistency of
teacher assessments on the part of students (Luoma, 2004; Munoz & Alvarez, 2010;
Newhouse, 2013). For example, a female student, taught Croatian by Teacher 2 in class 3,
said: “the teacher is subjective in oral examination”. Another female student in the same
class replied: “unfair oral examinations”. These comments indicate students’ perceptions
of oral examinations, a common form of assessment in Croatian secondary schools, as a
less fair form of assessment.
This study highlighted the disadvantages of oral examinations for students due to
teacher subjectivity and not knowing when they will take place, therefore catching them
unprepared, not to mention the ineffective use of class time, particularly in view of the fact
that they comprise around half of all assessments. The average class size in this research
was 28 students, and 3 hours of class time a week was allocated to each subject. Despite
their advantages for large classes, project tasks that promote interdisciplinary engagement
were rarely employed, conflicting with curriculum policies on compartmentalisation and a
decree against teaching subjects in isolation (Koludrović, 2013).
5.2.3WrittenAssessmentTasks
Some students commented on the difficulty of written assessment tasks, while
others stated it helped them to revise, learn and prepare for the national matriculation
exam. For certain students assessments were interesting; for others they were boring and
irrelevant to real life. While it was not always determinable from students’ general
96
comments whether they were referring to oral or written tasks, it was abundantly clear
from their specific comments on oral examinations (Munoz & Alvarez, 2004; Trskan,
2005).
5.2.4SummaryofAssessmentTasks
Teachers created and used both oral and written assessment tasks as stipulated by
the Croatian Education Department. They confirmed in the interviews that two or three of
each type of assessments took place each semester. It was clear that oral examination
exposed students to teacher bias, and led to a lack of consistency and negative perceptions
among students. They perceived the purpose of oral assessments as contributing to a total
score and final grade for semester, the results from both semesters giving the final grade
for the year.
5.3CreationofAssessmentCriteria
Carefully conceived assessment criteria are critical to the value and outcomes of
assessments for a number of reasons. Norcini et al. (2011) was a strong supporter of good
assessment criteria and identified seven essential factors: validity or coherence,
consistency, equivalence, feasibility, educational effect and acceptability. These factors
were formulated from a consensus statement and recommendations by the Ottawa 2010
Conference, founded on the perspectives of stakeholders comprised of teachers and
educational institutions.
The assessment criteria provided by teachers involved in this research included
information about what constituted each grade and the various types of teacher assessments
depending on the subject. Students were advised what each grade meant and the
percentages required for grades 5, 4, 3, 2 (all passing grades in Croatia) and 1 (fail),
equivalent to an A, B, C, D (unsatisfactory) which also constitutes a pass in Croatia and F
(fail) respectively. Students were awarded a numerical grade depending on how well they
met the criteria.
The subject assessment criteria were formulated at a county level by decree of the
Croatian Education Department and brought together subject teachers from 21 counties.
This method raises questions about the conflict of individual teachers, with differing
personal beliefs, in applying group-defined criteria enforced by an external agency, and
their commitment to complying (Allal, 2012; Hughes & Cappa, 2010; Sun & Chen, 2013).
97
The next section discusses the degree to which these factors interfere with one another and
impede consistent application of criteria.
5.3.1CriteriaforOralAssessment
Several issues arise from oral examination practices in Croatia; amongst them the
option for teachers’ to deviate from evaluating actual performance of assessment tasks and
the lack of documentation (Newhouse, 2013), since they allow for teacher bias. Oral
assessments have practical advantages for teachers: they take place during class time and
are less onerous than grading written papers which means less “take-home” work. Subject
criteria for oral examinations, as mandated by the Croatian Education Department, were
included in the written documents provided by the teachers.
Oral examinations took place during class time, where assessing performance in a
short space of time and without criteria make a consistent approach difficult. It is therefore
reasonable to conclude that teachers were prone to subjectivity, and despite their
unanimous claims of objectivity in the application of criteria, this was unlikely to be the
case when they were free to make their own choices and decisions (Kellermeier, 2010).
This was evident from the teachers of Croatian in schools 1 and 2, who both stated they
applied the criteria strictly for written tasks but less so for oral tasks. Similarly, the Biology
teacher in school 1 applied the set criteria strictly to written tasks, but was more flexible
with oral tasks.
5.3.2SelectionofCriteria
The school assessment documents provided to the researcher included statements
about making students aware that their grades were not merely mathematical, but also
included attendance, work ethic and attitude. There can be little doubt that these variables
made it acceptable for non-task related bias to creep into teachers’ assessments of student
performance.
Students were given to understand that factors such as behaviour and classroom
participation were taken into consideration and could affect their grades. These criteria
were not specifically defined; neither their application, nor how they would be reflected in
the final grade. Grades could therefore be inflated or deflated at will, for reasons unrelated
to students’ demonstration of ability. By way of example, students with a reserved
personality may be hampered to participate in classroom discussions, and despite being
more capable than other students, their lack of participation could lower their overall
98
grades (Charampoulos & Kokkinos, 2014). In contrast, a less capable student who
frequently contributes to classroom discussions may receive an inflated grade for ability.
Questions that arise are how are these factors quantified, to what extent do they contribute
and how is this reflected in the grade? One female student of Croatian in class 3 (school 1)
stated: “the teacher is biased most of the time”. Six other female students in the same class
commented on the teacher being “subjective” in assessments. “Subjective” was also used
by a Biology student in class 5 and by students of Croatian in classes 9 and 11, indicating a
tendency for teachers to take into account unrelated factors to task achievement.
5.3.3StudentAccesstoCriteria
Most subject teachers in the schools involved in this research claimed they provided
students with assessment criteria both verbally and in written form. They included the
mandated requirements of the Croatian Education Department and those created by groups
of subject teachers at county level for each subject. The criteria were officially lodged with
the school and available to students and parents. They were provided to the researcher by
the teachers interviewed and obtained from the school office, where they were kept in a
filing cabinet of the subject teacher in charge. The criteria were available to all teachers
involved in this research. Only Teacher 4 stated she didn’t have the written assessment
criteria but they were “in her head”. Nevertheless, students’ perceptions of Teacher 4’s
fairness in assessments were no less positive than those for the other teachers.
The vast majority of teachers were aware that criteria existed and communicated
them to their students, yet the students seemed unconcerned about whether assessment
criteria were formalised or not. Teachers implemented the criteria at their own discretion,
formally or informally. Teacher 4 openly stated she did not apply any formal criteria and
claimed to explain their grades to her students. For the reliable scales, Teacher 4 scored
second lowest for Congruence, third lowest for Authenticity and lowest for Transparency
(see Table 12), and for the unreliable scales she scored third lowest for Consultation and
second highest for Diversity. Having acknowledged that she didn’t use assessment criteria
consistently, this teacher only scored lowest for students’ clarity about assessment tasks,
perhaps indicating acceptance of unfair grading and resignation on the part of her students.
5.3.4Students’AcceptanceofAssessmentTasksandCriteria
The findings of this research suggest the existence of assessment criteria did not
necessarily guarantee students’ acceptance of them, nor did the implementation of criteria
necessarily eliminate teacher bias. Interestingly however, there didn’t appear to be a
99
connection between the lack of assessment criteria and student dissatisfaction; or between
ad- hoc teacher-generated criteria and student perceptions of unfairness. However, this
could be a result of students’ resignation to the status quo, where despite perceptions of
unfairness, criteria gradually become accepted as the norm.
Carmines and Zeller (1979) purported accurate measurements lead to accurate
conclusions. Very few statements from the six teachers inferred they made judgements
about students based on personality. Even though unrelated to specific assessment tasks,
two teachers mentioned diligence and conscientiousness as factors that could influence
their grading of students, posing a danger to accurate reflection of student ability (Allal,
2012). Furthermore, the flexibility of teachers to use their own judgement and include
elements not directly related to students’ achievements in oral examinations, means that
final grades were unaccountably open to interpretation and adjustment.
5.4ApplicationofAssessmentTasksandCriteria
An article titled Teachers as Mediators (Dargusch, 2014) focused on concerns
related to teachers’ application of assessment criteria. The research was conducted in two
Queensland, Australian high schools and contained a discussion about teachers’ reluctance
to use assessment criteria, their divergence from and use of additional criteria, and the role
of teachers’ personal judgement in student learning. All but one teacher in the study
claimed assessment criteria existed and they were applied consistently in order to evaluate
students’ work as uniformly as possibly.
In the current study, Teacher 4 stated she had no written criteria but they were in
her head, so it is unclear what exactly her criteria consisted of. All the other teachers had
written criteria, and claimed they provided them to their students and applied them
rigorously. Five teachers confirmed using assessment criteria created at county level. Since
the criteria mandated by the Croatian Ministry of Education allowed for the inclusion of
factors like student diligence and attitude, it is probable that they were taken into
consideration in awarding a final grade. It is therefore highly likely that factors unrelated to
task achievement impact on students’ grades in Croatia, as they do in other countries
around the world (Brookhart, 2015). Brookhart‘s analysis of grades in America over the
centuries support this contention. The author examined students’ standards-based grades
and created an appraisal scale for measuring how closely teachers followed recommended
grading practices. The findings proved that composite report cards, focused on classroom
achievements and encompassing student learning goals, yielded more valid grades.
100
Teacher 4’s claim that she didn’t possess any criteria posed a number of questions
about discrepancies between theory and practice. Firstly, was this really what she believed
or what she thought she should say? And was this true in practice? Since oral examinations
make up a significant proportion of assessments in Croatia and school-based criteria allow
teachers to use their own judgement, the reality of assessment criteria being applied
consistently is questionable. It is highly likely that these teachers were aware of subjective
practices in oral questioning as permitted by school-based criteria. Furthermore, the
research has shown that teachers face dilemmas when conflicts arise between assessment
criteria and their own personal beliefs (Brookhart, 2012; Sui & Chan, 2013). Despite this,
teachers generally accept the need for assessment criteria to be applied equally to all
students.
Teacher 5 assigned project tasks to students to improve their grades but did not
indicate whether she applied any particular set of assessment criteria to this task. Since the
student’s grade average represents his or her final grade for a subject, such projects could
be considered a positive assessment in that they helped students improve. However, they
were not offered to all students, implying a subjective approach by the teacher and
contradicting her claim that she strictly adhered to set criteria. She did not clarify how she
modified students’ grades, but did so after taking into account their performance in these
specially assigned projects. This teacher obviously deviated from strict adherence to
assessment criteria for all students, but insufficient information about implementation of
these additional student projects did not provide further detail.
5.4.1Validity,FairnessandReliability
Teacher assessments involve making judgements from the information gained
(Harlen, 2007; Joughin, 2010; Merriam, 1998; Golfashami, 2003; Miller et al., 2009;
Volante, 2010). Understandably, teachers who have difficulty justifying their assessment
decisions will be pursued with questions about the validity, fairness and/or reliability of
their assessment practices (Kane, 2010; Masters, 2013; McGaw, 2010). Some students
indicated a lack of validity in teachers’ judgements of their performance (Brookhart, 2015;
Gordon & Fay, 2010). For example, one student stated “the teacher is subjective”, despite
most teachers’ confirmation that they were in possession of assessment criteria, gave them
to students and applied them rigorously. Seven students in Teacher 2’s Croatian class 3
made comments about subjectivity. Teacher 3’s subjectivity was called into question by
two students and a third in Biology classes 4 and 5 respectively, as well as four students in
101
Biology class 10, taught by Teacher 5. The words “objective assessment” were used in
comments by students in Teacher 1’s English classes 1 and 6, indicating that they viewed
the teacher as impartial in her assessment. This aligns with the highest mean for the subject
of English and English Teacher 1 on the reliable scales of Congruency (see Table 6),
Authenticity (see Table 10) and Transparency (see Table 14). Students’ perceptions of
fairness were more positive for the subject of English as a foreign language than for
Biology or Croatian (see Figure 6), and appear to contradict the notion of subjective
practices. It could be that in English, the grammar, aural and oral tasks required
grammatical accuracy and knowledge of lexis, and therefore seemed more objective to
students than a creative composition assessment in the subject of Croatian (Hannafi &
Alisa, 2014).
Teachers believed the numerical grades awarded for written and oral test were
reliable scores of students’ performance (Brookhart, 2015). These grades contributed to an
overall numerical grade average for students in the subject, which together with their
performance in the state external matriculation examination, determined their entry into
university. Apart from the additional project task set by Teacher 5, there was no evidence
from any of the other teachers’ responses to indicate that their grades served as a form of
feedback to help students improve their learning and progress. Nor did they declare that
assessments were intended for any other purpose than providing numerical grades (Scott et
al., 2014). Comments from students suggested that teacher assessments served to check
their knowledge, prepare them for the final state matura or matriculation examination and
forced them to study. Again, there was no evidence of perceptions amongst students that
teacher assessments served as a learning tool or one that could help them improve and
advance. This sends a clear message that the only purpose of teacher assessments was
understood and accepted as a labelling system for grading students from 5 to 1.
In their study, Charampoulus and Kokkinos (2014) found that personality factors
entered into students’ perceptions of teachers, deeming one teacher more positive than
another. They named this phenomenon “Teacher Interpersonal Behaviour” (p. 236). The
authors identified better academic performance in classes where students perceived
positive teacher interpersonal behaviours, more evident in secondary schools than primary
schools. Teachers who were perceived by students to display more positive behaviours
facilitated higher student achievement and greater satisfaction with assessment processes,
102
as could be seen in the example of English Teacher 1 who was rated most highly by
students.
The quantitative data also revealed a high average score for students to Question 4,
indicating a perception that the scores or grades allocated to their performance were a fair
reflection of the quality of their work (see Figure 6.) In terms of mean scores, student
satisfaction was the highest for all scales in English, apart from the unreliable scale of
Diversity (see Table 10), particularly in the case of Teacher 1 (see Table 11) who scored
the highest means in Congruence, Authenticity and Consultation, the third highest for
Transparency and second highest for Diversity (see Table 11).
5.4.2DifferencesbetweenSubjects
Althoughthe subject of English received the highest mean scores in the five scales
of Congruency, Transparency, Authenticity, Consultation, and Transparency, this was not
the case with Diversity. The Diversity scale included questions where a lower numerical
response correlated with greater consistency in teacher assessments. For example, question
35: “I do work that is different from other students” (see Table 19) supported a favourable
trend in students’ perceptions of English assessments – this also applied to students’
comments about fairness and consistency. Despite the many negative comments from
students to the open-ended questions on fairness and consistency, the subject of Croatian
scored higher than Biology for all scales except Authenticity. Perceptions about the
application of assessment criteria to tasks therefore also appeared to be influenced by the
subject, not only by the teacher and teacher personality (Nazor, 1999). This may explain
the apparent difference between more favourable student perceptions of some aspects of
English assessments and the teacher’s subjectivity in oral assessment tasks.
5.4.3StudentAcceptanceofAssessment
In this study, most students reacted positively to teacher assessments. Over 50% of
students scored teachers’ application of assessment criteria at the highest response level
“often” (see Tables 4 and 5). Fewer than 7% gave this the lower responses of “rarely” or
“never”, contradicting anecdotal evidence that students despised teacher assessments and
considered them unfair. This could be due to the fact that the study was undertaken in two
grammar schools requiring high grade averages for entry into university, a higher rate of
entry into university than certain other schools. The two schools were chosen on the basis
of the researcher’s access to teachers who were acquaintances and known to the researcher.
Given the entry requirements for secondary schools in Croatia are predicated on students’
103
grade averages in primary school as opposed to place of residence like Australian schools,
extending this research to vocational secondary schools, comprised of teachers and
students with lower grade averages could provide additional insights. The results could
allow for comparisons between schools and potentially bring enhanced understanding.
Students’ gender could also account for differences in perceptions of assessment
practices (Alkaharusi, 2015). An analysis of students’ comments related to fairness and
consistency indicated that most negative comments came from males. Most of these (see
Figures 13 and 14) were related to the subject of Croatian, while the most positive
comments were associated with the subject of English. This was also reflected in the rank
order of mean scores for Congruence, Authenticity and Transparency (see Tables 7, 11 and
15 respectively) where Teacher 1 scored the highest. However, Teacher 2, who received
the most negative student comments regarding fairness and consistency, did not fare the
worst in these scales. In view of higher numbers of female students in this research, the
disproportionately high number of negative comments by males is noteworthy.
Subjects themselves were identified by Alkaharusi (2014) as contributing to
differences between students’ perception of teacher assessments. In this study, the subject
of Croatian received the highest number of negative comments from students to the open-
ended questions regarding fairness and consistency. In fact, 100 % of comments on
fairness and consistency in Croatian assessments were negative – there were no positive
comments. For English, 80% of all comments were positive and 20% negative. Out of all
comments however, Biology attracted 53% positive and 46% negative comments for
fairness and consistency. It could therefore be said that the subject itself was a determining
factor in student perceptions of teacher assessments, with English viewed most positively
by students compared with Biology and Croatian. Of the three subjects, Croatian received
the most negative comments in regard to teacher assessments.
5.5OutcomesBasedonAssessment
Used effectively, teacher assessment of students can have several valuable
outcomes (Stang & Pearson, 2015). Indeed, changes and reforms to educational systems
have been influenced by the results of teacher assessments of students (Masters 2013,
McGaw, 2006). Previous research highlighted a range of consequences, such as student
behaviour in and beyond the classroom, and making decisions about improved educational
programs, as well as effects on teacher training and teachers’ views of student outcomes.
104
In every case-study class at least one student commented on the usefulness of
assessments for checking knowledge, forcing them to learn and providing good
opportunities to practice for matriculation examinations. For example, one student in
English class 1 described a positive feature of assessment as “checking the knowledge”.
Another, in class 2 Croatian, reported that assessment “forced me to study”, and a student
in class 4 Biology stated: “I have to study everything, better preparation for
matriculation”. In general, students and teachers tended to perceive assessments as a
requirement, but also as valuable for their learning, whether they liked it or not. This
perhaps stems from the requirement to pass all subjects in the state matriculation (matura)
examination to gain entry into university, not to mention the fact that when primary and
secondary school students fail a subject, even after supplementary examinations, they fail
the year and have to repeat it. In cases where the same year is failed twice, students are
discontinued and not permitted to continue, since unlike primary school, secondary
schooling is not compulsory in Croatia.
Poor assessment practices have been shown to have a negative effect on students in
terms of motivation and effort (Furman, 2009; King & Olleddich, 1989). Strahinić (2011)
discussed negative student outcomes resulting from teacher assessment practices in
Croatia, including truanting, cheating, anti-social behaviour, self-fulfilling prophecies and
the halo effect, where students’ fates depend on teacher assessments regardless of whether
they are carried out fairly. A detrimental view of assessments by Barnes et al. (2017)
highlighted teachers’ perspectives of assessments as irrelevant because they lead to
negative outcomes.
In the current study, there was no evidence of the negative outcomes described
above, possibly because the research was carried out in gimnazija or grammar schools,
where students require a high grade average to gain entry. In other words, because more
successful and ambitious students were enrolled in these schools, they were unlikely to
exhibit the negative outcomes raised by Strahinić. Conducting this research in vocational
and trade schools with academically weaker students may reveal new evidence.
One consequence of teachers implementing assessments is that students accept the
assessment tasks as a measure of their performance, given that both teachers and students
are engaged in formal education. Furman talked about teachers who continuously set
assessment tasks for students, regardless of the negative effects on them. Some of these
105
were evident from students’ comments like: “we are not assessed on applying but
reproducing information” and “not useful in real life, stressful and unnecessary” and “I
feel pressure”, suggesting a certain level of anxiety on the part of students.
Students acknowledged that assessments were an expectation but had deeply
embedded concerns about them. Comments such as “too demanding, too difficult” by
female students in Croatian class 2 and “sometimes our mark is not equal to what we
actually know, it’s too difficult” by a female student in English class 12 attest to this. Their
concerns revolved around what teacher assessments represented and the inherent
difficulties of assessing the content. A female student in English class 1, school 1, reported
sometimes being asked unsuitable questions for their age that they were unable to answer
objectively. Another comment included the word “unrealistic”, suggesting flaws in the
quality of teacher assessment as perceived by students.
5.6ImpactonStudentPerceptionsofAssessment
The outcomes of assessment have implications for student perceptions of the
assessment itself, for assessment practices in general and for the teacher (Alkaharusi, 2015;
Charalampous & Kokkinos, 2014; Furman, 2009; Strahinić, 2011). In this study,
differences emerged in student perceptions of assessment between two classes taught the
same subject by the same teacher in the same year level at the same school. The most
considerable differences were evident between Teacher 3’s two classes (classes 4 and 5) in
the subject of Biology for the Congruence mean. There was only one comment about
fairness and consistency from class 5, but an equal number of positive and negative
comments from class 4 (see Table 24), with students in the latter class perceiving the
teacher’s approach to assessments more accurately reflected their abilities than those in
class 5. This could be explained by personality factors, and teachers and students
developing a liking for one another, therefore perceiving them in a positive light when
others do not (Charalampous et al., 2014).
A study by Alm and Colnerud (2015) found students felt disadvantaged by their
teacher or felt subjected to unfair assessment practices. These authors believed that certain
actions and practices by teachers, such as using criteria unrelated to tasks and rounding
grades up or down resulted in unfair perceptions. They argued that such practices had short
and long-term consequences. Alm and Colnerud reported that the majority of teachers were
trying to be as objective as possible in their grading practices, but often fell short. The
tendency for students in this research to select “often” more frequently than “rarely” or
106
“never” for statements related to Congruency and Authenticity (see Tables 6 and 10)
supports a positive rating for teacher assessment as a fair indication of student
performance.
5.7Summary
The need for assessment was reinforced by teachers who unanimously stated they
conducted assessment tasks with students as part of their job and as required by the
Croatian Ministry of Education. Students’ comments regarding the usefulness of
assessments and their perceptions of the application supported this. Assessments were
shown to be hierarchical and administered from the top down (teacher to student), with
evaluation determined by the teacher (Harlem, 2005; Strahinić, 2011). Both teachers and
students appeared resigned to the fact that teachers were responsible for student
assessments and the grades awarded.
Written and oral assessment tasks were created by teachers based on the prescribed
textbook for each subject. Oral tasks were equally as common as written ones. Most
teachers regarded assessment tasks as summative, and necessary for awarding students a
numerical grade (Canal et al., 2012; Dargusch, 2014; Sadler, 2009). Written assessment
tasks were carried out by all students in class at the same time, while oral examination
tasks were usually undertaken without any warning and could take up several periods of
class time. Despite the questions being based on the contents of the textbook, a lack of
consistency in administering oral assessments was highly likely, since although criteria
were set for both written and oral tasks, the freedom and flexibility in oral assessments
allowed for the inclusion of non-task-related factors such as attendance and attitude
(Dargusch, 2014).
Students’ perceptions of teacher assessments indicated they complied for the most
part and accepted the status quo. Some students commented on teacher subjectivity and
raised concerns about grades not accurately reflecting their knowledge (Alm & Colnerud,
2015), but there were also comments to the contrary. Students’ perceptions of subject
classes taught by the same teacher exposed differences, suggesting that personality factors
may have played a role (Charalampous et al., 2014). Teacher 1 was viewed most
positively, as was the subject of English which she taught. The overall positive responses
from students could perhaps be explained by the fact that both schools in the study
required a 5 or A-grade average for entry, so the students surveyed were high achievers in

107
the educational system, possibly contributing to positive perceptions of the institution and
its practices.
The next chapter revisits the research questions and examines the extent to which
they have been answered. The key findings of the research are elaborated and final
conclusions and recommendations provided.

108
ChapterSix:ConclusionsandRecommendations
The findings of the study are discussed in this chapter in relation to the main
research question and subsidiary questions.
6.1ResponsetoResearchQuestions
The main research question was: “How do assessment practices and processes,
including the consistency of teacher judgements in secondary school assessments influence
student perceptions of fairness in Croatia?” The findings of this research showed that most
students involved in the study viewed teacher assessments positively. While a difference
emerged between the same-subject classes taught by Teacher 5, the students’ views were
generally positive and contradicted my impressions from conversations with secondary
school students in Croatia prior to embarking on this research.
The first subsidiary question was: “What perceptions do Croatian secondary school
students hold about the fairness of assessment?” In the context of this research, fairness
was related to consistency in teachers’ application of assessment procedures. Overall,
students indicated they had received the grades they deserved. The student questionnaire
was completed by 12 classes of Year 12 students in two secondary schools across three
subjects of Croatian, English and Biology, and elicited students’ comments on teachers’
assessment practices to provide insights into their perceptions.
From the questionnaire and comments provided by the students, this study revealed
that students predominantly viewed teacher assessments positively. There were differences
in student perceptions between subjects, with English as a foreign language rated more
positively than Croatian and Biology. Differences were also apparent in students’
perceptions of one particular teacher, Teacher 1, who was viewed more positively than the
other five teachers. There was also a discrepancy between the perceptions of two classes of
the same subject taught by Teacher 5.
The second subsidiary question was: “To what extent are teachers in Croatia
consistent in their implementation of assessment processes and application of assessment
criteria to students’ work in secondary school subjects, and how do these influence student
perceptions of fairness?” Consistency and uniform assessment criteria were investigated in
teacher interviews in three subject areas. All teachers claimed they implemented
assessment tasks as stipulated by the Education Department and dictated by curriculum
subject matter. None of the teachers talked about assessing students according to non-task-
109
related criteria, such as student behaviour or personality; neither did any student mention
that assessments were based on personal factors.
The third subsidiary question was: “What practices are used by Croatian teachers in
secondary school subject/s to improve consistency in applying assessment criteria and how
do these influence student perceptions of fairness?” Teacher interviews were designed to
address the consistency with which assessment criteria were applied in Croatia in three
targeted subject areas. With only one exception, all teachers said they had the county
assessment criteria, made them available to students and applied them rigorously.
However, an analysis of the criteria and how they were implemented revealed there was
room for teacher subjectivity, particularly in oral examinations. Additional project tasks
assigned by Teacher 5 for certain students raised concerns. On the one hand, successful
completion of these tasks led to improvements in grades and provided opportunities for
positive reinforcement and motivation, but on the other, they jeopardised consistency.
There was no evidence of teachers using assessments to punish or discipline their
students, but this raises questions about whether teachers were responding with socially
acceptable answers rather than the truth. At the very least, the tendency of teachers to
reiterate their strict adherence to assessment criteria shows they were aware of the
importance of fair and consistent practices in this regard.
6.2RecommendationsforPolicyandPractice
This research indicates that a comprehensive review of oral examinations, that
contribute to final assessment grades in Croatian secondary schools, is needed for all
subjects other than language-specific subjects, such as modern foreign and native
languages where speaking is an integral skill that requires mastery. As secondary school
assessment criteria showed, oral examinations not only allowed for teacher bias but also
encouraged it, and for this reason oral examinations should be reviewed or at least
improved in terms of consistency. This can be done through assessment checklists and
student training for oral examinations.
Ongoing teacher education in Croatia is recommended to reinforce the importance
of consistent treatment of all students. Teachers are compelled by Croatian Education
Department decree at a county level to agree on assessment criteria for their particular
subjects, and there was as obvious awareness amongst teachers, as evidenced from their
responses. However, constant reminders, teacher development and ongoing enhancement
110
of assessment criteria are necessary to maintain relevance and validity in practice.
Professional education will assist in reinforcing fair and accurate representation of results,
and create a level playing field for all students with regard to university entry and future
employment. County meetings requiring teachers’ attendance are already in place, so such
an initiative can be incorporated with little additional cost and effort.
It is recommended that a consistency checklist be created and used for all
assessments. This will focus teachers on consistency, especially with regard to maintaining
the same level of difficulty for all students.
The inclusion of non-task-related criteria and teachers’ personal judgements is
widespread in Croatia and sanctioned by educational authorities. The criteria openly
declare that the final grade is not just arithmetic, but includes student participation and
attitudes. These factors should be separated from assessment of student performance so
that school grades accurately reflect the levels of knowledge and skill attained, since they
play such a significant role in students’ eligibility for university.
The amount of content students are expected to learn in each subject also requires
review. So too does the practice of examining students on the contents of one assigned
textbook per subject, which should be expanded to increase students’ sources of learning.
Secondary schools in Croatia enrol students on a ranking basis according to their
grade averages in primary school. Further research, using a wider sample of heterogeneous
groups from different school populations could provide deeper insights into the influences
and effects on student perceptions of assessments. A detailed analysis of final grades,
students’ attitudes and participation as perceived by teachers will also further our
understanding.
6.3LimitationsoftheResearch
Both schools involved in this research catered for students with high grade averages
in primary school as a prerequisite for enrolment. These were ranked from highest to
lowest and only students with the highest grade averages gained entry into gimnazija, the
type of school targeted in this study. The closest comparison is the English grammar
school that sets its sights on students with high grade averages and ambitions for tertiary
level studies.
Gimnazija are the most sought after schools by students and parents because they
are traditionally more academically oriented and place a heavier emphasis on theory in
111
preparation for the final matriculation examination, the results of which determine entry
into most universities in Croatia. These schools take a limited number of students. Those
who don’t gain entry attend vocational secondary schools for four years that also cater for
limited numbers of students, are more practically oriented for jobs that only require
secondary school completion and allow for university entry. If students are unsuccessful in
gaining a place in these schools, their only option is to attend secondary trade school for
three years, which does not allow entry into university.
6.4DirectionsforFurtherResearch
The students involved in this research were academically competitive and
represented some of the more successful in the education system, meaning that the research
sample was streamed. Using the same research questionnaire and interviewing a broader
sample of students from varying academic backgrounds will further our understanding of
the issues under investigation.
Hence, it is recommended that this research be also carried out in vocational
schools in Croatia. These schools in Croatia also have a four-year programme, but the
entry grade average of students is lower. Therefore, the results from students in these
schools could vary from those results gained here in two grammar schools or so called
gimnazija secondary schools. The student sample should be increased. That it, this research
should be carried out in more secondary schools and in a wider variety of secondary
schools in Croatia to gain a more accurate picture of student perceptions of teacher
assessment. Furthermore, more research into oral examination perhaps needs to be carried
out.
6.5ConcludingComments
This research, in its investigation of teacher assessments, attempted to uncover
student perceptions of fairness with the objective of minimising negative perceptions.
Numerous student comments related to unfairness in teacher assessments were the initial
motivation for this investigation, yet this study showed the majority of students rated
consistency positively. However, the findings showed that oral assessments, on which
student assessments rely heavily, need reduction and review.
This is the first research of its kind undertaken in Croatia and the findings shed
light on new knowledge regarding assessments. With Croatia’s entry into the European
Union and its adherence to European Union Directives, the Ministry of Education has
112
made a long-term commitment to school reform or “školska reforma”. This study has the
potential to inform amendments and improvements, particularly for oral examinations
which form a core part of the education system.
The findings are not limited to Croatia since the issues identified are relevant to a
core activity in all school systems. Current methods of creating and applying oral
assessment criteria in Croatia are in dire need of a more critical focus on fairer outcomes
for students. At the same time, increasing teachers’ awareness will improve student
outcomes with far-reaching consequences in terms of their eligibility for university, entry
into the workforce and their perceptions in general. It is hoped that this examination of
students’ perceptions will raise awareness in order to avoid or at least minimise the
negative perceptions of students with potential to deter their attitudes and aspirations for
learning and education more broadly.
113
References
Ahmed, A., Pollit, A., & Rose, L. (1999). Can oral assessment provide a clearer
perspective? London: University of Cambridge.
Alkharusi, H. (2008). Effects of classroom assessment practices on students’ achievement
goals. Educational Assessment,13(4), 243-266.
Alkararusi, H. (2014). Classroom assessment communication, perceived assessment
environment and academic achievement: A path analysis. British Journal of
Education 8(2), 117-126.
Alkararusi, H. (2015). An evaluation of the measurement of perceived classroom
assessment environment. International Journal of Instruction,8(2), 45-54.
Allal, L. (2013). Teachers' professional judgement in assessment: A cognitive act and a
socially situated practice. Assessment in Education: Principles, Policy and
Practice, 20(1), 20-34.doi: 10.1080/096959594X.2012.736364
Alm, F., & Colnerud, G. (2015). Teachers' experiences of unfair grading. Educational
Assessment, 20(2),132-150.doi: 10.1080/10627197.2015.1028620
Asking the right research questions (2016). Retrieved from
https://www.usability247.com/blog/asking-the-right-research-questions/
Bandalos, D. (2004). Can a teacher-led state assessment system work? Educational
Measurement Issues and Practice, 23(2), 33-40. doi:10.1111/j.1745-3992.
2004.tb00157. x
Barbour, R., & Schostak, J. F. (2005). Interviewing and focus groups. In B. Somekh & C.
Lewin (Eds.) Research Methods in the Social Sciences (pp.41-49). London: Sage.
Barnes, N., Fives, H., & Dacey. C. (2017). U.S. Teachers’ conceptions of the purposes of
assessment. Teacher and Teacher Education, 65, 7-16.
Barnes, N., Fives, H., & Dacey, C.. (2015). Teachers' beliefs about assessment. In H. Fives
& M.G. Gill (Eds.) The Handbook on Research on Teachers' Beliefs (pp.229-223).
New York, NY: Routledge.
Bjedov, V. et al. (2010). Mjerila za ocjenivanja učinikova uspjeha-za srednju i osnovnu
školu (Measuring student achievement – for secondary and primary school).
Zagreb, Croatia: Školska knjiga.
114
Black, P., Harrison, C., Hodgen, J., Marshall, B., & Serret, N. (2010). Validity in
Teachers’ Summative Assessments. Assessment in Education: Principles, Policy &
Practice, 17(2), 215-232.doi: 10.1080/09695941003696016
Black, P., Harrison, C., Lee, C., Marshall, B. & Williams, D. (2003). Assessment
forlearning. Putting it into practice. Maidenhead UK: Open University Press.
Blanche, M., & Durrheim, K. (1999). Histories of the present: Social science research in
context. In M.T. Blanche & K. Durrheim (Eds.), Research in practice: Applied
methods for the social sciences (pp.1-16). Cape Town, South Africa: University of
Cape Town Press.
Brkić-Devčić, V. (2002). Kažnjavenje ocjenama (Punishing with grades). In: Praćenje i
ocjenjivanje školskog uspjeha (ed. Vrgoč, H.). Zagreb, Croatia: Hrvatski
pedagoško-književni zbor.
Broadfoot, P. Daugherty R, Gardner J, Gipps C, Harlen W, James M & Stobart G. (1999).
Assessment for learning: Beyond the black box. London UK: Nuffeld Foundation
and University of Cambridge.
Brookhart, S., (1997). A theoretical framework for the role of classroom assessment in
motivating student effort and achievement. Applied Measurement in Education, 10,
161-180.
Brookhart, S. (2004). Local districts assessments: One indicator for the validation of
Nebraska’s standards, assessment, and accountability system. Lincoln: University
of Nebraska
Brookhart, S. (2013). The use of teacher judgement for summative assessment in the USA.
Assessment in Education: Principles, Policy and Practice, 20(1), 69-90.doi:
10.1080/0969594X.2012.703170
Brookhart, S. (2015). Graded achievement, tested achievement, and validity. Educational
Assessment,20, 268-296. doi: 10.1080/10627197
Brookhart, S., Guskey, T., Bowers, A., McMillan, J., Smith, J. (2016). A century of
grading research: Meaning and value in the most common educational measure.
Review of Educational Research, 86(4), 803-848.
Brown, G. T. L. (2011). Self-regulation of assessment beliefs and attitudes: A review of
the students’ conceptions of assessment inventory. Educational Psychology: An
International Journal of Experimental Educational Psychology, 31(6), 731-748.doi:
10.1080/01443410.2011.5999836
115
Brown, G.T.L.& Hirschfield, G.H.F. (2008).Assessment in Education: Principles, Policy &
Practice, 15(1), 3-19.
Bullock, A., & Stallybrass, O. (2000). New Fontana Dictionary of Modern Thought.
London, UK: HarperCollins.
Cambridge University Press (2017). Cambridge Advanced Learners’ Dictionary (4th ed.)
London, UK: Cambridge University Press.
Canal, L., Bonini, N., Micciolo R., & Tentori, K. (2012). Consistency in teachers’
judgements. Journal of Educational Psychology, 27(3), 319-327.
Carmines, E.G. & Zeller, R. A. (1979). Quantitative Applications in the Social Sciences;
Reliability and Validity Assessments. Thousand Oaks, CA: Sage Publications Ltd.
doi 10.4135/9781412985642
Charalampous, K. & Kokkinos, C.M. (2014). Students’ Big Three Personality Traits,
Perceptions of Teacher Interpersonal Behaviour, and Mathematics Achievement:
An Application of the Model of Reciprocal Causation. Communication Education,
83(3),235-258. doi:10-1080/03663523.2014.917688
Chu, M., Guo, Q.,& Leighton, J.P. (2013). Students’ interpersonal trust and attitudes
towards standardised tests: Exploring affective variables related to student
assessment. Assessment in Education: Principles, Policy and Practice, 21(2), 167-
192. doi:10.1080/0969594X.2013.844094
Cole, N., & Ziecky, M. (2001). The new faces of fairness. Journal of Educational
Measurement 38(2), 369-382.
Connole, H. (1993). The research enterprise. In H. Connole, B. Smith, & R. Wiseman
(Eds.), Study Guide: Issues and methods in research (pp.17-42).Underdale,
Australia: University of South Australia.
Connolly S., Klenowski V., & Wyatt-Smith C. (2011). Moderation and consistency of
teacher judgement: Teachers’ views. British Educational Research Journal, 38(4),
593-614.doi:10/1080/01411926.2011.569006
Corcoran, M. (2013). Authentic Assessment leads to Dynamic Data. Presented at Authentic
Assessment Conference, Melbourne, Australia.
Dargusch, J. (2014) Teachers as Mediators: Formative practices with assessment criteria
and standards. Australian Journal of Language and Literature,37(3), 192-204.
Darling-Hammond, L. (1994). Performance based assessment and educational equity.
Harvard Educational review, 64(1), 5-30.
116
Dayal, H. C., & Lingam, G. I. (2015). Fijian Teachers' Conceptions of
Assessment. Australian Journal of Teacher Education, 40(8).
Delanshere, G. (2002). Assessment as Inquiry.Teachers’ College Record,104(7), 1461-
1484.
DeLuca. C., Chavez. T., & Cao, C. (2013). Establishing a foundation for valid teacher
judgement on student learning: The role of pre-service assessment education.
Assessment in Education,20(1), 107-126.
Department of Education and Training (1995). Making consistent judgements. East Perth,
Australia: Department of Education and Training, Government of Western
Australia.
Department of Education (2016). Student Support Services Manual. Yukon, Canada:
Department of Education. Retrieved from
http://www.education.gov.yk.ca/support.html
Department of Science and Education (2011). Nacionalni okvirni kurikulum (National
Curriculum Frameworks). Croatia: Department of Science and Education.
Retrieved from
https://www.azoo.hr/images/stories/dokumenti/Nacionalni_okvirni_kurikulum.pdf
Dhindsa, H., Omar, K., &Waldrip, B. (2007). Upper secondary Bruneian science students’
perceptions of assessment. International Journal of Science Education, 29(10),
1261-1280.doi:10.1080/09500690600991149
Dixon,H.,& Williams, R. (2003). Teachers’ understanding and use of formative assessment
in literacy learning. New Zealand Annual Review of Education, 12, 95-110.
Dochy, F., & McDowell, L. (1997). Assessment as a tool for learning. Studies in
Educational Evaluation,23, 279-298. doi:10.1016/S0191-491X (97)86211-6
Domovic, V. (2004) Školsko ozračje i učinkovite škole (School environment and school
effectiveness).Zagreb, Croatia: Naklada Slap.
Dorman, J., Waldrip,B. G., & Fisher, D.F. (2008). Using the Student Perceptions of
Assessment Questionnaire (SPAQ) to develop an assessment typology for science
classes. Journal of Science Education,1(9), 13-17.
Dorman, J. & Knightley, W. (2006). Development and validation of an instrument to
assess secondary school students’ perceptions of assessment tasks. Educational
Studies,32(1), 47-58.doi:org/10.1080/1080/03055690500415951
117
Dudar, L., Scott, S.,& Scott, D.E (2017). Accelerating change in schools: Leading rapid,
successful and complex change initiatives (Advances in Educational
Administration, Volume 27).Bingley, UK: Emerald Publishing Limited.
Fastre, G. M. J., van de Klink, M., R., & van Merrienboer, J.J.G. (2010). The effects of
performance-based assessment criteria on student performance and self-assessment
skills. Advances in Health Science Education, 15(4), 517-532.
Faull, A. (2010). The Australian curriculum: A look through the lens of Christian
Education. Journal of Christian Education, 4(2), 8-13.
Finkelstein, I. (2010). Marking system in theory and practice. Whitefish, Montana:
Kessinger.
Furman, C. (2009). The Dangerous Necessity of Assessment: A teacher’s dilemma. The
Coalition of Essential Schools, 24(4), 1-5.
Geertz, C. (1973). The Interpretation of Cultures. London: Fontana/New York: Basic
Books.
Goldbart, J., & Hustler, D. (2005). Ethnography. In B. Somekh & C. Lewin (Eds.)
Research in the Social Sciences (pp.16-24) London: Sage.
Golfashami, N., (2003) Understanding reliability and validity in 1ualitative research. The
Qualitative Report,8(4), 597-606.
Gordon, M., & Fay, C. (2010). The effects of grading and teaching practices on students’
perceptions of grading fairness. College Teaching, 58(3), 93-98. doi:
10.1080/87567550903418586
Gotti, M., & Sarcevic, S. (Eds.) (2006). Insights into Specialised Translation. Oxford, UK:
Peter Lang Press.
Grgin, T. (2001). Školsko ocjenivanje znanja (School assessment of knowledge). Zagreb,
Croatia: Naklada Slap.
Hanifi, A. (2014). Second language learners on foreign language learners’ error: The case
of the French language for Algerian students learning French as a foreign language.
European Scientific Journal, 2, 1857-7881.
Harlen, W. (1997). Fairness in Assessment. Assessment in Education: Principles, Policy
and Practice, 14(3), 365-37.
Harlen, W. (2007). Assessment of Learning. London, UK: Sage.
Hopfenbeck, T.N., Lenkeit, J., El Masri, Y., Cantrell, K., Ryan, J., Baird, J. (2017).
Lessons Learned from PISA: A Systematic Review of Peer. Scandinavian Journal
of Educational Research, 62(3), 333-353. doi: 10.1080/00313831.2016.1258726
118
Huang, J. (2001). Factors affecting the assessment of students’ writing. Educational
Measurement Issues and Practice, 5(1), 1-17.
Hughes, C., & Cappa, C. (2007). Developing generic criteria and standards for assessment
in law: Processes and (by) products.Assessment & Evaluation in Higher Education,
32(4), 417-432.
Huxham, M., Campbell, F. & Westwood, J. (2012). Oral versus written assessments: A test
of student performance and attitudes. Assessment & Evaluation in
HigherEducation,37(1), 125-136.doi: 10.1080/02602938.2010.515012
International General Certificate of Secondary Education (2017). Retrieved from
http://www.britishcouncil.com.cy/exam/igcse-school.
Joughin, G. (1998). Dimensions of oral assessment. Assessment and Evaluation in Higher
Education, 23, 367-378.
Joughin, G. (2010). A short guide to oral assessment. In Leeds Metropolitan
University/University of Wollongong (pp. 1-20). Retrieved
fromhttps://www.qub.ac.uk/directorates/AcademicStudentAffairs/CentreforEducati
onalDevelopment/FilestoreDONOTDELETE/Filetoupload,213702,en.pdf
Kane, M. (2010). Validity and fairness. In Language Testing, 27(2), 177-182. doi: 10.
1177 0265532209329467.
Kellermeier, G., K. (2010). Foreign Language Oral Assessment Practices in
Florida.(Unpublished doctoral dissertation). University of Central Florida, Orlando,
FL.
King, N.J.,& Olleddich, T.H. (1989). Children's anxiety and phobic disorders in school
settings: Classification, assessment and intervention issues.Review of Educational
Research,59(4), 431-470.
Kirton, A., Hallam, S., Pferrs, J., Robertson, P., & Stobart, G. (2007). Revolution,
evolution or a Trojan horse? Piloting assessments for learning in some Scottish
primary schools. British Educational Research Journal, 33(4), 605-627.
Klenowski, V. (2011). Assessment for learning in the accountability era: Queensland,
Australia. Studies in Educational Evaluation, 37(1), 78-83.
Klenowski, V. (2014). Towards fairer assessment. The Australian Educational Researcher,
41(4), 445-470). doi: 10.1007/s1384-013-0132-x
Kohler, M. & Ebook, L. (2015). Teachers as mediators in the foreign language classroom.
Bristol, UK: Multilingual Matters.
119
Koludrović, M. (2013). Mogućnost razvijanja kompetencija učenja u suvremenoj nastavi.
(Possibilities of developing learning competencies in contemporary teaching).
Pedagogijska instraživanja, 10(2), 295-307.
Lumely, T., Dierhr, P., Emerson, S., & Chen, L. (2002). The importance of the normality
assumption in large public health data sets. Annual Review of Public Health, 23,
151-169.
Luoma, S. (2004). Assessing speaking. London, UK: Cambridge University Press.
McLaughlin, M. J. (2010). Evolving interpretations of educational equity and students with
disabilities. Exceptional Children, 76(3), 265-278.
Masters, G. N. (2013). Reforming Education Assessment: Imperatives principles and
challenges. Camberwell, Australia: ACER Press.
McGaw B., (2006). Assessment in an era of rapid change: Innovations of and best
practices. Paper presented at the 32nd Annual Conference for Educational
Assessment. Singapore.
McMahon, S., & Jones, I. (2015). A Comparative judgement approach to teacher
assessment. Assessment in Education,22(3), 368.
Meissel, J., Yao, E., Rubine-Davies, C. (2017). Subjectivity of teacher judgements.
Exploring student characteristics that influence teacher judgements. Teacher and
Teacher Education,6, 48-60.
Merriam, S.B. (1998). Case Study Research in Education.Qualitative Research and Case
Study Applications Eric.
Messick, S. (1996). Validity and washback in language testing.ETS Research Report
Series,(1), pp. 1-18.
Miller, M.D., Linn, R., Gronlund, N. (2009). Measurement and assessment in teaching.
(10thed.) Upper SaddleRiver.
Ministry of Education (Ministarstvo obrazovanje znanosti i športa) (2016) National
Curriculum (Nacionalni kurikulum nastavnog predmeta). Retrieved from
http://mzos.hr/datoteke/23-Predmetni_kurikulum-Etika.pdf
Morgan, G. A., Leech, N. L., Gloeckner, G.W., & Barrett, K. C. (2013). Measurement and
descriptive statistics(chapter 3). In IBM SPSS for Introductory Statistics: Use and
interpretation (5th ed., pp. 37-53). New York: Routledge.
Muller, J., (2016). Authentic assessment toolbox, North Central College, Naperville, II
http://jfmueller.faculty.noctrl.edu/toolbox/index.htm Accessed on7 July 2017

120
Munoz, A.P.&Alvarez, M.E. (2010). Washback of an oral assessment system in the EFL
classroom. Language Testing,27(1), 33-49.
Nazor, M. (1999) What a grade in chemistry depends on for secondary school students (O
čemu sve ovisi ocjena iz kemije učenika srednjih škola).Školski Vjesnik: časopis za
pedagoška i školska pitanja,48(1), 33-39.
Newhouse, C.P. (2010). Digital forms of performance assessment. In D. Gonn and G.
Romeo. Proceedings of the 2010 Australian Computers in Education Conference.
Canberra: Australian Council for Computers in Education.
Newhouse, C.P. (2013). Computer-based examinations in schools. Freedom from the
limitations of paper? Research and Practice in Technology Enhanced Learning,
8(3), 431-447.
Newhouse, C.P., & Cooper, M.G. (2013). Computer-based oral exams in Italian language
studies. Recall, 23(3), 321-339.
Norcini, J., Anderson B., Bollela, V., Burch, V., Costa. MJ., Duvivier, R., Galbraith,
R., Hays, R., Kent, A., Perrott, V., Roberts, T. (2011). Criteria for good assessment:
Consensus statement and recommendations from the Ottawa 2010 Conference.
Medical Teacher33(3), 206-214.
OECD (2012). PISA 2009 Technical Report, PISA, OECD Publishing. Retrieved from
https://www.oecd.org/pisa/pisaproducts/50036771.pdf
Patti, A. (2011). High school students’ attitudes and beliefs on using the science writing
heuristic in an advanced placement chemistry class. Journal of Chemical
Education, 88(4), 516-521.
Pelligrino, J.W., Chudowsky, N.,& Glaser, R. (2001). Knowing what students know: The
science and design of educational assessment. Washington Natural Academy of
Sciences. Washington, DC: National Academy Press.
Perso, T. (2009). Cracking the NAPLAN code: Numeracy and literacy demands.
Australian Primary Mathematics Classroom, 14(3), 14-18.
About GCSE exams (2017). Retrieved from
qualifications.pearson.com/en/qualifications/edexcel-international-gcses-and-
edexcel-certificates/about-international-gcses.html.
Pivac, (2009). Izazov školi (School’s challenges). Zagreb, Croatia: Školska knjiga.
Rutkowski, D.,& Wild, J. (2015). Stakes matter: Student motivation and the validity of
student assessments for teacher evaluation. Educational Assessment,20(3), 165.
121
Rust,C., Price, M.,& O’Donovan, B. (2003) Improving students’ learning by developing
their understanding of assessment criteria and processes. Assessment and
Evaluation in Higher Education,28(2),147-164.
Sadler, D.R. (2009).Grade integrity and the representation of academic achievement.
Studies in Higher Education, 34(7), pp.807-826.
Sambell, K., McDowell, L. & Brown, S. (1997). “But is it fair?”: An Exploratory Study of
Student Perceptions of the Consequential Validity of Assessment. Studies in
Educational Evaluation, 23(4), 349-371.
Saunders, M. & Davis, S. (1998) "The use of assessment criteria to ensure consistency of
marking: some implications for good practice", Quality Assurance in Education,
Vol. 6 Issue: 3, pp.162-171, https://doi.org/10.1108/09684889810220465
Sayre, E.C. (2014). Oral exams as a tool for teaching and assessment. Teaching Science,60
(2), 29-33.
Scott, S., Webber, C.F., Lupart, J., Aitken, L., & Scott, D.E. (2014). Fair and equitable
assessment practices for all students. Assessment in Education: Principles, Policy
and Practice, 21(1), 52-70.
Short, P. M.,& Greer, J. T. (2002). Leadership in empowered schools: Themes from
innovative efforts. Upper Saddle River, NJ: Pearson.
Somekh, B., & Lewin, C. (2009). Research Methods in the Social Sciences.London: Sage.
Stang, K. K.,& Pearson, M. R. (2006). The process of assessment is important to the
examination of student, teacher, and program outcomes. Academic Exchange
Quarterly,10(4), 4-8.
Stanić, I. & Borić, E. (2016). Mjerila Ocjenivanja u razrednoj nastavi (Assessment
measures in primary teaching). Zagreb, Croatia: Školska Knjiga.
Stobart, G.K. (2010). Assessment fit-for-the-future. Paper presented at the IAEA Annual
Conference. Bangkok, Thailand.
Strahinić, C. (2012). Škola bez ocjena (School without grades).Osijek, Croatia: Grafika
doo.
Sun, Y.,& Cheng, L. (2013). Teacher's grading practices: Meaning and values assigned.
Assessment in Education: Principles, Policy & Practice, 21(3), 326-343. doi:
10.1080/0969594X.2013.768207.
Swaffeld, S. (2011). Getting to the heart of authentic assessment for learning. Assessment
in Education: Principles, Policy and Practice, 18(4), 433-449.
122
Thomson, S. and De Bortoli, L. (2008). Exploring Scientific Literacy: How Australia
measures up. In The PISA 2006 survey of students' scientific, reading and
mathematical literacy skills. Retrieved from http://research.acer.edu.au/ozpisa/2.
Thuy, T.V. & Dall'Alba, G. (2014). Authentic assessment for student learning- An
ontological conceptualisation.Educational Philosophy and Theory incorporating
Access,46(7), 778.
Trškan, D. (2005). Provjera znanja i ocjenjivanje u nastavi povijesti (Checking knowledge
and assessment in the subject of history). Zagreb, Croatia: Srednja Europa.
Van de Watering, G., Gijbels, D., Dochy, F., & van de Rijt, J. (2008). Students’ assessment
preferences, perceptions of assessment and their relationships to study
results.Higher Education,56(6), 645-658. doi: 10.1007/s10734-008-9116-6
Volante, L. (2006). Reducing bias in classroom assessment. Orbit 36(2), 34-36.
Webber, C., Scott, S., Aitken, Lupart, J.,& Scott, D. E. (2013) Leading assessment for
enriched student outcomes.School Leadership and Management, 35(3), 240-255.
Webber, C.F.,& Scott, S. (2012). Assessment in a Canadian Civil Society.Journal of
Management Development, 31(1), 34-37.
Wesley, P.M. (2012). Learner attitudes, perceptions, and beliefs in language
learning. Foreign Language Annals, 45(1), 98-117.
Woolf, L. (2005). Review of the Working Methods of the European Court of Human
Rights. Strasbourg, The European Court of Human Rights. Retrieved from
https://www.echr.coe.int/Documents/2005_Lord_Woolf_working_methods_ENG.p
df
Wyatt-Smith, C.M., Klenowski, V., & Gunn, S. (2010). The centrality of teachers'
judgement practice in assessment: A study of standards in moderation. Assessment in
Education: Principles, Policy &Practice, 17(1), 59-75.
Wright, R.J. (2008). Educational assessment tests and measurement in the age of
accountability. London, UK: Sage.
Wubbels, T. & Brekelmans, M. (2005). Two decades of research on teacher – student
relationships in class. International Journal of Educational Research, 4, 6-24.
123
Appendices
AppendixAStudentQuestionnaire
I. STUDENT SURVEY – TEACHER STUDENT ASSESSMENT
Biology, Croatian, English
This survey is part of research being conducted by Tania Blazevic (student at ECU). You have been invited to participate in the study because you study either biology, Croatian or English in the final year of secondary schooling in Croatia. Your teacher will invite you to complete an anonymous voluntary 20 minute questionnaire. However, you do not have to complete the questionnaire if you do not want to. This is an anonymous questionnaire. By completing the questionnaire you are consenting to take part in this research. So you should first read the following Disclosure Statement carefully as it explains what this research is about. You may withdraw from completing any part or the whole of the questionnaire and there are no penalties or consequences from doing so.
Disclosure Statement This questionnaire forms part of the evaluation of teacher assessment of students at school to help the understanding of teacher assessment of students and the effect this assessment has on students. The evaluation is being conducted by Tania Blazevic, a student from ECU as part of my doctoral thesis. What you as a student think is very important to this evaluation and therefore I am surveying students from your class to collect this information. Your responses will be strictly confidential, only I will see your particular responses. The information will be collated with no reference to individuals and no identifying information for reports to the school and teachers at the school. Such reports will only include general and summary information and will in no manner identify individual or groups of students or teachers.
Instructions to Students Please do not write your name on the survey sheet. To ensure maximum confidentiality no one at your school will see your questionnaire. Take as long as you need o complete the survey.
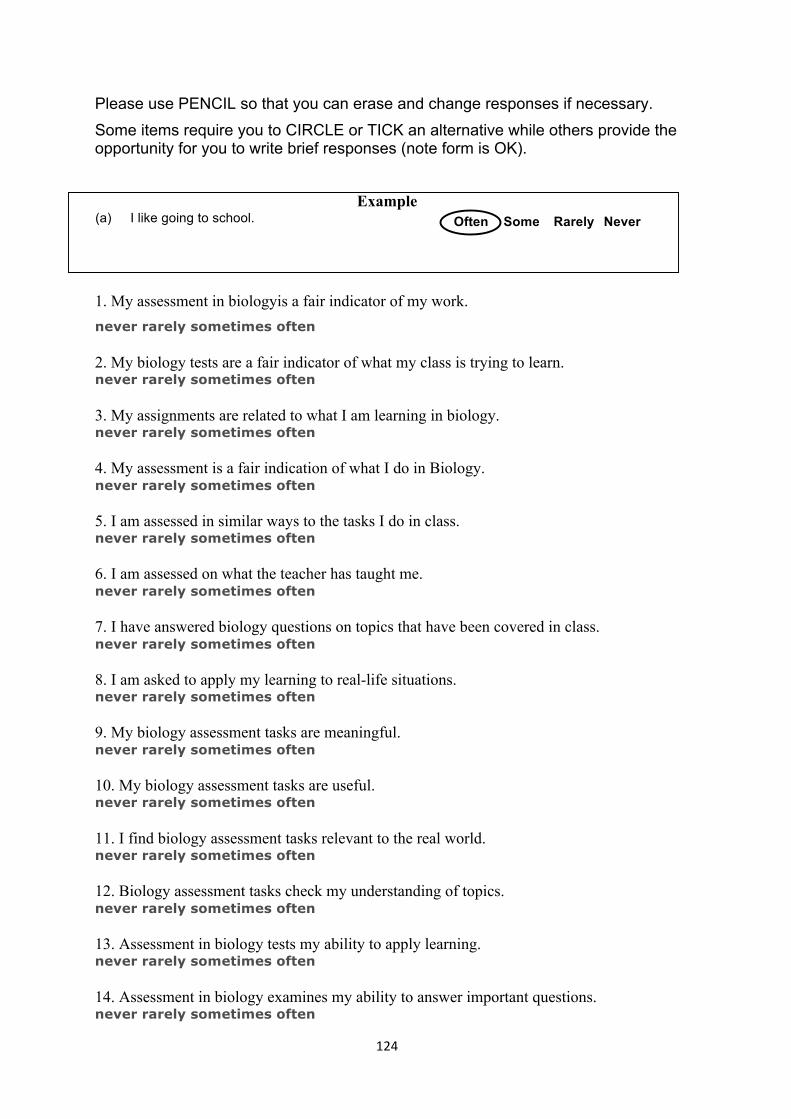
124
Please use PENCIL so that you can erase and change responses if necessary. Some items require you to CIRCLE or TICK an alternative while others provide the opportunity for you to write brief responses (note form is OK).
Example (a) I like going to school. Often Some Rarely Never
1. My assessment in biologyis a fair indicator of my work. never rarely sometimes often
2. My biology tests are a fair indicator of what my class is trying to learn. never rarely sometimes often 3. My assignments are related to what I am learning in biology. never rarely sometimes often 4. My assessment is a fair indication of what I do in Biology. never rarely sometimes often 5. I am assessed in similar ways to the tasks I do in class. never rarely sometimes often 6. I am assessed on what the teacher has taught me. never rarely sometimes often 7. I have answered biology questions on topics that have been covered in class. never rarely sometimes often 8. I am asked to apply my learning to real-life situations. never rarely sometimes often 9. My biology assessment tasks are meaningful. never rarely sometimes often 10. My biology assessment tasks are useful. never rarely sometimes often 11. I find biology assessment tasks relevant to the real world. never rarely sometimes often 12. Biology assessment tasks check my understanding of topics. never rarely sometimes often 13. Assessment in biology tests my ability to apply learning. never rarely sometimes often 14. Assessment in biology examines my ability to answer important questions. never rarely sometimes often
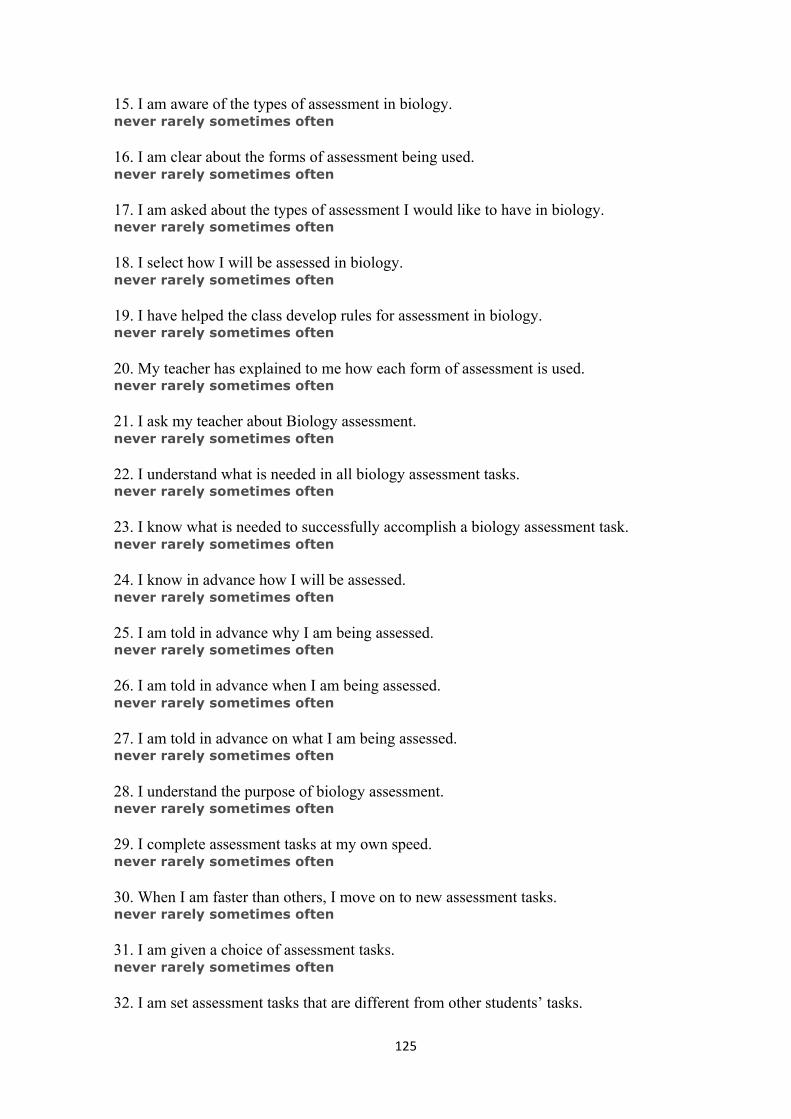
125
15. I am aware of the types of assessment in biology. never rarely sometimes often 16. I am clear about the forms of assessment being used. never rarely sometimes often 17. I am asked about the types of assessment I would like to have in biology. never rarely sometimes often 18. I select how I will be assessed in biology. never rarely sometimes often 19. I have helped the class develop rules for assessment in biology. never rarely sometimes often 20. My teacher has explained to me how each form of assessment is used. never rarely sometimes often 21. I ask my teacher about Biology assessment. never rarely sometimes often 22. I understand what is needed in all biology assessment tasks. never rarely sometimes often 23. I know what is needed to successfully accomplish a biology assessment task. never rarely sometimes often 24. I know in advance how I will be assessed. never rarely sometimes often 25. I am told in advance why I am being assessed. never rarely sometimes often 26. I am told in advance when I am being assessed. never rarely sometimes often 27. I am told in advance on what I am being assessed. never rarely sometimes often 28. I understand the purpose of biology assessment. never rarely sometimes often 29. I complete assessment tasks at my own speed. never rarely sometimes often 30. When I am faster than others, I move on to new assessment tasks. never rarely sometimes often 31. I am given a choice of assessment tasks. never rarely sometimes often 32. I am set assessment tasks that are different from other students’ tasks.
126
never rarely sometimes often 33. I am given assessment tasks that suit my ability. never rarely sometimes often 34. I use different assessment methods from other students. never rarely sometimes often 35. I do work that is different from other students’ work. never rarely sometimes often C. 1.
The two best things about doing assessment tasks or tests in this subject:
C C
2. The two worst things about doing assessment tasks or tests in this subject:
:
D D
Any other comments about assessment you would like to make
THANK YOU FOR YOUR HELP
Adapted from Student Perceptions of assessment tasks inventory (final form) by Dorman et al (2008) and Questionnaire of Digital Forms of Assessment by Newhouse (2012)
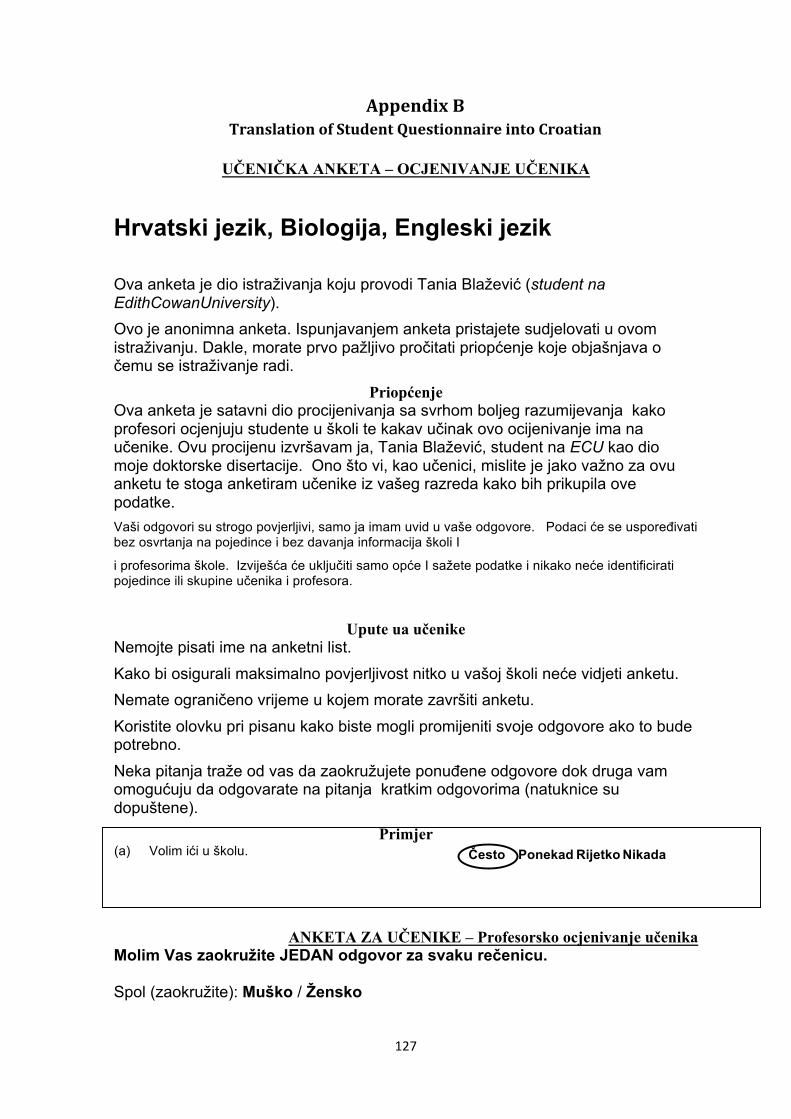
127
AppendixBTranslationofStudentQuestionnaireintoCroatian
UČENIČKA ANKETA – OCJENIVANJE UČENIKA
Hrvatski jezik, Biologija, Engleski jezik
Ova anketa je dio istraživanja koju provodi Tania Blažević (student na EdithCowanUniversity). Ovo je anonimna anketa. Ispunjavanjem anketa pristajete sudjelovati u ovom istraživanju. Dakle, morate prvo pažljivo pročitati priopćenje koje objašnjava o čemu se istraživanje radi.
Priopćenje Ova anketa je satavni dio procijenivanja sa svrhom boljeg razumijevanja kako profesori ocjenjuju studente u školi te kakav učinak ovo ocijenivanje ima na učenike. Ovu procijenu izvršavam ja, Tania Blažević, student na ECU kao dio moje doktorske disertacije. Ono što vi, kao učenici, mislite je jako važno za ovu anketu te stoga anketiram učenike iz vašeg razreda kako bih prikupila ove podatke. Vaši odgovori su strogo povjerljivi, samo ja imam uvid u vaše odgovore. Podaci će se uspoređivati bez osvrtanja na pojedince i bez davanja informacija školi I
i profesorima škole. Izviješća će uključiti samo opće I sažete podatke i nikako neće identificirati pojedince ili skupine učenika i profesora.
Upute ua učenike Nemojte pisati ime na anketni list. Kako bi osigurali maksimalno povjerljivost nitko u vašoj školi neće vidjeti anketu. Nemate ograničeno vrijeme u kojem morate završiti anketu. Koristite olovku pri pisanu kako biste mogli promijeniti svoje odgovore ako to bude potrebno. Neka pitanja traže od vas da zaokružujete ponuđene odgovore dok druga vam omogućuju da odgovarate na pitanja kratkim odgovorima (natuknice su dopuštene).
Primjer (a) Volim ići u školu. Često Ponekad Rijetko Nikada
ANKETA ZA UČENIKE – Profesorsko ocjenivanje učenika Molim Vas zaokružite JEDAN odgovor za svaku rečenicu. Spol (zaokružite): Muško / Žensko
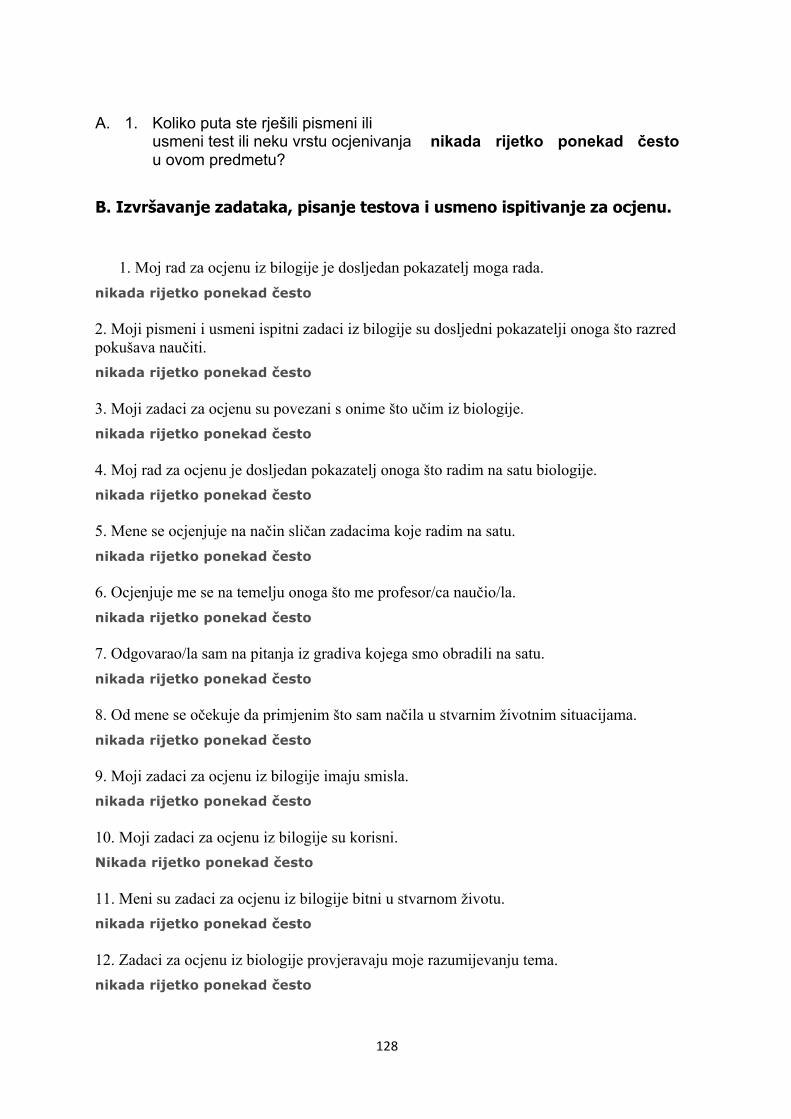
128
A. 1. Koliko puta ste rješili pismeni ili
usmeni test ili neku vrstu ocjenivanja u ovom predmetu?
nikada rijetko ponekad često
B. Izvršavanje zadataka, pisanje testova i usmeno ispitivanje za ocjenu.
1. Moj rad za ocjenu iz bilogije je dosljedan pokazatelj moga rada. nikada rijetko ponekad često
2. Moji pismeni i usmeni ispitni zadaci iz bilogije su dosljedni pokazatelji onoga što razred pokušava naučiti. nikada rijetko ponekad često
3. Moji zadaci za ocjenu su povezani s onime što učim iz biologije. nikada rijetko ponekad često
4. Moj rad za ocjenu je dosljedan pokazatelj onoga što radim na satu biologije. nikada rijetko ponekad često
5. Mene se ocjenjuje na način sličan zadacima koje radim na satu. nikada rijetko ponekad često
6. Ocjenjuje me se na temelju onoga što me profesor/ca naučio/la. nikada rijetko ponekad često
7. Odgovarao/la sam na pitanja iz gradiva kojega smo obradili na satu. nikada rijetko ponekad često
8. Od mene se očekuje da primjenim što sam načila u stvarnim životnim situacijama. nikada rijetko ponekad često
9. Moji zadaci za ocjenu iz bilogije imaju smisla. nikada rijetko ponekad često
10. Moji zadaci za ocjenu iz bilogije su korisni. Nikada rijetko ponekad često
11. Meni su zadaci za ocjenu iz bilogije bitni u stvarnom životu. nikada rijetko ponekad često
12. Zadaci za ocjenu iz biologije provjeravaju moje razumijevanju tema. nikada rijetko ponekad često
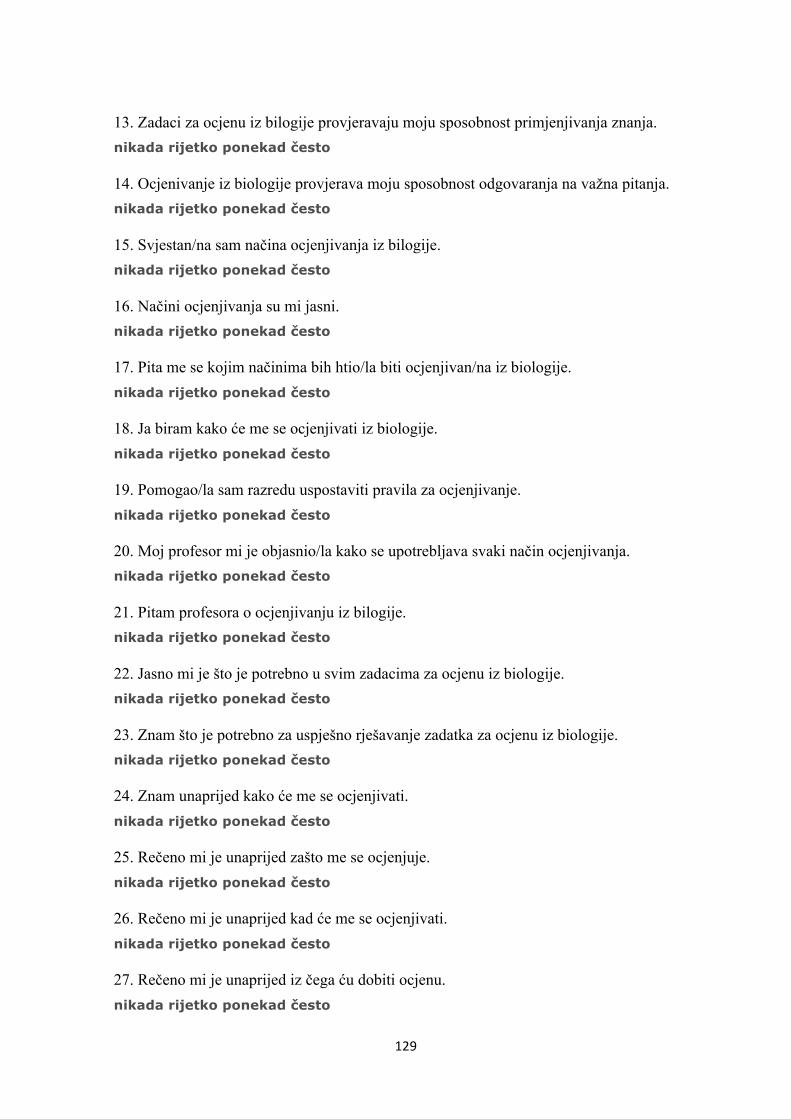
129
13. Zadaci za ocjenu iz bilogije provjeravaju moju sposobnost primjenjivanja znanja. nikada rijetko ponekad često
14. Ocjenivanje iz biologije provjerava moju sposobnost odgovaranja na važna pitanja. nikada rijetko ponekad često
15. Svjestan/na sam načina ocjenjivanja iz bilogije. nikada rijetko ponekad često
16. Načini ocjenjivanja su mi jasni. nikada rijetko ponekad često
17. Pita me se kojim načinima bih htio/la biti ocjenjivan/na iz biologije. nikada rijetko ponekad često
18. Ja biram kako će me se ocjenjivati iz biologije. nikada rijetko ponekad često
19. Pomogao/la sam razredu uspostaviti pravila za ocjenjivanje. nikada rijetko ponekad često
20. Moj profesor mi je objasnio/la kako se upotrebljava svaki način ocjenjivanja. nikada rijetko ponekad često
21. Pitam profesora o ocjenjivanju iz bilogije. nikada rijetko ponekad često
22. Jasno mi je što je potrebno u svim zadacima za ocjenu iz biologije. nikada rijetko ponekad često
23. Znam što je potrebno za uspješno rješavanje zadatka za ocjenu iz biologije. nikada rijetko ponekad često
24. Znam unaprijed kako će me se ocjenjivati. nikada rijetko ponekad često
25. Rečeno mi je unaprijed zašto me se ocjenjuje. nikada rijetko ponekad često
26. Rečeno mi je unaprijed kad će me se ocjenjivati. nikada rijetko ponekad često
27. Rečeno mi je unaprijed iz čega ću dobiti ocjenu. nikada rijetko ponekad često
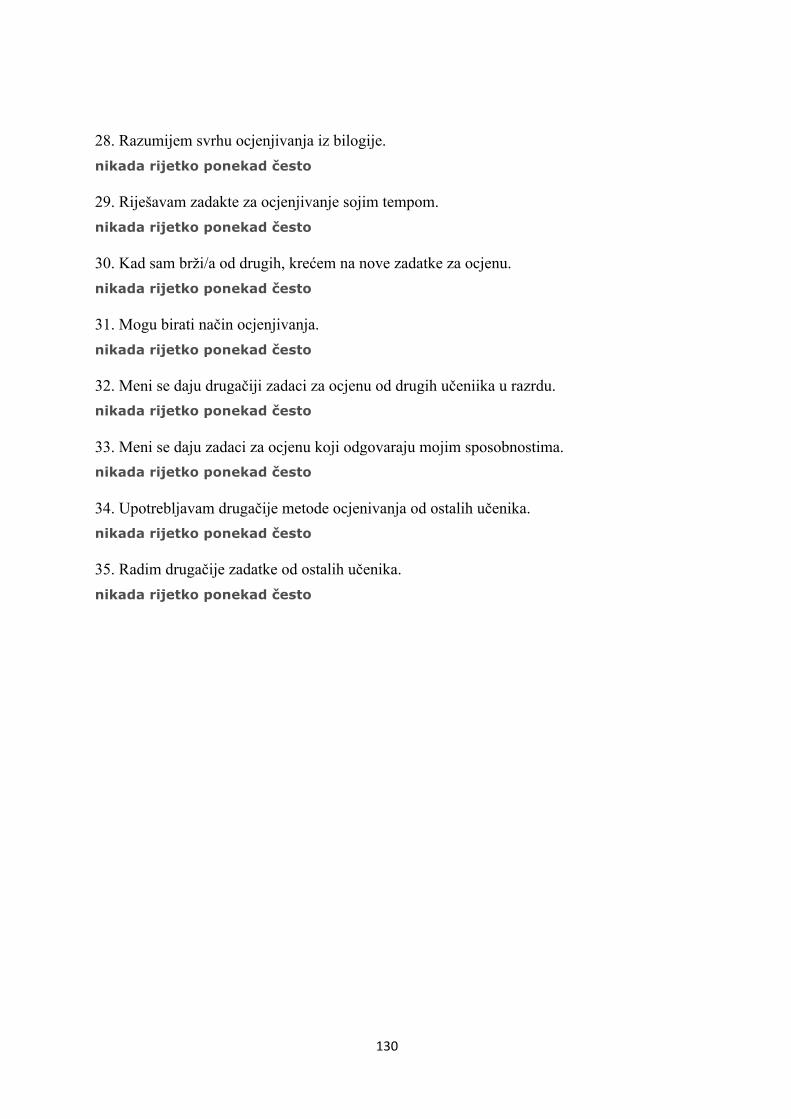
130
28. Razumijem svrhu ocjenjivanja iz bilogije. nikada rijetko ponekad često
29. Riješavam zadakte za ocjenjivanje sojim tempom. nikada rijetko ponekad često
30. Kad sam brži/a od drugih, krećem na nove zadatke za ocjenu. nikada rijetko ponekad često
31. Mogu birati način ocjenjivanja. nikada rijetko ponekad često
32. Meni se daju drugačiji zadaci za ocjenu od drugih učeniika u razrdu. nikada rijetko ponekad često
33. Meni se daju zadaci za ocjenu koji odgovaraju mojim sposobnostima. nikada rijetko ponekad često
34. Upotrebljavam drugačije metode ocjenivanja od ostalih učenika. nikada rijetko ponekad često
35. Radim drugačije zadatke od ostalih učenika. nikada rijetko ponekad često
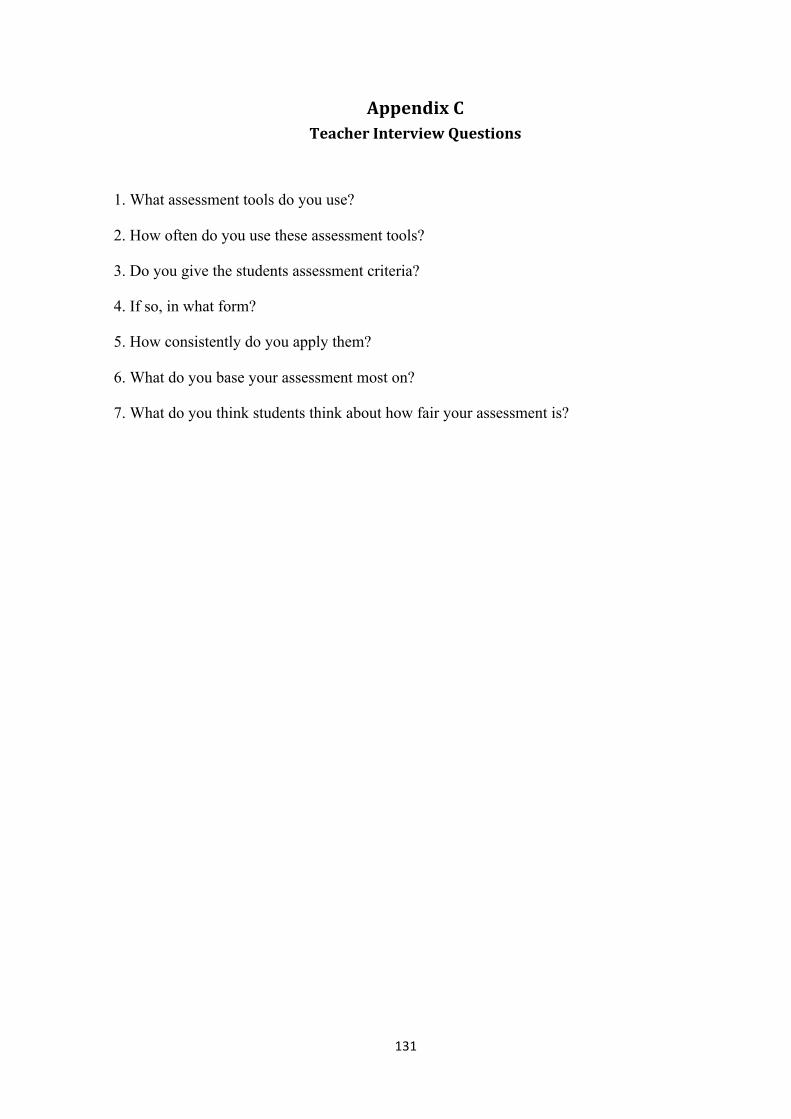
131
AppendixCTeacherInterviewQuestions
1. What assessment tools do you use?
2. How often do you use these assessment tools?
3. Do you give the students assessment criteria?
4. If so, in what form?
5. How consistently do you apply them?
6. What do you base your assessment most on?
7. What do you think students think about how fair your assessment is?
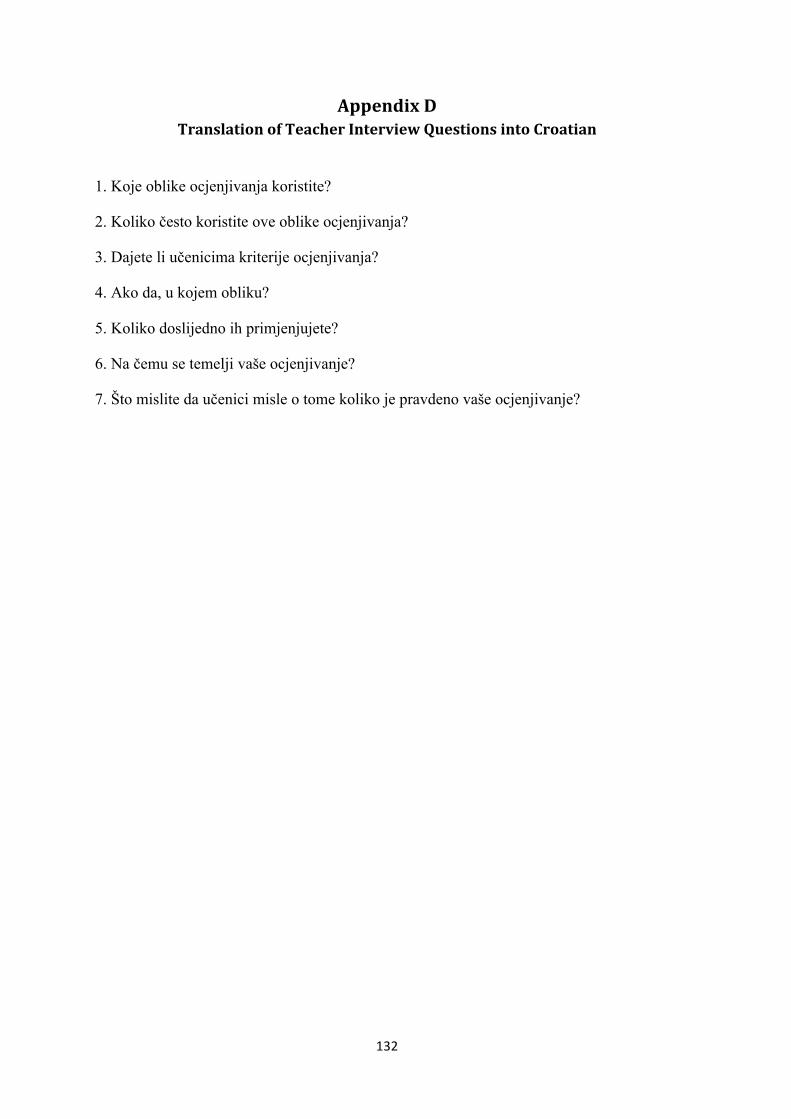
132
AppendixDTranslationofTeacherInterviewQuestionsintoCroatian
1. Koje oblike ocjenjivanja koristite?
2. Koliko često koristite ove oblike ocjenjivanja?
3. Dajete li učenicima kriterije ocjenjivanja?
4. Ako da, u kojem obliku?
5. Koliko doslijedno ih primjenjujete?
6. Na čemu se temelji vaše ocjenjivanje?
7. Što mislite da učenici misle o tome koliko je pravdeno vaše ocjenjivanje?
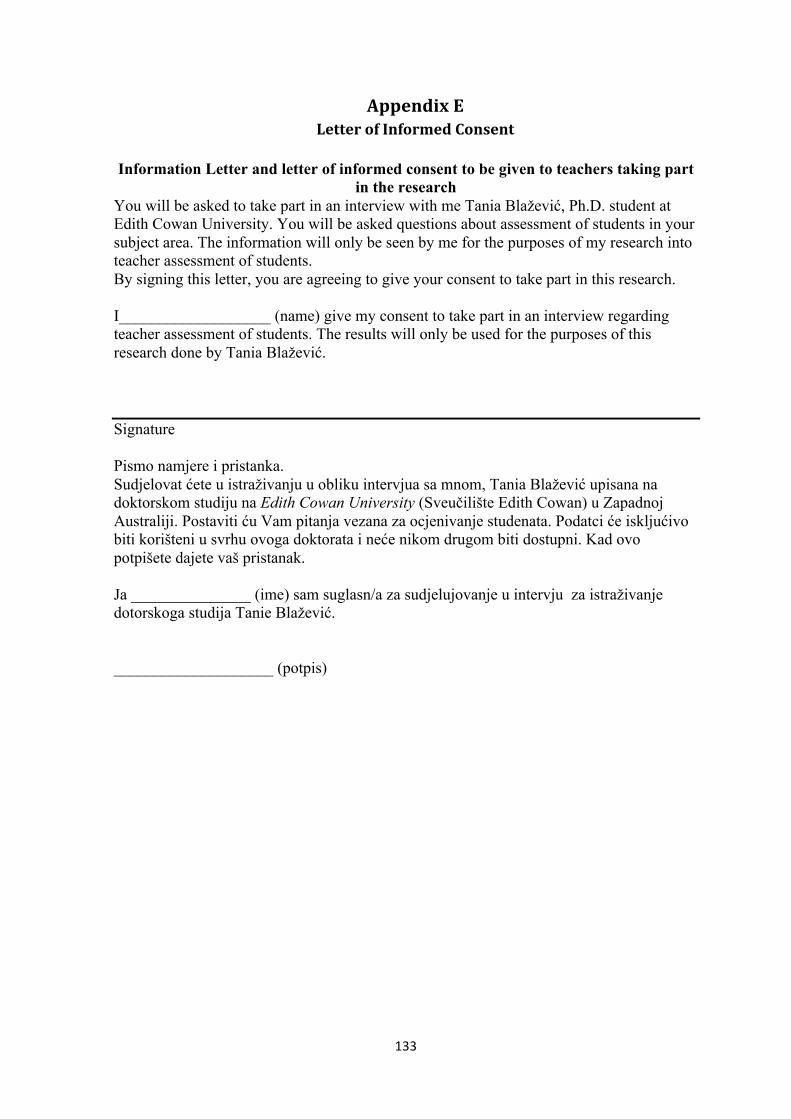
133
AppendixELetterofInformedConsent
Information Letter and letter of informed consent to be given to teachers taking part
in the research You will be asked to take part in an interview with me Tania Blažević, Ph.D. student at Edith Cowan University. You will be asked questions about assessment of students in your subject area. The information will only be seen by me for the purposes of my research into teacher assessment of students. By signing this letter, you are agreeing to give your consent to take part in this research. I___________________ (name) give my consent to take part in an interview regarding teacher assessment of students. The results will only be used for the purposes of this research done by Tania Blažević. Signature Pismo namjere i pristanka. Sudjelovat ćete u istraživanju u obliku intervjua sa mnom, Tania Blažević upisana na doktorskom studiju na Edith Cowan University (Sveučilište Edith Cowan) u Zapadnoj Australiji. Postaviti ću Vam pitanja vezana za ocjenivanje studenata. Podatci će iskljućivo biti korišteni u svrhu ovoga doktorata i neće nikom drugom biti dostupni. Kad ovo potpišete dajete vaš pristanak. Ja _______________ (ime) sam suglasn/a za sudjelujovanje u intervju za istraživanje dotorskoga studija Tanie Blažević. ____________________ (potpis)

134
AppendixFInformationSheetsforTeachersandStudents
INFORMATION SHEET - STUDENT Research for PhD thesis by Ms Tania Blažević Title: An investigation of secondary student perceptions of fairness about assessment processes implemented by their teachers. Dear Student I am conducting research as part of the requirements of a PhD at Edith Cowan University. This research aims to investigate the effect of teacher assessment practices in secondary schooling in Croatia on student perceptions of fairness. In particular, it aims to focus on the extent to which teachers consistently implement assessment practices and make judgements of student achievement and how this is likely to affect these student perceptions. Consequently, studying the application of teacher assessment will lead to an evaluation of the effects of teacher assessment practices on student perceptions of fairness. Your teacher has been invited to be interviewed as part of the study and has agreed to participate. You are also invited to participate in the study because you study either biology, Croatian or English in the final year of secondary schooling in Croatia. Your will be asked to complete an anonymous voluntary 20-minute questionnaire, which will be provided to you by your teacher. However, you do not have to complete the questionnaire if you do not want to. This will not require you to do anything that is unusual in a school environment, or have the potential for discomfort or inconvenience. You may withdraw from the study at any time without any penalty or adverse consequences. Your teacher will be provided with a confidential anonymous report on the data collected from your class that will not identify any individual student. The information you and your teacher provide will only be seen by myself and my supervisors, for the purposes of my research into teacher assessment of students. This information will be secured to ensure the confidentiality and privacy with pseudonyms and codes in place of names and the destruction of the data after five years. However, there are legal limits to confidentiality. The data will be stored in a cabinet at the University and on a University server with password protection and on my computer that is password protected. The results of the study will be published in my thesis and a number of journal and/or conference papers but none of these will include any information that may identify individual participants. If you would like to discuss any aspect of this project please contact me via email ([email protected]) or my supervisor Associate Professor Paul Newhouse, on 9370 6469 or via email ([email protected]). If you wish to speak with an independent person about the conduct of the project, please contact Ms Kim Gifkins the Research Ethics Officer on 6304 2170. If you consent to participation in this project please complete the questionnaire and return it to your teacher.
135
INFORMATION SHEET - TEACHER Research for PhD thesis by Ms Tania Blažević Title: An investigation of secondary student perceptions of fairness about assessment processes implemented by their teachers. Dear Teacher I am conducting research as part of the requirements of a PhD at Edith Cowan University. This research aims to investigate the effect of teacher assessment practices in secondary schooling in Croatia on student perceptions of fairness. In particular, it aims to focus on the extent to which teachers consistently implement assessment practices and make judgements of student achievement and how this is likely to affect these student perceptions. Consequently, studying the application of teacher assessment will lead to an evaluation of the effects of teacher assessment practices on student perceptions of fairness. You are invited to participate in the study because you teach either biology, Croatian or English to final year secondary students in Croatia. Teachers from two schools will be involved in an audio-recorded one-hour interview and will be asked to provide planning documents used for assessment, and to conduct an anonymous voluntary 20-minute survey with their students. None of these processes will require participants to do anything that is unusual in a school environment or have the potential for discomfort or inconvenience. You or any of your students may withdraw from the study at any time without any penalty or adverse consequences. If you complete the study you will be provided with a confidential anonymous report on the data collected from yourself and your class. The information you and your students provide will only be seen by myself and my supervisors, for the purposes of my research into teacher assessment of students. This information will be secured to ensure the confidentiality and privacy with pseudonyms and codes in place of names and the destruction of the data after five years. However, there are legal limits to confidentiality. The data will be stored in a cabinet at the University and on a University server with password protection and on my computer that is password protected. The results of the study will be published in my thesis and a number of journal and/or conference papers but none of these will include any information that may identify individual participants. If you would like to discuss any aspect of this project please contact me via email ([email protected]) or my supervisor Associate Professor Paul Newhouse, on 9370 6469 or via email ([email protected]). If you wish to speak with an independent person about the conduct of the project, please contact Ms Kim Gifkins the Research Ethics Officer on 6304 2170. If you consent to participation in this project please sign the consent form and return it to me.