An Investigation into High Quality Leader Member Exchange Relatio
90
University of South Florida Scholar Commons Graduate School eses and Dissertations Graduate School 1-1-2011 An Investigation into High Quality Leader Member Exchange Relationships and their Relation to Followers' Motivation to Lead Michael Rossi University of South Florida, [email protected] Follow this and additional works at: hp://scholarcommons.usf.edu/etd Part of the American Studies Commons , and the Psychology Commons is Dissertation is brought to you for free and open access by the Graduate School at Scholar Commons. It has been accepted for inclusion in Graduate School eses and Dissertations by an authorized administrator of Scholar Commons. For more information, please contact [email protected]. Scholar Commons Citation Rossi, Michael, "An Investigation into High Quality Leader Member Exchange Relationships and their Relation to Followers' Motivation to Lead" (2011). Graduate School eses and Dissertations. hp://scholarcommons.usf.edu/etd/3300
Transcript of An Investigation into High Quality Leader Member Exchange Relatio

University of South FloridaScholar Commons
Graduate School Theses and Dissertations Graduate School
1-1-2011
An Investigation into High Quality Leader MemberExchange Relationships and their Relation toFollowers' Motivation to LeadMichael RossiUniversity of South Florida, [email protected]
Follow this and additional works at: http://scholarcommons.usf.edu/etdPart of the American Studies Commons, and the Psychology Commons
This Dissertation is brought to you for free and open access by the Graduate School at Scholar Commons. It has been accepted for inclusion inGraduate School Theses and Dissertations by an authorized administrator of Scholar Commons. For more information, please [email protected].
Scholar Commons CitationRossi, Michael, "An Investigation into High Quality Leader Member Exchange Relationships and their Relation to Followers'Motivation to Lead" (2011). Graduate School Theses and Dissertations.http://scholarcommons.usf.edu/etd/3300
An Investigation into High Quality Leader Member Exchange Relationships and
Their Relation to Followers’ Motivation to Lead
by
Michael Rossi
A dissertation submitted in partial fulfillment of the requirements for the degree
Doctor of Philosophy College of Arts and Sciences University of South Florida
Co-Major Professor: Russell E. Johnson, Ph.D. Co-Major Professor: Michael Coovert, Ph.D.
Jennifer K. Bosson, Ph.D. Tiina Ojanen, Ph.D. Paul Spector, Ph.D.
Date of Approval March 25, 2011
Keywords: 360 assessment, leadership competencies, federal leaders, role models, leader performance
Copyright © 2011, Michael Rossi
i
Table of Contents
List of Tables iii
List of Figures iv
Abstract v
Chapter 1: Introduction 1 Motivation to Lead (MTL) 3
Affective-Identity MTL 5 Social-Normative MTL 5 Noncalculative MTL 6
Antecedents of MTL 7 Personality Traits 7 Cultural Values 8 LSE 9 Past Leadership Experience 9 LSE as a mediator between distal antecedents and MTL 10 Observed leadership as a proposed new antecedent to MTL 10
The Cascading Effect of Leadership 11 Relationship of Observed Leadership with MTL 14 Leader Member Exchange (LMX) 16 A Competency Based View of Leadership Effectiveness 20 Relationship of MTL to Leadership Criteria 22 Summary of Proposed Study 27
Chapter 2: Method 28 Participants 28
360 Participants 28 360 Raters 28
Measures 28 MTL 28 LSE 29 LMX 29 Leadership Competencies 29 Perceived Supervisor Leader Effectiveness 30 Control Variables 31
Procedure 31
ii
Data Cleaning 33 Scoring 33
Chapter 3: Results 36
Chapter 4: Discussion 49 Role-Modeling and MTL 49 MTL and Leadership Performance 51 Academic Implications 52 Applied Implications 53 Limitations 54 Future Research 58 Summary 59
References 61
Appendices 68 Appendix A: OPM Leadership 360 Competency Definitions 69 Appendix B: OPM Leadership 360 Items 72 Appendix C: Supplemental Survey 78

iii
List of Tables
Table 1: Study Variables, Descriptive Statistics and Correlations 37
Table 2: OPM Leadership 360 Assessment Descriptive Statistics 38
Table 3: Correlations between 360 Rating Groups on Overall Performance 39
Table 4: Intraclass Correlation Coefficients 39
Table 5: Regression Results for Perceived Supervisor Leader Effectiveness Predicting LSE and MTL 40
Table 6: Regression Results for Moderation Analysis 42
Table 7: Regression Results Predicting Leader Performance 45
Table 8: Regression Results Supervisor Rating Predicting Leader Performance 45
Table 9: Regression Results Peer Rating Predicting Leader Performance 46
Table 10: Regression Results Subordinate Rating Predicting Leader Performance 46
Table 11: Test of Group Differences 47
iv
List of Figures
Figure 1: Portion of Chan and Drasgow’s (2001) MTL Model 13
Figure 2: Slope Illustration for Moderation of LMX on the Relationship between Perceived Supervisor Leadership Experience and LSE 42
Figure 3: Slope Illustration for Moderation of LMX on the Relationship between Perceived Supervisor Leadership Experience and Noncalculative MTL 43

v
Abstract
This research further investigates the motivation to lead (MTL) construct and its
antecedents. While existing research has investigated culture, personality, and direct
experience as an antecedent to MTL, the indirect experience of observing an effective
leader has not been studied. It was hypothesized that having an effective supervisor
would be related to followers’ leadership self efficacy and MTL. It was also hypothesized
that this relationship would be moderated by the quality of the relationship between
leader and follower. Little evidence was found supporting these hypotheses. In addition,
the existing research into MTL has failed to establish the link between MTL and leader
performance. Using leadership 360 ratings as a proxy for leader performance, no support
was found linking MTL with leader performance. Academic and applied implications are
discussed.

1
Chapter 1: Introduction
The academic study of leadership is nearly 80 years old (House & Aditya, 1997),
and has experienced the cyclical trends that would be expected within any area of
research with such an extended history. Early leadership research focused on the
characteristics of the leader and was rooted in the great man theory. This theory posited
that leaders possessed character and personality traits that distinguished them from
followers (Carlyle, 1841/1907). Trait research dominated this initial leadership paradigm.
Traits such as dominance, assertiveness, physical stature, social sensitivity, and perhaps,
most importantly, intelligence, were extensively studied in early leadership research
(Chemers, 2000). Stogdill’s (1948) influential critique of trait research initiated a trend
away from such a focus, finding that while a few traits were often associated with
leadership, there was no single trait profile which could predict leadership across varied
situations. While the trait approach to leadership fell from favor in the late twentieth
century, more recent research has begun to again consider the explanatory power of
individual differences for predicting leadership effectiveness. One individual difference
variable that has emerged in recent years is the concept of motivation to lead (MTL)
(Chan & Drasgow, 2001). MTL is a malleable individual difference variable that affects a
person’s desire to assume leadership roles and partake in leadership development
opportunities, which in turn affect such person’s effort and persistence at taking on and
excelling in future leadership roles.

2
Chan and Drasgow’s work (Chan, 1999; Chan & Drasgow, 2001) proposes that
people possess a motivation to lead that is distally influenced by personality and cultural
factors, and more proximally influenced by leadership self-efficacy (LSE). This
individual characteristic of MTL affects people’s willingness to take on leadership roles
and training, which is then related to their overall leadership effectiveness. The quantity
and quality of these leadership experiences feed back into people’s LSE and future MTL.
While it is clear that MTL derives in part from personality and culture influences, this
motivation has a malleable component such that leadership-related training and
experiences may also impact LSE and MTL.
The purpose of this dissertation is to investigate further the experiential basis of
MTL, focusing on additional mechanisms of MTL formation. While direct leadership
experience and formal leadership training are certainly important for building LSE and
MTL, people’s observation of, and experiences with, their leaders may have an influence
on their individual LSE and MTL. Having a quality leadership role-model serves as a
learning opportunity similar to formal leadership training which may impact people’s
LSE and MTL. In addition, the benefits of this leadership role-model can be enhanced by
having a high quality leader member exchange (LMX) relationship with the leader. This
dissertation will investigate the relationship between LMX, leader behaviors, and
follower MTL; explore the outcomes related to MTL; and shed light on the relation of
MTL with leader performance.
Developing a more comprehensive view of leadership, with a focus on what
motivates an individual to want to take on leadership roles, is important from both
theoretical and practical perspectives. Leadership research and theory have often ignored

3
the motivational component of leadership, and have focused more on assessing the
qualities of good leaders. While developing an understanding of the knowledge, skills,
and abilities associated with successful leadership is certainly a worthwhile academic
endeavor, equally important is developing an understanding of why some unqualified
individuals pursue leadership roles, and why some exceptionally qualified individuals do
not. From an applied perspective, many organizations are placing an increased emphasis
on leader development, and on identifying the next cadre of high potential individuals
early on in their careers. Identifying high potential individuals is an exercise not only in
assessing qualifications, but also in determining desire. Chan and Drasgow’s (2001)
research on MTL is a first step at improving our understanding of the ‘why’ of
leadership, but it ignores the experiential mechanism of interacting with leader role
models. Developing a more comprehensive understanding of MTL by including a focus
on the impact of leaders on followers’ MTL will continue to provide answers to the
‘why’ question of leadership while also shedding light on the importance of leader-
follower relationships in the workplace. Below I present brief reviews of pertinent
leadership research along with hypothesized relationships.
Motivation to Lead (MTL)
Chan and Drasgow (2001) posit that there are non-cognitive ability constructs
such as personality traits and values that make people more or less likely to engage in
leadership related behaviors, which in turn impact their participation in more formal
leadership roles. Chan and Drasgow refer to this desire to engage in leadership roles as
the motivation to lead. People’s MTL, in combination with their ability, are the two
crucial person-based factors that influence leadership behavior. People who are motivated
4
to lead, possess the cognitive ability to do so, and find themselves in situations with
opportunities for leader emergence, will partake in leadership behaviors that will lead to
positive leader outcomes. These positive outcomes in turn will reinforce their MTL,
resulting in further leadership behavior. Conversely, those with low MTL will shy away
from opportunities to lead which in turn will result in less leadership experience that will
perpetuate the low MTL in the future.
MTL is not proposed to be an innate trait fitting into the great man theories of the
early leadership research, rather it is proposed to be a malleable individual difference
variable. Chan and Drasgow (2001), in their validation of the MTL scale, investigated the
non-cognitive antecedents of MTL. They showed that the Big Five personality traits,
along with values such as collectivism and individualism, were distal antecedents to
MTL, working primarily through an individual’s LSE. Building on the work of Bandura
(1986, 1997), LSE takes into account the experiential nature of leadership. Both positive
and negative leadership experiences provide a learning opportunity for the leader.
Positive leadership experiences help to reinforce the individual’s notion that he or she can
and should continue to lead, raising one’s LSE, which acts as a more proximal antecedent
to MTL. Conversely, negative leadership experiences can be deflating and may cause one
to question his or her leadership abilities. Thus, MTL is composed of more stable distal
antecedents including personality and values, which impact the more proximal and
somewhat fluid construct of LSE.
Chan and Drasgow (2001), borrowing from Fishbein and Ajzen’s (1975) theory of
reasoned action and Triandis’ (1980) theory of interpersonal behavior, reasoned that
MTL would best be conceptualized as a three dimensional construct comprised of

5
valences associated with the act of engaging in leadership, beliefs about outcomes of
enacting leadership behavior, and social norms regarding leadership. Similar to Myer and
Allen’s (1991, 1997) three component model of organizational commitment, Chan and
Drasgow proposed and showed through factor analytic techniques that MTL is comprised
of an affective-identity component (people lead because they want to), a noncalculative
component (people lead because there is no reason not to), and a social normative
component (people lead because it is the right thing to do). Their factor analysis on the
MTL items showed that the three factor model was indeed the better fitting model when
compared to the single factor unidimensional model.
Affective-identity MTL stems from people’s willingness to lead because of their
attitudes or affect related to leadership. When presented with the opportunity to take on
leadership roles, people who are high on affective-identity MTL assess the affective
result of taking on the leadership role. In essence, the question asked when deciding to
take on a leadership role is one of, “will this new role make me happy?” As outlined in
Chan (1999), affective-identity motivation is akin to the attitude component of Fishbein
and Ajzen’s (1975) theory of reasoned action or the affect component of Triandis’ (1977,
1980) theory of interpersonal behavior.
Social-normative MTL stems from people’s willingness to lead because of a sense
of duty or responsibility related to leadership. When presented with the opportunity to
take on leadership roles, people who are high on social-normative MTL rely on their
cultural or organizational norms with regard to leadership, and choose to lead based on
those norms. In cultures and organizations where being a leader is seen as honorable and
favored, those directed by social-normative MTL will take on leadership positions;

6
whereas in cultures and organizations were being a leader is seen in a less favorable light,
those directed by social-normative MTL will shy away from leadership roles. This social-
normative component of MTL is akin to the social norms component in the theory of
reasoned action (Fishbein & Ajzen, 1975) and the theory of interpersonal behavior
(Triandis, 1977, 1980).
Noncalculative MTL stems from a conscious evaluative process of determining
the rewards and consequences of taking on a leadership role. Noncalculative MTL can be
considered as a reverse formulation of a traditional outcome based motivation, whereby
individuals do not consider the economic gain of leading, but rather the economic loss
associated with taking on the added responsibility of leadership. Regardless, the
noncalculative component of MTL is economic in nature despite the framing of the
dimension in terms of absence of economic consideration. When presented with the
opportunity to take on leadership roles, people who are low on noncalculative MTL (and
are thus, calculative, when it comes to leadership) assess the potential rewards of
leadership (i.e., increased status, increased wealth, ability to make a difference) and
weigh those rewards against the potential costs (i.e., increased risk, increased
responsibility, potential for damaged relationships). This noncalculative component is
akin to the cognitive evaluation component present in Triandis’s (1977, 1980) theory of
interpersonal behavior. Those who are high in noncalculative MTL are not swayed by
economic gains or costs associated with leadership.
While Chan (1999) does not specifically hypothesize differential antecedents to
the three components of MTL, he notes the similarities to Meyer and Allen’s (1991)
commitment model. Chan also notes their argument that (1) affective commitment is a

7
direct result of experience and personal characteristics; (2) normative commitment is a
result of socialization practices at the cultural, familial, and organizational levels; and, (3)
continuance commitment is a result of one’s investment in the job or organization. With
regard to MTL, similar arguments should hold true. Affective-identity MTL is likely
most impacted by people’s experiences and personal characteristics. Social normative
MTL is likely a result of socialization practices at the cultural, familial and organizational
levels. While noncalculative MTL does not cleanly parallel continuance commitment, it
is expected that organizational factors (e.g., benefits, workload, etc.) for those in
leadership positions will drive noncalculative MTL.
Antecedents of MTL
Chan and Drasgow (2001) point out the importance of identifying the antecedent
variables that shape MTL in coming to a complete understanding of the construct and
how it operates. They outlined and tested five potential antecedents to MTL: general
cognitive ability, personality, values, LSE, and past leadership experience. Their findings
did not support general cognitive ability as an antecedent to MTL, but they did support
the other proposed relationships described below.
Personality traits. Chan and Drasgow (2001) discuss that the “personality trait
approach to leadership has, to a large extent equated personality traits with MTL.” Chan
(1999) points to reviews by Barrick and Mount (1991) and Hough (1992) that concluded
that personality variables were significantly related to managerial performance which can
be considered a proxy for leader performance. Given these findings, Chan and Drasgow
(2001) proposed personality traits as a distal antecedent to MTL, and tested their
hypothesis using hierarchical regression with the Big-Five personality dimensions and

8
their newly developed MTL measure. They found evidence for direct positive
relationships between extraversion with affective-identity MTL (ß = .24, p < .001,
R2=.61) agreeableness (ß = .18, p < .001, R2=.35) and emotional stability (ß = .11, p <
.001, R2=.35) with noncalculative MTL, and conscientiousness (ß = .14, p < .001, R2=.36)
agreeableness (ß = .15, p < .001, R2=.36) and extraversion (ß = .10, p < .01, R2=.36) with
social-normative MTL. Taken together, their findings support personality as a distal
antecedent to MTL.
Cultural values. Chan and Drasgow (2001) expanded their conceptualization of
distal antecedents of MTL from individual difference traits (i.e., personality and ability)
to include cultural determinants as predictors of MTL. They proposed that people’s
values would also serve as distal antecedents to MTL. Adopting Triandis’s (1995, 1998)
two dimensional conceptualization of culture, with a dimension representing
individualistic versus collectivistic orientation and a dimension representing vertical or
hierarchical versus horizontal orientation, they again tested their hypothesis using
hierarchical regression. They found evidence for a direct positive relationship between
vertical individualism (i.e., valuing personal achievement and competition) and affective-
identity MTL (ß = .12, p < .001, R2=.61). With regard to noncalculative MTL, they found
collectivist values (both vertical and horizontal) were positively related (ß = .23 and .09,
p < .01, R2=.35) and individualist values (again both vertical and horizontal) were
negatively related (ß = -.18 and -.09, p < .01, R2=.35). Finally, social-normative MTL
was positively related to vertical or hierarchical values (both individualist and
collectivist) (ß = .11 and .17, p < .001, R2=.36) and negatively related to horizontal
9
collectivism (i.e., valuing harmony and equality) (ß = -.11, p < .001, R2=.35). Taken
together, these finding suggests cultural values act as distal antecedents to MTL.
LSE. A more proximal antecedent to MTL proposed by Chan and Drasgow (2001)
is the concept of self-efficacy, or more specifically LSE. Self-efficacy is “the belief in
one’s capabilities to organize and execute the course of action required to manage
prospective situations” (Bandura, 1995, p. 2). LSE refers to the belief in one’s abilities to
function effectively and overcome obstacles in leadership roles. Given the widespread
consistent support of self-efficacy as a cognitive determinant of behavior (Stajkovic &
Luthans, 1998), they hypothesized LSE as a proximal antecedent to MTL. Using the
same analysis, they found that LSE was positively related to both affective-identity MTL
(ß = .40, p < .001, R2=.61) and social-normative MTL (ß = .17, p < .001, R2=.36), but was
not related to noncalculative MTL.
Past leadership experience. Finally, Chan and Drasgow (2001) proposed past
leadership experience as a semi-distal antecedent to MTL. They considered this semi-
distal in that it is more proximal than personality and values, but can have an impact on
LSE as a feedback loop and thus is not as proximal as LSE. Citing Fiedler and Garcia’s
(1987) cognitive resource theory of leadership which suggests that a leader’s past work
experience can have a significant impact on the performance of a leader and of his or her
group, Chan and Drasgow (2001) hypothesized that the quality and quantity of past
leadership experience has a direct path to MTL. Similar to the findings with LSE, past
leadership experience was only found to be positively related to affective-identity (ß =
.25, p < .001, R2=.61) and social-normative MTL (ß = .15, p < .001, R2=.36) and not to
noncalculative MTL.

10
LSE as a mediator between distal antecedents and MTL. In addition to the direct
paths proposed by Chan and Drasgow (2001) from both distal and proximal antecedents
of MTL, they also proposed indirect paths through LSE. Social cognitive beliefs, in this
case LSE or belief in one’s ability to lead, can be treated as more proximal explanations
of individual traits (Langston & Sykes, 1997). While they did not propose specific cases
of LSE mediating relationships between specific distal antecedents and the components
of MTL, they hypothesized the potential for mediation in the model. The results of their
studies suggested these indirect mediation paths existed between the distal antecedents of
extraversion, conscientiousness, and past leadership experience, and the affective-identity
and social-normative components of MTL. In addition, LSE mediated the relationship
between openness to experience and affective-identity MTL.
Observed leadership as a proposed new antecedent to MTL. Along with the
antecedents mentioned above and proposed by Chan and Drasgow (2001), it appears
possible that, in addition to LSE achieved through personal leadership successes and
failures, an individual may indeed also be impacted through an observational mechanism.
This observational mechanism could result from the positive experiences of having a high
quality relationship with an effective leader. Individuals not only learn through the
experiences of their own successes and failures, but they also learn through the successes
and failures of those around them, particularly those they regard as role models. In the
context of leadership, one’s direct supervisor serves as a primary role model with regard
to leadership behavior. Given the strong emphasis placed on LSE in the understanding of
MTL, it seems appropriate to further investigate additional means by which LSE is
developed and maintained. Research investigating the “cascading effect” of leadership

11
(Bass, Waldman, Avolio, & Webb, 1987) can be applied to MTL to provide further
explanation of how this motivation develops and is nurtured.
The Cascading Effect of Leadership
At the heart of Chan and Drasgow’s (2001) MTL model is LSE, or the belief that
one can enact the behaviors to succeed in a leadership role. This concept of self-efficacy
lies at the heart of Bandura’s (1986) social learning theory. According to Bandura, self-
efficacy can arise through four mechanisms: mastery experiences, social modeling, social
persuasion, and psychological responses. First, people can develop self-efficacy through
mastery experiences or through their own successful performance of tasks, and,
conversely, self-efficacy may be diminished following failed experiences. Second,
individuals can develop self-efficacy through social modeling or through the observation
of other people’s success in completing tasks. Third, people can develop self-efficacy
through social persuasion, or through positive reinforcement from others that one can
succeed at completing the task. Finally, self-efficacy can be shaped through an
individual’s psychological responses to situations. Feelings of stress or nervousness may
serve to diminish one’s self-efficacy, whereas feelings of excitement or anticipation may
boost one’s self-efficacy.
Chan and Drasgow’s model of MTL focuses primarily on mastery experience and
its impact on LSE. Their model reflects the feedback process of taking part in leadership
experiences, and the impact those experiences have on LSE and motivation to take on
additional leadership roles. Mastery experiences may be a primary mechanism in the
development of LSE and MTL. However, when direct leadership experience is limited or

12
absent, it seems important to consider additional mechanisms from which LSE can arise.
The observational mechanism proposed by social learning theory is a plausible candidate.
In addition to building LSE through direct behavior and reinforcement following
the mastery path, individuals can learn leadership behavior and develop LSE through the
observations of the behaviors of others. While the observed role model can certainly be
anyone in an individual’s life, one’s immediate supervisor will serve as a direct and
salient role model for leadership behavior. The notion that an immediate supervisor can
serve as a role model is supported by previous research (e.g., Gerstner & Day, 1997; Lord
& Brown, 2004) which proposed that work supervisors and their behaviors are salient
cues for followers in organizations.
Existing leadership research has focused on the direct supervisor as a role model
for followers. For example, Bass, Waldmen, Avolio, and Bebb (1987) investigated the
“cascading effect” of transformational leadership. Specifically, they found that
transformational leadership behaviors cascaded like “falling dominoes” where
transformational behaviors displayed at higher levels of management are similarly
displayed at lower levels of management. Mayer, Kuenzi, Greenbaum, Bardes, and
Salvador (2009) also looked at this cascading effect in the context of ethical leadership,
its impact on followers’ counterproductive work behaviors (CWBs), and organizational
citizenship behaviors (OCBs). Mayer et al., found that ethical behaviors performed by
upper-level management were related to the performance of CWBs (ß = -.31, p < .001)
and OCBs by the followers of upper-level managers (ß = .44, p < .001). The effects of
upper-level managers’ ethical behaviors on followers’ CWB and OCB were mediated by
supervisory ethical leadership. The authors suggest that social learning theory is a “useful

13
theoretical lens” through which to view their results in the passing down of ethical
behaviors. Both studies suggest a modeling or observational process by which individuals
observe the behaviors of their direct supervisors, and that, in turn, lead to a change in
behavior of the individuals.
It is expected that, in addition to gaining LSE and MTL by having positive
leadership experiences as currently represented in Chan and Drasgow’s (2001) model
(see Figure 1),1 there is also an observational mechanism to developing and maintaining
LSE and MTL whereby individuals observe successful leadership others. In short, it is
expected that having a high quality, close relationship with a direct supervisor who is
perceived to be an effective leader will result in increased LSE and MTL. In order to
fully formulate this hypothesis, it is important to first consider the importance of having a
high quality leader.
Figure 1 – Portion of Chan and Drasgow’s (2001) MTL model
1 Chan and Drasgow’s (2001) model of MTL is more expansive and includes cognitive ability and domain specific knowledge as additional precursors to leadership performance. In addition, the concept of leader performance is presented in the context of acquiring the skills and experiences needed to be a successful leader. This is different from leader performance conceptualized as leader effectiveness, which is the approach this research agenda takes.

14
Relationship of Observed Leadership with MTL
As previously stated, it is expected that in addition to the traditional leadership
mastery path whereby direct leadership experience leads to an increase in LSE and MTL,
there is also an observational mechanism at work whereby LSE and MTL can be
impacted by experiencing the positive leadership of others, specifically one’s direct
supervisor. Bandura (1986, 1988) discusses two means by which social modeling can
affect people’s self-efficacy. First, an effective model displays beneficial strategies for
managing difficult situations. Having knowledge of alternative and effective strategies
builds one’s confidence that he or she can perform in similar difficult situations. Second,
self-efficacy beliefs are impacted through the social comparison process whereby
observing similar individuals succeed in their endeavors helps to raise one’s belief that he
or she can succeed in similar endeavors. Certainly, if the skill level of the observer and
the model are vastly different, this social comparison may be de-motivating or
detrimental to one’s self-efficacy. However, in an organizational context where the skill
level and backgrounds of direct supervisors and followers are often not so disparate, this
social comparison is expected to be self-efficacy enhancing in nature. Interacting with a
supervisor that effectively displays leadership behaviors will serve as a role model for
enacting similar leadership behaviors, and serve to increase one’s confidence in
successfully engaging in those behaviors. This leads to the following hypothesis
regarding leader effectiveness and LSE:
Hypothesis 1: Employees’ perceptions of their direct supervisor’s leadership
effectiveness will be positively related to their own LSE.

15
Similarly it is expected that this observational mechanism will have an impact on
an individual’s MTL, and that this impact will be different depending on the component
of MTL. Given the similarities between the three component model of commitment
(Meyer & Allen, 1987, 1991) and the three component conceptualization of MTL, a
similar pattern of antecedents is expected. Allen and Meyer (1990) argued and provided
evidence that affective commitment was a direct consequence of work experiences and
personal characteristics. As previously stated, the behaviors supervisors enact are salient
organizational cues. Perceiving one’s supervisor as effective is a positive work
experience in the realm of leadership that will serve to enhance the affective-identity
component of MTL. This is similar to the way that positive work experiences enhance
affective commitment to one’s organization. Allen and Meyer argued that the normative
component of commitment was driven by an individual’s socialization experiences
(familial and cultural factors) and his or her experiences within the organization.
Interaction with, and observation of, one’s supervisor is a key component of that
organizational socialization. In essence, observing this positive behavior in one’s
supervisor serves to establish and/or reinforce the organizational norms associated with
being a successful leader, which serves as an antecedent to the social-normative
component of MTL. Finally, Allen and Meyer argue that the antecedents to continuance
commitment are rooted in the economic evaluation of investments and alternatives. While
it is certainly possible that one may observe the rewards and consequences of effective or
ineffective leadership from one’s direct supervisor, the contingencies are set at the
organizational level regardless of the perceptions of one’s supervisor’s effectiveness. The
economic incentives or consequences related to taking on a leadership position are

16
largely driven by the organizational context and not by the perceived effectiveness of
one’s supervisor. Some organizations may be very good at rewarding effective leadership
and punishing ineffective leadership, while other organizations may not be as successful.
The economic evaluation has less to do with the effectiveness of one’s leader and more to
do with the contingencies put into place by one’s organization, and the individual’s
orientation toward external rewards as a motivator. This leads to the following
hypotheses regarding leader effectiveness and MTL:
Hypothesis 2a: Employees’ perceptions of their direct supervisor’s leadership
effectiveness will be positively related to their own affective-identity MTL.
Hypothesis 2b: Employees’ perceptions of their direct supervisor’s leadership
effectiveness will be positively related to their own social-normative MTL.
Leader Member Exchange (LMX)
To this point, the discussion of developing LSE and MTL by observing one’s
direct supervisor has been limited strictly to the behaviors or perceived leadership
effectiveness of the supervisor. If subordinates perceive that their supervisors are
effective, it was hypothesized that this has a positive relationship with followers’ LSE
and MTL. When considering this observational mechanism, it is important to not just
consider the perceived effectiveness of the supervisors, but also the quality of the
supervisor. One supervisor may oversee several individuals and may have very different
relationships with each subordinate. It is expected that the benefits of observing an
effective supervisor will be stronger in a closer more meaningful relationship than it will
in a more distant, detached relationship. While much of leadership research is focused on
characteristics of the leader or the situational constraints placed on the leader, leader

17
member exchange (LMX) focuses the lens on the quality of the relationship between the
leader and the follower.
LMX has become a popular leadership theory in the past 30 years due to its
hypothesized relationships between leader processes and leader outcomes (Gerstner &
Day, 1997). At the time of its inception in the early 1970s by Graen and colleagues
(Dansereau, Cashman & Graen, 1973; Dansereau, Graen, & Haga, 1975; Graen, 1976;
Graen & Cashman, 1975), LMX represented a break from the more traditional leadership
research that focused on the characteristics of the leader or on the constraints of the
situation. Instead, LMX was one of the first leadership theories to focus on the
relationship element of leadership and the fact that all leadership relationships are not
created equal. The same leader may have very different relationships with each of the
individuals with whom he or she interacts. LMX also takes into account the evolutionary
nature of the leader follower relationship in that relationship trust is fostered over time.
The leader follower relationship evolves over time (Graen, 1976) with mutually
beneficial exchanges resulting in more mature developed relationships. While LMX is
likely related to perceptions of leader effectiveness, LMX is a distinct construct.
The research on LMX generally supports a positive relationship among LMX
quality, performance, and attitudinal outcomes, especially with regard to the follower
(Gerstner & Day, 1997). In their meta-analysis of LMX, Gerstner and Day (1997)
enumerate the research findings regarding the positive outcomes associated with LMX:
high performance ratings (e.g., Liden, Wayne, & Stilwell, 1993), better objective
performance (e.g., Graen, Novak, & Sommerkamp, 1982; Vecchio & Gobdel, 1984),
higher overall satisfaction (e.g., Graen, Novak, & Sommerkamp, 1982), greater
18
satisfaction with supervisor (e.g., Duchon, Green & Taber, 1986), stronger organizational
commitment (e.g., Nystron, 1990), and more positive role perceptions (e.g., Snyder &
Bruning, 1995). Their meta-analytic findings support the positive relationship between
LMX relationship quality and follower outcomes.
It is expected that the quality of the LMX relationship will have an impact on the
observational mechanism discussed above and outlined in Hypotheses 1 and 2. LMX
quality will moderate the strength of the relationships described above, such that
followers with stronger LMX relationships will experience a greater impact of leader
effectiveness on their LSE and MTL. With regard to LSE, having an effective leader can
impact follower effectiveness via two mechanisms: observing effective strategies, and
social comparisons to similar others. In both cases, a closer relationship is likely to
enhance the positive effects of leader effectiveness on the LSE of the follower. Having a
closer relationship will result in increased interactions, and concomitantly, increase the
likelihood of observing effective strategies for dealing with difficult situations. A closer
relationship will also facilitate the observational mechanism by increasing perceptions of
similarity, and by increasing the opportunity to observe leadership successes. This leads
to the following hypothesis regarding the moderating role of LMX on the relationship
between leader effectiveness and follower LSE.
Hypothesis 3: Leader member exchange (LMX) will moderate the positive
relationship between perceived supervisors’ leadership effectiveness and
subordinates’ LSE, such that the relationship will be stronger when the quality of
LMX is high versus low.

19
Similarly it is expected that high quality LMX will have an enhancing effect on
follower MTL. In the case of both affective-identity MTL and social-normative MTL, it
was proposed that effective leadership was a salient organization cue. With regard to
affective-identity MTL, the effective leader serves to create positive experiences for the
follower. Having a high quality relationship with one’s supervisor increases the
likelihood of experiencing these effective leader behaviors and the likelihood of the
follower perceiving these interactions as positive experiences. With regard to social-
normative MTL, the effective leader serves as a model of the organizational norms
related to leadership. Having a high quality relationship with one’s supervisor increases
the likelihood of observing the effective leader and the likelihood of interpreting the
effective leader’s behaviors as norms representing the organization. This leads to the
following hypotheses regarding the moderating role of LMX on the relationships between
leader effectiveness and follower MTL.
Hypothesis 4a: Leader member exchange (LMX) will moderate the positive
relationship between perceived supervisors’ leadership effectiveness and
subordinates’ affective-identity MTL, such that the relationship will be stronger
when the quality of LMX is high versus low.
Hypothesis 4b: Leader member exchange (LMX) will moderate the positive
relationship between perceived supervisors’ leadership effectiveness and
subordinates’ social-normative MTL, such that the relationship will be stronger
when the quality of LMX is high versus low.

20
A Competency Based View of Leadership Effectiveness
One difficulty in studying leadership is pinpointing the criteria for measuring
successful leadership. In an applied context, a proxy for successful leadership may be the
effectiveness of the group one is leading. However, this is obviously confounded with a
number of factors related to the skill and ability of team members. In short, a poorly led
group of individuals may be very successful, and, conversely, an extremely well-led
group may flounder. In general, the study of leadership separates performance criteria
into two categories: leader effectiveness and leader emergence (Lord et al., 1986). As
noted by Judge, Bono, Ilies, and Gerhardt (2002) leader emergence is more of an
assessment of who is leader-like, and is generally an assessment made by individuals who
have limited information regarding leader performance. Leader emergence is often used
as a leader criteria in experimental settings just for that reason, as individuals are often
working in low fidelity leader simulations where limited performance information is
present and a more heuristic assessment of who is leader-like is an appropriate leader
criteria. Leadership effectiveness, however, is less focused on perceptions of leadership
but is focused, rather, on the observable behaviors enacted by the leader toward the goal
of influencing or guiding the group’s activities toward a successful end (Judge et al.,
2002). In the context of real world applied research consisting of long-term established
relationships, which is the case with MTL research, it would seem that a behavioral
leadership effectiveness approach is appropriate for understanding leadership
performance and assessing success as a leader.
Over the last 20 years, the U.S. Office of Personnel Management has conducted
extensive research identifying the competencies related to successful leadership in the

21
federal government context (Hillery et al., 2003). These competencies encompass the
specific leadership behaviors that can be used to evaluate leadership success. Rooted in
the framework identified by Howard and Bray’s (1988) study of successful managerial
performance at AT&T, Corts and Gowing (1992) identified 26 primary and 10 ancillary
dimensions of leadership. These dimensions served as the bases for Gregory and Park’s
(1992) study of leadership effectiveness. They surveyed nearly 8,000 federal executives,
managers and supervisors, eliciting the importance of each competency toward effective
job performance in a leadership position. The resulting leadership competency model was
later updated, leveraging a study conducted by Eyde et al. (1999), in which subject matter
experts participated in focus groups to discuss the behaviors related to effective
managerial performance. The resulting competency model is comprised of 28 leadership
competencies consisting of behaviors that are related to leadership effectiveness at all
levels of supervision. These competencies and their definitions are listed in Appendix A.
The OPM Leadership Competency Model represents an exhaustive categorization of
leadership behaviors that are exhibited across the entire range of job roles in the federal
government. Since many of these competencies are only required in specific job roles,
only those competencies that are universal in nature will be used for the purposes of
hypothesis testing. The following 13 competencies will be used to evaluate leadership
effectiveness: accountability, conflict management, creativity and innovation,
decisiveness, developing others, flexibility, integrity and honesty, interpersonal skills,
oral communication, problem solving, resilience, team building, and written
communication.

22
Relationship of MTL to Leadership Criteria
In addition to investigating the observational mechanism for enhancing self-
efficacy and MTL, it is important to continue to assess the outcomes associated with a
motivated leader. To this point, relatively little research has investigated the positive or
negative consequences of having a strong MTL. It would certainly seem intuitive that a
motivated individual who has the requisite abilities to perform as a leader will be more
successful as compared to someone who lacks that motivation. But as discussed earlier,
the criteria for successful leadership is not always clear cut.
Chan and Drasgow’s (2001) conceptualization of MTL as it relates to leadership
outcomes was more focused on behavioral indicators of leadership potential rather than
behavioral indicators of leadership success. Their model was more focused on proximal
criteria related to MTL, such as an individual’s willingness to take on leadership training
or leadership positions. Their research, however, did not address the likelihood of success
in those leadership roles as a function of MTL. While they did address leadership
potential, which is more reflective of leader emergence than leader success, the more
distal outcome of MTL, actual success as a leader, was not examined. In their sample of
Singaporean military students, leadership potential ratings were collected from a panel of
raters as part of a three-day assessment center during the cadets’ basic training, and again
were collected from their direct supervisor at the end of the three-month basic training.
The assessment center was part of the cadets’ officer selection system, and as such,
represented a test of maximal performance. The supervisory assessment at the completion
of basic training covered the entire three-month period, and as such, represented a test of
typical performance.
23
Chan and Drasgow’s (2001) findings were consistent across the two measures of
leadership potential. In both the assessment center rating representing maximal
performance and the overall rating of performance in the basic training representing
typical performance, MTL added significant incremental validity in the prediction of
leadership potential above that of other measures such as cognitive ability, past
leadership experience, LSE, and personality variables ( R2 ranging from .01 to .16).
Looking at the three components of MTL separately, they found that affective MTL and
noncalculative MTL were both significantly predictive of leadership potential rating
above cognitive ability in both scenarios (assessment center and overall basic training
rating) with ß ranging from .08 to .13, p < .05. Social-normative MTL did correlate with
the leadership potential criterion in the expected direction, but did not contribute unique
variance to its prediction given the other predictors. Chan and Drasgow (2001) explain
these findings by stating that observers find individuals that enjoy leading, or that lead
with little concern for reward, to have more leadership potential. They state that “merely
having a sense of duty or social obligation to lead may be insufficient to convince others
that one has the potential to lead” (Chan & Drasgow, 2001; p. 494).
While this study provides some predictive validity evidence for MTL, the specific
nature of the sample (Singaporean military students), and the limited scope of the criteria
(leadership potential ratings as opposed to a more robust assessment of actual leadership
skill or behavior), necessitate more investigation into the predictive validity of MTL.
Hendricks and Payne (2007), in their study of goal orientation and leadership
effectiveness, extended the research on the relationship of MTL to leadership outcomes.
They investigated goal orientation, MTL, and leadership effectiveness in a lab setting

24
with teams of four undergraduates completing an experimental task involving building
products and maximizing their profits. One of the four individuals was randomly
assigned to act as the team leader in the task. They utilized two measures of leadership
effectiveness. First, team members assessed the leaders’ overall effectiveness and a
consensus score was calculated across the three rating members. Second, an objective
assessment of task success was used (overall profits in the experimental task). They
hypothesized positive relationships between each form of MTL and leader effectiveness.
Consistent with their hypotheses and with the findings of Chan and Drasgow (2001),
there was a significant and positive relationship between noncalculative MTL and
leadership effectiveness, as measured by the subjective assessment by team members of
leader effectiveness (ß = .23, p < .05). While not significant, the authors characterize the
relationship between affective MTL and subjective ratings of leader effectiveness as
approaching significance. Surprisingly, while not significant, the relationship between
social-normative MTL and subjective assessments of leadership effectiveness was
negative, such that those who were high in social normative MTL received lower
leadership effectiveness ratings. There were no significant relationships between
measures of MTL and the objective performance of groups on the experimental task.
While Hendricks and Payne’s (2007) study provides preliminary evidence
regarding the relationship between MTL and leader effectiveness, the low fidelity and
contrived nature of their experiment involving undergraduate students may not generalize
to work settings. To truly understand effective leadership and the effects of MTL on the
specific leadership behaviors that relate to effective leadership, a more ecologically valid
assessment of leadership in a field setting is in order. While the research on the

25
relationship between MTL and leadership outcomes is scant, in both cases (Chan &
Drasgow, 2001, with their assessment of the leadership outcome of leader potential and
Hendricks & Payne, 2007, with their assessment of the leadership outcome of leader
effectiveness), positive relationships were hypothesized between each component of
MTL and the leadership outcome. The surprising findings with regard to social-normative
MTL and leader outcomes could be a function of the subjective assessments involved
with both studies. In the case of Chan and Drasgow (2001), the assessments were of
leader potential which would not necessarily relate to leader effectiveness. In the case of
Hendricks and Payne (2007), the assessments were of leader effectiveness in a very
limited exercise, where perceptions of personality and leadership style may have colored
the assessment of effectiveness beyond the actual leadership skills being displayed.
A potential explanation for the past findings with regard to the link between the
various components of MTL and job performance may lie in the tenets of self
determination theory (Deci & Ryan, 1985), and the differential motivational power of
intrinsic versus extrinsic motivators. Self determination theory distinguishes between
autonomous motivation and controlled motivation, with a continuum ranging from purely
autonomous motivation (i.e., intrinsic motivation or doing something because one wants
to and derives pleasure and interest by doing so) to strictly controlled (i.e., extrinsic
motivation arising from contingent rewards or doing something because doing so will
result in money). Placing the three components of MTL along this continuum can shed
light on their relation to overall leadership performance, and potentially explain the past
research findings. Affective-identity MTL is clearly autonomous in nature and is the
intrinsic motivation because one enjoys leading. Noncalculative MTL is focused on the

26
rewards and/or lack of consequences associated with leadership, and is, therefore
controlled in nature. Social-normative MTL is not as easy to classify, but given the self-
determination continuum (Gagne & Deci, 2005), it appears that norms would be
considered introjected regulation, which is slightly more autonomous than purely
controlled external motivation, but still more on the controlled end of the continuum.
According to cognitive evaluation theory (Deci, 1971; Deci & Ryan, 1980), extrinsic
rewards can serve to reduce feelings of autonomy and thus undermine intrinsic
motivation. Given that affective-identity MTL is more related to intrinsic motivation, and
social-normative and noncalculative motivations to lead are more related to extrinsic
motivation, it is expected that affective-identity MTL will have a stronger relationship to
leader performance than social-normative and noncalculative MTL.
Given the previous research linking MTL with leader effectiveness and the
theoretical explanations provided above, this study will further investigate the following
hypothesis:
Hypothesis 5a: Employees’ affective-identity MTL will be positively related to
their leadership effectiveness.
Hypothesis 5b: Employees’ social-normative MTL will be positively related to
their leadership effectiveness.
Hypothesis 5c: Employees’ noncalculative MTL will be positively related to their
leadership effectiveness.
Hypothesis 6: The relationship between MTL and leadership effectiveness will be
strongest for affective-identity MTL.

27
Summary of Proposed Study
This dissertation will further the extant research on the construct of MTL. What
little research there is on MTL has, to date, investigated the measurement and antecedents
of MTL. The primary method of developing MTL is through mastery in leadership
experiences and training, which serves as a feedback loop fostering stronger LSE and
increased MTL. This dissertation will investigate a secondary method, which involves
observing and enacting the effective leadership behaviors experienced through a role
model in a high quality leader-follower relationship. This research will also advance the
understanding of the outcomes associated with MTL by focusing on the impact of MTL
on individual leader effectiveness. To date, the little research regarding MTL and
outcomes has been focused on leader emergence or subjective assessments of leader
potential. This research will serve as a first investigation into the impact of MTL on
leader effectiveness measured using 360 ratings on key leadership behaviors.

28
Chapter 2: Method
Participants
360 participants. Employees already participating in the U.S. Office of Personnel
Management’s Leadership 360 were asked to participate in this study. Their participation
was completely voluntary and they were informed that any additional data collected for
the purposes of this study would not be shared with anyone from their organization. Data
were collected from 226 individuals.
360 raters. Those participating in the OPM Leadership 360 assessment solicited
ratings from workers whom they consider to be their supervisor, peers and subordinates.
There were no added measures for individuals providing ratings, and as such, the 360
assessment procedure for raters remained identical to any other leadership 360
assessment conducted by OPM.
Measures
MTL. Chan and Drasgow’s (2001) 27 item Likert based scale was used to measure
MTL. In their initial study utilizing three samples, the scales, consisting of 9 items
measuring each of the three MTL dimensions (affective-identity, social-normative, and
noncalculative) showed relatively high internal consistency with as ranging from .91 to
.94 for affective-identity MTL, .80 to .84 for noncalculative MTL, and .65 to .75 for
social-normative MTL. Coefficient alphas for the current study can be found in Table 1.
A list of items can be found in Appendix C.

29
LSE. Paglis and Green’s (2002) LSE scale was used. The scale consists of 12
items, with 4 items measuring self-efficacy with regard to setting group direction, 4 items
measuring self-efficacy with regard to gaining group member commitment, and 4 items
measuring self-efficacy with regard to overcoming obstacles. Reliability of the three LSE
sub-scales ranges from a = .86 to .92 with a total LSE scale reliability of a = .92. The
coefficient alpha for the current study can be found in Table 1. A list of items can be
found in Appendix C.
LMX. The LMX-7 (Graen et al., 1982) was used to assess follower perceptions of
the LMX relationship. Previous research has suggested that the LMX-7 provides the
soundest psychometric properties of available LMX measures (Gerstner & Day, 1997). In
their meta-analysis, Gerstner and Day (1997) reported a mean alpha of .89 for this
measure. The coefficient alpha for the current study can be found in Table 1. A list of
items can be found in Appendix C.
Leadership competencies. The United States Office of Personnel Management’s
Leadership 360 assessment was used to collect participant leadership performance
criteria. OPM’s Leadership 360 is a multi-source rating device created to assess OPM’s
Leadership Model which was first developed in the early 1990s (Corts and Gowing,
1992), leveraging the framework from Howard and Bray’s (1988) seminal study of
dimensions of successful managerial performance at AT&T. This 100 item measure taps
into 28 leadership competencies and is administered to the participants, their direct
supervisor, self-identified peers, and self-identified subordinates. Competency scores are
calculated using a weighted average in which each supervisory ratings receive 1/3 of the
weighting toward the all-rater score, the average of all peer ratings receive 1/3 of the

30
weighting toward the all-rater score, and the average of all subordinate ratings receive 1/3
of the weighting toward the all-rater score. The OPM Leadership 360 is administered as a
strictly developmental assessment, and the individual results were only shared with the
participant receiving the assessment. The developmental nature of the OPM Leadership
360 reduces the likelihood of participants selecting raters that will inflate their ratings,
and increases the likelihood of raters providing frank and honest ratings. The OPM
Leadership 360 has been administered to over 17,000 participants with over 162,000 total
ratings. Coefficient alphas for the 28 leadership competencies range from .78 to .96
(Hillery et al., 2003). Coefficient alphas for the 28 competencies, broken out by rating
source for the current study, can be found in Table 2. A listing of the 28 leadership
competencies and their corresponding definitions can be found in Appendix A. A list of
items can be found in Appendix B.
Perceived supervisor leadership effectiveness. Participants were asked to
complete a partial leadership competency assessment for their direct supervisor (the
individuals they self-identified to complete the leadership portion of their 360
assessment). Only the 13 competencies identified as being universal in their value to
assessments of leadership were rated in order to minimize the additional burden on those
participating in the assessment. In addition, to minimize survey length single item
measures were administered for each competency, and the respondents were asked to rate
their supervisors overall effectiveness from very ineffective to very effective for each
competency. The 13 item measure of perceived supervisor leadership effectiveness on the
competencies was aggregated to produce a single overall rating of perceived supervisor

31
leadership effectiveness. The coefficient alpha for this scale can be found in Table 1. A
list of items can be found in Appendix C.
Control variables. Given the importance of past leadership experience as an
antecedent of LSE and MTL, it is important to control for past leadership experience
when testing the unique contribution of the effects of LMX and perceived supervisor
leadership effectiveness on follower LSE and MTL. A single item measure asking
participants to indicate how long they have been in a formal leadership position was used.
Procedure
Since this study leverages the existing OPM Leadership 360 process, the
procedure for conducting this research followed closely to the existing process for
administering the assessment. Participants were generally recruited by their agency to
participate in the leadership 360 assessment as part of an agency-sponsored leadership
development class and were run through the assessment as a cohort. In some instances,
the 360 assessment was offered on a more ad hoc basis, and was not tied to a specific
agency-run course. Regardless of the context in which the leadership 360 assessment was
offered, the procedure for conducting the assessment was identical.
Once participants were identified by their agency to take part in a leadership 360,
a one hour 360 orientation session was delivered either in person or via teleconference.
During such a session, the purpose of 360 assessments was reviewed, the OPM
leadership model was outlined, the participants were instructed of their role in the process
of the assessment, and the participants were provided the opportunity to ask questions
regarding the assessment and process. In addition, participants were instructed about the
research portion related to this particular study and advised that their participation in the
32
research portion of the study was strictly voluntary. Shortly after the orientation session,
individuals were sent email notifications with instructions for launching the 360
assessment.
Participants thereafter received an email with instructions and a link for accessing
the 360 assessment secure survey website. Once logged into the site, participants
identified individuals for providing 360 leadership feedback. They were instructed to
enter the name, email address, and relationship type for their direct supervisor, and at
least 3 subordinates, and at least 3 peers and that all raters should be able to assess their
leadership capabilities. It was suggested that only individuals who have known the
participant for at least 6 months should be chosen to complete the assessment. Once
participants completed and saved their list of participants, they clicked a notification
button that generated and sent instruction emails to their identified raters. This officially
began the assessment period for the participant. The assessment period generally lasted
three to four weeks, with extensions as needed.
During the assessment period, participants completed their self assessments and
raters completed their assessments on the participants. All assessments were completed
online using the account access information provided in the notification emails. All
assessments were identical and included the 100 prescribed items (98 close-ended
behavioral frequency rating items and 2 open-ended items). After completing the required
self-assessment, participants were directed to the optional research only portion of the
assessment where they were provided with the additional measures (MTL, LMX, and
perceived supervisor leadership effectiveness).
33
Once the 360 assessment period was closed, individual reports were produced.
Before distributing reports, a one hour group feedback session was conducted either in
person or via teleconference to review the 360 process, discuss group trends and
comparisons to government-wide benchmarks, and explore the best approach for
understanding the data presented in the individual feedback reports. After the group
feedback session reports were either distributed personally or electronically via email.
Data Cleaning
Prior to any analysis, the data was cleaned of any and all identifying information
to preserve the confidentiality of those choosing to participate in the research portion of
the 360 assessment. In addition, only the assessments of participants who completed the
full research portion of the assessment, where they provided responses to the MTL, LMX
and perceived supervisor leadership effectiveness items, were included in the analysis. If
individual responses to a scale were omitted, then data was preserved. However if an
entire scale was left incomplete the scale score was not imputed. Less then 1% of all
possible responses were left blank.
Scoring
Scoring for the research only scales (MTL, LMX, perceived supervisor leadership
effectiveness, LSE) followed the standard practice of calculating a mean for all items on
the scale in question. For the perceived supervisor leadership effectiveness items, which
measure the 13 core competencies, averages were calculated for each competency and an
overall supervisory leadership effectiveness average was calculated based on the mean of
all competency scores.

34
Scoring of the 360 leadership assessment, which was used to determine an overall
participant leadership performance score and individual competency scores for each of
the 28 core competencies, followed the standard OPM scoring procedure. Competency
scores were calculated using a weighted mean approach such that the supervisory rating
was weighted 1/3, the peer rating was weighted 1/3 and the subordinate rating was
weighted 1/3. The ratings for each rating group were a simple average of the scores
across all raters averaged across all items for a given competency. Consistent with the
OPM 360 assessment scoring and existing research on 360 assessments (Conway &
Huffcutt, 1997; Harris & Schaubroeck, 1988; Attwater, 1988), the self-assessment was
not used in the calculation of the overall or individual competency scores as this rating
has been shown to be the least accurate. Harris and Schaubroeck (1988) found a high
correlation between supervisor and peer ratings (.62), while Conway and Huffcutt
extended these findings by suggesting that only self ratings are significantly divergent to
warrant exception. Atwater (1998) suggests the disparity in self versus other (supervisor,
peer, and subordinate) ratings are likely caused by biases that affect self-ratings. While
the self rating component of 360 assessment is a valuable self-reflection and voice
component in the assessment process, consensus suggests that aggregating scores across
rater groups excluding self ratings is the appropriate scoring approach (Anderson,
Krajewski, Goffin & Jackson, 2008).
In addition to calculating an overall leadership performance score averaging
across the 28 leadership competencies, the OPM Leadership 360 model provides for a
logical breakdown of the 28 leadership competencies into a conceptual framework of
fundamental competencies, and five additional logical groupings of competencies aligned
35
around the type of focus a leader’s position might require. This Executive Core
Qualification (ECQ) model categorizes the 28 leadership competencies according to the
type of leadership being enacted. This model is the foundation for selecting individuals
into leadership positions and for evaluating performance at the executive level. The ECQ
model breaks the 28 leadership competencies into the following leadership areas:
fundamental leadership competencies, competencies associated with leading change,
competencies associated with leading people, competencies associated with driving
results, competencies associated with business acumen, and competencies associated with
building coalitions. Classification of competencies into their ECQ groupings can be
found in Appendix A. ECQ scores were also calculated by averaging the component
competencies, and were used as more specific, targeted measures of leadership
performance.
36
Chapter 3: Results
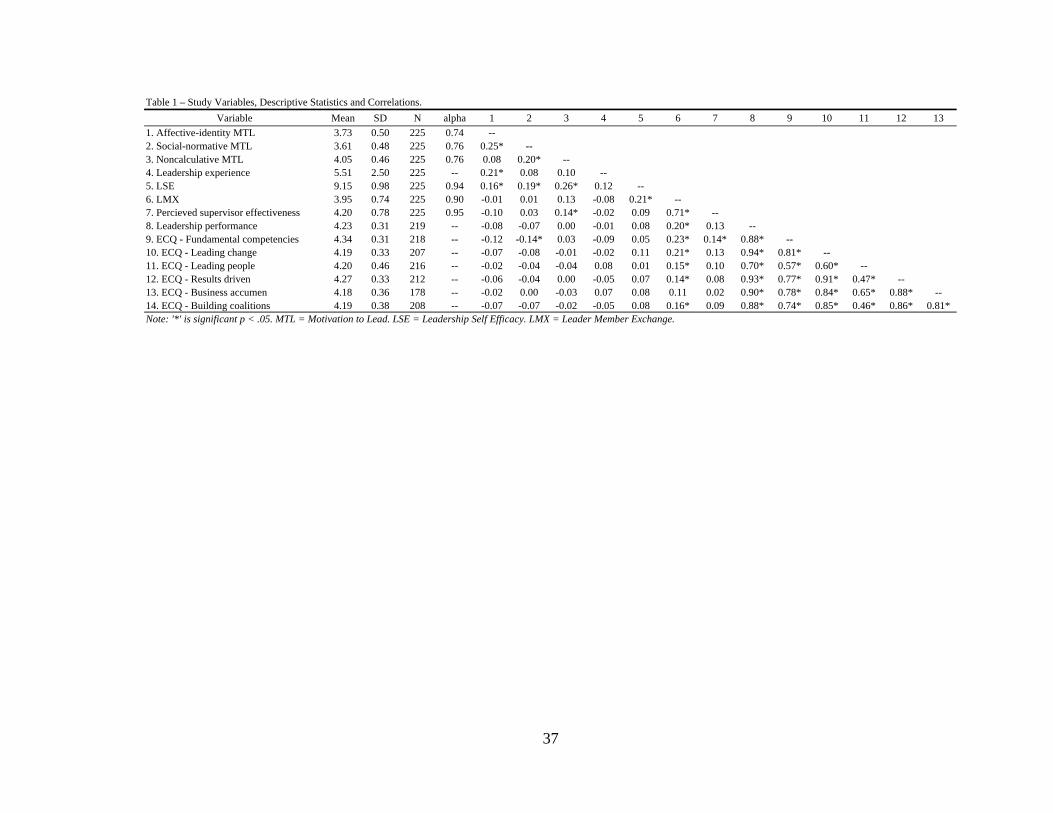
A total of 225 individuals completed the supplemental leadership motives survey,
of which 220 had corresponding OPM Leadership 360 assessments. The sample was
predominantly female (60%), and fairly tenured with respect to leadership experience,
with 54% indicating at least 5 years of experience in leadership positions and less than
20% indicating no, or less than 1 year, of leadership experience. Descriptive statistics and
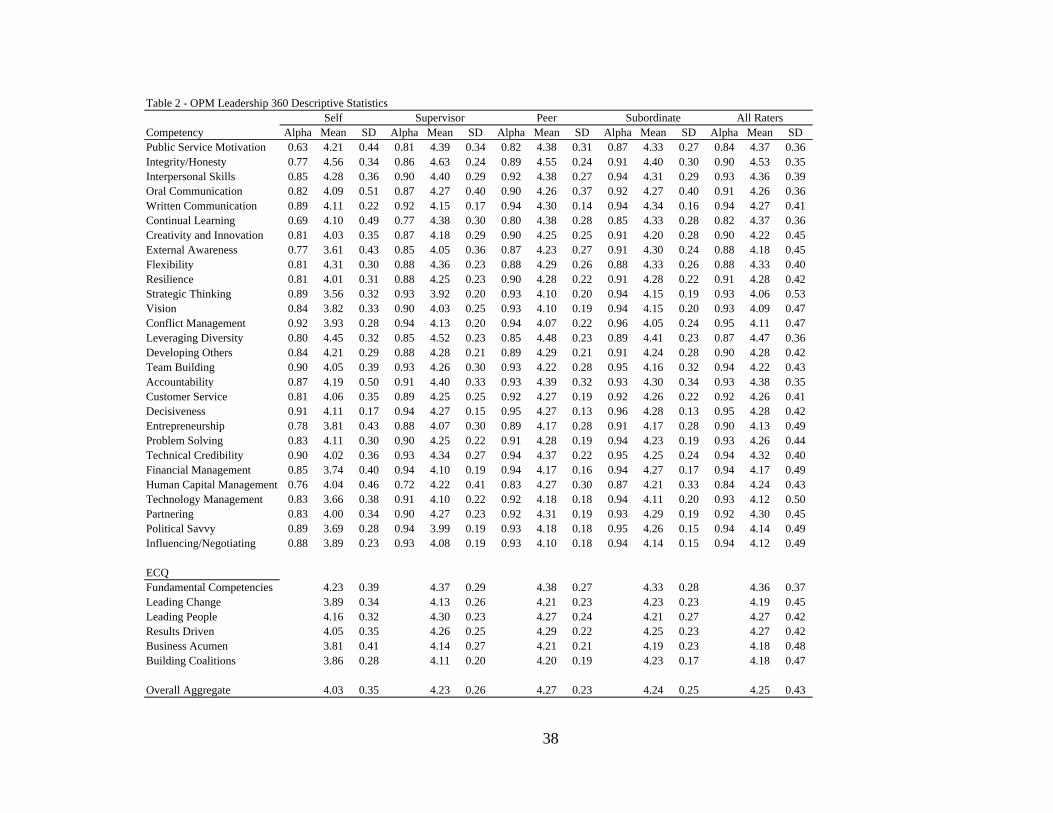
correlations for the study variables can be found in Table 1. A more comprehensive
review of the descriptive statistics for the OPM Leadership 360 assessment can be found
in Table 2. OPM Leadership 360 ratings were provided by 2370 individuals, yielding an
average of 10.8 raters per participant (1 self, 1.1 supervisors, 4.4 peers, and 4.2
subordinates). Intercorrelations of the overall subjective ratings of performance for the 4
rater groups can be found in Table 3. While the self ratings did not correlate with peer
and subordinate ratings, the three other rating groups (supervisor, peers and subordinates)
did correlate significantly with each other. Consistent with Oh and Berry (2009),
Intraclass Correlation Coefficients (ICCs) were calculated for the peer and subordinate
groups, with an average ICC of .36 and .30 respectively. An ICC was calculated for each
participant for each rating group across the 98 rated behaviors. Minimum, maximum, and
mean ICC information for the two rating groups are found in Table 4. Given that the vast
majority of ratings for the supervisor group were provided by single individuals, no ICCs
were calculated for this group.
37
Table 1 – Study Variables, Descriptive Statistics and Correlations.
Variable Mean SD N alpha 1 2 3 4 5 6 7 8 9 10 11 12 13
1. Affective-identity MTL 3.73 0.50 225 0.74 --2. Social-normative MTL 3.61 0.48 225 0.76 0.25* --3. Noncalculative MTL 4.05 0.46 225 0.76 0.08 0.20* --4. Leadership experience 5.51 2.50 225 -- 0.21* 0.08 0.10 --5. LSE 9.15 0.98 225 0.94 0.16* 0.19* 0.26* 0.12 --6. LMX 3.95 0.74 225 0.90 -0.01 0.01 0.13 -0.08 0.21* --7. Percieved supervisor effectiveness 4.20 0.78 225 0.95 -0.10 0.03 0.14* -0.02 0.09 0.71* --8. Leadership performance 4.23 0.31 219 -- -0.08 -0.07 0.00 -0.01 0.08 0.20* 0.13 --9. ECQ - Fundamental competencies 4.34 0.31 218 -- -0.12 -0.14* 0.03 -0.09 0.05 0.23* 0.14* 0.88* --10. ECQ - Leading change 4.19 0.33 207 -- -0.07 -0.08 -0.01 -0.02 0.11 0.21* 0.13 0.94* 0.81* --11. ECQ - Leading people 4.20 0.46 216 -- -0.02 -0.04 -0.04 0.08 0.01 0.15* 0.10 0.70* 0.57* 0.60* --12. ECQ - Results driven 4.27 0.33 212 -- -0.06 -0.04 0.00 -0.05 0.07 0.14* 0.08 0.93* 0.77* 0.91* 0.47* --13. ECQ - Business accumen 4.18 0.36 178 -- -0.02 0.00 -0.03 0.07 0.08 0.11 0.02 0.90* 0.78* 0.84* 0.65* 0.88* --14. ECQ - Building coalitions 4.19 0.38 208 -- -0.07 -0.07 -0.02 -0.05 0.08 0.16* 0.09 0.88* 0.74* 0.85* 0.46* 0.86* 0.81*Note: '*' is significant p < .05. MTL = Motivation to Lead. LSE = Leadership Self Efficacy. LMX = Leader Member Exchange.
38
Competency Alpha Mean SD Alpha Mean SD Alpha Mean SD Alpha Mean SD Alpha Mean SDPublic Service Motivation 0.63 4.21 0.44 0.81 4.39 0.34 0.82 4.38 0.31 0.87 4.33 0.27 0.84 4.37 0.36Integrity/Honesty 0.77 4.56 0.34 0.86 4.63 0.24 0.89 4.55 0.24 0.91 4.40 0.30 0.90 4.53 0.35Interpersonal Skills 0.85 4.28 0.36 0.90 4.40 0.29 0.92 4.38 0.27 0.94 4.31 0.29 0.93 4.36 0.39Oral Communication 0.82 4.09 0.51 0.87 4.27 0.40 0.90 4.26 0.37 0.92 4.27 0.40 0.91 4.26 0.36Written Communication 0.89 4.11 0.22 0.92 4.15 0.17 0.94 4.30 0.14 0.94 4.34 0.16 0.94 4.27 0.41Continual Learning 0.69 4.10 0.49 0.77 4.38 0.30 0.80 4.38 0.28 0.85 4.33 0.28 0.82 4.37 0.36Creativity and Innovation 0.81 4.03 0.35 0.87 4.18 0.29 0.90 4.25 0.25 0.91 4.20 0.28 0.90 4.22 0.45External Awareness 0.77 3.61 0.43 0.85 4.05 0.36 0.87 4.23 0.27 0.91 4.30 0.24 0.88 4.18 0.45Flexibility 0.81 4.31 0.30 0.88 4.36 0.23 0.88 4.29 0.26 0.88 4.33 0.26 0.88 4.33 0.40Resilience 0.81 4.01 0.31 0.88 4.25 0.23 0.90 4.28 0.22 0.91 4.28 0.22 0.91 4.28 0.42Strategic Thinking 0.89 3.56 0.32 0.93 3.92 0.20 0.93 4.10 0.20 0.94 4.15 0.19 0.93 4.06 0.53Vision 0.84 3.82 0.33 0.90 4.03 0.25 0.93 4.10 0.19 0.94 4.15 0.20 0.93 4.09 0.47Conflict Management 0.92 3.93 0.28 0.94 4.13 0.20 0.94 4.07 0.22 0.96 4.05 0.24 0.95 4.11 0.47Leveraging Diversity 0.80 4.45 0.32 0.85 4.52 0.23 0.85 4.48 0.23 0.89 4.41 0.23 0.87 4.47 0.36Developing Others 0.84 4.21 0.29 0.88 4.28 0.21 0.89 4.29 0.21 0.91 4.24 0.28 0.90 4.28 0.42Team Building 0.90 4.05 0.39 0.93 4.26 0.30 0.93 4.22 0.28 0.95 4.16 0.32 0.94 4.22 0.43Accountability 0.87 4.19 0.50 0.91 4.40 0.33 0.93 4.39 0.32 0.93 4.30 0.34 0.93 4.38 0.35Customer Service 0.81 4.06 0.35 0.89 4.25 0.25 0.92 4.27 0.19 0.92 4.26 0.22 0.92 4.26 0.41Decisiveness 0.91 4.11 0.17 0.94 4.27 0.15 0.95 4.27 0.13 0.96 4.28 0.13 0.95 4.28 0.42Entrepreneurship 0.78 3.81 0.43 0.88 4.07 0.30 0.89 4.17 0.28 0.91 4.17 0.28 0.90 4.13 0.49Problem Solving 0.83 4.11 0.30 0.90 4.25 0.22 0.91 4.28 0.19 0.94 4.23 0.19 0.93 4.26 0.44Technical Credibility 0.90 4.02 0.36 0.93 4.34 0.27 0.94 4.37 0.22 0.95 4.25 0.24 0.94 4.32 0.40Financial Management 0.85 3.74 0.40 0.94 4.10 0.19 0.94 4.17 0.16 0.94 4.27 0.17 0.94 4.17 0.49Human Capital Management 0.76 4.04 0.46 0.72 4.22 0.41 0.83 4.27 0.30 0.87 4.21 0.33 0.84 4.24 0.43Technology Management 0.83 3.66 0.38 0.91 4.10 0.22 0.92 4.18 0.18 0.94 4.11 0.20 0.93 4.12 0.50Partnering 0.83 4.00 0.34 0.90 4.27 0.23 0.92 4.31 0.19 0.93 4.29 0.19 0.92 4.30 0.45Political Savvy 0.89 3.69 0.28 0.94 3.99 0.19 0.93 4.18 0.18 0.95 4.26 0.15 0.94 4.14 0.49Influencing/Negotiating 0.88 3.89 0.23 0.93 4.08 0.19 0.93 4.10 0.18 0.94 4.14 0.15 0.94 4.12 0.49
ECQFundamental Competencies 4.23 0.39 4.37 0.29 4.38 0.27 4.33 0.28 4.36 0.37Leading Change 3.89 0.34 4.13 0.26 4.21 0.23 4.23 0.23 4.19 0.45Leading People 4.16 0.32 4.30 0.23 4.27 0.24 4.21 0.27 4.27 0.42Results Driven 4.05 0.35 4.26 0.25 4.29 0.22 4.25 0.23 4.27 0.42Business Acumen 3.81 0.41 4.14 0.27 4.21 0.21 4.19 0.23 4.18 0.48Building Coalitions 3.86 0.28 4.11 0.20 4.20 0.19 4.23 0.17 4.18 0.47
Overall Aggregate 4.03 0.35 4.23 0.26 4.27 0.23 4.24 0.25 4.25 0.43
All RatersSupervisorSelf Peer SubordinateTable 2 - OPM Leadership 360 Descriptive Statistics
39
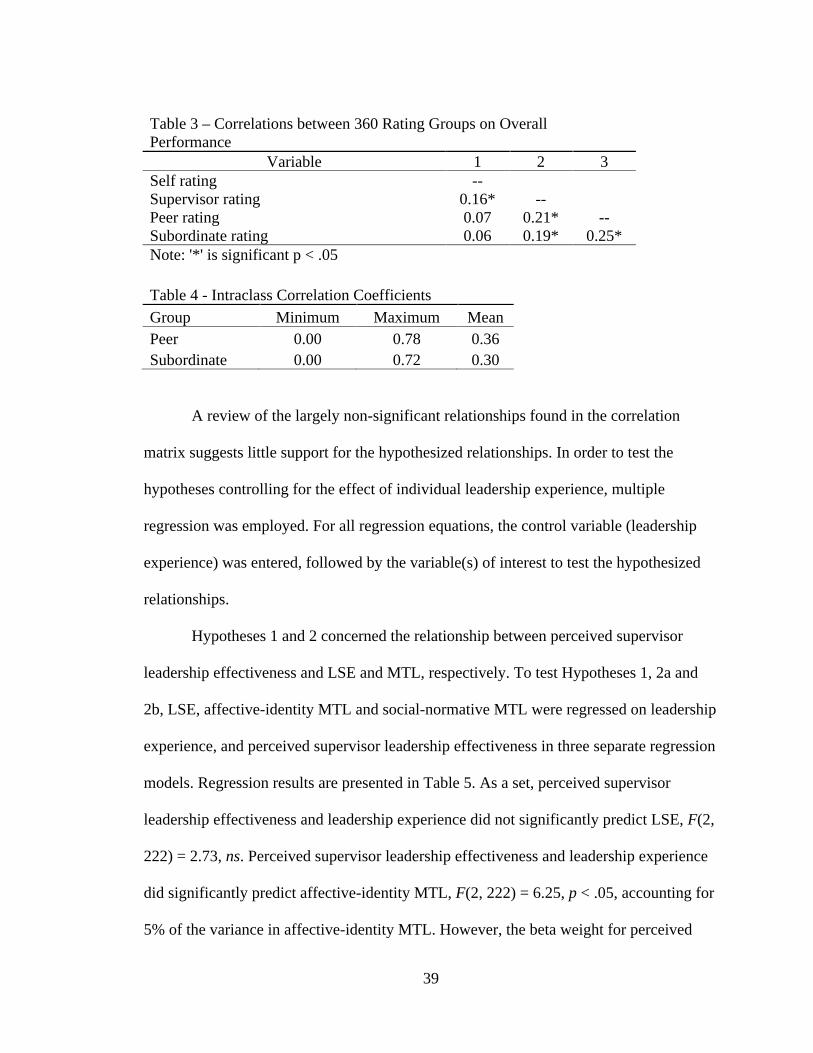
Table 3 – Correlations between 360 Rating Groups on Overall Performance
Variable 1 2 3 Self rating -- Supervisor rating 0.16* -- Peer rating 0.07 0.21* -- Subordinate rating 0.06 0.19* 0.25* Note: '*' is significant p < .05
Table 4 - Intraclass Correlation Coefficients
Group Minimum Maximum Mean Peer 0.00 0.78 0.36 Subordinate 0.00 0.72 0.30
A review of the largely non-significant relationships found in the correlation
matrix suggests little support for the hypothesized relationships. In order to test the
hypotheses controlling for the effect of individual leadership experience, multiple
regression was employed. For all regression equations, the control variable (leadership
experience) was entered, followed by the variable(s) of interest to test the hypothesized
relationships.
Hypotheses 1 and 2 concerned the relationship between perceived supervisor
leadership effectiveness and LSE and MTL, respectively. To test Hypotheses 1, 2a and
2b, LSE, affective-identity MTL and social-normative MTL were regressed on leadership
experience, and perceived supervisor leadership effectiveness in three separate regression
models. Regression results are presented in Table 5. As a set, perceived supervisor
leadership effectiveness and leadership experience did not significantly predict LSE, F(2,
222) = 2.73, ns. Perceived supervisor leadership effectiveness and leadership experience
did significantly predict affective-identity MTL, F(2, 222) = 6.25, p < .05, accounting for
5% of the variance in affective-identity MTL. However, the beta weight for perceived

40
supervisor leadership effectiveness was not significant (
= -.09, ns). Lastly, perceived
supervisor leadership effectiveness and leadership experience did not significantly predict
social-normative MTL, F(2, 222) = 0.83, ns. The non-hypothesized relationship between
perceived supervisor leadership effectiveness and noncalculative MTL was also tested.
Perceived supervisor leadership effectiveness and leadership experience did significantly
predict noncalculative MTL, F(2, 222) = 3.56, p < .05, accounting for 3% of the variance
in the criterion. In this instance, perceived supervisory leadership effectiveness was a
significant predictor, ß = .14, t(222) = 2.17, p < .05. Taken together, these results do not
provide support for Hypotheses 1 and 2.
Predictor ß t ß t ß t ß t
Leadership Experience 0.12 1.87 0.21 3.22** 0.08 1.23 0.11 1.59PSLE 0.10 1.43 -0.09 -1.41 0.03 0.41 0.14 2.17*
R 2
Adjusted R 2
Fdf
Social-normative MTL
Noncalculative MTL
Table 5 - Regression Results for Perceived Supervisor Leadership Effectiveness Predicting LSE and MTL
2,222
0.01
0.000.83
0.056.25**
0.02
2,222
LSEAffective-
identity MTL
0.022.73
Note: * signficant at p<.05, ** significant at p<.01. PSLE = Perceived Supervisor Leadership Effectiveness
2,2222,222
Final Model Statistics
0.03
0.023.57*
0.05
Hypotheses 3 and 4 concerned the moderating effects of LMX relationship quality
on the relationships of perceived supervisor leadership effectiveness with LSE and MTL,
respectively. To test Hypotheses 3, 4a and 4b, LSE, affective-identity MTL and social-
normative MTL were regressed on leadership experience and perceived supervisor
leadership effectiveness, with LMX included as a moderator in three separate regression

41
models. These results are shown in Table 6. LMX did significantly moderate the
relationship between perceived supervisor leadership effectiveness and LSE, F(4, 220) =
6.94, p <.05. Simple slope tests show that for those low on LMX (one standard deviation
below the mean), there is a negative association between perceived supervisor leadership
effectiveness and LSE (ß = -.26, t(222) = -2.22, p < .05), whereas the relationship was not
significant for those high on LMX (ß = .21, t(222) = -1.32, ns). This interaction is
illustrated in Figure 2. This provides support for Hypothesis 3. No moderating effects
were present with affective-identity MTL or with social-normative MTL. While not
specifically hypothesized, the moderating effects of LMX were also investigated with
respect to noncalculative MTL and found to significantly moderate the relationship
between perceived supervisor leadership effectiveness and noncalculative MTL F(4, 220)
= 3.56, p <.05. Simple slope tests show that for those high on LMX (one standard
deviation above the mean), there is a positive association between perceived supervisor
leadership effectiveness and noncalculative MTL (ß = .18, t(222) = 2.42, p < .05),
whereas the relationship was not-significant for those low on LMX (ß = .01, t(222) = .17,
ns). This interaction is illustrated in Figure 3.
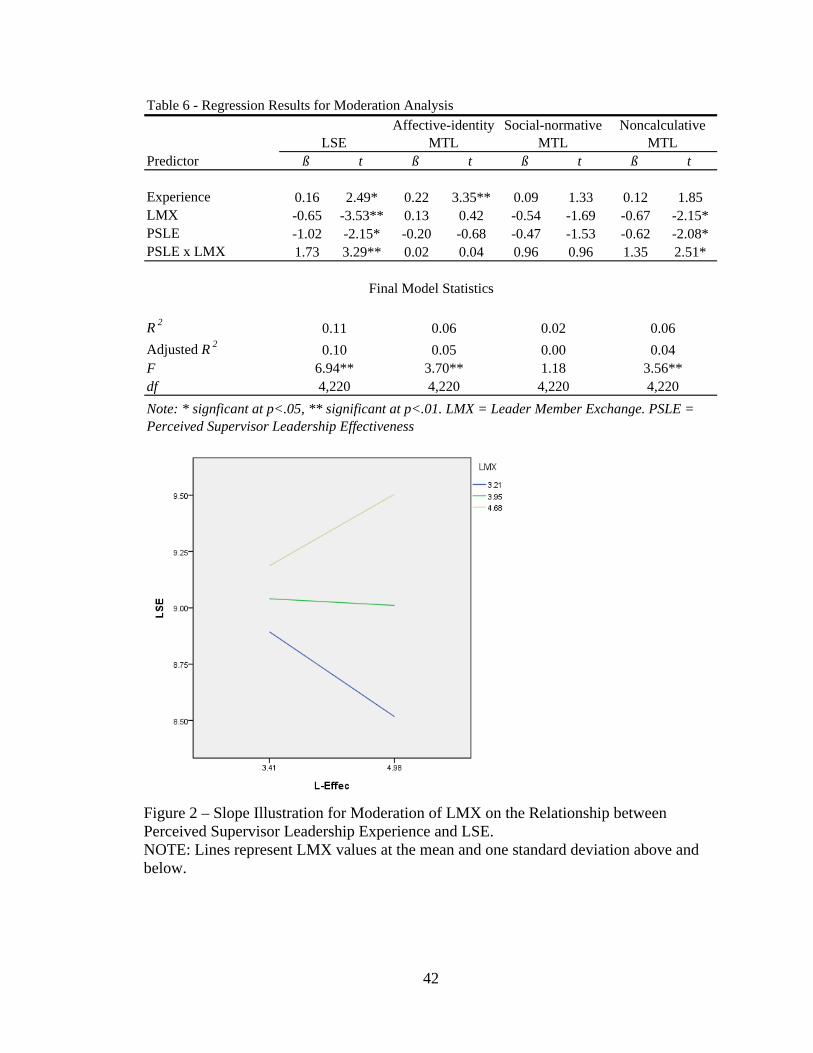
42
Table 6 - Regression Results for Moderation Analysis
Predictor ß t ß t ß t ß t
Experience 0.16 2.49* 0.22 3.35** 0.09 1.33 0.12 1.85LMX -0.65 -3.53** 0.13 0.42 -0.54 -1.69 -0.67 -2.15*PSLE -1.02 -2.15* -0.20 -0.68 -0.47 -1.53 -0.62 -2.08*PSLE x LMX 1.73 3.29** 0.02 0.04 0.96 0.96 1.35 2.51*
R 2
Adjusted R 2
Fdf
Final Model Statistics
0.06
0.043.56**
0.06
6.94**4,220
3.70**
0.02
0.001.184,220 4,220
Note: * signficant at p<.05, ** significant at p<.01. LMX = Leader Member Exchange. PSLE = Perceived Supervisor Leadership Effectiveness
0.05
LSEAffective-identity
MTLSocial-normative
MTLNoncalculative
MTL
4,220
0.11
0.10
Figure 2 – Slope Illustration for Moderation of LMX on the Relationship between Perceived Supervisor Leadership Experience and LSE. NOTE: Lines represent LMX values at the mean and one standard deviation above and below.

43
Figure 3 – Slope Illustration for Moderation of LMX on the Relationship between Perceived Supervisor Leadership Experience and Noncalculative MTL. NOTE: Lines represent LMX values at the mean and one standard deviation above and below.
Hypothesis 5 concerned the relationship between MTL and leadership
performance. In this case, leader performance was measured utilizing a comprehensive
developmental 360 leadership assessment. Ratings across all 28 leadership competencies
were averaged to create an overall subjective assessment of the participants’ leadership
performance. To test Hypotheses 5a, 5b and 5c, leadership experience, LSE and the three
forms of MTL (affective-identity, social-normative, and noncalculative) were entered
into a regression equation with overall leadership performance as the criterion.
Regression results are listed in Table 7. Leadership experience, LSE, affective-identity
MTL, social-normative MTL, and noncalculative MTL did not significantly predict
perceived leadership performance as measured by the 28 competency average, F(5, 213)
= 0.90, ns, suggesting no support for the leadership hypotheses pertaining to leadership
performance.

44
In addition to testing Hypothesis 5 using a single measure of overall subjective
leadership performance, separate analyses were conducted using the a priori breakdown
of the OPM leadership competency model, the ECQ model. Hypotheses 5a, 5b, and 5c
were tested by regressing each of the six ECQ leadership dimensions on leadership
experience, LSE, and the three forms of MTL (affective-identity, social-normative, and
noncalculative) in separate models. None of the resulting regression equations were
significant, again suggesting no support for the hypothesis related to leadership
performance. Since the correlations between rating groups overall performance ratings
were modest, all regressions were run at the rater group level and results displayed in
Table 8 (supervisor rating), Table 9 (peer rating) and Table 10 (subordinate rating). The
only significant findings were with regard to the relationship between affective-identity
MTL, and peer ratings of leadership performance perceptions with regard to the first
ECQ. Taken together, these results again suggest no evidence supporting a link between
LSE and MTL with leader performance as measured through the 360 assessment.
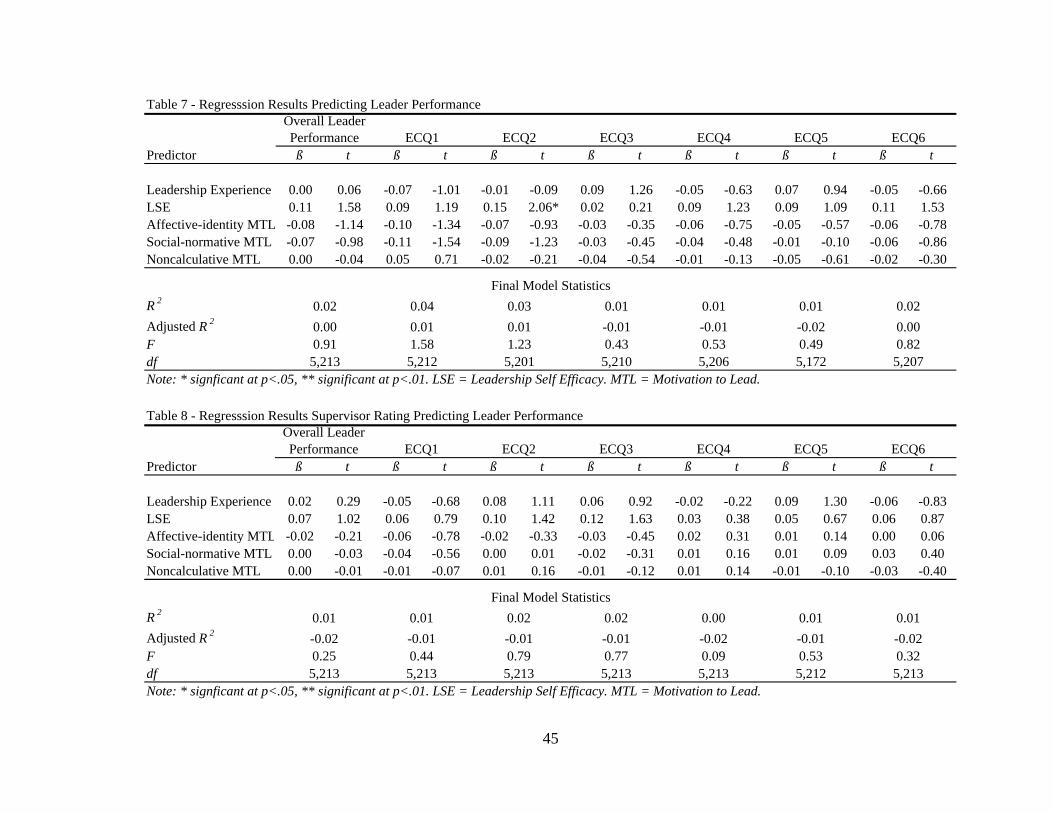
45
Table 7 - Regresssion Results Predicting Leader Performance
Predictor ß t ß t ß t ß t ß t ß t ß t
Leadership Experience 0.00 0.06 -0.07 -1.01 -0.01 -0.09 0.09 1.26 -0.05 -0.63 0.07 0.94 -0.05 -0.66LSE 0.11 1.58 0.09 1.19 0.15 2.06* 0.02 0.21 0.09 1.23 0.09 1.09 0.11 1.53Affective-identity MTL -0.08 -1.14 -0.10 -1.34 -0.07 -0.93 -0.03 -0.35 -0.06 -0.75 -0.05 -0.57 -0.06 -0.78Social-normative MTL -0.07 -0.98 -0.11 -1.54 -0.09 -1.23 -0.03 -0.45 -0.04 -0.48 -0.01 -0.10 -0.06 -0.86Noncalculative MTL 0.00 -0.04 0.05 0.71 -0.02 -0.21 -0.04 -0.54 -0.01 -0.13 -0.05 -0.61 -0.02 -0.30
R 2
Adjusted R 2
FdfNote: * signficant at p<.05, ** significant at p<.01. LSE = Leadership Self Efficacy. MTL = Motivation to Lead.
Overall Leader Performance ECQ1 ECQ2 ECQ3
0.00 0.01 0.01 -0.01
0.02 0.04 0.03 0.01
5,213 5,212 5,201 5,2100.91 1.58 1.23 0.43 0.53
5,206
ECQ5
0.01
-0.020.49
5,207
Final Model Statistics
ECQ6
0.02
0.000.82
5,172
ECQ4
0.01
-0.01
Table 8 - Regresssion Results Supervisor Rating Predicting Leader Performance
Predictor ß t ß t ß t ß t ß t ß t ß t
Leadership Experience 0.02 0.29 -0.05 -0.68 0.08 1.11 0.06 0.92 -0.02 -0.22 0.09 1.30 -0.06 -0.83LSE 0.07 1.02 0.06 0.79 0.10 1.42 0.12 1.63 0.03 0.38 0.05 0.67 0.06 0.87Affective-identity MTL -0.02 -0.21 -0.06 -0.78 -0.02 -0.33 -0.03 -0.45 0.02 0.31 0.01 0.14 0.00 0.06Social-normative MTL 0.00 -0.03 -0.04 -0.56 0.00 0.01 -0.02 -0.31 0.01 0.16 0.01 0.09 0.03 0.40Noncalculative MTL 0.00 -0.01 -0.01 -0.07 0.01 0.16 -0.01 -0.12 0.01 0.14 -0.01 -0.10 -0.03 -0.40
R 2
Adjusted R 2
FdfNote: * signficant at p<.05, ** significant at p<.01. LSE = Leadership Self Efficacy. MTL = Motivation to Lead.
ECQ4 ECQ5 ECQ6
Final Model Statistics
Overall Leader Performance ECQ1 ECQ2 ECQ3
0.01
-0.02 -0.01 -0.01 -0.01 -0.02 -0.01 -0.02
0.01 0.01
0.79 0.77
0.00 0.010.02 0.02
0.09 0.53 0.325,213 5,213 5,213 5,213 5,213 5,212 5,2130.25 0.44

46
Table 9 - Regresssion Results Peer Rating Predicting Leader Performance
Predictor ß t ß t ß t ß t ß t ß t ß t
Leadership Experience -0.08 -1.20 -0.10 -1.52 -0.08 -1.21 -0.05 -0.73 -0.09 -1.31 -0.04 -0.56 -0.07 -1.03LSE 0.13 1.90 0.13 1.80 0.13 1.83 0.16 2.23* 0.11 1.55 0.08 1.10 0.13 1.76Affective-identity MTL -0.13 -1.82 -0.14 -2.01* -0.13 -1.77 -0.14 -1.91 -0.10 -1.42 -0.10 -1.38 -0.11 -1.55Social-normative MTL -0.05 -0.74 -0.07 -0.91 -0.05 -0.74 -0.02 -0.29 -0.05 -0.69 -0.01 -0.10 -0.08 -1.18Noncalculative MTL -0.03 -0.48 0.05 0.67 -0.03 -0.47 -0.04 -0.56 -0.05 -0.74 -0.07 -0.97 -0.05 -0.72
R 2
Adjusted R 2
FdfNote: * signficant at p<.05, ** significant at p<.01. LSE = Leadership Self Efficacy. MTL = Motivation to Lead.
ECQ4 ECQ5 ECQ6
Final Model Statistics
Overall Leader Performance ECQ1 ECQ2 ECQ3
0.04
0.02 0.03 0.02 0.02 0.01 0.00 0.02
0.04 0.05
1.80 1.78
0.03 0.020.04 0.04
1.50 0.85 1.785,213 5,213 5,213 5,213 5,213 5,213 5,2131.86 2.35*
Table 10 - Regresssion Results Subordinate Rating Predicting Leader Performance
Predictor ß t ß t ß t ß t ß t ß t ß t
Leadership Experience 0.00 0.00 0.01 0.18 -0.01 -0.15 -0.01 -0.19 0.00 -0.01 -0.02 -0.22 0.04 0.61LSE 0.09 1.26 0.08 1.05 0.10 1.38 0.07 1.02 0.10 1.40 0.08 1.09 0.07 0.97Affective-identity MTL -0.08 -1.11 -0.10 -1.40 -0.08 -1.16 -0.08 -1.13 -0.08 -1.13 -0.05 -0.67 -0.04 -0.54Social-normative MTL -0.06 -0.77 -0.03 -0.39 -0.06 -0.87 -0.07 -0.93 -0.04 -0.49 -0.05 -0.66 -0.08 -1.13Noncalculative MTL -0.01 -0.07 0.00 0.06 -0.03 -0.36 -0.01 -0.15 -0.01 -0.11 0.01 0.08 0.03 0.38
R 2
Adjusted R 2
FdfNote: * signficant at p<.05, ** significant at p<.01. LSE = Leadership Self Efficacy. MTL = Motivation to Lead.
ECQ4 ECQ5 ECQ6
Final Model Statistics
Overall Leader Performance ECQ1 ECQ2 ECQ3
0.01
-0.01 -0.01 0.00 -0.01 -0.01 -0.01 -0.01
0.02 0.01
0.81 0.69
0.02 0.010.02 0.02
0.65 0.41 0.575,213 5,213 5,213 5,213 5,213 5,211 5,2130.66 0.63
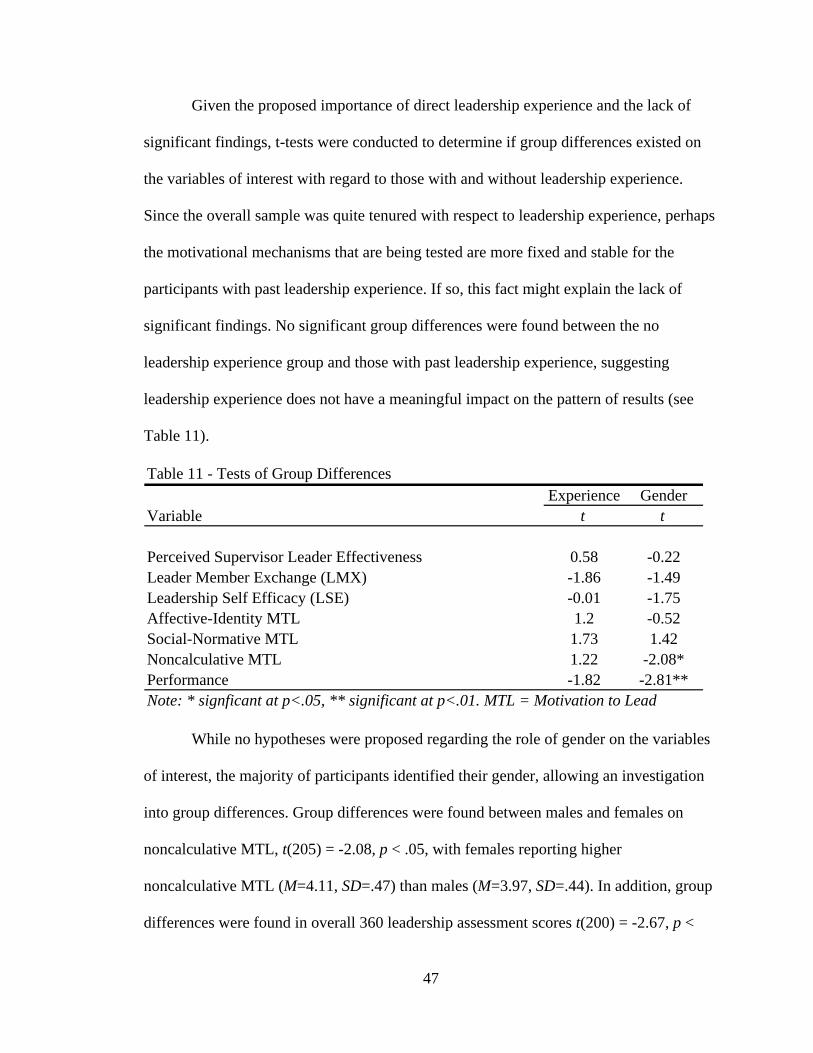
47
Given the proposed importance of direct leadership experience and the lack of
significant findings, t-tests were conducted to determine if group differences existed on
the variables of interest with regard to those with and without leadership experience.
Since the overall sample was quite tenured with respect to leadership experience, perhaps
the motivational mechanisms that are being tested are more fixed and stable for the
participants with past leadership experience. If so, this fact might explain the lack of
significant findings. No significant group differences were found between the no
leadership experience group and those with past leadership experience, suggesting
leadership experience does not have a meaningful impact on the pattern of results (see
Table 11).
Table 11 - Tests of Group DifferencesExperience Gender
Variable t t
Perceived Supervisor Leader Effectiveness 0.58 -0.22Leader Member Exchange (LMX) -1.86 -1.49Leadership Self Efficacy (LSE) -0.01 -1.75Affective-Identity MTL 1.2 -0.52Social-Normative MTL 1.73 1.42Noncalculative MTL 1.22 -2.08*Performance -1.82 -2.81**Note: * signficant at p<.05, ** significant at p<.01. MTL = Motivation to Lead
While no hypotheses were proposed regarding the role of gender on the variables
of interest, the majority of participants identified their gender, allowing an investigation
into group differences. Group differences were found between males and females on
noncalculative MTL, t(205) = -2.08, p < .05, with females reporting higher
noncalculative MTL (M=4.11, SD=.47) than males (M=3.97, SD=.44). In addition, group
differences were found in overall 360 leadership assessment scores t(200) = -2.67, p <

48
.05, with females (M=4.28, SD=.31) receiving significantly higher scores than males
(M=4.16, SD=.31). No other gender differences were observed.
49
Chapter 4: Discussion
This study sought to investigate the relationship between positive leadership role
modeling and an individual’s MTL. Existing research suggested a feedback loop whereby
individuals who have positive personal leadership experiences develop LSE and MTL,
making them more likely to take on additional leadership training and leadership roles. It
was hypothesized that in addition to this direct personal experience relationship, a role
modeling relationship involving observing the positive leadership of one’s supervisor
would also be related to higher MTL and LSE. In addition, the research on MTL has been
sparse with regard to its impact on perceived leader performance. This research sought to
establish this link, suggesting that individuals with higher MTL would have higher
leadership performance ratings.
Role Modeling and MTL
In the sample of 226 federal government employees, there was mixed evidence
supporting the relationship between a leadership role model and LSE or MTL.
Regression analysis found no support for direct relationships between modeled leadership
(as measured by perceived supervisor leader effectiveness) and the variables of interest
(LSE, affective-identity MTL and social-normative MTL). However, it was also
hypothesized that these role modeling relationships with LSE and MTL would be
moderated by the quality of the relationship between follower and supervisor. Support
was found for this moderated relationship between perceived supervisor leadership
50
effectiveness and LSE with those with lower quality relationships, exhibiting a negative
relationship between leader effectiveness and LSE supporting Hypothesis 3. Similarly,
the relationship between perceived supervisor leader effectiveness and noncalculative
MTL was moderated by relationship quality, such that those experiencing high quality
relationships had a significant positive relationship between perceived supervisor leader
effectiveness and noncalculative MTL. No moderation was found regarding affective-
identity MTL or social-normative MTL.
Taken together, this suggests that having an effective supervisor can have an
impact on individuals’ self beliefs of their leadership capabilities and on their
noncalculative motives for taking on leadership roles and training, depending on the
quality of the relationship with their supervisor. Results suggest that having a negative
relationship with an effective supervisor is related to lower beliefs in one’s ability to be
successful as a leader. Conversely, having a positive relationship with an effective leader
is related to one being more motivated to lead for less selfish reasons, i.e. more
noncalculative. The results also suggest that an individual’s belief in their own leadership
abilities, and their affective and normative motivations to take on leadership roles, are
unrelated to having a positive leadership role model. With regard to affective-identity
MTL, these results suggest that having a positive leadership role model does not lead an
individual to want to lead more for the happiness that may result from leadership. With
regard to social-normative MTL, these results suggest that having a positive leadership
role model does not lead an individual to want to lead more due to a sense of duty to take
on leadership roles.
51
Given the null findings with regard to affective-identity MTL and social-
normative MTL, these results suggest, perhaps, that MTL is much more stable than
initially believed. Chan and Drasgow (2001) characterize MTL as an individual
difference with personality traits and cultural values as distal determinants. In addition,
they point out the malleable nature of MTL, in that it can be fostered and developed more
proximally through successes in leadership roles or leadership training opportunities. The
results of this study provide little support for the role of leadership experience having any
impact on LSE or MTL. In addition, there is little evidence suggesting the alternative
means to establishing affective-identity MTL or social-normative MTL through
experiencing successful leadership in the form of modeled behavior from a perceived
effective leader.
MTL and Leadership Performance
In the sample of 220 federal government employees for which self-reported LSE
and MTL could be linked to an OPM Leadership 360 assessment, there was no evidence
to support a connection between LSE and/or MTL and leader performance. The 28
leadership competencies measured by the OPM Leadership 360 assessment were
aggregated into a single measure of leadership performance. Regression analysis found
no relationship between LSE or MTL with leader performance. In addition, the
theoretical executive core qualification model was used to aggregate the leadership
competencies into six groupings depending on the leadership function. The findings that
used these six groupings as dependent variables were similar, with no significant
relationships with LSE or MTL. A review of the correlation matrix in Table 2 shows high
inter-correlations among the leader performance measures, which is to be expected. In

52
addition, there are small but significant correlations between LMX and the leader
performance measures. This suggests that those with closer relationships to their direct
supervisor were rated better as leaders. Given that supervisory ratings are a component of
the OPM leadership 360 assessment, it is also equally likely that closer relationships
between rater (supervisor) and ratee (follower) can yield inflated 360 assessment ratings.
Further research is necessary to better understand these findings.
Academic Implications
One of the surprising findings or non-findings of this study is the relative lack of
contribution that individual experience had on the variance in LSE and MTL. While this
was not a primary variable of interest in this study and was only collected as a control
variable, Chan and Drasgow’s (2001) model discusses the malleable nature of MTL and
the effects of leadership experience as a self-fulfilling mechanism for developing MTL.
While the current research did find a significant relationship between leadership
experience and affective-identity MTL, this only accounted for 5% of the variance. No
significant relationships were uncovered with respect to LSE or the other forms of MTL.
This casts some doubt on the theoretical model proposed by Chan and Drasgow (2001)
and the feedback loop of leadership experience they present. Taken together with the null
findings regarding a modeling path and affective-identity MTL or social-normative MTL,
to date, there has been little research establishing the malleable nature of MTL. Perhaps
the moderated relationship between perceived supervisor leader effectiveness and
noncalculative MTL provides some evidence that MTL can be changed, but the largely
null results seem to support, rather, the stable individual difference perspective as
evidenced by Chan and Drasgow’s initial findings regarding personality and culture as

53
primary determinants of one’s MTL. Perhaps MTL is less something that one can
develop or learn over time, but rather more of a stable individual difference variable that
remains largely constant.
While not explicitly tested, the correlations between LSE, MTL and leader
performance suggest looking further into the developmental path by which these beliefs
develop. Chan and Drasgow (2001) propose that LSE is a proximal antecedent to MTL
which then leads to taking on leadership roles and training. Perhaps it is the case that
MTL is an antecedent to LSE such that individuals that develop more MTL begin to have
feelings of confidence in their ability to succeed at leading teams.
Applied Implications
Unfortunately, the largely null findings of this study do little to guide the
understanding of the development and fostering of MTL, or the impact of MTL on leader
performance. It was hypothesized that MTL could be developed and enhanced through
high quality interactions with effective leaders, and that being more motivated to lead
would result in positive organizational results in the form of increase leadership
performance. While this study supports this link with high quality relationships and non-
calculative MTL, the hypothesized relationships to affective-identity MTL and social-
normative MTL were not supported.
Many organizations are concerned with the early identification and fostering of
the next cadre of future leaders. Nowhere is this more important than in the federal
government where an aging workforce, quickly nearing or surpassing the age of
retirement, has leadership aggressively looking for new ways to identify high potential
(HIPOs) individuals for succession. If future research continues to fail in establishing

54
links between MTL and leadership performance, then the motivational component of
taking on leadership roles should not be a primary consideration in identifying and
developing HIPOs. The current status quo of identifying HIPOs based on knowledge,
skill, ability (KSAs), and one’s willingness to lead is likely a better approach.
With regard to the proposed modeling path to developing MTL, a link between
perceived supervisor leadership effectiveness would have suggested pairing HIPOs with
effective supervisors as a means to continue to develop MTL in the leaders of the future.
The results relating to noncalculative MTL suggest that doing so, and fostering positive
relationships with those supervisors, could yield noncalculative MTL. However, with no
evidence found in this study linking MTL to leadership performance, the findings of this
research suggest MTL should be of little interest to the applied world.
Limitations
There are many potential limitations that could be contributing to the null findings
of this study. At the outset, the characteristics of the sample are a potential concern. In
order to leverage the OPM Leadership 360 assessment, a convenience sample of federal
government leaders was used. While the OPM Leadership 360 assessment is assumed to
measure many of the same concepts as a more traditional private sector 360, its focus is
on assessing leadership behaviors in the federal government context. Measuring
leadership in the federal government is likely very similar to measuring leadership in
private industry, but there are unique challenges in the federal government context which
may have an impact on leadership. Leadership within the federal government is
inherently bureaucratic in nature and can result in barriers that are difficult for leaders to
overcome. In addition, with the highest levels of leadership often changing on a four- or

55
eight-year cycle, directions and priorities are often drastically changed. Taken together,
successful leadership in the federal space often requires high levels of resilience and
adaptability that may be required to a lesser extent in the private sector. Regardless, the
limited focus of measuring leadership solely in the federal government limits
generalizing any findings to the larger context of leadership as a whole.
Another limiting factor tied to this particular sample is the relative tenure of those
completing the assessment. While the OPM Leadership 360 is offered to individuals
across all levels of leadership experience, the majority of individuals completing the
OPM leadership 360 are tenured supervisors and managers. This was the case with this
particular sample, with more than half having at least 5 years formal leadership
experience in role and less than 20% having no leadership experience at all. The
experience of the sample could explain the fairly high means and low variances for the
introspective attitudinal variables (LSE and MTL), and similar high means and low
variances for the leadership competency measures as assessed by the OPM Leadership
360. Many of the standard deviations were in the .3 to .4 range which is quite low for
survey research. This could point to social desirability concerns with the LSE and MTL
scales. With regard to the 360 results, this likely reflects the experienced participant pool.
In addition, given that many of the individuals completed the 360 as part of a leadership
development course, even those in non-supervisory roles were likely high performers
identified as the next generation of government leaders. Essentially, this sample is
restricted in favor of those who have already proven their leadership capabilities and
progressed into roles demanding leadership skills. A more purposeful sampling strategy
to identify and survey more individuals who are not in supervisory positions, and who
56
have had little opportunity to develop leadership skills through in-role experiences or
through training opportunities, would likely yield a more varied sample in terms of LSE,
MTL, and leadership performance. While this is a concern with regard to all hypotheses,
this is of particular concern with regard to the link between MTL and performance. The
null findings regarding MTL’s link to leadership performance could certainly be a
function of the experienced sample. In essence, the individuals in this sample have
moved beyond the motivational component in the leadership journey. For whatever
reason, they have taken on and succeeded in leadership roles as evidenced by their
remaining in the leadership ranks. Taking a look at individuals early in their careers or
those transitioning into leadership roles, and looking at the motives that are or are not in
place for them, should shed more light on MTLs link to leader performance.
Another potential limitation is the study design. The cross-sectional nature of the
survey design, whereby all variables were measured at a single point in time, limits the
ability to speak to causality. Given the largely null findings, this is not a major concern.
However, future research into MTLs effects on leader performance should adopt a more
longitudinal approach, measuring motivation and leadership performance at multiple time
points in an attempt to understand whether increases in motivation lead to increases in
performance, or vice versa. While it is intuitive to think in terms of motivation or desire
to engage in a behavior leading to success in that endeavor, it is certainly possible that
successful performance in leadership roles can be rewarding and motivation enhancing.
In addition to the use of cross-sectional survey techniques, another potential
limitation related to survey design is the reliance on perceptions and subjective
assessments with regard to the assessment of leadership performance. The proposed
57
modeling path of LSE and MTL development was assessed using a perceptual measure of
supervisor leadership effectiveness. Individuals were asked to rate their direct supervisor
on 13 leadership competencies, making an assessment of their leadership effectiveness on
each. While subordinate assessments of effectiveness may be a proxy for leadership
performance, a more objective assessment may have yielded different results. The fact
that LMX scores, which were intended to measure the strength of relationship between
subordinate and supervisor, were so highly correlated with the perceived supervisor
leadership effectiveness ratings is a clear indication that individuals might not have been
able to sufficiently distinguish between having a good relationship with their supervisor
and having an effective leader. Implementing a more objective measure of supervisor
effectiveness, and using a multi-source approach to assessing relationship quality by
assessing the relationship from both sides, should lessen these concerns.
The problem of subjective assessment is also of concern with regard to the
assessment of individual leadership performance as assessed by the OPM Leadership
360. As discussed in the introduction, the measurement of leadership performance is a
difficult endeavor. Subjective assessments often result in ratings more akin to what is
leader-like as opposed to direct assessments of leader behavior. Objective assessments of
leader performance often do not distinguish between leader performance and team
results. Successful teams must have successful leaders. Utilizing a multi-source feedback
system with behavioral based items seeks to truly assess leader performance. Collecting
leadership performance data using the OPM Leadership 360 assessment is a real strength
of the current study; however, this reliance on subjective ratings is not without concern.
Rater biases, such as halo effect (rating all behaviors high because of high ratings on

58
some behaviors), are a concern. In addition, with an assessment of 100 items, rater
fatigue is also a concern and could limit the usefulness of competency level or ECQ level
data. While these are concerns at the competency and ECQ level, it is doubtful that they
would have an impact on overall subjective assessments of leadership performance.
Combining this multi-source behavioral assessment method for rating leadership
performance with objective assessments of leadership success, such as those employed in
formal performance appraisal systems, would provide a more valid and comprehensive
assessment of leadership performance.
Future Research
While the present findings do not offer a clear role modeling relationship with
LSE and MTL, the limitations described above may certainly be to blame. Future
research into the effects of an effective leadership role model should consider the target
of the modeling. Perhaps focusing on an effective leader that an individual identifies with
and then measuring his or her perceived effectiveness and closeness would yield different
results. The current research assumed one’s direct supervisor as the most appropriate role
model, but past supervisors or individuals outside the organization may be more salient
leader models for a given individual. In addition, the self-report nature of this study
focused on perceptions of leader effectiveness rather than an objective assessment of
leader effectiveness. Future research should focus on an established effective leader
rather than one who is simply perceived to be effective.
The lack of support for a link between MTL and leadership performance should
be of particular interest to MTL researchers. While utilizing the OPM leadership 360
assessment provided rich multi-source data on leader performance, the data was still

59
entirely subjective. Future research should focus on obtaining objective measures of
leader performance. In addition, future research should seek to correct the issues of range
restriction encountered in the current research agenda by targeting individuals early in
their career and before they have established themselves as leaders or as high potential
individuals. Whereas the current research focused more on individuals that were high in
LSE, MTL and leader performance, future research can and should focus more on the
opposite end of the spectrum.
Finally, the current findings with regard to the impact of leader experience run
contrary to those of Chan and Drasgow (2001). These findings may provide evidence that
call into question Chan and Drasgow’s (2001) original conceptualization of MTL as a
malleable trait that can be developed over time. Since this study was cross-sectional, it is
difficult to speak directly to the stability of MTL over time. But given the finding that
past experience was unrelated to MTL, it raises questions. Again, this could potentially
be a result of range restriction and the focus on individuals in, or aspiring to, leadership
positions. Additional research should be conducted to better understand the role of
leadership experience in fostering MTL. In addition, longitudinal research should be
conducted to help answer the question of the stability and malleability of the MTL
construct.
Summary
In closing, this research sought to establish the link between MTL and leader
performance while investigating an additional means to establishing and fostering MTL
through role modeling from an effective leader. Using a self report survey methodology
to measure MTL and its proposed antecedents, and a multi-source 360 leadership
60
assessment to measure leader performance, these relationships were tested. Little
evidence was found to support any of the proposed relationships. With regard to the
antecedents of MTL, the lack of support for the proposed hypotheses and the lack of a
relationship with leader experience suggest that MTL may be less malleable than
believed. The lack of findings regarding the link between MTL and actual leader
performance casts doubts on the usefulness of the MTL construct from an applied
perspective. Understanding the reasons why individuals participate in leadership
development activities or take on additional leadership responsibilities is an interesting
academic endeavor. However, if that knowledge does not help organizations increase
leaders performance, MTL will not be of use to the applied world. Given the limitations
of the current study, the book is not necessarily closed on MTL. These findings, however,
should certainly give pause to those considering research into leader motivation.

61
References
Allen, N. J., & Meyer, J. P. (1990). The measurement and antecedents of affective,
continuance and normative commitment to the organization. Journal of
Occupational Psychology, 63, 1-18.
Anderson, D. W., Krajewski, H. T., Goffin, R. D., & Jackson, D. N. (2008). A leadership
self-efficacy taxonomy and its relation to effective leadership. Leadership
Quarterly, 19, 595-608.
Attwater, L. E. (1998). The advantages and pitfalls of self-assessment in organizations. In
J.W. Smither (Ed.), Performance Appraisal: State of the Art in Practice (pp. 331-
369). San Francisco: Jossey-Bass.
Bandura, A. (1986). Social foundations of thought and action: A social cognitive theory.
Englewood Cliffs, NJ: Prentice-Hall.
Bandura, A. (1988). Organizational application of social cognitive theory. Australian
Journal of Management, 13, 275-302.
Bandura, A. (1995). Self-Efficacy in Changing Societies. New York: Cambridge
University Press.
Bandura, A. (1997). Self-efficacy: The exercise of self control. New York: Freeman.
Barrick, M. R., & Mount, M. K. (1991). The Big Five personality dimensions and job
performance: a meta-analysis. Personnel Psychology, 44, 1-26.
Carlyle, T. (1907). Heroes and hero worship. Boston: Adams. (Original work published
1841)

62
Chan, K, (1999). Toward a theory of individual differences and leadership:
Understanding the MTL. Doctoral Dissertation, Department of Psychology,
University of Illinois at Urbana-Champaign.
Chan, K., Drasgow, F. (2001). Toward a theory of individual differences and leadership:
Understanding the MTL. Journal of Applied Psychology, 86, 481-498.
Chemers, M. M. (2000). Leadership research and theory: A functional integration. Group
Dynamics: Theory, Research, and Practice, 4, 27-43.
Conway, J. M., & Huffcutt, A. I. (1997). Psychometric properties of multisource
performance ratings: A meta-analysis of subordinate, supervisor, peer, and self-
ratings. Human Performance, 10, 331-360.
Corts, D. B., & Gowing, M. K. (1992). Dimensions of effective behavior: Executives,
manager and supervisors. Washington, DC: U.S. Office of Personnel Management,
Personnel Resources and Development Center, PRDC-92-05.
Dansereau, F., Cashman, J., & Graen, G. (1973). Instrumentality theory and equity theory
as complementary approaches in predicting the relationship of leadership and
turnover among managers. Organizational Behavior and Human Performance, 10,
184-200.
Dansereau, F., Graen, G., & Haga, W. J. (1975). A vertical dyad linkage approach to
leadership within formal organizations: A longitudinal investigation of the role
making process. Organizational Behavior and Human Performance, 13, 46-78.
Deci, E. L. (1971). Effects of externally mediated rewards on intrinsic motivation.
Journal of Personality and Social Psychology, 18, 105-115.

63
Deci, E. L., & Ryan, R. M. (1980). The empirical exploration of intrinsic motivational
processes. In L. Berkowitz (Ed.), Advances in experimental social psychology (Vol.
13, pp.39-80). New York: Academic Press.
Deci, E. L., & Ryan, R. M. (1985). Intrinsic motivation and self-determination in human
behavior. New York: Plenum.
Duchon, D., Green, S. G., & Tabert, T. D. (1986). Vertical dyad linkage: A longitudinal
assessment of antecedents, measures, and consequences. Journal of Applied
Psychology, 71, 56-60.
Eyde, L. D., Gregory, D. J., Muldrow, T. W., & Mergen, P. K. (1999). High-performance
leaders- A competency model. Washington, DC: U.S. Office of Personnel
Management, Personnel Resources and Development Center, PRDC-99-02.
Feasel, K. E. (1995). Mediating the relation between goals and subjective well-being:
Global and domain-specific variants of self-efficacy. Unpublished master’s thesis.
University of Illinois at Urbana-Champaign.
Fiedler, F. E., & Garcia, J. E. (1987). New approaches to effective leadership: Cognitive
resources and organizational performance. New York: Wiley.
Fishbein, M., & Ajzen, I. (1975). Belief, attitude, intention and behavior. Don Mills,
Ontario, Canada: Addison-Wesley.
Gagne, M., & Deci, E. L. (2005). Self-determination theory and work motivation.
Journal of Organizational Behavior, 26, 331-362.
Gerstner, C.R. & Day, D.V. (1997). Meta-Analytic review of leader-member exchange
theory: Correlates and construct issues. Journal of Applied Psychology, 82, 827-
844.

64
Graen, G. B. (1976). Role-making processes within complex organizations. In M.D.
Dunnette (Ed.), Handbook of industrial and organizational psychology (pp. 1201-
1245). Chicago: Rand McNally.
Graen, G. B., & Cashman, J. (1975). A role-making model of leadership in formal
organizations: A developmental approach. In J.G. Hunt & L.L. Larson (Eds.),
Leadership frontiers (pp. 143-165). Kent, OH: Kent State University.
Graen, G. B., Novak, M. A., & Sommerkamp, P. (1982). The effects of leader-member
exchange and job design on productivity and satisfaction: Testing a dual attachment
model. Organizational Behavior and Human Performance, 30, 109-131.
Graen, G. B., & Uhl-Bien, M. (1995). Relationship-based approach to leadership:
Development of leader-member exchange (LMX) theory of leadership over 25
years: Applying a multi-level multi-domain perspective. Leadership Quarterly, 6,
219-247.
Gregory, D. J., & Park, R. K. (1992). Occupational study of Federal executives,
managers, and supervisors: An application of the Multipurpose Occupational
Systems Analysis Inventory-Closed Ended (MOSAIC). Washington, DC: U.S. Office
of Personnel Management, Personnel Resources and Development Center, PRDC-
92-21.
Harris, M. M., & Schaubroeck, J. (1988). A meta-analysis of self-supervisor, self-rater,
and peer-supervisor ratings. Personnel Psychology, 41, 43-62.
Hendricks, J. W., & Payne, S. C. (2007). Beyond the Big Five: Leader goal orientation as
a predictor of leader effectiveness. Human Performance, 20, 317-343.

65
Hillery, J. M., Case, J. L., Dyomina, N., Burnkrant, S. R., Schay, B. W., Eyde, L. (2003).
OPM Leadership 360: Development of a 360 degree leadership feedback system.
Washington, DC. U.S. Office of Personnel Management, Personnel Research and
Development Center, PRDC-03-06
Hough, L. M. (1992). The “Big Five” personality variables – construct confusion:
Description versus prediction. Human Performance, 5, 139-155.
House, R. J., & Aditya, R. N. (1997). The social scientific study of leadership: Quo
vadis?, Journal of Management, 23, 409-473.
Howard, A., & Bray, D. W. (1988). Managerial lives in transition: Advancing age and
changing times. New York: Guilford Press.
Judge, T. A., Bono, J.E., Ilies, R., & Gerhardt, M. W. (2002). Personality and leadership:
A qualitative and quantitative review. Journal of Applied Psychology, 87, 765-780.
Langston, C. A., & Sykes W. E. (1997). Beliefs and the Big Five: Cognitive bases of
broad individual differences in personality. Journal of Research in Personality, 31,
141-165.
Liden, R., Wayne, S. J., & Stillwell, D. (1993). A longitudinal study on the early
development of leader-member exchanges. Journal of Applied Psychology, 78, 662-
674.
Lord, R. G., Brown, D. G. (2001). Leadership processes and follower self-identity.
Mahwah:NJ: Lawrence Erlbaum Associates Publishers.
Lord, R. G., De Vader, C. L., & Alliger, G. M. (1986). A meta-analysis of the relation
between personality traits and leadership perceptions: An application of validity
generalization procedures. Journal of Applied Psychology, 71, 402-410.

66
Meyer, J.P., & Allen, N.J. (1991). A three-component conceptualization of organizational
commitment. Human Resource Management Review, 1, 61-89.
Meyer, J. P. & Allen, N. J. (1997). Commitment in the workplace: Theory, research, and
application. Thousand Oaks, CA: Sage.
Nystrom, P. C. (1990). Vertical exchanges and organizational commitments of American
business managers. Group and Organizational Studies, 15, 296-312.
Oh, I., & Berry, C. M. (2009). The Five-Factor model of personality and managerial
performance: Validity gains through the use of 360 degree performance ratings.
Journal of Applied Psychology, 94, 1498-1513.
Paglis, L. L., & Green, S. G. (2002). Leadership self-efficacy and managers’ motivation
for leading change. Journal of Organizational Behavior, 23, 215-235.
Snyder, R. A., & Bruning, N. S. (1985). Quality of vertical dyad linages: Congruence of
supervisor and subordinate competence and role stress as explanatory variables.
Group and Organization Studies, 10, 81-94.
Stogdill, R. M. (1948). Personal factors associated with leadership: A survey of the
leadership. Journal of Psychology, 25, 35-71.
Triandis, H. C. (1977). Interpersonal behavior. Monterey, CA: Brooks/Cole.
Triandis, H. C. (1980). Value, attitudes and interpersonal behavior. In M. M. Page (Ed.),
Nebraska symposium on motivation, beliefs, attitudes and values (Vol. 1., pp. 195-
259). Lincoln, NE: University of Nebraska.
Triandis, H. C. (1995). Individualism and collectivism. Boulder, CO: Westview Press.
67
Triandis, H. C. (1998). Vertical and horizontal individualism and collectivism: Theory
and research implications for international comparative management. Advances in
Comparative Management, 12, 7-35.
Vecchio, R. P., & Gobdel, B. C. (1984). The vertical dyad linkage model of leadership:
Problems and prospects. Organizational Behavior and Human Performance, 34, 5-
20.

68
Appendices

69
Appendix A - OPM Leadership 360 – Competency Definitions
*Accountability - Holds self and others accountable for measurable high-quality, timely, and cost-effective results. Determines objectives, sets priorities, and delegates work. Accepts responsibility for mistakes. Complies with established control systems and rules.
*Conflict Management - Encourages creative tension and differences of opinions. Anticipates and takes steps to prevent counter-productive confrontations. Manages and resolves conflicts and disagreements in a constructive manner.
Continual Learning - Assesses and recognizes own strengths and weaknesses; pursues self-development.
*Creativity and Innovation - Develops new insights into situations; questions conventional approaches; encourages new ideas and innovations; designs and implements new or cutting edge programs/processes.
Customer Service - Anticipates and meets the needs of both internal and external customers. Delivers high-quality products and services; is committed to continuous improvement.
*Decisiveness - Makes well-informed, effective, and timely decisions, even when data are limited or solutions produce unpleasant consequences; perceives the impact and implications of decisions.
*Developing Others - Develops the ability of others to perform and contribute to the organization by providing ongoing feedback and by providing opportunities to learn through formal and informal methods.
Entrepreneurship - Positions the organization for future success by identifying new opportunities; builds the organization by developing or improving products or services. Takes calculated risks to accomplish organizational objectives.
External Awareness - Understands and keeps up-to-date on local, national, and international policies and trends that affect the organization and shape stakeholders' views; is aware of the organization's impact on the external environment.
Financial Management - Understands the organization's financial processes. Prepares, justifies, and administers the program budget. Oversees procurement and contracting to achieve desired results. Monitors expenditures and uses cost-benefit thinking to set priorities.
*Flexibility - Is open to change and new information; rapidly adapts to new information, changing conditions, or unexpected obstacles.

70
Human Capital Management - Builds and manages workforce based on organizational goals, budget considerations, and staffing needs. Ensures that employees are appropriately recruited, selected, appraised, and rewarded; takes action to address performance problems. Manages a multi-sector workforce and a variety of work situations.
*Integrity and Honesty - Behaves in an honest, fair, and ethical manner. Shows consistency in words and actions. Models high standards of ethics.
Influencing/Negotiating - Persuades others; builds consensus through give and take; gains cooperation from others to obtain information and accomplish goals.
*Interpersonal Skills - Treats others with courtesy, sensitivity, and respect. Considers and responds appropriately to the needs and feelings of different people in different situations.
Leveraging Diversity - Fosters an inclusive workplace where diversity and individual differences are valued and leveraged to achieve the vision and mission of the organization.
*Oral Communication - Makes clear and convincing oral presentations. Listens effectively; clarifies information as needed.
Partnering - Develops networks and builds alliances; collaborates across boundaries to build strategic relationships and achieve common goals.
Political Savvy - Identifies the internal and external politics that impact the work of the organization. Perceives organizational and political reality and acts accordingly.
*Problem Solving - Identifies and analyzes problems; weighs relevance and accuracy of information; generates and evaluates alternative solutions; makes recommendations.
Public Service Motivation - Shows a commitment to serve the public. Ensures that actions meet public needs; aligns organizational objectives and practices with public interests.
*Resilience - Deals effectively with pressure; remains optimistic and persistent, even under adversity. Recovers quickly from setbacks.
Strategic Thinking - Formulates objectives and priorities, and implements plans consistent with the long-term interests of the organization in a global environment. Capitalizes on opportunities and manages risks.
*Team Building - Inspires and fosters team commitment, spirit, pride, and trust. Facilitates cooperation and motivates team members to accomplish group goals.
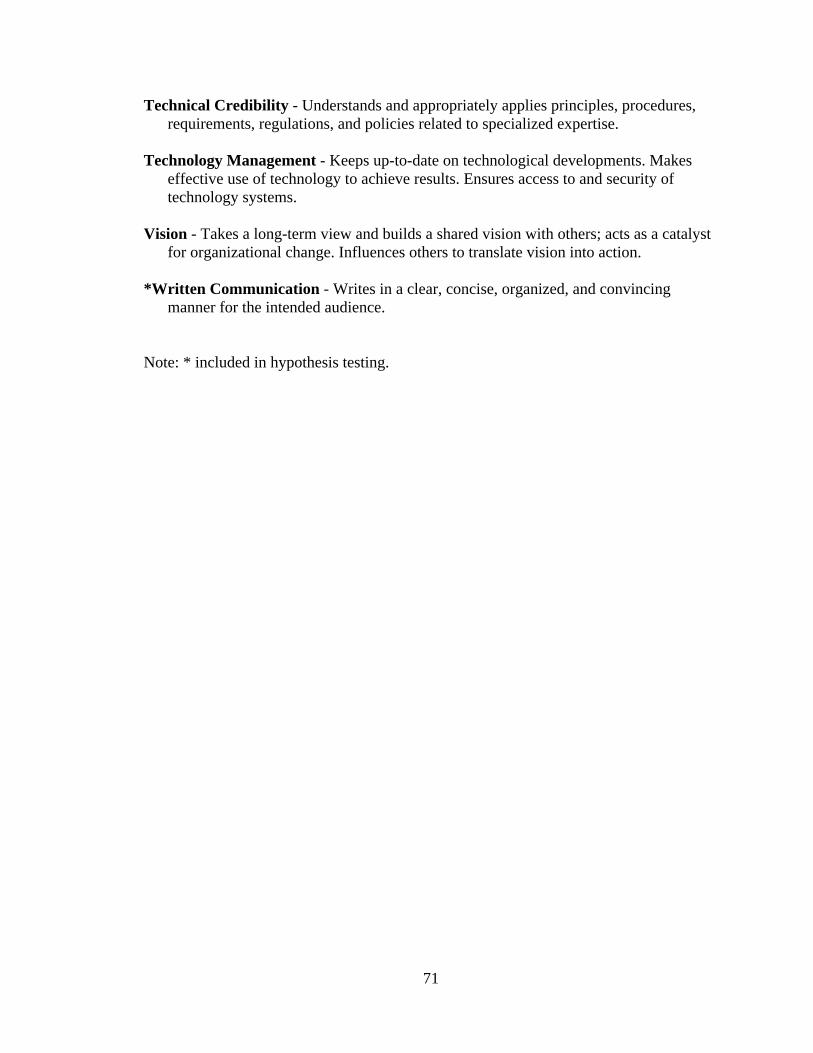
71
Technical Credibility - Understands and appropriately applies principles, procedures, requirements, regulations, and policies related to specialized expertise.
Technology Management - Keeps up-to-date on technological developments. Makes effective use of technology to achieve results. Ensures access to and security of technology systems.
Vision - Takes a long-term view and builds a shared vision with others; acts as a catalyst for organizational change. Influences others to translate vision into action.
*Written Communication - Writes in a clear, concise, organized, and convincing manner for the intended audience.
Note: * included in hypothesis testing.

72
Appendix B - OPM Leadership 360 Items
FUNDAMENTAL COMPETENCIES
Public Service Motivation
Shows a commitment to serve the public. Ensures that actions meet public needs; aligns organizational objectives and practices with public interests.
1. Demonstrates a commitment to public service 2. Inspires others to be service oriented 3. Makes organizational decisions after considering the impact on the public
Integrity and Honesty
Behaves in an honest, fair, and ethical manner. Shows consistency in words and actions. Models high standards of ethics.
4. Acts in a fair and ethical manner 5. Follows through on commitments and promises 6. Inspires trust and confidence
Interpersonal Skills
Treats others with courtesy, sensitivity, and respect. Considers and responds appropriately to the needs and feelings of different people in different situations.
7. Treats others with courtesy and respect 8. Handles interpersonal problems tactfully 9. Develops and maintains cooperative working relationships
Oral Communication
Makes clear and convincing oral presentations. Listens effectively; clarifies information as needed.
10. Makes convincing oral presentations 11. Explains complex information clearly 12. Listens to others and seeks clarification when needed 13. Ensures that everyone’s viewpoint is fully heard 14. Encourages open communication among employees 15. Informs employees of events that might affect their work
Written Communication
Writes in a clear, concise, organized, and convincing manner for the intended audience.
16. Writes convincingly for different audiences 17. Writes in a clear and organized manner 18. Effectively edits complex or sensitive reports and materials

73
Continual Learning
Assesses and recognizes own strengths and weaknesses; pursues self-development.
19. Learns from mistakes 20. Recognizes own strengths and weaknesses 21. Participates in training and self-development activities
LEADING CHANGE
Creativity and Innovation
Develops new insights into situations; questions conventional approaches; encourages new ideas and innovations; designs and implements new or cutting edge programs/processes.
22. Looks for better ways to accomplish work 23. Thinks “outside the box” to improve products, services, and processes 24. Encourages creativity and innovation
External Awareness
Understands and keeps up-to-date on local, national, and international policies and trends that affect the organization and shape stakeholders' views; is aware of the organization's impact on the external environment.
25. Keeps up-to-date with relevant laws, regulations, policies, and procedures that affect the organization
26. Monitors political and economic trends that may affect the organization 27. Considers external issues affecting the organization when making program decisions
Flexibility
Is open to change and new information; rapidly adapts to new information, changing conditions, or unexpected obstacles.
28. Is open to new ideas and opinions from others 29. Adapts to organizational change 30. Changes priorities, when necessary, as situations change
Resilience
Deals effectively with pressure; remains optimistic and persistent, even under adversity. Recovers quickly from setbacks.
31. Works well under pressure 32. Recovers quickly from setbacks 33. Overcomes obstacles to obtain needed resources

74
Strategic Thinking
Formulates objectives and priorities, and implements plans consistent with the long-term interests of the organization in a global environment. Capitalizes on opportunities and manages risks.
34. Establishes long-term goals and objectives for the organization 35. Develops effective strategies to meet organizational goals 36. Plans for potential organizational threats and opportunities
Vision
Takes a long-term view and builds a shared vision with others; acts as a catalyst for organizational change. Influences others to translate vision into action.
37. Builds a shared vision of the organization’s future 38. Communicates the organization’s mission, vision, and values 39. Promotes change consistent with the organization’s vision
LEADING PEOPLE
Conflict Management
Encourages creative tension and differences of opinions. Anticipates and takes steps to prevent counter-productive confrontations. Manages and resolves conflicts and disagreements in a constructive manner.
40. Acts before conflict escalates 41. Deals with interpersonal problems in a timely manner 42. Includes all affected parties in resolving conflicts
Leveraging Diversity
Fosters an inclusive workplace where diversity and individual differences are valued and leveraged to achieve the vision and mission of the organization.
43. Makes the most of each employee’s talents to meet organizational goals 44. Respects cultural, religious, gender, and racial differences 45. Creates an environment in which diversity is valued
Developing Others
Develops the ability of others to perform and contribute to the organization by providing ongoing feedback and by providing opportunities to learn through formal and informal methods.
46. Involves employees in important decisions 47. Provides employees with constructive suggestions to improve their job performance 48. Ensures that staff is capable and trained 49. Supports long-term employee development

75
Team Building
Inspires and fosters team commitment, spirit, pride, and trust. Facilitates cooperation and motivates team members to accomplish group goals.
50. Creates an atmosphere of cooperation among team members 51. Inspires pride and team spirit among team members
52. Delegates authority to teams 53. Builds teams of appropriate size and structure to accomplish work goals
RESULTS DRIVEN
Accountability
Holds self and others accountable for measurable high-quality, timely, and cost-effective results. Determines objectives, sets priorities, and delegates work. Accepts responsibility for mistakes. Complies with established control systems and rules.
54. Ensures that work responsibilities and assignments are clearly defined 55. Sets challenging but realistic performance goals 56. Reviews employees’ progress toward goals on a regular basis 57. Achieves results within set time frames
58. Manages time effectively
59. Ensures that important records are maintained and preserved 60. Protects the privacy of employees, customers, and members of the public 61. Safeguards assets and ensures accountability for property and equipment
Customer Service
Anticipates and meets the needs of both internal and external customers. Delivers high-quality products and services; is committed to continuous improvement.
62. Anticipates customer needs 63. Continuously improves products and services 64. Promotes the use of good customer service techniques
Decisiveness
Makes well-informed, effective, and timely decisions, even when data are limited or solutions produce unpleasant consequences; perceives the impact and implications of decisions.
65. Makes sound and timely decisions 66. Makes effective decisions, even when data are limited 67. Makes decisions that keep projects moving toward completion

76
Entrepreneurship
Positions the organization for future success by identifying new opportunities; builds the organization by developing or improving products or services. Takes calculated risks to accomplish organizational objectives.
68. Promotes the organization’s products and services 69. Identifies strategies to develop new products and services 70. Takes calculated risks to accomplish organizational goals
Problem Solving
Identifies and analyzes problems; weighs relevance and accuracy of information; generates and evaluates alternative solutions; makes recommendations.
71. Takes the initiative to solve problems affecting the work of the organization 72. Gathers information from relevant sources before generating solutions to problems 73. Considers and evaluates alternative courses of action when solving problems
Technical Credibility
Understands and appropriately applies principles, procedures, requirements, regulations, and policies related to specialized expertise.
74. Demonstrates technical expertise in area of responsibility 75. Knows relevant procedures, requirements, and regulations 76. Is actively sought out by others for technical expertise
BUSINESS ACUMEN
Financial Management
Understands the organization's financial processes. Prepares, justifies, and administers the program budget. Oversees procurement and contracting to achieve desired results. Monitors expenditures and uses cost-benefit thinking to set priorities.
77. Prepares and justifies a budget that meets program needs 78. Uses cost-effective approaches to accomplish work 79. Reviews expenditures regularly to keep within budget limitations
Human Capital Management
Builds and manages workforce based on organizational goals, budget considerations, and staffing needs. Ensures that employees are appropriately recruited, selected, appraised, and rewarded; takes action to address performance problems. Manages a multi-sector workforce and a variety of work situations.
80. Recruits and selects well-qualified employees 81. Delegates work effectively 82. Provides fair and accurate performance appraisals 83. Recognizes employees for doing good work 84. Takes corrective action when employees do not meet performance standards

77
85. Provides guidance and support to employees as needed to perform their jobs 86. Effectively manages workplace flexibilities (e.g., telework and alternative work
schedules)
Technology Management
Keeps up-to-date on technological developments. Makes effective use of technology to achieve results. Ensures access to and security of technology systems.
87. Identifies new technologies to meet the organization’s needs 88. Ensures that employees acquire up-to-date technology skills 89. Makes cost-effective use of technology to meet the organization’s goals
Partnering
Develops networks and builds alliances; collaborates across boundaries to build strategic relationships and achieve common goals.
90. Develops professional relationships with colleagues inside and outside of the organization
91. Builds networks of constituents, stakeholders, and decision-makers 92. Encourages collaboration across organizations
Political Savvy
Identifies the internal and external politics that impact the work of the organization. Perceives organizational and political reality and acts accordingly.
93. Recognizes the political implications of different courses of action for the organization
94. Recognizes the needs and perceptions of key stakeholders 95. Identifies the internal and external politics that affect the work of the organization
Influencing/Negotiating
Persuades others; builds consensus through give and take; gains cooperation from others to obtain information and accomplish goals.
96. Identifies common interests of parties in negotiations 97. Builds consensus about the appropriate course of action 98. Persuades others to adopt recommendations
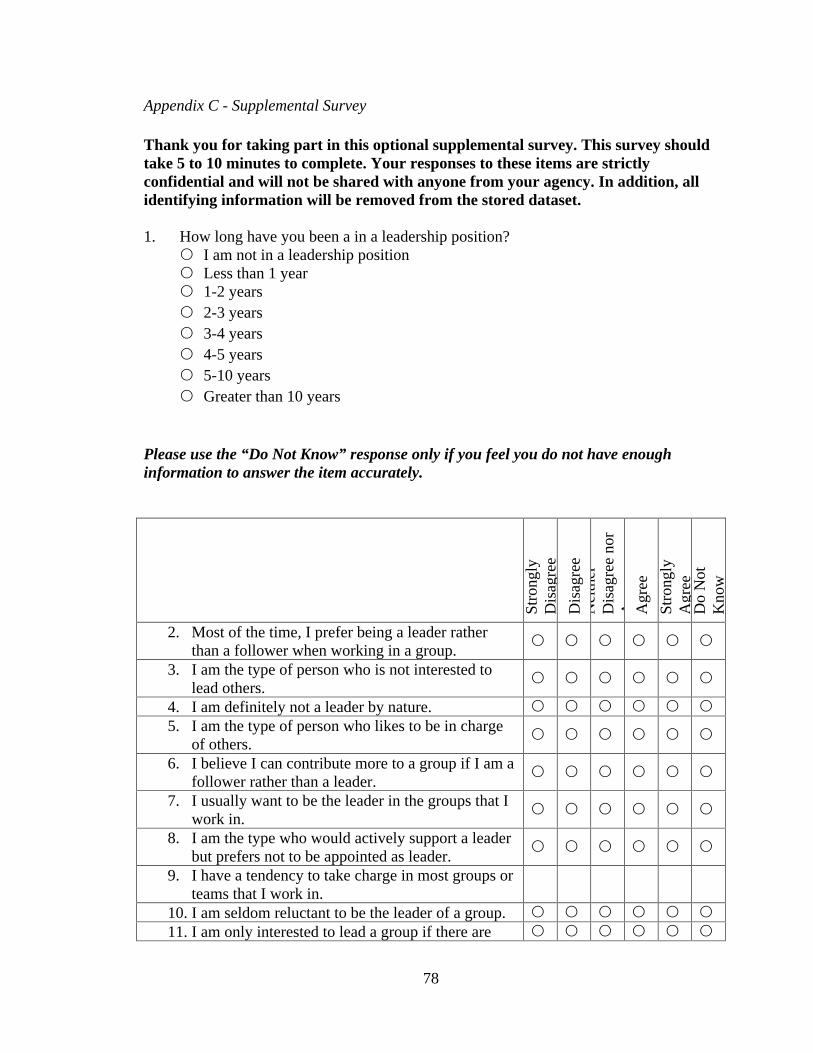
78
Appendix C - Supplemental Survey
Thank you for taking part in this optional supplemental survey. This survey should take 5 to 10 minutes to complete. Your responses to these items are strictly confidential and will not be shared with anyone from your agency. In addition, all identifying information will be removed from the stored dataset.
1. How long have you been a in a leadership position?
I am not in a leadership position
Less than 1 year
1-2 years
2-3 years
3-4 years
4-5 years
5-10 years
Greater than 10 years
Please use the “Do Not Know” response only if you feel you do not have enough information to answer the item accurately.
Stro
ngly
D
isag
ree
Dis
agre
e N
eith
er
Dis
agre
e no
r A
gree
Agr
ee
Stro
ngly
A
gree
Do
Not
K
now
2. Most of the time, I prefer being a leader rather than a follower when working in a group.
3. I am the type of person who is not interested to lead others.
4. I am definitely not a leader by nature.
5. I am the type of person who likes to be in charge of others.
6. I believe I can contribute more to a group if I am a follower rather than a leader.
7. I usually want to be the leader in the groups that I work in.
8. I am the type who would actively support a leader but prefers not to be appointed as leader.
9. I have a tendency to take charge in most groups or teams that I work in.
10. I am seldom reluctant to be the leader of a group.
11. I am only interested to lead a group if there are

79
clear advantages for me. 12. I will never agree to lead if I cannot see any
benefits from accepting that role.
13. I would only agree to be a group leader if I know I
can benefit from that role.
14. I would agree to lead others even if there are no
special rewards or benefits with that role.
15. I would want to know "what's in it for me" if I am going to agree to lead a group.
16. I never expect to get more privileges if I agree to lead a group.
17. If I agree to lead a group, I would never expect any advantages or special benefits.
18. I have more of my own problems to worry about than to be concerned about the rest of the group.
19. Leading others is really more of a dirty job rather than an honorable one.
20. I feel that I have a duty to lead others if I am asked.
21. I agree to lead whenever I am asked or nominated by the other members.
22. I was taught to believe in the value of leading others.
23. It is appropriate for people to accept leadership roles or positions when they are asked.
24. I have been taught that I should always volunteer to lead others if I can.
25. It is not right to decline leadership roles.
26. It is an honor and a privilege to be asked to lead.
27. People should volunteer to lead rather than wait for others to ask or vote for them.
28. I would never agree to lead just because others voted for me.
For the following items please rate your confidence in your ability to perform each of the following tasks. In these questions, "work group" refers to the group of employees currently reporting to you. If you do not have employees currently reporting to you then provide your confidence in your ability to perform these tasks if you did have a team of individuals reporting to you.
Rate your confidence level by selecting a number on the 100-point probability scale. For example, 0% reflects not at all confident, 50% reflects an intermediate level of confidence, and 100% means completely confident.

80
0%
10%
20%
30%
40%
50%
60%
70%
80%
90%
100%
29. I can figure out the best direction for where my work group needs to go in the future.
30. I can identify the most critical areas for making meaningful improvements in my work group's effectiveness.
31. I can develop plans for change that will take my work group in important new directions.
32. I can see the path my work group needs to take in order to significantly improve our effectiveness.
33. I can develop trusting relationships with my employees such that they will embrace change goals with me.
34. I can obtain the genuine support of my employees for new initiatives in the work group.
35. I can develop relationships with my employees that will motivate them to give their best efforts at continuous improvement.
36. I can gain my employees' commitment to new goals.
37. I can figure out ways for overcoming resistance to change from others whose cooperation we need to improve things.
38. I can figure out ways for my work group to solve

81
any policy or procedural problems hindering our change efforts.
39. I can work with my employees to overcome any resource limitations hindering our efforts at moving the work group forward.
40. I can find the needed supporters in management to back our change efforts.
The following items ask you to describe your relationship with your direct supervisor (i.e. the individual who will provide the supervisory rating as part of your OPM Leadership 360 assessment). For each of the items, indicate the degree to which you think the item is true for you.
41. Do you know where you stand with your supervisor…do you usually know how satisfied your supervisor is with what you do?
Rarely
Occasionally
Sometimes
Fairly Often
Very Often 42. How well does your supervisor understand your job problems and needs?
Not a bit
A little
A fair amount
Quite a bit
A great deal 43. How well does your supervisor recognize your potential
Not at all
A little
Moderately
Mostly
Fully 44. Regardless of how much formal authority he or she has built into his or her
position, what are the chances that your supervisor would use his or her power to help you solve problems in your work?
None
Small
Moderate
High
Very High
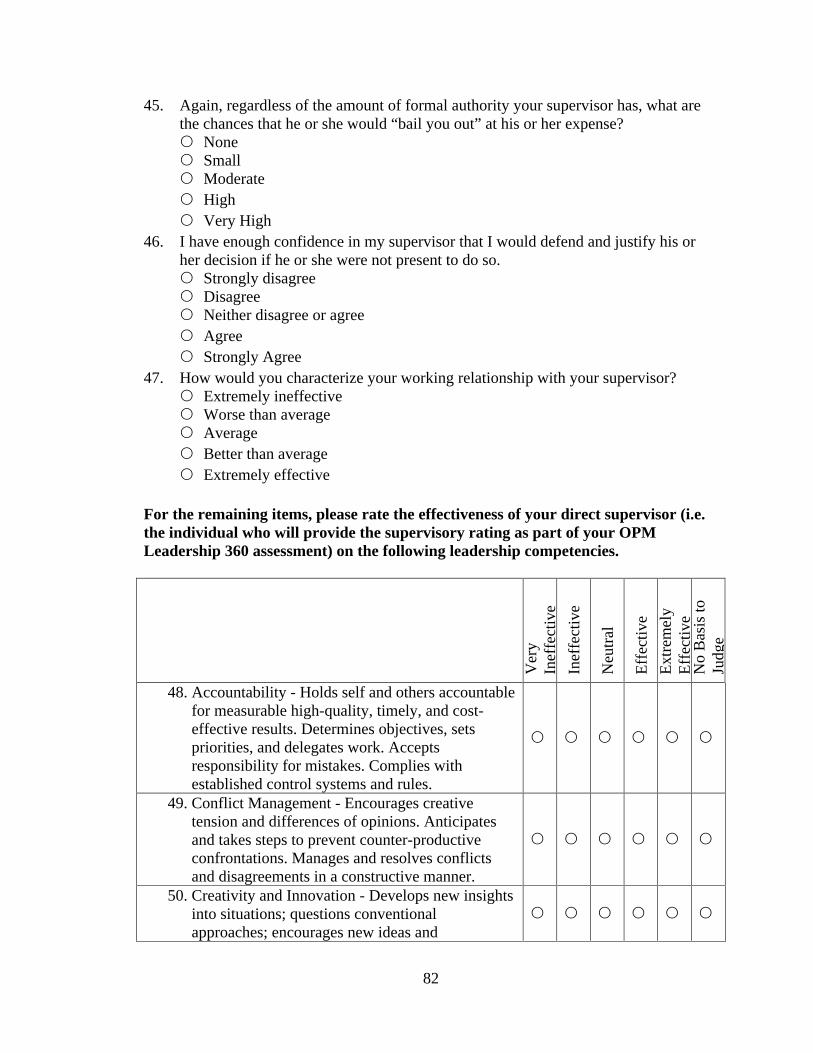
82
45. Again, regardless of the amount of formal authority your supervisor has, what are the chances that he or she would “bail you out” at his or her expense?
None
Small
Moderate
High
Very High
46. I have enough confidence in my supervisor that I would defend and justify his or her decision if he or she were not present to do so.
Strongly disagree
Disagree
Neither disagree or agree
Agree
Strongly Agree 47. How would you characterize your working relationship with your supervisor?
Extremely ineffective
Worse than average
Average
Better than average
Extremely effective
For the remaining items, please rate the effectiveness of your direct supervisor (i.e. the individual who will provide the supervisory rating as part of your OPM Leadership 360 assessment) on the following leadership competencies.
Ver
y In
effe
ctiv
e
Inef
fect
ive
Neu
tral
Eff
ecti
ve
Ext
rem
ely
Eff
ecti
ve
No
Bas
is to
Ju
dge
48. Accountability - Holds self and others accountable for measurable high-quality, timely, and cost-effective results. Determines objectives, sets priorities, and delegates work. Accepts responsibility for mistakes. Complies with established control systems and rules.
49. Conflict Management - Encourages creative tension and differences of opinions. Anticipates and takes steps to prevent counter-productive confrontations. Manages and resolves conflicts and disagreements in a constructive manner.
50. Creativity and Innovation - Develops new insights into situations; questions conventional approaches; encourages new ideas and

83
innovations; designs and implements new or cutting edge programs/processes.
51. Decisiveness - Makes well-informed, effective, and timely decisions, even when data are limited or solutions produce unpleasant consequences; perceives the impact and implications of decisions.
52. Developing Others - Develops the ability of others to perform and contribute to the organization by providing ongoing feedback and by providing opportunities to learn through formal and informal methods.
53. Flexibility - Is open to change and new information; rapidly adapts to new information, changing conditions, or unexpected obstacles.
54. Integrity and Honesty - Behaves in an honest, fair, and ethical manner. Shows consistency in words and actions. Models high standards of ethics.
55. Interpersonal Skills - Treats others with courtesy, sensitivity, and respect. Considers and responds appropriately to the needs and feelings of different people in different situations.
56. Oral Communication - Makes clear and convincing oral presentations. Listens effectively; clarifies information as needed.
57. Problem Solving - Identifies and analyzes problems; weighs relevance and accuracy of information; generates and evaluates alternative solutions; makes recommendations.
58. Resilience - Deals effectively with pressure; remains optimistic and persistent, even under adversity. Recovers quickly from setbacks.
59. Team Building - Inspires and fosters team commitment, spirit, pride, and trust. Facilitates cooperation and motivates team members to accomplish group goals.
60. Written Communication - Writes in a clear, concise, organized, and convincing manner for the intended audience.