an assessment-based study of listening sub-skills using ...
221
ResearchOnline@JCU This file is part of the following work: Guan, Yuanyuan (2019) EFL listening development through diagnosis: an assessment-based study of listening sub-skills using Rasch measurement. PhD Thesis, James Cook University. Access to this file is available from: https://doi.org/10.25903/5f079c1daaa29 Copyright © 2019 Yuanyuan Guan. The author has certified to JCU that they have made a reasonable effort to gain permission and acknowledge the owners of any third party copyright material included in this document. If you believe that this is not the case, please email [email protected]
-
Upload
khangminh22 -
Category
Documents
-
view
2 -
download
0
Transcript of an assessment-based study of listening sub-skills using ...

ResearchOnline@JCU
This file is part of the following work:
Guan, Yuanyuan (2019) EFL listening development through diagnosis: an
assessment-based study of listening sub-skills using Rasch measurement. PhD
Thesis, James Cook University.
Access to this file is available from:
https://doi.org/10.25903/5f079c1daaa29
Copyright © 2019 Yuanyuan Guan.
The author has certified to JCU that they have made a reasonable effort to gain
permission and acknowledge the owners of any third party copyright material
included in this document. If you believe that this is not the case, please email

EFL Listening Development Through Diagnosis
- An Assessment-based Study of Listening
Sub-skills Using Rasch Measurement
Thesis submitted by
GUAN Yuanyuan
M.A.
in July 2019
in partial fulfillment of the requirements
for the degree of Doctor of Philosophy
in the College of Arts, Society and Education
James Cook University

I
STATEMENT OF ACCESS
I, the undersigned, author of this book, understand that James Cook University will
make this thesis available for use within the University Library and, via the Australian
Digital Theses network for use elsewhere.
I understand that, as an unpublished work, a thesis has significant protection under the
Copyright Act and I do not wish to place any further restriction on access to this work.
15 July 2019 Signature Date

II
DECLARATION ON SOURCES
I declare that this thesis is my own work and has not been submitted in any form for
another degree or diploma at any university or other institution of tertiary education.
Information derived from the published or unpublished work of others has been
acknowledged in the text and a list of references is given.
15 July 2019 Signature Date

III
STATEMENT OF ACCESS
ELECTRONIC COPY
I, the undersigned, author of this thesis, declare that the electronic copy of this thesis
provided to the James Cook University Library is an accurate copy of the printed thesis
submitted, within the limits of the technology available.
15 July 2019 Signature Date

IV
STATEMENT ON THE CONTRIBUTIONS OF OTHERS
Supervisors:
Professor Trevor G. Bond, Dr. Claire Campbell, Dr. Yan Zi and Dr. Jane Lockwood
Financial Support:
College of Arts, Society and Education, JCU: JCU Postgraduate Research Scholarship
College of Arts, Society and Education, JCU: Tuition-waiver
Data Collection:
I would like to express my gratitude to the generous support of the DELTA project in
the Hong Kong Polytechnic University, City University of Hong Kong, and Lingnan
University, which provided me access to the test data.
15 July 2019 Signature Date

V
ACKNOWLEDGEMENTS
This journey would not have been possible without the love and support of many friends, colleagues, and my family.
First, I would like to thank Prof. Trevor Bond, my primary supervisor, for his tenacity and dedication to ensure I complete this thesis. His complete faith in my ability and endless patience has given me the courage and motivation to carry on despite the difficulties I encountered. I have benefited enormously from his academic expertise and have always felt privileged to have been supported by such an expert in the field.
To my secondary supervisors, Dr. Claire Campell, Dr. Yan Zi and Dr Jane Lockwood, I would like to express my utmost gratitude for agreeing to be part of the team that helped me see this thesis through. The extensive and valuable feedback they gave on my drafts, and more importantly, the emotional support they gave when I encountered personal difficulties, significantly helped me believe that I can accomplish this task.
Neither would this study have been possible without the generous help I received from many friends and colleagues. I would like to thank the DELTA team (Dr Alan Urmston, Dr. Michelle Raquel, Winnie Shum, Felicia Fang, Dr Carrie Tsang, and Roxanne Miller) for providing the data for my study and for their moral and intellectual support.
Thanks also to Prof. Mike Linacre, Dr. Vahid Aryadoust, Prof. Jack Stenner, Prof. George Engelhard, Dr. James Sick, and Prof. Mortiz Heene for giving me invaluable advice on problems I encountered with data analysis.
Ms Kerry Knight and Mrs Marie Bond deserve special mention for their generous assistance during my visits to James Cook University.
Finally, I would like to thank my family for their love, care, and understanding. They have given me the ultimate inspiration to pursue this endeavor.

VI
ABSTRACT
The lack of informed knowledge about listening subskills and their relationships
has hindered the development of the diagnostic English language track assessment
(DELTA) in three participating Hong Kong universities. This study investigates English
as a foreign language (EFL) learners’ listening proficiency development in understanding
different spoken genres in the Hong Kong Chinese tertiary contexts. It aims to: i) identify
the subskills and/or cognitive processes that underlie student performance on the DELTA
listening component; ii) examine the difficulty levels of the DELTA listening subskills,
and, consequentially, their hierarchical order; iii) investigate the impact of text type on
difficulty level and the hierarchical order of the subskills; and iv) infer principles
underlying the development of listening proficiency in the Hong Kong tertiary education
contexts.
A multi-method approach was employed for data collection and analysis. The
primary quantitative data were derived from the DELTA listening component items
answered by 2830 Chinese ELF learners who studied in their first or second year in the
DELTA participating universities in the 2013-14 academic year. The item pool included
207 multiple-choice questions (MCQ) from 33 texts of three text types – conversation,
interview and lecture. Each MCQ is intended to measure a particular listening subskill,
including: 1) identifying specific information (SSK1); 2) understanding main idea and
supporting ideas (SSK2); 3) understanding information and making an inference (SSK3);
4) interpreting a word or phrase as used by the speaker (SSK4); 5) inferring the attitude
or intention of the speaker (SSK5); and 6) inferring the speaker’s reasoning (SSK6). By
adopting inter-related Rasch analyses using Winsteps and Facets, all test items were
calibrated and analysed to determine their difficulty measures and their respective
difficulties across the three text types. Qualitative Stimulated Recall Protocol (SRP)
discussions were then conducted with 62 examinees of varying estimated listening
abilities one month later, in a simulated test situation, where the test-taking process was
video-recorded and the participants were asked to recall and to verbalise their thought
processes and strategies they used to answer each question.
The SRP results reveal an array of both cognitive processes and test-taking
strategies in the listening comprehension and test-answering process. Firstly, various
combinations of cognitive processes were utilised by both the high and low ability

VII
examinees to answer questions targeting the same listening sub-skill; however, the
dominant cognitive process that was reported to have been used to answer each question
corresponded with the particular listening subskill intended by DELTA item writers.
Secondly, an array of test-taking strategies best identified as elimination, and guessing,
were reported as used by examinees during the test. While this finding might not be
surprising given the exam-oriented atmosphere prevailing in Hong Kong secondary
school education, it alerted the researcher to scrutinise the validity of the DELTA
listening component.
The most striking observation from the listening test analysis is that, the DELTA
listening subskills are measurably separable from each other, and a hierarchical pattern is
established. In terms of their interaction with text type, the results showed that SSK1 and
SSK6 were, respectively, the easiest and the most difficult subskills, whereas the
hierarchical orders of the other four subskills varied across the three text types. More
generally, these findings provide empirical evidence for the proposition that EFL listening
comprehension is composed of multiple listening subskills, which operate interactively
and interdependently in the listening process. The results regarding the difficulty level
and the hierarchy of listening subskills corroborate the findings of prior research that low-
level processing, such as identifying specific information, poses less challenge than high-
level processing, such as summarising and inferencing. Because of the complexity in the
interaction between text type and listening subskills, it is difficult to identify an
overarching hierarchical order of the six listening subskills across the three text types. A
general pattern, however, is that the difficulty increased from SSK1, SSK2 to SSK6
irrespective of the text type, and this corresponds to the general subskill hierarchy.
The study will benefit teachers and students with diagnostic profiling and bridge
the gap in diagnostic test design with targeted items of appropriate difficulty for
predicting learners’ listening development. It will extend second language acquisition
theory with a hierarchical trajectory of listening proficiency growth. Limitations and
future research recommendations are discussed.

VIII
TABLE OF CONTENTS
STATEMENT OF ACCESS ............................................................................................. I
DECLARATION ON SOURCES .................................................................................... II
STATEMENT OF ACCESS .......................................................................................... III
STATEMENT ON THE CONTRIBUTIONS OF OTHERS ......................................... IV
ACKNOWLEDGEMENTS ............................................................................................. V
ABSTRACT.................................................................................................................... VI
TABLE OF CONTENTS............................................................................................. VIII
LIST OF TABLES ........................................................................................................... X
TABLE OF FIGURES ................................................................................................... XII
CHAPTER ONE INTRODUCTION ................................................................................ 1
1.1 Background to the Study ........................................................................................... 1
1.2 Research Context ........................................................................................................ 4
1.3 Research Objectives, Questions and Scope of the Study ...................................... 7
1.4 Outline of the Study ................................................................................................... 8
CHAPTER TWO LITERATURE REVIEW .................................................................. 11
2.1 Language Test Construct and Validity ..................................................................12
2.2 Cognitive Processing in Listening Comprehension .............................................14
2.3 The Subskill or Componential Approach to Listening ........................................19
2.4 Factors Affecting Listening Comprehension Process ..........................................26
2.5 Text Type and Listening Comprehension .............................................................42
2.6 Test-taking Strategies in Listening Comprehension ............................................44
2.7 Adopting the Rasch Model for Measurement .......................................................45
2.8 Summary ....................................................................................................................50
CHAPTER THREE METHODOLOGY ........................................................................ 51
3.1 The DELTA Listening Component ........................................................................51
3.2 Test Administration ..................................................................................................53
3.3 Stimulated Recall Protocol ......................................................................................55
3.4 Ethical clearance .......................................................................................................63
3.5 Summary ....................................................................................................................63
CHAPTER FOUR LISTENING TEST DATA ANALYSIS ......................................... 64
4.1 Data Structure............................................................................................................64

IX
4.2 Winsteps Analysis ....................................................................................................66
4.3 ANOVA Test ............................................................................................................71
4.4 Facets Analysis .........................................................................................................71
4.5 Interaction Analysis ..................................................................................................82
4.6 Summary ....................................................................................................................82
CHAPTER FIVE LISTENING TEST RESULTS.......................................................... 84
5.1 Winsteps Analysis Results: Global Model Fit ......................................................84
5.2 ANOVA Test Results: Subskill Difficulties .........................................................86
5.3 Facets Analysis Results ...........................................................................................93
5.4 Comparison of the Different Sets of Results ......................................................103
5.5 Summary of the difficulty and hierarchical measures of subskills ..................106
5.6 Interaction Analysis Results ..................................................................................107
5.7 Summary ..................................................................................................................117
CHAPTER SIX STIMULATED RECALL PROTOCOL RESULTS ......................... 119
6.1 SPR Listening Test Data and Results ..................................................................119
6.2 SRP Results .............................................................................................................124
6.3 Summary ..................................................................................................................141
CHAPTER SEVEN DISCUSSION AND CONCLUSION ......................................... 142
7.1 Introduction .............................................................................................................142
7.2 Cognitive Processes and Test-taking Strategies Underlying DELTA Listening Component .............................................................................................................143
7.3 Divisibility of DELTA Listening Subskills and Their Hierarchical Relationship............................................................................................................152
7.4 The Relationship Between Text Type and Subskills and Their Hierarchy .....155
7.5 Contributions and Implications .............................................................................156
7.6 Limitations and Future Research ..........................................................................160
7.7 Conclusions .............................................................................................................160
REFERENCE LIST ...................................................................................................... 162
APPENDIX A: DESCRIPTIONS AND EXAMPLES OF THE NVIVO CODINGS . 181
APPENDIX B: THE PERCENTAGE AGREEMENT AND KAPPA COEFFICIENTS OF DOUBLE CODING ...................................................................................... 184
APPENDIX C: ETHICS CLEARANCE PACKAGE .................................................. 186

X
LIST OF TABLES
Table 3.1 The allocation of DELTA listening test components ..................................... 54
Table 4.1 Subskill and item distribution across text type ............................................... 64
Table 4.2 Overall person and item statistics ................................................................... 66
Table 4.3 Free analysis statistics..................................................................................... 69
Table 4.4 Item and person statistics after omitting 280 low performing persons ........... 69
Table 4.5 Item and person statistics after CUTLO analysis ........................................... 69
Table 4.6 Item and person statistics after omitting 362 underfitting persons ................. 70
Table 4.7 Item and person statistics after deleting 362+33 underfitting persons ........... 70
Table 4.8 Subskills Measurement Report – Items Grouped by 18 subskill*texttype ..... 76
Table 4.9 Subskills Measurement Report – Items Grouped RANDOMLY into 18 ....... 77
Table 5.1 Standardised residual variance in Eigenvalue units of the entire data............ 84
Table 5.2 Standardised residual variance in Eigenvalue units of the reduced data ........ 85
Table 5.3 Descriptive statistics of subskills across text type with items measures from
Winsteps calibration analysis ......................................................................... 87
Table 5.4 Test of Homogeneity of Variances – item measures from Winsteps calibration
analysis ........................................................................................................... 89
Table 5.5 ANOVA results – item measures from Winsteps calibration analysis results 90
Table 5.6 Descriptive statistics of subskills across text types from Winsteps subskill
subtest analysis ............................................................................................... 91
Table 5.7 Test of Homogeneity of Variances – items measures from ............................ 92
Table 5.8 Multiple Comparisons: Scheffe – item measures from Winsteps subskill
subtests analysis ............................................................................................. 92
Table 5.9 Subskills measurement report (arranged by measure) from group-anchoring
both subskills .................................................................................................. 94
Table 5.10 Bias/interaction report (arranged by measure) ............................................. 95
Table 5.11 All facet statistics summary (item group-anchored and text type as a facet) 96
Table 5.12 Subskill measurement report after free analysis (item group-anchored and
text type as a facet) ......................................................................................... 97
Table 5.13 All facet statistics summary (item group-anchored and text type as
dummy) ...................................................................................................................... 98
Table 5.14 Subskill measurement report after free analysis (item group-anchored and
text type as dummy) ....................................................................................... 99

XI
Table 5.15 Subskill measurement report after calibration (item group-anchored and text
type as dummy) ............................................................................................ 101
Table 5.16 All facet statistics summary – item unfaceted ............................................ 102
Table 5.17 Subskill measure report – item unfaceted (after calibration)...................... 103
Table 5.18 Bias/Interaction report from item-GA text-type-faceted analysis .............. 108
Table 5.19 Bias/Interaction report from item-GA text-type-dummy analysis .............. 112
Table 5.20 Bias/Interaction report from item-unfaceted analysis ................................. 115
Table 6.1 Summary of texts and respondents used in SRP interviews ......................... 120
Table 6.2 Number of cognitive processes used for each subskill ................................. 124
Table 6.3 Cognitive processes * Subskills crosstabulation .......................................... 126
Table 6.4 Cognitive processes chi-square tests ............................................................ 128
Table 6.5 Cognitive processes symmetric measures .................................................... 128
Table 6.6 Cognitive processes Bootstrap for Symmetric Measures ............................. 128
Table 6.7 Use of elimination strategies by subskill ...................................................... 130
Table 6.8 Use of guessing strategies by subskill .......................................................... 130
Table 6.9 Test-taking strategies * Subskills crosstabulation ........................................ 132
Table 6.10 Test-taking strategies chi-square tests ........................................................ 132
Table 6.11 Test-taking strategies symmetric measures ................................................ 132
Table 6.12 Misfitting SRP interviewees’ use of cognitive processes versus subskills. 137
Table 6.13 Misfitting SRP interviewees’ use of test-taking strategies by subskills ..... 138
Table 6.14 Misfitting SRP interviewees’ use of cognitive processes by ability
groups ........................................................................................................... 139
Table 6.15 Misfitting SRP interviewees’ use of test-taking strategies by ability
groups ........................................................................................................... 140

XII
TABLE OF FIGURES
Figure 2.1 Some components of language use and language test performance. Adapted
from Bachman and Palmer (1996) ................................................................. 27
Figure 4.1 Overall test item structure ............................................................................. 65
Figure 5.1 Subskill measures from the Winsteps calibration analysis ........................... 88
Figure 5.2 Subskill measures from the Winsteps subskill subtest analysis .................... 89
Figure 5.3 Wright Map from Facets analysis Item-group anchored text type dummy . 100
Figure 5.4 Comparison of the measures of subskill from Winsteps calibration and Facets
calibration analyses (item-group anchored and text type-dummy) .............. 102
Figure 5.5 Comparison of the measures of subskill from different analyses ............... 104
Figure 5.6 Comparison of the order of subskills across different analyses .................. 104
Figure 5.7 t-statistics for interaction size from item-GA text type-faceted analysis .... 109
Figure 5.8 Absolute measures of subskills by text type from item-GA ....................... 110
Figure 5.9 Absolute measures of subskills by text type from item-GA ....................... 111
Figure 5.10 Interaction between text type and subskill (t-values) from ....................... 116
Figure 5.11 Absolute measures of subskill from item-unfaceted calibration analysis . 116
Figure 6.1 Scatterplot of all person infit mean squares (incl. SRP) from Winsteps Cal
and CUTLO .................................................................................................. 122
Figure 6.2 Scatterplots of SRP person measures and infit mean-squares from Calibration
and CUTLO analyses ................................................................................... 123
Figure 6.3 Use of cognitive processes and test-taking strategies by different ability
groups............................................................................................................................ 133
Figure 6.4 Use of cognitive processes by different groups........................................... 135
Figure 6.5 Use of test-taking strategies by different groups ......................................... 136
Figure 6.6 Use of cognitive processes and test-taking strategies by the misfitting SRP
interviewees .................................................................................................. 139

1
CHAPTER ONE
INTRODUCTION
1.1 Background to the Study
1.1.1 Listening instruction. Listening is the primary means of acquiring a
language (Rost, 2005; Nation & Newton, 2009) and the fundamental element of
communication skills since communication is not established unless the utterance is
comprehended by the listener (River, 1966). However, it is often neglected due to its
intangibility and complexity and is called the “Cinderella” of the four language skills –
listening, reading, speaking and writing (Nunan, 1999; Vandergrift, 1997). The traditional
audiolingual method of English pedagogy has viewed listening comprehension as a
passive skill which would develop without explicit instruction (Mendelsohn, 1983).
Guided by this approach, learners of English as a Foreign Language (EFL) were drilled
intensively with grammar exercises, vocabulary memorization and reading
comprehension, and were encouraged to learn the language through imitation and practice.
There was limited exposure to authentic listening and speaking environment given the
unavailability of appropriate learning resources.
Similarly, traditional listening classrooms were dominated by listening to audios
and answer checking. Condemning this comprehension approach as not teaching listening
but testing listening, Field (2008b) suggested that listening instruction should focus on
the process rather than the product, and proposed a diagnostic approach to teaching
second language (L2) listening. In this approach teachers should pay more attention to
the techniques and strategies employed by the learners in the comprehension process,
instead of seeking correct answers to comprehension questions. When teachers establish
a full picture of learners’ mastery of the listening techniques, instruction should proceed
with small-scale remedial exercises, which will be likely to help learners develop
listening ability in a constructive way. This approach, therefore, is heavily reliant upon
teachers’ understanding of the cognitive process (i.e., techniques, strategies or skills)
involved in listening comprehension.
With the rapid development of technology, scholars have been able to explore the
nature of the listening skill. Research into listening over the past three decades has, above
all, highlighted the intricacies of the physiological and psychological functions of the

2
brain. Consequently, a body of literature has been published to identify the operations
occurring in the listening comprehension process. Numerous studies have been conducted
to identify factors affecting listening comprehension (Brindley, 1997; Buck, 2001; Jensen
& Hansen, 1995; Jung, 2003; Stahr, 2009), explore the cognitive operations in the process
(Goh, 2000; Graham, 2006; Vandergrift, 2003), and to experiment with different
approaches for more effective instruction (e.g., Field, 2008b; Flowerdew & Miller, 2005;
Lund, 1990; Ur, 1984). Most of these studies share a common purpose to develop a better
understanding of the nature of listening comprehension, and to facilitate language learners
to acquire the language more effectively. This should then help to pave the way for test
developers to construct listening comprehension assessments for different purposes, and
to provide validation evidence for them.
1.1.2 Diagnostic language assessments and research. Language testing provides
a practical solution to determine the academic achievement, progress and potential of
students. However, traditional language testing of merely reporting a summative score to
indicate general ability is criticized because it emphasizes assessment of learning rather
than assessment for learning (Lee & Coniam, 2014; Jang, 2009). Moreover, the holistic
reporting method of a single score for the entire test or sub-test section is deficient in
providing useful information to benefit teaching and learning. It provides little
information about can-dos, and tends to create opportunities for exam techniques and
surface learning.
There has been increasing demand for more fine-tuned feedback on learner
performance so that different stakeholders can have a more detailed understanding of
mastery and non-mastery of knowledge and skills. Recent developments in language
testing have heightened the need for diagnostic assessment due to the capacity it has for
informing the field of language teaching and learning. This type of assessment,
specifically designed to identify the strong and weak areas in language, is often described
as diagnostic language assessment (Alderson, 2005; ALTE, 1998; Bachman, 1990;
Hughes, 2003). Alderson (2005) suggested that diagnostic language assessments should
possess particular features: “(1) developed based on theory; (2) identify learners’
strengths and weaknesses; (3) focus on micro linguistic aspects rather than global abilities;
and (4) provide diagnostic feedback for remedy” (p. 10).

3
It is claimed that diagnostic tests should serve a number of objectives. Two of these
include: the assessment of specific knowledge and skills, and the provision of appropriate
feedback for remedial treatment (Huff & Goodman, 2007; Jang, 2009a; Mousavi, 2009).
The conceptions of the assessment of learning and assessment for learning are
highlighted in this view. Apart from evaluation of learners’ performance on particular
language areas, well-designed diagnostic language tests should be able to provide
significant information with regard to appropriate types and levels of teaching and
learning activities for pedagogical improvement (Alderson, 2005; Bachman, 1990;
Hughes, 2003).
The development and use of diagnostic language assessments have increased
recently. Many are either newly or specifically designed for diagnosing foreign language
ability; for example, the Diagnostic Language Assessment System (DIALANG) in
Europe (Alderson, 2005), Diagnostic English Language Needs Assessment (DELNA) in
New Zealand (Read, 2008), Diagnostic English Language Assessment (DELA) in
Australia, and the Canadian Academic English Language Diagnostic Assessment
(CAELDA) (Doe, 2013), which is a retrofitted version of an existing proficiency /
placement test for diagnostic purposes. However, specifically designed diagnostic
English tests in the Asian region are rare (Tsang, 2013).
A growing number of studies have been conducted to investigate various aspects
of these assessments, especially with a focus on the diagnostic role these tests are
supposed to play in teaching and learning. For example, a series of articles have reported
the development and validation of the rating scale of the DELNA writing component
(Knoch, 2007, 2009, 2011). The appropriateness of using the CAEL for diagnosing
writing ability was examined by Doe (2013). There are also reports of students’ and
teachers’ views of the diagnostic feedback (Doe, 2015) and its impact on English for
Academic Purposes (EAP) curricular renewal and language policy change (Fox, 2009).
Another area where diagnostic language assessment has been widely applied relates to
the reading ability. Drawing upon various statistical techniques such as Q-Matrix or the
Fusion Model, researchers have attempted to profile ESL learners’ reading ability based
on the results from diagnostic reading assessments (Buck, Tatsuoka, & Kostin, 1998; Jang,
2005, 2009b; Kim, 2015; Lee & Sawaki, 2009). These research attempts have confirmed
that diagnosis of different language ability is of considerable importance and has benefits
for language learning.

4
1.1.3 Diagnosis of listening ability. Despite the fast-growing awareness and
adoption of diagnostic assessments in writing, there are comparatively fewer reports on
the diagnosis of the listening ability. Buck (2001) attributed this paucity to our limited
understanding of the sub-components underlying listening skills, let alone the diagnostic
feedback of learner performance to inform teaching and learning. Although a number of
researchers have employed various research methods in efforts to understand the sub-
skills and strategies of L2 listening (e.g., Buck, Tatsuoka, Kostin, & Phelps, 1997; Buck
& Tatsuoka, 1998; Goh, 2000), few of these were conducted in the context of diagnostic
assessments. Further, controversies exist as to whether the listening subskills are
empirically separable and orderable. As a consequence, there is a need for research
specifically to investigate the underlying constructs of listening assessments for
diagnosing learners’ strengths and weaknesses in listening skills and giving useful
formative information for listening instruction.
1.2 Research Context
1.2.1 The status of English in Hong Kong. From a sociolinguistic perspective,
ESL generally refers to situations when students learn English as a second language in a
foreign country where English is the predominant language for communication (e.g.,
United Kingdom, the United States of America, Canada, and Australia), while EFL
commonly refers to situations when students learn English as a foreign language in their
own countries where English is neither used for communication or medium of instruction
in schools (e.g., China, Japan, Thailand) (Phakiti (2006). Given the historic background
of Hong Kong, the status of English is both unique and complex in the city. While
Cantonese is predominantly the first language, English is seen as either a second or a
foreign language (Evans, 2016; Kirkpatrick, 2007; Scollon & Scollon, 2001). During the
British colonial period, English was the official language of government and education,
however, it was not used by the majority of the Chinese population in daily life. Since the
1997 handover, the government of Hong Kong Special Administrative Region (HKSAR)
has been implementing a “biliteracy and trilingualism” language education policy with
the aim to educate a generation who master written Chinese and English, and speak fluent
Cantonese, Mandarin and English. From 1998 to 2009, mother tongue education was
advocated by the government and schools were encouraged to adopt Cantonese as the
medium of instruction (CMI), which was later found to produce smaller numbers of
qualified graduates for higher education (Poon, 2009; Tsang, 2008). This triggered the

5
introduction of fine-tuning medium of instruction (MOI) policy in 2010, where secondary
schools have the flexibility to choose which language to use to teach which groups of
students. Therefore, both CMI and EMI co-exist in the current secondary school
education. However, the great majority of tertiary education utilises English as the sole
medium of instruction given its historic role in higher education in Hong Kong and its
unrivalled status as the global lingua franca since the late 20th century (Evans, 2016;
Jenkins, 2013). Researchers discovered that many students who studied in CMI schools
would encounter considerable challenges transitioning to the new tertiary EMI learning
environment, especially in listening to discipline-specific and academic vocabulary
(Evans & Bruce, 2012).
Despite the institutional status of English, its practical use by the general public
can never rival that of the Cantonese. According to Evans (2016, 2018), Cantonese is
used as the first language (L1) by 90% of the population whereas English and Mandarin
are spoken as additional languages (ALs) by 40%. It seems “the status of English in Hong
Kong cannot readily be compared with situations where English functions either as a
second language or a foreign language” (Luke & Richards, 1982, p. 55). Moreover,
numerous studies of English learning, teaching and research have treated the language as
either a second language (e.g., Liu, Yeung, Lin, & Wong, 2017) or a foreign language in
Hong Kong. As stated by Evans and Bruce (2012), “As a context of inquiry, Hong Kong
has the potential to illuminate issues and problems relevant to both ESL and EFL societies”
(p. 24). It is thus reasonable to draw upon theories and research findings from both ESL
and EFL fields to inform the present study on English language assessment in the Hong
Kong contexts.
1.2.2 The Diagnostic English Language Tracking Assessment (DELTA).
Listening plays a key role in language acquisition and in our daily communication. It
becomes even more important in formal educational contexts as students’ learning is
largely affected by the quality of their listening. The diagnosis of listening ability is
particularly significant in tertiary education contexts in Hong Kong because for many
students the medium of instruction shifts from Chinese to English, and many would not
be able to comprehend English language lectures effectively.
There is an overwhelming concern about the decreasing English proficiency of
Hong Kong undergraduates (Qian, 2008). To address this issue, the Hong Kong Special

6
Administrative Region (HKSAR) government has implemented a list of remedial policies,
including providing refund for students to take the International English Language
Testing System (IELTS) during their final year of university studies. Nevertheless, the
effectiveness of an exit test such as IELTS as a tool for enhancing students’ English
proficiency is, at best, questionable. Lyle Bachman (2010), a consultant to the University
Grants Committee (UGC) to review local institutions’ language enhancement activities
in 2008-09, commented, “over-emphasis on test preparation [IELTS] might undermine
efforts to help students genuinely improve their language proficiency” (p. 3). In the
meantime, Bachman suggested that the Tertiary English Language Test (TELT) which
was then specifically used as a diagnostic tool in local institutions should deserve more
attention, and should be used for the purpose of improving Hong Kong undergraduates’
English ability.
As suggested in section 1.1.2, although several diagnostic language assessments
are well established in the western world, there is currently no diagnostic test of the
English language in Asia, especially in the Hong Kong context where the majority of
learners use Cantonese as their mother tongue, and English as a foreign or second
language (Tsang, 2013) for educational purposes. In view of the potential benefits of the
TELT’s capacity to facilitate student learning in the process, the UGC took the initiative
to provide funding support to three local institutions (i.e., The Hong Kong Polytechnic
University, City University of Hong Kong, and Lingnan University) to develop a web-
based Diagnostic English Language Tracking Assessment (DELTA) based on the TELT.
The DELTA is designed to diagnose students’ strong and weak areas in English learning,
and to track their progress during study at the university. The DELTA assesses four major
language components: Listening, Reading, Vocabulary, and Grammar. A diagnostic
report is provided to profile student performance on these four English language skills
and to provide remedial feedback and tips for further enhancement of targeted skills or
subskills.
1.2.3 Issues with the DELTA listening component development. A number of
concerns arose during the construction of the DELTA listening assessment component.
Adopting the model of communicative language competence by Bachman (1990), the
DELTA listening component tests “students’ ability to listen to and understand the kinds
of spoken English that they would listen to for English language learning and tertiary
level study more generally” (DELTA Guidelines, 2012). More specifically, it assesses

7
students’ listening ability in university contexts, for example, talking with peers,
attending lectures, listening to English radio or TV programs, and so on. Based on the
construct definition of listening ability, the DELTA listening test involves a wide range
of spoken text types from daily conversations, and interviews, to academic lectures. Each
DELTA listening item is intended to test a specific subskill, i.e., item intent, in listening
comprehension. Nevertheless, in the process of test item production the writers found it
difficult to determine clearly the exact testing focus of each item. That is, the writers have
not reached consensus on what listening subskills the items are testing. It is also unknown
whether the examinees would actually use the identified subskills when they answer the
comprehension questions. To make things worse, the students are expected to take more
challenging tests after one year of learning so as to demonstrate a path of listening
proficiency progress. The DELTA listening test should be able to provide items with
targeted difficulty levels for predicting listening development. However, the relative
difficulty of the listening subskills is ambiguous. Hence, it is necessary to investigate the
hierarchical order of the listening sub-skills.
The subskills used to understand different spoken genres is another concern for
DELTA test developers. Genre, or text type, is a set of communicative events with shared
communicative purposes; the varying communicative purposes might result in different
text structures, delivery styles, lexico-grammatical choices, etc. (Bhatia, 1993; Swales,
1990). It is logical to assume that listeners with distinctive purposes in different
situational contexts might adopt a range of subskills to process the message conveyed in
different spoken genres (Rost, 2011). However, there seems to be inadequate knowledge
concerning whether the utilization of listening subskills varies across different spoken
genres; and there is even less information as to whether the easy subskills in conversations
will remain equally easy, or become difficult in other genres, when compared with other
listening subskills.
1.3 Research Objectives, Questions and Scope of the Study
In all, these discussion seem to indicate that there is no well-established theory or
solid empirical evidence concerning the underlying listening subskills of diagnostic
assessment, their relative difficulty levels, and their interactions across different spoken
genres. In practice, the issues arising in the development of the DELTA listening
component have somehow caused uncertainty and confusion for the DELTA test

8
designers, especially when assigning, a priori, the type of listening text. Given the gaps
in our understanding of the diagnostic listening assessment, and the problems encountered
in DELTA listening test construction, the present study is conducted with the objectives
to:
identify the subskills and cognitive processes that underlie student performance
on the DELTA listening component;
examine the difficulty levels of the DELTA listening subskills, and their
hierarchical order;
investigate the impact of text type on the difficulty level and the hierarchical order
of the DELTA listening subskills; and,
infer principles underlying the development of listening proficiency in the Hong
Kong tertiary level contexts.
It investigates the development of Hong Kong English language learners’ listening
proficiency in understanding different spoken genres in the tertiary level educational
contexts. Through a series of diagnostic tests and Rasch analysis of the DELTA test
results, it addresses the following research questions:
RQ1: What are the cognitive processes or listening subskills that underlie student
performance on the DELTA listening component?
RQ2: Are the DELTA listening subskills measurably identifiable and divisible from
each other?
RQ3: What is the hierarchical order of the DELTA listening subskills?
RQ4: Do the DELTA listening subskill difficulties vary across different text types?
Does the hierarchical order vary across text types?
1.4 Outline of the Study
The thesis comprises seven chapters. Chapter 1 (Introduction) has highlighted the
issues with diagnostic assessment of the listening skill in the literature and the confusion
that emerged in the test construction process of the DELTA. Based on the discussion of
these problems it has further formulated the objectives of this study and posed four

9
research questions with respect to the listening subskills tested in the DELTA listening
component.
Chapter 2 (Literature Review) addresses the need for the present study by reviewing
major concepts, theories and issues regarding language tests, listening comprehension
and language subskills. It starts with an explanation of fundamental concepts of construct
and validity of language tests, and then introduces the socio-cognitive perspective of
listening assessment validation. Four aspects of listening test validity are examined by
revisiting the prevailing theories of the nature of listening comprehension. Research on
the listening subskills is reviewed to identify the gaps in the literature to date. This is
followed by the investigation of other listening language test variables such as listening
input, listener and test setting. Lastly, the chapter explicates why the Rasch measurement
model is uniquely placed to address the issues of test reliability and construct validity in
language testing.
Chapter 3 (Methodology) and Chapter 4 (Listening Test Data Analysis) document
the research methods employed in conducting this study and explain the research design
and the instruments used in data collection and analysis. The study adopted a multi-
method approach on account of the importance of triangulation in data collection and
analysis in human research. The quantitative data included 203 multiple-choice questions
and responses of DELTA listening component whereas the qualitative data consisted of
62 individual interviews using the stimulated recall protocol to investigate test-takers
cognitive processing and strategies to answer the DELTA listening questions. A series of
Rasch analyses using Winsteps and FACETS was performed to analyse the quantitative
data to answer RQs1-3. Item calibration was conducted to examine the psychometric
properties of the DELTA listening component and to determine the relative difficulty
levels of the DELTA listening subskills, followed by ANOVA tests to investigate the
interactions between text type and listening subskills. To address the issues of the
disconnected subsets in the dataset, a sequence of FACETS analyses was performed to
gauge persons, items, listening subskills, and text type in one frame of reference for
interpreting the results. The findings are reported in Chapters 5 and 6.
Chapter 5 (Listening Test Results) presents findings derived from the quantitative
data of DELTA listening component. Firstly, it reports the results of the free and the
calibration analyses from Winsteps and then proceeds with the results of the effect of text

10
type on subskill difficulties using one-way ANOVA. Then an array of trials integrating
items, persons, subskills, and text types with FACETS analysis are described. In the end,
comparisons are made to identify consistent findings from these different analyses and to
outline the divergences in them.
Chapter 6 (Stimulated Recall Protocol Results) starts with a description of the
listening test and results used in the stimulated recall protocol. Constant comparative
analyses using NVivo were conducted with the qualitative data to provide supplementary
empirical cognitive evidence to address RQ1. The chapter then reports the SRP interview
data analysis and results. The key findings from the qualitative analysis include the
overall use of cognitive processes and test-taking strategies, their respective use by
different ability groups, and the misfitting persons identified from the SRP listening test.
Chapter 7 (Discussion) revisits the purpose of the thesis and interprets the results
from the earlier chapters. It starts with a broad discussion of the key findings with regard
to the use of cognitive processes in the DELTA listening test, the difficulty level of
subskills, the hierarchical pattern, and their interaction with text types. Then the detailed
comparison and interpretation of both types of data are made to address the four research
questions one by one. Then the chapter shifts to discuss how the results relate to the theory
of listening and how the results justify the future development of the DELTA listening
component.
The final chapter, Chapter 8 (Conclusion), summarises the key findings of the study
and draws conclusions. Findings related to each research question are presented, which
highlight the contribution of the present study to diagnostic language assessment
validation and DELTA test development. Implications and recommendations are
discussed concerning L2 listening development theory and listening instruction.
Limitations of the study and areas for further research are also presented in this chapter.

11
CHAPTER TWO
LITERATURE REVIEW
As noted in Chapter One, the status of English in Hong Kong has been unique and
complex – while it has been stipulated as one of the official languages and promoted as
the medium of instruction during colonial and post-colonial periods, its popularity in the
general public has never rivalled that of Cantonese, therefore, it has been regarded as both
a second language and a foreign language in academia and by the general public.
Although there have been reports that ESL and EFL students differ in their development
of pragmatic awareness (Schuer, 2006), it is common to apply theories on second
language acquisition (SLA) in both ESL and EFL teaching and research (e.g., Murphy,
2014; Phakiti, 2006). Furthermore, literature in listening and reading comprehension have
tended to use the two terms simultaneously (e.g., Buck, 2001; Field, 2008; Nation &
Newton, 2009; Vandergrift & Goh, 2009). Given the reasons outlined above, this study
will review relevant literature in both L2 and FL to inform the research into listening
subskills in the Hong Kong context.
This chapter synthesises the relevant literature from a number of distinct domains
to make clear the complexity of listening, especially with regard to listening to a second
language (L2) and the development of diagnostic assessment of listening ability. In order
to fully understand and appreciate the development and validation of diagnostic listening
tests, it is important to understand the key terms, theories and variables associated with
listening and assessment.
The first section of this chapter provides a review of the use of diagnostic language
assessment and its validation research. The discussion then moves on to introduce the
socio-cognitive perspective of listening assessment validation, which aims to provide a
theoretical framework for investigating diagnostic listening assessments. Revolving
around the three key elements under this framework – cognitive validity, contextual
validity, and scoring validity, the cognitive processing will be first examined by referring
to the prevailing theories and hypotheses of the nature of listening comprehension in order
to define the underlying latent structure. Afterwards, this chapter will look at the
contextual validity aspects to seek an understanding of input characteristics that comprise
listening comprehension and how these have been captured and included in listening tests.
This discussion will be followed by further investigation of the listener and test setting

12
variables. Finally, this chapter provides a review of the measurement model (i.e., the
Rasch model) employed in the study.
2.1 Language Test Construct and Validity
In measurement the concepts of construct and validity are significant. Construct
often refers to “the trait or traits that a test is intended to measure” (Davies, Brown, Elder,
Hill, Lumley, & McNamara, 2004, p. 31). It is generally theory-based and cannot be
measured directly, but can be assessed using a number of indicators of manifest variables.
Therefore it can be seen as “an ability or a set of abilities that will be reflected in test
performance and about which inferences can be made on the basis of test scores” (Davies
et al, 2004, p. 31).
Validity is another key concept in measurement. According to Chappelle (2012),
the conception of validity in language testing has undergone four major stages. Initially
validity addresses the question whether the test measures what it claims to measure (e.g.,
Lado, 1961; Valette, 1967, cited by Chappelle, 2012). This conception sees validity as
the property of tests and can consist of content validity, concurrent validity, predictive
validity, and construct validity, face validity etc., depending on the purpose of particular
tests. Messick (1989) emphasized the adequacy and appropriateness of interpretations and
actions based on test scores and described validity as a unitary conception with construct
validity as central rather than different types of validity and validation is an ongoing
process of inquiry.
The construct validity of a language test indicates the extent to which the test is
representative of, or, actually investigating, the underlying language construct. Construct
validation, therefore, involves drawing on various qualitative and quantitative approaches
to evaluate the ability, knowledge and skills that a language test measures, thus providing
evidence to support interpretation and inferences of test scores (Weir, 2005).
2.1.1 A socio-cognitive perspective of listening test validation. Following the
argument of Messick (1989, 1995) that validity does not just reside in the test itself, or,
rather, in the scores on the test, but also in the inferences that are made from them, Weir
(2005) identified five types of validity, namely, theory-based validity, context validity,
scoring validity, criterion-related validity and consequential validity, and proposed a
socio-cognitive framework for validating listening tests by integrating the five validity

13
elements. Theory-based validity assumes that the test developers should have a good
theoretical understanding of the language processing that underlie particular language
skills so that the construct can be fully and exclusively represented in the test. It was later
termed as cognitive validity by Field (2013, p. 78) as it “addresses the extent to which a
test requires a candidate to engage in cognitive processes that resemble or parallel those
that would be employed in non-test circumstances”. Cognitive validity can also be
obtained through post-test (a posteriori) statistical analysis of the psychometrical
properties to determine the existence and non-existence of the construct. Context validity
concerns the extent to which test tasks can represent the context in which language
processing takes place. It is similar to the traditional concept of content validity associated
with linguistic and interlocutor demands made by the task(s) as well as the conditions
under which the task is performed arising from both the task itself and its administrative
setting (Weir, 2005; Elliott & Wilson, 2013). Scoring validity accounts for the extent to
which test results are replicable under different circumstances and can be seen as a
superordinate term for all aspects of reliability, including test-retest reliability, parallel
forms reliability, internal consistency, and marker reliability (Weir, 2005). Criterion-
related validity is concerned with “the extent to which test scores correlate with a suitable
external criterion of performance with established properties” (Weir, 2005, p. 35) and
comprises of concurrent validity and predictive validity. Consequential validity pertains
to score interpretation and its social consequences and can be considered in three main
areas: differential validity, washback and effect on society (Weir, 2005).
The five key validity elements provide a unified approach to conceptualizing and
validating listening tests. While cognitive validity, context validity and scoring validity
deal with the internal aspects of validity, criterion-related validity and consequential
validity relate to the external aspects of validity. Temporarily, cognitive validity and
context validity are established before the test event (a priori validity) whereas the other
three validity types can only be obtained after the test (a posteriori validity). In addition,
there is a “triangular” (Taylor, 2013, p. 31) relationship between cognitive validity,
context validity and scoring validity with one influencing another and their interaction
constitutes “the heart of construct validity” (Weir, 2005, p. 85).
In light of the limited diagnostic assessment of listening ability and the significance
of cognitive validity, context validity, and scoring validity in construct validity
establishment, it is vital to examine the theoretical assumptions of the cognitive

14
processing involved in listening comprehension and the effect that context validity
dimensions have on candidates’ performance while completing a listening task. The
following section discusses how listening comprehension has been defined and
synthesizes relevant theories and models to understand the cognitive processes in
listening comprehension.
2.2 Cognitive Processing in Listening Comprehension
2.2.1 Definition of listening comprehension. Listening is a pervasive human
experience that occurs in various contexts ranging from daily informal conversations to
sophisticated academic debates (Murphy, 1991). Although listening is an essential skill
to provide language input for the learner (Rost, 2005), it is rendered the ‘Cinderella skill’
because of its tendency to be overlooked in English language teaching and research as
compared with speaking, reading, and writing (Nunan, 1997, 2003). It could be said that
the invisible and intangible nature of listening might account for the relatively scant
research in this field. With a flood of books on the subject of second language listening
(L2) over the past decades, listening’s Cinderella status has been elevated. Many
advances have been made towards fully understanding the nature and process of listening
from a variety of perspectives with an aim to inform pedagogy and assessment.
As a complex practice listening involves a “bundle of related processes” (Lynch &
Mendelson, 2010, p.180) of the spoken language. From a neurological perspective, the
auditory system receives and converts incoming sound waves into electrical pulses that
are then relayed to different areas of the brain. The different brain areas are responsible
for interpreting various aspects of the incoming input. For example, the Wernicke’s area
attends to speech recognition as well as lexical and syntactic comprehension, whereas the
Broca’s area takes care of calculation and responses to language-related tasks (Rost,
2005).
In addition to the physiological treatment of sound, listening also involves a series
of processes that assist the listener in making sense of the input. These processes include
linguistic processing, and pragmatic processing, and psycholinguistic processing (Rost,
2005). Linguistic processing entails the use of linguistic knowledge (such as
phonological, lexical, syntactic and semantic knowledge) to interpret the literal meaning
of the spoken input. Pragmatic processing requires listeners to use their socio-cultural and
pragmatic knowledge to interpret and infer the contextual meaning (such as social status

15
and interpersonal relationships) of the utterances. Psychological processing concerns the
application of cognition (e.g., perception, attention, memory, reasoning, etc.) to
comprehend and construct meaning from the messages. Thus, there is a key distinction
between hearing (passive and mere perception of sounds) and listening comprehension
(purposeful and active analysis of the utterances). The former emphasizes simple
reception or perception of the sound whereas the latter requires the listener to understand
and interact with the message where necessary (Hasan, 2000; Tomatis, 2007). More
specifically, interpretation of the incoming information needs to occur simultaneously as
the information is received, as, in most situations the information is generally not
repeatable or reviewable to the listener (Shohamy & Inbar, 1991). In a split second, the
listener has to complete the multiple online processes of using linguistic and real-world
knowledge to immediately understand the explicit and/or implied meanings of the spoken
language.
The thoughtful comprehension of the spoken input has been reflected in the
definition of listening comprehension proposed by different scholars. For example, it can
be described as “the process of relating language to concepts in one’s memory and to
references in the real world” (Rost, 2005, p. 59). Wipf (1984, as cited in Oxford, 1993)
defined listening comprehension as a “complex problem-solving skill, which is more than
just the perception of sounds. It includes comprehension of meaning-bearing words,
phrases, clauses, sentences and connected discourse” (p. 206). Rubin (1994) described it
as “an active process in which listeners select and interpret information which comes from
auditory and visual cues in order to express what is going on and what the speaker is
trying to say” (p. 210). Fischer and Farris (1995) regarded listening comprehension as a
process by which students actively form a mental representation of an aural text according
to prior knowledge of the topic and information found within. Buck (2001) defined L2
listening comprehension as “the ability to 1) process extended samples of realistic spoken
language, automatically and in real time; 2) understand the linguistic information that is
unequivocally included in the text; and 3) make whatever inferences are unambiguously
implicated by the content of the passage” (p. 114).
Whilst there is not a single definition of listening comprehension, all seem to
suggest that it involves a series of cognitive processes and a number of factors that relate
to the listener, the listening input and the situational context of listening behaviour
(Larson, Backlund, Redmond, & Barbour., 1978; Powers, 1986). The following sections

16
review the various hypothetical theories and models of the cognitive processes involved
in listening comprehension, and continue with examination of a number of factors that
relate to the listener, the listening input and the situational context of listening behaviour.
2.2.2 The model of listening stages. Listening comprehension comprises of a set
of mental operations and these mental operations have been studied and represented from
different perspectives; therefore various terms are found in the descriptions of the
listening process. For example, it can be deconstructed into several stages and phases
depending on the hypothetical order of how information is treated (Anderson, 1995;
Brown, 1995; Field, 2013; Rost, 2005); when it is examined in terms of the direction of
process, the bottom-up and top-down model is employed (Nunan, 1997; Rost, 2005).
When listening comprehension is seen as a language skill, the cognitive components are
then termed as listening sub-skills (Field, 2008b).
Just as listening is a complex process, so is the sub-process of listening
comprehension. Understanding of the L2 listening process is based on the assumption
that there are commonalities in the cognitive processing of spoken input between the first
language (L1) and the second language (L2) irrespective of more linguistic and socio-
cultural barriers for L2 listeners (Færch & Kasper, 1986). Therefore, most key theories
of L1 listening comprehension are applicable to L2 listening comprehension.
Anderson (1995) proposed a three-stage model for L1 comprehension, including
perceptual processing, parsing, and utilization (p. 329). Perceptual processing involves
segmenting phonemes from the continuous speech stream, retaining them in echoic
memory and making some initial analysis such as attending to the key words, pauses and
stresses and intonation, or contextual clues that that may support the interpretation of the
aural input; parsing means converting and recombining the original words and sentences
into meaningful mental representation; utilization involves relating the mental
representations to existing knowledge (schemas) to generate more personally meaningful
interpretations, inferences or responses. These are also called cognitive operations and
have been much quoted in the L2 literature.
Conversely, Brown (1995) argued that the process of understanding spoken text
involves four stages: identifying the spoken message, searching existing knowledge in
memory to relate to the new information, filing and storing the new information in
memory for future use, and using and acting upon the new information. He claimed that

17
the first three stages are essential for listening comprehension while the fourth stage could
be optional. It can be seen that this argument attaches more emphasis on the process of
meaning association and mental representation in listener’s brain.
Similar to Anderson, Rost (2005) suggested that second language (L2) listening
comprehension has three stages. During the decoding phase the listener recognizes lexical
items and parses propositions; in the comprehension phase he/she connects input to
relevant knowledge sources; the final phase involves interpretation of the listener in
respect to response options.
Alternative to the terms stage or phase, Field (2013) put more emphasis to the fact
that listening is a tentative process and listeners do not necessarily process information in
a sequential manner, and then argued to use the term level of analysis or level of
representation in his cognitive processing framework for listening. There are five levels:
input decoding when the listener transforms acoustic cues into groups of syllables; lexical
search when the listener identifies the best word-level matches for what has been heard,
based on a combination of perceptual information and word boundary cues; parsing when
the lexical material is related to the co-text in which it occurs in order to a) specify lexical
sense more precisely; b) impose a syntactic pattern; meaning construction when world
knowledge and inference are employed to add to the bare meaning of the message; and
discourse construction when the listener makes decisions on the relevance of the new
information and how congruent it is with what has gone before; and if appropriate,
integrates it into representation of the larger listening event.
Despite different terminologies used by various researchers in the proposed
theories reviewed above, there seems to be some consensus that listeners undergo two
main stages in comprehension: (1) apprehending linguistic information such as
recognizing the sounds, representing the sounds with words, translating words into
meanings, formulating mental representations; and (2) relating the information to a
broader context by either matching with the existing schemas, or filing new information
in memory or putting the information into use. It is important to note that listening
comprehension is a very tentative process with the listener constantly forming and
revising hypotheses as the evidence accumulates (Field, 2008b, 2013). The phases could
be completed in sequence or, alternatively, they could also occur simultaneously
(Anderson, 1995). This awareness of the non-sequential pattern of cognitive processing

18
is reflected in another prevailing model to understand the cognitive processes that
underlie the various operations required in listening comprehension: the bottom-up and
top-down model.
2.2.3 The bottom-up, top-down and interactive model. In the bottom-up model,
listeners build understanding by starting with the smallest units of individual sounds, then
combine them into words, and in turn form clauses, sentences and develop ideas, concepts
and relationships between them (Buck, 2001; Nunan, 1997; Tsui & Fullilove, 1998).
Speech perception and word recognition provide the ‘data’ for comprehension (Rost,
2005), therefore, this process is also referred to as data-driven processing or lower-level
processing. In the top-down model, listeners rely on their prior knowledge and global
expectation to identify and understand the incoming words and sentences (Nunan, 1997).
This often occurs in cases of inadequate recognition of the bottom-up data when the
listener will rely more exclusively on top-down processes: semantic expectations and
generalisations (Rost, 2005). Therefore, it is also called concept-driven processing or
higher-level processing. Different information source under each model and the terms
low-level and high-level seem to suggest different levels of processing, however, the
bottom-up and top-down model actually represents distinct “directions of listening” (Rost,
2013, p. 364).
Prior studies have shown that lower-ability learners may rely more on the bottom-
up model as their attention is focused on recognizing sounds and words and higher-ability
listeners tend to be more competent in employing the top-down processing (e.g.,
Shohamy & Inbar, 1991). However, it seems to be more likely that listeners adopt both
ways of processing depending on the confidence and proficiency level of the listener.
Thus, an interactive model has been proposed (Flowerdew & Miller, 2005). It has been
increasingly recognized that the relationship between bottom-up and top-down
processing is complex and interdependent (e.g., Field, 2013; Tsui & Fullilove, 1998).
Listeners utilize either bottom-up or top-down processing to compensate for the other
during listening. They may engage in bottom-up processing when guessing meanings of
words using contextual clues, and resort to top-down processing when activating prior
knowledge to infer meanings beyond the text (Tsui & Fullilove, 1998).
A recent study by Siegel and Siegel (2018) provided intervention of bottom-up
activities for EFL listeners and compared performance between the control and the

19
treatment groups. During the instructional process in the study the instructor asked
students to count words of the sentences, identify lexical differences, and predict words
that would appear in the listening input based on grammatical structure or semantic
meanings. Students were also asked to pay attention to and highlight the connected speech
in the input, and complete fill-in-the-blanks type of questions, and short transcriptions.
Their findings suggested that the bottom-up activities were conducive to improvement in
dictation and listening proficiency test and learners attached the importance of explicit
instruction of bottom-up processing skills.
Although the above cognitive processing theories (i.e., the listening stage model and
the bottom-up and top-down model) provide valuable insights into the nature of listening
comprehension, their application to teaching and assessing the listening skill is relatively
intangible and scarce. Therefore, researchers have proposed a componential approach to
listening (e.g., Field, 2008b) suggesting the listening ability consists of somewhat
divisible components or subskills. The following section will synthesise the theoretical
and empirical studies relating to the concept to listening subskills with an aim to provide
an overview of the key issues with the existent research on listening subskills in language
assessments.
2.3 The Subskill or Componential Approach to Listening
The notion of listening subskills originates from the instruction of reading in a
second language (Field, 2008b), where reading is broken down into different sub-
components such as recognizing words, understanding anophoric references, making
inferences of word meanings and so on. As listening is similar to reading in the way that
it involves processing of spoken rather than written information, it is assumed that the
listening may as well be treated as comprising a set of distinct sub-skills.
According to Field (1998, p.117), subskills are “competencies which native
listeners possess and which non-natives need to acquire in relation to the language they
are learning. They involve mastering the auditory phonetics, the word-identification
techniques, the patterns of reference, and the distribution of information which occur in
the target language”. Therefore, three areas have to be distinguished in a skill approach
to listening: types of listening (for gist, for information, etc.), discourse features
(reference, markers, etc.), and techniques (predicting, anticipating, recognizing
intonational cues, etc.)” (Field, 1998, p. 113).

20
Along this line of inquiry, scholars have attempted to create different taxonomies
to delineate listening comprehension. This section reviews the key taxonomies that are
developed from theoretical assumptions, or empirical research (Barta, 2010; Buck,
Tatsuoka, Kostin, & Phelps, 1997; Field, 1998; Lund, 1990; Munby, 1978; Richards,
1983; Weir, 1993).
2.3.1 Theory-based taxonomies of listening subskills. Munby (1978) set up a list
of 260 receptive and productive language skills for different language learning activities,
and specified the following skills for listening:
1. Discriminating sounds in isolated word forms;
2. Discriminating sounds in connected speech;
3. Discriminating stress patterns within words;
4. Recognizing variation in stress in connected speech;
5. Recognizing the use of stress in connected speech;
6. Understanding intonation patterns: neutral position of nucleus and use of tone;
7. Understanding intonation patterns: interpreting attitudinal meaning through
variation of tone or nuclear shifts; and
8. Interpreting attitudinal meaning through pitch variance, pause, or tempo.
These skills are mostly sound recognition in isolated words and connected speech,
understanding prosodic features of speech (stress and intonation). It can be argued that
these skills are fundamental for novice listeners to practice as they focus on discrete low-
level ability. But the practicability in listening test, text-based listening test in particular,
is debatable because apart from phonological knowledge, the comprehension of a text
requires more important knowledge in vocabulary, grammar, non-linguistic and para-
linguistic knowledge (Buck, 2001).
In order to provide a conceptual framework for L2 listening instruction, Lund
(1990) developed a taxonomy of L2 listening skills from two perspectives: listener
function and listener response. Listener function involves six aspects of the message the

21
listener attempts to process: identification, orientation, main idea comprehension, detail
comprehension, full comprehension, and replication. However, he claimed that listener
function should be differentiated from listening skills or motivation, as it is something in
between. “The motivation affects the function, which in turn influences the skills or
strategies that are thought to bear” (Lund, 1990, p. 107). He further pointed out that the
functions were statements of potential, which implies the possibility that the listener does
not necessarily have the skill to carry out the function. Therefore, realization of these
functions is likely to be associated with proficiency levels. According to Lund (1990), the
novice listeners might only have the ‘identification’ function, the ‘main idea’ function
differs an intermediate listener from a novice whereas ‘full comprehension’ of a text is a
typical indication of an advanced level.
Based on the assumption that listening purposes vary in different listening contexts,
Richards (1983) developed a comprehensive taxonomy of 33 micro-skills in
conversational listening, and 18 micro-skills in listening in academic contexts. In
exploring how to make use of these micro-skills in diagnostic assessment, he suggested
linking these micro-skills to existing listening proficiency descriptors such as Brindley
(1982). As most language proficiency descriptors are composed of a number of ‘can-do’
and ‘cannot-do’ statements, comparing the micro-skills with the descriptors may help
teachers identify which micro-skills students of particular listening proficiency level need
to focus on in their study.
Al-Musalli (2015) proposed a lecture note-taking taxonomy of skills and subskills
to describe the skills required for lecture comprehension, including skills at the four levels
– literal, inferential, critical, and creative. Unlike the listening test scenario, the creative
skills in lecture comprehension involve skills specific to note-taking, for example,
outlining, writing, and reviewing skills because most of the time listeners would jot down
notes and reproduce written outputs after listening to the lecture. The literal, inferential
and critical skills are similar to other listening subskill taxonomies that represent
phonological, syntactic, lexical, logical, textual skills (or rather knowledge) and
judgement skills in listening comprehension. Of note, the author categorized the skills
into four levels, however, whether a hierarchy exists in these four levels is subject to
empirical evidence.

22
2.3.2 Research-based inventories. While prior scholars have attempted to make
lists of hypothetical sub-skills in second language listening, others are more interested in
doing research to explore whether the postulated sub-skills are empirically identifiable
and separable. By adopting various psychometric measurement methods, a number of
studies have been able to identify three dominant listening sub-skills: understanding
specific information, understanding main ideas and making inferences (Song, 2008; Lee
& Sawaki, 2009; Goh & Aryadoust, 2010). The following section will review the research
on the methods and major findings of these studies.
By adopting the rule-space analysis of 30 TOEIC listening test items, Buck et al
(1997) identified 23 prime (discrete) attributes and 15 interaction attributes. The prime
attributes were clustered into four higher-order categories of sub-skills, which were
linguistic competence (vocabulary skills, syntax skills, discourse processing skills),
inferencing skills, and task performance skills or problem solving skills, and interactions.
The attributes were related to cognitive operations in listening comprehension. The prime
attributes were mostly associated with working memory whereas the interaction attributes
had more to do with the recognition. In terms of the difficulty relationship amongst these
attributes, they found that interaction attributes were more difficult than prime attributes
because when the attributes co-occur in one item they require more cognitive demands to
process the spoken input. The identification of interaction attributes may lend support to
the argument that listeners use a number of sub-skills in comprehension and it is difficult
to determine which sub-skill is critical in answering one particular question (Brindley,
1997).
Similarly, Goh and Aryadoust (2010) attempted to determine and gauge the test
construct underlying the Michigan English Language Assessment Battery listening test
(MELAB). Content analysis was firstly carried out to determine the five subskills
measured by the 30 items, which were: a) understanding and responding to the
unexpected statements and / or questions (shortened as minimal context); b)
understanding details and explicit information (explicit information); c) making
propositional inferences (propositional inferencing); d) making enabling inferences
(enabling inference); and e) drawing conclusions (close paraphrasing). Confirmatory
factor analysis (CFA) was then performed to investigate the divisibility of the subskills.
The findings show that the subskills were empirically divisible and functioned in an
interactive and interdependent manner in listening events particularly those that are

23
interactional in nature. In addition, all factors were attributed to a higher-order factor, and
the inference making and understanding paraphrase factors were partly predicted by the
ability to understand explicit information.
Lee and Sawaki (2009) used three psychometric models to analyse the listening and
reading sections of TOEFL iBT and identified four listening skills tested in TOEFL® iBT
(Test of English as a Foreign Language™):
(a) Understanding general information;
(b) Understanding specific information;
(c) Understanding text structure and speaker intention; and
(d) Connecting ideas.
Song’s (2008) study investigated the divisibility of subskills assumed to be involved
in the academic listening and reading comprehension of the WB-ESLPE (Web-based
English as a Second Language Placement Exam) at UCLA. Findings indicated that the
listening items measured three listening sub-skills: Topic (understanding the main and
topical ideas of a text); Detail (understanding supporting and specific details of a text);
and Inference (making inferences from the explicitly stated information). Meanwhile the
reading comprehension test identified two sub-skills, understanding explicit meaning
(Topic and Detail) and understanding implicit meaning (Inference), with Topic and Detail
inseparable in reading comprehension. Song also suggested that the divisibility of sub-
skills in listening and reading should take into consideration the test takers’ L2
proficiency and the characteristics of the test administered to them. Furthermore, he
argued the reason for the higher divisibility of academic listening than academic reading
is that listening to a lecture poses more difficulty to students than reading an academic
text.
Shang (2005) investigated whether listeners with different listening proficiencies
performed distinctly on different cognitive operations, and whether their performances
were consistent with their perceptions of the difficulty level of these cognitive operations.
The cognitive operations included interpreting main ideas, identifying details and
interpreting implications of conversations. Contrary to their hypothesis that interpreting
implications was the most difficult, the findings showed the trivial (detail) questions were

24
most challenging for all the three groups of different listening proficiencies. Furthermore,
despite the commonly held association of low-ability students with higher competence in
local details, they were found to perform better on global items than on the local ones.
Ghahramanlou, Zohoorian and Baghaei (2016) utilized the Linear Logistic Test
Model (LLYM) to examine six cognitive operations underlying the listening
comprehension section of ITLTS, including 1) using syntactic knowledge, 2) using
semantic knowledge, 3) understanding details and explicit information, 4) understanding
reduced forms, 5) keeping up with the pace of the speaker, and 6) making inferences. The
findings showed that phonological processing such as fast speech and reduced forms
posed greater challenge than syntactic and semantic processing. While operations
involving inferencing and detail comprehension ranked in between the other four, their
study resonated that understanding explicit and detail information was easier than making
inferences.
By comparing five models in the cognitive diagnostic assessment (CDA) model,
Aryadoust (2018) investigated a total of nine listening subskills and test-related
facets/subskills of the listening test of the Singapore-Cambridge General Certificate of
Education (GCE) exam. While the test-related facets might be regarded as test-taking
strategies and threats to the unidimensionality of the test construct, the author argued that
test-related subskills beyond or outside listening could play a significant role in test-
takers’ performance and has to be taken into consideration of listening test construct. The
findings showed that using world knowledge to make an inference, understanding surface
information, and catching surface details were easier than making pragmatic inferences
to equate the different words in the text and in the answer choice, understanding surface
information and paraphrasing. This study also confirmed the interdependency between
subskills, for example, he claimed understanding contradictory parts of the input or make
inferences were dependent on the ability to understand the surface information. The
author also argued that although negative and low correlations were found between the
listening subskills and some task-specific facets, both of them were fundamentally
important for students’ performance on the test.
2.3.3 Listening sub-skill hierarchy and listening development. It can be seen
from the review above that lower-level skills are assumed to be less difficult and easier
to master for low-ability students (Aryadoust, 2018; Becker, 2016; Ghahramanlou et al,

25
2016). Higher-level skills such as inferencing, which involves recognition of local
information and activation and retrieval of background knowledge, are believed to require
more cognitive load in processing, thus posing more challenge for listeners. Nevertheless,
it is disputable whether these sub-skills are, in fact, subject to hierarchical ordering in
terms of difficulty level. Also, it remains unknown as to whether the acquisition of these
sub-skills is actually consistent with that hierarchical order. The limited literature on
listening proficiency development suggests relating listening ability to the texts to be
understood (ACTFL, 2012; Brindley, 1982, 1998), rather than the sub-skills employed in
understanding these texts. The underlying assumption is, if the learner can handle texts
of increasing linguistic difficulty, he or she is seen to have progressed (Field, 2008b). In
describing the subskill approach to teaching listening, Field (2008b) acknowledged the
difficulty of grading different listening subskills and prioritizing them for learners.
Alderson (2005) stated that there is “a lack of a theory of the development of foreign
language listening ability (not only in CEFR but in applied linguistics more generally)”,
and there is “not much empirical evidence regarding how the ability develops to
understand a foreign language when spoken” (p.141). Dunkel, Henning and Chaudron
(1993) also admitted that although “a number of scholars have provided useful
taxonomies of listening comprehension component skills or operations…few of these
valuable efforts have attempted to provide clear definitions or non-redundant orderings
of components in any systematic graded hierarchy that has been shown empirically to
correspond to task difficulty” (p. 182).
Generally, there is a lack of evidence of the hierarchical order of listening sub-
skills, both theoretically and empirically. A possible solution to relate sub-skills to
language proficiency is Richards’ (1983) suggestion to match listening sub-skills with
language proficiency descriptors.
2.3.4 Cognitive processing and proficiency level. There have been some research
attempts to examine the relationship between the use of cognitive processings and learner
proficiency levels (Becker, 2016; Hildyard & Olson, 1982; O’Malley, Chamot, & Kupper,
1989; Lee & Bai, 2010; Wolff, 1987; Shang, 2005; Shohamy & Inbar, 1991). A common
finding emerging from these studies is that efficient listeners tend to employ background
knowledge to interpret the new text, thus adopting the top-down processing more
frequently, whereas weak listeners seem to rely more heavily on data-driven processing
such as repetition and rephrasing of words and phrases, and relate mostly to local details

26
such as prosodically salient, or heavily repeated words to determine the meaning of
individual words (Becker, 2016; Lee & Bai, 2010). Shohamy and Inbar’s (1991) study
showed that subjects with low proficiency level perform better on items referring to local
cues than on items referring to global ones, but conflicting results were reported by Shang
(2005) that the low proficiency group performed better on global items than on the local
ones.
So far, several perspectives of the nature of listening comprehension have been
discussed. The processing stage hypothesis describes how the aural input is recognized,
stored, and represented to make meaning, and the bottom-up and top-down model focuses
on what type of information source to rely on in listening; in contrast, the componential
model presumes what subskills are involved in the listening process. Little is known as
to how these subskills interact with, and relate to, each other.
Overall, although a number of L2 listening comprehension theories have been
suggested, few empirical studies have tested these theories. Perhaps due to the complex
and intricate nature of listening ability, there may not be an L2 listening ability framework
that is specifically applicable for L2 listening. The socio-cognitive framework of listening
assessment suggests that L2 listening ability should be assessed in terms of not only the
cognitive processings, but also the contextual factors such as the listening input and task,
test-taker, and other situational factors. These elements co-exist and interact with each
other in the listening assessment. Therefore, the following section will examine the
literature on relevant aspects of these factors and their impact on listening assessments.
2.4 Factors Affecting Listening Comprehension Process
As described previously, listening comprehension can be affected by a range of
variables pertinent to the listening input and the listeners. In the case of a listening
comprehension test, this is complicated by the impact of the particular tasks and settings
of the test. Bachman and Palmer (1996) suggested that test performance is affected by
test-taker and task characteristics. The test-taker characteristics consist of (a) topical
knowledge, (b) language knowledge, (c) personal characteristics, (d) strategic
competence, and (e) affective schemata. Of these characteristics, the former three interact
with the latter two. Furthermore, test-taker characteristics and test-task characteristics
interact with each other, and, consequently, affect test performance (see Figure 2.1). Buck
(2001) also identified four key characteristics that affect listening comprehension: input

27
characteristics, task characteristics, listener characteristics, and contextual characteristics.
The following section will review and discuss the relevant literatures on these aspects in
detail. The sections hereafter will start with a review of the literature on the variables
related to the listening input. This is will followed by a discussion of the key listener
characteristics that may affect performance in listening assessment. It will also revisit the
contextual factors concerning test setting and administration.
Figure 2.1: Some components of language use and language test performance. Adapted from Bachman and Palmer (1996)
2.4.1 Input characteristics. The input characteristics pertain to the nature of the
listening text that may affect the quality of the listening task. A number of empirical
findings have revealed the contribution of linguistic sources of the input made to
ESL/EFL listeners while completing a listening comprehension task. These linguistic
factors may include phonological modification, speech rate, accent, vocabulary, grammar,
text type and length, discourse markers or signaling cues and so on.
2.4.1.1 Sound. In many situations, sounds are not pronounced separately but are
modified in rapid speech, which can cause major comprehension problems for many L2

28
listeners (Buck, 2001). Phonological modifications vary depending on the scenario. For
example, speakers tend to speak fast and thus link sounds more frequently in casual
conversations whereas on more formal occasions they tend to speak with more care and
pronounce sounds more clearly.
Deterding and Poedjosoedarmo (1998) identified three main types of phonological
modifications in English: assimilation when a sound is changed by the pronunciation of
the sound next to it, e.g., that boy /ðæt bɔɪ/ becomes / ðæp bɔɪ /; elision or deletion when
sounds are dropped in rapid speech, e.g., best man /best mæn/ is changed to / bes mæn /
in rapid speech form; intrusion when a new sound is inserted between other sounds, e.g.
the sound /r/ is added between a word is spelt with a final letter r and the following word
starts with a vowel as in the case of for example /fə(r) ɪgˈzɑ:mpl/. In addition, many
functional words in English have two forms: a citation form when the word is read in
isolation or when it is stressed, and a weak form when it is unstressed in connected speech
in which the vowel is reduced to the schwa /ə/ (Buck, 2001; Deterding & Poedjosoedarmo,
1998). Field (2003) has discovered that L2 listeners tend to have difficulty in matching
the sounds heard to the right words or segmenting connected speech into their component
words, thereby forming inappropriate hypothesis of the listening input and leading to
distortion of later understanding.
Suprasegmental, or prosodic features of stress and intonation, are important
features of English and have a direct impact on how listeners chunk and interpret
discourse segments. There are two types of stress in English: word stress and sentence
stress. The stressed syllables are generally louder, longer and prominent than other
syllables. Intonation describes the rise and fall of the voice. Different intonational patterns
have different functions. The falling tone may signal the end of a statement, the rising
tone indicates a yes/no question, the falling-rising tone tends to have an attitudinal
function to indicate a non-final phrase or clause within an utterance, and the rising-falling
tone tends to be suggestive (Deterding & Poedjosoedarmo, 1998). It could be argued that
the prosodic features of English may hinder comprehension and acquisition for the
ESL/EFL listeners whose mother tongue is not characterized with stress or intonation
(Chen, Robb, Gilbert, & Lerman, 2001; Wei & Zhou, 2002). For example, Chinese is a
tonal language in which pitch changes occur over a single syllable instead of a stretch of
utterance of the entire sentence, and the change in tone alters the meaning of a syllable
(Ho & Bryant, 1997). Studies have found problems for Chinese speakers of English to

29
acquire the forms of English intonation (Zhang & Yin, 2009). Although there is a paucity
of knowledge regarding how tonal L1 speakers understand the intonational differences in
an L2 or FL which is not tonal (Boyle, 1984), in light of the considerable differences in
suprasegmental features between English and Chinese, studies in China and Taiwan have
identified the stress and intonation as a barrier for Chinese EFL learners (Hu, 2017; Huang,
2009; Yan, 2006).
2.4.1.2 Speech rate. According to Buck (2001), the average speech rate of English
is about 170 words per minute (wpm) or about 4 syllables per second (sps). The speed of
delivery varies according to different contexts or situations. Conversational speeches such
as dialogues and interviews tend to be faster and monologues such as lectures are a little
slower.
Prior studies have shown that speech rate has a major influence on L2 listening
comprehension and faster rates of delivery can reduce comprehension because of the short
working memory or the limited time for listeners to handle the heard message and
incoming sounds (e.g., Brindley & Slayter, 2002; Hasan, 2000; Zhao, 1997). In a recent
study, Ghahramanlou et al (2016) found keeping up with fast speech rate was the most
demanding cognitive operation amongst others such as syntactic or semantic processing.
However, to what extent speech rate affects comprehension might vary from person to
person and is complicated by other factors (Buck & Tatsuoka, 1998; Matsuura, Chiba,
Mahoney, & Rilling, 2014). There is evidence to suggest that when the speech rate does
not exceed a threshold, it might not make any difference in listeners’ comprehension. For
example, Révész and Brunfaut (2013) reported that the speed of delivery in their study
did not have an impact on comprehension probably due to the fact that the speech rate of
2.68 sps was too slow to cause any comprehension barriers for the participants of
relatively higher listening proficiency. Griffiths (1990) suggested that 1.93-2.85 sps
would not be a hindrance even for low-intermediate listeners.
2.4.1.3 Accent. Accent is another important variable that influences listeners’
understanding of the spoken text, especially in real-life contexts or when authentic
listening materials are used in the test. Many English tests have included standard English
accents such as British, American, Australian as well as a range of ESL varieties.
Although there are a limited number of studies on the relationship between accents and
listening comprehension, researchers have attempted to investigate whether familiar

30
accents are easier to understand than unfamiliar accents, which have been thought to pose
challenges for both native and non-native speakers (Major, Fitzmaurice, Burta, &
Balasubramanian, 2002; Matsuura, Chiba, Mahoney, & Rilling, 2014; Ockey, 2016;
Ockey, Papageorgiou, & French, 2016; Tauroza & Luk, 1997). Ockay et al (2016)
employed nine English accents in an ESL listening test and an accent strength scale to
investigate the relationship between the strength of accent, familiarity with the accent and
listening comprehension. The findings revealed a strong negative correlation between the
strength of accent and listening comprehension and a positive relationship between accent
familiarity and listening comprehension. The effect of accent seems to be moderated by
speech rate. Matsuura et al (2014) indicated that when the speech rate was reduced for
heavily accented monologue, the Japanese EFL listeners’ performance increased
significantly, but no significant effect was found with light accents with a decreased speed.
There is also research evidence to suggest listeners who share the same native
language (L1) with the speaker tend to have an advantage over those who do not
(Flowerdew, 1994; Harding, 2011). Harding (2011) had his Japanese L1 and Mandarin
Chinese L1 subjects listen to three texts of different accents – Australian, Japanese, and
Mandarin Chinese and found that both groups performed equally well on the Australian-
accented texts, but they did relatively better in the texts that carried the same L2 accent
as theirs.
2.4.1.4 Vocabulary. Vocabulary is considered a prerequisite to successful listening
comprehension (Buck, 2001; Kelly, 1991). Incomplete vocabulary repertoire and
unfamiliarity with the words used in the spoken input constitute the major sources of
confusion in listening comprehension. A body of empirical research has been identified
to support the robust role of vocabulary knowledge in successful L2 listening
comprehension (e.g., Bonk, 2000; Buck, 2001; Goh, 2000; Hasan, 2000; Kelly, 1991;
Kobeleva, 2012; Mecartty, 2000; Stæhr, 2009; Vandergrift & Baker, 2015). These studies
have adopted a range of instruments (e.g., a vocabulary test and a listening comprehension
test) to depict a clearer picture of vocabulary knowledge and listening comprehension.
For example, Mecartty (2000) compared the contribution of vocabulary knowledge and
grammatical knowledge to reading comprehension and listening comprehension and
found that both types of knowledge were conducive to listening comprehension, more
specifically, vocabulary knowledge explained 14% of the variance in the listening ability.
Staehr (2009) showed both vocabulary breadth and depth were highly correlated (r = .70

31
and .65 respectively) with L2 listening comprehension. Unlike previous studies (e.g.,
Mecartty, 2000) which used written vocabulary test (visual presentation) to assess
subjects’ vocabulary knowledge, Vandergrift and Baker (2015) measured the subjects’
oral receptive vocabulary knowledge by asking them to choose the correct image of a
word that they heard in a spoken stimulus (auditory presentation). Their study showed
confirming results to previous studies.
Révész and Brunfaut (2013) identified four possible lexical barriers that had a
moderate to strong impact on the difficulty of the listening task – proportion of function
words in the 1000 most frequent English word families, frequency of academic words,
lexical density, and lexical diversity. Bond (1999, cited by Field, 2008a) found that it was
significantly easier for ESL listeners to understand content words than function words
because of perceptual considerations. L2 listeners tend to focus more attention on content
words not only because they are more meaning-bearing than function words, but also
because they carry more prosodic salience in the speech and thus more dependable.
Uncommon proper names (e.g., names of persons, geographical locations, organisations,
events, etc) (Kobeleva, 2012), technical terms and concepts, and colloquial and slang
expressions (Huang, 2004) are reported to be amongst the sources of lexical difficulty
experienced by ESL listeners.
Breakdowns in recognising words might take place in both the steps of identifying
words and activating knowledge of word meanings (Rost, 2005). This is because it is
relatively difficult for L2 learners to locate word boundaries – segment sounds into
meaningful lexical units – in connected speech (Field, 2008c; Graham, 2006). Even when
the listeners have successfully identified individual words, they might not be able to
match the sounds to the templates in the memory and recall the correct word meanings
(Goh, 2000; Graham, 2006).
Chang (2007) found that vocabulary preparation prior to a listening comprehension
test improved their vocabulary knowledge and confidence but did not significantly affect
their performance on the listening test. This was echoed by Mehrpour and Rahimi (2010)
who discovered no significant effect of general word knowledge and specific lexical items
on students’ listening comprehension performance. They explained that the items in their
listening test did not require recall of detailed information involving specific vocabulary
knowledge and thus was unlikely to affect participants’ performance. They argued that

32
their findings did not imply the redundancy of lexical knowledge in listening
comprehension, nonetheless, a minimum threshold level of vocabulary is definitely
needed for comprehending the spoken language. This argument was supported by Stæhr
(2009) who found strong correlations between the depth and breadth of vocabulary
knowledge and listening comprehension and suggested a lexical coverage of 98% as the
threshold to understand 70% of the input text. However, in most cases full comprehension
might not be necessary, therefore, a lexical coverage of 95% would be sufficient for
adequate listening comprehension in most cases, requiring a vocabulary size of the 2000-
3000 most frequent word families (van Zeeland & Schmitt, 2013).
When confronting unfamiliar vocabulary in listening comprehension, listeners’
strategy to cope with them might vary (van Zeeland & Schmitt, 2013). Some may rely on
a bottom-up approach while others may use a more global and context-driven approach.
Cai and Lee (2010) investigated how differently ESL proficiency groups used contextual
clues (local co-text, global co-text, or extra-textual) in the oral input to activate and relate
to knowledge sources (linguistic, paralinguistic, and background knowledge) and
consequently employ different strategies (inferring and ignoring) to comprehend the
unknown words in listening comprehension tests. The findings show that the high-
proficiency group tended to use the inferencing strategy more frequently than the low-
proficiency counterparts and apply their overall understanding of the text to deduce word
meaning, whereas the less proficient subjects relied heavily on clues from the target words,
and words that were prosodically salient or heavily repeated to infer word meaning. More
detailed results were revealed by Cai and Lee (2010) regarding the effect of contextual
clues on the utilization of the inferencing strategy. Specifically, learners used the
inferencing strategy more frequently for words with global co-text clues and words with
extra-textual clues than for words with local co-text clues. The use of knowledge sources
was found to accord with the type of contextual clues, that is, learners used semantic
knowledge more frequently for words with local co-text clues whereas words with global
co-text clues were more associated with semantics of words dispersed the text; words
with extra-textual clues require the use of both semantic understanding of the local clues
and background knowledge.
In view of the significant role vocabulary knowledge plays in listening
comprehension, McLean, Kramer, and Beglar (2015) developed an aural vocabulary
levels test to diagnose knowledge to listen to and comprehend vocabulary in English. The

33
vocabulary knowledge used in the study included words from the first five 1000-word
frequency levels and the Academic Word List (AWL, Coxhead, 2000). The findings
suggested that good comprehension of a speech requires listeners’ awareness of 98% of
the words in the speech and the first 2000 words of English play a critical role in all
spoken texts.
2.4.1.5 Grammar. Theoretically, after the listener recognizes the words they would
assign them into grammatical categories (content words and function words) and establish
structural and semantic relations between them. This process of parsing makes it possible
for the listener to translate the incoming speech into propositional representations (Rost,
2005). However, studies on the relationship of syntactic knowledge and L2 listening
comprehension have occasionally produced conflicting results.
Hasan (2000) found that difficult grammatical structures were reported by the
students to be one of the major problems they encountered during the listening test.
Cervantes and Gainer (1992) discovered a positive link between lower-degree
subordination and comprehension of short lectures in two experimental studies. In the
investigation to see if lexical and syntactic simplification of listening input would reduce
the difficulty of the test, Shirzadi (2014) reported that the groups with simplified language
input outperformed the other groups. Compared with the prominent role vocabulary plays
in listening comprehension, the impact of grammar seems to be insignificant (Mecartty,
2000). Révész and Brunfaut (2013) investigated the effect of a number of syntactic
complexity contributors –subordination, phrasal complexity, and incidence of negations,
and overall complexity – and found no significant connection between them and L2
listening difficulty.
Overall, it might be concluded that both vocabulary and grammatical knowledge
in conjunction affect L2 listening comprehension, and the contribution of lexical
knowledge to the comprehension process, might outweigh that of grammatical knowledge.
2.4.1.6 Discourse. When the speaker conveys a message, he or she consciously or
subconsciously organizes the ideas in an order that helps the hearer to perceive the
intended meaning effectively and smoothly. This is particularly important in academic
lectures in which comprehension relies more on the correct interpretation of the inter-
relatedness and the structure of the whole text than the meaning of individual sentences
(Dunkel & Davis, 1994; Huang, 2005). The linguistic devices that are used to connect

34
and structure ideas in utterances are called discourse markers (DMs) (Fraser, 2006;
Hansen, 1998) or cohesive devices (Halliday & Hasan, 1976). The typical forms of
discourse markers include the linguistic items such as references, ellipsis, and
conjunctions. When they are used to link ideas at the clause or sentence level they are
called micro DMs, whereas those indicating major transitions, or overall structural
relations between paragraphs, are called macro DMs.
Given the importance of DMs in creating the semantic links between linguistic
units and directing the hearer’s attention to their relations, it is reasonable to assume that
it is easier for listeners to process spoken texts with stronger cohesion. Regardless, there
have been mixed findings on the effect of DMs on the comprehensibility of listening texts.
There is evidence to show that the organization of a lecture plays a vital role in its
comprehensibility. Sentence-level micro markers could enhance L2 listeners’
comprehension of lectures (e.g., Flowerdew & Tauroza, 1995; Jung, 2003), textual and
interpersonal markers favoured lower-level students in understanding academic texts
(Pérez & Macià, 2002), and lectures containing DMs helped L2 listeners to recall and
comprehend high-level information and low-level information better (Jung, 2006).
Tajabadi and Taghizadeh (2014) found that texts containing both micro and macro DMs
contributed more to the comprehension of L2 listeners than only micro or macro ones did.
On the other hand, Dunkel and Davis (1994) showed that DMs had no significant effect
on the information recall of L2 learners and there was no positive effect for DMs on the
quantity of notes taken by L2 learners. Gocheco (2011) found no discrepancies between
students’ comprehension of lectures with and without DMs.
2.4.1.7 Explicitness and implicitness. Explicitness is another factor to affect the
comprehensibility of the spoken language. It is assumed that texts with many implicit
ideas will exert more cognitive demand on the listener as it requires the listener to decode
the literal meaning (linguistic meaning) and instantly associate it with information
received earlier, background and personal knowledge to infer the implied intentions of
the speaker (pragmatic meaning) in a very short period of time. This process involves
many aspects of the listener’s knowledge in pragmatic and sociocultural conventions
(Buck, 2001; Rost, 2005).
Goh (2000) found that even if the listeners have understood the literal meaning of
words in the speech they might not be able to make sense of the intended meaning.

35
Taguchi (2005) investigated the accuracy and speed of interpreting the more and less
conventional implicatures in conversations by native speakers and Japanese ESL learners
and found that the Japanese participants experienced more difficulty in understanding less
conventional implicatures and spent more time on more conventional implicatures. This
might be explained by the possibility that unfamiliarity with conventions increased the
processing load on the listener, allowing less time and cognitive resources for the listener
on the incoming message. Garcia (2004) provided similar explanation that the
interpretation of pragmatic meaning through linguistic information would become more
automatized for high ability students whereas the low ability groups might use a different
set of listening skills to process the implied meanings.
2.4.1.8 Other text-based variables. Apart from the linguistic variables at the micro
sound, word and sentence level, there are a set of macro-level text features such as content
and organization that might affect L2 listeners’ cognitive processing of the listening input
(Field, 2013). This section will focus on the content and organization aspects of text to
understand its influence on the cognitive demand imposed on listeners.
Text length is one of the most obvious content factors that may make a spoken
input more or less difficult to understand. Hasan (2000) found that it is more difficult for
L2 listeners to understand a longer text because of their short-term memory load and
attentional diversion. In addition to the cognitive demand imposed on the listeners, longer
texts are also likely to undermine listeners’ confidence in pairing up the right segment of
the spoken input with a test item (Field, 2013).
Listening input with complex content involving a number of referents (people and
things) are more likely to confuse L2 listeners because it puts an extra burden on the
working memory to conflate identities, access information in memory and form mental
representations in the right way. This is particularly true if the individuals or objects in
question are very similar and indistinguishable in terms of names, roles or physical
characteristics (Brown, 1995). Other content variables such as unclear indication of the
relative importance of protagonists in the text, shifting relationships between protagonists,
and abstract content are also sources of difficulty for L2 listeners (Buck, 2001).
The organization of text also plays a part in the intelligibility of the input material,
which includes the temporal and spatial relations of referents, the causal and intentional
inferences between sentences and the informational relations of ideas. It is natural to

36
assume that texts involving events narrated in natural time order and simple spatial
relations are easier to understand (Brown, 1995; Buck, 2001).
The literature reviewed above has indicated that a variety of input variables play
crucial roles in listeners’ performance in the listening test. Taken together they exert
substantial cognitive load on listeners’ processing. To complicate the matter, listeners –
as the sole agent of the information processing – also contribute to their performance on
the test particularly with regard to their physical and mental state during the test period.
2.4.2 Listener characteristics. Although listening shares many similarities with
reading as a comprehension process, there are many unique characteristics that make
listening comprehension more demanding than reading comprehension. For example,
listening is more strenuous for listeners’ working memory because, unlike reading, once
information is spoken, the listener does not have a second chance to review it although
they can attempt to hold as much information as possible in their working memory (Rost,
2003). In addition, listening requires faster processing speed than reading because the
listener does not have control over the speed of the input or have the luxury of clear
boundaries between words of the input. Instead, the listener has to process the information
concurrently as the information is articulated.
According to Krashen’s (1982) affective filter hypothesis, variables such as
motivation, attitude and anxiety play important roles in second/foreign acquisition as well
and learners with low levels of anxiety perform better than anxious students. The next
section will focus on listener factors such as schema, working memory, anxiety involved
in L2 listening comprehension.
2.4.2.1 Schema. Schemas or (schemata) can be defined as modules of
preconceived ideas based on one’s prior knowledge and experience (Rost, 2005). They
are stored and organized in an infinite number of ways in the long-term memory and can
be modified and updated constantly. Examples of schemas include knowledge that
represents different aspects of the world such as culture, religion, discipline, topic, et
cetera. Schemata provide a framework for understanding when people listen to new things.
In most literatures on listening they are used interchangeably with such terms as
background knowledge, prior knowledge, personal and world knowledge.

37
Schemata are most likely to come into play in the utilization phase (Bacon, 1992)
in which the listener activates prior knowledge and integrates this knowledge with new
input received in the perceptual phase (Sadighi & Zare, 2006). The availability of prior
knowledge assists the listener in two ways: (1) to make predictions of the incoming
message (Brown & Yule, 1983; Jensen & Hansen, 1995; Mendelsohn, 1995); and, (2) to
compensate for the deficiencies caused by non-understanding the aural input (Goh, 2000;
Grant, 1997). There are shared comments from participants in Goh’s (2000) and Hasan’s
(2000) research that lack of background knowledge is one of the major barriers for their
successful apprehension of the spoken input. This learner perception has been confirmed
by empirical studies that specifically examine the effect of background knowledge and
listening comprehension in terms of religion (Markham & Latham, 1987), culture (Hayati,
2009), topic familiarity (Chang & Read, 2006; Chiang & Dunkel, 1992; Leeser, 2004;
Long, 1990; Sadighi & Zare, 2006; Salahshuri, 2011; Schmidt-Rinehart, 1994). When the
content of the material is familiar to the listener, he or she can easily activate their
background knowledge to make predictions which will be proved by the new input. In
contrast, if the listener is unfamiliar with the content of the listening text and deficient in
language proficiency, then they can only depend on the linguistic knowledge to make
sense of the information. Nonetheless, there is also evidence from Jensen and Hansen
(1995) who found the effect size of prior topical knowledge was not large enough to make
a difference in subjects’ performance on lecture comprehension. Chang (2006) also
indicated that topical knowledge could only play a supplementary role for college
students to comprehend the details of stories, and for low-level learners this effect was
even very limited.
2.4.2.2 Working memory. Working memory involves the temporary storage and
manipulation of information used in complex cognitive activities such as language
processing. The multicomponent model proposed by Baddeley (1992, 2003) suggested
that working memory consists of multiple components. The central executive component
is responsible for planning, coordinating the information flow and retrieving knowledge
from long-term memory; the slave system consists of two components - the phonological
loop to retain the phonological information of sounds currently being processed in a
rehearsal loop and a visuo-spatial sketchpad to store visual and spatial information; the
episodic buffer integrates information (episodes) from all the systems and transfer them
to long-term memory.

38
Hasan (2000) attributed listeners’ difficulty in comprehending a long spoken text
to their short-term memory load and attention distraction. Andringa, Olsthoorn, van
Beuningen, Schoonen, and Hulstijin (2012) found that while working memory seemed
somewhat correlated with some working memory tasks in the study, it could not explain
any unique variance in L2 listening ability when treated as a latent factor comprising all
five tasks. Similarly, Vandergrift and Baker (2015) did not find any significant
relationship from all the three cohorts of subjects. Therefore, the limited empirical
evidence to date tends to call for further research to gain a clear understanding of the
relationship between working memory and L2 listening comprehension.
2.4.2.3 Anxiety. Spielberger (1983) defined anxiety as “the subjective feeling of
tension, apprehension, nervousness, and worry associated with an arousal of the
automatic nervous system” (p. 15). Horwitz, Horwitz, and Cope (1986) denoted foreign
language (FL) anxiety as “a distinct complex of self-perceptions, belief, feelings, and
behaviors related to classroom language learning arising from the uniqueness of the
language learning process” (p. 128). The sources of FL anxiety may include perceived
self-efficacy, competence, frustration, and fear of failure (Elkhafaifi, 2005; Mills, Pajares,
& Herron, 2006; Baker & MacIntyre, 2000). There are also occasions whereby anxiety is
evoked by a specific situation or event over time, termed as “situation-specific anxiety”
(MacIntyre & Gardner, 1991, p. 90). Typical situation-specific anxiety may include
taking a test, delivering a speech, talking to a foreigner and so on. A large body of
empirical research has suggested that FL anxiety plays a significant role in language
learning problems (e.g., Awan, Azher, Anwar, & Naz, 2010; Horwitz, 2001, 2010; Kitano,
2001; Liu & Huang, 2011), and exerts a moderately adverse impact on speaking (e.g.,
Brantmeier, 2005; Liu, 2006), reading comprehension (Saito, Horwitz, & Garza, 1999;
Sellers, 2008; Argaman & Abu-Rabia, 2002), writing apprehension (Argaman & Abu-
Rabia, 2002; Brantmeier, 2005; Cheng, 2004; Woodrow, 2011).
Listening comprehension can be “highly anxiety provoking” (Krashen, as cited in
Young, 1992, p. 168). Especially in a stressful test situation this anxiety can be greatly
exacerbated – listeners may feel both emotionally anxious because of tension and
nervousness as well as cognitively anxious due to low perception of their ability or a false
impression that they must understand every word in the aural input. This anxiety might
be intensified when they are not able to hear or understand every single word. This could,
in turn, undermine their ability to become a good listener (Arnold, 2000; Hasan, 2000).

39
However, there seems to be scarce and inconsistent empirical findings to support this
assumption (e.g. Elkhafaifi, 2005; In’narmi, 2006; Mills et al., 2006).
Elkhafaifi (2005) found that anxiety was negatively and moderately correlated with
overall classroom performance (r = -0.15) and listening comprehension scores (r = -0.53)
for university students who learnt Arabic as a foreign language. It was also found that FL
learning anxiety and listening anxiety were separate but related phenomena that both
correlated negatively with achievement, years in school and years spent studying Arabic.
This finding was consistent with Mills et al. (2006) who reported adverse impact of
listening anxiety on listening proficiency of both gender groups.
In’narmi (2006) used two questionnaires and a listening comprehension test to
examine the impact of test anxiety on students’ listening comprehension performance.
The results showed that test anxiety did not affect listening test performance. Therefore,
he claimed that test anxiety seemed to work differently from communication
apprehension and fear of negative evaluation.
A recent study by Yang (2010) has suggested that listeners’ anxiety level is closely
related to their utilization of intentional forgetting strategy, which is a function of retrieval
inhibition to suppress unwanted memories from consciousness, during the listening
comprehension test. The size of intentional forgetting effect was negatively correlated
with the level of anxiety. The participants with higher ability in retrieval inhibition can
efficiently control the access to unwanted memories, which would favour the
apprehension process, whereas those with lower ability in retrieval inhibition are more
prone to anxiety arousals, which would in turn have a negative impact on listening
comprehension.
2.4.3 Contextual characteristics.
2.4.3.1 Visual aids / subtitles / paralinguistic factors. Real-life communication is
inevitably subject to factors other than the verbal information, which is described as
paralinguistic features of listening. These non-verbal inputs may include both auditory
information and visual signals. Rost (2005) classified visual signals into two main
categories: kinesic signals such as gestures and facial expressions of speakers, and
exophoric signals (or contextual cues) such as an outline of lecture structure on the visual
slides. It is important to understand how these different types of visual information

40
interacts with the linguistic input and affects listeners’ comprehension. A handful of
studies have been identified on the relationship between the two types of visual signals
and listening comprehension.
In Sueyoshi and Hardison’s investigation (2005) a lecture was video-taped and
modified into three versions, namely, AV-gesture-face (audiovisual including gestures
and face), AV-face (no gesture), and audio-only. A multiple-choice listening
comprehension task based on the lecture and a survey were administered to both low-
intermediate and advanced ESL learners. The findings from the listening task demonstrate
that students performed significantly better with visual cues regardless of proficiency
level. More specifically, the high ability group did best in the AV-face condition whereas
the low-level ones did best in the AV-gesture-face test. Survey results also showed
positive attitudes towards visual cues.
Shams and Elsaadany (2008) conducted a more detailed and thorough research on
the kinesic signals. He identified a number of paralinguistic features in terms of seeing
and hearing in videos of everyday English conversations and designed questions that
reflected the influence of the paralinguistic features to assess students’ listening
comprehension. Consistent with Sueyoshi and Hardison (2005), their results showed that
the paralinguistic features significantly enhanced the understanding of the treatment
group compared with those deprived of these aids in the control group. In addition,
significant differences were discovered in their effectiveness for comprehension, ranking
high from bodily contact, proximity, posture, lip-setting, looking, facial expression,
appearance, gestures, to other miscellaneous features that could be distinguished by
hearing.
Similarly, positive relations have also been discovered between contextual cues
and listening comprehension. For example, Muller (1980) conducted two experiments by
using a simple line drawing as contextual aids which illustrated the general situation of
an interview. The participants listened to the interview in three different settings: the
drawing was presented before listening (Visual Before), and after listening (Visual After),
and No Visuals. Immediate after the experiment they were asked to recall and write a
summary of the interview. Results of his Experiment 1 with the low proficiency group
indicate that the learners with contextual visuals scored significantly higher on the recall
measure than those without such aids. Moreover, the visual before hearing seems to result

41
in more comprehension than those in the Visual-After and No-Visual conditions.
According to Muller (1980), the possible reasons could be that Visual Before allows the
listener to activate prior knowledge and make predictions, reduces the likelihood of
incorrect interpretation of unknown words, and increases their interest and concentration
on the spoken input. Nonetheless, no significant yet substantial difference was found with
the high ability group.
In a more recent study, Ülper (2009) employed two experimental groups and one
control group of equal listening ability to investigate whether the visual availability of
schematic structure during listening assisted pupils understanding of stories. Two types
of visuals were used: schematic structure displayed on projected slides v. schematic
structure shown on printed handouts. The results indicate the mean scores of both
experimental groups were significantly higher than that of the control group on their mean
scores achieved in the post-listening test, implying that visual aids of schematic structures
significantly favored the listening comprehension process. He expounded that the visual
schematic structure aids enabled the pupils to make predictions of the story content. The
monitoring and checking of the correctness of the predictions while listening contributed
to better comprehension of the story. However, no apparent distinction was identified as
to which type of visual aid was more effective than the other.
2.4.3.2 Preparation prior to listening. According to Weir (2010), “test preparation
courses may also have an effect. To the extent that candidates are prepared for the
linguistic and meta-linguistic demands of the test, this is positive, but if the test lends
itself to test taking strategies that enhance performance without a concomitant rise in the
ability being tested then there must be some concern” (p. 55). The provision of some form
of support before or while listening may have an effect on the use of strategy, and in turn,
affect test performance. The positive impact is it provides test-takers with extra
information (Shohamy & Inbar, 1991; Chang & Read, 2006, 2007); the downside is it
may preoccupy them and interrupt their thinking. The most popular forms of listening
support are question preview, topic and vocabulary preparation, and repeated input.
Berne (1995) and Elkhafaifi (2005) adopted a similar research design to assess the
impact of pre-listening tasks (question preview, vocabulary study, and a task-irrelevant
activity) on listening test performance. Both studies found that students who completed
both the question and the vocabulary activities received higher scores than subjects who

42
completed the unrelated activity, and the question preview activity was found to be more
effective than the vocabulary preview activity though not significant in Berne (1995).
However, compared with the unrelated activity, the vocabulary preview activity did not
seem to make any significant difference on subjects’ performances (Berne, 1995). The
differential effect of question preview and vocabulary preview might be explained by the
strategy use stimulated by them. Previewing the comprehension questions before
listening allows the learners to see what information they will be responsible for, which
then allows them to focus their attention on the appropriate portions of the passage. Yet,
emphasis on vocabulary previewing might distract students’ attention from overall
understanding of the passage to local and individual vocabulary items (Berne, 1995;
Chang, 2007). In addition, the inauthenticity, passivity and irrelevance of vocabulary
preview activity may have an adverse impact (Berne, 1995).
Apart from question and vocabulary previewing, repeated input and note taking are
amongst the most popular listening support. Research has shown that multiple exposures
to the listening input can facilitate their listening comprehension because on the one hand,
it can help them to ease up their nervousness if they fail to apprehend the input in the first
time; on the other, a second chance of listening enables them to double-check and rectify
their comprehension (Chang, 2007; Elkhafaifi, 2005).
2.5 Text Type and Listening Comprehension
Listening purposes vary in different contexts or situations. For example, listening
to a new news broadcast to get a general idea of the news of the day involves different
processes and strategies from listening to the same broadcast for specific information.
Miller (1984) defined genre as a conventional category of discourse based in large-scale
categorization of rhetorical action; as action, it requires meaning from situation and from
the social context in which that situation happens. While different types of spoken
language have much in common, they may also vary according to other contextual
parameters, such as the degree to which they are planned or unplanned, whether they are
informational or procedural, and whether they are explicit or situationally dependent. As
a result, genres may differ in many aspects, including vocabulary, syntax, turn-taking,
discourse phenomena, disfluencies, paralinguistic effects and prosody. Cuendet,
Hakkani-Tu, Shriberg, Fung and Favre (2007) found that compared with conversational
multi-party meetings, average sentences in scripted broadcast news are two times longer

43
and the pitch features carry more information in broadcast news. Flowerdew and Miller
(1997) identified three key features to differentiate a scripted lecture from an authentic
lecture. The first is, a scripted lecture uses complete clauses and explicit conjunctions
such as “and”, “therefore”, and “however” to indicate the structure and logics in idea flow,
while in the real-life lectures the speech is often in incomplete clauses with pauses, and
connected with micro-level discourse markers such as “and”, “so”, “but”, and “okay”.
The second important feature of a scripted lecture is it does not have the false starts,
redundancies and repetitions, which are typical in authentic lecture discourse. The third
feature is the use of body language in real lectures while it is absent in the scripted lecture
(Flowerdew & Miller, 1997). It is reasonable to assume that written-oriented texts such
as short lectures are potentially more difficult to understand given the complex structure,
denser information and use of fewer pauses (i.e., cognitively taxing) than orally-oriented
texts such as daily conversations (Rubin, 1994).
Although some scholars claim that language tests should take into account the
generic features of the input as it affects test takers’ processing capacity (Nunan, 1997;
Tsui & Fullilove, 1998), the cognitive processes involved in handling these text types is
under researched. The following part reviews the few studies in this respect and identifies
the gap that needs more academic investigation.
Sadeghi, Hassani, and Noory (2014) used genre-based listening input in 12
listening sessions to teach two groups who scored equally in the pre-listening test, but the
concept of genre and their functions were only introduced to the treatment group not the
control group. They found that the treatment group performed significantly higher than
the control group in the post listening test and concluded that genres had significant
impact on listening comprehension of Iranian EFL students. This result might be due to
the reason that introduction of the listening genres (namely, narrative, argumentative,
descriptive and expository) and their respective features activates students’ prior
knowledge and alerts them to adopt the most appropriate listening strategy to comprehend
the input more easily.
Shohamy and Inbar (1991) investigated the effect of both text and question type
on test-taker’s scores on listening comprehension tests. The text type included a news
broadcast, a lecturette, and a consultative dialogue, ranging from the most literate to the
most oral speech. The questions included global, local and trivial types. Test-takers were

44
asked to listen to two different text types about two topics and answered identical
questions so that their performance on the different text types could be compared. It was
found that the text type affected the performance of the test takers in a systematic manner,
the difficulty increasing from the dialogue, the lecturette to the news broadcast.
According to Shohamy and Inbar (1991), the systematic impact of the most oral to the
most literate speech could be explained at both the linguistic and the pragmatic features
of each genre. Linguistically, the news broadcasts are dense with long propositions and
complex grammatical structures such as the passive and relative clauses, whereas the
dialogues and the lecturette might contain a number of redundant utterances and simple
structures. In terms of the pragmatic features, the dialogues and the lecturettes are more
likely to be familiar and interactive to the test takers than the news broadcasts, hence
exerting less difficulty on the comprehension during listening. Moreover, they found that
the local questions from the oral text type was the easiest while the global questions from
the literate text type presented the most difficult test version. The interactions between
text type and question types are in accordance with previously discussed findings
(Shohamy & Inbar, 1991), where literate genres present an added difficulty to the L2
learners as would a task demanding utilizing global strategies. It is logical that the
combination of these two elements increased the degree of complexity for test takers.
Using the 3-way ANOVA test, Berne (1993) found no main effect of text type on
the listening comprehension of English native speakers’ Spanish as a foreign language.
However, further analysis showed that text type was significant in the comprehension of
details in the multiple-choice test type. She claimed that the organization of academic
lectures was an important factor that affected listeners’ comprehension. Students unaware
of the structure of an academic lecture, or the conventions and cues which signal
important information in lectures, face problems in academic lecture comprehension
(Lebauer, 1984).
2.6 Test-taking Strategies in Listening Comprehension
It has been argued that there are three types of strategies that test-takers draw up
as they complete language tests: language learner strategies, test management strategies,
and test-wiseness strategies. According to Cohen (2012), language learner strategies
denote how test-takers operationalize the language skill in the test. This is similar to the
listening subskills described above, for example, differentiating sounds, distinguishing

45
main ideas from supporting ideas, et cetera. Test management strategies are used to
respond meaningfully to the test items and tasks. For example, during listening
comprehension test-takers may analyse the questions and compare the multiple-choice
options rigorously to determine the most appropriate answer. Test-wiseness strategies are
adopted when knowledge of test formats and other peripheral information is draw upon
to answer test items without going through the expected linguistic and cognitive processes.
Cohen (2012) reviewed the research on the strategies used in language assessment
and identified a number of test-taking strategies for different test methods and item types
for different language skills. The test-taking strategies pertinent to multiple-choice
listening comprehension items include:
Verifying if the options match elements of the listening text or the question in
terms of keywords, specific details, inferences about details, level of specificity
(which may constitute a test-wiseness strategy if the matching does not require
understanding the language);
Checking back to part of all of a prior question as a guide to selecting a response
to the item at hand;
Determining the level of detail required in answering a question so as to reject an
option that is either too general or too specific;
Identifying relevant background knowledge and then utilizing it in an appropriate
way; and
When uncertainty prevails, making an educated guess drawing on a combination
of strategies such as those listed above. (p. 101).
While language learner strategies are expected to reflect test-takers’ actual
cognitive processing of the spoken input in the listening test, investigation into test
management strategies and test-wiseness strategies could assist understanding what test
takers are actually doing to produce answers to questions, and how this corresponds to
the skills that were the target of the assessment.
2.7 Adopting the Rasch Model for Measurement
Given the complex nature of listening comprehension and the numerous variables
involved in L2 listening comprehension, it is appropriate to adopt a modern test theory
perspective to analyse the subskills of listening tests. Without an investigation of the

46
testing process and outcomes from a modern test theory perspective, the relationship
between various listening skills will remain ambiguous, and unable to generate useful
diagnostic information for stakeholders. A key model in modern test theory – the Rasch
model for measurement (Rasch, 1960) – could help to determine the psychometric
properties of the DELTA listening component and establish a scale of the subskills tested
in the DELTA listening component; therefore, it will help to address the research
questions of whether the proposed listening subskills in DELTA listening component are
empirically divisible and hierarchically orderable. The Rasch model and its suitability for
application in this research is outlined below.
2.7.1 Rationale for the Rasch Measurement family of models. The Rasch model
for measurement was developed by and named after the Danish mathematician George
Rasch (1901-1981). The mathematical theory underlying Rasch model is a special case
of item response theory (IRT). In IRT, more generally, one’s response to an item is
affected by a number of person and item factors. The person factor, known as person
ability, represents the person’s location on the scale that measures a particular underlying
latent trait or attribute. The item factor, called item parameters, might include item
difficulty, item discrimination, and a pseudo-guessing parameter. Item difficulty is the
location of the item on the latent trait scale; item discrimination refers to the degree to
which an item can differentiate high-ability persons from low-ability ones; the pseudo-
guessing parameter bears the assumption that even low-ability persons have 25% of
probability to choose the correct answer of a multiple-choice item with four options by
simply guessing. Depending on the number of item parameters involved in the analysis
IRT theory is construed in three forms: one-parameter model (1PL), two-parameter model
(2PL), and three-parameter model (3PL).
The Rasch model is a special case of the 1PL IRT model, which involves the person
ability parameter and only one item parameter, namely, item difficulty. The Rasch model
proposes that the probability of an individual’s succeeding on an item can be modeled as
a probabilistic function of the ability of the individual and the difficulty of the item only
(Bond & Fox, 2007). A person with higher ability should have higher chance of
answering any particular item correctly than a person with lower ability. Based on the
performance of a particular sample of subjects on a particular sample of items, the Rasch
model (as instantiated in widely used software) uses a mathematical procedure known as
maximum likelihood estimation to calculate the subjects’ abilities in relation to the entire

47
bank of such items, and the item difficulties for the entire population of prospective test
takers. Through iterative processes of calibration, it enables the analyst to establish an
interval scale where the candidate ability and item difficulty can be directly compared.
Different from general IRT and other statistical models, the Rasch model requires that the
data fit the model (Andrich, 2004) - rather than the model fitting data - and this is reflected
in the interpretation of residual-based ‘fit statistics’ (i.e., infit and outfit). To the extent
that the observed data fit the model, predictions can be made about the probability of any
person succeeding on the items that have been calibrated on the same measurement scale
(McNamara, 1996). Any erratic performance of items or persons would be seen as
misfitting, and is routinely regarded to have derived from factors other than the
underlying latent trait; thus those aberrant performances are flagged for closer monitoring
and diagnosis. Therefore, in Rasch analysis, the ultimate report of person ability and item
difficulty estimates are routinely reported in logits (with fit statistics) and standard errors
of measurement which indicate 95 percent range of the person’s true ability, or the true
difficulty of an item.
The crucial property of Rasch measurement is its embodiment of the principle of
invariance. Invariance refers to “[t]he maintenance of the value of an estimate across
measurement contexts. For example, item estimates remain stable (within error) across
samples and subsamples of suitable persons; person estimates remain stable (within error)
across suitable tests and subtests” (Bond & Fox, 2015, p. 362). The measures of item
performance remain constant regardless of which persons the items are used for; and the
measures of person performance remain constant regardless of which items are used for
the persons (Engelhard, 2013). This allows for the prediction of the location of item
difficulty along the scale comprised of specific test items and teachers can use can use
individual students’ current performance on the test items to predict their likely
performance on other items in the item pool.
There are a number of models in the Rasch family in terms of the nature of the data.
The dichotomous Rasch model is the original and “simplest” (Bond & Fox, 2015) model
among the Rasch-family models and used for analysis of dichotomous data comprising
of right or wrong answers. A right answer is coded 1 and a wrong answer is 0. A multiple-
choice item is normally regarded as dichotomous in that the key option tends to be seen
as the only right answer and the distracters are regarded as wrong answers. The
dichotomous model was then extended to cater for polytomous data such as survey items

48
using a rating scale. In such data an item has a number of ordered response categories
coded (e.g., strongly disagree=1, disagree=2, agree=3, and strongly agree=4), and all the
items have an identical response structure. This model is often referred to as the Rasch
rating scale model (RSM). The partial credit Rasch model (PCM) was later developed by
Wright & Masters (1982) to accommodate situations whereby partial marks are awarded
for partial success on some items. In this way questions with true/false answers (0 or 1)
and short questions scoring (0, 1, 2, 3) can both be modelled on one scale. On some
occasions variables other than items and persons may play a part in the testing. For
example, an English writing test often involves additional facets of marking criteria and
markers (or raters). How the raters use the marking criteria might affect the ultimate
determination of the persons’ score on the test. This issue can be accommodated by
another extension model of the Rasch measurement – the Many-Facets Rasch
measurement model (MFRM). The MFRM incorporates other facets beyond the item and
person into the model for evaluation (Linacre, 1992; Eckes, 2011). It is vital to note that
the MFRM requires minimally sufficient linkage between all elements of all facets in the
model so that direct and accurate comparison can be made between every element in the
test (Linacre, 1997).
2.7.2 Application of Rasch measurement in language testing. Rasch
measurement has been widely applied in the development and evaluation of surveys and
tests in education, social science, health and rehabilitation, and market research
(Belvedere, 2010; Boone, 2016). Its application in second and foreign language testing
started in the 1980s and research has been extensively published in the area of language
test development, delivery, and validation (McNamara & Knoch, 2012). Although
vestiges of an earlier controversy as to whether the Rasch model is appropriate for the
analysis of language test data might remain, proponents have been able to demonstrate
that the model could confirm the unidimensionality of language assessments (McNamara,
1996). The abundance of articles (48) published from 2010 to 2016 in the two leading
journals in language assessment, i.e., Language Testing and Language Assessment
Quarterly reviewed by Fan and Bond (2019) further indicates the increasing acceptance
of Rasch model in the language assessment field. Publications have proved the Rasch
measurement models to be useful for establishing construct validity of vocabulary test
(e.g., Beglar, 2010; McLean et al., 2015; Pae, Greenberg, & Morris, 2012), reading test
(e.g., Aryadoust & Zhang, 2016; Stantos, Cadime, Viana, Prieto, Chaves-Sousa, Spinillo,

49
& Ribeiro, 2016), rater behaviour and scoring criteria of writing or speaking test (e.g.,
Eckes, 2011; Elder, McNamara, & Congdon, 2003; Goodwin, 2016; Huhta, Alanen,
Tarnanen, Martin, & Hirvela, 2014; Knoch, 2007; Winke, Gass, & Myford, 2013), and
detecting differential item functioning (e.g., Aryadoust, Goh, & Kim, 2011; Banerjee &
Papageorgiou, 2016; Raquel, 2019; Runnels, 2013).
The application of Rasch measurement in listening comprehension test is on the
rise. The basic Rasch model and its extensions have been utilized in one way or another
to empower researchers to probe into the issues with construct validity, item and test-
taker performance in listening assessments. Fan and Bond (2019) suggested the PCM was
effective to explain the unidimensional construct under the listening test of the Fudan
English Test used in a Chinese university. The MFRM enabled Batty (2014) to compare
the difficulties of tests derived from different aural input formats (i.e., video and audio),
and investigate interactions between format and text-type, and format and proficiency.
Differential item functioning between the audio and video formats was also examined.
Using the mixture Rasch model (MRM) that integrates Rasch measurement and latent
class analysis, Aryadoust (2015) investigated the differential item functioning in a
listening paper under the BEC Vintage intermediate level.
2.7.3 Rasch-based computer software. A variety of computer software has been
developed to empower data analysis with the Rasch model and can be found at
www.rasch.org/software.html. The most popular ones include WINSTEPS, FACETS
ConQuest, Quest, R, STATA, RUMM. Most of the software allows for both dichotomous
and polytomous Rasch models whereas ConQuest 4 provides additional possibility for
multidimensional analysis. All of the packages provide estimates of item and person
parameters and fit statistics.
WINSTEPS and FACETS are widely used Rasch software programmes for the
Windows platform. Both of them were originally developed at the University of Chicago
and constantly updated by Prof. Mike Linacre. While WINSTEPS is competent to process
dichotomous and rating scale data, FACETS is more applicable to multiple facets under
the MFRM. Both of the packages allow for generation of Wright map to plot all the
modelled variables in one reference of frame, item and person measures, fit statistics,
principal component analysis of Rasch residuals, rating scale structure analysis and DIF
detection.

50
2.8 Summary
This chapter reviewed the literature pertinent to the current study. Focusing on the
cognitive, contextual, and scoring validity proposed in Weir’s socio-cognitive framework
of validating listening assessment, this chapter first reviewed various models to
understand the cognitive processings involved L2 listening comprehension. It then moved
on to discuss the literature on the contextual validity variables such as the listening input
and test settings. Finally, the scoring validity was addressed through the explanation of
the statistical analysis model – the Rasch model.
The shortage of diagnostic assessment of listening ability and research calls for
more research into the nature of L2 listening comprehension. Although the proponents of
the componential approach developed several taxonomies of listening subskills, empirical
research on whether these listening subskills really exist and differ from each other is still
scant. Moreover, given the complexity of the wide range of factors involved in listening
tests, much uncertainty still exists regarding the relationship between the cognitive
processings and the linguistic characteristics. In the case of the DELTA listening test,
listening subskills and the type of listening texts are two crucial indicators to show in the
diagnostic profile what the relative strong and weak areas test-takers have in terms of
listening ability. This indicates a strong need to understand the relationship between
listening subskills and text type to better benefit the development of the DELTA listening
test and its users.
In light of the gaps identified in the literature review, the present study aims to
address these issues by investigating the DELTA listening test component. It further
examines the cognitive processes involved in answering the DELTA listening test,
thereby providing cognitive validity to the test. By looking at the relative difficulty of the
listening subskills the present research offers empirical evidence to the separability and
the hierarchical order of the listening subskills. Lastly, by utilizing the Rasch
measurement to integrate distinct variables in one framework of reference, the interaction
between listening subskills, text types and examinees is determined. It therefore makes
implications for the independence of cognitive validity, contextual validity and scoring
validity that is claimed by the socio-cognitive perspective of listening test validation.

51
CHAPTER THREE
METHODOLOGY
To address the research questions outlined in Chapter One, the study employed a
multi-method approach to collect both quantitative test data and qualitative verbal report
data. This chapter first outlines the important aspects of the quantitative data source,
including the background of the DELTA, the instrument construction and structure, and
the selection and composition of the sample. Although the quantitative data which were
later analysed from the Rasch measurement perspective address RQ1, they do so only
partially, and need to be complemented by the qualitative evidence from Stimulated
Recall Protocol (SRP). It then proceeds to justify the deployment of qualitative SRP data
to triangulate the research and depicts the respondents, the instruments, and data
collection process. Finally issues related to research ethics are presented and resolved.
3.1 The DELTA Listening Component
3.1.1 Background. The primary source of data is the listening component of the
Diagnostic English Language Tracking Assessment (DELTA). The DELTA is an
ongoing collaborative research project amongst three Hong Kong tertiary institutions.
The project has received funds from the Hong Kong University Grants Committee (UGC)
and gained support from Lyle Bachman who has reported the inter-institutional
collaboration to develop a diagnostic English assessment as ‘of particular importance”
(Bachman, 2010, p. 3). The aims of the collaboration are to develop a web-based English
language assessment, to diagnose university students’ strengths and weaknesses in
English learning, to provide effective feedback in the form of an e-report, and to track
students’ English progress during their university studies. The DELTA system has three
major constituents: (1) the enrolment system, (2) the test interface, and (3) the reporting
system. Each year the system is open for enrolment before semester commences. The
students complete online enrolment and register for a test session. After taking the 90-
minute test in the university’s language lab, students receive diagnostic e-reports
indicating their overall and component proficiency level reported as DELTA measures
ranging from 0 to 200. The report also provides detailed diagnostic information on the
mastery of sub-skills in each component. The students are advised to consult their

52
language advisors and make use of the provided online links which direct them to
potential books and materials for practice.
3.1.2 Listening component: format and specifications. The DELTA listening
component assesses Hong Kong tertiary students’ ability to listen to, and understand
spoken texts of types used in academic and general contexts (DELTA, 2012). The
students are tested on their linguistic (lexical, grammatical, semantic and phonological),
pragmatic, and sociolinguistic competences to comprehend a range of spoken prose in
their university studies. Based on this understanding of the underlying listening construct,
the DELTA listening component tests the ability to:
Understand local linguistic meanings (linguistic competence);
Understand full linguistic meanings (linguistic competence);
Understand inferred meanings (linguistic and pragmatic competences); and
Communicative listening ability (linguistic, pragmatic and sociolinguistic
competence).
The listening component draws on a variety of audio sources to which Hong Kong
university students are most likely to be exposed. For example, most audio sources
include the following spoken genres (or text types): debates and discussions, dialogues
and conversations, information and instructions, news reports, personal reflections,
presentations and lectures, TV/radio interviews. The content of the spoken texts might be
both general and technical, provided that the technical content is unlikely to disadvantage
any section of the target population. The most frequently used topics include daily life,
business and marketing, employment, media and communication, and relations with
others. There is a balance of English accents across the audio pool; for example, Hong
Kong, British, American, Australian, Canadian, et cetera. There is also a balance of male
and female speakers. The speakers generally use a natural speed of speech; as a guideline,
the average speech rate ranges from 140 to 170 words per minute.
3.1.3 Item data structure. The investigator had permission to access and use all
DELTA listening tests that were in operational use during the previous two years. As
some of the DELTA text types contain a relatively small number of texts (such as the
personal reflections, information and instructions, news reports, debates and discussions),
the three main text types were selected for inclusion in the present study. The three main

53
text types are (1) dialogues and conversations, (2) TV/news reports, and (3) presentations
and lectures, which comprise a total of 33 listening texts. Each listening test has four
spoken texts with 5 to 8 questions for each, up to a maximum of 30 items. Each audio
recording starts with an introduction of the topic and the speakers involved, and lasts from
3 to 10 minutes. The recording is played once, with pauses of 15 seconds at appropriate
points for the examinees to answer corresponding questions (normally 3 to 5 questions
each section). A ‘beep’ sound is included in the pause in order to warn the candidates that
the recording is about to begin/resume. All the questions are multiple choice questions,
with one stem and four response options. Each item is designed to focus on one particular
item intent, namely, to test one particular listening sub-skill provided in the DELTA
specifications. These are the initial sub-skill types and listed as follows:
SSK1. Identifying specific information.
SSK2. Interpreting a word or phrase as used by the speaker.
SSK3. Understanding main ideas and supporting ideas.
SSK4. Understanding information and making an inference.
SSK5. Inferring the speaker’s reasoning.
SSK6. Interpreting an attitude or intention of the speaker.
3.2 Test Administration
3.2.1 Allocation of test questions. The DELTA is a web-based language
assessment. The examinees are enrolled online and select a test session in the first couple
of weeks of a new academic year. The system is adaptive, but differs from other adaptive
testing or Computerised Adaptive Testing (CAT) where test items are selected to adapt
to examinees’ performance on the test during the process of the test (Wainer, 2000).
Rather, the DELTA allocates test questions in accordance with the student’s previous test
result and the number of times the student has taken the test. For a student’s initial
DELTA assessment, the system assigns general test questions to the examinee; if it is a
subsequent attempt, the system assigns test questions based on the previously assessed
proficiency level of the examinee.
The listening test component of the DELTA has three levels of text complexity
(1) easy, (2) medium and (3) difficult. As the DELTA team was still in the process of
designing and importing new listening texts when the present study was conducted, the

54
difficulty of the new listening texts were predetermined by the item writers and
moderators whereas that of the used listening texts was determined based on the range of
item measures (in logits) which had been calibrated in the prior test rounds. The allocation
of DELTA listening test components to student’s attempts of the test is summarized in
Table 3.1. Generally, four texts are assigned for first attempt, including one easy, two
difficult and one difficult text. As texts of greater difficulty have longer recordings and
more test items, the medium and difficult versions for subsequent attempts consist of three
texts only.
Table 3.1: The allocation of DELTA listening test components
Attempt DELTA Proficiency Range
Text Difficulty
First Attempt Unidentified 1 easy + 2 medium + 1 medium-difficult / difficult
Subsequent Attempt (Easy)
101 and below 1 easy + 2 medium + 1 medium-difficult / difficult
Subsequent Attempt (Medium)
102~113 1 easy + 1 medium/difficult + 1 difficult
Subsequent Attempt (Difficult)
114 and above 2 medium-difficult + 1 difficult
3.2.2 Student sample. In the 2013-14 academic year, the DELTA listening
component was administered to 2830 first-year and second-year students from the
participating universities. Most of them were Hong Kong locals and mainland Chinese
EFL learners who would use English as the medium of Instruction (EMI) at university.
They were also enrolled in English enhancement programmes or EAP (English for
Academic Purposes) courses as required by each of the universities. The DELTA is a
low-stakes language test and the purpose of using it varies across universities. When the
present study was conducted, it was regarded as a voluntary test in two universities and a
compulsory component of the English courses in the other university. Generally, it was
expected that each student would take the test again during the following academic year.
Despite its differing statuses across universities, it can be argued that students’ motivation
to sit for the test was similarly low (Tsang, 2013).

55
3.3 Stimulated Recall Protocol
In the fields of L1 and L2 research, the stimulated recall verbal reporting method
has been employed to investigate reading and writing process and strategies, language
testing, translation, interlanguage pragmatics, conversational interaction, as well as
attention and awareness (Bowles, 2010). Listening comprehension is an invisible, internal
and complex process; it involves activation and application of a repertoire of cognitive
functions and skills. Buck (1991) suggested that “verbal reports on introspection could
provide useful data on both listening processes and the taking of listening-tests” (p. 28).
By reflecting on the processes of how they perceive the spoken input, recall and activate
relevant schemas and associate them with the incoming discourse, it is presumed that
listeners will be able to provide a detailed description of how they utilized their linguistic
and paralinguistic knowledge to comprehend the incoming spoken discourse to answer
the questions.
The research on L2 listening comprehension processes is dominated by the use of
immediate retrospection to examine listening strategies on the assumption that this kind
of verbal reporting allows for the elicitation of cognitive data with least intrusive effects
(e.g., Goh, 2002; Graham, Santos & Vanderplank, 2008; Vandergrift, 2003). Studies into
the L2 listening sub-skills reviewed earlier mostly have employed quantitative test item
analysis to generate subskill clusters by adopting certain data analysis models. Few
studies have used qualitative methods to obtain examinees’ reports on their processes in
online listening comprehension (Buck, 1991; Ross, 1997; Barta, 2010). Although
findings from psychometric analyses provide valuable insights into listening sub-skills, it
is equally important that these findings be justified, substantiated or confirmed with
qualitative data. As Ross (1997) asserted, the immediate retrospection method “provides
a useful tool for investigating the psycholinguistic validity of item response patterns and
can offer detailed qualitative data to supplement traditional and probabilistic approaches
to test analysis” (p. 219). This idea is also shared by Green (1998) who emphasised the
growing importance of verbal reports in test validation. Buck (1991) gave a more focused
direction for future research in this field, “Although this method may not be very suitable
for testing clearly formulated research hypotheses, it does seem likely to provide a broad
view of second-language listening processes and indicate how listening tests work” (p.
68).

56
3.3.1 The stimulated recall protocol method. As introspective verbal reporting
assumes that a cognitive process can be seen as a sequence of internal states successfully
transformed by a series of information processes, and that information is stored in, and
can be retrieved from, short-term and long-term memory (Ericsson & Simon, 1993).
Before verbalization of these reports, the test stimuli are subject to successive processes,
including recognition of stimuli, association of stimuli to schemas in long-term memory,
control of attention when necessary, fixation of new information, and conversion into
verbalizable codes. Depending on the temporal space (i.e., the timing of its
implementation), verbal reports can be further divided into concurrent and retrospective
reports. Concurrent reports (i.e., think aloud or talk aloud) require the subjects to vocalise
their thought processes while performing a task or solving a problem, whereas, in
retrospective reports, subjects recall and report on their thinking processes during a
previously performed task. It is reasonable to assume that some written, aural or visual
prompts might aid respondents’ recall of the mental processes in operation, thereby
enhancing the use of and access to short- and long-term memory structures. This type of
retrospective verbal recall is called stimulated recall protocol (SRP) (Gass & Mackey,
2000; Bowles, 2010). It has an advantage over concurrent verbal reports, or think-aloud,
in that not all subjects are likely to be equally capable of carrying out a task and
simultaneously talking about doing that task (Gass & Mackey, 2000). This holds true for
a listening test situation, such as the DELTA online testing, as the test has a time
restriction, the respondents do not have control over the listening input, and it would be
extremely difficult for the respondents to listen, answer and talk about the question-
answering process without affecting the performance of the listening task.
Its effectiveness for investigation of the listening comprehension processing has
been justified by a recently published study by Rukthong and Brunfaut (2019) that
examined the cognitive listening processes and metacognitive strategies. In their study
videos recording the listening-to-summarise tasks and notes and the summary they made
while listening were used as stimuli. Participants were asked to recall and report anything
she or he wanted to say about the test-answering process while watching the video. It
should be noted that while the SRP method adopted in the current study might appear to
be a replication of Rukthong and Brunfaut (2019), the design of the current study was
original and independent from Rukthong and Brunfaut (2019), and was carried out years
before Rukthong and Brunfaut (2019) became available.

57
3.3.2 The current study. The present study adopted SRP as a complement to the
quantitative test analysis to address the first research question: What are the listening sub-
skills that underlie student performance on the DELTA listening test? Various aspects of
the stimulated recall were considered for implementation including the relation to the
action, respondent training, instrument structure, type of stimulus for the recall, and
initiation of recall interaction (Gass & Mackey, 2000). The relation to the action refers to
the specificity of the action to be recalled and the immediacy of the recall to the action.
Whether the recall is consecutive, delayed or non-recent, affects respondents’ thinking
and behaviour in the SRP process. Respondent training is important for eliciting the
expected type of data but should be brief and minimal. The structure of the recall
procedure might range from low-structured such as open-ended questions to high-
structured ones such as multiple-choice questions. The stimulus are supposed to provide
strong support to help the participants to recollect their thought processes and can be in
the form of written work, audio or video recordings or data captured by computer. Either
the respondent or the researcher could initiate the recall depending on the interaction or
discussion involved in the recall and individual respondent variables (e.g., cultural or
language proficiency factors).
The SRP procedure was implemented with individual respondents in a language
lab with high quality acoustics. Each respondent was asked to ‘re-take’ the actual listening
test administered by the DELTA system. First, the respondents listened to the spoken text
and worked on the WORD-processed answer sheet on the computer just as they did in the
authentic DELTA test scenario, during which the answer sheet was displayed on the
webpage. The computer screen was video-taped to capture the movement of the mouse,
notes and corrections (if any) the respondents made on the answer sheet. Second, the
respondents then watched that recorded video input, section by section, with pauses for
them to review the corresponding test items and verbalise their interpreting, reasoning
and decision making processes in working out their answers. In the meantime, the
investigator observed and listened to the participants’ verbalization and took notes of
interesting and important reflections for subsequent interview. The investigator could also
pause the video if she had a question about the video stimulus or the verbalization. Lastly,
the investigator enquired further into the points noted in the previous step and asked the
participants to comment on the relative item difficulty, and the impact of text

58
characteristics (preferably generic features) on their comprehension. Respondents’
verbalisations and conversations with the investigator were audio-recorded.
3.3.2.1 Respondents. A total of 62 respondents (24 males and 38 females) were
recruited for the stimulated recall study. These particular respondents were selected for
three key reasons: (1) they were all non-native speakers of English; (2) they all had taken
the DELTA test recently; and (3) they answered at least two text types in the test. The
listening proficiencies of these participants ranged from 95 to 124 DELTA units. As
previously reported, the mean of the DELTA listening test was 108 on the 0~200 DELTA
scale. Based on their performance in the DELTA listening test, 28 of these respondents
were classified as lower proficiency participants and 34 were higher proficiency
respondents.
3.3.2.2 Stimulus: The Modified DELTA listening test. The DELTA listening test
was modified for the SRP for two key reasons: (1) to shorten the data collection session;
and (2) to obtain verbal data that were related to the current study only. The modifications
included simulation and recreation of the DELTA listening test format with Microsoft
WORD processor and reconstruction of listening tests as WORD documents.
As the DELTA is a web-based language test and students are allowed to use the
DELTA system only once a year, it is impossible to implement the test again on the
system in the same academic year merely for the purpose of the present study. Further,
the system is programmed to select items/texts for examinees according to the parameters
of item/text difficulty. Nevertheless, the parameters of item selection are applicable for
particular batches of items/texts only; for example, the system can choose items/texts
based on their difficulty level, but cannot select sets of items/texts to be identical with
those used in the previous test. Alternatively, it will choose items/texts of equivalent
difficulty levels from the item pool for the forthcoming test. Due to the system’s inability
to choose specific items/texts for particular students, for each subject, different sets of
texts were constructed with WORD to simulate the format of the test they had completed
in the previous online DELTA test.
Moreover, the DELTA listening test comprises of three to four listening texts,
which are likely to be a combination of different text types. But as this study focuses on
conversations, TV/radio interviews, and short lectures only, a small number of irrelevant

59
texts were removed; consequently, the simulated test constituted two or three texts. These
texts were arranged in the same order they appeared in the DELTA listening test each
respondent took. The audio files were then organized in the same order as the texts. In
keeping with the administration of the DELTA listening test, each audio file started with
a 1.5-minute instruction and 1 or 1.5-minute pause for previewing the questions
depending on the number of texts to be answered. Similarly, each audio file ended with a
1 or 1.5-minute pause for the interviewees to review the answers. The conditions were as
close as possible to those experienced by the subjects in their earlier DELTA test.
3.3.2.3 The Stimulated Recall Procedure.
Step 1: Consent. The aim and the steps of the SRP were explained and agreed to
by each participant who then signed the consent form.
Step 2: Training. The participants were given a brief outline of the session and
instructed on how to verbalize their thought processes by using a pilot-tested protocol,
which described what stimulated recall means, the preferred language(s) (choice of
English, Cantonese or Mandarin Chinese), and the level of detail and reflection required
in the recall process:
1. You will listen to the recording and select the most appropriate answer to the
test items on the computer. This will be video-taped as stimulus for subsequent
recall process. You are free to jot down notes if you want.
2. You will listen to the recording section by section with pauses and explain how
you listened to the recording and answered the questions. Please try to recall and
talk as much as you can. I will not interrupt you, but if you do not talk for a long
period of time or if you do not answer certain questions in the test-taking, I may
ask you to give some explanation.
3. I will conduct a follow-up interview about your perceptions of the difficulty of
the test and your general listening experience.
The whole process will take about 1.5 hours. Your voice and our conversation
will be audio-recorded and used for research only.

60
During the introduction, the participants were free to ask clarification questions.
Then they were asked to do a warm-up tasks (that is, some practice tasks before the actual
listening tasks) to gain some practice. They were shown a videotape of others completing
a listening comprehension task and they provided their own answers to the questions and
explain how they worked out the answers. Despite the argument that training and the
memory of the training material might interfere with the recall data (Gass & Mackey,
2000), the training turned out to be necessary in that some low proficiency participants,
perhaps due to their limited ability in understanding the listening input, did not fully
follow the instructions to pause the video and to talk aloud at certain points; they did not
introspect readily and waited for the video to finish. When this happened and the
verbalization was too brief or irrelevant, the investigator pointed that out and suggested
strategies for improvement.
Step 3: The listening test. The audio was played and the participants listened to
the recording and answered the questions on screen. The test-taking process was video-
taped by using CamStudio software, which could record both the movement of the mouse
on the computer screen and the audio played in the computer. The point is that the
recorded physical movements of the mouse during the listening task are considered good
indicators of metacognitive activity (Russel, 2011).
The video-recording process was conducted in a slightly different manner from
that originally proposed. It was proposed to video-record the subjects’ facial expressions,
however, due to the capacity of the available video-recording programmes (CamStudio
and Cute Screen Recorder), the programme would crash when it was used to record a
huge video file. If the movement of the mouse, the test audio, and the respondents’ face
had to be recorded, the subsequent video file would become too big (over 1GB for each
subject) for the programme to process and consequently the programme would crash.
However, in the piloting stage the respondents were rarely found to show any apparent
facial expressions as they listened. And only one respondent jotted down notes; others
stated in the follow-up interview that they would not take notes when they were doing
listening test on a computer. Therefore, in the main SRP data collection phase,
respondents’ facial expressions were not subject to video recording.
Step 4: Recall. Each respondent and the investigator watched the video together.
The respondent paused the video section-by-section, and verbalized what was heard, what

61
he or she was thinking, and how the answers to each question were worked out. The
investigator paused the video when she had queries for the subject. When each text was
finished the participant was asked to rate the difficulty level of each item.
Step 5: Follow-up interview. The investigator asked some follow-up questions
regarding subjects’ perception of the difficulty level of the texts, the factors that might
have affected the difficulty and their general listening experience. The questions included:
What do you think of the difficulty level of these texts?
What factors do you think might have affected the difficulty of the texts?
Can you tell the text type of each of these texts? How do you usually find the
difficulty level of each text type?
Do you have particular strategies when you listen to these text types?
3.3.2.4. Transcription and coding. All the 62 stimulated recall protocol (SRP)
audio files were transcribed verbatim with Microsoft Word software. English translations
were provided where the verbalization was made in Cantonese or Mandarin. All the SRP
transcripts were then coded with NVivo Version 11.0. By referring to the codings used in
previous studies and the cognitive processings and factors reviewed in Chapter 2, a set of
possible nodes describing the cognitive processes involved in listening comprehension
was used as NVivo nodes. For example, Cai & Lee (2010) used three coding strategies
for processing unfamiliar words, which are inferencing strategy, ignoring strategy and no
attention. Chang (2008) identified 23 strategies used before and while taking a listening
test, such as predicting possible test questions and thinking about the purpose of a test
beforehand, and guessing by context clues, and linking hearing with previous experience,
and so on. Descriptions and examples of the coding are presented in Appendix A.
Thirteen SRP transcripts were initially coded for instances where listeners
reported on the cognitive processes involved in answering the questions. Virtually all the
participants reported use of test-taking strategies, difficulties of understanding the
recording and failure to answer the questions. These are also categorised into parent nodes,
and were then applied to all the 62 SRP transcripts. As the coding proceeded, new nodes
were derived to code new themes emerging from the SRP interviews.

62
3.3.2.5. Double-coding and inter-rater reliability. Twenty-four SPR transcripts
involving 21 texts were used for double-coding, including 7 conversations (L024 was
excluded for coding because it only measured one subskill, i.e., SSK1), 8 Interviews (all
chosen), and 6 Lectures (all chosen). The texts were chosen based on three criteria: a) the
text measures multiple subskills, b) the texts are of varying difficulties as pre-judged by
experts, and c) the texts were answered by at least one low-ability and one high-ability
students. By so doing, it can be ensured that texts of varying difficulty levels and covering
all the listening subskills of interest could be represented during the double-coding
process. The primary coder was the author and the second coder had an MA in Applied
Linguistics and worked on the DELTA team as a research associate for over three years.
The remaining 12 texts were then coded by the author. The two coders used the set of
nodes describing cognitive processes as aforementioned to code SRP transcripts
independently and met regularly to discuss and resolve any differences between codings
(Graham et al., 2011; Vandergrift, 2003).
The codings were merged together by importing all nodes and node relations. A
coding comparison query was run on NVivo and the inter-rater reliability Kappa co-
efficient for each node was calculated by NVivo. Following the formula provided by
NVivo (NVivo Version 11), the overall Kappa co-efficient was obtained across all nodes
and all sources. The statistics of percentage agreement and disagreement and Kappa
coefficients of each node between the coders are shown in Appendix B.
Overall, the data shows a Kappa coefficient of 0.49 when the number of characters
in the sources is unweighted while a Kappa coefficient decreases to 0.47 when the source
size is weighted. Both results could be seen as fairly good agreement (NVivo Version 11)
between to two coders. The low Kappa coefficient for individual nodes might be because
“most of the sources have not been coded at the node by either coder, but each coder has
coded completely different small sections of the source at the node, then the percentage
agreement between the coders are high. But since this situation would be highly likely to
occur by chance (i.e., if the two coders had each coded a small section at random), the
Kappa co-efficient is low. Conversely, if most of a source has not been coded at the node
by either user, but each user has coded almost the same sections of the source at the node,
then the percentage agreement between the users will again be high. But this situation
would be highly unlikely to occur by chance, so the Kappa coefficient is also high”
(NVivo Version 11).

63
3.4 Ethical clearance
The approved ethics package is attached in Appendix C. The ethical clearance
procedure of the study was implemented in accordance with the Low and/or Negligible
Risk Human Research Ethics Application and Submission Guidelines of James Cook
University. As the study investigated the DELTA listening component, application for
data access was first sought from the DELTA team. Approval of DELTA data access was
granted by the DELTA prior to data collection of the study.
The ethics documents were completed and endorsed by the researcher and the
advisors. It was then submitted for full review on 8 May 2013, including:
(1) JCU Low/Negligible Risk Checklist Form
(2) JCU Human Research Ethics Application Form
(3) JCU Information Sheet
(4) JCU Informed Consent Form
Based on the questions raised by the JCU Human Research Ethics Committee,
amendments were made to the Information and the Informed Consent Form to make the
data collection procedures clearer on 4 June 2013. Further clarification was made to the
Information Sheet regarding the videos. (The videos and the audios will be retained on
computer/DVD/CD for at least 5 years for potential research and publications.) Finally
complete approval was granted by The JCU Human Research Ethics Committee on 27
June 2013 (Approval Number H5134).
3.5 Summary
This chapter outlines the procedure and the considerations for collecting both the
quantitative test data and the qualitative SRP data. Ethical issues regarding the DELTA
team’s approval to access the data and the interviewees’ consent to conduct the SRP were
also presented and enclosed in the Appendices.

64
CHAPTER FOUR
LISTENING TEST DATA ANALYSIS
This chapter describes in detail the procedures for analyzing the primary
quantitative listening test data from the Rasch measurement perspective. Owing to the
complications and limitations of data composition, a complementary array of analyses
employing the dichotomous Rasch model, the Many-Facets Rasch model and one-way
ANOVA test was performed to calibrate the listening test items, and determine their
difficulty levels and their interaction with text type. Specifically, a triangulated approach
was adopted within the quantitative analyses to trial a number of alternative strategies to
tackle the problems encountered in the data analysis process.
4.1 Data Structure
Figure 4.1 depicts the overall structural relationship of text types, texts, subskills
and items. Totally six listening subskills are assessed in a total of 207 multiple-choice
items spreading in 33 texts across three text types. The breakdown of items and subskills
in each text type is displayed in Table 4.1.
Table 4.1: Subskill and item distribution across text type
Conversation Interview Lecture Total
SSK1 IDEN SPC INFO 33 50 21 104
SSK2 UND MAIN ID 1 27 5 33
SSK3 UND INFO INF 5 13 5 23
SSK4 INTRPRT WRD 6 12 2 20
SSK5 INTRPRT ATTD 4 8 2 14
SSK6 INFR SPK REAS 2 9 2 13
Total 51 119 37 207

65
Figure 4.1 Overall test item structure
As was explained in Chapter 2, text types other than the ones in question were
excluded from the data set because there were a limited number of texts and items for
these genres. A ramification of this, however, is a reduced quantity of texts and items
each test taker is left with. From the final data set, two persons were removed because
none of the items assigned to them was from the text type under investigation; five
extreme cases were found to have answered only three items of the same subskill from
the same text and text type, while another three persons answered the maximum
combination of 30 items from four texts covering all the subskills and text types.
DELTA Listening
Component
Conversation
Text 1
SSK1Item 1
Item 2
SSK2 Item 3
SSK3 Item 4
SSK4Item 5
Item 6
Text 2
...
Text 8
SSK1
SSK3
SSK5
SSK6
Interview
Text 9
SSK1 Item 31
SSK2
Item 32
Item 33
Item 34
SSK3 Item 35
SSK4Item 36
Item 37
Text 10
...
Text 27
SSK1
SSK3
SSK5
SSK6
Lecture
Text 28
SSK1
SSK2
SSK3
SSK4Text 29
...
Text 33
SSK1
Item 200
Item 201
Item 202
Item 203
SSK3 Item 204
SSK5Item 205
item 206
SSK6 Item 207

66
4.2 Winsteps Analysis
The present study adopts the dichotomous Rasch model and analyses the
multiple-choice questions with Winsteps software package version 3.80.1 (Linacre,
2013b). The computer-based DELTA test was designed for direct data export from the
DELTA system for analysis. A two-step analysis was conducted for item calibration,
including a free analysis involving all items and persons, and an array of analyses which
excluded low performing and misfitting persons. The detailed description of the process
is reported below.
4.2.1 Item calibration
4.2.1.1 Separation / Reliability. After data collation a total number of 207 items
and 2830 persons were available for the calibration. It was found that two sets of
responses did not pertain to the texts under research, and thus were disregarded as valid
data for the analysis. Table 4.2 presents a summary of the overall person and item
statistics after free analysis. The means of item difficulty and person ability show that, on
average, the test is slightly easy for
Table 4.2: Overall person and item statistics
Total Score Count
Measure S. E.
Infit Outfit
MnSq ZStd MnSq ZStd Mean 9.20 15.50 0.56 0.65 0.99 0.00 0.98 0.10 P.SD 3.60 4.40 0.91 0.15 0.28 1.00 0.57 0.90 S.SD 3.60 4.40 0.91 0.15 0.28 1.00 0.57 0.90 Max. 21.00 30.00 3.98 1.53 2.41 3.30 9.90 3.80 Min. 1.00 3.00 -2.90 0.43 0.23 -2.60 0.07 -2.00 Real RMSE .71 True SD .57 Separation .81 Person reliability .40 Model RMSE .67 True SD .61 Separation .91 Person reliability .46 S.E. of person mean = .02 Maximum extreme score: 19 person .7% Minimum extreme score: 1 person .0% Lacking persons: 2 person
this group of students. The item reliability is 0.98 and the item separation is 6.41
respectively. According to Bond and Fox (2007), “item reliability and item separation
refer to the ability of the test to define a distinction hierarchy of items along the measured

67
variable” (p. 60). The high item reliability and separation values support the contention
that the DELTA listening test can formulate a hierarchical set of items to measure the
listening skills of EFL students in university contexts. The person reliability of 0.41
(separation 0.84) is substantially less than the item reliability.
4.2.1.2 Fit of data to the Rasch model. Both the infit and outfit mean square fit
statistics of persons (0.99; 0.98) and items (0.99; 0.99) are close to the Rasch-modelled
expectation of 1.0. There are two forms of fit statistics (i.e., infit and outfit) and both
should be used to report the accordance of the data with the model. The infit statistic gives
more weight to the performance of targeted persons or items and is an information-
weighted indicator of misfit. The outfit statistic is not weighted and remains more
sensitive to unexpected performances of outlying items and persons. Therefore, Rasch
studies tend to report infit more often than outfit.
Both infit and outfit statistics are represented in two forms: unstandardized mean
squares and standardized t ͚ or Z. Mean square is a chi-square statistic divided by its
degrees of freedom, and is the mean of the squared residuals. Residuals represent the
differences between the Rasch model’s theoretical expectation and the actual
performance of the items and persons in the data matrix. The expected value of mean
squares (i.e., when the data fit the model) is 1.0. Values smaller than 1.0 indicate the
responses as too predictable, and are referred to as overfitting the model; whereas mean
square values greater than 1.0 indicate unmodelled item or person performances and are
referred to as underfitting the model. Underfitting performances are regarded as “erratic”,
overfitting as “too good to be true”. A general guideline for acceptable item mean square
statistics for low-stakes multiple-choice test, is the range 0.7 < MnSq < 1.3 (Bond & Fox,
2007). The standardized form of fit, z-score, is a t-statistic with infinite degrees of
freedom, and is the result of a Wilson-Hiferty transformation of mean squared residuals
to a distribution with mean of 0 and an SD of 1. The acceptable Z values are between -2
to +2 (-2 < Z < +2, p < .05). While mean squares indicate the amount of the misfit z-
scores indicate the likelihood of the misfit. This analysis uses mean square values rather
than the standardized Z because they are claimed to be more appropriate to large datasets
(Smith et al, 1995, cited by Bonk & Ockey, 2003). Moreover, Linacre (2013a) suggests
that “if mean squares are acceptable, then ZStd can be ignored” (p. 96). Both infit and
outfit statistics are reported in these results but the infit values will be given more
credence for detecting misfitting items and persons.

68
Table 4.3 shows the range of item and person statistics after the free analysis. The
item infit mean squares are quite acceptable, although some of the outfits transcend the
range of 0.7 to 1.3. However, both the infit and outfit mean squares of persons have cases
beyond the acceptable range, with 362 persons found to be underfitting (infit mean
squares > 1.3).
In an attempt to optimize the infit range, three further analyses were implemented;
the item and person statistics are summarized in Table 4.4 and Table 4.5 respectively.
i. Removing low performing persons. Firstly, based on the assumption that the
low performing students might have provided less than useful data because of construct-
irrelevant behavior during the test, a conservative person deletion was conducted to put
aside those low performers. After taking out 10%, i.e., 280 low performing persons the
person infit mean squares increased to 0.23 – 2.55 whereas the item infit mean square
range decreased only marginally to 0.85 – 1.25 (see Table 4.4). Moreover, it appears low
ability person deletion did not improve the fit of the data as there were still 329
underfitting persons. It might be concluded that the person misfit might not have been
induced by the low performers.
ii. Removing a part of the observations (CUTLO = -1). Secondly, given the
likelihood that persons might guess answers during the test, especially those low ability
students who were faced with more challenging items relative to their proficiency, a
CUTLO analysis (CUTLO = -1, Linacre, 2010) was carried out to eliminate observations
of persons who encountered items over one logit too difficult for them. Consequently,
2827 persons (one person’s responses were all disregarded by CUTLO) and all 207 items
were retained in the reduced data set. The low cut-off did not improve the fit of persons
(see Table 4.5) and 322 persons still underfit, which tends to imply that the low-ability
persons were not the source of the misfit issue, thus corroborating the assumption made
in the previous step i.
iii. Deleting underfitting persons (infit mean square >1.3). An alternative
approach was then adopted to remove the 362 underfitting persons whose infit mean
squares were over 1.3 – approximately 12.8 % of the entire sample. The statistics for that
analysis reported in Table 4.6 show that another 33 persons had infit mean squares slightly
greater than 1.3 whereas both item infit and outfit mean squares were now within the
desirable fit range.

69
Table 4.3: Free analysis statistics
Mean Separation Reliability Measure In.MnSq In.ZStd Out.MnSq Out.ZStd Item 0.00 6.41 0.98 -3.58 – 4.03 0.83 – 1.28 -2.86 – 4.17 0.58 – 1.99 -2.14 – 4.17 Person 0.58 0.84 0.41 -2.50 – 5.00 0.23 – 2.40 -2.63 – 3.27 0.07 – 9.9 -2.01 – 3.80
Table 4.4: Item and person statistics after omitting 280 low performing persons
Mea
n Separatio
n Reliabilit
y Measure In.MnSq In.ZStd
Out.MnSq
Out.ZStd
Item 0.00 5.96 0.97 -3.98 – 4.15 0.85 – 1.25
-3.10 – 3.7 0.63 – 2.00
-3.44 – 3.87
Person
0.77 0.52 0.21 -0.59 – 5.23 0.23 – 2.55
-2.60 – 3.46
0.07 – 7.8 -2.00 –
3.80 Table 4.5: Item and person statistics after CUTLO analysis
Mean Separation Reliability Measure In.MnSq In.ZStd Out.MnSq Out.ZStd
Item 0.50 1.92 0.79 -3.76 –
6.78 0.77 – 1.23
-2.02 – 3.17
0.53 – 1.38
-1.63 – 3.32
Person 0.08 0.29 0.08 -4.41 – 6.69
0.12 – 2.31
-2.46 – 3.70
0.06 – 6.42
-2.14 – 3.65

70
Table 4.6: Item and person statistics after omitting 362 underfitting persons
Mean
Separation
Reliability
Measure In.MnSq In.ZStd Out.MnSq
Out.ZStd
Item -0.03 5.92 0.97 -4.64 – 4.18
0.01 – 1.16
-4.07 – 3.42
0.01 – 1.25
-3.59 – 3.58
Person 0.65 0.94 0.47 -3.11 – 5.16
0.23 – 1.52
-2.64 – 1.72
0.07 – 8.30
-2.00 – 3.20
Table 4.7: Item and person statistics after deleting 362+33 underfitting persons
Mean
Separation
Reliability
Measure In.MnSq In.ZStd Out.MnSq
Out.ZStd
Item -0.03 5.92 0.97 -6.03 – 5.53
0.81 – 1.20
-2.66 – 3.95
0.45 – 2.85
-2.29 – 4.24
Person
0.66 0.94 0.47 -3.51 – 6.49
0.11 – 1.77
-2.54 – 1.80
0.03 – 9.90
-1.91 – 4.62

71
These 33 persons were then removed, but this returned another 267 persons
underfitting. Even worse, the outfit values for both items and persons were inflated too
(see Table 4.7). Consequently, the item and person estimates after omitting only the
earlier 362 underfitting persons were retained for the subsequent ANOVA analysis.
4.3 ANOVA Test
One-way ANOVA test was conducted to examine the effect of text type on the
relative difficulties of different listening subskills. Two sets of ANOVA analyses were
carried out using two sets of item measure results from the Winsteps analysis. 1) The 207
items were seen to make up one test. The item measures generated from the calibration
analysis with the observations of the 2466 fitting persons were used directly in the
ANOVA test. 2) Items of one particular subskill were seen to comprise a subskill subtest.
To ensure the comparability of the items in the six subskill subtests, the person measures
generated from the previous calibration analysis with the 2466 reduced data were firstly
anchored, and then applied to the six subskill subtests to generate difficulty measures of
each item, which were later used in the ANOVA test. For the sake of easier reporting, the
former analysis was called Winsteps calibration analysis while the latter reported as
Winsteps subskill subtest analysis. In both analyses the items belonging to the same
subskill were labelled as one group and regarded as responses to text type. The text type
was set as the independent variable whereas the subskill was seen as dependent variable.
By doing so, the relative difficulty of subskills to text types was calculated and their
respective significance level was obtained accordingly.
As there is only one item of SSK2 (Understanding main idea and supporting ideas)
in the Conversation, it is not possible to include this particular subskill in the ANOVA
analysis. The results of the ANOVA tests are reported in the results, Chapter Five.
4.4 Facets Analysis
The Many-Facet Rasch Measurement (MFRM) model, also known as the facets
model, allows for “a simultaneous analysis of multiple variables” (Eckes, 2011, p.12) that
might play a role in the test results. In addition to the simpler item-person Rasch model,
the MFRM can incorporate other test facets such as rater, test round, etc. in the analysis,
and can be applied to both dichotomous and polytomous data. The data for this Facets
analysis consist of the original responses given by 2828 examinees to 207 multiple-choice

72
questions measuring six listening subskills across three text types. It is likely that at least
some of these variables might affect the probability of any given response, making Many-
Facet Rasch model analyses appropriate.
Due to unforeseen limitations in structure of the ensuing data set, the MFRM
analyses also underwent several iterations of reducing and simulating data, as reported in
the following sections. The selection of the particular test items for the administration of
the DELTA testing was based on the quota of items each examinee was given and the
text difficulty which was pre-judged by experts during the item moderation process.
There was no further requirement, e.g., on subskill type or passage genre for examinees.
This led to the consequence that the targeted data structure was not controlled a priori to
meet the requirements of minimal data linkages necessary for using the MFRM.
Moreover, because the present study focuses on only three text types, the items used in
text types other than conversations, interviews and lectures were omitted. As a result, the
final data set varied in terms of the sufficiency of the linkages between facets. The
minimal case was that one examinee answered three items from one conversation that
focus on one subskill of identifying specific information; in contrast, a maximum scenario
for one examinee might include 30 items from four texts of three different text types that
tap into all the six common subskills. Consequently, an iterative series of analyses was
conducted and each step is reported, in turn, below.
The data were analysed with the computer programme Facets (Version 3.71,
Linacre, 2013b), which used the responses that each examinee gave to a set of test items
to estimate individual examinee proficiencies, item difficulties, subskills difficulties as
well as text type difficulties where appropriate.
4.4.1 Pilot analysis
4.4.1.1 Preliminary analysis. The first MFRM analysis involved five facets that
were presumed to underlie the dataset: examinee, text, text type, subskill, and item. As
text is not a focus of the research it was assigned as a dummy facet (Linacre, 2013c). This
analysis generated 107 disjoint (i.e., unconnected) subsets of response data. As suggested
by Linacre (1997), all elements of all facets should be linked sufficiently in one way or
another so that they can be estimated within one single frame of reference. Lack of
connectedness between facets leads to ambiguous, or even misleading, interpretation of
results. If the disjoint subset problem is identified during the data collection process, the

73
elements identified as disconnected could be targeted to be included in the subsequent
data collection. However, the data collection for this project was completed as assigned
by the DELTA testing system well before the data analysis stage. While the system used
pre-judged text difficulty and number of items as the only parameters for item selection,
in retrospect, the DELTA testing process was quite unlikely to achieve a completely
connected data set for the listening skills sub-test. Therefore, after considerable ongoing
reading, reflection, consultation and experimentation, an alternative analytical strategy
was adopted to address the disconnectedness issue.
Alternatively, the six common subskills across three text types were regarded as
18 generic subskills-by-text type. Analysis was conducted with the entire data set
whereby the text facet was treated as dummy. However, the 18 disconnected subsets
problem recurred.
4.4.1.2 Data reduction. It was suspected that the limited linking between the texts
might have caused the disconnectedness in data, so the text facet was removed and the
remaining 4-facet analysis yielded 18 disjoint subsets (down from 107). In addition, the
dataset contained students who answered texts which came from a single particular text
type, so this batch of data was removed and the remaining 2514 student data set was used
for a 4-facet analysis, which also generated 18 disjoint subsets. A further batch of students
was set aside and only the 680 examinees who answered all the 6 subskills covering all
the three text types were retained for a 4-facet analysis. It returned the same problem of
18 disconnected subsets.
4.4.2 Group-anchoring. As the number of 18 disjoint subsets coincided with the
number of subskills multiplied by text types (i.e., 6x3), group-anchoring certain facets
might help to solve the disconnectedness problem. According to Linacre (2013c), when
a facet is group-anchored, “each element [of the facet] is measured independently, but the
sum of the measure of the group of elements is constrained to equal the sum of their
values”. For a facet group-anchored at 0, the mean of the elements of that facet is fixed
at 0 while the measures of the elements are comparable relative to that zero anchored
origin. Based on this principle, the following group-anchored analyses were conducted.
Adopting a 5-facet model, the data comprising responses from 2828 examinees
were included in the analysis in which the text facet was made a dummy with both the
subskill and the item facets group-anchored at 0. The 18 subskills-by-text types were

74
categorised into 3 groups by text type, and the mean of each group was fixed at 0.
Similarly, the 207 items were categorized into 18 groups by subskill-by-text type and
each item group anchored at the mean of 0. This method allowed for analyses without
disconnected subsets. A further analysis was then implemented to assess the interaction
between text type and subskill. The results are shown in Tables 5.9 and 5.10 in Chapter
Five.
Following on from this modest, yet encouraging success, another series of
analyses was attempted by grouping and/or anchoring the items and subskills respectively
by various categories. The items and subskills were grouped concurrently without
anchoring, yielding 107 disjoint subsets; the items only were group-anchored and three
disjoint subsets were generated; the subskills only were group-anchored and 18 disjoint
subsets were found; group-anchoring the examinees by their institutional affiliation also
led to 18 disconnected subsets.
To summarise, group-anchoring the 18 subskills-by-text types into three groups
by text type and the items into 18 categories by subskill-by-text type eliminated the
disconnectedness in the dataset and can help to answer the research question of the
hierarchical order of the subskills within text types; however, it remains impossible to
make direct comparisons of the difficulty of subskills across text types.
4.4.3 Including DELTA score.
4.4.3.1 DELTA as an additional facet. Based on the argument that the data are
disconnected because there is not a single common framework of reference, the DELTA
scores of all persons were then added to the dataset in an attempt to provide a single
referential framework since the DELTA scores are extracted from the previous Winsteps
analysis on the basis of items and persons. As a result, five facets were included in this
round of analysis, which were examinee, DELTA score, text type, subskill and item. The
text facet was deleted as it was not the research focus and had caused amplification of,
and complication in disconnectedness.
In this analysis, DELTA score facet was fixed at 1 in view of the presumption that
there were a range of DELTA scores, and if they were used as elements of a facet, it
would dramatically increase the number of disjoint subsets, therefore, all the DELTA

75
scores should be treated as 1 element. It turned out the 18 disjoint subset problem
persisted.
4.4.3.2 DELTA as an additional element of the item facet. Alternatively, given
that the disconnectivity was found with the item facet in the free analysis, it was thought
that an alternative strategy could be adopted to link the items and place them in one
framework of reference. Hence, an additional item needs to be added so that all examinees,
text types, subskills, and items would be connected. A decision was made as to which
DELTA score should be employed as item element 208 in addition to the existing 207
items, namely, a) the overall DELTA score (representing overall English proficiency)
produced from the four DELTA components (listening, reading, grammar and
vocabulary), or b) the listening score based on the pertinent listening texts only.
Conceptually, it seems reasonable to use a) because it is somewhat different from the 207
items.
In addition, as the Facet software does not accept data containing decimals, the
re-scaled overall DELTA scores were used and treated as rating scale responses in the
analysis. Therefore, two models were adopted in this analysis: 1) responses to items 1-
207 as dichotomous data, and b) DELTA scores to item 208 as rating scale data.
Consequently, the lack of connectivity in items disappeared, however, the text type and
subskill measures were all estimated at 0 logit (approx. 110 DELTA points).
4.4.4 Trial with a reduced sub-set of data with minimum connection between
facets. After speculation that limited linkage in data collection design (i.e., the
institutional testing procedures) had caused the disconnected subsets issue, a new round
of analyses was carried out by starting with a smaller sub-set of the data. Firstly, a number
of texts were selected to cover all the six subskills across three text types. As there was
only one item case of understanding main idea and supporting ideas in conversation, a
minimum of seven texts would suffice, including 3 conversations, 2 interviews, and 2
lectures. Forty-three items were involved and 1408 examinees were found to have
responded to these items. A 4-facet model (examinee, text type, subskill, item) was
adopted and the analysis generated 18 disjoint subsets. Items of the same subskill-by-text
type were found to constitute one subset, which was similar to the results in the pilot
analysis.

76
Secondly, based on the results above, another two analyses were performed: a)
The 18 subset grouping, which was suggested by Facets output and identical with
subskill-by-text type categorizing, was used; b) items were randomly categorized into 18
groups and analysed. Both methods seemed to have overcome the disjoint subset obstacle.
Table 4.8: Subskills Measurement Report – Items Grouped by 18 subskill*texttype
Subskills Measur
e S. E.
Infit Outfit Corr. PtBis MnSq ZStd MnSq ZStd
INFR REAS 0.63 0.06 0.99 -0.50 0.98 -0.60 0.10 INTPRT ATT 0.56 0.06 1.02 0.60 0.98 -0.40 0.13 INTPRT WRD -0.04 0.06 0.95 -2.00 0.95 -1.20 0.23 UND MAIN -0.11 0.05 1.04 1.70 1.04 1.10 0.15 IDN INF -0.37 0.04 1.00 -0.10 0.97 -0.80 0.18 UND INFR -0.67 0.08 1.17 4.20 1.16 2.20 0.25 Mean (Count: 6) 0.00 0.06 1.03 0.70 1.01 0.00 0.17 S. D. (Population) 0.47 0.01 0.07 2.00 0.07 1.20 0.05 S. D. (Sample) 0.51 0.01 0.08 2.20 0.08 1.30 0.06 Model, Populn: RMSE .06 Adj (True) S.D. 0.46 Separation 7.91 Strata 23.72 Reliability 0.98 Model, Sample: RMSE .06 Adj (True) S.D. 0.51 Separation 8.67 Strata 25.96 Reliability 0.99 Model, Fixed (all same) chi-square: 373.1 d.f.: 5 significance (probability): .00 Model, Random (normal) chi-square: 4.9 d.f.: 4 significance (probability): .29
However, the results from the two analyses were minimally different in terms of
subskill difficulty, as shown in Table 4.8 and Table 4.9. The respective measures of items
and examinees varied across the two analyses. It appears that the harder subskills were
inflated whereas the easier ones were deflated, and the discrepancies between each pair
of subskills in the two sets of results were close to 0.5 logit; similarly, the S.D., separation,
and strata indices were consequently magnified.
Despite the different difficulty measures for the same subskill in the two analyses,
the resultant subskill order remained mostly identical. The differences between adjacent
subskill were marginal, except that three pairs exhibited differences larger than their
combined standard errors – SSK5 (Interpreting an attitude or intention of the speaker)
and SSK4 (Interpreting a word or phrase as used by the speaker), SSK2 (Understanding

77
the main idea and supporting ideas) and SSK1 (Identifying specific information), and
SSK1 (Identifying specific information) and SSK3 (Understanding formation and making
an inference) – implying that the former subskills were most likely to be more difficult
than the latter ones.
Table 4.9: Subskills Measurement Report – Items Grouped RANDOMLY into 18
Subskills Measur
e S. E.
Infit Outfit Corr. PtBis MnSq ZStd MnSq ZStd
INPRT ATT 1.11 0.05 0.99 -0.20 0.97 -1.00 0.13 INFR REAS 1.06 0.06 1.04 1.50 1.04 1.00 0.10 INTPRT WRD 0.38 0.06 1.09 3.50 1.20 3.10 0.23 UND MAIN 0.28 0.05 1.04 1.80 1.03 0.90 0.15 IDN INF -1.03 0.04 1.01 0.30 0.98 -0.50 0.18 UND INFR -1.80 0.09 0.92 -1.50 0.85 -1.60 0.25 Mean (Count: 6) 0.00 0.06 1.01 0.90 1.01 0.30 0.17 S. D. (Population) 1.07 0.01 0.05 1.60 0.10 1.60 0.05 S. D. (Sample) 1.17 0.02 0.06 1.80 0.11 1.80 0.06 Model, Populn: RMSE .06 Adj (True) S.D. 1.07 Separation 17.54 Strata 23.72 Reliability 1.00 Model, Sample: RMSE .06 Adj (True) S.D. 1.17 Separation 19.22 Strata 25.96 Reliability 1.00 Model, Fixed (all same) chi-square: 1840.5 d.f.: 5 significance (probability): .00 Model, Random (normal) chi-square: 5.0 d.f.: 4 significance (probability): .29
Given that these two analyses involved only 1408 examinees’ responses to 43
items that contained all the six subskill across the three text types, the resultant subskill
order might not apply to the entire data set. However, the purpose of the analyses was to
find out if different group-anchoring strategies might result in variations in subskill
measures and order. It was then confirmed that this would not alter the order despite
roughly 0.5 logit differences in the difficulties of each subskill in the two sets of results.
4.4.5 Group-anchoring items by subskill-by-text type. The above analyses
reveal that group-anchoring items helped to eradicate the disconnectedness in the main
analysis and paved the way for a subsequent interaction analysis. The method was then
applied to the entire data set. Two different models were utilized depending on the
treatment of text type: as facet v. as dummy.

78
4.4.5.1 Analysis with text type as a facet. The first Many-Facets Rasch
Measurement model specified that data = examinee + subskill + text type + items, where
items were grouped into 18 subskill-by-text type categories and group-anchored at 0. It
yielded good connection in the data.
Fit statistics were diagnosed for the analysis above.
1) 350 examinees were found to have infit mean squares from 1.31 to 2.41 (i.e.,
underfitting), but only one item (#:96) only marginally exceeded the 1.3 criteria
(at 1.31) . Based on the reasoning that the persons exhibit underfit, those persons
were put aside.
2) 2748 examinees remained for analysis. Still another 256 examinees were
underfitting with infit mean squares ranging from 1.31 to 1.96; and, the number
of underfitting items increased from one to five (#: 184, 142, 77, 96, 192, , whose
infit mean squares range from 1.37 to 1.97).
3) Since the omission of underfitting examinees in Step 2) exacerbated the misfit of
both examinees and items, an alternative strategy was trialled to take out the
underfitting item (#96) from the main analysis. As a result, another three items
became underfitting (#: 77, 142, 192; infit mean squares: 1.37 to 1.86), and the
number of underfitting examinees decreased from 350 to 263, with infit mean
squares ranging from 1.31 to 1.99.
Investigation of infit statistics suggests that the removal of underfitting examinees
inflated the infit mean squares of both items and persons; in turn, the deletion of the sole
underfitting items magnifed the infit mean squares of items but alleviated the occurrence
of underfitting examinees. As the analysis at this stage focused on the investigation of
items and the infit values from the free analysis seem most desirable with only one item
slightly underfitting at 1.31, the statistics of examinees, subskills and items (see Table
5.11 and 5.12) were drawn for comparison with those from the following analysis with
text type as dummy in Chapter Five.
4.4.5.2 Analysis with text type as dummy. It might be assumed that the text type
facet might not actually affect the difficulty level of the six common subskills and should
be regarded only as a demographic or labelling facet for investigating the interaction
between subskills and text type. Consequently, another model was implemented with the

79
same data set: data = examinee + subskill + text type (dummy) + item (18 subskill-by-
text type groups).
1) Four items (#: 192, 96, 142, 77, infit MS: 1.34 – 1.7) and 343 examinees were
found underfitting after the main analysis. Thus, 343 persons were firstly put
aside (pd343). This analysis generated one more underfitting item (#59) in
addition to the existing four, and another 259 unfitting examinees.
2) The five underfitting items were removed (id5). Another five items (#: 184,
116, 15, 169, 78, infit MS: 1.41 – 1.88) returned as underfitting and the
number of underfitting examinees increased to 288 (infit MS: 1.31 – 1.75).
3) Removing the 288 persons resulted in one more item (pd343+288, id5)
(#:202, infit MS: 1.34 – 1.93) apart from the five in Step 2), and 226 more
persons (infit MS: 1.31 – 1.65) underfitting.
4) The six items were then deleted (pd343+288, id5+1), causing five more items
(#: 206, 170, 136, 79, 171, infit MS: 1.35 – 2.55) and 234 more examinees
(infit MS: 1.31 – 2.49) underfitting.
5) It was found that while the pd343+288-id5+1 deletion in Step 4 considerably
inflated the infits of the remaining items and persons, the 288-examinee
deletion in Step 3) changed only one more item (#202) to underfit, then only
the five underfitting items from Step 2) were deleted and the 288 examinees
were retained for another analysis (pd343, id5+5). This returned with another
four items (#: 206, 170, 136, 79, infit MS: 1.37 – 2.35) and 267 persons (infit
MS: 1.31 – 1.95) underfitting.
6) The 267 persons were deleted (pd343+267, id5+5). This returned with the
same four underfitting items (#: 206, 170, 136, 79, infit MS: 1.4 – 2.34) and
another 208 underfitting persons (infit MS: 1.31 – 1.56).
7) The 267-person deletion returned with the same underfitting items, thus, the
267 persons were retained while the four items (#: 206, 170, 136, 79) were
deleted for another analysis (pd343, id5+5+4). This yielded two more
underfitting items (#: 171, 143, infit MS: 2.09, 1.85 ) and another 272
underfitting persons, most of whom were identical with the previous 267
examinees in the pd343-id5+5 analysis in Step 5).
8) Instead of taking out the latest 267 underfitting persons, the two new
underfitting items were further removed (pd343, id5+5+4+2) to check if this

80
could resolve the misfit problem. However, another 2 items (#: 76, 91, infit
MS: 1.90, 1.46) and 260 examinees became underfitting (infit MS: 1.31 –
2.19).
9) The 260 examinees were deleted (pd343+260) together with the 16
underfitting items (id5+5+4+2), and this returned with the same two items
underfitting (#: 76, 91, infit MS: 2.07, 1.33) and another 202 underfitting
examinees (infit MS: 1.31 – 1.63).
10) Items 76 and 91 were removed whereas the 260 examinees were retained for
another analysis (pd343, id5+5+4+2+2). This came with only one more item
(#: 6, infit MS: 1.93) (Note: Item #6 was the most overfitting (0.75) in all the
analyses hitherto, however, it became underfitting now, which tends to imply
that it was not independent of the two deleted items #76, 91) and 258
examinees underfitting (infit MS: 1.31 – 3.10).
11) Removing item #6 returned (pd343, id5+5+4+2+2+1) another four items (#
26, 30, 37, 43 infit MS: 1.37 – 1.79) and 277 examinees (infit MS: 1.31 –
3.11) underfitting.
12) Alternative to Step 11, the 258 underfitting examiness from Step 10 were
removed to see if that could address the one underfitting item, i.e., deleting
343+ 258 persons and 5+5+4+2+2 items. It turned out that items #6 and 26
(infit MS: 1.92, 1.34) and another 204 persons (infit MS: 1.31 -1.62) were
underfitting.
Informed by the inflation identified in the previous analyses and assumption that
the removal of the underfitting data might inflate the infit mean square of both items and
persons, it was then decided to adopt the dataset generated after Step 9 where 603 (i.e.,
343+260) persons and 16 (i.e., 5+5+4+2) items were removed as final, on the ground that
both items and examinees had the best infit values in this round of analysis – only item
#76 seemed problematic and 98 of the 202 (1/3) underfitting examinees had infits smaller
than 1.35. Consequently, 2225 persons and 191 items were retained for follow-up analysis.
The facets statistics are summarized in Table 5.13, Table 5.14 and Table 5.15 in Chapter
Five.
4.4.6 No-item-facet (Item-unfaceted) analysis. Another model was piloted with
items seen as responses to subskills and removed from the model, which is called no-
item-facet analysis. This analysis was conducted for two key reasons. First, similar to the

81
earlier concern about subskill groups, although group-anchoring items in the previous
analyses successfully alleviated the disconnectedness problem, it was contemplated that
group-anchoring items according to subskill-by-text type might also have prevented the
possibility of comparisons between different item groups. Second, it seemed all the issues
of disconnected subsets stemmed from the fact that the 207 items are all unique, and the
sole commonality amongst them is that they could be classified into one subskill of one
particular text type, thus 18 subskill-by-text type groups. This classification however
implies that they are not connected in any way – none of the other facets could sufficiently
connect them in any way. For example, none of the examinees answered all the 18 groups
of items, therefore, the 18 groups could not be connected by any means.
4.4.6.1 Trial with simulated data. Firstly, a data set comprising 5 examinees, 3
text types, 6 subskills together with responses was simulated in which each subskill had
one response from one examinee. This dataset worked well without disconnectedness
problems. Secondly, the data were expanded to include more than 2 responses to each
subskill from each examinee, which resulted in good connection in the data. Thirdly, the
text type facet of 3 elements was added to the data, which generated 3 subsets whose
grouping was identical with text type. Lastly, the text type facet was regarded as a labeling
facet and made dummy, which – as a result – also removed the disconnected subsets.
4.4.6.2 Trial with real data. Seven texts were selected to cover all the six common
subskills of three text types. Examinees who answered minimally two text types were
used for analysis. The final data set included 303 examinees, 3 text types, 6 subskills and
43 items. There turned out to be 27 disjoint subsets.
The data file was re-constructed to omit the item facet, namely, the items were not
treated as a facet in the measurement but responses to subskills. Therefore, each subskill
might have multiples responses from one single examinee for one single text type. This
analysis reported 3 disjoint subsets corresponding with text type. The text type facet was
made dummy and the analysis worked well.
4.4.6.3 Trial with the entire dataset. The item facet was removed from the whole
dataset and the text type facet was made dummy. This returned output without disjoint
subsets. The infit mean square of ‘subskills’ was very close to 1.0. As there was no item
facet in such analyses, it was impossible to inspect the fit or measures of items, thus,
misfitting items could not be identified. The infit mean squares of examinees range from

82
0.56 to 1.48, indicating 25 examinees as underfitting. Removing the 25 examinees
returned with another four underfitting (infit mean square = 1.32), and the deletion of
these four led to only one person underfitting (infit mean square = 1.31). The data set
reduction ceased at this point.
The statistics of examinees and subskills of the free and calibration analyses are
reported in Table 5.16, Table 5.17 and Figure 5.5 in Chapter Five.
4.5 Interaction Analysis
As Facets calibrates all facets simultaneously on the same logit scale, creating a
single frame of reference for interpreting the results of the analysis. Once the parameters
of the model have been estimated, interaction effects between any pair of facets can be
detected by examining the standardized residuals (i.e., stardardised differences between
the observed and expected measures). An interaction analysis (or bias analysis) helps to
identify unusual interaction patterns among different facets (Linacre, 2013c).
To answer the RQ4 - whether the difficulty of subskills varies across different text
types - an interaction analysis was further conducted between subskill and text type on
Facets. Three sets of results are described in Chapter 5 in relation to the three analyses, 1)
item-group-anchored text dummy analysis, 2) item-group-anchored text faceted analysis,
and 3) item-unfaceted interaction analysis.
4.6 Summary
This chapter provided a detailed report of the various strategies that were
attempted in order to triangulate the quantitative data analysis procedure and address the
research questions. Through a data-driven procedure guided by dichotomous Rasch
model principles, the DELTA listening test items in the present study were calibrated step
by step using Winsteps software by scrutinsing the person and item fit statistics. The
resulting item measures were then used in ANOVA tests to pinpoint the difficulty levels
of the six DELTA listening subskills and their relationships with text types.
Because of the single case of SSK2 (understanding main idea and supporting ideas)
in Conversation, these relationships could not be determined through ANOVA tests alone.
The MFRM model was then adopted to investigate examinees, items, subskills and text
types in one framework of reference. The Facets analyses, however, were compromised

83
by disconnectedness in the four facets, and several rounds of trial and alternative analyses
were performed in an effort to resolve the problems. In the end, three sets of item measure
results were used to examine the interactions between subskill difficulties and text types.

84
CHAPTER FIVE
LISTENING TEST RESULTS
This chapter first reports the results of the free and calibration analyses generated
from Winsteps, followed by the results of the effect of text type on subskill difficulties
from one-way ANOVA analysis. Secondly, the results from the series of analyses with
Facets required by a disjoint subsets problem are also reported and compared. In the end,
a comparison is made between the results from these different analyses to make a
summary which enables the three research questions to be answered.
5.1 Winsteps Analysis Results: Global Model Fit
The Winsteps analysis aimed to calibrate items on a single measurement scale,
which generated two sets of results: 1) results of the entire data set (including 2828
persons and 207 items), and 2) results of the reduced data set in which 362 low
underfitting persons were removed for calibration (retaining 2466 persons and 207 items).
Tables 5.1 and 5.2, respectively, report the variance decomposition of the observations
for the entire and the reduced data set.
Table 5.1: Standardised residual variance in Eigenvalue units of the entire data
Eigenvalue
Observed
Expected Percentage
of total variance
Percentage of
unexplained variance
Total raw variance in observations 295.5018 100.00% 100.00% Raw variance explained by measures 88.5018 29.90% 30.00% Raw variance explained by persons 28.5624 9.70% 9.70% Raw Variance explained by items 59.9394 20.30% 20.30% Raw unexplained variance (total) 207 70.10% 100.00% 70.00% Unexplained variance in 1st contrast 1.6978 0.60% 0.80% Unexplained variance in 2nd contrast 1.6743 0.60% 0.80% Unexplained variance in 3rd contrast 1.6472 0.60% 0.80% Unexplained variance in 4th contrast 1.6298 0.60% 0.80% Unexplained variance in 5th contrast 1.6171 0.50% 0.80%

85
Linacre (2013a) suggested that the amount of explained variance depends on the
spread of items and persons. If the test instrument has a wide spread of items and results
in a wide spread of persons, then the measures should explain most of the variance. But
if the items are of almost equal difficulty and the persons are of similar ability, then the
measures will explain only a small amount of the variance. In the present case, both the
item and the person measures are central, and 29.9% of the variance is explained by item
and person measures (34.5% in the reduced data set).
Linacre (2013a) further pointed out that when the person and item S.Ds are around
1 logit, then only 25% of the variance in the data is explained by the Rasch measures; but
when the S.Ds are around 4 logits, then 75% of the variance is explained. Even with very
wide person and item distributions with S.Ds of 5 logits only 80% of the variance in the
data is explained. The item and person S.Ds of this data set are 1.27 and 0.61 respectively,
providing a possible explanation for the relatively low 29.9% explained variance.
Table 5.2: Standardised residual variance in Eigenvalue units of the reduced data
Eigenvalue
Observed
Expected Percentage of total
variance
Percentage of
unexplained variance
Total raw variance in observations 314.6103 100.00% 100.00% Raw variance explained by measures 108.6103 34.50% 34.50% Raw variance explained by persons 34.7985 11.10% 11.00% Raw Variance explained by items 73.8118 23.50% 23.40% Raw unexplained variance (total) 206 65.50% 100.00% 65.50% Unexplained variance in 1st contrast 1.7075 0.50% 0.80% Unexplained variance in 2nd contrast 1.6979 0.50% 0.80% Unexplained variance in 3rd contrast 1.6409 0.50% 0.80%
The establishment of Rasch modelled unidimensionality must also consider the
possible existence of competing dimensions; because item-person residuals should be
distributed at random, there should be no patterns in those residuals that are unexplained
by the model. According to Rasch model simulations, it is unlikely that the first contrast

86
in the “unexplained variance” (residual variance) will be larger than 2.0 eigenvalue units
(Linacre, 2013a) in unidimensional data. In the present study, the first contrast has an
eigenvalue of 1.70, and the variance explained by that first contrast is a mere 0.6%, far
smaller than the variance explained by item difficulties and person abilities in the Rasch
measure dimension. Therefore, it seems reasonable to assert that the DELTA listening
component satisfies those requirements for a unidimensional test.
Even though the Rasch dimension explains only 29.9% of the variance in the
entire data, the data are under statistical control. The variance explained is a little better
in the reduced data set (34.5%) and that analysis also provides no evidence of a secondary
dimension.
5.2 ANOVA Test Results: Subskill Difficulties
As reported in Chapter 4, the ANOVA test drew on the two sets of item measures
from the reduced data set, namely, 1) the Winsteps calibration analysis where the 207
items were regarded to form one test, and 2) Winsteps subskill subtest analysis where
items of each subskill were seen to constitute a subtest and the anchored person measures
from the calibration analysis were used to estimate item measures. The anchored person
measures ensured that items were comparable across the six subskill subtests. These two
sets of item measures were then used to calculate the overall subskill difficulty measures
and the relative subskill difficulties to different text types. The descriptive statistics of the
subskill difficulties will be reported first, followed by the test of homogeneity of variance.
Because of the unequal number of samples in each subskill type, the Scheffe method was
used for estimating statistical significance in the post-hoc test (see Table 5.8, p.92).
5.2.1 Subskill difficulties across text types from Winsteps calibration analysis.
Table 5.3 presents all the descriptive statistics from the ANOVA test with item measures
while Figure 5.1 specifically displays the measures together with the standard errors of
each subskill irrespective of text type. It is found out that SSK1 (Identifying specific
information, Mean = -0.42) is the easiest subskill, followed by SSK4 (Interpreting a word
or phrase as used by the speakers, Mean = 0.04), SSK2 (Understanding main idea and
supporting ideas, Mean = 0.18), SSK5 (Interpreting the attitude or intention of the
speaker, Mean = 0.44), SSK3 (Understanding information and making an inference,
Mean = 0.72), and SSK6 (Inferring the speaker’s reasoning, Mean = 1.26) as the most

87
Table 5.3: Descriptive statistics of subskills across text type with items measures from Winsteps calibration analysis
N Mean Std. Deviation Std. Error
95% Confidence Interval for Mean
Minimum Maximum Lower Bound Upper Bound SSK1 IDN INF Cona 33 -.59 1.11 .19 -.98 -.20 -2.99 1.68
Int 50 -.40 1.36 .19 -.79 -.02 -4.64 3.32 Lec 21 -.21 1.17 .26 -.74 .33 -2.01 2.05 Total 104 -.42 1.24 .12 -.66 -.18 -4.64 3.32
SSK2 UND MAIN Con 1 -.93 -.93 -.93 Int 27 .12 1.33 .26 -.41 .65 -2.03 4.18 Lec 5 .69 .94 .42 -.47 1.85 -.34 1.55 Total 33 .18 1.28 .22 -.28 .63 -2.03 4.18
SSK3 UND INFR Con 5 -.16 .58 .26 -.89 .56 -.95 .45 Int 13 1.36 1.32 .37 .56 2.16 -1.11 3.20 Lec 5 -.04 1.78 .80 -2.26 2.17 -2.41 2.38 Total 23 .72 1.46 .31 .09 1.36 -2.41 3.20
SSK4 INTPRT WRD Con 6 .15 1.20 .49 -1.11 1.41 -1.29 1.77 Int 12 -.04 1.42 .41 -.94 .86 -2.89 2.23 Lec 2 .15 1.18 .84 -10.46 10.75 -.69 .98 Total 20 .04 1.27 .28 -.56 .63 -2.89 2.23
SSK5 INTPRT ATT Con 4 .09 1.56 .78 -2.40 2.58 -1.11 2.39 Int 8 .45 .80 .28 -.22 1.11 -1.08 1.38 Lec 2 1.08 .00 .00 1.08 1.08 1.08 1.08 Total 14 .44 1.00 .27 -.14 1.02 -1.11 2.39
SSK6 INFR REAS Con 2 1.89 .06 .04 1.38 2.40 1.85 1.93 Int 9 1.17 .71 .24 .62 1.72 .22 2.38 Lec 2 1.03 .50 .36 -3.49 5.54 .67 1.38 Total 13 1.26 .67 .18 .85 1.66 .22 2.38
Note. Con is short for Conversation, Int for Interview, and Lec for Lecture.

88
Figure 5.1 Subskill measures from the Winsteps calibration analysis
difficult. This sequence of the common subskills, corroborates to some extent, the claim
that subskills requiring higher-order cognitive processing to understand implicit
information are more challenging than those lower-order subskills that involve merely
detecting explicit messages.
When the subskills are observed in the context of different text types, there is an
increasing trend in the mean difficulties of SSK1 (Identifying specific information, -0.59,
-0.40, -0.21), SSK2 (Understanding main idea and supporting ideas, -0.93, 0.12, 0.69)
and SSK5 (Interpreting the attitude or intention of the speaker, 0.09, 0.45, 1.08) from
conversations to interviews to lectures. This suggests the linguistically more complex text
types are likely to increase the difficulty level of the subskills. That order is reversed for
SSK6 (Inferring speaker’s reasoning, 1.89, 1.17, 1.03); SSK3 (Understanding
information and making an inference is easiest in conversations, -0.16) but most difficult
in interviews (1.36) while SSK4 (Interpreting a word or phrase as used by the speaker)
is easier in interviews (-0.04) but similarly more difficult in conversations and lectures
(0.15).
Table 5.4 presents the results of the variance homogeneity test. The significance
values for each subskill in the Levene test are all greater than the .05 level, which suggests
no significant difference in the variances for each subskill between different text types.
This satisfies the pre-requisite of homogeneity of variance and allows for comparison of
the means. All of the significance values for the F statistics in Table 5.5 are greater than
0.05, suggesting that there is no significant effect of text type on the mean difficulties of
-0.42
0.18
0.72
0.040.44
1.26
-1.5
-1
-0.5
0
0.5
1
1.5
2
IDN INFO UNDMAIN
UND INFR INTPRTWRD
INTPRTATT
INFR REAS

89
each subskill at the p < .05. Therefore, it might be inferred that there is no statistical
distinction in the difficulty levels of the subskills across different text types.
Table 5.4: Test of Homogeneity of Variances – item measures from Winsteps calibration analysis
Levene Statistic
df1 df2 Sig.
SSK1 IDEN INF .494 2 101 .611 SSK2 UND MAIN .264a 1 30 .611 SSK3 UND INFR 1.609 2 20 .225 SSK4 INTRPRT WRD .148 2 17 .864 SSK5 INTRPRT ATT 2.769 2 11 .106 SSK6 INFR REAS 3.892 2 10 .056 Note. Groups with only one case are ignored in computing the test of homogeneity of variance for SSK2 UND MAIN.
The following ANOVA results in Figure 5.2 and Table 5.6 drew on the general
subskill results from the Winsteps analysis in which person measures were anchored for
the estimation of item measures in the six subskill subtests. Similar to the earlier Winsteps
calibration analysis results, SSK1 (Identifying specific information, Mean = -0.57) ranked
lowest on the difficulty scale, followed by SSK4 (Interpreting a word or phrase as used
by the speaker, Mean = -0.03), SSK2 (Understanding main ideas and supporting ideas,
Mean = 0.19), SSK5 (Interpreting the attitude or intention of the speaker, Mean = 0.45),
SSK3 (Understanding information and making and inference, Mean =0.98), and finally
SSK6 (Interpreting the speaker’s reasoning, Mean = 1.44).
Figure 5.2 Subskill measures from the Winsteps subskill subtest analysis
-0.57
0.19
0.98
-0.03
0.45
1.44
-1.00
-.50
.00
.50
1.00
1.50
2.00
IDN INFO UND MAIN UND INFR INTPRTWRD
INTPRT ATT INFR REAS

90
Table 5.5: ANOVA results – item measures from Winsteps calibration analysis results
Sum of Squares df
Mean Square F Sig.
SSK1 IDN INF
Between Groups
(Combined) 1.883 2 .941 .607 .547 Linear Term
Unweighted 1.849 1 1.849 1.192 .277 Weighted 1.882 1 1.882 1.213 .273 Deviation .001 1 .001 .001 .980
Within Groups 156.643 101 1.551 Total 158.526 103
SSK2 UND MAIN
Between Groups
(Combined) 2.627 2 1.313 .791 .462
Linear Term
Unweighted 2.187 1 2.187 1.318 .260 Weighted 2.455 1 2.455 1.479 .233 Deviation .172 1 .172 .104 .750
Within Groups 49.779 30 1.659 Total 52.406 32
SSK3 UND INFR
Between Groups
(Combined) 12.130 2 6.065 3.459 .051
Linear Term
Unweighted .036 1 .036 .021 .887 Weighted .036 1 .036 .021 .887 Deviation 12.094 1 12.094 6.898 .016
Within Groups 35.066 20 1.753 Total 47.196 22
SSK4 INTPRT WRD
Between Groups
(Combined) .165 2 .083 .046 .955
Linear Term
Unweighted .000 1 .000 .000 .996 Weighted .029 1 .029 .016 .900 Deviation .136 1 .136 .075 .787
Within Groups 30.684 17 1.805 Total 30.849 19
SSK5 INTPRT ATT
Between Groups
(Combined) 1.303 2 .651 .608 .562
Linear Term
Unweighted 1.300 1 1.300 1.214 .294 Weighted 1.242 1 1.242 1.160 .305 Deviation .061 1 .061 .056 .816
Within Groups 11.780 11 1.071 Total 13.083 13
SSK6 INFR REAS
Between Groups
(Combined) .982 2 .491 1.134 .360 Linear Term
Unweighted .748 1 .748 1.727 .218 Weighted .748 1 .748 1.727 .218 Deviation .234 1 .234 .541 .479
Within Groups 4.332 10 .433 Total 5.314 12

91
Table 5.6: Descriptive statistics of subskills across text types from Winsteps subskill subtest analysis
N Mea
n
Std. Deviatio
n
Std. Erro
r
95% Confidence Interval for
Mean
Minimum
Maximum
Lower Boun
d
Upper Boun
d SSK1 IDN INFO
Con 33 -.74 1.37 .24 -1.22 -.25 -4.01 2.04 Int 50 -.59 1.72 .24 -1.08 -.10 -6.11 4.12 Lec 21 -.26 1.33 .29 -.87 .35 -2.17 2.27 Total
104
-.57 1.54 .15 -.87 -.27 -6.11 4.12
SSK2 UND MAIN
Con 1 -1.24 -1.24 -1.24 Int 27 .14 1.58 .30 -.49 .76 -2.26 5.01 Lec 5 .73 1.09 .49 -.62 2.08 -.49 1.79 Total
33 .19 1.52 .26 -.35 .72 -2.26 5.01
SSK3 UND INFR
Con 5 -.16 .70 .31 -1.03 .70 -1.11 .52 Int 13 1.82 1.86 .52 .70 2.95 -1.33 5.39 Lec 5 -.09 2.18 .98 -2.80 2.62 -3.01 2.86 Total 23 .98 1.95 .41 .13 1.82 -3.01 5.39
SSK4 INTPRT WRD
Con 6 .13 1.33 .54 -1.26 1.53 -1.45 2.04 Int 12 -.11 1.76 .51 -1.23 1.01 -3.55 2.76 Lec 2 -.06 1.51 1.07 -13.60 13.47 -1.13 1.00 Total 20 -.03 1.55 .35 -.76 .69 -3.55 2.76
SSK5 INTPRT ATT
Con 4 .01 1.75 .87 -2.76 2.79 -1.32 2.58 Int 8 .49 .99 .35 -.34 1.32 -1.43 1.78 Lec 2 1.17 .03 .02 .92 1.42 1.15 1.19 Total
14 .45 1.17 .31 -.23 1.13 -1.43 2.58
SSK6 INFR REAS
Con 2 2.14 .18 .13 .49 3.79 2.01 2.27 Int 9 1.36 .93 .31 .65 2.07 .07 2.84 Lec 2 1.07 .54 .38 -3.76 5.90 .69 1.45 Total
13 1.44 .84 .23 .93 1.94 .07 2.84

92
Table 5.7: Test of Homogeneity of Variances – items measures from Winsteps subskill subtests analysis
Subskill Levene Statistic df1 df2 Sig. SSK1 IDN INF .673 2 101 .512 SSK2 UND MAIN .304a 1 30 .585 SSK3 UND INFR 1.563 2 20 .234 SSK4 INTRPRT WRD .296 2 17 .748 SSK5 INTRPRT ATT 2.243 2 11 .152 SSK6 INFR REAS 3.770 2 10 .060
Table 5.8: Multiple Comparisons: Scheffe – item measures from Winsteps subskill subtests analysis
Dependent Variable Mean Difference (I-J)
Std. Error Sig.
95% Confidence Interval Lower Bound
Upper Bound
SSK1 IDN INF
Con Int -.15 .35 .91 -1.01 .71 Lec -.48 .43 .54 -1.55 .59
Int Con .15 .35 .91 -.71 1.01 Lec -.33 .40 .72 -1.32 .67
Lec Con .48 .43 .54 -.59 1.55 Int .33 .40 .72 -.67 1.32
SSK3 UND INFR
Con Int -1.98 .93 .13 -4.44 .48 Lec -.07 1.12 1.00 -3.03 2.88
Int Con 1.98 .93 .13 -.48 4.44 Lec 1.91 .93 .15 -.55 4.37
Lec Con .07 1.12 1.00 -2.88 3.03 Int -1.91 .93 .15 -4.37 .55
SSK 4 INTPRT WRD
Con Int .25 .82 .96 -1.94 2.43 Lec .20 1.33 .99 -3.37 3.77
Int Con -.25 .82 .96 -2.43 1.94 Lec -.05 1.25 1.00 -3.39 3.29
Lec Con -.20 1.33 .99 -3.77 3.37 Int .05 1.25 1.00 -3.29 3.39
SSK5 INTPRT ATT
Con Int -.48 .74 .82 -2.56 1.61 Lec -1.16 1.05 .56 -4.11 1.80
Int Con .48 .74 .82 -1.61 2.56 Lec -.68 .96 .78 -3.38 2.01
Lec Con 1.16 1.05 .56 -1.80 4.11 Int .68 .96 .78 -2.01 3.38
SSK6 INFR REAS
Con Int .78 .66 .52 -1.12 2.68 Lec 1.07 .85 .48 -1.36 3.50
Int Con -.78 .66 .52 -2.68 1.12 Lec .29 .66 .91 -1.61 2.19
Lec Con -1.07 .85 .48 -3.50 1.36 Int -.29 .66 .91 -2.19 1.61
Note. The mean difference is significant at the 0.05 level.

93
The significance values of the variance homogeneity test (see Table 5.7) were all
above 0.05 and made the comparison of the means possible. Because of the unequal
number of samples in the six subskill groups, the Scheffe approach was adopted for post-
hoc multiple comparisons to examine the significance of mean difference in the subskills
across text types. None of the tests showed significant differences between the text type
groups at the level of p <0.05 (see Table 5.8), which suggests the six subskills did not
differ statistically from each other across the three text types – Conversation, Interview,
and Lecture.
5.3 Facets Analysis Results
5.3.1 Results of subskill- and item-group-anchored analysis. The main analysis
of group-anchoring subskills by 3 text types and group-anchoring items by 18 subskill-
by-text types (see Table 5.9) indicates that:
In conversations, SSK1 (Identifying specific information, Measure = -0.72; SE =
0.03) is the easiest subskill, followed by SSK2 (Understanding main idea and supporting
ideas, Measure = -0.28; SE = 0.04), SSK3 (Understanding information and making an
inference, Measure = -0.27; SE = 0.09), SSK4 (Interpreting a words or phrase as used by
the speaker, Measure = -0.27; SE = 0.07); SSK5 (Interpreting the attitude or intention of
the speaker, Measure = -0.03; SE = 0.08) was more difficult, with SSK6 (Inferring
speaker’s reasoning, Measure = 1.84; SE = 0.17) being the most difficult listening subskill.
Likewise, SSK1 (Measure=-0.74; SE=0.03) is the easiest subskill for interviews,
followed by SSK4 (Measure = -0.58; SE = 0.05), SSK2 (Measure = -0.28; SE = 0.04),
SSK5 (Measure = -0.02; SE = 0.06), SSK3 (Measure = 0.80; SE = 0.04), and SSK6
(Measure = 0.82; SE = 0.05) is the most challenging subskill.
In lectures, SSK1 (Measure = -0.60; SE = 0.03) is the easiest, followed by SSK3
(Measure = -0.50; SE = 0.07), SSK4 (Measure = -0.28; SE = 0.04), SSK2 (Measure =
0.29; SE = 0.05), SSK6 (Measure = 0.59; SE = 0.07), the most difficult subskill in lectures
is SSK5 (Measure = 0.60; SE= 0.06). The subskills’ measures and respective SEs are
plotted in Figure 5.4 for comparison with results from other analyses.

94
Table 5.9: Subskills measurement report (arranged by measure) from group-anchoring both subskills
Subskills Measure
Model S.E. Infit Outfit
Corr. PtBis MnSq ZStd MnSq ZStd 6 INFR REAS_C 1.84 0.17 1.06 0.60 1.02 0.10 0.01 6 INFR REAS_I 0.82 0.05 0.97 -1.20 0.99 -0.20 0.11 3 UND INFR_I 0.80 0.05 1.03 1.20 1.14 2.50 0.19 5 INTPRT ATT_L 0.60 0.06 1.02 0.80 1.03 1.00 0.03 6 INFR REAS_L 0.59 0.07 1.02 0.90 1.02 0.60 0.05 2 UND MAIN ID_L 0.29 0.05 1.03 1.50 1.04 1.40 0.13 5 INTPRT ATT_I -0.02 0.06 1.01 0.20 0.99 -0.20 0.15 5 INTPRT ATT_C -0.03 0.08 1.04 0.90 1.03 0.40 0.24 4 INTPRT WRD_C -0.27 0.07 1.02 0.80 1.03 0.70 0.07 3 UND INFR_C -0.27 0.09 1.01 0.10 0.99 -0.20 0.07 2 UND MAIN ID_I -0.28 0.04 0.98 -1.40 0.98 -0.30 0.20 4 INTPRT WRD_L -0.38 0.08 1.00 -0.10 1.05 1.00 0.22 3 UND INFR_L -0.50 0.07 1.05 1.20 1.08 0.90 0.23 2 UND MAIN ID_C -0.54 0.16 1.02 0.40 1.04 0.40 0.03 4 INTPRT WRD_I -0.58 0.05 1.01 0.20 1.00 0.00 0.23 1 IDN SPC INF_L -0.60 0.03 0.99 -0.60 0.97 -1.00 0.22 1 IDN SPC INF_C -0.72 0.03 1.00 0.10 0.95 -1.50 0.20 1 IDN SPC INF_I -0.74 0.03 0.99 -1.00 0.94 -1.80 0.20 Model, Populn: RMSE .08 Adj (True) S.D. .67 Separation 8.54 Strata 11.72 Reliability .99 Model, Sample: RMSE .08 Adj (True) S.D. .69 Separation 8.79 Strata 12.06 Reliability .99 Model, Fixed (all same) chi-square: 2173.3 d.f.: 17 significance (probability): .00 Model, Random (normal) chi-square: 16.5 d.f.: 16 significance (probability): .42

95
Table 5.10: Bias/interaction report (arranged by measure)
Subskill Text Type Bias Size S.E. t d.f. Prob.
Infit MnSq
Outfit MnSq Label Measure Label Measure
1IDN INF_L -0.60 Lec 0.07 0.00 0.03 0.01 4996 0.99 1.00 1.00 3UND INFR_L -0.50 Lec 0.07 0.00 0.07 0.00 1479 1.00 1.00 1.10 4 INTPRT WRD_L -0.38 Lec 0.07 0.00 0.08 0.00 803 1.00 1.00 1.10 1 IDN INF_C -0.72 Con -0.17 0.00 0.03 0.00 8469 1.00 1.00 1.00 2 UND MAIN_C -0.54 Con -0.17 0.00 0.16 0.00 204 1.00 1.00 1.00 5 INTPRT ATT_I -0.02 Int 0.10 0.00 0.06 0.00 1312 1.00 1.00 1.00 3 IDN INF_I -0.74 Int 0.10 0.00 0.03 0.00 8421 1.00 1.00 0.90 4 INTPRT WRD_I -0.58 Int 0.10 0.00 0.05 0.00 2050 1.00 1.00 1.00 2 UND MAIN_L 0.29 Lec 0.07 0.00 0.05 0.00 1871 1.00 1.00 1.00 3 UND INFR_C -0.27 Con -0.17 0.00 0.09 0.00 679 1.00 1.00 1.00 6 INFR REAS_L 0.59 Lec 0.07 0.00 0.07 0.00 833 1.00 1.00 1.00 6 INFR REAS_C 1.84 Con -0.17 0.00 0.17 0.00 220 1.00 1.10 1.00 4 INTPRT WRD_C -0.27 Con -0.17 0.00 0.07 0.00 1152 1.00 1.00 1.00 5 INTPRT ATT_C -0.03 Con -0.17 0.00 0.08 0.00 1046 1.00 1.00 1.00 5 INTPRT ATT_L 0.60 Lec 0.07 0.00 0.06 0.00 1185 1.00 1.00 1.00 2 UND MAIN_I -0.28 Int 0.10 0.00 0.04 -0.01 4541 1.00 1.00 1.00 6 INFR REAS_I 0.82 Int 0.10 0.00 0.05 -0.01 1752 0.99 1.00 1.00 3 UND INFR_I 0.80 Int 0.10 0.00 0.05 -0.01 2440 0.99 1.00 1.10 Fixed (all = 0) chi-square: .0 d.f.: 18 significance (probability): 1.00

96
The results in Table 5.10 show that the bias statistics are all .00, t-values close to
0.0 and p-values over 0.99, which suggests, again, that text type does not have a
statistically significant impact on subskill measures.
5.3.2 Results from item-group-anchored analysis with text type as a facet.
Table 5.11 displays the statistics of examinees, subskills and items in the free analyses in
which items were grouped into 18 categories at 0.00 and text type was included as a facet.
No items or examinees were removed for further analysis as the analysis at this point
focused on items. The sole underfitting item has an infit mean square negligibly close to
1.3. The statistics of subskills are summarized in Table 5.12.
Table 5.11: All facet statistics summary (item group-anchored and text type as a facet)
Examinees Subskills Items Measure N 2828 6 206
Mean 0.99 0.00 0.00 S.D. 0.27 0.52 1.14 Range -3.22 – 4.89 -0.67 – 1.01 -3.28 – 4.10
Infit MnSq 0.22 – 2.41 0.99 – 1.02 0.85 – 1.31 ZStd -2.62 – 3.27 -0.8 – 1.4 -3.1 – 4.37
Outfit MnSq 0.06 – 9.0 0.95 – 1.10 0.57 – 1.96 ZStd -2.02 – 3.69 -2.6 – 2.9 -2.43 – 4.61
Strata / Reliability of Separation
1.55 / 0.45 20.38 / 1.00 8.07 / 0.97
Chi-square statistic (p-vlaue .00)
4671.3 1563.5 7214.4
Degree of freedom 2827 5 206
The separation statistics: (a) the fixed chi-square statistics χ2 (1563.5, d.f. = 5, p
< .00) was highly significant, indicating that the subskills were not equally difficult (after
allowing for measurement error), (b) the reliability of subskill separation attested to a
very high degree of heterogeneity among the six subskills (the high reliability of subskill
separation of 1.00 indicates that the subskills differ substantially in terms of their levels
of difficulty).
Table 5.12 reports subskill difficulty measures, their standard errors, infit and
outfit statistics, and the summary statistics for the subskill facet. The variability across
subskills in their level of difficulty was small. The subskill difficulty measures showed a

97
1.68 logit spread, – about one-quarter of the logit spread observed for item difficulty
measures (7.38 logits) and examinee ability measures (8.11 logits). SSK6, interfering
speaker’s reasoning at the top in order of measures (Measure = 0.80, SE = 0.04), is the
most difficult subskill while SSK1, identifying specific information at the bottom
(Measure = -0.57, SE = 0.02) is the easiest subskill. The average infit mean square is 1.01
and outfit mean square is 1.02, suggesting the data fit the model well. The subskill strata
(20.38) revealed that the items within the six subskills could be separated into more 20
statistically distinct levels of difficulty, which are “three standard errors apart and centred
on the mean of the sample” (Fisher, 1992; Wright & Masters, 2002, p. 888). The chi-
square statistic, χ2 = 1563.5, with d.f. = 5, p < 0.001, indicates that these subskill measures
are significantly different. However, the other chi-square statistic, χ2 = 5.0, with d.f. = 4,
p = .29, rejects the hypothesis that subskill measures are normally distributed.
Table 5.12: Subskill measurement report after free analysis (item group-anchored and text type as a facet)
Subskills Measure S. E.
Infit Outfit Corr. PtBis MnSq ZStd MnSq
ZStd
6 INFR REAS 0.80 0.04 1.01 0.30 1.02 0.80 0.10 3 UND INFR 0.18 0.04 1.02 1.30 1.10 2.90 0.27 5 INTPRT ATT 0.18 0.04 1.00 0.00 1.00 0.00 0.20 2 UND MAIN ID -0.10 0.03 0.99
-0.50 1.00 0.10 0.23
4 INTPRT WRD -0.41 0.04 1.02 1.40 1.03 1.00 0.20
1 IDN SPC INF -0.67 0.02 0.99 -
0.80 0.95 -2.60 0.22 Mean (Count: 6) 0.00 0.03 1.01 0.30 1.02 0.40 0.20 S. D. (Population) 0.47 0.01 0.01 0.90 0.04 1.70 0.05 S. D. (Sample) 0.52 0.01 0.01 1.00 0.05 1.80 0.06 Model, Populn: RMSE .03 Adj (True) S.D. .47 Separation 13.72 Strata 18.62 Reliability .99 Model, Sample: RMSE .03 Adj (True) S.D. .52 Separation 15.03 Strata 20.38 Reliability1.00 Model, Fixed (all same) chi-square: 1563.5 d.f.: 5 significance (probability): .00 Model, Random (normal) chi-square: 5.0 d.f.: 4 significance (probability): .29

98
Table 5.13: All facet statistics summary (item group-anchored and text type as dummy)
Examines Subskills Items Free Calibrated Free Calibrated Free Calibrated
Measure N 2828 2225 6 6 207 191 Mean 0.24 0.33 0.00 0.00 0.00 0.00 S.D. 0.92 1.08 0.54 0.72 1.14 1.61 Range -3.53 – 4.90 -4.57 – 5.89 -0.72 – 0.83 -0.77 – 1.11 -3.21 – 4.13 -5.36 – 5.57
Infit MnSq 0.20 – 2.23 0.11 – 1.63 1.00 – 1.03 0.99 – 1.05 0.68 – 1.70 0.71 – 2.07 ZStd -2.62 – 3.25 -2.31 – 2.00 -0.44 – 1.76 -0.42 – 1.98 -4.44 – 4.35 -4.25 – 9.00
Outfit MnSq 0.06 – 9.0 0.03 – 9.00 0.96 – 1.11 0.96 – 1.16 0.53 – 3.04 0.49 – 5.38 ZStd -1.98 – 3.53 -2.16 – 4.90 -2.2 – 2.72 -1.13 – 4.01 -3.39 – 5.19 -3.35 – 9.00
Strata / Reliability of Separation 1.55 / 0.45 1.70 / 0.51 21.42 / 1.00 23.03 / 1.00 8.04 / 0.97 7.46 / 0.97
Chi-square statistic (p-vlaue .00) 4660.5 4051.5 1777.3 2245.7 7178.3 6333.0
Degrees of freedom 2827 2224 5 5 206 190

99
Table 5.14: Subskill measurement report after free analysis (item group-anchored and text type as dummy)
Subskills Measure S. E.
Infit Outfit Corr. PtBis MnSq ZStd MnSq ZStd
6 INFR REAS 0.83 0.04 1.00 -0.20 1.01 0.20 0.10 5 INTPRT ATT 0.19 0.04 1.00 -0.10 1.00 0.00 0.20 3 UND INFR 0.18 0.04 1.03 1.70 1.10 2.70 0.27 2 UND MAIN ID -0.05 0.03 1.00 -0.10 1.01 0.30 0.23 4 INTPRT WRD -0.43 0.04 1.01 0.70 1.02 0.60 0.20 1 IDN SPC INF -0.72 0.02 1.00 -0.40 0.96 -2.30 0.22 Mean (Count: 6) 0.00 0.03 1.00 0.30 1.02 0.30 0.20 S. D. (Population) 0.49 0.01 0.01 0.80 0.04 1.50 0.05 S. D. (Sample) 0.54 0.01 0.01 0.80 0.04 1.60 0.06 Model, Populn: RMSE .03 Adj (True) S.D. .49 Separation 14.43 Strata 19.57 Reliability 1.00 Model, Sample: RMSE .03 Adj (True) S.D. .54 Separation 15.81 Strata 21.42 Reliability 1.00 Model, Fixed (all same) chi-square: 1777.3 d.f.: 5 significance (probability): .00 Model, Random (normal) chi-square: 5.0 d.f.: 4 significance (probability): .29
5.3.3 Results from item-group-anchored analysis with text type as a dummy.
The MFRM Wright map in Figure 5.3 displays the variable map representing the
calibrations of the examinees, text types, subskills, and items and shows a good
distribution of persons and items with the subskills spread within a narrower range, and
no difference between text types. Table 5.13 shows a comparison of the statistics of
examinees, subskills and items before and after calibration where text type was seen as
dummy. The subskill statistics from the free and the calibration analyses are respectively
shown in Table 5.14 and Table 5.15.
When the results in Table 5.11, 5.14 and 5.15 of the free and calibration analyses
where text type was treated as a facet and dummy respectively, are compared, the
differences in the subskill measures across the three sets of results appear to be minimal
(all less than 0.38 logit); given that 0.5 logits is normally adopted as a “meaningful” or
“substantive” (rather than measurable or statistically significant) difference in Rasch
measurement (Lai & Eton, 2002, p. 850). In addition, the order of subskills remained the

100
same except for SSK2 and SSK3 in the calibrated results of text-type-as-dummy analysis.
They are quite close to each other in terms of difficulty and their differences from the
adjacentSSK5 and SSK4 were also smaller than 0.5 logits. It was noted that SSK1 and
SSK4 were consistently the easiest subskills and SSK5 and SSK6 were the most difficult
subskills across all the three sets of results; and, more importantly, the differences
between these two groups of subskills remain consistently larger than 0.5 logits. It seems
reasonable to claim that SSK1 and SSK4 were consistently more difficult than SSK5 and
SSK6.
Figure 5.3 Wright Map from Facets analysis Item-group anchored text type dummy

101
The subskills measurement report in Table 5.15 shows that the subskill facet has
very good fit values after calibration. The difficulty levels range from -0.95 to 1.18 logits.
Although it is a relatively small range (c. 2 logits), the difficulties were significantly
different from each other at the probability level of p < .001. Compared to the overall
(anchored) mean of 0.00, the easier subskills include SSK1, SSK3, and SSK4, whereas
the harder ones include SSK6, SSK5 and SSK2. This order is generally similar to the
result from the Winsteps analysis (see Figure 5.4) in which SSK4 are easier than SSK6
and SSK5. The discrepancy lies in the difficulties of SSK2 and SSK3. In the Winsteps
results SSK2 is the third easiest while the SSK3 is the second hardest; however, in the
Facets results, SSK2 is the third hardest whereas SSK3 becomes the third easiest subskill.
Despite the variation in the ranking order of SKK2 and SSK3, the gaps between the
variation is no larger than the SEs. Winsteps analyses modelled two variables (item and
person) while Facets analyses modelled facets beyond item and person, namely, subskills
and text types. Although group-anchoring in the Facets analyses made it possible to run
the analyses, caution needs to be taken in interpretation. Each of the analyses was
compromised from optimal, one way or another, by the absence of adequate data linkage.
However, there were no inadequacies with the Winsteps analyses, so the Winsteps results
are more reliable for reporting.
Table 5.15: Subskill measurement report after calibration (item group-anchored and text type as dummy)
Infit Outfit
Subskills Measur
e S. E. MnSq ZStd MnSq ZStd Corr. PtBis
6 INFR REAS 1.18 0.05 0.99 -0.30 0.93 -1.80 0.12 5 INTPRT ATT 0.30 0.04 1.01 0.50 1.02 0.90 0.22 2 UND MAIN ID 0.02 0.03 1.00 0.00 1.12 1.90 0.26 3 UND INFR -0.09 0.06 1.08 3.60 1.13 3.90 0.33 4 INTPRT WRD -0.45 0.04 1.00 0.00 1.07 1.00 0.23 1 IDN SPC INF -0.95 0.02 1.00 -0.10 1.01 0.20 0.26 Mean (Count: 6) 0.00 0.04 1.01 0.60 1.05 1.00 0.24 S. D. (Population) 0.66 0.01 0.03 1.40 0.07 1.70 0.06 S. D. (Sample) 0.72 0.01 0.03 1.50 0.08 1.90 0.07 Model, Populn: RMSE .04 Adj (True) S.D. .66 Separation 15.53 Strata 21.04 Reliability 1.00 Model, Sample: RMSE .04 Adj (True) S.D. .72 Separation 17.02 Strata 23.03 Reliability 1.00 Model, Fixed (all same) chi-square: 2245.7 d.f.: 5 significance (probability): .00 Model, Random (normal) chi-square: 5.0 d.f.: 4 significance (probability): .29

102
5.3.4 No-item-facet analysis results. This analysis returned results without any
disjoint subsets of data. Table 5.16 summarises the statistics of examinees and subskills
in the free and calibration analysis when item was not viewed as a facet. It shows that
both the subskills and examinees had acceptable infit mean squares spread after
calibration. The abilities of examinees range from -2.61 to 4.17 while the difficulties of
subskills spread from -0.62 to 0.54 only, suggesting minimal differences between the
subskills.
Figure 5.4 Comparison of the measures of subskill from Winsteps calibration and Facets calibration analyses (item-group anchored and text type-dummy)
Table 5.16: All facet statistics summary – item unfaceted
Examines Subskills
Free Calibrated Free Calibrated Measure N 2828 2803 6 6
Mean 0.20 0.20 0.00 .00 S.D. 0.77 0.78 0.39 0.40 Range -2.61 – 4.17 -2.63 – 4.20 -0.60 – 0.52 -0.62 – 0.54
Infit MnSq 0.56 – 1.48 0.54 –1.31 0.96 – 1.05 0.96 – 1.04 ZStd -2.65 – 3.07 -2.63 – 2.30 -2.68 – 4.70 -2.80 – 4.40
Outfit MnSq 0.36 – 2.60 -0.35 – 2.75 0.95 – 1.05 0.95 – 1.05 ZStd -2.56 – 3.04 -2.54 – 2.34 -2.67 – 4.02 -2.70 – 3.80
Reliability of Separation 0.35 0.36 0.99 .99
Chi-square statistic (p-vlaue .00)
3860.5 3875.2 1241.6 1302.3
Degree of freedom 2827 2798 5 5
-1.5
-1
-0.5
0
0.5
1
1.5
2
IDNINFO
UNDMAIN
UNDINFR
INTPRTWRD
INTPRTATT
INFRREAS
Winsteps_Calibration
Item-GA texttyppe dummy

103
Compared with the results from group-anchoring analysis in Table 5.15, the
measures of SSK4 and SSK6 changed noticeably, by -0.57 and 0.64 logits respectively
from the group-anchoring to the no-item analysis while the differences in other skills were
small but still larger than their combined standard errors. In terms of the hierarchical
order of subskills, SSK1 remained the easiest and SSK6 the most difficult along the scale
although the discrepancies were not so apparent in the no-facet analysis (see Table 5.17).
Table 5.17: Subskill measure report – item unfaceted (after calibration)
Subskills Measure S. E.
Infit Outfit Corr. PtBis MnSq ZStd MnSq ZStd
6 INFR REAS 0.54 0.04 0.96 -2.80 0.95 -2.80 0.08 5 INTPRT ATT 0.19 0.04 0.99 -1.10 0.99 -0.90 0.14 4 INTPRT WRD 0.12 0.03 0.99 -1.10 0.99 -0.90 0.08 3 UND INFR 0.05 0.03 1.04 4.40 1.05 3.80 0.02 2 UND MAIN ID -0.28 0.03 1.01 1.30 1.01 0.80 0.06 1 IDN SPC INF -0.62 0.02 1.00 -0.60 0.99 -0.50 0.10 Mean (Count: 6) 0.00 0.03 1.00 0.00 1.00 -0.10 0.08 S. D. (Population) 0.36 0.01 0.03 2.40 0.03 2.10 0.03 S. D. (Sample) 0.40 0.01 0.03 2.60 0.03 2.20 0.04 Model, Populn: RMSE .03 Adj (True) S.D. .36 Separation 11.45 Strata 15.60 Reliability .99 Model, Sample: RMSE .03 Adj (True) S.D. .40 Separation 12.55 Strata 17.07 Reliability .99 Model, Fixed (all same) chi-square: 1302.3 d.f.: 5 significance (probability): .00 Model, Random (normal) chi-square: 5.0 d.f.: 4 significance (probability): .29
5.4 Comparison of the Different Sets of Results
The line graph in Figure 5.5 displays the results of subskill measures together with
respective standard errors from the five analyses – Winsteps calibration, Winsteps person
anchored, Facets item-group-anchored and text type faceted, Facets item-group-anchored
and text type as a dummy, and Facets item-unfaceted. A number of commonalities and
discrepancies were identified across the five sets of results and within the Winsteps and
Facets results respectively.
5.4.1 Common observations from both Winsteps and Facets analyses. As
revealed in Figure 5.6, the single most striking observation to emerge from all the
analyses is that in all of the five analyses SSK1 was consistently separable and easier than
the other five subskills at the confidence level of p < 0.05., whereas SSK6 was always

104
separable and more difficult than the other five subskills at the confidence level of p <
0.05.
Figure 5.5 Comparison of the measures of subskill from different analyses
Figure 5.6 Comparison of the order of subskills across different analyses
-1.5
-1
-0.5
0
0.5
1
1.5
2
IDN SPCINFO
UNDMAIN ID
UNDINFR
INTPRTWRD
INTPRTATT
INFRREAS
Subskill Measures Comparison
Winsteps_Calibration
Winsteps_Subskillsubtests
Item-GA text typefaceted
Item-GA text typedummy
Item-unfaceted
-1.5-1
-0.50
0.51
1.52
Subskill Measures Comparison
IDN SPC INFO
UND MAIN ID
UND INFR
INTPRT WRD
INTPRT ATT
INFR REAS

105
5.4.2 Observations from Winsteps analyses. Similar results were observed
between the two sets of Winsteps analyses. The resultant pair-wise subskill measures
from the two analyses were very close to each other, the differences (in the range of 0.01
to 0.26 logits) being unexceptionally smaller than the combined standard errors (in the
range of 0.27 to 0.72 logits). More importantly, the ranking orders of all the six subskills
were identical, ascending from SSK1, SSK4, SSK2, SSK5, SSK3 to SSK6 although
SSK4, SSK2, SSK5 and SSK3 remained not measurably different from each other.
The only difference between the two sets of results lies in the confidence of
claiming SSK6 to be more difficult than SSK3. The relative difficulty of SSK6 to SSK3
(1.26 – 0.72 = 0.54 logits) was greater than the combined standard errors (0.31+ 0.18 =
0.49 logits) in the calibration result, thereby rendering SSK6 marginally more difficult
than SSK3 in terms of both the combined S.Es as well as the 0.5 logits criteria for
determining the separability of different items. Nevertheless, this SSK6-SSK3 difference
(1.44 – 0.98 = 0.36 logit) in the PA analysis was much smaller than both the combined
S.E.s (0.41+ 0.23= 0.64 logit) and 0.5 logit cut-off making SSK6 not measurably different
from SSK3.
Given the relative measures and consistent ranking orders of the subskills, the
Winsteps analyses reveal that the six subskills can be divided into three tiers: SSK1 as
the easiest; SSK4, SSK2, SSK5, & SSK3 in the middle; and SSK6 as the most difficult.
5.4.3 Observations from Facets analyses. The three Facets analyses also found
SSK1 as the easiest, and SSK6 the most difficult subskill on the scale, together with some
similar results regarding SSK2, SSK3, SSK4 and SSK5 especially when the analyses
were paired for comparison.
Understanding main idea and supporting ideas (SSK2) was found to be easier
than SSK3 in the Item-GA text type faceted and the Item-unfaceted analyses, but more
difficult than SSK4 in both item-group anchored analyses, and easier than SSK5 in all the
three Facets analyses. Those differences were statistically significant.
In addition to the greater difficulty of understanding information and making an
inference (SSK3) than SSK2 in item-GA text type faceted and item-unfaceted analyses,
SSK3 was also found to be more difficult than SSK4 in both item-group-anchored
analyses, and no more difficult than SSK5 in the three Facets analyses.

106
As for its relationships with SSK2, and SSK3 described above, interpreting the
meaning of a word or phrase as used by the speaker (SSK4) was consistently found to be
less difficult than SSK5 in all of the Facets results.
5.5 Summary of the difficulty and hierarchical measures of subskills
Drawing on the results from the series of analyses from different but
complementary perspectives as reported above, a summary can be made to address
research questions 1, 2 and 3 formulated in the Introduction chapter.
RQ2: Are the subskills measurably identifiable and divisible from each other?
Overall, statistical significance was found between the measures of some subskills, thus
statistically measurable divisibility can be claimed in these subskills. SSK1 can be
consistently identified and separated from the other subskills in all of the analyses and is
measurably least difficult. It is the same with SSK6 in all analyses except in the Winsteps
calibration result when it was not measurably more difficult than SSK2.
Although SSK2, SSK3, SSK4 and SSK5 cannot be distinguished in the Winsteps
results, they were mostly found to be highly discernible in the Facets results. The
exceptions are in the Item-GA text type faceted where SSK3 and SSK5 had the same
measures, and in the Item-unfaceted result in which SSK4 was not measurably distinct
from SSK5, making it hard to differentiate the items measuring these two subskills at the
extremes.
RQ3: What is the hierarchical order of the subskills? First, SSK1 and SSK6 were
consistently and respectively the easiest and the most difficult subskill along the scale.
Second, in four out of the five analyses SSK4 is easier than SSK2, and SSK2 is easier
than SSK3 and SSK5. The relationship between SSK3 and SSK5 is undetermined. That
is, SSK1<SSK4<SSK2<SSK3</=/>SSK5<SSK6; or,
SSK6
SSK3</=/>SSK5
SSK2
SSK4
SSK1

107
5.6 Interaction Analysis Results
In order to address this research question: Do the DELTA subskills maintain
difficulty invariance across text types?, interaction analyses ((also referred to as bias
analysis) with Facets were conducted to investigate the extent to which the subskill
difficulties were influenced by differences in text type difficulty.
5.6.1 Results from the item-group-anchored text type faceted analysis. Table
5.18 displays the results of facet interactions between individual subskills and text types.
The bias size (in Column 5) is the interaction estimate in logits, representing the
difference of the contextual measure (in Column 2) relative to the overall measure (in
Column 11) (i.e., bias = Overall measure +/– local measure). The negative values of bias
estimates indicate bias against text types, and the positive values indicate bias for text
types. A measure difference of greater than 0.5 logits is often used to judge a substantive
DIF contrast (i.e., bias size). The t-statistic or z-score is a standardized interaction, and
assesses the statistical significance of the size of the interaction with the relevant d.f. and
p-value. Ideally, all the t-values should be approximately zero. A t-value larger than +2
or less than -2 indicates significantly biased interactions. The direction of t-statistic
accords with bias size. That is, t-values greater than +2.0 suggest that the text type
consistently favours the subskills. Conversely, t-values below -2.0 indicate consistent
disadvantage of the text type over particular subskills.
The fit mean squares in the last two columns indicate how much misfit remains
after the interactions are estimated (Linacre, 2013c) and suggest how consistent this
pattern of bias is for a particular text type to favour/disfavour a subskill for all the
examinees (Barkaoui, 2014; Kondo-Brown, 2002). It is noteworthy that they are not the
fit of the interaction terms, and do not have the usual statistical properties of mean-squares
(chi-squares); therefore, their standardized version (z-score) is unknown.
This detection analysed a total of 18 possible interactions between 6 subskills and
3 text types for these data. Twelve subskill-by-text type interactions were found to be
statistically significant (-2 < t < 2, p < 0.05). Three biased interactions were larger than
0.5 logits: SSK3 in lectures (interaction size = 0.73 logits), SSK3 in interviews (-0.52
logits), and SSK6 in conversations (0.96 logits). These three results require further
consideration.

108
Table 5.18: Bias/Interaction report from item-GA text-type-faceted analysis
Subskill Text Type
Label Measure Label Measure Bias Size S. E. t d.f. Prob. Infit MnSq Outfit MnSq Contextual
Measure 3 UND INFR 0.18 Lec 0.16 0.73 0.07 10.11 1479 0.00 1.10 1.10 -0.55 3 UND INFR 0.18 Con -0.22 0.37 0.09 4.32 679 0.00 1.00 1.00 -0.19 2 UND MAIN -0.10 Con -0.22 0.36 0.16 2.27 204 0.02 1.00 1.00 -0.46 6 INFR REAS 0.80 Lec 0.16 0.30 0.07 4.01 833 0.00 1.00 1.00 0.5 5 INTPRT ATT 0.18 Con -0.22 0.19 0.08 2.49 1046 0.01 1.00 1.00 -0.01 5 INTPRT ATT 0.18 Int 0.06 0.13 0.06 2.17 1312 0.03 1.00 1.00 0.05 2 UND MAIN -0.10 Int 0.06 0.13 0.04 3.56 4541 0.00 1.00 1.00 -0.23 4 INTPRT WRD -0.41 Int 0.06 0.10 0.05 1.84 2050 0.07 1.00 1.00 -0.51 4 INTPRT WRD -0.41 Lec 0.16 0.06 0.08 0.76 803 0.45 1.00 1.10 -0.47 1 IDN INF -0.67 Int 0.06 0.03 0.03 1.22 8421 0.22 1.00 0.90 -0.7 1 IDN INF -0.67 Con -0.22 -0.01 0.03 -0.43 8469 0.66 1.00 1.00 -0.66 1 IDN INF -0.67 Lec 0.16 -0.04 0.03 -1.03 4996 0.30 1.00 1.00 -0.63 6 INFR REAS 0.80 Int 0.06 -0.04 0.05 -0.68 1752 0.50 1.00 1.00 0.84 4 INTPRT WRD -0.41 Con -0.22 -0.19 0.07 -2.94 1152 0.00 1.00 1.00 -0.22 5 INTPRT ATT 0.18 Lec 0.16 -0.26 0.06 -4.20 1185 0.00 1.00 1.00 0.44 2 UND MAIN -0.10 Lec 0.16 -0.31 0.05 -5.90 1871 0.00 1.00 1.00 0.21 3 UND INFR 0.18 Int 0.06 -0.52 0.05 -10.06 2440 0.00 1.00 1.10 0.7 6 INFR REAS 0.80 Con -0.22 -0.96 0.17 -5.73 220 0.00 1.00 1.00 1.76 Mean (Count: 18) 0.00 0.07 0.10 1.00 1.00 S. D. (Population) 0.36 0.04 4.52 0.00 0.00 S. D. (Sample) 0.37 0.04 4.65 0.00 0.00 Fixed (all = 0) chi-square: 368.0 d.f.: 18 significance (probability): .00

109
Figure 5.7 graphically presents the information on text type-subskill interactions
in the form of bias t-statistics. The x-axis represents text type while the y-axis plots the t-
statistics. It can be seen that most of the t-values are located outside the -2 to +2 range
and a few patterns can be observed to reflect the significant differential impact of text
type on subskill difficulty:
(1) Conversations reduced difficulty of SSK3, SSK2 and SSK5, and increased
difficulty of SSK6, and SSK4;
(2) Interviews favoured SSK3, but disadvantaged SSK2 and SSK5;
(3) Lectures lessened the difficulty of SSK3, SSK6, and increased the difficulty
of SSK5 and SSK2;
(4) No impact of text type was found on subskill SSK1.
Figure 5.7 t-statistics for interaction size from item-GA text type-faceted analysis
As defined earlier (See 5.6.1), the bias/interaction size represents the difference
between the overall measure and the absolute measure, which is the local difficulty of
each subskill in the different text types investigated in this study. In other words, the
absolute measure equals the overall measure minus the interaction measure (i.e., bias size
in Table 5.18). Three sets of large and significant interactions were identified above,
hence the corresponding absolute measures of the subskill-by-text type are: SSK3 in
Lecture, -0.55 logit (0.18 – 0.73 logit); SSK3 in interviews, 0.70 logit (0.18 – -0.52 logit);
and SSK6 in conversations, 1.76 logits (0.80 – -0.96 logits).
-12-10
-8-6-4-202468
1012
1.Conversation
2. Interview 3. Lecture
3. su
bski
lls: t
-val
ue re
lativ
e-to
-ov
eral
l (-)
1. IDN INF
2. UND MAIN
3. UND INFR
4. INTPRT WRD
5. INTPRT ATT
6. INFR REAS

110
Figure 5.8 plots the local or absolute difficulty together with standard errors of
subskills in different text types from the analysis whereby items were group-anchored
and text type was counted as a facet. This line graph mainly reveals the key information
in terms of:
The variability of the difficulty regarding individual subskills across text type
(i.e., the impact of text type).The polylines with error bars on each demonstrate that the
subskills fluctuated in their difficulty measures across the three text types, with SSK4,
SSK1, and SSK2 as the exceptions. The bias contrasts greater than 0.5 logits were
displayed in Table 5.18 to highlight a large and meaningful difference between the text
types. It is noteworthy to point out that, pairwise, SSK3 would most likely pose a greater
challenge in Interview than in Lecture by 1.24 logits, and SSK6 would be 1.25 logits more
difficult in Conversation than in Lecture.
The separability of subskills within the text type. The subskills could all be
separated measurably from each other in Interview while this was not observed with
SSK3 and SSK4 in Conversation or Lecture, nor with SSK 5 or SSK6 in Lecture.
The hierarchical order of subskills within the text type. In light of the statistical
and substantive difference in the measures, the hierarchical order of the subskills can be
summarised as follows:
Conversation: SSK1 < (/SSK2/SSK4/SSK3/) SSK5 < SSK6. SSK1 was
consistently easier than SSK5 and SSK5 was consistently easier than SSK6, whereas the
other three subskills could not be distinguished from SSK1 or SSK5 very well.
Figure 5.8 Absolute measures of subskills by text type from item-GA
text type-faceted analysis
-1
-0.5
0
0.5
1
1.5
2
Conversation Interview LectureSubs
kill-
by-te
xt ty
pe m
easu
res 1. IDN INF
2. UND MAIN
3. UND INFR
4. INTPRT WRD
5. INTPRT ATT
6. INFR REAS

111
Interview: SSK1/SSK4 < (/SSK2/) SSK5 < SSK3/SSK6. SSK1 and SSK4 were
consistently and substantively easier than SSK5, followed by SSK3 and SSK6, while
SSK2 fell between SSK5 and SSK4 without apparent difference from either adjacent
subskills.
Lecture: SSK1/SSK3/SSK4 < SSK2/SSK5/SSK6. Overall the subskills can be
divided into two tiers with SSK1, SSK3 and SSK4 consistently and meaningfully easier
than SSK2, SSK5 and SSK6.
The hierarchical order can also be presented in the form below whereby subskills
in the parentheses denote undermined relationship between those above and below them.
Conversation Interview Lecture
SSK6
SSK5
(SSK2/SSK4/SSK3)
SSK1
SSK3/SSK6
SSK5
(SSK2)
SSK1/SSK4
SSK2/SSK5/SSK6
SSK1/SSK3/SSK4
Figure 5.9 Absolute measures of subskills by text type from item-GA text type-dummy analysis
-3.5-3
-2.5-2
-1.5-1
-0.50
0.51
1.52
2.53
3.5
Conversation Interview Lecture
Subs
kill-
by-te
xt ty
pe m
easu
res
1. IDN INF
2. UND MAIN
3. UND INFR
4. INTPRT WRD
5. INTPRT ATT
6. INFR REAS

112
5.6.2 Results from the item-group-anchored text-type-dummy analysis. Table
5.19 and Figure 5.9 report the results of the interaction analysis with item group-anchored
and text type as a dummy. Overall, 11 of the 18 interactions showed significance at p <
0.01and the significant influence of text type on subskills is summarized as follows:
(1) Conversations made SSK5 and SSK2 easier, and made SSK6 more difficult;
(2) Interviews made SSK2 easier, but made SSK3 more difficult;
(3) Lectures made SSK3 and SSK6 easier, and made of SSK1, SSK2 and SSK5
more difficult.
Six of the significant interactions were substantively larger than 0.5 logits,
alluding that the differential impact requires further attention.
The variability of the difficulty of individual subskills across text type (i.e., the
impact of text type). Figure 5.9 indicates similar results to the previous in terms of the
variability and separability of subskill difficulties. There were statistically significant
variations in individual subskill measures between text types, except SSK1 and SSK2 in
Conversation and Interview, and SSK4 in all the three text types. More importantly, the
measure contrasts of SSK3 between text types were all greater than 1.0, showing
substantive measurable differences in its difficulty when tested in different text types
(Contrast sizes Conversation-Interview = -3.04 logits, Interview-Lecture = 5.66 logits,
and Conversion-Lecture = 2.62 logits). It is also the case with SSK5 in
Conversaton*Interview (contrast size = -1.16 logits), and Conversation*Lecture (contrast
size = -1.68 logits).
The separability of subskills within the text type. Within each text type, the
subskills differentiated from each other very well in Interview with the exception that,
SSK3, SSK4 and SSK6 did not differ in Conversation, and both SSK6 and SSK5 did not
in Lecture.
The hierarchical order of subskills within the text type. When it comes to the
hierarchy of subskills within the text type more complicated patterns were discovered.
Conversation: SSK1(/SSK5/) < SSK2 (/SSK4/SSK3) < SSK6. The most obvious
finding is that SSK1 was consistently easier than SSK2, which was consistently easier
than SSK6, while the others clustered together on the scale. A closer inspection reveals
that SSK4 also stood out and was consistently easier than SSK1.

113
Table 5.19: Bias/Interaction report from item-GA text-type-dummy analysis
Subskill Text Type Label Measure Label Measure Bias Size S. E. t d.f. Prob. Infit MnSq Outfit MnSq 3 UND INFR -0.09 Lec 0.00 2.76 0.20 13.51 512 0.00 1.00 0.90 5 INTPRT ATT 0.30 Con 0.00 1.10 0.10 11.43 669 0.00 1.00 1.00 2 UND MAIN 0.02 Con 0.00 0.50 0.18 2.84 163 0.01 1.00 0.90 6 INFR REAS 1.18 Lec 0.00 0.32 0.08 3.90 708 0.00 1.00 1.00 2 UND MAIN 0.02 Int 0.00 0.17 0.04 3.80 3623 0.00 1.00 1.10 3 UND INFR -0.09 Con 0.00 0.14 0.10 1.52 568 0.13 1.00 1.00 4 INTPRT WRD -0.45 Int 0.00 0.11 0.07 1.67 1617 0.10 1.00 1.10 1 IDN INF -0.95 Con 0.00 0.05 0.03 1.67 6620 0.10 1.00 1.00 1 IDN INF -0.95 Int 0.00 0.01 0.03 0.39 6428 0.69 1.00 1.00 4 INTPRT WRD -0.45 Lec 0.00 -0.04 0.09 -0.41 658 0.68 1.00 1.20 5 INTPRT ATT 0.30 Int 0.00 -0.06 0.07 -0.82 1055 0.42 1.00 1.00 1 IDN INF -0.95 Lec 0.00 -0.11 0.04 -2.70 3782 0.01 1.00 1.00 4 INTPRT WRD -0.45 Con 0.00 -0.12 0.07 -1.58 959 0.11 1.00 1.00 6 INFR REAS 1.18 Int 0.00 -0.13 0.06 -1.98 1396 0.05 1.00 0.90 2 UND MAIN 0.02 Lec 0.00 -0.36 0.06 -6.20 1552 0.00 1.00 1.10 6 INFR REAS 1.18 Con 0.00 -0.57 0.21 -2.77 166 0.01 1.10 1.00 5 INTPRT ATT 0.30 Lec 0.00 -0.58 0.07 -8.46 1025 0.00 1.00 1.00 3 UND INFR -0.09 Int 0.00 -2.90 0.18 -16.45 475 0.00 1.10 1.20 Mean (Count: 18) 0.02 0.09 -0.04 1.00 1.00 S. D. (Population) 1.01 0.06 6.51 0.00 0.10 S. D. (Sample) 1.04 0.06 6.69 0.00 0.10 Fixed (all = 0) chi-square: 761.8 d.f.: 18 significance (probability): .00

114
Interview: SSK1(/SSK4/) < SSK2 (/SSK5) < SSK6< SSK3. The difficulties
ascended from SSK1, through SSK2 and SS5, then SSK6 to SSK, the differences amongst
which were measurable and meaningful. Of note is that while SSK4 differed substantively
from SSK5 it was indistinct from SSK1 and SSK2.
Lecture: SSK3 < SSK1/SSK4 < SSK2/SSK6/SSK5. The order of subskills in
Lecture generated from this analysis is quite different from all other results regarding
order. SSK3 was the easiest subskill while SSK5 and SSK6 were consistently the most
difficult. While SSK1 was harder than SSK3 and easier than SSK2, SSK5, and SSK6, it
did not it differ from SSK4 in a meaningful sense.
Conversation Interview Lecture
SSK6
(SSK3/SSK4)
SSK2
(SSK5)
SSK1
SSK3
SSK6
SSK2/SSK5
(SSK4)
SSK1
SSK5/SSK6/SSK2
SSK1/SSK4
SSK3
5.6.3 Results from the item-unfaceted interaction analysis. Table 5.20 shows
that 12 subskill-by-subskill interactions were found to be statistically significant (-2 < t <
2, p < 0.05), accounting for two-thirds of the total interactions. This tends to imply that
most text types in this study showed statistically significant bias to subskill. Furthermore,
five of the 12 significant interaction sizes were greater than 0.5 logits: SSK3 in lecture
and interview, SSK5 in conversation and lecture, and SSK2 in conversation – suggesting
significant and substantive interactions in the pair-wise combinations of text types and
subskills.
Figure 5.10 indicates the interaction patterns specific to each text type:
Conversations made SSK5 and SSK2 easier, but made SSK6 and SSK4
more difficult;
Interviews made SSK4 and SSK2 easier, but SSK3 more difficult;
Lecture reduced the difficulty of SSK3 and SSK6, but increased the
difficulty of SSK5, SSK2 and SSK4;
Text type exerted no differential impact on SSK1

115
Table 5.20: Bias/Interaction report from item-unfaceted analysis
Subskill Text Type S. E. t d.f. Prob. Infit MnSq Outfit MnSq Label Measure Label Measure Bias Size
3 UND INFR 0.05 Lec 0.00 0.93 0.06 15.47 1471 0.00 1.00 1.00 5 INTPRT ATT 0.19 Con 0.00 0.54 0.07 7.91 1033 0.00 1.00 0.90 2 UND MAIN -0.28 Con 0.00 0.50 0.18 2.80 201 0.01 1.00 1.00 4 INTPRT WRD 0.12 Int 0.00 0.39 0.05 8.25 2036 0.00 1.00 1.00 6 INFR REAS 0.54 Lec 0.00 0.18 0.07 2.49 832 0.01 1.00 1.00 2 UND MAIN -0.28 Int 0.00 0.11 0.03 3.47 4501 0.00 1.00 1.00 5 INTPRT ATT 0.19 Int 0.00 0.08 0.06 1.36 1293 0.17 1.00 1.00 3 UND INFR 0.05 Con 0.00 0.05 0.08 0.60 675 0.55 1.00 1.00 1 IDN INF -0.62 Lec 0.00 0.01 0.03 0.24 4956 0.81 1.00 1.00 1 IDN INF -0.62 Int 0.00 0.00 0.02 -0.09 8339 0.93 1.00 1.00 1 IDN INF -0.62 Con 0.00 0.00 0.03 -0.10 8405 0.92 1.00 1.00 6 INFR REAS 0.54 Int 0.00 -0.04 0.05 -0.78 1728 0.44 0.90 0.90 2 UND MAIN -0.28 Lec 0.00 -0.30 0.05 -6.18 1868 0.00 1.00 1.00 4 INTPRT WRD 0.12 Lec 0.00 -0.31 0.08 -4.10 798 0.00 0.90 0.90 6 INFR REAS 0.54 Con 0.00 -0.47 0.17 -2.81 218 0.01 1.00 0.90 4 INTPRT WRD 0.12 Con 0.00 -0.49 0.06 -7.69 1139 0.00 1.00 0.90 5 INTPRT ATT 0.19 Lec 0.00 -0.54 0.06 -8.63 1185 0.00 1.00 1.00 3 UND INFR 0.05 Int 0.00 -0.54 0.04 -12.34 2428 0.00 1.00 1.00 Mean (Count: 18) 0.01 0.07 -0.01 1.00 1.00 S. D. (Population) 0.40 0.04 6.44 0.00 0.00 S. D. (Sample) 0.41 0.04 6.63 0.00 0.00 Fixed (all = 0) chi-square: 747.7 d.f.: 18 significance (probability): .00

116
Figure 5.10 Interaction between text type and subskill (t-values) from item-unfaceted analysis
Figure 5.11 Absolute measures of subskill from item-unfaceted calibration analysis
The absolute difficulties of the 18 subskills-by-text type, alongside their
respective standard errors are plotted in Figure 5.11.
The variability of the difficulty of individual subskills across text type (the
impact of text type). As is shown in the graph, five of the subskills (except SSK1) varied
-14-12-10
-8-6-4-202468
1012141618
1. Conversation 2. Interview 3. Lecture
subs
kills
: t-v
alue
rela
tive-
to-o
vera
ll (-)
1. IDN INF
2. UND MAIN
3. UND INFR
4. INTPRT WRD
5. INTPRT ATT
6. INFR REAS
-1.5
-1
-0.5
0
0.5
1
1.5
Conversation Interview Lecture
Subs
kill-
by-te
xt ty
pe m
easu
res
1. IDN INF
2. UND MAIN
3. UND INFR
4. INTPRT WRD
5. INTPRT ATT
6. INFR REAS

117
significantly across the text types. Furthermore, two pairs (i.e., 50%) of subskills-by-text
type interactions exhibit contrasts (see Table 5.20) greater than one logit: SSK3 in
Interview and Lecture; SSK5 in Conversation and Lecture, indicating the difficulty of the
subskill in one text type was substantively distinct from its difficulty in another text type.
The separability of subskill measures within the text type. Overall, the six
subskills tended to differentiate well from each other irrespective of what type of text they
were measured in. The distances between the error bars in Figure 5.4 reveal that the
subskills were measurably separable from each other within the particular text type except
SSK3 and SSK6 in Interview, and SSK4 and SSK6 in Lecture.
The hierarchical order of subskills within the text type. In view of the measurable
and meaningful differences in the measures, the subskills can be ranked from the easiest
to the most difficult in the following sequences:
Conversation Interview Lecture
SSK4/SSK6
SSK3
(SSK5)
SSK2/SSK1
SS3/SSK6
(SSK5)
SSK1/SSK2/SSK4
SSK5
(SSK4/SSK6)
SSK2
SSK3/SSK1
5.7 Summary
This chapter reports the results from the Winsteps and Facets analyses of the
quantitative test data. Using the dichotomous Rasch model to analyse data on Winsteps,
it first investigates the psychometric properties of the DELTA listening test to confirm
that the DELTA listening test items contributes to a single unidimensional construct. The
ANOVA test helps to determine the subskill difficulties and their difficulties in relation
to text types. Alternatively, the subskill difficulties from different Facets analyses are also
examined one by one. By comparing the results from Winsteps and Facets analyses,
common observations regarding the subskill measures and their hierarchical order are
outlined.
In the same vein, results concerning the interaction between subskills and text
types are also reported. Although the results might suggest subskill measures and
hierarchical ordering vary in a complex manner in different text types, the consistent

118
finding is that SSK1 remains the easiest while SSK6 falls into into one of the hardest
subskills across conversations, interviews and lectures.
One important implication of assessing subskill difficulty with respect to text type
is that it would shed light on the task (text) assignment in the assessment because the
current text assignment in DELTA depends on pre-set overall text difficulty by expert
judgement and the total number of items determined by the system regardless of the text
type and subskill each student will be allocated. If subskill-by-text type interactions exist
in some items, student ability estimates will be affected because the effect of subskill-by-
text type is not sufficiently (at all) accounted for.

119
CHAPTER SIX
STIMULATED RECALL PROTOCOL RESULTS
While the cognitive validity of the DELTA listening component is supported by
investigating the psychometric properties of the test (Chapters 4 and 5), the qualitative
Stimulated Recall Protocol (SRP) data supplement the findings from the quantitative data
by providing more evidence of the mental processes involved in completing the test. This
chapter then addresses the research question, RQ1, “What are the cognitive processes that
underlie student performance on the DELTA listening component? Are they in line with
the targeted listening subskills the DELTA listening component?” The present chapter
starts with a description of the SRP listening test data and analysis. By comparing the
results from two Winsteps analyses, the results of the SRP listening test are reported and
used as the basis of subsequent SRP interview reporting, then followed by a description
of the SRP interview analysis procedure and results. The key findings from the NVivo
Version 11.0 analyses are reported, including the overall use of cognitive processes and
test-taking strategies, their respective use by different ability groups, and the misfitting
persons identified from the SRP listening test.
6.1 SPR Listening Test Data and Results
The purpose of the SRP is to supplement the answer to the research question RQ1
“What are the cognitive processes of listening subskills that underlie student performance
on the DELTA listening component?” and to provide evidence as to whether the SRP
interviewees were using the intended cognitive processes, or resorting to off-track test-
taking strategies to answer the listening questions. Therefore, the interviewees were asked
to complete the modified DELTA listening test questions before the SRP was conducted.
A total of 62 respondents participated in the SRP. The modified DELTA listening test is
a shortened version of the original DELTA listening component the respondents
answered during the main DELTA test; the modification was due to reasons set out in
Section 3.3.3.2: firstly, the web-based DELTA system only allows students to take the
test once a year; secondly, the system can only assign questions in terms of text difficulty
level rather than text type; lastly, the present study focuses on three text types (i.e.,
conversation, interview, lecture), therefore, other text types such as discussion, were
deliberately excluded from the SRP listening test.
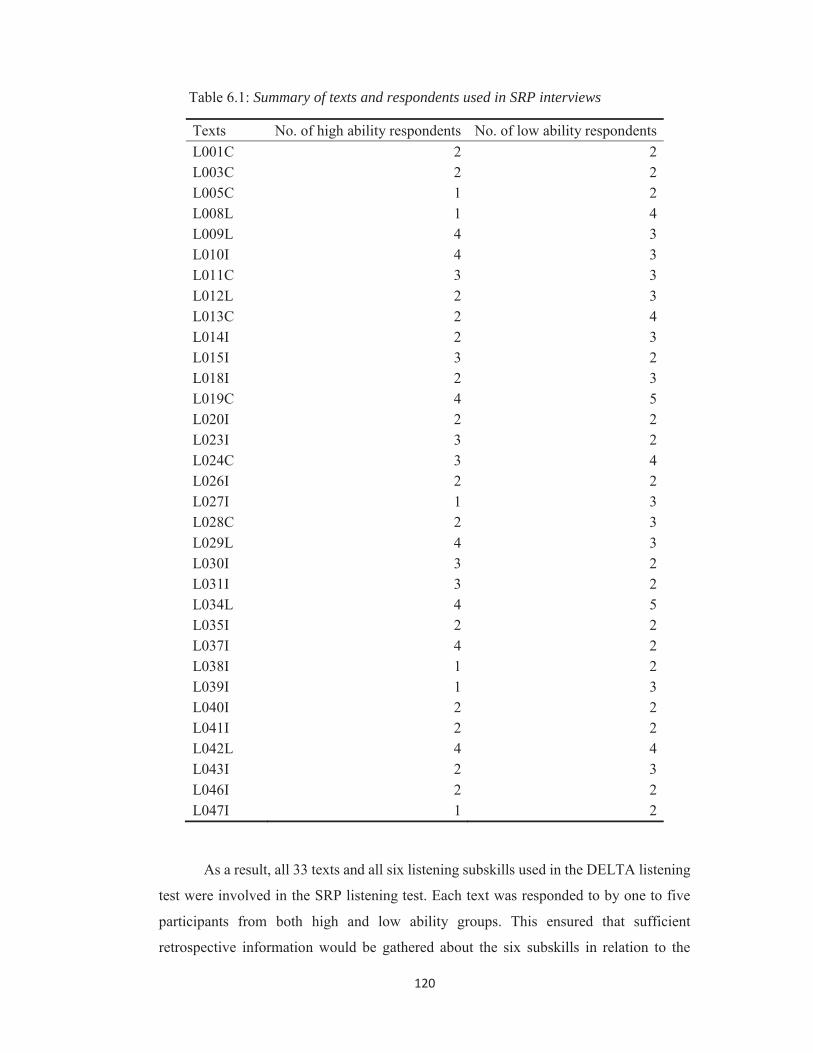
120
Table 6.1: Summary of texts and respondents used in SRP interviews
Texts No. of high ability respondents No. of low ability respondents L001C 2 2 L003C 2 2 L005C 1 2 L008L 1 4 L009L 4 3 L010I 4 3 L011C 3 3 L012L 2 3 L013C 2 4 L014I 2 3 L015I 3 2 L018I 2 3 L019C 4 5 L020I 2 2 L023I 3 2 L024C 3 4 L026I 2 2 L027I 1 3 L028C 2 3 L029L 4 3 L030I 3 2 L031I 3 2 L034L 4 5 L035I 2 2 L037I 4 2 L038I 1 2 L039I 1 3 L040I 2 2 L041I 2 2 L042L 4 4 L043I 2 3 L046I 2 2 L047I 1 2
As a result, all 33 texts and all six listening subskills used in the DELTA listening
test were involved in the SRP listening test. Each text was responded to by one to five
participants from both high and low ability groups. This ensured that sufficient
retrospective information would be gathered about the six subskills in relation to the

121
cognitive processing involved. In the meantime, each participant was assigned two or
three listening texts, which were identical with those they had answered during the
DELTA listening test. Table 6.1 summarises the number of high and low ability
participants for each text.
The SRP listening test data were incorporated into the main DELTA listening test
data and analysed with the Winsteps programme. To calibrate the SRP listening test data
and ensure the comparability of the test results, two Winsteps analyses were conducted –
the Calibration and the CUTLO = -1 logit analyses. The SRP-Calibration analysis was
based on the anchored item measures taken from the main DELTA calibration analysis,
while the SRP-CUTLO analysis disregarded the observations of items which are one logit
more challenging for persons. Overall, 2,892 sets of person statistics were obtained. The
person measures ranged from -3.11 to 5.16 with a mean of 0.58 and person infit ranging
from 0.23 to 2.50. All the persons’ infit statistics from the two analyses were plotted in
Figure 6.1. The horizontal and the vertical lines indicate the acceptable infit 1.3 and the
diagonal black line shows the correlation coefficients between the two sets of infit mean
squares is 0.91. These tend to suggest that, although there were still a number of misfitting
persons in the entire data, there was very little variation in person infit mean squares when
items that were one logit more difficult than the respondent’s ability were removed from
the data set.
The 62 SRP respondents’ listening test results (i.e., person measures) were also
extracted and plotted in terms of measures and infit mean squares. The scatterplot of the
results from the two analyses is displayed in Figure 6.2. The mean measures of the 62
SRP respondents’ listening test results were near identical at 0.90 logits (shown by the
horizontal red line). The black triangles in the graph represent the scatterplot points of the
calibration analysis while the blue diamonds plot the results from the CUTLO analysis.
Overall, the CUTLO analysis did not alter substantially the measures and infits of these
persons.

122
Figure 6.1 Scatterplot of all person infit mean squares (incl. SRP) from Winsteps Cal and CUTLO
The two vertical lines towards the middle of the graph demarcate an acceptable
range of infit mean squares 0.7 to 1.3 for low-stakes multiple choice questions (Bond &
Fox, 2007). It can be seen that most persons had good fit in both analyses and 10 persons
were found to be misfitting. However, only one case of a high ability person whose
(measures > 0.9) were located to right of the 1.3 the infit mean square value, while nine
low ability persons stood outside that 1.3 infit MnSq value. This tends to suggest that the
high ability group performances were more likely to fit the model than were those of the
low ability group. This might also allude to the possibility that the low ability group,
and/or the misfitting persons might be resorting to the test-taking strategies (rather than
cognitive strategies) more frequently during the test. This is investigated further in the
SRP verbalization results in the subsequent section.
R² = 0.9135
0
0.5
1
1.5
2
2.5
3
0 0.5 1 1.5 2 2.5 3
CU
TLO
Calibration
Acceptable infit: 1.3
Acce
ptab
lein
fit: 1
.3

123
Figure 6.2 Scatterplots of SRP person measures and infit mean-squares from Calibration and CUTLO analyses
As the SRP listening test results were likely to remain constant over different
analyses, the person measures of the 62 SRP respondents from the calibration analysis
were used to identify high and low ability sub-groups. Overall, all the 62 persons ranged
from -2.12 to 3.61 logits and the mean was 0.90. Thirty of them scored higher than
average person estimate (0.90) and 32 scored lower than average, and therefore they were
grouped respectively into the higher and the lower ability groups. This is slightly different
from the original grouping for SRP participant recruitment whereby 34 belonged to high
ability group and 28 to the low ability group. However, it might be argued that since the
SRP verbalisation was based on the SRP listening test alone, it is therefore more
reasonable to draw on the SRP listening test result for grouping.
-3
-2
-1
0
1
2
3
4
5
0 0.5 1 1.5 2 2.5
Mea
sure
Infit mean-square
SRP CUTLO
SRP calibration

124
6.2 SRP Results
6.2.1 Overall use of cognitive processes. Table 6.2 shows the frequencies of the
cognitive processes that were reported as utilised by the students when answering the
MCQs. Overall, nine cognitive processes were identified. As can be seen from the shaded
cells, the interviewees used different combinations of cognitive processes to answer
questions that were intended to test different listening subskills. The yellow cell
highlights the most frequently reported cognitive process employed for any particular
listening subskill. It seems that the reported cognitive processes accord with the expert
prediction of the targeted listening subskill, thus providing prima facie validity evidence
for the DELTA listening test.
Table 6.2: Number of cognitive processes used for each subskill
Cognitive Processes SSK1 SSK2
SSK3
SSK4
SSK5
SSK6
Recognising explicit information 538 13 10 9 7 1 Summarising ideas across a chunk of speech 8 58 2 0 1 2
Making an inference 18 14 57 13 28 15 Using co-text/contexts to understand unknown words or phrases 0 1 0 53 1 0
Interpreting about the speaker’s attitude 1 2 3 2 29 3
Inferring about the speaker’s reasoning 0 0 0 0 1 24
Detecting key words 97 38 83 23 38 46 Connecting related information 7 10 2 1 3 2 Relating to prior knowledge 2 1 0 0 0 0 Note: Generally, the highlighted figures indicate the most frequently reported cognitive process employed for that particular listening subskill.
6.2.1.1 Key cognitive processes. In order to gain a more in-depth evaluation of the
relationship between listening subskills and cognitive processes, a chi square test was
adopted examine the two categorical variables of interest. Three cognitive processes (i.e.,
detecting key words, connecting related information, and relating to prior knowledge)
were left out from this analysis because no specific patterns could be identified with them
in relation to the subskills. There were 6 variables in listening subskills and 6 variables in
cognitive processes. As the data issues were unforeseen and it was only after reflecting
on the evidenced collected, a supplementary research question (SuppRQa: Is there a

125
statistically significant relationship between the six listening subskills and the six
cognitive processes?) was formulated and answers attempted at this stage. The data
analysis procedure is shown below.
Because there were a number of zero cell counts in the raw data set, which were
likely to invalidate the sampling distribution, a bootstrap procedure was employed to
generate a sampling distribution based on the observed data by resampling data with
replacement from the original data set. According to the SPSS manual, “bootstrapping
uses listwise deletion to determine the case basis; that is, cases with missing values on
any of the analysis variables are deleted from the analysis” (SPSS Statistics 24.0.0,
https://www.ibm.com/support/knowledgecenter/en/SSLVMB_24.0.0/spss/bootstrapping
/bootstrap_analysis.html). Two bootstrapping procecures were employed, namely 10,000
and 5,000 bootstrapped samples of the same size in the study were draw and test statistics
were computer accordingly with SPSS 24.0 programme.
However, as was shown by the warning message in SPSS, “the total number of
pivot table cells across split files [in the 10,000 bootstrap sampling analysis] exceeds
20000000”, the chi-squre test results and the symmetric measures were not succussfully
computed. Alternatively, the 5,000 sampling bootstrap procedure was attempted and the
chi-square and symmetric measures were obtained. As suggested in an email by Prof
Mortiz Heene (personal communication, 27 July, 2018, “people usually use about 1,000
bootstrapped samples”, therefore, 5,000 bootstrapped samples should be sufficient
enough for the purpose of this study.” The results from this analysis are shown in Table
6.3, Table 6.4. Table 6.5 and Table 6.6.
As is shown in Table 6.4, the percentage of expected values less than 5 is 41.7%,
i.e., over 25%, the exact test was adopted for examining significance. The results show
that the Pearson chi-square is 2197.12 (d.f. = 25), p-value = 0.000. This result is
significant at p < 0.001. As the dataset adopted a 6x6 design, the Cramer’s V was also
used to examine the effect size of the association. According to Gravetter & Wallnau
(2007), Cramer’s V estimates the association between two categorical variables
consisting of more than two levels on a scale from 0 to 1. While zero indicates the
variables are not associated, close to one suggests strong association. To be more specific,
a value within the range of 0.07 – 0.21 indicates a small effect, a value within the range
of 0.21 – 0.35 indicates a medium effect, and a value larger than 0.35 indicates a large

126
Table 6.3: Cognitive processes * Subskills crosstabulation
Subskills
Total SSK1 SSK2 SSK3 SSK4 SSK5 SSK6 Cognitive Processes
Recognising explicit information
Count 538 12 10 9 7 1 577 Expected Count 357.1 55.0 45.5 48.7 42.3 28.4 577.0 % within Cognitive Processes
93.2% 2.1% 1.7% 1.6% 1.2% 0.2% 100.0%
% within Subskills 95.2% 13.8% 13.9% 11.7% 10.4% 2.2% 63.2% Standardized Residual 9.6 -5.8 -5.3 -5.7 -5.4 -5.1
Summarising ideas across a chunk of speech
Count 8 58 2 0 1 2 71 Expected Count 43.9 6.8 5.6 6.0 5.2 3.5 71.0 % within Cognitive Processes
11.3% 81.7% 2.8% 0.0% 1.4% 2.8% 100.0%
% within Subskills 1.4% 66.7% 2.8% 0.0% 1.5% 4.4% 7.8% Standardized Residual -5.4 19.7 -1.5 -2.4 -1.8 -.8
Making an inference
Count 18 14 57 13 28 15 145 Expected Count 89.7 13.8 11.4 12.2 10.6 7.1 145.0 % within Cognitive Processes
12.4% 9.7% 39.3% 9.0% 19.3% 10.3% 100.0%
% within Subskills 3.2% 16.1% 79.2% 16.9% 41.8% 33.3% 15.9% Standardized Residual -7.6 .0 13.5 .2 5.3 2.9
Using co-text/contexts to understand
Count 0 1 0 53 1 0 55 Expected Count 34.0 5.2 4.3 4.6 4.0 2.7 55.0 % within Cognitive Processes
0.0% 1.8% 0.0% 96.4% 1.8% 0.0% 100.0%

127
unknown words or phrases
% within Subskills 0.0% 1.1% 0.0% 68.8% 1.5% 0.0% 6.0% Standardized Residual -5.8 -1.9 -2.1 22.5 -1.5 -1.6
Interpreting about the speaker’s attitude
Count 1 2 3 2 29 3 40 Expected Count 24.8 3.8 3.2 3.4 2.9 2.0 40.0 % within Cognitive Processes
2.5% 5.0% 7.5% 5.0% 72.5% 7.5% 100.0%
% within Subskills 0.2% 2.3% 4.2% 2.6% 43.3% 6.7% 4.4% Standardized Residual -4.8 -.9 -.1 -.7 15.2 .7
Inferring about the speaker's reasoning
Count 0 0 0 0 1 24 25 Expected Count 15.5 2.4 2.0 2.1 1.8 1.2 25.0 % within Cognitive Processes
0.0% 0.0% 0.0% 0.0% 4.0% 96.0% 100.0%
% within Subskills 0.0% 0.0% 0.0% 0.0% 1.5% 53.3% 2.7% Standardized Residual -3.9 -1.5 -1.4 -1.5 -.6 20.5
Total Count 565 87 72 77 67 45 913 Expected Count 565.0 87.0 72.0 77.0 67.0 45.0 913.0 % within Cognitive Processes
61.9% 9.5% 7.9% 8.4% 7.3% 4.9% 100.0%
% within Subskills 100.0% 100.0% 100.0% 100.0% 100.0% 100.0% 100.0%

128
Table 6.4: Cognitive processes chi-square tests
Value df
Asymptotic Significance
(2-sided) Pearson Chi-Square 2197.133a 25 .000 Likelihood Ratio 1245.364 25 .000 Linear-by-Linear Association
630.702 1 .000
N of Valid Cases 913 Note: a. 15 cells (41.7%) have expected count less than 5. The minimum expected count is 1.23.
Table 6.5: Cognitive processes symmetric measures
Value Approximate Significance
Nominal by Nominal Cramer's V .694 .000 N of Valid Cases 913
Table 6.6: Cognitive processes Bootstrap for Symmetric Measures
Value
Bootstrapa
Bias Std. Error
BCa 95% Confidence Interval
Lower Upper Nominal by Nominal
Cramer's V .694 .002 .020 .654 .738
N of Valid Cases 913 0 0 . . a. Unless otherwise noted, bootstrap results are based on 5000 bootstrap samples
effect (Cohen, 1988). The Cramer’s V value in Table 6.6 is 0.694 with an approximate
significance of 0.000 and shows the overall association measure of the two variables is
very strong (Heene, personal communication, 27 July 2018). The bootstrapped 95%
confidence interval are both positive, suggesting that overall, the relationship between the
cognitive processes and the listening subskills is statistically significant (p < 0.001).
The standardized residuals (i.e, z-values) in the Crosstabulation table (Table 6.3)
are another indication of the relationship between the two categorical variables in
question. A z-value greater than |1.96| suggests a significant relationship (p < .05).

129
Whereas a significant positive z-value indicates there are more cases than expected, a
significant negative z-value indicates there are fewer cases than expected. The
standardized residuals therefore suggest that there are significantly positive association
between ‘recognizing explicit information’ and SSK1 (9.6), ‘summarising ideas across a
chunk of speech’ and SSK2 (19.7), ‘making an inference’ and SSK3 (13.5), SSK5 (5.3)
and SSK6 (2.9), ‘using co-text/contexts to understand unknown words or phrases’ and
SSK4 (22.5), ‘Interpreting about the speaker’s attitude’ and SSK5 (15.2), ‘inferring about
the speaker’s reasoning’ and SSK6 (20.5). Although it seems SSK5 and SSK6 are
respectively associated with two cognitive processes, the association measures are much
larger in the ‘Interpreting about the speaker’s attitude’ and ‘inferring about the speaker’s
reasoning’.
6.2.1.2 An ensemble of cognitive processes. Apart from the six salient cognitive
processes, ‘detecting key words’, ‘connecting related information’, and ‘relating to prior
knowledge’ were also identified for each subskill and the first two were somehow evenly
shared across the subskills. When observed within each subskill, it is revealed that, in
addition to the key targeted cognitive process, each subskill was associated with several
other cognitive processes though those numbers are limited. For example, SSK1 is related
to these cognitive processes – ‘summarising ideas across texts’, ‘making an inference’,
‘inferring about speaker’s attitude’, ‘detecting key words’, ‘connecting related
information’, and ‘relating to prior knowledge’ This finding tends to suggest that
answering listening questions requires an ensemble of cognitive processes, and listening
subskills are interactive and independent in their functions in listening comprehension.
6.2.2 Overall use of test-taking strategies. Given that the respondents verbalized
their thought processes for answering the listening questions, including what they heard,
what they thought and how they figured out the answers, it is reasonable to discover that
apart from the intended cognitive processes, a wide range of off-track test-taking
strategies were identified from the SRP interviews. These were then categorised under
two major themes – elimination and guessing. Using ‘irrelevant or incorrect information’
and ‘hearing the words similar to the option’ were found to be the most frequently
reported elimination and guessing strategies, respectively. The following section
describes the most frequently used strategies in relation to each listening subskill.

130
Table 6.7: Use of elimination strategies by subskill
SSK1 SSK2 SSK3 SSK4 SSK5 SSK6 Based on overall understanding of the recording 6 2 0 0 4 3 Based on previous test experience 1 0 0 0 0 0 Based on real world knowledge and logical thinking 39 16 21 9 7 12 Having unknown words in the option 17 7 10 7 4 4 Irrelevant or incorrect information 74 45 31 23 13 15 Not mentioned by the speaker 51 18 22 6 6 10 Not the best or most important 0 0 2 2 0 2 Similar meaning in options 6 2 1 0 1 0 The option contains absolute meaning 5 1 0 0 1 2 The option looks common or usual 0 0 0 0 0 1 Total 199 91 87 47 36 49
Table 6.8: Use of guessing strategies by subskill
SSK1 SSK2 SSK3 SSK4 SSK5 SSK6 Comparing the best answer for the question 15 2 3 7 2 1 First or last or repeated point the speaker mentioned 17 12 2 0 2 2 Having known or unknown words 3 0 2 0 2 1 Hearing the words similar to the option 66 26 15 15 8 13 Using common sense or personal knowledge 21 9 11 5 5 0 Using information from other questions to infer or confirm 3 2 1 2 2 0 Using overall understanding of the speech to guess particular items 9 5 11 1 1 2 Using the speaker's tone 1 3 2 4 1 0 Wild guess 10 6 3 4 2 2 Total 145 65 50 38 25 21

131
6.2.2.1 Elimination strategies. A consistent pattern was found in the use of
elimination strategies (see Table 6.7). While a total number of nine elimination strategies
were reported to have been used by the interviewees, not all of them were applied to each
subskill. Three were found to be dominant (accounting up to over 72.2% of the total
number of elimination strategies), including ‘irrelevant or incorrect information’, ‘not
mentioned by the speaker’, and ‘based on real world knowledge and logical’. Conversely,
the remainder were applied occasionally in particular subskills and frequency of use can
be negligible.
6.2.2.2 Guessing strategies. In addition to the elimination strategies, the
interviewees also reported the use of guessing (see Table 6.8), especially when they found
little information in the spoken input comprehensible, although the pattern tends to be
more complicated. Unlike the elimination strategies, almost all of the nine guessing
strategies were applied when the subjects were answering questions on the six listening
subskills; similar to the elimination strategies, within each subskill two to three dominant
guessing strategies were used while the occurrences of others were relatively low.
Seen across the subskills, ‘hearing the words similar to the option’, ‘comparing
the best answer for the question’, ‘using overall understanding of the speech to guess
particular items’, and ‘wild guess’ were commonly applied to all six subskills, although
‘hearing the words similar to the option’ was the most frequent. Within each subskill,
apart from the top used strategy for all subskills – ‘hearing the words similar to the option’,
another two most frequently adopted guessing strategies for SSK1 and SSK2 were ‘first
or last or repeated point the speaker mentioned’ and ‘using common sense or personal
knowledge’; for SSK3 ‘using common sense or personal knowledge’ and ‘using overall
understanding of the speech to guess particular items’; and, for SSK4 ‘comparing the best
answer for the question’ and ‘using common sense or personal knowledge’.
A supplementary research question (SuppRQb: Is there a relationship between the
listening subskills and the cognitive processes?) was also formulated in order to examine
the relationship between test-taking strategies (elimination and guessing) and listening
subskills. The results of the chi square test show that there was no statistically significant
association between the two variables (see Table 6.9-6.11).

132
Table 6.9: Test-taking strategies * Subskills crosstabulation
Subskills
Total SSK1 SSK2 SSK3 SSK4 SSK5 SSK6 Test-taking strategies
Elimination
Count 199 91 87 47 36 49 509 Expected Count 205.3 93.1 81.8 50.7 36.4 41.8 509.0 % within Test-taking strategies
39.1%
17.9%
17.1%
9.2% 7.1% 9.6% 100.0%
Standardized Residual
-.4 -.2 .6 -.5 -.1 1.1
Guessing Count 145 65 50 38 25 21 344 Expected Count 138.7 62.9 55.2 34.3 24.6 28.2 344.0 % within Test-taking strategies
42.2%
18.9%
14.5%
11.0%
7.3% 6.1% 100.0%
Standardized Residual
.5 .3 -.7 .6 .1 -1.4
Total Count 344 156 137 85 61 70 853 Expected Count 344.0 156.0 137.0 85.0 61.0 70.0 853.0 % within Test-taking strategies
40.3%
18.3%
16.1%
10.0%
7.2% 8.2% 100.0%
Table 6.10: Test-taking strategies chi-square tests
Value df
Asymptotic Significance (2-sided)
Exact Sig. (2-sided)
Exact Sig. (1-sided)
Point Probability
Pearson Chi-Square 5.218a 5 .390 .391 Likelihood Ratio 5.333 5 .377 .380 Fisher's Exact Test 5.246 .387 Linear-by-Linear Association
1.843b 1 .175 .179 .091 .007
N of Valid Cases 853 a. 0 cells (.0%) have expected count less than 5. The minimum expected count is 24.60. b. The standardized statistic is -1.358.
Table 6.11: Test-taking strategies symmetric measures
Value Approximate Significance
Exact Significance
Nominal by Nominal
Phi .078 .390 .391 Cramer's V .078 .390 .391
N of Valid Cases 853

133
6.2.3 Comparison between cognitive processes and test-taking strategies. A
series of comparison was then undertaken to investigate whether the use of cognitive
processes and test-taking strategies varies across ability groups. Given that this issue is
of only peripheral importance to the key research questions underlying this thesis, the
data are presented in a preliminary way, to see whether they appear to accord with the
main results so far. In that case, the results are presented in simple graphical plots of
counts of test-taking and cognitive strategies, and no tests of statistical significance were
undertaken.
Figure 6.3 Use of cognitive processes and test-taking strategies by different ability groups
Figure 6.3 plots the counts of the six cognitive processes and the two test-taking
strategies respectively on the y-axis and x-axis. The coloured squared and triangulated
symbols are used to represent the high ability and the low ability groups respectively in
the graph. It can be seen that all of the squares are on top of the 45 degree line, suggesting
the high ability students used more cognitive processes than test-taking strategies on all
subskills; two of the triangles are above the 45 degree line and the others are either on or
below the 45 degree line, suggesting low ability group used more cognitive processes for
SSK1 and SSK6, and more test-taking strategies for SSK2, SSK3, SSK4, and SSK5. In
addition, within the same subskill, the squares are all above the triangles, suggesting the
high ability group used more cognitive processes than did the low ability group. Most of
0
50
100
150
200
250
300
350
400
450
0 50 100 150 200 250 300 350 400 450
Cog
nitiv
e Pr
oces
ses
Test-taking Strategies
Low Ability
High Ability
Linear (45 degree)

134
the triangles are right to the squares, showing the low ability group used more test-taking
strategies for the subskills except SSK6 (in yellow).
6.2.3.1 Cognitive processes used by different groups. To look more closely into
the use of nine cognitive processes for each subskill by different groups, scatterplots
shown in Figure 6.4 were made to illustrate the comparison. It was found that: 1) overall,
the plot points are above the 45 degree lines, showing that the high ability group used
most of cognitive processes more often than the low ability group for most of the subskills;
and 2) a limited number of cases whereby the low ability group used more cognitive
processes were identified, including:
- SSK1: inferring about the speaker’s reasoning (1, 0), detecting key words
(49, 48), and relating to prior knowledge (2, 0)
- SSK2: connecting related information (7, 3)
- SSK4: making an inference (7, 6), detecting key words (14, 9), and
connecting related information (1, 0)
- SSK6: summarizing ideas across chunk of speech (2, 0), and inferring about
the speaker’s reasoning (13, 11).
6.2.3.2 Test-taking strategies used by different groups. Similarly, the counts of the
two test-taking strategies in relation to each subskill were also plotted in Figure 6.5 to
enable comparison between the two ability groups. It can be observed that:
1) All of the crosses are below the 45 degree line, indicating the low ability students
used more guessing strategies than the high ability group for all the subskills. This might
allude to their failure in comprehension, thus resorting to guessing. By contrast, two of
the circles are below the 45 degree line, suggesting high ability group used elimination
strategies for the two subskills – SSK2 and SSK6 – more often than the low ability group
did.

135
Figure 6.4 Use of cognitive processes by different groups
050
100150200250300350
0 50 100 150 200 250 300 350
Hig
h Ab
ility
Low Ability
Cognitive Processes for SSK1
0
5
10
15
20
25
30
35
0 5 10 15 20 25 30 35
Hig
h Ab
ility
Low Ability
Cognitive Processes for SSK2
0
10
20
30
40
50
0 10 20 30 40 50
Hig
h Ab
ility
Low Ability
Cognitive Processes for SSK3
0
5
10
15
20
25
30
0 5 10 15 20 25 30
Hig
h Ab
ility
Low Ability
Cognitive Processes for SSK4
0
5
10
15
20
0 5 10 15 20
Hig
h Ab
ility
Low Ability
Cognitive Processes for SSK5
05
101520253035
0 5 10 15 20 25 30 35
Hig
h Ab
ility
Low Ability
Cognitive Processes for SSK6

136
Figure 6.5 Use of test-taking strategies by different groups
This tends to suggest partial understanding of the listening input, which led to their
strategy of elimination of distractors.
2) Within the same subskill, vertically, the circles are all directly above the crosses,
suggesting for all the subskills the high ability group used the elimination strategies more
often than the guessing strategies; horizontally, only one cross is to the right of the circles,
showing the low ability group used more guessing than elimination for this subskill –
SSK2, and equal (SSK6) or more use of elimination strategies than guessing strategies
for the SSK1, SSK3, SSK4, and SSK5.
6.2.4 SRP misfitting persons’ use of cognitive processes and test-taking
strategies. As stated previously, misfitting persons’ might be expected to apply construct-
irrelevant or off-track techniques to answer questions, so, the examination of their use of
test-taking strategies could be fruitful. Ten misfitting persons’ SPR data were drawn for
comparison between the use of cognitive processes and test-takings in relation to subskills.
As is shown in Table 6.12, the overall pattern of cognitive process use is similar to the
pattern of the whole SRP sample, that is, the use of cognitive processes matches the
intended listening subskill.
0
20
40
60
80
100
120
0 50 100
High
Abi
lity
Low Ability
Elimination
Guessing
Linear (45 Degree)

137
Table 6.12: Misfitting SRP interviewees’ use of cognitive processes versus subskills
SSK
1 SSK
2 SSK
3 SSK
4 SSK
5 SSK
6 Recognising explicit information 60 0 0 0 0 0 Summarising ideas across a chunk of speech
3 11 1 0 0 0
Making an inference 1 1 6 1 4 0 Using cotext-contexts to understand unknown words or phrases
0 0 0 6 0 0
Interpreting about the speaker’s attitude 0 0 1 0 4 0
Inferring about the speaker's reasoning 0 0 0 0 1 7
Detecting key words 12 3 7 2 4 7
Connecting related information 1 4 0 0 2 0
Relating to prior knowledge 1 0 0 0 0 0
Further, the use of test-taking strategies is similar to that of the whole SRP sample
(see Table 6.13). The most frequently used elimination strategies for SSK1 and SSK3
was ‘not mentioned by the speaker’, for SSK2, SSK4 and SSK6 was ‘irrelevant
information or incorrect answer’, and for SSK5 is ‘based on real world knowledge and
logical thinking’. The second and third most frequently used strategies for SSK1 are
‘irrelevant information or incorrect answer’ and ‘based on real world knowledge and
logical thinking’. Although it seems for the other subskills, other elimination strategies
were sparsely employed and only a couple of cases were identified for each, it can still be
found that the interviewees tended to rely on these four elimination strategies: ‘based on
real world knowledge and logical thinking’, ‘having unknown words in the option’,
‘irrelevant information or incorrect answer’, and ‘not mentioned by the speaker’.
In the same vein, the use of guessing strategies by the misfitting SPR interviewees
is slightly different from that of the whole SRP sample. The most frequently used
guessing strategy for SSK1, SSK2, SSK5 and SSK6 (10, 5, 3, and 4 cases respectively)
was ‘hearing the words similar to the option’, for SSK3 is ‘Using overall understanding
of the speech to guess particular items’, and for SSK4 is ‘using the speaker’s tone’, of
which only two cases were found.

138
Table 6.13 Misfitting SRP interviewees’ use of test-taking strategies by subskills
SSK
1 SSK
2 SSK
3 SSK
4 SSK
5 SSK
6 Based on overall understanding of the recording 2 0 0 0 0 1
Based on previous test experience 1 0 0 0 0 0 Based on real world knowledge and logical thinking 6 0 2 1 3 2
Having unknown words in the option 5 2 2 1 0 2 Irrelevant information or incorrect answer 7 7 2 2 2 3
Not mentioned by the speaker 10 1 4 1 0 2 Not the best or most important 0 0 1 0 0 0 Similar meaning in options 0 0 0 0 0 0 The option contains absolute meaning 0 0 0 0 0 1 The option looks common or usual 0 0 0 0 0 1 Total Elimination 31 10 11 5 5 12 Compare the best answer for the question 1 0 0 1 0 0 First or last or repeated point the speaker mentioned 2 4 0 0 0 0
Having known or unknown words 1 0 0 0 1 0 Hearing the words heard similar to the option 10 5 1 1 3 4
Using common sense or personal knowledge 7 1 0 1 0 0
Using information from other questions to infer or confirm 2 0 0 0 0 0
Using overall understanding of the speech to guess particular items 3 1 5 0 0 2
Using the speaker's tone 0 1 1 2 0 0 Wild guess 2 0 0 0 0 1 Total Guessing 28 12 7 5 4 7
6.2.4.1 Use of cognitive processes versus test-taking strategies by misfitting SRP
interviewees. Figure 6.6 compares the use of cognitive processes and test-taking
strategies by the misfitting SPR interviewees. It is found that, except SSK1 and SSK5 for
which more occurrences of cognitive processes were identified, test-taking strategies
were more frequently used for SSK2, SSK3, SSK4 and SSK6. This seems to imply that
the misfitting persons would tend to use more test-taking strategies in most of the
subskills.

139
As there was only one high ability and nine low ability SPR interviewees who
were misfitting in the SRP listening test, the average use of CPs were compared for each
subskill. As shown in Table 6.14, for SSK1, the high ability person used ‘recognising
explicit information’ as well as ‘summarising ideas across a chunk of speech’, and
‘detecting key words’ while the low ability group only used ‘recognising explicit
information’ and ‘detecting key words’. The greatest difference lies in SSK5, whereby
Figure 6.6 Use of cognitive processes and test-taking strategies by the misfitting SRP interviewees
Table 6.14: Misfitting SRP interviewees’ use of cognitive processes by ability groups
SSK1 SSK2 SSK3 SSK4 SSK5
SSK6
Recognising explicit information 2/6 0 0 0 0 0 Summarising ideas across a chunk of speech 2/0 2/1 0 0 0 0 Making an inference 0 0 1/1 1/0 1/0 0 Using cotext-contexts to understand unknown words or phrases 0 0 0 1/1 0 0 Interpreting about the speaker’s attitude 0 0 0 0 3/0 0 Inferring about the speaker's reasoning 0 0 0 0 0 2/0 Detecting key words 1/1 0 1/1 0 1/0 1/0 Connecting related information 0 1/0 0 0 1/0 0 Relating to prior knowledge 0 0 0 0 0 0 Note: The figures in column 2-7 indicate the number of cognitive processes used by the high and the low ability group respectively for that particular subskill.
78
1915
915 14
59
2218
10 9
19
0
10
20
30
40
50
60
70
80
90
SSK1 SSK2 SSK3 SSK4 SSK5 SSK6
Cognitive Processes Test-taking strategies

140
the high-ability interviewee used four cognitive processes to tackle the subskill whereas
the low-ability group used none of the cognitive processes.
In terms of test-taking strategies, it was found that the high ability person used
more elimination strategies for SSK5 and SSK6 whereas the low-ability group used them
for SSK3 and SSK4. In terms of the guessing strategies, the high ability person used
‘hearing the words similar to the option’ only for SSK2 whereas the low ability group
used different guessing strategies for all the six subskills except SSK5 (see Table 6.15).
Table 6.15: Misfitting SRP interviewees’ use of test-taking strategies by ability groups
SSK
1 SSK
2 SSK
3 SSK
4 SSK
5 SSK
6 Based on overall understanding of the recording 0 0 0 0 0 0 Based on previous test experience 0 0 0 0 0 0 Based on real world knowledge and logical thinking 1/1 0 0 0 0 1/0 Having unknown words in the option 0/1 0 0 0 0 1/0 Irrelevant information or incorrect answer 2/1 1/1 0 0 2/0 0 Not mentioned by the speaker 0/1 0 0 0 0 0 Not the best or most important 0 0 0 0 0 0 Similar meaning in options 0 0 0 0 0 0 The option contains absolute meaning 0 0 0 0 0 0 The option looks common or usual 0 0 0 0 0 0 Total Elimination 3/3 1/1 0/1 0/1 2/0 2/1 Compare the best answer for the question 0 0 0 0 0 0 First or last or repeated point the speaker mentioned 0 0 0 0 0 0 Having known or unknown words 0 0 0 0 0 0 Hearing the words heard similar to the option 0/1 2/0 0 0 0 0 Using common sense or personal knowledge 0/1 0 0 0 0 0 Using information from other questions to infer or confirm 0 0 0 0 0 0 Using overall understanding of the speech to guess particular items 0 0 0/1 0 0 0 Using the speaker's tone 0 0 0 0 0 0 Wild guess 0 0 0 0 0 0 Total Guessing 0/3 2/1 0/1 0/1 0 0/1
Note: The figures in column 2-7 indicate the number of test-taking strategies used by the high and the low ability group respectively for that particular subskill.

141
6.3 Summary
To summarise, this chapter has reported the results of the SRP listening test and
interviews. One major finding from the listening test is that the SRP listening test results
are reliable and consistent across the two Winsteps analyses and therefore can be used for
subsequent SRP ability grouping and interview data analysis. A number of misfitting
persons were also identified in the SPR listening test, which were then examined through
interview data to shed light on the understanding of their thought processes.
Results from the SRP interview data provide further answers to RQ1 (What are
the cognitive processes or listening subskills that underlie student performance on the
DELTA listening component?), thus offering further empirical justification for the
cognitive validity to the DELTA listening test. It was found that an ensemble of cognitive
processes were used to answer the listening items and the highest occurrences of cognitive
processes correspond with targeted subskills in the DELTA listening test. There are also
shared use of cognitive processes between the subskills. One cognitive process can be
applied to answer questions that assess different subskills. In addition to the cognitive
processes, two major test-taking strategies (e.g., elimination and guessing) were found in
the interviews. Two supplementary research questions were proposed to examine the
significance of the relationship between cognitive processes and listening subskills, and
between test-taking strategies and listening subskills, respectively. The results show that
the six key cognitive processes were strongly associated with listening subskills whereas
the test-taking strategies were not. Comparisons between the high and low ability groups
reveal that the high ability group used most of the cognitive processes more often than
the low ability group for all of the subskills, and high ability students used elimination
strategies more than guessing strategies.

142
CHAPTER SEVEN
DISCUSSION AND CONCLUSION
7.1 Introduction
This chapter will first reiterate the purpose of the study, restate the research
questions, then summarise and discuss key findings from both the qualitative and
quantitative data to address the research questions one by one. Next, it will assess the
similarities and discrepancies between the study and existing literature. It will discuss the
contributions and implications the study has made for the theory of listening
comprehension and the future of the DELTA listening component. Limitations and
further research will then be discussed.
Although various theories about the listening comprehension processes have been
proposed, there is neither well-established theory nor solid empirical evidence about the
set of listening subskills that underlie diagnostic English language assessment. Their
relative difficulty levels and interactions with different spoken genres are also unknown.
The purpose of this study was to use a theory-driven analysis of the DELTA testing data
listening component in order to understand how the (listening subskills) intents of the
examiners are dealt with by the students and whether the cognitive processes students
used matched the intent of the examiners. Four research questions were formulated to
guide this study:
RQ1: What are the cognitive processes or listening subskills that underlie student
performance on the DELTA listening component?
RQ2: Are the DELTA listening subskills measurably identifiable and divisible from
each other?
RQ3: What is the hierarchical order of the DELTA listening subskills?
RQ4: Do the DELTA listening subskill difficulties vary across different text types?
Does the hierarchical order vary across text types?
A multi-method approach was adopted for both data collection and analyses. The
test data from the DELTA listening items based on subskills were analysed quantitatively
using the Rasch model for measurement. The stimulated recall data obtained from

143
students’ retrospection about their cognitive processing of the listening recordings and
questions were dealt with qualitatively. This provides for the triangulation of the
quantitative data about the listening subskills with the qualitative data about the cognitive
processes. Because the DELTA test was set up as a legislated diagnostic assessment of
the English language for first year and subsequent students who use Chinese as the first
language for university entrance in Hong Kong, but not for the purpose of my study, the
quantitative data did not satisfy all the requirements for connectivity of the MFRM model,
and required a further triangulation within the quantitative section, between a number of
complementary Rasch measurement estimation techniques. Although various analytical
techniques were adopted, consistent results did emerge in terms of the difficulty level and
hierarchical order of the listening subskills.
The following sections summarise the key findings of the study to address each
of the research questions in turn, including comparisons of these findings with previous
literature contributions; and implications of the study will be discussed.
7.2 Cognitive Processes and Test-taking Strategies Underlying DELTA Listening
Component
The study sought to understand the nature of listening comprehension, thereby
contributing to the construct validity of ESL listening assessment by addressing RQ1:
What are the cognitive processes or listening subskills that underlie student performance
on the DELTA listening component? The qualitative SRP data collection was designed
to elicit thought processes of 62 examinees from three Hong Kong universities who
completed the listening component of the DELTA assessment. The objective was to
investigate what the DELTA examinees do cognitively during the test, and whether their
cognitive processes match / differ from the intended listening subskills anticipated by the
DELTA item writers. The findings show that as well as a set of cognitive processes that
correspond well to the listening subskills, the reported deployment of the cognitive
processes was more complicated, as a suite of test-taking strategies were also utilised in
completing the DELTA listening component. On the one hand these findings provide
empirical evidence to the theoretical hypothesis of the nature of listening comprehension,
and on the other offer meaningful practical insights for the development of future
diagnostic English listening assessment.

144
7.2.1 Dominant cognitive processes. Generally, nine cognitive processes were
identified to have been utilised by the SRP respondents to understand the DELTA
listening texts, including recognizing explicit information, summarizing ideas across a
chunk of speech, making an inference, using co-text/context to understand unknown
words or phrases, interpreting about the speaker’s attitude, inferring about the speaker’s
reasoning, detecting key words, connecting related information, and relating to prior
knowledge.
However, six of these processes were found to be in dominant use in the test. The
highest incidences of six key cognitive processes correspond with the six targeted
subskills in the construction of the DELTA listening items. For example, for SSK1
(identifying specific information), although five cognitive processes were subsumed
under it, the overwhelming number (538) of the recognising explicit information process
far exceeds all of the others. This is, in part, due to the comparatively large number of
SSK1 listening items in the data set; but, the stimulated recall data also suggest that many
examinees can detect more than one information source in the listening input to tackle
that particular item. The multiple-choice questions of the DELTA listening component
include four response options. To answer a question on identifying specific information,
examinees reported that they could detect all the related details from the recording to
match with or eliminate from considering the four options. This strong evidence of
correctly matching the recorded information with the options for listening comprehension
suggests that the examinees were using the intended listening subskill (identifying
specific information) during their test performance.
7.2.1.1 Recognising explicit information. The most frequently reported cognitive
process in the SRP protocols is recognizing explicit information, which corresponds with
SSK 1 (identifying specific information). When dealing with questions addressing SSK1,
the examinees reported using this cognitive process either to identify the correct answer
or to distinguish competing information. This cognitive process is extensively used in the
test given that the item type is multiple-choice questions whereby examinees, while
listening would look for lexical overlap between the four options and the spoken input.
During the SRP, when hearing the specific message, the respondents would pause the
recording and tell the interviewer that they heard the exact words in the test options, or
they heard some words that carry similar meanings to the options, and thereby chose the

145
answer. This approach of matching the audio message with the test options provides a
good instantiation of the cognitive process and the listening subskill.
7.2.1.2 Summarising ideas across a chunk of speech. Summarising ideas across
a chunk of speech is a second cognitive process utilized by the examinees and in line with
SSK2 (understanding main idea and supporting ideas). This subskill requires listeners to
detect a number of specific information scattered in the listening input and to make further
syntheses to form a conclusion. In the SRP, some respondents could repeat the detailed
information they heard and then said the answer was a summary of those details. In
another example, a respondent would retell the story by saying “in the beginning they
said … then they … so I think… . ” When the interviewer asked if the answer was
explicitly said by the speaker, the respondent said “I just understand it from their
example”. Another respondent said she could not hear the answer or the details, but had
to relate the question to the whole recording. These examples all suggest that the
examinees were collecting information from different places of the recording to make an
information summary in order to answer the questions.
7.2.1.3 Making an inference. The third cognitive process, making an inference,
matches listening sub-skill SSK3 (understanding information and making an inference).
This requires the listener to recognize and understand the explicit information in the
listening input, and to use that information and background knowledge to infer an idea
that is not stated directly by the speaker. It can be seen from the SRP that this process was
used frequently with all DELTA subskills through logical reasoning, speaker’s tone, or
overall understanding of the content. For example, when answering questions about
forcefeeding, the respondent verbalized her thinking process:
Respondent 11: He already said forcefeeding should be applied to the patient, it
must mean that he thought it would make her get better.
Researcher: So the judge’s decision is to forcefeed the woman, right?
Respondent 11: Yes.
Researcher: Then how did you know he thought it would make her better?
Respondent 11: It’s quite like an inference. He made the decision, it couldn’t be
that he wants to harm her.

146
7.2.1.4 Using co-text/contexts to understand unknown words or phrases. This
cognitive process closely matches SSK4 (interpreting a word or phrase as used by the
listener). DELTA listening items testing SSK4 generally contain unfamiliar lexical items
including idioms or new words. To tackle the question, examinees have to identify the
unfamiliar lexical items in the listening input, understand the surrounding context, and
concurrently activate their linguistic knowledge including phonetic, vocabulary and
syntactic aspects to interpret the possible meaning of the unknown items.
7.2.1.5 Inferring about the speaker’s attitude. This cognitive process requires
listeners to make decisions about the speaker’s attitude or intention based on the literal
information and prosodic features such as tone or intonation that the speaker uses. In the
SRP, examinees would report that they chose the answer based on the words and the tone.
For example, in an item testing the speaker’s attitude towards a job interview, one
respondent said, “so I think she must be very tense, worried, clearly she hasn’t prepared
something about it. So I think the answer is C.” Another example about understanding
the tone the speaker used is to use the word “charming” thereby inferring her attitude.
Then a respondent said, “Here I heard the speaker say ‘charming’ suddenly, at that time
I really did not know what charming is, so this question I guessed again. I guessed C may
be the possible answer, because I think she wants to give her opinion on when people see
people suffering and feel happy. I think she is against these people, so I think she says
“charming” is something like ironic, so I choose C.” These examples tend to allude that
in order to infer attitude, understanding the prosodic features as well as the explicit
information in the aural input is critical.
7.2.1.6 Inferring about the speaker’s reasoning. This cognitive process is the
least used; perhaps because of the characteristics of the spoken input which contains a
large amount of information recognition but much less relationship interpretation or
inferencing.
Respondent 3: I chose D, because I might have used some logical thinking by
referring back to Q1, I think what the speaker wants to say in this
recording is mainly she wants to prove her point of view is right. Her
point of view is people can find happiness when they see people
suffering, so I think D is the most possible answer.
Researcher: What about B and C? There are some words about suffering or pain.

147
Respondent 3: I think the speaker gives out this example is to prove what she had
said previously. And what she said previously is people find
happiness when they see people suffering, so I would say D is the
most possible answer.
7.2.2 An ensemble of cognitive processes per listening subskill. Multiple
cognitive processes were used in conjunction to answer DELTA listening questions that
were intended to test particular listening subskills. In spite of the examiners’ intention to
focus on a single dominant subskill in each question, the SRP data showed that answering
each question required deployment of an ensemble of cognitive processes. This finding
resonates with previous views regarding the concurrence of listening skills or processes
to achieve an outcome (e.g., Dunkel, Henning, & Chaudron, 1993, cited by Goh &
Aryadoust, 2015; Yi, 2017). This finding is not surprising; it seems rather intuitive to
reckon that the same result can be achieved through diverse paths. This is reflected in two
scenarios. First, different examinees might employ different cognitive processes,
depending on their ability, background, et cetera. Second, any examinee might utilize a
range of cognitive processes for one particular item. This is demonstrated by the finding
of the study that high ability listeners tended to use most of the cognitive processes more
often than did the low ability listeners, and some could find more than one information
source to figure out the answer to a question.
7.2.3 Shared use of cognitive processes across listening subskills. In addition
to the six key cognitive processes that match the listening subskills which were the focus
of the DELTA test, additional cognitive processes were reported by the interviewees and
they are shared across the subskills, indicating that listening subskills are both interactive
and interdependent in their functions in listening comprehension (Goh & Aryadoust, 2015;
Buck et al., 1997). The identification of interaction attributes could lend support to the
argument that listeners use a number of subskills in comprehension, and it is difficult to
determine exactly which subskill is critical in answering any one particular question
(Brindley, 1997). The cognitive process – making an inference – was more evenly
distributed across all six subskills, suggesting inference making is used even when that is
not the explicit focus of the test item. Detecting key words was frequently related to all
subskills, and especially to ‘understanding information and making an inference’,
indicating that the ability to understand specific information (such as topic, time,
characters and so on) scattered through the listening input is significant for the making

148
inferences. This provides cognitive evidence for the Goh and Aryadoust (2015)
speculation that there is a general listening ability governing a set of listening subskills.
As was found in the current study, the identified cognitive processes did not occur
separately, but almost always in conjunction with others, so as to achieve a common
listening comprehension goal – finding the answer to the multiple-choice question.
Amongst all the identified cognitive processes, detecting key words is the second
most extensively used, and it co-occurred extensively with each subskill. This finding is
not surprising because it is a basic behaviour that listeners perform during listening
comprehension test no matter whether the listening purpose is to answer different types
of test items, multiple choice questions or to interact with others. It was found in the SPR
that the key words respondents most often detect related to the topic of the spoken input,
conjunctions indicating relationships between utterances, or cues giving clues to test
items, and so on. It can be seen that being able to identify the fundamental information as
hints of test items either facilitates or misdirects the interpretation and meaning-building
process.
Connecting related information is another commonly used cognitive process
involved across all the listening subskills. When using this cognitive process the
respondents tended to recall what they had heard previously, integrate it with the new
incoming message, evaluate both messages and then make a decision. For example, one
respondent said, “Before Michelle mentioned ‘are you real’, she mentioned ‘they’re not
different from their normal life.’” It is interesting, however, that there is only sporadic
report of using relating to prior knowledge in the SRP, which is in conflict with the
common belief that relating to prior knowledge should be a frequently used operation in
listening. Examination of the data reveals that in the SRP respondents explicitly stated
they had some knowledge about the topic or idea they were hearing, which helped them
comprehend the spoken input. This cognitive process differs from the test-taking strategy
– using common sense or personal knowledge to guess the answer, because in the
guessing scenario, instead of using prior knowledge to interpret the audio, the examinee
used it to make a judgement about the item options – whether they are correct or not.
Identification of these cognitive processes discussed above provides empirical
evidence for the previous proposition that EFL listening comprehension is an active
process that involves the interaction of multiple underlying sub-processes (Becker, 2016).

149
It is also compatible with Buck et al (1997) and Yi (2017) that more than one cognitive
attributes co-exist in one test item, which was validated by the Cognitive Diagnostic
Assessment Q-Matrix analysis. It should also be noted that although Yi (2017)
corroborated the varying contribution of the attributes (equivalent to cognitive processes
in the present study) to one item in the study, he pointed out that the weighting of different
attributes was still unknown and the order of contribution was likely to vary across items
and tests. Findings from the current study, however, provides supplementary evidence
that one cognitive process is significantly dominant while others might assist
comprehension in one way or another when examinees tackle one particular item.
7.2.4 Beyond RQ1 - Test-taking strategies: elimination and guessing. In
addition to the listening cognitive processes above, a suite of other strategies which
focused on test-taking (e.g., guessing and elimination) were reported by all SRP
interviewees. This finding provides supplementary evidence to the quantitative CDA
modelling to incorporate test-related facets in listening test and supports the argument
that (2018) that students’ performance relied on both listening-specific subskills and test-
related subskills (Aryadoust, 2018). The most adopted elimination strategies for all
subskills were to eliminate irrelevant or incorrect information. Judgement of incorrect
options is most likely to rely on its relevance to, or accordance with, the spoken input.
While Buck et al (1997) regarded it as an important attribute in relation to task
performance skills, in the context of this study, elimination of irrelevant or incorrect
information would be regarded as a test-taking strategy rather than as a construct-relevant
listening subskill required for successful comprehension. The second most used
elimination strategies for SSK1, SSK2 and SSK3 are not mentioned by the speaker,
whereas the strategy – based on real world knowledge and logical thinking – features for
SSK4, SSK5 and SSK6. The most frequently reported use of guessing is hearing the
words heard similar to the option. This is also a test-taking strategy typical of multiple-
choice questions and plays a vital role in this type of questions (Cheng, 2004). This
happened when the options were similar to the words they heard in the input. Test-
takerExaminees reported simply matching words or phrases they heard from the spoken
input with the options supplied even though they failed to understand what they had heard.
The second most used guessing strategy is using common sense or personal knowledge
to guess if the option was correct. The relevance of test-taking strategies to different
ability groups confirms the assumption that high level listeners would use more of

150
cognitive processes while low level listeners would rely heavily on test-taking strategies
to complete the test.
These test-taking strategies are relevant to test management strategies and test-
wiseness strategies as reviewed in Chapter 2, and have helped examinees to verify the
options and determine the answer to questions. Selection of the correct answer did not
necessarily mean full comprehension of the listening stimuli. Chinese learners of English,
including students in Hong Kong are generally believed to be exam-oriented and good at
using test-taking strategies to obtain high scores on tests. Multiple-choice questions such
as DELTA test have been found to be favoured by examinees over more open-ended
questions because the former could to a great extent facilitate comprehension of the
listening input (Cheng, 2004). It was revealed from the SRP reports that, many examinees
would take advantage of the 1-1.5 minutes previewing time before the recordings started
to quickly read through the questions and the options, highlighted the key words such as
what, when, where, compared and contrasted the options, and predicted about the topic
and the focus they need to pay attention to while listening. In this way, they analysed the
options, looked for lexical overlap between the stimuli and the options, eliminated the
incorrect options, and then chose the one left. According to Cheng (2004), being allowed
to preview questions and predict what was forthcoming before listening lowered their
anxiety and increased the rate of accuracy. However, the argument is, while this kind of
prediction could help lower listeners’ anxiety during test and increase the rate of accuracy
(Cheng, 2004), this study revealed that reliance on the given questions and options might
also lead to misunderstanding or distracting examinees to interpret the audio input
wrongly. As suggested by Goh (2002), using world knowledge to elaborate on the
meaning of the listening stimuli might generally be helpful, it is liable to become
unhelpful when the targeted knowledge is misplaced.
7.2.5 Comparison of cognitive process and test-taking strategy use between
high and low ability groups. The high ability group used most of cognitive processes
more often than did the low ability group for all of the listening subskills. In accordance
with the present result are previous studies which have demonstrated that higher achievers
reported using more cognitive strategies overall than did low achievers in high school
algebra tests, although only a few of them differentiated between high and low achievers
(Hong, Sas, & Sas, 2006). Previous studies of college students’ test-taking strategies
reported that high achievers engaged in activities for understanding, whereas low

151
achievers used more rehearsal strategies (Holschuh, 2000). This study, however,
indicated that the high ability listeners utilized both higher-level and lower-level
cognitive processes more frequently than did the low ability listeners. This could be due
to the nature of listening comprehension tests whereby understanding is built on the basis
of information recognition, interpretation, synthesis, and inferencing. As suggested by
Aryadoust (2015), high-ability listeners are able to comprehend texts of medium or high
difficulty and engage in multi-tasking such as storing the listening prompt in short
memory, processing the test items and selecting the answer. Lower ability listeners, in
contrast, given their deficiency in linguistic and non-linguistic knowledge, might not be
able to activate essential knowledge and skills to deal with the listening input and thus
fail to use the cognitive processes that are required for answering particular questions.
The high ability students used more elimination strategies than did the low ability
group; the high ability group used elimination strategies more often than guessing
strategies. These findings broadly endorse other studies in the area linking test-taking
strategy use with ability groups, which suggested that high achievers reported more use
of test-wiseness skills such as skipping difficult items, elimination strategies, and
anticipating answers to multiple choice items before reading the alternatives, to a higher
degree than lower achievers (Hong et al., 2006; Stenlund, Eklöf, & Lyrén, 2016). Because
high ability listeners understand and use the information source in the spoken input, this
enabled them to match the information with the options and discard incorrect options.
Conversely, the low ability group used more guessing than elimination for the
SSK2, equal use of guessing and elimination for SSK6, and more use of elimination
strategies than guessing strategies for the SSK1, SSK3, SSK4 and SSK5. These results
corroborate the ideas of Stenlund et al (2016), who found significant differences between
high and low achievers in terms of test-wiseness strategy use, and suggested that low
achievers reported random guessing to a higher extent if they did not know the answer to
an item.
For the SRP sub-group of misfitting persons from the Rasch analysis, the overall
use of cognitive processes is similar to that of the whole SRP sample and consistent with
the intended listening subskills.
The two sets of findings summarized above suggest that the use of cognitive
processes and test-taking strategies are related to overall listening proficiency. Listeners

152
with a higher listening proficiency tend to be able to utilize the intended listening subskills
to process listening input and tackle the questions. Within the elimination strategies, the
most frequent strategy used by the high ability group is irrelevant information or
incorrect answer, and not mentioned by the speaker, suggesting that the high ability
students use the information they heard from the listening prompt to make decisions on
the test item options. However, the low ability students would use ‘hearing the words
similar to the option’ and ‘using common sense or personal knowledge’ to judge the test
options, indicating that they did not understand the listening prompt and were randomly
guessing. This is supported by Aryadoust (2018) who suggested that elimination of
distractors relies on listeners’ understanding of the message they obtain from the passage.
The low-ability students did not understand the listening input, thus reporting
comparatively fewer cases of eliminating irrelevant information or incorrect answer and
not mentioned by the speaker. The use of eliminating irrelevant information or incorrect
answer and not mentioned by the speaker by the high-ability students also suggests that
they were actively involved in bottom-up processing as they could identify and decode
the details in the listening input to deal with the item options. In contrast, the low-ability
students tended to apply top-down processing in order to process the item options. An
implication might thus be drawn that test-taking strategies might not be entirely
independent from cognitive strategies. More informed data regarding to what extent
cognitive processes are used in the process of eliminating irrelevant information should
be obtained in future research.
7.3 Divisibility of DELTA Listening Subskills and Their Hierarchical Relationship
Notwithstanding the inherent limitations in DELTA online data collection and
testing arrangement, the triangulation approach of implementing a series of
complementary analytical strategies involving both the dichotomous and the many-facets
Rasch measurement model afforded the researcher the possibility of addressing the
research questions regarding the difficulty and the relationship of listening subskills: RQ2:
Are the DELTA listening subskills measurably identifiable and divisible from each other?
RQ3: What is the hierarchical order of the DELTA listening subskills?
7.3.1 Listening subskills are separable. The unidimensional property of the
DELTA listening component was confirmed through examination of the principal
component analysis and the fit statistics of the 207 listening items. Despite the adoption

153
of suite of Rasch analyses because of data disconnectivity, the prominent and consistent
finding shows that the DELTA listening subskills are mostly identifiable and separable
from each other with statistical significance. SSK1 (identifying specific information) can
always be identified and separated from other subskills in all the analyses. It is also the
case with SSK6 (inferring the speaker’s reasoning) in five out of the six analyses. SSK2
(understanding main idea and supporting ideas), SSK3 (understanding information and
making an inference), SSK4 (interpreting a word or phrase as used by the speaker) and
SSK5 (interpreting the intention or attitude of the speaker) can be distinguished from each
other in most of the Facets analyses but not the Winsteps analyses.
This finding provides considerable support to the componential approach that
listening comprehension consists of a set of subskills (Field, 1998, 2008b), and adds
further evidence to theory-based taxonomies of listening subskills proposed by different
scholars as set out in Chapter 2 (e.g., Munby, 1978; Lund, 1990; Richards, 1993). On the
empirical side, this finding is also in line with prior studies, although those adopted
different statistical approaches from the current study (Buck et al, 1997; Goh & Aryadoust,
2015; Lee & Sawaki, 2009; Shang, 2005; Song, 2008). While the previous taxonomies
included a wide range of micro-skills, the current study examined only six listening
subskills. However, it can be argued that these are the key subskills Hong Kong
undergraduate students are most often expected to encounter in their studies and in life
outside study (DELTA, 2012), thus affording important implications for the teaching and
assessment of English language as a foreign language (EFL) of Hong Kong learners.
7.3.2 The hierarchical order is established. Another significant finding from the
quantitative analyses relates to the hierarchical order of the listening subskills. First,
SSK1 (easiest) and SSK6 (most difficult) were consistently located at the extremes of the
subskill scale. Second, in four out of the five analyses SSK4 is easier than SSK2, and
SSK2 is easier than SSK3 and SSK5. The relationship between SSK3 and SSK5 is
undetermined. That is, SSK1<SSK4<SSK2<SSK3</=/>SSK5<SSK6. Hence, a scale of
the DELTA listening subskills is established.
SRP respondents further reported evidence that the answers to items testing SSK1
were straightforward and easy to answer.
Respondent 4: I think Q4 is the easy one, she said the exact how much the full
time students need to pay, I just clicked. This is the easiest question.

154
Respondent 34: Might be Q3 and Q1, because both of them have mentioned the
word directly and straightforward, and it's easier to understand and
get the answer.
Respondent 46: Q3 is most difficult because she didn't give the information
directly, just gave some information you need to digest and make
your own choice.
Respondent 50: But the men’s cooking question is a little bit difficult because I
need to think about the opposite, he only mentioned about women
in maths test, but men’s cooking is not directly mentioned by the
professor, so I need to think about it.
This finding accords with the results of most prior studies that subskills requiring
high-level processing of summarising and inferencing pose more challenges than do low-
level processing of identifying explicit information (e.g., Aryadoust, Goh, & Kim, 2012;
Hansen & Jensen, 1994; Shohamy & Inbar, 1991). On the contrary, Song (2005) found
that trivial (details) questions were most challenging regardless of listening proficiency,
and low-ability students were better on global questions than on local ones. According to
Buck et al (1997), summarising and inferencing subskills are more cognitively demanding
for listeners as they require not only detecting the specific information in the listening
prompt, but also employing personal knowledge to interpret the detected information and
make a decision, thus making the subskills more difficult. Goh and Aryadoust (2015)
provided empirical explanation of this relationship. Their confirmatory factor analysis
revealed that the ability to understand explicit information could predict the ability to
understand paraphrases and make inferences. This suggests the essential role of
understanding specific information in listening comprehension. Even though background
knowledge can facilitate understanding to some extent, it can be argued that without
sufficient comprehension of specific details of the listening input, the chances of accurate
comprehension would be slight.
SSK4 is easier than SSK2, which is easier than SSK3 and SSK5. SSK4 requires
listeners to interpret a word or phrase used by the speaker. It seems this type of vocabulary
subskill has been tested relatively less frequently in listening comprehension than in
reading comprehension. In spite of the often reported challenges caused by unknown
words in listening, this study found it is a less demanding subskill than the summarising

155
subskill. This might be attributed to the design of these two kinds of questions in DELTA.
In the audio, the clues to the vocabulary questions seem to be close to the lexical item
itself, or the speaker’s tone tends somewhat to alert the listener to pay attention to the
incoming message. On the other, the summarizing subskill SSK2 requires comprehension
of a more extended chunk of texts, and synthesis of the supporting ideas to arrive at a
summary, which is cognitively more demanding in terms of memorisation, retrieval and
meaning reconstruction.
7.4 The Relationship Between Text Type and Subskills and Their Hierarchy
Facets interaction analyses were conducted to examine the relationship between
text type (Conversation, Interview, and Lecture) and listening subskills to address RQ4.
Irrespective of the number of analyses due to the deficit in the data set, this study did not
find significant differences in SSK1 across these text types although previous studies
showed significant effect of text type on understanding local and detailed questions.
Shohamy and Inbar (1991) found that text type had increasing impacts on students’
performance on listening items from dialogues, lecturettes to news broadcasts. They
suggested that relatively loose and simple utterances in dialogues and lecturettes make
the input easier to listeners to process, therefore, the local questions from oral text type
are easier to answer.
The difficulty of SSK2 and SSK5, increased from Conversation, Interview to
Lecture. This is consistent with Shohamy & Inbar (1991) in that global questions from
the literate text type presented the most difficult test (Berne, 1993; Lebauer, 1984). The
difficulty of SSK3 increased significantly and substantively from Interview, and
Conversation to Lecture. The commonality of these three subskills is that they pose
greatest challenges in the context of lectures. As suggested by Song (2008, citing Olsen
& Huckin, 1990), being able to understand every word of a lecture does not mean
understanding its main points. On the one hand, the sheer amount of information in
lectures far exceeds that in conversations and interviews. On the other, the students might
not be aware of the academic discourse or structure of lectures in an EFL setting; in the
meantime, they have to rely more heavily on their prior and topical knowledge compared
to that in conversations or interviews (Flowerdew, 1994). Hence, they might have to make
greatest cognitive effort when dealing with questions in lectures.

156
The findings of SSK4 and SSK6 in relation to text types, however, seem to be
conflicting with the other subskills. They were found to cause greatest barrier in
conversations than in interviews and lectures. However, because of the relatively small
sample size for these two subskills when sub-divided into three text types, care should be
taken when claiming the impact of text type on these two subskills.
Because of the complexity in the interaction between text type and listening
subskills, it is difficult to identify an overarching hierarchical order of the six listening
subskills across the three text types. A general pattern, however, is that the difficulty
increased from SSK1, SSK2 to SSK6 irrespective of the text type, and this corresponds
to the general subskill hierarchy.
7.5 Contributions and Implications
7.5.1 Implications for theory, pedagogy and assessment of EFL listening. The
findings from this study make several contributions to the current literature. It has gone
some way to strengthen and expand our understanding of the nature of ESL listening
comprehension, and confirms the co-occurrence of multiple listening subskills as
hypothesized in previous scholarship. Apart from the widely researched subskills such as
understanding specific information and main ideas, and making inferences, this study
supplements the existing inventories of listening subskills with other important subskills:
interpreting a word or phrase as used by the speaker, interpreting an attitude or intention
of the speaker, and inferring about speaker’s reasoning. It addresses the issue of the extent
to which the DELTA listening component provides comprehensive representation of the
underlying theory of listening comprehension. The study further indicates that these
subskills are orderable in terms of difficulty. This finding makes contributions to the
existing taxonomies of listening subskills with an established hierarchy of the subskills.
It makes it possible to operationalize the componential or subskill approach to listening
instruction as teachers will have access to an established taxonomy of listening subskills.
In view of the substantial discrepancies between different spoken genres caused
by linguistic features and communicative purposes, and possible variations in the
activation of mental operations, this study has been one of the first attempts to examine
the impact of text type on listening subskills. Although no complete set of conclusive
findings can be drawn with regard to the hierarchical order of the identified listening
subskills, this study did confirm that the application of listening subskills varies across

157
text types, and that their difficulties alter accordingly in different genre contexts. It raises
the important point that interaction between text type and listening subskills is intricate
and involves numerous factors: lexico-grammatical characteristics, topics, question types,
and so on. These findings yield further pedagogical implications for listening course
designers and teachers that listening materials and instruction should integrate a number
of texts which encompass a variety of genres with differing degrees of comprehensibility.
For university students such as the Chinese ESL/EFL learners in Hong Kong, especially
those who studied in secondary schools where Chinese is the medium of instruction,
understanding lectures and communicating with teachers and classmates with overseas
backgrounds is a serious obstacle to their academic success (Evans & Bruce, 2011).
Therefore, it is vital that English enhancement programme in Hong Kong tertiary
institutions implement a genre-based curriculum to tailor for the needs of different
students.
The revelation of test-taking strategies in combination with the cognitive
processes to tackle particular listening subskills implies the indispensability of both
intended cognitive skills and test-taking strategies in language assessments. As indicated
by Xie (2011), test-takers perceived test-taking skills as necessary and supplementary to
intended language skills in the College English Test, which used to be a dominant
nationwide English language test held annually for university students in China before
2018 (Ministry of Education and National Language Commission of People’s Republic
of China, 2019). Whereas the identified cognitive processes provide cognitive validity to
the DELTA listening component, the reported test-taking strategies tend to suggest the
existence of contextual validity, which is caused by test-task characteristics. As reviewed
in Chapter 2, test performance is subject to the joint impact of both test-taker and test-
task characteristics (Bachman & Palmer, 1996). It is therefore worthwhile to reconsider
whether to regard these test-taking strategies as a vital element to test-taking process and
how to represent them more appropriately in test performance reporting.
7.5.2 Contributions to DELTA and listening test development. Evidence
favouring divisibility of DELTA listening subskills is useful because it could be used to
generate DELTA reports that provide a diagnostic profile regarding performance on
particular subskills. Examinees and teachers will benefit from the hierarchical trajectory
of the listening subskills as their relative performance on the subskills are determined so
that their strengths and weaknesses can be highlighted and prioritized.

158
The hierarchical relationship between the subskills is also useful for the
administration and operation of DELTA. Previously, the DELTA system used the pre-
determined difficulty levels based on experts’ subjective judgement about the linguistic
difficulty of the written script to set the difficulty level of listening texts. With the
availability of difficulty measures for all the listening items within one common frame of
reference, the difficulty level of each text can be gauged on one scale, and this will
facilitate the DELTA test designers to make more objective decisions so that assignment
of listening texts will become more appropriate and effective.
In terms of report generation, the tracking capacity of DELTA will become more
powerful and effective. It will also help the language centres of the DELTA participating
universities to develop the kind of educational programmes that would best meet the
language needs of the examinees. Examinees will receive more appropriate tests that will
target their ability level to make a more reliable appraisal of their performance.
Multiple-choice questions offer considerable advantages for test development as
they allow assessing large number of candidates along with cost-effectiveness in terms of
scoring. They are favoured by examinees over open-ended questions because the former
allow them to use test-taking strategies to increase understanding and earn better grades.
Nevertheless, they are never without limitations. Item writing flaws associated with
MCQs include cognitive level, question source, distribution of correct answers (Tarrant,
Knierim, Hayes, & Ware, 2006; Ali & Ruit, 2015). High quality MCQs are difficult and
time-consuming to construct. This study found that the majority of MCQs were produced
to test lower-level cognitive domains of knowledge and recognition. If other question
formats, used simultaneously, tested higher-level cognitive domains, this would help to
offset the low cognitive level of MCQ component of the overall assessment (Tarrant et
al., 2006). Therefore, it is suggested, in addition to the current MCQs, DELTA should
employ other test item types such as short answer questions which require more meaning
construction and production to minimise the impact of construct-irrelevant factors on
listeners’ performance. In addition to the conventional “listen-to-a-text-and-answer-
questions” format (Berne, 2005, p. 522), listening test designers could consider
integrating more interactive elements to assess comprehension.
7.5.3 Contributions to English learners in Hong Kong. Hong Kong has a long
history of using formal and high-stakes summative tests to make important decisions at

159
different stages of education. Although the HKSAR government has taken the initiative
to promote assessment for learning and alternative assessments are advocated in the
English language curriculum (Curriculum Development Council, 2007), teaching and
tutoring remain somewhat exam-driven and are often conducted to satisfy test
requirements (Lee & Coniam, 2014). Many teachers and tutors review past test papers,
provide modal answers, and teach students tricks to analyse test questions and make
educated guesses on them. Under such circumstances students tend to take a pragmatic
and exam-oriented approach to study (Berry, 2014; Lau, 2013). Even after entering
university where objectives and forms of assessment vary they still opt for the
conventional practice they have been exposed to since primary school, thereby often
being criticised about relying on passive and rote learning but lack critical thinking skills.
This study reveals that their concern about using strategies to get the right answer
outweighed their genuine understanding of the listening texts even on a low-stakes
assessment which aims to inform their learning. Therefore, students should be educated
to change their attitudes to understand the learning goals and adjust their motivation and
strategies to a more self-regulated and process-oriented approach.
7.5.4 Methodological implications. This study appears to be the only
investigation that has employed a multi-method approach to investigate the cognitive
validity of a diagnostic EFL listening assessment. While previous empirical research
largely relied on quantitative listening tests and statistical analysis adopting various
psychometric measurement models, this study provides the one of the first qualitative
assessments of the cognitive processes that EFL listeners utilize during a diagnostic
assessment situation. While a quantitative approach is conducive to the examination of
the psychometric properties of the assessment in question, a qualitative approach, such as
the SRP adopted in this study, enables the researcher to gain a more substantive
understanding of the construct underlying the test. The cognitive processes and the test-
taking strategies as revealed by SRPs in the study not only confirm the existence, in the
experience of the participants, of the listening subskills underlying the DELTA listening
component, but also provide possible explanation of the PCA variance that is not
explained by the underlying latent trait (i.e., listening subskill), and warrants further
research to scrutinize the structure of construct-irrelevant dimensions.
The stimulated recall protocols, as a type of retrospective reporting method, can
serve as a means by which ESL learners can utilize and discover more about their own

160
listening abilities. By verbalising what they hear, dealing with the aural input, and
tackling the comprehension questions, learners can reflect on the skills and strategies they
use as well as the difficulties they encounter. While effective skills and strategies can be
consolidated, those unfavourable skills and difficulties need to be highlighted and
addressed.
7.6 Limitations and Future Research
The most important limitation of the current research lies in the fact that the
listening items are disconnected in the data set. Because of the item design of DELTA,
different numbers of items for each subskill might have led to lower precision in data
analysis. The data were not well connected because of test item assignment of DELTA.
Future research could adopt an a priori data collection plan to ensure necessary
connections between different facets.
SRPs revealed little evidence of the impact of text type on subskill difficulties.
Because of the large number of texts and items involved in this study, a content analysis
of them was in vain. Future research could adopt a more rigorous approach to examining
the linguistic features of these text types. Researchers would need to refine the methods
for analysing text characteristics, and utilize a quantitative approach to quantify different
text variables such as speech rate, vocabulary, grammar, and discourse in order to
investigate their impact on listening subskills. It is expected that with detailed analyses
of these variables a more apparent pattern of text type and listening subskills might
emerge.
Notwithstanding the increasing number of studies on construct validity, literature
in the EFL/ESL field scarcely deals directly with test-wiseness (Allan, 1992). The test-
taking strategies of EFL/ESL listeners are surprisingly neglected by researchers, although
their implications for test construct validity are important. The present study showed that
examinees’ comprehension and performance was influenced by the skills which clearly
are not the focus of the test. Future research needs to address the influence of test-taking
strategies both on the performance of candidates and the overall validity of the test.
7.7 Conclusions
This study was an attempt to examine empirically the underlying subskills of the
DELTA listening component, their relationships with each other, and their interaction

161
with text type. The results of the study generally addressed the research questions. In the
first place, the DELTA listening subskills were quantitatively separable and a general
hierarchy of listening subskill difficulties was established, with identifying specific
information the easiest, and summaring and inferencing subskills more difficult. The
impact of text type on the difficulties of some subskills and their hierarchical order was
complicated. While findings of some subskills were inconclusive, the consistent result is
that SSK1 posed the least challenge regardless of text type. The cognitive processes
reported by the interviewees as actually used during the DELTA test show a strong
correspondence with the intended listening subskills. The SRPs amplified our
understanding of students’ cognitive processes by revealing the broad use of inferencing,
the use of additional CPs and more general test-taking strategies.
The study provides implications for our understanding of the nature of listening
comprehension. The established hierarchy order of subskills will benefit diagnostic
assessment with more fine-grained feedback. The report of test-taking strategies warns
EFL learning in HK to shift from exam preparation to more meaningful and authentic
learning.

162
REFERENCE LIST
ACTFL (2012). ACTFL Proficiency Guidelines. Retrieved from http://actfl
proficiencyguidelines2012.org/listening on July 11, 2012.
Alderson, J. C. (2005). Diagnosing foreign language proficiency: The interface between
learning and assessment. London: Continuum.
Al-Musalli, A. M., (2015) Taxonomy of lecture note-taking skills and subskills.
International Journal of Listening, 29(3), 134-147.
Ali, S. H., & Ruit, K. G. (2015). The Impact of item flaws, testing at low cognitive level,
and low distractor functioning on multiple-choice question quality. Perspectives
on Medical Education, 4(5), 244-251.
Allan, A. (1992). Development and validation of a scale to measure test-wiseness in
EFL/ESL reading test takers. Language Testing, 9(2), 101-119.
Anderson, J. R. (2005). Cognitive psychology and its implications. Macmillan.
Andrich, D. (2004) Controversy and the Rasch model: A characteristic of imcompatible
paradigms? Medicual Care, 42, 1-16.
Andringa, S., Olsthoorn, N., van Beuningen, C., Schoonen, R., & Hulstijn, J. (2012).
Determinants of success in native and non‐native listening comprehension: An
individual differences approach. Language Learning, 62, 49-78.
Argaman, O., & Abu-Rabia, S. (2002). The influence of language anxiety on English
reading and writing tasks among native Hebrew speakers. Language Culture and
Curriculum, 15(2), 143-160.
Arnold, J. (2000). Seeing through listening comprehension exam anxiety. TESOL
Quarterly, 34(4), 777-786.
Aryadoust, V. (2015). Fitting a mixture Rasch model to English as a foreign language
listening tests: The role of cognitive and background variables in explaining latent
differential item functioning. International Journal of Testing, 15(3), 216-238.
Aryadoust, V. (2018). A cognitive diagnostic assessment study of the listening test of the
Singapore–Cambridge General Certificate of Education O-Level: Application of
DINA, DINO, G-DINA, HO-DINA, and RRUM. International Journal of
Listening, 00, 1-24.
Aryadoust, V., Goh, C. C., & Kim, L. O. (2011). An investigation of differential item
functioning in the MELAB listening test. Language Assessment Quarterly, 8, 361-
385.

163
Aryadoust, V., & Zhang, L. (2016). Fitting the mixed Rasch model to a reading
comprehension test: Exploring individual difference profiles in L2 reading.
Language Testing, 33(4), 529-553.
Awan, R.-u.-N., Azher, M., Anwar, M. N., & Naz, A. (2010). An investigation of foreign
language classroom anxiety and its relationship with students achievement.
Journal of College Teaching & Learning, 7(11), 33-40.
Bachman, L. F. (1990). Fundamental considerations in language testing. Oxford
University Press.
Bachman, L. F. (2010). Language enhancement in Hong Kong universities: Some
observations and recommendations.
Bachman, L. F., & Palmer, A. S. (1996). Language testing in practice: Designing and
developing useful language tests (Vol. 1). Oxford: Oxford University Press.
Bacon, S. M. (1992). Phases of listening to authentic input in Spanish: A descriptive study.
Foreign Language Annals, 25, 317-334.
Baddeley, A. (1992). Working memory. Science, 255, 556-559.
Baddeley, A. (2003). Working memory and language: An overview. Journal of
Communication Disorders, 36(3), 189-208.
Baker, S. C., & MacIntyre, P. D. (2000). The role of gender and immersion in
communication and second language orientations. Language Learning, 50(2),
311-341.
Banerjee, J., & Papageorgiou, S. (2016). What’s in a topic? Exploring the interaction
between test-taker age and item content in high-stakes testing. International
Journal of Listening, 30(1-2), 8-24.
Barkaoui, K. (2014). Multifaceted Rasch Analysis for test evaluation. In A. J. Kunnan (1st
ed.), The Companion to Language Assessment (pp. 1-22). John Wiley & Sons, Inc.
DOI: 10.1001/9781118411360.wbcla070
Barta, E. (2010). Test-taker listening comprehension sub-skills and strategies. Working
Paper in Language Pedagogy, 4, 59-85.
Becker, A. (2016). L2 students’ performance on listening comprehension items targeting
local and global information. Journal of English for Academic Purposes, 24, 1-
13.
Berne, J. E. (1993). The Role of Text Type, Assessment Task, and Target Language
Experience in L2 Listening Comprehension Assessment. Paper presented at the
Annual Meetings of the American Association for Applied Linguistics and the

164
American Association of Teachers of Spanish and Portuguese (74th, Cancun,
Mexico, August 9-13, 1992).
Berne, J. E. (1995). How does varying pre-listening activities affect second language
listening comprehension? Hispania, 78(2), 316-329.
Berne, J. E. (2005). Listening comprehension strategies: A review of the literature.
Foreign Language Annals, 37(4), 521-531.
Berry, R. S. Y. (2014). Assessment for learning in Hong Kong: Conceptions, issues and
implications. In C., Marsh & J., C.-K., Lee (Eds.), Asia’s high performing
education systems: The case of Hong Kong (pp. 255-273). Routledge.
Bhatia, V. K. (1993). Analysing genre: Language use in professional settings.
London/New York: Longman.
Bond, T. G., & Fox, C. M. (2007). Applying the Rasch Model: Fundamental measurement
in the human sciences. London: Lawrence Erlbaum Associates.
Bond, T. G., & Fox, C. M. (2015). Applying the Rasch Model Fundamental Measurement
in the Human Sciences (3rd ed.). Mahwah, NJ L. Erlbaum.
Bonk, W. J. (2000). Second language lexical knowledge and listening comprehension.
International Journal of Listening, 14(1), 14-31.
Bonk, W. J., & Ockey, G. J. (2003). A many-facet Rasch analysis of the second language
group oral discussion task. Language Testing, 20(1), 89-110.
Bowles, M. A. (2010). The think-aloud controversy in second language research. New
York: Routledge.
Boyle, J. P. (1984). Factors affecting listening comprehension. ELT Journal, 38(1), 34-
38.
Brantmeier, C. (2005). Anxiety about L2 reading or L2 reading tasks? A study with
advanced language learners. Reading, 5(2), 67-85.
Brindley, G. P. (1982). Listening proficiency descriptions. Sydney: Adult Migrant
Education Service.
Brindley, G. P. (1997). Investigating second language listening ability: listening skills
and item difficulty. In G. Brindley & and H. Wigglesworth (Eds), Access: Issues
in language test design and delivery (pp. 65-86). Macquarie University, Sydney:
National Centre for English Language Teaching and Research.
Brindley, G. (1998). Describing language development? Rating scales and SLA. In L. F.
Bachman & A. D. Cohen (Eds.), Interface between second language acquisition

165
and language testing research (pp. 112-140). Cambridge: Cambridge University
Press.
Brindley, G., & Slatyer, H. (2002). Exploring task difficulty in ESL listening assessment.
Language Testing, 19(4), 369-394.
Brown, G., & Yule, G. (1983). Teaching the spoken language. Cambridge: Cambridge
University Press.
Brown, G. (1995). Dimensions of difficulty in listening comprehension. In D.
Mendelsohn, & J. Rubin (Eds.), A guide for the teaching of second language
listening (pp. 59-73). San Diego CA: Dominie Press.
Buck, G. (1991). The testing of listening comprehension: an introspective study.
Language Testing, 8(67), 67-91.
Buck, G. (2001). Assessing listening. Cambridge University Press.
Buck, G., & Tatsuoka, K. (1998). Application of the rule-space procedure to language
testing: Examining attributes of a free response listening test. Language testing,
15(2), 119-157.
Buck, G., Tatsuoka, K., & Kostin, I. (1997). The subskills of reading: Rule‐space analysis
of a multiple‐choice test of second language reading comprehension. Language
Learning, 47(3), 423-466.
Buck, G., Tatsuoka, K., Kostin, I. & Phelps, M. (1997). The sub-skills of listening: Rule-
space analysis of a multiple-choice test of second language listening
comprehension. In A.Huhta et al (Eds), Current Developments and Alternatives
in Language Assessment — Proceedings of LTRC (Vol. 96, pp. 589-624).
Cai, W., & Lee, B. P. (2010). Investigating the effect of contextual clues on the processing
of unfamiliar words in second language listening comprehension. Australian
Review of Applied Linguistics, 33(2), 18-1.
Cervantes, R., & Gainer, G. (1992). The effects of syntactic simplification and repetition
on listening comprehension. TESOL Quarterly, 26(4), 767-770.
Chang, A. C. S. (2007). The impact of vocabulary preparation on L2 listening
comprehension, confidence and strategy use. System, 35(4), 534-550.
Chang, A. C. S. (2008). Listening strategies of L2 learners with varied test tasks. TESL
Canada Journal/Revue TESL Du Canada, 25(2), 1-26.
Chang, A. C. S., & Read, J. (2006). The effects of listening support on the listening
performance of EFL learners. TESOL Quarterly, 40(2), 375-397.

166
Chang, A. C. S., & Read, J. (2007). Support for foreign language listeners: Its
effectiveness and limitations. RELC Journal, 38(3), 375-394.
Cheng, H. F. (2004). A comparison of multiple‐choice and open‐ended response formats
for the assessment of listening proficiency in English. Foreign Language Annals,
37(4), 544-553.
Cheng, Y. S. (2004). A measure of second language writing anxiety: Scale development
and preliminary validation. Journal of Second Language Writing, 13(4), 313-335.
Chiang, C. C., & Dunkel, P. (1992). The effect of speech modification, prior knowledge,
and listening proficiency on EFL lecture learning. TESOL Quarterly, 26, 345–374.
Cohen, A. D. (2012). Test-taking strategies. In C. Coombe, P. Davidson, B. O’Sullivan,
& S. Stoynoff (Eds.), The Cambridge guide to second language assessment (pp.
96-104). New York: Cambridge University Press.
Cohen, J. (1988). Statistical power analysis for the behavioral sciences (2nd ed.).
Hillsdale, NJ: Erlbaum.
Cuendet, S., Hakkani-Tur, D., Shriberg, E., Fung, J., & Favre, B. (2007, September).
Cross-genre feature comparisons for spoken sentence segmentation. In
International Conference on Semantic Computing (ICSC 2007) (pp. 265-274).
IEEE.
Davies, A., Brown, A., Elder, C., Hill, K., Lumley, T., & McNamara, T. (2004).
Dictionary of Language Testing (2nd Ed.). Cambridge: Cambridge University
Press.
DELTA (2012). Diagnostic English Language Tracking Assessment (DELTA) test
specifications for item writers. Hong Kong, October 2012.
Deterding, D. H., & Poedjosoedarmo, G. (1998). The sounds of English. Singapore:
Prentice Hall.
Doe, C. (2013). Validating the Canadian academic English language assessment for
diagnostic purposes from three perspectives: Scoring, teaching, and learning
(Doctoral dissertation). Retrieved from
https://qspace.library.queensu.ca/bitstream
/handle/1974/7995/Doe_Christine_D_201304_PhD.pdf?sequence=1&isAllowed
=y
Doe, C. (2015). Student interpretations of diagnostic feedback. Language Assessment
Quarterly, 12(1), 110-135.

167
Dunkel, P. A., & Davis, J. N. (1994). The effects of rhetorical signaling cues on the recall
of English lecture information by speakers of English as a native or second
language. In J. Flowerdew (Ed.) Academic listening: Research perspectives (pp.
55-74). Cambridge: Cambridge University Press.
Dunkel, P., Henning, G. & Chaudron, C. (1993). The assessment of an L2 listening
comprehension construct: A tentative model for test specification and
development. The Modern Language Journal, 77(2), 180-191.
Eckes, T. (2011). Introduction to many-facet Rasch measurement. Frankfurt am Main,
Germany: Peter Lang.
Elder, C., McNamara, T., Congdon, P. (2003). Rasch techniques for detecting bias in
performance assessments: An example comparing the performance of native and
non-native speakers on a test of academic English. Journal of Applied
Measurement, 4(2), 181–197.
Elkhafaifi, H. (2005). Listening comprehension and anxiety in the Arabic language
classroom. The Modern Language Journal, 89(2), 206-220.
Elliott, M., & Wilson, J. (2013). Context validity. In A., Geranpayeh & L. Taylor (Eds).
Examining Listening: Research and practice in assessing second language
listening (Vol. 35, pp. 77-151). Cambridge: Cambridge University Press.
Engelhard, G. (2013). Invariant measurement: Using Rasch models in the social,
behavioral, and health sciences. New York: Routledge.
Ericsson, K. A., & Simon, H. A. (1993). Protocol analysis: Verbal reports as data (Rev.
ed.). Cambridge, MA: Bradford Books/ MIT Press.
Evans, S. (2016). The English language in Hong Kong: Diachronic and synchronic
perspectives. London: Palgrave Macmillan.
Evans, S. (2018). Language policy in Hong Kong Education: A historical overview.
European Journal of Language Policy, 9(1), 67-84.
Evans, S., & Morrison, B. (2011). Meeting the challenges of English-medium higher
education: The first-year experience in Hong Kong. English for Specific Purposes,
30(3), 198-208.
Evans, S., & Morrison, B. (2012). Learning and using English at university: Lessons from
a longitudinal study in Hong Kong. Journal of Asia TEFL, 9(2), 21-47.
Fan, J. & Bond, T. (2019). Applying Rasch measurement in language assessment:
unidimensionality and local independence. In V., Aryadoust & M., Raquel (Eds.),

168
Quantitative Data Analysis for Language Assessment Volume I: Fundamental
Techniques (pp. 83-102). London and New York: Routledge.
Færch, C., & Kasper, G. (1986). One learner–two languages: Investigating types of
interlanguage knowledge. In J. House & S. Blum-Kulka (Eds.), Interlingual and
Intercultural Communication: Discourse and cognition in translation and second
language acquisition studies (pp. 211-227). Germany: Gunter Narr Verlag
Tübingen.
Field, J. (1998). Skills and strategies: towards a new methodology for listening. ELT
Journal 52(2), 110-118.
Field, J. (2003). Promoting perception: lexical segmentation in L2 listening. ELT Journal,
57(4), 325-334.
Field, J. (2008a). Bricks or mortar: Which pats of the input does a second language
listener rely on? TESOL Quarterly, 42(3), 411-432.
Field, J. (2008b). Listening in the language classroom. Cambridge: Cambridge University
Press.
Field, J. (2008c). Revising segmentation hypotheses in first and second language listening.
System, 36, 35-51.
Field, J. (2013). Cognitive validity. In A., Geranpayeh & L. Taylor (Eds). Examining
Listening: Research and practice in assessing second language listening (Vol. 35,
pp.152-241). Cambridge: Cambridge University Press.
Fischer, R., & Farris, M. (1995). Instructional basis of Libra. IALL Journal of Language
Learning Technologies, 28(1), 29-90.
Flowerdew, J. (1994). Research of relevance to second language lecture comprehension
— an overview. In J. Flowerdew (Ed.), Academic Listening: Research
Perspectives (pp. 7-33). Cambridge: Cambridge University Press.
Flowerdew, J., & Miller, L. (1997). The teaching of academic listening comprehension
and the question of authenticity. English for Specific Purposes, 16(1), 27-46.
Flowerdew, J., & Miller, L. (2005). Second language listening: Theory and practice.
Cambridge University Press.
Flowerdew, J., & Tauroza, S. (1995). The effect of discourse markers on second language
lecture comprehension. Studies in Second Language Acquisition, 17(4), 435-458.
Fox, J. D. (2009). Moderating top-down policy impact and supporting EAP curricular
renewal: Exploring the potential of diagnostic assessment. Journal of English for
Academic Purposes, 8(1), 26-42.

169
Fraser, B. (2006). Towards a theory of discourse markers. Approaches to Discourse
Particles, 1, 189-204.
Garcia, P. (2004). Pragmatic comprehension of high and low level language learners.
TESL-EJ, 8(2), 1-15.
Gass, S. M. & Mackey, A. (2000). Stimulated recall in second language research.
Mahwah, N.J.: Erlbaum Associates.
Ghahramanlou, M., Zohoorian, Z., & Baghaei, P. (2016). Understanding the cognitive
processes underlying performance in the IELTS listening comprehension test.
Preprints. doi: 10.20944/preprints201608.0190.v1
Gocheco, P.M. (2011). Evaluating the role of discourse markers and other enabling
factors in the academic listening comprehension. The Assessment Handbook, 4(2).
Goh, C. C. (2000). A cognitive perspective on language learners' listening comprehension
problems. System, 28(1), 55-75.
Goh, C. (2002). Exploring listening comprehension tactics and their interaction patterns.
System, 30, 185-206.
Goh, C., & Aryadoust, S. V. (2010). Investigating the construct validity of the MELAB
listening test through the Rasch analysis and correlated uniqueness modeling.
Spaan Fellow, 8, 31-68.
Goh, C. C., & Aryadoust, V. (2015). Examining the notion of listening subskill
divisibility and its implications for second language listening. International
Journal of Listening, 29(3), 109-133.
Goodwin, S. (2016). A Many-Facet Rasch analysis comparing essay rater behavior on an
academic English reading/writing test used for two purposes. Assessing Writing,
30, 21-31.
Graham, S. (2006). Listening comprehension: The learners’ perspective. System, 34(2),
165-182.
Graham, S., Santos, D. & Vanderplank, R. (2008). Listening comprehension and strategy
use: A longitudinal exploration. System, 36, 52-68.
Grant, L.H. (1997). Listening to English in the 21st century: The need for learner
strategies. In C. Zaher(Ed.) Proceedings of the Third EFL Skills Conference: New
Directions in Listening (pp. 10–18).The Center for Adult and Continuing
Education, The American University in Cairo, 3–5 December 1996.
Gravetter, F. J., & Wallnau, L. B. (2007). Statistics for the behavior sciences (7th ed.).
Belmont, CA: Wadsworth.

170
Green, A. (1998). Verbal protocol analysis in language testing research: A handbook.
Cambridge: Cambridge University Press.
Griffiths, R. (1990). Speech rate and NNS comprehension: A preliminary study in time‐
benefit analysis. Language Learning, 40(3), 311-336.
Harding, L. (2011). Accent, listening assessment and the potential for a shared-L1
advantage: A DIF perspective. Language Testing, 29(2), 163-180.
Hasan, A. S. (2000). Learners’ perceptions of listening comprehension problems.
Language Culture and Curriculum, 13(2), 137-153.
Hansen, M. B. M. (1998). The semantic status of discourse markers. Lingua, 104(3-4),
235-260.
Hildyard, A., & Olson, D. (1982). On the comprehension and memory of oral versus
written discourse. In D. Tannen (Ed.), Spoken and written language (pp. 19–32).
Norwood, NJ: Ablex Publishing.
Halliday, M. & Hasan, R. (1976). Cohesion in English. London: Longman.
Hayati, A. M. (2009). The Impact of Cultural Knowledge on Listening Comprehension
of EFL Learners. English Language Teaching, 2(3), 144-152.
Holschuh, J. P. (2000). Do as I say, not as I do: High, average, and low-performing
students' strategy use in biology. Journal of College Reading and Learning, 31(1),
94-108.
Hong, E., Sas, M., & Sas, J. C. (2006). Test-taking strategies of high and low mathematics
achievers. The Journal of Educational Research, 99(3), 144-155.
Horwitz, E. (2001). Language anxiety and achievement. Annual Review of Applied
Linguistics, 21, 112-126.
Horwitz, E. K. (2010). Foreign and second language anxiety. Language Teaching, 43(2),
154-167.
Hu, F. (2017). A study on Chinese EFL learners’ phonetic obstacles to listening
comprehension. Journal of Language Teaching and Research, 8(2), 404-410.
Huang, J. (2004). Voices from Chinese students: Professors’ use of English affects
academic listening. College Student Journal, 38(2), 213-223.
Huang, X. (2009) The relationship between Chinese EFL learners proficiency in
suprasegmental features of pronunciation and their listening comprehension.
CELEA Journal (Bimonthly), 32(2), 31-39.
Huff, K., & Goodman, D. P. (2007). The demand for cognitive diagnostic assessment. In
J. P. Leighton & M. J. Gierl (Eds.), Cognitive Diagnostic Assessment for

171
Education: Theory and Practice (pp. 19-60). Cambridge: Cambridge University
Press.
Hughes, A. (2003). Testing for language teachers (2nd ed). Cambridge: Cambridge
University Press.
Huhta, A., Alanen, R., Tarnanen, M., Martin, M., Hirvela, T. (2014). Asessing learners’
writing skills in a SLA study: Validating the rating process across tasks, scales
and languages. Language Testing, 31(3), 307–328.
Jang, E. E. (2005). A validity narrative: Effects of reading skills diagnosis on teaching
and learning in the context of NG TOEFL (Doctoral dissertation, University of
Illinois at Urbana-Champaign). Retrieved from
https://www.researchgate.net/profile/Eunice_Jang/publication/33746641_A_vali
dity_narrative_Effects_of_reading_skills_diagnosis_on_teaching_and_learning_
in_the_context_of_NG_TOEFL/links/5638dfa108ae7f7eb185e158/A-validity-
narrative-Effects-of-reading-skills-diagnosis-on-teaching-and-learning-in-the-
context-of-NG-TOEFL.pdf
Jang, E. E. (2009a). A framework for cognitive diagnostic assessment. In C. A. Chapelle,
Y.-R. Chung & J. Xu (Eds.), Towards adaptive CALL: Natural Language
Processing for Diagnostic Language Assessment (pp. 117-131). Ames, IA: Iowa
State University.
Jang, E. E. (2009b). Cognitive diagnostic assessment of L2 reading comprehension ability:
Validity arguments for Fusion Model application to LanguEdge assessment.
Language Testing, 26(1), 031-73.
Jenkins, J. (2013). English as a lingua franca in the international university: The politics
of academic English language policy. Routledge.
Jensen, C., & Hansen, C. (1995). The effect of prior knowledge on EAP listening-test
performance. Language Testing, 12(1), 99-119.
Jung, E. H. (2003). The role of discourse signaling cues in second language listening
comprehension. The Modern Language Journal, 87(4), 562-577.
Jung, E. H. S. (2006). Misunderstanding of academic monologues by nonnative speakers
of English. Journal of Pragmatics, 38(11), 1928-1942.
Kelly, P. (1991). Lexical Ignorance: The Main Obstacle to Listening Comprehension with
Advanced Foreign Language Learners. International Review of Applied
Linguistics in Language Teaching, 29(2), 135-149.

172
Kim, A. Y. (2015). Exploring ways to provide diagnostic feedback with an ESL
placement test: Cognitive diagnostic assessment of L2 reading ability. Language
Testing, 32(2), 227-258.
Kirkpatrick, A. (2007). World Englishes: Implications for International Communication
and English Language Teaching. Cambridge: Cambridge University Press.
Kitano, K. (2001). Anxiety in the college Japanese language classroom. The Modern
Language Journal, 85(4), 549-566.
Knoch, U. (2007). Diagnostic writing assessment: The development and validation of a
rating scale. (Doctoral dissertation). Retrieved from http://researchspace.
auckland.ac.nz
Knoch, U. (2009). Diagnostic assessment of writing: A comparison of two rating scales.
Language Testing, 26(2), 275-304.
Knoch, U. (2011). Rating scales for diagnostic assessment of writing: What should they
look like and where should the criteria come from?. Assessing Writing, 16(2), 81-
96.
Kobeleva, P. P. (2012). Second language listening and unfamiliar proper names:
Comprehension barrier?. RELC Journal, 43(1), 83-98.
Kondo-Brown, K. (2002). A FACETS analysis of rater bias in measuring Japanese second
language writing performance. Language Testing, 19(1), 3-31.
Krashen, S. (1982). Principles and practice in second language acquisition. New York:
Prentice-Hall International.
Larson, C., Backlund, P., Redmond, M., & Barbour, A. (1978). Assessing functional
communication. Falls Church, VA: Speech Communication Association/ERIC.
Lau, K. C. (2013). Impacts of a STSE high school biology course on the scientific literacy
of Hong Kong students. Asia-Pacific Forum on Science Learning and Teaching,
14(1), pp. 1-25.
Lebauer, R. S. (1984). Using lecture transcripts in EAP lecture comprehension courses.
TESOL Quarterly, 18(1), 41-54.
Lee, I., & Coniam, D. (2013). Introducing assessment for learning for EFL writing in an
assessment of learning examination-driven system in Hong Kong. Journal of
Second Language Writing, 22(1), 34-50.
Lee, Y-W. & Sawaki, Y. (2009). Application of three cognitive diagnosis models to ESL
reading and listening assessments. Language Assessment, 6(3), 239-263.

173
Leeser, M. J. (2004). The effects of topic familiarity, mode, and pausing on second
language learners’ comprehension and focus on form. Studies in Second
Language Acquisition, 26(4), 587-615.
Linacre, J. M. (1992). Many-facet Rasch measurement. Chicago: MESA Press.
Linacre, J. M. (1997). Judging plans and facets. MESA Research Note #3. Retrieved from
http://www.rasch.org/rn3.htm
Linacre, J. M. (2013a). A user’s guide to WINSTEPS. Chicago: Winsteps.com
Linacre, J. M. (2013b). Winsteps. http://www. winsteps. com
Linacre, J. M. (2013c). A user’s guide to FACETS: Rasch-model computer program.
Chicago: Winsteps.com
Linacre, J. M. (2013d). Facets Rasch-Model computer program. http://www.
winsteps.com
Liu, M. (2006). Anxiety in Chinese EFL students at different proficiency levels. System,
34(3), 301-316.
Liu, M., & Huang, W. (2011). An exploration of foreign language anxiety and English
learning motivation. Education Research International, 2011, 1-8.
doi:10.1155/2011/493167
Liu, Y., Yeung, S. S. S., Lin, D., & Wong, R. K. S. (2017). English expressive vocabulary
growth and its unique role in predicting English word reading: A longitudinal
study involving Hong Kong Chinese ESL children. Contemporary Educational
Psychology, 49, 195-202.
Long, D. R. (1990). What you don’t know can’t help you: An exploratory study of
background knowledge and second language listening comprehension. Studies in
Second Language Acquisition, 12(1), 65–80.
Luke, K. K., & Richards, J. C. (1982). English in Hong Kong: functions and status.
English World-Wide, 3(1), 47-64.
Lund, R. (1990). A taxonomy for teaching second language listening. Foreign Language
Annals, 23(2), 105-115.
MacIntyre, P. D., & Gardner, R. C. (1991). Language anxiety: Its relation to other
anxieties and to processing in native and second languages. Language Learning,
41, 513–534.
Major, R. C., Fitzmaurice, S. F., Bunta, F., & Balasubramanian, C. (2002). The effects of
nonnative accents on listening comprehension: Implications for ESL assessment.
TESOL Quarterly, 36(2), 173-190.

174
Markham, P., & Latham, M. (1987). The influence of religion‐specific background
knowledge on the listening comprehension of adult second‐language students.
Language Learning, 37(2), 157-170.
Masters, G. N. (1982). A Rasch model for partial credit scoring. Psychometrika, 47, 149–
174.
Matsuura, H., Chiba, R., Mahoney, S., & Rilling, S. (2014). Accent and speech rate
effects in English as a lingua franca. System, 46, 143-150.
McLean, S., Kramer, B., & Beglar, D. (2015). The creation and validation of a listening
vocabulary levels test. Language Teaching Research, 19(6), 741-760.
McNamara, T. (1996). Measuring second language performance. London/New York:
Longman.
McNamara, T. & Knoch, U. (2012). The Rasch wars: The emergence of Rasch
measurement in language testing. Language Testing, 0(0), 1-22.
Mecartty, F. (2000). Lexical and grammatical knowledge in reading and listening
comprehension by foreign language learners of Spanish. Applied Language
Learning, 11, 323-348.
Mehrpour, S., & Rahimi, M. (2010). The impact of general and specific vocabulary
knowledge on reading and listening comprehension: A case of Iranian EFL
learners. System, 38(2), 292-300.
Mendelsohn, D. (1995). Applying learning strategies in the second/foreign language
listening comprehension lesson. In D. J. Mendelsohn & J. Rubin (Eds.), A
guide for the teaching of second language listening (pp. 132–150). San Diego,
CA: Dominie Press.
Messick, S. (1989). Meaning and values in test validation: The science and ethics of
assessment. Educational Researcher, 18(2), 5-11.
Messick, S. (1995). Validity of psychological assessment: Validation of inferences from
persons' responses and performances as scientific inquiry into score meaning.
American Psychologist, 50(9), 741.
Miller, C. R. (1984). Genre as social action. Quarterly Journal of Speech, 70(2), 151-167.
Mills, N., Pajares, F., & Herron, C. (2006). A reevaluation of the role of anxiety: Self‐
efficacy, anxiety, and their relation to reading and listening proficiency. Foreign
Language Annals, 39(2), 276-295.

175
Ministry of Education and National Language Commission of People’s Republic of China.
(2019). China’s Standards of English Language Ability. Retreived from
http://cse.neea.edu.cn/ on 14 Oct 2019.
Mousavi, S.A. (2009). An encyclopedic dictionary of language testing (4th ed). Rahnama
Press.
Muller, G. A. (1980). Visual contextual cues and listening comprehension: An
experiment. The Modern Language Journal, 64(3), 335-340.
Munby, J. (1978). Communicative syllabus design. Cambridge: Cambridge University
Press.
Murphy, J. M. (1991). Oral communication in TESOL: Integrating speaking, listening,
and pronunciation. TESOL Quarterly, 25(1), 51-75.
Murphy, J. M. (2014). Intelligible, comprehensible, non-native models in ESL/EFL
pronunciation teaching. System, 42, 258-269.
Nation, I. S. P. & Newton, J. (2009). Teaching ESL/EFL listening and speaking. New
York & London: Routledge.
Nunan, D. (1997). Listening in language learning. The Language Teacher, 21(9), 47-51.
Nunan, D. (1999). Second language teaching & learning. Boston, Mass: Heinle & Heinle
Publishers.
Nunan, D. (2002). Listening in language learning. In J. C. Richards, & W. A. Renandya
(Eds.), Methodology in language teaching: An anthology of current practice (pp.
238-241). Cambridge: Cambridge University Press.
NVivo 11 for Windows Help. Retrived from http://help-nv11.qsrinternational.com
/desktop/welcome/welcome.htm
Ockey, G. J., Papageorgiou, S., & French, R. (2016). Effects of strength of accent on an
L2 interactive lecture listening comprehension test. International Journal of
Listening, 30(1-2), 84-98.
O’Malley, J. M., Chamot, A. U., & Küpper, L. (1989). Listening comprehension
strategies in second language acquisition. Applied Linguistics, 10(4), 418-437.
Oxford, R. L. (1993). Research update on teaching L2 listening. System, 21(2), 205-211.
Pérez, M. A., & Macià, E. A. (2002). Metadiscourse in lecture comprehension: Does it
really help foreign language learners?. Atlantis: Revista de la Asociación
Española de Estudios Anglo-Norteamericanos, 24(1), 7-22.
Phakiti, A. (2006). Theoretical and pedagogical issues in ESL/EFL teaching of strategic
reading. University of Sydney Papers in TESOL, 1(1), 19-50.

176
Poon, A. Y. K. 2009. “Reforming medium of instruction in Hong Kong”. In C. H. C., Ng
P. and Renshaw (eds.), Reforming Learning (pp.199–232). Dordrecht: Springer.
Powers, D. E. (1986). Academic demands related to listening skills. Language Testing,
3(1), 1-38.
Qian, D. D. (2008). English language assessment in Hong Kong: A survey of practices,
developments and issues. Language Testing, 25(1), 85-110.
Raquel, M. (2019). The Rasch measurement approach to differential item functioning
(DIF) analysis in language assessment research. In V., Aryadoust & M., Raquel
(Eds.), Quantitative Data Analysis for Language Assessment Volume I:
Fundamental Techniques (pp. 103-131). London and New York: Routledge.
Rasch, G. (1960). Probabilistic models for some intelligence and attainment tests.
Copenhagen, Denmark: Danish Institute for Educational Research. (Expanded
edition, 1980. Chicago, IL: University of Chicago Press.)
Read, J. (2008). Identifying academic language needs through diagnostic assessment.
Journal of English for Academic Purposes, 7(2), 180–190.
Révész, A., & Brunfaut, T. (2013). Text characteristics of task input and difficulty in
second language listening comprehension. Studies in Second Language
Acquisition, 35(01), 31-65.
Richards, J. (1983). Listening comprehension: approach, design, procedure. TESOL
Quarterly, 17(2), 219-240.
Rivers, W. M. (1966). Listening comprehension. The Modern Language Journal, 50(4),
196-204.
Ross, S. (1997). An introspective analysis of listeners’ inferencing on a second language
listening test. In G., Kasper & E., Kellerman (Eds.), Communication Strategies:
Psycholinguistic and Sociolinguistic Perspectives (pp. 216-237). London:
Longman.
Rost, M. (2005). Teaching and researching listening. Beijing: Foreign Language
Teaching and Research Press.
Rost , M.( 2011 ). Teaching and researching listening. London: Longman .
Roussel, S. (2011). A computer assisted method to track listening strategies in second
language learning. ReCALL, 23(2), 98-116.
Rukthong, A., & Brunfaut, T. (2019). Is anybody listening? The nature of second
language listening in integrated listening-to-summarize tasks. Language Testing,
1-23. doi.org/10.1177/0265532219871470

177
Rubin, J. (1994). A review of second language listening comprehension research. The
Modern Language Journal, 78(2), 199-221.
Runnels, J. (2013). Measuring differential item and test functioning across academic
disciplines. Language Testing in Asia, 3(1), 9-11.
Sadeghi, B., Taghi Hassani, M., & Noory, H. (2014). The Effect of Teaching Different
Genres on Listening Comprehension Performance of Iranian EFL Students.
Journal of Language Teaching & Research, 5(3), 517-523.
Sadighi, F., & Zare, S. (2006). Is listening comprehension influenced by the background
knowledge of the learners? A case study of Iranian EFL learners. The Linguistics
Journal, 1(3), 110-126.
Saito, Y., Garza, T. J., & Horwitz, E. K. (1999). Foreign language reading anxiety. The
Modern Language Journal, 83(2), 202-218.
Salahshuri, S. (2011). The role of background knowledge in foreign language listening
comprehension. Theory and Practice in Language Studies, 1(10), 1446-1451.
Santos, S., Cadime, I., Viana, F. L., Prieto, G., Chaves-Sousa, S., Spinillo, A. G., &
Ribeiro, I. (2016). An application of the Rasch model to reading comprehension
measurement. Psicologia: Reflexão e Crítica, 29(1), 38.
Schauer, G. A. (2006). Pragmatic awareness in ESL and EFL contexts: Contrast and
development. Language Learning, 56(2), 269-318.
Schmidt-Rinehart, B. C. (1994). The effects of topic familiarity on second language
listening comprehension. Modern Language Journal, 78, 179–189.
Scollon, R. & Scollon, S, (2001). Intercultural Communication: A Discourse Approach.
Oxford: Wiley-Blackwell.
Sellers, V. D. (2000). Anxiety and reading comprehension in Spanish as a foreign
language. Foreign Language Annals, 33(5), 512-520.
Shams, S. M., & Elsaadany, K. A. (2008). Paralinguistic effects on developing EFL
students' listening comprehension skills. International Journal of Applied
Educational Studies, 1(1), 83.
Shang, H-F. (2005). An investigation of cognitive operations on l2 listening
comprehension performance: An exploratory study. International Journal of
Listening, 19(1), 51-62.
Shirzadi, S. (2014). Syntactic and lexical simplification: the impact on EFL listening
comprehension at low and high language proficiency levels. Journal of Language
Teaching and Research, 5(3), 566-572.

178
Siegel, J. & Siegel, A. (2018). Getting to the bottom of L2 listening instruction: making
a case for bottom-up activities. Studies in Second Language Learning and
Teaching, 5(4), 637-662.
Shohamy, E. & Inbar, O. (1991). Validation of listening comprehension tests: The effect
of text and question type. Language Testing, 8(1), 23-40.
Song, M-Y. (2008). Do divisible sub-skills exist in second language (L2) comprehension?
A structural equation modeling approach. Language Testing, 25(4), 435-464.
Spielberger, C. D. (1983). Manual for the state-trait anxiety inventory. Palo Alto, CA:
Consulting Psychologists Press.
Stæhr, L. S. (2009). Vocabulary knowledge and advanced listening comprehension in
English as a foreign language. Studies in Second Language Acquisition, 31(4),
577-607.
Stenlund, T., Eklöf, H., & Lyrén, P. E. (2017). Group differences in test-taking behaviour:
An example from a high-stakes testing program. Assessment in Education:
Principles, Policy & Practice, 24(1), 4-20.
Sueyoshi, A., & Hardison, D. M. (2005). The role of gestures and facial cues in second
language listening comprehension. Language Learning, 55(4), 661-699.
Swales, (1990). Genre analysis: English in academic and research settings. Cambridge:
Cambridge University Press.
Taguchi, N. (2005). Comprehending implied meaning in English as a foreign language.
The Modern Language Journal, 89(4), 543-562.
Tajabadi, F., & Taghizadeh, M. (2014). The Impact of Discourse Signaling Devices on
the Listening Comprehension of L2 Learners. International Journal of
Progressive Education, 10(2), 73-88.
Tarrant, M., Knierim, A., Hayes, S. K., & Ware, J. (2006). The frequency of item writing
flaws in multiple-choice questions used in high stakes nursing assessments. Nurse
Education Today, 26(8), 662-671.
Tauroza, S., & Luk, J. (1997). Accent and second language listening comprehension.
RELC Journal, 28(1), 54-71.
Taylor, L. (2013). Introduction. In A., Geranpayeh & L. Taylor (Eds). Examining
Listening: Research and practice in assessing second language listening (Vol. 35,
1-35). Cambridge: Cambridge University Press.
Tsang, H. K. C. (2013). Student motivation on a diagnostic and tracking English
language test in Hong Kong (Doctoral dissertation, Institute of Education,

179
University of London). Retrieved from
http://discovery.ucl.ac.uk/10017892/1/Thesis_%28Carrie_Tsang%29_Final%20
copy.pdf
Tsang, W. K. (2008). The effect of medium-of-instruction policy on education
advancement. The Chinese University of Hong Kong, Hong Kong.
Tsui, A. B., & Fullilove, J. (1998). Bottom-up or top-down processing as a discriminator
of L2 listening performance. Applied Linguistics, 19(4), 432-451.
Ülper, H. (2009). The effect of visual strategies on textual structures in listening process
to comprehension level of the listeners. Procedia-Social and Behavioral Sciences,
1(1), 568-574.
Ur, P. (1984). Teaching listening comprehension. Cambridge University Press.
van Zeeland, H., & Schmitt, N. (2013). Lexical coverage in L1 and L2 listening
comprehension: The same or different from reading comprehension? Applied
Linguistics, 75, 1067-1084.
Vandergrift, L. (2003). Orchestrating strategy use: toward a model of the skilled second
language listener. Language Learning, 53(3), 463-496.
Vandergrift, L., & Baker, S. (2015). Learner variables in second language listening
comprehension: An exploratory path analysis. Language Learning, 65(2), 390-
416.
Vandergrift, L. (1997). The comprehension strategies of second language (French)
listeners: A descriptive study. Foreign Language Annals, 30(3), 387-409.
Vandergrift, L. (2003). Orchestrating strategy use: toward a model of the skilled second
language listener. Language Learning, 53(3), 463-496.
Vandergrift, L., & Baker, S. (2015). Learner variables in second language listening
comprehension: An exploratory path analysis. Language Learning, 65(2), 390-
416.Wainer, H. (2000). Computerized adaptive testing: A primer (2nd ed.).
Mahwah, NJ: Lawrence Erlbaum Associates.
Wei, Y. & Zhou, Y. (2002). Insights into English pronunciation problems of Thai students.
Paper presented at the Annual Meeting of the Quadruple Helix (8th., April 6, 2002).
Weir, C. (1993). Understanding and developing language tests. New York: Prentice Hall.
Weir, C. J. (2005). Language testing and validation. Hampshire: Palgrave McMillan.
Wolff, D. (1987). Some assumptions about second language text comprehension. Studies
in Second Language Acquisition, 9, 307–326.
180
Woodrow, L. (2011). College English writing affect: Self-efficacy and anxiety. System,
39(4), 510-522.
Wright, B. D., & Masters, G. N. (1982). Rating scale analysis: Rasch measurement.
Chicago: Mesa Press.
Xie, Q. (2011). Is test taker perception of assessment related to construct validity?
International Journal of Testing, 11, 324-348.
Yang, X. (2010). Intentional forgetting, anxiety, and EFL listening comprehension among
Chinese college students. Learning and Individual Differences, 20, 177-187.
Yi, Y. S. (2017). Probing the relative importance of different attributes in L2 reading and
listening comprehension items: An application of cognitive diagnostic models.
Language Testing, 34(3), 337-355.
Zhang, X. (2013). Foreign language listening anxiety and listening performance:
Conceptualizations and causal relationships. System, 41(1), 164-177.
Zhao, Y. (1997). The effects of listeners’ control of speech rate on second language
comprehension. Applied Linguistics, 18(1), 49-68.

181
APPENDIX A: DESCRIPTIONS AND EXAMPLES OF THE NVIVO CODINGS
Codes Description SRP report segment
Recognising explicit information
The listener catches the words/ phrases in the recording and matches them with the MCQ options.
Because in the beginning it’s talking about “hey you need to attend the interview”, so I choose B.
Summarising ideas across a chunk of speech
The listener catches key words and supporting details in a section of text and extracts the main message.
Respondent: So this question he calls to the hiring office he wants to hire someone, at this later point he mentioned he need Marcia to help to place some ad and some trade release or something like that. And also he mentioned he need new sales director or marketing director in some date. So it is a replacement for Brian. Researcher:Anything said about “online”? Respondent: I heard online, but I forgot where it is. Respondent:So for the last question, you kind of get bits of information together? Respondent: Yea, try to integrate them.
Making an inference
The listener understands the information given and uses his background knowledge and logical reasoning to fill the missing information or the intended meaning of the speech.
Respondent: He already said forcefeeding should be applied to the patient, it must mean that he thought it would make her get better. Researcher: So the judge’s decision is to forcefeed the woman right? Respondent: Yes. Researcher: Then how did you know he thought it would make her better?

182
Codes Description SRP report segment
Respondent: It’s quite like an inference. He made the decision, it couldn't be that he wants to harm her. Researcher: It’s like you understood the information, you understood the judge’s decision and you made an inference? Respondent: Yes.
Using co-text or contexts to understand unknown words or phrases
The listener uses surrounding texts and linguistic knowledge to understand a particular word/phrase
Respondent: The next sentence is paradoxically, Facebook is creating, something is creating a divide, so I think the answer is here, becoz the last sentence is talking about something positive, and it’s now turning to something negative, and creating a divide is objective description, so I think there should be ‘paradoxically’. Researcher: Do you know the meaning of ‘paradoxically”? Respondent: Just forgot, and the speaker’s tone also indicates this, his tone is like talking to me the answer is here. His tone changes.
Interpreting about the speaker’s attitude
The listener understands the information given and interprets the attitude or intention of the speaker based on the tone, intonation and lexico-grammatical choices.
Respondent: I think the purpose of this question is to test whether the student can figure out which tone Sarah is using. I think it's either C or D. But very confusing until now. I think it's C, becoz she decided, I don't think she still is not decided, I don't think it's D. But I also think Sarah is not worrying enough. If I have to choose an answer I will choose C. Researcher: How can you tell she’s worrying? Respondent: From her tone, ‘er ... um... actually I don’t...’, her tone is like this. So I think it's C. Researcher: So she’s not confident? Respondent: Yes, so I think it's definitely not A not B, she should be happy, so I think C.

183
Codes Description SRP report segment
Inferring about the speaker’s reasoning
The listener understands the meaning of complex ideas and infers the relationships between them.
Respondent: I thought the speaker want to give an example to prove what she’s saying, becoz she’s the speaker, so that’s why I think the example is strongly needed to match with her statement, so I chose 'prove’.
Detecting key words The listener catches the key words/phrases in the recording, which helps him to interpret the meaning of other information or make a decision about the answer.
Respondent: The Turkey Day is boring, and he said ‘this is a big day in his hometown’, so he said you can imagine other days about the hometown.
Connecting related information
The listener connects information scattered at different places to verify the options
Respondent: First of all, I remember the man said ‘he thinks is ugly’, but after he said ‘we talked about cat person last week’, he immediately respond to the woman and said 'we think cat people are crazy', so option is close to this, so I chose C.
Relating to prior knowledge
The listener catches the information given and associates it with prior knowledge or personal experience.
Respondent: It reminds me of something I learnt before, I don’t know what kind of words in English, but maybe something like a kind of sound human cannot hear, but some animals can hear this kind of sound.

184
APPENDIX B: THE PERCENTAGE AGREEMENT AND KAPPA COEFFICIENTS OF DOUBLE CODING
Kappa Agreement
(%) A and B (%)
Not A and Not B (%)
Disagreement (%)
A and Not B (%)
B and Not A (%)
Connecting related information
Unweighted 0.13 98.93 0.08 98.85 1.07 0.60 0.47 Weighted by source size
0.17 99.22 0.08 99.14 0.78 0.38 0.40
Detecting key words
Unweighted 0.29 95.01 1.15 93.87 4.99 3.13 1.86 Weighted by source size
0.30 95.50 1.07 94.43 4.50 2.76 1.74
Making an inference\about the speaker's attitude
Unweighted 0.12 98.84 0.09 98.76 1.16 0.90 0.26 Weighted by source size
0.17 99.04 0.10 98.94 0.96 0.71 0.25
Making an inference\based on logical reasoning
Unweighted 0.08 97.49 0.13 97.37 2.51 1.84 0.67 Weighted by source size
0.07 97.94 0.09 97.85 2.06 1.50 0.56
Making an inference\based on overall understanding of the content
Unweighted 0.05 96.86 0.11 96.76 3.14 1.22 1.92 Weighted by source size
0.05 97.35 0.08 97.26 2.65 1.06 1.60
Making an inference\based on the speaker's the tone
Unweighted 0.37 99.32 0.20 99.12 0.68 0.23 0.45 Weighted by source size
0.32 99.28 0.17 99.11 0.72 0.25 0.46

185
Kappa Agreement
(%) A and B (%)
Not A and Not B (%)
Disagreement (%)
A and Not B (%)
B and Not A (%)
Recognising explicit information\to distinguish competing information
Unweighted 0.20 97.92 0.27 97.66 2.08 1.81 0.27 Weighted by source size
0.15 98.03 0.18 97.85 1.97 1.82 0.15
Recognising explicit information\to identify the correct answer
Unweighted 0.56 97.27 1.84 95.43 2.73 1.72 1.01 Weighted by source size
0.53 97.60 1.43 96.17 2.40 1.62 0.79
Relating to prior knowledge
Unweighted 0.00 99.93 0.00 99.93 0.07 0.07 0.00 Weighted by source size
0.00 99.89 0.00 99.89 0.11 0.11 0.00
Summarising ideas across a chunck of speech
Unweighted 0.36 98.93 0.31 98.63 1.07 0.89 0.18 Weighted by source size
0.30 99.00 0.22 98.78 1.00 0.83 0.17
Using cotext-contexts to understand unknown words or phrases
Unweighted 0.42 98.63 0.50 98.13 1.37 0.98 0.39 Weighted by source size
0.34 98.83 0.31 98.52 1.17 0.95 0.22
Overall Unweighted 0.49 98.12 0.42 97.70 1.88 1.21 0.67

186
APPENDIX C: ETHICS CLEARANCE PACKAGE
The following documents attached hereafter were submitted for ethical review and
approval was granted.
(1) JCU Low/Negligible Risk Checklist Form
(2) JCU Human Research Ethics Application Form
(3) JCU Information Sheet
(4) JCU Informed Consent Form
(5) Approval of data access from DELTA
(6) Clarification of the stimulated recall procedure
(7) Ethics Committee approval


Cairns - Townsville - Brisbane – Singapore CRICOS Provider Code 00117J
INFORMATION SHEET
PROJECT TITLE: “EFL listening development through diagnosis – an assessment-based study of listening sub-skills using Rasch measurement”
You are invited to take part in a research project on the mental processes while you listen to different types of spoken text. The study is being conducted by GUAN Yuanyuan and will contribute to the research project of obtaining PhD in Education at James Cook University.
You have been asked to participate in this study because you are a non-native speaker of English and have taken the DELTA test recently. I intend to accomplish the goal(s) of the research by asking participants to explain what is going on in their mind while they listen to conversations, radio interviews and short lectures. The investigation procedure will be implemented in a one-on-one setting by following the steps below:
1. You listen to the recording and select the most appropriate answer to the test items on the answer sheet. This will be video-taped as stimulus for subsequent recall process.
2. You listen to the recording section by section with pauses and explain how you listened to the recording and answered the questions. In the meantime, the researcher listens and takes notes of interesting comments made by the participant.
3. The researcher conducts an interview with you in which we will look at your answers together and listen to portions of your verbalisations.
If you agree to be involved in the study, you will be invited to be interviewed. The interview, with your consent, will be video-taped, and should only take approximately 1.5 hour of your time. The interview will be conducted at the English Language Centre at City University of Hong Kong, or a venue of your choice.
Taking part in this study is completely voluntary and you can stop taking part in the study at any time without explanation or prejudice.
If you know of others that might be interested in this study, can you please pass on this information sheet to them so they may contact me to volunteer for the study.
Your responses and contact details will be strictly confidential. The data from the study will be used in research publications and reports. You will not be identified in any way in these publications.
If you have any questions about the study, please contact GUAN Yuanyuan via [email protected] .
Principal Investigator: GUAN Yuanyuan School of Education James Cook University Mobile: Email: [email protected]
Supervisor: Name: Trevor BOND School: School of Education James Cook University (or other institution) Mobile:Email: [email protected]
If you have any concerns regarding the ethical conduct of the study, please contact: Human Ethics, Research Office James Cook University, Townsville, Qld, 4811 Phone: (07) 4781 5011 ([email protected])


Application for Data Access to the DELTA Project


Clarification of the retrospective stimulated recall procedure
The stimulated recall procedure will be implemented with individual volunteer participants in
a language lab with high quality acoustics. It will use three separate recordings:
A replay of the listening test audio file in simulated test conditions, during which
a video of listening test performance will be made, and, immediately after,
the recall interview will be audio-taped.
First, the subjects listen to the listening test audio file and answer the questions. Second, with
the aid of the video of listening test performance, the subjects verbalise what they were
thinking at the time they listened to the audio and answered the test questions. Last, the
investigator asks them to provide comments when the investigator asks for clarification.
Please clarify why the interviews will be video recorded.
- To clarify, the simulated test-taking process, not the interview, will be video-recorded.
According to Bowles (2010), the verbal report process should be video-recorded because
that allows for capturing gestures and other non-verbal cues unavailable in a simple audio
recording. When the students listen and answer test questions, they might jot down notes,
change their responses to questions, and show a variety of facial expressions. It is
relatively safe to assume that these seemingly trivial behaviors might be overt reflections
of mental activities and provide valuable insights into the listening/testing processes of
the subjects. The video of listening test performance will be used as prompts for the
subjects to recollect their thought processes.
Please clarify what will be captured on the video recording of the test taking.
- In the video-recording, the subjects will be captured to record their facial expression and
note-taking while taking the simulated listening test on the computer. The computer
screen will be captured at the same time by using a screen recorder to track the movement
of the mouse and its time-course, any forward and backward movements of the screen
while the subjects are listening and answering the questions;.

Please clarify what will happen to the videos from the tests after they have acted as prompts
for discussion in the interview and what will happen to the videos of the interviews. - The video segments of listening test performance and the recall interview audio will both
be transcribed. The transcriptions will then be analysed by independent coders by using
the NVivo programme to identify the sub-skills used in the listening test.

Cairns - Townsville - Brisbane – Singapore CRICOS Provider Code 00117J
INFORMATION SHEET
PROJECT TITLE: “EFL listening development through diagnosis – an assessment-based study of listening sub-skills using Rasch measurement”
You are invited to take part in a research project on the mental processes while you listen to different types of spoken text. The study is being conducted by GUAN Yuanyuan and will contribute to the research project of obtaining PhD in Education at James Cook University.
You have been asked to participate in this study because you are a non-native speaker of English and have taken the DELTA test recently. I intend to accomplish the goal(s) of the research by asking participants to explain what is going on in their mind while they listen to conversations, radio interviews and short lectures. The investigation procedure will be implemented in a one-on-one setting by following the steps below:
1. You listen to the recording and select the most appropriate answer to the test items on the answer sheet. This will be video-taped as stimulus for subsequent recall process.
2. You listen to the recording section by section with pauses and explain how you listened to the recording and answered the questions. In the meantime, the researcher listens and takes notes of interesting comments made by the participant.
3. The researcher conducts an interview with you in which we will look at your answers together and listen to portions of your verbalisations.
If you agree to be involved in the study, you will be invited to be interviewed. The interview, with your consent, will be audio-taped, and should only take approximately 1.5 hour of your time. The interview will be conducted at the English Language Centre at City University of Hong Kong, or a venue of your choice.
Taking part in this study is completely voluntary and you can stop taking part in the study at any time without explanation or prejudice.
If you know of others that might be interested in this study, can you please pass on this information sheet to them so they may contact me to volunteer for the study.
Your responses and contact details will be strictly confidential. The data from the study will be retained for at least 5 yearsand used in research publications and reports. You will not be identified in any way in these publications.
If you have any questions about the study, please contact GUAN Yuanyuan via [email protected] .
Principal Investigator: GUAN Yuanyuan School of Education James Cook University Mobile: Email: [email protected]
Supervisor: Name: Trevor BOND School: School of Education James Cook University (or other institution) Mobile:Email: [email protected]
If you have any concerns regarding the ethical conduct of the study, please contact: Human Ethics, Research Office James Cook University, Townsville, Qld, 4811 Phone: (07) 4781 5011 ([email protected])