An analysis of the redistributive effects of agricultural policy in Tuscany with comparative results...
32
Department of Economic Studies, University of Dundee, Dundee. DD1 4HN Dundee Discussion Papers in Economics An analysis of the redistributive effects of agricultural policy in Tuscany with comparative results for Scotland (Revised version: January 2007) Paul Allanson and Benedetto Rocchi Working Paper No. 193 September 2006 Revised Jan 2007 ISSN:1473-236X
-
Upload
independent -
Category
Documents
-
view
0 -
download
0
Transcript of An analysis of the redistributive effects of agricultural policy in Tuscany with comparative results...
Department of Economic Studies, University of Dundee, Dundee. DD1 4HN
Dundee Discussion Papers in Economics
An analysis of the redistributive effects of agricultural policy in Tuscany
with comparative results for Scotland
(Revised version: January 2007)
Paul Allanson and Benedetto Rocchi
Working Paper No. 193
September 2006 Revised Jan 2007 ISSN:1473-236X

An analysis of the redistributive effects of agricultural policy in Tuscany with comparative results for Scotland
Paul Allanson* and Benedetto Rocchi** *School of Social Sciences, University of Dundee, Scotland
**Department of Agricultural and Resource Economics, University of Florence, Italy
September 2006 (Revised version: January 2007)
Abstract
The paper provides an empirical study of the redistributive effects of agricultural policy in
Tuscany which finds that the provision of support increased absolute income inequality
within the agricultural community because the distribution of transfers was both vertically
and horizontally inequitable. These conclusions are shown to hold whether or not non-farm
incomes are taken into account and for a range of alternative definitions of the agricultural
community. The results for Scotland are broadly comparable except that the distribution of
transfers was progressive not regressive, reflecting differences between the two regions in the
degree of dependency of agriculture on support.
Keywords: Income redistribution; Agricultural Policy; Tuscany; Scotland.
JEL classifications: D63, I38, Q18.
Acknowledgements
The work for this paper was undertaken with financial support from the Carnegie Trust for
the Universities of Scotland and the Faculty of Arts and Social Sciences, University of
Dundee. The authors would also like to thank the Statistical Office of the Regional
Government of Tuscany and the Scottish Executive Environment and Rural Affairs
Department for making available the data employed in the study. All opinions expressed in
this paper are solely the responsibility of the authors.

1
1. Introduction
The improvement of the income position of the agricultural community is a prominent if
poorly defined objective of agricultural policy in many countries. In particular, one of the
main objectives of the Common Agricultural Policy (CAP) is ‘to ensure a fair standard of
living for the agricultural community, in particular by increasing the individual earnings of
persons engaged in agriculture’ (European Union, 2002, Article 33). However there has been
relatively little empirical work to characterise and quantify the effects of farm support
programmes on the distribution of income within the agricultural community. One set of
studies (see e.g. Roberts and Russell, 1996; Rocchi et al. 2005; Cavalletti and Rocchi, 2006)
has examined the distributional effects of agricultural policy using macroeconomic models in
which the agricultural household sector is disaggregated by total household income class. In
particular, Rocchi et al. (2005) present a SAM-based model for Italy which shows inter alia
that agricultural households in higher total income classes receive a larger share of the total
value of CAP support accruing to the sector. A second line of work (see e.g. Keeney, 2000;
OECD, 2003; Allanson, 2006a, 2006b) has sought to explore the issues using farm business
survey data. The use of micro-level data allows a more detailed characterisation of the
redistributive properties of agricultural policy, but limitations in farm business survey
coverage and content have typically restricted the scope of such studies to the commercial
farm sector and the analysis to measures of farming income. Thus Allanson (2006a, 2006b)
is only able to establish that agricultural support would have had an equalizing effect on the
distribution of farming income across full-time farms in Scotland but for the adverse
distributional consequences of horizontal inequities induced by farm support measures. What
remains to be shown is whether these estimates of the redistributive effects of the CAP are
specific to the empirical setting or might hold more generally for broader measures of
2
income, more inclusive definitions of the agricultural community and other regions of the
European Union.
The main contribution of this paper is to report the results of a microeconomic study of
the redistributive effects of agricultural support in Tuscany that serves to throw light on all
three of these issues. First, the study offers a broader analysis of the impact of farm income
support on the economic welfare of the farming community by taking into account both farm
and non-farm sources of income. Farm households that are entirely dependent on agricultural
production for their livelihoods are a minority, with most also relying on some combination
of income from other gainful activities, pensions, social security and other payments to a
greater or lesser extent (Eurostat, 1996). Yet the design of agricultural policy almost entirely
fails to take the overall income situation of farm households into account. Second the study
explores the implications of using less restrictive definitions of the agricultural community
than the commercial farms sector. In particular, the paper provides additional results based
on both “broad” and “narrow” definitions of the agricultural household sector, where the
former covers all households which derive some income from agriculture while the latter is
limited to those for which farming is the main source of income. Finally, the paper provides
a comparative study which can serve to establish whether the results obtained for Scotland
are peculiar to that country or might be more generally characteristic of the effects of the
CAP. The choice of Tuscany for this purpose is likely to highlight any variability in the
distributional consequences of the CAP across the European Union given the marked
differences in both output mix and farm structures between the UK and Italy. Conversely,
the identification of common features would help to establish the generality of any
conclusions regarding the redistributive effects of the CAP.
The paper is organised as follows. The next section briefly summarizes the measures
that are used to characterise and quantify the redistributive effects of agricultural policy. The
3
third section describes the population-weighted micro-level data employed in the analysis,
which are derived from the Italian Agricultural Business Survey (REA) for 2002 and, for
comparative purposes, the Scottish Farm Accounts Survey (FAS) for 2002/03. The following
section presents the main findings of the study on the redistributive effects of agricultural
support in Tuscany, comparing the results from using alternative definitions of income and
the agricultural community, and those obtained for Scotland. The final section offers a
summary and considers the need for further research into the redistributive effects of
agricultural policy across the whole of society not just the agricultural community.
2. Measurement of the redistributive effects of agricultural policy
The study is based on the methodology proposed in Allanson (2006b) to measure the
redistributive effects of agricultural policy due to the transfers accruing to farmers from the
provision of support. In this approach, the overall redistributive effect is defined as the
difference between the inequality of pre-transfer and post-transfer farm incomes.
Specifically, R=AX-AY is defined as an index of the overall redistributive effect, where AX
and AY are the absolute Gini indices of pre-transfer and post-transfer incomes respectively.
Hence, R will be equal to half the change in the average absolute difference between all
distinct pairs of incomes in the population as a result of the provision of support.
Alternatively, if the policy evaluation function is given by the Sen (1973) welfare index
W= Ay − , where y is average income, then R may be interpreted as how much more or less
would have to be given to each farmer under a distributionally neutral policy of flat-rate
payments to yield a welfare level equal to that under the actual support programme.
2.1 Decomposition of the overall redistributive effect
The index R is decomposed to provide an explicit characterisation of the redistributive
properties of farm income support measures. The first step in the procedure identifies
4
horizontal inequities due to the violation of the ‘classical’ principle of the equal treatment of
pre-transfer income equals. Such violations may arise due to systematic differences in the
organization and level of support for different commodities, such that the level of transfers
received by farmers with identical pre-transfer incomes depends upon the type of farm in
terms of the choice of enterprise mix. Moreover, even after controlling for both pre-transfer
income and farm type, the incidence of transfers may still vary due to the heterogeneity of
individual farms in terms of natural resource endowments, managerial ability and historical
development.
The key to this step is the specification of a set of ‘reference’ functions that determine
the post-transfer incomes that farmers with a given level of pre-transfer income would
receive in the absence of each of the two possible sources of classical horizontal inequity
(HI). Consider a population of N farms made up of an exhaustive set of K mutually exclusive
farm types (k = 1,... K). Let x=(x1,… xk,… xK), t=(t1,… tk,… tK) and y=(y1,… yk,… yK) be
the vectors of observations on pre-transfer income, transfers and post-transfer incomes
respectively, where xk, tk, and yk are constituent sub-vectors of observations on farms of type
k. By definition, y=x+t . Moreover the relationship between transfers and pre-transfer
incomes can be written as:
tk = E[tk| xk] + εk = fk(xk) + εk; k = 1,….K (1)
where the farm type transfer function fk(xk) is defined as the expected value of transfers
conditional upon type and pre-transfer income; and εk is a vector of ‘disturbance’ terms
having zero mean at each pre-transfer income level.
The characterisation of transfers given by (1) allows for two possible sources of classical
HI. First classical HI may arise between farms of the same type due to the dispersion of
transfers tk about the conditional mean E[tk| xk]. Accordingly, the non-stochastic reference
function hW(x)=(g1(x1),…gk(xk),…gK(xK)), where gk(xk)=xk+ fk(xk), is identified as the vector
5
of post-transfer incomes that the population of farms would receive in the absence of within
type HI. Let AW be the absolute Gini index of hW(x) then within type HI is measured as the
difference in inequality between hW(x) and y, that is HW=AW–AY, which will be
asymptotically non-positive though this condition may not hold in any particular finite
sample drawn from the population. Only if εk=0, and hence y=hW(x), will there be a one-to-
one mapping from pre-transfer to post-transfer incomes for type k farms and hence no within
type HI.
Classical HI may also arise due to systematic discrimination between farm types, which
is assumed to change the distribution but not the overall value of transfers at any given pre-
transfer income. Accordingly, the non-discriminatory reference function hB(x)=E[y| x] may
be identified as the vector of post-transfer incomes that the population of farms would expect
to receive in the absence of discrimination, where:
hB(x) = ∑=
K
k 1
wk(x) gk(x) = x + ∑=
K
k 1
wk(x) fk(x) ≡ x + fB(x); ∑=
K
k 1
wk(x) = 1; (2)
the weights wk(x) are locally determined by the relative frequencies of the farm types at any
given pre-transfer income, fB(x) is identified as the non-discriminatory transfer function, and
1 is the unit vector. Let AB be the absolute Gini index of hB(x) then between type HI is
measured as the difference in inequality between hB(x) and hW(x), that is HB=AB–AW, which
again will be non-positive asymptotically but may not be so in finite samples. Only if
fk(xk)=f(xk) ∀k, and hence hW(x)=hB(x), will there be a one-to-one mapping from pre-transfer
incomes to expected post-transfer incomes for all farms and hence no between type HI.
The identification of the classical HI contributions to the overall redistributive effect R,
leaves a residual equal to the difference in inequality between pre-transfer and non-
discriminatory post-transfer incomes, AX-AB . The final step in the decomposition procedure
decomposes this residual into separate horizontal and vertical components:
6
VHCyGxGCyAA RBBXBBBBX +=−+−=− ][][ (3)
where GX and GB are the (ordinary) Gini coefficients of pre-transfer and non-discriminatory
post-transfer income, x and By are the corresponding mean incomes, and CB is the
concentration index obtained when non-discriminatory post-transfer incomes are ranked by
pre-transfer income.
The horizontal inequity component HR = ][ BBB GCy − in (3) measures the redistributive
effect of systematic changes in the ranking of farms between the pre-transfer and non-
discriminatory post-transfer income distributions, where [CB – GB] is the reranking index of
Atkinson (1980) and Plotnick (1981). HR is non-positive by definition, capturing the idea
that systematic reranking is a manifestation of procedural unfairness in the provision of
support. Only if hB(x) is increasing in x over the whole range of pre-transfer incomes will
there be no systematic reranking of farms.
Finally the vertical equity component V = [ BBX CyGx − ] =- CTB Bt measures the impact
of differences in non-discriminatory policy transfers between farms with different pre-
transfer incomes, which may be interpreted as an index of gross redistributive effect. This in
turn depends on the distribution and scale of policy transfers, where CTB is the concentration
coefficient of non-discriminatory transfers ranked by pre-transfer income and Bt is the mean
level of non-discriminatory transfers. Let D=-CTB be a disparity index that is positive
(negative) if support is progressive (regressive) in absolute terms such that mean non-
discriminatory transfers are a decreasing (increasing) function of pre-transfer income, and
that equals zero if the transfer schedule is uniform. For any given D, V will be proportional
to the average level of non-discriminatory transfers Bt . In general, V will be more positive
(or less negative) than R due to the various sources of HI that detract from the redistributive
effectiveness of policy.
7
2.2 Reference function estimation
The reference functions hW(x) and hB(x) may be directly estimated as in Allanson (2006b),
but an indirect approach based on the estimation of the transfer functions is preferable
inasmuch as this yields more meaningful regression summary statistics. Accordingly, the set
of farm type transfer functions fk(xk) in (1) is estimated from a sample consisting of nk
observations on transfers and pre-transfer incomes for each farm type. The choice of a
suitable non-parametric technique for the purpose gets round the need to impose any
parametric assumptions on the form of the fk(xk) functions. In this study, the variable span
smoother of Sasieni (1998) is used to fit a local linear regression to the observations on tk and
xk in the neighbourhood of each data point in the sample. The same local regression
technique is also applied to the pooled sample of n=∑nk observations in order to directly
estimate the non-discriminatory transfer function fB(x) in (2).
Local linear regression may be expected to provide reasonable approximations to fk(xk)
and fB(x) so long as the curvature of the unknown functions is not excessive (Hastie and
Loader, 1993). Moreover, the procedure ensures that the predicted level of non-
discriminatory transfers at any given pre-transfer income will automatically reflect the farm
type composition of the pooled sample in the neighbourhood of that point.
3. Data sources and derivation of variables
Calculation of the redistributive effect measures requires access to individual farm data on
pre-transfer and post-transfer incomes. The empirical study is based on weighted micro-level
data from the Italian Agricultural Business Survey (REA) for Tuscany in 2002 and the
Scottish Farm Accounts Survey (FAS) for the farming year 2003/2003. The two surveys
form the main source of microeconomic data on farm businesses in their respective countries,
with sub-samples from each forming part of the European Union’s Farm Accountancy Data

8
Network (FADN). Nevertheless there are significant differences between the surveys in
terms of coverage and content, which constrain the common definition and derivation of
variables used in the study.
3.1 Italian data1
The Italian Farm Business Survey (REA) has been carried out annually since 1999 by the
National Institute of Statistics (ISTAT, 2005). The main goal of the survey is to provide
microeconomic information compatible with the new European System of National Accounts
(ESA95) with reference to the agricultural sector. Accordingly the REA sample is designed
to represent the universe of agricultural holdings, with farms chosen to be representative of
their economic size and type at the regional level where the economic size of businesses is
measured in terms of standard gross margins and the farm type classification is based on the
relative importance of the various crop and livestock enterprises. The inclusion in the
observation field of all holdings makes the survey representative of the totality of agricultural
households, whatever the importance of farming as a source of income.
The REA sample for Tuscany in 2002 consisted of 643 farms, of which 569 were
operated by households. Data are available on a sufficient range of financial variables to
identify farming income but the underlying physical quantities are not generally recorded in
the database. Complete data on hours and remuneration, both on and off the farm, are also
available for each economically active farm household member and for any other partners
and directors who are actively engaged in the farm. This allows for an estimation of the total
income of farming households and an assessment of their relative position within the income
1 Access to the Italian data was authorised as part of the research project on “The use of
microeconomic information for the analysis of income distribution in Tuscan
Agriculture” funded by the Regional Government of Tuscany and carried out by the
Department of Agricultural and Resource Economics of the University of Florence.
9
distribution of the society. The data is weighted by size and type according to the number of
holdings enumerated in the 5th General Agricultural Census 2000, to yield summary statistics
for the population of agricultural holdings. With 83459 farms in the sampling frame, the
sampling fraction for each size and type is 0.77 per cent on average.
3.2 Scottish data
The FAS is an annual survey of farm businesses carried out on behalf of the Scottish
Executive Environment and Rural Affairs Department (SEERAD). It is designed as a survey
of full-time commercial businesses representing the main farm types in Scotland. The field
of observation therefore excludes farms smaller than 8 Economic Size Units (ESUs) as well
as specialist livestock units larger than 200 ESU and certain minor farm types (most notably
horticulture and specialist pigs and poultry farms). Farms in the survey are chosen to be
representative of their economic size and type, but part-time farmers and those with
substantial involvement in other agricultural or non-farm activities are excluded as a rule so
the survey results are likely to understate both the prevalence of pluriactivity and the
importance of non-farm income sources.
The survey is conducted on an accounting year basis with a typical year-end in early
March so FAS 2002/03 centres on the 2002 production and subsidy year. Accounts for 429
farms were collected in 2002/03, but the effective sample size is reduced to 376 once farms
directly affected by the FMD outbreak are excluded from the analysis.2 Data was collected
on a wide range of physical and financial variables, including crop areas, livestock numbers,
quotas, production, sales, revenues, subsidies and costs, which allows for the detailed
identification of policy transfers as well as of farm income, together with information on
other sources of income recorded by income class. The data is weighted by size and type
2. SEERAD (2004) notes that the resultant sub-sample is still sufficient “to give a
representative picture of full-time Scottish farm businesses”.
10
according to the number of farms enumerated in the June 2002 Agricultural Census, to yield
summary statistics for the population of full-time farms. With 14708 farms in the sampling
frame, the sampling fraction for each size and type is 2.6 per cent on average.
3.3 Definition and derivation of variables
The first issue relates to the identification of the agricultural community which is a
notoriously poorly defined concept (Hill, 1990). In the case of Italy, the information
available allows us to work with three different definitions of the agricultural community that
are commonly used in the literature. The most inclusive is based on the total population of
holdings, defined as the set of all farms of at least 1 hectare plus those of less than 1 hectare
producing more than a specified amount of output (at least 2066 Euro in the case of Italy) or
marketing a certain proportion of their output. This is the field of observation covered in the
General Census of Agriculture and corresponds both with the universe as defined by FADN
and the definition of 'agriculture' as an industry in the National Accounts framework. This
universe will encompass some holdings that are operated by corporate entities using hired
managers and workers exclusively. A second more restrictive definition includes only
holdings operated by individuals or households, whether with or without the employment of
additional hired labour. This corresponds to the broad definition of the agricultural
household institutional sector as employed in the Total Income of Agricultural Households
methodology (Eurostat, 1995) and may be further restricted to include only holdings operated
by households that gain the major part of their income from agriculture. Finally, the universe
includes both commercial and non-commercial holdings where the former are defined by
FADN to be farms that are “large enough to provide a main activity for the farmer and a level
of income sufficient to support his or her family”. A third definition therefore is limited to
those holdings that can be classified as commercial in the sense of exceeding a minimum
economic size, which in the case of Italy in 2002 was set by FADN at 4 ESU. For Scotland,
11
the limited information available restricts the analysis to this third commercial definition of
agriculture, for which the threshold size was fixed at 16 ESU in 2002, within which may be
identified a sub-set of farms operated by individuals or households.
The second question concerns the definition of post-transfer income. For Italy, the
information allows us to consider concepts of both farm income and total household income.
(Post-transfer) farm income is measured by cash income, which represents the cash return to
the group with an entrepreneurial interest in the farm, which typically will consist only of
members of the household,3 for their manual and managerial labour and on all their
investment in the business. Being the difference between total receipts and total expenditure,
this measure is seen to correspond closely to the income position as perceived by the farm
household (see, for example, Department of the Environment Food and Rural Affairs
(DEFRA), 2002) and to be broadly comparable with other non-farm sources of income.
(Post-transfer) total household income is equal to the sum of farm income and non-farm
incomes, including income from other gainful activities, pensions, social security and other
payments. Using information on the total number of household members further allows the
measurement of household income on a per-capita basis. This measure may be more
appropriate for an analysis of the impact of agricultural policy on the welfare of the
agricultural community. For Scotland, cash income as recorded in FAS must be
supplemented by wages paid to family workers, which are separately identified, to yield a
comparable measure of farm income. FAS also records non-farm income sources, but of the
farmer and spouse only, leading to a total income measure which can serve as a lower-bound
estimate of household income that will be exact if there are no other household members that
3 Household and non-household members of the entrepreneurial group are not separately
identified in the REA survey; however numbers of the latter are likely to be negligible. In
the case of Scotland, 97% of farms in the FAS sample operate as sole traders and
partnerships, of which only 1% include non-family members.
12
have non-farm sources of income. A per capita measure is also workable using information
on the number of household members actively involved in the management or operation of
the farm business.
Pre-transfer income is simply defined as post-transfer (farm, total household or per
capita) income, less the net value of transfers due to the provision of support, where the latter
is assumed equal to that part of gross support which accrues to farm occupiers as owners of
factors of agricultural production. Three types of support are identified in the analysis. First,
to calculate the impact of market price support on the value of farm output and the cost of
purchased feed and seed inputs, estimates of the gap between domestic market and border
prices for agricultural commodities, measured at the farm gate level, are taken from OECD
(2005) and Rapanà (2006). As the available data on Tuscany refer only to broad categories
of output, namely crops, livestock and livestock products, weighted estimates of market price
support by output category are constructed for this purpose using FADN data on the average
composition of farm output by farm type and region.4 Second, direct support payments cover
those payments made under CAP ‘Pillar I’ commodity schemes, after taking account of the
implicit loss in revenues resulting from obligatory set-aside requirements under the Arable
Area Payment scheme. Third, the value of other grants and subsidies includes all other
payments to farmers except for those in respect of permanent improvements.
The net value of this support to farmers will depend on the extent to which it results in
increased returns to the farm-owned factors of production and hence in increased farm
incomes. Following OECD (2003, Part II), the static effect on farm income of a unit increase
in output revenues, whether due to market price support, output payments or a reduction in
set-aside requirements, is identified as the combined income share of the farm-owned factors 4 The use of individual farm rather than FADN farm-type average data on output
composition by output category yields very similar estimates of the main redistributive
effects in the case of Scotland.
13
of production, while that of a unit increase in direct payments, grants or subsidies to
individual inputs (i.e. land and breeding livestock) is simply the farm-owned share of those
inputs. Estimates of the combined income share of land, labour and capital by farm type are
derived from the cross-section survey data as the average of the ratio of gross value added to
output revenue. Income shares attributable to land and labour are then separately estimated
from sub-samples containing only those farms with hired labour and rented land respectively,
to leave a residual share that is assumed to accrue to capital. Farm-owned shares of factors of
production are derived for each farm from the sample data. This approach recognizes that
farmers may not be the ultimate beneficiaries of farm support programmes, which will also
reward other suppliers of agricultural inputs including landlords. Moreover, the effective
incidence of support is allowed to vary depending on the mix of support measures.
4. Empirical findings
This section focuses on the results for Tuscany relating to the redistributive effects of
agricultural policy on the farm incomes of all holdings, and on the total household incomes of
the broadly defined agricultural household institutional sector. Comparisons are drawn where
appropriate with the results from using alternative definitions of post-transfer incomes and
the agricultural community, and those obtained for Scotland.
4.1 Descriptive statistics
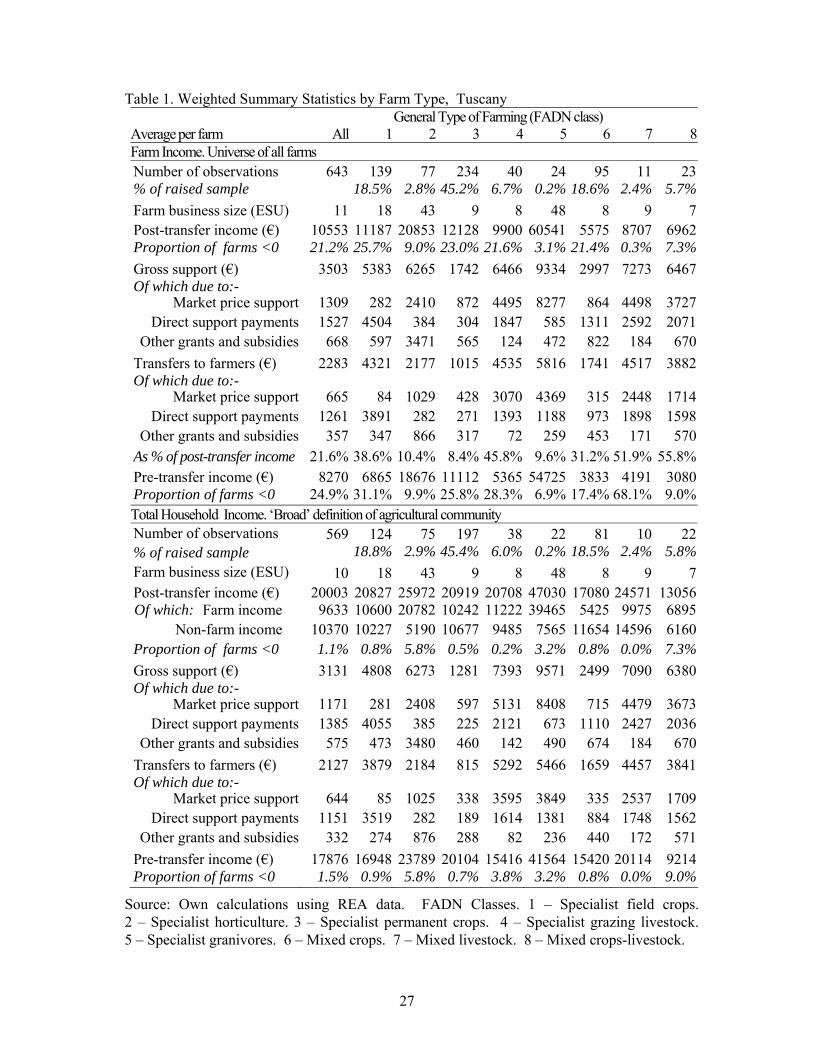
The upper panel of Table 1 presents weighted summary statistics on farm incomes by farm
type for the universe of all farms in Tuscany. The first column presents the results for all
farm types and shows that farm income was 10553 euros on average, but that 21% of farms
recorded losses in spite of the support available. The main source of support was provided in
the form of direct payments but market price support was also significant with domestic
producer prices for most livestock and livestock products well above corresponding world
14
price levels. Leakages to other owners of factors of production mean that farmers are
estimated to have received only 65% of the gross value of support on average. Overall, the
net value of transfers to farmers was 22% of post-transfer farm incomes, compared to 103%
in Scotland, reflecting the lower levels of support for Mediterranean products (Tracy, 1998).
The remaining columns of the top panel present comparable summary information for
the eight distinct farm types identified in the FADN General Type classification. Post-
transfer income levels were highest on specialist granivore and horticulture farms, which are
typically much larger business enterprises. Direct payments only provided the main source of
support on crop farms, but are much more significant as a source of transfers given the lower
income transfer efficiency of market price support measures.5 Gross support varied across
types, with the highest levels on specialist granivore farms and the lowest on specialist
permanent crop farms. Average transfers to farmers follow a broadly similar pattern but
differences in transfer efficiency rates lead to a lower degree of variation across farm types.
Controlling for average levels of post-transfer income, dependency on policy transfers by
farm type varies inversely with international competitiveness (see IRPET, 2004), being
particularly low on specialised permanent crop and specialised horticulture farms engaged in
the production of wine and ornamental plants respectively. Overall, the dispersion of average
incomes by farm type was lower for post-transfer incomes than for pre-transfer incomes,
implying that the provision of support generally served to reduce rather than exacerbate farm
income disparities between farm types in Tuscany. This was also the case in Scotland (see
Allanson, 2006b), though OECD (2003, Part I) reports that the provision of support increases
average income disparities between farm types in most countries.
5 The average value added share of output revenues is positive for all farm types, ranging
from 0.44 to 0.70, as is the residual share accruing to the farm-owned factors of
production on all but a handful of mixed cropping farms that are heavily reliant on both
hired labour and rented land and for which the residual share is set equal to zero.
15
The lower panel of Table 1 reports a similar set of summary statistics on total household
incomes by farm type for the broad definition of the agricultural community. The first
column again presents the results for all farm types and shows that average total household
income was 20003 euros, of which just less than 50% was derived from farming. Even net of
the value of policy transfers, less than 2% of farms recorded a negative income. Total
household income levels were highest on specialist granivore farms and lowest on mixed
crops-livestock farms, with the ranking of the farm types by total household income roughly
the same as that by farm income. In contrast, the ranking of farm types by non-farm income
is almost the reverse of that by farm income, with specialist granivore and horticulture farms
particularly dependent on farming as a source of income relative to the much lower levels of
dependence on non-specialised crop and livestock farms. Overall, non-farm income sources
generally served to reduce rather than exacerbate income disparities between farm types in
Tuscany with the dispersion of total household incomes by farm type slightly lower than that
of farm incomes. The picture that emerges of the relationships between farm, non-farm and
total household incomes is broadly similar to that painted by Hill (1999) from reviews of
available microeconomic data in a number of countries.
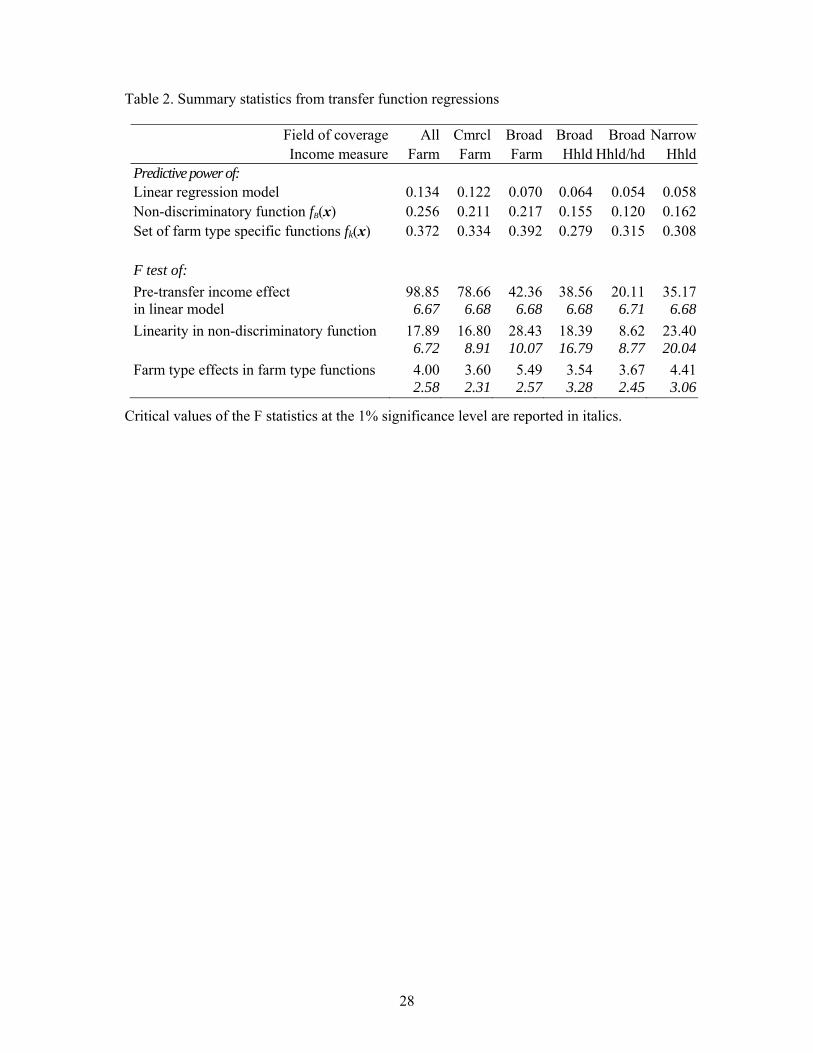
Table 2 reports regression summary statistics from the non-parametric estimation of the
transfer functions, together with comparable results from the linear regression of transfers on
pre-transfers incomes. The first point to note is that the predictive power of the non-
discriminatory transfer function, defined as the square of the correlation coefficient between
the fitted and observed values (see Zheng and Agresti, 2000), is superior to that of the linear
model for all definitions of the agricultural community and measures of income. Pre-transfer
income is highly significant in the linear model, but the assumption of linearity can generally
be rejected in favour of the non-discriminatory function using an appropriate F test procedure
(Cleveland and Devlin, 1988, p.599). Second the predictive power of the set of farm type
16
functions is superior to that of the non-discriminatory function in all cases. The set of
restrictions implicit in the pooled non-discriminatory function are consistently rejected,
implying that farm type had a significant influence on the level of transfers conditional on
pre-transfer income. Third, the predictive power of the non-parametric models is higher
using the farm rather than the household concept of income, which is not unexpected in the
absence of any direct link between transfers and non-farm incomes.
Table 3 presents the main findings of the study for Tuscany. The first column provides
the results on the redistributive effects of agricultural policy on farm incomes for the universe
of all farms. Absolute inequality in post-transfer farm incomes is shown to have been
substantial, implying that the average absolute income differential between farms was nearly
double average income. In comparison, the distribution of pre-transfer income exhibited
somewhat lower levels of absolute inequality. The provision of support thus increased
absolute income differentials as indicated by the negative values of the index of net
redistributive effect R which is significantly different from zero at the 1% level. Overall,
agricultural policy increased average farm income disparities by 15 per cent.
The decomposition of R reveals three main points of interest. First, the distribution of
non-discriminatory transfers was regressive in absolute terms, as indicated by the negative
values of the vertical redistribution and disparity indices, V and D. By implication, farmers
with high pre-transfer incomes received a more than equal share of non-discriminatory
transfers, which is consistent with the findings reported in Rocchi et al. (2005) for Italy as a
whole. Second, the redistributive impact of the regressive distribution of non-discriminatory
transfers was reinforced by the combined effect of the various sources of horizontal inequity,
as measured by the sum of the indices HR, HB and HW. Third, the redistributive effect of
within farm type HI was the dominant source of horizontal inequities, with neither the
estimate of between type HI nor that of the systematic reranking effect significantly different
17
from zero at the 5% level. By implication, the main factor underlying horizontal inequities
was the stochastic nature of the relationship between transfers and pre-transfer incomes at the
farm type level, rather than systematic discrimination between farm types due to the
commodity organisation of agricultural support or systematic re-ranking due to the presence
of income traps in the non-discriminatory benefit schedule.
The second column gives results on the redistributive effects of agricultural policy on
farm incomes for commercial farms only. By definition commercial farms are of above
average economic size and exhibit correspondingly higher average post-transfer incomes than
the universe of all farms. Higher average income disparities also emerge due to the
elimination of the mass of small non-commercial farms with similar income levels to each
other. Moreover, the negative redistributive impact of policy is greater for two reasons. First
the magnitude of V increases because the higher average value of transfers to commercial
farms leads to an increase in Bt which is only partly offset by the resultant decrease in the
disparity index D. Second within HI is higher because the conditional absolute variation in
transfer levels is increasing in pre-transfer incomes.
Comparable results to column 2 are given in the first column of Table 4 for the
commercial farm sector in Scotland. Commercial farms in Scotland must be larger than 16
ESU so it is not surprising that average income and transfer levels are higher and that the size
of the absolute redistributive effects is correspondingly greater. What stands out in contrast
to the Tuscan results is the finding that agricultural support in Scotland was progressive not
regressive in absolute terms. However this finding does not indicate that the nature of the
support provision in Scotland was fundamentally different, with transfers roughly
proportional to the volume of production in both regions (cf. European Commission, 1991).
Rather it reflects the fact that the majority of Scottish farms were engaged in enterprises that
were loss-making but for the provision of support, such that transfers in Scotland were
18
negatively not positively correlated with pre-transfer incomes (see Allanson, 2006b). In
general, the vertical stance of agricultural policy in a region may be expected to reflect the
degree of dependency of the region’s agriculture on support, with Tuscany and Scotland
towards opposite ends of the spectrum within the European Union (see Zanias, 2002, Table 1;
European Commission, 2001, Map 5.6).
Columns 3 and 4 of Table 3 give the results for Tuscany on the redistributive effects of
agricultural policy on farm and total household incomes for farms run by individuals and
households, that is for the broadly defined agricultural community. The first main finding
that emerges from the two sets of results is the increase in absolute inequality when passing
from a farm to a household definition of income. Farm households with low farm incomes
tend to have higher non-farm incomes than those with higher farm incomes so the distribution
of non-farm incomes is progressive in absolute terms with respect to farm incomes.
Nevertheless, taking non-farm incomes into account increases income inequality because of
differences in the levels of non-farm income earned by households with similar levels of farm
income (i.e. due to horizontal inequities in the incidence of non-farm incomes). Second, the
vertical stance of agricultural policy appears less regressive relative to the distribution of pre-
transfer income when using the total household definition of income. This is due to the re-
ranking of households in the pre-transfer distribution when non-farm incomes are taken into
account, leading to a reduction in the negativity of the disparity index D as farm-income poor
households with low policy transfers move up the distribution at the expense of those with
higher transfers. Third, the use of the total household income concept leads to an increase in
measured within HI, as might be expected given that the provision of agricultural support is
contingent on factors that are not directly related to non-farm incomes. In contrast, the likely
effect on between HI is more ambiguous depending on the nature of any biases in agricultural
policy relative to the non-farm income potential of households by farm type. And the impact
19
on the systematic reranking effect is likely to be small unless the relationship between non-
farm and farm incomes is highly non-monotonic (see Hill, 1999, for a summary of evidence
on this point).
Columns 5 of Table 3 also presents results for the broad agricultural community, but
with total income measured in per capita terms to accord with the concern for ‘the individual
earnings of persons engaged in agriculture’ expressed in the founding objectives of the CAP.
The average number of household members is 1.77, so income levels, absolute income
inequality and absolute redistributive effects are all understandably smaller when measured
on an individual rather than a household basis. The distribution of transfer is also less
regressive, as shown by the smaller negative value of the disparity index, reflecting the
positive association between household income and household size that is observed in
Tuscany (see Lam, 1997). Interpreting the income per capita results in welfare terms
(Atkinson and Bourguignon, 2000), annual transfers per household member could have been
cut by €612 with no effect on welfare if it had been possible to devise a distributionally
neutral policy regime, or by roughly half the average per capita transfer observed in practice.
Column 6 of Table 3 gives the results on the redistributive effects of agricultural policy
on total household incomes for the narrow rather than the broad definition of the agricultural
community. Limiting the size of the community in this way leads to an increase in both the
average economic size of farms and total household incomes. Moreover, the nature of the
threshold criterion leads to an increase in income disparities due to the elimination of the
mass of households with low farm incomes but high non-farm incomes. Finally, the negative
redistributive impact of policy R is also greater, both because V is more negative as the higher
average level of transfers Bt to farms more dependent on farming as a source of income is
only partially offset by the resultant decrease in the disparity index D, and because of the
increase in within HI due to the higher dispersion in transfer levels on farms with higher pre-
20
transfer incomes. These findings mirror those obtained from the comparison between all and
commercial farms on the basis of farm incomes.
Finally, columns 2, 3 and 4 of Table 4 give results for Scotland on the redistributive
effects of agricultural policy on farm, total household and per capita household incomes for
commercial farms run by individuals and households. These results must be treated with
some caution given the limitations of the data both on total income and household size.
Nevertheless the main findings that emerge when passing from a farm to a household
definition of income are similar to those for Tuscany. First, the distribution of household
incomes would have been less unequal than that of farm incomes if it had not been for the
adverse consequences of horizontal inequities in the incidence of non-farm incomes. Second,
the vertical stance of agricultural policy appears more progressive relative to the distribution
of pre-transfer income when using the total household definition of income due to the re-
ranking of households in the pre-transfer distribution when non-farm incomes are taken into
account. Third, the use of the total household income concept leads to an increase in
measured within HI, reflecting the inherent limitations of agricultural support as a means to
improve the overall welfare of the farming community. However, the distribution of
transfers is somewhat less progressive when household income is measured on a per capita
basis in spite of a similar positive association between household size and total income.
5. Conclusions
The main purpose of this paper has been to explore the robustness of estimates of the
redistributive effects of agricultural policy to the use of alternative measures of income and
definitions of the agricultural community. The European Commission has for many years
expressed concerns about the inequitable distribution of farm income support (European
Commission 1991, 1997, 2002) and in the recent Mid Term Review of Agenda 2000 made
21
various proposals to improve the targeting of direct support payments (European Commission
2002, 2003). The decoupling of most direct payments from production can only increase the
extent to which the purpose and distribution of support will be subject to question in the future.
The methodology employed in the paper is based on the use of population-weighted
micro-level data to evaluate changes in the distribution of income within the agricultural
community due to the provision of support. More specifically, the overall redistributive
effect of agricultural policy is measured as the difference between the absolute Gini indices
of pre-transfer and post-transfer incomes. This is a measure of the change in absolute
inequality, which provides a benchmark of distributional neutrality more in accord with both
public and official perceptions of fairness in the distribution of farm support than one based
on the concept of relative inequality. The measure may be interpreted as the monetary value
per farm of the change in inequality due to the provision of support. Moreover it may be
decomposed into a vertical redistribution effect and various HI components, and thus serves
not only to quantify but also to characterise the redistributive effect of agricultural policy.
The main set of empirical results presented in the paper are based on an analysis using
individual farm records for 2002 from the Italian Agricultural Business Survey (REA) of
Tuscany. These show that the provision of support increased absolute income inequality
within the agricultural community because the distribution of transfers was both vertically
and horizontally inequitable. The regressive incidence of transfers implies that farms with
higher pre-transfer incomes also tended to receive larger policy transfers, consistent with the
general perception that the bulk of agricultural support goes to those that do not need it
(OECD, 2003). Horizontal inequities largely arose due to the stochastic nature of the
relationship between transfers and pre-transfer incomes at the farm type level, rather than
because of either systematic discrimination between farm types due to the commodity
organisation of support or systematic reranking as a result of income traps in the transfer
22
schedule. The variation in the value of transfers received by farms of the same type with
similar pre-transfer incomes points to the imperfect targeting of support under the CAP (see
Allanson, 2006b, for further discussion).
The paper demonstrates that these findings concerning the redistributive properties of the
CAP are robust to the specification of alternative measures of income and definitions of the
agricultural community. First, moving from a farm to a total household measure of income
tends to exacerbate post-transfer income differentials, but reduce the negative redistributive
effects of agricultural policy as the regressivity of transfers is somewhat moderated by the re-
ranking of farms in the pre-transfer income distribution when non-farm incomes are taken
into account. Expressing total incomes in per-capita terms, that is on an individual rather
than a household basis, leads to a further slight reduction in the regressivity of transfers due
to the positive association between household income and size. Nevertheless the increase in
income differentials due to the provision of support remains substantial relative to the
average level of both transfers and post-transfer incomes. Second, moving from less to more
inclusive definitions of the agricultural community, by relaxing the thresholds on the size of
holding or dependence on farming income, tends to decrease post-transfer income
differentials due to the inclusion of a mass of smaller holdings with low incomes. The
redistributive effect of agricultural policy also falls as the impact of lower average transfers is
only partially offset by resultant increases in transfer regressivity, but remains negative.
Additionally, the paper shows that to the extent that it is possible to generate comparable
results for Scotland using Farm Accounts Survey data, then these tend to confirm the Tuscan
findings in spite of the marked differences in both agricultural structures and average support
levels between the two regions. Indeed, the only substantive difference in the results is the
finding that the distribution of transfers is progressive not regressive in Scotland as a result of
the chronic dependence of Scottish agriculture on support. The broad concordance in the
23
results suggests that the findings of the study may be more generally characteristic of the
redistributive properties of the CAP throughout the European Union, with the vertical stance
of agricultural policy in a region primarily determined by the degree of dependency of the
region’s agriculture on the provision of support.
Nevertheless the analysis is still confined within the agricultural household institutional
sector, that is the subset of households for which farming is a source of income (whether
primary or not). A fuller analysis would require a sample on the whole of the household
sector, with the possibility to identify agricultural policy transfers both to households within
the agricultural community and from those in other sections of society. Only then will it be
possible to definitively assess the extent to which agricultural policy is capable of both
identifying remaining low income problems among agricultural households and ensuring the
equitable treatment of the agricultural community in relation to the rest of society.
24
References
Allanson, P. (2006a). The redistributive effects of agricultural policy on Scottish farm
incomes, Journal of Agricultural Economics, 57, pp.117-128.
Allanson, P. (2006b). On the characterisation and measurement of the redistributive effects of
agricultural policy. Dundee Discussion Papers in Economics, No. 188. University of Dundee.
Atkinson, A.B. (1980). Horizontal equity and the distribution of the tax burden. In H. Aaron
and M.J. Boskin (eds.), The Economics of Taxation. Washington D.C., Brookings Institute,
pp.3-18.
Atkinson, A.B. and Bourguignon, F. (2000). Income distribution and economics. In A.B.
Atkinson and F. Bourguignon (eds.), Handbook of income distribution. Amsterdam,
Elsevier, pp.1-58.
Cavalletti, B. and Rocchi, B. (2006). Efficiency grounds and welfare effects in decoupling
farm support. Insights from an AGE model of the Italian economy, International Journal of
Sustainable Development, 9(2), pp. 106-121.
Cleveland, W.S. and Devlin, S.J. (1988) Locally Weighted Regression: An Approach to
Regression Analysis by Local Fitting, Journal of the American Statistical Association, 83, pp.
596-610
Department for Environment, Food and Rural Affairs (2002). Farm incomes in the United
Kingdom 2000/01. London, HMSO.
European Commission (1991). The development and future of the CAP - Reflections paper of
the Commission. COM(91) 100 final, Brussels.
European Commission (1997). Agenda 2000: For a stronger and wider Europe. COM(97)
2000, Supplement to the Bulletin of the European Union 5/97, Luxembourg, Office for
Official Publications of the European Communities.
European Commission (2001). Study on the impact of community agricultural policies on
economic and social cohesion. Brussels, Directorate-General for Regional Policy.
European Commission (2002). Communication from the Commission to the Council and the
25
European Parliament on the Mid-term Review of the Common Agricultural Policy.
COM(2002) 394 final, Brussels.
European Commission (2003). Explanatory Memorandum: A long-term policy perspective
for sustainable agriculture. COM(2003) 23 final, Brussels.
European Union (2002). Consolidated versions of the Treaty on European Union and of the
Treaty establishing the European Community, Official Journal of the European Communities,
C325, pp.33-184.
Eurostat (1995) Manual of the total income of agricultural households, (Rev.1). Theme 5
Series E. Luxembourg, Eurostat.
Eurostat (1996). Total income of agricultural households. 1995 Report. Luxembourg, Office
for Official Publications of the European Communities.
Hastie, T. and Loader, C. (1993). Local regression: automatic kernel carpentry, Statistical
Science, 8, pp.120-129.
Hill, B. (1990). In search of the Common Agricultural Policy’s ‘agricultural community’,
Journal of Agricultural Economics, 41, pp.316-326.
Hill, B. (1999). Farm household incomes: Perceptions and Statistics, European Review of
Agricultural Economics, 15, pp.345-358.
IRPET (2004). Economia e Politiche Rurali in Toscana. VI° Rapporto. Florence, IRPET/Arsia.
ISTAT (2005). I risultati economici delle aziende agricole Anno 2002, Statistiche in Breve, 7
giugno, www.istat.it/salastampa/comunicati/non_calendario/20050607_00/.
Keeney, M. (2000). The distributional impact of direct payments on Irish farm incomes,
Journal of Agricultural Economics, 51, 252-265.
Lam, D. (1997) Demographic variables and income inequality. In M.R. Rosenzweig and O.
Stark (eds.), Handbook of population and family economics, Volume 1B. Amsterdam,
Elsevier Science, pp.1015-1059.
Lerman, R.I. and Yitzhaki, S. (1989). Improving the accuracy of estimates of Gini
Coefficients, Journal of Econometrics, 42, pp.43-47.
26
Organisation for Economic Co-operation and Development (2003). Farm household income:
issues and policy responses. Paris, OECD Publications.
Organisation for Economic Co-operation and Development (2005). OECD Agricultural
databases, 2005 ed. Paris, OECD.
Plotnick, R. (1981). A measure of horizontal equity. Review of Economics and Statistics, 63,
pp.283-88.
Rapanà, F.M. (2006) CAP support of Mediterranean commodities: Estimates update to year
2004. CIPAS, University of Siena.
Roberts, D and Russell, N. (1995). Income Distribution and the Structure of Production:
Insights from a SAM-Based Model of UK Agriculture. In Midmore, P. and Harrison-
Mayfield, L. (eds). Rural Economic Modelling. An Input-Output Approach. Wallingford,
CAB International, pp.53-67.
Rocchi, B., Romano, D. and Stefani, G., (2005). Distributive impacts of alternative
agricultural policies: a SAM based analysis for Italy, Cahiers d’Economie et Sociologie
Rurales, 77, pp.86-112..
Sasieni, P. (1998). gr27. An adaptive variable span running line smoother, Stata Technical
Bulletin, 41, pp.4–7.
Scottish Executive Environment and Rural Affairs Department (2004). Farm Incomes in
Scotland. Edinburgh, Scottish Executive.
Sen, A. (1973) On Economic Inequality. Oxford, Clarendon Press.
Tracy, M. (ed) (1998). CAP reform: the southern products. Brussels, Agricultural Policy
Studies.
Zanias, G.P. (2002). The distribution of CAP benefits among member states and the impact
of a partial re-nationalisation: a note, Journal of Agricultural Economics, 53(1), pp.108-112.
Zheng, B. andAgresti, A. (2000). Summarizing the predictive power of a generalized linear
model, Statistics in Medicine, 19, pp.1771–1781.
27
Table 1. Weighted Summary Statistics by Farm Type, Tuscany General Type of Farming (FADN class) Average per farm All 1 2 3 4 5 6 7 8Farm Income. Universe of all farms Number of observations 643 139 77 234 40 24 95 11 23% of raised sample 18.5% 2.8% 45.2% 6.7% 0.2% 18.6% 2.4% 5.7%Farm business size (ESU) 11 18 43 9 8 48 8 9 7Post-transfer income (€) 10553 11187 20853 12128 9900 60541 5575 8707 6962Proportion of farms <0 21.2% 25.7% 9.0% 23.0% 21.6% 3.1% 21.4% 0.3% 7.3%Gross support (€) 3503 5383 6265 1742 6466 9334 2997 7273 6467Of which due to:-
Market price support 1309 282 2410 872 4495 8277 864 4498 3727Direct support payments 1527 4504 384 304 1847 585 1311 2592 2071
Other grants and subsidies 668 597 3471 565 124 472 822 184 670Transfers to farmers (€) 2283 4321 2177 1015 4535 5816 1741 4517 3882Of which due to:-
Market price support 665 84 1029 428 3070 4369 315 2448 1714Direct support payments 1261 3891 282 271 1393 1188 973 1898 1598
Other grants and subsidies 357 347 866 317 72 259 453 171 570As % of post-transfer income 21.6% 38.6% 10.4% 8.4% 45.8% 9.6% 31.2% 51.9% 55.8%Pre-transfer income (€) 8270 6865 18676 11112 5365 54725 3833 4191 3080Proportion of farms <0 24.9% 31.1% 9.9% 25.8% 28.3% 6.9% 17.4% 68.1% 9.0%Total Household Income. ‘Broad’ definition of agricultural community Number of observations 569 124 75 197 38 22 81 10 22% of raised sample 18.8% 2.9% 45.4% 6.0% 0.2% 18.5% 2.4% 5.8%Farm business size (ESU) 10 18 43 9 8 48 8 9 7Post-transfer income (€) 20003 20827 25972 20919 20708 47030 17080 24571 13056Of which: Farm income 9633 10600 20782 10242 11222 39465 5425 9975 6895
Non-farm income 10370 10227 5190 10677 9485 7565 11654 14596 6160Proportion of farms <0 1.1% 0.8% 5.8% 0.5% 0.2% 3.2% 0.8% 0.0% 7.3%Gross support (€) 3131 4808 6273 1281 7393 9571 2499 7090 6380Of which due to:-
Market price support 1171 281 2408 597 5131 8408 715 4479 3673Direct support payments 1385 4055 385 225 2121 673 1110 2427 2036
Other grants and subsidies 575 473 3480 460 142 490 674 184 670Transfers to farmers (€) 2127 3879 2184 815 5292 5466 1659 4457 3841Of which due to:-
Market price support 644 85 1025 338 3595 3849 335 2537 1709Direct support payments 1151 3519 282 189 1614 1381 884 1748 1562
Other grants and subsidies 332 274 876 288 82 236 440 172 571Pre-transfer income (€) 17876 16948 23789 20104 15416 41564 15420 20114 9214Proportion of farms <0 1.5% 0.9% 5.8% 0.7% 3.8% 3.2% 0.8% 0.0% 9.0%
Source: Own calculations using REA data. FADN Classes. 1 – Specialist field crops. 2 – Specialist horticulture. 3 – Specialist permanent crops. 4 – Specialist grazing livestock. 5 – Specialist granivores. 6 – Mixed crops. 7 – Mixed livestock. 8 – Mixed crops-livestock.
28
Table 2. Summary statistics from transfer function regressions
Field of coverage All Cmrcl Broad Broad Broad NarrowIncome measure Farm Farm Farm Hhld Hhld/hd Hhld
Predictive power of: Linear regression model 0.134 0.122 0.070 0.064 0.054 0.058Non-discriminatory function fB(x) 0.256 0.211 0.217 0.155 0.120 0.162Set of farm type specific functions fk(x) 0.372 0.334 0.392 0.279 0.315 0.308 F test of: Pre-transfer income effect 98.85 78.66 42.36 38.56 20.11 35.17in linear model 6.67 6.68 6.68 6.68 6.71 6.68Linearity in non-discriminatory function 17.89 16.80 28.43 18.39 8.62 23.40 6.72 8.91 10.07 16.79 8.77 20.04Farm type effects in farm type functions 4.00 3.60 5.49 3.54 3.67 4.41 2.58 2.31 2.57 3.28 2.45 3.06
Critical values of the F statistics at the 1% significance level are reported in italics.

29
Table 3. Redistributive effects of agricultural support policy, Tuscany. Field of coverage All Cmrcl Broad Broad Broad NarrowIncome measure Farm Farm Farm Hhld Hhld/hd Hhld
Number of observations n 643 567 569 569 569 357Population 83459 34075 81463 81463 144134 20313Average post-transfer income (€) y 10553 24455 9633 20003 11306 38060 1253 2456 1140 1314 712 3756Of which: Farm income 10553 24455 9633 9633 5444 34919
1253 2456 1140 1211 633 3675 Non-farm income - - - 10370 5861 3141 - - - 584 349 394Average gross support (€) 3503 8115 3131 3131 1770 10096 357 713 355 352 192 1101Average transfers to farmers (€) t 2283 5378 2127 2127 1202 6986 233 470 238 236 132 758Average pre-transfer income (€) z 8270 19077 7506 17876 10103 31075 1105 2218 989 1175 639 3380Absolute Gini index of AY 10049 20574 8678 10142 5485 24767post-transfer income 1112 2037 979 1007 519 2752Absolute Gini index of AW 9662 19579 8317 9627 5171 23445farm type specific reference income 1100 2029 967 995 512 2750Absolute Gini index of AB 9652 19700 8364 9751 5131 23257non-discriminatory reference income 1104 2033 974 999 515 2763Absolute concentration index of By CB 9652 19700 8364 9751 5131 23242non-discriminatory reference income 1104 2034 973 999 515 2762Absolute Gini index of AX 8614 18105 7251 8990 4873 21682pre-transfer income 1030 1950 894 929 482 2677Index of redistributive effect R -1434 -2469 -1426 -1151 -612 -3084 165 314 170 159 90 403Index of vertical redistribution V -1037 -1595 -1113 -761 -259 -1559 171 317 173 162 96 448
Disparity of net transfers D -0.466 -0.291 -0.526 -0.352 -0.315 -0.278 0.058 0.050 0.055 0.061 0.062 0.057
Av. non-discriminatory transfers Bt 2283 5378 2127 2127 1202 6986239 478 238 256 158 785
Index of systematic reranking HR 0 0 0 0 0 -1621 22 22 3 1 91
Between farm type classical HI HB -10 121 48 125 -39 -188 87 161 81 93 57 253
Within farm type classical HI HW -387 -995 -361 -515 -314 -1321 69 140 62 91 53 202
Source: Own calculations using REA data. All measures are calculated using the population-weighted data. Absolute Gini and concentration indices are estimated using the formulae in Lerman and Yitzhaki (1989) for weighted samples. Bootstrap standard errors, based on 1000 replications, are reported in italics and reflect not only the inherent sampling variability of the measures given the stratified nature of the sample, but also the uncertainty about the exact values of non-farm income.
30
Table 4. Redistributive effects of agricultural support policy, Scotland. Field of coverage All cmrcl Broad cmrcl Broad cmrcl Broad cmrclIncome measure Farm Farm Hhld Hhld/hd
Number of observations n 354 336 336 336Population 13277 13069 13069 25093Average post-transfer income (€) y 49455 49310 65434 34078 1865 1927 2209 1352Of which: Farm income 49455 49310 49310 25681
1865 1927 1992 1180 Non-farm income - - 16123 8397 - - 1399 761Average gross support (€) 81594 81272 81272 42327 1561 1523 1594 1213Average transfers to farmers (€) t 51110 51028 51028 26576 1184 1186 1220 772Average pre-transfer income (€) z -1655 -1718 14405 7502 1416 1390 1869 991Absolute Gini index of AY 23496 23432 24077 13105post-transfer income 1160 1169 1187 643Absolute Gini index of AW 16235 16526 16979 9497farm type specific reference income 1196 1234 1260 738Absolute Gini index of AB 13692 13388 15097 8554non-discriminatory reference income 2057 2131 2180 1289Absolute concentration index of By CB 13253 13023 14837 8016non-discriminatory reference income 2062 2150 2180 1291Absolute Gini index of AX 18762 18760 21195 11268pre-transfer income 1039 1097 1153 660Index of redistributive effect R -4733 -4672 -2882 -1838 1067 1081 1167 590Index of vertical redistribution V 5510 5737 6358 3251 1305 1340 1319 806
Disparity of net transfers D 0.096 0.103 0.127 0.113 0.025 0.025 0.019 0.022
Av. non-discriminatory transfers Bt 51110 51028 51028 26576 1905 1995 2228 1447
Index of systematic reranking HR -439 -365 -260 -537148 168 41 20
Between farm type classical HI HB -2543 -3138 -1882 -943 1329 1365 1420 827
Within farm type classical HI HW -7261 -6906 -7098 -3609 613 610 669 359
Source: Own calculations using FAS data. The difference in sample size between the first and other columns is partly due to the dropping of a number of observations with incomplete records on non-farm incomes. See also the notes to Table 3.