Adversarial moments: A study of short-form interviews in the news
Upload
khangminh22Category
view
3download
0
An Adversarial Analysis of the Reidentifiability of theHeritage Health Prize Dataset
Arvind Narayanan∗
Stanford University
May 27, 2011
Abstract
I analyze the reidentifiability of the Heritage Health Prize dataset tak-ing into account the auxiliary information available online and offline toa present-day adversary. A key technique is identifying providers, whichis useful both as an end in itself and as a stepping stone towards identify-ing members. My primary findings are: 1. Grouping providers based onshared members results in the formation of clusters which likely correspondto hospitals; 2. There is enough auxiliary information to identify most ofthese hospitals, and possibly also individual providers; 3. An adversarywho has detailed information about a member’s health conditions will beable to uniquely identify him or her; 4. While there are numerous websiteswhere users can share reviews, health conditions, etc., their adoption is notcurrently high enough to serve as a source of auxiliary information for alarge-scale member-reidentification attack.
I provide bounds on the efficacy of the methods I describe, but time con-straints prevented me from attempting a more complete attack. To the bestof my judgment, reidentification is within the realm of possibility; however,it is far from straightforward and will require algorithmic sophistication aswell as sleuthing for auxiliary data. While identification of providers mightbe useful to contestants for improving predictive performance, large-scalereidentification of members—that has the potential to pose a threat to pri-vacy and to the fidelity of the contest—appears unlikely to be feasible dueto the paucity of auxiliary information.
∗e-mail: [email protected]; web: http://randomwalker.info/
1

1 The Heritage Health PrizeThe Heritage Health Prize (HHP) is a machine-learning contest to “develop apredictive algorithm that can identify patients who will be admitted to the hospitalwithin the next year, using historical claims data.” The goal is to lower healthcarecosts by predicting and preventing unnecessary hospitalizations. The two-yearcontest offers a USD 3 million Grand Prize as well as “Milestone Prizes”.1
The contest is sponsored by the Heritage Provider Network (HPN), an um-brella organization of healthcare providers consisting of nine medical groups inSouthern California.2 The technical platform is provided by Kaggle Ltd., an Aus-tralia and U.S.-based startup that specializes in hosting such contests.3 Kaggle hashosted 18 contests as of this writing, but the HHP has by far the largest purse andprestige.
As is the norm in machine-learning contests, “anonymized” or “deidentified”data is available for download. The deidentification was carried out by a team ledby Khaled El-Emam, and used techniques such as generalization and suppressionto in order to satisfy a set of k-anonymity–like criteria [EKA+11].
My involvement stems from my interaction with Kaggle. A previous Kagglecontest, the IJCNN social network challenge, asked contestants to predict missingedges in a social network graph. My team won the contest by deanonymizing thegraph (which was derived from Flickr); deanonymization allowed us to simply“look up” the edges on Flickr [NSR11]. Due to this work and my previous re-search on deanonymization and privacy, I was asked to be on the HHP advisoryboard, and to analyze the reidentifiability of the contest data. I was not providedthe data early enough for my report to have any bearing on the data release.
The data consists primarily of claims. Members (patients) and providers (physi-cians, labs, etc.) are identified by pseudonyms. In addition to the member andprovider, each claim lists the diagnosis and procedure codes and several other at-tributes.4 There is limited demographic information associated with each member:generalized age (decade) and sex.
The rest of this document, together with the Abstract above, constitute thereport I prepared for HPN and Kaggle. Sections 2–5 elaborate on points 1–4 in theAbstract, and Section 6 presents my concluding thoughts including suggestionsfor improving deidentification on the basis of my results.
1http://www.heritagehealthprize.com/2http://www.heritageprovidernetwork.com/3http://www.kaggle.com/4For a full list see http://www.heritagehealthprize.com/c/hhp/Data.
2

2 Providers and hospitalsThe natural way to view the Claims data is a graph—specifically, a bipartite multi-graph of members and providers. An edge connects a member with a provider, andrepresents a visit. Typically a visit corresponds to a single row (claim) in the table,but occasionally more than one. The other attributes such as Length of Stay andDiagnosis Code may be thought of as being attached to these edges, i.e., visits.
A graph is a data structure that lends itself well to large-scale deanonymiza-tion [NS09], provided that suitable auxiliary information is available. There areabout 145,000 members and about 17,500 providers listed; this suggests that thereis far more information per provider than there is per member. Similarly, auxiliaryinformation about providers is more easily available than about members, and ismore complete, as we will see in Sections 3 and 5. For these reasons, in this sec-tion I will focus on identifying providers. To do this, it will help to convert thebipartite graph into a graph of relationships between providers alone.
2.1 Clustering providersProviders vary greatly in the number of members they are connected to in themember–provider graph. About a third have only one member, whereas the max-imum member count is around 36,000. Figures 1 and 2 are two ways to visualizethe number of members per provider. Providers break down into various spe-cialties, shown in Figure 3, whereas Figure 4 shows the breakdown of membercount per provider by specialty. Unsurpisingly, labs handle far more patients thanphysicians.
Let’s call two providers related if they share at least one member. A crudebut reasonably effective way to measure the degree of relatedness is the cosinesimilarity between the two sets of members that each is connected to.5 This givesus a weighted graph between providers that will be a fundamental construct inmuch of the following analysis.
Of the ∼17,500 providers, ∼17,400 are related to at least one other provider,and∼17,300 are in the giant connected component of the provider–provider graph.Of the 4,650 providers that have at least 10 members, all are in the giant compo-nent. Providers with at least 10 members are numerically in the minority, but theyare responsible for 99.3% of all visits.
5The cosine similarity between two sets X and Y is |X∩Y |√|X|·|Y |
3
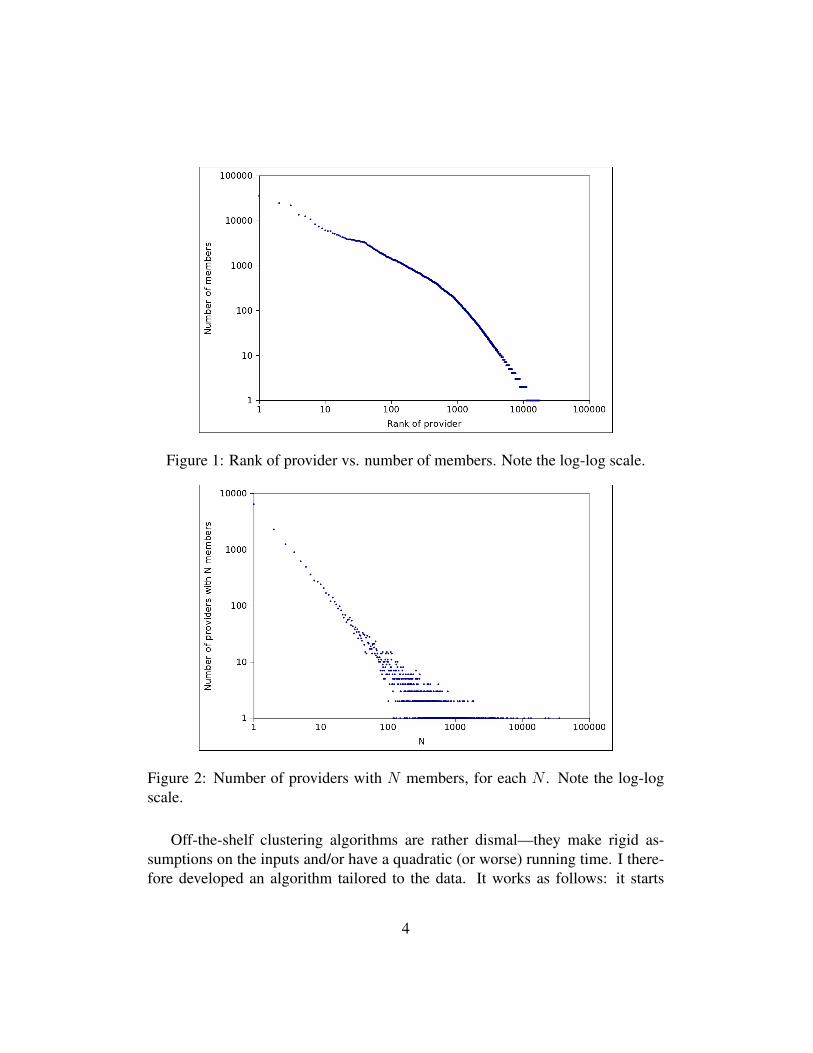
Figure 1: Rank of provider vs. number of members. Note the log-log scale.
Figure 2: Number of providers with N members, for each N . Note the log-logscale.
Off-the-shelf clustering algorithms are rather dismal—they make rigid as-sumptions on the inputs and/or have a quadratic (or worse) running time. I there-fore developed an algorithm tailored to the data. It works as follows: it starts
4

Figure 3: Number of providers, by specialty of provider
Figure 4: Members per provider, by specialty of provider
from a random point and accretively “grows” a cluster in a greedy manner. Whenthe cohesion of the cluster (roughly, average edge weight) falls beneath a certainthreshold, the cluster growth is stopped. Some overlap between clusters is per-mitted, but if the new cluster overlaps “too much” with an existing one, then it isdiscarded. Clusters of fewer than 10 providers are also discarded.
The algorithm found 180 clusters ranging in size from 10 to 190. Beyond thissize the clusters are unable to maintain their cohesion. Together there are 4,400
5

providers that are part of a cluster, or about 25% of providers. This might seemlike a small fraction but the reason will presently become clear.
The obvious question is what these clusters represent. Intuitively, there are twopossible geographic scales at which clusters might form: individual hospitals andtowns. The number and sizes of the clusters suggest that they are hospitals, butthe clinching piece of evidence is the Place of Visit field. Only 12% of physicianswho primarily see patients in the office were part of a cluster, whereas 42% ofphysicians who do so primarily in hospital settings were clustered.6
Figure 5 shows a more detailed view of this data, broken down by cluster. Inthe majority of clusters (70%), there are at least three times as many hospital visitsas office visits; in the overall data, the ratio is reversed: there are over three timesas many office visits as hospital visits. That said, there are a small number oflarge clusters (shaded area) with a hospital-to-office-visit ratio of under 1, and itis plausible that these represent small towns.
Figure 5: Clusters: size and composition. Note the log-log scale.
There are several ways in which the clustering algorithm can be improved.First, it has numerous parameters, and the size and nature of clusters seems todepend on the parameter choices. Second, one can incorporate medical knowl-edge/expertise about the nature of hospitals, for example, sharing of independent
6The ‘Office’ Place of Visit was treated as an office visit, the ‘Inpatient Hospital’, ‘OutpatientHospital’ and ‘Urgent Care’ fields were treated as hospital visits, and the rest were ignored.
6

laboratories between hospitals. Third, currently the algorithm doesn’t look atfields other than the member and provider, such as the primary care provider andvendor. I believe that a combination of these techniques can lead to identificationof a higher fraction of hospitals, with lower false positive and false negative rates,as well as better identification of small towns.
2.2 Identifying hospitalsDue to the rich structure of the data, there are four different scales at which rei-dentification can happen: 1. cities/towns, which are large clusters or groups ofclusters; 2. hospitals, which are individual clusters; 3. providers; and 4. mem-bers. These levels strongly interact with each other—for example, identifying asingle provider who is known to practice in Bakersfield, CA will tell us whichcluster of hospitals corresponds to Bakersfield. Now I will describe several poten-tial techniques to identify hospitals, assuming the availability of suitable auxiliaryinformation (which is described in Section 3).
• Age. If the average age of members that visit a particular hospital is unusu-ally low, then maybe it is a pediatric hospital, or perhaps it is a hospital witha high proportion of pediatric doctors. If the average age is unusually high,then perhaps it is an assisted living facility.
• Location. As mentioned earlier cities/towns can potentially be isolated, butperhaps by observing relatedness on an even bigger scale we can estimatethe geographic proximity between any two clusters. Armed with this infor-mation, identifying a small number of hospitals could lead to a cascadingidentification of all hospitals.
• Hospital quality. The connectedness between hospitals has a directional-ity: patients will get referred to the top hospitals from average hospitals iftheir condition doesn’t improve, but the other way around happens muchless frequently. A visit to two different hospitals for the same condition isindicative of a referral, and the Days Since First Claim field tells us whichcame first. By applying a pagerank-like algorithm, we can determine whichclusters represent the top hospitals. Since the list of top hospitals is well-known, this gives us a relatively small set of possible matches.
• Specialties. The mix of specialties of doctors practicing in a given hospitalmight serve as a unique fingerprint. As a reminder, all of this depends onthe fact that suitable auxiliary data exists, which is discussed in Section 3.
7

I was able to investigate the the first item in the above list, namely clusterswhose members have unusually low ages on average. Figure 6 shows the meanmember age for each of the top 50 clusters. There are a handful with mean agetoo low and a couple with mean age too high. I reran the clustering algorithmby restricting the original data to members who are in the 0–10 and 10–20 agegroups. This resulted in 24 clusters of size at least 10. Some of these may bespurious, but I believe that at least the top 4—which have sizes 88, 62, 43 and 42respectively—are truly clusters that represent pediatric hospitals or hospitals witha significant pediatric specialization.
Figure 6: Age distribution of members associated with clusters
In the next Section I discuss how to determine which hospitals some of theseclusters might be. But another question worth considering is how providers can beidentified assuming that many or most hospitals have been identified. Physicianswho practice at two are more locations, or who moved during the period repre-sented in the dataset are prime candidates for reidentification. Given that special-ties are also known, and considering that the number of physicians per hospitalper specialty is fairly small, even a small amount of additional information suchas average patient volume and referral patterns could be sufficient for identifyingphysicians. The State Inpatient Databases, discussed in Section 5.1 are an entirelydifferent path to identifying providers.
8

3 Auxiliary information: providersNow we are starting to reach the limit of what we can infer from the contestdata alone, and we must go to external data sources to make further progress. Inmy investigations, I found three main types of useful external data on providers,although it is likely that there are others.
NPPES. The first is data published under the National Plan and Provider Enu-meration System (NPPES).7 It is a result of HIPAA which mandates the estab-lishment of a unique identifiers for providers (the well-known National ProviderIdentifier, or NPI). In addition to identifiers, several pieces of information are col-lected from (self-reported by) each provider, and the aggregated dataset has beenpublished regularly since 2007.
The current file is around 380MB compressed and contains 3.3 million providers.Of these, 380,000 list their Business Practice State as California. But at most89,000 of these seem to be physicians (degree = M.D.); the others are dentists,psychologists, pharmacists, and various types of business entities. A typical recordis shown in Appendix A.
There are many useful pieces of information here including business practiceaddress, insurance plans accepted, and medical group. Given a hospital, it is easyto find the list of physicians who practice there. However, it must be noted thatthe majority of physicians do not report medical group information. It is likelythat the quality of this dataset will improve with time (the NPPES website makesregular releases), but it is also possible that other data sources will help bridgethe gap. Indeed, the remaining two that I will describe are useful mainly for thatpurpose.
Screen-scraping provider finder interfaces. Medical groups typically offeronline services to the public including searching for a provider (“provider finder”).According to the HPN website, there are 9 affiliated medical groups.8 I picked oneof the larger ones, Regal Medical Group. As expected, RMG has a provider finderservice.9
I was able to write a script to interact with the provider finder to extract allRMG-associated physicians in the following manner. Although a completelyempty search doesn’t work, it is possible to search for all providers in a city —the list of cities is available as a dropdown — and navigate all the pages of searchresults. This process yielded 1,500 providers in 170 cities.
7https://nppes.cms.hhs.gov/8http://www.heritageprovidernetwork.com/?p=medical-groups9http://www.regalmed.com/members.cfm?m=phys
9

The name and address are sufficient to link this dataset with the NPPES database.The provider finder has some useful additional fields like specialty and languagesspoken. While I did not try other medical groups, I am confident that a similarprocess will work for all or most of them. After all, this is information that needsto be revealed to customers.
Hospital affiliation list. There is a list of hospitals utilized for HMO businessby each California medical group.10 HPN is affiliated with 54 hospitals in the list,but it is not clear what fraction of visits in the HHP dataset fall under HMO cov-erage. Interestingly, there is only one institution whose name suggests a pediatricfocus: the Children’s Hospital of Orange County (CHOC), which is apparentlyone of the busiest children’s hospitals in the country.11 Therefore I feel confidentthat CHOC corresponds to one of the 4 pediatric clusters mentioned in Section2.1.
In conclusion, I have shown in this section that it is possible to obtain large-scale and accurate information about HPN-affiliated providers and hospitals. Itis not quite complete, but in my judgement, an essentially complete list can beobtained with a little more effort and possibly some monetary expenditure. Theadversary fundamentally has the advantage here because there isn’t a strong normor expectation of privacy for basic data about physicians and their affiliations.Finally, it is worth pointing out that other publicly available lists such as lists oftop hospitals12 and census data on population density and demographics13 are alsopotentially useful for reidentification of providers and hospitals.
4 Member uniquenessThreat model. There are 145,000 members in the dataset, and as pointed outby the deidentification team [EKA+11], the demographic information—age rangeand sex—is not nearly enough to identify members uniquely. But what if theadversary has some information about the member’s medical history? That’s whatI will investigate in this section. Initially I will assume that nothing is known interms of provider identities.
There are several people in our lives such as family, close friends and perhaps
10http://www.cattaneostroud.com/med_group_reports/21B-Web.pdf11http://en.wikipedia.org/wiki/Children’s_Hospital_of_Orange_
County12http://health.usnews.com/best-hospitals13http://2010.census.gov/2010census/data/
10

neighbors who know something about our medical history. In the worst case, anindividual who is potentially in the dataset might try to identify their own data,either out of curiosity or because an attacker bribed them to do so.
In addition to the demographic variables, the relevant attributes are Length ofStay, the Diagnosis Codes, the claim year and the Days Since First Claim fieldwhich roughly acts as proxy for date of visit in that the difference between twoDays Since First Claim values equals the difference between the correspondingdates of visit.
There is no realistic generic model of auxiliary information in this situation—we can only have a meaningful model if we are considering a specific externaldataset. Since we don’t know what dataset the adversary might use, all we’releft with is guesswork. In the deidentification paper, the authors make a specific,somewhat arbitrary set of assumptions. For example, they say “we assume thatthe adversary does not know the order of the quasi-identifier values. For example,the adversary would not know that the heart attack occurred before the brokenarm...”. I cannot fathom the reason for this. If the auxiliary information comesfrom online review sites, for example, detailed timeline information is very muchavailable.
I believe that deriving reidentification probabilities based on such assumptionsis a largely meaningless exercise. Nevertheless, I will perform such an analysiswith a different set of assumptions, one that seems at least as realistic to me as theoriginal. If nothing else, this should illustrate that mildly divergent assumptionscan give very different results. Ultimately, the only relevant question is whetheror not the auxiliary information is extensive enough; if it is, no deidentificationprocedure can possibly offer a meaningful level of protection.
I will assume that the adversary knows k of the diagnosis codes, for variousvalues of k, and that he knows the approximate number of diagnosis codes (towithin a factor of two). As for the timeline, I will assume a weak version isknown to the adversary, namely the year but not the month of each visit.
There are numerous possibilities for what the adversary’s auxiliary informa-tion could be. The timeline information could be more accurate or less accuratethan in my model. The diagnosis codes known could be error-prone. On the otherhand I have ignored the Length of Stay field, as well as lab results and proceduresthat I understand are planned for a future data release. I believe the choices aboverepresent a reasonable middle ground. Also note that if the member’s health con-ditions are known, there is no privacy risk to them from reidentification. Rather,the adversary’s goal is to hack the contest or to find “seeds” for a large-scale at-tack.
11

An important issue is the fact that the released sample of members represents afraction of HPN members, and a smaller fraction still of California residents (theadversary may not necessarily know which individuals are members of HPN).Any uniqueness metrics must account for this fact and estimate uniqueness in thepopulation and not in the sample. For simplicity I will assume that the popula-tion size is 10 million, which is roughly equivalent to the adversary having someknowledge of the ZIP codes in which HPN-affiliated medical groups operate.
My methodology is as follows. For each k, I will calculate the nk such that50% of members are unique in a sample of size nk if the adversary knows k of theirdiagnosis codes. This can be calculated as long as nk < µk ·Nsample where µk isthe fraction of members in the sample with k or more diagnosis codes. Making theassumption that the data is a random sample of the population, I will extrapolatethis curve and find the kpop such that at least 50% of members are unique in theentire population if kpop diagnosis codes are known. Finally, I will calculate thefraction of members that have kpop or more diagnosis codes.
In Figure 7, the blue line (bottom) represents the plot of k vs. nk withoutdemographic information. The curve is very close to a straight line, and I willgeneralize from this and assume that both of the lines in Figure 7 are straight line,and also that it remains a straight line if extrapolated to the right. One explanationfor the straightness is a lack of correlation between different conditions. But thatis not the only explanation; it is also possible that there is a small correlation butthis is cancelled out because members with more conditions are also likely to haverarer conditions (which have more entropy).
The pink line (top) is the same plot but including demographic information.The pink line is the one that I’m actually after. Knowing the slope, I can extend theline and find kpop, which is the k for which nk exceeds µk ·Npop (I’m assuming thatµk for the sample is the same as for the population.) It turns out that kpop = 7. Inother words, roughly half of members with 7 or more diagnosis codes are uniqueif the adversary knows 7 of their diagnosis codes. This works out half of 25% or12.5% of members.
In summary, I have shown that a significant fraction of members are vulner-able if the adversary knows demographic information and a sufficient number ofdiagnosis codes (and Year of Claim for each one). But if the adversary knows thata member is associated with a cluster that has been identified as a certain hospi-tal, it changes the equation completely. Most clusters have only a few hundredmembers associated with them, which means that far less auxiliary informationis required for reidentification. In particular, members who move to a differentarea during the data collection period are at high risk. The combination of hos-
12
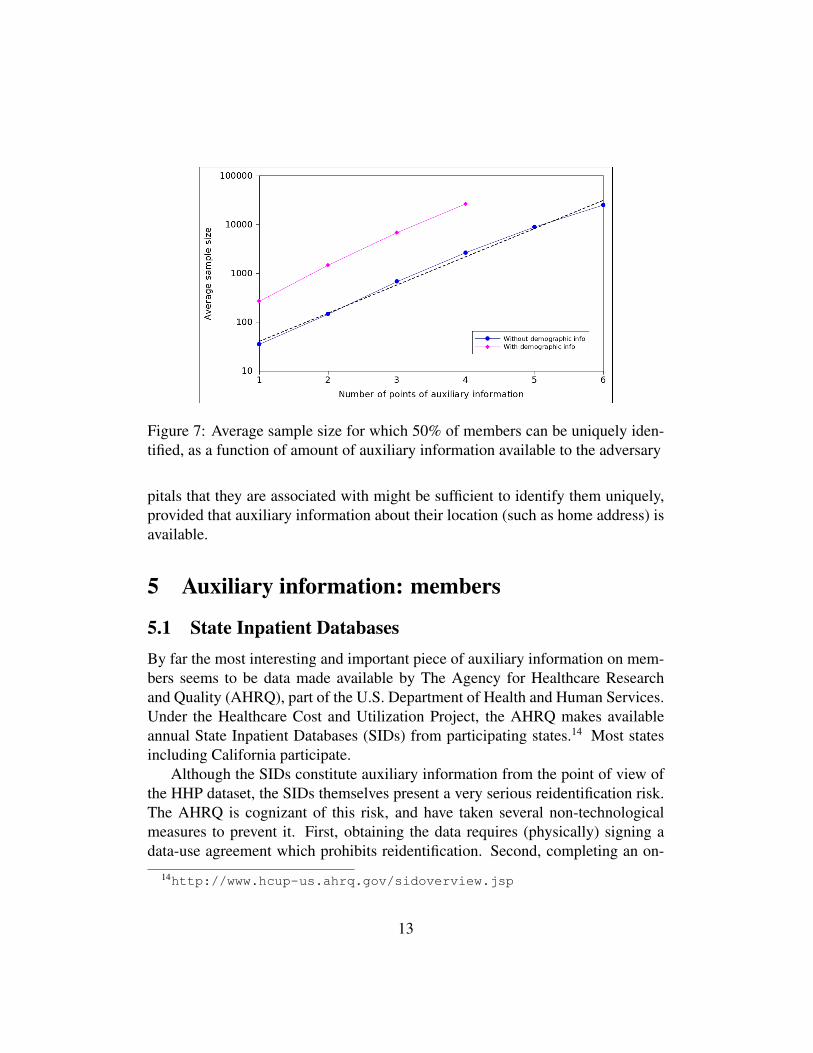
Figure 7: Average sample size for which 50% of members can be uniquely iden-tified, as a function of amount of auxiliary information available to the adversary
pitals that they are associated with might be sufficient to identify them uniquely,provided that auxiliary information about their location (such as home address) isavailable.
5 Auxiliary information: members
5.1 State Inpatient DatabasesBy far the most interesting and important piece of auxiliary information on mem-bers seems to be data made available by The Agency for Healthcare Researchand Quality (AHRQ), part of the U.S. Department of Health and Human Services.Under the Healthcare Cost and Utilization Project, the AHRQ makes availableannual State Inpatient Databases (SIDs) from participating states.14 Most statesincluding California participate.
Although the SIDs constitute auxiliary information from the point of view ofthe HHP dataset, the SIDs themselves present a very serious reidentification risk.The AHRQ is cognizant of this risk, and have taken several non-technologicalmeasures to prevent it. First, obtaining the data requires (physically) signing adata-use agreement which prohibits reidentification. Second, completing an on-
14http://www.hcup-us.ahrq.gov/sidoverview.jsp
13

line Data Use Agreement Training Course is required. Third, there is a fee toobtain the data, although for some state databases including California, this is atoken fee of $35. Finally, and the one that I find most interesting, is a requirementto describe the research project for which the data is going to be used.15 If thereis a human, especially one with domain knowledge, reviewing these applications,the last requirement can be very effective.
That said, if an adversary can manage to get his hands on the CaliforniaSID, it can be a game-changer. In the deidentification document (Section 2.5.3—“Matching With Semi-Public Registry”), the authors say:
if an individual can match the hospitalization records with the SIDrecords, then the adversary can discover the exact month and year ofbirth of the member, their race, and their detailed diagnosis codes andprocedures. This would more information than is disclosed and willtherefore raise the re-identification risk.
Is this attack feasible? Unequivocally so. In the California SID databases, eachpatient is assigned a pseudonym with the explicit purpose of enabling trackingacross hospitals and through time.16 Further, the SID contains “relative dates” ona per-patient level, very similar to the Days Since First Claim field in the HPNdataset.17 This means that for the purpose of matching these two databases, theadversary has far more auxiliary information than the analysis in the previoussection; with accurate timeline information as well as diagnosis codes, I claimthat most members can be matched in a straightforward manner.
To be clear, this does not mean that members can be identified, as the SIDdatabase contains only pseudonyms. But it does have two important consequences.The first is that when dealing with an adversary who has access to the SID databases,the HPN data can be assumed to contain year and month of birth and all the otherattributes listed earlier (a full list of attributes is available on the AHRQ website.18)This must be borne in mind when reading the following subsection.
The second consequence is that once members are matched across the twodatabases, identifying providers becomes a lot easier. This is because there are
15The application form, which incorporates all these requirements, is available at http://www.hcup-us.ahrq.gov/db/state/SIDSASDSEDD_Final.pdf
16http://www.hcup-us.ahrq.gov/db/vars/siddistnote.jsp?var=visitlink and http://www.hcup-us.ahrq.gov/db/vars/siddistnote.jsp?var=pnum_r
17http://www.hcup-us.ahrq.gov/db/vars/siddistnote.jsp?var=daystoevent
18http://www.hcup-us.ahrq.gov/db/state/siddist/sid_multivar.jsp
14

pseudonyms for physicians in the SIDs, also with the explicit purpose of track-ing physicians. Better, the hospital identifier—not a pseudonym, but an AmericanHospital Association identifier—is also provided with each record. This meansthat the adversary can bypass the whole process described in Section 2 of cluster-ing physicians in the HHP dataset and matching them to hospitals.
5.2 Mining the WebThere are 3 main types of auxiliary information about individuals that an adver-sary might look for online: health conditions, hospitals visited, and physicians.Each is very useful for matching in a different stage of deanonymization, as we’veseen in previous sections. Websites that make the identity of the user available,and not just a pseudonym, are particularly useful sources of auxiliary information.
Yelp appears to be the breakout winner in terms of the amount of publiclyavailable auxiliary information about patient visits. This information comes fromuser reviews of both patients and hospitals. San Francisco General, a busy hos-pital, currently has 117 reviews while Alameda County Medical Center, a moreobscure hospital has two reviews. Many hospitals from the affiliation list dis-cussed earlier have no Yelp reviews. Active Yelp users typically make so muchinformation public that they are identifiable for all practical purposes.
Relative to the number of hospital visits, however, the number of reviews isvery low. The average internist sees about 1,000 patients per year19 but the totalnumber of reviews for a physician on Yelp rarely exceeds 10. At the hospitallevel, it is more informative to focus on trauma care centers since those are muchmore likely to elicit a review for the hospital itself rather than for an individualphysician. A busy trauma care center such as SFGH experiences annual patientvolumes of around 50,000, and as mentioned earlier, has 117 reviews. In bothcases, only a fraction of a percent of visits seem to lead to reviews. Unsurprisingly,given the above numbers, the fraction of users who review two or more hospitalsor providers seems vanishingly small.
Patientslikeme.com is an interesting case. There are 100,000 members and agood fraction have detailed medical information. The site collects and displaysmembers’ sex, age and city, but otherwise encourages anonymity. It is not clearif members have much anonymity against a determined adversary: in previous re-search I found that users often pick the same screen name across websites and this
19http://gateway.nlm.nih.gov/MeetingAbstracts/ma?f=102275563.html
15

can be used to match profiles [Nar08]. More anecdotal evidence about Patients-likeme members losing their anonymity can be found in a Wall Street JournalArticle [AS10]. Another interesting fact about Patientslikeme is that the reportedhealth conditions are available in machine-readable form (unlike all other web-sites surveyed here where such information is available only in the free-form textreviews that users write, if at all they choose to do so) although the mapping tothe diagnosis codes in the HHP dataset may be far from straightforward.
Then there are numerous physician review sites: healthgrades.com, vitals.com,ratemds.com and UCompare to name a few. These sites are aimed at middleAmerica rather than a young, urban, tech-forward population like Yelp is. The firstthree sites in fact seem much larger than Yelp in terms of number of medical re-views collected; however, they make little or no information available about userswho provided the reviews, likely because the target demographic is not comfort-able with this. Finally, sites such as Google Places and yellowpages.com containa fair amount of hospital reviews but not reviews of individual providers. Users ofGoogle Places are typically identifiable.
Auxiliary information about hospitals visited could come from an entirely dif-ferent source: location-sharing websites. One benefit for the adversary of this typeof data is that accurate timestamps are available, but an important caveat is thatthe user who checked in online might not be the patient.
Check-in data is easier to come by than reviews, as one might expect. TheCedars-Sinai Medical Center has been checked into 4000 times by 1200 users onFoursquare.20 A list of “recent” check-ins for each location is available on the sitebut it doesn’t appear that the full list can be crawled.
6 Concluding thoughtsIn the preceding sections I have shown how hospitals and possibly providers canbe identified by a determined adversary, and that while members who share infor-mation publicly about their hospital visits and health conditions are identifiable,not many currently do so.
Contest process. I find the AHRQ’s data release procedure, described in theprevious section, admirable and some of the steps potentially applicable to theHHP scenario. At the same time, I appreciate the importance of minimizing barri-ers to data download so that the participation rate does not suffer. But it might be
20https://foursquare.com/venue/1959781
16

possible to have the best of both worlds by dividing the process into two stages.For the first stage, the current minimally intrusive process is retained, but the
contestants don’t get to download the full data. Instead, there are two possibilities.One is to release only a subset of the data. The other is to release a syntheticdataset based on the real data. Overstock.com recently announced this strategyfor their contest.21
For the second stage, there are various possibilities, not mutually exclusive:require physically signing a data-use agreement and/or taking an online course,a la AHRQ; restrict the contest to the best performers from the first stage; andrun the contest by having participants upload code to the server and obtain re-sults, rather than download any data. The latter two strategies have again beenannounced by Overstock.
Auxiliary information and deidentification. Norms around public sharingof information are rapidly changing, and this is both a blessing and a curse fromthe standpoint of the HHP contest. It is a blessing because the contest data coversa period antecedent to the present time, and auxiliary data—especially locationcheck-ins—gets progressively rarer as we go back in time. It is a curse becauseeven user-generated data about future events might be useful auxiliary informa-tion. For example, some health conditions could be chronic. Another possibilityis that within a few years, it might be the case that the majority of hospital visitsare to be publicly disclosed via check-ins, at least in urban areas.
Perhaps the biggest saving grace, in my opinion, is that a random Californiaresident has a probability of under half a percent of being in the HHP dataset.This means that the expected payoff for an individual from spending time tryingto identify themself or a friend out of mere curiosity is very small. Trying to lookfor celebrities might be a realistic threat, and large-scale attacks are certainlywell-motivated.
As for the deidentification process, what could be done differently? I gavesome thought to methods for resisting reidentification of providers, such as sup-pressing some hospitals entirely so that the adversary’s task of matching clustersto hospitals isn’t 1-1. Ultimately, however, I believe these measures are futile, orat least, not worth the damage to the usefulness of the data.
It is much better to go after the adversary’s weak point, which is the fact thateven if the dataset can be augmented by matching it perfectly against the Califor-nia SIDs, it doesn’t seem possible to get to member identities based on public and
21http://www.freedom-to-tinker.com/blog/aleecia/overstocks-1m-challenge
17
quasi-public databases alone. Members who moved around might be vulnerable;for everyone else, some sort of self-reported online information about health orlocation appears necessary. A simple step could thus prove to be an effective wayto forestall reidentification: write a script to scour the web for information abouteach member (using their real name, etc., before deidentification), and simplydrop members from the dataset who have a habit of exposing personal informa-tion online. Based on current social trends, however, it may only be a matter oftime before this strategy becomes untenable due to the ubiquity of self-reportedauxiliary information online.
References[AS10] Julia Angwin and Steve Stecklow. ‘Scrapers’ Dig Deep for
Data on Web. http://online.wsj.com/article/SB10001424052748703358504575544381288117888.html, 2010.
[EKA+11] Khaled El Emam, Gunes Koru, Luk Arbuckle, Ben Eze, LisaGaudette, Emilio Neri, Sean Rose, Anthony Goldbloom, and JonathanGluck. The De-identification of the Heritage Health Prize ClaimsData Set, 2011.
[Nar08] Arvind Narayanan. Lendingclub.com: A De-anonymization Walk-through. http://33bits.org/2008/11/12/57/, 2008.
[NS09] Arvind Narayanan and Vitaly Shmatikov. De-anonymizing social net-works. IEEE Symp. Security and Privacy, 0:173–187, 2009.
[NSR11] Arvind Narayanan, Elaine Shi, and Benjamin Rubinstein. Link pre-diction by deanonymization: How we won the kaggle social networkchallenge, 2011. http://arxiv.org/pdf/1102.4374v1;http://wp.me/pl3mS-bf.
18

Appendix A Example NPPES Record
NPI 1417950460Provider Last Name (Legal Name) GARCIAProvider First Name JOHNProvider Middle Name AProvider Name Prefix Text DR.Provider Credential Text M.D.Provider First Line Business Mailing Address PO BOX 129Provider Business Mailing Address City Name LOS ALAMOSProvider Business Mailing Address State Name NMProvider Business Mailing Address Postal Code 875440129Provider Business Mailing Address Telephone Number 5056619118Provider Business Mailing Address Fax Number 5056619192Provider First Line Business Practice Location Address 3917 WEST RDProvider Second Line Business Practice Location Address SUITE 139Provider Business Practice Location Address City Name LOS ALAMOSProvider Business Practice Location Address State Name NMProvider Business Practice Location Address Postal Code 875442275Provider Business Practice Location Address Telephone Number 5056619118Provider Business Practice Location Address Fax Number 5056619192Provider Enumeration Date 05/23/2005Last Update Date 08/01/2008Provider Gender Code MHealthcare Provider Taxonomy Code 1 207X00000XProvider License Number 1 2003001211Provider License Number State Code 1 MOHealthcare Provider Primary Taxonomy Switch 1 YOther Provider Identifier 1 H81983Other Provider Identifier 2 5729197Other Provider Identifier Issuer 2 CIGNAOther Provider Identifier 3 9274Other Provider Identifier Issuer 3 EXCLUSIVE CHOICEOther Provider Identifier 4 7135504Other Provider Identifier Issuer 4 AETNAOther Provider Identifier 5 179426Other Provider Identifier Issuer 5 BLUE CROSS BLUE SHIELDOther Provider Identifier 6 2305584Other Provider Identifier Issuer 6 UHCOther Provider Identifier 7 351240001Other Provider Identifier Issuer 7 CIGNA DMERCOther Provider Identifier 8 561510Other Provider Identifier Issuer 8 HEALTHLINKOther Provider Identifier 9 43511Other Provider Identifier Issuer 9 HEALTHCARE USAIs Sole Proprietor N
19
Copyright © 2022 FDOKUMEN