Alexander County Schools 2012-2013
49
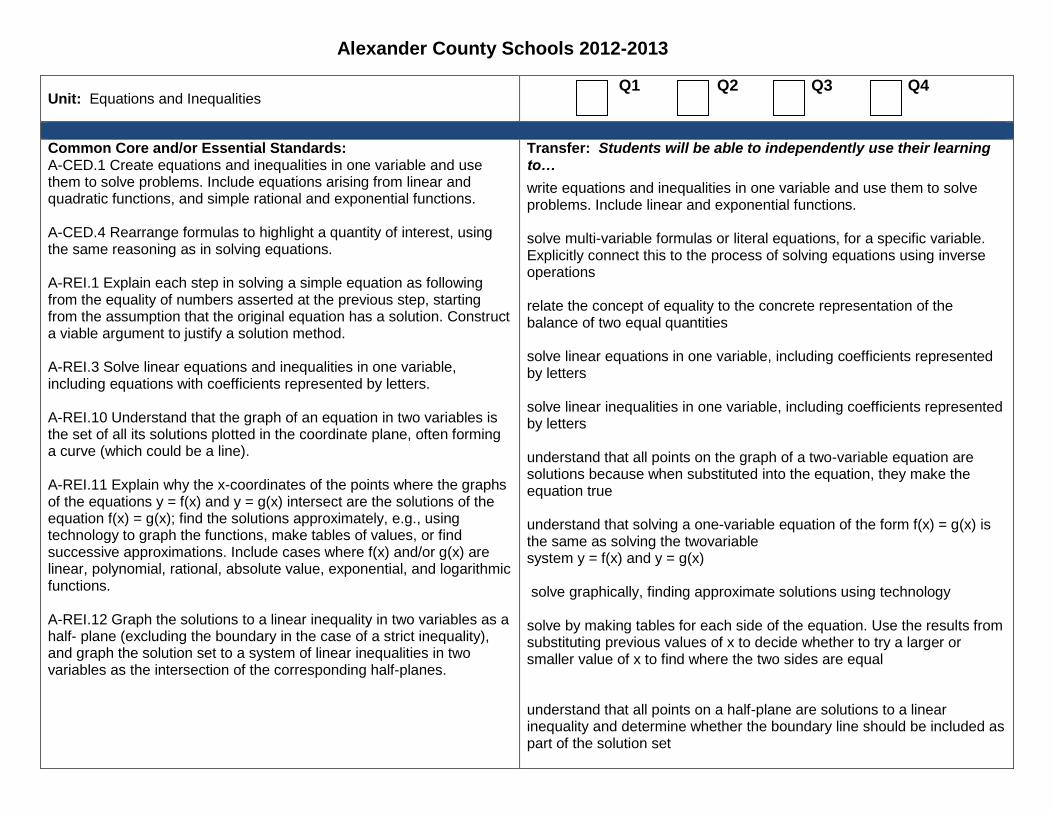
Alexander County Schools 2012-2013 Unit: Equations and Inequalities Q1 Q2 Q3 Q4 Common Core and/or Essential Standards: A-CED.1 Create equations and inequalities in one variable and use them to solve problems. Include equations arising from linear and quadratic functions, and simple rational and exponential functions. A-CED.4 Rearrange formulas to highlight a quantity of interest, using the same reasoning as in solving equations. A-REI.1 Explain each step in solving a simple equation as following from the equality of numbers asserted at the previous step, starting from the assumption that the original equation has a solution. Construct a viable argument to justify a solution method. A-REI.3 Solve linear equations and inequalities in one variable, including equations with coefficients represented by letters. A-REI.10 Understand that the graph of an equation in two variables is the set of all its solutions plotted in the coordinate plane, often forming a curve (which could be a line). A-REI.11 Explain why the x-coordinates of the points where the graphs of the equations y = f(x) and y = g(x) intersect are the solutions of the equation f(x) = g(x); find the solutions approximately, e.g., using technology to graph the functions, make tables of values, or find successive approximations. Include cases where f(x) and/or g(x) are linear, polynomial, rational, absolute value, exponential, and logarithmic functions. A-REI.12 Graph the solutions to a linear inequality in two variables as a half- plane (excluding the boundary in the case of a strict inequality), and graph the solution set to a system of linear inequalities in two variables as the intersection of the corresponding half-planes. Transfer: Students will be able to independently use their learning to… write equations and inequalities in one variable and use them to solve problems. Include linear and exponential functions. solve multi-variable formulas or literal equations, for a specific variable. Explicitly connect this to the process of solving equations using inverse operations relate the concept of equality to the concrete representation of the balance of two equal quantities solve linear equations in one variable, including coefficients represented by letters solve linear inequalities in one variable, including coefficients represented by letters understand that all points on the graph of a two-variable equation are solutions because when substituted into the equation, they make the equation true understand that solving a one-variable equation of the form f(x) = g(x) is the same as solving the twovariable system y = f(x) and y = g(x) solve graphically, finding approximate solutions using technology solve by making tables for each side of the equation. Use the results from substituting previous values of x to decide whether to try a larger or smaller value of x to find where the two sides are equal understand that all points on a half-plane are solutions to a linear inequality and determine whether the boundary line should be included as part of the solution set
-
Upload
khangminh22 -
Category
Documents
-
view
4 -
download
0
Transcript of Alexander County Schools 2012-2013
Alexander County Schools 2012-2013
Unit: Equations and Inequalities Q1 Q2 Q3 Q4
Common Core and/or Essential Standards: A-CED.1 Create equations and inequalities in one variable and use them to solve problems. Include equations arising from linear and quadratic functions, and simple rational and exponential functions. A-CED.4 Rearrange formulas to highlight a quantity of interest, using the same reasoning as in solving equations. A-REI.1 Explain each step in solving a simple equation as following from the equality of numbers asserted at the previous step, starting from the assumption that the original equation has a solution. Construct a viable argument to justify a solution method. A-REI.3 Solve linear equations and inequalities in one variable, including equations with coefficients represented by letters. A-REI.10 Understand that the graph of an equation in two variables is the set of all its solutions plotted in the coordinate plane, often forming a curve (which could be a line). A-REI.11 Explain why the x-coordinates of the points where the graphs of the equations y = f(x) and y = g(x) intersect are the solutions of the equation f(x) = g(x); find the solutions approximately, e.g., using technology to graph the functions, make tables of values, or find successive approximations. Include cases where f(x) and/or g(x) are linear, polynomial, rational, absolute value, exponential, and logarithmic functions. A-REI.12 Graph the solutions to a linear inequality in two variables as a half- plane (excluding the boundary in the case of a strict inequality), and graph the solution set to a system of linear inequalities in two variables as the intersection of the corresponding half-planes.
Transfer: Students will be able to independently use their learning to…
write equations and inequalities in one variable and use them to solve problems. Include linear and exponential functions. solve multi-variable formulas or literal equations, for a specific variable. Explicitly connect this to the process of solving equations using inverse operations relate the concept of equality to the concrete representation of the balance of two equal quantities solve linear equations in one variable, including coefficients represented by letters solve linear inequalities in one variable, including coefficients represented by letters understand that all points on the graph of a two-variable equation are solutions because when substituted into the equation, they make the equation true understand that solving a one-variable equation of the form f(x) = g(x) is the same as solving the twovariable system y = f(x) and y = g(x) solve graphically, finding approximate solutions using technology solve by making tables for each side of the equation. Use the results from substituting previous values of x to decide whether to try a larger or smaller value of x to find where the two sides are equal understand that all points on a half-plane are solutions to a linear inequality and determine whether the boundary line should be included as part of the solution set
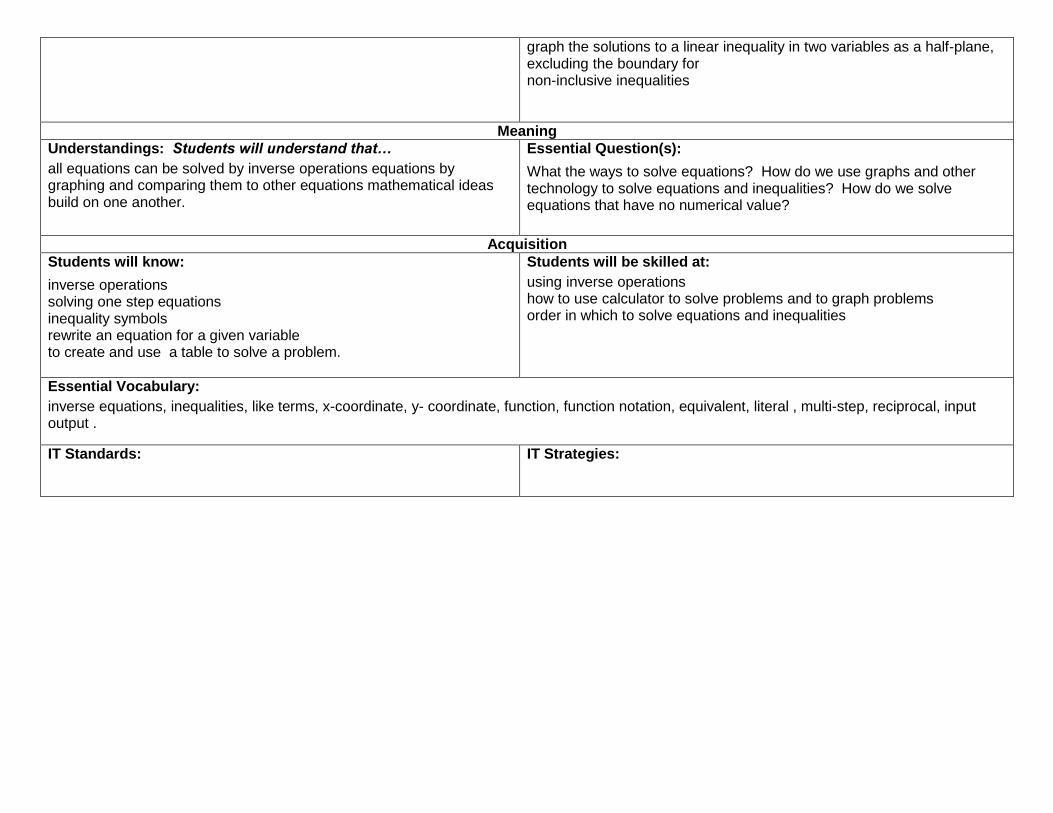
graph the solutions to a linear inequality in two variables as a half-plane, excluding the boundary for non-inclusive inequalities
Meaning
Understandings: Students will understand that…
all equations can be solved by inverse operations equations by graphing and comparing them to other equations mathematical ideas build on one another.
Essential Question(s):
What the ways to solve equations? How do we use graphs and other technology to solve equations and inequalities? How do we solve equations that have no numerical value?
Acquisition
Students will know:
inverse operations solving one step equations inequality symbols rewrite an equation for a given variable to create and use a table to solve a problem.
Students will be skilled at:
using inverse operations how to use calculator to solve problems and to graph problems order in which to solve equations and inequalities
Essential Vocabulary:
inverse equations, inequalities, like terms, x-coordinate, y- coordinate, function, function notation, equivalent, literal , multi-step, reciprocal, input output .
IT Standards: IT Strategies:
Unit Title: Equations and Inequalities Grade: 9th
Subject: Math 1
STAGE 2
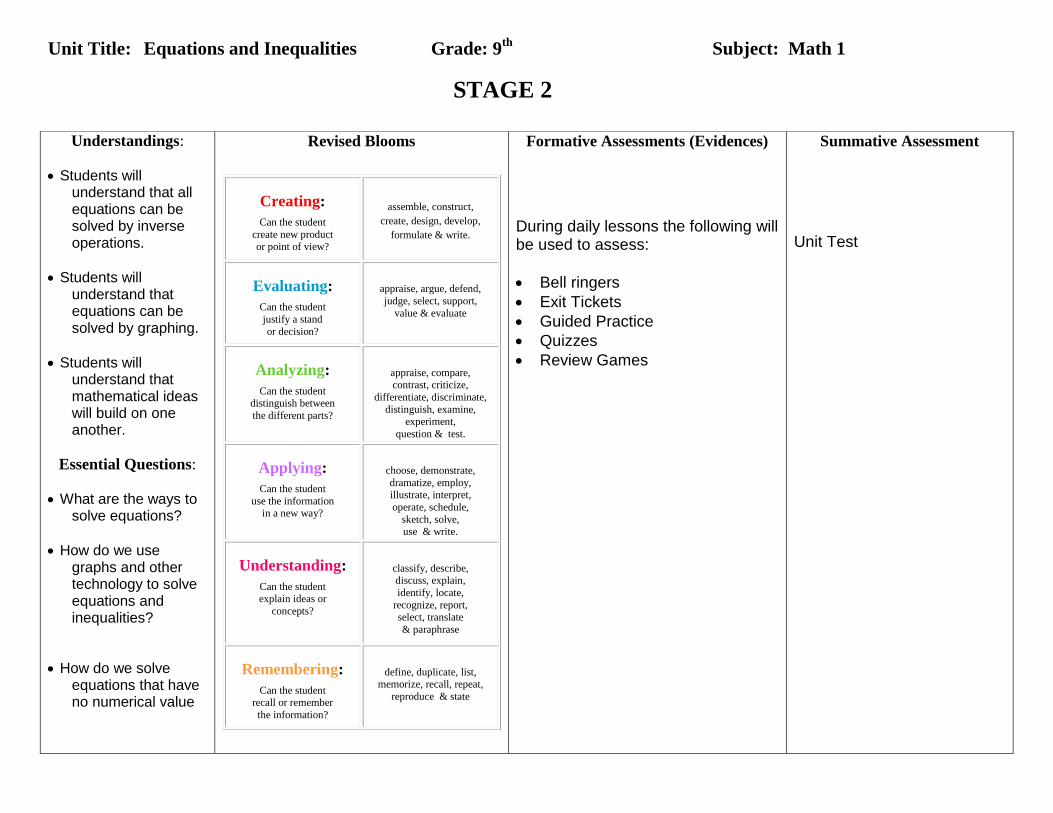
Understandings:
Students will understand that all equations can be solved by inverse operations.
Students will understand that equations can be solved by graphing.
Students will understand that mathematical ideas will build on one another.
Essential Questions:
What are the ways to solve equations?
How do we use graphs and other technology to solve equations and inequalities?
How do we solve equations that have no numerical value
Revised Blooms
Creating:
Can the student
create new product or point of view?
assemble, construct,
create, design, develop,
formulate & write.
Evaluating:
Can the student
justify a stand
or decision?
appraise, argue, defend,
judge, select, support,
value & evaluate
Analyzing:
Can the student distinguish between
the different parts?
appraise, compare, contrast, criticize,
differentiate, discriminate,
distinguish, examine, experiment,
question & test.
Applying:
Can the student
use the information in a new way?
choose, demonstrate,
dramatize, employ, illustrate, interpret,
operate, schedule,
sketch, solve, use & write.
Understanding:
Can the student explain ideas or
concepts?
classify, describe, discuss, explain,
identify, locate,
recognize, report,
select, translate
& paraphrase
Remembering:
Can the student recall or remember
the information?
define, duplicate, list,
memorize, recall, repeat,
reproduce & state
Formative Assessments (Evidences)
During daily lessons the following will be used to assess:
Bell ringers
Exit Tickets
Guided Practice
Quizzes
Review Games
Summative Assessment
Unit Test
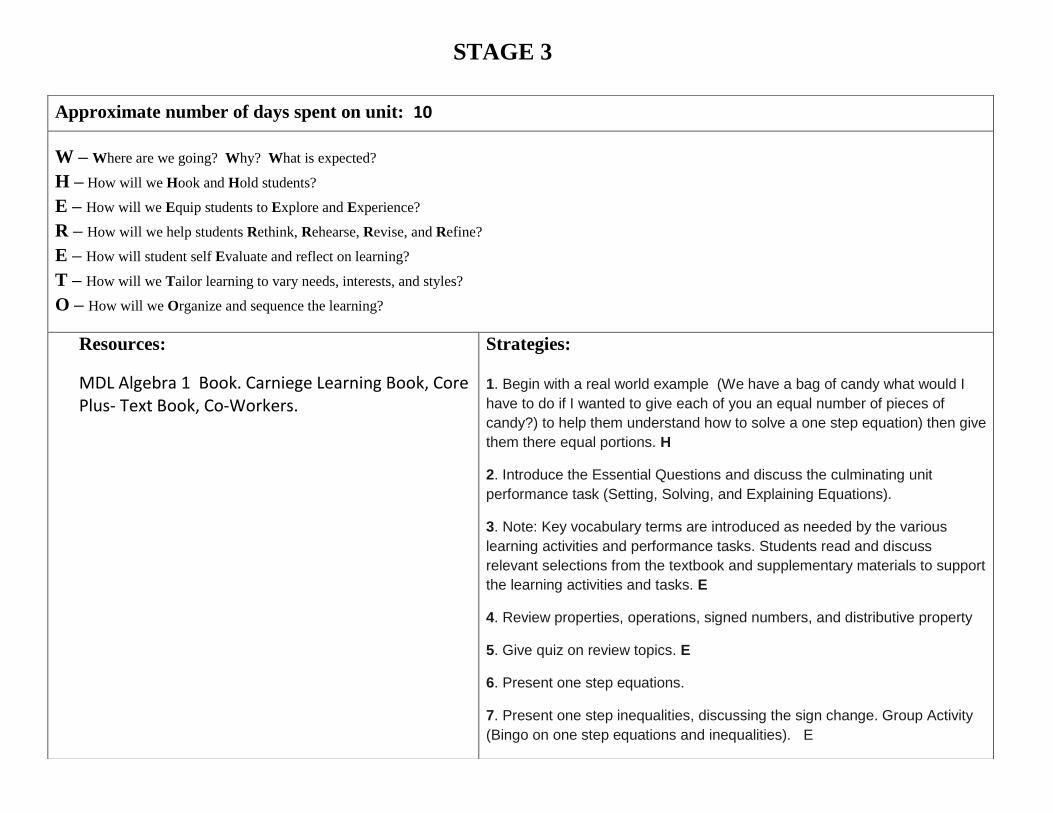
STAGE 3
Approximate number of days spent on unit: 10
W – Where are we going? Why? What is expected?
H – How will we Hook and Hold students?
E – How will we Equip students to Explore and Experience?
R – How will we help students Rethink, Rehearse, Revise, and Refine?
E – How will student self Evaluate and reflect on learning?
T – How will we Tailor learning to vary needs, interests, and styles?
O – How will we Organize and sequence the learning?
Resources:
MDL Algebra 1 Book. Carniege Learning Book, Core Plus- Text Book, Co-Workers.
Strategies:
1. Begin with a real world example (We have a bag of candy what would I
have to do if I wanted to give each of you an equal number of pieces of
candy?) to help them understand how to solve a one step equation) then give
them there equal portions. H
2. Introduce the Essential Questions and discuss the culminating unit
performance task (Setting, Solving, and Explaining Equations).
3. Note: Key vocabulary terms are introduced as needed by the various
learning activities and performance tasks. Students read and discuss
relevant selections from the textbook and supplementary materials to support
the learning activities and tasks. E
4. Review properties, operations, signed numbers, and distributive property
5. Give quiz on review topics. E
6. Present one step equations.
7. Present one step inequalities, discussing the sign change. Group Activity
(Bingo on one step equations and inequalities). E
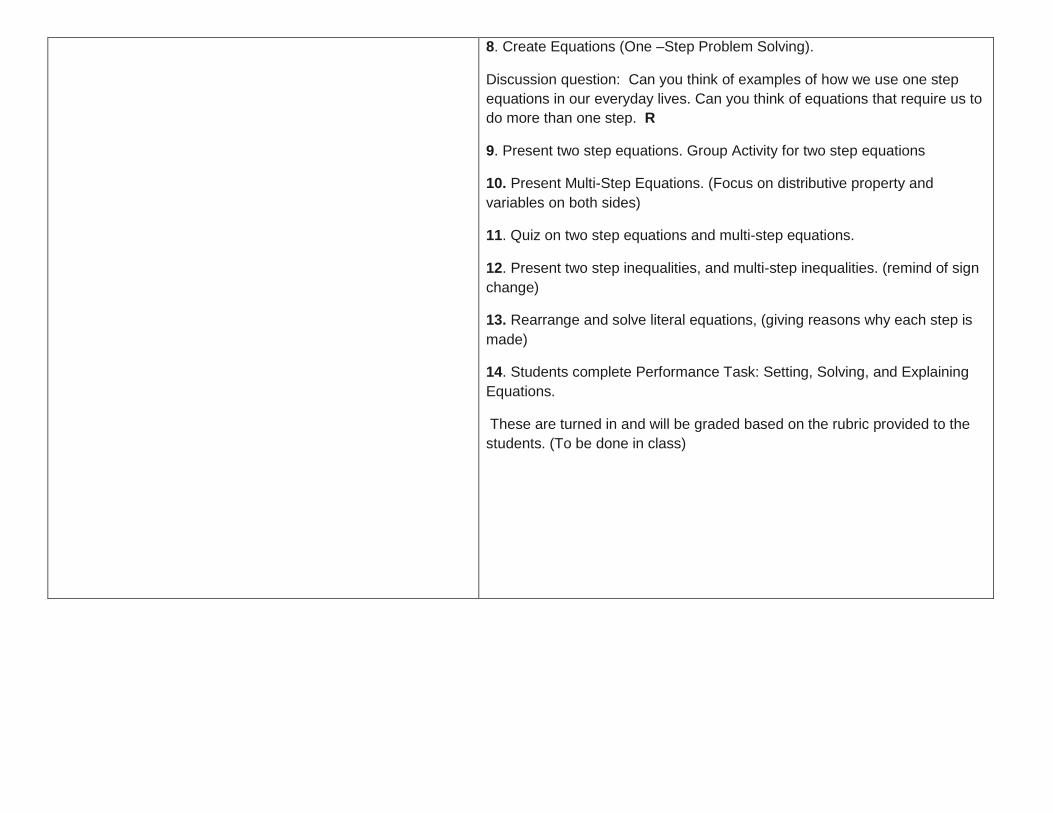
8. Create Equations (One –Step Problem Solving).
Discussion question: Can you think of examples of how we use one step
equations in our everyday lives. Can you think of equations that require us to
do more than one step. R
9. Present two step equations. Group Activity for two step equations
10. Present Multi-Step Equations. (Focus on distributive property and
variables on both sides)
11. Quiz on two step equations and multi-step equations.
12. Present two step inequalities, and multi-step inequalities. (remind of sign
change)
13. Rearrange and solve literal equations, (giving reasons why each step is
made)
14. Students complete Performance Task: Setting, Solving, and Explaining
Equations.
These are turned in and will be graded based on the rubric provided to the
students. (To be done in class)
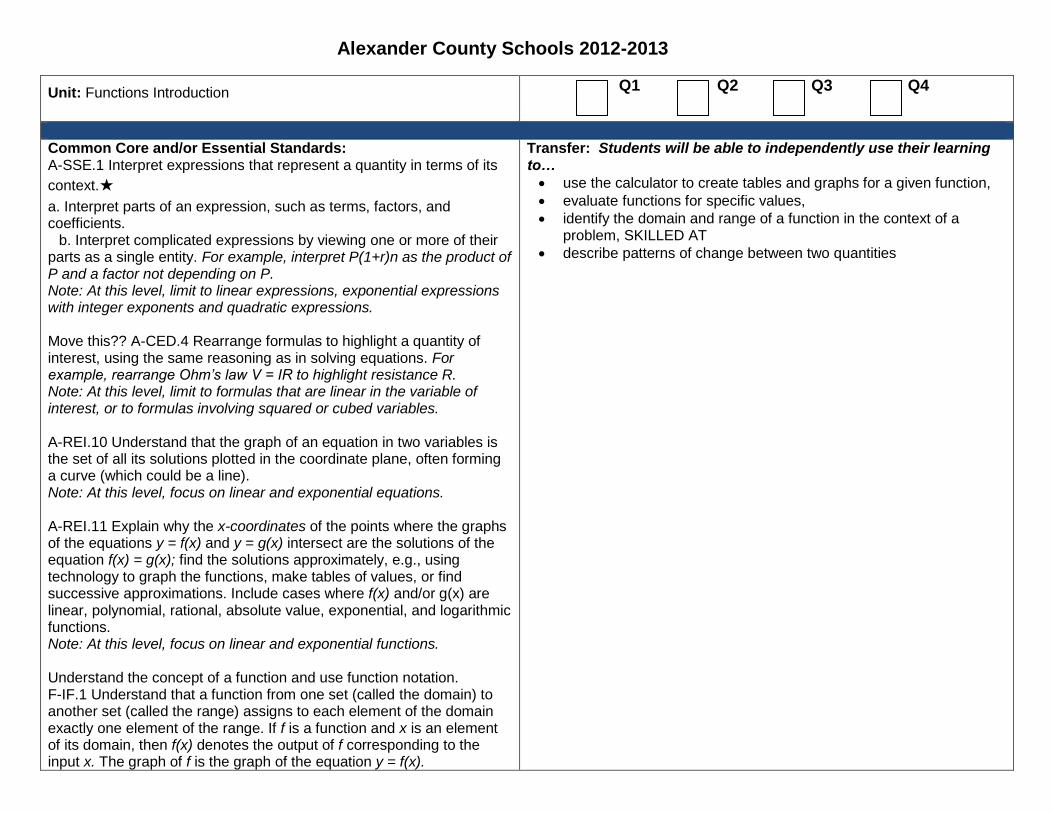
Alexander County Schools 2012-2013
Unit: Functions Introduction
Q1 Q2 Q3 Q4
Common Core and/or Essential Standards: A-SSE.1 Interpret expressions that represent a quantity in terms of its
context.★
a. Interpret parts of an expression, such as terms, factors, and coefficients. b. Interpret complicated expressions by viewing one or more of their parts as a single entity. For example, interpret P(1+r)n as the product of P and a factor not depending on P. Note: At this level, limit to linear expressions, exponential expressions with integer exponents and quadratic expressions. Move this?? A-CED.4 Rearrange formulas to highlight a quantity of interest, using the same reasoning as in solving equations. For example, rearrange Ohm’s law V = IR to highlight resistance R. Note: At this level, limit to formulas that are linear in the variable of interest, or to formulas involving squared or cubed variables. A-REI.10 Understand that the graph of an equation in two variables is the set of all its solutions plotted in the coordinate plane, often forming a curve (which could be a line). Note: At this level, focus on linear and exponential equations. A-REI.11 Explain why the x-coordinates of the points where the graphs of the equations y = f(x) and y = g(x) intersect are the solutions of the equation f(x) = g(x); find the solutions approximately, e.g., using technology to graph the functions, make tables of values, or find successive approximations. Include cases where f(x) and/or g(x) are linear, polynomial, rational, absolute value, exponential, and logarithmic functions. Note: At this level, focus on linear and exponential functions. Understand the concept of a function and use function notation. F-IF.1 Understand that a function from one set (called the domain) to another set (called the range) assigns to each element of the domain exactly one element of the range. If f is a function and x is an element of its domain, then f(x) denotes the output of f corresponding to the input x. The graph of f is the graph of the equation y = f(x).
Transfer: Students will be able to independently use their learning to…
use the calculator to create tables and graphs for a given function,
evaluate functions for specific values,
identify the domain and range of a function in the context of a problem, SKILLED AT
describe patterns of change between two quantities
F-IF.2 Use function notation, evaluate functions for inputs in their domains, and interpret statements that use function notation in terms of a context. Note: At this level, the focus is linear and exponential functions. F-IF.3 Recognize that sequences are functions, sometimes defined recursively, whose domain is a subset of the integers. For example, the Fibonacci sequence is defined recursively by f(0) = f(1) = 1, f(n+1) = f(n) + f(n-1) for n ≥ 1. Interpret functions that arise in applications in terms of the context. F-IF.4 For a function that models a relationship between two quantities, interpret key features of graphs and tables in terms of the quantities, and sketch graphs showing key features given a verbal description of the relationship. Key features include: intercepts; intervals where the function is increasing, decreasing, positive, or negative; relative maximums and minimums; symmetries; end behavior; and periodicity. Note: At this level, focus on linear, exponential and quadratic functions; no end behavior or periodicity. F-IF.5 Relate the domain of a function to its graph and, where applicable, to the quantitative relationship it describes. For example, if the function h(n) gives the number of person-hours it takes to assemble n engines in a factory, then the positive integers would be an
appropriate domain for the function.★
Note: At this level, focus on linear and exponential functions. F-IF.9 Compare properties of two functions each represented in a different way (algebraically, graphically, numerically in tables, or by verbal descriptions). For example, given a graph of one quadratic function and an algebraic expression for another, say which has the larger maximum. Note: At this level, focus on linear, exponential, and quadratic functions. F-BF.1 Write a function that describes a relationship between two
quantities.★
a. Determine an explicit expression, a recursive process, or steps for calculation from a context.
Meaning
Understandings: Students will understand that…
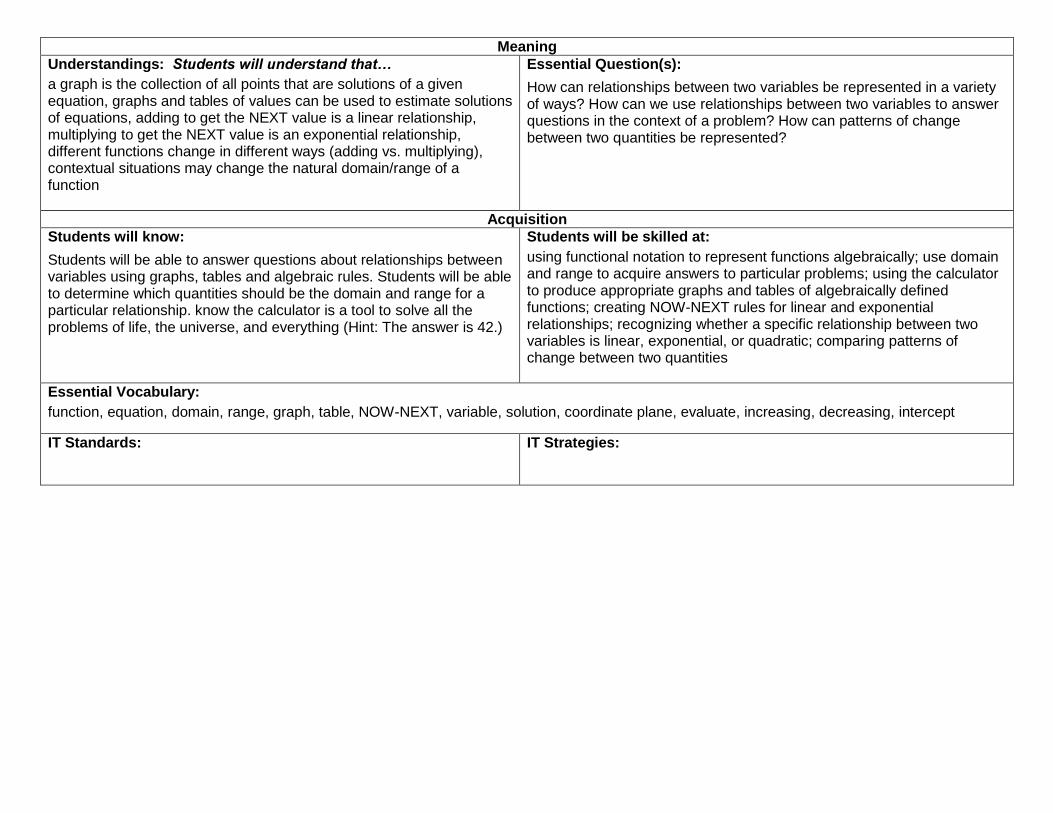
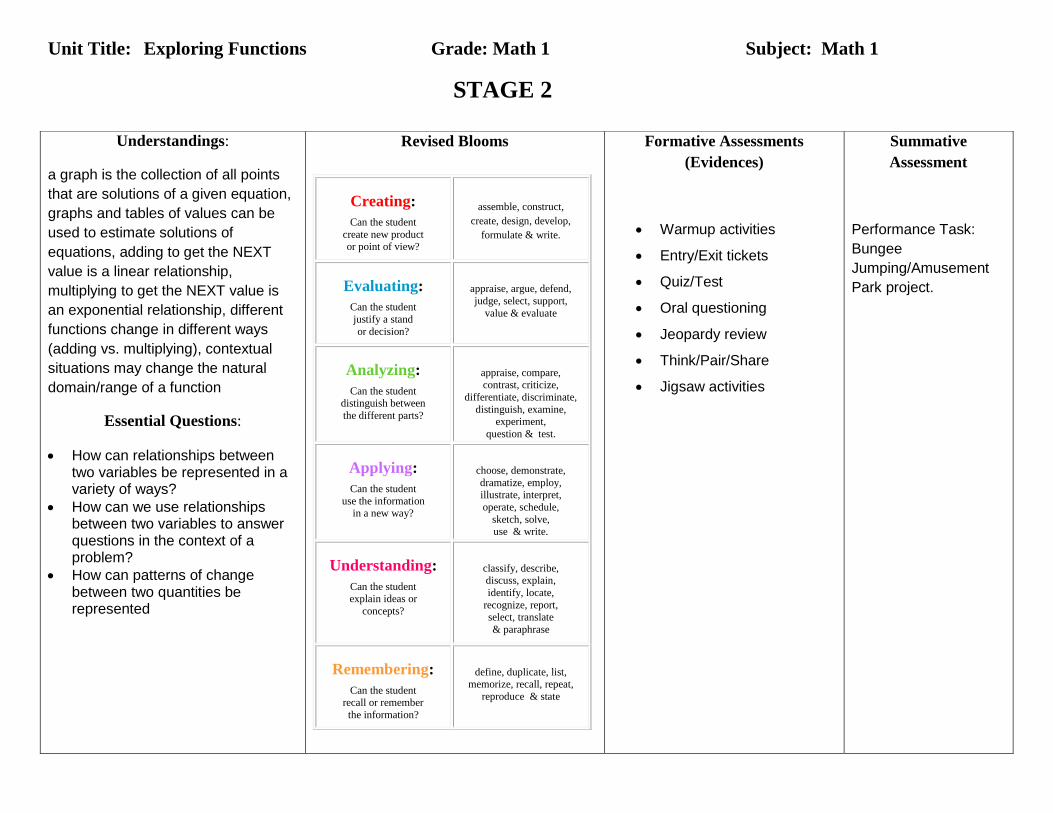
a graph is the collection of all points that are solutions of a given equation, graphs and tables of values can be used to estimate solutions of equations, adding to get the NEXT value is a linear relationship, multiplying to get the NEXT value is an exponential relationship, different functions change in different ways (adding vs. multiplying), contextual situations may change the natural domain/range of a function
Essential Question(s):
How can relationships between two variables be represented in a variety of ways? How can we use relationships between two variables to answer questions in the context of a problem? How can patterns of change between two quantities be represented?
Acquisition
Students will know:
Students will be able to answer questions about relationships between variables using graphs, tables and algebraic rules. Students will be able to determine which quantities should be the domain and range for a particular relationship. know the calculator is a tool to solve all the problems of life, the universe, and everything (Hint: The answer is 42.)
Students will be skilled at:
using functional notation to represent functions algebraically; use domain and range to acquire answers to particular problems; using the calculator to produce appropriate graphs and tables of algebraically defined functions; creating NOW-NEXT rules for linear and exponential relationships; recognizing whether a specific relationship between two variables is linear, exponential, or quadratic; comparing patterns of change between two quantities
Essential Vocabulary:
function, equation, domain, range, graph, table, NOW-NEXT, variable, solution, coordinate plane, evaluate, increasing, decreasing, intercept
IT Standards: IT Strategies:
Unit Title: Exploring Functions Grade: Math 1 Subject: Math 1
STAGE 2
Understandings:
a graph is the collection of all points
that are solutions of a given equation,
graphs and tables of values can be
used to estimate solutions of
equations, adding to get the NEXT
value is a linear relationship,
multiplying to get the NEXT value is
an exponential relationship, different
functions change in different ways
(adding vs. multiplying), contextual
situations may change the natural
domain/range of a function
Essential Questions:
How can relationships between two variables be represented in a variety of ways?
How can we use relationships between two variables to answer questions in the context of a problem?
How can patterns of change between two quantities be represented
Revised Blooms
Creating:
Can the student
create new product or point of view?
assemble, construct,
create, design, develop,
formulate & write.
Evaluating:
Can the student
justify a stand
or decision?
appraise, argue, defend,
judge, select, support,
value & evaluate
Analyzing:
Can the student distinguish between
the different parts?
appraise, compare, contrast, criticize,
differentiate, discriminate,
distinguish, examine, experiment,
question & test.
Applying:
Can the student
use the information in a new way?
choose, demonstrate,
dramatize, employ, illustrate, interpret,
operate, schedule,
sketch, solve, use & write.
Understanding:
Can the student explain ideas or
concepts?
classify, describe, discuss, explain,
identify, locate,
recognize, report,
select, translate
& paraphrase
Remembering:
Can the student recall or remember
the information?
define, duplicate, list,
memorize, recall, repeat,
reproduce & state
Formative Assessments
(Evidences)
Warmup activities
Entry/Exit tickets
Quiz/Test
Oral questioning
Jeopardy review
Think/Pair/Share
Jigsaw activities
Summative
Assessment
Performance Task:
Bungee
Jumping/Amusement
Park project.
STAGE 3
Approximate number of days spent on unit:
W – Where are we going? Why? What is expected?
H – How will we Hook and Hold students?
E – How will we Equip students to Explore and Experience?
R – How will we help students Rethink, Rehearse, Revise, and Refine?
E – How will student self Evaluate and reflect on learning?
T – How will we Tailor learning to vary needs, interests, and styles?
O – How will we Organize and sequence the learning?
Resources:
Calculators
Graph paper
Rubber bands
Fishing weights
Draw activities from Core Plus Math I
Draw activities from Carnegie Learning Algebra
Sequencing activity from CL Alg. I
Strategies:
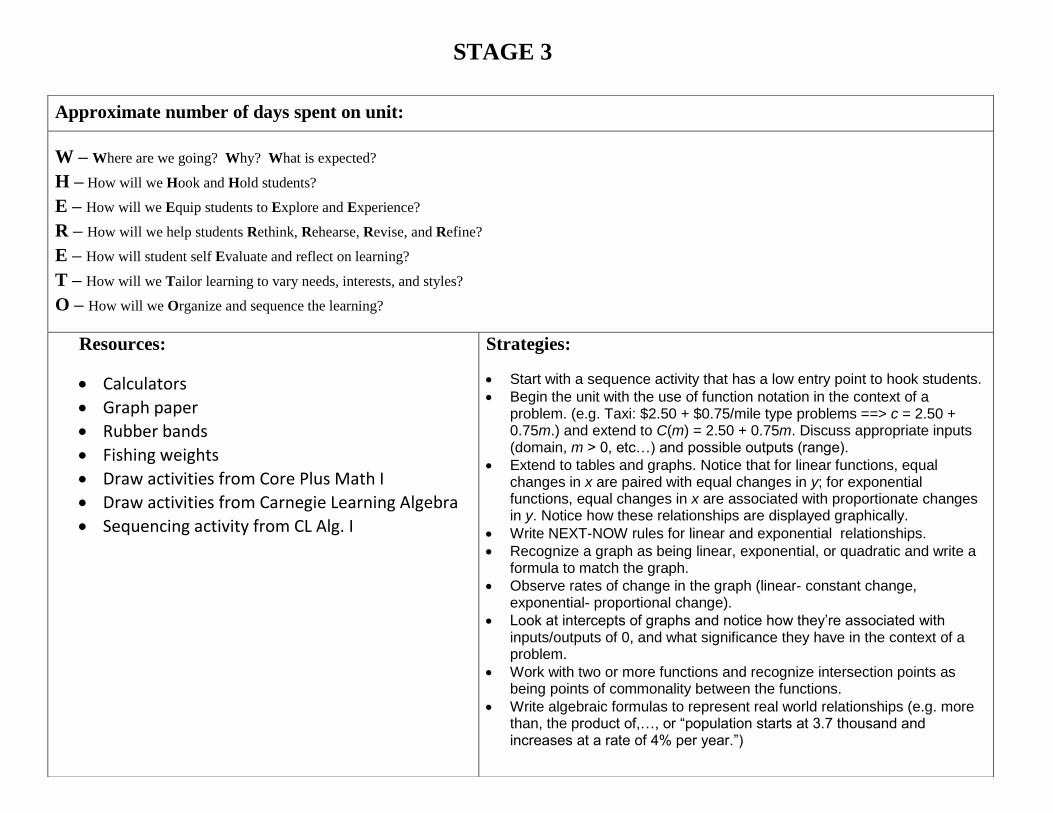
Start with a sequence activity that has a low entry point to hook students.
Begin the unit with the use of function notation in the context of a problem. (e.g. Taxi: $2.50 + $0.75/mile type problems ==> c = 2.50 + 0.75m.) and extend to C(m) = 2.50 + 0.75m. Discuss appropriate inputs (domain, m > 0, etc…) and possible outputs (range).
Extend to tables and graphs. Notice that for linear functions, equal changes in x are paired with equal changes in y; for exponential functions, equal changes in x are associated with proportionate changes in y. Notice how these relationships are displayed graphically.
Write NEXT-NOW rules for linear and exponential relationships.
Recognize a graph as being linear, exponential, or quadratic and write a formula to match the graph.
Observe rates of change in the graph (linear- constant change, exponential- proportional change).
Look at intercepts of graphs and notice how they’re associated with inputs/outputs of 0, and what significance they have in the context of a problem.
Work with two or more functions and recognize intersection points as being points of commonality between the functions.
Write algebraic formulas to represent real world relationships (e.g. more than, the product of,…, or “population starts at 3.7 thousand and increases at a rate of 4% per year.”)
Alexander County Schools 2012-2013
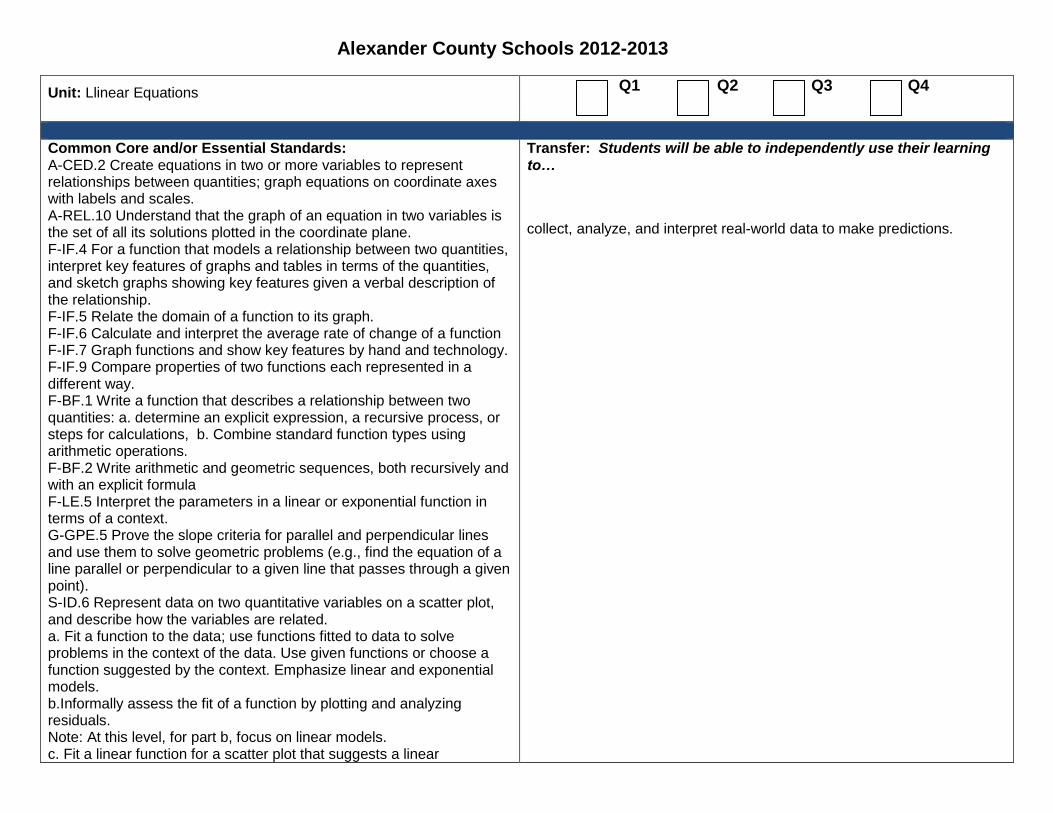
Unit: Llinear Equations
Q1 Q2 Q3 Q4
Common Core and/or Essential Standards: A-CED.2 Create equations in two or more variables to represent relationships between quantities; graph equations on coordinate axes with labels and scales. A-REL.10 Understand that the graph of an equation in two variables is the set of all its solutions plotted in the coordinate plane. F-IF.4 For a function that models a relationship between two quantities, interpret key features of graphs and tables in terms of the quantities, and sketch graphs showing key features given a verbal description of the relationship. F-IF.5 Relate the domain of a function to its graph. F-IF.6 Calculate and interpret the average rate of change of a function F-IF.7 Graph functions and show key features by hand and technology. F-IF.9 Compare properties of two functions each represented in a different way. F-BF.1 Write a function that describes a relationship between two quantities: a. determine an explicit expression, a recursive process, or steps for calculations, b. Combine standard function types using arithmetic operations. F-BF.2 Write arithmetic and geometric sequences, both recursively and with an explicit formula F-LE.5 Interpret the parameters in a linear or exponential function in terms of a context. G-GPE.5 Prove the slope criteria for parallel and perpendicular lines and use them to solve geometric problems (e.g., find the equation of a line parallel or perpendicular to a given line that passes through a given point). S-ID.6 Represent data on two quantitative variables on a scatter plot, and describe how the variables are related. a. Fit a function to the data; use functions fitted to data to solve problems in the context of the data. Use given functions or choose a function suggested by the context. Emphasize linear and exponential models. b.Informally assess the fit of a function by plotting and analyzing residuals. Note: At this level, for part b, focus on linear models. c. Fit a linear function for a scatter plot that suggests a linear
Transfer: Students will be able to independently use their learning to…
collect, analyze, and interpret real-world data to make predictions.
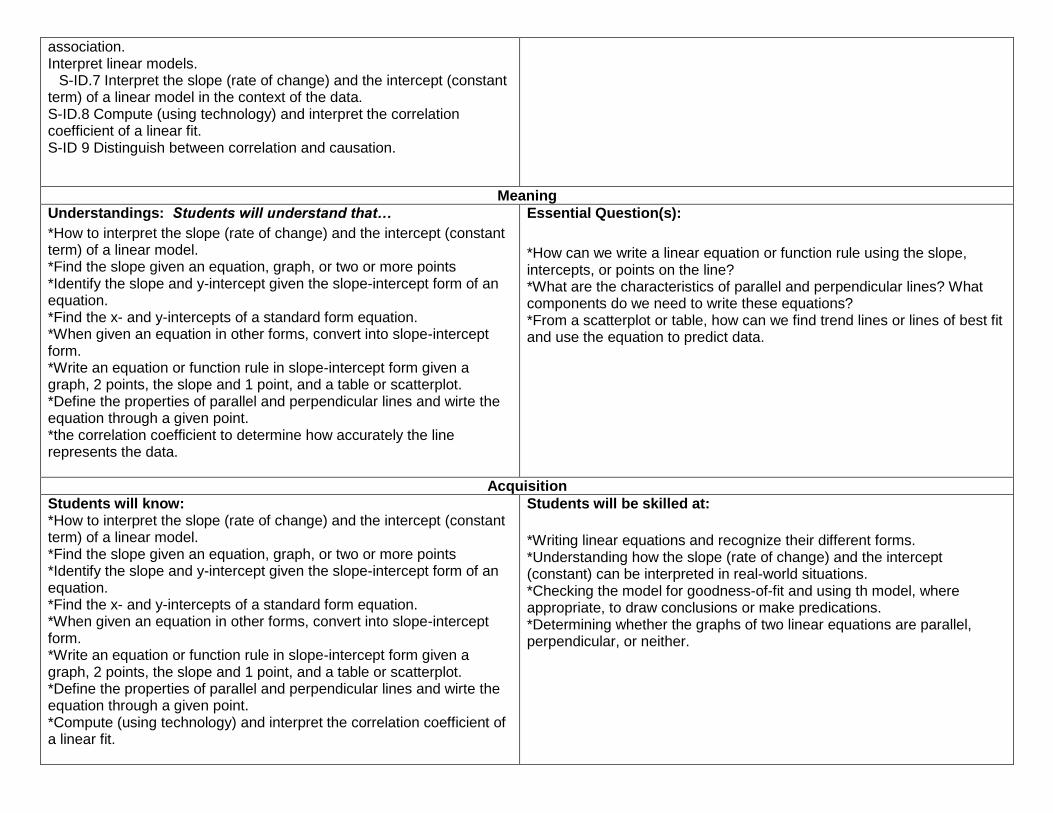
association. Interpret linear models. S-ID.7 Interpret the slope (rate of change) and the intercept (constant term) of a linear model in the context of the data. S-ID.8 Compute (using technology) and interpret the correlation coefficient of a linear fit. S-ID 9 Distinguish between correlation and causation.
Meaning
Understandings: Students will understand that…
*How to interpret the slope (rate of change) and the intercept (constant term) of a linear model. *Find the slope given an equation, graph, or two or more points *Identify the slope and y-intercept given the slope-intercept form of an equation. *Find the x- and y-intercepts of a standard form equation. *When given an equation in other forms, convert into slope-intercept form. *Write an equation or function rule in slope-intercept form given a graph, 2 points, the slope and 1 point, and a table or scatterplot. *Define the properties of parallel and perpendicular lines and wirte the equation through a given point. *the correlation coefficient to determine how accurately the line represents the data.
Essential Question(s):
*How can we write a linear equation or function rule using the slope, intercepts, or points on the line? *What are the characteristics of parallel and perpendicular lines? What components do we need to write these equations? *From a scatterplot or table, how can we find trend lines or lines of best fit and use the equation to predict data.
Acquisition
Students will know: *How to interpret the slope (rate of change) and the intercept (constant term) of a linear model. *Find the slope given an equation, graph, or two or more points *Identify the slope and y-intercept given the slope-intercept form of an equation. *Find the x- and y-intercepts of a standard form equation. *When given an equation in other forms, convert into slope-intercept form. *Write an equation or function rule in slope-intercept form given a graph, 2 points, the slope and 1 point, and a table or scatterplot. *Define the properties of parallel and perpendicular lines and wirte the equation through a given point. *Compute (using technology) and interpret the correlation coefficient of a linear fit.
Students will be skilled at:
*Writing linear equations and recognize their different forms. *Understanding how the slope (rate of change) and the intercept (constant) can be interpreted in real-world situations. *Checking the model for goodness-of-fit and using th model, where appropriate, to draw conclusions or make predications. *Determining whether the graphs of two linear equations are parallel, perpendicular, or neither.

Essential Vocabulary:
Slope, linear equation, line of best fit, parallell, negative reciprocal, perpendicular lines, rate of change, slope-intercept form, point-slope form, standard form,x-intercept, y-intercept, horizontal, vertical, correlation coefficient, scatter plot, domain, range, function
IT Standards: IT Strategies:

Unit Title: Linear Equations Grade: 9th
Subject: Math 1
STAGE 2
Understandings:
Essential Questions:
*How can we write a linear
equation or function rule using the
slope, intercepts, or points on the
line?
*What are the characteristics of
parallel and perpendicular lines?
What components do we need to
write these equations?
*From a scatterplot or table, how can we find trend lines or lines of best fit, use the equation to predict data, and interpret the rate of change and constant.
Revised Blooms
Creating:
Can the student
create new product or point of view?
assemble, construct,
create, design, develop,
formulate & write.
Evaluating:
Can the student
justify a stand
or decision?
appraise, argue, defend,
judge, select, support,
value & evaluate
Analyzing:
Can the student distinguish between
the different parts?
appraise, compare, contrast, criticize,
differentiate, discriminate,
distinguish, examine, experiment,
question & test.
Applying:
Can the student
use the information in a new way?
choose, demonstrate,
dramatize, employ, illustrate, interpret,
operate, schedule,
sketch, solve, use & write.
Understanding:
Can the student explain ideas or
concepts?
classify, describe, discuss, explain,
identify, locate,
recognize, report,
select, translate
& paraphrase
Remembering:
Can the student recall or remember
the information?
define, duplicate, list,
memorize, recall, repeat,
reproduce & state
Formative Assessments
(Evidences)
During daily lessons, the following will be used to assess: *Bellringers *Tickets Out The Door *Guided practice *Quizzes *Observations and Dialogues *Discussion Groups *Personal white boards to see classwork Answers, review games,, and problems demonstrated on the board. Linear Equations will be written given: *graphs *slope and y-intercept *2 points *x- and y-intercept *slope and 1 point *tables and scatterplots
Summative Assessment
Performance Task:
How Do You Measure Up?
Unit Test
STAGE 3
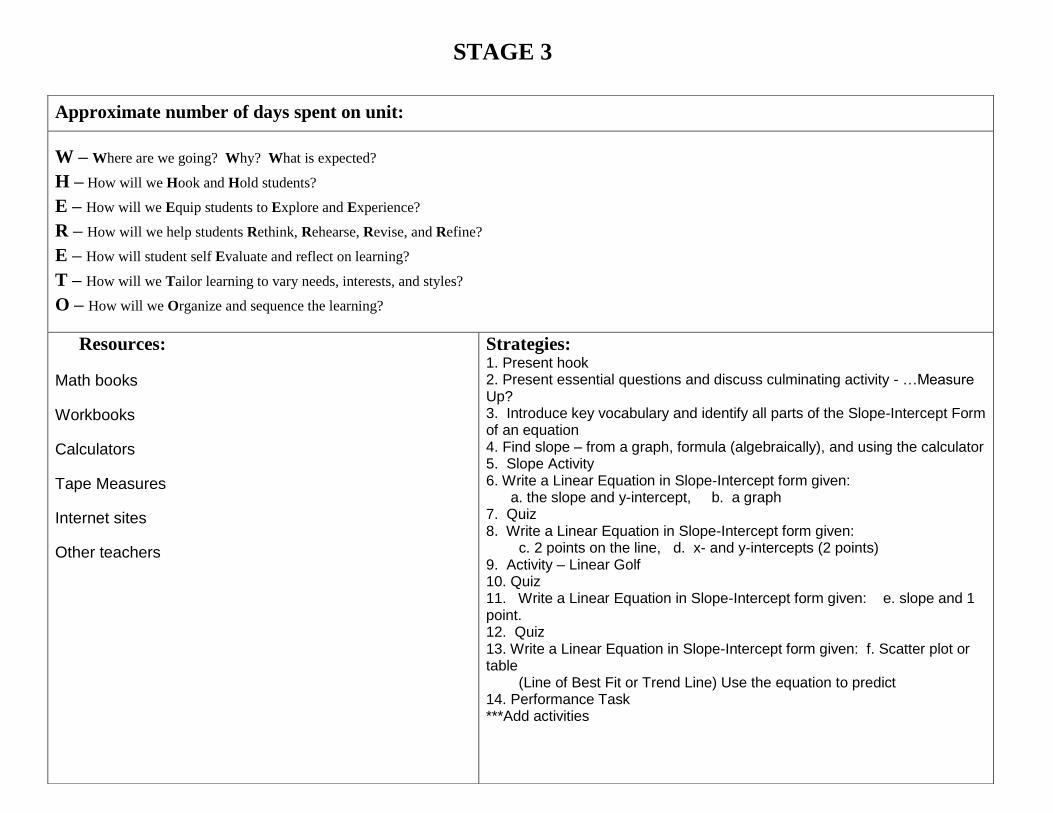
Approximate number of days spent on unit:
W – Where are we going? Why? What is expected?
H – How will we Hook and Hold students?
E – How will we Equip students to Explore and Experience?
R – How will we help students Rethink, Rehearse, Revise, and Refine?
E – How will student self Evaluate and reflect on learning?
T – How will we Tailor learning to vary needs, interests, and styles?
O – How will we Organize and sequence the learning?
Resources:
Math books
Workbooks
Calculators
Tape Measures
Internet sites
Other teachers
Strategies: 1. Present hook 2. Present essential questions and discuss culminating activity - …Measure Up? 3. Introduce key vocabulary and identify all parts of the Slope-Intercept Form of an equation 4. Find slope – from a graph, formula (algebraically), and using the calculator 5. Slope Activity 6. Write a Linear Equation in Slope-Intercept form given: a. the slope and y-intercept, b. a graph 7. Quiz 8. Write a Linear Equation in Slope-Intercept form given: c. 2 points on the line, d. x- and y-intercepts (2 points) 9. Activity – Linear Golf 10. Quiz 11. Write a Linear Equation in Slope-Intercept form given: e. slope and 1 point. 12. Quiz 13. Write a Linear Equation in Slope-Intercept form given: f. Scatter plot or table (Line of Best Fit or Trend Line) Use the equation to predict 14. Performance Task ***Add activities
Alexander County Schools 2012-2013
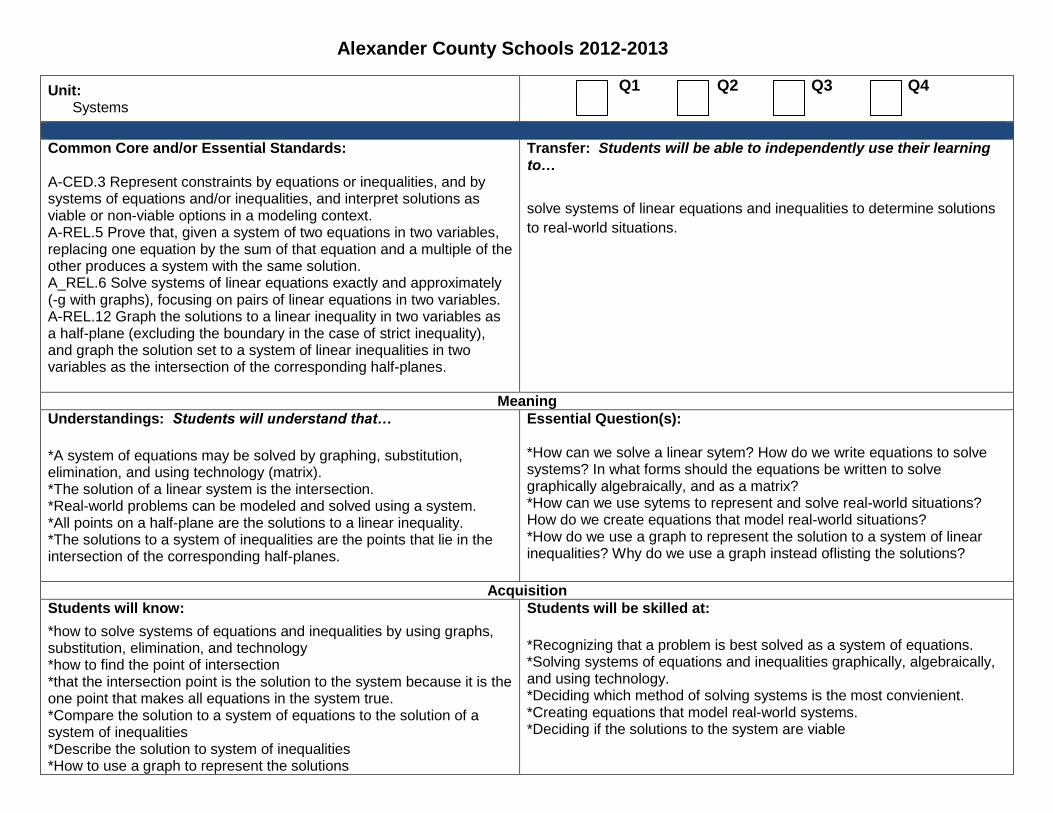
Unit: Systems
Q1 Q2 Q3 Q4
Common Core and/or Essential Standards: A-CED.3 Represent constraints by equations or inequalities, and by systems of equations and/or inequalities, and interpret solutions as viable or non-viable options in a modeling context. A-REL.5 Prove that, given a system of two equations in two variables, replacing one equation by the sum of that equation and a multiple of the other produces a system with the same solution. A_REL.6 Solve systems of linear equations exactly and approximately (-g with graphs), focusing on pairs of linear equations in two variables. A-REL.12 Graph the solutions to a linear inequality in two variables as a half-plane (excluding the boundary in the case of strict inequality), and graph the solution set to a system of linear inequalities in two variables as the intersection of the corresponding half-planes.
Transfer: Students will be able to independently use their learning to…
solve systems of linear equations and inequalities to determine solutions
to real-world situations.
Meaning
Understandings: Students will understand that…
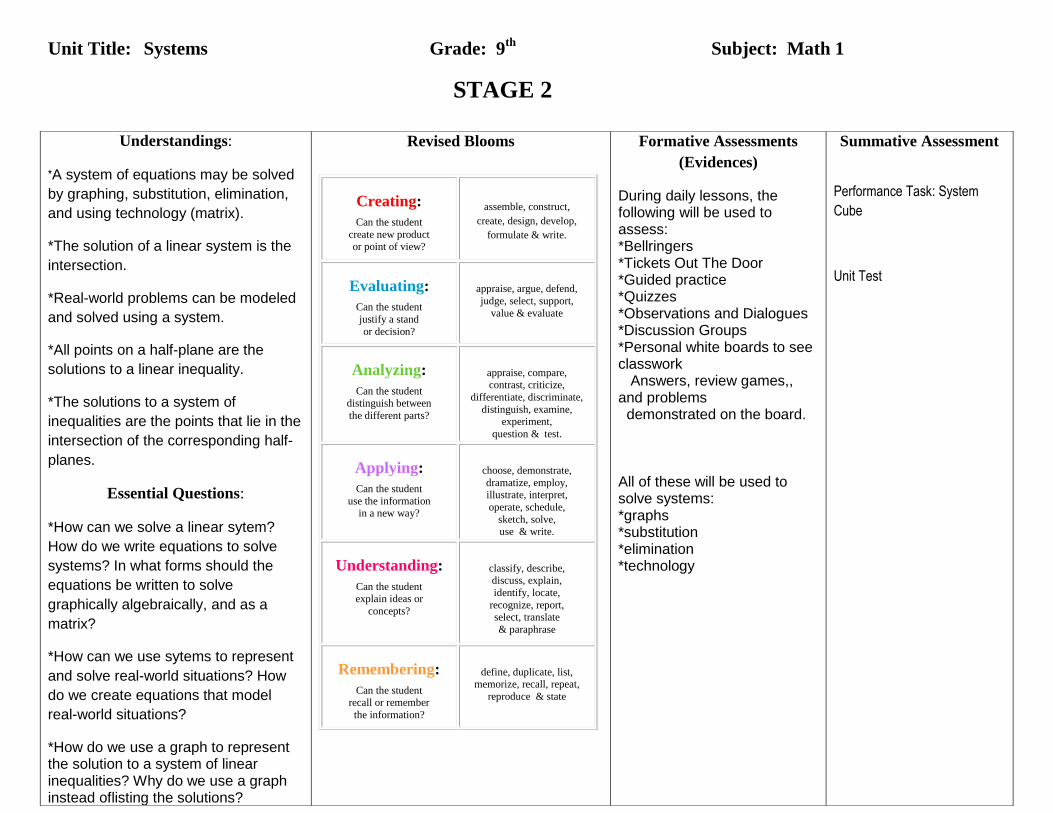
*A system of equations may be solved by graphing, substitution, elimination, and using technology (matrix). *The solution of a linear system is the intersection. *Real-world problems can be modeled and solved using a system. *All points on a half-plane are the solutions to a linear inequality. *The solutions to a system of inequalities are the points that lie in the intersection of the corresponding half-planes.
Essential Question(s): *How can we solve a linear sytem? How do we write equations to solve systems? In what forms should the equations be written to solve graphically algebraically, and as a matrix? *How can we use sytems to represent and solve real-world situations? How do we create equations that model real-world situations? *How do we use a graph to represent the solution to a system of linear inequalities? Why do we use a graph instead oflisting the solutions?
Acquisition
Students will know:
*how to solve systems of equations and inequalities by using graphs, substitution, elimination, and technology *how to find the point of intersection *that the intersection point is the solution to the system because it is the one point that makes all equations in the system true. *Compare the solution to a system of equations to the solution of a system of inequalities *Describe the solution to system of inequalities *How to use a graph to represent the solutions
Students will be skilled at:
*Recognizing that a problem is best solved as a system of equations. *Solving systems of equations and inequalities graphically, algebraically, and using technology. *Deciding which method of solving systems is the most convienient. *Creating equations that model real-world systems. *Deciding if the solutions to the system are viable

*Decide if the boundary line is included as part of the solution. *Decide if the solution is viable. Justify the results.
Essential Vocabulary:
elimination method, substitution method, graphing method, no solution, solution, linear, coordinate, inequality, system, intersection point, matrix, slope-intercept form, standard form, constraints, viable
IT Standards: IT Strategies:
Unit Title: Systems Grade: 9th
Subject: Math 1
STAGE 2
Understandings:
*A system of equations may be solved
by graphing, substitution, elimination,
and using technology (matrix).
*The solution of a linear system is the
intersection.
*Real-world problems can be modeled
and solved using a system.
*All points on a half-plane are the
solutions to a linear inequality.
*The solutions to a system of
inequalities are the points that lie in the
intersection of the corresponding half-
planes.
Essential Questions:
*How can we solve a linear sytem?
How do we write equations to solve
systems? In what forms should the
equations be written to solve
graphically algebraically, and as a
matrix?
*How can we use sytems to represent
and solve real-world situations? How
do we create equations that model
real-world situations?
*How do we use a graph to represent the solution to a system of linear inequalities? Why do we use a graph instead oflisting the solutions?
Revised Blooms
Creating:
Can the student
create new product or point of view?
assemble, construct,
create, design, develop,
formulate & write.
Evaluating:
Can the student
justify a stand
or decision?
appraise, argue, defend,
judge, select, support,
value & evaluate
Analyzing:
Can the student distinguish between
the different parts?
appraise, compare, contrast, criticize,
differentiate, discriminate,
distinguish, examine, experiment,
question & test.
Applying:
Can the student
use the information in a new way?
choose, demonstrate,
dramatize, employ, illustrate, interpret,
operate, schedule,
sketch, solve, use & write.
Understanding:
Can the student explain ideas or
concepts?
classify, describe, discuss, explain,
identify, locate,
recognize, report,
select, translate
& paraphrase
Remembering:
Can the student recall or remember
the information?
define, duplicate, list,
memorize, recall, repeat,
reproduce & state
Formative Assessments
(Evidences)
During daily lessons, the following will be used to assess: *Bellringers *Tickets Out The Door *Guided practice *Quizzes *Observations and Dialogues *Discussion Groups *Personal white boards to see classwork Answers, review games,, and problems demonstrated on the board. All of these will be used to solve systems: *graphs *substitution *elimination *technology
Summative Assessment
Performance Task: System
Cube
Unit Test

STAGE 3
Approximate number of days spent on unit:
W – Where are we going? Why? What is expected?
H – How will we Hook and Hold students?
E – How will we Equip students to Explore and Experience?
R – How will we help students Rethink, Rehearse, Revise, and Refine?
E – How will student self Evaluate and reflect on learning?
T – How will we Tailor learning to vary needs, interests, and styles?
O – How will we Organize and sequence the learning?
Resources:
Activities List
Math books
Workbooks
Internet sites
Other teachers
Strategies:
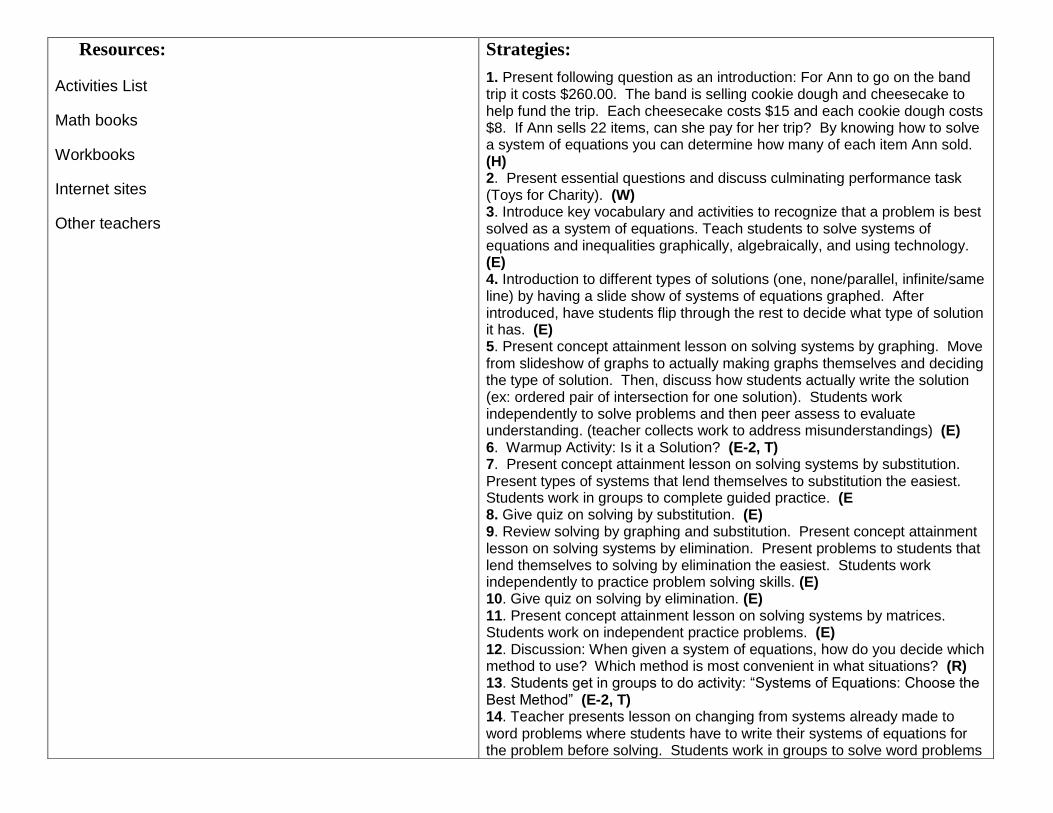
1. Present following question as an introduction: For Ann to go on the band trip it costs $260.00. The band is selling cookie dough and cheesecake to help fund the trip. Each cheesecake costs $15 and each cookie dough costs $8. If Ann sells 22 items, can she pay for her trip? By knowing how to solve a system of equations you can determine how many of each item Ann sold. (H) 2. Present essential questions and discuss culminating performance task (Toys for Charity). (W) 3. Introduce key vocabulary and activities to recognize that a problem is best solved as a system of equations. Teach students to solve systems of equations and inequalities graphically, algebraically, and using technology. (E) 4. Introduction to different types of solutions (one, none/parallel, infinite/same line) by having a slide show of systems of equations graphed. After introduced, have students flip through the rest to decide what type of solution it has. (E) 5. Present concept attainment lesson on solving systems by graphing. Move from slideshow of graphs to actually making graphs themselves and deciding the type of solution. Then, discuss how students actually write the solution (ex: ordered pair of intersection for one solution). Students work independently to solve problems and then peer assess to evaluate understanding. (teacher collects work to address misunderstandings) (E) 6. Warmup Activity: Is it a Solution? (E-2, T) 7. Present concept attainment lesson on solving systems by substitution. Present types of systems that lend themselves to substitution the easiest. Students work in groups to complete guided practice. (E 8. Give quiz on solving by substitution. (E) 9. Review solving by graphing and substitution. Present concept attainment lesson on solving systems by elimination. Present problems to students that lend themselves to solving by elimination the easiest. Students work independently to practice problem solving skills. (E) 10. Give quiz on solving by elimination. (E) 11. Present concept attainment lesson on solving systems by matrices. Students work on independent practice problems. (E) 12. Discussion: When given a system of equations, how do you decide which method to use? Which method is most convenient in what situations? (R) 13. Students get in groups to do activity: “Systems of Equations: Choose the Best Method” (E-2, T) 14. Teacher presents lesson on changing from systems already made to word problems where students have to write their systems of equations for the problem before solving. Students work in groups to solve word problems
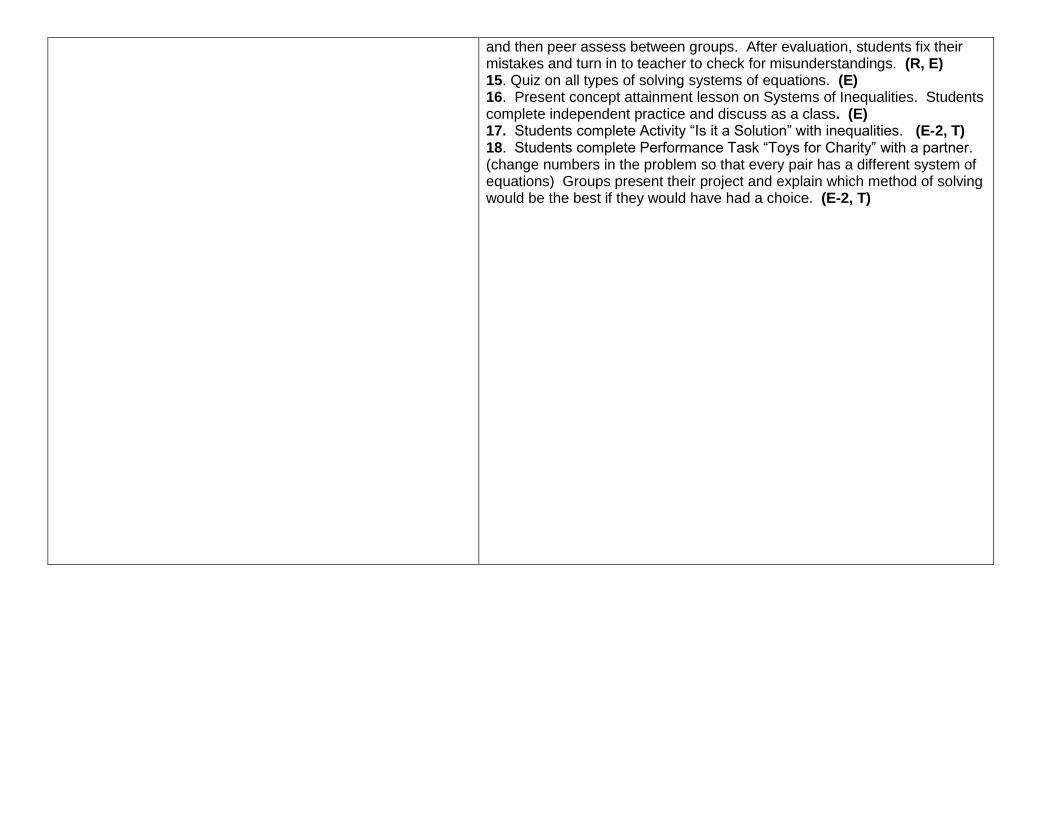
and then peer assess between groups. After evaluation, students fix their mistakes and turn in to teacher to check for misunderstandings. (R, E) 15. Quiz on all types of solving systems of equations. (E) 16. Present concept attainment lesson on Systems of Inequalities. Students complete independent practice and discuss as a class. (E) 17. Students complete Activity “Is it a Solution” with inequalities. (E-2, T) 18. Students complete Performance Task “Toys for Charity” with a partner. (change numbers in the problem so that every pair has a different system of equations) Groups present their project and explain which method of solving would be the best if they would have had a choice. (E-2, T)
Alexander County Schools 2012-2013
Unit: 5 Exponential Functions
Q1 Q2 Q3 Q4
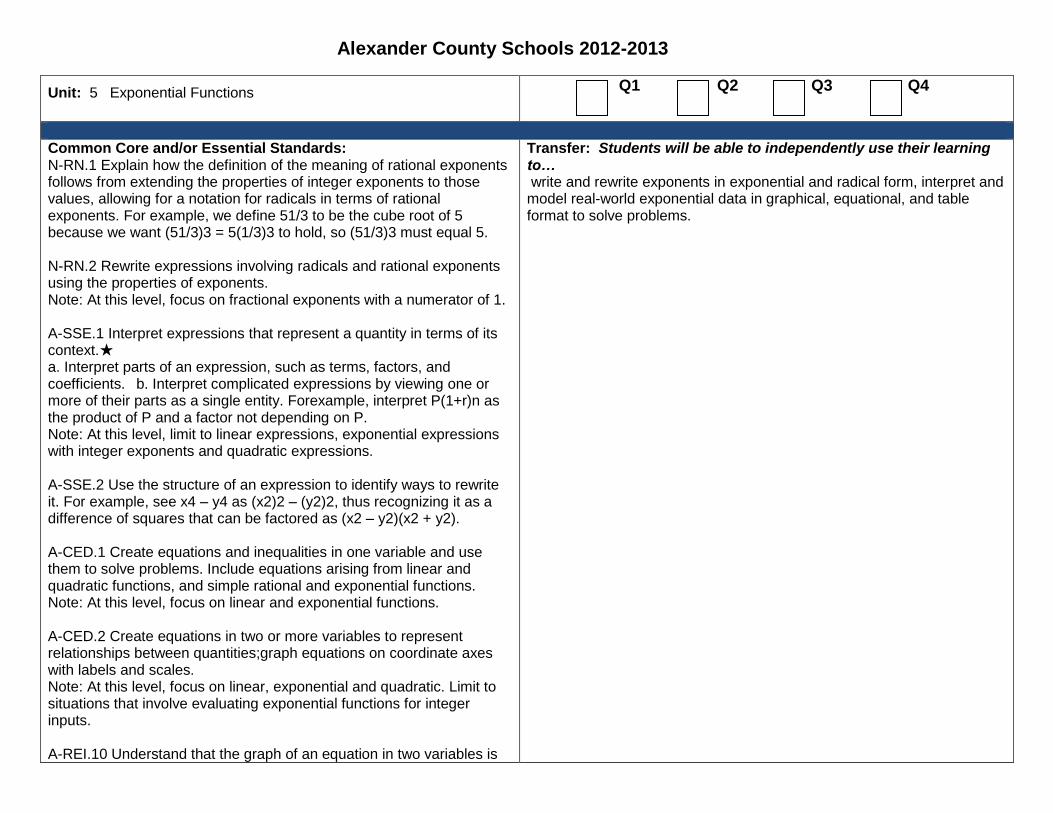
Common Core and/or Essential Standards: N-RN.1 Explain how the definition of the meaning of rational exponents follows from extending the properties of integer exponents to those values, allowing for a notation for radicals in terms of rational exponents. For example, we define 51/3 to be the cube root of 5 because we want (51/3)3 = 5(1/3)3 to hold, so (51/3)3 must equal 5. N-RN.2 Rewrite expressions involving radicals and rational exponents using the properties of exponents. Note: At this level, focus on fractional exponents with a numerator of 1. A-SSE.1 Interpret expressions that represent a quantity in terms of its context.★ a. Interpret parts of an expression, such as terms, factors, and coefficients. b. Interpret complicated expressions by viewing one or more of their parts as a single entity. Forexample, interpret P(1+r)n as the product of P and a factor not depending on P. Note: At this level, limit to linear expressions, exponential expressions with integer exponents and quadratic expressions. A-SSE.2 Use the structure of an expression to identify ways to rewrite it. For example, see x4 – y4 as (x2)2 – (y2)2, thus recognizing it as a difference of squares that can be factored as (x2 – y2)(x2 + y2). A-CED.1 Create equations and inequalities in one variable and use them to solve problems. Include equations arising from linear and quadratic functions, and simple rational and exponential functions. Note: At this level, focus on linear and exponential functions. A-CED.2 Create equations in two or more variables to represent relationships between quantities;graph equations on coordinate axes with labels and scales. Note: At this level, focus on linear, exponential and quadratic. Limit to situations that involve evaluating exponential functions for integer inputs. A-REI.10 Understand that the graph of an equation in two variables is
Transfer: Students will be able to independently use their learning to… write and rewrite exponents in exponential and radical form, interpret and model real-world exponential data in graphical, equational, and table format to solve problems.
the set of all its solutions plotted in the coordinate plane, often forming a curve (which could be a line). Note: At this level, focus on linear and exponential equations. A-REI.11 Explain why the x-coordinates of the points where the graphs of the equations y = f(x) and y = g(x) intersect are the solutions of the equation f(x) = g(x); find the solutions approximately, e.g., using technology to graph the functions, make tables of values, or find successive approximations. Include cases where f(x) and/or g(x) are linear, polynomial, rational, absolute value, exponential, and logarithmic functions. Note: At this level, focus on linear and exponential functions. F-IF.4 For a function that models a relationship between two quantities, interpret key features of graphs and tables in terms of the quantities, and sketch graphs showing key features given a verbal description of the relationship. Key features include: intercepts; intervals where the function is increasing, decreasing, positive, or negative; relative maximums and minimums; symmetries; end behavior; and periodicity. Note: At this level, focus on linear, exponential and quadratic functions; no end behavior or periodicity. F-IF.5 Relate the domain of a function to its graph and, where applicable, to the quantitative relationship it describes. For example, if the function h(n) gives the number of person-hours it takes to assemble n engines in a factory, then the positive integers would be an appropriate domain for the function.★ Note: At this level, focus on linear and exponential functions. F-IF.6 Calculate and interpret the average rate of change of a function (presented symbolically or as atable) over a specified interval. Estimate the rate of change from a graph.★ Note: At this level, focus on linear functions and exponential functions whose domain is a subset ofthe integers. F-IF.7 Graph functions expressed symbolically and show key features of the graph, by hand in simple cases and using technology for more complicated cases.★ e. Graph exponential and logarithmic functions, showing intercepts and end behavior, andtrigonometric functions, showing period, midline, and amplitude. Note: At this level, for part e, focus on exponential functions only. F-IF.8 Write a function defined by an expression in different but
equivalent forms to reveal and explain different properties of the function. b. Use the properties of exponents to interpret expressions for exponential functions. For example, identify percent rate of change in functions such as y = (1.02)t, y = (0.97)t, y = (1.01)12t, y = (1.2)t/10, and classify them as representing exponential growth or decay. F-IF.9 Compare properties of two functions each represented in a different way (algebraically, graphically, numerically in tables, or by verbal descriptions). For example, given a graph of one quadratic function and an algebraic expression for another, say which has the larger maximum.Note: At this level, focus on linear, exponential, and quadratic functions. F-BF.1 Write a function that describes a relationship between two quantities.★ a. Determine an explicit expression, a recursive process, or steps for calculation from a context. b. Combine standard function types using arithmetic operations. For example, build a function that models the temperature of a cooling body by adding a constant function to a decaying exponential, and relate these functions to the model. Note: At this level, limit to addition or subtraction of constant to linear, exponential or quadratic functions or addition of linear functions to linear or quadratic functions. F-BF.2 Write arithmetic and geometric sequences both recursively and with an explicit formula, use them to model situations, and translate between the two forms. Note: At this level, formal recursive notation is not used. Instead, use of informal recursive notation (such as NEXT = NOW + 5 starting at 3) is intended. Build new functions from existing functions. F-BF.3 Identify the effect on the graph of replacing f(x) by f(x) + k, k f(x), f(kx), and f(x + k) for specific values of k (both positive and negative); find the value of k given the graphs. Experiment with cases and illustrate an explanation of the effects on the graph using technology. Include recognizing even and odd functions from their graphs and algebraic expressions for them.Note: At this level, limit to vertical and horizontal translations of linear and exponential functions. Even and odd functions are not addressed.
F-LE.2 Construct linear and exponential functions, including arithmetic and geometric sequences, given a graph, a description of a relationship, or two input-output pairs (include reading these from a table). Interpret expressions for functions in terms of the situation they model. F-LE.5 Interpret the parameters in a linear or exponential function in terms of a context. S-ID.6 Represent data on two quantitative variables on a scatter plot, and describe how the variables are related.
a. Fit a function to the data; use functions fitted to data to solve problems in the context of the data. Use given functions or choose a function suggested by the context. Emphasize linear and exponential models.
Meaning
Understandings: Students will understand that…
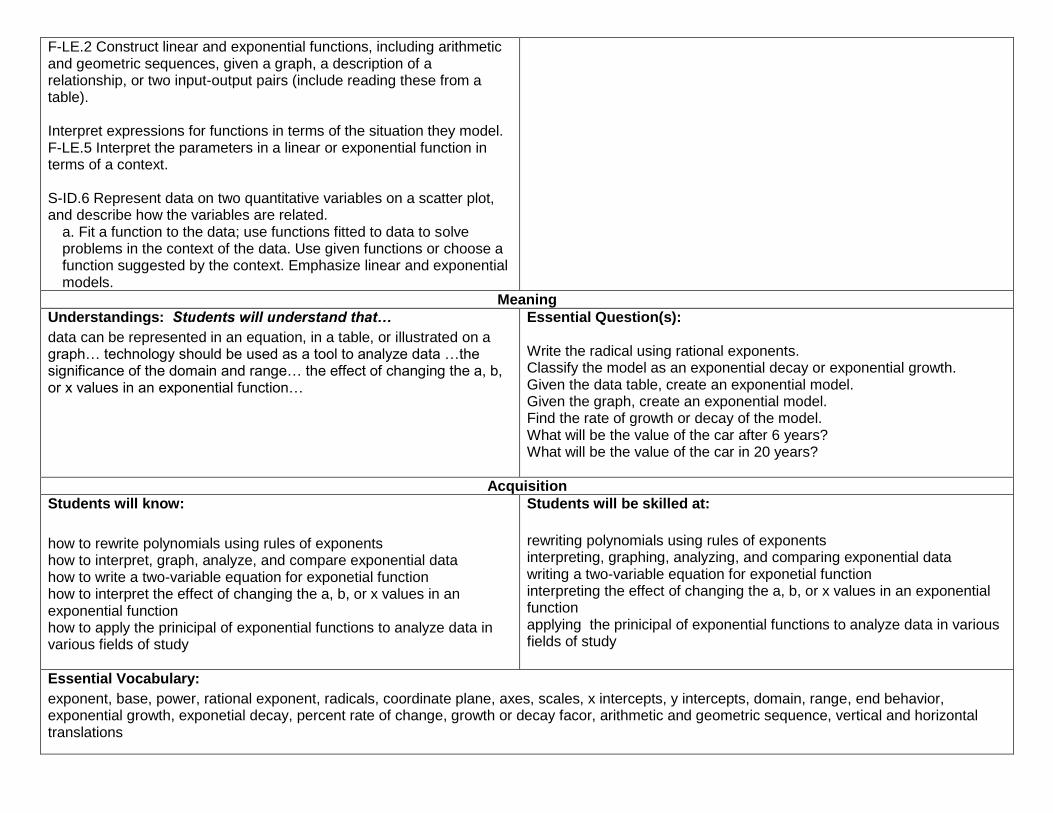
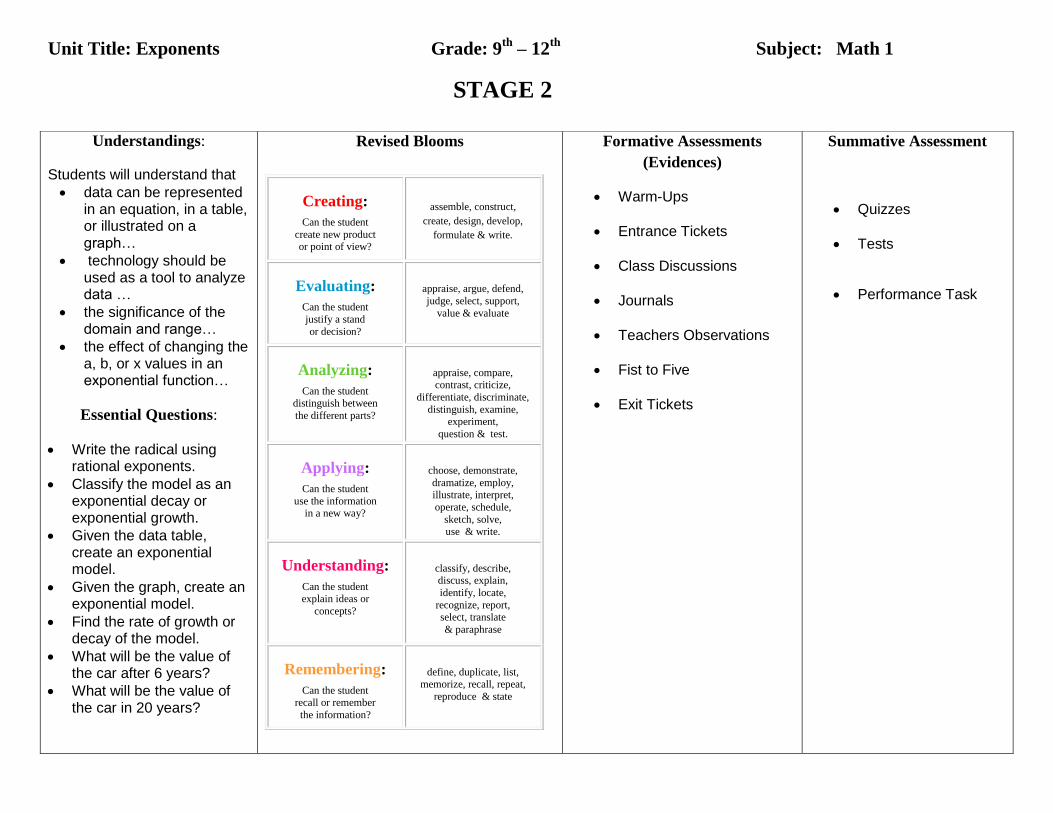
data can be represented in an equation, in a table, or illustrated on a graph… technology should be used as a tool to analyze data …the significance of the domain and range… the effect of changing the a, b, or x values in an exponential function…
Essential Question(s): Write the radical using rational exponents. Classify the model as an exponential decay or exponential growth. Given the data table, create an exponential model. Given the graph, create an exponential model. Find the rate of growth or decay of the model. What will be the value of the car after 6 years? What will be the value of the car in 20 years?
Acquisition
Students will know:
how to rewrite polynomials using rules of exponents how to interpret, graph, analyze, and compare exponential data how to write a two-variable equation for exponetial function how to interpret the effect of changing the a, b, or x values in an exponential function how to apply the prinicipal of exponential functions to analyze data in various fields of study
Students will be skilled at:
rewriting polynomials using rules of exponents interpreting, graphing, analyzing, and comparing exponential data writing a two-variable equation for exponetial function interpreting the effect of changing the a, b, or x values in an exponential function applying the prinicipal of exponential functions to analyze data in various fields of study
Essential Vocabulary:
exponent, base, power, rational exponent, radicals, coordinate plane, axes, scales, x intercepts, y intercepts, domain, range, end behavior, exponential growth, exponetial decay, percent rate of change, growth or decay facor, arithmetic and geometric sequence, vertical and horizontal translations
IT Standards: IT Strategies:
Unit Title: Exponents Grade: 9th
– 12th
Subject: Math 1
STAGE 2
Understandings:
Students will understand that
data can be represented in an equation, in a table, or illustrated on a graph…
technology should be used as a tool to analyze data …
the significance of the domain and range…
the effect of changing the a, b, or x values in an exponential function…
Essential Questions:
Write the radical using rational exponents.
Classify the model as an exponential decay or exponential growth.
Given the data table, create an exponential model.
Given the graph, create an exponential model.
Find the rate of growth or decay of the model.
What will be the value of the car after 6 years?
What will be the value of the car in 20 years?
Revised Blooms
Creating:
Can the student
create new product or point of view?
assemble, construct,
create, design, develop,
formulate & write.
Evaluating:
Can the student
justify a stand
or decision?
appraise, argue, defend,
judge, select, support,
value & evaluate
Analyzing:
Can the student distinguish between
the different parts?
appraise, compare, contrast, criticize,
differentiate, discriminate,
distinguish, examine, experiment,
question & test.
Applying:
Can the student
use the information in a new way?
choose, demonstrate,
dramatize, employ, illustrate, interpret,
operate, schedule,
sketch, solve, use & write.
Understanding:
Can the student explain ideas or
concepts?
classify, describe, discuss, explain,
identify, locate,
recognize, report,
select, translate
& paraphrase
Remembering:
Can the student recall or remember
the information?
define, duplicate, list,
memorize, recall, repeat,
reproduce & state
Formative Assessments
(Evidences)
Warm-Ups
Entrance Tickets
Class Discussions
Journals
Teachers Observations
Fist to Five
Exit Tickets
Summative Assessment
Quizzes
Tests
Performance Task
STAGE 3
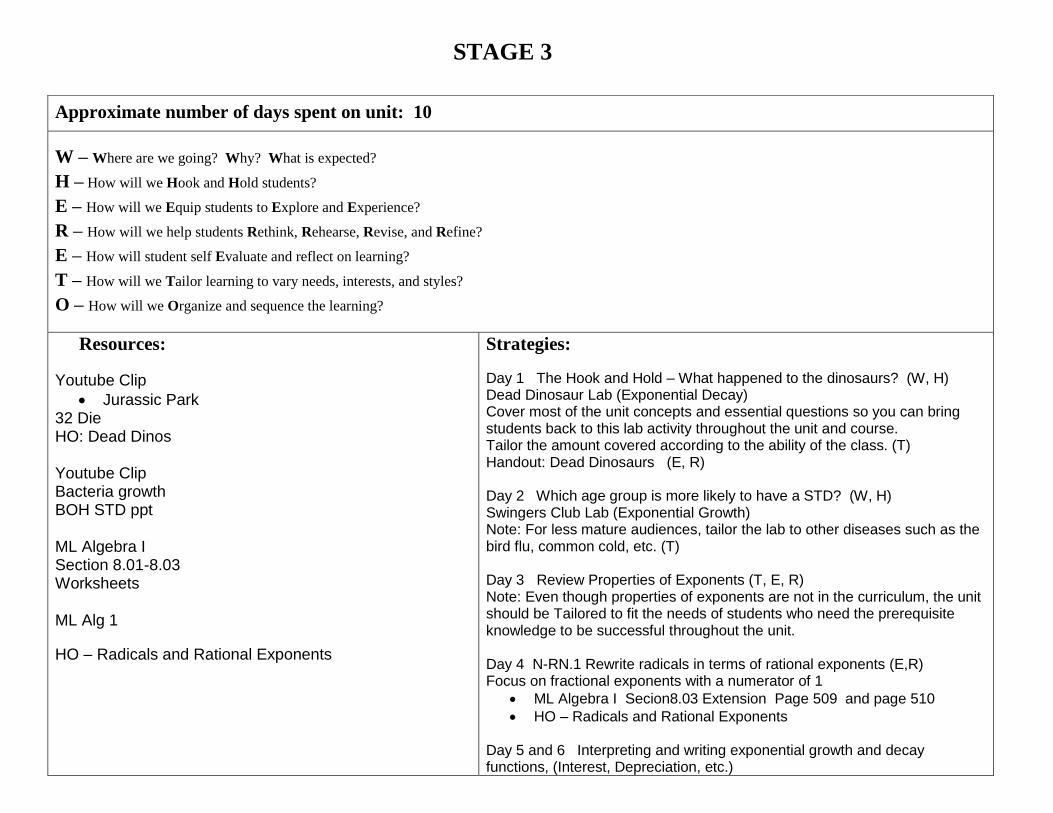
Approximate number of days spent on unit: 10
W – Where are we going? Why? What is expected?
H – How will we Hook and Hold students?
E – How will we Equip students to Explore and Experience?
R – How will we help students Rethink, Rehearse, Revise, and Refine?
E – How will student self Evaluate and reflect on learning?
T – How will we Tailor learning to vary needs, interests, and styles?
O – How will we Organize and sequence the learning?
Resources:
Youtube Clip
Jurassic Park 32 Die HO: Dead Dinos Youtube Clip Bacteria growth BOH STD ppt ML Algebra I Section 8.01-8.03 Worksheets ML Alg 1
HO – Radicals and Rational Exponents
Strategies:
Day 1 The Hook and Hold – What happened to the dinosaurs? (W, H) Dead Dinosaur Lab (Exponential Decay) Cover most of the unit concepts and essential questions so you can bring students back to this lab activity throughout the unit and course. Tailor the amount covered according to the ability of the class. (T) Handout: Dead Dinosaurs (E, R) Day 2 Which age group is more likely to have a STD? (W, H) Swingers Club Lab (Exponential Growth) Note: For less mature audiences, tailor the lab to other diseases such as the bird flu, common cold, etc. (T) Day 3 Review Properties of Exponents (T, E, R) Note: Even though properties of exponents are not in the curriculum, the unit should be Tailored to fit the needs of students who need the prerequisite knowledge to be successful throughout the unit. Day 4 N-RN.1 Rewrite radicals in terms of rational exponents (E,R) Focus on fractional exponents with a numerator of 1
ML Algebra I Secion8.03 Extension Page 509 and page 510
HO – Radicals and Rational Exponents Day 5 and 6 Interpreting and writing exponential growth and decay functions, (Interest, Depreciation, etc.)
Day 7 and 8 Arithmetic and Geometric using explicit and recursive equations Day 9 and 10 Remediation and Summative Assessment

Alexander County Schools 2012-2013
Unit: Quadratic Functions
Q1 Q2 Q3 Q4
Common Core and/or Essential Standards: A-SSE.1 Interpret expressions that represent a quantity in terms of its context. A-SSE.2 Use the structure of an expression to indentify ways to rewrite it. A-SSE.3a Factor a quadratic expression to reveal the zeros of the function it defines. A-APR.1 Understand that polynomials form a system analogous to the intergers, namely, they are closed under the operations of addition, subtraction, and multiplication; add, subtract, multiply polynomials. A-CED.2 Create equations in two or more variables to represent relationships between quantities; graph equations on coordinate axes with labels and scales. F-IF.4 For a function that models a relationship between two quantities, interpret key features of graphs and tables in terms of the quanitities, and sketch graphs showing key features given a verbal decription of the relationship. F-IF.7a Graph linear and quadratic functions and show intercepts, maxima, and minima. F-IF.8a Use the process of factoring and completeing the square in a quadratic function to show zeros, extreme values, and symmetry of the graph, and interpret these in terms of a context. F-IF.9 Compare properties of two functions each represented in a different way (algebraically, graphically, numerically in tables, or by verbal descriptions). F-BF.1a Determine an explicit expression, a recursive process, or steps for calculations from a context. F-BF.1b Combine standard functions using arimetic operations. F-BF.3 Identify the effect on the graph by replacing f(x) by f(x)+k, kf(x), f(kx), and f(x+k) for specific values of k (both positive and negative); find the value of k given the graphs. Experiment with cases and illustrate an explantion of the effects on the graph using technology. Include recognizing even and odd functions from their graphs and algebraic expressions for them.
Transfer: Students will be able to independently use their learning to…
graph, solve, factor, interpret constants, add, subtract, write quadratic
functions.
Meaning
Understandings: Students will understand that…
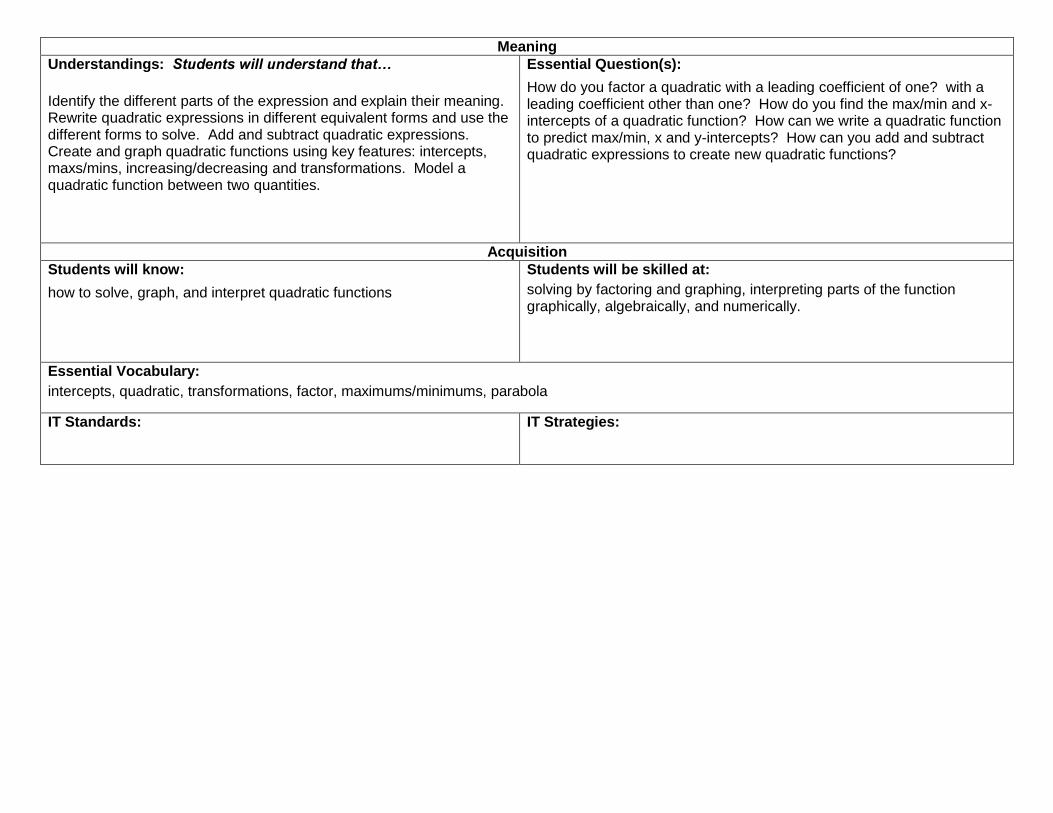
Identify the different parts of the expression and explain their meaning. Rewrite quadratic expressions in different equivalent forms and use the different forms to solve. Add and subtract quadratic expressions. Create and graph quadratic functions using key features: intercepts, maxs/mins, increasing/decreasing and transformations. Model a quadratic function between two quantities.
Essential Question(s):
How do you factor a quadratic with a leading coefficient of one? with a leading coefficient other than one? How do you find the max/min and x-intercepts of a quadratic function? How can we write a quadratic function to predict max/min, x and y-intercepts? How can you add and subtract quadratic expressions to create new quadratic functions?
Acquisition
Students will know:
how to solve, graph, and interpret quadratic functions
Students will be skilled at:
solving by factoring and graphing, interpreting parts of the function graphically, algebraically, and numerically.
Essential Vocabulary:
intercepts, quadratic, transformations, factor, maximums/minimums, parabola
IT Standards: IT Strategies:

Unit Title: Quadratic Functions Grade: 9th
Subject: Math 1
STAGE 2
Understandings:
Identify the different parts of the expression and explain their meaning. Rewrite quadratic expressions in different equivalent forms and use the different forms to solve. Add and subtract quadratic expressions. Create and graph quadratic functions using key features: intercepts, maxs/mins, increasing/decreasing and transformations. Model a quadratic function between two quantities.
Essential Questions:
How do you factor a quadratic with a leading coefficient of one? with a leading coefficient other than one? How do you find the max/min and x-intercepts of a quadratic function? How can we write a quadratic function to predict max/min, x and y-intercepts? How can you add and subtract quadratic expressions to create new quadratic functions?
Revised Blooms
Creating:
Can the student
create new product or point of view?
assemble, construct,
create, design, develop,
formulate & write.
Evaluating:
Can the student
justify a stand
or decision?
appraise, argue, defend,
judge, select, support,
value & evaluate
Analyzing:
Can the student distinguish between
the different parts?
appraise, compare, contrast, criticize,
differentiate, discriminate,
distinguish, examine, experiment,
question & test.
Applying:
Can the student
use the information in a new way?
choose, demonstrate,
dramatize, employ, illustrate, interpret,
operate, schedule,
sketch, solve, use & write.
Understanding:
Can the student explain ideas or
concepts?
classify, describe, discuss, explain,
identify, locate,
recognize, report,
select, translate
& paraphrase
Remembering:
Can the student recall or remember
the information?
define, duplicate, list,
memorize, recall, repeat,
reproduce & state
Formative Assessments
(Evidences)
informal observations bell ringers thumbs think-pair-share teacher-student dialogue quizzes homework/classwork
Summative Assessment
unit test performance task
(M&M catapult)
STAGE 3
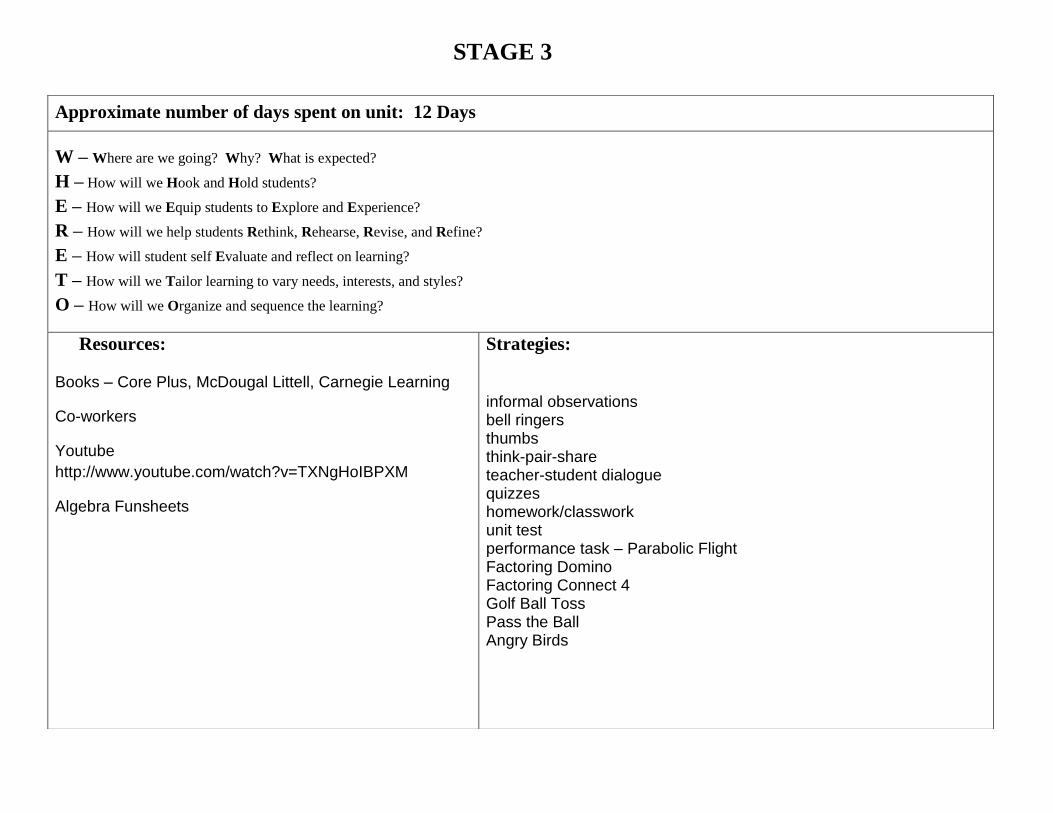
Approximate number of days spent on unit: 12 Days
W – Where are we going? Why? What is expected?
H – How will we Hook and Hold students?
E – How will we Equip students to Explore and Experience?
R – How will we help students Rethink, Rehearse, Revise, and Refine?
E – How will student self Evaluate and reflect on learning?
T – How will we Tailor learning to vary needs, interests, and styles?
O – How will we Organize and sequence the learning?
Resources:
Books – Core Plus, McDougal Littell, Carnegie Learning
Co-workers
Youtube
http://www.youtube.com/watch?v=TXNgHoIBPXM
Algebra Funsheets
Strategies:
informal observations bell ringers thumbs think-pair-share teacher-student dialogue quizzes homework/classwork unit test performance task – Parabolic Flight Factoring Domino Factoring Connect 4 Golf Ball Toss Pass the Ball Angry Birds
Alexander County Schools 2012-2013
Unit:
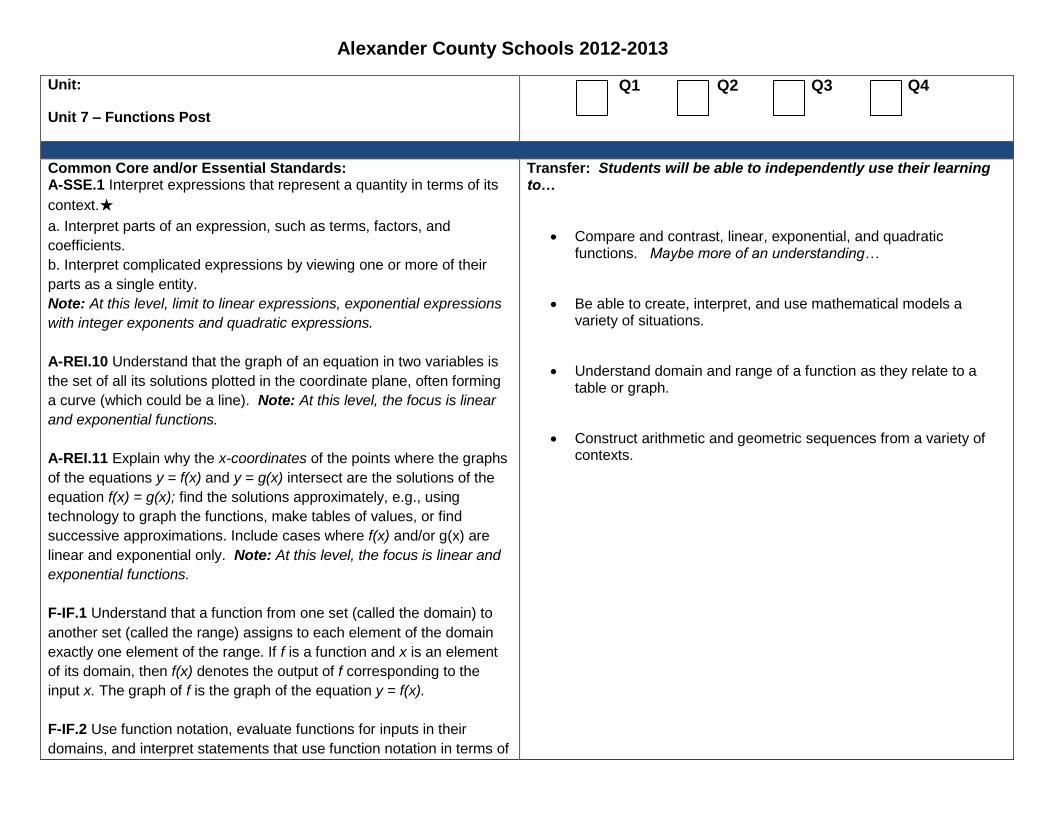
Unit 7 – Functions Post
Q1 Q2 Q3 Q4
Common Core and/or Essential Standards: A-SSE.1 Interpret expressions that represent a quantity in terms of its
context.★
a. Interpret parts of an expression, such as terms, factors, and
coefficients.
b. Interpret complicated expressions by viewing one or more of their
parts as a single entity.
Note: At this level, limit to linear expressions, exponential expressions
with integer exponents and quadratic expressions.
A-REI.10 Understand that the graph of an equation in two variables is
the set of all its solutions plotted in the coordinate plane, often forming
a curve (which could be a line). Note: At this level, the focus is linear
and exponential functions.
A-REI.11 Explain why the x-coordinates of the points where the graphs
of the equations y = f(x) and y = g(x) intersect are the solutions of the
equation f(x) = g(x); find the solutions approximately, e.g., using
technology to graph the functions, make tables of values, or find
successive approximations. Include cases where f(x) and/or g(x) are
linear and exponential only. Note: At this level, the focus is linear and
exponential functions.
F-IF.1 Understand that a function from one set (called the domain) to
another set (called the range) assigns to each element of the domain
exactly one element of the range. If f is a function and x is an element
of its domain, then f(x) denotes the output of f corresponding to the
input x. The graph of f is the graph of the equation y = f(x).
F-IF.2 Use function notation, evaluate functions for inputs in their
domains, and interpret statements that use function notation in terms of
Transfer: Students will be able to independently use their learning to…
Compare and contrast, linear, exponential, and quadratic functions. Maybe more of an understanding…
Be able to create, interpret, and use mathematical models a variety of situations.
Understand domain and range of a function as they relate to a table or graph.
Construct arithmetic and geometric sequences from a variety of contexts.
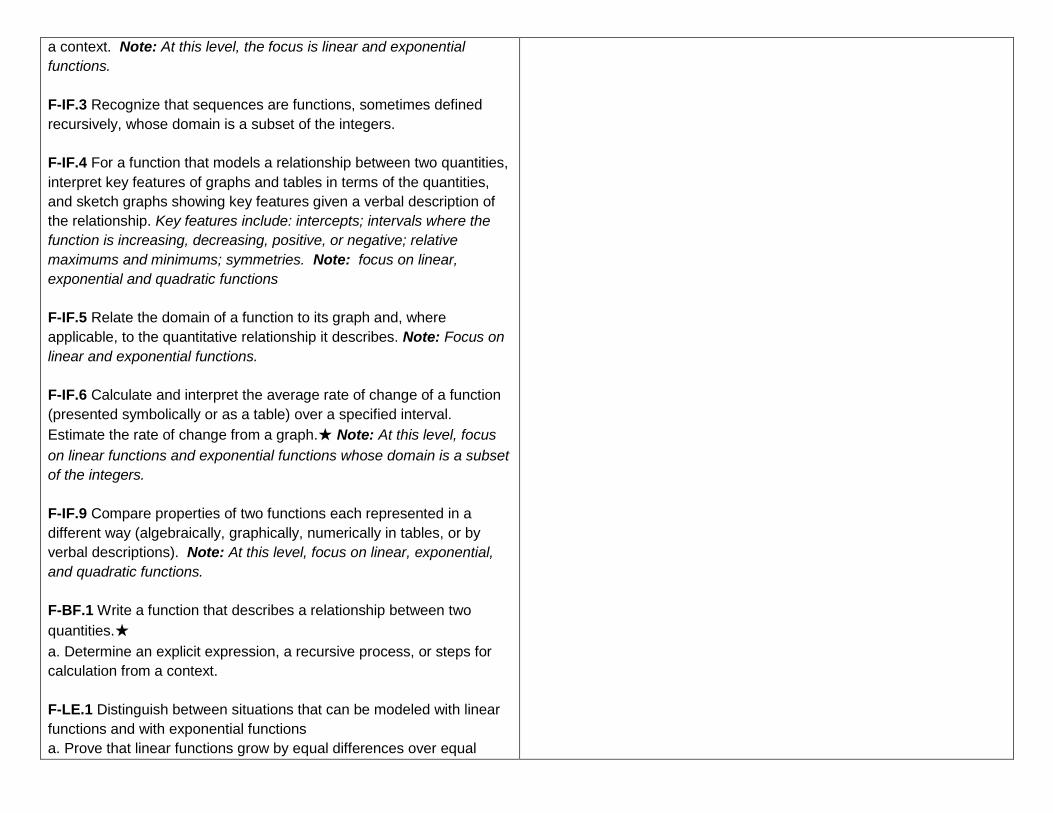
a context. Note: At this level, the focus is linear and exponential
functions.
F-IF.3 Recognize that sequences are functions, sometimes defined
recursively, whose domain is a subset of the integers.
F-IF.4 For a function that models a relationship between two quantities,
interpret key features of graphs and tables in terms of the quantities,
and sketch graphs showing key features given a verbal description of
the relationship. Key features include: intercepts; intervals where the
function is increasing, decreasing, positive, or negative; relative
maximums and minimums; symmetries. Note: focus on linear,
exponential and quadratic functions
F-IF.5 Relate the domain of a function to its graph and, where
applicable, to the quantitative relationship it describes. Note: Focus on
linear and exponential functions.
F-IF.6 Calculate and interpret the average rate of change of a function
(presented symbolically or as a table) over a specified interval.
Estimate the rate of change from a graph.★ Note: At this level, focus
on linear functions and exponential functions whose domain is a subset
of the integers.
F-IF.9 Compare properties of two functions each represented in a
different way (algebraically, graphically, numerically in tables, or by
verbal descriptions). Note: At this level, focus on linear, exponential,
and quadratic functions.
F-BF.1 Write a function that describes a relationship between two
quantities.★
a. Determine an explicit expression, a recursive process, or steps for
calculation from a context.
F-LE.1 Distinguish between situations that can be modeled with linear
functions and with exponential functions
a. Prove that linear functions grow by equal differences over equal
intervals, and that exponential functions grow by equal factors over
equal intervals.
b. Recognize situations in which one quantity changes at a constant
rate per unit interval relative to another.
c. Recognize situations in which a quantity grows or decays by a
constant percent rate per unit interval relative to another.
F-LE.2 Construct linear and exponential functions, including arithmetic
and geometric sequences, given a graph, a description of a
relationship, or two input-output pairs (include reading these from a
table).
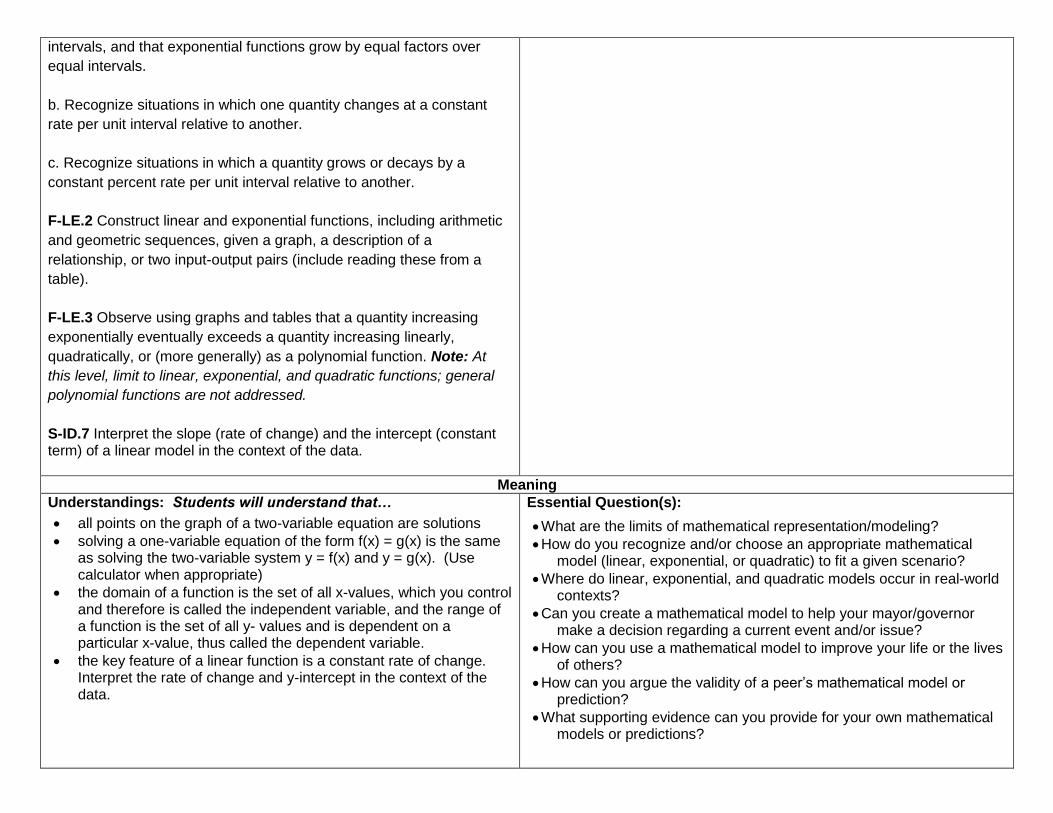
F-LE.3 Observe using graphs and tables that a quantity increasing
exponentially eventually exceeds a quantity increasing linearly,
quadratically, or (more generally) as a polynomial function. Note: At
this level, limit to linear, exponential, and quadratic functions; general
polynomial functions are not addressed.
S-ID.7 Interpret the slope (rate of change) and the intercept (constant term) of a linear model in the context of the data.
Meaning
Understandings: Students will understand that…
all points on the graph of a two-variable equation are solutions
solving a one-variable equation of the form f(x) = g(x) is the same as solving the two-variable system y = f(x) and y = g(x). (Use calculator when appropriate)
the domain of a function is the set of all x-values, which you control and therefore is called the independent variable, and the range of a function is the set of all y- values and is dependent on a particular x-value, thus called the dependent variable.
the key feature of a linear function is a constant rate of change. Interpret the rate of change and y-intercept in the context of the data.
Essential Question(s):
What are the limits of mathematical representation/modeling?
How do you recognize and/or choose an appropriate mathematical model (linear, exponential, or quadratic) to fit a given scenario?
Where do linear, exponential, and quadratic models occur in real-world contexts?
Can you create a mathematical model to help your mayor/governor make a decision regarding a current event and/or issue?
How can you use a mathematical model to improve your life or the lives of others?
How can you argue the validity of a peer’s mathematical model or prediction?
What supporting evidence can you provide for your own mathematical models or predictions?

Acquisition
Students will know:
…how to solve by making tables for each side of the equation. Use the results from substituting previous values of x to decide whether to try a larger or smaller value of x to find where the two sides are equal.
…a sequence can be thought of as a function, with the input numbers consisting of the integers, and the output numbers being the terms of the sequence. (NOW-NEXT functions)
…when given a table or graph of a function that models a real-life situation, how to explain the meaning of the characteristics of the graph in the context of the problem. The characteristics described should include rate of change, intercepts, maximums/minimums, symmetries, and intervals of increase and/or decrease.
…how to identify the domain of a function from its graph. In context, students will identify the domain, stating any restrictions and why they are restrictions.
…how to interpret what the average rate of change means in terms of the context it is in.
…how to recognize when a relationship exists between two quantities and write a function to describe them. Use steps, the recursive process, to make the calculations from context in order to write the explicit expression that represents the relationship.
…when comparing graphs of various functions, such as linear, exponential, and quadratic, that any values that increase exponentially eventually increases or grows at a faster rate than values that increase linearly, and quadratically.
Students will be skilled at:
…manipulating the terms, factors, and coefficients in difficult expressions to explain the meaning of the individual parts of the expression. Use them to make sense of the multiple factors and terms of the expression.
…grouping together parts of an expression to reveal underlying structure.
...solving graphically, finding approximate solutions using technology.
…using function notation, evaluate functions and explain values based on their context.
…sketching a graph of the relationship, showing key features, when given a verbal description of the relationship between two quantities
…finding the average rate of change of a function if given a table, an equation, or a graph.
…using graphs, a verbal description, two-points (in the linear case), and reading from a table of values to write the linear or exponential function that each of these representations describes. Also include arithmetic and geometric sequences,
…comparing the properties of two functions represented by verbal descriptions, tables, graphs, and equations.
…deciding whether a situation can be represented using a linear model or an exponential model. (NOW-NEXT equations)
Essential Vocabulary:
Mathematical model, regression, function notation, linear function, exponential function, quadratic function, independent variable, domain, restrictions, dependent variable, range, ordered pair, initial value, y-intercept, prediction(s), solution(s), x-intercept(s), data, scatter plot, trend line, exponential trend, quadratic trend, maximum and minimum values, rate of change, increasing/decreasing patterns, sequence, symmetry, terms, factors, coefficients,
IT Standards: IT Strategies:
Unit Title: Functions Post Grade: Subject: Math 1
STAGE 2
Understandings:
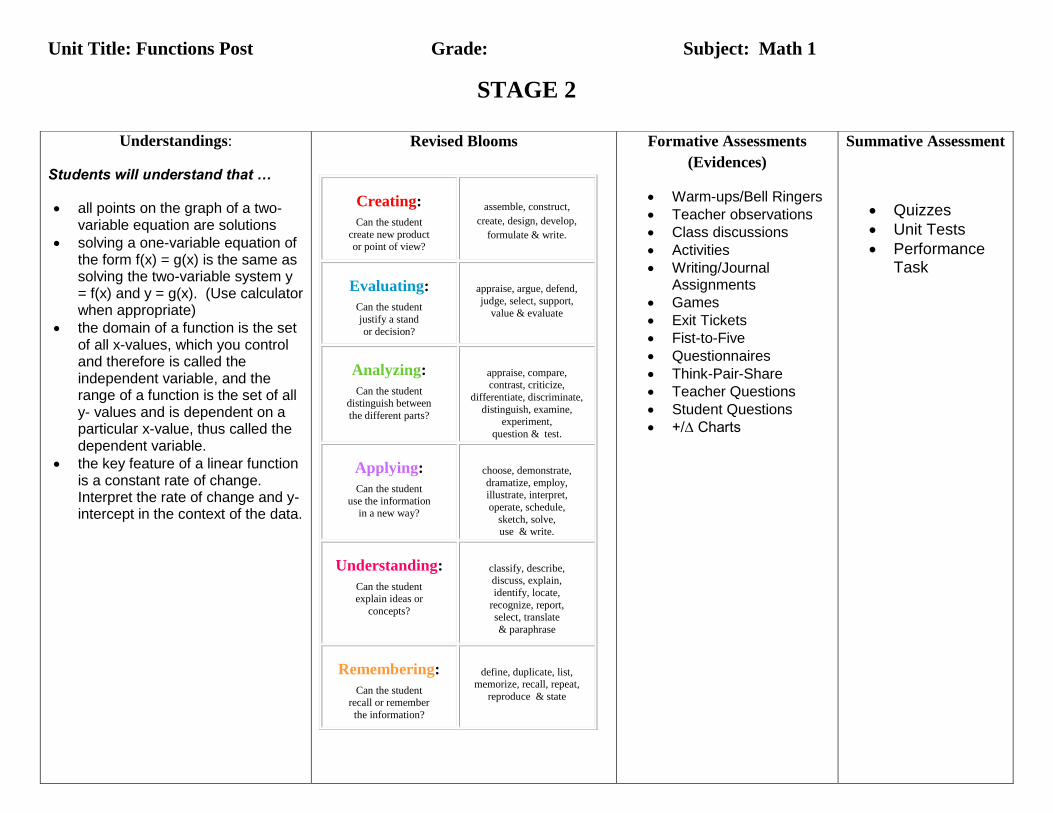
Students will understand that …
all points on the graph of a two-variable equation are solutions
solving a one-variable equation of the form f(x) = g(x) is the same as solving the two-variable system y = f(x) and y = g(x). (Use calculator when appropriate)
the domain of a function is the set of all x-values, which you control and therefore is called the independent variable, and the range of a function is the set of all y- values and is dependent on a particular x-value, thus called the dependent variable.
the key feature of a linear function is a constant rate of change. Interpret the rate of change and y-intercept in the context of the data.
Revised Blooms
Creating:
Can the student
create new product or point of view?
assemble, construct,
create, design, develop,
formulate & write.
Evaluating:
Can the student
justify a stand
or decision?
appraise, argue, defend,
judge, select, support,
value & evaluate
Analyzing:
Can the student distinguish between
the different parts?
appraise, compare, contrast, criticize,
differentiate, discriminate,
distinguish, examine, experiment,
question & test.
Applying:
Can the student
use the information in a new way?
choose, demonstrate,
dramatize, employ, illustrate, interpret,
operate, schedule,
sketch, solve, use & write.
Understanding:
Can the student explain ideas or
concepts?
classify, describe, discuss, explain,
identify, locate,
recognize, report,
select, translate
& paraphrase
Remembering:
Can the student recall or remember
the information?
define, duplicate, list,
memorize, recall, repeat,
reproduce & state
Formative Assessments
(Evidences)
Warm-ups/Bell Ringers
Teacher observations
Class discussions
Activities
Writing/Journal Assignments
Games
Exit Tickets
Fist-to-Five
Questionnaires
Think-Pair-Share
Teacher Questions
Student Questions
+/∆ Charts
Summative Assessment
Quizzes
Unit Tests
Performance Task

Essential Questions:
What are the limits of mathematical representation/ modeling?
How do you recognize and/or choose an appropriate mathematical model (linear, exponential, or quadratic) to fit a given scenario?
Where do linear, exponential, and quadratic models occur in real-world contexts?
Can you create a mathematical model to help your mayor/governor make a decision regarding a current event and/or issue?
How can you use a mathematical model to improve your life or the lives of others?
How can you argue the validity of a peer’s mathematical model or prediction?
What supporting evidence can you provide for your own mathematical models or predictions?
STAGE 3
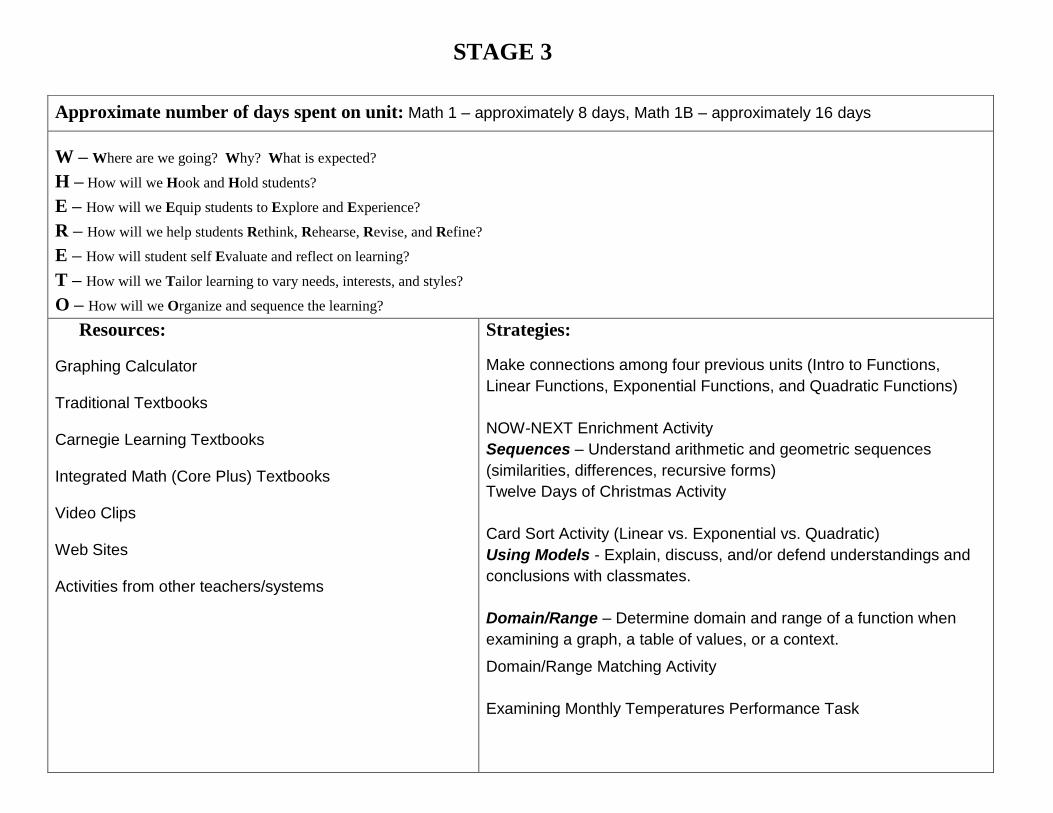
Approximate number of days spent on unit: Math 1 – approximately 8 days, Math 1B – approximately 16 days
W – Where are we going? Why? What is expected?
H – How will we Hook and Hold students?
E – How will we Equip students to Explore and Experience?
R – How will we help students Rethink, Rehearse, Revise, and Refine?
E – How will student self Evaluate and reflect on learning?
T – How will we Tailor learning to vary needs, interests, and styles?
O – How will we Organize and sequence the learning?
Resources:
Graphing Calculator Traditional Textbooks Carnegie Learning Textbooks Integrated Math (Core Plus) Textbooks Video Clips Web Sites Activities from other teachers/systems
Strategies:
Make connections among four previous units (Intro to Functions,
Linear Functions, Exponential Functions, and Quadratic Functions)
NOW-NEXT Enrichment Activity
Sequences – Understand arithmetic and geometric sequences
(similarities, differences, recursive forms)
Twelve Days of Christmas Activity
Card Sort Activity (Linear vs. Exponential vs. Quadratic)
Using Models - Explain, discuss, and/or defend understandings and
conclusions with classmates.
Domain/Range – Determine domain and range of a function when
examining a graph, a table of values, or a context.
Domain/Range Matching Activity
Examining Monthly Temperatures Performance Task
Alexander County Schools 2012-2013
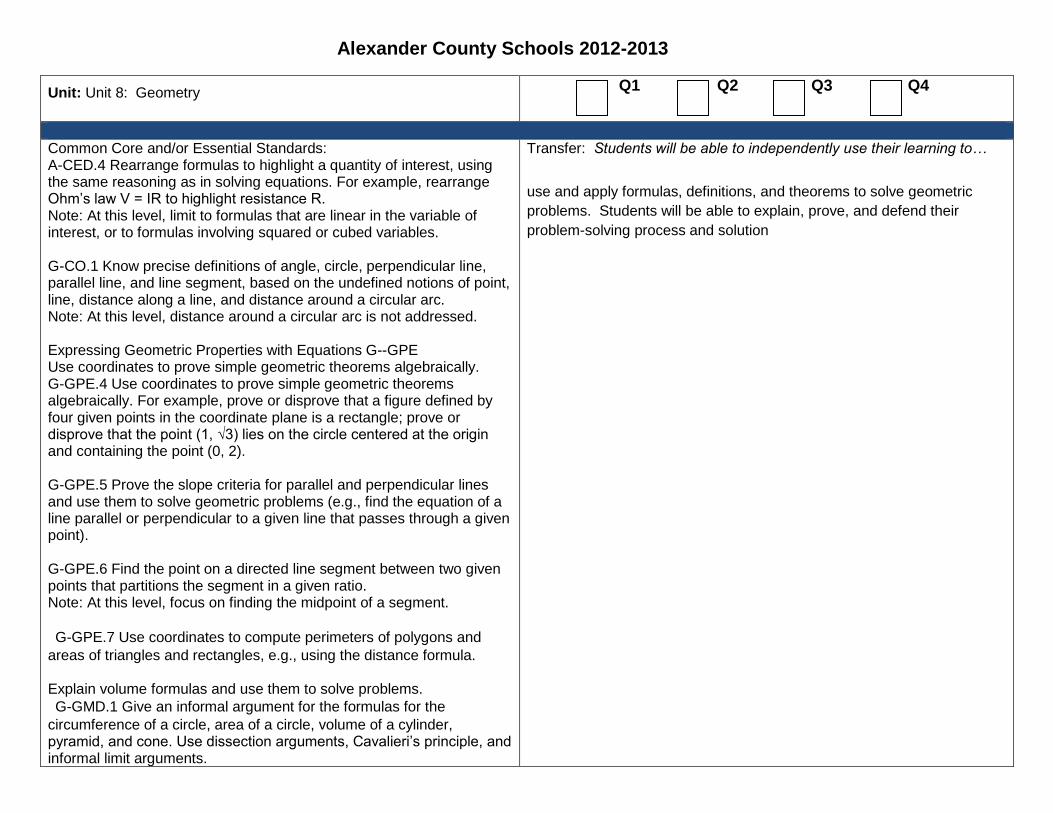
Unit: Unit 8: Geometry
Q1 Q2 Q3 Q4
Common Core and/or Essential Standards: A-CED.4 Rearrange formulas to highlight a quantity of interest, using the same reasoning as in solving equations. For example, rearrange Ohm’s law V = IR to highlight resistance R. Note: At this level, limit to formulas that are linear in the variable of interest, or to formulas involving squared or cubed variables. G-CO.1 Know precise definitions of angle, circle, perpendicular line, parallel line, and line segment, based on the undefined notions of point, line, distance along a line, and distance around a circular arc. Note: At this level, distance around a circular arc is not addressed. Expressing Geometric Properties with Equations G-GPE Use coordinates to prove simple geometric theorems algebraically. G-GPE.4 Use coordinates to prove simple geometric theorems algebraically. For example, prove or disprove that a figure defined by four given points in the coordinate plane is a rectangle; prove or disprove that the point (1, √3) lies on the circle centered at the origin and containing the point (0, 2). G-GPE.5 Prove the slope criteria for parallel and perpendicular lines and use them to solve geometric problems (e.g., find the equation of a line parallel or perpendicular to a given line that passes through a given point). G-GPE.6 Find the point on a directed line segment between two given points that partitions the segment in a given ratio. Note: At this level, focus on finding the midpoint of a segment.
G-GPE.7 Use coordinates to compute perimeters of polygons and
areas of triangles and rectangles, e.g., using the distance formula. Explain volume formulas and use them to solve problems.
G-GMD.1 Give an informal argument for the formulas for the
circumference of a circle, area of a circle, volume of a cylinder, pyramid, and cone. Use dissection arguments, Cavalieri’s principle, and informal limit arguments.
Transfer: Students will be able to independently use their learning to…
use and apply formulas, definitions, and theorems to solve geometric
problems. Students will be able to explain, prove, and defend their
problem-solving process and solution
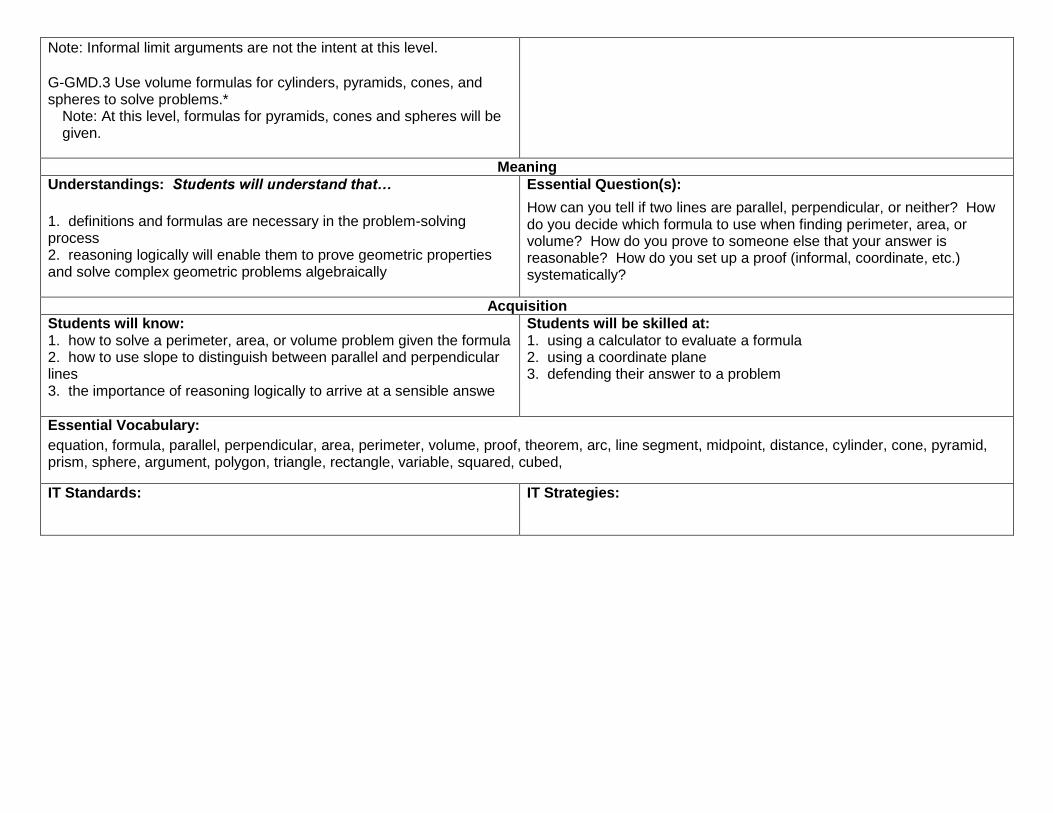
Note: Informal limit arguments are not the intent at this level. G-GMD.3 Use volume formulas for cylinders, pyramids, cones, and spheres to solve problems.*
Note: At this level, formulas for pyramids, cones and spheres will be given.
Meaning
Understandings: Students will understand that…
1. definitions and formulas are necessary in the problem-solving process 2. reasoning logically will enable them to prove geometric properties and solve complex geometric problems algebraically
Essential Question(s):
How can you tell if two lines are parallel, perpendicular, or neither? How do you decide which formula to use when finding perimeter, area, or volume? How do you prove to someone else that your answer is reasonable? How do you set up a proof (informal, coordinate, etc.) systematically?
Acquisition
Students will know: 1. how to solve a perimeter, area, or volume problem given the formula 2. how to use slope to distinguish between parallel and perpendicular lines 3. the importance of reasoning logically to arrive at a sensible answe
Students will be skilled at: 1. using a calculator to evaluate a formula 2. using a coordinate plane 3. defending their answer to a problem
Essential Vocabulary:
equation, formula, parallel, perpendicular, area, perimeter, volume, proof, theorem, arc, line segment, midpoint, distance, cylinder, cone, pyramid, prism, sphere, argument, polygon, triangle, rectangle, variable, squared, cubed,
IT Standards: IT Strategies:
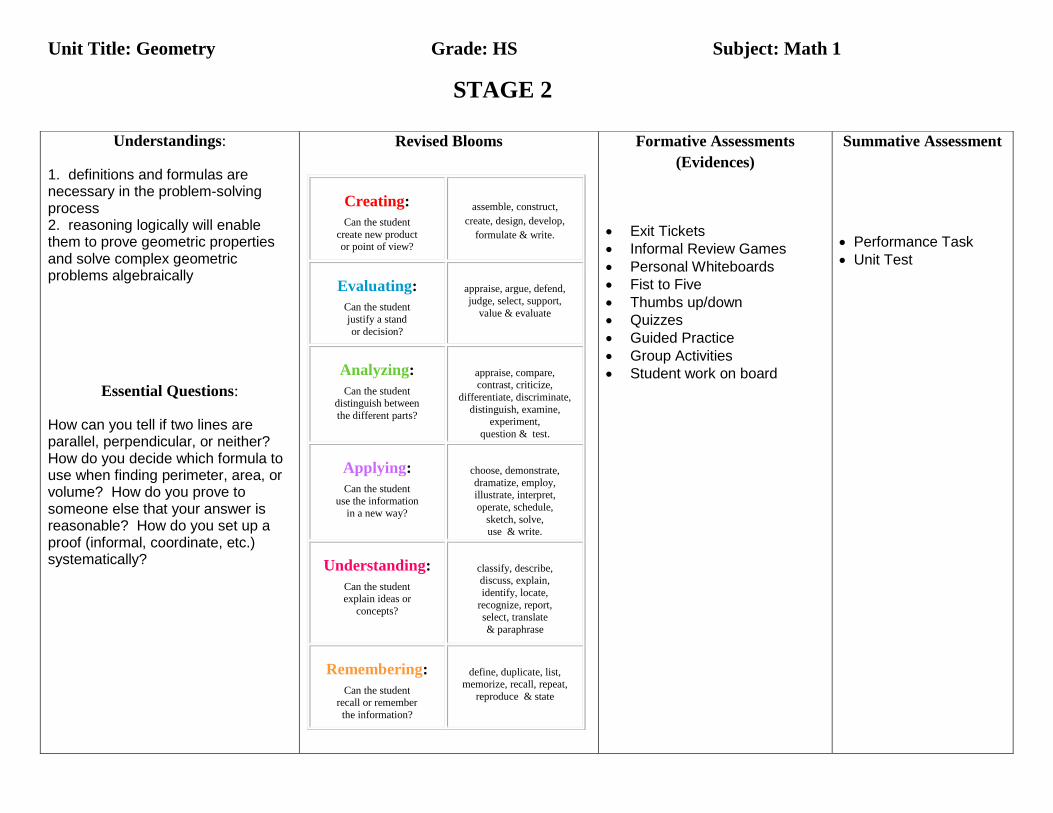
Unit Title: Geometry Grade: HS Subject: Math 1
STAGE 2
Understandings:
1. definitions and formulas are necessary in the problem-solving process 2. reasoning logically will enable them to prove geometric properties and solve complex geometric problems algebraically
Essential Questions:
How can you tell if two lines are parallel, perpendicular, or neither? How do you decide which formula to use when finding perimeter, area, or volume? How do you prove to someone else that your answer is reasonable? How do you set up a proof (informal, coordinate, etc.) systematically?
Revised Blooms
Creating:
Can the student
create new product or point of view?
assemble, construct,
create, design, develop,
formulate & write.
Evaluating:
Can the student
justify a stand
or decision?
appraise, argue, defend,
judge, select, support,
value & evaluate
Analyzing:
Can the student distinguish between
the different parts?
appraise, compare, contrast, criticize,
differentiate, discriminate,
distinguish, examine, experiment,
question & test.
Applying:
Can the student
use the information in a new way?
choose, demonstrate,
dramatize, employ, illustrate, interpret,
operate, schedule,
sketch, solve, use & write.
Understanding:
Can the student explain ideas or
concepts?
classify, describe, discuss, explain,
identify, locate,
recognize, report,
select, translate
& paraphrase
Remembering:
Can the student recall or remember
the information?
define, duplicate, list,
memorize, recall, repeat,
reproduce & state
Formative Assessments
(Evidences)
Exit Tickets
Informal Review Games
Personal Whiteboards
Fist to Five
Thumbs up/down
Quizzes
Guided Practice
Group Activities
Student work on board
Summative Assessment
Performance Task
Unit Test

STAGE 3
Approximate number of days spent on unit:
W – Where are we going? Why? What is expected?
H – How will we Hook and Hold students?
E – How will we Equip students to Explore and Experience?
R – How will we help students Rethink, Rehearse, Revise, and Refine?
E – How will student self Evaluate and reflect on learning?
T – How will we Tailor learning to vary needs, interests, and styles?
O – How will we Organize and sequence the learning?
Resources:
Midpoint / Distance Formula Discovery
Community Park Activity
Cabri Investigation ~ Parallel & Perpendicular
Swimming Pool Activity
Circles Investigation w/ Origami Paper (wedges)
Dog Problem (addition to swimming pool)
Discovery of Pi ~ Circumference of a circle (measuring objects with string, writing ratio of circumference to diameter)
Discovery of Volume Formulas (prism & cylinder) / Cavalieri’s Principle (CD’s)
Discovery of Volume Formulas (cone & pyramid) with rice
Volume of a Sphere (Balls)
Performance Task ~ Tin Man Project
Unit Test
Strategies:
Skill Warm-Ups
Group Investigations
Reflection / Journal
Exit Tickets
Class Discussion
Short Video Clips
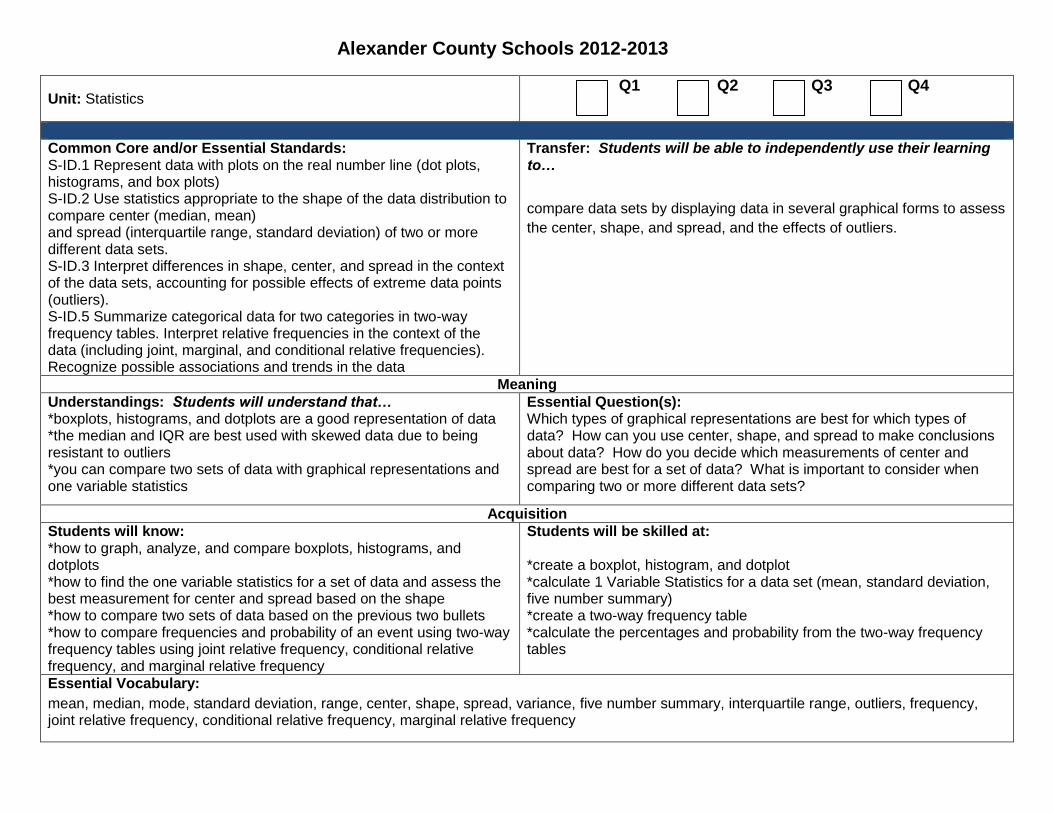
Alexander County Schools 2012-2013
Unit: Statistics Q1 Q2 Q3 Q4
Common Core and/or Essential Standards: S-ID.1 Represent data with plots on the real number line (dot plots, histograms, and box plots) S-ID.2 Use statistics appropriate to the shape of the data distribution to compare center (median, mean) and spread (interquartile range, standard deviation) of two or more different data sets. S-ID.3 Interpret differences in shape, center, and spread in the context of the data sets, accounting for possible effects of extreme data points (outliers). S-ID.5 Summarize categorical data for two categories in two-way frequency tables. Interpret relative frequencies in the context of the data (including joint, marginal, and conditional relative frequencies). Recognize possible associations and trends in the data
Transfer: Students will be able to independently use their learning to…
compare data sets by displaying data in several graphical forms to assess
the center, shape, and spread, and the effects of outliers.
Meaning
Understandings: Students will understand that… *boxplots, histograms, and dotplots are a good representation of data *the median and IQR are best used with skewed data due to being resistant to outliers *you can compare two sets of data with graphical representations and one variable statistics
Essential Question(s): Which types of graphical representations are best for which types of data? How can you use center, shape, and spread to make conclusions about data? How do you decide which measurements of center and spread are best for a set of data? What is important to consider when comparing two or more different data sets?
Acquisition
Students will know: *how to graph, analyze, and compare boxplots, histograms, and dotplots *how to find the one variable statistics for a set of data and assess the best measurement for center and spread based on the shape *how to compare two sets of data based on the previous two bullets *how to compare frequencies and probability of an event using two-way frequency tables using joint relative frequency, conditional relative frequency, and marginal relative frequency
Students will be skilled at: *create a boxplot, histogram, and dotplot *calculate 1 Variable Statistics for a data set (mean, standard deviation, five number summary) *create a two-way frequency table *calculate the percentages and probability from the two-way frequency tables
Essential Vocabulary:
mean, median, mode, standard deviation, range, center, shape, spread, variance, five number summary, interquartile range, outliers, frequency, joint relative frequency, conditional relative frequency, marginal relative frequency

IT Standards: IT Strategies:
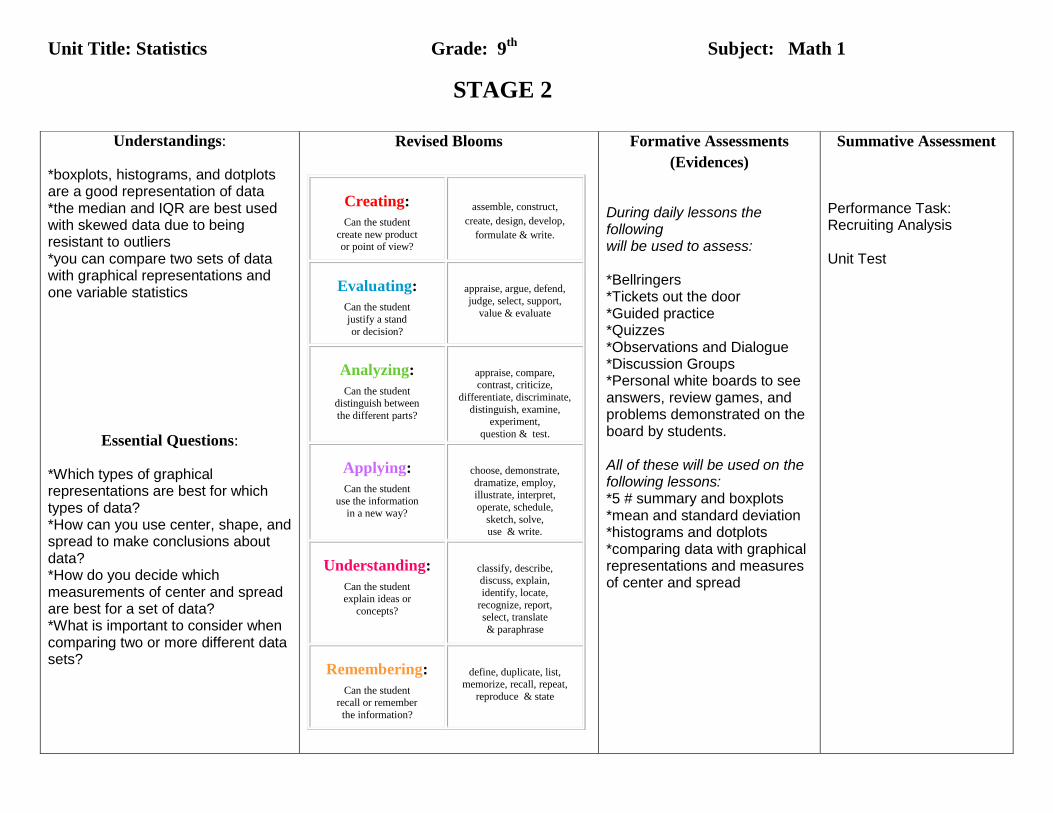
Unit Title: Statistics Grade: 9th
Subject: Math 1
STAGE 2
Understandings:
*boxplots, histograms, and dotplots are a good representation of data *the median and IQR are best used with skewed data due to being resistant to outliers *you can compare two sets of data with graphical representations and one variable statistics
Essential Questions:
*Which types of graphical representations are best for which types of data? *How can you use center, shape, and spread to make conclusions about data? *How do you decide which measurements of center and spread are best for a set of data? *What is important to consider when comparing two or more different data sets?
Revised Blooms
Creating:
Can the student
create new product or point of view?
assemble, construct,
create, design, develop,
formulate & write.
Evaluating:
Can the student
justify a stand
or decision?
appraise, argue, defend,
judge, select, support,
value & evaluate
Analyzing:
Can the student distinguish between
the different parts?
appraise, compare, contrast, criticize,
differentiate, discriminate,
distinguish, examine, experiment,
question & test.
Applying:
Can the student
use the information in a new way?
choose, demonstrate,
dramatize, employ, illustrate, interpret,
operate, schedule,
sketch, solve, use & write.
Understanding:
Can the student explain ideas or
concepts?
classify, describe, discuss, explain,
identify, locate,
recognize, report,
select, translate
& paraphrase
Remembering:
Can the student recall or remember
the information?
define, duplicate, list,
memorize, recall, repeat,
reproduce & state
Formative Assessments
(Evidences)
During daily lessons the following will be used to assess: *Bellringers *Tickets out the door *Guided practice *Quizzes *Observations and Dialogue *Discussion Groups *Personal white boards to see answers, review games, and problems demonstrated on the board by students. All of these will be used on the following lessons: *5 # summary and boxplots *mean and standard deviation *histograms and dotplots *comparing data with graphical representations and measures of center and spread
Summative Assessment
Performance Task: Recruiting Analysis Unit Test

STAGE 3
Approximate number of days spent on unit: 7
W – Where are we going? Why? What is expected?
H – How will we Hook and Hold students?
E – How will we Equip students to Explore and Experience?
R – How will we help students Rethink, Rehearse, Revise, and Refine?
E – How will student self Evaluate and reflect on learning?
T – How will we Tailor learning to vary needs, interests, and styles?
O – How will we Organize and sequence the learning?
Resources:
Tax activity: USA Today
Recruiting Analysis: School of Science and Math
Birthday Activity
Math books, worksheets, internet sites
Strategies:
1. Begin with an entry question (Why do the “richest” cities have the most
homeless on the streets?) to hook students into considering types of center
and spread. H
2. Introduce the Essential Questions and discuss the culminating unit
performance task (Recruiting Analysis). Show students a slideshow of the
same data shown with different graphs to discuss which ones show the data
“best”. W
3. Note: Key vocabulary terms are introduced as needed by the various
learning activities and performance tasks. Students read and discuss
relevant selections from the textbook and supplementary materials to support
the learning activities and tasks. E
4. Review median and mean(discuss each on the data sets in the slideshow)
and then present concept attainment lesson on range, standard deviation,
and variance. Have students practice with data sets. E
5. Give quiz on mean, median, range, standard deviation, and variation. E
6. Present concept attainment lesson on boxplots and histograms. Have
students complete birthdays activity to create human boxplot. Practice
boxplots independently on multiple sets of data. E
7. Present concept attainment lesson on Normal Curves. In groups, do
activity based on assessing if Taxes are Normal. E
8. Review and discuss everything taught in unit so far.
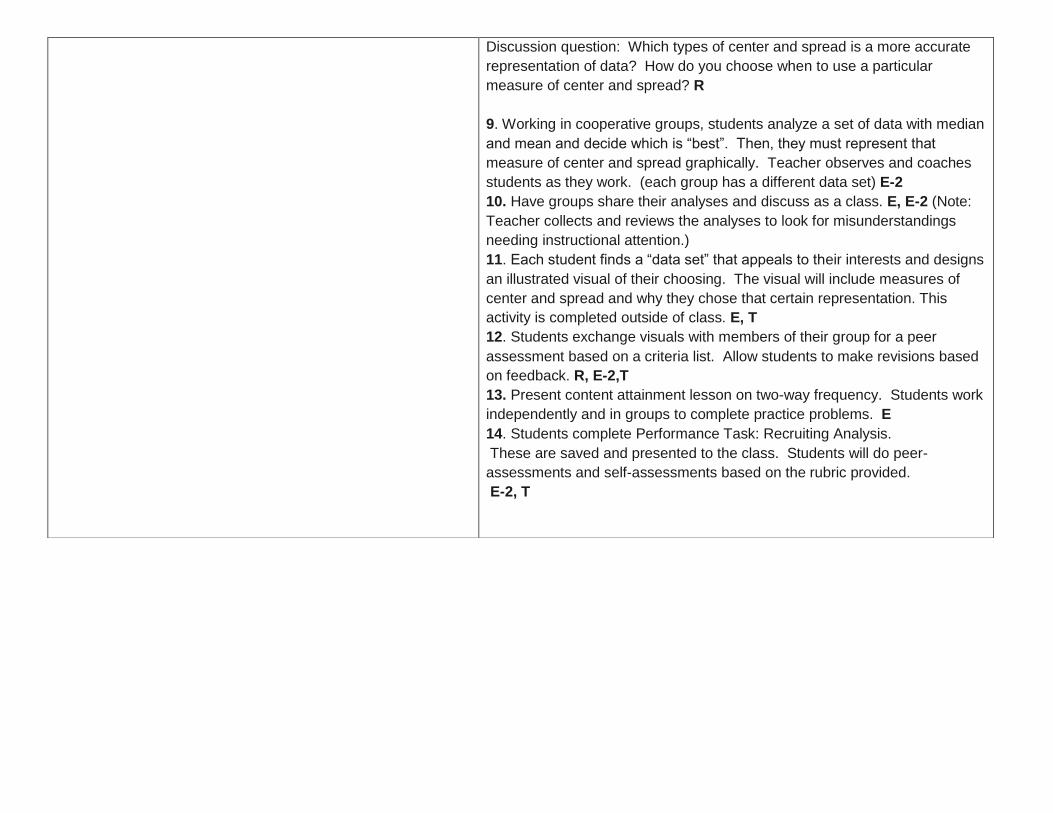
Discussion question: Which types of center and spread is a more accurate
representation of data? How do you choose when to use a particular
measure of center and spread? R
9. Working in cooperative groups, students analyze a set of data with median
and mean and decide which is “best”. Then, they must represent that
measure of center and spread graphically. Teacher observes and coaches
students as they work. (each group has a different data set) E-2
10. Have groups share their analyses and discuss as a class. E, E-2 (Note:
Teacher collects and reviews the analyses to look for misunderstandings
needing instructional attention.)
11. Each student finds a “data set” that appeals to their interests and designs
an illustrated visual of their choosing. The visual will include measures of
center and spread and why they chose that certain representation. This
activity is completed outside of class. E, T
12. Students exchange visuals with members of their group for a peer
assessment based on a criteria list. Allow students to make revisions based
on feedback. R, E-2,T
13. Present content attainment lesson on two-way frequency. Students work
independently and in groups to complete practice problems. E
14. Students complete Performance Task: Recruiting Analysis.
These are saved and presented to the class. Students will do peer-
assessments and self-assessments based on the rubric provided.
E-2, T