Age, seniority and labour costs: lessons from the Finnish IT revolution
58
Economic Policy January 2007 Printed in Great Britain © CEPR, CES, MSH, 2007. SUMMARY The bad labour market performance of the workforce over 50 indicates that an aged workforce is often a burden for firms. Our paper seeks to investigate whether and why this is the case by providing evidence on the relation between age, seniority and experience, on the one hand, and the main components of labour costs, namely productivity and wages, on the other, for a sample of plants in three manufacturing industries (‘forest’, ‘industrial machinery’ and ‘electronics’) in Finland during the IT revolution in the 1990s. In ‘average’ industries – those not under- going major technological shocks – productivity and wages keep rising almost indefinitely with the accumulation of either seniority (in the forest industry) or experience (in the industry producing industrial machinery). In these industries, the skill depreciation often associated with higher seniority beyond a certain threshold does not seemingly raise labour costs. In elec- tronics, instead, the seniority-productivity profile shows a positive relation first and then becomes negative as one looks at plants with higher average seniority. This body of evidence is con- sistent with the idea that fast technical change brings about accelerated skill depreciation of senior workers. We cannot rule out, however, that our correlations are also simultaneously produced by worker movements across plants. The seniority-earnings profile in electronics is instead rather similar to that observed for the other industries – a likely symptom of the prevailing Finnish wage bargaining institutions which tend to make seniority one essential element of wage determination. In the end, seniority matters for labour costs, not age as such. But only in high-tech industries, not in the economy at large. This is well tuned with previous research on gross flows of workers and jobs in the US and other OECD countries which unveiled the productivity-driving role of resource reallocation (or lack thereof ) between plants. To improve the employability of the elderly at times of fast technical change, public policy should thus divert resources away from preserving existing jobs and lend more attention to the retraining of old workers to ease their reallocation away from less productive plants (or plants where they have become less productive) into new jobs . — Francesco Daveri and Mika Maliranta Age, seniority and labour costs
Transcript of Age, seniority and labour costs: lessons from the Finnish IT revolution

Economic Policy January 2007 Printed in Great Britaincopy CEPR CES MSH 2007
Blackwell Publishing LtdOxford UKECOPEconomic Policy0266-4658copy CEPR CES MSH 2007xxxOriginal ArticleAGE SENIORITY and LABOUR COSTSFRANCESCO DAVERI and MIKA MALIRANTAAge seniority and labour costs
SUMMARY
The bad labour market performance of the workforce over 50 indicates that an aged workforce
is often a burden for firms Our paper seeks to investigate whether and why this is the case by
providing evidence on the relation between age seniority and experience on the one hand and
the main components of labour costs namely productivity and wages on the other for a sample
of plants in three manufacturing industries (lsquoforestrsquo lsquoindustrial machineryrsquo and lsquoelectronicsrsquo)
in Finland during the IT revolution in the 1990s In lsquoaveragersquo industries ndash those not under-
going major technological shocks ndash productivity and wages keep rising almost indefinitely
with the accumulation of either seniority (in the forest industry) or experience (in the industry
producing industrial machinery) In these industries the skill depreciation often associated
with higher seniority beyond a certain threshold does not seemingly raise labour costs In elec-
tronics instead the seniority-productivity profile shows a positive relation first and then becomes
negative as one looks at plants with higher average seniority This body of evidence is con-
sistent with the idea that fast technical change brings about accelerated skill depreciation of
senior workers We cannot rule out however that our correlations are also simultaneously
produced by worker movements across plants The seniority-earnings profile in electronics is
instead rather similar to that observed for the other industries ndash a likely symptom of the
prevailing Finnish wage bargaining institutions which tend to make seniority one essential
element of wage determination In the end seniority matters for labour costs not age as such
But only in high-tech industries not in the economy at large This is well tuned with previous
research on gross flows of workers and jobs in the US and other OECD countries which
unveiled the productivity-driving role of resource reallocation (or lack thereof ) between plants
To improve the employability of the elderly at times of fast technical change public policy
should thus divert resources away from preserving existing jobs and lend more attention to
the retraining of old workers to ease their reallocation away from less productive plants (or
plants where they have become less productive) into new jobs
mdash
Francesco Daveri and Mika Maliranta
Age seniority
and labour costs
AGE SENIORITY AND LABOUR COSTS 119
Economic Policy January 2007 pp 117ndash175 Printed in Great Britaincopy CEPR CES MSH 2007
Age seniority and labour costs lessons from the Finnish IT revolution
Francesco Daveri and Mika Maliranta
Universitagrave di Parma and IGIER ETLA Helsinki
1 INTRODUCTION
Workers over 50 participate less in the labour market than their younger counterpartsand when unemployed they remain longer on the dole
1
These are clear symptoms thatcompanies are more reluctant to hire the elderly and that ultimately an aged workforceis a burden for most firms Whether and why this is the case is not obvious however
We are very grateful to our discussants Wendy Carlin and Rudolf Winter-Ebmer two referees and other panel participants fortheir comments on a previous draft Previous drafts of this paper previously circulated as IGIER Working Paper 309 and ETLADiscussion Paper 1010 under the title lsquoAge Technology and Labour Costsrsquo and benefited from the comments of seminarparticipants at the Government Institute of Economic Research (Helsinki) Bocconi (Milan) Humboldt (Berlin) Parma the 5thlsquoEconomics of ICT Conferencersquo in Mannheim the 2005 ONS Conference on the lsquoAnalysis of Enterprise Micro-Datarsquo in CardiffGilbert Cette Pekka Ilmakunnas Olmo Silva and Alexandra Spitz provided useful comments on previous drafts Maliranta gratefullyacknowledges financial support provided by Tekes within the Research Programme for Advanced Technology Policy (ProAct)We are grateful to the Research Laboratory of Statistics Finland for providing access to these data and especially to Satu Nurmithe Head of the Laboratory for constructing these data
The Managing Editor in charge of this paper was Paul Seabright
1
While labour market participation (the ratio between the labour force and the total population in working age) ranges between90 and 95 in all OECD countries the same ratio was instead substantially lower for older workers (from a high of some80 in Sweden to a low of about 45 in Italy) The OECD data on labour market transitions (see OECD 2006) documentthat the hiring rate of older workers is much lower (between one-third and one-half ) than for younger workers very few of theolder unemployed find a job and very few of those who left the labour force come back to work older workers are more likelyto quit their jobs than younger workers finally the old no longer working rarely move into unemployment while more thanhalf retire early and a significant proportion does not work because of reported disability
120 FRANCESCO DAVERI AND MIKA MALIRANTA
11 The controversy
Workforce ageing is known to entail skill deterioration and lessened ability to adaptand learn new things The studies of psychologists and medical scientists have in factoften shown that cognitive abilities tend to deteriorate with age Although this declineis not uniform across abilities after a certain age threshold further advancements inage are seemingly associated with lower productivity at work Beyond that thresholdfurther increases of experience add little or nothing to the working ability of a givenworker
2
This skill depreciation effect is possibly more pronounced though for a worker whostays within the same company for a long time A senior worker is more likely to haveexhausted her learning potential on the particular job or work environment she isattached to while a worker of the same age but new to the firm and to the job mayhave not This begs the question of whether seniority rather than age is behind thebad labour market performance of the elderly that we see in the data
The importance of distinguishing the effects of age from those of seniority manifestsitself in a related aspect too Declining productivity is in fact not enough to make anold (or senior) worker a burden for her firm as long as the additional year of age (orseniority) goes hand in hand with a parallel flattening of the individual earningsprofile Unfortunately this is rarely the case In many OECD countries labour marketinstitutions associated with the presence of collective agreements make the seniority-related part of the wage a particularly large fraction of workersrsquo wages therebypreventing companies from keeping wages aligned to the declining productivity ofsenior workers And a seniority wage may also be the result of the internal dynamicsof the firm Workers with a high degree of seniority have usually reached top positionsin their company which often enable them to extract a rent over and above theirproductivity contribution to the company Or employees and employers may haveentered an implicit contract implying a deferred compensation scheme so that theyoung are underpaid and the old overpaid with respect to their productivity In allthese cases the stop or outright reversal in the process of skill accumulation becomesmore pronounced right at a time when firms find it particularly hard to detachseniority from earnings Note however that it is seniority not age as such that is themost likely cause of rising labour costs
The productivity-wage race during the individual career paths and its counterpartfor company costs is in turn crucially affected by the pace of technical change Fasttechnical change usually embodied in new machines and methods of work accelerates
2
It should not be forgotten that workforce ageing is not necessarily a burden and may actually be a blessing for the firm Anolder labour force is more experienced and therefore potentially more productive Moreover having had more time to hangaround and search the labour market an old worker has potentially good chances of finding herself in a better job Finallythanks to the secular improvements in healthcare ageing has the potential to raise workersrsquo productivity by enhancing abilityand attitude to work also increasing and lengthening labour force participation The balance between the good and the badsides of ageing is duly discussed in the paper
AGE SENIORITY AND LABOUR COSTS 121
the depreciation of existing skills naturally occurring with age or seniority and thusmakes it more likely that senior workers become a burden for the firm As a resultthe adverse effects of seniority on labour costs may be particularly striking in high-tech industries and more generally in firms where incessant changes in the methodsof production and the set of goods and services offered to the public are crucialingredients of the maintained competitive ability of the company
12 Policy relevance
Policy-makers are increasingly worried about the labour market consequences ofworkforce ageing In the last few years the rapid diffusion of outright new andlsquoglobalizedrsquo methods of production and work in those countries and industries mostheavily affected by the IT revolution have possibly made the skill deterioration ofolder workers faster and hence contributed to the worsening of their labour marketposition The shape of the relation between seniority and labour costs is seeminglywell known to Wal-Mart managers as exemplified by the following quote
lsquoOver the past 4 years the average Associate tenure [at Wal-Mart] has increased by 02months per calendar year As a result more Associates qualify for participation in benefitsprograms and for more paid time off An even more important factor is wages whichincrease in lock-step with tenure and directly drive the cost of many benefits Given theimpact of tenure on wages and benefits the cost of an Associate with 7 years of tenure isalmost 55 per cent more than the cost of an Associate with 1 year of tenure yet there is nodifference in his or her productivityrsquo (Internal memorandum to the Board of DirectorsWal-Mart March 2006)
But not too dissimilar preoccupations also probably underlie the recent move byEricsson the Swedish telecoms equipment maker which in April 2006 offered avoluntary redundancy package to up to 1000 of its Sweden-based employees betweenthe ages of 35 and 50 Interviewed by the
Financial Times
Carl-Henric SvanbergEricssonrsquos CEO justified his move as follows lsquothe companyrsquos age structure and lowstaff turnover ndash about 1 per cent in a year ndash is storing up problems for the future andhas to be addressedrsquo Accordingly Mr Svanberg has set the minimum target for staffturnover at 3 per year
The anecdotes on such almost quintessentially global companies as Wal-Mart andEricsson may be representative of the problems that an enlarging set of companieswill have to deal with in the future If companies take action to stop the rise in labourcosts due to declining or stagnating ability above a certain age or seniority thresholdand higher wages than ever in career this may further worsen the labour marketposition of the elderly Yet the seniority of their employees seems to be the problemfor Wal-Mart and Ericsson managers not their age as such
Whether the envisaged mechanism of wage-productivity misalignments potentiallyat the roots of the weak labour market position of the elderly is due to age or seniorityalso has far-reaching implications for the type of policy correction to undertake If
122 FRANCESCO DAVERI AND MIKA MALIRANTA
ageing as such is behind the worse labour market outcomes of the elderly this callsfor age-specific active labour market and educational policies to counteract depreci-ating skills improve the employability and eventually facilitate the re-entry of oldworkers into the labour force If instead seniority is really the problem then no age-biased active labour market policy is warranted Labour market policy should insteadbe mainly aimed at easing worker reallocation across jobs and firms for instance byreducing firing and hiring costs
13 Our contribution
Our paper seeks to illuminate the debate on the implications of workforce ageing forcompanies by contrasting age seniority and general experience profiles with produc-tivity and earnings for a sample of plants in three manufacturing industries (lsquoforestrsquolsquoindustrial machineryrsquo and lsquoelectronicsrsquo) in Finland
Finland is an appropriate laboratory to study our issues of interest in two respectsFirst it was hit by the IT revolution in the 1990s which affected firms in the variousindustries in different ways Second it has good data to study the problem So notonly does Finland provide the scope but also the means for properly analysing therelation between seniority experience productivity and wages at the plant level
To evaluate whether such relations differ across industries we pick a subset of threeindustries that include the most traditional Finnish industry one can think of (the forestindustry) and two industries producing capital goods one (production of electronicsequipment) playing a crucial role and another one (production of machinery andequipment) less involved in the IT revolution We can thus study the relation betweenage seniority and experience on the one hand and labour cost variables (productivity andearnings) in lsquotreatedrsquo industries (electronics) and lsquocontrolrsquo industries (the other two industries)one of which is technologically dissimilar but representative of the average Finnishindustry and another not too dissimilar from electronics Altogether our statistical analysisprovides a reasonably coherent picture of the empirical relation between age-relatedvariables plant productivity and wages in Finland in the years of the IT revolution
Our empirical exercise is implemented in two steps First we compute an overallproductivity index for each plant from labour productivity data Then we analysethe statistical relation between the plant productivity index and age-related variables(age first but also and crucially seniority and potential experience) in each of thethree industries separately Clearly within each industry plant productivity may varyfor many reasons in addition to changes in seniority or experience of workers Someof these determinants ndash workersrsquo education vintage foreign ownership size of theplant ndash are observed Some others (such as managerial ability) are not but there arestatistical methods to implicitly account for their effect We investigate the signifi-cance of the same set of variables for earnings as well
At first sight our results seem to support the view that workforce ageing as suchhas adverse effects on labour costs Age is essentially unrelated with productivity while
AGE SENIORITY AND LABOUR COSTS 123
it is positively correlated with wages Upon a closer scrutiny though when we dulydistinguish the effects of seniority on productivity and wages from those of generalexperience we find that the picture sharply differs across industries
In lsquoaveragersquo industries ndash those not undergoing major technological shocks ndashproductivity and wages keep rising almost indefinitely with the accumulation ofeither seniority (in the forest industry) or experience (in the industry producingindustrial machinery) In these industries skill depreciation does not seemingly raiselabour costs Instead the responses of plant productivity and wages to seniority arevery different from each other in electronics ndash the industry where people are exposedto rapid technological and managerial changes In electronics the seniority-productivity profile shows a positive relation first and then becomes negative as onelooks at plants with higher average seniority This holds for plants with similareducation plant age and size and other conditions and is thus not related to plantdifferences in these other respects The inverted-U-shaped correlation between plantseniority and productivity in electronics is most precisely measured when data areaveraged over time that is when purged of the potential noise arising from year-to-year fluctuations but a weaker correlation is still there when the time series variationof the data is considered
This body of evidence is consistent with the idea that fast technical change bringsabout accelerated skill depreciation of senior workers We cannot rule out howeverthat our correlations are also simultaneously produced by worker movements acrossplants The negative correlation between seniority and productivity may in fact also reflectthe reallocation away of younger (and more productive) workers who leave behindolder plants attracted by the career prospects offered in newly born high-productivityfirms and plants While we cannot precisely quantify the relative importance of thetwo effects in our statistical analysis we conclude that both skill depreciation andworker reallocation affect the relation between seniority and productivity in the Finnishhigh-tech industry
The change of sign (first positive then negative) in the seniority-productivity profilesis not there for plant wages The seniority-earnings profile in electronics is rathersimilar to that observed for the other industries ndash a likely symptom of the prevailingFinnish wage bargaining institutions which tend to make seniority one essential elementof wage determination
These latter findings indicate that the looming rise in labour costs coming aboutfrom seniority-based wages is particularly significant in high-tech industries (the mostdynamic industries of the economy) This is well tuned with previous research on grossflows of workers and jobs in the US and other OECD countries which unveiled theproductivity-driving role of resource reallocation (or lack thereof ) between plants Theadverse link between seniority and productivity and the discrepancy between produc-tivity and earnings profiles are instead less apparent for firms in other industries Inthe end seniority matters mostly for labour costs not age as such But in high-techindustries only and not in the economy at large
124 FRANCESCO DAVERI AND MIKA MALIRANTA
14 Organization of the paper
The structure of this paper is as follows In Section 2 we discuss the main ideas thateconomists bring to bear when thinking about the relation between ageing seniorityexperience productivity and wages In Section 3 we present data explaining whyFinland is an interesting case in point and how our variables of interest correlate toeach other in the data set employed in our statistical analysis In Section 4 we presentand discuss our empirical strategy and main results Section 5 concludes This paperalso includes an appendix where we give a more detailed description of our data
2 AGE SENIORITY EXPERIENCE PRODUCTIVITY AND WAGES THEORIES AND EMPIRICAL PREDICTIONS
Various theories of the functioning of the labour market bear distinct empirical pre-dictions and help think about the relation between age seniority experience and themain components of labour costs productivity and earnings We briefly survey thevarious theories below before contrasting them with the data
21 Age productivity and wages theories
The most straightforward way of tackling the question whether ageing is associatedto higher labour costs for the firm is to look at whether workforce ageing drives anegative wedge between the workerrsquos productivity and its wage
But answering this question is not enough Ageing usually manifests itself in twomain guises seniority and overall experience Plainly an older worker has very oftenspent more time in the labour market ndash and has thus a bigger general experience ndashthan a younger worker Instead an old worker need not be a senior worker in aparticular firm Distinguishing the two facets of ageing in the labour market ndash as thevarious theories do ndash is particularly important for policy purposes as ageing is essen-tially exogenous to the individual worker while potential experience and to an evengreater extent seniority are not
211 The human capital hypothesis
The most obvious benchmark for ourdiscussion on ageing and labour costs is Beckerrsquos human capital hypothesis (1962p 119) according to which an older labour force is more experienced and thereforemore productive
First of all ageing often ndash not always ndash comes about with higher seniority of theworker within a given firm As long as some learning and training is undertaken onthe job early on in a career higher seniority should be associated to higher workerrsquosproductivity Moreover the human capital hypothesis posits that ageing should beassociated with the acquisition of generic experience in the labour market over andabove the increased seniority within a given firm If generic experience buys enhanced
AGE SENIORITY AND LABOUR COSTS 125
flexibility and adaptability to the worker this is again likely associated to higherproductivity and market wages Yet such productivity and wage enhancements arenot the counterpart of higher seniority
In turn the extent to which higher productivity results in higher wages dependson whether training is general or firm-specific as well as on incentive considerationsIf training is general the worker fully appropriates the productivity increase enabledby training at a later stage in hisher career If instead training is firm-specific workerand firm will share the quasi-rents generated by training In other words with at leastpartially firm-specific human capital one should expect the seniority-productivity profileto be steeper than the seniority-wage profile so that the productivity of senior workerseventually exceeds their earnings while the opposite applies at early career stages
Altogether ageing affects productivity and wages both through seniority andgeneral experience Their effects however need not coincide empirically
Finally the theory of human capital also suggests that the returns from seniorityand experience alone (ie without further educational or training inputs) do not stayconstant over the workerrsquos lifetime As emphasized in the psychometric studies under-taken by medical scientists (see Skirbekk 2003) cognitive abilities tend to deterioratewith age so that after a certain age threshold growing older is seemingly associatedto lower not higher productivity (See Box 1 for a discussion of the main issues)
Box 1 Age and individual productivity
The productivity of individual workers depends on a host of characteristicssuch as education and skills experience motivation intellectual and physicalabilities Some of these worker characteristics ndash notably the productive valueof skills ndash may deteriorate with age
Verhaegen and Salthouse (1997) present a meta-analysis of 91 studies on howmental abilities develop over the individual life span Based on these studies theyconclude that the cognitive abilities (reasoning speed and episodic memory) declinesignificantly before 50 years of age and more thereafter Maximum levels areinstead achieved in the 20s and the 30s This is a universal phenomenonindependent of country and sex (this same phenomenon appears to hold evenamong non-human species ndash from fruit flies to primates) Kanazawa (2003) showsthat age-genius curve of scientists bends down around between 20 and 30 yearsSimilar curves are also found for jazz musicians and painters Given that thedecline seems to apply mainly to married men Kanazawa ventures the idea thatchanged levels of testosterone provide the psychological micro-foundation forthis productivity decline
In putting together our pieces of evidence we will leave aside a few importantaspects which are likely to make the picture more complicated than this First
126 FRANCESCO DAVERI AND MIKA MALIRANTA
a distinction must be drawn between fluid abilities and crystallized abilitiesFluid abilities concern the performance and speed of solving tasks related tonew material and they include perceptual speed and reasoning They are stronglyreduced at older ages Crystallized abilities such as verbal meaning and wordfluency even improve with accumulated knowledge and remain at a high func-tional level until a late age in life The distinction between fluid and crystallizedabilities is supported by empirical findings where the psychometric test resultsof young and old men are analysed It is found that verbal abilities remainvirtually unchanged while reasoning and speed abilities decline with age Henceone should not expect to see the declining part of the age-productivity profileto set in equally for all tasks and jobs
Second the relative demand for work tasks that involve certain cognitiveabilities may have shifted asymmetrically over recent decades As argued andempirically documented by Autor
et al
(2003) the demand for interactive skills(hence for abilities that stay relatively stable over the life cycle) has likelyincreased more than the demand for mathematical aptitude (which insteaddeclines substantially with age) This suggests that older workers may becomerelatively more productive in value terms over time Whether such countervail-ing factors are relevant for Finland remains to be seen being presumablyparticularly important for IT users rather than for the workers involved in theproduction of IT goods The micro data employed by Maliranta and Rouvinen(2004) indicate that the use of ICT has had a particularly significant effect onproductivity in ICT producing and using manufacturing industries That studyalso provided evidence that the use of ICT has a stronger positive effect onproductivity in younger organizations
Our plant-level data set does not give us much leeway to exploit such addi-tional interesting implications and we leave them aside
Particularly relevant for the topic of this paper the deterioration of individualability may be a more serious shortcoming at times of ndash and in companies and industriessubject to ndash fast technological change The misalignment of plant productivity andearnings was apparent in the Wal-Mart and Ericsson examples in Section 1 This hasalso possibly been the case in the Finnish economy since the early 1990s wheninformation technology started radically changing modes of production and workover a relatively short period of time If these rapid changes had an impact onewould expect to observe an age-productivity (or seniority-productivity) profile with anearlier turnaround point andor a steeper decline in high-tech industries (such asthose today producing electronic equipment) than in traditional technologically matureindustries (such as forest) as well as relatively less IT-intensive but still capital-good-producing industries (such as machinery and equipment)
AGE SENIORITY AND LABOUR COSTS 127
To sum up based on the human capital hypothesis accumulation of skills withinand outside the firm is an important but not unceasing productivity driver Individualproductivity profiles are expected to have an upward sloping part possibly changingits slope into negative beyond a certain threshold Under the same hypothesis wagesare instead supposed to follow a flatter time profile than productivity
A major problem for the research on the connections between age and productivityat the micro level has been the difficulty of measuring the marginal productivity ofindividuals although their earnings can be measured with a reasonable degree ofprecision (see Box 2)
Box 2 Measures of individual productivity
To gauge indirect information about individual productivity three main approacheshave been followed supervisorsrsquo ratings piece-rate samples and the study ofage-earnings data within matched employer-employee data sets
Studies based on supervisorsrsquo ratings tend not to find any clear systematicrelation between the employeersquos age and hisher productivity At most aslightly negative relation is found albeit small A problem with these studies isthat managers often wish to reward loyalty rather than productivity Hencesupervisory evaluations may be inflated and results biased Bosses are oftensenior workers and many older workers have been familiar to them for a longtime This may be positively reflected in the wage levels of older workers
Work-samples provide evidence from task-qualityspeed tests Here a neg-ative relation between age and productivity is typically found The slope of thedecline is not steep for blue-collar workers and leads to cumulative declines ofaround 15ndash20 compared to peak levels while the productivity decline ofolder workers in creative jobs is probably more pronounced
Employer-employee linked data sets such as the one we are using in thispaper are less prone to subjectivity issues than the studies based on supervisorsrsquoratings and to selectivity issues than work-samples The problem here is to isolatethe genuine contribution of the age of the marginal worker to the companyrsquosvalue added from other intervening factors How to deal with these issues isdiscussed in the main text
One way out is to use data on wages If wages were directly related to productivitythe age-earnings profile would also measure the productivity profile Indeed as reportedby the OECD (2006 p 66) earnings profiles are often hump-shaped especially formen which may reflect results from the decline of individual productivity
128 FRANCESCO DAVERI AND MIKA MALIRANTA
212 The deferred compensation hypothesis
The human capital hypothesisoffers one explanation and a few testable predictions on the relation between ageseniority experience productivity and earnings It is not the only game in townhowever Its predictions on the wage-productivity race throughout the working careerhave been challenged by Lazearrsquos deferred compensation hypothesis
Seniority-based wages are indeed commonplace in many countries This oftencomes in parallel with mandatory retirement
3
In general earnings appear to continueto grow well beyond the moment when the age-productivity profile would be predictedto flatten or change its sign into negative according to the human capital approach
These pieces of evidence are at odds with one of the main implications of thehuman capital hypothesis namely that the wage profile is flatter than the productivityprofile But they also raise the question of why firms should accept to grant workerspay raises in excess of their productivity performance One possibility (see Lazear 1981)is that firms are willing to pay high wages to motivate workers whose performance ishard to monitor to exert their work effort until late in career Deferred compensationschemes would however distort workersrsquo decisions to retire Hence deferred com-pensation schemes come together with mandatory retirement ndash an effective way toeventually put old workers out of the labour force and resolve the eventual unsustain-ability of the underlying pay systems
The seniority-based wage systems observed in Korea and Japan are broadly con-sistent with the deferred compensation hypothesis A complementary possibility ndashplausibly relevant for European countries ndash is the presence of collective agreementsor social norms that often make seniority a firmly embedded feature of the wagesetting process
213 Sorting and matching models
Another problem with the human capitalapproach is its assumption that worker seniority and experience are essentially exog-enous to the firm Instead the relation between firm seniority and productivity is notnecessarily one-way only Other theories draw on the widespread diffusion of sortingand matching in actual labour markets to emphasize that seniority and experienceshould not (only) be regarded as the causes of the observed productivity developmentsbut also as their consequences
The positive link between seniority and productivity may in fact be there forsorting reasons Given that a worker stays with the firm only if the firm-worker matchis good senior workers presumably belong to the pool of the most productive (egTeulings and Hartog 1998) Hence even in the absence of the relation implied bythe human capital hypothesis productivity and seniority may still be correlated in the
3
The available OECD evidence indicates that explicit or implicit seniority-based rules lead earnings to rise even more steeplywith age than early on in a career in Austria France Japan South Korea Luxembourg and Switzerland In Finland and theUS the non-wage components of labour costs (for health insurance purposes) rise steeply with age
AGE SENIORITY AND LABOUR COSTS 129
data Moreover feed-back effects may also be at work as emphasized by Manning(2000) when the link between experience and productivity is examined Labour marketsearch by raising the chance of finding a good job-worker match may also implyupward sloping experience-earnings profiles in parallel with flat or declining produc-tivity and absent seniority effects Notice that this search argument would imply apure effect of experience such that when age is controlled for firm-specific senioritywould have no impact on wage Clearly the feed-back effects implied by sorting andmatching models should be taken into account in the empirical analysis
22
Empirically testable questions
To be able to discriminate between the different theories of the functioning of thelabour market briefly summarized above we use our Finnish data set to investigatefour main questions on the relation between workforce ageing seniority experienceand labour costs
1 Is age as such related to productivity and wages at all2 Is the effect of seniority on productivity and earnings different from the effect of
age through the general experience channel3 Are the effects of age (and seniority in particular) on productivity and wages
significantly different from each other and across industries (in particular betweenindustries subject to fast technical change and the other industries)
4 Is the correlation between age and age-related variables on the one hand andproductivity and wages on the other really the result of causation
3 WORKFORCE AGEING SENIORITY AND LABOUR COSTS IN FINLAND BASIC FACTS
In this section we present some basic pieces of information on the variables ofinterest in the statistical analysis below
In Section 31 we argue that Finland shares some common demographic andlabour market trends with other European countries such as the difficult labourmarket position of old workers Hence the Finnish case discussed here may be seenas paradigmatic of issues faced by many countries At the same time though theFinnish case also presents some specificity namely the intensity of the technologicaland managerial shock in the late 1990s As discussed above rapid technologicalchange may accelerate skill depreciation thereby making the cost-increasing effect ofageing and seniority a more serious concern for firms
In Section 32 directly related to our main object of concern (ie investigating howworkforce ageing may be a burden for firms) we briefly describe how plant ageseniority and potential experience pair-wise correlate with productivity and wages inour data set of manufacturing plants
130 FRANCESCO DAVERI AND MIKA MALIRANTA
31
Workforce ageing and the Finnish IT revolution in the 1990s
Finland is no exception in the OECD as far as the weak labour market situation ofolder workers is concerned Old workers in Finland tend to achieve lower labourmarket participation and employment rates and suffer from higher unemploymentrates than workers in the same age group in other Nordic countries At the sametime if one compares Finland to countries in Continental Europe one finds that theold Finns enjoy relatively higher participation and employment and lower unemploy-ment So Finland is about half-way down the OECD ranking
These labour market outcomes come with a twist of originality compared to therest of the OECD though throughout the 1990s the skills of older workers inFinland have also been challenged by the unusually fast pace of the IT revolution inthat country
In the 1990s the world demand for cellular phones boomed under the push ofdeclining semi-conductor prices Thanks to Nokiarsquos managerial ability and leadershipin the cellular phone industry the share of electronics (SITC 32ndash33) in the FinnishGDP markedly rose from about 35 of nominal GDP in 1995 to 82 in 2000
4
Throughout the same period of time the value added of the forest industry (andnotably of the industry named lsquoPulp paper and wood productsrsquo SITC 20ndash21) fellfrom 75 in 1995 to 6 in 2000 In parallel ndash an example of how not all of the socalled high-tech industries have gained throughout this period of time ndash the valueadded share of lsquoIndustrial machinery and equipmentrsquo (SITC 29ndash31) slightly fell from57 to 54 in 2000
The Nokia-driven technological and managerial shock has been unique in aninternational landscape As reported in Table 1 the share of IT goods productionover total manufacturing went up by 134 percentage points in Finland between 1995and 2001 This is also remarkable because the beneficial effects of declining semicon-ductor prices were potentially out there for every country As shown in Table 2however the other OECD countries have seemingly not taken this opportunity or
4
This increase was also the result of the rapid development of a myriad of ancillary manufacturing and high-tech consultancyactivities around Nokia Some of them are first-tier suppliers to Nokia Some others provide such electronic manufacturingservices as component sourcing equipment renting production design and testing and thus bridge the gap between equipmentmanufacturers and component suppliers See Ali-Yrkkouml
et al
(2000) and Daveri and Silva (2004) for more detailed renditions
Table 1 The exceptional increase in the share of IT manufacturing goods in total manufacturing in Finland in the second half of the 1990s (1995ndash2001 percentage points)
Swe Nor Den Jap USA UK Fin Ger Net Ire Fra Spa Ita
minus14 +04 +01 +20 +20 +06 +134 +10 minus03 +23 +08 minus04 minus08
Source OECD (2003)
AGE SENIORITY AND LABOUR COSTS 131
have exploited it differently (perhaps on the IT services side) No doubt the intensityof the IT technological and managerial shock in the 1990s was of much biggermagnitude in Finland than in any other OECD country
32
Age seniority experience productivity and earnings in Finnish manufacturing plants
To tackle the questions we are interested in before delving into the deeper statisticalanalysis enabled by multivariate techniques we describe the main features of ourplant-level data set as well as the sample statistics and correlation between ageseniority and potential experience on the one hand and the two main componentsof labour costs productivity and wages on the other
321 Data set
Similar to the other Nordic countries Finland is endowed with arich register data of companies plants and individuals The unique identification codesfor persons companies and plants used in the different registers form the backboneof the Finnish administrative register network and the Finnish statistical systemwhereby different sources of information can be integrated conveniently for variousstatistical purposes
5
5
Data sources and linking of them are described in the Appendix of this paper and in greater detail in Ilmakunnas
et al
(2001)and Maliranta (2003)
Table 2 Correlations between averages in 1995ndash2002
Age Experience Seniority log of TFP log of wage
Forest industryAge 1Experience 09939 1Seniority 07824 07679 1log of TFP minus01747 minus01766 minus01815 1log of wage 04736 04271 06069 1Number of observations 365Industrial machineryAge 1Experience 09790 1Seniority 06792 06605 1log of TFP minus0117 minus01565 1log of wage 02317 01127 01635 03495 1Number of observations 567ElectronicsAge 1Experience 09528 1Seniority 07085 06971 1log of TFP minus02118 1log of wage 02697 02556 1Number of observations 172
132 FRANCESCO DAVERI AND MIKA MALIRANTA
This paper employs linked plant-level information for plants and workforce fromthe Census of Manufacturing and Employment Statistics between 1990 and 2002(1995 and 2002 in the main part of our statistical analysis)
6
Thanks to this link wehave valuable information on the characteristics of the labour input for the plantsThis includes the average potential experience (the number of years after the lastcompleted degree) seniority (the number of years spent working in the current com-pany) and education (the number of schooling years needed for the degree) On theside of the plant labour costs we have information about gross wage value added perhour worked (lsquolabour productivityrsquo) capital stock per hour worked (the lsquocapital-labourratiorsquo) and the value added shares of capital These pieces of information put togetheras detailed in Box 3 allow us to compute a total factor productivity (TFP) index ameasure of sheer efficiency of each plant
Box 3 How we computed plant productivity
We numerically compute a TFP (total factor productivity) index ndash an index ofdisembodied technical knowledge under constant returns to scale and perfectcompetition in factor markets from the standard growth accounting formulain natural logarithms
ln(
TFP
)
pit
=
ln(
Y
L
)
pit
minus
(1
minus
a
i
) ln(
K
L
)
pit
with
a
i
denoting the average industry specific labour share during the periodThe average is calculated from the annual industry labour shares preliminarilysmoothed by a non-linear filter Thus we allow the output elasticity of capitaland labour to vary between different industries but not between plants withinthe same industry Our TFP index is thus suitable both for analysing both thecross-sectional and time series variation of our data
In the second step of our empirical analysis we relate the computed TFPindex to the plant characteristics including average workers characteristicsindicated in the main text
322 Summary statistics for Finnish industries and plants
Tables 2 and 3show data on the pattern of correlation in our data set separately for each industryboth for period-averaged plant data (hence along the cross-sectional dimension seeTable 2) and along the time series dimension (see Table 3)
6
The observations between 1990 and 1994 are employed as instruments for data concerning the 1995ndash2002 period in ourstatistical analysis
AGE SENIORITY AND LABOUR COSTS 133
As implied by how we measure potential experience there is a very strong correlationbetween age and potential experience in all three industries along both cross-sectionaland time dimensions Not surprisingly either age and potentially experience havevery similar correlations with other variables The correlation between age and sen-iority is instead somewhat lower (it ranges between 07 and 08) but is still clearlystatistically significant The correlation regarding other variables is often statisticallyinsignificant particularly over time if this is the case we omit reporting correlationcoefficients
In the cross-sectional data age and wages are positively correlated while age isnegatively correlated (in the forest industry) or uncorrelated (in Industrial Machineryand Electronics) with TFP Seniority instead has a negative correlation with TFPin all the three industries but has a positive correlation with the wage level exceptin Electronics where the correlation is not statistically significant A positivecorrelation between the wage level and TFP is there instead for IndustrialMachinery and Electronics We have also computed these correlations separatelyfor declining and expanding plants Some of the earlier significant correlations turnout to be insignificant but the problem is the small number of observations in somecases (especially in Electronics) which makes it hard to draw further conclusions fromthese calculations
Table 3 Correlation over time (between variable changes from 1995 to 2002)
Age Experience Seniority log of TFP log of wage
Forest industryAge 1Experience 09784 1Seniority 07029 07566 1log of TFP 1log of wage 1Number of observations 199Industrial machineryAge 1Experience 09812 1Seniority 07989 07591 1log of TFP 1log of wage 1Number of observations 197ElectronicsAge 1Experience 09922 1Seniority 1log of TFP 1log of wage 1Number of observations 49
Notes We only report correlation significant at least at the 10 level indicates significance at the 1 levelBonferroni adjustments have been made to significance levels
134 FRANCESCO DAVERI AND MIKA MALIRANTA
4 WORKFORCE AGEING AND THE FIRM THE EVIDENCE FROM FINNISH MANUFACTURING PLANTS
41
Empirical strategy
The aim of our statistical analysis is to identify the plant-wide relation between ageand age-related variables (seniority potential experience) on the one hand and labourcosts (productivity and wages) on the other
The logic of our empirical exercise is straightforward To evaluate the relationbetween ageing and plant productivity we first relate the plant productivity index(computed as in Box 3) to our main variables of interest age potential experienceand seniority of the plant workforce and (as indicated in Box 4) to a number of otherrelevant variables whose statistical significance is of secondary importance for ourmain purpose in this paper Then we repeat the same type of exercise with earningsndash instead of productivity ndash as a dependent variable
Box 4 Two methods for calculating age-productivity profiles at theplant level
Hellerstein and Neumark (1995) Hellerstein
et al
(1999) Haegeland andKlette (1999) and Ilmakunnas and Maliranta (2005) have used information onthe shares of workers in different groups (such as to education age and thelike) to model the quality of the labour input of a plant in a productionfunction estimated from plant level data By directly estimating this productionfunction jointly with an equation for average wage they were able to quantifyand compare the productivity and wage profiles
At least with our Finnish data set (but this is known to be a more generalproblem) this method often tends to produce implausibly low estimates forthe capital input coefficients which may bias the estimated coefficients forage-productivity profiles Thus following Griliches and Rinstad (1971) andmore recently Ilmakunnas
et al
(2004) we employ a two-step procedureFirst we numerically compute a TFP (total factor productivity) index (as
described in Box 4) Then in the second step of our empirical analysis werelate the computed TFP index to the plant characteristics including averageworkers characteristics indicated in the main text Our variables of interest areseniority (the number of years spent working in the current company) averagepotential experience (the number of years after the last completed degree) andthe number of schooling years (usually needed for the degree) Other includedvariables are plant age foreign ownership and a dummy variable for disap-pearing plants
AGE SENIORITY AND LABOUR COSTS 135
In the end our two-step specification partly based on growth accountingtechniques comes at the cost of accepting the ndash possibly plausible but essen-tially untested ndash constant returns to scale and perfect competition assumptionsmentioned above Maliranta (1997) found that the assumption of constantreturns to scale in the Finnish manufacturing sector is approximately correct
In our empirical analysis we exploit three industry panels along the cross-plant and timeseries dimensions The three industries have been selected for being representativerespectively of an lsquoaveragersquo pre-boom manufacturing industry (lsquoforestrsquo) a non-boomingcapital-intensive industry (lsquoindustrial machineryrsquo) and a booming high-tech industry(lsquoelectronicsrsquo) As reported in the summary statistics in Table A1 of the appendix we havedata for 365 plants for the forest industry 567 plants for lsquoindustrial machinery and equip-mentrsquo and 172 plants for lsquoelectronicsrsquo For each of these plants we have a maximum ofeight observations over the years between 1995 and 2002 The unbalanced nature ofour panel is such that when using the variation of the data over time we are able toemploy at most respectively 1523 1717 and 496 observations (hence about 52 38and 36 of the total potential observations) A fraction of the missing observations isdue to plant lsquodeathrsquo in 1996ndash2002 which represents about 12 of the forest industry 20of machinery and 22 of electronics The share of disappearing plants is thereforeone-fourth of the total missing for forest and about one-third for the other industries
411 What we hope to learn
The statistical significance and the size of the estimatedcoefficients of the variables of interest give us important information as to whetherand how workforce ageing raises labour costs for the firm or not Moreover we wantto learn whether age as such is important or if instead as predicted by the theoriesdiscussed in the previous section the productivity-wage implications of seniority(lsquoageing within the firmrsquo) are different from those of potential experience (lsquoageingoutside the firmrsquo) as predicted by some of the models discussed in the previous sectionMoreover to understand whether the intuition underlying human capital theories isborne by the data we will also check whether ageing has a declining effect on productivityand wages for older people Third to learn whether human capital theories must besupplemented by the other explanations based on the institutions and incentive con-siderations discussed above as the deferred compensation hypothesis we will checkwhether the effects of age seniority and experience are different for productivity and wages
In addition to that the cross-industry variation in our data gives us the possibility oftesting whether the industry (more ambitiously the technological content of industrialproduction) makes a difference for age-productivity profiles If new technologies sig-nificantly affect the wage-productivity race we expect to find industry-specific patterns ofpartial correlation with differences showing up in particular between electronics andthe other industries
136 FRANCESCO DAVERI AND MIKA MALIRANTA
Finally productivity and wages do not depend on variables such as age seniorityor experience only but also on education (measured as the number of years ofschooling) as well as a few additional other observed and unobserved factors varyingacross plants but more or less constant over time (such as plant size foreign ownershipand outright time-invariant plant vintage discussed right below) as well as thosefactors varying over time but equally for all plants (such as unobserved year-specificeffects)7 Hence the influence of all these variables together with the effects of ageingis jointly tested in our statistical analysis In each table explanatory notes will reportthe list of the variables employed in the various specifications
42 Implementation difficulties
Our undertaking confronts five main difficulties of implementation attenuationreverse causation unobserved heterogeneity selectivity and measurement error Wediscuss each of them separately also indicating how we tackle such problems in ourempirical analysis
421 Attenuation A very common problem with panels such as the one at handis that the variation over time of the panel data may be very noisy and subtractprecision from the statistical analysis of the underlying phenomenon giving rise tothe so-called attenuation bias In practice if this problem is present the estimatedcoefficient of age or seniority in the empirical analysis of the determinants of produc-tivity would be artificially biased towards zero Using plant data averaged over allavailable years allows one to get rid of this unnecessary noise and hopefully concen-trate on the underlying long-run relation This is why in each table we present oneset of results where standard statistical techniques (such as ordinary least squares) areemployed with the cross-section of plants estimated separately for each industry
422 Reverse causation Cross-sectional statistical analysis based on averaged datais not problem-free either unfortunately A big problem is potential reverse causationThe statistical relations we intend to analyse posit that age or age-related variablesare the independent variables and productivity the dependent variable But cross-sectional data as such (be they observed at a given point in time or averaged overtime) only indicate correlation not causation Therefore if the estimated coefficientlinking seniority and productivity is negative (say after a certain age threshold) thismay not indicate that the plants where aged workers are employed are less productiveRather the negative correlation may simply signal that senior workers tend to behired in less productive and older plants probably featuring outdated machines andmethods of production while new innovative and high-productivity plants may be
7 Such period effects are appended to the list of the explanatory variables when the time variation of the data is consideredand not when cross-sectional plant data are used
AGE SENIORITY AND LABOUR COSTS 137
more often matched to young workers If this is the case we would be wrongly interpret-ing what causes what attributing to seniority the effect of plant age on plant productivity
We deal with this problem in two ways First in our cross-sectional analysis wealways include an additional explanatory variable plant age namely a categoricalvariable indicating the period of establishment of the plant If the correlation betweenseniority or experience and productivity hides a causal correlation from low-productivity old machines onto old (potentially high-productivity) workers the statis-tical effect of workersrsquo seniority and experience on plant productivity should disappearonce the effect of plant age is accounted for Second in another empirical specification(Instrumental Variables or IV) we supplement the contemporaneous values of theexplanatory variables with their lagged values (measured in 1990ndash94) as additionalexplanatory variables If todayrsquos plant productivity (say in 1995ndash2002) may have acontemporaneous feedback effect onto todayrsquos plant seniority this feedback is lesslikely to be present when another explanatory variable such as seniority measuredyesterday (ie in 1990ndash94) is appended to the list of the productivity determinants
423 Unobserved heterogeneity Surely a lot of unobserved heterogeneity inplant productivity is still there in the data even once we have augmented the list ofproductivity determinants with plant vintage and other lagged variables Yet theproblem of interpreting the statistical results from cross-sectional estimates arises ifand only if the unobserved (therefore unmeasured) plant variables are correlated withthe included explanatory variables For example if managerial ability ndash a typicallyunobserved plant variable ndash were unrelated to hiring decisions then leaving it out ofthe empirical analysis would not be a major problem Unfortunately instead an ableplant manager may be particularly inclined to hire young productive workers (asJuuti 2001 pointed out) Then if managerial ability is not observed and thereforeomitted from the analysis its effect may be picked up by the negative estimatedrelation between senior workers and productivity We would be misperceiving theeffect of managerial ability on hiring decisions as if it were the causal effect of age onproductivity To tackle this problem we use fixed-effects estimation by appending tothe list of explanatory variables terms summarizing the joint effect of the unobserveddeterminants of plant productivity as long as they are not variable over time (as man-agerial efficiency is) In this way the estimated coefficient linking age and productivityis purged of the unwanted influence of unobserved variables constant over time
By analysing the time variation of our data as well we can significantly extendsample size usually associated with enhanced statistical precision8 When adopting
8 Clearly however the additional observations being repeated for the same plants cannot be taken as independent observa-tions Thus in our statistical analysis we allow for the error term (the residual unobserved components not captured by theexplanatory variable included in our statistical analysis) to be auto-correlated ie to be time-dependent This serves the purposeof not being misled by the potentially increased gain of precision achieved in capturing the phenomena at hand thanks to theincreased sample size Accounting for auto-correlation is instead important to correctly appreciate the explanatory power of ourmodel along the time dimension
138 FRANCESCO DAVERI AND MIKA MALIRANTA
the fixed-effects statistical model however one effectively relinquishes informationcontained in the cross-sectional framework and concentrate on the so-called lsquowithin-plantrsquo variation in the panel data set This may be a good thing if the goal is to answersome questions which ndash by construction ndash could not be addressed in the cross-sectionalframework the main of which is whether the relation between the age-related variableseducation productivity and wages is a simultaneous one or whether it operates withsome delay
424 Selectivity Our panel data set also presents selectivity problems which man-ifest themselves in two fashions The first problem is typical of any panel of plants orindividuals Longitudinal studies typically suffer from non-random attrition that isthe loss of respondents over time tends to generate an upward bias in the age-productivity estimate given that the plants remaining in the sample are usuallypositively selected being very often the best ones A remedy for this type of selectivitywould entail splitting the statistical analysis into two steps The first step is to estimatethe probability that plants (and workers) will disappear from our sample The secondstep entails correcting the estimated coefficients taking into account the bias inducedby the omission of the disappeared plants We do not go that far Plainly in evaluatingour cross-sectional evidence we check the statistical significance of a variable takingvalue equal to zero for the plants continuing throughout the period and one for theplants exiting the sample between 1996 and 2002 (as Griliches and Regev 1995 didin their Israeli study) This variable is not significantly related to productivity orwages in our sample and therefore does not affect our results
Within continuing plants though the between-plant movement of workers mayadd another bias whose sign is not clear a priori Those workers who choose to stayand continue to work in a given plant instead of engaging in job shopping to improvetheir existing match may be the least entrepreneurial (and possibly the least productive)workers The most able and youngest workers with a greater scope for job-to-job mobilitymay instead be eager to leave the most inefficient firms Hence plant productivitymay appear to decline as a result of the process of job turnover that leaves behindsenior workers rather than being the sheer consequence of declining ability Thereforea negative statistical correlation in a cross-section of plants may not be the result ofskill depreciation of the workforce in each given plant and instead originate from thereallocation effects due to the movement of workers between plants
By the same token the rising part of the seniority-productivity profile may not bethe result of the higher average productivity of expert workers Experienced workersmay well end up in more productive plants as a result of positive sorting seniorworkers may have had the time to sort out plants and choose the best places for work
Our statistical techniques allow us to evaluate the influence of the host of factorsthat may be causing attenuation reverse causation and unobserved heterogeneity Butwe are unable to precisely decompose how much of our results are due to reallocationand how much to skill depreciation Hence we cannot fully deal with this second
AGE SENIORITY AND LABOUR COSTS 139
type of selectivity issues due to workersrsquo reallocation and sorting Yet if one simplyappends hiring and separation rates (lagged by one period to lessen reverse causation)in our empirical exercises to be discussed below plant productivity is unrelated tohiring rates and negatively related to separation rates while the statistical significanceof the age-related variables does not change
This is good news for us for it implies that our results are not merely the figmentof specification mistakes Yet given that hiring and separation rates are presumablyjointly determined with productivity and wages we hesitate to interpret our resultsas definite evidence that our correlations are only due to skill depreciation and notworker reallocation
425 Measurement error in value added shares As explained above ourempirical analysis goes in two steps First we numerically calculate productivity fromvalue added data imputing constant industry-specific value added shares of labourand capital and then we relate our productivity index to its likely determinants Theresulting residual is legitimately interpreted as lsquoplant productivityrsquo as long as theassumptions of constant returns to scale and perfect competition are accepted Thismay be hard-to-swallow assumptions that may bias our results in a direction hard totrace a priori As a shortcut we simply re-computed our productivity index withsomewhat higher and somewhat lower value added shares (by plus and minus 10)For brevity we do not report the results of this experiment here Their thrust thoughis that our findings carry over unchanged irrespective of the imputed values of thevalue added shares
Another way of tackling this issue is by directly estimating production or valueadded functions We cannot estimate production functions for our data set does notinclude data on intermediate products We did look however at the partial correlationbetween capital per hour worked and our variables of interest on the one hand andvalue added per hour worked on the other in simple value added regressions that arebased on an idea of two inputs in production labour and capital The estimatedcoefficients for capital per hour worked are statistically significant for plants in the forestindustry and industrial machinery but much lower than the imputed value for theshare of capital in value added (usually about one-third) while they are instead notsignificantly different from zero for electronics9 In any case the statistical significanceof our variables of interest (age seniority experience) and education does not change
43 Main results
The main results of this paper revolve around the questions listed at the end ofSection 2 Is age related to productivity and wages at all Is the seniority effect of age
9 The unavailability of data for the intermediate inputs prevents from carrying out the Levinsohn-Petrin correction for theendogeneity of capital in production function and value added regressions
140 FRANCESCO DAVERI AND MIKA MALIRANTA
on productivity and wages different from the effect of age through the general expe-rience channel Are the effects of age on productivity and wages significantly differentfrom each other and across industries in particular between lsquoaveragersquo and high-techindustries And finally are we capturing causal relations
Our answers to these questions are presented in industry tables Table 4 presentsthe results for the Forest industry Table 5 for Industrial Machinery and Table 6 forElectronics Each table is organized in two sub-tables with the results on the deter-minants of productivity in the upper panel (panel a) and results for wages in the lowerpanel (panel b) In turn each sub-table includes the estimated coefficients for thevariables of interest (age seniority potential experience and education) computed invarious ways for there is no best statistical method to compute them The reportedresults are obtained both averaging data over time (and using Ordinary Least Squares(OLS) and Instrumental Variables (IV) methods of estimation) and also simultane-ously exploiting the cross-section and time series variation in the data with the time-invariant plant-specific unobserved determinants of productivity and wages capturedby fixed effects (FE) But as discussed above cross-section estimates minimize loss ofprecision (attenuation bias) at the cost of enhancing reverse causation unobservedheterogeneity and selectivity biases IV estimates reduce reverse causation and FEestimates tackle unobserved heterogeneity but both (IV and FE) methods often entailsubstantial loss of precision of the estimated coefficients
In any case each table is structured so as to make the results from the various twistsof our statistical exercises easily comparable The list of the additionally includedvariables (potentially important determinants of productivity and wages which arenot the main focus of this paper) is also provided at the bottom of each table
431 Age as such is not related to productivity but is positively correlatedto wages The statistical results in columns [1] and [2] in each table account forat least 50 (with a maximum of 60) of the total variability of plant productivityand wages in the three industries Most of the explanatory power of the estimatedstatistical relations comes however from two groups of variables which do not rep-resent the main focus of this paper but are anyway possibly important determinantsof productivity and earnings education and plant age (more comments below in thenext section)
The main result from columns [1] and [2] is that workforce age per se is unrelatedto plant productivity Age is instead positively related to wages in all of the threeindustries with some evidence of declining effects of age on wages in industrialmachinery So as payroll increases but productivity stays constant it means that afirmrsquos profitability declines with ageing of the firmrsquos labour force
The different pattern of correlation between age productivity and wages bringsabout another related point if wages do not reflect the productivity contribution ofolder workers approximating individually unobserved productivity by wages ndash as sometimesis done ndash may drive one to misleading conclusions
AG
E SE
NIO
RIT
Y A
ND
LA
BO
UR
CO
STS
141Table 4 Statistical analysis of the determinants of plant productivity and wages forest industry
OLS IV Fixed effects
Cross-section Cross-section Panel
[1] [2] [3] [4] [5] [6]
Panel a ProductivityAge 0015 0000
(0154) (0011)Age2 minus0002
(0019)log of tenure 0181 0240 0373+ minus0198
(0305) (0099) (0221) (0122)[log of tenure]2 0017
(0076)Potential experience minus0023 minus0022 minus0031 0019
(0016) (0015) (0025) (0012)Schooling years minus0048 minus0048 minus0067 minus0063 0052 0082
(0082) (0083) (0090) (0086) (0080) (0057)Schooling y (tminus1) minus0014
(0056)Schooling y (tminus2) 0046
(0051)R-squared 0409 0409 0422 0422 0191Adj R-squared 0385 0387 0398 0399 0157 0132R-squared within 0089Observations 365 365 365 365 279 1523Overident test 0813Relevance test 0000Panel b WagesAge minus0025 0025
(0046) (0003)Age2 0006
(0006)
142FR
AN
CE
SCO
DAV
ER
I AN
D M
IKA
MA
LIR
AN
TA
log of tenure minus0173 0112 0425 0136(0085) (0027) (0081) (0030)
[log of tenure]2 0081(0023)
Potential experience 0009 0015 minus0013 0009(0005) (0004) (0009) (0003)
Schooling years 0159 0157 0158 0174 0150 0245(0024) (0024) (0025) (0025) (0033) (0014)
Schooling y (tminus1) 0179(0014)
Schooling y (tminus2) 0096(0013)
R-squared 0520 0517 0565 0546 0532Adj R-squared 0500 0500 0547 0528 0513 0590R-squared within 0670Observations 365 365 365 365 279 1523Overident test 0467Relevance test 0000
Notes Dependent variable is logarithm of plant productivity in panel a and log of wages in panel b Other control variables (results not reported) for models reported in columns[1]ndash[4] include a dummy variable for foreign-owned plant one for plants that disappear in 1996ndash2002 and other dummies for plant vintage groups (6 groups) and size groups(5 groups) In column [5] seniority is instrumented with a set of lagged variables (the average in the period 1990ndash94) They include schooling years potential experiencepotential experience squared seniority and seniority squared In column [5] high p-values (gt 10) for the over-identification test (Hansen J statistics) indicate that the validityof the instruments cannot be rejected and low p-values (lt 01) of relevance test (Anderson canonical correspondence LR statistic) gives indication that the employedinstruments are relevant both in productivity and wage estimations+ p lt 01 p lt 005 p lt 001 p lt 0001
OLS IV Fixed effects
Cross-section Cross-section Panel
[1] [2] [3] [4] [5] [6]
Table 4 Continued
AG
E SE
NIO
RIT
Y A
ND
LA
BO
UR
CO
STS
143Table 5 Statistical analysis of the determinants of plant productivity and wages Industrial machinery
OLS IV Fixed effects
Cross-section Cross-section Panel
[1] [2] [3] [4] [5] [6]
Panel a ProductivityAge 0103 0005
(0079) (0005)Age2 minus0013
(0010)log of tenure 0135 minus0081 minus0035 0077
(0191) (0050) (0114) (0087)[log of tenure]2 minus0062
(0051)Potential experience 0014 0012+ minus0003 minus0014
(0007) (0007) (0011) (0009)Schooling years 0124 0125 0138 0137 0086 0035
(0026) (0026) (0028) (0028) (0028) (0034)Schooling y (tminus1) 0001
(0037)Schooling y (tminus2) 0102
(0036)R-squared 0394 0392 0397 0395 0219Adj R-squared 0378 0377 0380 0380 0193 0212R-squared within 0049Observations 567 567 567 567 348 1717Overident test 0351Relevance test 0000Panel b WagesAge 0105 0015
(0024) (0002)
144FR
AN
CE
SCO
DAV
ER
I AN
D M
IKA
MA
LIR
AN
TA
Age2
minus0012(0003)
log of tenure 0074 minus0012 0097+ 0056(0073) (0017) (0055) (0024)
[log of tenure]2 minus0025(0019)
Potential experience 0017 0016 0008 0003(0002) (0002) (0005) (0002)
Schooling years 0117 0117 0133 0133 0124 0065(0008) (0008) (0008) (0008) (0011) (0010)
Schooling y (tminus1) 0005(0010)
Schooling y (tminus2) 0019+(0010)
R-squared 0470 0454 0457 0455 0437Adj R-squared 0457 0441 0442 0441 0419 0836R-squared within 0871Observations 567 567 567 567 348 1717Overident test 0024Relevance test 0000
Notes Dependent variable is logarithm of plant productivity in panel a and log of wages in panel b Other control variables (results not reported) for models reported in columns[1]ndash[4] include a dummy variable for foreign-owned plant one for plants that disappear in 1996ndash2002 and other dummies for plant vintage groups (6 groups) and size groups(5 groups) In column [5] seniority is instrumented with a set of lagged variables (the average in the period 1990ndash94) They include schooling years potential experiencepotential experience squared seniority and seniority squared In column [5] high p-values (gt 10) for the over-identification test (Hansen J statistics) indicate that the validityof the instruments cannot be rejected and low p-values (lt 01) of relevance test (Anderson canonical correspondence LR statistic) gives indication that the employedinstruments are relevant in productivity but not in wage estimation+ p lt 01 p lt 005 p lt 001 p lt 0001
OLS IV Fixed effects
Cross-section Cross-section Panel
[1] [2] [3] [4] [5] [6]
Table 5 Continued
AG
E SE
NIO
RIT
Y A
ND
LA
BO
UR
CO
STS
145Table 6 Statistical analysis of the determinants of plant productivity and wages Electronics
OLS IV Fixed effects
Cross-section Cross-section Panel
[1] [2] [3] [4] [5] [6]
Panel a ProductivityAge minus0408 0024
(0377) (0026)Age2 0061
(0053)log of tenure 1741 minus0062 2380+ 0937
(0749) (0232) (1443) (0599)[log of tenure]2 minus0549 minus0639+ minus0356+
(0230) (0349) (0184)Potential experience 0028 0030 minus0013 minus0010
(0035) (0036) (0045) (0032)Schooling years 0180 0178 0182 0207 0191 minus0043
(0064) (0064) (0071) (0070) (0055) (0082)Schooling y (tminus1) minus0007
(0090)Schooling y (tminus2) 0182
(0081)R-squared 0301 0290 0320 0291 0308Adj R-squared 0239 0232 0254 0228 0211 minus0203R-squared within 0086Observations 172 172 172 172 98 496Overident test 0258Relevance test 0000Panel b WagesAge minus0046 0019
(0061) (0004)Age2 0009
(0009)
146FR
AN
CE
SCO
DAV
ER
I AN
D M
IKA
MA
LIR
AN
TA
log of tenure 0192+ 0031 0528 0250+(0112) (0044) (0420) (0146)
[log of tenure]2 minus0049 minus0107 minus0068(0033) (0105) (0045)
Potential experience 0016 0016 0008 0020(0006) (0006) (0012) (0008)
Schooling years 0123 0123 0137 0140 0145 0160(0010) (0009) (0011) (0011) (0015) (0020)
Schooling y (tminus1) 0120(0022)
Schooling y (tminus2) 0134(0020)
R-squared 0536 0530 0537 0532 0617Adj R-squared 0494 0492 0492 0491 0563 0493R-squared within 0615Observations 172 172 172 172 98 496Overident test 0001Relevance test 0000
Notes Dependent variable is logarithm of plant productivity in panel a and log of wages in panel b Other control variables (results not reported) for models reported in columns[1]minus[4] include a dummy variable for foreign-owned plant one for plants that disappear in 1996ndash2002 and other dummies for plant vintage groups (6 groups) and size groups(5 groups) In column [5] seniority is instrumented with a set of lagged variables (the average in the period 1990ndash94) They include schooling years potential experiencepotential experience squared seniority and seniority squared In column [5] high p-values (gt 10) for the over-identification test (Hansen J statistics) indicate that the validityof the instruments cannot be rejected and low p-values (lt 01) of relevance test (Anderson canonical correspondence LR statistic) gives indication that the employedinstruments are relevant in productivity but not in wage estimation
+ p lt 01 p lt 005 p lt 001 p lt 0001
OLS IV Fixed effects
Cross-section Cross-section Panel
[1] [2] [3] [4] [5] [6]
Table 6 Continued
AGE SENIORITY AND LABOUR COSTS 147
432 Seniority matters for productivity more often than experience butdifferently in traditional and high-tech industries The discussion inSection 2 invites thinking of why age may (or may not) be associated with productivityIt does so suggesting that the process of human capital accumulation takes placewithin the firm and outside the firm Lumping together the two effects (as implicitlydone in the empirical formulations underlying the results in columns [1] and [2] whereage as such is related to productivity) may obscure that the two forms of humancapital accumulation need not bear the same returns The importance of distinguishingthese two sources of skills in the analysis of productivity effects is emphasized forinstance by Ilmakunnas et al (2004) and Dygalo and Abowd (2005) For example theaccumulation of knowledge that occurs through seniority may be productivity-enhancingwhile the accumulation of human capital that occurs through the acquisition ofoverall labour market experience may not contribute positively In the statistical anal-ysis underlying the results in columns [3]ndash[6] we dropped this restriction We findthat the statistical significance of seniority and potential experience is indeed differentfrom each other This also holds across industries and across estimation methods Theoverall goodness of fit of IV and FE-based specifications drops significantly
In the forest industry as well as in electronics we find that seniority not potentialexperience is positively related to productivity Our formulation (in logs and logssquared so as to obtain the best fit of the data) also implies that the effect of seniorityon productivity depends on its starting level
One additional year of seniority for a freshly hired worker adds to productivity less thanit adds for a senior worker who has spent a considerable number of years within the samefirm In other words there are positive but diminishing returns to seniority In the electronicsindustry the returns to seniority decline so much to become negative beyond a certainthreshold These results are well determined when using the period-averaged cross-sectionof plants and are still there ndash though less precisely measured ndash even when seniority isinstrumented to allow for possible feedback effects from the lagged values In the forestindustry the correlation disappears when the time variation of the data is considered throughfixed-effects estimation while a weaker correlation survives for plants in electronics
In the industrial machinery plants instead potential experience positively corre-lates though at the usual declining rates with productivity Seniority is instead notsignificantly related to productivity in a statistical sense in this industry The patternof partial correlations in this industry is however somewhat statistically weaker thanfor the other industries for they do not survive when other methods of estimationthan the cross-section OLS are employed This is a symptom that our statisticalmodel that links plant productivity to human capital variables is not equally effectivein capturing the determinants of plant productivity in all industries
433 Wage and productivity profiles are dissimilar from each other inelectronics and similar in the other industries In our data set searchingfor wage determinants is a more successful undertaking than searching for productivity
148 FRANCESCO DAVERI AND MIKA MALIRANTA
determinants The line interpolating the data explains more than 50 of the totalvariability of plant wages in the forest industry and in electronics and more than 40of the total in industrial machinery even when the time dimension of the data set isconsidered Among the age-related variables seniority drives wages in forest andexperience drives wages in the industrial machinery industry Notably the seniority-wage profile in the lower panel is not too far apart from the seniority-productivityprofile estimated in the upper panel for the forest industry The same applies toexperience-wage and experience-productivity profiles for industrial machineryalthough it should be kept in mind that as emphasized above the statistical relationis much less precisely measured for the plants in this industry
When it comes to electronics the picture instead changes substantially Wagesdepend positively but to a declining extent on both tenure and experience in thecross-section of plants This result is still there when the time variation of the paneldata set is considered through fixed-effects estimation This correlation is instead notthere when variables are instrumented by their lagged values
We interpret these results as showing that the profiles of wages and productivitywith respect to age-related variables are significantly different from each other inelectronics Wages keep going up though at declining rates with both seniority andexperience while the seniority-productivity profile follows a very different path madeof definite increases when seniority is low and a flattening out which also involvessheer productivity declines as seniority goes beyond a given threshold
44 More results
The statistical analysis underlying Tables 4 5 and 6 also includes some ancillaryresults on the determinants of plant productivity and wages concerning educationand plant age The important implication of these additional results is that the cor-relations between age-related variables productivity and wages (discussed above) donot hinge on the omission of other important determinants of plant productivity andwages Reassuringly education and plant age affect productivity and wages as expectedbut consideration of these additional elements does not cancel our main results
441 Education is positively related to productivity and wages The earningsequations estimated by labour economists routinely include education as an explan-atory variable and make inference as to the rate of return on additional years ofeducation And even the importance of workersrsquo educational levels in determiningplant productivity can hardly be overstated
In our statistical analysis education turns out always positively related to wages inthe three industries with estimated coefficients ranging between 012 and 015 Yetthe estimated coefficient is bigger in forest than in more technologically advancedindustries As to its effects on productivity they seem to be instead ranked in decreas-ing order of the technological level of the industry at hand Education is positively
AGE SENIORITY AND LABOUR COSTS 149
and sizably related to plant productivity in electronics with a bigger coefficient thanin industrial machinery No relation is there for the forest industry
When the time series dimension is considered these effects are present only whenthe delayed values of the explanatory variables are considered instead of the currentones Education is indeed positively associated with productivity with a delay of abouttwo years (the lagged value of education is almost significantly related to productivitythough with a small coefficient even for the forest industry)
Altogether these effects indicate that high-education workers in more advancedindustries are in some way lsquoexploitedrsquo while high-education people in forestry enjoya rent The idea that high-education people accept lower wages possibly in exchangefor a bright future to buy the lottery of working in dynamic plants and industries isconsistent with anecdotal evidence from Finnish newspapers10
442 Newer plants are more productive Another ancillary result underlyingTables 4 5 and 6 is that older plants tend to be less productive than newer plantsThis effect is consistently present for the three industries These results are notreported in the tables for brevity but are anyway singled out and pictured in Figure 1
Figure 1 shows a graphical illustration of productivity and wage effects of plantvintage whereas the horizontal bars indicate the average effects of plant vintage onproductivity (printed light grey) and wages (printed dark grey) with 95 confidenceintervals appended The evidence in the graph points to the marked quantitativerelevance of such effects Younger plants are indeed definitely more productive in allindustries This also holds for wages though the effect is much less marked Theseresults are consistent with the literature briefly surveyed in Box 511
45 Implications of our main results a numerical illustration
If theory and the related empirical findings were to imply that the effect of age-related variables on productivity is always the same irrespective of age seniority orexperience one might easily compute the numerical effect of ageing on productivityThe estimated coefficient would tell us by how many percentage points productivityvaries as a result of a unit change in the age or seniority of a given person (or theaverage age of a typical worker in a given plant)
Unfortunately psychometric studies and the economics of human capital teach usthat the world is more complicated and the effect of age on productivity may changeits sign from positive into negative starting from some threshold age onwards Thisraises the empirical questions of where (at which year of age seniority or experience) this
10 A more academic argument following more or less the same lines is in Moen (2005)11 Maliranta (1999) experimented with alternative capital stock measures (perpetual inventory method vs fire insurance valueof capital stock) They yielded quite similar results for the plant vintage effects More recent Finnish evidence of the plant vintageeffects include Ilmakunnas et al (2004) and Ilmakunnas and Maliranta (2005)
150 FRANCESCO DAVERI AND MIKA MALIRANTA
Figure 1 An illustration of productivity and wage effects of plant vintage
Notes Bars indicate the log difference of total factor productivity and monthly wage with respect to the reference group (plants established in 1976 or earlier) Error bars around the mean bars indicate 95 confidence inter-vals The estimates are from the models presented in column [3] of Tables 4ndash6
AGE SENIORITY AND LABOUR COSTS 151
threshold is Moreover having found that the returns to seniority decline with seniorityor as in electronics actually become negative it remains unclear by how much they decline
Box 5 Old plants old workers productivity and wages
Old-aged firms may be less productive and disproportionately hire old-ageworkers The evidence on the relation between firm age and productivity isnot abundant though Dunne et al (1989) report that manufacturing plantsthat have been in business longer are less likely to close and Brock and Evans(1986) show that older firms are less likely to fail (controlling for plant and firmsize respectively) This may partly explain why older workers tend to stick withthese probably less productive but more financially sound firms
On the other hand it has often been found that older firms pay higher wagesafter controlling for other relevant firm characteristics This is often taken toreflect the quality (and thus the higher productivity) of the workers they hireas well as the working conditions they offer Yet as discussed in the main textthis need not be the case Older firms may pay higher wages to extend fringebenefits such as pensions or health insurance to their most faithful workers ormore subtly because they cannot deny pay raises to people who have devel-oped a good knowledge of the companyrsquos ability to pay throughout the years
Davis and Haltiwanger (1991) find that older manufacturing plants indeedpay higher wages and age remains a significant determinant of wages onceindustry region and size differences are accounted for with and without con-trolling for the probability that the plant will close (usually lower for olderfirms) Troske (1999 Table 1111) reports similar results controlling for employersize and location workers in plants that are less than 5 years old earn nearly20 less than workers in plants that have been in business 15 years or moreBlanchflower and Oswald (1988) find no significant relationship betweenwages and years in operation in British data while Winter-Ebmer (2001) founda positive relation with Austrian data The very careful study by Koumllling et al (2005)shows that in Germany older firms pay on average higher wages for workerswith the same broadly defined degree of formal qualification More recentlyBrown and Medoff (2003) have analysed the relationship between how long anemployer has been in business (firm age) and wages According to their analysisfirms that have been in business longer pay higher wages (as previous studieshave found) but pay if anything lower wages after controlling for workercharacteristics There is some evidence that the relationship is not monotonicwith wages falling and then rising with the number of years in business
Finally regarding evidence with Finnish data Nurmi (2004) finds that oldand large firms are less likely to fail and less sensitive to exogenous shocks thanyoung and small firms
152 FRANCESCO DAVERI AND MIKA MALIRANTA
In this section we employ statistical simulation ndash a quantitative technique thatallows one to describe complicated phenomena in a flexible way (how is described inthe top part of Box 5) ndash to illustrate these issues
The simulation results are then translated out of the jargon using CLARIFY theuser-friendly software developed by Harvard political scientists Gary King MichaelTomz and Jason Wittenberg (King et al 2000 Tomz et al 2003) expressly for deliv-ering the results of the application of even complicated quantitative techniques to awider audience not necessarily trained in statistics but still interested in achieving arather precise knowledge of the quantitative aspects of economic and social issues (seemore details in the bottom part of Box 6)
Box 6 Numerical simulations through CLARIFY
a The issueThe starting point may be a standard multivariate regression exercise wherethe statistical relation between a dependent variable (say productivity) and ahost of potential explanatory variables (say age education and so on) isinvestigated The result of a regression exercise usually consists of quantitativeinformation (lsquoestimated coefficientsrsquo) on the sensitivity of the dependent variableto each of the explanatory variables while holding the other explanatoryvariables constant This piece of information is however subject to varioussources of uncertainty (the statistical model may be wrong or incomplete theavailable information on the explanatory variables may be incomplete as wellsome variables of interest may be outright unobserved) Hence this lsquopartialcorrelationrsquo may thus be more or less precisely estimated If the researcherobtains a precise estimate the quantitative implication of his-her research maybe trusted otherwise not
b Simulation-based approach to interpreting statistical resultsAmong other things numerical (so called lsquoMontecarlorsquo) simulation essentiallyapplies survey sampling techniques to proxy complicated (but presumablymore realistic) mathematical relations and eventually determines how trust-worthy the results of a given regression are In surveys random sampling fromthe population of interest is commonly used to estimate key features (such asmean and variance) of such population with the precision of the estimateincreasing in sample size Simulation essentially follows the same logic to learnabout probability distributions of estimated coefficients not populations In thesame fashion as with real samples approximations can be computed to anydesired level of precision by varying the number of simulations
AGE SENIORITY AND LABOUR COSTS 153
c How statistical simulation works in practice through the software CLARIFYStart from a set of point-wise estimated coefficients of age education and theother variables set out to explain productivity Each of these coefficients has asampling distribution The central limit theorem guarantees that for a largeenough sample one can randomly draw (lsquosimulatersquo) coefficient (lsquoparameterrsquo)values from a multivariate normal distribution with mean equal to the pointestimates of the coefficients and variances equal to the estimated variance andcovariance matrix of the point-wise estimates By random drawing one canobtain a realization of the estimated coefficients on average consistent withtheir point-wise estimates This is the result of one simulation round Thisexperiment can be repeated many times at will (clearly if the coefficient wereprecisely known each draw would be identical) and many values for the esti-mated coefficient of interest computed Each coefficient can then be multipliedby the value of its corresponding explanatory variable (age) The variability inthe values of the simulated coefficients translates in variability (randomness) ofthe expected value of productivity (the dependent variable) while the effectsof the other variables on productivity are held constant at their means
As a result we can compute (and graph) the average partial effect of age onproductivity and also confidence intervals that delimit the degree of trustworthi-ness of such an average To sum up in our case the true relation between age andproductivity is likely complicated for the effect of age on productivity may bepositive or negative depending on age If this is the case describing the resultsof statistical analysis becomes rapidly cumbersome and only imperfectly relatedto the question at hand King et al (2000) have developed a software program(CLARIFY) that without changing any underlying data or statistical assumptionprovides interpretation-friendly and graphical answers to the questions of interest
Figures 2 and 3 are the outputs of CLARIFY and concern respectively theseniority and experience profiles of productivity and wages estimated through OrdinaryLeast Squares from the period-averaged cross-section of plants12 Being OLS cross-sectionalOLS estimates they suffer from many of the biases whose shortcomings have beenextensively discussed above Although precisely tracking the overall direction of thebiases is not easy the reported results likely represent upper bound estimates andthey include both skill depreciation and worker reallocation effects
The statistical simulations underlying Figures 2 and 3 and Table 7 (based on thosefigures) revolve around the multivariate statistical analysis whose point-wise resultsand significance are reported in Table A2 in the appendix To maximize the goodness
12 To compute the necessary confidence intervals CLARIFY requires relatively precisely estimated coefficients be imputed Thisis why we use OLS cross-sectional estimates with the caveats in the main text
154 FRANCESCO DAVERI AND MIKA MALIRANTA
Figure 2 Productivity and wage responses to seniority simulation analysis from estimates in Table A2
Notes See Box 6 for a detailed explanation of how such profiles are constructed
AGE SENIORITY AND LABOUR COSTS 155
Figure 3 Productivity and wage responses to potential experience simulation analysis from estimates in Table A2
Notes See Box 6 for a detailed explanation of how such profiles are constructed
156FR
AN
CE
SCO
DAV
ER
I AN
D M
IKA
MA
LIR
AN
TA
Table 7 Simulations of cumulated productivity and wage responses under various settings
Difference
from to in log of TFP in log of monthly wage
Mean Std err t-value Mean Std err t-value
SeniorityForestSeniority in years 7 17 038 015 260 023 004 581and other variables at their means at their meansMachinerySeniority in years 7 17 000 008 001 002 003 073and other variables at their means at their meansElectronicsSeniority in years 2 6 107 032 331 013 007 183and other variables at their means at their meansSeniority in years 6 10 minus068 020 minus334 minus003 005 minus061and other variables at their means at their meansPotential ExperienceForestExperience in years 15 25 minus040 017 minus233 008 005 169and other variables at their means at their meansMachineryExperience in years 13 20 012 007 177 015 002 776and other variables at their means at their meansElectronicsExperience in years 10 16 minus048 022 minus222 002 005 046and other variables at their means at their meansExperience in years 16 22 049 025 195 012 006 213Other variables at their means at their means
AG
E SE
NIO
RIT
Y A
ND
LA
BO
UR
CO
STS
157
Seniority and experience combinedForestSeniority in years 7 17 minus002 012 minus016 031 004 822and experience in years 15 25and other variables at their means at their meansMachinerySeniority in years 3 10 004 007 053 015 002 662and experience in years 13 20and other variables at their means at their meansElectronicsSeniority in years 2 6 061 029 211 014 005 271and experience in years 10 14and other variables at their means at their meansSeniority in years 6 12 minus069 025 minus277 005 005 106and experience in years 14 20and other variables at their means at their means
Notes Simulations are based on the same regression models (results in Table A2) used for drawing Figures 2ndash3 lsquoMeanrsquo indicates the log difference of productivity (or wage)levels Multiplying the number by 100 provides an approximation of percentage difference in productivity (or wage) levels in the different hypothetical situations For moredetails on how these figures are computed see Box 6
Difference
from to in log of TFP in log of monthly wage
Mean Std err t-value Mean Std err t-value
Table 7 Continued
158 FRANCESCO DAVERI AND MIKA MALIRANTA
of fit of the interpolating line the empirical specification underlying the graphs is moreflexible than those in Tables 4 5 and 6 This boils down to appending more polynomialterms of the same variables to the list of the productivity and wage determinantsin addition to the linear and squared terms present in the tables seen above
In each figure along the vertical axis one reads the marginal response of thedependent variables (logarithms of TFP and wages) to changes in seniority experi-ence and education years measured along the horizontal axis Such responses aredefined over the interval of values taken by each explanatory variable in the industryat hand The thick and dotted lines indicate respectively the average marginalresponse of TFP and wages (with the average taken over the very many potentialvalues of the coefficients of interest) The dot-shaded and line-shaded intervalsaround such estimated average responses represent confidence intervals which pro-vide an indication of the degree of precision of the simulated estimates
451 Seniority profiles (Figure 2) Productivity and wage responses to thecross-section variability in the number of seniority years are very similar to each otherin the forest industry (both growing fast) and in industrial machinery (both essentiallyflat once confidence intervals are taken into account) From the figures reported inthe upper part of Table 7 one learns that moving from a plant with a seniority of 7years for the average worker to a plant with seniority equal to 17 having set the otherdeterminants of productivity to their means results in a productivity increase of 38in the forest industry In electronics the seniority-productivity profile follows a well-defined inverted-U shape while the wage is mildly increasing These trends corre-spond to a swift positive productivity response of cumulated 107 as one shift fromplants with an average worker seniority of two years to plants with worker seniorityequal to six years (with wages going up more moderately) If one moves further byanother four years from plants with seniority equal to six to plants with seniorityequal to ten productivity undergoes a (relative) shortfall of cumulative 68 withroughly unchanged wages These are huge numbers As mentioned in the caveatabove however they are upper bound estimates also inclusive of worker reallocationeffects It should be noted though that very drastic declines in relative productivitylevels with age have been documented for other countries such as France in theliterature (see eg Figure 44 in Productivity Commission 2005)
452 Experience profiles (Figure 3) Productivity and wage responses to thecross-section variability in the years of potential experience are much less preciselyestimated particularly for productivity This may be the result of multi-collinearitybetween experience and seniority which may be at the origin of the initially down-ward sloping response of productivity to experience in the forest industry and inelectronics In industrial machinery one finds instead plausible results with positivewage and productivity responses to experience (with wages and productivity by 15and 12 respectively over 7 years see Table 7) A possible way out is to compute the
AGE SENIORITY AND LABOUR COSTS 159
implied productivity response of both higher experience and seniority (after all if aworker stays with the same plant heshe acquires both experience and seniority atonce) When this is done (see the results in the lower panel of Table 7 lsquoSeniority andexperience combinedrsquo) one finds an essentially flat productivity response to the com-bination of seniority and experience and a moderately positive wage response for acumulated 15 over 7 years of time The combination of seniority and experienceleaves the results for electronics qualitatively unchanged instead When the numberof seniority and experience years is relatively low moving from low-seniority and low-experience plants to high-seniority and high-experience plants corresponds to acumulated productivity increase of about 60 When this is done moving fromintermediate to high levels of seniority and experience the productivity shortfall is ofabout 70 Wages do not follow suit instead but keep going up
46 Summing up and discussion
Our statistical analysis provides a reasonably coherent picture of the empirical rela-tion between age seniority and experience on the one hand and plant productivityand wages on the other in Finland in the years of the IT revolution
At first sight our results seem to support the view that workforce ageing as suchhas adverse effects on labour costs Age is essentially unrelated to productivity whileit is positively correlated with wages As we distinguish the effects of seniority onproductivity and wages from those of general experience though we find that thepicture is more complicated and sharply differs across industries (see Box 7 for a surveyof other studies emphasizing industry differences in productivity and wage profiles)
Box 7 Previous statistical evidence on age seniority experienceproductivity and wages
About 25 years ago Medoff and Abraham (1980 1981) used performanceevaluation to gauge separate information about individual productivity andwage profiles They found that wages do not necessarily reflect productivityBishop (1987) and Flabbi and Ichino (2001) also put together measures ofindividual productivity following the Medoff and Abraham methodology andconfirming their results with other data sets
Hellerstein et al (1999) using US data find that productivity and wagesincrease with age except for the oldest age group in some specifications andtheir patterns are fairly similar Creacutepon et al (2002) use French data andconclude that the relationship of productivity and age follows an inverted U-shape but wage is increasing in age In manufacturing wage increases withskill level but productivity increases even more In non-manufacturing wage
160 FRANCESCO DAVERI AND MIKA MALIRANTA
increases more than productivity as skill levels go up Haegeland and Klette(1999) use Norwegian data and find that productivity and wage increase witheducation and the highly educated go hand in hand by productivity Medium-level potential experience (age minus education years) gave higher productivitythan short experience but with long experience productivity declined althoughstill stayed higher than with short experience Medium-level experience wasunderpaid but the wage premium for long experience corresponded to theproductivity premium They concluded that the wage-experience profile onlypartly reflected the productivity profile
Only a few scholars have looked at cross-industry heterogeneity of produc-tivity and wage responses Aubert and Creacutepon (2004) estimated average earn-ings relations for France and found evidence of declining productivity after theage of 55 but they found that the age-productivity profile (as captured by suchearnings functions) does not differ much across industries In contrast Aubertet al (2004) estimated labour demand curves by using wage bill shares condi-tioned on value added as well as old and new economy capital they did findsignificant evidence that innovative firms and work-practices present lowerwage bill shares
The same result seemingly applies within occupational groups for othercountries Similarly to our findings here Neuman and Weiss (1995) found thatearnings peaks are located earlier in age in the high-tech sector Hellersteinand Neumark (1995) using Israeli data find that earnings and productivityprofiles are fairly similar for the relatively less skilled workers (the group thatcovers most of the workforce)
Other studies have in turn found that the relation has changed over timeThe seniority-wage profile has seemingly become steeper and its peak movedforwards in Denmark as a result of the decentralization of wage determination(Bingley and Westergaard-Nielsen 2003) Eriksson and Jaumlntti (1997) found thatin 1971 the peak of the wage profile was at the age group 35ndash39 years but hasthen moved forward being at the age group 45ndash49 years in 1990 in Finland
Finally a host of previous studies indeed highlights the productivity-enhancingrole of worker mobility between plants The mobility of workers has anadditional important productivity effect that goes beyond the lsquowithin firmrsquoeffect discussed above and examined in this paper lsquoChurningrsquo of plantsfirms(ie simultaneous entries and exits) has been found to have a dominant role inindustry productivity growth Thanks to this mechanism a workerrsquos produc-tivity may improve greatly when she moves from a low productivity plantfirmto a high productivity plantfirm (Foster et al 2001 Disney et al 2003) Withthe data from the Finnish manufacturing sector Maliranta (2003) finds that theaverage productivity growth rate of the plants is typically 50ndash70 of the industry
AGE SENIORITY AND LABOUR COSTS 161
productivity growth rate which is due to the fact that entries but especially exitsand the reallocation of labour and capital between the continuing plants have animportant role to play as well This gap between industry and plant productivitygrowth has been particularly pronounced in the Finnish electronics industrysince the latter part of the 1980s but has also been substantial for instance inthe textile and wearing industry during the latter half of the 1980s and in the basicmetal industry during the latter half of the 1980s and the first half of the 1990s
Returns to seniority are usually positive but declining with the level of seniority inthe forest industry plants about the same applies to earnings profiles Similar consid-erations hold for the productivity and wage effects of general experience in industrialmachinery although the estimated relation is statistically less solid The similarity ofthe productivity and wages responses to the accumulation of human capital indicatesthat in lsquoaveragersquo industries skill depreciation does not seemingly lead to higherlabour costs And given that these industries are still quantitatively important in theFinnish economy wage-productivity misalignments cannot be the main explanationfor the bad labour market performance of the elderly in Finland
The picture is quite different for the high-tech plants In electronics ndash the industrywhere people are exposed to rapid technological and managerial changes ndash theresponses of plant productivity and wages to seniority are very different from eachother The seniority-productivity profile shows a positive relation first and then negativeas one looks at plants with higher average seniority while wages instead keep goingup with seniority13 This holds for plants with similar education plant age and sizeand other conditions and is thus not related to plant differences in these other respectsHow negative the productivity returns to seniority may become cannot be said withcertainty Numerical simulations based on our OLS cross-sectional results indicatethat the change of sign in the seniority-productivity profile may be pronounced
Altogether our results are consistent with the idea that fast technical change bringsabout accelerated skill depreciation of senior workers We cannot honestly rule outhowever that our correlations may also be the result of worker movements acrossplants The negative correlation between seniority and productivity may in fact alsoreflect the reallocation away of younger (and more productive) workers who leavebehind older plants attracted by the career prospects offered in newly born high-productivity firms and plants14 We cannot precisely quantify the relative importance
13 This is not too surprising as recently discussed at length by Uusitalo and Vartiainen (2005) the combination of highlycentralized collective agreements with relatively autonomous but still highly unionized industry wage setting has resulted in avery low weight (44 on average) given to performance-related firm-level corrections of wages14 Evidence on the importance of reallocation for productivity purposes was indeed provided by Ilmakunnas et al (2005) for theFinnish manufacturing sector where it was shown that the churning of workers (ie simultaneous hiring and separation ofworkers within a plant) speeds up plant productivity growth while holding back seniority
162 FRANCESCO DAVERI AND MIKA MALIRANTA
of the two effects in our statistical analysis Both skill depreciation and worker reallo-cation appear to affect the relation between seniority and productivity in the Finnishhigh-tech industry
It looks as though the deferred compensation hypothesis perhaps amended withthe insights from sorting and matching theories fits better the labour market facts inhigh-tech industries than the human capital hypothesis Yet the evidence for thelsquoaveragersquo industries is not consistent with this hypothesis This is an open issue thatwe briefly discuss further in the concluding section
5 CONCLUSIONS
We started this paper asking ourselves whether we could explain the weak labourmarket position of older workers The simultaneous presence of a relatively aged ndashand still rapidly ageing ndash workforce and a major external shock (such as the ITrevolution of the late 1990s) makes Finland a nice experiment to address this questioninvestigating the diverse responses of wages and productivity to age seniority andexperience patterns across industries
Our results do not indicate that age as such is responsible for the bad labourmarket outcomes of the elderly The differential effect of seniority and experienceon productivity and earnings is minor for two of the three Finnish manufactur-ing industries (the lsquoaveragersquo ones) we chose to analyse These productivity andwage patterns probably reflect the relatively more valuable role of tacit knowledgein traditional industries Productivity and wage profiles differ just in electronicsnot in the other industries We interpret this as implying that exposure torapid technological and managerial changes seems to make a difference for plantproductivity less so for wages for the high-tech plants Yet this productivity-wage discrepancy is not associated with age but rather with seniority hence with avariable which can be affected by individual and policy decisions to a greater extentthan age that is largely exogenous for the individual (though not for the plantmanager)
In the end our results give support to at least two important policy implicationsFirst the similar shapes of productivity and wage profiles in lsquoaverage industriesrsquoindicate that the weak labour market performance of older workers in Finland is notbecause they are a burden for the average firm in the economy Leaving high-techplants aside the bad labour market outcomes of the elderly in the rest of the economyare presumably driven by two other causes such as discriminatory attitudes on theemployer side and public incentives schemes easing the way towards early retirementTo ameliorate the labour market performance of the elderly policy should addressthese issues Second higher seniority is instead associated with higher labour costs inhigh-tech plants This is consistent with the anecdotal evidence from Wal-Mart andEricsson that we have reported It is also consistent with the beliefs ndash entertained bymany Finnish employers ndash that older people could not adapt as easily as younger ones
AGE SENIORITY AND LABOUR COSTS 163
to the arrival of the new technology15 And indeed a survey conducted by the Ministryof Labour in 2002 indicates that as much as 10 of prime-aged workers (and 15of workers above 50) agree that lsquoworkplace discriminates against old workersrsquo16 Inspite of government-mandated media campaigns to counteract such attitudes thepossibility that a negative employer bias against old workers has affected hiring andfiring practices in the late 1990s cannot thus be easily ruled out Our results suggestthat this effect is not present in the Finnish economy at large but mainly in high-techplants
To improve the employability of older workers in these industries public policyshould divert resources away from preserving existing jobs and lend more attentionon the retraining of old workers to ease their reallocation away from less productiveplants (or plants where they have become less productive) into new jobs Some gov-ernments are more worried and more interventionist than others in this respect Inthe last few years for instance the Finnish Government has already embarked on aprogramme (lsquoThe National Programme on Ageing Workersrsquo see OECD 2004 p119) aimed at deferring retirement and in parallel improving the so called lsquoemploy-abilityrsquo of older workers It is unclear however to what extent grand plans maybe effective to bring about a solution to these problems Policies aimed at easingreallocation across plants even within the same industry would probably be a usefulcomplementary tool in this respect
Finally our results are also somehow puzzling in at least one respect They are notfully consistent with any of the existing theories that we know The results for thehigh-tech plants are consistent with the deferred compensation hypothesis and notwith the human capital hypothesis As surveyed in the theoretical section of the paperthe human capital hypothesis would predict a negative discrepancy in plants with anolder labour force where we instead find the opposite results But even the Lazearhypothesis is not fully consistent with our Finnish data because the results found forelectronics are not there for the other industries
This begs the question of why the Lazear model is more relevant in high-techplants than in the other plants One possibility is that productivity is less easilyobservable in high-tech industries This would make the asymmetric informationmechanism envisaged by Lazear more sensible in those industries This explanationwould probably do if our results were there for plants producing immaterial lsquoweight-lessrsquo services whose output is typically hard to measure Our discussion here insteadconcerns plants producing lsquoconcretersquo manufacturing goods for which productivitymis-measurement is presumably a less serious concern An alternative possibility is
15 Juuti (2001) reports that young line managers with a good educational background often harboured prejudice against theability of older workers to cope with new things This is potentially important for hiring and firing practices Althoughdiscriminating attitudes are rarely shared by top-level managers recruitment decisions happen to be taken by the mid-managementlevel16 Kouvonen (1999) reports somewhat lower figures with a 5 share of people above 45 having experienced age at discrimi-nation at work for the average firm
164 FRANCESCO DAVERI AND MIKA MALIRANTA
that seniority being the other side of impeded resource reallocation is particularlydamaging in industries where changes ndash requiring flexibility and ability to quicklyadapt ndash come about all the time Hence the adverse consequences of seniority mani-fest themselves in these industries and less so in other industries where changes aresmoother Under these circumstances a less mobile ageing workforce might constitutean impediment to productivity growth of firms and their plants To the extent thatlow productivity (and low immobility) is a consequence of declining ability to inces-santly adopt new technologies due to weak basic education public policy should focuson efforts to increase the quantity and improve the quality of the adult education Ifhowever the main reason for staying still too long is not the inability of older workersto adopt new technologies policy-makers should seek ways to encourage the mobilityof the ageing workforce to maintain the scope for continued productivity enabled bylearning-by-doing Greater mobility of workers might also facilitate the diffusion oftechnologies and thereby speed up productivity growth of the firms ndash and stimulatinglsquocreative destructionrsquo (ie productivity-enhancing churning of plants and firms withinindustry) to boot
Finally how special are our results Insofar as the use of ICT will spread to otherindustries in the years to come it can be expected that the productivity patternsobserved in electronics will emerge in other industries in the future The findings forelectronics may be foretelling more general developments in the other industries ofthe Finnish economy ndash and possibly other economies For sure in a world whereinnovation forces as opposed to catching up forces have become the key engine ofgrowth (see Acemoglu et al 2003 and the Sapir Report 2004) companies andgovernments will be more and more involved in such problems as the ones discussedin this paper
Discussion
Wendy CarlinUniversity College London and CEPR
Four facts about the advanced economies provide the motivation for this paperthe poor labour market performance of older workers (unemployment and employ-ment rates) the ageing of the labour force evidence measured in surveys of a declinein physical and mental performance at higher ages and finally the change in industrystructure toward lsquohigh techrsquo industries This raises the question of whether theemployability of older workers declines because they become too costly (diminishingproductivity is not compensated by lower wages) and whether this is especiallymarked in high-tech sectors of the economy The authors of this paper do not findevidence supporting either of these hypotheses in their data from three Finnishmanufacturing industries However their findings suggest that there is a hump-shaped
AGE SENIORITY AND LABOUR COSTS 165
relationship between a measure of productivity and the seniority (not age) of workersin plants in the high-tech industry in their sample electronics There is no corre-sponding pattern for wages This is interpreted as signalling a potential problem inthe matching of workers to jobs in industries with rapid technological progress in thecontext of constraints on worker mobility (eg costs of firing)
Channels through which ageing can affect economic performance are the averagequality of the direct labour input the effect on capital deepening because of theimplications of ageing for private and public saving and its impact on technologicalprogress (new ideas and diffusion) Older people may be less creative entrepreneurialand risk-taking and the depreciation of their skill set may imply less adaptation anddiffusion of new knowledge On the other hand an ageing population may createbigger incentives for labour and memory saving innovation
In order to evaluate the economic impact of age-related variables it is essential tospecify whose perspective we are taking From the perspective of workers the decisionis whether to remain in their job to search for a new one to leave the labour forceor to invest in (re)training And the key question is how age and or seniority affectwage and employment prospects as well as training opportunities within and outsidethe firm For firms the question is how age or seniority affects the profitability ofexisting production and the firmrsquos investment in human and physical capital and ininnovation What are the constraints on the wage structure they can deploy and onfiring From the perspective of a policy-maker concerned with welfare the questionis the impact of age-related variables on total factor productivity and the role ofpolicy-related barriers to the reallocation of workers training and early retirementprogrammes
In this paper Daveri and Maliranta take one slice of this question focusing on theimpact of age-related variables on the quality of direct labour input
bull How are productivity and wages related to age structure and seniority at theplant level in manufacturing
bull Does this relationship vary according to the innovativeness or technology inten-siveness of the industry
To answer these questions it is necessary to have matched employer-employee dataand a clear contrast in industry characteristics This makes the use of data fromFinland an appropriate choice there is high-quality matched data and looking at theperiod of the late 1990s to the early 2000s provides a nice contrast among thetraditional industry of lsquoforest productsrsquo a neutral one of industrial machinery and ahigh-tech industry electronics
The method is to use plant-level data to estimate an index of total factor produc-tivity and to calculate the average wage Each of these is then used as the dependentvariable in a separate regression for each industry with various combinations of theage-related variables on the right-hand side along with a set of plant-level controlvariables (including years of schooling a dummy for a foreign-owned plant and
166 FRANCESCO DAVERI AND MIKA MALIRANTA
dummies for different vintages of plants including those that exit during the observa-tion period) The age-related variables are worker age seniority (ie years in thecurrent firm) and labour market potential experience (age minus age when completedlast qualificationdegree) averaged for workers in each plant It is somewhat odd thatTFP is the productivity variable of choice when an initial motivation was the impactof age-related variables on firm profitability via labour costs which suggests that it islabour productivity that is relevant not TFP17
Neither age nor age squared is ever significant in a productivity regression Inelectronics but in neither of the other industries there is a positive coefficient onseniority and a negative coefficient on the squared term in seniority This says thatwhen looking across plants TFP initially rises as the average tenure of workers in theplant goes up but then falls in plants with higher levels of average seniority Theeffects of age-related variables on wages are mainly (but not always) positive in forestproducts hump-shaped for age (but with no robust tenure effects) in machinery andpositive for age and weakly positive for tenure and experience in electronics
The authors conclude that it is not age per se but seniority that affects TFP andthat this effect is found only in the high-tech sector electronics In order to make theirresults more easily interpretable they estimate modified versions of their equationsand produce graphs showing the average partial effect of the variable of interestFrom these equations they calculate the effect on TFP of a change in for exampleseniority As acknowledged by the authors the estimate that plant productivitydoubles when average seniority of the workforce goes from 2 to 6 years and then falls bytwo-thirds as average seniority goes from 6 to 10 years is very large My main concernwith this central result in the paper is that it may reflect the dynamics of a rapidlygrowing industry rather than the inherent characteristics of long-tenure workers inelectronics
In electronics a plant where the average tenure is six years is estimated to be atthe lsquoturning pointrsquo from rising to falling TFP As Table A1 shows the mean tenurein the sample for electronics plants is six years which reflects the rapid growth of theindustry it is 11 years and 9 years respectively in the forest products and machineryindustries The likely role of industry dynamics in generating tenureproductivityprofiles of the kind shown in the paper can be illustrated by a simple example If weassume that initially there are three industries F M and W with identical plants interms of TFP age and seniority structure In particular we assume there is no causallink from the average age or seniority of workers in a plant to the plantrsquos TFP Wenow introduce a different demand shock for each industry a negative demand shockfor industry F no change for M and a positive shock for E We assume that there isunobserved heterogeneity in managerial ability across plants As a consequence of the
17 TFP is calculated using a simple growth accounting framework with the assumption of a constant labour share (WLY ) Ifthe aim is to test whether seniority or ageing affects labour costs which are measured by the ratio of wages to labourproductivity then this is perhaps not an ideal choice
AGE SENIORITY AND LABOUR COSTS 167
differential demand shocks and assuming there are costs of entry and exit we willobserve disequilibrium in the F and E industries Good managers in E will expandoutput increase hiring and raise TFP relative to other plants in E Since hires havezero seniority average seniority in these expanding higher TFP plants will fall lowerseniority is associated with higher TFP but by assumption this is independent of anyrelationship between individual human capital (and TFP) and tenure Similarly goodmanagers in F identify the decline in their industry earlier and cease hiring soonerwith the result that higher TFP firms end up with on average longer tenure workersThis produces a positive relationship between seniority and TFP in the lsquodecliningrsquoindustry and a negative relationship in the lsquoexpandingrsquo industry In the industrywhere there is no shock there is no relationship This pattern is consistent with thecontrast between the three industries shown in Figure 2 of the paper18
Figure 4 provides some illustrative data showing that employment grew in telecom-munications equipment and shrank in forest products over the time period consideredin the paper
18 A similar story could be told to account for the within firm pattern that is shown in column [6] of Table 6 Using fixed effectsestimation the relationship between changes in TFP over time and in the age-related variables is uncovered controlling fortime invariant characteristics of plants such as managerial quality A similar although a much weaker hump-shaped relationshipbetween TFP and seniority is reported If we now assume that a new higher TFP technology emerges in electronics during theperiod of observation but not in forest products production in electronics becomes more profitable and each firm expands Theincrease in hiring reduces seniority and we associate a within-firm rise in TFP with a fall in seniority
Figure 4 Contrasting industry dynamics in Finland 1995ndash2002
Note Telecommunications equipment = ISIC322 Mechanical engineering = ISIC29 Forest products =ISIC20+21
Source Groningen Growth and Development Centre 60-Industry Database October 2005 httpwwwggdcnet updated from OrsquoMahony and van Ark (2003)
168 FRANCESCO DAVERI AND MIKA MALIRANTA
The authors undertake a number of tests to check the robustness of their resultsbut they are not able to separate out the possible impact of industry dynamics drivenby exogenous demand or technology shocks from the causality of seniority producinga change in efficiency that they seek to identify Another approach to identifying suchan effect would be to focus on those who switch jobs The DaverindashMaliranta storyimplies that in electronics longer tenure workers are worse substitutes for otherwiseequivalent workers than is the case in the other two industries This suggests that theyshould get a bigger wage cut if they switch jobs as compared with similar workers inone of the other industries19
Hence although the results in the paper are suggestive I think further investigationis required before we can be confident that there really is a causal link of policy-relevant magnitude in a high-tech industry from seniority (longer tenure in a givenfirm) to lower TFP
Rudolf Winter-EbmerUniversity of Linz Institute for Advanced Studies (IHS) Vienna and CEPR
Daveri and Maliranta have produced a very interesting paper on the impact of ageand seniority on wages and productivity in Finland The main idea is that the effectsof ageing on firm productivity are very different in traditional industries as comparedto high-tech or information technology industries (electronics in their empirical analysis)Psychometric studies have shown that physical cognitive and verbal abilities havedifferent age gradients whereas physical and cognitive skills such as mathematicaland logical skills decay pretty fast organizational and verbal skills show no particularageing pattern at all (Skirbekk 2003) Daveri and Maliranta argue that ageing of theworkforce is more problematic in high-tech industries because of a faster technicalchange faster changes in production technologies and faster product developmentWhile most psychometric and other studies relate to age as such Daveri andMaliranta concentrate their argument on the impact of job tenure within a particularfirm while there is no difference between the productivity-experience and wage-experience paths in the electronics industry ndash nor in the machinery industry by theway ndash there is a significant divergence in the development of productivity and wagesas seniority in a firm increases This pattern cannot be seen in more traditionalindustries like forestry and machinery
While the general pattern of a higher interdependence between firm senioritytechnology adaptation and learning ndash and in turn productivity ndash in high-tech firmsis sensible the main empirical results seem to be out of line Productivity in electronicsfirms increases by 61 log points in the first 4 years of tenure (in fact from year 2 to
19 Using Finnish data Uusitalo and Vartiainen (2005) report that firm exits and promotions increase earnings up to age 50after which such events do not on average improve a personrsquos relative position Whether this is true of tenure and whether itdiffers across industries would be relevant evidence for the DaverindashMaliranta hypothesis
AGE SENIORITY AND LABOUR COSTS 169
year 6) but decreases in the following 6 years again by 69 log points (see Table 7) Aliteral interpretation of these results would be that workers who stay with their firmsfor more than 6 years lose more than half of their productivity they become such aburden to the firm that everybody would have to be fired otherwise the managerswould be acting completely irresponsibly This is probably not what we are seeing inthese firms
Moreover the measured effect is basically a product of a simple OLS cross-sectionregression it is much reduced and less well statistically determined if other methodsor data are used Some other possible explanations come to my mind which couldhave produced such an outcome The data relate to mean characteristics of theworkforce such as mean age and mean tenure of workers As the IT boom in Finlanddid not start before the mid 1990s I suspect that there are not many firms with meantenure of its workforce of more than 7 years ndash and if they exist they might be fairlydifferent firms with a different technology and firm organization As Daveri andMaliranta correctly state the causal impact of mean tenure on productivity cannotbe properly distinguished from matching and selection problems it is by no means acoincidence that some workers stay with the firm longer others donrsquot it is no coin-cidence why some firms stick to their complete workforce longer or to phrase itdifferently why workers want to stay longer with a particular firm Good workers staywith good firms and vice versa All these matching arguments make the strong pointthat a simple correlation between job seniority and productivity will be an upwardbiased estimate of the real causal effect of job seniority on productivity Relatedlabour economics studies on the causal effect of seniority on wages come to theconclusion that OLS estimates overestimate the true causal effect by a factor betweentwo and four (Topel 1991 Altonji and Shakotko 1987)
It has to be said though that finding convincing estimates of the relation betweenfirm employment structure and productivity is very difficult simple fixed effectsmodels using variation in the composition of the workforce over time to determine thevariation of productivity fall again prey to the criticism of reverse causality why doand how can firms change the composition of their workforce Only by changingrecruitment and lay-off policies policies which are obviously related to past andexpected productivity While the causal impact is very difficult to establish in suchstudies any work in this direction using new data sets is very interesting Furtherimportant questions come to my mind for instance concerning inter-firm mobilitywithin the industry which seems to contribute to productivity growth throughout theindustry (Parent 2000) It seems that inter-firm mobility is higher in the high-techsector which could contribute to explain the diverging pattern between seniority-productivity and experience-productivity profiles Another important issue concernswage-setting schemes If indeed high-tech sectors have a higher prevalence ofdeferred payment schemes like stock options or profit sharing in some sort or theother the relation between age or tenure and wages would be steeper and the diver-gence between wage and productivity development would shrink
170 FRANCESCO DAVERI AND MIKA MALIRANTA
The personnel economics and firm organization literature has also stressed com-plementarities in the composition of the workforce a good mix of old and youngworkers might be better for firm productivity than employing only young or only oldworkers (Lazear 1998 Grund and Westergaringrd-Nielsen 2005) It might be interestingto see whether these results hold also in the high-tech industry Such an analysiswould require looking at the age and tenure composition of the workforce in moredetail by using the underlying micro data
In my view policy conclusions are still difficult to draw from this paper MaybeFinland was not such a good experiment in this respect because its high-tech sectorhad an explosive growth after 1995 which is too short and too turbulent a period todraw firm conclusions about the effects of firm seniority and the like Replicating thestudy for another country with a more smooth development of its high-tech sectormight be a welcome complement
APPENDIX DATA SET AND VARIABLE DESCRIPTION
Similarly to the other Nordic countries Finland is endowed with a rich register dataof companies plants and individuals (see Statistics Denmark et al 2003) The uniqueidentification codes for persons companies and plants used in the different registersform the backbone of the Finnish administrative register network and the Finnishstatistical system whereby different sources of information can be integrated conven-iently for various statistical purposes20 By using this system Statistics Finland hasconstructed the Finnish Longitudinal Employer-Employee Database (FLEED) whichis tailored for various needs of economic research Its most comprehensive anddetailed version is maintained at Statistics Finland It contains information of com-panies plants and individuals Plants are linked to their companies and individualsto their employer plants and companies Data are collected from Business Register(plants and companies in the business sector) Census of Manufacturing (manufactur-ing plants) Financial Statements Statistics (companies in the business sector) RampDsurvey and ICT survey (companies in the business sector) and Employment Statistics(individuals aged between 16 and 69 years) These data include a wide variety ofdetailed information on these units A large proportion of variables are available from1990 to 2002 These data cover essentially the whole target population of companiesplants and individuals Due to confidentiality concerns outside researchers do nothave direct access to it For the outside researchers Statistics Finland has constructeda separate version of it The variable set is more limited and some of the categoricalvariables are broader (many industries are combined for example)
This paper employs plant level information for plants and workforce Productivitymeasures plant age plant size originate from the Census of Manufacturing We donot have information of the levels of value added hours worked or capital stock as
20 Data sources and linking of them is described in greater detail in Ilmakunnas et al (2001) and Maliranta (2003)
AG
E SE
NIO
RIT
Y A
ND
LA
BO
UR
CO
STS
171
Table A1 Descriptive statistics of data on plants by industry plant averages in 1995ndash2002
Variables Forest industry Machinery industry Electronics industry
Mean Sd p5 Median 95p Mean Sd p5 Median 95p Mean Sd p5 Median 95p
Log of TFP index 180 074 088 166 328 283 059 208 272 400 227 104 099 205 458Log of monthly wage (in euros)
761 024 723 759 802 769 019 736 769 800 765 023 727 767 803
Schooling years 110 04 103 110 117 116 09 106 114 136 122 12 106 119 145Age in years 396 38 333 401 450 393 40 318 398 450 356 38 294 358 416Potential experience in years
216 39 151 221 271 207 42 131 211 269 164 40 93 166 225
Seniority in years 109 56 26 108 195 92 48 27 89 175 63 33 21 53 1269
Proportion ()
Proportion ()
Proportion ()
Plant birth before 1977 570 3457 2791Plant birth 1977ndash1980 63 847 756Plant birth 1981ndash1985 55 688 407Plant birth 1986ndash1990 107 1658 2326Plant birth 1991ndash1995 99 1887 1977Plant birth 1996ndash 107 1464 1744Plant size 5ndash9 persons 18 314 317Plant size 10ndash19 persons 90 1020 685Plant size 20ndash49 persons 309 4108 3351Plant size 50ndash99 persons 217 2056 2065Plant size 100ndash persons 367 2502 3581Foreign-owned plant 62 1986 1295Plant death during 1996ndash2002
118 1922 2209
Number of plants 365 567 172
Notes The data are constructed in the Research Laboratory of Statistics Finland by linking the plants in the Finnish Manufacturing Census and individuals in the EmploymentStatistics with plant codes
Source Authorsrsquo own calculations
172FR
AN
CE
SCO
DAV
ER
I AN
D M
IKA
MA
LIR
AN
TA
Table A2 Statistical analysis behind the simulation graphs between plants estimation
Forest TFP
Forest wage
Machinery TFP
Machinery wage
Elect TFP
Elect wage
Schooling years minus3386 minus0073 0826+ 0182 1481 0310(2491) (0815) (0470) (0140) (1294) (0210)
[Schooling years]2 1503 0095 minus0285 minus0020 minus0511 minus0070(1113) (0368) (0194) (0057) (0524) (0084)
Potential experience 1017 minus0014 0171 0082+ minus0785 0007(0371) (0118) (0151) (0044) (0616) (0110)
[Potential experience]2 minus0513 0021 minus0072 minus0024 0364 minus0012(0187) (0057) (0081) (0022) (0390) (0071)
[Potential experience]3 0081 minus0005 0010 0002 minus0047 0005(0030) (0009) (0014) (0004) (0078) (0015)
Seniority in years minus0013 minus0003 minus0045 minus0020 1276 0131(0086) (0027) (0054) (0018) (0272) (0062)
[Seniority in years]2 0070 0012 0033 0022 minus1665 minus0161+(0081) (0026) (0056) (0017) (0365) (0083)
[Seniority in years]3 minus0025 minus0000 minus0008 minus0007 0622 0061+(0022) (0007) (0017) (0005) (0153) (0034)
Plant birth in 77ndash80 0237 0003 minus0051 0019 minus0088 minus0027(0119) (0032) (0066) (0029) (0154) (0044)
Plant birth in 81ndash85 0247 0059 0057 0014 minus0210 0032(0117) (0041) (0079) (0021) (0257) (0043)
Plant birth in 86ndash90 0658 0040 0255 0013 0094 0019(0104) (0027) (0057) (0018) (0209) (0046)
Plant birth in 91ndash95 0575 0026 0432 0083 0680 minus0012(0144) (0037) (0060) (0017) (0232) (0042)
Plant birth in 96ndash 0969 0052 0629 0077 0677 0029(0196) (0037) (0088) (0025) (0286) (0052)
R-squared 0545 0647 0486 0516 0527 0581Adj R-squared 0510 0620 0461 0493 0442 0505Number of plants 365 365 567 567 172 172
Notes Other control variables include dummies for plant size (5 groups) foreign-ownership and death during 1996ndash2002 Robust standard errors are shown in parentheses+ p lt 01 p lt 005 p lt 001 p lt 0001
AGE SENIORITY AND LABOUR COSTS 173
such but we do have the ratio of value added to the number of hours worked (bywhich we identify labour productivity) and the capital stock per hour worked (ameasure of the capital-labour ratio) The capital stock measure is calculated throughthe perpetual inventory method (for more details see Maliranta 2003)
Since 1995 (our main period of analysis) all plants owned by firms that employ noless than 20 persons are included Therefore since 1995 the data also include thevery small plants of multi-unit firms but on the other hand the plants of smallsingle-unit firms are left outside Some plants are dropped from the sample becauseof failure of linking some plants in the Manufacture Census to other sources ofinformation Thanks to the link between Census of Manufacturing and EmploymentStatistics we have information about plant workforce This includes the averagepotential experience (the number of years after the last completed degree) seniority(the number of years spent working in the current company) and the number ofschooling years (usually needed for the degree) The labour characteristics of theplants are computed in Statistics Finland by using the comprehensive version of thedatabase About 80ndash90 of individuals can be linked to their plants so that ourvariables should be measured with a reasonable accuracy In the analysis we havealso dropped some outliers21
REFERENCES
Acemoglu D P Aghion and F Zilibotti (2003) lsquoVertical integration and distance to frontierrsquoJournal of the European Economic Association 1(23) 630ndash38
Ali-Yrkkouml J L Paija C Reilly and P Ylauml-Anttila (2000) Nokia A Big Company in a SmallCountry ETLA The Research Institute of the Finnish Economy Series B162 Helsinki
Altonji JG and RA Shakotko (1987) lsquoDo wages rise with job seniorityrsquo Review of EconomicStudies 54 437ndash39
Aubert P and B Creacutepon (2004) Age Salaire Et Productiviteacute La Productiviteacute Des Salarieacutes Deacutecline-T-Elle En Fin De Carriegravere Technical report Mimeo Economie et Statistiques
Aubert P E Caroli and M Roger (2004) New Technologies Workplace Organisation and the AgeStructure of the Workforce Firm-Level Evidence INSEE Paris
Autor DH F Levy and RJ Murnane (2003) lsquoThe skill content of recent technologicalchange An empirical explorationrsquo Quarterly Journal of Economics 118(4) 1279ndash333
Becker GS (1962) lsquoInvestment in human capital A theoretical analysisrsquo Journal of PoliticalEconomy 70(5 Part 2 Investment in Human Beings) 9ndash49
Bingley P and N Westergaard-Nielsen (2003) lsquoReturns to tenure firm-specific human capitaland worker heterogeneityrsquo International Journal of Manpower 24(7) 774ndash88
Bishop J (1987) lsquoThe recognition and reward of employee performancersquo Journal of LaborEconomics 5(4) s36ndashs56
Blanchflower DG and AJ Oswald (1988) lsquoInternal and external influences upon pay settle-mentsrsquo British Journal of Industrial Relations 26(3) 363ndash70
Brock WA and DS Evans (1986) The Economics of Small Business Holmes amp Meier NewYork
Brown C and JL Medoff (2003) lsquoFirm age and wagesrsquo Journal of Labor Economics 21(3) 677ndash97
21 In the estimation some extreme outliers are removed from the regression analysis Identification has been carried out byusing the method of Hadi (1992 1994) The variables used in this procedure are the log of labour productivity the log ofmonthly wage the log of capital intensity schooling years and potential experience Overall a couple of percentages of plantswere dropped for being deemed outliers
174 FRANCESCO DAVERI AND MIKA MALIRANTA
Creacutepon B N Deniau and S Peacuterez-Duarte (2002) Wages Productivity and Worker Chara-cteristics A French Perspective January INSEE httpwwwcrestfrpagepersocreponCreponDeniauPerezDuarte2002pdf
Daveri F and O Silva (2004) lsquoNot only Nokia What Finland tells us about new economygrowthrsquo Economic Policy 19(38) 117ndash63
Davis SJ and J Haltiwanger (1991) lsquoWage dispersion between and within US manufactur-ing plants 1963ndash86rsquo Brookings Papers on Economic Activity Microeconomics 1991 115ndash80
Disney R J Haskel and Y Heden (2003) lsquoRestructuring and productivity growth in UKmanufacturingrsquo Economic Journal 113(489) 666ndash94
Dunne T MJ Roberts and L Samuelson (1989) lsquoThe growth and failure of US manu-facturing plantsrsquo Quarterly Journal of Economics 104(4) 671ndash98
Dygalo NN and JM Abowd (2005) lsquoEstimating experience-productivity profiles from earn-ings over employment spellsrsquo unpublished manuscript 27 November
Eriksson T and M Jaumlntti (1997) lsquoThe distribution of earnings in Finland 1971ndash1990rsquoEuropean Economic Review 41(9) 1763ndash79
Flabbi L and A Ichino (2001) lsquoProductivity seniority and wages New evidence from per-sonnel datarsquo Labour Economics 8(3) 359ndash87
Foster L J Haltiwanger and CJ Krizan (2001) lsquoAggregate productivity growth Lessonsfrom microeconomic evidencersquo in CR Hulten ER Dean amp MJ Harper (eds) NewDevelopments in Productivity Analysis (pp 303ndash63) University of Chicago Press Chicago
Griliches Z (1995) lsquoRampD and productivity Econometric results and measurement issuesrsquo inP Stoneman (Ed) Handbook of the Economics of Innovation and Technological Change (pp 52ndash89)Blackwell Publishers Ltd Oxford
Griliches Z and V Ringstad (1971) Economics of Scale and the Form of the Production FunctionNorth Holland Amsterdam 1971
Griliches Z and H Regev (1995) lsquoProductivity and firm turnover in Israeli industry 1979ndash1988rsquo Journal of Econometrics 65 175ndash203
Grund C and N Westergaringrd-Nielsen (2005) lsquoAge structure of the workforce and firm per-formancersquo IZA Working Paper No 1816 Bonn
Hadi AS (1992) lsquoIdentifying multiple outliers in multivariate datarsquo Journal of the Royal Statis-tical Society Series (B) 54 761ndash71
mdash (1994) lsquoA modification of a method for the detection of outliers in multivariate samplesrsquoJournal of the Royal Statistical Society Series (B) 56 393ndash96
Haegeland T and TJ Klette (1999) lsquoDo higher wages reflect higher productivity Educationgender and experience premiums in a matched plant-worker data setrsquo in The Creation and Analysisof Employer-Employee Matched Data (pp 231ndash59) Elsevier Science North-Holland Amsterdam
Hellerstein JK and D Neumark (1995) lsquoAre earnings profiles steeper than productivityprofilesrsquo Journal of Human Resources 30(1) 89
Hellerstein JK D Neumark and KR Troske (1999) lsquoWages productivity and workercharacteristics Evidence from plant-level production functions and wage equationsrsquo Journalof Labor Economics 17(3) 409ndash46
Ilmakunnas P and M Maliranta (2005) lsquoTechnology labour characteristics and wage-productivity gapsrsquo Oxford Bulletin of Economics and Statistics 67(5) 623ndash44
Ilmakunnas P M Maliranta and J Vainiomaumlki (2001) lsquoLinked employer-employee data onFinnish plants for the analysis of productivity wages and turnoverrsquo in T Jensen and AHolm (eds) Nordic Labour Market Research on Register Data (pp 205ndash46) TemaDord NordicCouncil of Ministers Coperhagen
mdash (2004) lsquoThe roles of employer and employee characteristics for plant productivityrsquo Journalof Productivity Analysis 21 249ndash76
mdash (2005) lsquoWorker turnover and productivity growthrsquo Applied Economics Letters 12(7) 395ndash98Juuti P (2001) Ikaumljohtaminen Kansallinen ikaumlohjelma Tyoumlministeriouml JTO-tutkimuksia No 13
HelsinkiKanazawa S (2003) lsquoWhy productivity fades with age The crime-genius connectionrsquo Journal
of Research in Personality 37 257ndash72King G M Tomz and J Wittenberg (2000) lsquoMaking the most of statistical analyses Improving
interpretation and presentationrsquo American Journal of Political Science 44(2) 347ndash61Kouvonen A (1999) Ikaumlsyrjintaumlkokemukset Tyoumlssauml Ja Tyoumlhoumlnotossa Tyoumlpoliittinen tutkimus No 203Koumllling A C Schnabel and J Wagner (2005) lsquoEstablishment age and wages Evidence from
German linked employer-employee datarsquo in L Bellmann O Huumlbler W Meyer and
AGE SENIORITY AND LABOUR COSTS 175
G Stephan (eds) Institutionen Loumlhne Und Beschaumlftigung (pp 81ndash99) Nuumlrnberg httpwwwwisouni-erlangendeforschungforschungsberichteforschungsbericht2005pdf
Lazear EP (1981) lsquoAgency earnings profiles productivity and hours restrictionsrsquo AmericanEconomic Review 71(4) 606ndash20
mdash (1998) Personnel Economics for Managers John Wiley and Sons New YorkMaliranta M (1997) lsquoPlant Productivity in Finnish Manufacturing ndash Characteristics of High
Productivity Plantsrsquo The Research Institute of the Finnish Economy (ETLA) DiscussionPaper No 612 Helsinki
mdash (1999) lsquoFactors of performance by plant generation Some findings from Finlandrsquo in SBiffignandi (ed) Micro- and Macrodata of Firms Statistical Analysis and International Comparison(pp 391ndash424) Physica Heidelberg
mdash (2003) Micro Level Dynamics of Productivity Growth An Empirical Analysis of the Great Leap inFinnish Manufacturing Productivity in 1975ndash2000 The Research Institute of the Finnish Econ-omy (ETLA) Series A 38 (available at httpwwwetlafifiles1075_micro_level_dynamicspdf )Helsinki
Maliranta M and P Rouvinen (2004) lsquoICT and business productivity Finnish micro-levelevidencersquo in The Economic Impact of ICT Measurement Evidence and Implications (pp 213ndash40)OECD Paris
Manning A (2000) lsquoMovin on up Interpreting the earnings-experience profilersquo Bulletin ofEconomic Research 52 261ndash95
Medoff JL and KG Abraham (1980) lsquoExperience performance and earningsrsquo QuarterlyJournal of Economics 95(4) 703ndash36
mdash (1981) lsquoAre those paid more really more productive The case of experiencersquo Journal ofHuman Resources 16(2) 186ndash216
Moen J (2005) lsquoIs mobility of technical personnel a source of RampD spilloversrsquo Journal ofLabor Economics 23(1) 81ndash114
Neuman S and A Weiss (1995) lsquoOn the effects of schooling vintage on experience-earningsprofiles Theory and evidencersquo European Economic Review 39(5) 943ndash55
Nurmi S (2004) Essays on Plant Size Employment Dynamics and Survival Helsinki School ofEconomics A-230 Helsinki
OECD (2003) OECD Science Technology and Industry Scoreboard OECD Parismdash (2004) Ageing and Employment Policies Finland OECD Parismdash (2006) Live Longer Work Longer OECD ParisOrsquoMahony M and B Van Ark (eds) (2003) EU Productivity and Competitiveness An Industry Perspec-
tive Can Europe Resume the Catching-Up Process European Commission Enterprise PublicationsParent D (2000) lsquoIndustry-specific capital and the wage profile Evidence from the NLSY
and the PSIDrsquo Journal of Labor Economics 18(2) 306ndash23Productivity Commission (2005) Economic Implications of an Ageing Australia Research Report
Canberra (httpwwwpcgovaustudyageingfinalreport)Sapir Report (2004) An Agenda for a Growing Europe Oxford University Press OxfordSkirbekk V (2003) Age and Individual Productivity A Literature Survey MPIDR Working Paper
No 2003-028Statistics Denmark Statistics Finland Statistics Iceland Statistics Norway and Statistics
Sweden (2003) Access to Microdata in the Nordic Countries Statistics Sweden OumlrebroTeulings C and J Hartog (1998) Corporatism or Competition Cambridge University Press CambridgeTomz M J Wittenberg and G King (2003) Clarify Software for Interpreting and Presenting
Statistical Results (Version 21) Stanford University University of Wisconsin and HarvardUniversity 5 January Available at httpgkingharvardedu
Topel RH (1991) lsquoSpecific capital mobility and wages Wages rise with job seniorityrsquo Journalof Political Economy 99 145ndash76
Troske KR (1999) lsquoEvidence on the employer size-wage premium from worker-establishmentmatched datarsquo Review of Economics and Statistics 81(February) 15ndash26
Uusitalo R and J Vartiainen (2005) lsquoFinland Firm factors in wages and wage changesrsquounpublished manuscript 9 June
Verhaegen P and TA Salthouse (1997) lsquoMeta-analyses of age-cognition relations in adult-hood Estimates of linear and nonlinear age effects and structural modelsrsquo PsychologicalBulletin 122(3) 231ndash49
Winter-Ebmer R (2001) lsquoFirm size earnings and displacement riskrsquo Economic Inquiry 39(3)474ndash86
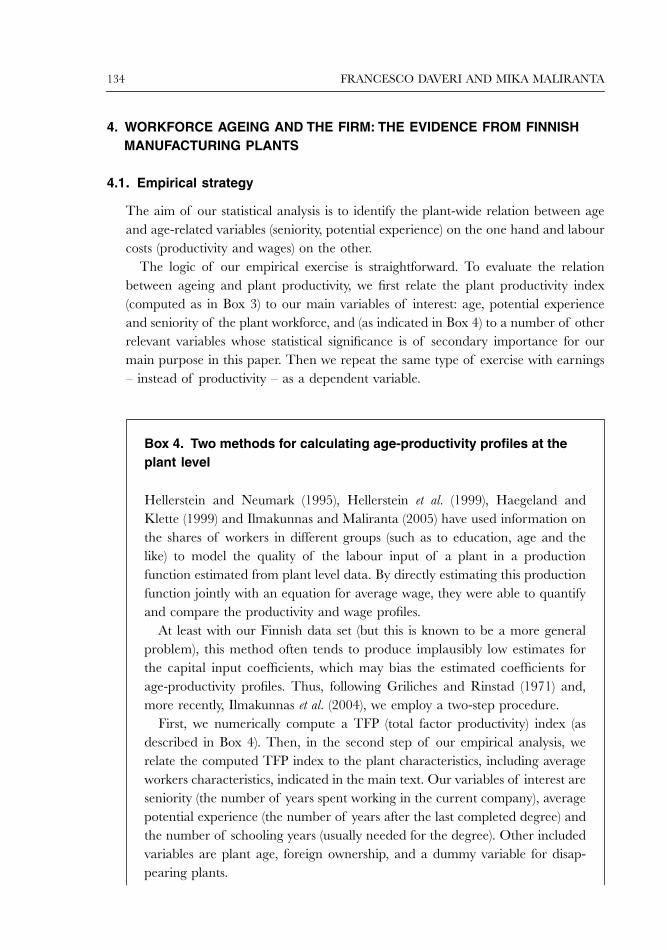

AG
E SE
NIO
RIT
Y A
ND
LA
BO
UR
CO
STS
141Table 4 Statistical analysis of the determinants of plant productivity and wages forest industry
OLS IV Fixed effects
Cross-section Cross-section Panel
[1] [2] [3] [4] [5] [6]
Panel a ProductivityAge 0015 0000
(0154) (0011)Age2 minus0002
(0019)log of tenure 0181 0240 0373+ minus0198
(0305) (0099) (0221) (0122)[log of tenure]2 0017
(0076)Potential experience minus0023 minus0022 minus0031 0019
(0016) (0015) (0025) (0012)Schooling years minus0048 minus0048 minus0067 minus0063 0052 0082
(0082) (0083) (0090) (0086) (0080) (0057)Schooling y (tminus1) minus0014
(0056)Schooling y (tminus2) 0046
(0051)R-squared 0409 0409 0422 0422 0191Adj R-squared 0385 0387 0398 0399 0157 0132R-squared within 0089Observations 365 365 365 365 279 1523Overident test 0813Relevance test 0000Panel b WagesAge minus0025 0025
(0046) (0003)Age2 0006
(0006)
142FR
AN
CE
SCO
DAV
ER
I AN
D M
IKA
MA
LIR
AN
TA
log of tenure minus0173 0112 0425 0136(0085) (0027) (0081) (0030)
[log of tenure]2 0081(0023)
Potential experience 0009 0015 minus0013 0009(0005) (0004) (0009) (0003)
Schooling years 0159 0157 0158 0174 0150 0245(0024) (0024) (0025) (0025) (0033) (0014)
Schooling y (tminus1) 0179(0014)
Schooling y (tminus2) 0096(0013)
R-squared 0520 0517 0565 0546 0532Adj R-squared 0500 0500 0547 0528 0513 0590R-squared within 0670Observations 365 365 365 365 279 1523Overident test 0467Relevance test 0000
Notes Dependent variable is logarithm of plant productivity in panel a and log of wages in panel b Other control variables (results not reported) for models reported in columns[1]ndash[4] include a dummy variable for foreign-owned plant one for plants that disappear in 1996ndash2002 and other dummies for plant vintage groups (6 groups) and size groups(5 groups) In column [5] seniority is instrumented with a set of lagged variables (the average in the period 1990ndash94) They include schooling years potential experiencepotential experience squared seniority and seniority squared In column [5] high p-values (gt 10) for the over-identification test (Hansen J statistics) indicate that the validityof the instruments cannot be rejected and low p-values (lt 01) of relevance test (Anderson canonical correspondence LR statistic) gives indication that the employedinstruments are relevant both in productivity and wage estimations+ p lt 01 p lt 005 p lt 001 p lt 0001
OLS IV Fixed effects
Cross-section Cross-section Panel
[1] [2] [3] [4] [5] [6]
Table 4 Continued
AG
E SE
NIO
RIT
Y A
ND
LA
BO
UR
CO
STS
143Table 5 Statistical analysis of the determinants of plant productivity and wages Industrial machinery
OLS IV Fixed effects
Cross-section Cross-section Panel
[1] [2] [3] [4] [5] [6]
Panel a ProductivityAge 0103 0005
(0079) (0005)Age2 minus0013
(0010)log of tenure 0135 minus0081 minus0035 0077
(0191) (0050) (0114) (0087)[log of tenure]2 minus0062
(0051)Potential experience 0014 0012+ minus0003 minus0014
(0007) (0007) (0011) (0009)Schooling years 0124 0125 0138 0137 0086 0035
(0026) (0026) (0028) (0028) (0028) (0034)Schooling y (tminus1) 0001
(0037)Schooling y (tminus2) 0102
(0036)R-squared 0394 0392 0397 0395 0219Adj R-squared 0378 0377 0380 0380 0193 0212R-squared within 0049Observations 567 567 567 567 348 1717Overident test 0351Relevance test 0000Panel b WagesAge 0105 0015
(0024) (0002)
144FR
AN
CE
SCO
DAV
ER
I AN
D M
IKA
MA
LIR
AN
TA
Age2
minus0012(0003)
log of tenure 0074 minus0012 0097+ 0056(0073) (0017) (0055) (0024)
[log of tenure]2 minus0025(0019)
Potential experience 0017 0016 0008 0003(0002) (0002) (0005) (0002)
Schooling years 0117 0117 0133 0133 0124 0065(0008) (0008) (0008) (0008) (0011) (0010)
Schooling y (tminus1) 0005(0010)
Schooling y (tminus2) 0019+(0010)
R-squared 0470 0454 0457 0455 0437Adj R-squared 0457 0441 0442 0441 0419 0836R-squared within 0871Observations 567 567 567 567 348 1717Overident test 0024Relevance test 0000
Notes Dependent variable is logarithm of plant productivity in panel a and log of wages in panel b Other control variables (results not reported) for models reported in columns[1]ndash[4] include a dummy variable for foreign-owned plant one for plants that disappear in 1996ndash2002 and other dummies for plant vintage groups (6 groups) and size groups(5 groups) In column [5] seniority is instrumented with a set of lagged variables (the average in the period 1990ndash94) They include schooling years potential experiencepotential experience squared seniority and seniority squared In column [5] high p-values (gt 10) for the over-identification test (Hansen J statistics) indicate that the validityof the instruments cannot be rejected and low p-values (lt 01) of relevance test (Anderson canonical correspondence LR statistic) gives indication that the employedinstruments are relevant in productivity but not in wage estimation+ p lt 01 p lt 005 p lt 001 p lt 0001
OLS IV Fixed effects
Cross-section Cross-section Panel
[1] [2] [3] [4] [5] [6]
Table 5 Continued
AG
E SE
NIO
RIT
Y A
ND
LA
BO
UR
CO
STS
145Table 6 Statistical analysis of the determinants of plant productivity and wages Electronics
OLS IV Fixed effects
Cross-section Cross-section Panel
[1] [2] [3] [4] [5] [6]
Panel a ProductivityAge minus0408 0024
(0377) (0026)Age2 0061
(0053)log of tenure 1741 minus0062 2380+ 0937
(0749) (0232) (1443) (0599)[log of tenure]2 minus0549 minus0639+ minus0356+
(0230) (0349) (0184)Potential experience 0028 0030 minus0013 minus0010
(0035) (0036) (0045) (0032)Schooling years 0180 0178 0182 0207 0191 minus0043
(0064) (0064) (0071) (0070) (0055) (0082)Schooling y (tminus1) minus0007
(0090)Schooling y (tminus2) 0182
(0081)R-squared 0301 0290 0320 0291 0308Adj R-squared 0239 0232 0254 0228 0211 minus0203R-squared within 0086Observations 172 172 172 172 98 496Overident test 0258Relevance test 0000Panel b WagesAge minus0046 0019
(0061) (0004)Age2 0009
(0009)
146FR
AN
CE
SCO
DAV
ER
I AN
D M
IKA
MA
LIR
AN
TA
log of tenure 0192+ 0031 0528 0250+(0112) (0044) (0420) (0146)
[log of tenure]2 minus0049 minus0107 minus0068(0033) (0105) (0045)
Potential experience 0016 0016 0008 0020(0006) (0006) (0012) (0008)
Schooling years 0123 0123 0137 0140 0145 0160(0010) (0009) (0011) (0011) (0015) (0020)
Schooling y (tminus1) 0120(0022)
Schooling y (tminus2) 0134(0020)
R-squared 0536 0530 0537 0532 0617Adj R-squared 0494 0492 0492 0491 0563 0493R-squared within 0615Observations 172 172 172 172 98 496Overident test 0001Relevance test 0000
Notes Dependent variable is logarithm of plant productivity in panel a and log of wages in panel b Other control variables (results not reported) for models reported in columns[1]minus[4] include a dummy variable for foreign-owned plant one for plants that disappear in 1996ndash2002 and other dummies for plant vintage groups (6 groups) and size groups(5 groups) In column [5] seniority is instrumented with a set of lagged variables (the average in the period 1990ndash94) They include schooling years potential experiencepotential experience squared seniority and seniority squared In column [5] high p-values (gt 10) for the over-identification test (Hansen J statistics) indicate that the validityof the instruments cannot be rejected and low p-values (lt 01) of relevance test (Anderson canonical correspondence LR statistic) gives indication that the employedinstruments are relevant in productivity but not in wage estimation
+ p lt 01 p lt 005 p lt 001 p lt 0001
OLS IV Fixed effects
Cross-section Cross-section Panel
[1] [2] [3] [4] [5] [6]
Table 6 Continued
AGE SENIORITY AND LABOUR COSTS 147
432 Seniority matters for productivity more often than experience butdifferently in traditional and high-tech industries The discussion inSection 2 invites thinking of why age may (or may not) be associated with productivityIt does so suggesting that the process of human capital accumulation takes placewithin the firm and outside the firm Lumping together the two effects (as implicitlydone in the empirical formulations underlying the results in columns [1] and [2] whereage as such is related to productivity) may obscure that the two forms of humancapital accumulation need not bear the same returns The importance of distinguishingthese two sources of skills in the analysis of productivity effects is emphasized forinstance by Ilmakunnas et al (2004) and Dygalo and Abowd (2005) For example theaccumulation of knowledge that occurs through seniority may be productivity-enhancingwhile the accumulation of human capital that occurs through the acquisition ofoverall labour market experience may not contribute positively In the statistical anal-ysis underlying the results in columns [3]ndash[6] we dropped this restriction We findthat the statistical significance of seniority and potential experience is indeed differentfrom each other This also holds across industries and across estimation methods Theoverall goodness of fit of IV and FE-based specifications drops significantly
In the forest industry as well as in electronics we find that seniority not potentialexperience is positively related to productivity Our formulation (in logs and logssquared so as to obtain the best fit of the data) also implies that the effect of seniorityon productivity depends on its starting level
One additional year of seniority for a freshly hired worker adds to productivity less thanit adds for a senior worker who has spent a considerable number of years within the samefirm In other words there are positive but diminishing returns to seniority In the electronicsindustry the returns to seniority decline so much to become negative beyond a certainthreshold These results are well determined when using the period-averaged cross-sectionof plants and are still there ndash though less precisely measured ndash even when seniority isinstrumented to allow for possible feedback effects from the lagged values In the forestindustry the correlation disappears when the time variation of the data is considered throughfixed-effects estimation while a weaker correlation survives for plants in electronics
In the industrial machinery plants instead potential experience positively corre-lates though at the usual declining rates with productivity Seniority is instead notsignificantly related to productivity in a statistical sense in this industry The patternof partial correlations in this industry is however somewhat statistically weaker thanfor the other industries for they do not survive when other methods of estimationthan the cross-section OLS are employed This is a symptom that our statisticalmodel that links plant productivity to human capital variables is not equally effectivein capturing the determinants of plant productivity in all industries
433 Wage and productivity profiles are dissimilar from each other inelectronics and similar in the other industries In our data set searchingfor wage determinants is a more successful undertaking than searching for productivity
148 FRANCESCO DAVERI AND MIKA MALIRANTA
determinants The line interpolating the data explains more than 50 of the totalvariability of plant wages in the forest industry and in electronics and more than 40of the total in industrial machinery even when the time dimension of the data set isconsidered Among the age-related variables seniority drives wages in forest andexperience drives wages in the industrial machinery industry Notably the seniority-wage profile in the lower panel is not too far apart from the seniority-productivityprofile estimated in the upper panel for the forest industry The same applies toexperience-wage and experience-productivity profiles for industrial machineryalthough it should be kept in mind that as emphasized above the statistical relationis much less precisely measured for the plants in this industry
When it comes to electronics the picture instead changes substantially Wagesdepend positively but to a declining extent on both tenure and experience in thecross-section of plants This result is still there when the time variation of the paneldata set is considered through fixed-effects estimation This correlation is instead notthere when variables are instrumented by their lagged values
We interpret these results as showing that the profiles of wages and productivitywith respect to age-related variables are significantly different from each other inelectronics Wages keep going up though at declining rates with both seniority andexperience while the seniority-productivity profile follows a very different path madeof definite increases when seniority is low and a flattening out which also involvessheer productivity declines as seniority goes beyond a given threshold
44 More results
The statistical analysis underlying Tables 4 5 and 6 also includes some ancillaryresults on the determinants of plant productivity and wages concerning educationand plant age The important implication of these additional results is that the cor-relations between age-related variables productivity and wages (discussed above) donot hinge on the omission of other important determinants of plant productivity andwages Reassuringly education and plant age affect productivity and wages as expectedbut consideration of these additional elements does not cancel our main results
441 Education is positively related to productivity and wages The earningsequations estimated by labour economists routinely include education as an explan-atory variable and make inference as to the rate of return on additional years ofeducation And even the importance of workersrsquo educational levels in determiningplant productivity can hardly be overstated
In our statistical analysis education turns out always positively related to wages inthe three industries with estimated coefficients ranging between 012 and 015 Yetthe estimated coefficient is bigger in forest than in more technologically advancedindustries As to its effects on productivity they seem to be instead ranked in decreas-ing order of the technological level of the industry at hand Education is positively
AGE SENIORITY AND LABOUR COSTS 149
and sizably related to plant productivity in electronics with a bigger coefficient thanin industrial machinery No relation is there for the forest industry
When the time series dimension is considered these effects are present only whenthe delayed values of the explanatory variables are considered instead of the currentones Education is indeed positively associated with productivity with a delay of abouttwo years (the lagged value of education is almost significantly related to productivitythough with a small coefficient even for the forest industry)
Altogether these effects indicate that high-education workers in more advancedindustries are in some way lsquoexploitedrsquo while high-education people in forestry enjoya rent The idea that high-education people accept lower wages possibly in exchangefor a bright future to buy the lottery of working in dynamic plants and industries isconsistent with anecdotal evidence from Finnish newspapers10
442 Newer plants are more productive Another ancillary result underlyingTables 4 5 and 6 is that older plants tend to be less productive than newer plantsThis effect is consistently present for the three industries These results are notreported in the tables for brevity but are anyway singled out and pictured in Figure 1
Figure 1 shows a graphical illustration of productivity and wage effects of plantvintage whereas the horizontal bars indicate the average effects of plant vintage onproductivity (printed light grey) and wages (printed dark grey) with 95 confidenceintervals appended The evidence in the graph points to the marked quantitativerelevance of such effects Younger plants are indeed definitely more productive in allindustries This also holds for wages though the effect is much less marked Theseresults are consistent with the literature briefly surveyed in Box 511
45 Implications of our main results a numerical illustration
If theory and the related empirical findings were to imply that the effect of age-related variables on productivity is always the same irrespective of age seniority orexperience one might easily compute the numerical effect of ageing on productivityThe estimated coefficient would tell us by how many percentage points productivityvaries as a result of a unit change in the age or seniority of a given person (or theaverage age of a typical worker in a given plant)
Unfortunately psychometric studies and the economics of human capital teach usthat the world is more complicated and the effect of age on productivity may changeits sign from positive into negative starting from some threshold age onwards Thisraises the empirical questions of where (at which year of age seniority or experience) this
10 A more academic argument following more or less the same lines is in Moen (2005)11 Maliranta (1999) experimented with alternative capital stock measures (perpetual inventory method vs fire insurance valueof capital stock) They yielded quite similar results for the plant vintage effects More recent Finnish evidence of the plant vintageeffects include Ilmakunnas et al (2004) and Ilmakunnas and Maliranta (2005)
150 FRANCESCO DAVERI AND MIKA MALIRANTA
Figure 1 An illustration of productivity and wage effects of plant vintage
Notes Bars indicate the log difference of total factor productivity and monthly wage with respect to the reference group (plants established in 1976 or earlier) Error bars around the mean bars indicate 95 confidence inter-vals The estimates are from the models presented in column [3] of Tables 4ndash6
AGE SENIORITY AND LABOUR COSTS 151
threshold is Moreover having found that the returns to seniority decline with seniorityor as in electronics actually become negative it remains unclear by how much they decline
Box 5 Old plants old workers productivity and wages
Old-aged firms may be less productive and disproportionately hire old-ageworkers The evidence on the relation between firm age and productivity isnot abundant though Dunne et al (1989) report that manufacturing plantsthat have been in business longer are less likely to close and Brock and Evans(1986) show that older firms are less likely to fail (controlling for plant and firmsize respectively) This may partly explain why older workers tend to stick withthese probably less productive but more financially sound firms
On the other hand it has often been found that older firms pay higher wagesafter controlling for other relevant firm characteristics This is often taken toreflect the quality (and thus the higher productivity) of the workers they hireas well as the working conditions they offer Yet as discussed in the main textthis need not be the case Older firms may pay higher wages to extend fringebenefits such as pensions or health insurance to their most faithful workers ormore subtly because they cannot deny pay raises to people who have devel-oped a good knowledge of the companyrsquos ability to pay throughout the years
Davis and Haltiwanger (1991) find that older manufacturing plants indeedpay higher wages and age remains a significant determinant of wages onceindustry region and size differences are accounted for with and without con-trolling for the probability that the plant will close (usually lower for olderfirms) Troske (1999 Table 1111) reports similar results controlling for employersize and location workers in plants that are less than 5 years old earn nearly20 less than workers in plants that have been in business 15 years or moreBlanchflower and Oswald (1988) find no significant relationship betweenwages and years in operation in British data while Winter-Ebmer (2001) founda positive relation with Austrian data The very careful study by Koumllling et al (2005)shows that in Germany older firms pay on average higher wages for workerswith the same broadly defined degree of formal qualification More recentlyBrown and Medoff (2003) have analysed the relationship between how long anemployer has been in business (firm age) and wages According to their analysisfirms that have been in business longer pay higher wages (as previous studieshave found) but pay if anything lower wages after controlling for workercharacteristics There is some evidence that the relationship is not monotonicwith wages falling and then rising with the number of years in business
Finally regarding evidence with Finnish data Nurmi (2004) finds that oldand large firms are less likely to fail and less sensitive to exogenous shocks thanyoung and small firms
152 FRANCESCO DAVERI AND MIKA MALIRANTA
In this section we employ statistical simulation ndash a quantitative technique thatallows one to describe complicated phenomena in a flexible way (how is described inthe top part of Box 5) ndash to illustrate these issues
The simulation results are then translated out of the jargon using CLARIFY theuser-friendly software developed by Harvard political scientists Gary King MichaelTomz and Jason Wittenberg (King et al 2000 Tomz et al 2003) expressly for deliv-ering the results of the application of even complicated quantitative techniques to awider audience not necessarily trained in statistics but still interested in achieving arather precise knowledge of the quantitative aspects of economic and social issues (seemore details in the bottom part of Box 6)
Box 6 Numerical simulations through CLARIFY
a The issueThe starting point may be a standard multivariate regression exercise wherethe statistical relation between a dependent variable (say productivity) and ahost of potential explanatory variables (say age education and so on) isinvestigated The result of a regression exercise usually consists of quantitativeinformation (lsquoestimated coefficientsrsquo) on the sensitivity of the dependent variableto each of the explanatory variables while holding the other explanatoryvariables constant This piece of information is however subject to varioussources of uncertainty (the statistical model may be wrong or incomplete theavailable information on the explanatory variables may be incomplete as wellsome variables of interest may be outright unobserved) Hence this lsquopartialcorrelationrsquo may thus be more or less precisely estimated If the researcherobtains a precise estimate the quantitative implication of his-her research maybe trusted otherwise not
b Simulation-based approach to interpreting statistical resultsAmong other things numerical (so called lsquoMontecarlorsquo) simulation essentiallyapplies survey sampling techniques to proxy complicated (but presumablymore realistic) mathematical relations and eventually determines how trust-worthy the results of a given regression are In surveys random sampling fromthe population of interest is commonly used to estimate key features (such asmean and variance) of such population with the precision of the estimateincreasing in sample size Simulation essentially follows the same logic to learnabout probability distributions of estimated coefficients not populations In thesame fashion as with real samples approximations can be computed to anydesired level of precision by varying the number of simulations
AGE SENIORITY AND LABOUR COSTS 153
c How statistical simulation works in practice through the software CLARIFYStart from a set of point-wise estimated coefficients of age education and theother variables set out to explain productivity Each of these coefficients has asampling distribution The central limit theorem guarantees that for a largeenough sample one can randomly draw (lsquosimulatersquo) coefficient (lsquoparameterrsquo)values from a multivariate normal distribution with mean equal to the pointestimates of the coefficients and variances equal to the estimated variance andcovariance matrix of the point-wise estimates By random drawing one canobtain a realization of the estimated coefficients on average consistent withtheir point-wise estimates This is the result of one simulation round Thisexperiment can be repeated many times at will (clearly if the coefficient wereprecisely known each draw would be identical) and many values for the esti-mated coefficient of interest computed Each coefficient can then be multipliedby the value of its corresponding explanatory variable (age) The variability inthe values of the simulated coefficients translates in variability (randomness) ofthe expected value of productivity (the dependent variable) while the effectsof the other variables on productivity are held constant at their means
As a result we can compute (and graph) the average partial effect of age onproductivity and also confidence intervals that delimit the degree of trustworthi-ness of such an average To sum up in our case the true relation between age andproductivity is likely complicated for the effect of age on productivity may bepositive or negative depending on age If this is the case describing the resultsof statistical analysis becomes rapidly cumbersome and only imperfectly relatedto the question at hand King et al (2000) have developed a software program(CLARIFY) that without changing any underlying data or statistical assumptionprovides interpretation-friendly and graphical answers to the questions of interest
Figures 2 and 3 are the outputs of CLARIFY and concern respectively theseniority and experience profiles of productivity and wages estimated through OrdinaryLeast Squares from the period-averaged cross-section of plants12 Being OLS cross-sectionalOLS estimates they suffer from many of the biases whose shortcomings have beenextensively discussed above Although precisely tracking the overall direction of thebiases is not easy the reported results likely represent upper bound estimates andthey include both skill depreciation and worker reallocation effects
The statistical simulations underlying Figures 2 and 3 and Table 7 (based on thosefigures) revolve around the multivariate statistical analysis whose point-wise resultsand significance are reported in Table A2 in the appendix To maximize the goodness
12 To compute the necessary confidence intervals CLARIFY requires relatively precisely estimated coefficients be imputed Thisis why we use OLS cross-sectional estimates with the caveats in the main text
154 FRANCESCO DAVERI AND MIKA MALIRANTA
Figure 2 Productivity and wage responses to seniority simulation analysis from estimates in Table A2
Notes See Box 6 for a detailed explanation of how such profiles are constructed
AGE SENIORITY AND LABOUR COSTS 155
Figure 3 Productivity and wage responses to potential experience simulation analysis from estimates in Table A2
Notes See Box 6 for a detailed explanation of how such profiles are constructed
156FR
AN
CE
SCO
DAV
ER
I AN
D M
IKA
MA
LIR
AN
TA
Table 7 Simulations of cumulated productivity and wage responses under various settings
Difference
from to in log of TFP in log of monthly wage
Mean Std err t-value Mean Std err t-value
SeniorityForestSeniority in years 7 17 038 015 260 023 004 581and other variables at their means at their meansMachinerySeniority in years 7 17 000 008 001 002 003 073and other variables at their means at their meansElectronicsSeniority in years 2 6 107 032 331 013 007 183and other variables at their means at their meansSeniority in years 6 10 minus068 020 minus334 minus003 005 minus061and other variables at their means at their meansPotential ExperienceForestExperience in years 15 25 minus040 017 minus233 008 005 169and other variables at their means at their meansMachineryExperience in years 13 20 012 007 177 015 002 776and other variables at their means at their meansElectronicsExperience in years 10 16 minus048 022 minus222 002 005 046and other variables at their means at their meansExperience in years 16 22 049 025 195 012 006 213Other variables at their means at their means
AG
E SE
NIO
RIT
Y A
ND
LA
BO
UR
CO
STS
157
Seniority and experience combinedForestSeniority in years 7 17 minus002 012 minus016 031 004 822and experience in years 15 25and other variables at their means at their meansMachinerySeniority in years 3 10 004 007 053 015 002 662and experience in years 13 20and other variables at their means at their meansElectronicsSeniority in years 2 6 061 029 211 014 005 271and experience in years 10 14and other variables at their means at their meansSeniority in years 6 12 minus069 025 minus277 005 005 106and experience in years 14 20and other variables at their means at their means
Notes Simulations are based on the same regression models (results in Table A2) used for drawing Figures 2ndash3 lsquoMeanrsquo indicates the log difference of productivity (or wage)levels Multiplying the number by 100 provides an approximation of percentage difference in productivity (or wage) levels in the different hypothetical situations For moredetails on how these figures are computed see Box 6
Difference
from to in log of TFP in log of monthly wage
Mean Std err t-value Mean Std err t-value
Table 7 Continued
158 FRANCESCO DAVERI AND MIKA MALIRANTA
of fit of the interpolating line the empirical specification underlying the graphs is moreflexible than those in Tables 4 5 and 6 This boils down to appending more polynomialterms of the same variables to the list of the productivity and wage determinantsin addition to the linear and squared terms present in the tables seen above
In each figure along the vertical axis one reads the marginal response of thedependent variables (logarithms of TFP and wages) to changes in seniority experi-ence and education years measured along the horizontal axis Such responses aredefined over the interval of values taken by each explanatory variable in the industryat hand The thick and dotted lines indicate respectively the average marginalresponse of TFP and wages (with the average taken over the very many potentialvalues of the coefficients of interest) The dot-shaded and line-shaded intervalsaround such estimated average responses represent confidence intervals which pro-vide an indication of the degree of precision of the simulated estimates
451 Seniority profiles (Figure 2) Productivity and wage responses to thecross-section variability in the number of seniority years are very similar to each otherin the forest industry (both growing fast) and in industrial machinery (both essentiallyflat once confidence intervals are taken into account) From the figures reported inthe upper part of Table 7 one learns that moving from a plant with a seniority of 7years for the average worker to a plant with seniority equal to 17 having set the otherdeterminants of productivity to their means results in a productivity increase of 38in the forest industry In electronics the seniority-productivity profile follows a well-defined inverted-U shape while the wage is mildly increasing These trends corre-spond to a swift positive productivity response of cumulated 107 as one shift fromplants with an average worker seniority of two years to plants with worker seniorityequal to six years (with wages going up more moderately) If one moves further byanother four years from plants with seniority equal to six to plants with seniorityequal to ten productivity undergoes a (relative) shortfall of cumulative 68 withroughly unchanged wages These are huge numbers As mentioned in the caveatabove however they are upper bound estimates also inclusive of worker reallocationeffects It should be noted though that very drastic declines in relative productivitylevels with age have been documented for other countries such as France in theliterature (see eg Figure 44 in Productivity Commission 2005)
452 Experience profiles (Figure 3) Productivity and wage responses to thecross-section variability in the years of potential experience are much less preciselyestimated particularly for productivity This may be the result of multi-collinearitybetween experience and seniority which may be at the origin of the initially down-ward sloping response of productivity to experience in the forest industry and inelectronics In industrial machinery one finds instead plausible results with positivewage and productivity responses to experience (with wages and productivity by 15and 12 respectively over 7 years see Table 7) A possible way out is to compute the
AGE SENIORITY AND LABOUR COSTS 159
implied productivity response of both higher experience and seniority (after all if aworker stays with the same plant heshe acquires both experience and seniority atonce) When this is done (see the results in the lower panel of Table 7 lsquoSeniority andexperience combinedrsquo) one finds an essentially flat productivity response to the com-bination of seniority and experience and a moderately positive wage response for acumulated 15 over 7 years of time The combination of seniority and experienceleaves the results for electronics qualitatively unchanged instead When the numberof seniority and experience years is relatively low moving from low-seniority and low-experience plants to high-seniority and high-experience plants corresponds to acumulated productivity increase of about 60 When this is done moving fromintermediate to high levels of seniority and experience the productivity shortfall is ofabout 70 Wages do not follow suit instead but keep going up
46 Summing up and discussion
Our statistical analysis provides a reasonably coherent picture of the empirical rela-tion between age seniority and experience on the one hand and plant productivityand wages on the other in Finland in the years of the IT revolution
At first sight our results seem to support the view that workforce ageing as suchhas adverse effects on labour costs Age is essentially unrelated to productivity whileit is positively correlated with wages As we distinguish the effects of seniority onproductivity and wages from those of general experience though we find that thepicture is more complicated and sharply differs across industries (see Box 7 for a surveyof other studies emphasizing industry differences in productivity and wage profiles)
Box 7 Previous statistical evidence on age seniority experienceproductivity and wages
About 25 years ago Medoff and Abraham (1980 1981) used performanceevaluation to gauge separate information about individual productivity andwage profiles They found that wages do not necessarily reflect productivityBishop (1987) and Flabbi and Ichino (2001) also put together measures ofindividual productivity following the Medoff and Abraham methodology andconfirming their results with other data sets
Hellerstein et al (1999) using US data find that productivity and wagesincrease with age except for the oldest age group in some specifications andtheir patterns are fairly similar Creacutepon et al (2002) use French data andconclude that the relationship of productivity and age follows an inverted U-shape but wage is increasing in age In manufacturing wage increases withskill level but productivity increases even more In non-manufacturing wage
160 FRANCESCO DAVERI AND MIKA MALIRANTA
increases more than productivity as skill levels go up Haegeland and Klette(1999) use Norwegian data and find that productivity and wage increase witheducation and the highly educated go hand in hand by productivity Medium-level potential experience (age minus education years) gave higher productivitythan short experience but with long experience productivity declined althoughstill stayed higher than with short experience Medium-level experience wasunderpaid but the wage premium for long experience corresponded to theproductivity premium They concluded that the wage-experience profile onlypartly reflected the productivity profile
Only a few scholars have looked at cross-industry heterogeneity of produc-tivity and wage responses Aubert and Creacutepon (2004) estimated average earn-ings relations for France and found evidence of declining productivity after theage of 55 but they found that the age-productivity profile (as captured by suchearnings functions) does not differ much across industries In contrast Aubertet al (2004) estimated labour demand curves by using wage bill shares condi-tioned on value added as well as old and new economy capital they did findsignificant evidence that innovative firms and work-practices present lowerwage bill shares
The same result seemingly applies within occupational groups for othercountries Similarly to our findings here Neuman and Weiss (1995) found thatearnings peaks are located earlier in age in the high-tech sector Hellersteinand Neumark (1995) using Israeli data find that earnings and productivityprofiles are fairly similar for the relatively less skilled workers (the group thatcovers most of the workforce)
Other studies have in turn found that the relation has changed over timeThe seniority-wage profile has seemingly become steeper and its peak movedforwards in Denmark as a result of the decentralization of wage determination(Bingley and Westergaard-Nielsen 2003) Eriksson and Jaumlntti (1997) found thatin 1971 the peak of the wage profile was at the age group 35ndash39 years but hasthen moved forward being at the age group 45ndash49 years in 1990 in Finland
Finally a host of previous studies indeed highlights the productivity-enhancingrole of worker mobility between plants The mobility of workers has anadditional important productivity effect that goes beyond the lsquowithin firmrsquoeffect discussed above and examined in this paper lsquoChurningrsquo of plantsfirms(ie simultaneous entries and exits) has been found to have a dominant role inindustry productivity growth Thanks to this mechanism a workerrsquos produc-tivity may improve greatly when she moves from a low productivity plantfirmto a high productivity plantfirm (Foster et al 2001 Disney et al 2003) Withthe data from the Finnish manufacturing sector Maliranta (2003) finds that theaverage productivity growth rate of the plants is typically 50ndash70 of the industry
AGE SENIORITY AND LABOUR COSTS 161
productivity growth rate which is due to the fact that entries but especially exitsand the reallocation of labour and capital between the continuing plants have animportant role to play as well This gap between industry and plant productivitygrowth has been particularly pronounced in the Finnish electronics industrysince the latter part of the 1980s but has also been substantial for instance inthe textile and wearing industry during the latter half of the 1980s and in the basicmetal industry during the latter half of the 1980s and the first half of the 1990s
Returns to seniority are usually positive but declining with the level of seniority inthe forest industry plants about the same applies to earnings profiles Similar consid-erations hold for the productivity and wage effects of general experience in industrialmachinery although the estimated relation is statistically less solid The similarity ofthe productivity and wages responses to the accumulation of human capital indicatesthat in lsquoaveragersquo industries skill depreciation does not seemingly lead to higherlabour costs And given that these industries are still quantitatively important in theFinnish economy wage-productivity misalignments cannot be the main explanationfor the bad labour market performance of the elderly in Finland
The picture is quite different for the high-tech plants In electronics ndash the industrywhere people are exposed to rapid technological and managerial changes ndash theresponses of plant productivity and wages to seniority are very different from eachother The seniority-productivity profile shows a positive relation first and then negativeas one looks at plants with higher average seniority while wages instead keep goingup with seniority13 This holds for plants with similar education plant age and sizeand other conditions and is thus not related to plant differences in these other respectsHow negative the productivity returns to seniority may become cannot be said withcertainty Numerical simulations based on our OLS cross-sectional results indicatethat the change of sign in the seniority-productivity profile may be pronounced
Altogether our results are consistent with the idea that fast technical change bringsabout accelerated skill depreciation of senior workers We cannot honestly rule outhowever that our correlations may also be the result of worker movements acrossplants The negative correlation between seniority and productivity may in fact alsoreflect the reallocation away of younger (and more productive) workers who leavebehind older plants attracted by the career prospects offered in newly born high-productivity firms and plants14 We cannot precisely quantify the relative importance
13 This is not too surprising as recently discussed at length by Uusitalo and Vartiainen (2005) the combination of highlycentralized collective agreements with relatively autonomous but still highly unionized industry wage setting has resulted in avery low weight (44 on average) given to performance-related firm-level corrections of wages14 Evidence on the importance of reallocation for productivity purposes was indeed provided by Ilmakunnas et al (2005) for theFinnish manufacturing sector where it was shown that the churning of workers (ie simultaneous hiring and separation ofworkers within a plant) speeds up plant productivity growth while holding back seniority
162 FRANCESCO DAVERI AND MIKA MALIRANTA
of the two effects in our statistical analysis Both skill depreciation and worker reallo-cation appear to affect the relation between seniority and productivity in the Finnishhigh-tech industry
It looks as though the deferred compensation hypothesis perhaps amended withthe insights from sorting and matching theories fits better the labour market facts inhigh-tech industries than the human capital hypothesis Yet the evidence for thelsquoaveragersquo industries is not consistent with this hypothesis This is an open issue thatwe briefly discuss further in the concluding section
5 CONCLUSIONS
We started this paper asking ourselves whether we could explain the weak labourmarket position of older workers The simultaneous presence of a relatively aged ndashand still rapidly ageing ndash workforce and a major external shock (such as the ITrevolution of the late 1990s) makes Finland a nice experiment to address this questioninvestigating the diverse responses of wages and productivity to age seniority andexperience patterns across industries
Our results do not indicate that age as such is responsible for the bad labourmarket outcomes of the elderly The differential effect of seniority and experienceon productivity and earnings is minor for two of the three Finnish manufactur-ing industries (the lsquoaveragersquo ones) we chose to analyse These productivity andwage patterns probably reflect the relatively more valuable role of tacit knowledgein traditional industries Productivity and wage profiles differ just in electronicsnot in the other industries We interpret this as implying that exposure torapid technological and managerial changes seems to make a difference for plantproductivity less so for wages for the high-tech plants Yet this productivity-wage discrepancy is not associated with age but rather with seniority hence with avariable which can be affected by individual and policy decisions to a greater extentthan age that is largely exogenous for the individual (though not for the plantmanager)
In the end our results give support to at least two important policy implicationsFirst the similar shapes of productivity and wage profiles in lsquoaverage industriesrsquoindicate that the weak labour market performance of older workers in Finland is notbecause they are a burden for the average firm in the economy Leaving high-techplants aside the bad labour market outcomes of the elderly in the rest of the economyare presumably driven by two other causes such as discriminatory attitudes on theemployer side and public incentives schemes easing the way towards early retirementTo ameliorate the labour market performance of the elderly policy should addressthese issues Second higher seniority is instead associated with higher labour costs inhigh-tech plants This is consistent with the anecdotal evidence from Wal-Mart andEricsson that we have reported It is also consistent with the beliefs ndash entertained bymany Finnish employers ndash that older people could not adapt as easily as younger ones
AGE SENIORITY AND LABOUR COSTS 163
to the arrival of the new technology15 And indeed a survey conducted by the Ministryof Labour in 2002 indicates that as much as 10 of prime-aged workers (and 15of workers above 50) agree that lsquoworkplace discriminates against old workersrsquo16 Inspite of government-mandated media campaigns to counteract such attitudes thepossibility that a negative employer bias against old workers has affected hiring andfiring practices in the late 1990s cannot thus be easily ruled out Our results suggestthat this effect is not present in the Finnish economy at large but mainly in high-techplants
To improve the employability of older workers in these industries public policyshould divert resources away from preserving existing jobs and lend more attentionon the retraining of old workers to ease their reallocation away from less productiveplants (or plants where they have become less productive) into new jobs Some gov-ernments are more worried and more interventionist than others in this respect Inthe last few years for instance the Finnish Government has already embarked on aprogramme (lsquoThe National Programme on Ageing Workersrsquo see OECD 2004 p119) aimed at deferring retirement and in parallel improving the so called lsquoemploy-abilityrsquo of older workers It is unclear however to what extent grand plans maybe effective to bring about a solution to these problems Policies aimed at easingreallocation across plants even within the same industry would probably be a usefulcomplementary tool in this respect
Finally our results are also somehow puzzling in at least one respect They are notfully consistent with any of the existing theories that we know The results for thehigh-tech plants are consistent with the deferred compensation hypothesis and notwith the human capital hypothesis As surveyed in the theoretical section of the paperthe human capital hypothesis would predict a negative discrepancy in plants with anolder labour force where we instead find the opposite results But even the Lazearhypothesis is not fully consistent with our Finnish data because the results found forelectronics are not there for the other industries
This begs the question of why the Lazear model is more relevant in high-techplants than in the other plants One possibility is that productivity is less easilyobservable in high-tech industries This would make the asymmetric informationmechanism envisaged by Lazear more sensible in those industries This explanationwould probably do if our results were there for plants producing immaterial lsquoweight-lessrsquo services whose output is typically hard to measure Our discussion here insteadconcerns plants producing lsquoconcretersquo manufacturing goods for which productivitymis-measurement is presumably a less serious concern An alternative possibility is
15 Juuti (2001) reports that young line managers with a good educational background often harboured prejudice against theability of older workers to cope with new things This is potentially important for hiring and firing practices Althoughdiscriminating attitudes are rarely shared by top-level managers recruitment decisions happen to be taken by the mid-managementlevel16 Kouvonen (1999) reports somewhat lower figures with a 5 share of people above 45 having experienced age at discrimi-nation at work for the average firm
164 FRANCESCO DAVERI AND MIKA MALIRANTA
that seniority being the other side of impeded resource reallocation is particularlydamaging in industries where changes ndash requiring flexibility and ability to quicklyadapt ndash come about all the time Hence the adverse consequences of seniority mani-fest themselves in these industries and less so in other industries where changes aresmoother Under these circumstances a less mobile ageing workforce might constitutean impediment to productivity growth of firms and their plants To the extent thatlow productivity (and low immobility) is a consequence of declining ability to inces-santly adopt new technologies due to weak basic education public policy should focuson efforts to increase the quantity and improve the quality of the adult education Ifhowever the main reason for staying still too long is not the inability of older workersto adopt new technologies policy-makers should seek ways to encourage the mobilityof the ageing workforce to maintain the scope for continued productivity enabled bylearning-by-doing Greater mobility of workers might also facilitate the diffusion oftechnologies and thereby speed up productivity growth of the firms ndash and stimulatinglsquocreative destructionrsquo (ie productivity-enhancing churning of plants and firms withinindustry) to boot
Finally how special are our results Insofar as the use of ICT will spread to otherindustries in the years to come it can be expected that the productivity patternsobserved in electronics will emerge in other industries in the future The findings forelectronics may be foretelling more general developments in the other industries ofthe Finnish economy ndash and possibly other economies For sure in a world whereinnovation forces as opposed to catching up forces have become the key engine ofgrowth (see Acemoglu et al 2003 and the Sapir Report 2004) companies andgovernments will be more and more involved in such problems as the ones discussedin this paper
Discussion
Wendy CarlinUniversity College London and CEPR
Four facts about the advanced economies provide the motivation for this paperthe poor labour market performance of older workers (unemployment and employ-ment rates) the ageing of the labour force evidence measured in surveys of a declinein physical and mental performance at higher ages and finally the change in industrystructure toward lsquohigh techrsquo industries This raises the question of whether theemployability of older workers declines because they become too costly (diminishingproductivity is not compensated by lower wages) and whether this is especiallymarked in high-tech sectors of the economy The authors of this paper do not findevidence supporting either of these hypotheses in their data from three Finnishmanufacturing industries However their findings suggest that there is a hump-shaped
AGE SENIORITY AND LABOUR COSTS 165
relationship between a measure of productivity and the seniority (not age) of workersin plants in the high-tech industry in their sample electronics There is no corre-sponding pattern for wages This is interpreted as signalling a potential problem inthe matching of workers to jobs in industries with rapid technological progress in thecontext of constraints on worker mobility (eg costs of firing)
Channels through which ageing can affect economic performance are the averagequality of the direct labour input the effect on capital deepening because of theimplications of ageing for private and public saving and its impact on technologicalprogress (new ideas and diffusion) Older people may be less creative entrepreneurialand risk-taking and the depreciation of their skill set may imply less adaptation anddiffusion of new knowledge On the other hand an ageing population may createbigger incentives for labour and memory saving innovation
In order to evaluate the economic impact of age-related variables it is essential tospecify whose perspective we are taking From the perspective of workers the decisionis whether to remain in their job to search for a new one to leave the labour forceor to invest in (re)training And the key question is how age and or seniority affectwage and employment prospects as well as training opportunities within and outsidethe firm For firms the question is how age or seniority affects the profitability ofexisting production and the firmrsquos investment in human and physical capital and ininnovation What are the constraints on the wage structure they can deploy and onfiring From the perspective of a policy-maker concerned with welfare the questionis the impact of age-related variables on total factor productivity and the role ofpolicy-related barriers to the reallocation of workers training and early retirementprogrammes
In this paper Daveri and Maliranta take one slice of this question focusing on theimpact of age-related variables on the quality of direct labour input
bull How are productivity and wages related to age structure and seniority at theplant level in manufacturing
bull Does this relationship vary according to the innovativeness or technology inten-siveness of the industry
To answer these questions it is necessary to have matched employer-employee dataand a clear contrast in industry characteristics This makes the use of data fromFinland an appropriate choice there is high-quality matched data and looking at theperiod of the late 1990s to the early 2000s provides a nice contrast among thetraditional industry of lsquoforest productsrsquo a neutral one of industrial machinery and ahigh-tech industry electronics
The method is to use plant-level data to estimate an index of total factor produc-tivity and to calculate the average wage Each of these is then used as the dependentvariable in a separate regression for each industry with various combinations of theage-related variables on the right-hand side along with a set of plant-level controlvariables (including years of schooling a dummy for a foreign-owned plant and
166 FRANCESCO DAVERI AND MIKA MALIRANTA
dummies for different vintages of plants including those that exit during the observa-tion period) The age-related variables are worker age seniority (ie years in thecurrent firm) and labour market potential experience (age minus age when completedlast qualificationdegree) averaged for workers in each plant It is somewhat odd thatTFP is the productivity variable of choice when an initial motivation was the impactof age-related variables on firm profitability via labour costs which suggests that it islabour productivity that is relevant not TFP17
Neither age nor age squared is ever significant in a productivity regression Inelectronics but in neither of the other industries there is a positive coefficient onseniority and a negative coefficient on the squared term in seniority This says thatwhen looking across plants TFP initially rises as the average tenure of workers in theplant goes up but then falls in plants with higher levels of average seniority Theeffects of age-related variables on wages are mainly (but not always) positive in forestproducts hump-shaped for age (but with no robust tenure effects) in machinery andpositive for age and weakly positive for tenure and experience in electronics
The authors conclude that it is not age per se but seniority that affects TFP andthat this effect is found only in the high-tech sector electronics In order to make theirresults more easily interpretable they estimate modified versions of their equationsand produce graphs showing the average partial effect of the variable of interestFrom these equations they calculate the effect on TFP of a change in for exampleseniority As acknowledged by the authors the estimate that plant productivitydoubles when average seniority of the workforce goes from 2 to 6 years and then falls bytwo-thirds as average seniority goes from 6 to 10 years is very large My main concernwith this central result in the paper is that it may reflect the dynamics of a rapidlygrowing industry rather than the inherent characteristics of long-tenure workers inelectronics
In electronics a plant where the average tenure is six years is estimated to be atthe lsquoturning pointrsquo from rising to falling TFP As Table A1 shows the mean tenurein the sample for electronics plants is six years which reflects the rapid growth of theindustry it is 11 years and 9 years respectively in the forest products and machineryindustries The likely role of industry dynamics in generating tenureproductivityprofiles of the kind shown in the paper can be illustrated by a simple example If weassume that initially there are three industries F M and W with identical plants interms of TFP age and seniority structure In particular we assume there is no causallink from the average age or seniority of workers in a plant to the plantrsquos TFP Wenow introduce a different demand shock for each industry a negative demand shockfor industry F no change for M and a positive shock for E We assume that there isunobserved heterogeneity in managerial ability across plants As a consequence of the
17 TFP is calculated using a simple growth accounting framework with the assumption of a constant labour share (WLY ) Ifthe aim is to test whether seniority or ageing affects labour costs which are measured by the ratio of wages to labourproductivity then this is perhaps not an ideal choice
AGE SENIORITY AND LABOUR COSTS 167
differential demand shocks and assuming there are costs of entry and exit we willobserve disequilibrium in the F and E industries Good managers in E will expandoutput increase hiring and raise TFP relative to other plants in E Since hires havezero seniority average seniority in these expanding higher TFP plants will fall lowerseniority is associated with higher TFP but by assumption this is independent of anyrelationship between individual human capital (and TFP) and tenure Similarly goodmanagers in F identify the decline in their industry earlier and cease hiring soonerwith the result that higher TFP firms end up with on average longer tenure workersThis produces a positive relationship between seniority and TFP in the lsquodecliningrsquoindustry and a negative relationship in the lsquoexpandingrsquo industry In the industrywhere there is no shock there is no relationship This pattern is consistent with thecontrast between the three industries shown in Figure 2 of the paper18
Figure 4 provides some illustrative data showing that employment grew in telecom-munications equipment and shrank in forest products over the time period consideredin the paper
18 A similar story could be told to account for the within firm pattern that is shown in column [6] of Table 6 Using fixed effectsestimation the relationship between changes in TFP over time and in the age-related variables is uncovered controlling fortime invariant characteristics of plants such as managerial quality A similar although a much weaker hump-shaped relationshipbetween TFP and seniority is reported If we now assume that a new higher TFP technology emerges in electronics during theperiod of observation but not in forest products production in electronics becomes more profitable and each firm expands Theincrease in hiring reduces seniority and we associate a within-firm rise in TFP with a fall in seniority
Figure 4 Contrasting industry dynamics in Finland 1995ndash2002
Note Telecommunications equipment = ISIC322 Mechanical engineering = ISIC29 Forest products =ISIC20+21
Source Groningen Growth and Development Centre 60-Industry Database October 2005 httpwwwggdcnet updated from OrsquoMahony and van Ark (2003)
168 FRANCESCO DAVERI AND MIKA MALIRANTA
The authors undertake a number of tests to check the robustness of their resultsbut they are not able to separate out the possible impact of industry dynamics drivenby exogenous demand or technology shocks from the causality of seniority producinga change in efficiency that they seek to identify Another approach to identifying suchan effect would be to focus on those who switch jobs The DaverindashMaliranta storyimplies that in electronics longer tenure workers are worse substitutes for otherwiseequivalent workers than is the case in the other two industries This suggests that theyshould get a bigger wage cut if they switch jobs as compared with similar workers inone of the other industries19
Hence although the results in the paper are suggestive I think further investigationis required before we can be confident that there really is a causal link of policy-relevant magnitude in a high-tech industry from seniority (longer tenure in a givenfirm) to lower TFP
Rudolf Winter-EbmerUniversity of Linz Institute for Advanced Studies (IHS) Vienna and CEPR
Daveri and Maliranta have produced a very interesting paper on the impact of ageand seniority on wages and productivity in Finland The main idea is that the effectsof ageing on firm productivity are very different in traditional industries as comparedto high-tech or information technology industries (electronics in their empirical analysis)Psychometric studies have shown that physical cognitive and verbal abilities havedifferent age gradients whereas physical and cognitive skills such as mathematicaland logical skills decay pretty fast organizational and verbal skills show no particularageing pattern at all (Skirbekk 2003) Daveri and Maliranta argue that ageing of theworkforce is more problematic in high-tech industries because of a faster technicalchange faster changes in production technologies and faster product developmentWhile most psychometric and other studies relate to age as such Daveri andMaliranta concentrate their argument on the impact of job tenure within a particularfirm while there is no difference between the productivity-experience and wage-experience paths in the electronics industry ndash nor in the machinery industry by theway ndash there is a significant divergence in the development of productivity and wagesas seniority in a firm increases This pattern cannot be seen in more traditionalindustries like forestry and machinery
While the general pattern of a higher interdependence between firm senioritytechnology adaptation and learning ndash and in turn productivity ndash in high-tech firmsis sensible the main empirical results seem to be out of line Productivity in electronicsfirms increases by 61 log points in the first 4 years of tenure (in fact from year 2 to
19 Using Finnish data Uusitalo and Vartiainen (2005) report that firm exits and promotions increase earnings up to age 50after which such events do not on average improve a personrsquos relative position Whether this is true of tenure and whether itdiffers across industries would be relevant evidence for the DaverindashMaliranta hypothesis
AGE SENIORITY AND LABOUR COSTS 169
year 6) but decreases in the following 6 years again by 69 log points (see Table 7) Aliteral interpretation of these results would be that workers who stay with their firmsfor more than 6 years lose more than half of their productivity they become such aburden to the firm that everybody would have to be fired otherwise the managerswould be acting completely irresponsibly This is probably not what we are seeing inthese firms
Moreover the measured effect is basically a product of a simple OLS cross-sectionregression it is much reduced and less well statistically determined if other methodsor data are used Some other possible explanations come to my mind which couldhave produced such an outcome The data relate to mean characteristics of theworkforce such as mean age and mean tenure of workers As the IT boom in Finlanddid not start before the mid 1990s I suspect that there are not many firms with meantenure of its workforce of more than 7 years ndash and if they exist they might be fairlydifferent firms with a different technology and firm organization As Daveri andMaliranta correctly state the causal impact of mean tenure on productivity cannotbe properly distinguished from matching and selection problems it is by no means acoincidence that some workers stay with the firm longer others donrsquot it is no coin-cidence why some firms stick to their complete workforce longer or to phrase itdifferently why workers want to stay longer with a particular firm Good workers staywith good firms and vice versa All these matching arguments make the strong pointthat a simple correlation between job seniority and productivity will be an upwardbiased estimate of the real causal effect of job seniority on productivity Relatedlabour economics studies on the causal effect of seniority on wages come to theconclusion that OLS estimates overestimate the true causal effect by a factor betweentwo and four (Topel 1991 Altonji and Shakotko 1987)
It has to be said though that finding convincing estimates of the relation betweenfirm employment structure and productivity is very difficult simple fixed effectsmodels using variation in the composition of the workforce over time to determine thevariation of productivity fall again prey to the criticism of reverse causality why doand how can firms change the composition of their workforce Only by changingrecruitment and lay-off policies policies which are obviously related to past andexpected productivity While the causal impact is very difficult to establish in suchstudies any work in this direction using new data sets is very interesting Furtherimportant questions come to my mind for instance concerning inter-firm mobilitywithin the industry which seems to contribute to productivity growth throughout theindustry (Parent 2000) It seems that inter-firm mobility is higher in the high-techsector which could contribute to explain the diverging pattern between seniority-productivity and experience-productivity profiles Another important issue concernswage-setting schemes If indeed high-tech sectors have a higher prevalence ofdeferred payment schemes like stock options or profit sharing in some sort or theother the relation between age or tenure and wages would be steeper and the diver-gence between wage and productivity development would shrink
170 FRANCESCO DAVERI AND MIKA MALIRANTA
The personnel economics and firm organization literature has also stressed com-plementarities in the composition of the workforce a good mix of old and youngworkers might be better for firm productivity than employing only young or only oldworkers (Lazear 1998 Grund and Westergaringrd-Nielsen 2005) It might be interestingto see whether these results hold also in the high-tech industry Such an analysiswould require looking at the age and tenure composition of the workforce in moredetail by using the underlying micro data
In my view policy conclusions are still difficult to draw from this paper MaybeFinland was not such a good experiment in this respect because its high-tech sectorhad an explosive growth after 1995 which is too short and too turbulent a period todraw firm conclusions about the effects of firm seniority and the like Replicating thestudy for another country with a more smooth development of its high-tech sectormight be a welcome complement
APPENDIX DATA SET AND VARIABLE DESCRIPTION
Similarly to the other Nordic countries Finland is endowed with a rich register dataof companies plants and individuals (see Statistics Denmark et al 2003) The uniqueidentification codes for persons companies and plants used in the different registersform the backbone of the Finnish administrative register network and the Finnishstatistical system whereby different sources of information can be integrated conven-iently for various statistical purposes20 By using this system Statistics Finland hasconstructed the Finnish Longitudinal Employer-Employee Database (FLEED) whichis tailored for various needs of economic research Its most comprehensive anddetailed version is maintained at Statistics Finland It contains information of com-panies plants and individuals Plants are linked to their companies and individualsto their employer plants and companies Data are collected from Business Register(plants and companies in the business sector) Census of Manufacturing (manufactur-ing plants) Financial Statements Statistics (companies in the business sector) RampDsurvey and ICT survey (companies in the business sector) and Employment Statistics(individuals aged between 16 and 69 years) These data include a wide variety ofdetailed information on these units A large proportion of variables are available from1990 to 2002 These data cover essentially the whole target population of companiesplants and individuals Due to confidentiality concerns outside researchers do nothave direct access to it For the outside researchers Statistics Finland has constructeda separate version of it The variable set is more limited and some of the categoricalvariables are broader (many industries are combined for example)
This paper employs plant level information for plants and workforce Productivitymeasures plant age plant size originate from the Census of Manufacturing We donot have information of the levels of value added hours worked or capital stock as
20 Data sources and linking of them is described in greater detail in Ilmakunnas et al (2001) and Maliranta (2003)
AG
E SE
NIO
RIT
Y A
ND
LA
BO
UR
CO
STS
171
Table A1 Descriptive statistics of data on plants by industry plant averages in 1995ndash2002
Variables Forest industry Machinery industry Electronics industry
Mean Sd p5 Median 95p Mean Sd p5 Median 95p Mean Sd p5 Median 95p
Log of TFP index 180 074 088 166 328 283 059 208 272 400 227 104 099 205 458Log of monthly wage (in euros)
761 024 723 759 802 769 019 736 769 800 765 023 727 767 803
Schooling years 110 04 103 110 117 116 09 106 114 136 122 12 106 119 145Age in years 396 38 333 401 450 393 40 318 398 450 356 38 294 358 416Potential experience in years
216 39 151 221 271 207 42 131 211 269 164 40 93 166 225
Seniority in years 109 56 26 108 195 92 48 27 89 175 63 33 21 53 1269
Proportion ()
Proportion ()
Proportion ()
Plant birth before 1977 570 3457 2791Plant birth 1977ndash1980 63 847 756Plant birth 1981ndash1985 55 688 407Plant birth 1986ndash1990 107 1658 2326Plant birth 1991ndash1995 99 1887 1977Plant birth 1996ndash 107 1464 1744Plant size 5ndash9 persons 18 314 317Plant size 10ndash19 persons 90 1020 685Plant size 20ndash49 persons 309 4108 3351Plant size 50ndash99 persons 217 2056 2065Plant size 100ndash persons 367 2502 3581Foreign-owned plant 62 1986 1295Plant death during 1996ndash2002
118 1922 2209
Number of plants 365 567 172
Notes The data are constructed in the Research Laboratory of Statistics Finland by linking the plants in the Finnish Manufacturing Census and individuals in the EmploymentStatistics with plant codes
Source Authorsrsquo own calculations
172FR
AN
CE
SCO
DAV
ER
I AN
D M
IKA
MA
LIR
AN
TA
Table A2 Statistical analysis behind the simulation graphs between plants estimation
Forest TFP
Forest wage
Machinery TFP
Machinery wage
Elect TFP
Elect wage
Schooling years minus3386 minus0073 0826+ 0182 1481 0310(2491) (0815) (0470) (0140) (1294) (0210)
[Schooling years]2 1503 0095 minus0285 minus0020 minus0511 minus0070(1113) (0368) (0194) (0057) (0524) (0084)
Potential experience 1017 minus0014 0171 0082+ minus0785 0007(0371) (0118) (0151) (0044) (0616) (0110)
[Potential experience]2 minus0513 0021 minus0072 minus0024 0364 minus0012(0187) (0057) (0081) (0022) (0390) (0071)
[Potential experience]3 0081 minus0005 0010 0002 minus0047 0005(0030) (0009) (0014) (0004) (0078) (0015)
Seniority in years minus0013 minus0003 minus0045 minus0020 1276 0131(0086) (0027) (0054) (0018) (0272) (0062)
[Seniority in years]2 0070 0012 0033 0022 minus1665 minus0161+(0081) (0026) (0056) (0017) (0365) (0083)
[Seniority in years]3 minus0025 minus0000 minus0008 minus0007 0622 0061+(0022) (0007) (0017) (0005) (0153) (0034)
Plant birth in 77ndash80 0237 0003 minus0051 0019 minus0088 minus0027(0119) (0032) (0066) (0029) (0154) (0044)
Plant birth in 81ndash85 0247 0059 0057 0014 minus0210 0032(0117) (0041) (0079) (0021) (0257) (0043)
Plant birth in 86ndash90 0658 0040 0255 0013 0094 0019(0104) (0027) (0057) (0018) (0209) (0046)
Plant birth in 91ndash95 0575 0026 0432 0083 0680 minus0012(0144) (0037) (0060) (0017) (0232) (0042)
Plant birth in 96ndash 0969 0052 0629 0077 0677 0029(0196) (0037) (0088) (0025) (0286) (0052)
R-squared 0545 0647 0486 0516 0527 0581Adj R-squared 0510 0620 0461 0493 0442 0505Number of plants 365 365 567 567 172 172
Notes Other control variables include dummies for plant size (5 groups) foreign-ownership and death during 1996ndash2002 Robust standard errors are shown in parentheses+ p lt 01 p lt 005 p lt 001 p lt 0001
AGE SENIORITY AND LABOUR COSTS 173
such but we do have the ratio of value added to the number of hours worked (bywhich we identify labour productivity) and the capital stock per hour worked (ameasure of the capital-labour ratio) The capital stock measure is calculated throughthe perpetual inventory method (for more details see Maliranta 2003)
Since 1995 (our main period of analysis) all plants owned by firms that employ noless than 20 persons are included Therefore since 1995 the data also include thevery small plants of multi-unit firms but on the other hand the plants of smallsingle-unit firms are left outside Some plants are dropped from the sample becauseof failure of linking some plants in the Manufacture Census to other sources ofinformation Thanks to the link between Census of Manufacturing and EmploymentStatistics we have information about plant workforce This includes the averagepotential experience (the number of years after the last completed degree) seniority(the number of years spent working in the current company) and the number ofschooling years (usually needed for the degree) The labour characteristics of theplants are computed in Statistics Finland by using the comprehensive version of thedatabase About 80ndash90 of individuals can be linked to their plants so that ourvariables should be measured with a reasonable accuracy In the analysis we havealso dropped some outliers21
REFERENCES
Acemoglu D P Aghion and F Zilibotti (2003) lsquoVertical integration and distance to frontierrsquoJournal of the European Economic Association 1(23) 630ndash38
Ali-Yrkkouml J L Paija C Reilly and P Ylauml-Anttila (2000) Nokia A Big Company in a SmallCountry ETLA The Research Institute of the Finnish Economy Series B162 Helsinki
Altonji JG and RA Shakotko (1987) lsquoDo wages rise with job seniorityrsquo Review of EconomicStudies 54 437ndash39
Aubert P and B Creacutepon (2004) Age Salaire Et Productiviteacute La Productiviteacute Des Salarieacutes Deacutecline-T-Elle En Fin De Carriegravere Technical report Mimeo Economie et Statistiques
Aubert P E Caroli and M Roger (2004) New Technologies Workplace Organisation and the AgeStructure of the Workforce Firm-Level Evidence INSEE Paris
Autor DH F Levy and RJ Murnane (2003) lsquoThe skill content of recent technologicalchange An empirical explorationrsquo Quarterly Journal of Economics 118(4) 1279ndash333
Becker GS (1962) lsquoInvestment in human capital A theoretical analysisrsquo Journal of PoliticalEconomy 70(5 Part 2 Investment in Human Beings) 9ndash49
Bingley P and N Westergaard-Nielsen (2003) lsquoReturns to tenure firm-specific human capitaland worker heterogeneityrsquo International Journal of Manpower 24(7) 774ndash88
Bishop J (1987) lsquoThe recognition and reward of employee performancersquo Journal of LaborEconomics 5(4) s36ndashs56
Blanchflower DG and AJ Oswald (1988) lsquoInternal and external influences upon pay settle-mentsrsquo British Journal of Industrial Relations 26(3) 363ndash70
Brock WA and DS Evans (1986) The Economics of Small Business Holmes amp Meier NewYork
Brown C and JL Medoff (2003) lsquoFirm age and wagesrsquo Journal of Labor Economics 21(3) 677ndash97
21 In the estimation some extreme outliers are removed from the regression analysis Identification has been carried out byusing the method of Hadi (1992 1994) The variables used in this procedure are the log of labour productivity the log ofmonthly wage the log of capital intensity schooling years and potential experience Overall a couple of percentages of plantswere dropped for being deemed outliers
174 FRANCESCO DAVERI AND MIKA MALIRANTA
Creacutepon B N Deniau and S Peacuterez-Duarte (2002) Wages Productivity and Worker Chara-cteristics A French Perspective January INSEE httpwwwcrestfrpagepersocreponCreponDeniauPerezDuarte2002pdf
Daveri F and O Silva (2004) lsquoNot only Nokia What Finland tells us about new economygrowthrsquo Economic Policy 19(38) 117ndash63
Davis SJ and J Haltiwanger (1991) lsquoWage dispersion between and within US manufactur-ing plants 1963ndash86rsquo Brookings Papers on Economic Activity Microeconomics 1991 115ndash80
Disney R J Haskel and Y Heden (2003) lsquoRestructuring and productivity growth in UKmanufacturingrsquo Economic Journal 113(489) 666ndash94
Dunne T MJ Roberts and L Samuelson (1989) lsquoThe growth and failure of US manu-facturing plantsrsquo Quarterly Journal of Economics 104(4) 671ndash98
Dygalo NN and JM Abowd (2005) lsquoEstimating experience-productivity profiles from earn-ings over employment spellsrsquo unpublished manuscript 27 November
Eriksson T and M Jaumlntti (1997) lsquoThe distribution of earnings in Finland 1971ndash1990rsquoEuropean Economic Review 41(9) 1763ndash79
Flabbi L and A Ichino (2001) lsquoProductivity seniority and wages New evidence from per-sonnel datarsquo Labour Economics 8(3) 359ndash87
Foster L J Haltiwanger and CJ Krizan (2001) lsquoAggregate productivity growth Lessonsfrom microeconomic evidencersquo in CR Hulten ER Dean amp MJ Harper (eds) NewDevelopments in Productivity Analysis (pp 303ndash63) University of Chicago Press Chicago
Griliches Z (1995) lsquoRampD and productivity Econometric results and measurement issuesrsquo inP Stoneman (Ed) Handbook of the Economics of Innovation and Technological Change (pp 52ndash89)Blackwell Publishers Ltd Oxford
Griliches Z and V Ringstad (1971) Economics of Scale and the Form of the Production FunctionNorth Holland Amsterdam 1971
Griliches Z and H Regev (1995) lsquoProductivity and firm turnover in Israeli industry 1979ndash1988rsquo Journal of Econometrics 65 175ndash203
Grund C and N Westergaringrd-Nielsen (2005) lsquoAge structure of the workforce and firm per-formancersquo IZA Working Paper No 1816 Bonn
Hadi AS (1992) lsquoIdentifying multiple outliers in multivariate datarsquo Journal of the Royal Statis-tical Society Series (B) 54 761ndash71
mdash (1994) lsquoA modification of a method for the detection of outliers in multivariate samplesrsquoJournal of the Royal Statistical Society Series (B) 56 393ndash96
Haegeland T and TJ Klette (1999) lsquoDo higher wages reflect higher productivity Educationgender and experience premiums in a matched plant-worker data setrsquo in The Creation and Analysisof Employer-Employee Matched Data (pp 231ndash59) Elsevier Science North-Holland Amsterdam
Hellerstein JK and D Neumark (1995) lsquoAre earnings profiles steeper than productivityprofilesrsquo Journal of Human Resources 30(1) 89
Hellerstein JK D Neumark and KR Troske (1999) lsquoWages productivity and workercharacteristics Evidence from plant-level production functions and wage equationsrsquo Journalof Labor Economics 17(3) 409ndash46
Ilmakunnas P and M Maliranta (2005) lsquoTechnology labour characteristics and wage-productivity gapsrsquo Oxford Bulletin of Economics and Statistics 67(5) 623ndash44
Ilmakunnas P M Maliranta and J Vainiomaumlki (2001) lsquoLinked employer-employee data onFinnish plants for the analysis of productivity wages and turnoverrsquo in T Jensen and AHolm (eds) Nordic Labour Market Research on Register Data (pp 205ndash46) TemaDord NordicCouncil of Ministers Coperhagen
mdash (2004) lsquoThe roles of employer and employee characteristics for plant productivityrsquo Journalof Productivity Analysis 21 249ndash76
mdash (2005) lsquoWorker turnover and productivity growthrsquo Applied Economics Letters 12(7) 395ndash98Juuti P (2001) Ikaumljohtaminen Kansallinen ikaumlohjelma Tyoumlministeriouml JTO-tutkimuksia No 13
HelsinkiKanazawa S (2003) lsquoWhy productivity fades with age The crime-genius connectionrsquo Journal
of Research in Personality 37 257ndash72King G M Tomz and J Wittenberg (2000) lsquoMaking the most of statistical analyses Improving
interpretation and presentationrsquo American Journal of Political Science 44(2) 347ndash61Kouvonen A (1999) Ikaumlsyrjintaumlkokemukset Tyoumlssauml Ja Tyoumlhoumlnotossa Tyoumlpoliittinen tutkimus No 203Koumllling A C Schnabel and J Wagner (2005) lsquoEstablishment age and wages Evidence from
German linked employer-employee datarsquo in L Bellmann O Huumlbler W Meyer and
AGE SENIORITY AND LABOUR COSTS 175
G Stephan (eds) Institutionen Loumlhne Und Beschaumlftigung (pp 81ndash99) Nuumlrnberg httpwwwwisouni-erlangendeforschungforschungsberichteforschungsbericht2005pdf
Lazear EP (1981) lsquoAgency earnings profiles productivity and hours restrictionsrsquo AmericanEconomic Review 71(4) 606ndash20
mdash (1998) Personnel Economics for Managers John Wiley and Sons New YorkMaliranta M (1997) lsquoPlant Productivity in Finnish Manufacturing ndash Characteristics of High
Productivity Plantsrsquo The Research Institute of the Finnish Economy (ETLA) DiscussionPaper No 612 Helsinki
mdash (1999) lsquoFactors of performance by plant generation Some findings from Finlandrsquo in SBiffignandi (ed) Micro- and Macrodata of Firms Statistical Analysis and International Comparison(pp 391ndash424) Physica Heidelberg
mdash (2003) Micro Level Dynamics of Productivity Growth An Empirical Analysis of the Great Leap inFinnish Manufacturing Productivity in 1975ndash2000 The Research Institute of the Finnish Econ-omy (ETLA) Series A 38 (available at httpwwwetlafifiles1075_micro_level_dynamicspdf )Helsinki
Maliranta M and P Rouvinen (2004) lsquoICT and business productivity Finnish micro-levelevidencersquo in The Economic Impact of ICT Measurement Evidence and Implications (pp 213ndash40)OECD Paris
Manning A (2000) lsquoMovin on up Interpreting the earnings-experience profilersquo Bulletin ofEconomic Research 52 261ndash95
Medoff JL and KG Abraham (1980) lsquoExperience performance and earningsrsquo QuarterlyJournal of Economics 95(4) 703ndash36
mdash (1981) lsquoAre those paid more really more productive The case of experiencersquo Journal ofHuman Resources 16(2) 186ndash216
Moen J (2005) lsquoIs mobility of technical personnel a source of RampD spilloversrsquo Journal ofLabor Economics 23(1) 81ndash114
Neuman S and A Weiss (1995) lsquoOn the effects of schooling vintage on experience-earningsprofiles Theory and evidencersquo European Economic Review 39(5) 943ndash55
Nurmi S (2004) Essays on Plant Size Employment Dynamics and Survival Helsinki School ofEconomics A-230 Helsinki
OECD (2003) OECD Science Technology and Industry Scoreboard OECD Parismdash (2004) Ageing and Employment Policies Finland OECD Parismdash (2006) Live Longer Work Longer OECD ParisOrsquoMahony M and B Van Ark (eds) (2003) EU Productivity and Competitiveness An Industry Perspec-
tive Can Europe Resume the Catching-Up Process European Commission Enterprise PublicationsParent D (2000) lsquoIndustry-specific capital and the wage profile Evidence from the NLSY
and the PSIDrsquo Journal of Labor Economics 18(2) 306ndash23Productivity Commission (2005) Economic Implications of an Ageing Australia Research Report
Canberra (httpwwwpcgovaustudyageingfinalreport)Sapir Report (2004) An Agenda for a Growing Europe Oxford University Press OxfordSkirbekk V (2003) Age and Individual Productivity A Literature Survey MPIDR Working Paper
No 2003-028Statistics Denmark Statistics Finland Statistics Iceland Statistics Norway and Statistics
Sweden (2003) Access to Microdata in the Nordic Countries Statistics Sweden OumlrebroTeulings C and J Hartog (1998) Corporatism or Competition Cambridge University Press CambridgeTomz M J Wittenberg and G King (2003) Clarify Software for Interpreting and Presenting
Statistical Results (Version 21) Stanford University University of Wisconsin and HarvardUniversity 5 January Available at httpgkingharvardedu
Topel RH (1991) lsquoSpecific capital mobility and wages Wages rise with job seniorityrsquo Journalof Political Economy 99 145ndash76
Troske KR (1999) lsquoEvidence on the employer size-wage premium from worker-establishmentmatched datarsquo Review of Economics and Statistics 81(February) 15ndash26
Uusitalo R and J Vartiainen (2005) lsquoFinland Firm factors in wages and wage changesrsquounpublished manuscript 9 June
Verhaegen P and TA Salthouse (1997) lsquoMeta-analyses of age-cognition relations in adult-hood Estimates of linear and nonlinear age effects and structural modelsrsquo PsychologicalBulletin 122(3) 231ndash49
Winter-Ebmer R (2001) lsquoFirm size earnings and displacement riskrsquo Economic Inquiry 39(3)474ndash86

AG
E SE
NIO
RIT
Y A
ND
LA
BO
UR
CO
STS
143Table 5 Statistical analysis of the determinants of plant productivity and wages Industrial machinery
OLS IV Fixed effects
Cross-section Cross-section Panel
[1] [2] [3] [4] [5] [6]
Panel a ProductivityAge 0103 0005
(0079) (0005)Age2 minus0013
(0010)log of tenure 0135 minus0081 minus0035 0077
(0191) (0050) (0114) (0087)[log of tenure]2 minus0062
(0051)Potential experience 0014 0012+ minus0003 minus0014
(0007) (0007) (0011) (0009)Schooling years 0124 0125 0138 0137 0086 0035
(0026) (0026) (0028) (0028) (0028) (0034)Schooling y (tminus1) 0001
(0037)Schooling y (tminus2) 0102
(0036)R-squared 0394 0392 0397 0395 0219Adj R-squared 0378 0377 0380 0380 0193 0212R-squared within 0049Observations 567 567 567 567 348 1717Overident test 0351Relevance test 0000Panel b WagesAge 0105 0015
(0024) (0002)
144FR
AN
CE
SCO
DAV
ER
I AN
D M
IKA
MA
LIR
AN
TA
Age2
minus0012(0003)
log of tenure 0074 minus0012 0097+ 0056(0073) (0017) (0055) (0024)
[log of tenure]2 minus0025(0019)
Potential experience 0017 0016 0008 0003(0002) (0002) (0005) (0002)
Schooling years 0117 0117 0133 0133 0124 0065(0008) (0008) (0008) (0008) (0011) (0010)
Schooling y (tminus1) 0005(0010)
Schooling y (tminus2) 0019+(0010)
R-squared 0470 0454 0457 0455 0437Adj R-squared 0457 0441 0442 0441 0419 0836R-squared within 0871Observations 567 567 567 567 348 1717Overident test 0024Relevance test 0000
Notes Dependent variable is logarithm of plant productivity in panel a and log of wages in panel b Other control variables (results not reported) for models reported in columns[1]ndash[4] include a dummy variable for foreign-owned plant one for plants that disappear in 1996ndash2002 and other dummies for plant vintage groups (6 groups) and size groups(5 groups) In column [5] seniority is instrumented with a set of lagged variables (the average in the period 1990ndash94) They include schooling years potential experiencepotential experience squared seniority and seniority squared In column [5] high p-values (gt 10) for the over-identification test (Hansen J statistics) indicate that the validityof the instruments cannot be rejected and low p-values (lt 01) of relevance test (Anderson canonical correspondence LR statistic) gives indication that the employedinstruments are relevant in productivity but not in wage estimation+ p lt 01 p lt 005 p lt 001 p lt 0001
OLS IV Fixed effects
Cross-section Cross-section Panel
[1] [2] [3] [4] [5] [6]
Table 5 Continued
AG
E SE
NIO
RIT
Y A
ND
LA
BO
UR
CO
STS
145Table 6 Statistical analysis of the determinants of plant productivity and wages Electronics
OLS IV Fixed effects
Cross-section Cross-section Panel
[1] [2] [3] [4] [5] [6]
Panel a ProductivityAge minus0408 0024
(0377) (0026)Age2 0061
(0053)log of tenure 1741 minus0062 2380+ 0937
(0749) (0232) (1443) (0599)[log of tenure]2 minus0549 minus0639+ minus0356+
(0230) (0349) (0184)Potential experience 0028 0030 minus0013 minus0010
(0035) (0036) (0045) (0032)Schooling years 0180 0178 0182 0207 0191 minus0043
(0064) (0064) (0071) (0070) (0055) (0082)Schooling y (tminus1) minus0007
(0090)Schooling y (tminus2) 0182
(0081)R-squared 0301 0290 0320 0291 0308Adj R-squared 0239 0232 0254 0228 0211 minus0203R-squared within 0086Observations 172 172 172 172 98 496Overident test 0258Relevance test 0000Panel b WagesAge minus0046 0019
(0061) (0004)Age2 0009
(0009)
146FR
AN
CE
SCO
DAV
ER
I AN
D M
IKA
MA
LIR
AN
TA
log of tenure 0192+ 0031 0528 0250+(0112) (0044) (0420) (0146)
[log of tenure]2 minus0049 minus0107 minus0068(0033) (0105) (0045)
Potential experience 0016 0016 0008 0020(0006) (0006) (0012) (0008)
Schooling years 0123 0123 0137 0140 0145 0160(0010) (0009) (0011) (0011) (0015) (0020)
Schooling y (tminus1) 0120(0022)
Schooling y (tminus2) 0134(0020)
R-squared 0536 0530 0537 0532 0617Adj R-squared 0494 0492 0492 0491 0563 0493R-squared within 0615Observations 172 172 172 172 98 496Overident test 0001Relevance test 0000
Notes Dependent variable is logarithm of plant productivity in panel a and log of wages in panel b Other control variables (results not reported) for models reported in columns[1]minus[4] include a dummy variable for foreign-owned plant one for plants that disappear in 1996ndash2002 and other dummies for plant vintage groups (6 groups) and size groups(5 groups) In column [5] seniority is instrumented with a set of lagged variables (the average in the period 1990ndash94) They include schooling years potential experiencepotential experience squared seniority and seniority squared In column [5] high p-values (gt 10) for the over-identification test (Hansen J statistics) indicate that the validityof the instruments cannot be rejected and low p-values (lt 01) of relevance test (Anderson canonical correspondence LR statistic) gives indication that the employedinstruments are relevant in productivity but not in wage estimation
+ p lt 01 p lt 005 p lt 001 p lt 0001
OLS IV Fixed effects
Cross-section Cross-section Panel
[1] [2] [3] [4] [5] [6]
Table 6 Continued
AGE SENIORITY AND LABOUR COSTS 147
432 Seniority matters for productivity more often than experience butdifferently in traditional and high-tech industries The discussion inSection 2 invites thinking of why age may (or may not) be associated with productivityIt does so suggesting that the process of human capital accumulation takes placewithin the firm and outside the firm Lumping together the two effects (as implicitlydone in the empirical formulations underlying the results in columns [1] and [2] whereage as such is related to productivity) may obscure that the two forms of humancapital accumulation need not bear the same returns The importance of distinguishingthese two sources of skills in the analysis of productivity effects is emphasized forinstance by Ilmakunnas et al (2004) and Dygalo and Abowd (2005) For example theaccumulation of knowledge that occurs through seniority may be productivity-enhancingwhile the accumulation of human capital that occurs through the acquisition ofoverall labour market experience may not contribute positively In the statistical anal-ysis underlying the results in columns [3]ndash[6] we dropped this restriction We findthat the statistical significance of seniority and potential experience is indeed differentfrom each other This also holds across industries and across estimation methods Theoverall goodness of fit of IV and FE-based specifications drops significantly
In the forest industry as well as in electronics we find that seniority not potentialexperience is positively related to productivity Our formulation (in logs and logssquared so as to obtain the best fit of the data) also implies that the effect of seniorityon productivity depends on its starting level
One additional year of seniority for a freshly hired worker adds to productivity less thanit adds for a senior worker who has spent a considerable number of years within the samefirm In other words there are positive but diminishing returns to seniority In the electronicsindustry the returns to seniority decline so much to become negative beyond a certainthreshold These results are well determined when using the period-averaged cross-sectionof plants and are still there ndash though less precisely measured ndash even when seniority isinstrumented to allow for possible feedback effects from the lagged values In the forestindustry the correlation disappears when the time variation of the data is considered throughfixed-effects estimation while a weaker correlation survives for plants in electronics
In the industrial machinery plants instead potential experience positively corre-lates though at the usual declining rates with productivity Seniority is instead notsignificantly related to productivity in a statistical sense in this industry The patternof partial correlations in this industry is however somewhat statistically weaker thanfor the other industries for they do not survive when other methods of estimationthan the cross-section OLS are employed This is a symptom that our statisticalmodel that links plant productivity to human capital variables is not equally effectivein capturing the determinants of plant productivity in all industries
433 Wage and productivity profiles are dissimilar from each other inelectronics and similar in the other industries In our data set searchingfor wage determinants is a more successful undertaking than searching for productivity
148 FRANCESCO DAVERI AND MIKA MALIRANTA
determinants The line interpolating the data explains more than 50 of the totalvariability of plant wages in the forest industry and in electronics and more than 40of the total in industrial machinery even when the time dimension of the data set isconsidered Among the age-related variables seniority drives wages in forest andexperience drives wages in the industrial machinery industry Notably the seniority-wage profile in the lower panel is not too far apart from the seniority-productivityprofile estimated in the upper panel for the forest industry The same applies toexperience-wage and experience-productivity profiles for industrial machineryalthough it should be kept in mind that as emphasized above the statistical relationis much less precisely measured for the plants in this industry
When it comes to electronics the picture instead changes substantially Wagesdepend positively but to a declining extent on both tenure and experience in thecross-section of plants This result is still there when the time variation of the paneldata set is considered through fixed-effects estimation This correlation is instead notthere when variables are instrumented by their lagged values
We interpret these results as showing that the profiles of wages and productivitywith respect to age-related variables are significantly different from each other inelectronics Wages keep going up though at declining rates with both seniority andexperience while the seniority-productivity profile follows a very different path madeof definite increases when seniority is low and a flattening out which also involvessheer productivity declines as seniority goes beyond a given threshold
44 More results
The statistical analysis underlying Tables 4 5 and 6 also includes some ancillaryresults on the determinants of plant productivity and wages concerning educationand plant age The important implication of these additional results is that the cor-relations between age-related variables productivity and wages (discussed above) donot hinge on the omission of other important determinants of plant productivity andwages Reassuringly education and plant age affect productivity and wages as expectedbut consideration of these additional elements does not cancel our main results
441 Education is positively related to productivity and wages The earningsequations estimated by labour economists routinely include education as an explan-atory variable and make inference as to the rate of return on additional years ofeducation And even the importance of workersrsquo educational levels in determiningplant productivity can hardly be overstated
In our statistical analysis education turns out always positively related to wages inthe three industries with estimated coefficients ranging between 012 and 015 Yetthe estimated coefficient is bigger in forest than in more technologically advancedindustries As to its effects on productivity they seem to be instead ranked in decreas-ing order of the technological level of the industry at hand Education is positively
AGE SENIORITY AND LABOUR COSTS 149
and sizably related to plant productivity in electronics with a bigger coefficient thanin industrial machinery No relation is there for the forest industry
When the time series dimension is considered these effects are present only whenthe delayed values of the explanatory variables are considered instead of the currentones Education is indeed positively associated with productivity with a delay of abouttwo years (the lagged value of education is almost significantly related to productivitythough with a small coefficient even for the forest industry)
Altogether these effects indicate that high-education workers in more advancedindustries are in some way lsquoexploitedrsquo while high-education people in forestry enjoya rent The idea that high-education people accept lower wages possibly in exchangefor a bright future to buy the lottery of working in dynamic plants and industries isconsistent with anecdotal evidence from Finnish newspapers10
442 Newer plants are more productive Another ancillary result underlyingTables 4 5 and 6 is that older plants tend to be less productive than newer plantsThis effect is consistently present for the three industries These results are notreported in the tables for brevity but are anyway singled out and pictured in Figure 1
Figure 1 shows a graphical illustration of productivity and wage effects of plantvintage whereas the horizontal bars indicate the average effects of plant vintage onproductivity (printed light grey) and wages (printed dark grey) with 95 confidenceintervals appended The evidence in the graph points to the marked quantitativerelevance of such effects Younger plants are indeed definitely more productive in allindustries This also holds for wages though the effect is much less marked Theseresults are consistent with the literature briefly surveyed in Box 511
45 Implications of our main results a numerical illustration
If theory and the related empirical findings were to imply that the effect of age-related variables on productivity is always the same irrespective of age seniority orexperience one might easily compute the numerical effect of ageing on productivityThe estimated coefficient would tell us by how many percentage points productivityvaries as a result of a unit change in the age or seniority of a given person (or theaverage age of a typical worker in a given plant)
Unfortunately psychometric studies and the economics of human capital teach usthat the world is more complicated and the effect of age on productivity may changeits sign from positive into negative starting from some threshold age onwards Thisraises the empirical questions of where (at which year of age seniority or experience) this
10 A more academic argument following more or less the same lines is in Moen (2005)11 Maliranta (1999) experimented with alternative capital stock measures (perpetual inventory method vs fire insurance valueof capital stock) They yielded quite similar results for the plant vintage effects More recent Finnish evidence of the plant vintageeffects include Ilmakunnas et al (2004) and Ilmakunnas and Maliranta (2005)
150 FRANCESCO DAVERI AND MIKA MALIRANTA
Figure 1 An illustration of productivity and wage effects of plant vintage
Notes Bars indicate the log difference of total factor productivity and monthly wage with respect to the reference group (plants established in 1976 or earlier) Error bars around the mean bars indicate 95 confidence inter-vals The estimates are from the models presented in column [3] of Tables 4ndash6
AGE SENIORITY AND LABOUR COSTS 151
threshold is Moreover having found that the returns to seniority decline with seniorityor as in electronics actually become negative it remains unclear by how much they decline
Box 5 Old plants old workers productivity and wages
Old-aged firms may be less productive and disproportionately hire old-ageworkers The evidence on the relation between firm age and productivity isnot abundant though Dunne et al (1989) report that manufacturing plantsthat have been in business longer are less likely to close and Brock and Evans(1986) show that older firms are less likely to fail (controlling for plant and firmsize respectively) This may partly explain why older workers tend to stick withthese probably less productive but more financially sound firms
On the other hand it has often been found that older firms pay higher wagesafter controlling for other relevant firm characteristics This is often taken toreflect the quality (and thus the higher productivity) of the workers they hireas well as the working conditions they offer Yet as discussed in the main textthis need not be the case Older firms may pay higher wages to extend fringebenefits such as pensions or health insurance to their most faithful workers ormore subtly because they cannot deny pay raises to people who have devel-oped a good knowledge of the companyrsquos ability to pay throughout the years
Davis and Haltiwanger (1991) find that older manufacturing plants indeedpay higher wages and age remains a significant determinant of wages onceindustry region and size differences are accounted for with and without con-trolling for the probability that the plant will close (usually lower for olderfirms) Troske (1999 Table 1111) reports similar results controlling for employersize and location workers in plants that are less than 5 years old earn nearly20 less than workers in plants that have been in business 15 years or moreBlanchflower and Oswald (1988) find no significant relationship betweenwages and years in operation in British data while Winter-Ebmer (2001) founda positive relation with Austrian data The very careful study by Koumllling et al (2005)shows that in Germany older firms pay on average higher wages for workerswith the same broadly defined degree of formal qualification More recentlyBrown and Medoff (2003) have analysed the relationship between how long anemployer has been in business (firm age) and wages According to their analysisfirms that have been in business longer pay higher wages (as previous studieshave found) but pay if anything lower wages after controlling for workercharacteristics There is some evidence that the relationship is not monotonicwith wages falling and then rising with the number of years in business
Finally regarding evidence with Finnish data Nurmi (2004) finds that oldand large firms are less likely to fail and less sensitive to exogenous shocks thanyoung and small firms
152 FRANCESCO DAVERI AND MIKA MALIRANTA
In this section we employ statistical simulation ndash a quantitative technique thatallows one to describe complicated phenomena in a flexible way (how is described inthe top part of Box 5) ndash to illustrate these issues
The simulation results are then translated out of the jargon using CLARIFY theuser-friendly software developed by Harvard political scientists Gary King MichaelTomz and Jason Wittenberg (King et al 2000 Tomz et al 2003) expressly for deliv-ering the results of the application of even complicated quantitative techniques to awider audience not necessarily trained in statistics but still interested in achieving arather precise knowledge of the quantitative aspects of economic and social issues (seemore details in the bottom part of Box 6)
Box 6 Numerical simulations through CLARIFY
a The issueThe starting point may be a standard multivariate regression exercise wherethe statistical relation between a dependent variable (say productivity) and ahost of potential explanatory variables (say age education and so on) isinvestigated The result of a regression exercise usually consists of quantitativeinformation (lsquoestimated coefficientsrsquo) on the sensitivity of the dependent variableto each of the explanatory variables while holding the other explanatoryvariables constant This piece of information is however subject to varioussources of uncertainty (the statistical model may be wrong or incomplete theavailable information on the explanatory variables may be incomplete as wellsome variables of interest may be outright unobserved) Hence this lsquopartialcorrelationrsquo may thus be more or less precisely estimated If the researcherobtains a precise estimate the quantitative implication of his-her research maybe trusted otherwise not
b Simulation-based approach to interpreting statistical resultsAmong other things numerical (so called lsquoMontecarlorsquo) simulation essentiallyapplies survey sampling techniques to proxy complicated (but presumablymore realistic) mathematical relations and eventually determines how trust-worthy the results of a given regression are In surveys random sampling fromthe population of interest is commonly used to estimate key features (such asmean and variance) of such population with the precision of the estimateincreasing in sample size Simulation essentially follows the same logic to learnabout probability distributions of estimated coefficients not populations In thesame fashion as with real samples approximations can be computed to anydesired level of precision by varying the number of simulations
AGE SENIORITY AND LABOUR COSTS 153
c How statistical simulation works in practice through the software CLARIFYStart from a set of point-wise estimated coefficients of age education and theother variables set out to explain productivity Each of these coefficients has asampling distribution The central limit theorem guarantees that for a largeenough sample one can randomly draw (lsquosimulatersquo) coefficient (lsquoparameterrsquo)values from a multivariate normal distribution with mean equal to the pointestimates of the coefficients and variances equal to the estimated variance andcovariance matrix of the point-wise estimates By random drawing one canobtain a realization of the estimated coefficients on average consistent withtheir point-wise estimates This is the result of one simulation round Thisexperiment can be repeated many times at will (clearly if the coefficient wereprecisely known each draw would be identical) and many values for the esti-mated coefficient of interest computed Each coefficient can then be multipliedby the value of its corresponding explanatory variable (age) The variability inthe values of the simulated coefficients translates in variability (randomness) ofthe expected value of productivity (the dependent variable) while the effectsof the other variables on productivity are held constant at their means
As a result we can compute (and graph) the average partial effect of age onproductivity and also confidence intervals that delimit the degree of trustworthi-ness of such an average To sum up in our case the true relation between age andproductivity is likely complicated for the effect of age on productivity may bepositive or negative depending on age If this is the case describing the resultsof statistical analysis becomes rapidly cumbersome and only imperfectly relatedto the question at hand King et al (2000) have developed a software program(CLARIFY) that without changing any underlying data or statistical assumptionprovides interpretation-friendly and graphical answers to the questions of interest
Figures 2 and 3 are the outputs of CLARIFY and concern respectively theseniority and experience profiles of productivity and wages estimated through OrdinaryLeast Squares from the period-averaged cross-section of plants12 Being OLS cross-sectionalOLS estimates they suffer from many of the biases whose shortcomings have beenextensively discussed above Although precisely tracking the overall direction of thebiases is not easy the reported results likely represent upper bound estimates andthey include both skill depreciation and worker reallocation effects
The statistical simulations underlying Figures 2 and 3 and Table 7 (based on thosefigures) revolve around the multivariate statistical analysis whose point-wise resultsand significance are reported in Table A2 in the appendix To maximize the goodness
12 To compute the necessary confidence intervals CLARIFY requires relatively precisely estimated coefficients be imputed Thisis why we use OLS cross-sectional estimates with the caveats in the main text
154 FRANCESCO DAVERI AND MIKA MALIRANTA
Figure 2 Productivity and wage responses to seniority simulation analysis from estimates in Table A2
Notes See Box 6 for a detailed explanation of how such profiles are constructed
AGE SENIORITY AND LABOUR COSTS 155
Figure 3 Productivity and wage responses to potential experience simulation analysis from estimates in Table A2
Notes See Box 6 for a detailed explanation of how such profiles are constructed
156FR
AN
CE
SCO
DAV
ER
I AN
D M
IKA
MA
LIR
AN
TA
Table 7 Simulations of cumulated productivity and wage responses under various settings
Difference
from to in log of TFP in log of monthly wage
Mean Std err t-value Mean Std err t-value
SeniorityForestSeniority in years 7 17 038 015 260 023 004 581and other variables at their means at their meansMachinerySeniority in years 7 17 000 008 001 002 003 073and other variables at their means at their meansElectronicsSeniority in years 2 6 107 032 331 013 007 183and other variables at their means at their meansSeniority in years 6 10 minus068 020 minus334 minus003 005 minus061and other variables at their means at their meansPotential ExperienceForestExperience in years 15 25 minus040 017 minus233 008 005 169and other variables at their means at their meansMachineryExperience in years 13 20 012 007 177 015 002 776and other variables at their means at their meansElectronicsExperience in years 10 16 minus048 022 minus222 002 005 046and other variables at their means at their meansExperience in years 16 22 049 025 195 012 006 213Other variables at their means at their means
AG
E SE
NIO
RIT
Y A
ND
LA
BO
UR
CO
STS
157
Seniority and experience combinedForestSeniority in years 7 17 minus002 012 minus016 031 004 822and experience in years 15 25and other variables at their means at their meansMachinerySeniority in years 3 10 004 007 053 015 002 662and experience in years 13 20and other variables at their means at their meansElectronicsSeniority in years 2 6 061 029 211 014 005 271and experience in years 10 14and other variables at their means at their meansSeniority in years 6 12 minus069 025 minus277 005 005 106and experience in years 14 20and other variables at their means at their means
Notes Simulations are based on the same regression models (results in Table A2) used for drawing Figures 2ndash3 lsquoMeanrsquo indicates the log difference of productivity (or wage)levels Multiplying the number by 100 provides an approximation of percentage difference in productivity (or wage) levels in the different hypothetical situations For moredetails on how these figures are computed see Box 6
Difference
from to in log of TFP in log of monthly wage
Mean Std err t-value Mean Std err t-value
Table 7 Continued
158 FRANCESCO DAVERI AND MIKA MALIRANTA
of fit of the interpolating line the empirical specification underlying the graphs is moreflexible than those in Tables 4 5 and 6 This boils down to appending more polynomialterms of the same variables to the list of the productivity and wage determinantsin addition to the linear and squared terms present in the tables seen above
In each figure along the vertical axis one reads the marginal response of thedependent variables (logarithms of TFP and wages) to changes in seniority experi-ence and education years measured along the horizontal axis Such responses aredefined over the interval of values taken by each explanatory variable in the industryat hand The thick and dotted lines indicate respectively the average marginalresponse of TFP and wages (with the average taken over the very many potentialvalues of the coefficients of interest) The dot-shaded and line-shaded intervalsaround such estimated average responses represent confidence intervals which pro-vide an indication of the degree of precision of the simulated estimates
451 Seniority profiles (Figure 2) Productivity and wage responses to thecross-section variability in the number of seniority years are very similar to each otherin the forest industry (both growing fast) and in industrial machinery (both essentiallyflat once confidence intervals are taken into account) From the figures reported inthe upper part of Table 7 one learns that moving from a plant with a seniority of 7years for the average worker to a plant with seniority equal to 17 having set the otherdeterminants of productivity to their means results in a productivity increase of 38in the forest industry In electronics the seniority-productivity profile follows a well-defined inverted-U shape while the wage is mildly increasing These trends corre-spond to a swift positive productivity response of cumulated 107 as one shift fromplants with an average worker seniority of two years to plants with worker seniorityequal to six years (with wages going up more moderately) If one moves further byanother four years from plants with seniority equal to six to plants with seniorityequal to ten productivity undergoes a (relative) shortfall of cumulative 68 withroughly unchanged wages These are huge numbers As mentioned in the caveatabove however they are upper bound estimates also inclusive of worker reallocationeffects It should be noted though that very drastic declines in relative productivitylevels with age have been documented for other countries such as France in theliterature (see eg Figure 44 in Productivity Commission 2005)
452 Experience profiles (Figure 3) Productivity and wage responses to thecross-section variability in the years of potential experience are much less preciselyestimated particularly for productivity This may be the result of multi-collinearitybetween experience and seniority which may be at the origin of the initially down-ward sloping response of productivity to experience in the forest industry and inelectronics In industrial machinery one finds instead plausible results with positivewage and productivity responses to experience (with wages and productivity by 15and 12 respectively over 7 years see Table 7) A possible way out is to compute the
AGE SENIORITY AND LABOUR COSTS 159
implied productivity response of both higher experience and seniority (after all if aworker stays with the same plant heshe acquires both experience and seniority atonce) When this is done (see the results in the lower panel of Table 7 lsquoSeniority andexperience combinedrsquo) one finds an essentially flat productivity response to the com-bination of seniority and experience and a moderately positive wage response for acumulated 15 over 7 years of time The combination of seniority and experienceleaves the results for electronics qualitatively unchanged instead When the numberof seniority and experience years is relatively low moving from low-seniority and low-experience plants to high-seniority and high-experience plants corresponds to acumulated productivity increase of about 60 When this is done moving fromintermediate to high levels of seniority and experience the productivity shortfall is ofabout 70 Wages do not follow suit instead but keep going up
46 Summing up and discussion
Our statistical analysis provides a reasonably coherent picture of the empirical rela-tion between age seniority and experience on the one hand and plant productivityand wages on the other in Finland in the years of the IT revolution
At first sight our results seem to support the view that workforce ageing as suchhas adverse effects on labour costs Age is essentially unrelated to productivity whileit is positively correlated with wages As we distinguish the effects of seniority onproductivity and wages from those of general experience though we find that thepicture is more complicated and sharply differs across industries (see Box 7 for a surveyof other studies emphasizing industry differences in productivity and wage profiles)
Box 7 Previous statistical evidence on age seniority experienceproductivity and wages
About 25 years ago Medoff and Abraham (1980 1981) used performanceevaluation to gauge separate information about individual productivity andwage profiles They found that wages do not necessarily reflect productivityBishop (1987) and Flabbi and Ichino (2001) also put together measures ofindividual productivity following the Medoff and Abraham methodology andconfirming their results with other data sets
Hellerstein et al (1999) using US data find that productivity and wagesincrease with age except for the oldest age group in some specifications andtheir patterns are fairly similar Creacutepon et al (2002) use French data andconclude that the relationship of productivity and age follows an inverted U-shape but wage is increasing in age In manufacturing wage increases withskill level but productivity increases even more In non-manufacturing wage
160 FRANCESCO DAVERI AND MIKA MALIRANTA
increases more than productivity as skill levels go up Haegeland and Klette(1999) use Norwegian data and find that productivity and wage increase witheducation and the highly educated go hand in hand by productivity Medium-level potential experience (age minus education years) gave higher productivitythan short experience but with long experience productivity declined althoughstill stayed higher than with short experience Medium-level experience wasunderpaid but the wage premium for long experience corresponded to theproductivity premium They concluded that the wage-experience profile onlypartly reflected the productivity profile
Only a few scholars have looked at cross-industry heterogeneity of produc-tivity and wage responses Aubert and Creacutepon (2004) estimated average earn-ings relations for France and found evidence of declining productivity after theage of 55 but they found that the age-productivity profile (as captured by suchearnings functions) does not differ much across industries In contrast Aubertet al (2004) estimated labour demand curves by using wage bill shares condi-tioned on value added as well as old and new economy capital they did findsignificant evidence that innovative firms and work-practices present lowerwage bill shares
The same result seemingly applies within occupational groups for othercountries Similarly to our findings here Neuman and Weiss (1995) found thatearnings peaks are located earlier in age in the high-tech sector Hellersteinand Neumark (1995) using Israeli data find that earnings and productivityprofiles are fairly similar for the relatively less skilled workers (the group thatcovers most of the workforce)
Other studies have in turn found that the relation has changed over timeThe seniority-wage profile has seemingly become steeper and its peak movedforwards in Denmark as a result of the decentralization of wage determination(Bingley and Westergaard-Nielsen 2003) Eriksson and Jaumlntti (1997) found thatin 1971 the peak of the wage profile was at the age group 35ndash39 years but hasthen moved forward being at the age group 45ndash49 years in 1990 in Finland
Finally a host of previous studies indeed highlights the productivity-enhancingrole of worker mobility between plants The mobility of workers has anadditional important productivity effect that goes beyond the lsquowithin firmrsquoeffect discussed above and examined in this paper lsquoChurningrsquo of plantsfirms(ie simultaneous entries and exits) has been found to have a dominant role inindustry productivity growth Thanks to this mechanism a workerrsquos produc-tivity may improve greatly when she moves from a low productivity plantfirmto a high productivity plantfirm (Foster et al 2001 Disney et al 2003) Withthe data from the Finnish manufacturing sector Maliranta (2003) finds that theaverage productivity growth rate of the plants is typically 50ndash70 of the industry
AGE SENIORITY AND LABOUR COSTS 161
productivity growth rate which is due to the fact that entries but especially exitsand the reallocation of labour and capital between the continuing plants have animportant role to play as well This gap between industry and plant productivitygrowth has been particularly pronounced in the Finnish electronics industrysince the latter part of the 1980s but has also been substantial for instance inthe textile and wearing industry during the latter half of the 1980s and in the basicmetal industry during the latter half of the 1980s and the first half of the 1990s
Returns to seniority are usually positive but declining with the level of seniority inthe forest industry plants about the same applies to earnings profiles Similar consid-erations hold for the productivity and wage effects of general experience in industrialmachinery although the estimated relation is statistically less solid The similarity ofthe productivity and wages responses to the accumulation of human capital indicatesthat in lsquoaveragersquo industries skill depreciation does not seemingly lead to higherlabour costs And given that these industries are still quantitatively important in theFinnish economy wage-productivity misalignments cannot be the main explanationfor the bad labour market performance of the elderly in Finland
The picture is quite different for the high-tech plants In electronics ndash the industrywhere people are exposed to rapid technological and managerial changes ndash theresponses of plant productivity and wages to seniority are very different from eachother The seniority-productivity profile shows a positive relation first and then negativeas one looks at plants with higher average seniority while wages instead keep goingup with seniority13 This holds for plants with similar education plant age and sizeand other conditions and is thus not related to plant differences in these other respectsHow negative the productivity returns to seniority may become cannot be said withcertainty Numerical simulations based on our OLS cross-sectional results indicatethat the change of sign in the seniority-productivity profile may be pronounced
Altogether our results are consistent with the idea that fast technical change bringsabout accelerated skill depreciation of senior workers We cannot honestly rule outhowever that our correlations may also be the result of worker movements acrossplants The negative correlation between seniority and productivity may in fact alsoreflect the reallocation away of younger (and more productive) workers who leavebehind older plants attracted by the career prospects offered in newly born high-productivity firms and plants14 We cannot precisely quantify the relative importance
13 This is not too surprising as recently discussed at length by Uusitalo and Vartiainen (2005) the combination of highlycentralized collective agreements with relatively autonomous but still highly unionized industry wage setting has resulted in avery low weight (44 on average) given to performance-related firm-level corrections of wages14 Evidence on the importance of reallocation for productivity purposes was indeed provided by Ilmakunnas et al (2005) for theFinnish manufacturing sector where it was shown that the churning of workers (ie simultaneous hiring and separation ofworkers within a plant) speeds up plant productivity growth while holding back seniority
162 FRANCESCO DAVERI AND MIKA MALIRANTA
of the two effects in our statistical analysis Both skill depreciation and worker reallo-cation appear to affect the relation between seniority and productivity in the Finnishhigh-tech industry
It looks as though the deferred compensation hypothesis perhaps amended withthe insights from sorting and matching theories fits better the labour market facts inhigh-tech industries than the human capital hypothesis Yet the evidence for thelsquoaveragersquo industries is not consistent with this hypothesis This is an open issue thatwe briefly discuss further in the concluding section
5 CONCLUSIONS
We started this paper asking ourselves whether we could explain the weak labourmarket position of older workers The simultaneous presence of a relatively aged ndashand still rapidly ageing ndash workforce and a major external shock (such as the ITrevolution of the late 1990s) makes Finland a nice experiment to address this questioninvestigating the diverse responses of wages and productivity to age seniority andexperience patterns across industries
Our results do not indicate that age as such is responsible for the bad labourmarket outcomes of the elderly The differential effect of seniority and experienceon productivity and earnings is minor for two of the three Finnish manufactur-ing industries (the lsquoaveragersquo ones) we chose to analyse These productivity andwage patterns probably reflect the relatively more valuable role of tacit knowledgein traditional industries Productivity and wage profiles differ just in electronicsnot in the other industries We interpret this as implying that exposure torapid technological and managerial changes seems to make a difference for plantproductivity less so for wages for the high-tech plants Yet this productivity-wage discrepancy is not associated with age but rather with seniority hence with avariable which can be affected by individual and policy decisions to a greater extentthan age that is largely exogenous for the individual (though not for the plantmanager)
In the end our results give support to at least two important policy implicationsFirst the similar shapes of productivity and wage profiles in lsquoaverage industriesrsquoindicate that the weak labour market performance of older workers in Finland is notbecause they are a burden for the average firm in the economy Leaving high-techplants aside the bad labour market outcomes of the elderly in the rest of the economyare presumably driven by two other causes such as discriminatory attitudes on theemployer side and public incentives schemes easing the way towards early retirementTo ameliorate the labour market performance of the elderly policy should addressthese issues Second higher seniority is instead associated with higher labour costs inhigh-tech plants This is consistent with the anecdotal evidence from Wal-Mart andEricsson that we have reported It is also consistent with the beliefs ndash entertained bymany Finnish employers ndash that older people could not adapt as easily as younger ones
AGE SENIORITY AND LABOUR COSTS 163
to the arrival of the new technology15 And indeed a survey conducted by the Ministryof Labour in 2002 indicates that as much as 10 of prime-aged workers (and 15of workers above 50) agree that lsquoworkplace discriminates against old workersrsquo16 Inspite of government-mandated media campaigns to counteract such attitudes thepossibility that a negative employer bias against old workers has affected hiring andfiring practices in the late 1990s cannot thus be easily ruled out Our results suggestthat this effect is not present in the Finnish economy at large but mainly in high-techplants
To improve the employability of older workers in these industries public policyshould divert resources away from preserving existing jobs and lend more attentionon the retraining of old workers to ease their reallocation away from less productiveplants (or plants where they have become less productive) into new jobs Some gov-ernments are more worried and more interventionist than others in this respect Inthe last few years for instance the Finnish Government has already embarked on aprogramme (lsquoThe National Programme on Ageing Workersrsquo see OECD 2004 p119) aimed at deferring retirement and in parallel improving the so called lsquoemploy-abilityrsquo of older workers It is unclear however to what extent grand plans maybe effective to bring about a solution to these problems Policies aimed at easingreallocation across plants even within the same industry would probably be a usefulcomplementary tool in this respect
Finally our results are also somehow puzzling in at least one respect They are notfully consistent with any of the existing theories that we know The results for thehigh-tech plants are consistent with the deferred compensation hypothesis and notwith the human capital hypothesis As surveyed in the theoretical section of the paperthe human capital hypothesis would predict a negative discrepancy in plants with anolder labour force where we instead find the opposite results But even the Lazearhypothesis is not fully consistent with our Finnish data because the results found forelectronics are not there for the other industries
This begs the question of why the Lazear model is more relevant in high-techplants than in the other plants One possibility is that productivity is less easilyobservable in high-tech industries This would make the asymmetric informationmechanism envisaged by Lazear more sensible in those industries This explanationwould probably do if our results were there for plants producing immaterial lsquoweight-lessrsquo services whose output is typically hard to measure Our discussion here insteadconcerns plants producing lsquoconcretersquo manufacturing goods for which productivitymis-measurement is presumably a less serious concern An alternative possibility is
15 Juuti (2001) reports that young line managers with a good educational background often harboured prejudice against theability of older workers to cope with new things This is potentially important for hiring and firing practices Althoughdiscriminating attitudes are rarely shared by top-level managers recruitment decisions happen to be taken by the mid-managementlevel16 Kouvonen (1999) reports somewhat lower figures with a 5 share of people above 45 having experienced age at discrimi-nation at work for the average firm
164 FRANCESCO DAVERI AND MIKA MALIRANTA
that seniority being the other side of impeded resource reallocation is particularlydamaging in industries where changes ndash requiring flexibility and ability to quicklyadapt ndash come about all the time Hence the adverse consequences of seniority mani-fest themselves in these industries and less so in other industries where changes aresmoother Under these circumstances a less mobile ageing workforce might constitutean impediment to productivity growth of firms and their plants To the extent thatlow productivity (and low immobility) is a consequence of declining ability to inces-santly adopt new technologies due to weak basic education public policy should focuson efforts to increase the quantity and improve the quality of the adult education Ifhowever the main reason for staying still too long is not the inability of older workersto adopt new technologies policy-makers should seek ways to encourage the mobilityof the ageing workforce to maintain the scope for continued productivity enabled bylearning-by-doing Greater mobility of workers might also facilitate the diffusion oftechnologies and thereby speed up productivity growth of the firms ndash and stimulatinglsquocreative destructionrsquo (ie productivity-enhancing churning of plants and firms withinindustry) to boot
Finally how special are our results Insofar as the use of ICT will spread to otherindustries in the years to come it can be expected that the productivity patternsobserved in electronics will emerge in other industries in the future The findings forelectronics may be foretelling more general developments in the other industries ofthe Finnish economy ndash and possibly other economies For sure in a world whereinnovation forces as opposed to catching up forces have become the key engine ofgrowth (see Acemoglu et al 2003 and the Sapir Report 2004) companies andgovernments will be more and more involved in such problems as the ones discussedin this paper
Discussion
Wendy CarlinUniversity College London and CEPR
Four facts about the advanced economies provide the motivation for this paperthe poor labour market performance of older workers (unemployment and employ-ment rates) the ageing of the labour force evidence measured in surveys of a declinein physical and mental performance at higher ages and finally the change in industrystructure toward lsquohigh techrsquo industries This raises the question of whether theemployability of older workers declines because they become too costly (diminishingproductivity is not compensated by lower wages) and whether this is especiallymarked in high-tech sectors of the economy The authors of this paper do not findevidence supporting either of these hypotheses in their data from three Finnishmanufacturing industries However their findings suggest that there is a hump-shaped
AGE SENIORITY AND LABOUR COSTS 165
relationship between a measure of productivity and the seniority (not age) of workersin plants in the high-tech industry in their sample electronics There is no corre-sponding pattern for wages This is interpreted as signalling a potential problem inthe matching of workers to jobs in industries with rapid technological progress in thecontext of constraints on worker mobility (eg costs of firing)
Channels through which ageing can affect economic performance are the averagequality of the direct labour input the effect on capital deepening because of theimplications of ageing for private and public saving and its impact on technologicalprogress (new ideas and diffusion) Older people may be less creative entrepreneurialand risk-taking and the depreciation of their skill set may imply less adaptation anddiffusion of new knowledge On the other hand an ageing population may createbigger incentives for labour and memory saving innovation
In order to evaluate the economic impact of age-related variables it is essential tospecify whose perspective we are taking From the perspective of workers the decisionis whether to remain in their job to search for a new one to leave the labour forceor to invest in (re)training And the key question is how age and or seniority affectwage and employment prospects as well as training opportunities within and outsidethe firm For firms the question is how age or seniority affects the profitability ofexisting production and the firmrsquos investment in human and physical capital and ininnovation What are the constraints on the wage structure they can deploy and onfiring From the perspective of a policy-maker concerned with welfare the questionis the impact of age-related variables on total factor productivity and the role ofpolicy-related barriers to the reallocation of workers training and early retirementprogrammes
In this paper Daveri and Maliranta take one slice of this question focusing on theimpact of age-related variables on the quality of direct labour input
bull How are productivity and wages related to age structure and seniority at theplant level in manufacturing
bull Does this relationship vary according to the innovativeness or technology inten-siveness of the industry
To answer these questions it is necessary to have matched employer-employee dataand a clear contrast in industry characteristics This makes the use of data fromFinland an appropriate choice there is high-quality matched data and looking at theperiod of the late 1990s to the early 2000s provides a nice contrast among thetraditional industry of lsquoforest productsrsquo a neutral one of industrial machinery and ahigh-tech industry electronics
The method is to use plant-level data to estimate an index of total factor produc-tivity and to calculate the average wage Each of these is then used as the dependentvariable in a separate regression for each industry with various combinations of theage-related variables on the right-hand side along with a set of plant-level controlvariables (including years of schooling a dummy for a foreign-owned plant and
166 FRANCESCO DAVERI AND MIKA MALIRANTA
dummies for different vintages of plants including those that exit during the observa-tion period) The age-related variables are worker age seniority (ie years in thecurrent firm) and labour market potential experience (age minus age when completedlast qualificationdegree) averaged for workers in each plant It is somewhat odd thatTFP is the productivity variable of choice when an initial motivation was the impactof age-related variables on firm profitability via labour costs which suggests that it islabour productivity that is relevant not TFP17
Neither age nor age squared is ever significant in a productivity regression Inelectronics but in neither of the other industries there is a positive coefficient onseniority and a negative coefficient on the squared term in seniority This says thatwhen looking across plants TFP initially rises as the average tenure of workers in theplant goes up but then falls in plants with higher levels of average seniority Theeffects of age-related variables on wages are mainly (but not always) positive in forestproducts hump-shaped for age (but with no robust tenure effects) in machinery andpositive for age and weakly positive for tenure and experience in electronics
The authors conclude that it is not age per se but seniority that affects TFP andthat this effect is found only in the high-tech sector electronics In order to make theirresults more easily interpretable they estimate modified versions of their equationsand produce graphs showing the average partial effect of the variable of interestFrom these equations they calculate the effect on TFP of a change in for exampleseniority As acknowledged by the authors the estimate that plant productivitydoubles when average seniority of the workforce goes from 2 to 6 years and then falls bytwo-thirds as average seniority goes from 6 to 10 years is very large My main concernwith this central result in the paper is that it may reflect the dynamics of a rapidlygrowing industry rather than the inherent characteristics of long-tenure workers inelectronics
In electronics a plant where the average tenure is six years is estimated to be atthe lsquoturning pointrsquo from rising to falling TFP As Table A1 shows the mean tenurein the sample for electronics plants is six years which reflects the rapid growth of theindustry it is 11 years and 9 years respectively in the forest products and machineryindustries The likely role of industry dynamics in generating tenureproductivityprofiles of the kind shown in the paper can be illustrated by a simple example If weassume that initially there are three industries F M and W with identical plants interms of TFP age and seniority structure In particular we assume there is no causallink from the average age or seniority of workers in a plant to the plantrsquos TFP Wenow introduce a different demand shock for each industry a negative demand shockfor industry F no change for M and a positive shock for E We assume that there isunobserved heterogeneity in managerial ability across plants As a consequence of the
17 TFP is calculated using a simple growth accounting framework with the assumption of a constant labour share (WLY ) Ifthe aim is to test whether seniority or ageing affects labour costs which are measured by the ratio of wages to labourproductivity then this is perhaps not an ideal choice
AGE SENIORITY AND LABOUR COSTS 167
differential demand shocks and assuming there are costs of entry and exit we willobserve disequilibrium in the F and E industries Good managers in E will expandoutput increase hiring and raise TFP relative to other plants in E Since hires havezero seniority average seniority in these expanding higher TFP plants will fall lowerseniority is associated with higher TFP but by assumption this is independent of anyrelationship between individual human capital (and TFP) and tenure Similarly goodmanagers in F identify the decline in their industry earlier and cease hiring soonerwith the result that higher TFP firms end up with on average longer tenure workersThis produces a positive relationship between seniority and TFP in the lsquodecliningrsquoindustry and a negative relationship in the lsquoexpandingrsquo industry In the industrywhere there is no shock there is no relationship This pattern is consistent with thecontrast between the three industries shown in Figure 2 of the paper18
Figure 4 provides some illustrative data showing that employment grew in telecom-munications equipment and shrank in forest products over the time period consideredin the paper
18 A similar story could be told to account for the within firm pattern that is shown in column [6] of Table 6 Using fixed effectsestimation the relationship between changes in TFP over time and in the age-related variables is uncovered controlling fortime invariant characteristics of plants such as managerial quality A similar although a much weaker hump-shaped relationshipbetween TFP and seniority is reported If we now assume that a new higher TFP technology emerges in electronics during theperiod of observation but not in forest products production in electronics becomes more profitable and each firm expands Theincrease in hiring reduces seniority and we associate a within-firm rise in TFP with a fall in seniority
Figure 4 Contrasting industry dynamics in Finland 1995ndash2002
Note Telecommunications equipment = ISIC322 Mechanical engineering = ISIC29 Forest products =ISIC20+21
Source Groningen Growth and Development Centre 60-Industry Database October 2005 httpwwwggdcnet updated from OrsquoMahony and van Ark (2003)
168 FRANCESCO DAVERI AND MIKA MALIRANTA
The authors undertake a number of tests to check the robustness of their resultsbut they are not able to separate out the possible impact of industry dynamics drivenby exogenous demand or technology shocks from the causality of seniority producinga change in efficiency that they seek to identify Another approach to identifying suchan effect would be to focus on those who switch jobs The DaverindashMaliranta storyimplies that in electronics longer tenure workers are worse substitutes for otherwiseequivalent workers than is the case in the other two industries This suggests that theyshould get a bigger wage cut if they switch jobs as compared with similar workers inone of the other industries19
Hence although the results in the paper are suggestive I think further investigationis required before we can be confident that there really is a causal link of policy-relevant magnitude in a high-tech industry from seniority (longer tenure in a givenfirm) to lower TFP
Rudolf Winter-EbmerUniversity of Linz Institute for Advanced Studies (IHS) Vienna and CEPR
Daveri and Maliranta have produced a very interesting paper on the impact of ageand seniority on wages and productivity in Finland The main idea is that the effectsof ageing on firm productivity are very different in traditional industries as comparedto high-tech or information technology industries (electronics in their empirical analysis)Psychometric studies have shown that physical cognitive and verbal abilities havedifferent age gradients whereas physical and cognitive skills such as mathematicaland logical skills decay pretty fast organizational and verbal skills show no particularageing pattern at all (Skirbekk 2003) Daveri and Maliranta argue that ageing of theworkforce is more problematic in high-tech industries because of a faster technicalchange faster changes in production technologies and faster product developmentWhile most psychometric and other studies relate to age as such Daveri andMaliranta concentrate their argument on the impact of job tenure within a particularfirm while there is no difference between the productivity-experience and wage-experience paths in the electronics industry ndash nor in the machinery industry by theway ndash there is a significant divergence in the development of productivity and wagesas seniority in a firm increases This pattern cannot be seen in more traditionalindustries like forestry and machinery
While the general pattern of a higher interdependence between firm senioritytechnology adaptation and learning ndash and in turn productivity ndash in high-tech firmsis sensible the main empirical results seem to be out of line Productivity in electronicsfirms increases by 61 log points in the first 4 years of tenure (in fact from year 2 to
19 Using Finnish data Uusitalo and Vartiainen (2005) report that firm exits and promotions increase earnings up to age 50after which such events do not on average improve a personrsquos relative position Whether this is true of tenure and whether itdiffers across industries would be relevant evidence for the DaverindashMaliranta hypothesis
AGE SENIORITY AND LABOUR COSTS 169
year 6) but decreases in the following 6 years again by 69 log points (see Table 7) Aliteral interpretation of these results would be that workers who stay with their firmsfor more than 6 years lose more than half of their productivity they become such aburden to the firm that everybody would have to be fired otherwise the managerswould be acting completely irresponsibly This is probably not what we are seeing inthese firms
Moreover the measured effect is basically a product of a simple OLS cross-sectionregression it is much reduced and less well statistically determined if other methodsor data are used Some other possible explanations come to my mind which couldhave produced such an outcome The data relate to mean characteristics of theworkforce such as mean age and mean tenure of workers As the IT boom in Finlanddid not start before the mid 1990s I suspect that there are not many firms with meantenure of its workforce of more than 7 years ndash and if they exist they might be fairlydifferent firms with a different technology and firm organization As Daveri andMaliranta correctly state the causal impact of mean tenure on productivity cannotbe properly distinguished from matching and selection problems it is by no means acoincidence that some workers stay with the firm longer others donrsquot it is no coin-cidence why some firms stick to their complete workforce longer or to phrase itdifferently why workers want to stay longer with a particular firm Good workers staywith good firms and vice versa All these matching arguments make the strong pointthat a simple correlation between job seniority and productivity will be an upwardbiased estimate of the real causal effect of job seniority on productivity Relatedlabour economics studies on the causal effect of seniority on wages come to theconclusion that OLS estimates overestimate the true causal effect by a factor betweentwo and four (Topel 1991 Altonji and Shakotko 1987)
It has to be said though that finding convincing estimates of the relation betweenfirm employment structure and productivity is very difficult simple fixed effectsmodels using variation in the composition of the workforce over time to determine thevariation of productivity fall again prey to the criticism of reverse causality why doand how can firms change the composition of their workforce Only by changingrecruitment and lay-off policies policies which are obviously related to past andexpected productivity While the causal impact is very difficult to establish in suchstudies any work in this direction using new data sets is very interesting Furtherimportant questions come to my mind for instance concerning inter-firm mobilitywithin the industry which seems to contribute to productivity growth throughout theindustry (Parent 2000) It seems that inter-firm mobility is higher in the high-techsector which could contribute to explain the diverging pattern between seniority-productivity and experience-productivity profiles Another important issue concernswage-setting schemes If indeed high-tech sectors have a higher prevalence ofdeferred payment schemes like stock options or profit sharing in some sort or theother the relation between age or tenure and wages would be steeper and the diver-gence between wage and productivity development would shrink
170 FRANCESCO DAVERI AND MIKA MALIRANTA
The personnel economics and firm organization literature has also stressed com-plementarities in the composition of the workforce a good mix of old and youngworkers might be better for firm productivity than employing only young or only oldworkers (Lazear 1998 Grund and Westergaringrd-Nielsen 2005) It might be interestingto see whether these results hold also in the high-tech industry Such an analysiswould require looking at the age and tenure composition of the workforce in moredetail by using the underlying micro data
In my view policy conclusions are still difficult to draw from this paper MaybeFinland was not such a good experiment in this respect because its high-tech sectorhad an explosive growth after 1995 which is too short and too turbulent a period todraw firm conclusions about the effects of firm seniority and the like Replicating thestudy for another country with a more smooth development of its high-tech sectormight be a welcome complement
APPENDIX DATA SET AND VARIABLE DESCRIPTION
Similarly to the other Nordic countries Finland is endowed with a rich register dataof companies plants and individuals (see Statistics Denmark et al 2003) The uniqueidentification codes for persons companies and plants used in the different registersform the backbone of the Finnish administrative register network and the Finnishstatistical system whereby different sources of information can be integrated conven-iently for various statistical purposes20 By using this system Statistics Finland hasconstructed the Finnish Longitudinal Employer-Employee Database (FLEED) whichis tailored for various needs of economic research Its most comprehensive anddetailed version is maintained at Statistics Finland It contains information of com-panies plants and individuals Plants are linked to their companies and individualsto their employer plants and companies Data are collected from Business Register(plants and companies in the business sector) Census of Manufacturing (manufactur-ing plants) Financial Statements Statistics (companies in the business sector) RampDsurvey and ICT survey (companies in the business sector) and Employment Statistics(individuals aged between 16 and 69 years) These data include a wide variety ofdetailed information on these units A large proportion of variables are available from1990 to 2002 These data cover essentially the whole target population of companiesplants and individuals Due to confidentiality concerns outside researchers do nothave direct access to it For the outside researchers Statistics Finland has constructeda separate version of it The variable set is more limited and some of the categoricalvariables are broader (many industries are combined for example)
This paper employs plant level information for plants and workforce Productivitymeasures plant age plant size originate from the Census of Manufacturing We donot have information of the levels of value added hours worked or capital stock as
20 Data sources and linking of them is described in greater detail in Ilmakunnas et al (2001) and Maliranta (2003)
AG
E SE
NIO
RIT
Y A
ND
LA
BO
UR
CO
STS
171
Table A1 Descriptive statistics of data on plants by industry plant averages in 1995ndash2002
Variables Forest industry Machinery industry Electronics industry
Mean Sd p5 Median 95p Mean Sd p5 Median 95p Mean Sd p5 Median 95p
Log of TFP index 180 074 088 166 328 283 059 208 272 400 227 104 099 205 458Log of monthly wage (in euros)
761 024 723 759 802 769 019 736 769 800 765 023 727 767 803
Schooling years 110 04 103 110 117 116 09 106 114 136 122 12 106 119 145Age in years 396 38 333 401 450 393 40 318 398 450 356 38 294 358 416Potential experience in years
216 39 151 221 271 207 42 131 211 269 164 40 93 166 225
Seniority in years 109 56 26 108 195 92 48 27 89 175 63 33 21 53 1269
Proportion ()
Proportion ()
Proportion ()
Plant birth before 1977 570 3457 2791Plant birth 1977ndash1980 63 847 756Plant birth 1981ndash1985 55 688 407Plant birth 1986ndash1990 107 1658 2326Plant birth 1991ndash1995 99 1887 1977Plant birth 1996ndash 107 1464 1744Plant size 5ndash9 persons 18 314 317Plant size 10ndash19 persons 90 1020 685Plant size 20ndash49 persons 309 4108 3351Plant size 50ndash99 persons 217 2056 2065Plant size 100ndash persons 367 2502 3581Foreign-owned plant 62 1986 1295Plant death during 1996ndash2002
118 1922 2209
Number of plants 365 567 172
Notes The data are constructed in the Research Laboratory of Statistics Finland by linking the plants in the Finnish Manufacturing Census and individuals in the EmploymentStatistics with plant codes
Source Authorsrsquo own calculations
172FR
AN
CE
SCO
DAV
ER
I AN
D M
IKA
MA
LIR
AN
TA
Table A2 Statistical analysis behind the simulation graphs between plants estimation
Forest TFP
Forest wage
Machinery TFP
Machinery wage
Elect TFP
Elect wage
Schooling years minus3386 minus0073 0826+ 0182 1481 0310(2491) (0815) (0470) (0140) (1294) (0210)
[Schooling years]2 1503 0095 minus0285 minus0020 minus0511 minus0070(1113) (0368) (0194) (0057) (0524) (0084)
Potential experience 1017 minus0014 0171 0082+ minus0785 0007(0371) (0118) (0151) (0044) (0616) (0110)
[Potential experience]2 minus0513 0021 minus0072 minus0024 0364 minus0012(0187) (0057) (0081) (0022) (0390) (0071)
[Potential experience]3 0081 minus0005 0010 0002 minus0047 0005(0030) (0009) (0014) (0004) (0078) (0015)
Seniority in years minus0013 minus0003 minus0045 minus0020 1276 0131(0086) (0027) (0054) (0018) (0272) (0062)
[Seniority in years]2 0070 0012 0033 0022 minus1665 minus0161+(0081) (0026) (0056) (0017) (0365) (0083)
[Seniority in years]3 minus0025 minus0000 minus0008 minus0007 0622 0061+(0022) (0007) (0017) (0005) (0153) (0034)
Plant birth in 77ndash80 0237 0003 minus0051 0019 minus0088 minus0027(0119) (0032) (0066) (0029) (0154) (0044)
Plant birth in 81ndash85 0247 0059 0057 0014 minus0210 0032(0117) (0041) (0079) (0021) (0257) (0043)
Plant birth in 86ndash90 0658 0040 0255 0013 0094 0019(0104) (0027) (0057) (0018) (0209) (0046)
Plant birth in 91ndash95 0575 0026 0432 0083 0680 minus0012(0144) (0037) (0060) (0017) (0232) (0042)
Plant birth in 96ndash 0969 0052 0629 0077 0677 0029(0196) (0037) (0088) (0025) (0286) (0052)
R-squared 0545 0647 0486 0516 0527 0581Adj R-squared 0510 0620 0461 0493 0442 0505Number of plants 365 365 567 567 172 172
Notes Other control variables include dummies for plant size (5 groups) foreign-ownership and death during 1996ndash2002 Robust standard errors are shown in parentheses+ p lt 01 p lt 005 p lt 001 p lt 0001
AGE SENIORITY AND LABOUR COSTS 173
such but we do have the ratio of value added to the number of hours worked (bywhich we identify labour productivity) and the capital stock per hour worked (ameasure of the capital-labour ratio) The capital stock measure is calculated throughthe perpetual inventory method (for more details see Maliranta 2003)
Since 1995 (our main period of analysis) all plants owned by firms that employ noless than 20 persons are included Therefore since 1995 the data also include thevery small plants of multi-unit firms but on the other hand the plants of smallsingle-unit firms are left outside Some plants are dropped from the sample becauseof failure of linking some plants in the Manufacture Census to other sources ofinformation Thanks to the link between Census of Manufacturing and EmploymentStatistics we have information about plant workforce This includes the averagepotential experience (the number of years after the last completed degree) seniority(the number of years spent working in the current company) and the number ofschooling years (usually needed for the degree) The labour characteristics of theplants are computed in Statistics Finland by using the comprehensive version of thedatabase About 80ndash90 of individuals can be linked to their plants so that ourvariables should be measured with a reasonable accuracy In the analysis we havealso dropped some outliers21
REFERENCES
Acemoglu D P Aghion and F Zilibotti (2003) lsquoVertical integration and distance to frontierrsquoJournal of the European Economic Association 1(23) 630ndash38
Ali-Yrkkouml J L Paija C Reilly and P Ylauml-Anttila (2000) Nokia A Big Company in a SmallCountry ETLA The Research Institute of the Finnish Economy Series B162 Helsinki
Altonji JG and RA Shakotko (1987) lsquoDo wages rise with job seniorityrsquo Review of EconomicStudies 54 437ndash39
Aubert P and B Creacutepon (2004) Age Salaire Et Productiviteacute La Productiviteacute Des Salarieacutes Deacutecline-T-Elle En Fin De Carriegravere Technical report Mimeo Economie et Statistiques
Aubert P E Caroli and M Roger (2004) New Technologies Workplace Organisation and the AgeStructure of the Workforce Firm-Level Evidence INSEE Paris
Autor DH F Levy and RJ Murnane (2003) lsquoThe skill content of recent technologicalchange An empirical explorationrsquo Quarterly Journal of Economics 118(4) 1279ndash333
Becker GS (1962) lsquoInvestment in human capital A theoretical analysisrsquo Journal of PoliticalEconomy 70(5 Part 2 Investment in Human Beings) 9ndash49
Bingley P and N Westergaard-Nielsen (2003) lsquoReturns to tenure firm-specific human capitaland worker heterogeneityrsquo International Journal of Manpower 24(7) 774ndash88
Bishop J (1987) lsquoThe recognition and reward of employee performancersquo Journal of LaborEconomics 5(4) s36ndashs56
Blanchflower DG and AJ Oswald (1988) lsquoInternal and external influences upon pay settle-mentsrsquo British Journal of Industrial Relations 26(3) 363ndash70
Brock WA and DS Evans (1986) The Economics of Small Business Holmes amp Meier NewYork
Brown C and JL Medoff (2003) lsquoFirm age and wagesrsquo Journal of Labor Economics 21(3) 677ndash97
21 In the estimation some extreme outliers are removed from the regression analysis Identification has been carried out byusing the method of Hadi (1992 1994) The variables used in this procedure are the log of labour productivity the log ofmonthly wage the log of capital intensity schooling years and potential experience Overall a couple of percentages of plantswere dropped for being deemed outliers
174 FRANCESCO DAVERI AND MIKA MALIRANTA
Creacutepon B N Deniau and S Peacuterez-Duarte (2002) Wages Productivity and Worker Chara-cteristics A French Perspective January INSEE httpwwwcrestfrpagepersocreponCreponDeniauPerezDuarte2002pdf
Daveri F and O Silva (2004) lsquoNot only Nokia What Finland tells us about new economygrowthrsquo Economic Policy 19(38) 117ndash63
Davis SJ and J Haltiwanger (1991) lsquoWage dispersion between and within US manufactur-ing plants 1963ndash86rsquo Brookings Papers on Economic Activity Microeconomics 1991 115ndash80
Disney R J Haskel and Y Heden (2003) lsquoRestructuring and productivity growth in UKmanufacturingrsquo Economic Journal 113(489) 666ndash94
Dunne T MJ Roberts and L Samuelson (1989) lsquoThe growth and failure of US manu-facturing plantsrsquo Quarterly Journal of Economics 104(4) 671ndash98
Dygalo NN and JM Abowd (2005) lsquoEstimating experience-productivity profiles from earn-ings over employment spellsrsquo unpublished manuscript 27 November
Eriksson T and M Jaumlntti (1997) lsquoThe distribution of earnings in Finland 1971ndash1990rsquoEuropean Economic Review 41(9) 1763ndash79
Flabbi L and A Ichino (2001) lsquoProductivity seniority and wages New evidence from per-sonnel datarsquo Labour Economics 8(3) 359ndash87
Foster L J Haltiwanger and CJ Krizan (2001) lsquoAggregate productivity growth Lessonsfrom microeconomic evidencersquo in CR Hulten ER Dean amp MJ Harper (eds) NewDevelopments in Productivity Analysis (pp 303ndash63) University of Chicago Press Chicago
Griliches Z (1995) lsquoRampD and productivity Econometric results and measurement issuesrsquo inP Stoneman (Ed) Handbook of the Economics of Innovation and Technological Change (pp 52ndash89)Blackwell Publishers Ltd Oxford
Griliches Z and V Ringstad (1971) Economics of Scale and the Form of the Production FunctionNorth Holland Amsterdam 1971
Griliches Z and H Regev (1995) lsquoProductivity and firm turnover in Israeli industry 1979ndash1988rsquo Journal of Econometrics 65 175ndash203
Grund C and N Westergaringrd-Nielsen (2005) lsquoAge structure of the workforce and firm per-formancersquo IZA Working Paper No 1816 Bonn
Hadi AS (1992) lsquoIdentifying multiple outliers in multivariate datarsquo Journal of the Royal Statis-tical Society Series (B) 54 761ndash71
mdash (1994) lsquoA modification of a method for the detection of outliers in multivariate samplesrsquoJournal of the Royal Statistical Society Series (B) 56 393ndash96
Haegeland T and TJ Klette (1999) lsquoDo higher wages reflect higher productivity Educationgender and experience premiums in a matched plant-worker data setrsquo in The Creation and Analysisof Employer-Employee Matched Data (pp 231ndash59) Elsevier Science North-Holland Amsterdam
Hellerstein JK and D Neumark (1995) lsquoAre earnings profiles steeper than productivityprofilesrsquo Journal of Human Resources 30(1) 89
Hellerstein JK D Neumark and KR Troske (1999) lsquoWages productivity and workercharacteristics Evidence from plant-level production functions and wage equationsrsquo Journalof Labor Economics 17(3) 409ndash46
Ilmakunnas P and M Maliranta (2005) lsquoTechnology labour characteristics and wage-productivity gapsrsquo Oxford Bulletin of Economics and Statistics 67(5) 623ndash44
Ilmakunnas P M Maliranta and J Vainiomaumlki (2001) lsquoLinked employer-employee data onFinnish plants for the analysis of productivity wages and turnoverrsquo in T Jensen and AHolm (eds) Nordic Labour Market Research on Register Data (pp 205ndash46) TemaDord NordicCouncil of Ministers Coperhagen
mdash (2004) lsquoThe roles of employer and employee characteristics for plant productivityrsquo Journalof Productivity Analysis 21 249ndash76
mdash (2005) lsquoWorker turnover and productivity growthrsquo Applied Economics Letters 12(7) 395ndash98Juuti P (2001) Ikaumljohtaminen Kansallinen ikaumlohjelma Tyoumlministeriouml JTO-tutkimuksia No 13
HelsinkiKanazawa S (2003) lsquoWhy productivity fades with age The crime-genius connectionrsquo Journal
of Research in Personality 37 257ndash72King G M Tomz and J Wittenberg (2000) lsquoMaking the most of statistical analyses Improving
interpretation and presentationrsquo American Journal of Political Science 44(2) 347ndash61Kouvonen A (1999) Ikaumlsyrjintaumlkokemukset Tyoumlssauml Ja Tyoumlhoumlnotossa Tyoumlpoliittinen tutkimus No 203Koumllling A C Schnabel and J Wagner (2005) lsquoEstablishment age and wages Evidence from
German linked employer-employee datarsquo in L Bellmann O Huumlbler W Meyer and
AGE SENIORITY AND LABOUR COSTS 175
G Stephan (eds) Institutionen Loumlhne Und Beschaumlftigung (pp 81ndash99) Nuumlrnberg httpwwwwisouni-erlangendeforschungforschungsberichteforschungsbericht2005pdf
Lazear EP (1981) lsquoAgency earnings profiles productivity and hours restrictionsrsquo AmericanEconomic Review 71(4) 606ndash20
mdash (1998) Personnel Economics for Managers John Wiley and Sons New YorkMaliranta M (1997) lsquoPlant Productivity in Finnish Manufacturing ndash Characteristics of High
Productivity Plantsrsquo The Research Institute of the Finnish Economy (ETLA) DiscussionPaper No 612 Helsinki
mdash (1999) lsquoFactors of performance by plant generation Some findings from Finlandrsquo in SBiffignandi (ed) Micro- and Macrodata of Firms Statistical Analysis and International Comparison(pp 391ndash424) Physica Heidelberg
mdash (2003) Micro Level Dynamics of Productivity Growth An Empirical Analysis of the Great Leap inFinnish Manufacturing Productivity in 1975ndash2000 The Research Institute of the Finnish Econ-omy (ETLA) Series A 38 (available at httpwwwetlafifiles1075_micro_level_dynamicspdf )Helsinki
Maliranta M and P Rouvinen (2004) lsquoICT and business productivity Finnish micro-levelevidencersquo in The Economic Impact of ICT Measurement Evidence and Implications (pp 213ndash40)OECD Paris
Manning A (2000) lsquoMovin on up Interpreting the earnings-experience profilersquo Bulletin ofEconomic Research 52 261ndash95
Medoff JL and KG Abraham (1980) lsquoExperience performance and earningsrsquo QuarterlyJournal of Economics 95(4) 703ndash36
mdash (1981) lsquoAre those paid more really more productive The case of experiencersquo Journal ofHuman Resources 16(2) 186ndash216
Moen J (2005) lsquoIs mobility of technical personnel a source of RampD spilloversrsquo Journal ofLabor Economics 23(1) 81ndash114
Neuman S and A Weiss (1995) lsquoOn the effects of schooling vintage on experience-earningsprofiles Theory and evidencersquo European Economic Review 39(5) 943ndash55
Nurmi S (2004) Essays on Plant Size Employment Dynamics and Survival Helsinki School ofEconomics A-230 Helsinki
OECD (2003) OECD Science Technology and Industry Scoreboard OECD Parismdash (2004) Ageing and Employment Policies Finland OECD Parismdash (2006) Live Longer Work Longer OECD ParisOrsquoMahony M and B Van Ark (eds) (2003) EU Productivity and Competitiveness An Industry Perspec-
tive Can Europe Resume the Catching-Up Process European Commission Enterprise PublicationsParent D (2000) lsquoIndustry-specific capital and the wage profile Evidence from the NLSY
and the PSIDrsquo Journal of Labor Economics 18(2) 306ndash23Productivity Commission (2005) Economic Implications of an Ageing Australia Research Report
Canberra (httpwwwpcgovaustudyageingfinalreport)Sapir Report (2004) An Agenda for a Growing Europe Oxford University Press OxfordSkirbekk V (2003) Age and Individual Productivity A Literature Survey MPIDR Working Paper
No 2003-028Statistics Denmark Statistics Finland Statistics Iceland Statistics Norway and Statistics
Sweden (2003) Access to Microdata in the Nordic Countries Statistics Sweden OumlrebroTeulings C and J Hartog (1998) Corporatism or Competition Cambridge University Press CambridgeTomz M J Wittenberg and G King (2003) Clarify Software for Interpreting and Presenting
Statistical Results (Version 21) Stanford University University of Wisconsin and HarvardUniversity 5 January Available at httpgkingharvardedu
Topel RH (1991) lsquoSpecific capital mobility and wages Wages rise with job seniorityrsquo Journalof Political Economy 99 145ndash76
Troske KR (1999) lsquoEvidence on the employer size-wage premium from worker-establishmentmatched datarsquo Review of Economics and Statistics 81(February) 15ndash26
Uusitalo R and J Vartiainen (2005) lsquoFinland Firm factors in wages and wage changesrsquounpublished manuscript 9 June
Verhaegen P and TA Salthouse (1997) lsquoMeta-analyses of age-cognition relations in adult-hood Estimates of linear and nonlinear age effects and structural modelsrsquo PsychologicalBulletin 122(3) 231ndash49
Winter-Ebmer R (2001) lsquoFirm size earnings and displacement riskrsquo Economic Inquiry 39(3)474ndash86

AG
E SE
NIO
RIT
Y A
ND
LA
BO
UR
CO
STS
145Table 6 Statistical analysis of the determinants of plant productivity and wages Electronics
OLS IV Fixed effects
Cross-section Cross-section Panel
[1] [2] [3] [4] [5] [6]
Panel a ProductivityAge minus0408 0024
(0377) (0026)Age2 0061
(0053)log of tenure 1741 minus0062 2380+ 0937
(0749) (0232) (1443) (0599)[log of tenure]2 minus0549 minus0639+ minus0356+
(0230) (0349) (0184)Potential experience 0028 0030 minus0013 minus0010
(0035) (0036) (0045) (0032)Schooling years 0180 0178 0182 0207 0191 minus0043
(0064) (0064) (0071) (0070) (0055) (0082)Schooling y (tminus1) minus0007
(0090)Schooling y (tminus2) 0182
(0081)R-squared 0301 0290 0320 0291 0308Adj R-squared 0239 0232 0254 0228 0211 minus0203R-squared within 0086Observations 172 172 172 172 98 496Overident test 0258Relevance test 0000Panel b WagesAge minus0046 0019
(0061) (0004)Age2 0009
(0009)
146FR
AN
CE
SCO
DAV
ER
I AN
D M
IKA
MA
LIR
AN
TA
log of tenure 0192+ 0031 0528 0250+(0112) (0044) (0420) (0146)
[log of tenure]2 minus0049 minus0107 minus0068(0033) (0105) (0045)
Potential experience 0016 0016 0008 0020(0006) (0006) (0012) (0008)
Schooling years 0123 0123 0137 0140 0145 0160(0010) (0009) (0011) (0011) (0015) (0020)
Schooling y (tminus1) 0120(0022)
Schooling y (tminus2) 0134(0020)
R-squared 0536 0530 0537 0532 0617Adj R-squared 0494 0492 0492 0491 0563 0493R-squared within 0615Observations 172 172 172 172 98 496Overident test 0001Relevance test 0000
Notes Dependent variable is logarithm of plant productivity in panel a and log of wages in panel b Other control variables (results not reported) for models reported in columns[1]minus[4] include a dummy variable for foreign-owned plant one for plants that disappear in 1996ndash2002 and other dummies for plant vintage groups (6 groups) and size groups(5 groups) In column [5] seniority is instrumented with a set of lagged variables (the average in the period 1990ndash94) They include schooling years potential experiencepotential experience squared seniority and seniority squared In column [5] high p-values (gt 10) for the over-identification test (Hansen J statistics) indicate that the validityof the instruments cannot be rejected and low p-values (lt 01) of relevance test (Anderson canonical correspondence LR statistic) gives indication that the employedinstruments are relevant in productivity but not in wage estimation
+ p lt 01 p lt 005 p lt 001 p lt 0001
OLS IV Fixed effects
Cross-section Cross-section Panel
[1] [2] [3] [4] [5] [6]
Table 6 Continued
AGE SENIORITY AND LABOUR COSTS 147
432 Seniority matters for productivity more often than experience butdifferently in traditional and high-tech industries The discussion inSection 2 invites thinking of why age may (or may not) be associated with productivityIt does so suggesting that the process of human capital accumulation takes placewithin the firm and outside the firm Lumping together the two effects (as implicitlydone in the empirical formulations underlying the results in columns [1] and [2] whereage as such is related to productivity) may obscure that the two forms of humancapital accumulation need not bear the same returns The importance of distinguishingthese two sources of skills in the analysis of productivity effects is emphasized forinstance by Ilmakunnas et al (2004) and Dygalo and Abowd (2005) For example theaccumulation of knowledge that occurs through seniority may be productivity-enhancingwhile the accumulation of human capital that occurs through the acquisition ofoverall labour market experience may not contribute positively In the statistical anal-ysis underlying the results in columns [3]ndash[6] we dropped this restriction We findthat the statistical significance of seniority and potential experience is indeed differentfrom each other This also holds across industries and across estimation methods Theoverall goodness of fit of IV and FE-based specifications drops significantly
In the forest industry as well as in electronics we find that seniority not potentialexperience is positively related to productivity Our formulation (in logs and logssquared so as to obtain the best fit of the data) also implies that the effect of seniorityon productivity depends on its starting level
One additional year of seniority for a freshly hired worker adds to productivity less thanit adds for a senior worker who has spent a considerable number of years within the samefirm In other words there are positive but diminishing returns to seniority In the electronicsindustry the returns to seniority decline so much to become negative beyond a certainthreshold These results are well determined when using the period-averaged cross-sectionof plants and are still there ndash though less precisely measured ndash even when seniority isinstrumented to allow for possible feedback effects from the lagged values In the forestindustry the correlation disappears when the time variation of the data is considered throughfixed-effects estimation while a weaker correlation survives for plants in electronics
In the industrial machinery plants instead potential experience positively corre-lates though at the usual declining rates with productivity Seniority is instead notsignificantly related to productivity in a statistical sense in this industry The patternof partial correlations in this industry is however somewhat statistically weaker thanfor the other industries for they do not survive when other methods of estimationthan the cross-section OLS are employed This is a symptom that our statisticalmodel that links plant productivity to human capital variables is not equally effectivein capturing the determinants of plant productivity in all industries
433 Wage and productivity profiles are dissimilar from each other inelectronics and similar in the other industries In our data set searchingfor wage determinants is a more successful undertaking than searching for productivity
148 FRANCESCO DAVERI AND MIKA MALIRANTA
determinants The line interpolating the data explains more than 50 of the totalvariability of plant wages in the forest industry and in electronics and more than 40of the total in industrial machinery even when the time dimension of the data set isconsidered Among the age-related variables seniority drives wages in forest andexperience drives wages in the industrial machinery industry Notably the seniority-wage profile in the lower panel is not too far apart from the seniority-productivityprofile estimated in the upper panel for the forest industry The same applies toexperience-wage and experience-productivity profiles for industrial machineryalthough it should be kept in mind that as emphasized above the statistical relationis much less precisely measured for the plants in this industry
When it comes to electronics the picture instead changes substantially Wagesdepend positively but to a declining extent on both tenure and experience in thecross-section of plants This result is still there when the time variation of the paneldata set is considered through fixed-effects estimation This correlation is instead notthere when variables are instrumented by their lagged values
We interpret these results as showing that the profiles of wages and productivitywith respect to age-related variables are significantly different from each other inelectronics Wages keep going up though at declining rates with both seniority andexperience while the seniority-productivity profile follows a very different path madeof definite increases when seniority is low and a flattening out which also involvessheer productivity declines as seniority goes beyond a given threshold
44 More results
The statistical analysis underlying Tables 4 5 and 6 also includes some ancillaryresults on the determinants of plant productivity and wages concerning educationand plant age The important implication of these additional results is that the cor-relations between age-related variables productivity and wages (discussed above) donot hinge on the omission of other important determinants of plant productivity andwages Reassuringly education and plant age affect productivity and wages as expectedbut consideration of these additional elements does not cancel our main results
441 Education is positively related to productivity and wages The earningsequations estimated by labour economists routinely include education as an explan-atory variable and make inference as to the rate of return on additional years ofeducation And even the importance of workersrsquo educational levels in determiningplant productivity can hardly be overstated
In our statistical analysis education turns out always positively related to wages inthe three industries with estimated coefficients ranging between 012 and 015 Yetthe estimated coefficient is bigger in forest than in more technologically advancedindustries As to its effects on productivity they seem to be instead ranked in decreas-ing order of the technological level of the industry at hand Education is positively
AGE SENIORITY AND LABOUR COSTS 149
and sizably related to plant productivity in electronics with a bigger coefficient thanin industrial machinery No relation is there for the forest industry
When the time series dimension is considered these effects are present only whenthe delayed values of the explanatory variables are considered instead of the currentones Education is indeed positively associated with productivity with a delay of abouttwo years (the lagged value of education is almost significantly related to productivitythough with a small coefficient even for the forest industry)
Altogether these effects indicate that high-education workers in more advancedindustries are in some way lsquoexploitedrsquo while high-education people in forestry enjoya rent The idea that high-education people accept lower wages possibly in exchangefor a bright future to buy the lottery of working in dynamic plants and industries isconsistent with anecdotal evidence from Finnish newspapers10
442 Newer plants are more productive Another ancillary result underlyingTables 4 5 and 6 is that older plants tend to be less productive than newer plantsThis effect is consistently present for the three industries These results are notreported in the tables for brevity but are anyway singled out and pictured in Figure 1
Figure 1 shows a graphical illustration of productivity and wage effects of plantvintage whereas the horizontal bars indicate the average effects of plant vintage onproductivity (printed light grey) and wages (printed dark grey) with 95 confidenceintervals appended The evidence in the graph points to the marked quantitativerelevance of such effects Younger plants are indeed definitely more productive in allindustries This also holds for wages though the effect is much less marked Theseresults are consistent with the literature briefly surveyed in Box 511
45 Implications of our main results a numerical illustration
If theory and the related empirical findings were to imply that the effect of age-related variables on productivity is always the same irrespective of age seniority orexperience one might easily compute the numerical effect of ageing on productivityThe estimated coefficient would tell us by how many percentage points productivityvaries as a result of a unit change in the age or seniority of a given person (or theaverage age of a typical worker in a given plant)
Unfortunately psychometric studies and the economics of human capital teach usthat the world is more complicated and the effect of age on productivity may changeits sign from positive into negative starting from some threshold age onwards Thisraises the empirical questions of where (at which year of age seniority or experience) this
10 A more academic argument following more or less the same lines is in Moen (2005)11 Maliranta (1999) experimented with alternative capital stock measures (perpetual inventory method vs fire insurance valueof capital stock) They yielded quite similar results for the plant vintage effects More recent Finnish evidence of the plant vintageeffects include Ilmakunnas et al (2004) and Ilmakunnas and Maliranta (2005)
150 FRANCESCO DAVERI AND MIKA MALIRANTA
Figure 1 An illustration of productivity and wage effects of plant vintage
Notes Bars indicate the log difference of total factor productivity and monthly wage with respect to the reference group (plants established in 1976 or earlier) Error bars around the mean bars indicate 95 confidence inter-vals The estimates are from the models presented in column [3] of Tables 4ndash6
AGE SENIORITY AND LABOUR COSTS 151
threshold is Moreover having found that the returns to seniority decline with seniorityor as in electronics actually become negative it remains unclear by how much they decline
Box 5 Old plants old workers productivity and wages
Old-aged firms may be less productive and disproportionately hire old-ageworkers The evidence on the relation between firm age and productivity isnot abundant though Dunne et al (1989) report that manufacturing plantsthat have been in business longer are less likely to close and Brock and Evans(1986) show that older firms are less likely to fail (controlling for plant and firmsize respectively) This may partly explain why older workers tend to stick withthese probably less productive but more financially sound firms
On the other hand it has often been found that older firms pay higher wagesafter controlling for other relevant firm characteristics This is often taken toreflect the quality (and thus the higher productivity) of the workers they hireas well as the working conditions they offer Yet as discussed in the main textthis need not be the case Older firms may pay higher wages to extend fringebenefits such as pensions or health insurance to their most faithful workers ormore subtly because they cannot deny pay raises to people who have devel-oped a good knowledge of the companyrsquos ability to pay throughout the years
Davis and Haltiwanger (1991) find that older manufacturing plants indeedpay higher wages and age remains a significant determinant of wages onceindustry region and size differences are accounted for with and without con-trolling for the probability that the plant will close (usually lower for olderfirms) Troske (1999 Table 1111) reports similar results controlling for employersize and location workers in plants that are less than 5 years old earn nearly20 less than workers in plants that have been in business 15 years or moreBlanchflower and Oswald (1988) find no significant relationship betweenwages and years in operation in British data while Winter-Ebmer (2001) founda positive relation with Austrian data The very careful study by Koumllling et al (2005)shows that in Germany older firms pay on average higher wages for workerswith the same broadly defined degree of formal qualification More recentlyBrown and Medoff (2003) have analysed the relationship between how long anemployer has been in business (firm age) and wages According to their analysisfirms that have been in business longer pay higher wages (as previous studieshave found) but pay if anything lower wages after controlling for workercharacteristics There is some evidence that the relationship is not monotonicwith wages falling and then rising with the number of years in business
Finally regarding evidence with Finnish data Nurmi (2004) finds that oldand large firms are less likely to fail and less sensitive to exogenous shocks thanyoung and small firms
152 FRANCESCO DAVERI AND MIKA MALIRANTA
In this section we employ statistical simulation ndash a quantitative technique thatallows one to describe complicated phenomena in a flexible way (how is described inthe top part of Box 5) ndash to illustrate these issues
The simulation results are then translated out of the jargon using CLARIFY theuser-friendly software developed by Harvard political scientists Gary King MichaelTomz and Jason Wittenberg (King et al 2000 Tomz et al 2003) expressly for deliv-ering the results of the application of even complicated quantitative techniques to awider audience not necessarily trained in statistics but still interested in achieving arather precise knowledge of the quantitative aspects of economic and social issues (seemore details in the bottom part of Box 6)
Box 6 Numerical simulations through CLARIFY
a The issueThe starting point may be a standard multivariate regression exercise wherethe statistical relation between a dependent variable (say productivity) and ahost of potential explanatory variables (say age education and so on) isinvestigated The result of a regression exercise usually consists of quantitativeinformation (lsquoestimated coefficientsrsquo) on the sensitivity of the dependent variableto each of the explanatory variables while holding the other explanatoryvariables constant This piece of information is however subject to varioussources of uncertainty (the statistical model may be wrong or incomplete theavailable information on the explanatory variables may be incomplete as wellsome variables of interest may be outright unobserved) Hence this lsquopartialcorrelationrsquo may thus be more or less precisely estimated If the researcherobtains a precise estimate the quantitative implication of his-her research maybe trusted otherwise not
b Simulation-based approach to interpreting statistical resultsAmong other things numerical (so called lsquoMontecarlorsquo) simulation essentiallyapplies survey sampling techniques to proxy complicated (but presumablymore realistic) mathematical relations and eventually determines how trust-worthy the results of a given regression are In surveys random sampling fromthe population of interest is commonly used to estimate key features (such asmean and variance) of such population with the precision of the estimateincreasing in sample size Simulation essentially follows the same logic to learnabout probability distributions of estimated coefficients not populations In thesame fashion as with real samples approximations can be computed to anydesired level of precision by varying the number of simulations
AGE SENIORITY AND LABOUR COSTS 153
c How statistical simulation works in practice through the software CLARIFYStart from a set of point-wise estimated coefficients of age education and theother variables set out to explain productivity Each of these coefficients has asampling distribution The central limit theorem guarantees that for a largeenough sample one can randomly draw (lsquosimulatersquo) coefficient (lsquoparameterrsquo)values from a multivariate normal distribution with mean equal to the pointestimates of the coefficients and variances equal to the estimated variance andcovariance matrix of the point-wise estimates By random drawing one canobtain a realization of the estimated coefficients on average consistent withtheir point-wise estimates This is the result of one simulation round Thisexperiment can be repeated many times at will (clearly if the coefficient wereprecisely known each draw would be identical) and many values for the esti-mated coefficient of interest computed Each coefficient can then be multipliedby the value of its corresponding explanatory variable (age) The variability inthe values of the simulated coefficients translates in variability (randomness) ofthe expected value of productivity (the dependent variable) while the effectsof the other variables on productivity are held constant at their means
As a result we can compute (and graph) the average partial effect of age onproductivity and also confidence intervals that delimit the degree of trustworthi-ness of such an average To sum up in our case the true relation between age andproductivity is likely complicated for the effect of age on productivity may bepositive or negative depending on age If this is the case describing the resultsof statistical analysis becomes rapidly cumbersome and only imperfectly relatedto the question at hand King et al (2000) have developed a software program(CLARIFY) that without changing any underlying data or statistical assumptionprovides interpretation-friendly and graphical answers to the questions of interest
Figures 2 and 3 are the outputs of CLARIFY and concern respectively theseniority and experience profiles of productivity and wages estimated through OrdinaryLeast Squares from the period-averaged cross-section of plants12 Being OLS cross-sectionalOLS estimates they suffer from many of the biases whose shortcomings have beenextensively discussed above Although precisely tracking the overall direction of thebiases is not easy the reported results likely represent upper bound estimates andthey include both skill depreciation and worker reallocation effects
The statistical simulations underlying Figures 2 and 3 and Table 7 (based on thosefigures) revolve around the multivariate statistical analysis whose point-wise resultsand significance are reported in Table A2 in the appendix To maximize the goodness
12 To compute the necessary confidence intervals CLARIFY requires relatively precisely estimated coefficients be imputed Thisis why we use OLS cross-sectional estimates with the caveats in the main text
154 FRANCESCO DAVERI AND MIKA MALIRANTA
Figure 2 Productivity and wage responses to seniority simulation analysis from estimates in Table A2
Notes See Box 6 for a detailed explanation of how such profiles are constructed
AGE SENIORITY AND LABOUR COSTS 155
Figure 3 Productivity and wage responses to potential experience simulation analysis from estimates in Table A2
Notes See Box 6 for a detailed explanation of how such profiles are constructed
156FR
AN
CE
SCO
DAV
ER
I AN
D M
IKA
MA
LIR
AN
TA
Table 7 Simulations of cumulated productivity and wage responses under various settings
Difference
from to in log of TFP in log of monthly wage
Mean Std err t-value Mean Std err t-value
SeniorityForestSeniority in years 7 17 038 015 260 023 004 581and other variables at their means at their meansMachinerySeniority in years 7 17 000 008 001 002 003 073and other variables at their means at their meansElectronicsSeniority in years 2 6 107 032 331 013 007 183and other variables at their means at their meansSeniority in years 6 10 minus068 020 minus334 minus003 005 minus061and other variables at their means at their meansPotential ExperienceForestExperience in years 15 25 minus040 017 minus233 008 005 169and other variables at their means at their meansMachineryExperience in years 13 20 012 007 177 015 002 776and other variables at their means at their meansElectronicsExperience in years 10 16 minus048 022 minus222 002 005 046and other variables at their means at their meansExperience in years 16 22 049 025 195 012 006 213Other variables at their means at their means
AG
E SE
NIO
RIT
Y A
ND
LA
BO
UR
CO
STS
157
Seniority and experience combinedForestSeniority in years 7 17 minus002 012 minus016 031 004 822and experience in years 15 25and other variables at their means at their meansMachinerySeniority in years 3 10 004 007 053 015 002 662and experience in years 13 20and other variables at their means at their meansElectronicsSeniority in years 2 6 061 029 211 014 005 271and experience in years 10 14and other variables at their means at their meansSeniority in years 6 12 minus069 025 minus277 005 005 106and experience in years 14 20and other variables at their means at their means
Notes Simulations are based on the same regression models (results in Table A2) used for drawing Figures 2ndash3 lsquoMeanrsquo indicates the log difference of productivity (or wage)levels Multiplying the number by 100 provides an approximation of percentage difference in productivity (or wage) levels in the different hypothetical situations For moredetails on how these figures are computed see Box 6
Difference
from to in log of TFP in log of monthly wage
Mean Std err t-value Mean Std err t-value
Table 7 Continued
158 FRANCESCO DAVERI AND MIKA MALIRANTA
of fit of the interpolating line the empirical specification underlying the graphs is moreflexible than those in Tables 4 5 and 6 This boils down to appending more polynomialterms of the same variables to the list of the productivity and wage determinantsin addition to the linear and squared terms present in the tables seen above
In each figure along the vertical axis one reads the marginal response of thedependent variables (logarithms of TFP and wages) to changes in seniority experi-ence and education years measured along the horizontal axis Such responses aredefined over the interval of values taken by each explanatory variable in the industryat hand The thick and dotted lines indicate respectively the average marginalresponse of TFP and wages (with the average taken over the very many potentialvalues of the coefficients of interest) The dot-shaded and line-shaded intervalsaround such estimated average responses represent confidence intervals which pro-vide an indication of the degree of precision of the simulated estimates
451 Seniority profiles (Figure 2) Productivity and wage responses to thecross-section variability in the number of seniority years are very similar to each otherin the forest industry (both growing fast) and in industrial machinery (both essentiallyflat once confidence intervals are taken into account) From the figures reported inthe upper part of Table 7 one learns that moving from a plant with a seniority of 7years for the average worker to a plant with seniority equal to 17 having set the otherdeterminants of productivity to their means results in a productivity increase of 38in the forest industry In electronics the seniority-productivity profile follows a well-defined inverted-U shape while the wage is mildly increasing These trends corre-spond to a swift positive productivity response of cumulated 107 as one shift fromplants with an average worker seniority of two years to plants with worker seniorityequal to six years (with wages going up more moderately) If one moves further byanother four years from plants with seniority equal to six to plants with seniorityequal to ten productivity undergoes a (relative) shortfall of cumulative 68 withroughly unchanged wages These are huge numbers As mentioned in the caveatabove however they are upper bound estimates also inclusive of worker reallocationeffects It should be noted though that very drastic declines in relative productivitylevels with age have been documented for other countries such as France in theliterature (see eg Figure 44 in Productivity Commission 2005)
452 Experience profiles (Figure 3) Productivity and wage responses to thecross-section variability in the years of potential experience are much less preciselyestimated particularly for productivity This may be the result of multi-collinearitybetween experience and seniority which may be at the origin of the initially down-ward sloping response of productivity to experience in the forest industry and inelectronics In industrial machinery one finds instead plausible results with positivewage and productivity responses to experience (with wages and productivity by 15and 12 respectively over 7 years see Table 7) A possible way out is to compute the
AGE SENIORITY AND LABOUR COSTS 159
implied productivity response of both higher experience and seniority (after all if aworker stays with the same plant heshe acquires both experience and seniority atonce) When this is done (see the results in the lower panel of Table 7 lsquoSeniority andexperience combinedrsquo) one finds an essentially flat productivity response to the com-bination of seniority and experience and a moderately positive wage response for acumulated 15 over 7 years of time The combination of seniority and experienceleaves the results for electronics qualitatively unchanged instead When the numberof seniority and experience years is relatively low moving from low-seniority and low-experience plants to high-seniority and high-experience plants corresponds to acumulated productivity increase of about 60 When this is done moving fromintermediate to high levels of seniority and experience the productivity shortfall is ofabout 70 Wages do not follow suit instead but keep going up
46 Summing up and discussion
Our statistical analysis provides a reasonably coherent picture of the empirical rela-tion between age seniority and experience on the one hand and plant productivityand wages on the other in Finland in the years of the IT revolution
At first sight our results seem to support the view that workforce ageing as suchhas adverse effects on labour costs Age is essentially unrelated to productivity whileit is positively correlated with wages As we distinguish the effects of seniority onproductivity and wages from those of general experience though we find that thepicture is more complicated and sharply differs across industries (see Box 7 for a surveyof other studies emphasizing industry differences in productivity and wage profiles)
Box 7 Previous statistical evidence on age seniority experienceproductivity and wages
About 25 years ago Medoff and Abraham (1980 1981) used performanceevaluation to gauge separate information about individual productivity andwage profiles They found that wages do not necessarily reflect productivityBishop (1987) and Flabbi and Ichino (2001) also put together measures ofindividual productivity following the Medoff and Abraham methodology andconfirming their results with other data sets
Hellerstein et al (1999) using US data find that productivity and wagesincrease with age except for the oldest age group in some specifications andtheir patterns are fairly similar Creacutepon et al (2002) use French data andconclude that the relationship of productivity and age follows an inverted U-shape but wage is increasing in age In manufacturing wage increases withskill level but productivity increases even more In non-manufacturing wage
160 FRANCESCO DAVERI AND MIKA MALIRANTA
increases more than productivity as skill levels go up Haegeland and Klette(1999) use Norwegian data and find that productivity and wage increase witheducation and the highly educated go hand in hand by productivity Medium-level potential experience (age minus education years) gave higher productivitythan short experience but with long experience productivity declined althoughstill stayed higher than with short experience Medium-level experience wasunderpaid but the wage premium for long experience corresponded to theproductivity premium They concluded that the wage-experience profile onlypartly reflected the productivity profile
Only a few scholars have looked at cross-industry heterogeneity of produc-tivity and wage responses Aubert and Creacutepon (2004) estimated average earn-ings relations for France and found evidence of declining productivity after theage of 55 but they found that the age-productivity profile (as captured by suchearnings functions) does not differ much across industries In contrast Aubertet al (2004) estimated labour demand curves by using wage bill shares condi-tioned on value added as well as old and new economy capital they did findsignificant evidence that innovative firms and work-practices present lowerwage bill shares
The same result seemingly applies within occupational groups for othercountries Similarly to our findings here Neuman and Weiss (1995) found thatearnings peaks are located earlier in age in the high-tech sector Hellersteinand Neumark (1995) using Israeli data find that earnings and productivityprofiles are fairly similar for the relatively less skilled workers (the group thatcovers most of the workforce)
Other studies have in turn found that the relation has changed over timeThe seniority-wage profile has seemingly become steeper and its peak movedforwards in Denmark as a result of the decentralization of wage determination(Bingley and Westergaard-Nielsen 2003) Eriksson and Jaumlntti (1997) found thatin 1971 the peak of the wage profile was at the age group 35ndash39 years but hasthen moved forward being at the age group 45ndash49 years in 1990 in Finland
Finally a host of previous studies indeed highlights the productivity-enhancingrole of worker mobility between plants The mobility of workers has anadditional important productivity effect that goes beyond the lsquowithin firmrsquoeffect discussed above and examined in this paper lsquoChurningrsquo of plantsfirms(ie simultaneous entries and exits) has been found to have a dominant role inindustry productivity growth Thanks to this mechanism a workerrsquos produc-tivity may improve greatly when she moves from a low productivity plantfirmto a high productivity plantfirm (Foster et al 2001 Disney et al 2003) Withthe data from the Finnish manufacturing sector Maliranta (2003) finds that theaverage productivity growth rate of the plants is typically 50ndash70 of the industry
AGE SENIORITY AND LABOUR COSTS 161
productivity growth rate which is due to the fact that entries but especially exitsand the reallocation of labour and capital between the continuing plants have animportant role to play as well This gap between industry and plant productivitygrowth has been particularly pronounced in the Finnish electronics industrysince the latter part of the 1980s but has also been substantial for instance inthe textile and wearing industry during the latter half of the 1980s and in the basicmetal industry during the latter half of the 1980s and the first half of the 1990s
Returns to seniority are usually positive but declining with the level of seniority inthe forest industry plants about the same applies to earnings profiles Similar consid-erations hold for the productivity and wage effects of general experience in industrialmachinery although the estimated relation is statistically less solid The similarity ofthe productivity and wages responses to the accumulation of human capital indicatesthat in lsquoaveragersquo industries skill depreciation does not seemingly lead to higherlabour costs And given that these industries are still quantitatively important in theFinnish economy wage-productivity misalignments cannot be the main explanationfor the bad labour market performance of the elderly in Finland
The picture is quite different for the high-tech plants In electronics ndash the industrywhere people are exposed to rapid technological and managerial changes ndash theresponses of plant productivity and wages to seniority are very different from eachother The seniority-productivity profile shows a positive relation first and then negativeas one looks at plants with higher average seniority while wages instead keep goingup with seniority13 This holds for plants with similar education plant age and sizeand other conditions and is thus not related to plant differences in these other respectsHow negative the productivity returns to seniority may become cannot be said withcertainty Numerical simulations based on our OLS cross-sectional results indicatethat the change of sign in the seniority-productivity profile may be pronounced
Altogether our results are consistent with the idea that fast technical change bringsabout accelerated skill depreciation of senior workers We cannot honestly rule outhowever that our correlations may also be the result of worker movements acrossplants The negative correlation between seniority and productivity may in fact alsoreflect the reallocation away of younger (and more productive) workers who leavebehind older plants attracted by the career prospects offered in newly born high-productivity firms and plants14 We cannot precisely quantify the relative importance
13 This is not too surprising as recently discussed at length by Uusitalo and Vartiainen (2005) the combination of highlycentralized collective agreements with relatively autonomous but still highly unionized industry wage setting has resulted in avery low weight (44 on average) given to performance-related firm-level corrections of wages14 Evidence on the importance of reallocation for productivity purposes was indeed provided by Ilmakunnas et al (2005) for theFinnish manufacturing sector where it was shown that the churning of workers (ie simultaneous hiring and separation ofworkers within a plant) speeds up plant productivity growth while holding back seniority
162 FRANCESCO DAVERI AND MIKA MALIRANTA
of the two effects in our statistical analysis Both skill depreciation and worker reallo-cation appear to affect the relation between seniority and productivity in the Finnishhigh-tech industry
It looks as though the deferred compensation hypothesis perhaps amended withthe insights from sorting and matching theories fits better the labour market facts inhigh-tech industries than the human capital hypothesis Yet the evidence for thelsquoaveragersquo industries is not consistent with this hypothesis This is an open issue thatwe briefly discuss further in the concluding section
5 CONCLUSIONS
We started this paper asking ourselves whether we could explain the weak labourmarket position of older workers The simultaneous presence of a relatively aged ndashand still rapidly ageing ndash workforce and a major external shock (such as the ITrevolution of the late 1990s) makes Finland a nice experiment to address this questioninvestigating the diverse responses of wages and productivity to age seniority andexperience patterns across industries
Our results do not indicate that age as such is responsible for the bad labourmarket outcomes of the elderly The differential effect of seniority and experienceon productivity and earnings is minor for two of the three Finnish manufactur-ing industries (the lsquoaveragersquo ones) we chose to analyse These productivity andwage patterns probably reflect the relatively more valuable role of tacit knowledgein traditional industries Productivity and wage profiles differ just in electronicsnot in the other industries We interpret this as implying that exposure torapid technological and managerial changes seems to make a difference for plantproductivity less so for wages for the high-tech plants Yet this productivity-wage discrepancy is not associated with age but rather with seniority hence with avariable which can be affected by individual and policy decisions to a greater extentthan age that is largely exogenous for the individual (though not for the plantmanager)
In the end our results give support to at least two important policy implicationsFirst the similar shapes of productivity and wage profiles in lsquoaverage industriesrsquoindicate that the weak labour market performance of older workers in Finland is notbecause they are a burden for the average firm in the economy Leaving high-techplants aside the bad labour market outcomes of the elderly in the rest of the economyare presumably driven by two other causes such as discriminatory attitudes on theemployer side and public incentives schemes easing the way towards early retirementTo ameliorate the labour market performance of the elderly policy should addressthese issues Second higher seniority is instead associated with higher labour costs inhigh-tech plants This is consistent with the anecdotal evidence from Wal-Mart andEricsson that we have reported It is also consistent with the beliefs ndash entertained bymany Finnish employers ndash that older people could not adapt as easily as younger ones
AGE SENIORITY AND LABOUR COSTS 163
to the arrival of the new technology15 And indeed a survey conducted by the Ministryof Labour in 2002 indicates that as much as 10 of prime-aged workers (and 15of workers above 50) agree that lsquoworkplace discriminates against old workersrsquo16 Inspite of government-mandated media campaigns to counteract such attitudes thepossibility that a negative employer bias against old workers has affected hiring andfiring practices in the late 1990s cannot thus be easily ruled out Our results suggestthat this effect is not present in the Finnish economy at large but mainly in high-techplants
To improve the employability of older workers in these industries public policyshould divert resources away from preserving existing jobs and lend more attentionon the retraining of old workers to ease their reallocation away from less productiveplants (or plants where they have become less productive) into new jobs Some gov-ernments are more worried and more interventionist than others in this respect Inthe last few years for instance the Finnish Government has already embarked on aprogramme (lsquoThe National Programme on Ageing Workersrsquo see OECD 2004 p119) aimed at deferring retirement and in parallel improving the so called lsquoemploy-abilityrsquo of older workers It is unclear however to what extent grand plans maybe effective to bring about a solution to these problems Policies aimed at easingreallocation across plants even within the same industry would probably be a usefulcomplementary tool in this respect
Finally our results are also somehow puzzling in at least one respect They are notfully consistent with any of the existing theories that we know The results for thehigh-tech plants are consistent with the deferred compensation hypothesis and notwith the human capital hypothesis As surveyed in the theoretical section of the paperthe human capital hypothesis would predict a negative discrepancy in plants with anolder labour force where we instead find the opposite results But even the Lazearhypothesis is not fully consistent with our Finnish data because the results found forelectronics are not there for the other industries
This begs the question of why the Lazear model is more relevant in high-techplants than in the other plants One possibility is that productivity is less easilyobservable in high-tech industries This would make the asymmetric informationmechanism envisaged by Lazear more sensible in those industries This explanationwould probably do if our results were there for plants producing immaterial lsquoweight-lessrsquo services whose output is typically hard to measure Our discussion here insteadconcerns plants producing lsquoconcretersquo manufacturing goods for which productivitymis-measurement is presumably a less serious concern An alternative possibility is
15 Juuti (2001) reports that young line managers with a good educational background often harboured prejudice against theability of older workers to cope with new things This is potentially important for hiring and firing practices Althoughdiscriminating attitudes are rarely shared by top-level managers recruitment decisions happen to be taken by the mid-managementlevel16 Kouvonen (1999) reports somewhat lower figures with a 5 share of people above 45 having experienced age at discrimi-nation at work for the average firm
164 FRANCESCO DAVERI AND MIKA MALIRANTA
that seniority being the other side of impeded resource reallocation is particularlydamaging in industries where changes ndash requiring flexibility and ability to quicklyadapt ndash come about all the time Hence the adverse consequences of seniority mani-fest themselves in these industries and less so in other industries where changes aresmoother Under these circumstances a less mobile ageing workforce might constitutean impediment to productivity growth of firms and their plants To the extent thatlow productivity (and low immobility) is a consequence of declining ability to inces-santly adopt new technologies due to weak basic education public policy should focuson efforts to increase the quantity and improve the quality of the adult education Ifhowever the main reason for staying still too long is not the inability of older workersto adopt new technologies policy-makers should seek ways to encourage the mobilityof the ageing workforce to maintain the scope for continued productivity enabled bylearning-by-doing Greater mobility of workers might also facilitate the diffusion oftechnologies and thereby speed up productivity growth of the firms ndash and stimulatinglsquocreative destructionrsquo (ie productivity-enhancing churning of plants and firms withinindustry) to boot
Finally how special are our results Insofar as the use of ICT will spread to otherindustries in the years to come it can be expected that the productivity patternsobserved in electronics will emerge in other industries in the future The findings forelectronics may be foretelling more general developments in the other industries ofthe Finnish economy ndash and possibly other economies For sure in a world whereinnovation forces as opposed to catching up forces have become the key engine ofgrowth (see Acemoglu et al 2003 and the Sapir Report 2004) companies andgovernments will be more and more involved in such problems as the ones discussedin this paper
Discussion
Wendy CarlinUniversity College London and CEPR
Four facts about the advanced economies provide the motivation for this paperthe poor labour market performance of older workers (unemployment and employ-ment rates) the ageing of the labour force evidence measured in surveys of a declinein physical and mental performance at higher ages and finally the change in industrystructure toward lsquohigh techrsquo industries This raises the question of whether theemployability of older workers declines because they become too costly (diminishingproductivity is not compensated by lower wages) and whether this is especiallymarked in high-tech sectors of the economy The authors of this paper do not findevidence supporting either of these hypotheses in their data from three Finnishmanufacturing industries However their findings suggest that there is a hump-shaped
AGE SENIORITY AND LABOUR COSTS 165
relationship between a measure of productivity and the seniority (not age) of workersin plants in the high-tech industry in their sample electronics There is no corre-sponding pattern for wages This is interpreted as signalling a potential problem inthe matching of workers to jobs in industries with rapid technological progress in thecontext of constraints on worker mobility (eg costs of firing)
Channels through which ageing can affect economic performance are the averagequality of the direct labour input the effect on capital deepening because of theimplications of ageing for private and public saving and its impact on technologicalprogress (new ideas and diffusion) Older people may be less creative entrepreneurialand risk-taking and the depreciation of their skill set may imply less adaptation anddiffusion of new knowledge On the other hand an ageing population may createbigger incentives for labour and memory saving innovation
In order to evaluate the economic impact of age-related variables it is essential tospecify whose perspective we are taking From the perspective of workers the decisionis whether to remain in their job to search for a new one to leave the labour forceor to invest in (re)training And the key question is how age and or seniority affectwage and employment prospects as well as training opportunities within and outsidethe firm For firms the question is how age or seniority affects the profitability ofexisting production and the firmrsquos investment in human and physical capital and ininnovation What are the constraints on the wage structure they can deploy and onfiring From the perspective of a policy-maker concerned with welfare the questionis the impact of age-related variables on total factor productivity and the role ofpolicy-related barriers to the reallocation of workers training and early retirementprogrammes
In this paper Daveri and Maliranta take one slice of this question focusing on theimpact of age-related variables on the quality of direct labour input
bull How are productivity and wages related to age structure and seniority at theplant level in manufacturing
bull Does this relationship vary according to the innovativeness or technology inten-siveness of the industry
To answer these questions it is necessary to have matched employer-employee dataand a clear contrast in industry characteristics This makes the use of data fromFinland an appropriate choice there is high-quality matched data and looking at theperiod of the late 1990s to the early 2000s provides a nice contrast among thetraditional industry of lsquoforest productsrsquo a neutral one of industrial machinery and ahigh-tech industry electronics
The method is to use plant-level data to estimate an index of total factor produc-tivity and to calculate the average wage Each of these is then used as the dependentvariable in a separate regression for each industry with various combinations of theage-related variables on the right-hand side along with a set of plant-level controlvariables (including years of schooling a dummy for a foreign-owned plant and
166 FRANCESCO DAVERI AND MIKA MALIRANTA
dummies for different vintages of plants including those that exit during the observa-tion period) The age-related variables are worker age seniority (ie years in thecurrent firm) and labour market potential experience (age minus age when completedlast qualificationdegree) averaged for workers in each plant It is somewhat odd thatTFP is the productivity variable of choice when an initial motivation was the impactof age-related variables on firm profitability via labour costs which suggests that it islabour productivity that is relevant not TFP17
Neither age nor age squared is ever significant in a productivity regression Inelectronics but in neither of the other industries there is a positive coefficient onseniority and a negative coefficient on the squared term in seniority This says thatwhen looking across plants TFP initially rises as the average tenure of workers in theplant goes up but then falls in plants with higher levels of average seniority Theeffects of age-related variables on wages are mainly (but not always) positive in forestproducts hump-shaped for age (but with no robust tenure effects) in machinery andpositive for age and weakly positive for tenure and experience in electronics
The authors conclude that it is not age per se but seniority that affects TFP andthat this effect is found only in the high-tech sector electronics In order to make theirresults more easily interpretable they estimate modified versions of their equationsand produce graphs showing the average partial effect of the variable of interestFrom these equations they calculate the effect on TFP of a change in for exampleseniority As acknowledged by the authors the estimate that plant productivitydoubles when average seniority of the workforce goes from 2 to 6 years and then falls bytwo-thirds as average seniority goes from 6 to 10 years is very large My main concernwith this central result in the paper is that it may reflect the dynamics of a rapidlygrowing industry rather than the inherent characteristics of long-tenure workers inelectronics
In electronics a plant where the average tenure is six years is estimated to be atthe lsquoturning pointrsquo from rising to falling TFP As Table A1 shows the mean tenurein the sample for electronics plants is six years which reflects the rapid growth of theindustry it is 11 years and 9 years respectively in the forest products and machineryindustries The likely role of industry dynamics in generating tenureproductivityprofiles of the kind shown in the paper can be illustrated by a simple example If weassume that initially there are three industries F M and W with identical plants interms of TFP age and seniority structure In particular we assume there is no causallink from the average age or seniority of workers in a plant to the plantrsquos TFP Wenow introduce a different demand shock for each industry a negative demand shockfor industry F no change for M and a positive shock for E We assume that there isunobserved heterogeneity in managerial ability across plants As a consequence of the
17 TFP is calculated using a simple growth accounting framework with the assumption of a constant labour share (WLY ) Ifthe aim is to test whether seniority or ageing affects labour costs which are measured by the ratio of wages to labourproductivity then this is perhaps not an ideal choice
AGE SENIORITY AND LABOUR COSTS 167
differential demand shocks and assuming there are costs of entry and exit we willobserve disequilibrium in the F and E industries Good managers in E will expandoutput increase hiring and raise TFP relative to other plants in E Since hires havezero seniority average seniority in these expanding higher TFP plants will fall lowerseniority is associated with higher TFP but by assumption this is independent of anyrelationship between individual human capital (and TFP) and tenure Similarly goodmanagers in F identify the decline in their industry earlier and cease hiring soonerwith the result that higher TFP firms end up with on average longer tenure workersThis produces a positive relationship between seniority and TFP in the lsquodecliningrsquoindustry and a negative relationship in the lsquoexpandingrsquo industry In the industrywhere there is no shock there is no relationship This pattern is consistent with thecontrast between the three industries shown in Figure 2 of the paper18
Figure 4 provides some illustrative data showing that employment grew in telecom-munications equipment and shrank in forest products over the time period consideredin the paper
18 A similar story could be told to account for the within firm pattern that is shown in column [6] of Table 6 Using fixed effectsestimation the relationship between changes in TFP over time and in the age-related variables is uncovered controlling fortime invariant characteristics of plants such as managerial quality A similar although a much weaker hump-shaped relationshipbetween TFP and seniority is reported If we now assume that a new higher TFP technology emerges in electronics during theperiod of observation but not in forest products production in electronics becomes more profitable and each firm expands Theincrease in hiring reduces seniority and we associate a within-firm rise in TFP with a fall in seniority
Figure 4 Contrasting industry dynamics in Finland 1995ndash2002
Note Telecommunications equipment = ISIC322 Mechanical engineering = ISIC29 Forest products =ISIC20+21
Source Groningen Growth and Development Centre 60-Industry Database October 2005 httpwwwggdcnet updated from OrsquoMahony and van Ark (2003)
168 FRANCESCO DAVERI AND MIKA MALIRANTA
The authors undertake a number of tests to check the robustness of their resultsbut they are not able to separate out the possible impact of industry dynamics drivenby exogenous demand or technology shocks from the causality of seniority producinga change in efficiency that they seek to identify Another approach to identifying suchan effect would be to focus on those who switch jobs The DaverindashMaliranta storyimplies that in electronics longer tenure workers are worse substitutes for otherwiseequivalent workers than is the case in the other two industries This suggests that theyshould get a bigger wage cut if they switch jobs as compared with similar workers inone of the other industries19
Hence although the results in the paper are suggestive I think further investigationis required before we can be confident that there really is a causal link of policy-relevant magnitude in a high-tech industry from seniority (longer tenure in a givenfirm) to lower TFP
Rudolf Winter-EbmerUniversity of Linz Institute for Advanced Studies (IHS) Vienna and CEPR
Daveri and Maliranta have produced a very interesting paper on the impact of ageand seniority on wages and productivity in Finland The main idea is that the effectsof ageing on firm productivity are very different in traditional industries as comparedto high-tech or information technology industries (electronics in their empirical analysis)Psychometric studies have shown that physical cognitive and verbal abilities havedifferent age gradients whereas physical and cognitive skills such as mathematicaland logical skills decay pretty fast organizational and verbal skills show no particularageing pattern at all (Skirbekk 2003) Daveri and Maliranta argue that ageing of theworkforce is more problematic in high-tech industries because of a faster technicalchange faster changes in production technologies and faster product developmentWhile most psychometric and other studies relate to age as such Daveri andMaliranta concentrate their argument on the impact of job tenure within a particularfirm while there is no difference between the productivity-experience and wage-experience paths in the electronics industry ndash nor in the machinery industry by theway ndash there is a significant divergence in the development of productivity and wagesas seniority in a firm increases This pattern cannot be seen in more traditionalindustries like forestry and machinery
While the general pattern of a higher interdependence between firm senioritytechnology adaptation and learning ndash and in turn productivity ndash in high-tech firmsis sensible the main empirical results seem to be out of line Productivity in electronicsfirms increases by 61 log points in the first 4 years of tenure (in fact from year 2 to
19 Using Finnish data Uusitalo and Vartiainen (2005) report that firm exits and promotions increase earnings up to age 50after which such events do not on average improve a personrsquos relative position Whether this is true of tenure and whether itdiffers across industries would be relevant evidence for the DaverindashMaliranta hypothesis
AGE SENIORITY AND LABOUR COSTS 169
year 6) but decreases in the following 6 years again by 69 log points (see Table 7) Aliteral interpretation of these results would be that workers who stay with their firmsfor more than 6 years lose more than half of their productivity they become such aburden to the firm that everybody would have to be fired otherwise the managerswould be acting completely irresponsibly This is probably not what we are seeing inthese firms
Moreover the measured effect is basically a product of a simple OLS cross-sectionregression it is much reduced and less well statistically determined if other methodsor data are used Some other possible explanations come to my mind which couldhave produced such an outcome The data relate to mean characteristics of theworkforce such as mean age and mean tenure of workers As the IT boom in Finlanddid not start before the mid 1990s I suspect that there are not many firms with meantenure of its workforce of more than 7 years ndash and if they exist they might be fairlydifferent firms with a different technology and firm organization As Daveri andMaliranta correctly state the causal impact of mean tenure on productivity cannotbe properly distinguished from matching and selection problems it is by no means acoincidence that some workers stay with the firm longer others donrsquot it is no coin-cidence why some firms stick to their complete workforce longer or to phrase itdifferently why workers want to stay longer with a particular firm Good workers staywith good firms and vice versa All these matching arguments make the strong pointthat a simple correlation between job seniority and productivity will be an upwardbiased estimate of the real causal effect of job seniority on productivity Relatedlabour economics studies on the causal effect of seniority on wages come to theconclusion that OLS estimates overestimate the true causal effect by a factor betweentwo and four (Topel 1991 Altonji and Shakotko 1987)
It has to be said though that finding convincing estimates of the relation betweenfirm employment structure and productivity is very difficult simple fixed effectsmodels using variation in the composition of the workforce over time to determine thevariation of productivity fall again prey to the criticism of reverse causality why doand how can firms change the composition of their workforce Only by changingrecruitment and lay-off policies policies which are obviously related to past andexpected productivity While the causal impact is very difficult to establish in suchstudies any work in this direction using new data sets is very interesting Furtherimportant questions come to my mind for instance concerning inter-firm mobilitywithin the industry which seems to contribute to productivity growth throughout theindustry (Parent 2000) It seems that inter-firm mobility is higher in the high-techsector which could contribute to explain the diverging pattern between seniority-productivity and experience-productivity profiles Another important issue concernswage-setting schemes If indeed high-tech sectors have a higher prevalence ofdeferred payment schemes like stock options or profit sharing in some sort or theother the relation between age or tenure and wages would be steeper and the diver-gence between wage and productivity development would shrink
170 FRANCESCO DAVERI AND MIKA MALIRANTA
The personnel economics and firm organization literature has also stressed com-plementarities in the composition of the workforce a good mix of old and youngworkers might be better for firm productivity than employing only young or only oldworkers (Lazear 1998 Grund and Westergaringrd-Nielsen 2005) It might be interestingto see whether these results hold also in the high-tech industry Such an analysiswould require looking at the age and tenure composition of the workforce in moredetail by using the underlying micro data
In my view policy conclusions are still difficult to draw from this paper MaybeFinland was not such a good experiment in this respect because its high-tech sectorhad an explosive growth after 1995 which is too short and too turbulent a period todraw firm conclusions about the effects of firm seniority and the like Replicating thestudy for another country with a more smooth development of its high-tech sectormight be a welcome complement
APPENDIX DATA SET AND VARIABLE DESCRIPTION
Similarly to the other Nordic countries Finland is endowed with a rich register dataof companies plants and individuals (see Statistics Denmark et al 2003) The uniqueidentification codes for persons companies and plants used in the different registersform the backbone of the Finnish administrative register network and the Finnishstatistical system whereby different sources of information can be integrated conven-iently for various statistical purposes20 By using this system Statistics Finland hasconstructed the Finnish Longitudinal Employer-Employee Database (FLEED) whichis tailored for various needs of economic research Its most comprehensive anddetailed version is maintained at Statistics Finland It contains information of com-panies plants and individuals Plants are linked to their companies and individualsto their employer plants and companies Data are collected from Business Register(plants and companies in the business sector) Census of Manufacturing (manufactur-ing plants) Financial Statements Statistics (companies in the business sector) RampDsurvey and ICT survey (companies in the business sector) and Employment Statistics(individuals aged between 16 and 69 years) These data include a wide variety ofdetailed information on these units A large proportion of variables are available from1990 to 2002 These data cover essentially the whole target population of companiesplants and individuals Due to confidentiality concerns outside researchers do nothave direct access to it For the outside researchers Statistics Finland has constructeda separate version of it The variable set is more limited and some of the categoricalvariables are broader (many industries are combined for example)
This paper employs plant level information for plants and workforce Productivitymeasures plant age plant size originate from the Census of Manufacturing We donot have information of the levels of value added hours worked or capital stock as
20 Data sources and linking of them is described in greater detail in Ilmakunnas et al (2001) and Maliranta (2003)
AG
E SE
NIO
RIT
Y A
ND
LA
BO
UR
CO
STS
171
Table A1 Descriptive statistics of data on plants by industry plant averages in 1995ndash2002
Variables Forest industry Machinery industry Electronics industry
Mean Sd p5 Median 95p Mean Sd p5 Median 95p Mean Sd p5 Median 95p
Log of TFP index 180 074 088 166 328 283 059 208 272 400 227 104 099 205 458Log of monthly wage (in euros)
761 024 723 759 802 769 019 736 769 800 765 023 727 767 803
Schooling years 110 04 103 110 117 116 09 106 114 136 122 12 106 119 145Age in years 396 38 333 401 450 393 40 318 398 450 356 38 294 358 416Potential experience in years
216 39 151 221 271 207 42 131 211 269 164 40 93 166 225
Seniority in years 109 56 26 108 195 92 48 27 89 175 63 33 21 53 1269
Proportion ()
Proportion ()
Proportion ()
Plant birth before 1977 570 3457 2791Plant birth 1977ndash1980 63 847 756Plant birth 1981ndash1985 55 688 407Plant birth 1986ndash1990 107 1658 2326Plant birth 1991ndash1995 99 1887 1977Plant birth 1996ndash 107 1464 1744Plant size 5ndash9 persons 18 314 317Plant size 10ndash19 persons 90 1020 685Plant size 20ndash49 persons 309 4108 3351Plant size 50ndash99 persons 217 2056 2065Plant size 100ndash persons 367 2502 3581Foreign-owned plant 62 1986 1295Plant death during 1996ndash2002
118 1922 2209
Number of plants 365 567 172
Notes The data are constructed in the Research Laboratory of Statistics Finland by linking the plants in the Finnish Manufacturing Census and individuals in the EmploymentStatistics with plant codes
Source Authorsrsquo own calculations
172FR
AN
CE
SCO
DAV
ER
I AN
D M
IKA
MA
LIR
AN
TA
Table A2 Statistical analysis behind the simulation graphs between plants estimation
Forest TFP
Forest wage
Machinery TFP
Machinery wage
Elect TFP
Elect wage
Schooling years minus3386 minus0073 0826+ 0182 1481 0310(2491) (0815) (0470) (0140) (1294) (0210)
[Schooling years]2 1503 0095 minus0285 minus0020 minus0511 minus0070(1113) (0368) (0194) (0057) (0524) (0084)
Potential experience 1017 minus0014 0171 0082+ minus0785 0007(0371) (0118) (0151) (0044) (0616) (0110)
[Potential experience]2 minus0513 0021 minus0072 minus0024 0364 minus0012(0187) (0057) (0081) (0022) (0390) (0071)
[Potential experience]3 0081 minus0005 0010 0002 minus0047 0005(0030) (0009) (0014) (0004) (0078) (0015)
Seniority in years minus0013 minus0003 minus0045 minus0020 1276 0131(0086) (0027) (0054) (0018) (0272) (0062)
[Seniority in years]2 0070 0012 0033 0022 minus1665 minus0161+(0081) (0026) (0056) (0017) (0365) (0083)
[Seniority in years]3 minus0025 minus0000 minus0008 minus0007 0622 0061+(0022) (0007) (0017) (0005) (0153) (0034)
Plant birth in 77ndash80 0237 0003 minus0051 0019 minus0088 minus0027(0119) (0032) (0066) (0029) (0154) (0044)
Plant birth in 81ndash85 0247 0059 0057 0014 minus0210 0032(0117) (0041) (0079) (0021) (0257) (0043)
Plant birth in 86ndash90 0658 0040 0255 0013 0094 0019(0104) (0027) (0057) (0018) (0209) (0046)
Plant birth in 91ndash95 0575 0026 0432 0083 0680 minus0012(0144) (0037) (0060) (0017) (0232) (0042)
Plant birth in 96ndash 0969 0052 0629 0077 0677 0029(0196) (0037) (0088) (0025) (0286) (0052)
R-squared 0545 0647 0486 0516 0527 0581Adj R-squared 0510 0620 0461 0493 0442 0505Number of plants 365 365 567 567 172 172
Notes Other control variables include dummies for plant size (5 groups) foreign-ownership and death during 1996ndash2002 Robust standard errors are shown in parentheses+ p lt 01 p lt 005 p lt 001 p lt 0001
AGE SENIORITY AND LABOUR COSTS 173
such but we do have the ratio of value added to the number of hours worked (bywhich we identify labour productivity) and the capital stock per hour worked (ameasure of the capital-labour ratio) The capital stock measure is calculated throughthe perpetual inventory method (for more details see Maliranta 2003)
Since 1995 (our main period of analysis) all plants owned by firms that employ noless than 20 persons are included Therefore since 1995 the data also include thevery small plants of multi-unit firms but on the other hand the plants of smallsingle-unit firms are left outside Some plants are dropped from the sample becauseof failure of linking some plants in the Manufacture Census to other sources ofinformation Thanks to the link between Census of Manufacturing and EmploymentStatistics we have information about plant workforce This includes the averagepotential experience (the number of years after the last completed degree) seniority(the number of years spent working in the current company) and the number ofschooling years (usually needed for the degree) The labour characteristics of theplants are computed in Statistics Finland by using the comprehensive version of thedatabase About 80ndash90 of individuals can be linked to their plants so that ourvariables should be measured with a reasonable accuracy In the analysis we havealso dropped some outliers21
REFERENCES
Acemoglu D P Aghion and F Zilibotti (2003) lsquoVertical integration and distance to frontierrsquoJournal of the European Economic Association 1(23) 630ndash38
Ali-Yrkkouml J L Paija C Reilly and P Ylauml-Anttila (2000) Nokia A Big Company in a SmallCountry ETLA The Research Institute of the Finnish Economy Series B162 Helsinki
Altonji JG and RA Shakotko (1987) lsquoDo wages rise with job seniorityrsquo Review of EconomicStudies 54 437ndash39
Aubert P and B Creacutepon (2004) Age Salaire Et Productiviteacute La Productiviteacute Des Salarieacutes Deacutecline-T-Elle En Fin De Carriegravere Technical report Mimeo Economie et Statistiques
Aubert P E Caroli and M Roger (2004) New Technologies Workplace Organisation and the AgeStructure of the Workforce Firm-Level Evidence INSEE Paris
Autor DH F Levy and RJ Murnane (2003) lsquoThe skill content of recent technologicalchange An empirical explorationrsquo Quarterly Journal of Economics 118(4) 1279ndash333
Becker GS (1962) lsquoInvestment in human capital A theoretical analysisrsquo Journal of PoliticalEconomy 70(5 Part 2 Investment in Human Beings) 9ndash49
Bingley P and N Westergaard-Nielsen (2003) lsquoReturns to tenure firm-specific human capitaland worker heterogeneityrsquo International Journal of Manpower 24(7) 774ndash88
Bishop J (1987) lsquoThe recognition and reward of employee performancersquo Journal of LaborEconomics 5(4) s36ndashs56
Blanchflower DG and AJ Oswald (1988) lsquoInternal and external influences upon pay settle-mentsrsquo British Journal of Industrial Relations 26(3) 363ndash70
Brock WA and DS Evans (1986) The Economics of Small Business Holmes amp Meier NewYork
Brown C and JL Medoff (2003) lsquoFirm age and wagesrsquo Journal of Labor Economics 21(3) 677ndash97
21 In the estimation some extreme outliers are removed from the regression analysis Identification has been carried out byusing the method of Hadi (1992 1994) The variables used in this procedure are the log of labour productivity the log ofmonthly wage the log of capital intensity schooling years and potential experience Overall a couple of percentages of plantswere dropped for being deemed outliers
174 FRANCESCO DAVERI AND MIKA MALIRANTA
Creacutepon B N Deniau and S Peacuterez-Duarte (2002) Wages Productivity and Worker Chara-cteristics A French Perspective January INSEE httpwwwcrestfrpagepersocreponCreponDeniauPerezDuarte2002pdf
Daveri F and O Silva (2004) lsquoNot only Nokia What Finland tells us about new economygrowthrsquo Economic Policy 19(38) 117ndash63
Davis SJ and J Haltiwanger (1991) lsquoWage dispersion between and within US manufactur-ing plants 1963ndash86rsquo Brookings Papers on Economic Activity Microeconomics 1991 115ndash80
Disney R J Haskel and Y Heden (2003) lsquoRestructuring and productivity growth in UKmanufacturingrsquo Economic Journal 113(489) 666ndash94
Dunne T MJ Roberts and L Samuelson (1989) lsquoThe growth and failure of US manu-facturing plantsrsquo Quarterly Journal of Economics 104(4) 671ndash98
Dygalo NN and JM Abowd (2005) lsquoEstimating experience-productivity profiles from earn-ings over employment spellsrsquo unpublished manuscript 27 November
Eriksson T and M Jaumlntti (1997) lsquoThe distribution of earnings in Finland 1971ndash1990rsquoEuropean Economic Review 41(9) 1763ndash79
Flabbi L and A Ichino (2001) lsquoProductivity seniority and wages New evidence from per-sonnel datarsquo Labour Economics 8(3) 359ndash87
Foster L J Haltiwanger and CJ Krizan (2001) lsquoAggregate productivity growth Lessonsfrom microeconomic evidencersquo in CR Hulten ER Dean amp MJ Harper (eds) NewDevelopments in Productivity Analysis (pp 303ndash63) University of Chicago Press Chicago
Griliches Z (1995) lsquoRampD and productivity Econometric results and measurement issuesrsquo inP Stoneman (Ed) Handbook of the Economics of Innovation and Technological Change (pp 52ndash89)Blackwell Publishers Ltd Oxford
Griliches Z and V Ringstad (1971) Economics of Scale and the Form of the Production FunctionNorth Holland Amsterdam 1971
Griliches Z and H Regev (1995) lsquoProductivity and firm turnover in Israeli industry 1979ndash1988rsquo Journal of Econometrics 65 175ndash203
Grund C and N Westergaringrd-Nielsen (2005) lsquoAge structure of the workforce and firm per-formancersquo IZA Working Paper No 1816 Bonn
Hadi AS (1992) lsquoIdentifying multiple outliers in multivariate datarsquo Journal of the Royal Statis-tical Society Series (B) 54 761ndash71
mdash (1994) lsquoA modification of a method for the detection of outliers in multivariate samplesrsquoJournal of the Royal Statistical Society Series (B) 56 393ndash96
Haegeland T and TJ Klette (1999) lsquoDo higher wages reflect higher productivity Educationgender and experience premiums in a matched plant-worker data setrsquo in The Creation and Analysisof Employer-Employee Matched Data (pp 231ndash59) Elsevier Science North-Holland Amsterdam
Hellerstein JK and D Neumark (1995) lsquoAre earnings profiles steeper than productivityprofilesrsquo Journal of Human Resources 30(1) 89
Hellerstein JK D Neumark and KR Troske (1999) lsquoWages productivity and workercharacteristics Evidence from plant-level production functions and wage equationsrsquo Journalof Labor Economics 17(3) 409ndash46
Ilmakunnas P and M Maliranta (2005) lsquoTechnology labour characteristics and wage-productivity gapsrsquo Oxford Bulletin of Economics and Statistics 67(5) 623ndash44
Ilmakunnas P M Maliranta and J Vainiomaumlki (2001) lsquoLinked employer-employee data onFinnish plants for the analysis of productivity wages and turnoverrsquo in T Jensen and AHolm (eds) Nordic Labour Market Research on Register Data (pp 205ndash46) TemaDord NordicCouncil of Ministers Coperhagen
mdash (2004) lsquoThe roles of employer and employee characteristics for plant productivityrsquo Journalof Productivity Analysis 21 249ndash76
mdash (2005) lsquoWorker turnover and productivity growthrsquo Applied Economics Letters 12(7) 395ndash98Juuti P (2001) Ikaumljohtaminen Kansallinen ikaumlohjelma Tyoumlministeriouml JTO-tutkimuksia No 13
HelsinkiKanazawa S (2003) lsquoWhy productivity fades with age The crime-genius connectionrsquo Journal
of Research in Personality 37 257ndash72King G M Tomz and J Wittenberg (2000) lsquoMaking the most of statistical analyses Improving
interpretation and presentationrsquo American Journal of Political Science 44(2) 347ndash61Kouvonen A (1999) Ikaumlsyrjintaumlkokemukset Tyoumlssauml Ja Tyoumlhoumlnotossa Tyoumlpoliittinen tutkimus No 203Koumllling A C Schnabel and J Wagner (2005) lsquoEstablishment age and wages Evidence from
German linked employer-employee datarsquo in L Bellmann O Huumlbler W Meyer and
AGE SENIORITY AND LABOUR COSTS 175
G Stephan (eds) Institutionen Loumlhne Und Beschaumlftigung (pp 81ndash99) Nuumlrnberg httpwwwwisouni-erlangendeforschungforschungsberichteforschungsbericht2005pdf
Lazear EP (1981) lsquoAgency earnings profiles productivity and hours restrictionsrsquo AmericanEconomic Review 71(4) 606ndash20
mdash (1998) Personnel Economics for Managers John Wiley and Sons New YorkMaliranta M (1997) lsquoPlant Productivity in Finnish Manufacturing ndash Characteristics of High
Productivity Plantsrsquo The Research Institute of the Finnish Economy (ETLA) DiscussionPaper No 612 Helsinki
mdash (1999) lsquoFactors of performance by plant generation Some findings from Finlandrsquo in SBiffignandi (ed) Micro- and Macrodata of Firms Statistical Analysis and International Comparison(pp 391ndash424) Physica Heidelberg
mdash (2003) Micro Level Dynamics of Productivity Growth An Empirical Analysis of the Great Leap inFinnish Manufacturing Productivity in 1975ndash2000 The Research Institute of the Finnish Econ-omy (ETLA) Series A 38 (available at httpwwwetlafifiles1075_micro_level_dynamicspdf )Helsinki
Maliranta M and P Rouvinen (2004) lsquoICT and business productivity Finnish micro-levelevidencersquo in The Economic Impact of ICT Measurement Evidence and Implications (pp 213ndash40)OECD Paris
Manning A (2000) lsquoMovin on up Interpreting the earnings-experience profilersquo Bulletin ofEconomic Research 52 261ndash95
Medoff JL and KG Abraham (1980) lsquoExperience performance and earningsrsquo QuarterlyJournal of Economics 95(4) 703ndash36
mdash (1981) lsquoAre those paid more really more productive The case of experiencersquo Journal ofHuman Resources 16(2) 186ndash216
Moen J (2005) lsquoIs mobility of technical personnel a source of RampD spilloversrsquo Journal ofLabor Economics 23(1) 81ndash114
Neuman S and A Weiss (1995) lsquoOn the effects of schooling vintage on experience-earningsprofiles Theory and evidencersquo European Economic Review 39(5) 943ndash55
Nurmi S (2004) Essays on Plant Size Employment Dynamics and Survival Helsinki School ofEconomics A-230 Helsinki
OECD (2003) OECD Science Technology and Industry Scoreboard OECD Parismdash (2004) Ageing and Employment Policies Finland OECD Parismdash (2006) Live Longer Work Longer OECD ParisOrsquoMahony M and B Van Ark (eds) (2003) EU Productivity and Competitiveness An Industry Perspec-
tive Can Europe Resume the Catching-Up Process European Commission Enterprise PublicationsParent D (2000) lsquoIndustry-specific capital and the wage profile Evidence from the NLSY
and the PSIDrsquo Journal of Labor Economics 18(2) 306ndash23Productivity Commission (2005) Economic Implications of an Ageing Australia Research Report
Canberra (httpwwwpcgovaustudyageingfinalreport)Sapir Report (2004) An Agenda for a Growing Europe Oxford University Press OxfordSkirbekk V (2003) Age and Individual Productivity A Literature Survey MPIDR Working Paper
No 2003-028Statistics Denmark Statistics Finland Statistics Iceland Statistics Norway and Statistics
Sweden (2003) Access to Microdata in the Nordic Countries Statistics Sweden OumlrebroTeulings C and J Hartog (1998) Corporatism or Competition Cambridge University Press CambridgeTomz M J Wittenberg and G King (2003) Clarify Software for Interpreting and Presenting
Statistical Results (Version 21) Stanford University University of Wisconsin and HarvardUniversity 5 January Available at httpgkingharvardedu
Topel RH (1991) lsquoSpecific capital mobility and wages Wages rise with job seniorityrsquo Journalof Political Economy 99 145ndash76
Troske KR (1999) lsquoEvidence on the employer size-wage premium from worker-establishmentmatched datarsquo Review of Economics and Statistics 81(February) 15ndash26
Uusitalo R and J Vartiainen (2005) lsquoFinland Firm factors in wages and wage changesrsquounpublished manuscript 9 June
Verhaegen P and TA Salthouse (1997) lsquoMeta-analyses of age-cognition relations in adult-hood Estimates of linear and nonlinear age effects and structural modelsrsquo PsychologicalBulletin 122(3) 231ndash49
Winter-Ebmer R (2001) lsquoFirm size earnings and displacement riskrsquo Economic Inquiry 39(3)474ndash86

AG
E SE
NIO
RIT
Y A
ND
LA
BO
UR
CO
STS
157
Seniority and experience combinedForestSeniority in years 7 17 minus002 012 minus016 031 004 822and experience in years 15 25and other variables at their means at their meansMachinerySeniority in years 3 10 004 007 053 015 002 662and experience in years 13 20and other variables at their means at their meansElectronicsSeniority in years 2 6 061 029 211 014 005 271and experience in years 10 14and other variables at their means at their meansSeniority in years 6 12 minus069 025 minus277 005 005 106and experience in years 14 20and other variables at their means at their means
Notes Simulations are based on the same regression models (results in Table A2) used for drawing Figures 2ndash3 lsquoMeanrsquo indicates the log difference of productivity (or wage)levels Multiplying the number by 100 provides an approximation of percentage difference in productivity (or wage) levels in the different hypothetical situations For moredetails on how these figures are computed see Box 6
Difference
from to in log of TFP in log of monthly wage
Mean Std err t-value Mean Std err t-value
Table 7 Continued
158 FRANCESCO DAVERI AND MIKA MALIRANTA
of fit of the interpolating line the empirical specification underlying the graphs is moreflexible than those in Tables 4 5 and 6 This boils down to appending more polynomialterms of the same variables to the list of the productivity and wage determinantsin addition to the linear and squared terms present in the tables seen above
In each figure along the vertical axis one reads the marginal response of thedependent variables (logarithms of TFP and wages) to changes in seniority experi-ence and education years measured along the horizontal axis Such responses aredefined over the interval of values taken by each explanatory variable in the industryat hand The thick and dotted lines indicate respectively the average marginalresponse of TFP and wages (with the average taken over the very many potentialvalues of the coefficients of interest) The dot-shaded and line-shaded intervalsaround such estimated average responses represent confidence intervals which pro-vide an indication of the degree of precision of the simulated estimates
451 Seniority profiles (Figure 2) Productivity and wage responses to thecross-section variability in the number of seniority years are very similar to each otherin the forest industry (both growing fast) and in industrial machinery (both essentiallyflat once confidence intervals are taken into account) From the figures reported inthe upper part of Table 7 one learns that moving from a plant with a seniority of 7years for the average worker to a plant with seniority equal to 17 having set the otherdeterminants of productivity to their means results in a productivity increase of 38in the forest industry In electronics the seniority-productivity profile follows a well-defined inverted-U shape while the wage is mildly increasing These trends corre-spond to a swift positive productivity response of cumulated 107 as one shift fromplants with an average worker seniority of two years to plants with worker seniorityequal to six years (with wages going up more moderately) If one moves further byanother four years from plants with seniority equal to six to plants with seniorityequal to ten productivity undergoes a (relative) shortfall of cumulative 68 withroughly unchanged wages These are huge numbers As mentioned in the caveatabove however they are upper bound estimates also inclusive of worker reallocationeffects It should be noted though that very drastic declines in relative productivitylevels with age have been documented for other countries such as France in theliterature (see eg Figure 44 in Productivity Commission 2005)
452 Experience profiles (Figure 3) Productivity and wage responses to thecross-section variability in the years of potential experience are much less preciselyestimated particularly for productivity This may be the result of multi-collinearitybetween experience and seniority which may be at the origin of the initially down-ward sloping response of productivity to experience in the forest industry and inelectronics In industrial machinery one finds instead plausible results with positivewage and productivity responses to experience (with wages and productivity by 15and 12 respectively over 7 years see Table 7) A possible way out is to compute the
AGE SENIORITY AND LABOUR COSTS 159
implied productivity response of both higher experience and seniority (after all if aworker stays with the same plant heshe acquires both experience and seniority atonce) When this is done (see the results in the lower panel of Table 7 lsquoSeniority andexperience combinedrsquo) one finds an essentially flat productivity response to the com-bination of seniority and experience and a moderately positive wage response for acumulated 15 over 7 years of time The combination of seniority and experienceleaves the results for electronics qualitatively unchanged instead When the numberof seniority and experience years is relatively low moving from low-seniority and low-experience plants to high-seniority and high-experience plants corresponds to acumulated productivity increase of about 60 When this is done moving fromintermediate to high levels of seniority and experience the productivity shortfall is ofabout 70 Wages do not follow suit instead but keep going up
46 Summing up and discussion
Our statistical analysis provides a reasonably coherent picture of the empirical rela-tion between age seniority and experience on the one hand and plant productivityand wages on the other in Finland in the years of the IT revolution
At first sight our results seem to support the view that workforce ageing as suchhas adverse effects on labour costs Age is essentially unrelated to productivity whileit is positively correlated with wages As we distinguish the effects of seniority onproductivity and wages from those of general experience though we find that thepicture is more complicated and sharply differs across industries (see Box 7 for a surveyof other studies emphasizing industry differences in productivity and wage profiles)
Box 7 Previous statistical evidence on age seniority experienceproductivity and wages
About 25 years ago Medoff and Abraham (1980 1981) used performanceevaluation to gauge separate information about individual productivity andwage profiles They found that wages do not necessarily reflect productivityBishop (1987) and Flabbi and Ichino (2001) also put together measures ofindividual productivity following the Medoff and Abraham methodology andconfirming their results with other data sets
Hellerstein et al (1999) using US data find that productivity and wagesincrease with age except for the oldest age group in some specifications andtheir patterns are fairly similar Creacutepon et al (2002) use French data andconclude that the relationship of productivity and age follows an inverted U-shape but wage is increasing in age In manufacturing wage increases withskill level but productivity increases even more In non-manufacturing wage
160 FRANCESCO DAVERI AND MIKA MALIRANTA
increases more than productivity as skill levels go up Haegeland and Klette(1999) use Norwegian data and find that productivity and wage increase witheducation and the highly educated go hand in hand by productivity Medium-level potential experience (age minus education years) gave higher productivitythan short experience but with long experience productivity declined althoughstill stayed higher than with short experience Medium-level experience wasunderpaid but the wage premium for long experience corresponded to theproductivity premium They concluded that the wage-experience profile onlypartly reflected the productivity profile
Only a few scholars have looked at cross-industry heterogeneity of produc-tivity and wage responses Aubert and Creacutepon (2004) estimated average earn-ings relations for France and found evidence of declining productivity after theage of 55 but they found that the age-productivity profile (as captured by suchearnings functions) does not differ much across industries In contrast Aubertet al (2004) estimated labour demand curves by using wage bill shares condi-tioned on value added as well as old and new economy capital they did findsignificant evidence that innovative firms and work-practices present lowerwage bill shares
The same result seemingly applies within occupational groups for othercountries Similarly to our findings here Neuman and Weiss (1995) found thatearnings peaks are located earlier in age in the high-tech sector Hellersteinand Neumark (1995) using Israeli data find that earnings and productivityprofiles are fairly similar for the relatively less skilled workers (the group thatcovers most of the workforce)
Other studies have in turn found that the relation has changed over timeThe seniority-wage profile has seemingly become steeper and its peak movedforwards in Denmark as a result of the decentralization of wage determination(Bingley and Westergaard-Nielsen 2003) Eriksson and Jaumlntti (1997) found thatin 1971 the peak of the wage profile was at the age group 35ndash39 years but hasthen moved forward being at the age group 45ndash49 years in 1990 in Finland
Finally a host of previous studies indeed highlights the productivity-enhancingrole of worker mobility between plants The mobility of workers has anadditional important productivity effect that goes beyond the lsquowithin firmrsquoeffect discussed above and examined in this paper lsquoChurningrsquo of plantsfirms(ie simultaneous entries and exits) has been found to have a dominant role inindustry productivity growth Thanks to this mechanism a workerrsquos produc-tivity may improve greatly when she moves from a low productivity plantfirmto a high productivity plantfirm (Foster et al 2001 Disney et al 2003) Withthe data from the Finnish manufacturing sector Maliranta (2003) finds that theaverage productivity growth rate of the plants is typically 50ndash70 of the industry
AGE SENIORITY AND LABOUR COSTS 161
productivity growth rate which is due to the fact that entries but especially exitsand the reallocation of labour and capital between the continuing plants have animportant role to play as well This gap between industry and plant productivitygrowth has been particularly pronounced in the Finnish electronics industrysince the latter part of the 1980s but has also been substantial for instance inthe textile and wearing industry during the latter half of the 1980s and in the basicmetal industry during the latter half of the 1980s and the first half of the 1990s
Returns to seniority are usually positive but declining with the level of seniority inthe forest industry plants about the same applies to earnings profiles Similar consid-erations hold for the productivity and wage effects of general experience in industrialmachinery although the estimated relation is statistically less solid The similarity ofthe productivity and wages responses to the accumulation of human capital indicatesthat in lsquoaveragersquo industries skill depreciation does not seemingly lead to higherlabour costs And given that these industries are still quantitatively important in theFinnish economy wage-productivity misalignments cannot be the main explanationfor the bad labour market performance of the elderly in Finland
The picture is quite different for the high-tech plants In electronics ndash the industrywhere people are exposed to rapid technological and managerial changes ndash theresponses of plant productivity and wages to seniority are very different from eachother The seniority-productivity profile shows a positive relation first and then negativeas one looks at plants with higher average seniority while wages instead keep goingup with seniority13 This holds for plants with similar education plant age and sizeand other conditions and is thus not related to plant differences in these other respectsHow negative the productivity returns to seniority may become cannot be said withcertainty Numerical simulations based on our OLS cross-sectional results indicatethat the change of sign in the seniority-productivity profile may be pronounced
Altogether our results are consistent with the idea that fast technical change bringsabout accelerated skill depreciation of senior workers We cannot honestly rule outhowever that our correlations may also be the result of worker movements acrossplants The negative correlation between seniority and productivity may in fact alsoreflect the reallocation away of younger (and more productive) workers who leavebehind older plants attracted by the career prospects offered in newly born high-productivity firms and plants14 We cannot precisely quantify the relative importance
13 This is not too surprising as recently discussed at length by Uusitalo and Vartiainen (2005) the combination of highlycentralized collective agreements with relatively autonomous but still highly unionized industry wage setting has resulted in avery low weight (44 on average) given to performance-related firm-level corrections of wages14 Evidence on the importance of reallocation for productivity purposes was indeed provided by Ilmakunnas et al (2005) for theFinnish manufacturing sector where it was shown that the churning of workers (ie simultaneous hiring and separation ofworkers within a plant) speeds up plant productivity growth while holding back seniority
162 FRANCESCO DAVERI AND MIKA MALIRANTA
of the two effects in our statistical analysis Both skill depreciation and worker reallo-cation appear to affect the relation between seniority and productivity in the Finnishhigh-tech industry
It looks as though the deferred compensation hypothesis perhaps amended withthe insights from sorting and matching theories fits better the labour market facts inhigh-tech industries than the human capital hypothesis Yet the evidence for thelsquoaveragersquo industries is not consistent with this hypothesis This is an open issue thatwe briefly discuss further in the concluding section
5 CONCLUSIONS
We started this paper asking ourselves whether we could explain the weak labourmarket position of older workers The simultaneous presence of a relatively aged ndashand still rapidly ageing ndash workforce and a major external shock (such as the ITrevolution of the late 1990s) makes Finland a nice experiment to address this questioninvestigating the diverse responses of wages and productivity to age seniority andexperience patterns across industries
Our results do not indicate that age as such is responsible for the bad labourmarket outcomes of the elderly The differential effect of seniority and experienceon productivity and earnings is minor for two of the three Finnish manufactur-ing industries (the lsquoaveragersquo ones) we chose to analyse These productivity andwage patterns probably reflect the relatively more valuable role of tacit knowledgein traditional industries Productivity and wage profiles differ just in electronicsnot in the other industries We interpret this as implying that exposure torapid technological and managerial changes seems to make a difference for plantproductivity less so for wages for the high-tech plants Yet this productivity-wage discrepancy is not associated with age but rather with seniority hence with avariable which can be affected by individual and policy decisions to a greater extentthan age that is largely exogenous for the individual (though not for the plantmanager)
In the end our results give support to at least two important policy implicationsFirst the similar shapes of productivity and wage profiles in lsquoaverage industriesrsquoindicate that the weak labour market performance of older workers in Finland is notbecause they are a burden for the average firm in the economy Leaving high-techplants aside the bad labour market outcomes of the elderly in the rest of the economyare presumably driven by two other causes such as discriminatory attitudes on theemployer side and public incentives schemes easing the way towards early retirementTo ameliorate the labour market performance of the elderly policy should addressthese issues Second higher seniority is instead associated with higher labour costs inhigh-tech plants This is consistent with the anecdotal evidence from Wal-Mart andEricsson that we have reported It is also consistent with the beliefs ndash entertained bymany Finnish employers ndash that older people could not adapt as easily as younger ones
AGE SENIORITY AND LABOUR COSTS 163
to the arrival of the new technology15 And indeed a survey conducted by the Ministryof Labour in 2002 indicates that as much as 10 of prime-aged workers (and 15of workers above 50) agree that lsquoworkplace discriminates against old workersrsquo16 Inspite of government-mandated media campaigns to counteract such attitudes thepossibility that a negative employer bias against old workers has affected hiring andfiring practices in the late 1990s cannot thus be easily ruled out Our results suggestthat this effect is not present in the Finnish economy at large but mainly in high-techplants
To improve the employability of older workers in these industries public policyshould divert resources away from preserving existing jobs and lend more attentionon the retraining of old workers to ease their reallocation away from less productiveplants (or plants where they have become less productive) into new jobs Some gov-ernments are more worried and more interventionist than others in this respect Inthe last few years for instance the Finnish Government has already embarked on aprogramme (lsquoThe National Programme on Ageing Workersrsquo see OECD 2004 p119) aimed at deferring retirement and in parallel improving the so called lsquoemploy-abilityrsquo of older workers It is unclear however to what extent grand plans maybe effective to bring about a solution to these problems Policies aimed at easingreallocation across plants even within the same industry would probably be a usefulcomplementary tool in this respect
Finally our results are also somehow puzzling in at least one respect They are notfully consistent with any of the existing theories that we know The results for thehigh-tech plants are consistent with the deferred compensation hypothesis and notwith the human capital hypothesis As surveyed in the theoretical section of the paperthe human capital hypothesis would predict a negative discrepancy in plants with anolder labour force where we instead find the opposite results But even the Lazearhypothesis is not fully consistent with our Finnish data because the results found forelectronics are not there for the other industries
This begs the question of why the Lazear model is more relevant in high-techplants than in the other plants One possibility is that productivity is less easilyobservable in high-tech industries This would make the asymmetric informationmechanism envisaged by Lazear more sensible in those industries This explanationwould probably do if our results were there for plants producing immaterial lsquoweight-lessrsquo services whose output is typically hard to measure Our discussion here insteadconcerns plants producing lsquoconcretersquo manufacturing goods for which productivitymis-measurement is presumably a less serious concern An alternative possibility is
15 Juuti (2001) reports that young line managers with a good educational background often harboured prejudice against theability of older workers to cope with new things This is potentially important for hiring and firing practices Althoughdiscriminating attitudes are rarely shared by top-level managers recruitment decisions happen to be taken by the mid-managementlevel16 Kouvonen (1999) reports somewhat lower figures with a 5 share of people above 45 having experienced age at discrimi-nation at work for the average firm
164 FRANCESCO DAVERI AND MIKA MALIRANTA
that seniority being the other side of impeded resource reallocation is particularlydamaging in industries where changes ndash requiring flexibility and ability to quicklyadapt ndash come about all the time Hence the adverse consequences of seniority mani-fest themselves in these industries and less so in other industries where changes aresmoother Under these circumstances a less mobile ageing workforce might constitutean impediment to productivity growth of firms and their plants To the extent thatlow productivity (and low immobility) is a consequence of declining ability to inces-santly adopt new technologies due to weak basic education public policy should focuson efforts to increase the quantity and improve the quality of the adult education Ifhowever the main reason for staying still too long is not the inability of older workersto adopt new technologies policy-makers should seek ways to encourage the mobilityof the ageing workforce to maintain the scope for continued productivity enabled bylearning-by-doing Greater mobility of workers might also facilitate the diffusion oftechnologies and thereby speed up productivity growth of the firms ndash and stimulatinglsquocreative destructionrsquo (ie productivity-enhancing churning of plants and firms withinindustry) to boot
Finally how special are our results Insofar as the use of ICT will spread to otherindustries in the years to come it can be expected that the productivity patternsobserved in electronics will emerge in other industries in the future The findings forelectronics may be foretelling more general developments in the other industries ofthe Finnish economy ndash and possibly other economies For sure in a world whereinnovation forces as opposed to catching up forces have become the key engine ofgrowth (see Acemoglu et al 2003 and the Sapir Report 2004) companies andgovernments will be more and more involved in such problems as the ones discussedin this paper
Discussion
Wendy CarlinUniversity College London and CEPR
Four facts about the advanced economies provide the motivation for this paperthe poor labour market performance of older workers (unemployment and employ-ment rates) the ageing of the labour force evidence measured in surveys of a declinein physical and mental performance at higher ages and finally the change in industrystructure toward lsquohigh techrsquo industries This raises the question of whether theemployability of older workers declines because they become too costly (diminishingproductivity is not compensated by lower wages) and whether this is especiallymarked in high-tech sectors of the economy The authors of this paper do not findevidence supporting either of these hypotheses in their data from three Finnishmanufacturing industries However their findings suggest that there is a hump-shaped
AGE SENIORITY AND LABOUR COSTS 165
relationship between a measure of productivity and the seniority (not age) of workersin plants in the high-tech industry in their sample electronics There is no corre-sponding pattern for wages This is interpreted as signalling a potential problem inthe matching of workers to jobs in industries with rapid technological progress in thecontext of constraints on worker mobility (eg costs of firing)
Channels through which ageing can affect economic performance are the averagequality of the direct labour input the effect on capital deepening because of theimplications of ageing for private and public saving and its impact on technologicalprogress (new ideas and diffusion) Older people may be less creative entrepreneurialand risk-taking and the depreciation of their skill set may imply less adaptation anddiffusion of new knowledge On the other hand an ageing population may createbigger incentives for labour and memory saving innovation
In order to evaluate the economic impact of age-related variables it is essential tospecify whose perspective we are taking From the perspective of workers the decisionis whether to remain in their job to search for a new one to leave the labour forceor to invest in (re)training And the key question is how age and or seniority affectwage and employment prospects as well as training opportunities within and outsidethe firm For firms the question is how age or seniority affects the profitability ofexisting production and the firmrsquos investment in human and physical capital and ininnovation What are the constraints on the wage structure they can deploy and onfiring From the perspective of a policy-maker concerned with welfare the questionis the impact of age-related variables on total factor productivity and the role ofpolicy-related barriers to the reallocation of workers training and early retirementprogrammes
In this paper Daveri and Maliranta take one slice of this question focusing on theimpact of age-related variables on the quality of direct labour input
bull How are productivity and wages related to age structure and seniority at theplant level in manufacturing
bull Does this relationship vary according to the innovativeness or technology inten-siveness of the industry
To answer these questions it is necessary to have matched employer-employee dataand a clear contrast in industry characteristics This makes the use of data fromFinland an appropriate choice there is high-quality matched data and looking at theperiod of the late 1990s to the early 2000s provides a nice contrast among thetraditional industry of lsquoforest productsrsquo a neutral one of industrial machinery and ahigh-tech industry electronics
The method is to use plant-level data to estimate an index of total factor produc-tivity and to calculate the average wage Each of these is then used as the dependentvariable in a separate regression for each industry with various combinations of theage-related variables on the right-hand side along with a set of plant-level controlvariables (including years of schooling a dummy for a foreign-owned plant and
166 FRANCESCO DAVERI AND MIKA MALIRANTA
dummies for different vintages of plants including those that exit during the observa-tion period) The age-related variables are worker age seniority (ie years in thecurrent firm) and labour market potential experience (age minus age when completedlast qualificationdegree) averaged for workers in each plant It is somewhat odd thatTFP is the productivity variable of choice when an initial motivation was the impactof age-related variables on firm profitability via labour costs which suggests that it islabour productivity that is relevant not TFP17
Neither age nor age squared is ever significant in a productivity regression Inelectronics but in neither of the other industries there is a positive coefficient onseniority and a negative coefficient on the squared term in seniority This says thatwhen looking across plants TFP initially rises as the average tenure of workers in theplant goes up but then falls in plants with higher levels of average seniority Theeffects of age-related variables on wages are mainly (but not always) positive in forestproducts hump-shaped for age (but with no robust tenure effects) in machinery andpositive for age and weakly positive for tenure and experience in electronics
The authors conclude that it is not age per se but seniority that affects TFP andthat this effect is found only in the high-tech sector electronics In order to make theirresults more easily interpretable they estimate modified versions of their equationsand produce graphs showing the average partial effect of the variable of interestFrom these equations they calculate the effect on TFP of a change in for exampleseniority As acknowledged by the authors the estimate that plant productivitydoubles when average seniority of the workforce goes from 2 to 6 years and then falls bytwo-thirds as average seniority goes from 6 to 10 years is very large My main concernwith this central result in the paper is that it may reflect the dynamics of a rapidlygrowing industry rather than the inherent characteristics of long-tenure workers inelectronics
In electronics a plant where the average tenure is six years is estimated to be atthe lsquoturning pointrsquo from rising to falling TFP As Table A1 shows the mean tenurein the sample for electronics plants is six years which reflects the rapid growth of theindustry it is 11 years and 9 years respectively in the forest products and machineryindustries The likely role of industry dynamics in generating tenureproductivityprofiles of the kind shown in the paper can be illustrated by a simple example If weassume that initially there are three industries F M and W with identical plants interms of TFP age and seniority structure In particular we assume there is no causallink from the average age or seniority of workers in a plant to the plantrsquos TFP Wenow introduce a different demand shock for each industry a negative demand shockfor industry F no change for M and a positive shock for E We assume that there isunobserved heterogeneity in managerial ability across plants As a consequence of the
17 TFP is calculated using a simple growth accounting framework with the assumption of a constant labour share (WLY ) Ifthe aim is to test whether seniority or ageing affects labour costs which are measured by the ratio of wages to labourproductivity then this is perhaps not an ideal choice
AGE SENIORITY AND LABOUR COSTS 167
differential demand shocks and assuming there are costs of entry and exit we willobserve disequilibrium in the F and E industries Good managers in E will expandoutput increase hiring and raise TFP relative to other plants in E Since hires havezero seniority average seniority in these expanding higher TFP plants will fall lowerseniority is associated with higher TFP but by assumption this is independent of anyrelationship between individual human capital (and TFP) and tenure Similarly goodmanagers in F identify the decline in their industry earlier and cease hiring soonerwith the result that higher TFP firms end up with on average longer tenure workersThis produces a positive relationship between seniority and TFP in the lsquodecliningrsquoindustry and a negative relationship in the lsquoexpandingrsquo industry In the industrywhere there is no shock there is no relationship This pattern is consistent with thecontrast between the three industries shown in Figure 2 of the paper18
Figure 4 provides some illustrative data showing that employment grew in telecom-munications equipment and shrank in forest products over the time period consideredin the paper
18 A similar story could be told to account for the within firm pattern that is shown in column [6] of Table 6 Using fixed effectsestimation the relationship between changes in TFP over time and in the age-related variables is uncovered controlling fortime invariant characteristics of plants such as managerial quality A similar although a much weaker hump-shaped relationshipbetween TFP and seniority is reported If we now assume that a new higher TFP technology emerges in electronics during theperiod of observation but not in forest products production in electronics becomes more profitable and each firm expands Theincrease in hiring reduces seniority and we associate a within-firm rise in TFP with a fall in seniority
Figure 4 Contrasting industry dynamics in Finland 1995ndash2002
Note Telecommunications equipment = ISIC322 Mechanical engineering = ISIC29 Forest products =ISIC20+21
Source Groningen Growth and Development Centre 60-Industry Database October 2005 httpwwwggdcnet updated from OrsquoMahony and van Ark (2003)
168 FRANCESCO DAVERI AND MIKA MALIRANTA
The authors undertake a number of tests to check the robustness of their resultsbut they are not able to separate out the possible impact of industry dynamics drivenby exogenous demand or technology shocks from the causality of seniority producinga change in efficiency that they seek to identify Another approach to identifying suchan effect would be to focus on those who switch jobs The DaverindashMaliranta storyimplies that in electronics longer tenure workers are worse substitutes for otherwiseequivalent workers than is the case in the other two industries This suggests that theyshould get a bigger wage cut if they switch jobs as compared with similar workers inone of the other industries19
Hence although the results in the paper are suggestive I think further investigationis required before we can be confident that there really is a causal link of policy-relevant magnitude in a high-tech industry from seniority (longer tenure in a givenfirm) to lower TFP
Rudolf Winter-EbmerUniversity of Linz Institute for Advanced Studies (IHS) Vienna and CEPR
Daveri and Maliranta have produced a very interesting paper on the impact of ageand seniority on wages and productivity in Finland The main idea is that the effectsof ageing on firm productivity are very different in traditional industries as comparedto high-tech or information technology industries (electronics in their empirical analysis)Psychometric studies have shown that physical cognitive and verbal abilities havedifferent age gradients whereas physical and cognitive skills such as mathematicaland logical skills decay pretty fast organizational and verbal skills show no particularageing pattern at all (Skirbekk 2003) Daveri and Maliranta argue that ageing of theworkforce is more problematic in high-tech industries because of a faster technicalchange faster changes in production technologies and faster product developmentWhile most psychometric and other studies relate to age as such Daveri andMaliranta concentrate their argument on the impact of job tenure within a particularfirm while there is no difference between the productivity-experience and wage-experience paths in the electronics industry ndash nor in the machinery industry by theway ndash there is a significant divergence in the development of productivity and wagesas seniority in a firm increases This pattern cannot be seen in more traditionalindustries like forestry and machinery
While the general pattern of a higher interdependence between firm senioritytechnology adaptation and learning ndash and in turn productivity ndash in high-tech firmsis sensible the main empirical results seem to be out of line Productivity in electronicsfirms increases by 61 log points in the first 4 years of tenure (in fact from year 2 to
19 Using Finnish data Uusitalo and Vartiainen (2005) report that firm exits and promotions increase earnings up to age 50after which such events do not on average improve a personrsquos relative position Whether this is true of tenure and whether itdiffers across industries would be relevant evidence for the DaverindashMaliranta hypothesis
AGE SENIORITY AND LABOUR COSTS 169
year 6) but decreases in the following 6 years again by 69 log points (see Table 7) Aliteral interpretation of these results would be that workers who stay with their firmsfor more than 6 years lose more than half of their productivity they become such aburden to the firm that everybody would have to be fired otherwise the managerswould be acting completely irresponsibly This is probably not what we are seeing inthese firms
Moreover the measured effect is basically a product of a simple OLS cross-sectionregression it is much reduced and less well statistically determined if other methodsor data are used Some other possible explanations come to my mind which couldhave produced such an outcome The data relate to mean characteristics of theworkforce such as mean age and mean tenure of workers As the IT boom in Finlanddid not start before the mid 1990s I suspect that there are not many firms with meantenure of its workforce of more than 7 years ndash and if they exist they might be fairlydifferent firms with a different technology and firm organization As Daveri andMaliranta correctly state the causal impact of mean tenure on productivity cannotbe properly distinguished from matching and selection problems it is by no means acoincidence that some workers stay with the firm longer others donrsquot it is no coin-cidence why some firms stick to their complete workforce longer or to phrase itdifferently why workers want to stay longer with a particular firm Good workers staywith good firms and vice versa All these matching arguments make the strong pointthat a simple correlation between job seniority and productivity will be an upwardbiased estimate of the real causal effect of job seniority on productivity Relatedlabour economics studies on the causal effect of seniority on wages come to theconclusion that OLS estimates overestimate the true causal effect by a factor betweentwo and four (Topel 1991 Altonji and Shakotko 1987)
It has to be said though that finding convincing estimates of the relation betweenfirm employment structure and productivity is very difficult simple fixed effectsmodels using variation in the composition of the workforce over time to determine thevariation of productivity fall again prey to the criticism of reverse causality why doand how can firms change the composition of their workforce Only by changingrecruitment and lay-off policies policies which are obviously related to past andexpected productivity While the causal impact is very difficult to establish in suchstudies any work in this direction using new data sets is very interesting Furtherimportant questions come to my mind for instance concerning inter-firm mobilitywithin the industry which seems to contribute to productivity growth throughout theindustry (Parent 2000) It seems that inter-firm mobility is higher in the high-techsector which could contribute to explain the diverging pattern between seniority-productivity and experience-productivity profiles Another important issue concernswage-setting schemes If indeed high-tech sectors have a higher prevalence ofdeferred payment schemes like stock options or profit sharing in some sort or theother the relation between age or tenure and wages would be steeper and the diver-gence between wage and productivity development would shrink
170 FRANCESCO DAVERI AND MIKA MALIRANTA
The personnel economics and firm organization literature has also stressed com-plementarities in the composition of the workforce a good mix of old and youngworkers might be better for firm productivity than employing only young or only oldworkers (Lazear 1998 Grund and Westergaringrd-Nielsen 2005) It might be interestingto see whether these results hold also in the high-tech industry Such an analysiswould require looking at the age and tenure composition of the workforce in moredetail by using the underlying micro data
In my view policy conclusions are still difficult to draw from this paper MaybeFinland was not such a good experiment in this respect because its high-tech sectorhad an explosive growth after 1995 which is too short and too turbulent a period todraw firm conclusions about the effects of firm seniority and the like Replicating thestudy for another country with a more smooth development of its high-tech sectormight be a welcome complement
APPENDIX DATA SET AND VARIABLE DESCRIPTION
Similarly to the other Nordic countries Finland is endowed with a rich register dataof companies plants and individuals (see Statistics Denmark et al 2003) The uniqueidentification codes for persons companies and plants used in the different registersform the backbone of the Finnish administrative register network and the Finnishstatistical system whereby different sources of information can be integrated conven-iently for various statistical purposes20 By using this system Statistics Finland hasconstructed the Finnish Longitudinal Employer-Employee Database (FLEED) whichis tailored for various needs of economic research Its most comprehensive anddetailed version is maintained at Statistics Finland It contains information of com-panies plants and individuals Plants are linked to their companies and individualsto their employer plants and companies Data are collected from Business Register(plants and companies in the business sector) Census of Manufacturing (manufactur-ing plants) Financial Statements Statistics (companies in the business sector) RampDsurvey and ICT survey (companies in the business sector) and Employment Statistics(individuals aged between 16 and 69 years) These data include a wide variety ofdetailed information on these units A large proportion of variables are available from1990 to 2002 These data cover essentially the whole target population of companiesplants and individuals Due to confidentiality concerns outside researchers do nothave direct access to it For the outside researchers Statistics Finland has constructeda separate version of it The variable set is more limited and some of the categoricalvariables are broader (many industries are combined for example)
This paper employs plant level information for plants and workforce Productivitymeasures plant age plant size originate from the Census of Manufacturing We donot have information of the levels of value added hours worked or capital stock as
20 Data sources and linking of them is described in greater detail in Ilmakunnas et al (2001) and Maliranta (2003)
AG
E SE
NIO
RIT
Y A
ND
LA
BO
UR
CO
STS
171
Table A1 Descriptive statistics of data on plants by industry plant averages in 1995ndash2002
Variables Forest industry Machinery industry Electronics industry
Mean Sd p5 Median 95p Mean Sd p5 Median 95p Mean Sd p5 Median 95p
Log of TFP index 180 074 088 166 328 283 059 208 272 400 227 104 099 205 458Log of monthly wage (in euros)
761 024 723 759 802 769 019 736 769 800 765 023 727 767 803
Schooling years 110 04 103 110 117 116 09 106 114 136 122 12 106 119 145Age in years 396 38 333 401 450 393 40 318 398 450 356 38 294 358 416Potential experience in years
216 39 151 221 271 207 42 131 211 269 164 40 93 166 225
Seniority in years 109 56 26 108 195 92 48 27 89 175 63 33 21 53 1269
Proportion ()
Proportion ()
Proportion ()
Plant birth before 1977 570 3457 2791Plant birth 1977ndash1980 63 847 756Plant birth 1981ndash1985 55 688 407Plant birth 1986ndash1990 107 1658 2326Plant birth 1991ndash1995 99 1887 1977Plant birth 1996ndash 107 1464 1744Plant size 5ndash9 persons 18 314 317Plant size 10ndash19 persons 90 1020 685Plant size 20ndash49 persons 309 4108 3351Plant size 50ndash99 persons 217 2056 2065Plant size 100ndash persons 367 2502 3581Foreign-owned plant 62 1986 1295Plant death during 1996ndash2002
118 1922 2209
Number of plants 365 567 172
Notes The data are constructed in the Research Laboratory of Statistics Finland by linking the plants in the Finnish Manufacturing Census and individuals in the EmploymentStatistics with plant codes
Source Authorsrsquo own calculations
172FR
AN
CE
SCO
DAV
ER
I AN
D M
IKA
MA
LIR
AN
TA
Table A2 Statistical analysis behind the simulation graphs between plants estimation
Forest TFP
Forest wage
Machinery TFP
Machinery wage
Elect TFP
Elect wage
Schooling years minus3386 minus0073 0826+ 0182 1481 0310(2491) (0815) (0470) (0140) (1294) (0210)
[Schooling years]2 1503 0095 minus0285 minus0020 minus0511 minus0070(1113) (0368) (0194) (0057) (0524) (0084)
Potential experience 1017 minus0014 0171 0082+ minus0785 0007(0371) (0118) (0151) (0044) (0616) (0110)
[Potential experience]2 minus0513 0021 minus0072 minus0024 0364 minus0012(0187) (0057) (0081) (0022) (0390) (0071)
[Potential experience]3 0081 minus0005 0010 0002 minus0047 0005(0030) (0009) (0014) (0004) (0078) (0015)
Seniority in years minus0013 minus0003 minus0045 minus0020 1276 0131(0086) (0027) (0054) (0018) (0272) (0062)
[Seniority in years]2 0070 0012 0033 0022 minus1665 minus0161+(0081) (0026) (0056) (0017) (0365) (0083)
[Seniority in years]3 minus0025 minus0000 minus0008 minus0007 0622 0061+(0022) (0007) (0017) (0005) (0153) (0034)
Plant birth in 77ndash80 0237 0003 minus0051 0019 minus0088 minus0027(0119) (0032) (0066) (0029) (0154) (0044)
Plant birth in 81ndash85 0247 0059 0057 0014 minus0210 0032(0117) (0041) (0079) (0021) (0257) (0043)
Plant birth in 86ndash90 0658 0040 0255 0013 0094 0019(0104) (0027) (0057) (0018) (0209) (0046)
Plant birth in 91ndash95 0575 0026 0432 0083 0680 minus0012(0144) (0037) (0060) (0017) (0232) (0042)
Plant birth in 96ndash 0969 0052 0629 0077 0677 0029(0196) (0037) (0088) (0025) (0286) (0052)
R-squared 0545 0647 0486 0516 0527 0581Adj R-squared 0510 0620 0461 0493 0442 0505Number of plants 365 365 567 567 172 172
Notes Other control variables include dummies for plant size (5 groups) foreign-ownership and death during 1996ndash2002 Robust standard errors are shown in parentheses+ p lt 01 p lt 005 p lt 001 p lt 0001
AGE SENIORITY AND LABOUR COSTS 173
such but we do have the ratio of value added to the number of hours worked (bywhich we identify labour productivity) and the capital stock per hour worked (ameasure of the capital-labour ratio) The capital stock measure is calculated throughthe perpetual inventory method (for more details see Maliranta 2003)
Since 1995 (our main period of analysis) all plants owned by firms that employ noless than 20 persons are included Therefore since 1995 the data also include thevery small plants of multi-unit firms but on the other hand the plants of smallsingle-unit firms are left outside Some plants are dropped from the sample becauseof failure of linking some plants in the Manufacture Census to other sources ofinformation Thanks to the link between Census of Manufacturing and EmploymentStatistics we have information about plant workforce This includes the averagepotential experience (the number of years after the last completed degree) seniority(the number of years spent working in the current company) and the number ofschooling years (usually needed for the degree) The labour characteristics of theplants are computed in Statistics Finland by using the comprehensive version of thedatabase About 80ndash90 of individuals can be linked to their plants so that ourvariables should be measured with a reasonable accuracy In the analysis we havealso dropped some outliers21
REFERENCES
Acemoglu D P Aghion and F Zilibotti (2003) lsquoVertical integration and distance to frontierrsquoJournal of the European Economic Association 1(23) 630ndash38
Ali-Yrkkouml J L Paija C Reilly and P Ylauml-Anttila (2000) Nokia A Big Company in a SmallCountry ETLA The Research Institute of the Finnish Economy Series B162 Helsinki
Altonji JG and RA Shakotko (1987) lsquoDo wages rise with job seniorityrsquo Review of EconomicStudies 54 437ndash39
Aubert P and B Creacutepon (2004) Age Salaire Et Productiviteacute La Productiviteacute Des Salarieacutes Deacutecline-T-Elle En Fin De Carriegravere Technical report Mimeo Economie et Statistiques
Aubert P E Caroli and M Roger (2004) New Technologies Workplace Organisation and the AgeStructure of the Workforce Firm-Level Evidence INSEE Paris
Autor DH F Levy and RJ Murnane (2003) lsquoThe skill content of recent technologicalchange An empirical explorationrsquo Quarterly Journal of Economics 118(4) 1279ndash333
Becker GS (1962) lsquoInvestment in human capital A theoretical analysisrsquo Journal of PoliticalEconomy 70(5 Part 2 Investment in Human Beings) 9ndash49
Bingley P and N Westergaard-Nielsen (2003) lsquoReturns to tenure firm-specific human capitaland worker heterogeneityrsquo International Journal of Manpower 24(7) 774ndash88
Bishop J (1987) lsquoThe recognition and reward of employee performancersquo Journal of LaborEconomics 5(4) s36ndashs56
Blanchflower DG and AJ Oswald (1988) lsquoInternal and external influences upon pay settle-mentsrsquo British Journal of Industrial Relations 26(3) 363ndash70
Brock WA and DS Evans (1986) The Economics of Small Business Holmes amp Meier NewYork
Brown C and JL Medoff (2003) lsquoFirm age and wagesrsquo Journal of Labor Economics 21(3) 677ndash97
21 In the estimation some extreme outliers are removed from the regression analysis Identification has been carried out byusing the method of Hadi (1992 1994) The variables used in this procedure are the log of labour productivity the log ofmonthly wage the log of capital intensity schooling years and potential experience Overall a couple of percentages of plantswere dropped for being deemed outliers
174 FRANCESCO DAVERI AND MIKA MALIRANTA
Creacutepon B N Deniau and S Peacuterez-Duarte (2002) Wages Productivity and Worker Chara-cteristics A French Perspective January INSEE httpwwwcrestfrpagepersocreponCreponDeniauPerezDuarte2002pdf
Daveri F and O Silva (2004) lsquoNot only Nokia What Finland tells us about new economygrowthrsquo Economic Policy 19(38) 117ndash63
Davis SJ and J Haltiwanger (1991) lsquoWage dispersion between and within US manufactur-ing plants 1963ndash86rsquo Brookings Papers on Economic Activity Microeconomics 1991 115ndash80
Disney R J Haskel and Y Heden (2003) lsquoRestructuring and productivity growth in UKmanufacturingrsquo Economic Journal 113(489) 666ndash94
Dunne T MJ Roberts and L Samuelson (1989) lsquoThe growth and failure of US manu-facturing plantsrsquo Quarterly Journal of Economics 104(4) 671ndash98
Dygalo NN and JM Abowd (2005) lsquoEstimating experience-productivity profiles from earn-ings over employment spellsrsquo unpublished manuscript 27 November
Eriksson T and M Jaumlntti (1997) lsquoThe distribution of earnings in Finland 1971ndash1990rsquoEuropean Economic Review 41(9) 1763ndash79
Flabbi L and A Ichino (2001) lsquoProductivity seniority and wages New evidence from per-sonnel datarsquo Labour Economics 8(3) 359ndash87
Foster L J Haltiwanger and CJ Krizan (2001) lsquoAggregate productivity growth Lessonsfrom microeconomic evidencersquo in CR Hulten ER Dean amp MJ Harper (eds) NewDevelopments in Productivity Analysis (pp 303ndash63) University of Chicago Press Chicago
Griliches Z (1995) lsquoRampD and productivity Econometric results and measurement issuesrsquo inP Stoneman (Ed) Handbook of the Economics of Innovation and Technological Change (pp 52ndash89)Blackwell Publishers Ltd Oxford
Griliches Z and V Ringstad (1971) Economics of Scale and the Form of the Production FunctionNorth Holland Amsterdam 1971
Griliches Z and H Regev (1995) lsquoProductivity and firm turnover in Israeli industry 1979ndash1988rsquo Journal of Econometrics 65 175ndash203
Grund C and N Westergaringrd-Nielsen (2005) lsquoAge structure of the workforce and firm per-formancersquo IZA Working Paper No 1816 Bonn
Hadi AS (1992) lsquoIdentifying multiple outliers in multivariate datarsquo Journal of the Royal Statis-tical Society Series (B) 54 761ndash71
mdash (1994) lsquoA modification of a method for the detection of outliers in multivariate samplesrsquoJournal of the Royal Statistical Society Series (B) 56 393ndash96
Haegeland T and TJ Klette (1999) lsquoDo higher wages reflect higher productivity Educationgender and experience premiums in a matched plant-worker data setrsquo in The Creation and Analysisof Employer-Employee Matched Data (pp 231ndash59) Elsevier Science North-Holland Amsterdam
Hellerstein JK and D Neumark (1995) lsquoAre earnings profiles steeper than productivityprofilesrsquo Journal of Human Resources 30(1) 89
Hellerstein JK D Neumark and KR Troske (1999) lsquoWages productivity and workercharacteristics Evidence from plant-level production functions and wage equationsrsquo Journalof Labor Economics 17(3) 409ndash46
Ilmakunnas P and M Maliranta (2005) lsquoTechnology labour characteristics and wage-productivity gapsrsquo Oxford Bulletin of Economics and Statistics 67(5) 623ndash44
Ilmakunnas P M Maliranta and J Vainiomaumlki (2001) lsquoLinked employer-employee data onFinnish plants for the analysis of productivity wages and turnoverrsquo in T Jensen and AHolm (eds) Nordic Labour Market Research on Register Data (pp 205ndash46) TemaDord NordicCouncil of Ministers Coperhagen
mdash (2004) lsquoThe roles of employer and employee characteristics for plant productivityrsquo Journalof Productivity Analysis 21 249ndash76
mdash (2005) lsquoWorker turnover and productivity growthrsquo Applied Economics Letters 12(7) 395ndash98Juuti P (2001) Ikaumljohtaminen Kansallinen ikaumlohjelma Tyoumlministeriouml JTO-tutkimuksia No 13
HelsinkiKanazawa S (2003) lsquoWhy productivity fades with age The crime-genius connectionrsquo Journal
of Research in Personality 37 257ndash72King G M Tomz and J Wittenberg (2000) lsquoMaking the most of statistical analyses Improving
interpretation and presentationrsquo American Journal of Political Science 44(2) 347ndash61Kouvonen A (1999) Ikaumlsyrjintaumlkokemukset Tyoumlssauml Ja Tyoumlhoumlnotossa Tyoumlpoliittinen tutkimus No 203Koumllling A C Schnabel and J Wagner (2005) lsquoEstablishment age and wages Evidence from
German linked employer-employee datarsquo in L Bellmann O Huumlbler W Meyer and
AGE SENIORITY AND LABOUR COSTS 175
G Stephan (eds) Institutionen Loumlhne Und Beschaumlftigung (pp 81ndash99) Nuumlrnberg httpwwwwisouni-erlangendeforschungforschungsberichteforschungsbericht2005pdf
Lazear EP (1981) lsquoAgency earnings profiles productivity and hours restrictionsrsquo AmericanEconomic Review 71(4) 606ndash20
mdash (1998) Personnel Economics for Managers John Wiley and Sons New YorkMaliranta M (1997) lsquoPlant Productivity in Finnish Manufacturing ndash Characteristics of High
Productivity Plantsrsquo The Research Institute of the Finnish Economy (ETLA) DiscussionPaper No 612 Helsinki
mdash (1999) lsquoFactors of performance by plant generation Some findings from Finlandrsquo in SBiffignandi (ed) Micro- and Macrodata of Firms Statistical Analysis and International Comparison(pp 391ndash424) Physica Heidelberg
mdash (2003) Micro Level Dynamics of Productivity Growth An Empirical Analysis of the Great Leap inFinnish Manufacturing Productivity in 1975ndash2000 The Research Institute of the Finnish Econ-omy (ETLA) Series A 38 (available at httpwwwetlafifiles1075_micro_level_dynamicspdf )Helsinki
Maliranta M and P Rouvinen (2004) lsquoICT and business productivity Finnish micro-levelevidencersquo in The Economic Impact of ICT Measurement Evidence and Implications (pp 213ndash40)OECD Paris
Manning A (2000) lsquoMovin on up Interpreting the earnings-experience profilersquo Bulletin ofEconomic Research 52 261ndash95
Medoff JL and KG Abraham (1980) lsquoExperience performance and earningsrsquo QuarterlyJournal of Economics 95(4) 703ndash36
mdash (1981) lsquoAre those paid more really more productive The case of experiencersquo Journal ofHuman Resources 16(2) 186ndash216
Moen J (2005) lsquoIs mobility of technical personnel a source of RampD spilloversrsquo Journal ofLabor Economics 23(1) 81ndash114
Neuman S and A Weiss (1995) lsquoOn the effects of schooling vintage on experience-earningsprofiles Theory and evidencersquo European Economic Review 39(5) 943ndash55
Nurmi S (2004) Essays on Plant Size Employment Dynamics and Survival Helsinki School ofEconomics A-230 Helsinki
OECD (2003) OECD Science Technology and Industry Scoreboard OECD Parismdash (2004) Ageing and Employment Policies Finland OECD Parismdash (2006) Live Longer Work Longer OECD ParisOrsquoMahony M and B Van Ark (eds) (2003) EU Productivity and Competitiveness An Industry Perspec-
tive Can Europe Resume the Catching-Up Process European Commission Enterprise PublicationsParent D (2000) lsquoIndustry-specific capital and the wage profile Evidence from the NLSY
and the PSIDrsquo Journal of Labor Economics 18(2) 306ndash23Productivity Commission (2005) Economic Implications of an Ageing Australia Research Report
Canberra (httpwwwpcgovaustudyageingfinalreport)Sapir Report (2004) An Agenda for a Growing Europe Oxford University Press OxfordSkirbekk V (2003) Age and Individual Productivity A Literature Survey MPIDR Working Paper
No 2003-028Statistics Denmark Statistics Finland Statistics Iceland Statistics Norway and Statistics
Sweden (2003) Access to Microdata in the Nordic Countries Statistics Sweden OumlrebroTeulings C and J Hartog (1998) Corporatism or Competition Cambridge University Press CambridgeTomz M J Wittenberg and G King (2003) Clarify Software for Interpreting and Presenting
Statistical Results (Version 21) Stanford University University of Wisconsin and HarvardUniversity 5 January Available at httpgkingharvardedu
Topel RH (1991) lsquoSpecific capital mobility and wages Wages rise with job seniorityrsquo Journalof Political Economy 99 145ndash76
Troske KR (1999) lsquoEvidence on the employer size-wage premium from worker-establishmentmatched datarsquo Review of Economics and Statistics 81(February) 15ndash26
Uusitalo R and J Vartiainen (2005) lsquoFinland Firm factors in wages and wage changesrsquounpublished manuscript 9 June
Verhaegen P and TA Salthouse (1997) lsquoMeta-analyses of age-cognition relations in adult-hood Estimates of linear and nonlinear age effects and structural modelsrsquo PsychologicalBulletin 122(3) 231ndash49
Winter-Ebmer R (2001) lsquoFirm size earnings and displacement riskrsquo Economic Inquiry 39(3)474ndash86