Reconstructive Description of Eighteenth-century Xinka Grammar
Acoustic emission monitoring of an eighteenth century wardrobe to support a strategy for indoor climate management Marcin Strojecki1, Michał Łukomski1,2,*, Leszek Krzemień1, Joanna Sobczyk2, Łukasz Bratasz1,2 1Jerzy Haber Institute of Catalysis and Surface Chemistry, Polish Academy of Sciences, Krakow, Poland 2The National Museum in Krakow, Poland *the corresponding author Abstract The on-site monitoring of acoustic emission (AE) has allowed the direct tracing of climate-induced crack propagation in an eighteenth century wardrobe displayed in the Gallery of Decorative Art in the National Museum in Krakow, Poland. The anti-correlation measuring scheme and frequency filtering allowed very low levels of physical damage to the wardrobe to be detected in spite of the high background noise typical of the museum environment. The total AE energy recorded during two years of monitoring corresponded to a fractured area of 12 mm2 or a total crack propagation of 1.2 mm for two10 mm-thick panels. Although the total damage recorded was minute, correlation between the events of fracturing and falls in indoor relative humidity (RH) in winter due to insufficient humidification was evident. The risk of damage, expressed in terms of crack propagation, was quantified as a function of the magnitude of the RH falls of the duration compatible with the response time of the object. The data allows acceptable RH falls to be identified if a conservation professional or a curator selects a ‘tolerable’ yearly propagation of the fracture, in other words the progress of damage considered insignificant. Keywords Acoustic emission, monitoring, physical damage, cracking, furniture, relative humidity, indoor climate, management strategy
Introduction [heading] Managing the indoor climate in museums in a responsible manner, especially in terms of reducing energy consumption and carbon emission, has been much debated in recent years (IIC, 2010). There has been a growing agreement that collections can sustain greater variations in relative humidity (RH) and temperature than previously recommended, which allows relaxing controls of the heating, ventilation and air-conditioning (HVAC) systems and, consequently, considerably reducing energy consumption (Bratasz, 2012; Ascione et al., 2009). It has been also widely accepted that the proposed broadening of the allowable variations of climatic parameters has to be informed by growing scientific understanding of how environmental conditions affect real artefacts. There are two fundamental approaches to establishing the allowable ranges of climatic variations for a particular object sensitive to climate-induce damage – an analysis of an object’s mechanical response to climate variations, or an analysis of the climate to which the object has acclimatized over a long period of time. In the first approach, the dimensional response of the object to changes in temperature and RH, and the critical levels of strain at which materials that constitute the object begin to deform or fail physically, need to be systematically examined. For example, the structural analysis of painted wood has allowed maps of allowable RH variations to be produced which take into account their amplitude, duration and starting RH level (Mecklenburg et al., 1998; Rachwał et al., 2012a,b). However, one should not forget about simplifying assumptions behind the approach. The structural analysis of objects is usually carried out using specimens of new materials which do not necessarily reflect the material properties of historical objects which have adapted over many decades to a particular indoor environment within which they have been preserved. Such adaptation might have involved an unknown level of permanent change, like ageing, deformation or fracturing, making historical materials different also in terms of their vulnerability to damage processes. Furthermore, objects are often complex physical systems and the vulnerability of entire artefacts may be greater than that of their most vulnerable component. Additionally, the structural analysis of the damage processes often yields discrete values of thresholds of the environmental factors, whereas in real-world conditions the failure of historical objects from the macroscopic perspective is preceded by the progressive evolution of damage at the micro-level. In turn, the acclimatisation of an object to the environment within which it has been preserved for a long time assumes that the risk of physical damage beyond that already accumulated in the past is extremely low if the current fluctuations do not go beyond the past pattern (Michalski, 2009). Very conveniently, the acclimatisation concept eliminates any need for elaborating structural analysis of objects and their response to climate. The concept was explicitly expressed in standards on the control of indoor environmental conditions favouring the conservation of sensitive historical materials (for example: EN 15757, 2010). However, the harmlessness of the pre-existing climatic conditions has been the key assumption in the approach. The assumption has to be carefully checked in each case, as physical damage can be cumulative rather than catastrophic, therefore fluctuations, even if not exceeding the past levels, can involve risk of damage. Conservation treatments can erase safety margins of objects achieved by their acclimatisation to past conditions. If cracks in an object act as expansion joints relieving stress, the consolidation may make the object more vulnerable to climate fluctuations. Treatments can also change, sometime radically, the dimensional and mechanical properties of the original artistic materials. The limitations of the two approaches in predicting precisely the risk of damage of a concrete historical object in its specific environment have led to the search for scientific methods of directly tracing damage: non-invasive, continuous, economically viable and capable of operating in real-world conditions in museums, historical buildings or during the

transportation of works of art. The idea has been to record an observable indicator related to the damage of an object in a continuous way or at a specified time interval rather than to monitor the environment which affects the object. The acoustic emission method, which is based on monitoring the energy released as sound waves during fracture processes in materials, has been successfully used in directly tracing the fracturing intensity in massive wooden sculptures, caused by rapid falls in RH brought about by episodes of intermittent heating in a church (Jakieła et al., 2007). Each rapid RH fall produced a strong moisture content gradient through the wood owing to slow diffusion of the water vapour to the surface. The gradient gave rise to tension in the dried outer shell and wood fracturing traced by the acoustic energy release. This paper reports on a long-term acoustic-emission monitoring of an eighteenth century wardrobe in the Gallery of Decorative Art in the National Museum in Krakow, Poland. The condition of concern in this case was built-in restraint that prevented wooden panels of the walls from naturally swelling and shrinking in response to RH fluctuations. Already considerably cracked, the wardrobe was selected by the curators as representative of bulky furniture displayed in the galleries, but was also considered as particularly vulnerable to climate-induced damage. The AE monitoring was an element in a systematic evaluation of the effectiveness of the existing climate management, especially insufficient humidification of the air during repeating falls in the indoor RH in winter. The investigations have been expected to support a review of Museum’s policy regarding climate management so that the desirability of long-term preservation of the collection is optimally reconciled with the need to control the investment and operating costs of the climate control systems. Acoustic Emission (AE) technique [heading] AE monitoring is a method of tracing physical damage in any material or object in which a stress field develops due to some deterioration mechanism. Unlike many available sensors or dosimeters, the AE sensor records damage directly rather than probing the aggressiveness of the environment, and is a universal sensor rather than a sensor dedicated to monitoring a specific material or a specific deterioration process. Acoustic emission is defined as the energy released due to micro-displacements in a structure undergoing a deformation. Energy passes through the material as ultrasound and sound waves and is detected on the surface using a piezoelectric transducer which converts the surface vibration to an electrical signal. The AE experimental setup used in this study consisted of wideband differential AE sensors WD (Physical Acoustic Corporation), an acoustic amplifier (EA System), a simultaneous-sampling analogue input card PCI-9812 (Adlink Technology Inc.) and a personal computer used for controlling the experiment as well as storing and post-processing the acquired data. The choice of these resonant sensors was dictated by their high sensitivity and signal-to-noise ratio. The recorded signals were sampled at a rate of 1 MHz. A single data set consisted of 128,000 points corresponding to 128 ms time-windows, while the duration of a typical AE event was of the order of hundreds of μs. The dead time between two consecutive data sets was found to be around 100 ms. The storage of an AE event was triggered when the electrical signal produced by the AE event first crossed the threshold voltage of 0.6 V (56 dB) which was twice the continuous background noise (0.3 V corresponding to 50 dB). Raw data recorded during the monitoring were post-processed with the help of a computer program searching for individual AE events, extracting them and calculating the most important AE features: amplitude, energy, duration and frequency distribution. On-site AE monitoring [heading]

A wardrobe dated to 1785 was chosen for the AE monitoring as both representative of bulky furniture displayed in the Gallery of Decorative Art of the National Museum in Krakow, and vulnerable to climate-induce damage. The wardrobe, richly decorated with ornamental carving, is a work of supreme craftsmanship. The oak structure is entirely veneered with walnut and decorated with inlays of ivory, tin, graphite and various types of wood in which the maker created rich ornaments including allegorical figures (Fig. 1). Fluctuations in ambient RH are considered to be one of the main factors that contributed to the past deterioration of the wardrobe. They have caused cracks on the front and side walls in the areas where cross-grained wooden elements have been assembled in the structure: the four-part frame has acted as a restraint for the central plank as illustrated in Fig. 2. From the technical point of view, a long-term continuous AE monitoring of the micro-damage development in an object displayed in a gallery is a challenging task as a very low level of signal in comparison to the background noise is expected in such an environment. To increase sensitivity of the applied measuring technique, the sensors were located close to the tips of existing cracks which are areas most at risk of climate-induced fracturing. The appropriate location of the sensors is important as the AE signals can be detected from fracturing occurring in wood at relatively short distances: 30 cm along the direction parallel to the fibres and 10 cm in the direction perpendicular to the fibres. The sensors were pressed to the interior walls of the wardrobe without using any glue or grease coupling which could have contaminated the wood surface (Fig. 3). Monitoring required highly effective filtering of any possible noise resulting from processes different than the fracturing of the wood structure. To prevent recording electrical and unwanted acoustic signals, the anti-correlation measuring scheme was utilized. Two identical AE sensors were connected to the opposite sides of the wardrobe at such a distance that events recorded by one sensor were out of the range of the other (Fig. 3). By discarding events recorded by two sensors simultaneously (within a 1 ms time window), a significant reduction of the noise was achieved. A further reduction of the noise was possible by the application of frequency filtering of the recorded signals. It has been already discussed by Jakieła et al. (2007) and Strojecki et al.(2013) that signals with a high-frequency content are associated with the fracturing of the wood structure whereas signals of low-frequency characteristics are typical of the ambient noise. 60 kHz high pass frequency filtering was applied after an initial 45 days of the monitoring. The same signal filtering was used during the calibration procedure described in detail below. Parallel to the AE monitoring of the wardrobe, air temperature and RH were measured every hour in object’s environment by a permanent microclimate monitoring system operating in the museum. A comparison of the AE measurements with the microclimatic parameters makes risk analysis possible for the monitored object and defining the climate management strategy for the gallery. Calibration of the AE measurements [heading] Energy of AE events is the primary measure of the fracturing intensity in the wooden structure. To relate quantitatively the measured AE energy to the damage development, a series of calibration measurements for the AE system used was performed on oak specimens (150 x 40 x 4 mm3) conditioned at 25, 50 and 75% RH. An artificial crack (a notch) was introduced into each specimen along the grain. The specimens were mounted in a Universal Testing Machine (Inspekt Table 10 kN) in such a way that the slow movement of the machine clamps resulted in crack propagation in the wood structure (Fig. 4a). The propagation of the crack was recorded with the use of a BCi4-6600 CMOS camera and stored on a computer, whereas AE energy was recorded with the use of the monitoring system described above. It is essential that the same system is used for calibration and monitoring. During the tests, the

specimen was strained with a constant speed of 0.03%/s up to the level when fracturing of the wood started. From this moment on, it was possible to directly relate the recorded AE energy with the observed increase in the crack length in real time (Fig. 4b). Using this procedure, the AE energy released during the fracturing of a certain wood area was established for each specimen. Statistical measurement errors resulted mostly from differences in the anatomical structure of the specimens measured and the attenuation of the signal amplitude which depended on the distance the released signal travelled through the wood. By averaging the results of calibration experiments, 58,000 arbitrary units (a.u.) were accepted as energy released during the fracturing of 1 mm2
of the oak wood surface area. It should be noted that the calibration tests involve the intense fracturing of wood over a relatively short time. As a result, large number of AE events can overload the AE detection system, some events may occur in the system’s dead time and the calibration may underestimate the energy released during the fracturing of a unit area of fractured wood.Therefore, the progress of damage in an object monitored in the real conditions of a museum is unlikely to be underestimated in the interpretation of the AE recorded. Results [heading] The results of almost two years of monitoring the AE and local climatic conditions are presented in Fig. 5. The AE activity is shown as energy of AE events accumulated per one-hour time intervals. As one can see, managing indoor climate was subordinated to the comfort of visitors and staff. Therefore, the temperature was maintained at approximately 20 °C throughout the year with periods of slight increases or decreases in summer and winter, respectively. Though average RH was about 40%, a distinct low-high seasonal RH cycle was caused by heating in winter. The seasonal cycle was obtained by calculating, for each reading, the 30-day simple moving average which is the arithmetic mean of all the RH readings taken in a 30-day period before the time at which the average is computed. The 30-day period taken for the calculation followed the recent European standard (EN 15757, 2010). However, a simple moving average rather than a central one recommended by the standard was used in the calculation as only past data from a certain time interval bring about the response of a studied artifact, which is the primary focus of this study. The seasonal RH cycle ranged from 47% in May 2011 (day 440 in Fig. 5) to 32% in February 2012 (day 720). The most pronounced falls in RH recorded in December 2010 (day 270), February 2011 and February 2012 (day 720) were due to spells of particularly cold dry weather, when the outdoor air drawn into the museum was heated to the set temperature but was insufficiently humidified by the air-conditioning system. A multi-step analysis of the data focused on the risk of RH variations to the monitored object as thermal expansion or contraction have a minor effect on the overall dimensional changes of the wood as compared to its response to moisture. As the drops in RH during winter and the wood shrinkage they produce are the primary condition of concern, correlation was sought between the measured AE energy and the RH values recorded in the object’s environment. It should be noted that climate-related cracking of wood is usually associated with changes (drops) in RH rather than absolute low RH values as proposed in this study. There is a silent assumption that the RH drops are related to some RH level at which no forces (tensile or compressive) are present in the wood. Such level can be a single value related to a long-term average RH or can gradually change with the seasonal RH cycle as wood is prone to stress relaxation. Direct tracing of cracking eliminates any need for assessing such RH levels or cycles, and offers precise risk assessment based just on absolute low RH values which are directly measured and can be easily used in climate-control strategies. It should be borne in mind that the cracks in the wardrobe would propagate when two conditions were simultaneously met. On the one hand, a fall in RH must go beyond a certain

critical level, on the other, the variation must last longer than the response time of the wooden panels to bring about their dimensional change. The panels are approximately 10 mm thick. If one assumes that both panel faces have the same permeability to the diffusion of water vapour, the 95% response time in such case falls within the range of 5 – 7 days depending on the air velocity around the panel, that is, if the adjacent air layer is calm or turbulent (ASHRAE, 2007, Rachwał et al., 2012a). However, the response time of a panel can dramatically increase when wood is coated with layers hindering the moisture flow: the 95% response times for a 10 mm panel coated with light, medium or heavy varnish are approximately 10, 20 and 40 days, respectively (ASHRAE, 2007). An increase in the response time can be brought about also by the asymmetric diffusion through the uncoated back-face of the panel when the top face is coated with any kind of a finishing layer blocking the moisture flow. The detailed procedure of the analysis is illustrated in Fig. 6 for a time interval of one week corresponding to a response time of a 10 mm thick panel with two faces diffusively opened as discussed above. In the first step of the analysis, the weekly simple moving average for each RH reading is calculated which is the arithmetic mean of all the RH readings taken in one week before the time at which the average is calculated (called from here the one-week average). In this way, the short-term fluctuations are smoothed and the longer-term cycles to which the elements might have responded are emphasized. To each AE signal, represented by vertical bars in the figure, a corresponding value of the one-week RH average is attributed. The procedure for three selected AE events is illustrated in Fig.6. In the next step of the analysis, the number of RH drops during the monitored period is established as illustrated in Fig. 7 for the time period shown in Fig.6. The smoothed one-week average RH plot is recalculated into a series of discrete steps in RH with a resolution of 1% RH. The number of RH drops to each RH level can be then derived. Finally, the energies of AE events corresponding to intervals with the same value of RH± 0.5% RH were averaged, that is added and divided by the number of RH drops to that RH value. As the fracturing and the AE signals are caused just by RH drops, all AE events recorded were related in this way to a drop of at least 1% in the one-week RH average. As 58,000 a.u. was established in the calibration procedure as the energy released during the fracturing of 1 mm2
of the wood area, or 0.1 mm of crack propagation for the 10 mm thick panel, the AE energy can be recalculated into the equivalent crack propagation. Fig. 8 presents plots of the crack propagation averaged per RH drop to a given RH level. For comparison, the figure also shows plots obtained by the same data analysis but using time-intervals of two and four weeks, corresponding to possible longer response times of the panels. The plots immediately reveal which response time is correct. As the process leading to damage is related to RH drops, the damage should be more and more severe with decreasing RH value. Such tendency is observed most clearly for the one-week time interval, which indicates that the damage progress is due to RH variations of the approximate duration of one week or less. In contrast, the correlation between cracking and RH values is lost for too long averaging period of four weeks, not compatible with the real response time of the panels. Drops in RH readings excessively flattened by the four-week moving average are fewer and close to the annual RH average of about 40%, which is reflected in an unrealistic shift of cracking intensity - a peak in the AE energy released - to that RH. The total AE energy registered during the two-year monitoring period was 703,000 a.u. Thus, the total area fractured was 12.1 mm2 corresponding to 1.2 mm of crack propagation in the two 10 mm thick panels monitored, or 0.6 mm per year on average. It should be recalled at this point that the AE sensors were located close to the tips of the existing cracks where further growth is most likely. The recorded crack propagation is relatively small for any practical assessment of the damage. So the principal conclusion from the two-year monitoring

carried out is that the climatic conditions in the gallery are relatively low risk for the collection. However, the amazing sensitivity and reproducibility of the AE sensors in detecting extremely small sources of acoustic signals enabled the analysis to be further refined. Fig. 9 shows a plot of cumulative crack propagation per year which has occurred as a results of the drops of one-week RH average not going below a given low limit of RH in the entire monitoring period. The plot demonstrates that no fracturing occurs when one-week average RH stays above 45% which, thus, can be regarded as an absolutely safe target RH level eliminating any risk of climate-induced damage to the wood. However, if such level of climate control proves difficult to obtain, the plot in Fig. 9 allows acceptable RH falls to be derived if a conservation professional or a curator select a ‘tolerable’ magnitude of the fracture, in other words the magnitude below which an object’s damage is considered insignificant. For example, an improvement in the present climate conditions in the object’s environment by maintaining one-week average RH over 38% at all times would halve the current yearly crack propagation in the wardrobe to a 0.3 mm/year. If the allowable one-week RH level is further increased to 40%, the yearly crack propagation would be reduced to a mere 0.13 mm/year. Conclusions [heading] The monitoring of acoustic emission (i.e. of energy released as ultrasound and sound waves in the wood structure) has proved a very promising non-destructive method of tracing fracturing intensity in wooden cultural objects in which stress is induced by exposing the objects to variations in temperature and RH. The climate-induced stress is caused by the restrained dimensional response to the moisture sorption/desorption. The restraint of the dimensional response is universally present in real-world conditions. Wood can experience internal restraint, as the moisture diffusion is not instantaneous and the outer part of the wood will respond more quickly than the interior to RH variations as was the case with wooden sculptures exposed to intermittent heating episodes in a church monitored in our previous study (Jakieła et al., 2007). The restraint may also result from the rigid construction restricting movement, especially joining wood elements with different mutual orientations of their fibre direction as was the case with the wardrobe monitored in this study, in the National Museum in Krakow. The monitoring performed as a warning system. It proved capable of recording the progress of micro-damage in the art object monitored, induced by specific climatic conditions in its environment. The AE activity recorded near the tips of existing cracks in the wardrobe structure revealed their gradual, though minute, propagation. This means that the acclimatization of the wardrobe to the climatic conditions in its environment has not been accomplished, and the fatigue process leads to a gradual, very slow damage development during RH falls in winter. It should be noted that direct tracing of damage offers the assessment of cracking risk based on absolute low RH values which are directly measured and can be easily used in any climate-control strategies. The analysis of the data accumulated over a period of two years allowed the risk of damage to be quantified, expressed in terms of crack propagation, as a function of the magnitude of the RH falls of the duration compatible with the response time of the object. It should be stressed at this point that the approach allows risk of damage to be precisely predicted for a concrete historic object in its specific environment. Therefore, the determined critical RH levels can be relevant only for similar objects acclimatized to similar display environments. With this limitation in mind, the presented case study has shown that AE monitoring has a considerable potential to support the assessment of existing climatic control strategies and the development of improved ones, based on the specific needs of the monitored object. In particular, the climate management strategy in the gallery analyzed can be reviewed with great precision so
that the desirability of the collection’s long-term preservation is optimally reconciled with the need to control the investment and energy costs of climate control systems. Acknowledgements [heading] The research was supported by a grant from the Polish Ministry of Science and Higher Education supporting activities of COST Action IE0601 „Wood science for conservation of cultural heritage”. Further support by grant N N105 278536 funded by the same Ministry is acknowledged. Suppliers [heading] C-Cam Technologies BCi4-6600 CMOS Camera: www.c-cam.be Physical Acoustic Corporation acoustic emission sensors: www.pacndt.com Hegewald & Peschke Meß- und Prüftechnik GmbH universal testing machine: www.hegewald-peschke.com Adlink Technology Inc. simultaneous-sampling analogue input card: www.adlinktech.com References [heading] Ascione F., Bellia, L., Capozzoli, A., & Minichiello, F. 2009. Energy saving strategies in air-conditioning for museums. Applied Thermal Engineering, 29: 676-686. ASHRAE. 2007. Museums, Galleries, Archives and Libraries. In: M.S. Owen, ed. ASHRAE Handbook – HVAC Applications. Atlanta: ASHRAE - American Society of Heating, Refrigerating, and Air-Conditioning Engineers Inc. Chapter 21. Bratasz, Ł. 2012. Allowable microclimatic variations for pained wood. Studies in Conservation, DOI 10.1179/2047058412Y.0000000061. EN 15757:2010. 2010. Conservation of Cultural Property - Specifications for temperature and relative humidity to limit climate-induced mechanical damage in organic hygroscopic materials, Brussels: European Committee for Standardisation. IIC. 2010. The Plus/Minus Dilemma: The Way Forward in Environmental Guidelines, a discussion held on May 13, 2010 Milwaukee Wisconsin, USA, edited transcription, International Institute of Conservation [accessed 23 November 2012]. Available at: <http://www.iiconservation.org/sites/default/files/dialogues/plus-minus-en.pdf> Jakieła, S., Bratasz, Ł., & Kozłowski, R. 2007. Acoustic emission for tracing the evolution of damage in wooden objects. Studies in Conservation, 52: 101-109. Mecklenburg, M.F., Tumosa, C.S., & Erhardt, D. 1998. Structural response of painted wood surfaces to changes in ambient relative humidity. In: V. Dorge & F. C. Howlett, eds. Painted Wood: History and Conservation. Los Angeles: The Getty Conservation Institute, pp. 464-483. Michalski, S. 2009. The ideal climate, risk management, the ASHRAE chapter, proofed fluctuations, and towards a full risk analysis model. In: F. Boersma, ed. Proceedings of Experts’ Roundtable on Sustainable Climate Management Strategies, Tenerife, 2007. Los Angeles: Getty Conservation Institute [accessed 23 November 2012]. Available at: <www.getty.edu/conservation/our_projects/science/climate/paper_michalski.pdf >

Rachwał, B., Bratasz, Ł., Łukomski, M., & Kozłowski, R. 2012a. Response of wood supports in panel paintings subjected to changing climate conditions. Strain, 48: 366-374. Rachwał, B., Bratasz, Ł., Krzemień, L., Łukomski, M., & Kozłowski, R. 2012b. Fatigue damage of the gesso layer in panel paintings subjected to changing climate conditions. Strain, 48: 474-481. Strojecki, M., Łukomski, M., Colla, C., & Gabrielli, E. 2013. Acoustic Emission as a Non-Destructive Method for Tracing Damage: From Laboratory Testing to Monitoring Historic Structures. In: Nondestructive Testing of Materials and Structures, RILEM Bookseries vol. 6, pp. 1131-1136.

Legend of figures
1. Wardrobe, 1785, the National Museum in Krakow (MNK 4-Sp-732).

2. Damage area on a side wall of the wardrobe (a); cracks visible on the veneered decoration
are related to the construction of the wall - evident inside (b); anatomical directions of the construction elements are indicated on the schematic drawing of the structure (c).
3. The monitoring system installed inside the wardrobe. Two AE probes are pressed to the
opposite walls of the wardrobe using gravitational counterbalances. A detailed view of the sensor mounting is shown in the frame.

4. Calibration setup – a wooden specimen with an artificial crack to which an AE sensor was
attached is stretched in a Universal Testing Machine, the crack propagation is recorded in real time with the help of a CCD camera (a). The results of a measurement for an oak wood specimen (b): applied load (grey line) versus crack propagation in mm (black dashed line), vertical bars – AE energy in arbitrary units.
5. Indoor climate in the environment of the wardrobe as plots of temperature and RH
recorded every hour (grey line). The RH seasonal cycle is also shown by calculating, for each reading, the 30-day simple moving average (black line). The AE energy recorded for the wardrobe is shown as vertical bars. Periods when no signal filtering or 60 kHz high-pass signal filtering were used are indicated.
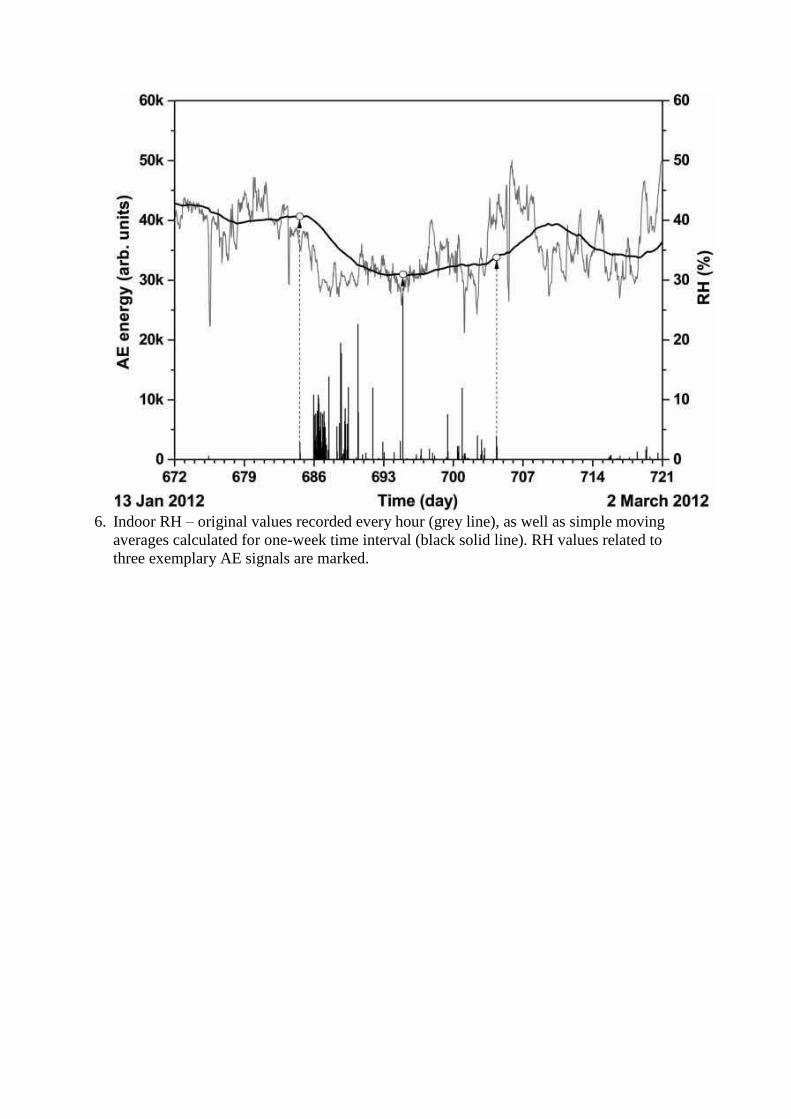
6. Indoor RH – original values recorded every hour (grey line), as well as simple moving
averages calculated for one-week time interval (black solid line). RH values related to three exemplary AE signals are marked.

7. Indoor RH as one-week simple moving averages recalculated into discrete steps in RH
with a resolution of 1% RH.

8. Plots of average AE energy per RH drop to a given RH level.

9. Cumulative crack propagation per year which occurred as a result of drops of one-week RH average not going below the RHmin level in the entire monitoring period. For example, drops in one-week RH average not going below 40% in the monitoring period induced the cumulative crack propagation of 0.13 mm/year.
Copyright © 2022 FDOKUMEN