ACES: An efficient admission control scheme for QoS-aware web servers
13
ACES: An efficient admission control scheme for QoS-aware web servers Xiangping Chen, Huamin Chen, Prasant Mohapatra * 2063 Engineering II, Department of Computer Science, University of California, One Sheilds Ave., Davis, CA 95616, USA Received 22 May 2002; revised 9 October 2002; accepted 31 October 2002 Abstract The unpredictability of server response performance hinders the advance of new application on the Internet. In this paper, we present an efficient admission control algorithm, ACES, based on the server workload characteristics. The admission control algorithm ensures the bounded response time from a web server by periodical allocation of system resources according to the resource requirements of incoming tasks. By rejecting requests exceeding server capacity, the response performance of the server is well maintained even under high system utilization. The resource requirements of tasks are estimated based on their types. A double-queue structure is implemented to reduce the effects caused by estimation inaccuracy, and to exploit the spare capacity of the server, thus increasing the system throughput. The admission control algorithm can be used for server overload control and for QoS provisioning of service differentiating Internet servers. Response delays of accepted tasks are bounded by the desired predefined time period. Theoretical analyses and experimental studies show that the ACES algorithm provides desirable throughput and bounded response delay to the tasks, without any significant impact on the aggregate throughput performance of the system under various workload situations. q 2002 Elsevier Science B.V. All rights reserved. Keywords: Admission control; Bounded response time; Internet; Admission control based on estimation of service time; QoS; Service differentiating Internet servers 1. Introduction The Internet and its services, especially the use of World Wide Web (WWW) in commercial activities, well known as e-commerce, are increasing explosively [1].A widely existing problem in contemporary web servers, however, is the unpredictability of response time. Usually, one second response time is desired from web sites, which is appropriate to the human response speed [2]. Long response delay frustrates user interest in interaction with web sites, thus devalues the service quality. Although current web servers are able to serve thousands of requests per second, the response delay of a popular server can be several seconds even minutes during high load periods, causing the de facto ‘denial-of-service’ effects. It was estimated that in 1998 about 10–25% of e- commerce transactions were aborted owing to long response delay, which translated to about 1.9 billion dollars loss of revenue [3]. The unpredictability of the web response is mainly due to temporary server overload conditions. The peak workload of a web server is usually several orders of magnitude higher than the average load, and the average load usually experiences continuous growth, making it expensive and even impossible to plan the server capacity to fulfill service requirements at all times. An overloaded server does not have enough resources to serve all the incoming requests, and has to deny service to some clients. Furthermore, it wastes resources in processing non-productive operations, such as rejecting new connections or aborting partially completed ones, while failing to process tasks to com- pletion. Abdelzaher and Bhatti [4] reported that as much as half of the server’s processing capacity is wasted on eventually rejected requests when the load is three times the server capacity. Admission control (AC) has been used for overload protection. However, most contemporary web servers use a rather naive AC scheme, namely tail-dropping AC, in which incoming requests are dropped when the number of awaiting tasks exceeds a predefined threshold. The tail-dropping AC scheme requires careful system capacity planning and works well only in steady workload situations where 0140-3664/03/$ - see front matter q 2002 Elsevier Science B.V. All rights reserved. PII: S0140-3664(02)00259-1 Computer Communications 26 (2003) 1581–1593 www.elsevier.com/locate/comcom * Corresponding author. Tel.: þ 1-530-7548380; fax: þ 1-530-7524767. E-mail addresses: [email protected] (P. Mohapatra), chenhua@ cs.ucdavis.edu (H. Chen).
-
Upload
independent -
Category
Documents
-
view
2 -
download
0
Transcript of ACES: An efficient admission control scheme for QoS-aware web servers

ACES: An efficient admission control scheme for QoS-aware web servers
Xiangping Chen, Huamin Chen, Prasant Mohapatra*
2063 Engineering II, Department of Computer Science, University of California, One Sheilds Ave., Davis, CA 95616, USA
Received 22 May 2002; revised 9 October 2002; accepted 31 October 2002
Abstract
The unpredictability of server response performance hinders the advance of new application on the Internet. In this paper, we present an
efficient admission control algorithm, ACES, based on the server workload characteristics. The admission control algorithm ensures the
bounded response time from a web server by periodical allocation of system resources according to the resource requirements of incoming
tasks. By rejecting requests exceeding server capacity, the response performance of the server is well maintained even under high system
utilization. The resource requirements of tasks are estimated based on their types. A double-queue structure is implemented to reduce the
effects caused by estimation inaccuracy, and to exploit the spare capacity of the server, thus increasing the system throughput. The admission
control algorithm can be used for server overload control and for QoS provisioning of service differentiating Internet servers. Response
delays of accepted tasks are bounded by the desired predefined time period. Theoretical analyses and experimental studies show that the
ACES algorithm provides desirable throughput and bounded response delay to the tasks, without any significant impact on the aggregate
throughput performance of the system under various workload situations.
q 2002 Elsevier Science B.V. All rights reserved.
Keywords: Admission control; Bounded response time; Internet; Admission control based on estimation of service time; QoS; Service differentiating Internet
servers
1. Introduction
The Internet and its services, especially the use of
World Wide Web (WWW) in commercial activities, well
known as e-commerce, are increasing explosively [1]. A
widely existing problem in contemporary web servers,
however, is the unpredictability of response time. Usually,
one second response time is desired from web sites, which
is appropriate to the human response speed [2]. Long
response delay frustrates user interest in interaction with
web sites, thus devalues the service quality. Although
current web servers are able to serve thousands of
requests per second, the response delay of a popular
server can be several seconds even minutes during high
load periods, causing the de facto ‘denial-of-service’
effects. It was estimated that in 1998 about 10–25% of e-
commerce transactions were aborted owing to long
response delay, which translated to about 1.9 billion
dollars loss of revenue [3].
The unpredictability of the web response is mainly due to
temporary server overload conditions. The peak workload
of a web server is usually several orders of magnitude higher
than the average load, and the average load usually
experiences continuous growth, making it expensive and
even impossible to plan the server capacity to fulfill service
requirements at all times. An overloaded server does not
have enough resources to serve all the incoming requests,
and has to deny service to some clients. Furthermore, it
wastes resources in processing non-productive operations,
such as rejecting new connections or aborting partially
completed ones, while failing to process tasks to com-
pletion. Abdelzaher and Bhatti [4] reported that as much as
half of the server’s processing capacity is wasted on
eventually rejected requests when the load is three times
the server capacity.
Admission control (AC) has been used for overload
protection. However, most contemporary web servers use a
rather naive AC scheme, namely tail-dropping AC, in which
incoming requests are dropped when the number of awaiting
tasks exceeds a predefined threshold. The tail-dropping AC
scheme requires careful system capacity planning and
works well only in steady workload situations where
0140-3664/03/$ - see front matter q 2002 Elsevier Science B.V. All rights reserved.
PII: S0 14 0 -3 66 4 (0 2) 00 2 59 -1
Computer Communications 26 (2003) 1581–1593
www.elsevier.com/locate/comcom
* Corresponding author. Tel.: þ1-530-7548380; fax: þ1-530-7524767.
E-mail addresses: [email protected] (P. Mohapatra), chenhua@
cs.ucdavis.edu (H. Chen).

the variance in task processing time is low. Thus, the
number of tasks can be used as a good indicator of the server
load. However, the dynamics of web server workload
weakens the efficiency of the tail-dropping AC in overload
protection. For example, the wide usage of Internet server in
e-commerce environment demands more and more dynamic
and secure transactions, which consume about 10–100
times processing power than ordinary tasks. More flexible
AC schemes are needed to adapt to the dynamics of traffic.
These algorithms should be designed considering the
characteristics of task variety.
In this study, we propose a simple and effective AC
algorithm, ACES (Admission Control based on Estimation
of Service time), to provide bounds on server response delay
for incoming requests under highly variant workload
environments. Admission of a request is decided by
comparing the available computation power for a duration
equivalent to the predetermined delay bound with the
estimated service time of the request. If the task is admitted
based on this constraint, then it is very likely that the request
will be served within the specific time bounds. The service
time estimation is done on the basis of an empirical
expression, which is derived from an experimental study on
a real web server. A double-queueing organization is used to
compensate the inaccuracy in estimation, if any, and exploit
spare capacity of the system, which simplifying the task
management. Simulation experiments conducted using real
workload indicate that the ACES algorithm provides
response delay bounds and can also help provide QoS in
service differentiating Internet servers [5].
The rest of the paper is organized as below. Section 2
describes the basic processing procedure of web server and
analyzes the service time components. Section 3 presents
the ACES algorithm in detail and how bounded response
time being ensured. Section 4 discusses how the algorithm
can be used in a service differentiating Internet server.
Performance evaluation of the algorithm is reported in
Section 5. Related works are discussed in Section 6. Section
7 concludes the study.
2. Background
In this section, we describe the basic processing steps
performed by a web server and the service time distribution
in each step. As shown in Fig. 1, a client sends a request to
the server after it successfully establishes a connection with
the server. The server picks up the request from the
incoming request queue, reads and parses the requests, and
invokes a request handler according to the request type. The
corresponding request handler generates the content for the
response. The server sends back the response header with
content to the client, and logs the transaction after the
response transmission completes. The service time of
retrieving a web object can be divided into three parts: the
almost fixed URL processing time, the content generation
time which depend on the object type, and the content
transfer time, which is decided primarily by the response
sizes. As the number of active transactions in the server
increases, the server may spend on increasing portion of its
time for synchronization and context switching.
Web servers uses multi-process, multi-threaded, or non-
blocking I/O single process architecture to serve requests
concurrently. Each architecture has its advantages and
disadvantages. In a multi-process web server, each process
has its own process memory space, thus available memory
for data decreases with the increase of process number. In a
multi-threaded web server, multiple threads share one single
process space, thus some form of synchronization is needed
to control access to shared data. In a single process server,
asynchronous disk and network operations should be
supported to provide a non-blocking I/O environment,
which are still short of full implementation in most of current
operating systems. In this paper, we use the Apache1 web
server to analyze server performance, mainly because of its
freely available source code and large market share; around
50% of contemporary web servers are Apache servers. The
Apache server uses the multi-process architecture.
To collect the service time attributes, we set up an
experiment environment consisting of one Apache (version
1.3.12) web server and three WebStone (version 2.5) clients,
connected through a 10 Mb Ethernet. The web server
hardware is based on a Pentium II 233 MHz CU with
128 MB memory. The operating system used in the server is
Linux 2.2.9. The clients are installed in three Sun UltraSparc
10 with 128 MB memory, running Solaris 2.6. The three
WebStone client machines can generate up to 60 HTTP
request processes simultaneously without being highly
loaded. During the tests, the web server experienced varying
workload from a single HTTP request to 60 simultaneous
requests. The total size of the files being requested exceeded
that of the server’s memory thus reducing the caching
effects. The experiments were repeated under varying file
compositions and the results were found almost stable.
The server response time or service time is defined as the
busy CPU cycles consumed between the time that the server
accepts a client request, and the time that the server finishes
sending the response. The CPU cycles are used as time units
Fig. 1. Web server processing steps.
1 Apache server project. http://www.apache.org.
X. Chen et al. / Computer Communications 26 (2003) 1581–15931582

to obtain the service time, since the typical service time of a
request is much less than one second. Even millisecond
resolution is not sufficient to provide an accurate picture of
the service time distribution in different processing
procedures. The performance monitoring counters provided
by the Intel P6 family processors are used to record the
elapsed busy CPU cycles of the current process.
Fig. 2 depicts the mean service time of static objects
versus requested file size under different maximum process
number (MPN) in the server. It is well known that the MPN
has direct influence in service time distribution, which are
discussed in detail in following paragraphs. CPU cycles
have been converted into seconds in the figure. The
coefficient of variation (CoV) of service times varies
between 0.09 and 0.11.
It can be observed from the figure that the curves have
two phases. If the files are smaller than 64 Kbytes, the
service times with the same MNP are almost constant. If the
file sizes exceed 64 KB, the mean service times increase
linearly with the file sizes and the MNP value. We call this
phenomenon the 64 KB leap. The 64 KB leap is mainly due
to the underlying operating system kernel. In Linux socket
implementation, a 64 KB send buffer limit is imposed for
every transmission. Any send request of more than 64 KB is
fragmented and the first 64 KB is processed while the
remaining parts wait for the buffer space. The kernel can
thus avoid crashing from any imprudent code asking for
more memory than what the kernel could provide. This limit
is tunable via ioctl() function. However, a large send buffer
will not necessarily improve the overall performance since
smaller transmission may spend more time in the queue
waiting for the larger requests to be transmitted. Some other
factors also contribute to the 64 KB leap. For example,
asynchronized disk I/O is widely used in current UNIX
operating systems, and the default size for read-ahead
operation is 64 KB. At most 64 KB can be loaded from the
hard disk in one I/O operation.
The slopes of service time increase linearly with the
number of maximum processes, because the increase of
process number caused higher probability of page faults,
higher context switching, and synchronization overhead.
Based on the observation from Fig. 2, the service time of a
task Tðs; nÞ can be estimated by the file size s KB and MPN
value of n.
Tðs; nÞ ¼ a þ ½s=64� p ðb þ c p nÞ; ð1Þ
where a is the service time for small static web objects, i.e.
requests for files smaller than 64 KB. b is the data
transferring time factor, and c is the context switching
overhead factor. Using linear regression, we get the relative
value for a; b; and c as: a : b : c ¼ 1 : 0:06 : 0:18:
Rechecking the file size distributions, we find that less
than 1% of HTML and image files are larger than 64 KB.
Thus the service time of most HTML and image files are
rather uniform. Service times of dynamic objects, mainly
CGI requests, depend on the computation complexity of the
URL processing instead of response size. Using the CGI
scripts test set provided by WebStone 2.5 test set, the
average service time of a CGI request is around one order of
magnitude higher than the service times of static objects
with a file size less than 64 KB. The experimental results
indicate that the object type is a good indicator of the
requested CPU time, which can be derived from the
requested URL. Besides, classification of object types
introduces less overhead than retrieving file size infor-
mation, which requires one fstat() system call in UNIX
operating systems.
The empirical function was concluded from results
achieved in a LAN environment where the data were
transmitted through high speed media. The TCP send buffer
and the data transferring time factor (b in function 1) can be
obtained from the operating system configuration and band-
width setting, respectively. When extended to the Internet,
which is characterized by heterogeneity of end users with
various link speeds, the TCP send buffer and the data
transfer time can still be obtained by recording TCP level
parameters like congestion window size and round trip time.
The traffic variation may affect the accuracy of the service
time estimation in the Internet domain, which in turn affects
the proposed admission control algorithm. To capture and
nullify the impact of these variations, a double-queue
architecture is proposed (as discussed later) for the missed
requests.
3. The ACES algorithm and overload control
Usually a queue of incoming requests is maintained in
a web server awaiting to be processed. Using the tail-
dropping AC scheme, incoming requests are put in the
queue until the queue is full. Queue length is not always
a good indicator of the system overload, especially when
the variance of processing time is high. Without effective
admission control, the server response time and through-
put deteriorate drastically when the aggregate request rateFig. 2. Mean service time of web objects.
X. Chen et al. / Computer Communications 26 (2003) 1581–1593 1583

exceeds the server capacity, indiscriminately affecting all
clients. Abdelzaher and Bhatti [6] reported that a much as
half of the web system’s processing capacity is wasted on
eventually aborted/rejected requests when the load is
high.
To accommodate the high variance in service pattern
of web servers, we propose a simple and adaptive
admission control algorithm, ACES, to provide assurance
of bounded response delay, while preserving the system
throughput. Service time of each task is estimated based
on the request types. Inaccurate estimations are dynami-
cally adjusted and bounded delay is achieved by a double-
queue architecture.
3.1. Delay bound assurance
In a stable system, i.e. if the server has the capacity to
process all the requests in the steady state, a queue and the
associated queuing delay are introduced to smooth out the
short term variations in the job arrival rate. When the short
term arrival rate is faster than the processing rate, newly
arrived requests have to wait in the queue for service. If
variations of job arrival rate and processing rate are high,
more queueing buffer is needed, and therefore average
queueing time and response delay would be high. One way
to increase the response time predictability of a system is to
limit the number of accepted requests in a given time period
to no more than what the system can handle in that period of
time. Borowsky et al. [7] have provided a theoretical proof
of short term response time verses arrival rate in a FCFS
work-conserving system.
The theorem is described as below: Let KðtÞ be the queue
length at time t. LetPKðtÞ
n¼0 Sn be the sum of the service time
for requests in queue at time t. S0 is residual service time of
the request in service. Let N (t; t0) be the number of requests
arrive in the period (t; t0),PNðt;t0Þ
i¼1 Si be the sum of service
time required by requests N(t; t0). Therefore,
XKðtÞ
n¼0
Sn ,¼XNðt2T ;tÞ
i¼1
Si ,¼ T : ð2Þ
The response delay required by pending jobs is no more than
T, if the sum of service time required by arriving jobs at any
duration T is bounded by time T. The response time (or
delay) of all requests can be bounded by T by restricting the
workload arriving in every interval of length T.
Assume that the time is divided into discrete slots
ð0;TÞ; ðT ; 2TÞ;…; ðkT ; ðk þ 1ÞTÞ;…: For simplicity, we use
the beginning point of each time period, kT, to represent the
duration (kT ; ðk þ 1ÞT). Let c be the unit processing
capacity of the system, CðkTÞ be the predicted system
processing capacity in period kT ; Sði; kTÞ be the service time
needed by the ith task at period kT, and nðkTÞ be the number
of admitted tasks in period kT. If the server has a precise
knowledge of service time needed by each task, the
admission decision can be made based on the following
expression.
CðkTÞ ¼ c p T $XnðkTÞ
i¼1
Sði; kTÞ: ð3Þ
If expression (3) is true, then, the request is admitted,
otherwise it is rejected. The maximum response delay of
each task is bounded by the value of T if the service time of
each task is known prior to the admission decision phase.
The discretization of time scale in the proposed AC
algorithm may deviate from the requirements of Eq. (2)
for certain situations. To handle such situations, we have
proposed a double-queue architecture as discussed in
Section 3.3. The results shown in Section 5 further justifies
the approximation.
3.2. Service time estimation
While deciding to accept a request, the system should
ensure that the sum of service time of accepted tasks do not
exceed the system capacity. In reality, it is not possible to
know the service time Sði; kTÞ in advance. High variance in
resource requirement is a widely recognized characteristic
of web server workload. As indicated in Section 3.1,
however, the service time and bandwidth requirement of the
same type of requests are more or less consistent. Service
time of web objects can be thus estimated based on the
request type distribution of the server access pattern. We
approximate the service time of each task by using weighted
computation quantum (CQ) matching the CPU processing
time of different type of tasks.
When a new request arrives, the system checks if there
are enough CQ available to grant to the request. Only
requests that are granted enough CQ can be enqueued and
served eventually. The number of CQ issued to each task is
determined by the resource requirement of the request. Here
we denote Tn as the number of types of requests to a web
server, which can be derived from the workload character-
ization of a web server. Let NiðkTÞ be the number of requests
of type i in period kT ;CQi be the weighted CQ matching the
CPU processing time for type i tasks. Then Eq. (3) can be
approximated as:
CðkTÞ $Xn
i¼1
CQi p NiðkTÞ: ð4Þ
As in the case of Eq. (3), a request is admitted if Eq. (4)
holds true, otherwise is rejected.
3.3. The double queue structure
Since Eq. (4) is based on the estimation of service time,
care needs to be taken to amortize the accumulate delay
influence of over-admission during a time period. Assume
that a restricted prioritized processing is enforced inside a
queue, i.e. no lower priority tasks get served if there is a
higher priority task waiting, incoming requests are queued
X. Chen et al. / Computer Communications 26 (2003) 1581–15931584

in the order from high priorities to low priorities. Requests
in the same priority are queued in FCFS order. When over-
admission happens, it is possible that low priority tasks stay
in the queue for a long time awaiting services while high
priority tasks get dropped due to lack of queue space. On the
other hand, under-admission wastes system capacity. A
double-queue structure is used to handle the over/under
admission problems. A primary queue is used as the
incoming task queue, and a secondary queue is added for
the backed up requests (we call this as the backup queue).
The system structure is shown in Fig. 3.
An incoming request is first sent to the AC manager
ACM. The ACM classifies the request priority and decides
if the request can be enqueued. Enqueued requests wait to be
served in the primary queue (Qp). At the beginning of the
next period, unfinished requests are sent to the backup queue
(Qb). When the Qb becomes full, it is cleared up and queued
tasks are dropped. Other methods for expunging tasks from
Qb can be explored. The task scheduler TS picks up requests
in the queues and sends to the server pool. No request in the
Qb can be picked up unless the Qp is empty. Replies are sent
back through the server network interface Nb. By using a
double-queue structure, newly accepted requests need not
wait for a long time for service, thus bounded delay is
achieved for most of the requests.
4. Service differentiation
The ACES algorithm can be extended to provide
prioritized services in a service differentiating Internet
server (SDIS). The basic ideas of SDIS include classifi-
cation of client requests into groups with different service
requirements, resource allocations based on the task groups,
prioritized scheduling and task assignments schemes. A
detailed study on the concept and performance evaluation of
SDIS is reported in Ref. [8].
In a prioritized system, the periodic system capacity seen
by different priority groups changes with the prediction of
resource requirements of each priority group. By adjusting
the assigned system capacity to each priority group,
the ACES algorithm provides service quality assurance to
prioritized tasks. There are two kinds of service disciplines
that can be provided by the ACES algorithm: prioritized
resource allocation (PRA) and weighted fair allocation
(WFA). PRA is implemented by assigning resources equal
to the whole system capacity to the highest priority tasks (or
premium tasks). Lower priority tasks get the remaining
resources. The WFA is realized by setting shares of system
resources in each priority group, where each priority group
gets at most/least their shares. In this study we only discuss
the PRA control scheme. The WFA scheme can be easily
extended from the PRA scheme by setting a minimum or
maximum resource ratio for each priority group.
The objective of the server is to ensure QoS to high
priority tasks whenever their arrival rate is lower than the
system capacity. Thus, for high priority tasks, the available
resources are equal to the system period capacity. For lower
priority tasks, the available resources are the system
capacity minus the predicted resource requirements of
higher priority requests during a time period. Since the
priority ratio and type distribution of incoming tasks vary
over time, dynamic assignment of system capacity is needed
to preserve the system throughput.
Assume all the requests are classified and are assigned a
priority p; ðp ¼ 1;…;PÞ; wherein P denotes the highest
priority. Let lpredictedi ; ði ¼ 1;…;PÞ be the predicted inter-
arrival rates of tasks for each priority group. The system
capacity available to priority group p at time kT # t #
ðk þ 1ÞT ; denoted as CpðkT ; tÞ; is:
CpðkT ; tÞ ¼CðkTÞ2XP
i¼pþ1
lpredictedi ðkTÞpT 2lpðkTÞp t: ð5Þ
A task with priority p is admitted if the service time is equal
or less than available capacity CpðkT ; tÞ:
4.1. Estimation of request rate
The resources allocated to each priority group is based on
the prediction of the request rate of incoming prioritized
tasks. Apparent seasonal workload patterns corresponding
Fig. 3. Web server system structure.
X. Chen et al. / Computer Communications 26 (2003) 1581–1593 1585
to daily cycles discussed in Section 4 can be used to predict
current traffic intensity based on the workload history. On
the other hand, reports in Refs. [9,10] suggested that the
aggregate web traffic tends to smooth out as Poisson traffic
in short observation time windows. This suggestion was
further proved by Morris and Lin in Ref. [11]. Based on the
above published results, we decide to use Markov-
Modulated Poisson Process described in Ref. [12] to capture
the seasonal behavior of the aggregate workload of web
servers, while preserving the tractability of modulated
Poisson process. The request arrival process is described as
a Markov process MðiÞ with state space 1; 2;…; i;…;N:
State i has arrivals complying with Poisson process at rate
li: To follow the seasonal behavior, especially the day/night
cyclic behavior of the web server load, the observed traffic
data is chopped into subsets for each hour on a daily basis.
The Markov transition matrix QðnÞ ¼ ½QijðnÞ�; ðn ¼
1;…; 24Þ for each hour can be easily calculated by
quantizing the inter-arrival rate in each observation period,
and calculating the frequency at which MðnÞ is switched
from state i to state j. The predicted access rate lpredictedðkTÞ
can be expressed by the following equation:
lpredictedðkTÞ ¼ ½lððk 2 1ÞTÞ� p QðkTÞ; ð6Þ
where [lððk 2 1ÞTÞ] is the state vector of measured inter-
arrival rate in the previous period. QðkTÞ can be further
adjusted by comparing the differences between predicted
data and measured data, to catch up with the long term
trends of a web server load. In the experiment, we use three
state (pinc; psame; pdec) transition matrices to capture the
traffic trends in each observation period. pinc is the
probability of increment request rate, psame the probability
of the same request rate, and pdec the probability of
decrement request rate. The d value for increment and
decrement is 10% of measured value. The experiment
shows that there is not much difference in the capability of
capturing the traffic trends in each observation period
between a three state transition matrix and more compli-
cated state transition matrices.
4.2. Delay bounds of prioritized tasks
One way to increase the response time predictability of a
system is to limit the number of requests in a given ‘short
time’ period T to no more than what the system can handle
in that period of time. Borowsky et al. [7] provided a
theoretical proof that the service time required by pending
jobs is no more than T in a FCFS work-conserving system, if
the sum of service time required by the arriving jobs at any
duration T is bounded by time T. Thus the response time (or
delay) of all requests can be bounded by T by restricting the
workload arriving in every interval of length T time.
In a prioritized environment where each request is
assigned a specific priority, the processing order and
resource allocation are based on the priority of each request.
The FCFS processing assumption in the above theorem is no
longer valid. In Ref. [5], we proved that the mean response
time of a request is bounded by the arrival rate with equal or
higher priority and the service rate of the system, if requests
with different priorities have the same service requirement
distribution and a strict priority scheduling is used.
Let pð1 # p # PÞ denote the priority of the requests and
P be the total number of priorities. Let sp (i ) be the service
time requirement of task i belonging to priority p, and Np
(t 2 T ; t) be the number of requests of priority p arriving
during the period T.
Lemma. : In a prioritized preemptive work-conserving
environment with no pending work, if N(t 2 T ; t) requests
arrive belonging to a single priority level p, then their
response time is bounded by Tp (Tp , T) ifPNðt2T ;tÞ
i¼1 �
spðiÞ # Tp ( proved in Ref. [7]).
Theorem. : If the priority levels are in the increasing order
of p, the response time of a task with priority p is bounded byPPq¼p Tq: If
PPq¼1 Tq # T ; the response time of any task is
bounded by T.
Proof. : Let Rp;iðnÞ be the response time of the ith task in the
priority class p during period n, and busy_time(n ) be the
amount of time in (n ) that the system is busy during period
n, Let the request time series be partitioned into periods of n
with length T.
For n ¼ 1, i.e. t ¼ ð0;TÞ; without loss of generality, let all
requests arriving during (0, T ) be re-shuffled to be served in
the decreasing order of p
(for p ¼ 1;…;PÞ; then RP;i (1) ,¼ TP; for i ¼ 1;…;NPð1Þ;
and Rp;i (1) ,¼PP
q¼pþ1 Tq þ Tp ,¼PP
q¼p Tq; for �
p ¼ 1;…P:
Assume the above expressions hold true in the period k 2 1;
re-shuffle the requests in queue in the decreasing order of p
during period k. Let QpðkÞ be the sum of the service times
for the pth priority tasks, then
QpðkÞ ¼ Qpðk 2 1Þ þXP
q¼p
XNqðk21Þ
i¼1
sqðiÞ2 busy_time ðkÞ: ð7Þ
Clearly, Qpðk 2 1Þ ,¼ busy_time ðkÞ: By assumption,PP
q¼p
PNqðk21Þ
i¼1 sqðiÞ (PP
q¼p Tq; so
QpðkÞ (XP
q¼p
XNqðk21Þ
i¼1
sqðiÞ (XP
q¼p
Tq: ð8Þ
Hence, by induction and from Eq. (8), we get Rp;iðkÞ (PPq¼p Tqði ¼ 1;…;NpÞðkÞ; for p ¼ 1;…;P; and k ¼ 1; 2;…;
i.e. the response delay boundary of each prioritized task can
be achieved by controlling the requested service time in the
each period of length T. As long as the sum of service times
requested by high priority tasks does not exceed T, the
system response time can be assured by restricting the
number of admitted low priority tasks. B
X. Chen et al. / Computer Communications 26 (2003) 1581–15931586

The granularity of T affects the system performance.
Increasing the value of T smoothes out the access variance
between adjacent periods and allows more requests to be
admitted. However, large value of T also increases the
variance of response time and degrades the system
responsiveness. Both user perceivable delay and system
throughput should be considered in determining an appro-
priate value of T.
4.3. Waiting time estimation
The service time of web object can be estimated from
statistics of the same or similar type of web objects with
acceptable variance. The number of requests allowed by the
system can be derived from the expected waiting time and
the job arrival rate. Let WpðtÞ denote the expected waiting
time of tasks with priority p at time t, ApðtÞ be the expected
arrival rate of tasks with priority p at time t. Let WðtÞ denote
the expected waiting time of a task in the system at time
t;AðtÞ be the expected arrival rate of asks of the system at
time t. In the period k, the expected number of tasks in the
system equals:
NðkÞ ¼ WðkÞ p AðkÞ ¼XP
p¼1
ApðkÞWpðkÞ: ð9Þ
According to Little’s Law [13], the waiting times of each
priority group equals:
WpðkÞ ¼NðkÞ2
XP
i¼pþ1AiðkÞWiðkÞ
ApðkÞ: ð10Þ
On the other hand, the waiting time of a task in the pth
priority group equals the residual life of the executing task
W0 plus the sum of service times of equal or higher priority
tasks in the queue, and the sum of service times of higher
priority tasks arriving while it waits in the queue. The mean
service time of group i in period k is represented as SiðkÞ:
The waiting time is thus equal to:
WpðkÞ ¼ W0 þXP
i¼p
NiðkÞ þXP
i¼pþ1
WpðkÞAiðkÞSiðkÞ: ð11Þ
Let riðkÞ ¼ AiðkÞSiðkÞ: By combining results of Eqs. (10)
and (11) we can get,
WpðkÞ ¼W0
1 2XP
i¼priðkÞ
� �1 2
XP
i¼pþ1riðkÞ
� �
#1
c 1 2XP
i¼priðkÞ
� �1 2
XP
i¼pþ1riðkÞ
� � : ð12Þ
c is the unit processing capacity of the system, its inverse
value is the worst case expected residual life of an executing
task, which happens when the utilization factor approaches
to 1. Eq. (12) shows the mean waiting time of prioritized
tasks by using the estimation of the inter-arrival rate of
equal or higher priority tasks.
Similarly, we can get the expected task inter-arrival rate
and acceptable number of tasks in each period based on the
expected waiting time. The result in shown as:
NpðkÞ ¼ ApðkÞ p T
¼W0 2 WpðkÞ 1 2
XP
i¼pþ1riðkÞ
� �2
1 2 WpðkÞSpðkÞXP
i¼pþ1riðkÞ
T : ð13Þ
Note that the above analyses are based on the periodic data
collection assumption. In fact, all the data used in the above
equations can be easily obtained from a few counters, which
are reset periodically. The workload of each priority level is
estimated at the end of each period. Expected number of
tasks is determined based on the expected inter-arrival rate.
During one period, if the number of incoming tasks of one
priority level exceeds the expected number, then there is no
need to accept new requests in the same priority level until
the beginning of next period.
5. Performance evaluation
To test the effectiveness of the ACES algorithm, we
developed an event driven simulator for the web server and
used real traces of web requests as the input. The reference
locality, response size, and object type distribution extracted
from the logs of the Computer Science departmental web
server at Michigan State University2 were used for the
workload generation. The web request traces for a one-week
period was used, which has about a million access logs. The
system configuration was set based on the average
configuration of current popular web servers as shown in
the Table 1.
Three performance metrics are used in the simulation:
server throughput, mean response time, and response delay
bound miss rate of each priority group. System throughput
indicates the server capability. Mean response time and
delay bound miss rate quantify the service qualities in each
priority group. The delay bound miss rate indicates the
proportion of tasks whose response time exceeds the
bounded delay.
Three kinds of admission control algorithms are
implemented to examine the effectiveness of ACES
algorithm in terms of providing bounded delay and high
system throughput. The first admission control algorithm,
we call it simple admission control (SAC) algorithm, is
analogous to the leaky bucket [14] algorithm used in traffic
engineering in the Network transmissions. Using the SAC
scheme, each admitted request is allocate one CQ
irrespective of the request type, thus there is no estimation
2 This work was done while the authors were at Michigan State
University.
X. Chen et al. / Computer Communications 26 (2003) 1581–1593 1587

of service time. The SAC scheme performs better than the
tail-dropping scheme, since it smoothes out the web server
traffic and provides preliminary overload protection.
Another admission control algorithm used for comparison
purpose is the conservative admission control (CAC)
scheme. The CAC scheme is a hypothetical scheme, in
which the server is assumed to have precise knowledge of
service time a request needs. Using the CAC scheme, the
allocated CQs are allocated barely enough to fulfill
the service time requirements. Although implementation of
the CAC is unrealistic, we use it to compare the performance
of ACES scheme. Conservative AC scheme tends to under-
allocate system resources. In the experiments, the admission
criteria was relaxed to allow admission if the CPU is idle, no
matter whether there are CQ left or not.
Based on the data collected, web objects are classified
into four types: static, dynamic, audio and video objects.
The CQs consumed by each object type in the ACES
scheme are listed in the Table 2. The CQs allocated to each
object type is based on the results in Section 2.
5.1. Overload management performance
Two kinds of workloads are used in the experiment. The
first is the stress test workload, in which traffic intensity
increases continuously till 2.5 times of the system capacity.
We try to explore the capability of the three algorithms in
preserving the system throughput under extremely high load
by stress test. The second kind of workload is aimed to
examine the sensitivity of the three algorithms under
fluctuating workload. There are two modes in the workload
series used in the sensitivity test; one is sustained lightload
or overload, and the other is occasional lightload or
overload. The maximum workload is two times of the
system capacity. The occasional overload duration is 2 time
units, and the sustained overload duration is 10 time units.
Each time unit is 100 times of the observation period, i.e.
100 s. During sensitivity test, the result of the first 10 time
units are recorded to indicated the server response behavior
with respect to load fluctuations.
5.1.1. Throughput comparison
Figs. 4 and 5 plots the throughput performance of the
three admission control algorithms under the two tests.
It can be observed that the throughput of the system
increases linearly with the workload during low load periods
(lower than 0.6 of system capacity) irrespective of the
admission control scheme. With the increase in load,
the throughput of the CAC scheme is a little bit lower
than the other two schemes. The reason is that the CAC
scheme tends to waste system resources when the inter-
arrival rate of requests is temporarily lower than the system
capacity. With the increase of system load to extremely
Table 1
Simulation configuration
Parameter Value
Priority level 2
Scheduling period 1 s
System capacity for static objects 1000 req./s
Network bandwidth 50 Mbps
Disk bandwidth 10 Mbps
Caching hit ratio 0.7
Dynamic objects processing overhead 10 ms
Maximum open connection 1000
Total queue length 1000
Response delay bounds 1 s
Table 2
CQs allocated to each object types
Object types Static Dynamic Audio Video
CQs 1 10 20 100
Request Freq. 94.7 5 0.2 0.1
Fig. 4. Throughput of stress test.
Fig. 5. Throughput of sensitivity test.
X. Chen et al. / Computer Communications 26 (2003) 1581–15931588

high, the throughput of CAC improved a little bit due to
lower chance of wasting system resources. When the system
load is around the system capacity, the throughput
performance the ACES scheme is a little bit lower than
the SAC scheme, because the SAC scheme tends to over-
allocate system resources. Under even higher load situation,
the ACES scheme has similar performance as the SAC
scheme.
5.1.2. Average delay
Figs. 6 and 7 depicts the average delay performance of the
three admission control algorithms under the stress test and
sensitivity test. During low load periods, the delay perform-
ance of the three AC scheme is about the same. The average
delay is slightly higher in using the SAC scheme than the
other two schemes during medium load periods. However,
the average delay of the SAC scheme is one order of
magnitude higher than the other two schemes during
overload periods. The mean response delay of the ACES
scheme is about one fifth of the delay bounds during overload
periods, while delay of the CAC scheme is about one tenth of
the delay bounds during overload situations. Since nearly all
the tasks need to wait from the tail of queue for service under
high load situations, the average delay of the SAC scheme
under high load periods is determined by the system total
queue length. The experiment proves that the system
responsiveness of ACES is close to the ideal case. Based
on the queue length and waiting time relationship per Little’s
Law, the average delay differences between the three AC
schemes suggest that the required queue length might be
much shorter for ACES compared to that of SAC.
5.1.3. Delay bound miss probability
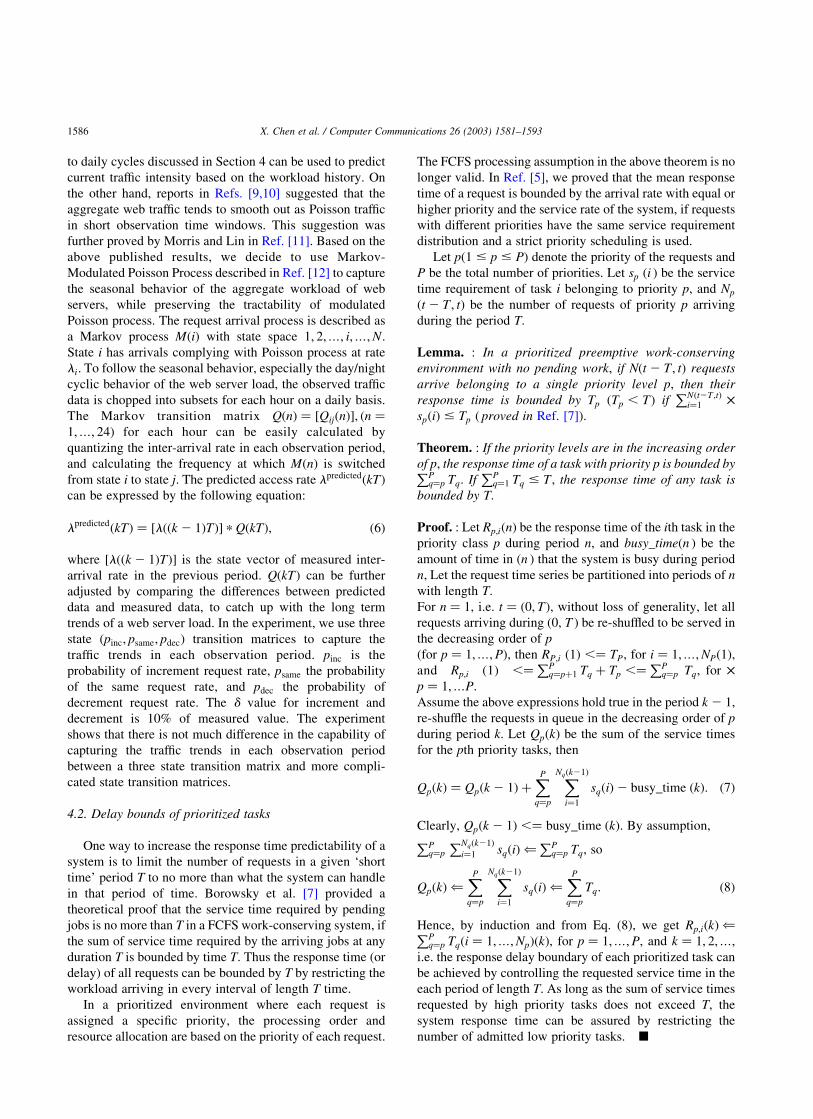
Figs. 8 and 9 depicts the delay bounds miss ratio of the
three admission control algorithms under two tests. As
expected, delay bounds miss rate (Dbm rate) for CAC is
zero, since the system stops admitting tasks when it cannot
serve them within the delay bounds. Using the SAC scheme,
on the contrary, the system fails to meet the delay bounds
for nearly all the tasks in high load periods. The reason is
that the SAC scheme fails to catch up with the changes of
system resource consumption and tends to over-admit tasks.
The over admission leads to the formation of long queue,
thus introducing long waiting time for all admitted tasks.
However, under low or medium load situation (about less
than 0.7 of the system capacity), the SAC scheme performs
as well as the other two schemes. The performance of ACES
is good under reasonably high load (less than 2.0 of the
system capacity), and nearly no delay bounds miss is
incurred at this load. Under extremely high load situation,
the ACES scheme has lower than 1% of delay bound miss
ratio.
The two tests prove that the ACES algorithm is effective
in providing delay assurance as well as in preserving system
throughput under diverse load and overload situation in a
web server system. Its throughput performance is closer to
the SAC scheme, and the response delay performance is
closer to the CAC scheme.
Fig. 6. Delay of stress test.
Fig. 7. Delay of sensitivity test. Fig. 8. Dbm rate of stress test.
X. Chen et al. / Computer Communications 26 (2003) 1581–1593 1589
The CAC scheme is powerful in controlling the deadline
misses of tasks, as it does not incurs any bound miss.
However, the throughput of CAC is much lower than the
other two schemes. The low throughput is partly due to the
strict admission control. The server does not make full use
of computing resources when the variance of request rate is
high. The CAC scheme is suited for the hard real-time
services where deadline guarantee is critical.
The SAC scheme is suitable for a system with uniform
workload, as it does not work well in highly diverse
workload environments such as a web server. The SAC
scheme performs well during low or medium load periods.
During high or overload periods, the SAC scheme tends to
over allocate system resources, which causes long response
delay. Accumulative effect of overload has long term
influence in degradation of system responsiveness and
throughput.
5.2. The ACES algorithm is SDIS
The following experiments evaluate the performance of
the ACES algorithm as opposed to a simple admission
control (SAC) algorithm in a prioritized web server. High
priorities are assigned to 50% of the incoming requests
randomly, and the remaining requests are marked as low
priority. Thus the ratio of high priority to low priority tasks
is 1 to 1, and both types of tasks are randomly distributed in
the whole arrival sequence.
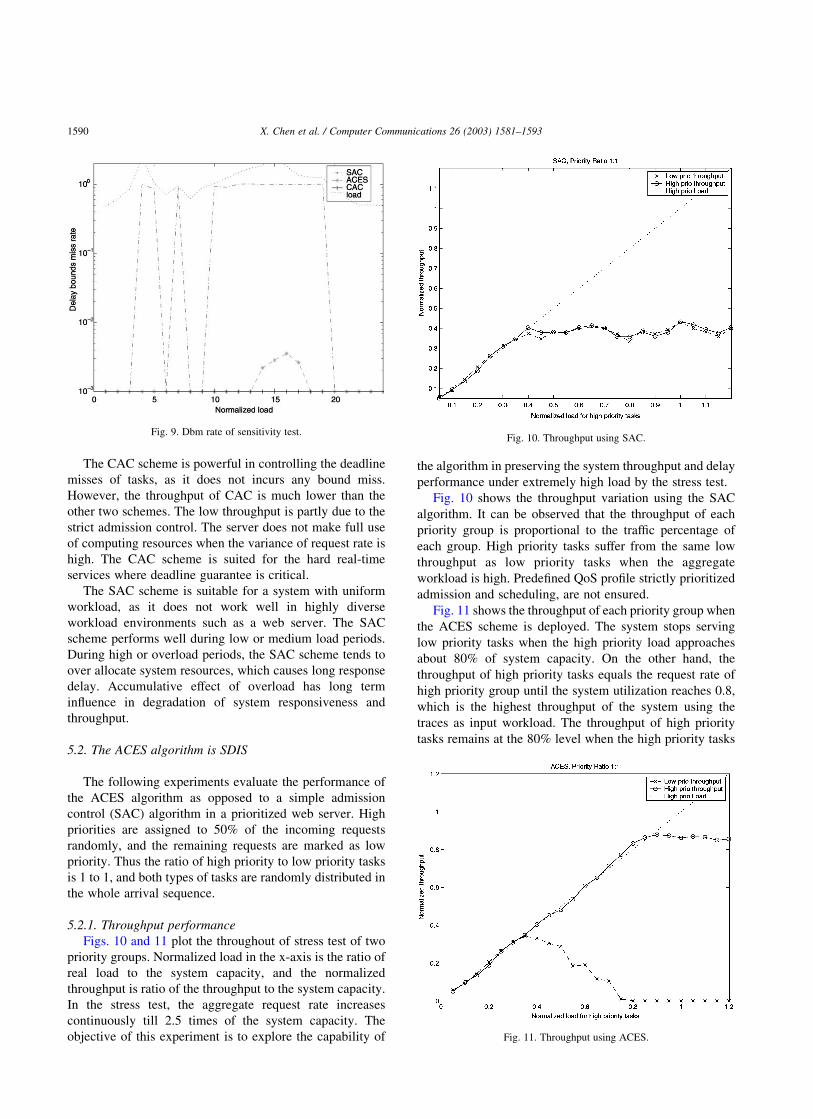
5.2.1. Throughput performance
Figs. 10 and 11 plot the throughout of stress test of two
priority groups. Normalized load in the x-axis is the ratio of
real load to the system capacity, and the normalized
throughput is ratio of the throughput to the system capacity.
In the stress test, the aggregate request rate increases
continuously till 2.5 times of the system capacity. The
objective of this experiment is to explore the capability of
the algorithm in preserving the system throughput and delay
performance under extremely high load by the stress test.
Fig. 10 shows the throughput variation using the SAC
algorithm. It can be observed that the throughput of each
priority group is proportional to the traffic percentage of
each group. High priority tasks suffer from the same low
throughput as low priority tasks when the aggregate
workload is high. Predefined QoS profile strictly prioritized
admission and scheduling, are not ensured.
Fig. 11 shows the throughput of each priority group when
the ACES scheme is deployed. The system stops serving
low priority tasks when the high priority load approaches
about 80% of system capacity. On the other hand, the
throughput of high priority tasks equals the request rate of
high priority group until the system utilization reaches 0.8,
which is the highest throughput of the system using the
traces as input workload. The throughput of high priority
tasks remains at the 80% level when the high priority tasks
Fig. 9. Dbm rate of sensitivity test.Fig. 10. Throughput using SAC.
Fig. 11. Throughput using ACES.
X. Chen et al. / Computer Communications 26 (2003) 1581–15931590

overload the system. It can also be observed that the
aggregate throughput of the two AC schemes remains at the
same level. It suggested that the prediction and reservation
behaviors of the ACES scheme do not degrade the system
aggregate throughput.
5.2.2. Delay performance
The average delay of each priority group is also well
controlled under the ACES scheme. As shown in Figs. 12
and 13, the average delay of each priority group is much
lower than the predefined delay bounds of 1 s by using the
ACES algorithm.
Fig. 12 plots the low priority task delay and throughput
performance of the two AC algorithms. Using the SAC
algorithm, low priority task throughput is proportional to the
ratio of low priority traffic. However, extremely long delays
are introduced when prioritized processing is used. On the
contrary, the ACES algorithm blocks admission of low
priority tasks during high load periods in exchange of low
delay bounds miss ratio. The prediction and CQ assignment
behavior of the ACES scheme avoids unnecessary waiting
of low priority tasks, thus decrease the system overload
during high load periods.
Fig. 13 plots the high priority task delay and throughput
performance of the two AC algorithms. Using the SAC
algorithm, high priority task throughput is proportional to
the ratio of high priority traffic to the total traffic volume,
although the high priority task traffic is low. Delays of high
priority tasks are kept low because prioritized processing is
used. On the contrary, the ACES algorithm preserves
throughput performance of high priority tasks during high
load periods with the cost of higher average response delay,
but still within the delay bounds.
5.2.3. Sensitivity test
Figs. 14 and 15 plot throughput and delay perform-
ance under fluctuating workload. The experiment is
aimed at examining the sensitivity of the ACES
algorithm to the variation in the workload. The test set
can be phased as sustained lightload or overload, and
occasional lightload or overload. The occasional overload
duration is 2 time units, and the sustained overload
duration is 10 time units. Each time unit is 1000 times of
the observation period.
The maximum resource requirements of high priority
requests equal the system capacity. It can be observed from
Fig. 14 that the ACES scheme is very sensitive to the load
fluctuation, which blocks the low priority tasks under high
load situation to preserve the throughput of high priority
tasks, and resume service of low priority tasks during
medium to low load situation. Fig. 15 shows the delay
performance of the two priority groups. The delay of high
priority tasks follow the trends of incoming high priority
workload, but the maximum value is only about one fifth of
the delay bounds. The delay of low priority tasks is also well
controlled under the delay bound.
Fig. 12. Performance comparison of low priority tasks.
Fig. 13. Performance comparison of high priority tasks. Fig. 14. Throughput under fluctuating load.
X. Chen et al. / Computer Communications 26 (2003) 1581–1593 1591

6. Related works
Several studies on QoS support in web servers have
addressed the technology of prioritized task processing and
admission control issues. Bhatti and Friedrich [15] addressed
the importance of server QoS mechanisms to support tiered
service levels and overload management. A Web-QoS
architecture prototype was developed by adding connection
manager module to the Apache1 Web server. Admission
control is implemented by blocking low priority tasks when
the high priority waiting task number exceeds the threshold.
Eggert and Heidemann [16] evaluated application level
mechanisms to provide two different levels of web services.
The admission control is implemented by limiting process
pool size and response transmission rate to different priority
groups. Pandey et al. [17] described a distributed HTTP
server which enables QoS by prioritizing pages on a web site.
The admission control is realized by assigning communi-
cation channel to prioritized pages. All of the admission
control mechanisms mentioned above are based on a
predefined ‘threshold’. Performance of high priority tasks
is guaranteed by emulation of a fixed bandwidth ‘leased
line’. However, it is expensive to satisfy the requirements of
burst workload by ‘leased line’ scheme, since peak loads are
several orders of magnitude higher than average load.
7. Conclusion
The growth of the Internet and WWW applications have
imposed continuous challenge to the Internet server
performance and quality of service assurance in terms of
predictable delay and throughput. However, the prevalent
‘bursty’ nature of the server access patterns makes it
difficult and expensive to maintain fast response at all times
even by a high performance server. The peak workload of an
Internet server may exceed the average workload by orders
of magnitudes. In this study, we present a simple and
effective admission control algorithm, ACES, to adapt to the
highly variant processing times of web server environments.
Tasks are admitted based on the estimation service time. A
double-queue structure is deployed to compromise the
inaccuracy of service time estimation, prevent accumulation
of response delay, and improve the system throughput. A
detained experimental measurement of service time distri-
bution of web objects is conducted to provide foundations of
service time estimation. Simulation results demonstrate that
the ACES algorithm is able to provide assurance of response
time while maintain its throughput under various workload
situations.
When a server is unable to provide satisfactory service to
all requests, selective resource allocation is a promising
technique to assure service to requests which are more
important to clients or servers. The ACES algorithm can be
extended to adapt to the highly variant access patterns and
processing of web server environments to ensure the service
differentiation quality. Tasks are admitted based on the
estimation of periodical behavior of prioritized task groups
and service times. The performances of high priority tasks
are preserved by blocking the traffic of low priority tasks
when the system load is high. Delay of most tasks are
bounded by the algorithm processing period. Theoretical
proof and simulation results demonstrate that the ACES
algorithm is able to provide assurance of response time and
throughput performance for each priority group under
various workload situations. Its aggregate throughput
performance is similar to the SAC algorithm, while the
peak high priority task throughput is much higher than the
SAC algorithm. The average delay is about 10 times lower
than predefined boundary, and the delay bounds miss ratio is
0 during most of time periods. Compared to ‘threshold’
based admission control such as tail-dropping, the ACES
algorithm adjusts to the ‘burst’ of workload dynamically
and sensitively, increasing throughput during low load
periods and ensure QoS during high load periods.
Acknowledgements
This research was supported in part by the National
Science Foundation through the grants CCR-09988179 and
ANI-0087548. A preliminary version of this paper was
presented at the International World Wide Web Conference,
2001.
References
[1] E.J.W. West, Using the internet for business-web oriented routes to
market and existing it infrastructures, Computer Networks and ISDN
Systems 29 (1997) 1769–1776.
[2] Usability Engineering. Academic Press, New York, 1993.
Fig. 15. Delay under fluctuating load.
X. Chen et al. / Computer Communications 26 (2003) 1581–15931592

[3] T. Wilson, E-biz bucks lost under ssl strain, Internet Week Online
May 20 (1999) http://www.internetwk.com/lead/lead052099.htm.
[4] T.F. Abdelzaher, N. Bhatti, Web server qos management by adaptive
content delivery, Proceedings of the International Workshop on
Quality of Service, (London, England), 1999, http://www.eecs.umich.
edu/zaher/iwqos99.ps.
[5] X. Chen, P. Mohapatra, Providing differentiated service from an
internet server, Proceedings of IEEE Internet Conference on
Computer Communications and Networks, (Boston, MA), 1999,
http://www.cse.msu.edu/rgroups/isal/pubs/conf/ic3n99.ps.gz.
[6] T.F. Abdelzaher, N. Bhatti, Web server QoS management by adaptive
content delivery, IEEE Infocom (2000) http://www.ieee-infocom.org/
2000/papers.
[7] E. Borowsky, R. Golding, P. Jacobson, A. Merchant, L. Schreier, M.
Spasojevic, J. Wilkes, Capacity planning with phased workloads,
Proceedings of WOSP’98, (Santa Fe, NM), ACM, 1998, http://www.
hpl.hp.com/research/itc/csl/ssp/papers/index.html.
[8] X. Chen, P. Mohapatra, Service differentiating internet servers, IEEE
Transactions on Computers November (2002) pp. 1368–1375.
[9] A.K. Iyengar, M.S. Squillante, L. Zhang, Analysis and characteriz-
ation of large-scale web server access patterns and performance,
World Wide Web (1999) 85–100.
[10] J.C. Mogul, Network behavior of a busy web server and its clients,
Technical Report WRL 95/5, DEC Western Research Laboratory,
Palo Alto, CA, 1995.
[11] R. Morris, D. Lin, Variance of aggregated web traffic, IEEE Infocom
(2000) http://www/ieee-infocom.org/2000/papers.
[12] V.S. Frost, B. Melamed, Traffic modeling for telecommunications
networks, IEEE Communications Magazine 32 (1994) 70–81.
[13] L. Kleinrock, Queueing Systems, Wiley, London, 1976.
[14] K. Sohraby, M. Sidi, On the performance of bursty and
correlated sources subject to leaky bucket rate-based access
control schemes, Proceedings of the Conference on Computer
Communications (IEEE Infocom), (Bal Harbour, Florida), 1991,
pp. 426–434.
[15] N. Bhatti, R. Friedrich, Web server support for tiered services, IEEE
Network (1999) 64–71.
[16] L. Eggert, J. Heidemann, Application-level differentiated services for
web servers, World Wide Web Journal 3 (2) (1999) 133–142. http://
www.isi.edu/~larse/papers/index.html.
[17] R. Pandey, J.F. Barnes, R. Olsson, Supporting Quality Of Service in
HTTP Servers, Proceedings of the Seventeenth Annual SIGACT-
SIGOPS Symposium on Principles of Distributed Computing, (Puerto
Vallarta, Mexico), ACM, 1998, pp. 247–256.
X. Chen et al. / Computer Communications 26 (2003) 1581–1593 1593