AAPM Report No 166
70
AAPM REPORT NO. 166 The Use and QA of Biologically Related Models for Treatment Planning Report of AAPM Task Group 166 of the Therapy Physics Committee March 2012 © 2012 by American Association of Physicists in Medicine DISCLAIMER: This publication is based on sources and information believed to be reliable, but the AAPM, the authors, and the editors disclaim any war- ranty or liability based on or relating to the contents of this publication. The AAPM does not endorse any products, manufac- turers, or suppliers. Nothing in this publication should be interpreted as implying such endorsement.
-
Upload
khangminh22 -
Category
Documents
-
view
6 -
download
0
Transcript of AAPM Report No 166

AAPM REPORT NO. 166
The Use and QA of Biologically RelatedModels for Treatment Planning
Report of AAPM Task Group 166of the Therapy Physics Committee
March 2012
© 2012 by American Association of Physicists in Medicine
DISCLAIMER: This publication is based on sourcesand information believed to be reliable, but theAAPM, the authors, and the editors disclaim any war-ranty or liability based on or relating to the contents ofthis publication.
The AAPM does not endorse any products, manufac-turers, or suppliers. Nothing in this publication shouldbe interpreted as implying such endorsement.

DISCLAIMER: This publication is based on sources and information believed to be reliable,but the AAPM, the authors, and the publisher disclaim any warranty or liability
based on or relating to the contents of this publication.
The AAPM does not endorse any products, manufacturers, or suppliers. Nothing in thispublication should be interpreted as implying such endorsement.
ISBN: 978-1-936366-13-2ISSN: 0271-7344
© 2012 by American Association of Physicists in Medicine
All rights reserved.
Published by
American Association of Physicists in MedicineOne Physics Ellipse
College Park, MD 20740-3846
iii
X. Allen Li (Chair)Radiation Oncology, Medical College of Wisconsin, Milwaukee, Wisconsin
Markus AlberClinic for Radio-oncology, University of Munich, Germany
Joseph O. DeasyMedical Physics, Memorial Sloan-Kettering Cancer Center, New York, New York
Andrew JacksonMedical Physics, Memorial Sloan-Kettering Cancer Center, New York, New York
Kyung-Wook Ken JeeRadiation Oncology, Massachusetts General Hospital, Boston, Massachusetts
Lawrence B. MarksRadiation Oncology, University of North Carolina, Chapel Hill, North Carolina
Mary K. MartelRadiation Physics, UT MD Anderson Cancer Center, Houston, Texas
Charles MayoRadiation Oncology, Mayo Clinic, Rochester, Minnesota
Vitali MoiseenkoPhysics, Vancouver Cancer Center, Vancouver, Canada
Alan E. NahumDepartment of Physics, Clatterbridge Centre for Oncology, Wirral, Merseyside, United Kingdom
Andrzej NiemierkoRadiation Oncology, Massachusetts General Hospital, Boston, Massachusetts
Vladimir A. SemenenkoRadiation Oncology, Medical College of Wisconsin, Milwaukee, Wisconsin
Ellen D. YorkeMedical Physics, Memorial Sloan-Kettering Cancer Center, New York, New York
Short reportpublished in Medical Physics, vol 39, No. 3, 2012
TaskGroupMembers
iv
Treatment planning tools that use biologically related models for plan optimization and/or eval-uation are being introduced for clinical use. A variety of dose response models and quantitiesalong with a series of organ-specific model parameters are included in these tools. However, dueto various limitations, such as the limitations of models and available model parameters, theincomplete understanding of dose responses, and the inadequate clinical data, the use of a bio-logically based treatment planning system (BBTPS) represents a paradigm shift and can bepotentially dangerous. There will be a steep learning curve for most planners. The purpose ofthis task group (TG) is to address some of these relevant issues before the use of BBTPSbecomes widely spread. In this report, we (1) review the biologically related models includingboth used and potentially to be used in treatment planning process; (2) discuss strategies, limi-tations, conditions, and cautions for using biologically based models and parameters in clinicaltreatment planning; (3) demonstrate the practical use of the three commercially availableBBTPSs and potential dosimetric differences between biologically model–based and dose-volume (DV)–based treatment plan optimization and evaluation; (4) identify the desirable featuresand future directions in developing BBTPS; and (5) provide general guidelines and methodologyfor the acceptance testing, commissioning, and routine quality assurance (QA) of BBTPS.
Abstract

Contents
List of Symbols and Abbreviations ....................................................................................... ix
1. INTRODUCTION...................................................................................................... 1I.A. Brief Review of the History and Significance of Dose-Response
Modeling for Treatment Planning ........................................................................ 1I.B. Limitations of Currently Used Dose-Volume–Based Treatment Planning ............ 3I.C. Scope and Terminology ...................................................................................... 3
II. DOSE-RESPONSE MODELS ................................................................................... 5II.A. Generalized Equivalent Uniform Dose (gEUD) .................................................. 5II.B. Linear-Quadratic (LQ) Model............................................................................. 6II.C. LQ-Based Correction of Dose-Volume Histograms............................................. 6II.D. Common TCP Models ........................................................................................ 7II.E. Availability of TCP Model Parameters ................................................................ 8II.F. Common NTCP Models ..................................................................................... 9
II.F.1. Lyman-Kutcher-Burman (LKB) Model................................................ 9II.F.2. Relative Seriality Model....................................................................... 10II.F.3. Other NTCP Models............................................................................ 11
II.G. Availability of NTCP Model Parameters and QUANTEC Survey........................ 11
III. USES OF BIOLOGICALLY RELATED MODELSIN TREATMENT PLANNING ................................................................................. 12III.A. Biological Models in Plan Optimization .............................................................. 13
III.A.1. Advantages of Biological Cost Functions over DV Cost Functions ....... 13III.A.2. Precautions for Using Biological Models in Plan Optimization............. 13III.A.3. Strategies for Effective Use of Biological Models
in Plan Optimization............................................................................ 14III.A.4. Effects of DVH Computation Inaccuracies and Statistical
Uncertainties on Plan Optimization Using Biological Models............... 16III.B. Biological Models in Plan Evaluation.................................................................. 17
III.B.1. Advantages of Biological Models over DV Evaluation Criteria ............ 17III.B.2. Precautions for Using Biological Models in Plan Evaluation................. 18
v

AAPM REPORT NO. 166
IV. DESCRIPTION AND COMPARISON OF CURRENTLY AVAILABLETREATMENT PLANNING SYSTEMS EMPLOYING BIOLOGICALMODELS...................................................................................................................... 20IV.A. CMS Monaco® ................................................................................................... 20
IV.A.1. Plan Optimization Tools ...................................................................... 20IV.A.2. Parameter Sensitivity ........................................................................... 23
IV.B. Philips Pinnacle® ................................................................................................ 24IV.B.1. Plan Optimization Tools ...................................................................... 24IV.B.2. Plan Evaluation Tools .......................................................................... 26IV.B.3. Parameter Sensitivity ........................................................................... 26
IV.C. Varian Eclipse .................................................................................................... 27IV.C.1. Plan Optimization Tools ...................................................................... 27IV.C.2. Plan Evaluation Tools .......................................................................... 29IV.C.3. Parameter Sensitivity ........................................................................... 29
IV.D. Comparison of CMS Monaco, Philips Pinnacle, and Varian Eclipse Systems...... 32IV.D.1. Comparison and Verification of Reported EUD, NTCP, TCP,
and P+ Values Obtained with Pinnacle and Eclipse Systems................. 32IV.D.2. Comparison of Plans Generated with CMS Monaco,
Philips Pinnacle, and Varian Eclipse Systems ...................................... 35
V. ACCEPTANCE, COMMISSIONING, AND ROUTINE QA TESTSFOR BIOLOGICALLY BASED PLANNING SYSTEMS ....................................... 38V.A. Acceptance Tests ................................................................................................ 38V.B. Commissioning Tests........................................................................................... 38
V.B.1. Selective Verification of Biological Metrics .......................................... 38V.B.2. Double Planning .................................................................................. 38V.B.3. Compilation of Benchmark 3D Datasets and DVHs
for Major Sites ..................................................................................... 39V.C. Procedures for Routine QA ................................................................................. 39
VI. VISION OF TG-166 FOR FUTURE DEVELOPMENTOF BIOLOGICALLY BASED TREATMENT PLANNING................................... 40VI.A. Evolution of Biologically Based Treatment Planning Systems .............................. 40VI.B. Desired Features and Functionalities for Future Biologically
Based Treatment Planning Systems ..................................................................... 43
VII. SUMMARY OF RECOMMENDATIONS AND PRECAUTIONSFOR CLINICAL USE OF BIOLOGICALLY BASED MODELS ........................... 45VII.A. General Recommendations ................................................................................. 45VII.B. TPS-Specific Recommendations ......................................................................... 46
VII.B.1. CMS Monaco ...................................................................................... 46VII.B.2. Philips Pinnacle ................................................................................... 46VII.B.3. Varian Eclipse ..................................................................................... 46
vi

vii
APPENDIX A. cEUD: Cell Killing-Based Equivalent Uniform Dose........................ 47
APPENDIX B. Extension of Poisson-Based TCP Model to Accountfor Repopulation and Interpatient Heterogeneity ........................... 48
APPENDIX C. Critical Element and CriticalVolume Models .................................. 49
REFERENCES .................................................................................................................... 50
List of Tables
Table I. Biological Models Used for Treatment Plan Optimization in CMS Monaco ........ 22
Table II. Biological Models Used for Treatment Plan Optimization in Philips Pinnacle ..... 25
Table III. Biological Models Used for Treatment Plan Evaluation in Philips Pinnacle ......... 27
Table IV. Biological Models Used for Treatment Plan Optimization in Varian Eclipse ....... 29
Table V. Biological Models Used for Treatment Plan Evaluation in Varian Eclipse ........... 30
Table VI. Details of Benchmark Phantom Structures ......................................................... 34
Table VII. TCP and NTCP Values Calculated for DVHs Obtained in the BenchmarkPhantom............................................................................................................. 34
Table VIII. gEUD (Gy) values Calculated Based on the DVHs for Three Sample Plansalong with the Parameter a Used ........................................................................ 37
Table IX. Evolution of BBTP ............................................................................................. 40
Table X. Pros and Cons of Homogeneous versus Heterogeneous Tumor DoseDistributions ...................................................................................................... 42
THE USE AND QA OF BIOLOGICALLY RELATED MODELS FOR TREATMENT PLANNING

This page intentionally left blank.

ix
3D three-dimensional3DCRT three-dimensional conformal radiation therapy
AAPM American Association of Physicists in MedicineAP/PA anterior-posterior/posterior-anteriorASTRO American Society for Radiation Oncology
BBTP biologically based treatment planningBBTPS biologically based treatment planning systemBGRT biologically guided radiation therapy
CDF cumulative distribution functionCERR Computational Environment for Radiotherapy ResearchcEUD cell killing-based equivalent uniform doseCPF complication probability factorCRCAE Common Terminology Criteria for Adverse EventsCRE cumulative radiation effectCTV clinical target volume
DICOM Digital Imaging and Communications in MedicineDSB double-strand breakDV dose volumeDVH dose-volume histogram
EORTC European Organization for Research and Treatment of CancerEUD equivalent uniform dose
fDVH functional DVHFSU functional subunit
gEUD generalized EUDGTV gross tumor volume
IMRT intensity-modulated radiation therapy
List of Symbols and Abbreviations Used in this Report

x
LKB Lyman-Kutcher-Burman (model)LQ linear quadratic
MLD mean lung dose
NSD nominal standard doseNTCP normal tissue complication probability
OAR organ at risk
P+ complication-free curePDD percentage depth dosePET positron emission tomographyPRV planning organ at risk volumePTV planning target volume
QA quality assuranceQUANTEC QUantitative Analysis of Normal Tissue Effects in the Clinic
ROI region of interestRT radiation therapyRTOG Radiation Oncology Therapy Group
SBRT stereotactic body radiation therapySF surviving fractionSRS stereotactic radiosurgery
TCP tumor control probabilityTD time doseTDF time dose fractionationTPS treatment planning system
UTCP uncomplicated TCP
Vx volume receiving at least dose x in Gy
AAPM REPORT NO. 166

I. INTRODUCTION
The goal of radiation therapy (RT) is to deliver a therapeutic dose of radiation to target tissueswhile minimizing the risks of normal tissue complications. Until recently, the quality of a radia-tion treatment plan has been judged by physical quantities, i.e., dose and dose-volume (DV)parameters, thought to correlate with biological response rather than by estimates of the biolog-ical outcome itself. It is widely recognized that the DV criteria, which are merely surrogatemeasures of biological responses, should be replaced by biological indices in order for the treat-ment process to more closely reflect clinical goals of RT (Ling and Li 2005). Developments inour understanding of advantages and limitations of existing dose-response models begin to allowthe incorporation of biological concepts into a routine treatment planning process.
I.A. BRIEF REVIEW OF THE HISTORY AND SIGNIFICANCE OFDOSE-RESPONSE MODELING FOR TREATMENT PLANNING
In the early days of radiation oncology, the biological consequences of treatment were judgedmainly by the dose absorbed in the tumor and surrounding normal tissues, with experience-driven accounting for overall treatment time and fractionation. To correct for the latter two factorsnominal standard dose (NSD), cumulative radiation effect (CRE), and time dose fractionation(TDF) formalisms were developed (Strandqvist 1944; Ellis 1969; Kirk et al. 1971; Orton andEllis 1973). These concepts, while serving a practical purpose, were statistical in nature andwere not based on clear radiobiological principles. Progress in basic radiobiology in the mid ofthe last century has led to the formulation of first models of cell killing and, eventually, to mod-els that linked radiation sensitivity to cure rates for tumors. One of the first such formalisms wasproposed by Munro and Gilbert (1961). Although the radiobiological complexity of models todescribe cell survival, which are an essential part of any mechanistic tumor control probability(TCP) model, varied significantly among different investigators, the assumption that a number ofsurviving cells follows the Poisson distribution (section II.D) put forward by Munro and Gilbert(1961) to this day remains a basis of the majority of biologically based TCP models.
The roots of normal tissue complication probability (NTCP) modeling lie in attempts toquantify dependence of tolerance dose for a certain radiation effect on the size of the treatedregion (reviewed in Schultheiss et al. 1983). A power-law relationship between irradiated vol-ume and tolerance dose (section II.F.1) formulated in these early studies remains an importantcomponent of many present-day concepts. NTCP modeling gained more attention with theadvent of three-dimensional conformal radiation therapy (3DCRT). Highly non-homogenousdose distributions in organs at risk (OARs) obtained with 3DCRT required additional tools tohelp collapse complex dose distributions into a single metric that correlates with the risk of radi-ation injury. One of the first metrics to take into account the non-homogeneous nature of a dosedistribution was a complication probability factor (CPF) proposed by Dritschilo et al. (1978).Subsequent efforts involved attempts to include additional radiobiological details into the model-ing process [e.g., Källman et al. (1992b), Jackson et al. (1993), Niemierko and Goitein (1993)],although empirical models have also found their niche (e.g., Lyman 1985). For additional infor-mation regarding early applications of biological modeling in treatment planning, the reader isreferred to a review by Orton et al. (2008).
1
THE USE AND QA OF BIOLOGICALLY RELATED MODELS FOR TREATMENT PLANNING

2
Several radiotherapy centers incorporated dose-response modeling into their dose-escalation protocols. TCP and NTCP models (Ten Haken et al. 1993; Jackson et al. 1996;Mehta et al. 2001) have been used to guide safe dose escalation for non–small-cell lung cancer(Robertson et al. 1997; Hayman et al. 2001; Rosenzweig et al. 2005; Adkison et al. 2008) andhepatic tumors (McGinn et al. 1998; Ben-Josef et al. 2005; Dawson et al. 2006). Song et al.(2005) used an NTCP model to guide prescription dose selection for stereotactic body radiationtherapy (SBRT) of lung tumors. Many investigators incorporated TCP and NTCP models intoin-house computer programs for evaluation of treatment plans [e.g., Sanchez-Nieto andNahum (2000), Warkentin et al. (2004)]. Although absolute values of predicted outcomeprobabilities may not yet be reliable, such tools might provide useful information when alter-nate treatment plans are compared, particularly in cases where dosimetric advantages ofone plan over another is not clear-cut according to DV criteria (Kutcher et al. 1991). However,this view has been questioned (Langer et al. 1998) suggesting that caution should be exercisedeven when using TCP/NTCP indices in a relative sense to rank treatment plans. Because ofdoubts in robustness of model predictions and accuracy of parameter values, biologically basedplan evaluation tools have not yet found a widespread use in commercial treatment planningsystems (TPSs).
Another great potential of radiobiological modeling lies in the use of models to constructcost functions for optimization of treatment plans. Early attempts involve optimization of dosedistributions outside of the tumor volume based on the CPF concept (Wolbarst et al. 1980).When more sophisticated dose-response models were proposed, several research groups investi-gated the possibility of using cost functions comprised of TCP and NTCP for optimization oftreatment plans (Källman et al. 1992a; Mohan et al. 1992; Niemierko et al. 1992; Söderströmand Brahme 1993; Wang et al. 1995). For example, the concept of “complication-free cure,”denoted as P+, was suggested as a cost function for unconstrained biologically based optimiza-tion (Brahme et al. 1991). Despite the potential benefits of TCP/NTCP-based optimization out-lined in these studies, it was widely recognized that much more additional work was needed toincrease confidence in the biologically based treatment planning approach (Bortfeld et al. 1996;Mohan and Wang 1996). A concept of the equivalent uniform dose (EUD) [including the gen-eralized EUD (gEUD)] proposed by Niemierko (1997, 1999) has found considerable supportamong proponents of biologically based optimization because it offers a compromise betweenpurely biological indices, such as TCP and NTCP, and traditional DV metrics. Many investiga-tors have demonstrated that incorporating EUD-based cost functions into inverse treatment plan-ning algorithms for the optimization of intensity-modulated radiation therapy (IMRT) plans mayresult in improved sparing of OARs without sacrificing target coverage (Wu et al. 2002, 2003,2005; Thieke et al. 2003; Stavrev et al. 2003; Yang and Xing 2004; Thomas et al. 2005; Chapetet al. 2005; Spalding et al. 2007). Several studies reported that optimization of IMRT plansbased on a mixture of EUD-based and DV-based cost functions is a robust way to obtain desireddose distributions. This approach is therefore attractive for the purposes of the commercialimplementations of biological models for treatment planning (section IV).
AAPM REPORT NO. 166

3
I.B. LIMITATIONS OF CURRENTLY USED DOSE-VOLUME–BASEDTREATMENT PLANNING
Single or multiple DV constraints used for inverse treatment planning or plan evaluation arebased on clinical studies that demonstrate correlation between tumor control/complication inci-dence and particular DV metrics. For example V20 (percentage of lung volume receiving at least20 Gy) is used to gauge the probability of a plan causing grade ≥ 2 or grade ≥ 3 radiation pneu-monitis (Graham et al. 1999). There are a number of limitations associated with this approach:(1) Typically more than one point on the DVH (e.g., V5, V40, mean lung dose) correlates withthe complication. This correlation is however specific to treatment delivery technique, i.e., IMRTor 3DCRT, beam arrangements, etc. Marks et al. (2010) in their recent QUANTEC (section II.G)report on radiation effects in lung noted that “the correlations between dosimetric parametersare technique dependent, and readers should carefully assess the similarity of their treatmenttechnique to the historical reports before using any of these limits as clinical constraints.”(2) Generally, optimization with DV constraints is indirect, requiring substantial skill in select-ing values and relative weights for constraints that provided optimal TCP and NTCP values.With typically 1 to 3 constraints, a range of optimized normal tissue DVHs that comply equallywell with these few constraints but carry distinctly different risk of complications is possible.When biological methods are also used in the optimization, then DV points may be replacedwith a function that more efficiently drives the shape of the DVH curves to achieve the planleading to the most favorable overall treatment outcome, rather than satisfying the appliedconstraints. (3) Specifying multiple DV constraints increases computational complexity of theinverse treatment planning problem. Moreover, cost functions based on DV constraints can leadto multiple local minima (Deasy 1997; Wu and Mohan 2002). This implies that a search algo-rithm designed for global minimum problems is likely to get trapped in a local minimum, poten-tially leading to less favorable dose distributions.
Most current systems that use DV-based plan optimization also lack tools for routinely eval-uating biologically based metrics alongside DVH metrics. These tools are an important step fordeveloping datasets that demonstrate intra-clinic correlation with outcomes, and comparisonswith conventional DV point constraint optimization. Since dose distributions for plans driven bybiological methods’ constraints may differ substantially from those driven by DV point con-straints, evaluation tools are important as a basis for progression to preferentially adopting bio-logical methods in optimization.
I.C. SCOPE AND TERMINOLOGY
Historically, dose prescription in RT has been performed using population-based knowledgeabout behavior of a particular type of tumor or normal tissue. Rapid advances in functionalimaging, molecular techniques, predictive assays, and RT delivery technology will sooner orlater enable implementing truly-individualized RT in the clinic (Stewart and Li 2007). This taskgroup report (TG-166) will refer to a framework of RT that takes advantage of informationabout spatial and temporal distribution of relevant patient-specific biological parameters, such astumor and normal cell radiosensitivity, oxygenation status, proliferation rate, etc., as biologicallyguided radiation therapy (BGRT). Other investigators have previously used various alternate
THE USE AND QA OF BIOLOGICALLY RELATED MODELS FOR TREATMENT PLANNING

4
terms to describe the same basic concept, e.g., radiobiologically optimized radiation therapy(Brahme 1999), multidimensional conformal radiotherapy (Ling et al. 2000), biologically con-formal radiation therapy (Yang and Xing 2005), biologically based radiation treatment planning(Ling and Li 2005), theragnostic imaging (Bentzen 2005), and risk-adaptive optimization (Kimand Tomé 2006).
An integral part of BGRT is the ability to design dose distributions that would produce thedesired balance between tumor cure and normal tissue injury based on the knowledge of bio-logical properties of the particular tumor and surrounding normal tissues. Such a multidimen-sional problem is most appropriately addressed in the framework of inverse treatment planningpresently employed for the optimization of IMRT plans and will rely on models to describe rela-tionships between dose distributions and biological outcomes. This TG report will refer to anyuse of biological response models that involves feedback from a model during the treatmentplanning process as biologically based treatment planning (BBTP). The feedback may beeither passive/automated in the case of inverse treatment planning, or with active participationfrom the planner in the case of forward treatment planning.
Whereas future development of BGRT relies on sufficient advances in methods to obtainindividualized biological parameters, BBTP has already started to enter clinical practice. BBTPis viewed as a subset of BGRT. However, BGRT is more than just BBTP based on patient-specific biological parameters; BGRT will employ biological models not only at the time of initialplanning, but also to adapt treatment based on tumor/OAR response to RT (e.g., Søvik et al.2007). For a detailed discussion on BGRT and BBTP, readers are referred to a vision 20/20paper by Stewart and Li (2007). The scope of this report is limited to BBTP, i.e., the use of bio-logical models for plan optimization and evaluation in external beam radiation therapy. Theemphasis is made on the models that are implemented or may potentially be implemented incommercial TPSs.
The following definitions and terms are used in this report:Plan optimization or inverse planning: the process of generating an optimal plan following
the desired objectives. The planner specifies objectives (i.e., optimization criteria) includingconstraints (limits that should not be violated) and goals for both the target and normal struc-tures. Internally, the planning system represents these objectives in a cost function, which mustbe maximized or minimized by an optimization algorithm.
Tumor control or local control: no evidence of tumor recurrence in the region treated witha definitive intent.
Normal tissue complication: an unfavorable symptom, sign, or disease temporally associ-ated with the use of radiation therapy. The Common Terminology Criteria for Adverse Events(CTCAE) (http://ctep.cancer.gov) or EORTC/RTOG scale (Cox et al. 1995) is commonly usedfor grading normal tissue complications.
Functional subunit (FSU): structurally or functionally discrete tissue elements (Withers etal. 1988), e.g., nephrons in kidney or alveoli in lung.
Volume effect: modification of normal tissue/organ tolerance with a change in irradiated vol-ume. That is, the tolerance dose increases to a degree that depends on the tissue and complica-tion endpoint as the irradiated volume decreases. The magnitude of the volume effect depends,at least in part, on an underlying anatomic/biological structure of the organ.
AAPM REPORT NO. 166

5
Parallel organ: normal organ in which each FSU functions relatively independentlyand damage to a sufficiently small region does not render the whole organ dysfunctional.Consequently, a volume threshold or functional reserve may exist. Examples are lung, kidney,and liver.
Serial organ: normal organ in which FSU are structured in a series; if one FSU is incapacitated,the organ will exhibit complications. Examples are spinal cord, intestines, and optic nerve.
Serial and parallel response: normal organ response characterized by small and large vol-ume dependence, respectively. The connection between organ architecture designated as serialor parallel (see above) and serial or parallel response is not always exact. Nevertheless withinthe framework of this report, an exact correspondence between organ architecture and responseis assumed. This means that in parallel organs complications are assumed to occur after a sub-stantial fraction of FSUs are damaged, volume effect is large, and response is “parallel.” In con-trast, a serial organ would exhibit complications after a single FSU is incapacitated, volumeeffect is small, and response is “serial.”
II. DOSE RESPONSE MODELS
The field of study of mathematical models of tumor and normal tissue responses to dose is exten-sive and beyond the scope of this report to explore fully. The present treatment is intended toprovide the reader with perspective on the models and parameters typically encountered inBBTP along with references helpful to further exploration. Supplemental information is pre-sented in the appendices.
II.A. GENERALIZED EQUIVALENT UNIFORM DOSE (gEUD)
The concept of equivalent uniform dose (EUD) proposed by Niemierko (Niemierko 1997)provides a single metric for reporting non-uniform tumor dose distributions. It is defined as theuniform dose that, if delivered over the same number of fractions as the non-uniform dosedistribution of interest, yields the same radiobiological effect. To extend the concept of EUDto normal tissues, Niemierko (1999) proposed a phenomenological formula referred to as thegeneralized EUD, or gEUD:
(1)
where vi is the fractional organ volume receiving a dose Di and a is a tissue-specific parameterthat describes the volume effect. For a → –∞, gEUD approaches the minimum dose; thus nega-tive values of a are used for tumors. For a → +∞, gEUD approaches the maximum dose (serialorgans). For a = 1, gEUD is equal to the arithmetic mean dose. For a = 0, gEUD is equal to thegeometric mean dose. The cell killing-based EUD (cEUD, appendix A) has a more mechanis-tic background than the gEUD. However the gEUD is often used in plan evaluation and opti-mization because the same functional form can be applied to both targets and OARs with asingle parameter capturing (it is hoped) the dosimetric “essence” of the biological response.
gEUD =
∑ v Di i
a
i
a1
,
THE USE AND QA OF BIOLOGICALLY RELATED MODELS FOR TREATMENT PLANNING

6
II.B. LINEAR-QUADRATIC (LQ) MODEL
The linear-quadratic (LQ) formalism is most commonly used to model cell survival. Radiation-induced reproductive cell death has been conclusively linked to DNA damage, specifically toDNA double-strand breaks (DSB). In cellular environment, DSB dose-response is linear up tovery high doses (40 to 50 Gy) and approximately 40 to 50 DSB are produced per Gy (Sachs etal. 1997). Most DSB are faithfully repaired; however, some undergo binary misrepair, whichmay lead to a production of a lethal lesion, while some fail to get repaired. Induction, repair,and misrepair of DSB and formation of lethal lesions as a function of dose rate and time can bedescribed as a system of differential equations (Sachs et al. 1997). This led to development ofkinetic reaction-rate models, lethal-potentially-lethal (Curtis 1986) and repair-misrepair(Tobias 1985). The solution to these equations to derive dose-response for lethal lesions takesa complex form and is available for only specific situations; for example, instantaneous dosedelivery followed by full repair. It has been demonstrated that for doses and dose rates of rele-vance to radiation therapy, with a possible exception of doses per fraction used in SBRT, i.e., inexcess of 10 Gy per fraction, the yield of lethal lesions can be well approximated by an LQfunction of dose. That is, the fraction of cells surviving irradiation to a dose D in n fractionscan be approximated as
(2)
where α and b are the proportionality coefficients for the linear and quadratic components,respectively. Effects of repopulation (appendix B) and repair (not discussed) may be reflected asadditional terms within the exponent, but Eq. (2) is most commonly encountered.
Validity of the LQ model for large doses per fraction encountered in radiosurgery and SBRThas become a matter of ongoing debate (Marks 1995; Hall and Brenner 1995; Brenner 2008;Kirkpatrick et al. 2008; Fowler 2008). The issue of contention is that the LQ formalism predictsa continuously bending survival curve while experimental data clearly demonstrate that at largedoses the surviving fraction becomes an exponential function of dose; i.e., follows a straight lineon a semi-log plot. Hybrid solutions accounting for this effect have been suggested (Park et al.2008). Despite these controversies, the LQ model remains a tool of choice for isoeffect calcula-tions in conventionally fractionated photon beam therapy.
II.C. LQ-BASED CORRECTION OF DOSE-VOLUME HISTOGRAMS
To account for variations in dose per fraction in different subvolumes of a target or an OAR withchanges in fractionation schedules, total physical dose corresponding to each DVH bin, Di, issometimes converted into isoeffective dose in 2-Gy fractions using the equation (Wheldon et al.1998; Yorke 2001):
(3)LQED21
12i i
i
D
D n
=+
+
α β
α β
,
S DDn
= − −
exp ,α β2
AAPM REPORT NO. 166

7
where n is the number of fractions. This procedure requires one parameter, the a/b ratio, whichis typically assumed to be equal to 3 Gy for late-responding normal tissues and 10 Gy for tumorsand early responding normal tissues. In general literature, radiation responses were typicallydetermined for 2-Gy fractions. It is thus a good practice to utilize LQED2 rather than D in cal-culations of NTCP and TCP.
II.D. COMMON TCP MODELS
A majority of mechanistic TCP models are based on the assumption that the number of surviv-ing clonogenic tumor cells, i.e., cells capable of regrowing the tumor, follows the Poisson distri-bution (Munro and Gilbert 1961). A unicellular hypothesis, i.e., a single surviving clonogen issufficient to regrow the tumor is further invoked. If the initial number of clonogens is N, theaverage number of surviving clonogens is given by SN, where S is the overall surviving fractionafter a course of radiation therapy; e.g., Eq. (2). The probability of tumor control is then equalto the probability that no clonogens survive:
TCP = exp(–SN). (4)
TCP can be approximated by any two-parameter mathematical function representing a sigmoid-shaped curve. In commonly used empirical TCP models these two parameters are D50, the dose
at which 50% of tumors are controlled, and normalized dose-response gradient
evaluated at D = D50 (Brahme 1984). In practice, parameter details sufficient for a fully describedmechanistic model, such as N or the distribution of a (appendix B) are often unavailable.Therefore, even mechanistic models approximate these parameters with empirical approximations.
The Poisson assumption [Eq. (4)] has limitations when clonogen repopulation occurs duringtreatment. One obvious problem is that simple application of exponential tumor growth predictsthat all tumors recur at sufficiently long times after external beam treatment or for permanentimplants with exponentially decaying sources (Zaider and Minerbo 2000). Some investigatorshave proposed TCP models based on detailed descriptions of clonogen proliferation kinetics(Tucker and Taylor 1996; Zaider and Minerbo 2000). Such non-Poisson models, however, lacksimple analytical solutions, which has limited their applications in BBTP.
In general, TCP is formulated as a product over the structure’s voxels weighted probabilityfunctions:
(5)
where M is the number of voxels and the relative volume of the voxel is vi = Vi /Vref. For practi-cal calculations, bins of a differential DVH, (Di, vi), may be used. Several formulations of theprobability are commonly encountered. One (Lind et al. 1999) uses the LQ model:
(6)P D DDni i
i( ) = − − −
exp exp .eγ α β
2
TCP = ( )=
∏ P Div
i
Mi
1
,
γ = Dd
dDTCP
THE USE AND QA OF BIOLOGICALLY RELATED MODELS FOR TREATMENT PLANNING

8
Here, the number of clonogens, N, is approximated by exp(eg ). In Eq. (6), g is the normalizeddose-response gradient at the dose, where the absolute dose-response gradient is the steepest.The expression N = exp(eg ) is exact when b = 0 or while the dose per fraction remains constantand constitutes a very close approximation otherwise (Bentzen and Tucker 1997). Given inputvalues of D50, g , and a /b , individual values for a and b are calculated as
(7)
and
(8)
Another formulation is a linear-Poisson formulation (Lind et al. 1999):
(9)
If the dose at each voxel is converted to its equivalent dose for a 2-Gy fraction using the LQequation [Eq. (3)] and that dose (LQED2i) is substituted for Di in Eq. (9), the result is equiva-lent to Eq. (6). These are the most commonly encountered formulations used for calculating theTCP among the treatment planning systems examined in this report.
The logistic function is a popular choice to describe the sigmoid shape dose-response inempirical TCP models. For example, Okunieff et al. (1995) used:
(10)
where k is related to the normalized dose-response gradient according to k = D50/(4g ). Theempirical log-logistic function (Schultheiss et al. 1983; Niemierko and Goitein 1991):
(11)
where k controls the slope of the curve. This formulation is recommended in AAPM Report 137(Nath et al. 2009) for use with brachytherapy sources.
II.E. AVAILABILITY OF TCP MODEL PARAMETERS
Okunieff et al. (1995) have collected and analyzed dose-response data for local control of vari-ous tumors treated with adjuvant intent (control of microscopic disease) and with curative intent(control of gross disease). Equation (10) was fit to the data, and estimates of D50 and g werereported for 62 dose-response curves for the control of macroscopic disease and 28 dose-response curves for the control of microscopic disease. Parameter estimates for the Poisson
P DD D
i
ik( ) =
+ ( )1
1 50
,
P DD D k
D D kii
i
( ) =−( )
+ −( )
exp
exp,
50
501
P D eDD
eii( ) = − − − ( )( )
exp exp ln lnγ γ50
2
.
β γα β
=− ( )
+( )e ln ln
.2
250D
α γ
α β
=− ( )
+
e ln ln2
12
50D
AAPM REPORT NO. 166

9
statistics-based model [Eqs. (B1) or (B2)] have been obtained for head & neck tumors (Robertsand Hendry 1993; Wu et al. 1997), breast tumors (Brenner et al. 1993; Guerrero and Li 2003),malignant melanoma (Brenner 1993), squamous cell carcinoma of the respiratory and upperdigestive tracts (Brenner 1993), prostate cancer (Brenner and Hall 1999; Wang et al. 2003),brain tumors (Qi et al. 2006), rectal cancer (Suwinski et al. 2007), and liver cancer (Tai et al.2008). The Poisson-based model incorporating distribution of interpatient radiosensitivity[Eq. (B3)] has been used to refit previously analyzed datasets (Brenner 1993; Brenner and Hall1999) for breast cancer, melanoma, tumors of the respiratory and upper digestive tracts (Webb1994), and prostate cancer (Nahum et al. 2003).
II.F. COMMON NTCP MODELS
The notion of volume effects is the cornerstone of efforts to model dose-response relationshipsfor normal tissues. In parallel organs, considerable sparing of organ function is afforded byreducing the irradiated volume and their response is well correlated with a mean organ dose. Incontrast, serial organs typically exhibit threshold-like responses to radiation and little, if any,modulation of the response is obtained by reducing the volume of organ irradiated. Theirresponse is generally well correlated with a maximum organ dose or the “hot spot.” A robustmodel should accurately describe dose-response of incidence of complications as well as prop-erly account for volume effect. Briefly presented below are NTCP models commonly used inBBTP. Serial (critical element) and parallel (critical volume) organ models are described inappendix C.
II.F.1. Lyman-Kutcher-Burman (LKB) Model
The Lyman model (Lyman 1985) was designed to describe complication probabilities for uni-formly irradiated whole or partial organ volumes. The cumulative distribution function (CDF) ofthe normal distribution is chosen to represent an empirical sigmoid dependence of NTCP ondose. Two parameters, TD50 and m, describe the position of the sigmoid curve along the doseaxis and curve steepness, respectively. A third parameter, n, describes the magnitude of the vol-ume effect using a power-law relationship between the tolerance dose and irradiated volume:
(12)
Here, n is related with parameter a in Eq. (1) as n = 1/a, TD(V) is the tolerance dose for agiven partial volume fraction V, and TD(1) is the tolerance dose for the full volume. Smallvalues of n correspond to small volume effects (“serial” effects) and large values correspond tolarge (parallel) volume effects. Although n ≤ 1 is used for the earliest applications of the Lymanmodel (Burman et al. 1991), this is not a physical or biological restriction and many recentanalyses find best fits to complications data with n > 1.
Because the Lyman model is defined for uniform irradiation and normal tissues are rarelyirradiated uniformly, several algorithms (DVH-reduction algorithms) to convert a heterogeneousdose distribution into a uniform partial or whole organ irradiation resulting in the same NTCPhave been designed [see Hamilton et al. (1992) and Cozzi et al. (2000) for an overview]. Amongthese the effective volume method (Kutcher and Burman 1989) is most commonly used to
TD V TD V n( ) − ( )1 .
THE USE AND QA OF BIOLOGICALLY RELATED MODELS FOR TREATMENT PLANNING

10
complement the Lyman model. The combined formalism is often referred to as the Lyman-Kutcher-Burman (LKB) model (e.g., Deasy 2000).
A mathematically equivalent but more conceptually transparent formulation of the LKBmodel was first proposed by Mohan et al. (1992). According to this model, NTCP is calculatedusing the following equations:
(13)
(14)
(15)
where Deff is the dose that, if given uniformly to the entire volume, will lead to the same NTCPas the actual non-uniform dose distribution, TD50 is the uniform dose given to the entire organthat results in 50% complication risk, m is a measure of the slope of the sigmoid curve, n is thevolume effect parameter, and vi is the fractional organ volume receiving a dose Di. Note that Deff
is conceptually identical to the gEUD [Eq. (1)] with parameter a = 1/n. To account for differ-ences in dose per fractionation, it is common to replace Di with the equivalent dose delivered in2-Gy fractions, LQED2 [Eq. (3)]. For a derivation of Eqs. (13)–(15) from the Lyman model(Lyman 1985) and the Kutcher-Burman DVH reduction scheme (Kutcher and Burman 1989),see Deasy (2000), Li et al. (2003), and Luxton et al. (2008).
II.F.2. Relative Seriality Model
The relative seriality model or the s-model (Källman et al. 1992b) describes response of anorgan with a mixture of serial- and parallel-arranged FSUs. The relative contribution of eachtype of architecture is described by the parameter s, which is equal to unity for a fully serialorgan and zero for a fully parallel organ. NTCP is given by the following equation [see Källmanet al. 1992b for details):
(16)
where vi is the fractional organ volume receiving a dose Di and P(Di) is the complication.Although the relative seriality model has been designed using mechanistic tissue architectureprinciples, in practice values of the parameter s found to provide best fits to clinical data oftenexceed the theoretical maximum of unity, which prompted suggestions to consider the modelphenomenological (Stavreva and Stavrev 2002). The Poisson model for P(Di) [Eqs. (6)–(8), areoften used in TPSs for calculation of NTCP.
NTCP = − − ( )
∏1 11
P Dis v
I
si
,
D v Deff i in
i
n
=
∑ 1 ,
tD TD
mTDeff=
− 50
50
NTCP =−∞∫
1
2
2
2
πe dx
xt
AAPM REPORT NO. 166

11
II.F.3. Other NTCP Models
Some alternative NTCP modeling approaches have been proposed to improve the accuracy ofcomplication risk predictions. These models have the potential to be used in future BBTP effortsand therefore warrant a brief mention. Although DV metrics usually show the strongest correla-tions with complication incidence compared to demographic and clinical variables, the inclusionof non-dosimetric factors into NTCP models has been shown to increase their predictive power.For example, more accurate predictions of radiation pneumonitis risk have been obtained whenplasma levels of transforming growth factor b (Fu et al. 2001), tumor position along the cranio-caudal axis (Hope et al. 2006), or smoking status (Tucker et al. 2008) were added to dosimetricparameters. In another example, the use of concurrent chemotherapy provides an independentpredictive factor of acute esophageal toxicity in lung cancer patients and, when combinedwith dosimetric factors, helps to more accurately estimate patients’ risks (Bradley et al. 2004;Belderbos et al. 2005). NTCP analyses based on patient populations with incomplete follow-upmay substantially underestimate complication risks. At the expense of additional adjustableparameters, the effect of censoring can be taken into account, resulting in potentially more accu-rate NTCP estimates (Tucker et al. 2008). The majority of current NTCP models are DVH-based and therefore ignore important information about location of cold and hot spots within anOAR. The so-called “cluster models” (Thames et al. 2004; Tucker et al. 2006) are based on theassumption that not only volume, but also spatial distribution of hot spots affect complicationrisks. These models provide a first step toward a new class of NTCP models that would take intoaccount the entire three-dimensional (3D) dose distribution, and may further improve the accu-racy of NTCP estimates.
II.G. AVAILABILITY OF NTCP MODEL PARAMETERSAND QUANTEC SURVEY
The modern knowledge of normal tissue tolerance was summarized in the seminal publicationby Emami et al. (1991). The authors compiled tolerance dose values for uniform whole- and par-tial-organ irradiation of 28 critical structures based on available literature and personal experi-ence. In an accompanying article, Burman et al. (1991) fit the Lyman model (section II.F.1) tothe Emami et al., tolerance data. In the past 18 years, many investigators tested NTCP predic-tions based on the Emami et al., and Burman et al., reports against new clinical data and/or pro-vided new parameter estimates for various NTCP models. Most data have been collected for thelung, parotid glands, liver, rectum, and esophagus (Kong et al. 2007; Milano et al. 2007 and ref-erences therein); information about other organs, albeit less abundant, is also available. Severalattempts have been made to obtain NTCP model parameters based on pooled data from differ-ent institutions (e.g., Kwa et al. 1998; Rancati et al. 2004; Tucker et al. 2007; Semenenko andLi 2008). However, it is recognized that many limitations are inherent in extracting/pooling datafrom the literature. That is, variations in endpoint definitions/grading scales, fractionationschedules, patient populations, dosimetry, etc., among different studies have to be reconciled.Regardless of these difficulties, there is an urgent need to summarize the new normal tissue tox-icity data in a clinically useful manner.
QUANTEC (QUantitative Analysis of Normal Tissue Effects in the Clinic) is a multidisci-plinary effort jointly funded by the American Association of Physicists in Medicine (AAPM)
THE USE AND QA OF BIOLOGICALLY RELATED MODELS FOR TREATMENT PLANNING

12
and the American Society for Radiation Oncology (ASTRO), which aims to summarize currentknowledge of DV dependencies of normal tissue complications from external beam radiother-apy, and where possible, give quantitative guidance for clinical treatment planning and opti-mization. Following an initial meeting in October 2007 attended by approximately 75 radiationoncologists, medical physicists, and biostatisticians, extensive literature reviews were undertakenand clinically significant endpoints identified for some 16 organs. Where possible, results weresynthesized and compared, guided by the quality and levels of evidence of the studies. Criteriaincluded prospective or retrospective nature, statistical power, presence and reliability of quanti-tative data on DV effects. Other clinical factors influencing complications were assessed, such asthe influence of chemotherapy, fraction size, and preexisting medical conditions. Where avail-able, NTCP model parameters were compiled. This information is expected to provide a boostfor further deployment of biological models in the clinical treatment planning process. Theresults of QUANTEC analyses were published (QUANTEC, 2010). The QUANTEC publica-tions are available on the AAPM website (http://www.aapm.org).
III. USES OF BIOLOGICALLY RELATED MODELSIN TREATMENT PLANNING
Dose-response models for tumor and normal structures, as reviewed in section II, can bebroadly characterized as either mechanistic or phenomenological. The former attempt to mathe-matically formulate the underlying biological processes, whereas the latter simply intend to fitthe available data empirically. Mechanistic models are often considered preferable, as they maybe more rigorous and scientifically sound. However, the underlying biological processes for mosttumor and normal tissue responses are fairly complex and often are not fully understood, and itmay not be feasible to accurately and/or completely describe these phenomena mathematically.On the other hand, phenomenological models are advantageous since they typically are relativelysimple compared to the mechanistic models. Their use obviates the need to fully understand theunderlying biological phenomena. Limitations of such empirical approaches are that they strivefor mathematical simplicity and thus are limited in their ability to consider more complex phe-nomena. Further, it may be somewhat risky to extrapolate model predictions beyond the realmwithin which the model and parameter values were validated. A mechanistic model might bemore forgiving in its ability to extrapolate to these more uncertain areas.
As described later in section IV, phenomenological models are mostly used in the currentlyavailable BBTPS due to their simplicity in implementation. It is a vision of this task group thatmore mechanistic models will be employed as BBTPS advances (section VI). In this early stageof BBTPS, the EUD is the most commonly used phenomenological model. As demonstratedwith EUD models, this report describes general strategies, advantages, and limitations for usingbiologically based models for treatment planning.
Biologically related figures of merit may be used for both plan optimization and evaluation.Both tasks are closely related as any optimization algorithm continuously evaluates treatmentplans and alters them incrementally in order to improve their figures of merit. However, desiredproperties (e.g., predicting power) of biological models may differ whether they are used for
AAPM REPORT NO. 166

13
plan optimization or plan evaluation. As pointed out by Choi and Deasy (2002), treatment opti-mization only requires a model to have the ability to steer the optimization process in the desireddirection. In contrast, for an effective use of dose-response models in plan evaluation, especiallywhen absolute TCP/NTCP values are used to guide clinical decisions, the accuracy of modelpredictions is of paramount importance.
III.A. BIOLOGICAL MODELS IN PLAN OPTIMIZATION
III.A.1. Advantages of Biological Cost Functions over DV Cost Functions
Limitations on use of DV constraints in treatment planning were discussed in section I.B.Optimization criteria based on biologically related models are potentially more versatile anddirectly associated with treatment outcome than those based on DV criteria.
If biologically related models are constructed to capture the dose response, they would allowsome extrapolation beyond the range of clinical evidence. Unfortunately, there is no guaranteethat a biologically related model does indeed estimate the consequence of dose distributions ifthey deviate greatly from the baseline dataset that led to the model parameters. However, for thepurpose of dose optimization it is sufficient that the use of the model can guide the optimizationtowards favorable dose distributions.
Another aspect of plan optimization is that the figure of merit has to address the inevitablevariability of patient geometries and resultant dose distributions in a population. In this regardmultiple DV criteria for a single organ may become problematic as they need to be given anindividual priority and ideally ought to be combined into a single figure of merit to avoid ambi-guities. In contrast, biologically related models have the potential to provide an inherent priori-tization of multiple DV criteria incorporated in a single figure of merit. The single parameter fororgan dose optimization when gEUD is used has been demonstrated by Wu et al. (2003) forhead and neck and prostate sites and by Mihailidis et al. (2010) for breast and chest wall sites.
The optimization with cost functions based on the EUD concept, commonly used in theavailable BBTPSs, is straightforward and numerically expedient (Romeijn et al. 2004; Alberand Reemtsen 2007).
III.A.2. Precautions for Using Biological Models in Plan Optimization
As most of the currently available BBTPSs use EUD/gEUD-based optimizations, we mainlydiscuss the concerns with EUD here. With respect to optimization, the DV effect incorporatedby a EUD-based model is of paramount importance. For example, the assumption that a normaltissue responds in serial manner leads to lack of control over the low- and mid-dose range, as therisk of complications is predominantly determined by the high doses. Conversely, if a parallelbehavior is assumed, hot spots are allowed but large volumes to lower doses are undesirable. Ina worst-case scenario, a serially responding complication would be assumed to behave in a par-allel fashion. Plan optimization may then be steered towards allowing clinically unacceptablehot spots. If in doubt, one should always maneuver intentionally towards a smaller volumeeffect, as this will put a limit on both the size and the dose of hot spots in normal tissues dur-ing plan optimization.
THE USE AND QA OF BIOLOGICALLY RELATED MODELS FOR TREATMENT PLANNING

14
The gEUD models for serial response do not give rise to local minima of the optimizationproblem (Choi and Deasy 2002). On the other hand, it cannot be ruled out that gEUD modelsfor parallel response create local minima, though due to their generally less pronounced nonlin-earity, this risk is less than that for DV objectives. Although gEUD itself is convex for a ≥ 1 (Choiand Deasy 2002), any cost function formulated as a product of nonlinear gEUD/TCP/NTCPmodels is subject to violating the convex or quasi-convex properties of the underlying biologicalmodels (Romeijn et al. 2004). Two examples include the probability of complication-free tumorcontrol, P+ (Källman et al.1992a), and the product of sigmoid functions based on gEUD (Wu etal. 2002). Although the clinical significance of local minima remains to be seen (Wu and Mohan2002), from a mathematical point of view inappropriate choice of the cost function for plan opti-mization may result in multiple local minima, which diminishes the theoretical advantages ofusing biological-model–based cost functions.
Direct maximization of biological indices for targets (e.g.,TCP or gEUD) is known to pro-duce highly inhomogeneous target dose distributions (de Gersem et al. 1999; Wu et al. 2002)because TCP is increased by the creation of hot spots and using TCP alone does not penalize hotspots. Thus, one must consider limiting planning target volume (PTV) dose inhomogeneity or atleast constraining the hot spots to the gross tumor volume (GTV) or clinical target volume(CTV). This can be achieved by adding physical maximum-dose cost functions to optimizationcriteria for target volumes. Alternatively, the hot spots in target volumes can be controlled usingbiological cost functions assuming serial response by treating the targets as both tumors and“hypothetical” normal tissues (Wu et al. 2002).
Another challenging issue is to use a biologically related model for a fractionation schemethat is very different from the scheme under which the model was derived. Applying modelparameters that were derived for a conventional fractionation scheme to the optimization of ahypofractionated treatment (e.g., stereotactic radiosurgery [SRS] or SBRT) is especially haz-ardous. In the absence of clinical data to provide guidance, this task group advises adjustingparameters (DV or biological) to steer critical organ doses into a dose volume zone that is provento be safe clinically. Examples of such safety zones are provided in the reports from the recentQUANTEC initiative (QUANTEC 2010) and from the TG-101 report (Benedict et al. 2010).
III.A.3. Strategies for Effective Use of Biological Models in Plan Optimization
For plan optimization using biologically related models, two rival, yet complementary, conceptsare the EUD and TCP/NTCP models. In one sense, the difference between EUD-based modelsand TCP/NTCP models is irrelevant, because every TCP/NTCP model can be converted into anEUD model (find the dose which results in the equivalent probability if applied to the wholevolume) and vice versa (choose a suitable sigmoid wrapper function which maps EUD onto theinterval [0, 1]). Note that this EUD does not need to be the same simple expression as the“gEUD.” Thus, TCP/NTCP models are not essential and a EUD-based formalism represents themost basic form of expressing a biologically related cost function for plan optimization (Romeijnet al. 2004; Alber and Reemtsen 2007).
To optimize a plan based on biological models, multiple EUD-dependent goals can be com-bined to a weighted combination that defines the composite cost function for the optimizationalgorithm. These biologically related goals usually need to be supplemented by any number of
AAPM REPORT NO. 166

15
physical goals that would ensure certain properties deemed clinically desirable by a treatingphysician. For example, a limit on hot spots in the target volume is usually motivated by estab-lished clinical practice rather than rigorous biological considerations. Furthermore, there may bebiological goals in normal tissues for which no dose-response model exists, for example the over-all conformity of the dose to the target volume. All of these cost functions can be combined inoptimization, although how this is implemented is determined by the TPS.
It can be beneficial to treat EUD-based cost functions as hard constraints because they aredirectly associated with control/complication risks. On the other hand, the definition of EUDallows for a certain freedom in shaping the dose distribution. Therefore, EUD constraints areless restrictive than multiple DV constraints and offer an inherent trade-off between differentdose levels, allowing controlled violations for some DV constraints while overfulfilling otherconstraints to generate an overall better dose distribution.
Although each biologically motivated cost function incorporates a specific volume effect andthus favors a certain shape of the dose distribution, the result of an optimization depends on acomplex interplay of all participating terms of the cost functions. For this reason, it is essentialthat the treatment planner understand which traits of a dose distribution are controlled by thechosen cost function terms and which traits are merely coincidental. It is helpful to visualize theaction of an EUD-based model on a DVH as a set of connected DV objectives whose weightgrows in a specific fashion. For a cost function term assuming serial response, the weight ofthese virtual DV objectives grows with dose [Figure 1(a)]. The smaller the volume effect, themore rapidly the weight of these objectives grows. For a cost function term assuming parallelresponse, their weight should tend to zero for very high doses and reach a maximum around themid-dose range [Figure 1(b)].
The best measure against the hazards of using biologically motivated cost functions is tounderstand their effect on the dose distribution and to know the desirable properties of the final
THE USE AND QA OF BIOLOGICALLY RELATED MODELS FOR TREATMENT PLANNING
Figure 1. Weights of “virtual” DV objectives representing the same volume effect as a serial-type costfunction (a) or a parallel-type cost function (b).

16
dose distribution. The overall dose distribution derived from such an optimization should becarefully inspected; one should not rely purely on DVH metrics. Each desired goal should bereflected by a specific cost function term, which should be chosen to be capable of controllingthis particular property of the dose distribution sufficiently. Thus, the task of setting up abiologically related optimization problem becomes, in the order of increasing importance:(1) choice of sufficient cost functions; (2) choice of right types of cost functions; (3) choice ofright volume effect parameters; and (4) clear idea of what features make a dose distributionacceptable or unacceptable in your clinic. For example, an organ like spinal cord, for whichthe maximum dose is considered to have the highest priority, is ideally modeled by gEUD witha >> 1. This kind of model is very sensitive to high doses while it is very insensitive to low andintermediate doses. Clearly, this kind of behavior is not sought for organs like lung, where theprimary objective is to spare sufficient lung volume from intermediate doses while controllingthe maximum dose is only of secondary importance. Here, a gEUD model with a smaller avalue or a parallel complication model is a better choice, but one has to be aware that this typeof model does not control the maximum dose. In order to achieve this, it needs to be comple-mented with either a second gEUD model with a greater parameter a value or a maximum doseconstraint. Notice that, in this example, the two models represent two types of complication con-trol with different volume dependency: one aiming to control volume-related complications likepneumonitis and loss of lung function, while the other trying to manage more local complica-tions like destruction of large blood vessels or even necrosis.
III.A.4. Effects of DVH Computation Inaccuracies and Statistical Uncertaintieson Plan Optimization Using Biological Models
Biologically based models that use more pronounced nonlinear functions than DV functionstend to amplify the effects of any uncertainty in the dose and/or DVH computation. For exam-ple, the EUD can be calculated directly from the DVH. Depending on the implementation of theTPS, a DVH may be more than just the straightforward statistics of the voxel doses of an organ.Thus, EUD computed directly from the dose calculation grid and from the DVH may differ.Further, all issues associated with the computation of a DVH, such as voxelization, interpolation,binning, and volume normalization, affect the computation of EUD. If the uncertainties are ran-dom and not systematic in nature, the EUD error will usually tend to be on the safe side, i.e.,normal tissue EUD will be overestimated while target EUD will be underestimated. This is aconsequence of the positive curvature of the most common EUD implementations (with theexception of the gEUD for parallel complications). These TPS-related sources of error can betaken into account in practice, if a number of treatment plans that were considered safe are ret-rospectively evaluated with the EUD models intended for future dose optimization.
A special case of EUD estimate bias arises if the dose distribution is calculated with MonteCarlo methods. Here, the statistical uncertainty of the dose translates into a systematic error ofEUD (Kawrakow 2004), which grows with the magnitude of the noise in the dose. For lowstatistical uncertainties (total dose ≤ 1%) this error can be corrected precisely. EUD calculatedwithout this correction from a Monte Carlo dose grid may differ from the values based on DVH.Therefore, low statistical uncertainties, preferably <1% of the total dose, are desirable in theMonte Carlo–calculated dose distribution.
AAPM REPORT NO. 166

17
III.B. BIOLOGICAL MODELS IN PLAN EVALUATION
III.B.1. Advantages of Biological Models over DV Evaluation Criteria
As with plan optimization, either EUD or TCP/NTCP models can be used for biologically basedplan evaluation. Although both concepts can be used interchangeably for plan optimization, theEUD has the advantage of fewer model parameters, as compared to TCP/NTCP models (sec-tions II, III.A.3) and allows more clinical flexibility. The proper calibration of a TCP/NTCPmodel requires monitoring the outcomes for a large number of patients. In contrast, EUD mod-els can rank a number of treatment plans without having to quantify the actual tumorresponse/complication risk as long as the chosen parameters (a in the case of gEUD) are cali-brated to give reasonable results for clinical plans for which the treatment outcomes are known.An EUD model can be calibrated against the past clinical practice of any institution simply bycalculating the previously applied distribution of EUD values. This establishes a reference rangeof EUD values that were considered acceptable in the past. Studies along this line have beenreported (for example, Wang and Li 2003; Mihailidis et al. 2010).
Thus a properly calibrated EUD model has the potential to provide a reliable ranking of rivalplans and is most useful when a clinician needs to select the best plan from two or more alter-natives. Of course, it is essential that the clinician understands the prior calibration process andis willing to consider biological evaluation. The utility of EUD for evaluating a single plan islimited. In contrast, properly calibrated TCP/NTCP models can provide direct estimates of out-come probabilities, which are more clinically meaningful than the EUD. If these estimates arewithin the clinician’s goals, the treatment plan under consideration can be accepted without hav-ing to explore other possible plans. The disadvantage of TCP/NTCP models is that they requiremore parameters (most commonly three) and more effort for their calibration as compared to theEUD (one parameter for gEUD [Eq. (1)] and the simplest form of cEUD [Eq. (A1)]). Similar toan EUD model but with more importance, a TCP/NTCP model derived from the experience ofother institutions (different TPS, dose calculation, patient population, dose fractionation, etc.)must be applied with extreme caution.
Use of DV criteria (or EUD alone) for plan evaluation implies a binary outcome, i.e., aneffect occurs if a DVH passes above a certain point in DV space, and does not occur in theDVH passes below. Such threshold-like behavior of tumor control/complication risk is a roughapproximation of actual biological processes. In contrast, biological evaluation metrics in theform of TCP/NTCP provide continuous estimates of outcome probabilities. Also, consider a casewhen multiple DV points are used to evaluate a dose distribution in a particular organ. It mighthappen that the dose distribution passes the evaluation test for some points and fails for others,requiring the treatment planner/radiation oncologist to prioritize different DV criteria. Biologicalmetrics may be advantageous in such situations because they can weigh various DV criteria andcan condense them into a single unambiguous estimate of biological outcome, as demonstratedby Wu et al (2003).
Some mechanistic biological models [e.g., Eq. (B1)] directly incorporate terms describingradiosensitivity as a function of dose per fraction. If properly calibrated using the data clinicallyapproved for a range of fraction sizes, these models implicitly take into account the dose perfraction effects and can be used to predict outcomes of different fractionation schemes. DV cri-teria, on the other hand, apply to a single fraction size for which their efficacy has been tested.
THE USE AND QA OF BIOLOGICALLY RELATED MODELS FOR TREATMENT PLANNING

18
If the standard fractionation scheme is significantly altered, DV-based prescription/normaltissue constraints need to be explicitly modified based on clinical experience and/or isoeffectcalculations (section II.C).
III.B.2. Precautions for Using Biological Models in Plan Evaluation
In contrast to the use of biological models in plan optimization, where biologically based costfunctions are only required to capture the correct volume effect and to steer dose distributionsin a desired direction, the use of biological models to replace DV criteria in plan evaluationrequires clinically realistic correct plan ranking and/or outcome estimates. To evaluate a partic-ular plan (not just plan ranking), accurate TCP/NTCP models and parameter estimates becomeabsolutely essential. It is also essential that the models used be applied retrospectively to makesure that they agree with the treatments that you know to be safe and effective in your practice.Whether the problem lies in the abstract model or its implementation in TPS, such a realitycheck is necessary before using a model for clinical plan evaluation. As it is desirable to incor-porate outcome data in the treatment planning process, two options exist for using biologicalmodels in plan evaluation. The users can derive TCP/NTCP model parameters based on theirown experience by calibrating selected model(s) against observed clinical outcomes. Thisapproach has the potential to yield the most reliable data directly reflecting the practice adoptedat a particular institution. Furthermore, initial parameter estimates can be easily refined as addi-tional follow-up data become available. However this method may not be feasible for many smalland even mid-sized institutions, as it requires expertise in outcome modeling, sufficient patientthroughput, and substantial time commitment.
Another option is to cautiously use published parameter values. Published data are availablefor many tumor sites and complication types (sections II.E and II.G), affording the user a vari-ety of choices. However, this approach is fraught with significant risks if published parametersets are applied injudiciously without following the same practices that were used to generate theoriginal data (e.g., Ten Haken et al. 2006). Caution should be exercised if clinical and demo-graphic characteristics of the patient population under evaluation differ substantially from thosein the original patient cohort used to derive published parameter estimates. The reason is thatadditional variables influencing the outcome, which were not present in the original population,may be present in the evaluated patient population (e.g., Koh et al. 2006). When using publishedparameter estimates for plan evaluation, it has to be carefully verified that they apply to theappropriate endpoints, organ volume definitions, and fractionation schemes.
Most NTCP models do not include explicit description of dose-per-fraction effects in theattempt to minimize the number of parameters. Given this, whether one is using in-house orpublished data, parameter estimates can only be used to evaluate treatment plans correspondingto a narrow range of doses per fraction similar to the doses per fraction in the original patientpopulation. If the fraction size in a plan under evaluation is very different from that in thedataset used to derive parameter estimates, both sets of data should be normalized to the samedose per fraction, usually using the LQ formalism [Eq. (3)]. If the dose per fraction varies con-siderably in the patient cohort of which parameter estimates are being derived, it is reasonable tonormalize all doses to some standard fractionation scheme. Examples include LKB modeling ofliver (Dawson et al. 2002) and lung (Seppenwoolde et al. 2003) complications. These sets of
AAPM REPORT NO. 166

19
parameter estimates, obviously, work best for fraction-size corrected normal tissue DVHs.However, if these parameter values are used for non-corrected dose delivered with a conven-tional target fraction size (i.e., ~2 Gy per fraction), the fraction sizes for normal tissues aremuch less than 2 Gy and hence a model produces conservative overestimates of NTCP. Thisargument is reversed for hypofractionated delivery, and the model can significantly underesti-mate the risk of a complication (Xu et al. 2006). Even if the prescription fraction size isunchanged, the simultaneous use of an increasing number of beams/orientations (e.g. withmulti-field IMRT) reduces the dose per fraction in the exposed normal tissues away from the tar-get, compared to what they would have seen with a “conventional” plan with a limited numberof beam orientations used sequentially (e.g., AP/PA beams followed by opposed obliquebeams).
Whether self-derived or published parameter estimates are used, it is essential to standard-ize the organ volume relative to which the parameter is computed. For example, the EUD orNTCP for rectum and rectal wall will differ because the dose distributions in each volume dif-fer. The EUD or NTCP will also depend on the delineated length of rectum or rectal wall. Muchmore subtle is the computation of biological indices for the spinal cord, where either a standard-ized length has to be segmented (e.g., including all thoracic and cervical vertebrae) or theparameter is computed relative to a normalized volume. Care should be taken that for parallelorgans, whose response is correlated with the mean dose, the entire organ is included in theimage set and dose calculation grid.
Parameter estimates clearly should be used only with the model for which they werederived. In some cases, fits to more than one model are available for the same dataset. For suchsituations, it has been observed that different NTCP models often provide different answers toimportant clinical problems (Zaider and Amols 1998; Moiseenko et al. 2000; Muren et al.2001). It is generally not possible to determine which model is right based on observing fits toclinical data (Moiseenko et al. 2000). To resolve this situation and to ensure further progress inthe use of biological models for plan evaluation, concerted efforts to select the most practicalmodels and to create databases of parameter estimates are urgently needed. Such sets of data(e.g., the QUANTEC initiative, section II.G), being supported by experts in TCP/NTCP mod-eling, will provide a strong basis for TPS manufacturers to include biologically based evalua-tion tools in their products.
In general, biological figures of merit for target volumes require much less considerationsince their utility for outcome prediction is frequently limited by uncertainties of individualtumor biology. Also, current clinical practice demands homogeneous doses to the PTV, whichusually includes a large share of normal tissue, while a TCP figure can only be meaningful forthe GTV or CTV. It is important to understand which aspects of a target dose distribution influ-ence the TCP. Various investigators have demonstrated using the Poisson-based model with inter-patient heterogeneity [Eq. (B3)] that even very small cold spots may considerably decrease theTCP, whereas the hot spots only affect the TCP to a great extent if the volume of the hot spot islarge (Sanchez-Nieto and Nahum 1999; Tomé and Fowler 2000, 2002).
Available sets of TCP parameter estimates are less consistent than NTCP parameters in thesense that different analyses use somewhat different assumptions when deriving model parame-ters, e.g., fixed number of clonogens vs. fixed clonogen density, inclusion or exclusion of thetime factor, etc. Strictly speaking, it is incorrect to apply parameters derived using one set of
THE USE AND QA OF BIOLOGICALLY RELATED MODELS FOR TREATMENT PLANNING

20
assumptions to even a slightly modified model. This poses difficulties because users wishing tointegrate TCP calculations into their plan evaluation routine need to implement not only differ-ent models that were used to analyze data for different sites, but also different variations of thesame basic model. Large sets of TCP data compiled using uniform criteria are rare [e.g.,Okunieff et al. (1995)]. Efforts similar to QUANTEC are needed to summarize TCP data and toderive common sets of parameters for one or two models, which could then be built into com-mercial TPSs.
Finally, current clinical standards for acceptable treatment plans in external beam RT includecertain DV goals that are not readily transcribed using biological metrics, such as target doseuniformity and overall conformity of high-dose regions. These goals should be considered sep-arately when EUD/TCP/NTCP are used for plan evaluation.
IV. DESCRIPTION AND COMPARISON OF CURRENTLYAVAILABLE TREATMENT PLANNING SYSTEMSEMPLOYING BIOLOGICAL MODELS
Three commercially available and most commonly used TPSs that employ biological modelshave been selected to demonstrate the issues discussed above (section III). These three systems,presented in a chronological order based on their release times, are Monaco® V1.0 (CMS/Elekta,Maryland Heights, MO), Pinnacle® V8.0h (Philips Medical Systems, Andover, MA), andEclipse V10.0 (Varian Medical Systems, Palo Alto, CA). Each of these systems uses differentmodels and/or different implementation. Initial experiences for using the Monaco and Pinnaclesystems have been reported (Semenenko et al. 2008; Qi et al. 2009). Readers are referred to ven-dor-provided manuals or training for more detailed descriptions about these systems. Selectedsystem-specific issues are discussed. It should be noted that system upgrades may make someissues discussed below no longer relevant.
IV.A. CMS MONACO®
At the time this reported is written, the Monaco system (V1.0) does not offer a plan evaluationtool based on biological metrics. Only the plan optimization is discussed for this system.
IV.A.1. Plan Optimization Tools
The Monaco system is one of the first commercial IMRT treatment planning systems incorpo-rating biologically based optimization features. Monaco offers three biological cost functionstitled Poisson statistics cell kill model, Serial complication model, and Parallel complicationmodel to handle dose prescription for targets and OARs exhibiting serial and parallel behavior.Five physical cost functions are also supplied: Quadratic overdose penalty, Quadratic underdosepenalty, Overdose DVH constraint, Underdose DVH constraint, and Maximum dose constraint.Despite the presence of conventional DV-based cost functions, the system has been specificallydesigned to utilize biological models, and produces better plans when the biological optimizationfeatures are used to their full potential. The Poisson cell kill model has been made a mandatorycost function for targets. If there is a sole PTV, this function must be assigned to the PTV; addi-
AAPM REPORT NO. 166

21
tional physical cost functions may also be specified. In case of multiple PTVs, the Poisson cellkill model must be used to create optimization criteria for at least one of the PTVs.
The biological cost functions implemented in Monaco are based on a formalism developed atthe University of Tübingen (Alber and Nüsslin 1999; Alber 2000). For each of the three func-tions, a 3D dose distribution in a structure is reduced to a single index that reflects a putative bio-logical response of the structure to radiation. This index is referred to as isoeffect. For the Poissoncell kill model and Serial complication model, the isoeffect is expressed in units of dose. For theParallel complication model, the isoeffect is a percentage of the organ that is damaged. Dose orpercentage levels specified by the user as optimization goals are referred to as isoconstraints.Following each iteration, isoeffects are recomputed and compared with isoconstraints to deter-mine whether user-specified criteria have been met.
Isoeffects for targets (i.e., the Poisson cell kill model) are calculated as
(17)
where a ′ is the average cell sensitivity, r ′ is the average clonogen density, V is the total volumeof the organ (i.e., number of voxels), and is a biological response function given by
(18)
where is the local density of clonogenic tumor cells, is the cell sensitivity in a par-ticular voxel, and is the absorbed dose in this voxel. Equations (17) and (18) are ready toaccommodate information about spatially heterogeneous clonogen density and/or clonogenradiosensitivity that will become available in the future, pending advances in biological imagingtechniques. However at present, spatial variations in either clonogen density or cell sensitivityare not taken into account, i.e., and Parameter r ′ has been hard-coded to106 clonogens per voxel and presently its value has no impact on isoeffect calculations because
in Eq. (18) and r ′ in Eq. (17) cancel out. Parameter a ′ takes on user-specified valuesin the range 0.1 to 1.0 Gy–1 with a default value of 0.25 Gy–1. Equation (18) represents a sim-plified (only linear component of cell killing is taken into account) expression for the numberof surviving clonogens in a voxel based on the standard Poisson statistics-based TCP model[Eq. (B1)]. Equation (17) is an inverted form of Eq. (18) and conceptually represents the equiv-alent uniform dose (section II.A).
Isoeffects for serial-type OARs are specified in terms of an effective dose given by
(19)
where k is the volume effect parameter, V is the total number of voxels, and a response functionapplied to each voxel takes the form
(20)g D x D xkr r( )( ) = ( ) .
DV
g D x dxeff V
k
= ( )( )
∫
1 31r
,
ρ rx( )
ρ rx( )
α αrx( ) ′; .ρ ρr
x( ) ′;
α rx( )f D x x x D x
r r r r( )( ) = ( ) − ( ) ( ) ρ αexp ,
f D xr( )( )
DV
f D x dxeff V= −
′ ′( )( )
∫
1 1 3
α ρln ,
r
THE USE AND QA OF BIOLOGICALLY RELATED MODELS FOR TREATMENT PLANNING
D xr( )

22
Combination of Eqs. (19) and (20) is mathematically equivalent to the gEUD formula (sec-tion II.A) with k � a. Deff approaches maximum dose as k increases.
Although the Serial complication model with k = 1 may be used to handle situations whenmean organ dose needs to be controlled, i.e., for parallel-type structures, Monaco provides anadditional cost function for this purpose. Isoeffects for the Parallel complication model are com-puted in terms of the mean organ damage:
(21)
where V is the total number of voxels and a voxel response function h is calculated as
(22)
where d0 is referred to as the reference dose, i.e., a dose that results in 50% complication rate,k is the power-law exponent, which determines the steepness of the sigmoid curve described byEq. (22). As a rule of thumb, one may choose k = 0.15 Gy–1 × d0 (Alber and Belka 2006). Whenexpressed as a fraction rather than a percentage, the mean organ damage is mathematicallyequivalent to the fdam concept of the parallel complication model (appendix C). Properties of bio-logical cost functions employed in Monaco are summarized in Table I. Limits imposed onparameter or isoconstraint values are shown in parentheses. Because the Poisson cell kill modeldoes not include a mechanism to control hot spots in target volumes, a physical cost function,either the Quadratic overdose penalty or Maximum dose, must be added to create optimizationgoals for target volumes. In our practice, it has always been possible to design good quality treat-ment plans using the three biological functions listed in Table I and the Quadratic overdosepenalty cost function (Semenenko et al. 2008).
h D xd
D x
kr
r( )( ) = + ( )
−
1 0
1
,
vV
h D x dxeff V= × ( )( )∫100
1 3% ,r
AAPM REPORT NO. 166
Table I. Biological Models Used for Treatment Plan Optimization in CMS Monaco.
Structure Objectives/Type Name Parameters Constraints Comments
Target Poisson statistics Cell sensitivity Prescription Mandatory cost functioncell kill model (0.1–1.0 Gy–1) (1–150 Gy) for targets; no penalty
for hot spots
OAR Serial Power-law Equivalent Effective for controllingcomplication exponent (1–20) uniform dose maximum organ dosemodel (1–150 Gy)
OAR Parallel Reference dose Mean organ Effective for controllingcomplication (1–100 Gy) damage mean organ dosemodel Power-law (1%–100%)
exponent (1–4)

23
Monaco supports the concept of constrained optimization. That is, the two biological costfunctions used for OARs and all physical cost functions are treated as hard constraints. All opti-mization criteria specified using these cost functions will be met by the TPS. The Poisson cellkill model is only an objective, meaning that the system finds the optimal cell kill subject tosatisfying the hard constraints. As a result, the treatment planner does not have to specifyany weights, i.e., effectively all cost functions except the Poisson cell kill model are assignedinfinitely large weights. Because target dose is only an objective, achieving this objective mayoften be limited by one or more constraints on dose in nearby OARs or constraints on hot spotsin target volumes. A Sensitivity Analysis tool (Alber et al. 2002) is provided to help the plannerto identify the limiting constraints. Desired target coverage could then be obtained by relaxing(increasing) isoconstraint values for the restrictive cost functions.
In addition to primary biological constraints for OARs (i.e., Serial and Parallel complicationmodels), Monaco allows specification of secondary optimization objectives with these functions.This is referred to as the “Multicriterial option.” This option could be used to attempt to furtherreduce OAR doses when adequate target coverage had already been achieved or in special caseswhen additional OAR sparing is more important than adequate target coverage, such as re-treat-ments for recurrent tumors.
IV.A.2. Parameter Sensitivity
The impact of changing Monaco parameters/isoconstraints (Table I) on optimized dose distri-butions is demonstrated using a test head & neck (hypopharynx) case planned with a 6 MVseven-field IMRT (Figure 2). Only one parameter or isoconstraint at a time was changed.Figure 2(a) shows the result of changing cell sensitivity for PTV 70 from the default value of0.25 Gy–1 to maximum and minimum allowable values of 1.0 and 0.1 Gy–1, respectively. Thisparameter has a small effect on minimum dose in PTV 70, with greater values of cell sensitiv-ity corresponding to larger minimum doses: 60.4 Gy for cell sensitivity of 0.1 Gy–1, 62.5 Gyfor 0.25 Gy–1, and 65.7 Gy for 1.0 Gy–1. Because the Poisson cell kill model is only an objec-tive, changing prescription dose for PTV 70 without any changes in dose-limiting constraintsdoes not affect target DVHs (data not shown). Behavior of the Serial complication model hasbeen investigated on an example of spinal cord planning organ-at-risk volume (PRV), whichwas defined as 5-mm expansion around the spinal canal. Increasing power-law exponent param-eter or decreasing EUD isoconstraint for the Serial complication model applied to the spinalcord PRV results in lower maximum doses for the cord accompanied by some deterioration intarget coverage [Figures 2(b) and 2(c), dashed lines], and vice versa [Figures 2(b) and 2(c),dotted lines]. Changing power-law exponent parameter for the Parallel complication modelapplied to the parotid gland from a 3.9 value suggested in Monaco reference documentation tothe lowest allowed value of 1.0 [Figure 2(d)] does not result in any discernable trend. Smallerreference dose [Figure 2(e)] or mean organ damage [Figure 2(f)] values in the Parallel compli-cation model lead to lower mean doses to the parotid gland. In the example chosen, reducingthe reference dose or mean organ damage for the left parotid gland results in substantial spar-ing of that gland with no deterioration of target coverage. However, mean dose to the otherparotid gland somewhat increases (not shown).
THE USE AND QA OF BIOLOGICALLY RELATED MODELS FOR TREATMENT PLANNING

24
IV.B. PHILIPS PINNACLE®
IV.B.1. Plan Optimization Tools
Pinnacle3 (V8.0h) offers biological optimization features incorporated into its P3IMRT inversetreatment planning module. The biological objective functions have been developed byRaySearch Laboratories AB (Stockholm, Sweden) (Härdemark et al. 2004). As opposed toMonaco, Pinnacle is not a designated biologically based optimization system, but rather uses bio-logical cost functions to enhance the traditional, DV-based optimization approach. In addition toa number of DV cost functions (Min dose, Max dose, Uniform dose, Min DVH, Max DVH, andUniformity), Pinnacle has at its disposal three biological cost functions denoted Min EUD,Target EUD, and Max EUD. These cost functions are defined as (Härdemark et al. 2004):
(23)F EUD EUD EUDEUD EUD
EUD( ) = ( ) −
θ , ,00
0
2
AAPM REPORT NO. 166
Figure 2. Sensitivity of dose distributions obtained with CMS Monaco to changes in parameters or iso-constraints. Solid lines show base plan DVHs; dashed and dotted lines show DVHs obtained by varyingeach parameter/isoconstraint in either direction from its base value. For clarity, only DVHs for anaffected OAR (spinal cord PRV or left parotid gland) and for target volumes (PTV 70, PTV 54, andPTV 50) are shown.

25
where EUD0 is the desired dose level specified by the user. Actually attained dose, EUD, is com-puted according to the gEUD formalism (section II.A). Function q is defined as
(24)
where H is the Heaviside step function.Properties of biological cost functions implemented in Pinnacle for the purpose of plan opti-
mization are summarized in Table II. Each function requires specification of a single volumeparameter, a, which has the same interpretation as described by Niemierko (1999). For negativea values, cold spots influence EUD to a greater extent, and for positive a values, EUD is mostinfluenced by hot spots. Generally, negative a values are an appropriate choice for targets, posi-tive a values should be used for serial structures, and a = 1 should be used for parallel structures.Biophysically meaningful ranges of the volume parameter for a corresponding cost function areshown in parentheses in Table II. However in contrast to Monaco, Pinnacle does not impose anylimits on values of the volume parameter or EUD.
Pinnacle employs the traditional unconstrained optimization approach. Target and OAR costfunctions contribute to the overall cost function in proportion to user-specified weights. Also forany cost function (with the exception of the Uniformity, which can only be used as a constraintand the Uniform dose, which can only be used as an objective), a treatment planner has anoption to use it as either an objective or constraint. The latter effectively sets a very high penaltyfor violating an optimization goal specified using this cost function.
Philips Pinnacle allows a gradual transition to biologically based inverse planning throughcombining conventional DV-based and novel EUD-based cost functions. Especially for targets,it is advised to supplement EUD-based objectives with DV-based ones to better control targetdose distributions (Härdemark et al. 2004; Wu et al. 2003).
THE USE AND QA OF BIOLOGICALLY RELATED MODELS FOR TREATMENT PLANNING
θ EUD EUD
H EUD EUD EUD
E, 0
0
1( ) =−( ) for Max
for Target UUD
H EUD EUD EUD0 −( )
for Min
,
Table II. Biological Models Used for Treatment Plan Optimization in Philips Pinnacle.
Structure Objectives/Type Name Parameters Constraints Comments
Target Min EUD Volume EUD Penalizes for too lowparameter (a < 1) (Gy or cGy) EUD
Target Target EUD Volume EUD Penalizes for anyparameter (a < 1) (Gy or cGy) deviation from the
desired EUD
OAR Max EUD Volume EUD Penalizes for too highparameter (a ≥ 1) (Gy or cGy) EUD; can be used with
both serial and parallelstructures

26
IV.B.2. Plan Evaluation Tools
Pinnacle provides two separate tools, titled NTCP/TCP Editor and Biological Response panel,for plan evaluation with the help of biological models. The NTCP/TCP Editor is used to obtainNTCP and TCP estimates. NTCP is calculated according to the LKB model (Eqs. 13–15). Adatabase of model parameters originating from Burman et al. (1991) is available, and a user isgiven the option to customize parameter values. TCP is calculated using an empirical sigmoidcurve corresponding to the CDF of the normal distribution. Users are responsible for specifyingtheir own estimates of two model parameters describing dose to control 50% of tumors, D50, anda measure of a slope of the sigmoid curve, m.
Users licensed for Biological Evaluation may take advantage of an enhanced plan evaluationtool that includes a database of endpoint- and tumor stage-specific parameter values (accompa-nied by literature references) for calculation of NTCP and TCP, capability to compare alternatetreatment plans side-by-side, graphical representation of NTCP/TCP for individual structures,and composite estimates of NTCP, TCP, and probability of complication-free tumor control forthe entire plan. Models and parameter estimates implemented in the Biological Response panelare based on the expertise collected at the Karolinska Institute and Stockholm University (Lindet al. 1999; Kåver et al. 1999). The Källman s-model, also known as the relative seriality model[Eq. (16)], is used to calculate NTCP. The Poisson model with LQ cell survival [Eqs. (6)–(8)] isused to describe response of the entire organ to uniform irradiation. TCP is calculated with thePoisson model [Eqs. (5)–(8)]. The majority of default parameter values provided for NTCP cal-culations come from a Ph.D. thesis (Ågren 1995), which is not readily available in the open lit-erature. Given the publication date, the parameter estimates were likely obtained by refitting therelative seriality model to the Emami et al. (1991) data. Default values of D50 and g provided forTCP calculations are taken from old literature dating back to the 1960s, with the most recentreport being from 1993. Both TCP and NTCP parameter databases are customizable, but thechoice of models is fixed. The models used for biological plan evaluation in Philips Pinnacle aresummarized in Table III.
IV.B.3. Parameter Sensitivity
Sensitivity of dose distributions obtained with Pinnacle to changes in volume parameter (sameas power-law exponent in Monaco) or EUD (Table II) is shown in Figure 3 for the same head &neck case irradiated with the 6 MV beam. Optimization goals for PTV 70 were created usingthe Target EUD cost function combined with the Uniformity constraint. Variations in the volumeparameter specified with Target EUD cost function have very small effect on PTV 70 DVH[Figure 3(a)]. Minimum dose to PTV 70 slightly increases as the volume parameter decreases:62.1 Gy for a = 50, 62.4 Gy for a = –10, and 64.6 Gy for a = –50. Increasing the EUD forPTV 70 has an effect of shifting the DVH toward higher doses [Figure 3(b)]. Increasing thevolume parameter for the Max EUD cost function applied to the spinal cord PRV from 12 to20 results in the reduction of maximum dose to the cord and some deterioration of target cov-erage [Figure 3(c)]. Decreasing the volume parameter from 12 to 1 has little, if any, effect on thedose distributions. Maximum dose to the cord decreases as the EUD value specified for the MaxEUD cost function is decreased [Figure 3(d)]. Minimum dose in a PTV closest to the spinal cordPRV (PTV 54 in this example) also decreases in proportion to the EUD for the cord. Similar
AAPM REPORT NO. 166

27
THE USE AND QA OF BIOLOGICALLY RELATED MODELS FOR TREATMENT PLANNING
Table III. Biological Models Used for Treatment Plan Evaluation in Philips Pinnacle.
Structure Parameters/Tool Type Name/Description Inputs Comments
NTCP/TCP Target Empirical TCP model D50, m Sigmoid curve representedEditor by the CDF of the normal
distribution
OAR Lyman-Kutcher model D50, m, n Database of modelparameters is provided
Biological Target Poisson/LQ-based D50, g, a /b Database of modelResponse TCP model parameters is providedPanel OAR Källman s-model D50, g, a /b, Database of model
seriality (s) parameters is provided
Multiple Composite TCP TCP fortargets individual targets
Multiple Composite NTCP NTCP forOARs individual OARs
Targets Probability of Composite TCP,and complication-free composite NTCPOARs tumor control
TCP TCP= ∏ ii
NTCP NTCP= − −( )∏1 1 ii
P+ = −( )max ,TCP NTCP 0
trends were observed for the Max EUD cost function applied to the left parotid gland, i.e.,increasing the volume parameter or decreasing the EUD reduces dose to the parotid gland andcreates cold spots in adjacent target volume (PTV 54). Decreasing the volume parameter orincreasing the EUD slightly increases dose to the parotid gland with virtually no effect on targetcoverage [Figures 3(e) and 3(f)].
IV.C. VARIAN ECLIPSE
IV.C.1. Plan Optimization Tools
Eclipse (V10.0) provides biological optimization through the use of a “plug-in” to an applicationby RaySearch Laboratories (Stockholm, Sweden). Selecting biological optimization transfers allpatient and plan information to the application for fluence optimization with a separate rapid cal-culation algorithm. The optimized fluences are then returned to the Eclipse dose engine for thefinal dose calculation.
The optimizer differentiates between biological and physical functions used in the optimiza-tion. The biological models used in the optimization include TCP Poisson-LQ, NTCP Poisson-LQ, and NTCP Lyman, and are tabulated in Table IV. The TCP Poisson-LQ and NTCPPoisson-LQ models are identical, respectively, to the TCP and NTCP models implemented in theBiological Response panel in Pinnacle. The NTCP Lyman model is the LKB model calculatedbased on an LQ-corrected DVH [Eq. (3)]. This model is thus somewhat different from the“Lyman-Kutcher” model in the NTCP/TCP Editor in Pinnacle, which does not take an extra a /b

28
parameter and is calculated based on non-corrected DVHs. The models allow specification ofrepair time for NTCP models and repair/repopulation times for TCP. The biological functionsallow the user to specify the weight (Constraint Bound Percentage) used in calculation of thecost function. Physical functions do not allow assignment of a weight but are regarded as con-straints that cannot be compromised. Physical functions include: maximum dose, maximumdose for percentage structure volume, maximum gEUD, uniformity. For structures defined astargets one may additionally define minimum values for dose, dose for percentage of structurevolume, and gEUD. Each structure may also have a conformity constraint that specifies the dosegradient near to the structure.
A library of tissue-specific parameter values for the TCP and NTCP models is provided,enabling selection of standardized values within the Biological Optimizer application. Thelibrary may be edited and modified to include user-specified parameter sets and tissues.
The optimizer screen displays the evolution of items used to monitor and modify parametersused in optimization: optimization functions and parameter values, color wash of coronal and
AAPM REPORT NO. 166
Figure 3. Sensitivity of dose distributions obtained with Philips Pinnacle to changes in volume parame-ter (power-law exponent) or EUD. Solid lines show base plan DVHs; dashed and dotted lines showDVHs obtained by varying each parameter in either direction from its base value. For clarity, onlyDVHs for an affected OAR (spinal cord or left parotid gland) and for target volumes (PTV 70, PTV 54,and PTV 50) are shown.

29
sagittal views of the evolving dose distribution, beam fluence patterns, charts and tables ofevolving cost function values for each constraint, DVH, and a graph plotting sensitivity of thebiological response for a change in dose per fraction for constant total number of fractions. Dosedistributions from plans calculated in Eclipse may be specified to be used as a base dose fromwhich the optimization proceeds. During optimization the user iterates through addition andmodification of optimization functions to achieve the desired DVH characteristics or until theoptimization thresholds are reached.
IV.C.2. Plan Evaluation Tools
After a treatment plan has been generated in Eclipse, it may be evaluated using the BiologicalEvaluation Module. The same biological functions used in the optimizer may be used to calculate
THE USE AND QA OF BIOLOGICALLY RELATED MODELS FOR TREATMENT PLANNING
Table IV. Biological Models Used for Treatment Plan Optimization in Varian Eclipse.
Structure Objectives/Type Name Parameters Constraints Comments
Target Min EUD Volume EUD Penalizes for too lowparameter (a) (Gy or cGy) values; cannot be
weighted; listed underphysical functions
Target Max EUD Volume EUD Penalizes for high values;or parameter (a) (Gy or cGy) cannot be weighted;OAR listed under physical
functions
Target TCP Poisson-LQ D50, g, a /b, TCP Penalizes for smallseriality (s), values; can be weightedT1/2 for short vs.long repair time,% with longrepair time,repopulationtimes: Tpot andTstart
OAR NTCP D50, g, a /b, NTCP Penalizes for largePoisson-LQ seriality (s), values; can be weighted
T1/2 for short vs.long repair time,% with longrepair time
OAR NTCP Lyman D50, m, n, g, a /b, NTCP Penalizes for largeT1/2 for short vs. values of NTCP; can belong repair time, weighted% with longrepair time

30
NTCP and TCP values for structures. Evaluation of EUD is not supported in this module.Models used for plan evaluation are included in Table V.
The tool may be used to evaluate effect on NTCP and TCP values of changing fractionationschedules (e.g., twice vs. once per day), changing number of fractions or scaling total dose. Inaddition to the conventional DVH, two other graphs are available for plan evaluation. TheLQ-Scaled DVH utilizes the a /b ratio specified in the NTCP or TCP model to scale the DVHto equivalent values for 2-Gy fractions [Eq. (3)] as a standard benchmark for plan comparison.The Radiobiological Response graph shows the potential effect of altering total plan dose byplotting the value of NTCP or TCP versus a scale factor (0.7 to 3.0) for the total dose.
Since the RaySearch libraries are used in Pinnacle also, the general comments in sectionIV.B.2 on parameters are applicable to the Eclipse evaluation tools.
IV.C.3. Parameter Sensitivity
The sensitivity of DVHs to changes in model parameters, e.g., gEUD volume parameter (power-law exponent), or to threshold levels for the gEUD specified in the optimizer, were tested inEclipse in a similar way as that discussed for Monaco and Pinnacle. Results of these tests areillustrated in Figure 4. Optimization goals for PTV 70 were created with a maximum dose con-straint and a minimum EUD constraint, instead of a minimum dose constraint. The maximumdose constraint was selected over the use of a uniformity constraint since it provided more reli-ably consistent results. If only a gEUD constraint is used, without a max dose or uniformity con-straint, then the maximum dose in the PTV 70 volume rose to >100 Gy. This is consistent withthe discussion in section III.A.2, on the lack of sensitivity to hot spots for TCP and gEUD opti-mization constraints for target tissues. In the creation of the data in Figure 4, only one parame-ter was changed at a time. For example, Figure 4(a) shows the result of changing power-law
AAPM REPORT NO. 166
TableV. Biological Models Used for Treatment Plan Evaluation in Varian Eclipse.
StructureTool Type Name Parameters Comments
Biological Target TCP D50, g, a /b, seriality(s), User selectableEvaluation Poisson-LQ T1/2 for short vs. long parameters or from
repair time, % with database of modellong repair time, parametersrepopulation times:Tpot and Tstart
OAR NTCP D50, g, a /b, seriality(s), User selectablePoisson-LQ T1/2 for short vs. long parameters or from
repair time, % with database of modellong repair time parameters
OAR NTCP Lyman D50, m, n, a /b, User selectableT1/2 for short vs. long parameters or fromrepair time, % with database of modellong repair time parameters

31
exponent for PTV 70 from the default value of –10 to values of –1 and –50. It is seen fromFigure 4(a) that variations in DVHs for PTV 70, PTV 54, and PTV 50 were relatively insensi-tive to the magnitude of the volume parameter. V70 was 97.6, 98.5, 99.2, and 99.5% for a valuesof –1, –5, –10, –50, respectively. Figure 4(b) presents the result for varying gEUD for PTV 70that changes the DVHs for PTV 70 and PTV 54. Figure 4(c) demonstrates that larger values ofthe power-law exponent (a > 10) have similar effects on the DVHs, while the D50 for cord PRVwas 28, 25, and 25 Gy for a = 1, 12, and 20, respectively. Increasing the threshold for maximumgEUD shifted the cord DVH uniformly toward the threshold dose [Figure 4(d)]. Since theparotid abuts the target volumes, interaction of constraint on the normal tissue affecting the tar-get dose was noticeable. Sensitivity to the value of the power-law exponent was significant forDVH of the parotid [Figure 4(e)]. Values of V45 = 36, 22, and 16% for the parotid were obtainedfor a = 0.1, 1, and 5, respectively. Mean doses were similar for a = 1 and a = 5. The significantchanges in the DVHs for the target volumes (PTV 70, PTV 54, and PTV 50) were observed
THE USE AND QA OF BIOLOGICALLY RELATED MODELS FOR TREATMENT PLANNING
Figure 4. Sensitivity of dose distributions obtained with Varian Eclipse to changes in volume parameter(power-law exponent) or EUD for elected target and OARs. Solid lines show base plan DVHs; dashedand dotted lines show DVHs obtained by varying a parameter from its base value, for example,(a) changing the power-law exponent for PTV 70 as indicated by the headings. For clarity, only DVHsfor an affected OAR (spinal cord or left parotid gland) and for all target volumes (PTV 70, PTV 54, andPTV 50) are shown.

32
with the large volume parameter value (i.e., a = 5). Fixing the volume parameter at a = 1 forthe parotid and then varying the gEUD threshold increase or decrease the mean doses in theexpected direction [Figure 4(f)].
Constraints using NTCP and TCP values may also be used to shape the dose distribution.This is more complex owing to the number of input parameters and, in principal, produces sim-ilar results to gEUD constraints as outlined in section III.A.3. To obtain a clinically desirabledose distribution using NTCP- and TCP-based cost functions, it is often necessary to use param-eters for these functions quite different from those used to evaluate their value. For exampleusing a D50 much lower for optimizing the parotid dose can produce a better final dose distribu-tion than obtained using the same value of D50 used to evaluate the NTCP of the plan.
IV.D. COMPARISON OF CMS MONACO, PHILIPS PINNACLE,ANDVARIAN ECLIPSE SYSTEMS
IV.D.1. Comparison andVerification of EUD, NTCP, TCP, or P+Values Obtainedwith Pinnacle and Eclipse Systems
Both Pinnacle and Eclipse systems provide tools to calculate EUD, TCP, NTCP, or P+ (Table III)as plan evaluation metrics. To verify this calculation, selected metrics have been calculated man-ually and compared to the same quantities reported by Pinnacle and Eclipse. All work in this sec-tion has been performed using a benchmark case, which involves a single 6 MV, 20×20 cm2
photon beam incident on a sufficiently large cubical water phantom at 100 cm source-to-surfacedistance. A dose of 72 Gy in 40 fractions was prescribed to a point at 6 cm depth along the cen-tral axis. Four simple structures (3 rectangular, 1 triangular) were created inside the phantom[Figure 5(a)]. The DVHs for these structures look similar to those encountered in a typical plan[Figure 5(b)]. This case was chosen because it could be easily and reproducibly set up in anycommercial TPS, providing a simple, nearly identical input dose distribution for comparison ofbiological evaluation tools between different TPSs. Use of a percentage depth dose (PDD)-baseddose distribution and simple structures also facilitates spreadsheet-based, hand calculations ofDVH, TCP, and NTCP values for comparison. Details on the geometries of the structures in thebenchmark phantom are provided in Table VI.
In a DVH view page of the Pinnacle system, users can specify a value of the volumeparameter, a, for each structure, and the TPS will calculate and report gEUD in the region ofinterest ROI Statistics section in addition to physical quantities. By default, a = 1, and thereported gEUD is the same as the mean dose. Parameter a was varied in the range between–50 and 50, and gEUD values reported by the TPS for all four structures were recorded. Thesame gEUD values were then calculated on the spreadsheet based on DVHs exported fromPinnacle. Both sets of data agreed very well (<0.1%) for all combinations of the structure andvolume parameter.
To spot-check results reported in the Biological Response panel from Pinnacle, TCP calcula-tions were performed for two structures and NTCP calculations were performed for all fourstructures. Input parameters and calculated values are detailed in Table VII. Model parameterswere chosen from the included library so that resulting TCP and NTCP estimates are notequal to 0 or 1. All individual TCP and NTCP values and composite metrics (composite TCP,
AAPM REPORT NO. 166

33
THE USE AND QA OF BIOLOGICALLY RELATED MODELS FOR TREATMENT PLANNING
Figure 5. Benchmark case for verification of EUD, NTCP, TCP, and P+ calculations in Pinnacle. (a) Beamsetup and structures. (b) DVHs.

34
composite NTCP, and P+) reported by Pinnacle closely matched (<0.5%) the same quantitiescalculated on the spreadsheet using Eqs. [(5)–(8)] for TCP and Eqs. [(6)–(8), (16)] for NTCP. Aclose agreement (<1.5%) was also obtained between TCP and NTCP estimates reported byNTCP/TCP Editor (another tool in Pinnacle) and corresponding quantities calculated from theDVHs using Eqs. (13)–(15).
Similar calculations were performed using the evaluation tool in Eclipse with DVHs for thebenchmark phantom generated from Eclipse. The TCP/NTCP values obtained with Eclipse werefound to agree, within one percentage point, with those generated by Pinnacle (BiologicalResponse panel). For example, TCP/NTCP values for one of the rectangular structures were0.81/0.19 and 0.80/0.18 for Pinnacle and Eclipse, respectively.
AAPM REPORT NO. 166
TableVI. Details of Benchmark Phantom Structures.
Dimensions X coordinate Y coordinate Depth rangeStructure (cm) range (cm) range (cm) (cm)
PTV Rectangle 4 × 4 × 2 –2 to 2 –2 to 2 4 to 6
Rectangle 1 2 × 4 × 8 –2 to 0 –2 to 2 6 to 14
Rectangle 2 2 × 2 × 18 0 to 2 –2 to 2 6 to 24
Triangle 1 4 × 4 (base) × 20 0 × 0 –2 to 2 4 to 24at depth = 4–2 to 2
at depth = 24
TableVII. TCP and NTCP Values Calculated for DVHs Obtained in the Benchmark Phantom.Values for TCP and NTCP were calculated using a dose distribution calculated in the Pinnacle
system (section IV.D.1). Variability among institutions in reproducing the phantom and differencesin 6 MV photon beams will produce small inter-institutional differences in the calculated values.
PTV Rectangle PTV Rectangle Rectangle TriangleStructure Rectangle 1 Rectangle 1 2 1
D50 (Gy) 63.3 44.2 80 75.1 55.3 46
g 5 1.6 3 2.8 3.1 1.8
a /b (Gy) 10 10 3 3 3 3
Seriality N/A N/A 0.18 8.4 0.69 1
Function TCP TCP NTCP NTCP NTCP NTCP
Value (%) 94.1 80.3 26.6 18.1 23.5 29.5

35
The presence of two different tools to calculate TCP and NTCP in Pinnacle (BiologicalResponse panel and NTCP/TCP Editor) offers the user greater flexibility. The TCP model imple-mented in the NTCP/TCP Editor is not widely used in the literature, and a database of modelparameters is not provided, which is likely to steer users toward the Biological Response panelfor all TCP calculations. On the other hand, the LKB model implemented in the Editor is muchmore widely used than the Poisson-based NTCP model from the Biological Response panel. Forboth models, the origin of parameters included in the library can be traced to the organ toler-ance data of Emami et al. (1991). It is therefore reasonable to hypothesize that the NTCP mod-els in the Biological Response panel and NTCP/TCP Editor should provide similar estimates forthe same endpoint and dose distribution. To test that, structures and endpoints for NTCP calcu-lations in NTCP/TCP Editor were matched to those previously selected in the BiologicalResponse panel. The two tools produce somewhat different values of NTCP, with the Editor giv-ing smaller estimates for all structure/endpoint combinations. In one case, an NTCP estimateprovided by the Editor was smaller by a factor of 2 than the corresponding estimate from theBiological Response panel (25% vs. 50%). Users should be cautioned against using models andparameter estimates of unverified origin, if predicted TCP/NTCP values are to be used for makingclinical decisions. A similar warning statement is provided in the vendor’s user manual.Alternatively, users can input their own or other validated data using the tools provided in the TPS.
IV.D.2. Comparison of Plans Generated by Monaco, Pinnacle,and Eclipse Systems
Treatment plans for three representative test cases designed using CMS Monaco (V1.0), PhilipsPinnacle (V8.0h), and Varian Eclipse (V10.0) are compared in Figure 6. The head & neck planshown in Figure 6 is the same that was used for the sensitivity studies (sections IV.A.2 andIV.B.3). The gEUD values computed based on these DVHs for selected organs are tabulated inTable VIII. The gEUD values were calculated based on the power law [Eq. (1)] and the param-eter a used is included in the table. All Monaco plans resulted in substantially less homogeneoustarget dose distributions compared to the Pinnacle and Eclipse plans. This result is a conse-quence of the compulsory cell killing objective which penalizes small cold spots less drasticallythan physical minimum dose penalties and the practice of normalizing the treatment plans to theminimum dose in the target, not to equivalent target EUD (note that Monaco also allows usersto supplement the target EUD cost function with physical constraints). In terms of OAR sparing,the three TPS produced plans of similar quality for the head & neck case, with the exception ofthe spinal cord PRV dose in the Eclipse plan. In the prostate case, Pinnacle offers somewhat bet-ter sparing of the rectum at low and intermediate doses. It has been previously demonstratedthat one can use Monaco to generate plans with substantially better OAR sparing compared tothe plans designed using DV-based TPS XiO (Semenenko et al. 2008). The same trend has beenobserved for plans created in Pinnacle using biological vs. DV-based cost functions (Qi et al.2009), similar to those reported previously (Wu et al. 2002, 2003, 2005).
THE USE AND QA OF BIOLOGICALLY RELATED MODELS FOR TREATMENT PLANNING

36
AAPM REPORT NO. 166
Figure 6. DVHs for head & neck, prostate, and brain cases obtained using biologically based optimiza-tion features implemented in CMS Monaco (solid lines), Philips Pinnacle (dashed lines), and VarianEclipse (dotted lines).

37
THE USE AND QA OF BIOLOGICALLY RELATED MODELS FOR TREATMENT PLANNING
TableVIII. gEUD (Gy) Values Calculated Based on the DVHs for Three Sample Plansalong with the Parameter a Used.
Case Organs a Value Monaco Pinnacle Eclipse
Head & Neck PTV 70 –10 74.40 71.99 72.15
PTV 54 –10 59.59 61.04 59.01
PTV 50 –10 53.79 53.25 52.13
Cord PRV 20 27.19 27.77 39.91
Lt parotid gland 1 23.12 23.12 23.61
Rt parotid gland 1 20.57 23.05 23.11
Mandible 10 38.52 38.66 38.78
Prostate PTV 70.2 –10 73.61 71.77 71.41
Rectum 8 46.11 44.61 41.30
Bladder 8 43.21 43.00 45.79
Lt femoral head 12 14.76 20.09 18.21
Rt femoral head 12 16.86 18.43 13.90
Pubic bone 12 41.25 41.19 49.06
Brain GTV 54 –10 56.08 55.55 56.56
PTV 50.4 –10 54.11 53.90 53.26
Brain stem 16 41.61 40.06 42.80
Optic chiasm 16 46.11 44.99 41.68
Lt eye 16 1.94 2.29 1.08
Rt eye 16 2.04 2.45 1.13
Lt optic nerve 16 12.33 10.12 8.68
Rt optic nerve 16 14.07 17.16 8.61
Lt inner ear 16 16.28 18.60 18.22
Rt inner ear 16 34.36 34.00 34.57
Lt = LeftRt = Right

38
V. ACCEPTANCE, COMMISSIONING, AND ROUTINE QA TESTSFOR BIOLOGICALLY BASED PLANNING SYSTEMS
The acceptance, commissioning, and periodic QA tests recommended by previous TG reports[TG-40, Kutcher et al. (1994); TG-53, Fraass et al. (1998); TG-119, Ezzell et al. (2009);TG-142, Klein et al. (2009)] for general TPS features (e.g., data input/output, dose calculations,plan deliverability, clinical software tools) should be performed for BBTPS. These recommen-dations will not be repeated here. The aim of this section is to provide examples of the additionalQA tests specific to general features pertinent to BBTPS. Physicists are encouraged to developtheir own QA tests specific to the BBTPS in use at their clinics. It is expected that a more com-plete list of such QA tests will become available as more practical experience is gained in thefuture. All acceptance and commissioning tests should be carried out on the system after it hasbeen installed in the clinic but before it is used clinically.
V.A. ACCEPTANCE TESTS
Based on the previous TG reports [TG-40, Kutcher et al. (1994); TG-53, Fraass et al. (1998)],an acceptance test is performed to confirm that the TPS performs according to its specifications.Because the quantifiable and testable specifications are generally lacking for a BBTPS at thepresent time, the acceptance testing may be limited to verify functionalities offered by theBBTPS. Examples of these functionalities that might be included in the acceptance testing are:(1) allowing user to update model and/or model parameters, (2) allowing user to specify model-based goals and constraints for optimization, and (3) allowing user to evaluate plan based onbiological metrics.
V.B. COMMISSIONING TESTS
V.B.1. SelectiveVerification of Biological Metrics
Biological metrics, i.e., EUD/TCP/NTCP, calculated within a TPS should be independently ver-ified by the user for selected cases before routine clinical use and after major upgrades. Thebenchmark phantom used in this report (section IV.D.1) may be used in this verification. If fullyvalidated by the medical physics community, other research software tools, such as CERR(Deasy et al. 2003) at http://radium.wustl.edu/CERR/about.php), BIOPLAN (Sanchez-Nietoand Nahum 2000), or BioSuite (Uzan and Nahum 2009), may be used as evaluation tools. TPSvendors are urged to provide detailed descriptions of all implemented models and parameter val-ues to make this possible. It is also recommended that TPS vendors provide tools to export dosedistributions, DVHs, and 3D dose matrices to external programs. Note that results may differwhether EUD/TCP/NTCP is calculated using the dose grid or DVH (section III.A.4). TPS doc-umentation should clearly state the technique used to calculate all biological metrics.
V.B.2. Double Planning
It is recommended that for the first several cases from each representative tumor site, new usersof BBTPS prepare second plans using their standard DV-based TPS. New and traditional plans
AAPM REPORT NO. 166

39
can be compared to help understand how different aspects of a dose distribution are controlledby biological cost functions. Preparation of backup plans may be discontinued after sufficientexpertise in treatment planning and knowledge of advantages/limitations the BBTPS have beengained.
V.B.3. Compilation of Benchmark 3D Datasets and DVHs for Major Sites
The task group has prepared sample plans for the benchmark phantom and three test cases rep-resenting major sites often treated using IMRT: head & neck, prostate, and brain. Image andstructure sets in the DICOM format as well as tabular DVH data for these three cases can bedownloaded from:
• http://www.aapm.org/org/committees/TG166/TG166prostate.zip,
• http://www.aapm.org/org/committees/TG166/TG166headneck.zip,
• http://www.aapm.org/org/committees/TG166/TG166brain.zip, and
• http://www.aapm.org/org/committees/TG166/EUD_Monaco_Pinnacle_Eclipse.xls.
Note that these sample plans do not necessarily represent the best plans possible for the cases.They are provided for comparison purposes. Physicists attempting to commission a BBTPS maycompare plans obtained with their system to these sample plans and may explore whether simi-lar or better plans can be obtained with the BBTPS in question. If applicable, the EUD valuesprovided for these sample plans in Table VIII may be used to validate the EUD calculation in thetesting of BBTPS.
V.C. PROCEDURES FOR ROUTINE QA
It is suggested that users of biologically based TPS prepare an IMRT sample plan generated bythe biologically based plan optimization based on either one of the benchmark cases or theuser’s own case at the time of commissioning. This sample case should be re-planned annuallyor after major upgrades and compared to the baseline data, i.e., DVHs, EUD/TCP/NTCP, toensure that models, parameters, and algorithms implemented in the TPS plan optimizationremain the same. For a BBTPS with a biologically based plan evaluation tool, users should pre-pare a 3D dose distribution based on one of the benchmark cases or the user’s own case andobtain its baseline DV and biological metrics using the evaluation tool at the time of commis-sioning. These metrics should be re-evaluated annually or after major upgrades. The new met-rics should be identical to the baseline data. For TPS capable of Monte Carlo dose calculations,a non-stochastic dose calculation algorithm should be used, if available, for initial and subse-quent treatment planning to eliminate statistical uncertainties associated with the Monte Carlomethod (section III.A.4).
THE USE AND QA OF BIOLOGICALLY RELATED MODELS FOR TREATMENT PLANNING
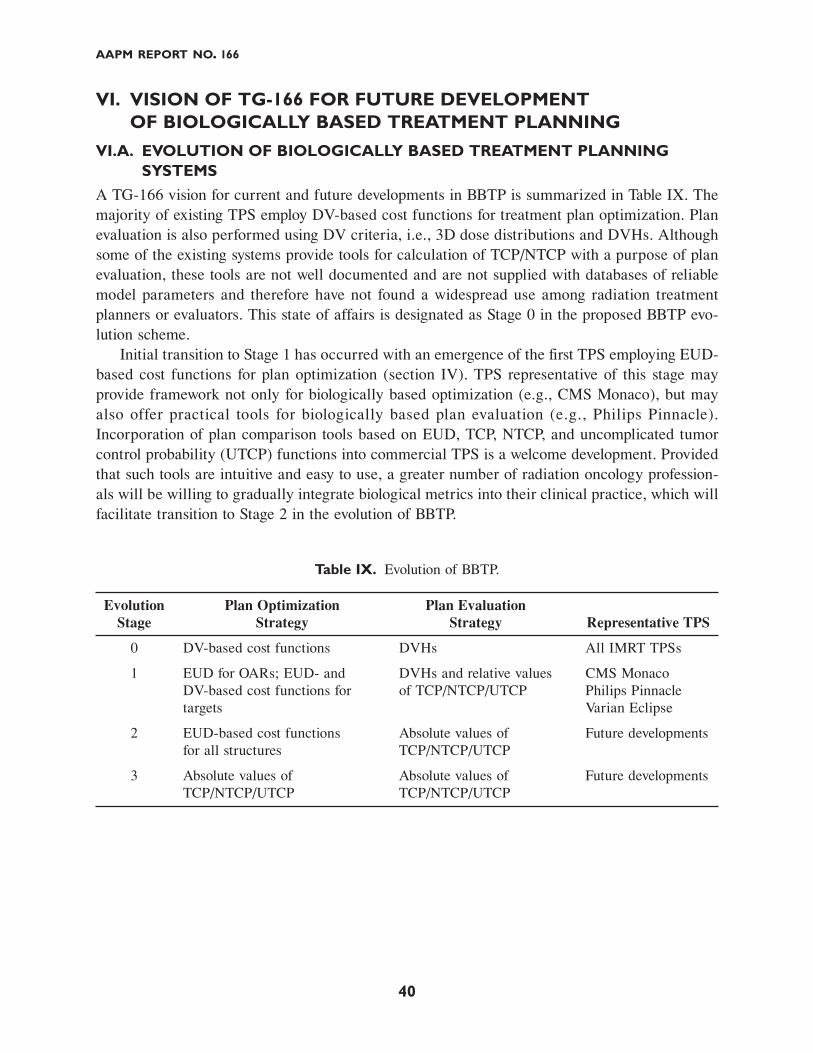
40
VI. VISION OF TG-166 FOR FUTURE DEVELOPMENTOF BIOLOGICALLY BASED TREATMENT PLANNING
VI.A. EVOLUTION OF BIOLOGICALLY BASED TREATMENT PLANNINGSYSTEMS
A TG-166 vision for current and future developments in BBTP is summarized in Table IX. Themajority of existing TPS employ DV-based cost functions for treatment plan optimization. Planevaluation is also performed using DV criteria, i.e., 3D dose distributions and DVHs. Althoughsome of the existing systems provide tools for calculation of TCP/NTCP with a purpose of planevaluation, these tools are not well documented and are not supplied with databases of reliablemodel parameters and therefore have not found a widespread use among radiation treatmentplanners or evaluators. This state of affairs is designated as Stage 0 in the proposed BBTP evo-lution scheme.
Initial transition to Stage 1 has occurred with an emergence of the first TPS employing EUD-based cost functions for plan optimization (section IV). TPS representative of this stage mayprovide framework not only for biologically based optimization (e.g., CMS Monaco), but mayalso offer practical tools for biologically based plan evaluation (e.g., Philips Pinnacle).Incorporation of plan comparison tools based on EUD, TCP, NTCP, and uncomplicated tumorcontrol probability (UTCP) functions into commercial TPS is a welcome development. Providedthat such tools are intuitive and easy to use, a greater number of radiation oncology profession-als will be willing to gradually integrate biological metrics into their clinical practice, which willfacilitate transition to Stage 2 in the evolution of BBTP.
AAPM REPORT NO. 166
Table IX. Evolution of BBTP.
Evolution Plan Optimization Plan EvaluationStage Strategy Strategy Representative TPS
0 DV-based cost functions DVHs All IMRT TPSs
1 EUD for OARs; EUD- and DVHs and relative values CMS MonacoDV-based cost functions for of TCP/NTCP/UTCP Philips Pinnacletargets Varian Eclipse
2 EUD-based cost functions Absolute values of Future developmentsfor all structures TCP/NTCP/UTCP
3 Absolute values of Absolute values of Future developmentsTCP/NTCP/UTCP TCP/NTCP/UTCP

41
The principal difference between Stages 1 and 2 is that TCP and NTCP functions will playa more important role in the treatment plan evaluation process and will supersede DV metricsas the major indicators of plan quality. As opposed to the use of TCP and NTCP in Stage 1,where these estimates are used primarily in a relative fashion as an ancillary tool to comparealternative treatment plans, in Stage 2 the growing confidence in predictive power of dose-response models will allow decisions about plan quality to be based on absolute estimates ofTCP/NTCP. Because the effectiveness of a plan will be judged by the predicted biological out-come, dose-based constraints will no longer be required to force target dose to be as uniformas possible so long as the plan results in desired values of TCP and inhomogeneous targetdoses do not jeopardize intermixed normal tissues; and therefore treatments could be optimizedbased on EUD-based cost functions alone. Stage 2 must be accompanied by clear supportingevidence for the reliability of each model used and may be adopted at different times for differ-ent disease sites.
Transition to non-uniform target dose distributions represents a major paradigm shift intreatment planning. The requirement for uniform dose delivery was a long-standing tradition inour field. It may have been based on the assumption that tumors behave as “parallel structures,”and that the ultimate TCP will be related to the minimum dose. Seeking a uniform target dosethat exceeds the desired minimum was a way to reduce the overall integral dose/exposure to thepatient. This concept has also been rooted in convention (ICRU 1993, Report 50). However,there is no proof that this construct is valid for tumors. Relaxing target uniformity constraint,and allowing hot spots within the target, may afford the planner increased flexibility in creatinga better plan that may lead to better critical structure sparing (De Gersem et al. 1999). Table Xsummarizes arguments in favor and against using heterogeneous dose distributions. While mostof the supporting arguments are theoretical, there are some examples where non-uniform dosedelivery has proven to be safe and effective, e.g., brachytherapy, intracranial SRS, and simulta-neously integrated boost. It is also known that, due to organ motion and daily setup uncertain-ties, actual delivered dose distr ibutions are less homogeneous than the planned dosedistributions, especially if small margins are used (Killoran et al. 1997). This implies that sev-eral generations of radiation oncologists have been treating patients using moderately inhomoge-neous dose distributions.
The ultimate BBTP (Table IX, Stage 3) is represented by a scenario in which treatment planswill be optimized using objective scores based on TCP/NTCP (e.g., Källman et al. 1992a;Brenner and Sachs 1999). The optimized values of TCP and NTCP will be used directly to eval-uate treatment plans.
THE USE AND QA OF BIOLOGICALLY RELATED MODELS FOR TREATMENT PLANNING

Table X. Pros and Cons of Homogeneous versus Heterogeneous Tumor Dose Distributions.
Homogeneous Dose Partial Tumor Boosts Heterogeneous Dose
Pros
42
AAPM REPORT NO. 166
Proven track record.
Consistent with classicalradiobiology.
Less ambiguity inreporting and analyzingdelivered doses.
Hot spots are probablyuseless unless they covermost of the tumor or themost resistant sub-volume.
Most logical approach ifinformation about tumorheterogeneity is notavailable.
Predicted to be effectiveunder a wide range oftheoretical assumptions.
Easy to do using IMRT.
The PTV margin providesa natural “draw-down”region between a GTVboost and critical normalstructures.
Adds another degree offreedom to the treatmentplanning problem and canlead to better criticalstructure sparing.
Hot spots may not bedetrimental if they arelocated inside the GTV.
Because tumors areheterogeneous(e.g., positron emissiontomography (PET)imaging), there is noreason that tumor doseshould be uniform.
Would allow biologicaltargeting via the use ofPET, etc.
Stereotactic and implantexperience is supportivealthough in differentdose/dose-rate regimens.
Old school/tradition-driven.
Opportunity to exploittumor heterogeneities islost.
Opportunity to use theflexibility of IMRT islimited.
Mounting data support thenotion that heterogeneousdose may be advantageous.
No consistent human oranimal data to confirmpositive effects, althoughsupportive data can befound for certain tumorsites.
Due to temporal changesin tumor volumes, effect ofpartial tumor boost may bediminished.
No consistent human oranimal data to confirmpositive effects, althoughsupportive data can befound for certain tumorsites.
Theoretical benefits arelimited by the accuracy ofTCP models.
Effect of cold spots maybe underestimated,especially if cold spots arelocated in the GTV.
Must be careful that hotspots within the PTV arelocated within the GTV,and not the normal tissuemargin.
Cons

43
VI.B. DESIRED FEATURES AND FUNCTIONALITIES FOR FUTUREBIOLOGICALLY BASED TREATMENT PLANNING SYSTEMS
It is instructive to speculate as to what constitutes an ideal (optimal) BBTPS. Many preferredgeneral features for TPS (e.g., fast and accurate dose calculation and optimization algorithms,same dose engine for optimization and for forward calculation, accurate DVH generation, robustand effective input and output tools) are also important for future BBTPS. In addition, thefollowing characteristics and functionalities are desirable for a BBTPS:
(1) The system should allow the user to input or to update models and model parametersfor both plan evaluation and optimization. A library of model parameters, containingthe default parameter values with capability of allowing user to update these parame-ters based on specific clinical situation or local patient population, should be provided.The system should supply detailed documentation for the models and the defaultparameter sets (their origin, applicability, and provenance). For example, the LKBNTCP model along with a database of parameters for common organs and endpoints,indicating the sources (e.g., QUANTEC), should be provided. For an updated model,inclusion of new biological or medical factors might introduce additional uncertainties.The user should be provided with the tools to do the calculations based on both latestand previous models. As there may be competing models for a given clinical situation,the user should have a choice regarding which model should be used for the situation.There might be clinical reasons to trust one type of model over others in certain situa-tions. The system should allow user to consider organ interaction (e.g., interactionbetween heart and lung, or liver and kidney) by modifying model(s) and/or selectingmodel parameters. Note that some of these features are included in the existing TPSs(e.g., Pinnacle).
(2) The system should allow combinations of biological model- and DV-based constraintsfor all structures in the optimization. For example, one might want to use lung EUD (orLKB NTCP model) but also keep V20 below 35%. The maximum dose may be used ashard constraint to limit hot spot. For some organs, the user may choose to use DV con-straints only. (For example, the uniform dose that approaches the tolerance dose forbrainstem may be used in the overlap region of brainstem and glioma PTV.) For cer-tain situations, a hybrid approach, e.g., using DV-based optimization followed by bio-logically based optimization (Das 2010), may be helpful.
(3) The optimizer should “reward” getting lower NTCP than requested, if that is possiblewithout violating the higher priority goals or preventing lower priorities from beingachieved, and should allow maximizing TCP for a given NTCP or minimizing NTCPfor a given TCP.
(4) The system should allow the user to define “stop values” for iteration during plan opti-mization. For example, the plan optimization may attempt to lower EUD or NTCP fornormal tissue no matter what they are. The user-defined value below which further opti-mization is unnecessary would improve efficiency of the optimization.
THE USE AND QA OF BIOLOGICALLY RELATED MODELS FOR TREATMENT PLANNING

44
(5) The user should be able to input “dose-modifying factors” to account for the effects ofcertain medical factors such as the use of chemotherapy, pre-existing conditions (e.g.,diabetes), and lifestyle choices (e.g., tobacco use), or biological factors such as geneticpredispositions to a complication. For example, if chemotherapy is known to be a fac-tor, the user can choose either using a different set of model parameters, or introducinga dose-modifying factor. The system should provide the user with the opportunity toassess the potential variations in outcome with changes in these factors. For example,estimations such as “this plan is anticipated to increase the patient’s risk of lung cancerby xx%, and this risk can be reduced to yy% if the patient discontinues smokingtobacco” could be informative.
(6) The system should have connectivity with medical information systems such that clini-cal parameters that might be used in optimization (e.g., pulmonary function tests) canbe accurately and directly incorporated. Similarly, clinical information within the med-ical information systems may be needed to determine which predictive model(s) to use.For example, the predictive models for pneumonitis might be different for patients withcancers of the lung vs. breast.
(7) The system should provide an option to assess the outcomes of a tentative plan reflec-tive of anticipated delivery uncertainties including setup errors, inter- and intrafrac-tional anatomic variations. The system should allow building a population-based orpatient-specific probability distribution into the evaluation of TCP and NTCP, perhapswith “confidence limited” NTCPs and TCPs for a given population-based or patient-specific motion probability distribution.
(8) For a given treatment, the best achievable dose distribution depends on the patientgeometry and the physical limitations of the radiation in question. For example, theminimal dose to an OAR adjacent to the PTV mostly depends on the distance betweenthe OAR and PTV and the physical characteristics of the radiation beam and the degra-dation in target coverage (TCP) that the physician is willing to accept. It is desirablethat the TPS can estimate best possible NTCP conditional on a chosen TCP, avoidingthe unnecessary effort in search for non-achievable plans.
(9) Models should allow for spatial radiobiological variations (e.g., clonogenic cell density,radiosensitivity, hypoxia) linking to biological/functional images. The planning systemshould provide a “painting-by-number” feature (Ling et al. 2000; Wu et al. 2005). Thatis, the user should be able to generate a highly non-uniform dose distribution based onthe spatially varying biological/functional information. Plan evaluation tools, such asthe functional DVH (fDVH) (Lu et al. 1997; Marks et al. 1999) that can take intoaccount the spatial distribution of the functional importance, should be provided.
(10) Outcome models should be able to consider time effects (e.g., treatment breaks, frac-tionation, tumor growth, and delivery time). The system should have the capability tooptimize around a prior dose distribution either from external beams or frombrachytherapy. Validated deformable registration for calculating delivered dose fromprevious treatment courses should be available.
(11) The system should have user-friendly graphic tools to show information during theoptimization process. This information includes table with constraints and priorities,
AAPM REPORT NO. 166

45
graphs displaying components of cost function (biologically based and/or DV-basedconstraints), DV and/or biological indices as in the current iteration.
(12) For plan evaluation, the calculation of biological indices should be accompanied byparameter sensitivity analysis. Ability to renormalize/adjust a plan to achieve biologicalgoals is also useful. For example, in addition to being able to renormalize the planaccording to DV criteria (e.g., 98% of PTV receives at least 95% prescription dose)renormalize to achieve an acceptable value of NTCP or EUD for a given OAR.
VII. SUMMARY OF RECOMMENDATIONS AND PRECAUTIONSFOR CLINICAL USE OF BIOLOGICALLY BASED MODELS
VII.A. GENERAL RECOMMENDATIONS
Biologically based cost functions for OARs may be preferable to DV constraints because the for-mer typically controls entire portions of the DV domain whereas the latter controls only a sin-gle point. For OARs requiring more than one DV constraint for inverse treatment planning, itmay be preferable to replace multiple constraints by a single EUD-based cost function withappropriate choice of a volume effect parameter. Because a biological cost function controlsgreater space in the DV domain, it may be more effective in optimizing a plan towards OARsparing as compared to the use of DV constraints.
Currently implemented biological cost functions for target volumes control only cold spots.These functions are not essential to obtain good quality plans and may be replaced with mini-mum dose constraints on target dose even in biologically based optimization.
Biological cost functions for target volumes do not effectively control hot spots. Despite someevidence in favor of less homogeneous target dose distributions, TG-166 maintains that highlynon-uniform dose distributions caused by the optimization technique (as opposed to deliberateand tested non-uniformity as is seen in SRS, simultaneously integrated boost techniques, andbrachytherapy) should be avoided. To obtain clinically acceptable plans with respect to targetdose homogeneity, biological cost functions should be supplemented with maximum-dose–typephysical cost functions.
At present, the plan evaluation should be performed based on established DV criteria.Therefore, biologically based TPSs must present physical parameters (i.e., DVHs; minimum,maximum, mean dose) along with any biological metrics. EUD can be used to rank plans pro-vided the parameter a is calibrated appropriately. Relative estimates of biological indices (i.e.,TCP, NTCP, and UTCP) may be used to help select rival plans, provided that the users under-stand the range of applicability of models and parameter values implemented in their TPS.Use of absolute estimates of TCP/NTCP as main indicators of plan quality is not warranted atthis time.
Regardless of advancement of biological tools for treatment planning, TG-166 recommendsthat review of 3D dose distributions always remain a part of the treatment plan evaluationprocess. TPSs should allow the dose to be viewed in multiple planes (e.g., axial, coronal, andsagittal, as well as non-standard planes and an overall volumetric display) since hot spots in non-specific tissues and heterogeneities in physiology/function within tumor/normal tissues are some-times more clearly understood in these other planes.
THE USE AND QA OF BIOLOGICALLY RELATED MODELS FOR TREATMENT PLANNING

46
If the parameter a cannot be calibrated in the calculation of EUD, the following generic val-ues may be used as starting values: a = 1 for a parallel organ and a = 8 for a serial organ. Anuncertainty analysis should be performed by calculating a type of confidence interval around thecalculated EUD values, for example, by calculating the lower and upper bounds on the EUDusing a = 0.5 and a = 3 for parallel structures, and a = 4 and a = 15 for a serial structures.
VII.B. TPS-SPECIFIC RECOMMENDATIONS
The recommendations below apply to the specific system versions described in section IV.
VII.B.1. CMS Monaco
Commonly found values for the cell sensitivity of tumors of ~0.25 Gy–1 frequently do notpenalize cold spots as forcefully as demanded by clinical practice, so that higher values of cellsensitivity may have a greater utility, if less biological meaning. However, for the selected testcase (section IV.A.2), the choice of cell sensitivity parameter had minimal impact on the min-imum PTV dose.
The Poisson statistics cell kill model should always be used in conjunction with a physicalconstraint, either the Maximum dose or Quadratic overdose penalty. Failure to specify the sec-ond cost function results in convergence problems and long running times.
Reasonable starting points for EUD constraints can be derived by an EUD computation for anumber of acceptable dose distributions in each institution. Typically, without biological opti-mization the EUD values will be spread out over an interval of values. A good starting pointcould be the median of this distribution, meaning that half of the patients could get a lower EUDby means of biologically constrained optimization.
VII.B.2. Philips Pinnacle
By adjusting the volume parameter, the Max EUD objective can be used to specify optimizationgoals for all types of OARs.
In case of a single PTV, combining the Target EUD objective with the Uniformity constraintyields good results.
For plans with multiple PTVs, using Min dose and Max dose cost functions offers better con-trol over target dose distributions.
VII.B.3. Varian Eclipse
Use of Min/Max dose or percentage structure volume at dose provides more reliable control overtarget dose distributions. Effect of adding EUD or TCP models should be carefully monitored toavoid introducing target dose heterogeneities that would not be accepted in clinical plans.
Adjusting TD50 and n values in LKB model can be used to shape evolution of OAR DVH inoptimizer.
Adjusting volume parameter and target EUD can be used to shape the DVH on OARs.
AAPM REPORT NO. 166
47
TG-166 proposes a new term—“cell killing-based EUD” or “cEUD”—to help distinguish aclass of expressions based on mechanistic models of cell killing (Niemierko 1997) from theempirical generalized equivalent uniform dose (gEUD) formula (section II.A). cEUD is derivedby equating survival fractions or TCP for the equivalent uniform and the true non-uniform dosedelivery scenarios. In its most simplified form, cEUD is given by (Niemierko 1997):
(A1)
where Dref = 2 Gy is the reference dose, SF2 is the surviving fraction at the reference dose, and(Di, vi) are bins of a differential DVH for the non-uniform distribution of interest. The underly-ing assumption in the Eq. (A1) is that cell survival can be approximated by an exponential func-tion of dose. This is a valid assumption for tumor cell survival typically characterized by largea /b, of the order of 10 Gy. The other assumption is that dose distribution is nearly homogenous,which also typically holds for tumors. cEUD is independent of the total number of clonogens.
Other radiobiological details, such as non-uniform spatial distribution of clonogens, dose-fractionation effects, interpatient heterogeneity, etc., can be easily incorporated into the expres-sion for cEUD at the expense of additional parameters (Niemierko 1997).
cEUD is relatively insensitive to the level of inter-patient heterogeneity and the value ofa /b ratio used for dose-per-fraction corrections, and therefore the simplest version of cEUD[Eq. (A1)] can often be used with sufficient accuracy (Niemierko 1997). Comparisons of cEUDwith the TCP model incorporating interpatient heterogeneity [Eq. (B3)] show that cEUD is amore robust concept, which implies that it is safer to use in the environment of large uncertain-ties in radiobiological parameters (Ebert 2000). These properties make cEUD an attractivequantity for BBTP.
cEUDSF
ln SFref2
ref
=( )
( )∑
Dvi i
D Dln
,2
APPENDIX A
cEUD: Cell Killing-Based Equivalent Uniform Dose

48
To account for repopulation, the LQ survival probability is often multiplied by an exponentialterm (Fowler 1989) exp[h max(T – Tk ,0)], where h is the proliferation rate (note that thisparameter is usually designated by g in the literature, but it is assigned a different symbol in thisreport to avoid confusion with the slope parameter), Tk is the time at which repopulation beginsafter the start of treatment, and T is the overall treatment time. The expression for TCP thenbecomes
(B1)
This model can be easily extended to a case of non-uniform dose distribution in the tumor:
(B2)
where r is the clonogen density, here assumed to be uniform throughout the tumor, and vi isthe fractional volume of the tumor irradiated to a dose Di. For practical calculations, bins of adifferential DVH, (Di, vi), may be used.
Equation (B1) has been used (sometimes with omission of the time factor) in a number ofstudies to estimate parameters from clinical data (e.g., Brenner 1993; Roberts and Hendry 1993;Wu et al. 1997) and found to yield unreasonably low estimates of a and N (King and Mayo2000). Some authors (Zaider and Minerbo 2000; Brenner et al. 2002) argue that this is a correctresult because tumor control requires the eradication of a very small number of highly radiore-sistant clonogens, but more often, these findings may be attributed to a failure of Eq. (B1) toaccount for inter-patient heterogeneity in the model parameters, particularly a, which wouldinevitably be present in any clinical cohort (Suit et al. 1992; Brenner 1993; Webb 1994; Webband Nahum 1998). Webb and Nahum (1993), Webb (1994), and Nahum and Sanchez-Nieto(2001) have modeled interpatient heterogeneity by assuming that a is normally distributed withthe mean and standard deviation σa :
(B3)
where TCP(a) is given by Eqs. (B1) or (B2). Roberts and Hendry (1998) have proposed aclosed-form TCP model incorporating interpatient heterogeneity that has the same number ofadjustable parameters (five) as Eqs. (B1) or (B2).
TCP = − − +
+ −( )
exp exp max ,N D
Dn
T Tkα β η 0
.
α
TCP = − − +
+ −( )
exp exp max ,N D
Dn
T Tkα β η 0
.
APPENDIX B
Extension of Poisson-Based TCP Model to Accountfor Repopulation and Interpatient Heterogeneity
TCP TCP= ( )∏ = − − +
+D v v D
Dni i
ii i
i, exp expρ α β ηη max , ,T Tki
−( )
∑
0

49
The critical element or serial model is premised on a simple argument that, if the probability offailure for a single FSU, p, is known, the probability of failure for an entire organ composed ofN FSUs arranged in a series can be calculated as 1 – (1 – p)N [e.g., Withers et al. (1988)].Additional mathematical manipulations [see Schultheiss et al. (1983) and Niemierko andGoitein (1991) for details] allow expressing NTCP for a non-uniformly irradiated organ througha complication probability for the entire organ irradiated uniformly, P(Di):
(C1)
where vi is the fractional organ volume receiving a dose Di. The dose-response relationship fora uniformly irradiated organ is often described empirically by the log-logistic function (Eq. 11).The model directly accommodates non-uniform dose distributions and does not require a sepa-rate DVH reduction algorithm.
The critical volume or parallel model (Withers et al. 1988; Niemierko and Goitein 1993;Yorke et al. 1993; Jackson et al. 1993) hypothesizes that NTCP for a parallel-type organ isrelated to the fraction of FSUs that are destroyed by radiation rather than the absolute number ofdamaged FSUs. The complication occurs when this fraction, denoted the fraction damaged orfdam, exceeds some critical value referred to as “functional reserve.” For a non-uniformly irradi-ated organ or tissue, the fraction damaged is calculated according to
(C2)
where vi is the fractional organ volume receiving a dose Di and P(Di) is the probability of destroy-ing a single FSU following a uniform irradiation with the dose Di (Jackson et al. 1995). The prob-ability p(Di) is often expressed using the empirical sigmoid relationship given by Eq. (11), wherethe two parameters have the same meaning as described above but refer to the response of anindividual FSU rather than the entire organ (Jackson et al. 1995; Yorke et al. 2002).
In order to relate fdam to clinically observed complication rates, a distribution of functionalreserves among the patient population must be specified. Jackson et al. (1995) used the normaldistribution involving two additional parameters to describe the population mean and the stan-dard deviation of functional reserves, which brings the total number of parameters to four. Toavoid specifying these extra parameters for the parallel model, it is often considered practical todirectly use fdam for treatment evaluation and optimization (Yorke et al. 2002).
f v P Ddam ii
i= ( )∑ ,
NTCP = − − ( ) ∏1 1 P Dii
vi ,
APPENDIX C
Critical Element and Critical Volume Models

50
Adkison, J. B., D. Khuntia, S. M. Bentzen, G. M. Cannon, W. A. Tomé, H. Jaradat, W. Walker, A. M.Traynor, T. Weigel, and M. P. Mehta. (2008). “Dose escalated, hypofractionated radiotherapy usinghelical tomotherapy for inoperable non-small cell lung cancer: preliminary results of a risk-stratifiedPhase I dose escalation study.” Technol Cancer Res Treat 7(6):441–447.
Ågren, A. K. Quantification of the Response of Heterogeneous Tumors and Organized Tissues toFractionated Radiotherapy. Ph.D. Thesis, Stockholm University, 1995.
Alber, M. (2000). A Concept for the Optimization of Radiotherapy. Ph.D. dissertation, University ofTübingen, Tübingen, Germany. Available at tobias-lib.ub.uni-tuebingen.de/volltexte/2001/221/.
Alber, M., and C. Belka. (2006). “A normal tissue dose response model of dynamic repair processes.”Phys Med Biol 51(1):153–172.
Alber, M., and F. Nüsslin. (1999). “An objective function for radiation treatment optimization based onlocal biological measures.” Phys Med Biol 44(2):479–493.
Alber, M., and R. Reemtsen. (2007). “Intensity modulated radiotherapy treatment planning by use of abarrier-penalty multiplier method.” Optim Methods Softw 22(3):391–411.
Alber, M., M. Birkner, and F. Nüsslin. (2002). “Tools for the analysis of dose optimization: II. Sensitivityanalysis.” Phys Med Biol 47(19):N265–N270.
Amols, H. I., and C. C. Ling. (2002). “EUD but not QED.” Int J Radiat Oncol Biol Phys 52(1):1–2.Barendsen, G. W. (1982). “Dose fractionation, dose rate and iso-effect relationships for normal tissue
responses.” Int J Radiat Oncol Biol Phys 8(11):1981–1997.Belderbos, J., W. Heemsbergen, M. Hoogeman, K. Pengel, M. Rossi, and J. Lebesque. (2005). “Acute
esophageal toxicity in non-small cell lung cancer patients after high dose conformal radiotherapy.”Radiother Oncol 75(2):157–164.
Ben-Josef, E., D. Normolle, W. D. Ensminger, S. Walker, D. Tatro, R. K. Ten Haken, J. Knol, L. A.Dawson, C. Pan, and T. S. Lawrence. (2005). “Phase II trial of high-dose conformal radiation ther-apy with concurrent hepatic artery floxuridine for unresectable intrahepatic malignancies.” J ClinOncol 23(34):8739–8747.
Benedict, S. H., K. M. Yenice, D. Followill, J. M. Galvin, W. Hinson, B. Kavanagh, P. Keall,M. Lovelock, S. Meeks, L. Papiez, T. Purdie, R. Sadagopan, M. C. Schell, B. Salter, D. J.Schlesinger, A. S. Shiu, T. Solberg, D. Y. Song, V. Stieber, R. Timmerman, W. A. Tomé, D. Verellen,L. Wang, F.-F. Yin. (2010). “Stereotactic body radiation therapy: The report of AAPM TaskGroup 101.” Med Phys 37(8):4078–4101. Available as AAPM Report No. 101 athttp://www.aapm.org/pubs/reports/RPT_101.pdf.
Bentzen, S. M. (2005). “Theragnostic imaging for radiation oncology: Dose-painting by numbers.”Lancet Oncol 6(2):112–117.
Bentzen, S. M., and S. L. Tucker. (1997). “Quantifying the position and steepness of radiation dose-response curves.” Int J Radiat Biol 71(5):531–542.
Bortfeld, T., W. Schlegel, C. Dykstra, S. Levegrün, and K. Preiser. (1996). “Physical vs. biological objec-tives for treatment plan optimization.” Radiother Oncol 40(2):185–187.
Bradley, J., J. O. Deasy, S. Bentzen, and I. El-Naqa. (2004). “Dosimetric correlates for acute esophagitisin patients treated with radiotherapy for lung carcinoma.” Int J Radiat Oncol Biol Phys 58(4):1106–1113.
REFERENCES
51
Brahme, A. (1984). “Dosimetric precision requirements in radiation therapy.” Acta Radiol Oncol23(5):379–391.
Brahme, A. (1999). “Optimized radiation therapy based on radiobiological objectives.” Semin RadiatOncol 9(1):35–47.
Brahme, A., B. K. Lind, P. Källman. (1991). Physical and Biological Dose Optimization Using InverseRadiation Therapy Planning. Stockholm: Department of Radiation Physics, Karolinska Institute andUniversity of Stockholm.
Brenner, D. J. (1993). “Dose, volume, and tumor-control predictions in radiotherapy.” Int J Radiat OncolBiol Phys 26(1):171–179.
Brenner, D. J. (2008). “The linear-quadratic model is an appropriate methodology for determining isoef-fective doses at large doses per fraction.” Semin Radiat Oncol 18(4):234–239.
Brenner, D. J., and E. J. Hall. (1999). “Fractionation and protraction for radiotherapy of prostate carci-noma.” Int J Radiat Oncol Biol Phys 43(5):1095–1101.
Brenner, D. J., and D. E. Herbert. (1997). “The use of the linear-quadratic model in clinical radiationoncology can be defended on the basis of empirical evidence and theoretical argument.” Med Phys24(8):1245–1248.
Brenner, D. J., and R. K. Sachs. (1999). “A more robust biologically based ranking criterion for treat-ment plans.” Int J Radiat Oncol Biol Phys 43(3):697–698.
Brenner, D. J., L. R. Hlatky, P. J. Hahnfeldt, Y. Huang, and R. K. Sachs. (1998). “The linear-quadraticmodel and most other common radiobiological models result in similar predictions of time-dose rela-tionships.” Radiat Res 150(1):83–91.
Brenner, D. J., A. A. Martinez, G. K. Edmundson, C. Mitchell, H. D. Thames, and E. P. Armour. (2002).“Direct evidence that prostate tumors show high sensitivity to fractionation (low α/β ratio), similar tolate-responding normal tissue.” Int J Radiat Oncol Biol Phys 52(1):6–13.
Burman, C., G. J. Kutcher, B. Emami, and M. Goitein. (1991). “Fitting of normal tissue tolerance datato an analytic function.” Int J Radiat Oncol Biol Phys 21(1): 123–135.
Chapet, O., E. Thomas, M. L. Kessler, B. A. Fraass, and R. K. Ten Haken. (2005). “Esophagus sparingwith IMRT in lung tumor irradiation: An EUD-based optimization technique.” Int J Radiat OncolBiol Phys 63(1):179–187.
Choi, B., and J. O. Deasy. (2002). “The generalized equivalent uniform dose function as a basis forintensity-modulated treatment planning.” Phys Med Biol 47(20):3579–3589.
Cox, J. D., J. Stetz, and T. F. Pajak. (1995). “Toxicity criteria of the Radiation Therapy Oncology Group(RTOG) and the European Organization for Research and Treatment of Cancer (EORTC).” Int JRadiat Oncol Biol Phys 31(5):1341–1346.
Cozzi, L., F. M. Buffa, and A. Fogliata. (2000). “Comparative analysis of dose volume histogram reduc-tion algorithms for normal tissue complication probability calculations.” Acta Oncol 39(2):165–171.
Curtis, S. B. (1986). “Lethal and potentially lethal lesions induced by radiation: A unified repair model.”Radiat Res 106(2):252–270.
Dale, R. G. (1985). “The application of the linear-quadratic dose-effect equation to fractionated andprotracted radiotherapy.” Br J Radiol 58(690):515–528.
Das, S. (2010). “A role for biological optimization within the current treatment planning paradigm.” MedPhys 36(10):4672–4682.
Dawson, L. A., C. Eccles, and T. Craig. (2006). “Individualized image guided iso-NTCP based livercancer SBRT.” Acta Oncol 45(7):856–864.
Dawson, L. A., D. Normolle, J. M. Balter, C. J. McGinn, T. S. Lawrence, and R. K. Ten Haken. (2002).“Analysis of radiation-induced liver disease using the Lyman NTCP model.” Int J Radiat Oncol BiolPhys 53(4):810–821. Erratum in: Int J Radiat Oncol Biol Phys 53(5):1422 (2002).
THE USE AND QA OF BIOLOGICALLY RELATED MODELS FOR TREATMENT PLANNING

52
Deasy, J. O. (1997). “Multiple local minima in radiotherapy optimization problems with dose-volumeconstraints.” Med Phys 24(7):1157–1161.
Deasy, J. O. (2000). “Comments on the use of the Lyman-Kutcher-Burman model to describe tissueresponse to nonuniform irradiation.” Int J Radiat Oncol Biol Phys 47(5):1458–1460.
Deasy, J. O., A. I. Blanco, V. H. Clark. (2003). “CERR: A computational environment for radiotherapyresearch.” Med Phys 30(5):979–985.
De Gersem, W. R., S. Derycke, C. O. Colle, C. De Wagter, and W. J. De Neve. (1999). “Inhomogeneoustarget-dose distributions: A dimension more for optimization?” Int J Radiat Oncol Biol Phys 44(2):461–468.
Dritschilo, A., J. T. Chaffey, W. D. Bloomer, and A. Marck. (1978). “The complication probability factor:A method for selection of radiation treatment plans.” Br J Radiol 51(605):370–374.
Ebert, M. A. (2000). “Viability of the EUD and TCP concepts as reliable dose indicators.” Phys MedBiol 45(2):441–457.
Ellis, F. (1969). “Dose, time and fractionation: A clinical hypothesis.” Clin Radiol 20(1):1–7.Emami, B., J. Lyman, A. Brown, L. Coia, M. Goitein, J. E. Munzenrider, B. Shank, L. J. Solin, and M.
Wesson. (1991). “Tolerance of normal tissue to therapeutic irradiation.” Int J Radiat Oncol BiolPhys 21(1):109–122.
Ezzell, G. A., J. W. Burmeister, N. Dogan, T. J. Losasso, J. G. Mechalakos, D. Mihailidis, A. Molineu,J. R. Palta, C. R. Ramsey, B. J. Salter, J. Shi, P. Xia, N. J. Yue, Y. Xiao. (2009). “IMRT commis-sioning: Multiple institution planning and dosimetry comparisons, a report from AAPM Task Group119.” Med Phys 36(11):5359–5373. Available as AAPM Report No. 119 athttp://www.aapm.org/pubs/reports/RPT_119.pdf.
Fowler, J. F. (1989). “The linear-quadratic formula and progress in fractionated radiotherapy.” Br JRadiol 62(740):679–694.
Fowler, J. F. (2008). “Linear quadratics is alive and well: In regard to Park et al. (Int J Radiat Oncol BiolPhys 2008;70:847–852).” Int J Radiat Oncol Biol Phys 72:957.
Fraass, B., K. Doppke, M. Hunt, G. Kutcher, G. Starkschall, R. Stern, and J. Van Dyke. (1998).“American Association of Physicists in Medicine Radiation Therapy Committee Task Group 53:Quality assurance for clinical radiotherapy treatment planning.” Med Phys 25:1773–1829. AAPMReport No. 62. http://www.aapm.org/pubs/reports/rpt_62.pdf.
Fu, X. L., H. Huang, G. Bentel, R. Clough, R. L. Jirtle, F. M. Kong, L. B. Marks, and M. S. Anscher.(2001). “Predicting the risk of symptomatic radiation-induced lung injury using both the physicaland biologic parameters V30 and transforming growth factor β.” Int J Radiat Oncol Biol Phys50(4):899–908.
Graham, M. V., J. A. Purdy, B. Emami, W. Harms, W. Bosch, M. A. Lockett, and C. A. Perez. (1999).“Clinical dose-volume histogram analysis for pneumonitis after 3D treatment for non-small lungcancer (NSCLC).” Int J Radiat Oncol Biol Phys 45(2):323–329.
Guerrero, M., and X. A. Li. (2003). “Analysis of a large number of clinical studies for breast cancerradiotherapy: Estimation of radiobiological parameters for treatment planning.” Phys Med Biol48(20):3307–3326.
Guerrero, M., R. D. Stewart, J. Z. Wang, and X. A. Li. (2002). “Equivalence of the linear-quadratic andtwo-lesion kinetic models.” Phys Med Biol 47(17):3197–3209.
Hall, E. J., and D. J. Brenner. (1995). “In response to Dr. Marks.” Int J Radiat Oncol Biol Phys 32:275–276.
Hall, E. J., and A. J. Ciaccia. Radiobiology for the Radiologist, 6th edition. Philadelphia: LippincottWilliams & Wilkins, 2006.
AAPM REPORT NO. 166

53
Hamilton, C. S., L. Y. Chan, D. L. McElwain, and J. W. Denham. (1992). “A practical evaluation of fivedose-volume histogram reduction algorithms.” Radiother Oncol 24(4):251–260.
Härdemark, B., A. Liander, H. Rehbinder, J. Löf, and D. Robinson. (2004). P3IMRT Biological opti-mization and EUD. Pinnacle3 White Paper. Available at www.edu-doc.com/ebook/hardemark.html.
Hayman, J. A., M. K. Martel, R. K. Ten Haken, D. P. Normolle, R. F. Todd III, J. F. Littles, M. A.Sullivan, P. W. Possert, A. T. Turrisi, and A. S. Lichter. (2001). “Dose escalation in non-small-celllung cancer using three-dimensional conformal radiation therapy: Update of a phase I trial.” J ClinOncol 19(1):127–136.
Herbert, D. (1997). “Comment on ‘Point/Counterpoint: The use of the linear-quadratic model in clinicalradiation oncology can be defended on the basis of empirical evidence and theoretical argument.’[Med Phys 24:1245–1248 (1997)].” Med Phys 24(8):1329 (1997).
Hope, A. J., P. E. Lindsay, I. El Naqa, J. R. Alaly, M. Vicic, J. D. Bradley, and J. O. Deasy. (2006).“Modeling radiation pneumonitis risk with clinical, dosimetric, and spatial parameters.” Int J RadiatOncol Biol Phys 65(1):112–124.
ICRU (1993). International Commission on Radiation Units and Measurements Report 50: Prescribing,Recording and Reporting Photon Beam Therapy. Bethesda, MD: ICRU, 1993.
Jackson, A., G. J. Kutcher, and E. D. Yorke. (1993). “Probability of radiation-induced complications fornormal tissues with parallel architecture subject to non-uniform irradiation.” Med Phys 20(3):613–625.
Jackson, A., R. K. Ten Haken, J. M. Robertson, M. L. Kessler, G. J. Kutcher, and T. S. Lawrence. (1995).“Analysis of clinical complication data for radiation hepatitis using a parallel architecture model.” IntJ Radiat Oncol Biol Phys 31(4):883–891.
Jackson, A., C. C. Ling, G. J. Kutcher, C. M. Burman, E. S. Venkatraman, J. Bass, A. Raben, S. Liebel,and Z. Fuks. (1996). “A conformal dose escalation protocol for the treatment of tumors in the lungor other normal tissues with parallel architecture.” Med Phys 23:1495.
Källman, P., B. K. Lind, and A. Brahme. (1992a). “An algorithm for maximizing the probability of com-plication-free tumour control in radiation therapy.” Phys Med Biol 37(4):871–890.
Källman, P., A. Ågren, and A. Brahme. (1992b). “Tumour and normal tissue responses to fractionatednon-uniform dose delivery.” Int J Radiat Biol 62(2):249–262.
Kåver, G., B. K. Lind, J. Löf, A. Liander, and A. Brahme. (1999). “Stochastic optimization of intensitymodulated radiotherapy to account for uncertainties in patient sensitivity.” Phys Med Biol 44(2):2955–2969.
Kawrakow, I. (2004). “The effect of Monte Carlo statistical uncertainties on the evaluation of dose dis-tributions in radiation treatment planning.” Phys Med Biol 49(8):1549–1556.
Killoran, J. H., H. M. Kooy, D. J. Gladstone, F. J. Welte, and C. J. Beard. (1997). “A numerical simula-tion of organ motion and daily setup uncertainties: Implications for radiation therapy.” Int J RadiatOncol Biol Phys 37(1):213–221.
Kim, Y., and W. A. Tomé. (2006). “Risk-Adaptive Optimization: Selective boosting of high-risk tumorsubvolumes.” Int J Radiat Oncol Biol Phys 66(5):1528–1542.
King, C. R., and C. S. Mayo. (2000). “Is the prostate alpha/beta ratio of 1.5 from Brenner & Hall a mod-eling artifact?” Int J Radiat Oncol Biol Phys 47(2):536–539.
Kirk, J., W. M. Gray, and E. R. Watson. (1971). “Cumulative radiation effect. I. Fractionated treatmentregimes.” Clin Radiol 22(2):145–155.
Kirkpatrick, J. P., J. J. Meyer, and L. B. Marks, (2008). “The linear-quadratic model is inappropriate tomodel high dose per fraction effects in radiosurgery.” Semin Radiat Oncol 18(4):240–243.
THE USE AND QA OF BIOLOGICALLY RELATED MODELS FOR TREATMENT PLANNING

54
Klein, E. E., J. Hanley, J. Bayouth, F. F. Yin, W. Simon, S. Dresser, C. Serago, F. Aguirre, L. Ma, B.Arjomandy, C. Liu, C. Sandin, T. Holmes. (2009). “Task Group 142 report: quality assurance ofmedical accelerators.” Med Phys 36(9):4197–4212. AAPM Report No. 62. http://www.aapm.org/pubs/reports/RPT_142.pdf.
Koh, E. S., A. Sun, T. H. Tran, R. Tsang, M. Pintilie, D. C. Hodgson, W. Wells, R. Heaton, and M. K.Gospodarowicz. (2006). “Clinical dose-volume histogram analysis in predicting radiation pneumoni-tis in Hodgkin’s lymphoma.” Int J Radiat Oncol Biol Phys 66(1):223–228.
Kong, F. M., C. Pan, A. Eisbruch, and R. K. Ten Haken. (2007). “Physical models and simpler dosimet-ric descriptors of radiation late toxicity.” Semin Radiat Oncol 17(2):108–120.
Kutcher, G. J., and C. Burman. (1989). “Calculation of complication probability factors for non-uniformnormal tissue irradiation: The effective volume method.” Int J Radiat Oncol Biol Phys 16(6):1623–1630.
Kutcher, G. J., C. Burman, L. Brewster, M. Goitein, and R. Mohan. (1991). “Histogram reductionmethod for calculating complication probabilities for three-dimensional treatment planning evalua-tions.” Int J Radiat Oncol Biol Phys 21(1):137–146.
Kutcher, G. J., L. Coia, M. Gillin, W. F. Hanson, S. Leibel, R. J. Morton, J. R. Palta, J. A. Purdy, L. E.Reinstein, G. K. Svensson, M. Weller, and L. Wingfield. (1994). “Comprehensive QA for radiationoncology: Repor t of AAPM Radiation Therapy Committee Task Group 40.” Med Phys21(4):581–618. AAPM Report No. 46. http://www.aapm.org/pubs/reports/RPT_46.pdf.
Kwa, S. L., J. V. Lebesque, J. C. Theuws, L. B. Marks, M. T. Munley, G. Bentel, D. Oetzel, U. Spahn,M. V. Graham, R. E. Drzymala, J. A. Purdy, A. S. Lichter, M. K. Martel, and R. K. Ten Haken.(1998). “Radiation pneumonitis as a function of mean lung dose: An analysis of pooled data of 540patients.” Int J Radiat Oncol Biol Phys 42(1):1–9.
Langer, M., S. S. Morrill, and R. Lane. (1998). “A test of the claim that plan rankings are determinedby relative complication and tumor-control probabilities.” Int J Radiat Oncol Biol Phys 41(2):451–457.
Lea, D. E. Actions of Radiation on Living Cells. London: Cambridge University Press, 1946.Lea, D. E., and D. G. Catcheside. (1942). “A theory of the action of radiation on biological materials
capable of recovery. 1. The intensity factor.” J Genet 44:216–245.Li, X. A., J. Z. Wang, R. D. Stewart, and S. J. DiBiase. (2003). “Dose escalation in permanent
brachytherapy for prostate cancer: Dosimetric and biological considerations.” Phys Med Biol48(17):2753–2765.
Lind, B. K., P. Mavroidis, S Hyödynmaa, and C. Kappas. (1999). “Optimization of the dose level for agiven treatment plan to maximize the complication-free tumor cure.” Acta Oncol 38(6):787–798.
Ling, C. C., and X. A. Li. (2005). “Over the next decade the success of radiation treatment planning willbe judged by the immediate biological response of tumor cells rather than by surrogate measuressuch as dose maximization and uniformity.” Med Phys 32(7):2189–2192.
Ling, C. C., J. Humm, S. Larson, H. Amols, Z. Fuks, S. Leibel, and J. A. Koutcher.(2000). “Towardsmultidimensional radiotherapy (MD-CRT): Biological imaging and biological conformality.” Int JRadiat Oncol Biol Phys 47(3):551–560.
Lu, Y., D. R. Spelbring, and G. T. Chen. (1997). “Functional dose-volume histograms for functionallyheterogeneous normal organs.” Phys Med Biol 42(2):345–356.
Luxton, G., P. J. Keall, and C. R. King. (2008). “A new formula for normal tissue complication proba-bility (NTCP) as a function of equivalent uniform dose (EUD).” Phys Med Biol 53(1):23–36.
Lyman, J. T. (1985). “Complication probability as assessed from dose-volume histograms.” Radiat ResSuppl 8:S13–S19 (1985).
AAPM REPORT NO. 166

55
Marks, L. B. (1995). “Extrapolating hypofractionated radiation schemes from radiosurgery data:Regarding Hall et al., IJROBP 21:819–824; 1991 and Hall and Brenner, IJROBP 25:381–385;1993.” Int J Radiat Oncol Biol Phys 32:274–275.
Marks, L. B., G. W. Sherouse, M. T. Munley, G. C. Bentel, and D. P. Spencer. (1999). “Incorporation offunctional status into dose-volume analysis.” Med Phys 26(2):196–199.
Marks, L. B., S. M. Bentzen, J. O. Deasy, F. M. Kong, J. D. Bradley, I. S. Vogelius, I. El Naqa, J. L.Hubbs, J. V. Lebesque, R. D. Timmerman, M. K. Martel, and A. Jackson. (2010). “Radiation dose-volume effects in the lung.” Int J Radiat Oncol Biol Phys 76(3 Suppl):S70–S76 (2010).
McGinn, C. J., R. K. Ten Haken, W. D. Ensminger, S. Walker, S. Wang, and T. S. Lawrence. (1998).“Treatment of intrahepatic cancers with radiation doses based on a normal tissue complication prob-ability model.” J Clin Oncol 16(6):2246–2252.
Mehta, M., R. Scrimger, R. Mackie, B. Paliwal, R. Chappell, and J. Fowler. (2001). “A new approach todose escalation in non-small-cell lung cancer.” Int J Radiat Oncol Biol Phys 49(1):23–33.
Mihailidis, D. N., B. Plants, L. Farinash, M. Harmon, L. Whaley, P. Paja, and P. Tomara. (2010).“Superiority of equivalent uniform dose (EUD)-based optimization for breast and chest wall.” MedDosim 35(1):67–76.
Milano, M. T., L. S. Constine, and P. Okunieff. (2007). “Normal tissue tolerance dose metrics for radia-tion therapy of major organs.” Semin Radiat Oncol 17(2):131–140.
Mohan, R., G. S. Mageras, B. Baldwin, L. J. Brewster, G. J. Kutcher, S. Leibel, C. M. Burman, C. C.Ling, and Z. Fuks. (1992). “Clinically relevant optimization of 3-D conformal treatments.” MedPhys 19(4):933–944.
Mohan, R., and X. H. Wang. (1996). “Response to Bortfeld et al. Re physical vs. biological objectives fortreatment plan optimization.” Radiother Oncol 40(2):186–187.
Moiseenko, V., J. Battista, and J. Van Dyk. (2000). “Normal tissue complication probabilities:Dependence on choice of biological model and dose-volume histogram reduction scheme.” Int JRadiat Oncol Biol Phys 46(4):983–993.
Munro, T. R., and C. W. Gilbert. (1961). “The relation between tumour lethal doses and the radiosensi-tivity of tumour cells.” Br J Radiol 34:246–251.
Muren, L. P., N. Jebsen, A. Gustafsson, and O. Dahl. (2001). “Can dose-response models predict reli-able normal tissue complication probabilities in radical radiotherapy of urinary bladder cancer? Theimpact of alternative radiation tolerance models and parameters.” Int J Radiat Oncol Biol Phys50(3):627–637.
Nahum, A. E., and B. Sanchez-Nieto. (2001). “Tumour control probability modeling: Basic principlesand applications in treatment planning.” Phys Med 17:13–23.
Nahum, A. E., B. Movsas, E. M. Horwitz, C. C. Stobbe, and J. D. Chapman (2003). “Incorporating clin-ical measurements of hypoxia into tumor local control modeling of prostate cancer: implications forthe a/b ratio.” Int J Radiat Oncol Biol Phys 57(2):391–401.
Nath, R., W. S. Bice, W. M. Butler, Z. Chen, A. S. Meigooni, V. Narayana, M. J. Rivard, and Y. Yu.(2009). “AAPM recommendations on dose prescription and reporting methods for permanent inter-stitial brachytherapy for prostate cancer: Report of Task Group 137.” Med Phys 36Λ(11):5310–5322. AAPM Report No. 137. http://www.aapm.org/pubs/reports/RPT_137.pdf.
Niemierko, A. (1997). “Reporting and analyzing dose distributions: A concept of equivalent uniformdose.” Med Phys 24(1):103–110.
Niemierko, A. (1999). “A generalized concept of equivalent uniform dose (EUD).” Med Phys 26:1101.Abstract WE-C2-9.
THE USE AND QA OF BIOLOGICALLY RELATED MODELS FOR TREATMENT PLANNING

56
Niemierko, A., and M. Goitein. (1991). “Calculation of normal tissue complication probability and dose-volume histogram reduction schemes for tissues with a critical element architecture.” RadiotherOncol 20(3):166–176.
Niemierko, A., and M. Goitein. (1993). “Modeling of normal tissue response to radiation: The criticalvolume model.” Int J Radiat Oncol Biol Phys 25(1):135–145.
Niemierko, A., M. Urie, and M. Goitein. (1992). “Optimization of 3D radiation therapy with both phys-ical and biological end points and constraints.” Int J Radiat Oncol Biol Phys 23(1):99–108.
Okunieff, P., D. Morgan, A. Niemierko, and H. D. Suit. (1995). “Radiation dose-response of humantumors.” Int J Radiat Oncol Biol Phys 32(4):1227–1237.
Orton, C. G., and F. Ellis. (1973). “A simplification in the use of the NSD concept in practical radio-therapy.” Br J Radiol 46(547):529–537.
Orton, C. G., T. R. Bortfeld, A. Niemierko, and J. Unkelbach. (2008). “The role of medical physicistsand the AAPM in the development of treatment planning and optimization.” Med Phys35(11):4911–4923.
Park, C., L. Papiez, S. Zhang, M. Story, and R. D. Timmerman. (2008). “Universal survival curve andsingle fraction equivalent dose: useful tools in understanding potency of ablative radiotherapy.” Int JRadiat Oncol Biol Phys 70(3):847–852.
Qi, X. S., C. J. Schultz, and X. A. Li. (2006). “An estimation of radiobiologic parameters from clinicaloutcomes for radiation treatment planning of brain tumor.” Int J Radiat Oncol Biol Phys 64(5):1570–1580.
Qi, X. S., V. A. Semenenko, and X. A. Li. (2009). “Improved critical structure sparing with biologicallybased IMRT optimization.” Med Phys 36(5):1790–1799.
QUANTEC. Int J Radiat Oncol Biol Phys 76(3 Suppl) (2010). March 1. Supplement devoted to QUANTEC.Rancati, T., C. Fiorino, G. Gagliardi, G. M. Cattaneo, G. Sanguineti, V. C. Borca, C. Cozzarini, G.
Fellin, F. Foppiano, G. Girelli, L. Menegotti, A. Piazzolla, V. Vavassori, and R. Valdagni. (2004).“Fitting late rectal bleeding data using different NTCP models: Results from an Italian multi-centricstudy (AIROPROS0101).” Radiother Oncol 73(1):21–32.
Roberts, S. A., and J. H. Hendry. (1993). “The delay before onset of accelerated tumour cell repopula-tion during radiotherapy: A direct maximum-likelihood analysis of a collection of worldwidetumour-control data.” Radiother Oncol 29(1):69–74.
Roberts, S. A., and J. H. Hendry. (1998). “A realistic closed-form radiobiological model of clinicaltumor-control data incorporating intertumor heterogeneity.” Int J Radiat Oncol Biol Phys 41(3):689–699.
Robertson, J. M., R. K. Ten Haken, M. B. Hazuka, A. T. Turrisi, M. K. Martel, A. T. Pu, J. F. Littles,F. J. Martinez, I. R. Francis, L. E. Quint, and A. S. Lichter. (1997). “Dose escalation for non-smallcell lung cancer using conformal radiation therapy.” Int J Radiat Oncol Biol Phys 37(5):1079–1085.
Romeijn, H. E., J. F. Dempsey, and J. G. Li. (2004). “A unifying framework for multi-criteria fluencemap optimization models.” Phys Med Biol 49:1991–2013.
Rosenzweig, K. E., J. L. Fox, E. Yorke, H. Amols, A. Jackson, V. Rusch, M. G. Kris, C. C. Ling, andS. A. Leibel. (2005). “Results of a phase I dose-escalation study using three-dimensional conformalradiotherapy in the treatment of inoperable nonsmall cell lung carcinoma.” Cancer 103(10):2118–2127.
Sachs, R. K., and D. J. Brenner. (1998). “The mechanistic basis of the linear-quadratic formalism.” MedPhys 25(10):2071–2073.
Sachs, R. K., P. Hahnfeld, and D. J. Brenner(1997). “The link between low-LET dose-response relationsand the underlying kinetics of damage production/repair/misrepair.” Int J Radiat Biol 72(4):351–374.
AAPM REPORT NO. 166

57
Sanchez-Nieto, B., and A. E. Nahum. (1999). “The delta-TCP concept: A clinically useful measure oftumor control probability.” Int J Radiat Oncol Biol Phys 44(2):369–380.
Sanchez-Nieto. B., and A. E. Nahum. (2000). “BIOPLAN: Software for the biological evaluation ofradiotherapy treatment plans.” Med Dosim 25(2):71–77 .
Schultheiss, T. E., C. G. Orton, and R. A. Peck. (1983). “Models in radiotherapy: Volume effects.” MedPhys 10(4):410–415.
Semenenko, V. A., and X. A. Li. (2008). “Lyman-Kutcher-Burman NTCP model parameters for radia-tion pneumonitis and xerostomia based on combined analysis of published clinical data.” Phys MedBiol 53(3):737–755.
Semenenko, V. A., B. Reitz, E. Day, X. S. Qi, M. Miften, and X. A. Li. (2008). “Evaluation of a com-mercial biologically based IMRT treatment planning system.” Med Phys 35(12):5851–5860.
Seppenwoolde, Y., J. V. Lebesque, K. de Jaeger, J. S. Belderbos, L. J. Boersma, C. Schilstra, G. T.Henning, J. A. Hayman, M. K. Martel, and R. K. Ten Haken. (2003). “Comparing different NTCPmodels that predict the incidence of radiation pneumonitis. Normal tissue complication probability.”Int J Radiat Oncol Biol Phys 55(3):724–735.
Söderström, S., and A. Brahme. (1993). “Optimization of the dose delivery in a few field techniquesusing radiobiological objective functions.” Med Phys 20(4):1201–1210.
Song, D. Y., S. H. Benedict, R. M. Cardinale, T. D. Chung, M. G. Chang, and R. K. Schmidt-Ullrich.(2005). “Stereotactic body radiation therapy of lung tumors: Preliminary experience using normaltissue complication probability-based dose limits.” Am J Clin Oncol 28(6):591–596.
Søvik, A., E. Malinen, H. K. Skogmo, S. M. Bentzen, O. S. Bruland, and D. R. Olsen. (2007).“Radiotherapy adapted to spatial and temporal variability in tumor hypoxia.” Int J Radiat Oncol BiolPhys 68(5):1496–1504.
Spalding, A. C., K. W. Jee, K. Vineberg, M. Jablonowski, B. A. Fraass, C. C. Pan, T. S. Lawrence, R. K.Ten Haken, and E. Ben-Josef. (2007). “Potential for dose-escalation and reduction of risk in pancre-atic cancer using IMRT optimization with lexicographic ordering and gEUD-based cost functions.”Med Phys 34(2):521–529.
Stavrev, P., D. Hristov, B. Warkentin, E. Sham, N. Stavreva, B. G. Fallone. (2003). “Inverse treatmentplanning by physically constrained minimization of a biological objective function.” Med Phys30(11):2948–2958.
Stavreva, N. A., and P. V. Stavrev. (2002). “Some limitations of the application of the NTCP modeldescribing the response of organs with ‘relatively serial’ structure.” Int J Radiat Biol 78(10):948–950.
Stewart, R. D., and X. A. Li. (2007). “BGRT: Biologically guided radiation therapy–the future is fastapproaching!” Med Phys 34(10):3739–3751.
Strandqvist, M. (1944). “Studien uber die Kumulative Wirkung der Rontgenstrahlen bei Fraktionierung.”Acta Radiol Suppl 55:1–300. [German].
Suit, H., S. Skates, A. Taghian, P. Okunieff, and J. T. Efird. (1992). “Clinical implications of hetero-geneity of tumor response to radiation therapy.” Radiother Oncol 25(4):251–260.
Suwinski, R., I. Wzietek, R. Tarnawski, A. Namysl-Kaletka, M. Kryj, A. Chmielarz, and J. Wydmanski.(2007). “Moderately low alpha/beta ratio for rectal cancer may best explain the outcome of threefractionation schedules of preoperative radiotherapy.” Int J Radiat Oncol Biol Phys 69(3):793–799.
Tai, A., B. Erickson, K. A. Khater, and X. A. Li. (2008). “Estimate of radiobiologic parameters fromclinical data for biologically based treatment planning for liver irradiation.” Int J Radiat Oncol BiolPhys 70(3):900–907.
THE USE AND QA OF BIOLOGICALLY RELATED MODELS FOR TREATMENT PLANNING

58
Ten Haken, R. K., M. K. Martel, M. L. Kessler, M. B. Hazuka, T. S. Lawrence, J. M. Robertson, A. T.Turrisi, and A. S. Lichter. (1993). “Use of Veff and iso-NTCP in the implementation of dose escala-tion protocols.” Int J Radiat Oncol Biol Phys 27(3):689–695.
Ten Haken, R. K., T. S. Lawrence, and L. A. Dawson. (2006). “Prediction of radiation-induced liver dis-ease by Lyman normal-tissue complication probability model in three-dimensional conformal radia-tion therapy for primary liver carcinoma: in regards to Xu et al. (Int J Radiat Oncol Biol Phys2006;65:189–195).” Int J Radiat Oncol Biol Phys 66(4):1272.
Thames, H. D. Jr., H. R. Withers, L. J. Peters, and G. H. Fletcher. (1982). “Changes in early and lateradiation responses with altered dose fractionation: Implications for dose-survival relationships.” IntJ Radiat Oncol Biol Phys 8(2):219–226.
Thames, H. D., M. Zhang, S. L. Tucker, H. H. Liu, L. Dong, and R. Mohan. (2004). “Cluster models ofdose-volume effects.” Int J Radiat Oncol Biol Phys 59:1491–1504.
Thieke, C., T. Bortfeld, A. Niemierko, and S. Nill. (2003). “From physical dose constraints to equivalentuniform dose constraints in inverse radiotherapy planning.” Med Phys 30:2332–2339.
Thomas, E., O. Chapet, M. L. Kessler, T. S. Lawrence, and R. K. Ten Haken. (2005). “Benefit of usingbiologic parameters (EUD and NTCP) in IMRT optimization for treatment of intrahepatic tumors.”Int J Radiat Oncol Biol Phys 62(2):571–578.
Tobias, C. A. (1985). “The repair-misrepair model in radiobiology: Comparison to other models.” RadiatRes Suppl 8:S77–S95.
Tomé, W. A., and J. F. Fowler. (2000). “Selective boosting of tumor subvolumes.” Int J Radiat OncolBiol Phys 48:593–599.
Tomé,W. A., and J. F. Fowler.(2002). “On cold spots in tumor subvolumes.” Med Phys 29(7):1590–1598.Tucker, S. L., and J. M. Taylor. (1996). “Improved models of tumour cure.” Int J Radiat Biol
70(5):539–553.Tucker, S. L., M. Zhang, L. Dong, R. Mohan, D. Kuban, and H. D. Thames. (2006). “Cluster model
analysis of late rectal bleeding after IMRT of prostate cancer: A case-control study.” Int J RadiatOncol Biol Phys 64(4):1255–1264.
Tucker, S. L., L. Dong, W. R. Bosch, J. Michalski, K. Winter, A. K. Lee, M. R. Cheung, D. A. Kuban,J. D. Cox, and R. Mohan, (2007). “Fit of a generalized Lyman normal-tissue complication probability(NTCP) model to Grade ≥ 2 late rectal toxicity data from patients treated on protocol RTOG 94-06.”Int J Radiat Oncol Biol Phys 69(3):S8–S9.
Tucker, S. L., H. H. Liu, Z. Liao, X. Wei, S. Wang, H. Jin, R. Komaki, M. K. Martel, and R. Mohan.(2008). “Analysis of radiation pneumonitis risk using a generalized Lyman model.” Int J RadiatOncol Biol Phys 72(2):568–574.
Uzan, J., and A. E. Nahum. (2009). “BioSuite, New Software for Radiobiological Customisation of Doseand Fraction Size in External-Beam Radiotherapy.” Presentation at the10th Biennial ESTRO meet-ing, Maastricht, The Netherlands, 29 Aug–3 Sep, 2009.
Wang, J. Z., and X. A. Li. (2003). “Evaluation of external beam radiotherapy and brachytherapy forlocalized prostate cancer using equivalent uniform dose.” Med Phys 30:34-40.
Wang, J. Z., M. Guerrero, and X. A. Li. (2003). “How low is the α/β ratio for prostate cancer?” Int JRadiat Oncol Biol Phys 55:194–203 .
Wang, X. H., R. Mohan, A. Jackson, S. A. Leibel, Z. Fuks, and C. C. Ling. (1995). “Optimization ofintensity-modulated 3D conformal treatment plans based on biological indices.” Radiother Oncol37(2):140–152.
Warkentin, B., P. Stavrev, N. Stavreva, C. Field, and B. G. Fallone. (2004). “A TCP-NTCP estimationmodule using DVHs and known radiobiological models and parameter sets.” JACMP J Appl ClinMed Phys 5(1):50–63.
AAPM REPORT NO. 166

59
Webb, S. “Optimum parameters in a model for tumour control probability including interpatient hetero-geneity.” Phys Med Biol 39(11):1895–1914.
Webb, S., and A. E. Nahum. (1993). “A model for calculating tumour control probability in radiother-apy including the effects of inhomogeneous distributions of dose and clonogenic cell density.” PhysMed Biol 38(6):653–666.
Webb, S., and A. E. Nahum. (1998). “Regarding, Wu, Chua, Sham et al, IJROBP 37(4):913-920; 1997.”Int J Radiat Oncol Biol Phys 40(4):1009–1010.
Wheldon, T. E., C. Deehan, E. G. Wheldon, and A. Barrett. (1998). “The linear-quadratic transforma-tion of dose-volume histograms in fractionated radiotherapy.” Radiother Oncol 46(3):285–295.
Withers, H. R., H. D. Thames Jr., and L. J. Peters. (1983). “A new isoeffect curve for change in dose perfraction.” Radiother Oncol 1(2):187–191.
Withers, H. R., J. M. Taylor, and B. Maciejewski. (1988). “Treatment volume and tissue tolerance.” Int JRadiat Oncol Biol Phys 14(4):751–759.
Wolbarst, A. B., E. S. Sternick, B. H. Curran, and A. Dritschilo. (1980). “Optimized radiotherapy treat-ment planning using the complication probability factor (CPF).” Int J Radiat Oncol Biol Phys 6(6):723–728.
Wu, P. M., D. T. Chua, J. S. Sham, L. Leung, D. L. Kwong, M. Lo, A. Yung, and D. T. Choy. (1997).“Tumor control probability of nasopharyngeal carcinoma: A comparison of different mathematicalmodels.” Int J Radiat Oncol Biol Phys 37(4):913–920 (1997).
Wu, Q., and R. Mohan. (2002). “Multiple local minima in IMRT optimization based on dose-volumecriteria.” Med Phys 29(7):1514–1527.
Wu, Q., R. Mohan, A. Niemierko, and R. Schmidt-Ullrich. (2002). “Optimization of intensity-modu-lated radiotherapy plans based on the equivalent uniform dose.” Int J Radiat Oncol Biol Phys52(1):224–235.
Wu, Q., D. Djajaputra, Y. Wu, J. Zhou, H. H. Liu, and R. Mohan. (2003). “Intensity-modulated radio-therapy optimization with gEUD-guided dose-volume objectives.” Phys Med Biol 48(3):279–291.
Wu, Q., D. Djajaputra, H. H. Liu, L. Dong, R. Mohan, and Y. Wu. (2005). “Dose sculpting with gener-alized equivalent uniform dose.” Med Phys 32(5):1387–1396.
Xu, Z. Y., S. X. Liang, J. Zhu, X. D. Zhu, J. D. Zhao, H. J. Lu, Y. L. Yang, L. Chen, A. Y. Wang, X. L.Fu, and G. L. Jiang. (2006). “Prediction of radiation-induced liver disease by Lyman normal-tissuecomplication probability model in three-dimensional conformal radiation therapy for primary livercarcinoma.” Int J Radiat Oncol Biol Phys 65(1):189–195.
Yang, Y., and L. Xing. (2004). “Clinical knowledge-based inverse treatment planning.” Phys Med Biol49(22):5101–5117.
Yang, Y., and L. Xing. (2005). “Towards biologically conformal radiation therapy (BCRT): SelectiveIMRT dose escalation under the guidance of spatial biology distribution.” Med Phys 32(6):1473–1484.
Yorke, E. D. (2001). “Modeling the effects of inhomogeneous dose distributions in normal tissues.”Semin Radiat Oncol 11(3):197–209.
Yorke, E. D., G. J. Kutcher, A. Jackson, and C. C. Ling. (1993). “Probability of radiation-induced com-plications in normal tissues with parallel architecture under conditions of uniform whole or partialorgan irradiation.” Radiother Oncol 26(3):226–237.
Yorke, E. D., A. Jackson, K. E. Rosenzweig, S. A. Merrick, D. Gabrys, E. S. Venkatraman, C. M.Burman, S. A. Leibel, and C. C. Ling. (2002). “Dose-volume factors contributing to the incidenceof radiation pneumonitis in non-small-cell lung cancer patients treated with three-dimensional con-formal radiation therapy.” Int J Radiat Oncol Biol Phys 54(2):329–339.
THE USE AND QA OF BIOLOGICALLY RELATED MODELS FOR TREATMENT PLANNING

60
Zaider, M. (1998). “There is no mechanistic basis for the use of the linear-quadratic expression in cellu-lar survival analysis.” Med Phys 25(5):791–792.
Zaider, M. (1998). “Sequel to the discussion concerning the mechanistic basis of the linear quadratic for-malism.” Med Phys 25(10):2074–2075.
Zaider, M., and H. I. Amols. (1998). “A little to a lot or a lot to a little: Is NTCP always minimized inmultiport therapy?” Int J Radiat Oncol Biol Phys 41(4):945–950.
Zaider, M., and H. I. Amols. (1999). “Practical considerations in using calculated healthy-tissue compli-cation probabilities for treatment-plan optimization.” Int J Radiat Oncol Biol Phys 44(2):439–447.
Zaider, M., and G. N. Minerbo. (2000). “Tumour control probability: A formulation applicable to anytemporal protocol of dose delivery.” Phys Med Biol 45(2):279–293.
AAPM REPORT NO. 166

![[2019] SGCA 20 Civil Appeal No 166 of 2018 Between Li ...](https://static.fdokumen.com/doc/165x107/63198ae91a1adcf65a0eb2ee/2019-sgca-20-civil-appeal-no-166-of-2018-between-li-.jpg)