
C−H⋯Pd interactions and cyano-bridged heteronuclear polymeric complexes

A Series of Cyanide-Bridged Binuclear Complexes
Michael T. Mock‡, Matthew T. Kieber-Emmons‡, Codrina V. Popescu§, Patrick Gasda§, GlennP. A. Yap‡, and Charles G. Riordan‡‡Department of Chemistry and Biochemistry University of Delaware, Newark, Delaware 19716§Department of Chemistry, Ursinus College, Collegeville, Pennsylvania 19426
AbstractA series of cyanide-bridged binuclear complexes, (‘S3’)Ni–CN–M[TptBu] (‘S3’ = bis(2-mercaptophenyl)sulfide, TptBu = hydrotris(3-tert-butylpyrazolyl)borate, M = Fe (2-Fe), Co (2-Co),Ni (2-Ni), Zn (2-Zn)) was prepared by the coupling of K[(‘S3’)Ni(CN)] with [TptBu]MX. Theisostructural series of complexes was structurally and spectroscopically characterized. A similarcoupling strategy was used to synthesize the anionic copper(I) analogue, Et4N{(‘S3’)Ni–CN–Cu[TptBu]}, 2-Cu.
An alternative synthesis was devised for the preparation of the linkages isomers of 2-Zn, i.e. ofcyanide-bridged linkage isomers. X-ray diffraction, 13C NMR and IR spectral studies establishedthat isomerization to the more stable Ni–CN–Zn isomer occurs. DFT computational results buttressedthe experimental observations indicating that the cyanide-bridged isomer is ca. 5 kcal/mol morestable than its linkage isomer.
Keywordscyanide; cyanide-bridged; binuclear complex; linkage isomers; Tp
1. IntroductionTransition metal cyanide complexes have been subject of intense research due to theirinteresting physical properties including magnetism, color, conductivity and hydrogen storagecapacity.[1,2] For example, variations of one of the earliest coordination compounds, Prussianblue, ([Fe4{Fe(CN)6}3] xH2O), has been used to construct room-temperature organometallicmagnets.[3] Despite the novel physical properties that many transition metal-cyanidecomplexes exhibit, simple M–CN–M’ complexes containing only one cyanide linkage remainless uncommon. As a consequence, the vibrational properties of such an isolated linkage arenot well understood[4] and are worthy of study. In fact, recent reports have focused onfundamental vibrational spectra of M–CN and M–CN–M’ type binding modes, specifically,to understand the spectroscopic differences between CN and the isoelectronic CO ligand.[4,5]
© 2009 Elsevier B.V. All rights reserved.Correspondence to: Charles G. Riordan.Publisher's Disclaimer: This is a PDF file of an unedited manuscript that has been accepted for publication. As a service to our customerswe are providing this early version of the manuscript. The manuscript will undergo copyediting, typesetting, and review of the resultingproof before it is published in its final citable form. Please note that during the production process errors may be discovered which couldaffect the content, and all legal disclaimers that apply to the journal pertain.
NIH Public AccessAuthor ManuscriptInorganica Chim Acta. Author manuscript; available in PMC 2010 September 15.
Published in final edited form as:Inorganica Chim Acta. 2009 September 15; 362(12): 4553–4562. doi:10.1016/j.ica.2009.05.042.
NIH
-PA Author Manuscript
NIH
-PA Author Manuscript
NIH
-PA Author Manuscript

Recently, transition metal cyanide motifs have also been revealed as integral components ofmetalloenzyme active sites. For example, both Ni-Fe and Fe-only hydrogenases, enzymes thatcatalyze the reversible oxidation of H2, contain terminal cyanide and carbonyl ligands ligatedto the iron center of the active site.[6] Furthermore, cyanide often inhibits or inactivates enzymecatalysis by binding to the enzyme active site(s) in a competitive fashion, i.e. binding at thesubstrate site. For example, cytochrome c oxidase is the target of cyanide poisoning in higherorganisms.[7] Inhibitor binding often alters the spectroscopic characteristics of the enzymes,such that these spectroscopic changes can be used as probes providing mechanistic insightconcerning the location of inhibitor ion/substrate binding.
Of particular interest in this laboratory is a class of metalloenzymes found in anaerobic bacteriaand archaea, carbon monoxide dehydrogenases (COdHs) and acetyl coenzyme A synthase.[8] These metalloenzymes catalyze the interconversion of CO and CO2 and the synthesis ofacetyl coenzyme A, respectively. Crystallographic studies have shown the C-cluster of COdHsfrom anaerobes contain a NiFe3S4 cubane subunit ligated to an external single iron site by abridging cysteine,[9] μ-sulfido[10] or hydroxo[11] ligand. Cyanide, a known inhibitor ofCOdH,[12] has been proposed to inhibit by bridging between the nickel and the unique iron.[13] In the proposed catalytic mechanism,[14] which finds support in recent crystallographicstudies,[11] CO binds to the Ni site of the cubane and is attacked by a substrate hydroxide ionthat was formally bridging the Ni and unique Fe sites. Hydroxide attack leads to the formationof a Ni-bound carboxylate that subsequently dissociates as CO2 completing the catalytic cycle.Cyanide was found to displace substrate hydroxide, leading to the suggestion that these anionsbind to the same site. This hypothesis raises important questions regarding the role and identityof the bridging ligand in enzyme structure and catalysis. To address these issues, we sought toprepare synthetic complexes that contain a single cyanide bridge between iron and nickel.Whereas there are examples of polycyanide complexes containing a Ni-NC-Fe linkage,[15]we are unaware of either a monocyanide complex containing this bridge or any example of thelinkage isomer, Ni-CN-Fe. Herein, we detail binuclear metal complexes containing a singlecyanide bridge aimed at modeling inhibited forms of COdH, so as to provide structural andspectroscopic information applicable for analysis of the more complex active site.
2. Experimental2.1. General Procedures
All air and moisture sensitive reactions were performed under N2 using standard Schlenk linetechniques or carried out under an argon or N2 atmosphere in a Vacuum Atmospheres gloveboxequipped with a gas purification system.[16] Unless described otherwise, all reagents werepurchased from commercial sources and were used as received. Solvents were dried by passagethrough activated alumina,[17] sparged with N2, and tested with Na/benzophenone before use.Deuterated solvents and were purchased from Cambridge Isotope Laboratories and stored over4 Å molecular sieves. K13CN was purchased from Cambridge Isotope Laboratories. KCN andEt4NCl were purchased from Acros Chemical Company. ‘S3’-H2,[18] Tl[TptBu],[19]NMe4[Ni(‘S3’)(CN)],[18] [TptBu]MX (M = Fe, Co, Ni, Zn; X = Cl, Br, I)[19] [TptBu]Cu(NCCH3),[20] [PhTttBu]Cu(NCCH3),[21] and [Ni(‘S3’)]2[18] and were prepared following thepublished procedures. [TptBu]Zn(CN)[22] and its 13CN isotopomer were prepared followingthe procedure published[19] for the synthesis of [TptBu]Zn(N3) replacing NaN3 with KCN (orK13CN).
1H and 13C NMR spectra were recorded on a Bruker AC-250, AM-360, DRX-400 or AV-400MHz NMR spectrometers. NMR spectra were referenced to residual protio solvent signals atambient temperature unless noted otherwise. NMR abbreviations are as follows: s, singlet; d,doublet; t, triplet; q, quartet; m, multiplet; br, broad. 31P NMR spectra were recorded on eithera Bruker DRX-400 or AV-400 MHz NMR spectrometer using an aqueous solution of 85%
Mock et al. Page 2
Inorganica Chim Acta. Author manuscript; available in PMC 2010 September 15.
NIH
-PA Author Manuscript
NIH
-PA Author Manuscript
NIH
-PA Author Manuscript

phosphoric acid in D2O as an external reference (0 ppm). Solid-state magnetic moments weredetermined on a Johnson Matthey magnetic susceptibility balance. The magnetic susceptibilityof the sample was adjusted for diamagnetic contributions using Pascal’s constants. Mössbauerspectra were collected on a spectrometer with closed cycle refrigeration, model CCR4K,operating between 4.5 and 325 K, in constant acceleration mode. The spectrometer was fittedwith a permanent 0.3 Tesla magnet. The spectra were analyzed using the software packageWMOSS (Dr. Thomas Kent, SEE Co., Minnesota.) Isomer shifts are quoted with respect toiron metal at room temperature. Perpendicular mode, X-band EPR spectra were recorded at9.44 GHz on a Bruker EMX spectrometer equipped with a ER073 magnet, T103 resonatorcavity, ER041MR microwave bridge and ER081 power supply. Sample temperature wascontrolled by an Oxford Systems LHe cryostat system. Infrared spectra were recorded on aMattson Genesis Series FTIR spectrometer at ambient temperature and under a purge streamof nitrogen. Solid-state FT-IR samples were prepared as KBr pellets. Cyclic voltammetry wasperformed in a Vacuum Atmospheres MO-40M glovebox under an argon atmosphere using aBAS (Bioanalytical Systems) CV-50W voltammetric analyzer. A typical three-electrode singlecompartment electrochemical cell included a glassy carbon (r = 1 mm) working electrode, aAg+/Ag reference electrode and a platinum wire auxiliary electrode in 10 mL of 0.1 M [n-Bu4N][PF6] as the supporting electrolyte. IR compensation for solution resistance wasestablished prior to each measurement. Ferrocene was used as the internal standard (E 1/2 =801 mV in THF versus NHE). Substrate concentrations were in the range of 5–20 mM. Meltingpoints were taken with a Melt-Temp melting point apparatus. Elemental analyses wereperformed by Desert Analytics, Inc. Tucson AZ, or Atlantic Microlabs, Atlanta, GA.
2.2. Syntheses2.2.1. K[Ni(‘S3’)CN] (K1, K1-13CN)—Sellmann and co-workers previously reported thepreparation of the [NBu4]1[23] and [NMe4]1[18] salts of the anion [Ni(‘S3’)CN]. The K saltwas prepared and isolated as follows: potassium cyanide (0.145 g, 2.23 mmol) in 10 mLmethanol and 1 mL H2O was added to a stirring suspension of brown [Ni(‘S3’)]2 (0.685 g, 1.12mmol) in 50 mL THF. The solution color changed from brown to yellow-brown withdissolution of the solids. Following 3 hours of stirring, the solvent was removed in vacuo. Theresulting solid was redissolved in 30 mL methanol yielding a tan precipitate that was removedby filtration through a medium porosity glass frit. The solvent was removed in vacuo and thebrown solids were extracted with acetonitrile, filtered, and dried in vacuo. Trituration of thesticky brown solids with ethyl ether afforded a fine green powder that was collected by vacuumfiltration. Yield: 0.553 g, 66%. 1H NMR (d6-acetone): δ 6.95 (t, C6H4, 2 H), 7.05 (t, C6H4, 2H), 7.28 (d, C6H4, 2 H), 7.78 (d, C6H 4, 2 H). 13C NMR (d6-acetone): δ 122.2 (C5-‘S3’), 126.0(Ni-13CN), 128.3 (C4-‘S3’), 128.8 (C3-‘S3’), 130.1 (C6-‘S3’), 133.3 (C1-‘S3’), 156.3(C2-‘S3’). UV-vis (THF), λmax (ε, cm−1 M−1): 290 (20,025), 318 (sh), 422 (1200), 628 (57).IR (KBr): vCN (13CN) = 2106 (2065) cm−1. Anal. Calcd. for C13H8KNNiS3: %C, 41.95; %H, 2.16; %N, 3.76 Found: %C, 41.85; %H, 2.44; %N, 3.61.
2.2.2. Et4N[Ni(‘S3’)13CN] (Et4N1-13CN)—This complex was prepared following theliterature procedure employing K13CN.[18] IR (KBr): (v13
CN) 2067 cm−1. 13C NMR (d6-acetone): δ 122.2 (C5-‘S3’), 124.7 (Ni-13CN), 128.3 (C4-‘S3’), 128.8 (C3-‘S3’), 130.1(C6-‘S3’), 133.3 (C1-‘S3’), 156.3 (C2-‘S3’).
2.2.3. (‘S3’)Ni–CN–Fe[TptBu](2-Fe)—K1 (0.060 g, 0.161 mmol) in 5 mL of THF was addeddropwise to a stirring solution of [TptBu]FeBr (0.084 g, 0.161 mmol) in 20 mL of THF. Theresulting green-brown solution was to stirred overnight after which time a precipitate formedand the solution color changed to light brown. The solution was filtered through Celite andreduced to dryness in vacuo. The dry solid was washed with ethyl ether and a light brown solidwas collected by filtration. X-ray quality crystals were grown by slow evaporation of
Mock et al. Page 3
Inorganica Chim Acta. Author manuscript; available in PMC 2010 September 15.
NIH
-PA Author Manuscript
NIH
-PA Author Manuscript
NIH
-PA Author Manuscript

concentrated benzene or THF solution. Yield: 0.076 g, 61%. 1H NMR (C6D6): δ 67.4 (s, 4-pz), 29.5 (s, 5-pz), 18.4 (br, B-H), 9.5 (s, C6H4), 9.1 (s, C6H4), 8.3 (s, C6H4), 7.4 (s,C6H4), 3.3(br, 3-pz-C(CH3)3). UV-vis (THF), λmax (ε, cm−1 M−1): 262 (29,000), 290 (29,000), 320 (sh),412 (1900), 640 (160). IR (KBr): (vCN) = 2120 cm−1,(vBH) = 2493 cm−1. μeff (solid, 294 K) =5.4(1) μB. Anal. Calcd. for C34H42BFeN7NiS3: %C, 53.01; %H, 5.49; %N, 12.72 Found: %C,52.75; %H, 5.20; %N, 12.36.
2.2.4. (‘S3’)Ni–CN–Co[TptBu] (2-Co)—To a stirring solution of [TptBu]CoI (0.100g 0.176mmol) in 20 mL of THF was added K1 (0.066g 0.176 mmol) in 5 mL THF. The solution wasstirred under N2 overnight during which time the color changed from blue to dark green. Thesolution was filtered through Celite to remove the white precipitate (KI). The resulting deepgreen solution was dried in vacuo affording a green solid. X-ray quality crystals were grownby cooling a concentrated toluene solution to –25° C for 48 hours. Yield: 0.121 g, 89%. 1HNMR (C6D6): δ 75.6 (s, 4-pz), 34.8 (s, 5-pz), 7.5 (s, C6 H 4), 7.3 (s, C6 H 4), 7.1 (br, 3-pz-C(CH 3)3), 6.8 (s, C6 H 4), 6.3 (s, C6 H 4), −5.8 (br, B-H). UV-vis (THF), λ max (ε, cm−1 M−1):262 (28,000), 290 (29,000), 321 (sh), 405 (2500), 573 (970), 604 (1287), 623 (1337). IR (KBr):(v CN) = 2132 cm−1, (v BH) = 2494 cm−1. μ eff (solid, 293 K) = 4.2(1) μ B. Anal. Calcd. forC37.50H46BCoN7NiS3: %C, 54.96; %H, 5.65; %N, 11.96. Found: %C, 54.40; %H, 5.59; %N,12.16.
2.2.5. (‘S3’)Ni–CN–Ni[TptBu] (2-Ni)—K1 (0.087g, 0.236 mmol) in 10 mL of THF wasadded dropwise to a stirring solution of [TptBu]NiCl (0.111g, 0.236 mmol) in 10 mL of THF.The resulting solution was stirred for 6 hours during which time the color turned dark red. Thered solution was filtered through Celite and reduced to dryness in vacuo. The solid was washedwith ethyl ether and a dark red product was collected by filtration. X-ray quality crystals weregrown by evaporation of a concentrated 1,3,5 trimethylbenzene solution under a slow streamof N2. Yield: 0.044 g, 25%. 1H NMR (C6D6): δ 86.5 (s, 4-pz), 18.7 (s, 5-pz), −13.0 (br, B-H), 7.6 (s, C6 H 4), 7.4 (s, C6 H 4), 7.3 (s, C6 H 4), 7.1 (s,C6 H 4), 5.75 (br, 3-pz-C(CH 3)3).UV-vis (THF), λ max (ε, cm−1 M−1): 264 (14,500), 289 (18,000), 320 (sh), 409 (1300), 559(270), 809 (67). IR (KBr): (v CN) = 2124 cm−1, (v BH) = 2494 cm−1. μ eff (solid, 293 K) = 3.6(2) μ B. Anal. Calcd. for C38.50H48BN7Ni2S3: %C, 55.50; %H, 5.80; %N, 11.76. Found: %C,55.93; %H, 5.80; %N, 10.87.
2.2.6. (‘S3’)Ni–CN–Zn[TptBu] (2-Zn)—K1 (0.077 g, 0.207 mmol) in 10 mL of THF wasadded dropwise to a stirring solution of [TptBu]ZnCl (0.100 g, 0.207 mmol) in 20 mL of THF.The resulting brown colored solution was stirred overnight, then filtered through Celite andreduced to dryness in vacuo. The solid was extracted with 1,3,5 trimethylbenzene. The solublematerial was isolated by filtration through Celite and dried in vacuo. X-ray quality crystalswere grown by slow evaporation of a concentrated methylene chloride solution. Yield: 0.069g, 43%. 1H NMR (C6D6): δ 7.61 (d, C6H4, 2 H), 7.21 (d, C6H4, 2 H), 7.18 (s, 5-pz, 3 H), 6.79(t, C6H4, 2 H), 6.59 (t, C6H4, 2 H), 5.69 (s, 4-pz, 3 H), 1.51 (s, 3-pz-C(CH3)3, 27 H). 13C NMR(C6D6): δ 165.8 (3-pz), 154.8 (C2-‘S3’), 153.6 (Ni–13CN–Zn), 136.6 (5-pz), 136.2 (C1-‘S3’),133.2 (C6-‘S3’), 130.4 (C3-‘S3’), 129.0 (C4-‘S3’), 122.5 (C5-‘S3’), 103.0 (4-pz), 32.4 (C(CH3)3), 31.2 (C(CH3)3). UV-vis (THF), λmax (ε, cm−1 M−1): 321 (sh), 400 (745). IR (KBr):vCN, (13CN) = 2152, (2109) cm−1, vBH2494, (2497) cm−1. Anal. Calcd. forC35H44BCl2N7NiS3Zn: %C, 48.61; %H, 5.13; %N, 11.33. Found: %C, 48.68; %H, 5.36; %N,11.46.
2.2.7. [NEt4][(‘S3’)Ni–CN–Cu(TptBu)] (2-Cu)—NEt41 (0.048 g, 0.103 mmol) in a 5 mLTHF/CH3CN (4:1) solution was added dropwise to a stirring solution of [TptBu]Cu(NCCH3)(0.053g, 0.110 mmol) in 20 mL THF. The orange solution was stirred for 8 hours, filteredthrough Celite, and reduced to dryness in vacuo. The product was recrystallized by diffusion
Mock et al. Page 4
Inorganica Chim Acta. Author manuscript; available in PMC 2010 September 15.
NIH
-PA Author Manuscript
NIH
-PA Author Manuscript
NIH
-PA Author Manuscript

of pentane into a THF solution. Crystalline yield: 0.066 g, 70%. 1H NMR (d 6-acetone): δ 7.82(d, C6H4, 2 H), 7.36 (s, 5-pz, 3 H), 7.33 (d, C6H4, 2 H), 7.10 (t, C6H4, 2 H), 6.97 (t, C6H4, 2H), 5.84 (d, 4-pz, 3 H), 3.39 (q, (CH2CH3)4N 8 H), 1.48 (s, 3-pz-C(CH3)3, 27 H), 1.31 (t,(CH2CH3)4N, 12 H). 13C NMR (d6-acetone): δ 161.6 (3-pz), 156.5 (C2-‘S3’), 133.4 (5-pz),133.2 (C1-‘S3’), 130.1 (C6-‘S3’), 128.9 (C3-‘S3’), 128.5 (Ni-13CN-Cu), 128.3 (C4-‘S3’),122.2 (C5-‘S3’), 100.1 (4-pz), 52.9 ((CH2CH3)4N), 32.6 (C(CH3)3), 31.3 (C(CH3)3), 7.62((CH2CH3)4N). UV-vis (THF), λmax (ε, cm−1 M−1): 368 (sh), 419 (1681). IR (KBr): v CN,(v13
CN) = 2127, (2081) cm−1 (weak), vBH2430, (2432) cm−1. Anal. Calcd. forC42H62BCuN8NiS3: %C, 55.54; %H, 6.88; %N, 12.34. Found: %C, 55.59; %H, 6.95; %N,12.48.
2.2.8. Et4N{[(κ2–PhTttBu)Cu]2(μ-CN)} 3—[NEt4]CN (0.012 g, 0.076 mmol) wasdissolved in 1 mL of acetonitrile and added to a stirring solution of [PhTttBu]Cu(NCCH3)(0.080 g,. 0.16 mmol) in 20 mL of acetonitrile. The solution was stirred overnight, filteredthrough Celite and the solvent was removed in vacuo. The off-white solid was extracted withTHF, filtered through Celite and reduced to dryness under vacuum affording a white solid.Crystals were grown by vapor diffusion of pentane into a benzene solution or alternatively, byslow evaporation of concentrated acetonitrile solution. Crystalline Yield: 0.060 g, 75%. 1HNMR (CD3CN): δ 7.31 (s, o-(C6 H 5)B, 4 H), 7.04 (t, m-(C6 H 5), 4 H), 6.89 (t, p-(C6 H 5)B,2 H), 3.13 (q, (CH 2CH3)4N, 8 H), 1.87 (s, CH 2 B, 12 H), 1.29 (s, (C(CH 3)3, 54 H), 1.18 (t,(CH2CH 3)4N, 12 H). 13C NMR (CD3CN): δ 132.9 ((o-C 6H5)B), 127.4 ((m-C 6H5)B), 124.2((p-C 6H5)B), 53.0 ((CH2CH3)4N), 43.7 (CH2B), 30.2 (C(CH3)3), 7.75 ((CH2 CH3)4N). UV-vis (THF), λ max (ε, cm−1 M−1): 220 (sh). IR (KBr): (v CN) = 2121 cm−1. Anal. Calcd. forC51H96BCuN2S6: %C, 56.80; %H, 8.97; %N, 2.59. Found: %C, 56.86; %H, 8.68; %N, 2.46.
2.2.9. [TptBu]Zn13CN—This complex was prepared following the reported procedure[22]employing K13CN. IR (KBr): (νBH) = 2526 cm−1. 13C NMR (C6D6): δ 30.92 (C(CH3)3, 32.1(C(CH3)3, 102.5 (4-pz), 135.9 (5-pz), 137.7 (Zn-13CN), 165.1 (3-pz).
2.3. Density functional calculationsCalculations were performed using Gaussian03.[24] Input atomic coordinates were derivedfrom crystallographic determined structures. For computational expediency, the tert-butylmoieties of the TptBu ligand were replaced with hydrogens. Molecular structures wereoptimized using the BLYP functional, Ahlrich’s polarized triple-ζ quality basis set (TZVP) onzinc, nickel, copper, cyanide, sulfur, and the metal-bound pyrazolyl-nitrogen, and polarizedsplit valence basis set on remaining atoms. Calculations using the BP86 method were alsoperformed and yielded qualitatively similar results. Density fitting was employed andgeometries were optimized to tight convergence criteria, which necessitated the use of tightSCF cutoffs and an ultrafine integration grid. To verify that each optimized structure was infact a stationary point on the potential energy surface, analytical frequency calculations wereperformed, and no imaginary frequencies were obtained. Calculations aimed at the reliabilityof the wavefunctions with respect to open shell instabilities were also performed, anduncovered no lower energy solutions. Single point calculations were performed using thehybrid functional B3LYP with a balanced triple-ζ quality basis set, 6–311+g(d), on all atoms.The final energy was the sum of the electronic energy from the single point calculations andthe thermal corrections from analytical frequency calculations at 298.15 K.
2.4. X-ray CrystallographyX-ray structural analysis for 2-Fe•0.5(thf), and 2-Zn•(pentane): Crystals were mounted usingviscous oil on glass fibers and cooled to the data collection temperature. Data were collectedon a Brüker-AXS APEX CCD diffractometer with graphite-monochromated Mo-Kα radiation(λ=0.71073 Å). Unit cell parameters were obtained from 60 data frames, 0.3º ω, from three
Mock et al. Page 5
Inorganica Chim Acta. Author manuscript; available in PMC 2010 September 15.
NIH
-PA Author Manuscript
NIH
-PA Author Manuscript
NIH
-PA Author Manuscript

different sections of the Ewald sphere. No symmetry higher than triclinic was observed for 2-Fe•0.5(thf) and solution in the centrosymmetric space group option yielded chemicallyreasonable and computationally stable results of refinement. The systematic absences in thediffraction data are consistent with Cmc21 and Cmcm for 2-Zn•(pentane). Only solution in thespace group Cmc21 for 2-Zn•(pentane) yielded chemically reasonable and computationallystable results of refinement. The absolute structure parameter refined to nil indicating that thetrue hand of the data for Zn•(pentane) had been determined. The data sets were treated withSADABS absorption corrections based on redundant multiscan data.[25] The structures weresolved using direct methods and refined with full-matrix, least-squares procedures on F2. Twosymmetry unique but chemically identical compound molecules and one thf solvent moleculeare located in the asymmetric unit of 2-Fe•0.5(thf). The compound molecule lies on a mirrorplane in 2-Zn•(pentane). Disordered solvent molecules of crystallization were treated asdiffused contributions.[26] Slight disorder, caused by the rotation of the t-butyl groups, whichcannot be modeled because of the <1 Å difference in the disordered atomic positions, yieldedless than optimal Ueq ranges. All non-hydrogen atoms were refined with anisotropicdisplacement parameters. All hydrogen atoms were treated as idealized contributions. Structurefactors and anomalous dispersion coefficients are contained in the SHELXTL 6.12 programlibrary.[25] The crystallographic details for isostructural compounds 2-Co•2(toluene), 2-Ni•0.5(mesitylene), 2- Zn•2(CH2Cl2) and 2-Cu•0.5(pentane)•(thf) are reported in thesupplementary material. These structures have been deposited with the CambridgeCrystallographic Data Centre under CCDC 718982 [2-Fe•0.5(thf)], 718983 [2-Co•2(toluene)],718983 [2-Ni•0.5(mesitylene)], 718984 (2-Zn), 718985 [2-Zn•(pentane)], and 718986 [2-Cu•0.5(pentane)•(thf)].
3. Results and discussion3.1. Synthesis of cyanide-bridged binuclear complexes 2-Fe, 2-Co, 2-Ni, 2-Zn
The synthesis of a series of cyanide-bridged binuclear complexes proceeds by the coupling oftwo independently ligated metal complexes, Scheme 1. We chose the monoanion [Ni(CN)(‘S3’)]−, 1–, (‘S3’ = bis(2-mercaptophenyl)sulfide) first prepared by Sellmann[18] due to itssulfur-rich ligation and square planar stereochemistry, the latter characteristic ensuring adiamagnetic complex. As emphasized by Holm is his recent studies,[27] the Ni site in COdHhas approximate square planar coordination despite being contained within the NiFe3S4 core.The nickel(II) ion is ligated by the tridentate thioether-dithiolate ligand (‘S3’) and a cyanideligand. The second portion of the cyanide-bridged complexes consists of the [TptBu]Mfragment. The sterically demanding [TptBu] ligand[19] allows for the isolation of monomericmetal halide complexes, [TptBu]MX, (M = Fe, Co, Ni, Zn; X = Cl, Br or I) as suitable precursorsto the targeted binuclear complexes.
Initial attempts to synthesize the cyanide-bridged binuclear complexes using Et4N1 resultedonly in recovery of the starting materials. Consequently, the synthetic protocol of Sellmannwas altered to permit for isolation of K1 reasoning that the potassium would add to the drivingforce of the coupling reaction via precipitation of KCl. Indeed, the room temperature reactionof K1 with [TptBu]MX in THF produces the cyanide-bridged binuclear complexes (‘S3’)Ni–CN–M[TptBu] (M = Fe (2-Fe), Co (2-Co), Ni (2-Ni), Zn (2-Zn)) in variable yields. X-raydiffraction studies confirmed the formation of the isostructural series of binuclear cyanide-bridged complexes, vide infra.
3.2. X-ray structures of cyanide-bridged binuclear complexes 2A representative thermal ellipsoid plot (2-Fe) of the molecular structures of 2 is depicted inFigure 1, and selected metric parameters summarized in Table 1. Plots of the isostructuralcomplexes along with X-ray collection and refinement data are available in the Supplementary
Mock et al. Page 6
Inorganica Chim Acta. Author manuscript; available in PMC 2010 September 15.
NIH
-PA Author Manuscript
NIH
-PA Author Manuscript
NIH
-PA Author Manuscript

Material. The general structural features of the complexes are quite similar, supporting thecompositions and structures assigned based on spectroscopic evaluation, vide infra. The[TptBu]M fragment maintains its pseudo-tetrahedral geometry ligated to the linear cyanidebridge via the nitrogen atom. The cyanide is coordinated via the carbon atom to the squareplanar nickel ion. The M–NC distances fall within a very narrow range, decreasing across theperiod, from 1.980(2) Å for 2-Fe to 1.925(2)/1.927(2) Å for 2-Zn. The M–N bond lengths areconsistent with the M2+ oxidation state assignment. The M–N–C and Ni–C–N angles are allwithin a few degrees, at most, to linear. The Ni–CN distances at ~1.850 Å, are insensitive tothe identity of the second metal, whereas, the C–N distances fall within 1.135 to 1.163 Å, voidof any apparent trends. The nickel ‘S3’ coordination sphere is composed of two thiolate sulfurdonors and one thioether sulfur donor with the tridentate ligand exhibiting a butterfly puckeras noted by Sellmann[18] in which the thiolate sulfur atoms lie slightly below the idealizedsquare plane and the thioether sulfur atoms lie slightly above the plane.
3.3. Spectroscopy of cyanide-bridged binuclear complexes 2The room temperature proton NMR spectra of 2-Fe, 2-Co and 2-Ni exhibit well dispersedparamagnetically-shifted signals for protons of the [TptBu]M fragments with the number ofsignals indicating three-fold symmetry of the ligand. The t-butyl groups of the [TptBu] ligandsappear as broad signals downfield of the diamagnetic ligand, δ = 3.3 for 2-Fe, 7.1 for 2-Co and5.7 for 2-Ni. The 4-pz and 5-pz protons of the pyrazoyl rings and the B–H proton exhibit widechemical shift dispersions, similar to those for analogous [TptBu]MX complexes. In eachcomplex, the ‘S3’ ligand displays four signals consistent with the mirror symmetry.Interestingly, in 2-Fe these signals also exhibit small paramagnetic shifts. These slightdownfield shifts are attributed to a through space dipolar shift interaction[28] caused by theparamagnetic iron. It is unlikely that a Fermi contact interaction is at the origin of theparamagnetic contributions to the phenyl proton chemical shifts due to the fact that the pathwaythrough which spin could be delocalized is common amongst 2-Fe, 2-Co, and 2-Ni.Specifically, in each complex, the magnetic orbitals are involved in cyanide binding, thus aFermi contact shift would be expected for each complex. A dipolar shift mechanism isreasonable when considering (i) the smaller spin states of 2-Co (S = 3/2) and 2-Ni (S = 1)compared to 2-Fe (S = 2) and (ii) the magnetic anisotropy as reflected in the molecular g-tensors, specifically, g ||, estimated at ~2.2 for 2-Ni,[29] 5.2 for 2-Co, and ~8.5 for 2-Fe.[30]The 1H NMR spectrum of diamagnetic 2-Zn is consistent with its structure as determined byX-ray diffraction.
The solid-state magnetic moments of solid samples of 2-Fe, 2-Co and 2-Ni were determinedusing a magnetic susceptibility balance. In each case, the magnetic moment was consistentwith the expected ground states as follows: 2-Fe, μ eff = 5.4(1) μ B for S = 2; 2-Co, μ eff = 4.2(1) μ B for S = 3/2; 2-Ni, μ eff = 3.6(2) μ B for S = 1.
The electronic absorption spectra of 2-Fe, 2-Co, 2-Ni and 2-Zn in THF displays two highenergy Ni←Sthiolate and Ni←Sthioether ligand-to-metal charge transfer (LMCT) bands locatedat ca. 260 and 290 nm and a Ni←CN metal-to-ligand charge transfer band (MLCT) at ~400nm. These assignments are based on a comparison with the spectrum of the anion, [(‘S3’)Ni(CN)]–, which displays nearly identical bands. The square planar nickel also displays a weakligand field transition located at ~600 nm; this feature is observed in 2-Fe, 2-Ni and 2-Zn.[31] In 2-Co the Ni ligand field band is obscured by the Co ligand field transitions at 573 nm604 nm and 623 nm, energies typical of tetrahedral cobalt(II) complexes.[32] 2-Ni also displaystwo absorption features, located at 559 nm and 809 nm, assigned as ligand field transitions forthe tetrahedral nickel site.
Mock et al. Page 7
Inorganica Chim Acta. Author manuscript; available in PMC 2010 September 15.
NIH
-PA Author Manuscript
NIH
-PA Author Manuscript
NIH
-PA Author Manuscript

3.3.1. Infrared spectra of 2—Terminal M–CN linkages typically exhibit sharp, intenseνCN modes between 2000 and 2200 cm−1.[33] The 13CN isotopically-labeled complexes weresynthesized in order confirm spectral assignments and to address the issue of CN linkageisomerism in the bridged complexes as detailed later in this paper.
Upon formation of the cyanide-bridged complexes, the ν CN frequency shifts to higher energy,Figure 2 and Table S-3 and Table S-4 (Supplementary material). The frequency shift rangesfrom 14 – 46 cm−1 depending on the identity of the metal ion with the order increasing, 2-Fe< 2-Ni < 2-Co < 2-Zn. Increases in ν CN values for M–CN–M’ compared with M–CN are welldocumented.[5,33,34] Typically the ν CN increase has been rationalized as a consequence ofthe donation of σ-electron density from the antibonding lone pair on nitrogen. The depopulationof the antibonding orbital strengthens the CN triple bond, leading to an increase in ν CN.[1]The kinematic effect,[35] or the restraint of the CN group due to the attachment of a secondmass, has also been offered to explain the observed increase of ν CN in bridging complexes.However, a recent study has found that this effect has been overestimated and suggests thatthe kinematic effect does not contribute significantly to the observed ν CN frequency increase.[5] In the present series of complexes, a correlation between the ν CN value and M–N bondlength is noted, wherein the complex with the shortest M–N bond length has the highestν CN value. This trend is consistent with the analysis above, as removal of electron densityfrom the cyanide N lone pair strengthens the CN bond.
A number of factors can influence CN vibrational energy including metal oxidation state andC–N–M bond angle. Notable examples in biological systems include studies on COdH andcytochrome c oxidase. Infrared spectroscopic studies of COdH enzyme incubated with cyanidedemonstrated a very low energy CN stretch at 2037 cm−1.[36] It was postulated that the causeof the low energy vibration was due to carbon-bound cyanide coordination to a strongly π-donating metal (suggested to be Fe) in combination with a bent M–CN–M’ bridge. Supportingthe latter hypothesis, similarly low ν CN energies were observed in synthetic models of aninhibited form of cytochrome c oxidase containing a Fe(III)–CN–Cu(II) linkage, with thefrequency decreasing up to 60 cm–1 as the C–N–Cu bond angle decreased.[34]
The νBH vibrational mode is sensitive to electronic changes in the metal coordination sphereand can be used to indicate binuclear complex formation. The ν BH of the cyanide-bridgedcomplexes shifts to lower energy as compared to the energy for the [TptBu]MX startingmaterials. Interestingly, the ν BH value of ca. 2494 cm−1 is invariant among the complexeswithin the series. This significant change in stretching frequency upon bridge formationindicates that the [(‘S3’)Ni(CN)]– fragment is a weaker σ-donor than the halide substituents ofthe [TptBu]MX precursors, resulting in reduction of negative charge at boron.[37]
3.3.2. Electrochemical Characterization of Cyanide-Bridged BinuclearComplexes 2—Cyclic voltammetry experiments were conducted to establish the redoxcharacteristics of the series of binuclear cyanide-bridged complexes. These electrochemicaldata are summarized in Table 2 (potentials referenced vs. NHE). Each complex exhibits a quasi-reversible cathodic wave in the range ca. –1.0 to –1.2 V. Given the similarity among thesecomplexes and with the monomeric precursor, K[(‘S3’)Ni(CN)], this feature is ascribed to theNi(II)/Ni(I) couple of the square planar nickel site, although (‘S3’) ligand-based reductionaffords an alternative site to house the added electron. The CV of 2-Ni displays a cathodicreduction wave at –0.96 V assigned as the Ni(II)/Ni(I) reduction for [TptBu]Ni. For calibration,the reduction wave observed for [TptBu]NiCl is at –0.91 V. The reduction potential for thetetrahedral site in 2-Ni is lower than the square planar (‘S3’)Ni site due to the ability of thetetrahedral Ni site to support the Ni(I) oxidation state because of the lower energy of anavailable metal orbital (t 2-like symmetry) as compared to the higher energy LUMO (dx2–y2)of the square planar site.
Mock et al. Page 8
Inorganica Chim Acta. Author manuscript; available in PMC 2010 September 15.
NIH
-PA Author Manuscript
NIH
-PA Author Manuscript
NIH
-PA Author Manuscript

2-Co exhibits an irreversible cathodic wave at –1.73 V assigned to the Co(II)/Co(I) reductionbased on comparison with [TptBu]CoI. 3-Fe exhibits two irreversible cathodic waves at –2.02and –2.33 V, tentatively assigned as the Fe(II)/(I) and Fe(I)/Fe(0) reductions, respectively.
3.3.3. Mössbauer Spectroscopy of 2-Fe—The Mössbauer spectrum of 2-Fe at 4.4 K ina magnetic field of 0.03 T exhibits a quadrupole doublet with an isomer shift, δ = 0.94(3) mm/s and quadrupole splitting ΔE Q = 2.61(2) mm/s. The large isomer shift and quadrupole splittingare in the ranges corresponding to high-spin ferrous pseudo-tetrahedral species.[38] Mössbauerparameters of the C-cluster of COdH ferrous component II, FCII, (the unique iron) are ΔE Q= 2.82 mm/s and δ = 0.82 mm/s,[39] suggesting a pentacoordinate iron.[40] Interestingly, uponaddition of cyanide to COdH, the quadrupole splitting changed to ΔE Q = 2.53 mm/s, whilethe isomer shift remained the same.
3.3.4. Electron paramagnetic resonance of 2-Co—The EPR spectrum of 2-Corecorded in toluene at 5 K exhibits a broad rhombic signal with effective g-values, g = 5.3, 4.2and 2.2. These broad features are typical for high-spin, S = 3/2, tetrahedral cobalt(II) due tothe 59Co (I = 7/2) nuclear spin. Similar, broad EPR spectra have been reported for themononuclear complex [PhBPiPr]CoI with g ≈ 4.8 and g ≈ 2.2.[41] A similar EPR signal wasreported for the cobalt substituted rubredoxin model complex (Et4N)2[Co(SC6H4-p-Cl)4] witheffective g-values, g = 4.8, 3.6 and 2.08.[42]
3.4. Cyanide-bridged binuclear complex Et4N{(‘S3’)Ni–CN–Cu[TptBu]} 2-CuSynthetic efforts to prepare the copper(II) cyanide-bridged binuclear complex commencingwith [TptBu]CuCl proved unsuccessful. Thus, we turned to copper(I) precursors given thestability and established reactivity of copper(I) nitriles. The ionic complex Et4N{(‘S3’)Ni–CN–Cu[TptBu]}, 2-Cu, was isolated in good crystalline yield following the addition of Et4N1 to aTHF solution of [TptBu]Cu(NCCH3),[20] Scheme 2.
3.4.1. X-ray structure of 2-Cu—The molecular structure of the anion of 2-Cu, which isisostructural with the other, neutral derivatives in this series is provided in the SupportingInformation with selected metric parameters for the anion contained in Table 1. The coppercoordination sphere is composed of three nitrogens from the [TptBu] ligand and a nitrogen ofthe cyanide ligand. The average Cu-N bond length from the nitrogen donors of the [TptBu]ligand is 2.100(2) Å, notably longer than the average Cu-N bond length of 2.064(5) Å in[TpiPr2]Cu(NCCH3).[43] The Cu-NC distance is 1.890(2) Å, the shortest within the series ofcomplexes reported here, and similar to the Cu-N bond of coordinated acetonitrile in [TpiPr2]Cu(NCCH3) at 1.875(6) Å. The Ni–CN–Cu linkage is linear. The square planar nickel(II)coordination sphere is composed of two thiolate sulfur donors at 2.1685(8) Å and 2.1814(8)Å and a thioether sulfur at 2.1108(7) Å. The fourth coordination site is occupied by the cyanideligand with a Ni-C bond distance of 1.856(2) Å. The C–N bond length of the bridging cyanideligand in 5 was found to be 1.148(3) Å, matching the C–N bond length of 1.153 Å in Me4N1.[18]
3.4.2. Spectroscopy of 2-Cu—The electronic absorption spectrum of diamagnetic 2-Cuin THF solution displays the bands of the nickel fragment: two high energy Ni←Sthiolate andNi←Sthioether LMCT bands at 261 and 290 nm. An absorption feature at 419 (1680 M−1
cm−1) nm is assigned to a Ni←CN MLCT as seen for the other complexes of this series.
The solid state IR spectrum of 2-Cu displays a very weak ν CN band at 2127 cm−1 and aν BH mode at 2429 cm−1. The frequencies of these two modes are in accord with the frequenciesfor the neutral binuclear analogues. To confirm assignment of the unusually weak ν CNmode, 13CN-enriched 2-Cu-13CN was prepared. This sample displays a weak ν CN mode at
Mock et al. Page 9
Inorganica Chim Acta. Author manuscript; available in PMC 2010 September 15.
NIH
-PA Author Manuscript
NIH
-PA Author Manuscript
NIH
-PA Author Manuscript

2081 cm–1; the shift in energy is in quantitative agreement with reduced mass considerations,i.e. ca. 2082 cm–1. The unusually weak ν CN signal intensity indicates a small dipole momentchange associated with the vibration. As a consequence of the overall negative charge of 2-Cu the charge distribution is such that the normally large CN dipole is significantly diminished.This assertion is supported by DFT calculations, vide infra.
The 13C NMR spectrum of 2-Cu-13CN contains an intense singlet at δ = 128.5, ascribed to thebridging ligand. Interestingly, this signal is shifted only slightly downfield of that for theenriched starting material, Et4N1-13CN at δ = 124.7. In contrast, the 13C NMR signal for 2-Zn- 13CN, δ = 153.6, exhibits a 28 ppm downfield shift indicating that in neutral 2-Zn thecyanide carbon is significantly deshielded relative to the monomeric precursor. A similardownfield shift of the 13C NMR resonance has been observed upon bridge formation in(CO)5W–CN–Cu(PPh3)3, δ = 147.8, relative to the anionic precursor, Na[(CO)5W(CN)], δ =136.4.[44] As with the analysis of the intensity difference of the ν CN bands, the chargedistribution in the anion of 2-Cu impacts its 13C NMR spectral feature.
The cyclic voltammogram of 2-Cu exhibits an irreversible Ni(II)/Ni(I) cathodic wave at –1.27V, similar in value to this reduction in the neutral complexes. An irreversible anodic wave at0.81 V is ascribed to the Cu(II)/Cu(I) couple. The irreversible electrochemical behaviorindicates that upon oxidation to copper(II) 2-Cu is unstable or undergoes a structural change.While it is perhaps surprising that the oxidized product is electrochemically unstable, this resultis consistent with our inability to independently prepare the neutral Ni–CN–Cu(II) complex.A second irreversible anodic wave is located at 1.19 V is tentatively ascribed to (‘S3’) ligandoxidation.
3.4.3. DFT analysis of 2-Cu—DFT calculations were performed on 2-Cu to clarify theunusually weak νCN intensity. In the computational model, the tert-butyl groups of the[TptBu] ligand were replaced with hydrogens, i.e. [Tp]. The optimized structure closelyresembles the experimentally determined structure of 2-Cu, Table 3. The key DFT derivedvibrational bands, νBH = 2449 cm–1 and νCN = 2107 cm–1 are in good agreement with theexperimental values, 2429 and 2127 cm–1, respectively. The weak νCN intensity is reflected inpart, in the value of the dipole moment of the anion. A comparison of the calculated dipolemoments of 2-Cu with 2-Zn and its linkage isomer 2-Zn’ reveals a significantly lower dipolemoment, μ = 1.6440 D in the former compared to μ = 9.2796 D and 9.6028 D, in the latter twocomplexes. The correlation between the gas-phase DFT calculations and the experimentalsolid-state IR measurements indicates that this phenomenon is not a consequence of ion-pairingin the solid state.
3.5. Cyanide-bridged binuclear complex Et4N{[(κ2–PhTttBu)Cu]2(μ-CN)} 3Following the preparation of cyanide-bridged binuclear complexes detailed in the precedingsections, efforts to extend this series of complexes using the tetrahedral metal precursors,[PhTttBu]MCl (PhTttBu = phenyl(tris(tert-butylthio)methyl)borate, M = Fe, Co, Ni, Zn)[45] inlieu of [TptBu]MX were investigated. These condensation reactions proved uniformlyunsuccessful due to lability of the [PhTttBu] Ligand under the reaction conditions. Subsequentsynthetic efforts focused on the analogous reaction in Scheme 2, substituting the monovalentcopper complex [PhTttBu]Cu(NCCH3) for [TptBu]Cu(NCCH3). This reaction affordedunanticipated products, Et4N{[(κ2–PhTttBu)Cu]2(μ-CN)}, 3, and the known nickel dimer [Ni(‘S3’)]2. The formation of 3 suggests that the copper(I) complex extracts cyanide from thenickel complex, perhaps via intermediacy of undetected {(‘S3’)NiCNCu[PhTttBu]}–. Theresulting (‘S3’)Ni fragments couple yielding [Ni(‘S3’)]2. The independent reaction of[PhTttBu]Cu(NCCH3) with half an equivalent of [NEt4]CN produces the 3 in 75 % yield.
Mock et al. Page 10
Inorganica Chim Acta. Author manuscript; available in PMC 2010 September 15.
NIH
-PA Author Manuscript
NIH
-PA Author Manuscript
NIH
-PA Author Manuscript

3.5.1. Spectroscopy of 3—The proton NMR spectrum of 3 in d3-acetonitrile exhibitedsingle tert-butyl and methylene proton resonances, δ = 1.29 and 1.87, respectively, indicatingmagnetic equivalence of the thioether groups consistent with either symmetric ligation of the[PhTttBu] ligand or that the thioether arms are in fast exchange on the NMR timescale. Suchphenomena have been previously noted, for example in [κ2-PhTttBu]Ni(η3-allyl).[46]
Compound 3 exhibits a medium intensity vCN = 2121 cm−1 for the bridging CN ligand. Thisband is similar in energy to the weak CN vibrational mode in the anionic 2-Cu located at 2127cm−1, but with an intensity more characteristic of the other cyanide containing complexes.
3.6. Cyanide Linkage IsomersHere we describe efforts to assemble the cyanide-bridged linkage isomer of 2-Zn, denoted as2-Zn’, for the purpose of establishing its structural and spectroscopic characteristics incomparison with 2-Zn. The strategy for the synthesis of the series of cyanide-bridged binuclearcomplexes described above, highlights the approach of coupling of two metal complexes inwhich the cyanide ligand is affixed to one of the precursors. Implicit in this strategy is theassumption that under kinetic control bridge formation proceeds without cyanideisomerization. With this consideration in mind, reaction of [TptBu]MCN with [Ni(‘S3’)]2should yield the corresponding isomer of 2 (at least under kinetic control). It is noted that therelated trimer, [Ni(‘S3’)]3 undergoes facile bridge rupture in reactions with nucleophilesincluding KCN.[23] Very few four-coordinate tetrahedral metal complexes with terminalcyanide ligands have been reported and attempted syntheses in our laboratory have been largelyunsuccessful. This reality limits the scope of this investigation. However, the application ofknown [TptBu]ZnCN[22] permits us to test the validity of this approach, Scheme 3. As theNiZn binuclear complexes are diamagnetic, a direct comparison of the reaction products isamenable to NMR interrogation.
3.6.1. X-ray diffraction analyses—Addition of [TptBu]ZnCN to suspension of [Ni(‘S3’)]2 in THF produced upon workup a brown solid in 48% yield. X-ray quality crystals weregrown by slow diffusion of pentane into a concentrated 1,3,5 trimethylbenzene solution. Theproposed 2-Zn’ material was recrystallized by pentane diffusion into concentrated mesitylenesolution which yielded unsolvated crystals different from 2-Zn•2CH2Cl2. The molecule lieson a crystallographic mirror plane rendering each half of the complex metrically equivalent.The data set was alternatively modeled as the two isomers, 2-Zn and 2-Zn’, Fig. 3. The 2-Zn model passed the Hirshfeld Rigid-Bond Test,[47] which is a test for the agreement ofthermal parameters for adjacent, bonded atoms. The 2-Zn’ model failed this test because thecyanide atoms (C20‘ and N5’) were apparently misidentified. Nonetheless, while these datasupport isomerization to the 2-Zn form, detailed spectroscopic studies were undertaken ineffort to confirm the identity of this isomer.
3.6.2. Spectroscopic analyses—The proton NMR spectra of the products derived for thetwo independent synthetic routes are indistinguishable and do not warrant further description.Table 4 contains 13C NMR and infrared spectroscopic data for the 13CN labeled precursorsand the products. The two products, 2-Zn and proposed 2-Zn’, exhibit identical 13CN chemicalshifts, δ = 153.3. This result clearly supports the assertion that the products are identical.Further, the lack of a second cyanide signal rules out the possibility of compositional disorder(at least at concentrations detectable by NMR). In a relevant report of cyanide bridged linkageisomers, Darensbourg and co-workers prepared (CO)5W–CN–Cu(PPh3)3 and (CO)5W–NC–Cu(PPh3)3 by two different synthetic routes, the products affording different spectralcharacteristics distinguishable by 13C NMR spectroscopy.[44] The latter was found to undergorearrangement in solution forming thermodynamically favored, (CO)5W–CN–Cu(PPh3)3.Therefore, our 13C NMR data indicate only 2-Zn is generated here.
Mock et al. Page 11
Inorganica Chim Acta. Author manuscript; available in PMC 2010 September 15.
NIH
-PA Author Manuscript
NIH
-PA Author Manuscript
NIH
-PA Author Manuscript

Solid-state IR spectra of the samples of 2-Zn and proposed 2-Zn’ (and their 13CN-labeledforms) exhibit ν CN bands within four wavenumbers of one another, Table 4. The congruenceof these values further suggests that the materials are identical. However, examples from theliterature indicate that IR analysis of the νCN bands does not necessarily provide a compellingmethod for establishing cyanide-bridged linkages isomers. Notably, the two isomers (CO)5W–CN–Cu(PPh3)3 and (CO)5W–NC–Cu(PPh3)3, distinguishable by 13C NMR spectroscopy,exhibit identical ν CN stretching bands.[44] Alternatively, Vahrenkamp’s [Cp(CO)2Fe–CN–Mn(CO)2Cp] and [Cp(CO)2Fe–NC–Mn(CO)2Cp] isomers display ν CN modes that differ by50 cm–1.[48] The similar ν CN frequencies for 2-Zn and proposed 2-Zn’ when considered withthe X-ray and 13C NMR data point to formation of a single isomer, 2-Zn.
3.6.3. DFT Calculations of the linkage isomers, 2-Zn and 2-Zn’—To furthercorroborate the experimental data indicating that the cyanide-bridged linkage isomer 2-Zn isthe thermodynamically more stable isomer, a computational study was undertaken. Thecomputational models used [Tp] as a truncated version of [TptBu]. The DFT optimizedstructures of the linkage isomers afforded overall slightly longer calculated bond distancescompared to the X-ray crystallographic data, Table 5. The DFT optimized frequency analysisreveals that significant differences in ν CN values are expected, with 2-Zn ca. 46 cm–1 lowerin energy. These results support the conclusion that a single product is formed from the twoindependent synthetic routes. Further, the 2-Zn isomer is calculated to be 5 kcal/mol lower inenergy.
4. SummaryA binuclear Ni–CN–Fe complex, 2-Fe, designed to provide insight into the fundamentalcharacteristics of the cyanide-inhibited form of the NiFeS enzyme COdH was spectroscopicallyand structurally characterized. The linear Ni-CN-Fe bridge displays a νCN value ~80 cm–1
higher than that found in the inhibited form of COdH supporting the hypothesis that the bridgein the latter is bent. The scope of these studies was extended to include a series of isostructuralcyanide-bridged binuclear complexes, 2-Co, 2-Ni and 2-Zn. A similar coupling scheme wasused to synthesize the copper(I) analogue, 2-Cu, yielding the anionic complex. The copperanalogue is isostructural with the neutral complexes as elucidated by spectroscopic and X-raydiffraction analysis. Interestingly, 2-Cu did not exhibit an intense ν CN stretching band. DFTcomputations reveal a significantly lower dipole moment for 2-Cu than for the neutral 2-Znand 2-Zn’ (and by extension 2-Fe, 2-Co and 2-Ni). The lack of a significant dipole momentin the anion presumably translates to a small dipole moment change upon C–N stretching.
Two synthetic strategies were employed for the attempted synthesis of cyanide-bridged linkageisomers. The products of two different 13CN labeled reactions intended to yield (‘S3’)Ni–CN–Zn[TptBu] and (‘S3’)Ni–NC–Zn[TptBu] were analyzed. The structural refinement of theproposed (‘S3’)Ni–NC–Zn[TptBu] complex exhibits a better structural refinement as (‘S3’)Ni–CN–Zn[TptBu]. This structural assignment was supported by the Hirshfeld Rigid-Bond Test[47] analysis, which clearly favored assignment as 2-Zn over 2-Zn’. Nearly identical infraredand 13C NMR spectroscopic data provide additional evidence that (‘S3’)Ni–CN–Zn[TptBu] isproduced in both reactions. DFT optimized structures of (‘S3’)Ni–CN–Zn[Tp] and (‘S3’)Ni–NC–Zn[Tp] suggest that (‘S3’)Ni–CN–Zn[Tp] is the thermodynamically preferred structureby 5 kcal/mol supporting the formation of (‘S3’)Ni–CN–Zn[TptBu] by both synthetic routes.
Supplementary MaterialRefer to Web version on PubMed Central for supplementary material.
Mock et al. Page 12
Inorganica Chim Acta. Author manuscript; available in PMC 2010 September 15.
NIH
-PA Author Manuscript
NIH
-PA Author Manuscript
NIH
-PA Author Manuscript

AcknowledgmentsThese studies were supported by the NIH (GM59191). Computational resources used in these studies were providedin part by the Bioinformatics Center of the University of Arkansas for Medical Sciences (NIH Grant P20 RR-16460from the IDeA Networks of Biomedical Research Excellence (INBRE) Program of the National Center for ResearchResources). The Mössbauer spectrometer was purchased through NSF grant CHE-0421116 (to CVP).
References1. Dunbar KR, Heintz RA. Prog. Inorg. Chem 1997;45:283–391.2. Richardson GN, Brand U, Vahrenkamp H. Inorg. Chem 1999;38:3070–3079.Kaye SS, Long JR.
Catalysis Today 2007;120:311–316.3. Ferlay S, Mallah T, Ouahes R, Veillet P, VM. Nature 1995;378:701–703.4. Kettle SFA, Aschero GL, Diana E, Rossetti R, Stanghellini PL. Inorg. Chem 2006;45:4928–4937.
[PubMed: 16780314]5. Kettle SFA, Diana E, Boccaleri E, Stanghellini PL. Inorg. Chem 2007;46:2409–2416. [PubMed:
17330966]6. Volbeda A, Garcia E, Piras C, Delacey AL, Fernandez VM, Hatchikian EC, Frey M, Fontecilla-Camps
JC. J. Am. Chem. Soc 1996;118:12989–12996.Peters JW, Lanzilotta WN, Lemon BJ, Seefeldt LC.Science 1998;282:1853–1858. [PubMed: 9836629]
7. Cooper CE, Brown GC. J. Bioenergetics Biomem 2008;40:533–539.8. Ragsdale SW. J. Inorg. Biochem 2007;101:1657–1666. [PubMed: 17716738] Riordan CG. J. Biol.
Inorg. Chem 2004;9:542–549. [PubMed: 15221481]9. Drennan CL, Heo JY, Sintchak MD, Schreiter E, Ludden PW. Proceedings of the National Academy
of Sciences of the United States of America 2001;98:11973–11978. [PubMed: 11593006]10. Dobbek H, Svetlitchnyi V, Gremer L, Huber R, Meyer O. Science 2001;293:1281–1285. [PubMed:
11509720]11. Joeung JH, Dobbek H. Science 2007;318:1461–1464. [PubMed: 18048691]12. Ensign SA, Hyman MR, Ludden PW. Biochemistry 1989;28:4973–4979. [PubMed: 2504285]
Anderson ME, Lindahl PA. Biochemistry 1994;33:8702–8711. [PubMed: 8038160]13. Feng J, Lindahl PA. J. Am. Chem. Soc 2004;126:9094–9100. [PubMed: 15264843]14. DeRose VJ, Telser J, Anderson ME, Lindahl PA, Hoffman BM. J. Am. Chem. Soc 1998;120:8767–
8776.15. Li D, Clérac R, Wang G, Yee GT, Holmes SM. Eur. J. Inorg. Chem 2008:1341–1346.Gu JZ, Jiang
L, Tan MY, Lu TB. J. Mol. Struct 2008;890:24–30.16. Shriver, DF.; Drezdon, MA. The Manipulation of Air Sensitive Compounds. 2nd ed. New York:
Wiley; 1986.17. Pangborn AB, Giardello MA, Grubbs RH, Rosen RK, Timmers FJ. Organometallics 1996;15:1518–
1520.18. Sellmann D, Häuβinger D, Heinemann FW. Eur. J. Inorg. Chem 1999:1715–1725.19. Trofimenko S, Calabrese JC, Thompson JS. Inorg. Chem 1987;26:1507–1514.20. Carrier SM, Ruggiero CE, Tolman WB. J. Am. Chem. Soc 1992;114:4407–4408.21. Ohrenberg C, Riordan CG, Liable-Sands LM, Rheingold AL. Inorg. Chem 2001;40:4276–4283.
[PubMed: 11487333]22. Yoon K, Parkin G. Inorg. Chem 1992;31:1656–1662.23. Sellmann D, Geipel F, Heinemann FW. Chem.-Eur. J 2000;6:4279–4284.24. Gaussian 03, RC.; Frisch, MJ.; Trucks, GW.; Schlegel, HB.; Scuseria, GE.; Robb, MA.; Cheeseman,
JR.; Montgomery, JA., Jr; Vreven, T.; Kudin, KN.; Burant, JC.; Millam, JM.; Iyengar, SS.; Tomasi,J.; Barone, V.; Mennucci, B.; Cossi, M.; Scalmani, G.; Rega, N.; Petersson, GA.; Nakatsuji, H.; Hada,M.; Ehara, M.; Toyota, K.; Fukuda, R.; Hasegawa, J.; Ishida, M.; Nakajima, T.; Honda, Y.; Kitao,O.; Nakai, H.; Klene, M.; Li, X.; Knox, JE.; Hratchian, HP.; Cross, JB.; Bakken, V.; Adamo, C.;Jaramillo, J.; Gomperts, R.; Stratmann, RE.; Yazyev, O.; Austin, AJ.; Cammi, R.; Pomelli, C.;Ochterski, JW.; Ayala, PY.; Morokuma, K.; Voth, GA.; Salvador, P.; Dannenberg, JJ.; Zakrzewski,
Mock et al. Page 13
Inorganica Chim Acta. Author manuscript; available in PMC 2010 September 15.
NIH
-PA Author Manuscript
NIH
-PA Author Manuscript
NIH
-PA Author Manuscript

VG.; Dapprich, S.; Daniels, AD.; Strain, MC.; Farkas, O.; Malick, DK.; Rabuck, AD.; Raghavachari,K.; Foresman, JB.; Ortiz, JV.; Cui, Q.; Baboul, AG.; Clifford, S.; Cioslowski, J.; Stefanov, BB.; Liu,G.; Liashenko, A.; Piskorz, P.; Komaromi, I.; Martin, RL.; Fox, DJ.; Keith, T.; Al-Laham, MA.;Peng, CY.; Nanayakkara, A.; Challacombe, M.; Gill, PMW.; Johnson, B.; Chen, W.; Wong, MW.;Gonzalez, C.; Pople, JA. Wallingford CT: Gaussian, Inc; 2004.
25. Sheldrick, G. Madison, WI: Bruker-AXS Inc; 2001.26. Spek AL. J. Appl. Cryst 2003;36:7–13.27. Sun J, Tessier C, Holm RH. Inorg. Chem 2007;46:2691–2699. [PubMed: 17346040]28. Ming, L-J. Nuclear Magnetic Resonance of Paramagnetic Metal Centers in Proteins. In Physical
Methods in Bioinorganic Chemistry. In: Larry Que, J., editor. Spectroscopy and Magnetism.Sausalito, CA: University Science Books; 2000. p. 375-464.
29. Desrochers PJ, Telser J, Zvyagin SA, Ozarowski A, Krzystek J, Vicic DA. Inorg. Chem2006;45:8930–8941. [PubMed: 17054352]
30. Pavel EG, Kitajima N, Solomon EI. J. Am. Chem. Soc 1998;120:3949–3962.31. Cotton, FA.; Wilkinson, G.; Murillo, CA.; Bochmann, M. Advanced Inorganic Chemistry. Sixth ed.
New York: John Wiley & Sons, Inc; 1999. p. 83532. Han RY, Looney A, McNeill K, Parkin G, Rheingold AL, Haggerty BS. J. Inorg. Biochem
1993;49:105–121.33. Nakamoto, K. Infrared and Raman Spectra of Inorganic and Coordination Compounds. 5th ed.. Vol.
Vol. B. New York: John Wiley & Sons, Inc; 1997. Applications in Coordination, Organometallicand Bioinorganic Chemistry
34. Scott MJ, Holm RH. J. Am. Chem. Soc 1994;116:11357–11367.35. Dows DA, Haim A, Wilmarth WK. J. Inorg. Nucl. Chem 1961;21:33–37.36. Qiu D, Kumar M, Ragsdale SW, Spiro TG. J. Am. Chem. Soc 1996;118:10429–10435.37. Senda S, Ohki Y, Hirayama T, Toda D, Chen J-L, Matsumoto T, Kawaguchi H, Tatsumi K. Inorg.
Chem 2006;45:9914–9925. [PubMed: 17112290]38. For recent examples, see Muresan N, Lu CN, Ghosh M, Peters JC, Abe M, Henling LM, Weyermoller
T, Bill E, Wieghardt K. Inorg. Chem 2008;47:4579–4590. [PubMed: 18442239]39. Hu Z, Spangler NJ, Anderson ME, Xia J, Ludden PW, Lindahl PA, Münck E. J. Am. Chem. Soc
1996;118:830–845.40. Ciurli S, Carrie M, Weigel JA, Carney MJ, Stack TDP, Papaefthymiou GC, Holm RH. J. Am. Chem.
Soc 1990;112:2654–2664.41. Betley TA, Peters JC. Inorg. Chem 2003;42:5074–5084. [PubMed: 12924878]42. Fukui K, Ohya-Nishiguchi H, Hirota N. Bull. Chem. Soc. Jpn 1991;64:1205–1212.43. Fujisawa K, Ono T, Ishikawa Y, Amir N, Miyashita Y, Okamoto K, Lehnert N. Inorg. Chem
2006;45:1698–1713. [PubMed: 16471983]44. Darensbourg DJ, Yoder JC, Holtcamp MW, Klausmeyer KK, Reibenspies JH. Inorg. Chem
1996;35:4764–4769.45. Schebler PJ, Riordan CG, Guzei I, Rheingold AL. Inorg. Chem 1998;37:4754–4755. [PubMed:
11670635] Chiou S-J, Innocent J, Lam K-C, Riordan CG, Liable-Sands L, Rheingold AL. Inorg.Chem 2000;39:4347–4353. [PubMed: 11196931] Mock MT, Popescu CV, Yap GPA, DoughertyWG, Riordan CG. Inorg. Chem 2007;47:1889–1891. [PubMed: 18275141]
46. DuPont JA, Coxey MB, Schebler PJ, Incarvito CD, Dougherty WG, Yap GPA, Rheingold AL,Riordan CG. Organometallics 2007;26:971–979.
47. Hirshfeld FL. Acta Cryst. A 1976;32:239–244.48. Zhu NY, Vahrenkamp H, Chem Angew. Int. Ed. Engl 1994;33:2090–2091.49. Looney A, Han R, Gorrell IB, Cornebise M, Yoon K, Parkin G, Rheingold AL. Organometallics
1995;14:274–288.
Mock et al. Page 14
Inorganica Chim Acta. Author manuscript; available in PMC 2010 September 15.
NIH
-PA Author Manuscript
NIH
-PA Author Manuscript
NIH
-PA Author Manuscript

Fig. 1.Molecular structure of 2-Fe. Thermal ellipsoids are drawn to 30% probability and hydrogenatoms have been omitted for clarity.
Mock et al. Page 15
Inorganica Chim Acta. Author manuscript; available in PMC 2010 September 15.
NIH
-PA Author Manuscript
NIH
-PA Author Manuscript
NIH
-PA Author Manuscript

Fig. 2.Infrared spectra for the complexes K1 and 2 in the 2000-2600 cm–1 frequency range.
Mock et al. Page 16
Inorganica Chim Acta. Author manuscript; available in PMC 2010 September 15.
NIH
-PA Author Manuscript
NIH
-PA Author Manuscript
NIH
-PA Author Manuscript

Fig. 3.Molecular structures of the proposed 2-Zn’ refined alternatively as the linkage isomers 2-Zn(left) and 2-Zn’ (right) with thermal ellipsoids at 30%. Note the differences in the thermalellipsoids of the cyanide ligands.
Mock et al. Page 17
Inorganica Chim Acta. Author manuscript; available in PMC 2010 September 15.
NIH
-PA Author Manuscript
NIH
-PA Author Manuscript
NIH
-PA Author Manuscript

Scheme 1.
Mock et al. Page 18
Inorganica Chim Acta. Author manuscript; available in PMC 2010 September 15.
NIH
-PA Author Manuscript
NIH
-PA Author Manuscript
NIH
-PA Author Manuscript

Scheme 2.
Mock et al. Page 19
Inorganica Chim Acta. Author manuscript; available in PMC 2010 September 15.
NIH
-PA Author Manuscript
NIH
-PA Author Manuscript
NIH
-PA Author Manuscript

Scheme 3.
Mock et al. Page 20
Inorganica Chim Acta. Author manuscript; available in PMC 2010 September 15.
NIH
-PA Author Manuscript
NIH
-PA Author Manuscript
NIH
-PA Author Manuscript

NIH
-PA Author Manuscript
NIH
-PA Author Manuscript
NIH
-PA Author Manuscript
Mock et al. Page 21
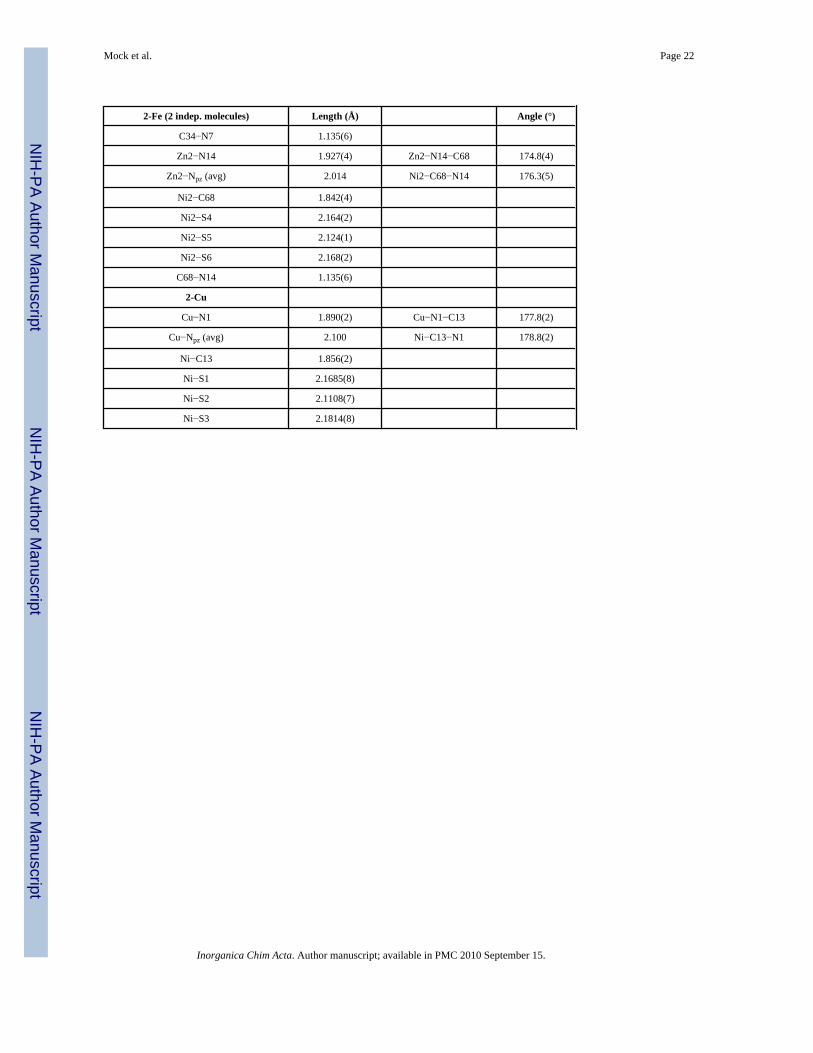
Table 1
Selected bond lengths (Å) and bond angles (°) for 2-Fe, 2-Co, 2-Ni, 2-Zn, and 2-Cu.
2-Fe (2 indep. molecules) Length (Å) Angle (°)
Fe1−N1 1.980(5) Fe1−N1−C1 175.5(5)
Fe1−Npz (avg) 2.064 Ni1−C1−N1 177.5(5)
Ni1−C1 1.850(6)
Ni1−S1 2.181(2)
Ni1−S2 2.110(2)
Ni1−S3 2.159(2)
C1−N1 1.145(7)
Fe2−N8 1.980(5)
Fe2− Npz (avg) 2.057 Fe2−N8−C35 172.1(5)
Ni2−C35 1.850(6) Ni2−C35−N8 178.1(6)
Ni2−S4 2.181(2)
Ni2−S5 2.111(2)
Ni2−S6 2.177(2)
C35−N8 1.135(7)
2-Co
Co−N7 1.949(3) Co−N7−C34 174.4(3)
Co−Npz (avg) 2.014 Ni−C34−N7 179.1(3)
Ni−C34 1.846(3)
Ni−S1 2.159(1)
Ni−S2 2.106(1)
Ni−S3 2.172(1)
C34−N7 1.163(4)
2-Ni
Ni−N5 1.954(7) Ni1−N5−C14 178.5(7)
Ni1− Npz (avg) 1.992 Ni2−C14−N5 177.2(8)
Ni2−C14 1.842(8)
Ni2−S1 2.174(2)
Ni2−S1A 2.174(2)
Ni2−S2 2.132(2)
C14−N5 1.135(9)
2-Zn (2 indep. molecules)
Zn1−N7 1.925(4) Zn1−N7−C34 179.0(4)
Zn1−Npz (avg) 2.018 Ni1−C34−N7 179.2(5)
Ni1−C34 1.850(4)
Ni1−S1 2.159(1)
Ni1−S2 2.131(1)
Ni1−S3 2.179(1)
Inorganica Chim Acta. Author manuscript; available in PMC 2010 September 15.
NIH
-PA Author Manuscript
NIH
-PA Author Manuscript
NIH
-PA Author Manuscript
Mock et al. Page 22
2-Fe (2 indep. molecules) Length (Å) Angle (°)
C34−N7 1.135(6)
Zn2−N14 1.927(4) Zn2−N14−C68 174.8(4)
Zn2−Npz (avg) 2.014 Ni2−C68−N14 176.3(5)
Ni2−C68 1.842(4)
Ni2−S4 2.164(2)
Ni2−S5 2.124(1)
Ni2−S6 2.168(2)
C68−N14 1.135(6)
2-Cu
Cu−N1 1.890(2) Cu−N1−C13 177.8(2)
Cu−Npz (avg) 2.100 Ni−C13−N1 178.8(2)
Ni−C13 1.856(2)
Ni−S1 2.1685(8)
Ni−S2 2.1108(7)
Ni−S3 2.1814(8)
Inorganica Chim Acta. Author manuscript; available in PMC 2010 September 15.

NIH
-PA Author Manuscript
NIH
-PA Author Manuscript
NIH
-PA Author Manuscript
Mock et al. Page 23
Table 2
Summary of CV data for K1 and the series of complexes 2.
E1/2, VNi(II)/Ni(I)
Ipa/Ipc Epc, V
K1 −1.26 0.40
2-Fe−1.24 0.40 −2.02
-- −2.33
2-Co –1.25 0.21 –1.73
2-Ni −1.18 0.11 −0.96
2-Zn−0.91 0.54 --
−1.21 0.15 --
Electrochemical experiments were performed in THF at a scan rate of 200 mV/s. Reduction potentials are referenced to internal Fc+/Fc couple at+801 mV versus NHE.
Inorganica Chim Acta. Author manuscript; available in PMC 2010 September 15.

NIH
-PA Author Manuscript
NIH
-PA Author Manuscript
NIH
-PA Author Manuscript
Mock et al. Page 24
Table 3
Selected DFT optimized bond lengths and vibrational frequencies for the truncated model of 2-Cu.
{[(Tp)Cu]-NC-[Ni(‘S3’)]}–1
C–N (Å) 1.1760
νCN (cm−1) ([I]) 2106.7 (3)
νBH (cm−1) 2448.6
Cu–CCN (Å) n/a
Ni–NCN (Å) n/a
Ni–CCN (Å) 1.8639
Cu–NCN (Å) 1.8994
Cu–NPz (Å) 2.1437, 2.1523, 2.1579
Ni–Strans (Å) 2.1878
Inorganica Chim Acta. Author manuscript; available in PMC 2010 September 15.

NIH
-PA Author Manuscript
NIH
-PA Author Manuscript
NIH
-PA Author Manuscript
Mock et al. Page 25
Table 4
IR and 13C NMR spectroscopic data for K1, [TptBu]Zn13CN, 2-Zn and the material proposed as 2-Zn’.
Experimental νCN, cm−1 Calculatedaν13CN, cm−1 νBH, cm−1 δ13CN
K1 2106 -- -- --
K1-13CN 2065 2062 -- 125.9
[TptBu]Zn13CN 2214b -- 2526 137.7
2-Zn 2152 -- 2495 --
2-Zn-13CN 2109 2107 2497 153.3
2-Zn’ 2146 -- 2493 --
2-Zn’-13CN 2105 2103 2491 153.3
aValue calculated based on reduced mass differences assuming a simple diatomic oscillator.
bReference [49].
Inorganica Chim Acta. Author manuscript; available in PMC 2010 September 15.

NIH
-PA Author Manuscript
NIH
-PA Author Manuscript
NIH
-PA Author Manuscript
Mock et al. Page 26
Table 5
Selected DFT optimized bond lengths and vibrational frequencies.
(‘S3’)Ni–NC–Zn[Tp] (‘S3 ‘)Ni–CN–Zn[Tp]
C–N (Å) 1.16754 1.17742
νCN (cm–1) ([I]) 2176.0 (253) 2114.3 (1327)
νBH (cm–1) 2514.0 2514.7
Zn–CCN (Å) 1.9580 n/a
Ni–NCN (Å) 1.8637 n/a
Ni–CCN (Å) n/a 1.8309
Zn–NCN (Å) n/a 1.9083
Zn–NPz (Å) 2.0757, 2.0759, 2.0766 2.0706, 2.0706, 2.0711
Ni–Strans (Å) 2.1630 2.1889
Inorganica Chim Acta. Author manuscript; available in PMC 2010 September 15.
Copyright © 2022 FDOKUMEN


![Synthesis, crystal structures and magnetic properties of cyanide-and phenolate-bridged [MIIINiII] 2 tetranuclear complexes (M= Fe and Cr)](https://static.fdokumen.com/doc/165x107/632a63a501b83cca6a040028/synthesis-crystal-structures-and-magnetic-properties-of-cyanide-and-phenolate-bridged.jpg)


![Mono and binuclear complexes involving [Pd(N,N-dimethylethylenediamine)(H2O)2], 4,4′-bipiperidine and DNA constituents](https://static.fdokumen.com/doc/165x107/631fd774d85b325bc2095ade/mono-and-binuclear-complexes-involving-pdnn-dimethylethylenediamineh2o2.jpg)