A new method for assessing squash tactics using 15 court areas for ball locations
10
A new method for assessing squash tactics using 15 court areas for ball locations Goran Vuc ˇkovic ´ a , Nic James b , Mike Hughes b , Stafford Murray c , Zoran Milanovic ´ d,⇑ , Janez Perš e , Goran Sporiš f a Faculty of Sport, University of Ljubljana, Ljubljana, Slovenia b London Sport Institute, Middlesex University, London, England, United Kingdom c English Institute of Sport, Manchester, England, United Kingdom d Faculty of Sport and Physical Education, University of Niš, Niš, Serbia e Faculty of Electrical Engineering, University of Ljubljana, Ljubljana, Slovenia f Faculty of Kinesiology, University of Zagreb, Zagreb, Croatia article info Article history: Available online xxxx Keywords: Squash tactics Ball analysis Method Shot types abstract Tactics in squash have typically been assessed using the frequency of different shot types played at different locations on the court either without reference to other relevant information or on the basis of the preceding shot. This paper presents a new squash spe- cific method for categorizing court locations in which the ball was played, a novel techniques for assessing the reliability of this method and presents typical shots responses in these new areas controlled for preceding shot as well as the time between shots and the handedness of the players. Twelve games were viewed using the SAGIT/Squash software and 2907 shots viewed a second time from a video image taken from behind the court with an over- all agreement of 88.90% for the court location data and 99.52% for shot type. 3192 shots from 9 matches from the 2003 World Team Championships were analyzed in SAGIT/Squash. In the court areas analyzed between 2 and 7 shot responses were predominant sug- gesting tactical patterns were evident. This was supported by dif- ferences evident between shot responses played from the two back corners where the backhand side was characterized by a pre- dominance of straight drives whereas straight and crosscourt drives were played on the forehand side. These results tended to confirm that tactics i.e., consistent shot types, are played although these are only apparent when factors that determine shot selection http://dx.doi.org/10.1016/j.humov.2014.01.002 0167-9457/Ó 2014 Elsevier B.V. All rights reserved. ⇑ Corresponding author. Address: Faculty of Sport and Physical Education, C ˇ arnojevic ´ eva 10a, 18000 Niš, Serbia. Tel.: +381 63 7 399 366. E-mail address: [email protected] (Z. Milanovic ´). Human Movement Science xxx (2014) xxx–xxx Contents lists available at ScienceDirect Human Movement Science journal homepage: www.elsevier.com/locate/humov Please cite this article in press as: Vuc ˇkovic ´, G., et al. A new method for assessing squash tactics using 15 court areas for ball locations. Human Movement Science (2014), http://dx.doi.org/10.1016/j.humov.2014.01.002
Transcript of A new method for assessing squash tactics using 15 court areas for ball locations
Human Movement Science xxx (2014) xxx–xxx
Contents lists available at ScienceDirect
Human Movement Science
journal homepage: www.elsevier .com/locate/humov
A new method for assessing squash tactics using15 court areas for ball locations
http://dx.doi.org/10.1016/j.humov.2014.01.0020167-9457/� 2014 Elsevier B.V. All rights reserved.
⇑ Corresponding author. Address: Faculty of Sport and Physical Education, Carnojeviceva 10a, 18000 Niš, Serbia. Tel.:7 399 366.
E-mail address: [email protected] (Z. Milanovic).
Please cite this article in press as: Vuckovic, G., et al. A new method for assessing squash tactics using 1areas for ball locations. Human Movement Science (2014), http://dx.doi.org/10.1016/j.humov.2014.01.002
Goran Vuckovic a, Nic James b, Mike Hughes b, Stafford Murray c,Zoran Milanovic d,⇑, Janez Perš e, Goran Sporiš f
a Faculty of Sport, University of Ljubljana, Ljubljana, Sloveniab London Sport Institute, Middlesex University, London, England, United Kingdomc English Institute of Sport, Manchester, England, United Kingdomd Faculty of Sport and Physical Education, University of Niš, Niš, Serbiae Faculty of Electrical Engineering, University of Ljubljana, Ljubljana, Sloveniaf Faculty of Kinesiology, University of Zagreb, Zagreb, Croatia
a r t i c l e i n f o
Article history:Available online xxxx
Keywords:Squash tacticsBall analysisMethodShot types
a b s t r a c t
Tactics in squash have typically been assessed using the frequencyof different shot types played at different locations on the courteither without reference to other relevant information or on thebasis of the preceding shot. This paper presents a new squash spe-cific method for categorizing court locations in which the ball wasplayed, a novel techniques for assessing the reliability of thismethod and presents typical shots responses in these new areascontrolled for preceding shot as well as the time between shotsand the handedness of the players. Twelve games were viewedusing the SAGIT/Squash software and 2907 shots viewed a secondtime from a video image taken from behind the court with an over-all agreement of 88.90% for the court location data and 99.52% forshot type. 3192 shots from 9 matches from the 2003 World TeamChampionships were analyzed in SAGIT/Squash. In the court areasanalyzed between 2 and 7 shot responses were predominant sug-gesting tactical patterns were evident. This was supported by dif-ferences evident between shot responses played from the twoback corners where the backhand side was characterized by a pre-dominance of straight drives whereas straight and crosscourtdrives were played on the forehand side. These results tended toconfirm that tactics i.e., consistent shot types, are played althoughthese are only apparent when factors that determine shot selection
+381 63
5 court
2 G. Vuckovic et al. / Human Movement Science xxx (2014) xxx–xxx
Please cite this article in press as: Vuckovic,areas for ball locations. Human Movement Sci
are accounted for. This paper has controlled for some of these fac-tors but others need to be considered e.g., if individual player pro-files are to be ascertained.
� 2014 Elsevier B.V. All rights reserved.
1. Introduction
Squash performance is largely characterized by the movement of players and shot selection. Themain objective is to move an opponent away from a central area of the court, commonly referredto as the ‘T area’. Vuckovic, Perš, James, and Hughes (2009) found that winners of games tended tospend a greater proportion of time in the T area (a 2 � 2.8 m area) than losers although this wasnot evident in closely contested games. The fact that players sometimes failed to position themselvesin the T area at the moment when their opponent was playing their shot was thought to be due to shotselection and the accuracy of the shot. However no analysis was undertaken by Vuckovic et al. (2009)regarding shot types and consequently the implications of playing different shots in different courtlocations was not investigated.
Previous research has also tried to infer tactical aspects of squash performance using the frequencyof different shot types played at different locations on the court (Chan & Hong, 1996; Hong, Robinson,Chan, Clark, & Choi, 1996; Hughes, 1985, 1998). While this can give a general idea of the typical shotsplayed, e.g., county players typically play the ball to the back of the court on the backhand side(Hughes, 1985, 1998), a more comprehensive analysis would also consider the preceding shot (McGar-ry & Franks, 1996). The preceding shot is likely to be important since some shot types can put an oppo-nent under severe pressure e.g., a hard low accurate drive, whereas other may produce minimal or nopressure e.g., an inaccurate lob gives an opponent lots of time and may be played from the middle ofthe court. To some extent this relates to the available time for a shot to be played, a factor that has notreceived much attention in the literature. This type of analysis has the potential for discoveringwhether players adopt similar strategies irrespective of their opponent i.e., a consistent pattern fromspecific court locations, or whether they adapt their shot selections as a consequence of trying to limitthe effectiveness of their opponent’s shots e.g., different patterns against different players.
One issue that has seemingly not been debated is the dimension and shape of the cells used for theshot locations. Previous researchers have consistently used 16 rectangular cells of equal dimensionwith no discussion of their appropriateness. We considered two issues of relevance to the appropriate-ness of these cell dimensions. Firstly the location of the shot may be more critical near the sidewallsthan in the center of the court. Secondly straight and crosscourt shots tend to have different trajecto-ries, particularly when the sidewalls are hit. Consequently this paper presents a case for an alternativemethod of dividing the court into cells, which takes into consideration squash tactics.
In order to assess the movement and shot characteristics of squash players it is necessary to have adata collection system that can reliably and accurately record these variables (Atkinson & Nevill,1998). James, Taylor, and Stanley (2007) suggested that reliability in performance analysis concernsthe extent to which the event codes reflect what happened in the game and is therefore also an esti-mate of the accuracy (validity). These event codes can be manually input by the analyst or, using asystem like SAGIT/Squash, automatically processed in software. Performance analysis researchershave taken this issue seriously since Hughes, Cooper, and Nevill (2002) presented data to show that70% of research papers presented at world conferences featuring performance analysis papers failedto present any reliability assessments. This paper prompted researchers to present reliability statisticsalthough debate ensued regarding how this should be achieved culminating in a reliability edition ofthe International Journal of Performance Analysis in Sport in 2007 where different views were ex-pressed regarding statistical tests to adopt. Consequently researchers today routinely present reliabil-ity information, however, one issue presented by Hughes et al. (2002), that a reliability assessmentshould be at the level of the subsequent analysis, has seemingly not been considered to the sameextent. Since a reliability test determines the extent to which errors in data capture are present, the
G., et al. A new method for assessing squash tactics using 15 courtence (2014), http://dx.doi.org/10.1016/j.humov.2014.01.002
G. Vuckovic et al. / Human Movement Science xxx (2014) xxx–xxx 3
subsequent results can be assessed in relation to the magnitude of these errors. However this is onlypossible if researchers provide errors rates for each measure separately and not combined into oneoverall measure of reliability. This detail is not prevalent in the research literature with overall reli-ability values more usually presented.
This paper will assess the reliability of ball location information input into the SAGIT/Squash per-formance analysis software (Perš, Bon, Kovacic, Šibila, & Dezman, 2002). This software both tracksplayer movements and allows input of shot information where both measures can be determinedin relation to the ball location at the point of ball striking. This system has been used by (Vuckovic,Dezman, Erculj, Kovacic, & Perš, 2003, 2005; Vuckovic, Perš, James, & Hughes, 2008, 2010) and the reli-ability of the tracking system reported in Vuckovic et al. (2010).
This paper will present shot selections in response to where the preceding shot was played fromwith consideration to the time available to play the shot, using a novel method for splitting the courtinto cells of irregular shape. The reliability for determining ball location information is assessed usinga novel technique.
2. Methods
2.1. Sample of matches and participants
Matches were recorded at the World Team Championships (n = 11), the Slovenian National Cham-pionships (n = 11) and during a local tournament (n = 15), all played in 2003. One match was randomlyselected from each tournament (12 games in total) for reliability analysis. Only matches played be-tween right handed players (n = 9) during the World Team Championships were used for the tacticsanalysis. Ethical approval for the study was granted by a university ethics committee and informedwritten consent was obtained from all participants.
2.2. Procedure
Matches took place on a court set up with a PAL video camera (JBL UTC – A6000H, Korea) attachedto the ceiling above the central part of the court and a similar camera located on a tripod at groundlevel behind the court. The camera placement and methodology for getting the video images into SA-GIT/Squash for automatic processing with operator supervision has been well documented in Vucko-vic et al. (2009) and the reliability associated with the resultant calculations of distance and speed foreach player were published by Vuckovic et al. (2010). The exact camera location for the overhead cam-era (both vertically and horizontally) was not deemed important, as subsequent calibration for imagecapture accounted for its location.
2.3. Automatic tracking of movements and manual coding
Since this research paper was concerned with recording where the shots were played, it wasimportant to assess how reliably this information was captured, particularly since this was manuallyadded to the software. James, Jones, and Hollely (2002) suggested three sources of error for manualcoding of events; Operational error: where the observer presses the wrong button to label an event,Observational errors: the observer fails to code an event, and Definitional errors: the observer labelsan event inappropriately. Observer error in this study was likely due to the wrong shot type or anincorrect ball location being entered into SAGIT/Squash.
The SAGIT/Squash system has a separate input system designed to allow the operator to view thevideo taken from the overhead camera and the ball could be marked on the court via a touch sensitiveinterface. To improve the accuracy of this input a separate video recording, taken from behind thecourt, was used to enable the operator to estimate the height of the ball above the floor at the timeof the stroke. This measure was input into SAGIT/Squash so that the software could make a small cor-rection for any perspective distortion caused by the ceiling-mounted camera not always being directlyabove the ball location. This height information was only used to decrease the perspective error and assuch even a relatively coarse estimate by the operator was sufficient to improve, albeit slightly, the
Please cite this article in press as: Vuckovic, G., et al. A new method for assessing squash tactics using 15 courtareas for ball locations. Human Movement Science (2014), http://dx.doi.org/10.1016/j.humov.2014.01.002
4 G. Vuckovic et al. / Human Movement Science xxx (2014) xxx–xxx
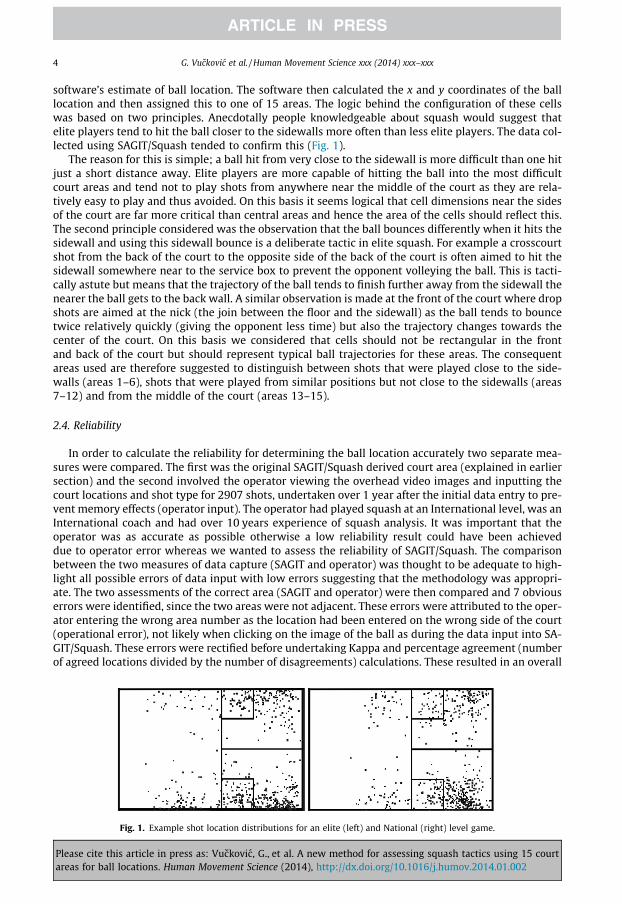
software’s estimate of ball location. The software then calculated the x and y coordinates of the balllocation and then assigned this to one of 15 areas. The logic behind the configuration of these cellswas based on two principles. Anecdotally people knowledgeable about squash would suggest thatelite players tend to hit the ball closer to the sidewalls more often than less elite players. The data col-lected using SAGIT/Squash tended to confirm this (Fig. 1).
The reason for this is simple; a ball hit from very close to the sidewall is more difficult than one hitjust a short distance away. Elite players are more capable of hitting the ball into the most difficultcourt areas and tend not to play shots from anywhere near the middle of the court as they are rela-tively easy to play and thus avoided. On this basis it seems logical that cell dimensions near the sidesof the court are far more critical than central areas and hence the area of the cells should reflect this.The second principle considered was the observation that the ball bounces differently when it hits thesidewall and using this sidewall bounce is a deliberate tactic in elite squash. For example a crosscourtshot from the back of the court to the opposite side of the back of the court is often aimed to hit thesidewall somewhere near to the service box to prevent the opponent volleying the ball. This is tacti-cally astute but means that the trajectory of the ball tends to finish further away from the sidewall thenearer the ball gets to the back wall. A similar observation is made at the front of the court where dropshots are aimed at the nick (the join between the floor and the sidewall) as the ball tends to bouncetwice relatively quickly (giving the opponent less time) but also the trajectory changes towards thecenter of the court. On this basis we considered that cells should not be rectangular in the frontand back of the court but should represent typical ball trajectories for these areas. The consequentareas used are therefore suggested to distinguish between shots that were played close to the side-walls (areas 1–6), shots that were played from similar positions but not close to the sidewalls (areas7–12) and from the middle of the court (areas 13–15).
2.4. Reliability
In order to calculate the reliability for determining the ball location accurately two separate mea-sures were compared. The first was the original SAGIT/Squash derived court area (explained in earliersection) and the second involved the operator viewing the overhead video images and inputting thecourt locations and shot type for 2907 shots, undertaken over 1 year after the initial data entry to pre-vent memory effects (operator input). The operator had played squash at an International level, was anInternational coach and had over 10 years experience of squash analysis. It was important that theoperator was as accurate as possible otherwise a low reliability result could have been achieveddue to operator error whereas we wanted to assess the reliability of SAGIT/Squash. The comparisonbetween the two measures of data capture (SAGIT and operator) was thought to be adequate to high-light all possible errors of data input with low errors suggesting that the methodology was appropri-ate. The two assessments of the correct area (SAGIT and operator) were then compared and 7 obviouserrors were identified, since the two areas were not adjacent. These errors were attributed to the oper-ator entering the wrong area number as the location had been entered on the wrong side of the court(operational error), not likely when clicking on the image of the ball as during the data input into SA-GIT/Squash. These errors were rectified before undertaking Kappa and percentage agreement (numberof agreed locations divided by the number of disagreements) calculations. These resulted in an overall
Fig. 1. Example shot location distributions for an elite (left) and National (right) level game.
Please cite this article in press as: Vuckovic, G., et al. A new method for assessing squash tactics using 15 courtareas for ball locations. Human Movement Science (2014), http://dx.doi.org/10.1016/j.humov.2014.01.002
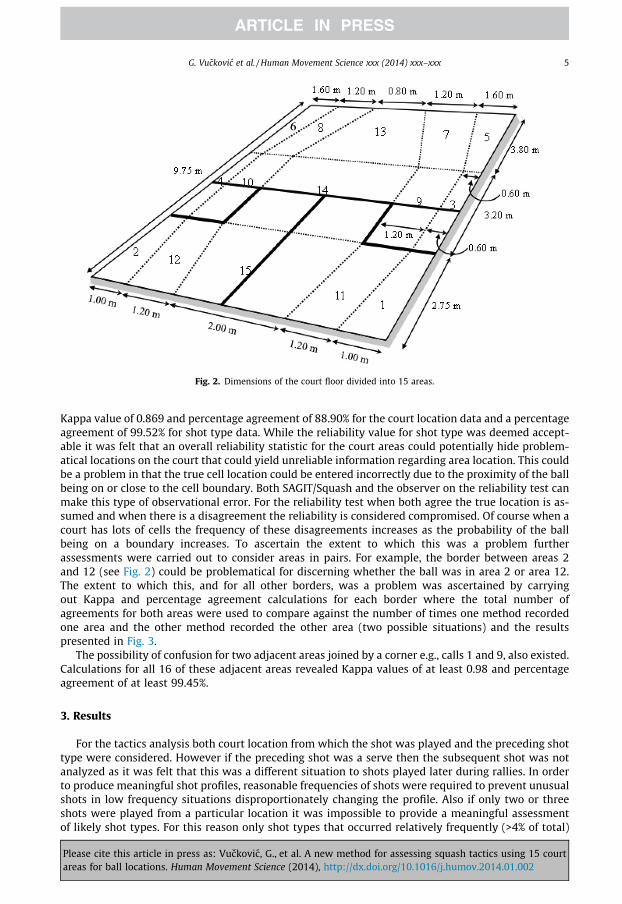
Fig. 2. Dimensions of the court floor divided into 15 areas.
G. Vuckovic et al. / Human Movement Science xxx (2014) xxx–xxx 5
Kappa value of 0.869 and percentage agreement of 88.90% for the court location data and a percentageagreement of 99.52% for shot type data. While the reliability value for shot type was deemed accept-able it was felt that an overall reliability statistic for the court areas could potentially hide problem-atical locations on the court that could yield unreliable information regarding area location. This couldbe a problem in that the true cell location could be entered incorrectly due to the proximity of the ballbeing on or close to the cell boundary. Both SAGIT/Squash and the observer on the reliability test canmake this type of observational error. For the reliability test when both agree the true location is as-sumed and when there is a disagreement the reliability is considered compromised. Of course when acourt has lots of cells the frequency of these disagreements increases as the probability of the ballbeing on a boundary increases. To ascertain the extent to which this was a problem furtherassessments were carried out to consider areas in pairs. For example, the border between areas 2and 12 (see Fig. 2) could be problematical for discerning whether the ball was in area 2 or area 12.The extent to which this, and for all other borders, was a problem was ascertained by carryingout Kappa and percentage agreement calculations for each border where the total number ofagreements for both areas were used to compare against the number of times one method recordedone area and the other method recorded the other area (two possible situations) and the resultspresented in Fig. 3.
The possibility of confusion for two adjacent areas joined by a corner e.g., calls 1 and 9, also existed.Calculations for all 16 of these adjacent areas revealed Kappa values of at least 0.98 and percentageagreement of at least 99.45%.
3. Results
For the tactics analysis both court location from which the shot was played and the preceding shottype were considered. However if the preceding shot was a serve then the subsequent shot was notanalyzed as it was felt that this was a different situation to shots played later during rallies. In orderto produce meaningful shot profiles, reasonable frequencies of shots were required to prevent unusualshots in low frequency situations disproportionately changing the profile. Also if only two or threeshots were played from a particular location it was impossible to provide a meaningful assessmentof likely shot types. For this reason only shot types that occurred relatively frequently (>4% of total)
Please cite this article in press as: Vuckovic, G., et al. A new method for assessing squash tactics using 15 courtareas for ball locations. Human Movement Science (2014), http://dx.doi.org/10.1016/j.humov.2014.01.002
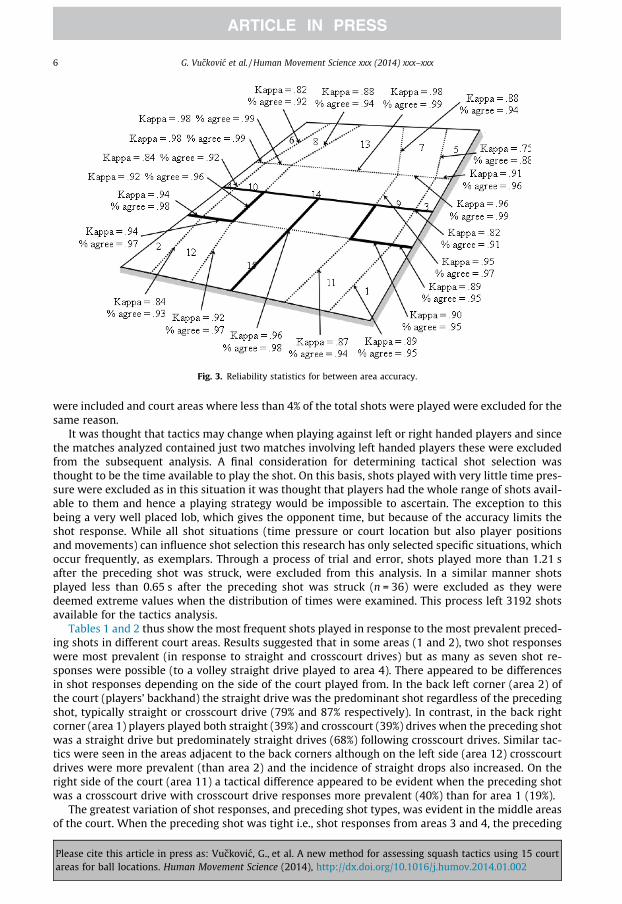
Fig. 3. Reliability statistics for between area accuracy.
6 G. Vuckovic et al. / Human Movement Science xxx (2014) xxx–xxx
were included and court areas where less than 4% of the total shots were played were excluded for thesame reason.
It was thought that tactics may change when playing against left or right handed players and sincethe matches analyzed contained just two matches involving left handed players these were excludedfrom the subsequent analysis. A final consideration for determining tactical shot selection wasthought to be the time available to play the shot. On this basis, shots played with very little time pres-sure were excluded as in this situation it was thought that players had the whole range of shots avail-able to them and hence a playing strategy would be impossible to ascertain. The exception to thisbeing a very well placed lob, which gives the opponent time, but because of the accuracy limits theshot response. While all shot situations (time pressure or court location but also player positionsand movements) can influence shot selection this research has only selected specific situations, whichoccur frequently, as exemplars. Through a process of trial and error, shots played more than 1.21 safter the preceding shot was struck, were excluded from this analysis. In a similar manner shotsplayed less than 0.65 s after the preceding shot was struck (n = 36) were excluded as they weredeemed extreme values when the distribution of times were examined. This process left 3192 shotsavailable for the tactics analysis.
Tables 1 and 2 thus show the most frequent shots played in response to the most prevalent preced-ing shots in different court areas. Results suggested that in some areas (1 and 2), two shot responseswere most prevalent (in response to straight and crosscourt drives) but as many as seven shot re-sponses were possible (to a volley straight drive played to area 4). There appeared to be differencesin shot responses depending on the side of the court played from. In the back left corner (area 2) ofthe court (players’ backhand) the straight drive was the predominant shot regardless of the precedingshot, typically straight or crosscourt drive (79% and 87% respectively). In contrast, in the back rightcorner (area 1) players played both straight (39%) and crosscourt (39%) drives when the preceding shotwas a straight drive but predominately straight drives (68%) following crosscourt drives. Similar tac-tics were seen in the areas adjacent to the back corners although on the left side (area 12) crosscourtdrives were more prevalent (than area 2) and the incidence of straight drops also increased. On theright side of the court (area 11) a tactical difference appeared to be evident when the preceding shotwas a crosscourt drive with crosscourt drive responses more prevalent (40%) than for area 1 (19%).
The greatest variation of shot responses, and preceding shot types, was evident in the middle areasof the court. When the preceding shot was tight i.e., shot responses from areas 3 and 4, the preceding
Please cite this article in press as: Vuckovic, G., et al. A new method for assessing squash tactics using 15 courtareas for ball locations. Human Movement Science (2014), http://dx.doi.org/10.1016/j.humov.2014.01.002

Table 1Percentage of shots played from different areas of the left side of the court in response to the most frequent types of previous shot.
Area Preceding shot Shot response played in area Percentage(%)
2
St drv (76%) St drv (79%); Xcourt drv (9%) 88
Xcourt drv(12%)
St drv (87%); Xcourt drv (7%) 94
(Sample = 88%)
12
St drv (36%) St drv (60%); Xcourt drv (16%); St drop (10%) 86
Xcourt drv(47%)
St drv (63%); Xcourt drv (13%); St drop (8%) 84
V Xcourt drv(13%)
St drv (70%); Xcourt drv (22%) 92
(Sample = 96%)
4
St drv (51%) St drv (10%); V Xcourt drv (27%); V St drv (29%); V St drop(24%)
90
V St drv (10%) St drv (28%); Xcourt drv (11%); V Xcourt drv (13%); V St drv(17%); St drop (9%); V St drop (11%); Xcourt lob (9%)
98
St dropshot(18%)
St drv (14%); Xcourt drv (22%) St drop (41%); Xcourt lob(22%)
99
V St dropshot(18%)
St drv e (14%); Xcourt drv (22%) St drop (34%); Xcourt lob(27%)
97
(Sample = 97%)
10
St drv (54%) V Xcourt drv (24%); V St drv (33%); V St drop (29%) 86
Xcourt drv(15%)
St drv (19%); Xcourt drv (12%); V Xcourt drv (17%); V St drv(22%); V St drop (27%)
97
V St drv (11%) St drv (27%); V Xcourt drv (26%); V St drv (11%); V St drop(31%)
95
(Sample = 80%)
6
St drop (73%) St drv (9%); Xcourt drv (23%); St drop (30%); Xcourt lob(32%)
94
V St drop (15%) St drop (30%); Xcourt lob (58%) 88(Sample = 80%)
Key: St = Straight; drv = drive; V = volley; Xcourt = crosscourt; drop = dropshot.
G. Vuckovic et al. / Human Movement Science xxx (2014) xxx–xxx 7
Please cite this article in press as: Vuckovic, G., et al. A new method for assessing squash tactics using 15 courtareas for ball locations. Human Movement Science (2014), http://dx.doi.org/10.1016/j.humov.2014.01.002
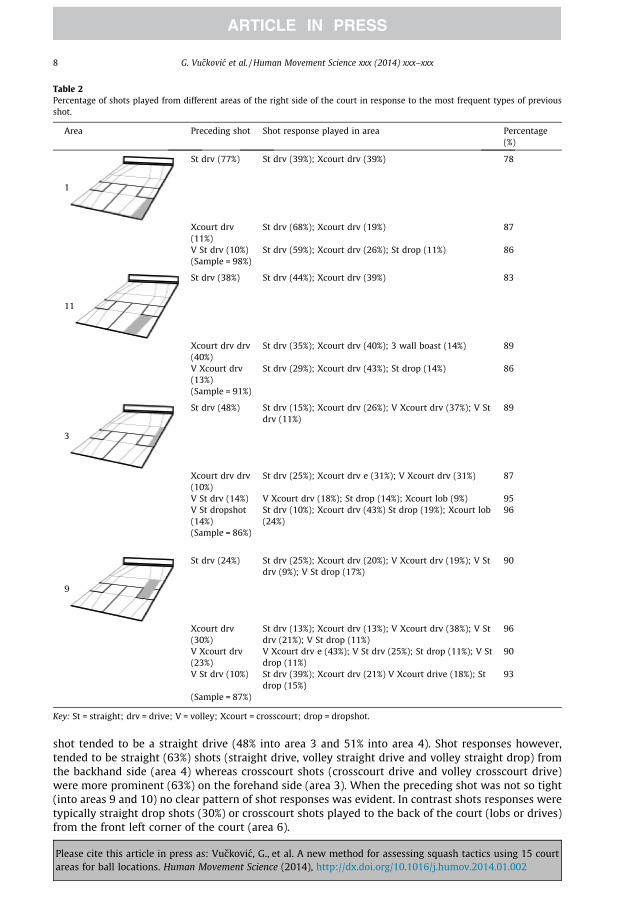
Table 2Percentage of shots played from different areas of the right side of the court in response to the most frequent types of previousshot.
Area Preceding shot Shot response played in area Percentage(%)
1
St drv (77%) St drv (39%); Xcourt drv (39%) 78
Xcourt drv(11%)
St drv (68%); Xcourt drv (19%) 87
V St drv (10%) St drv (59%); Xcourt drv (26%); St drop (11%) 86(Sample = 98%)
11
St drv (38%) St drv (44%); Xcourt drv (39%) 83
Xcourt drv drv(40%)
St drv (35%); Xcourt drv (40%); 3 wall boast (14%) 89
V Xcourt drv(13%)
St drv (29%); Xcourt drv (43%); St drop (14%) 86
(Sample = 91%)
3
St drv (48%) St drv (15%); Xcourt drv (26%); V Xcourt drv (37%); V Stdrv (11%)
89
Xcourt drv drv(10%)
St drv (25%); Xcourt drv e (31%); V Xcourt drv (31%) 87
V St drv (14%) V Xcourt drv (18%); St drop (14%); Xcourt lob (9%) 95V St dropshot(14%)
St drv (10%); Xcourt drv (43%) St drop (19%); Xcourt lob(24%)
96
(Sample = 86%)
9
St drv (24%) St drv (25%); Xcourt drv (20%); V Xcourt drv (19%); V Stdrv (9%); V St drop (17%)
90
Xcourt drv(30%)
St drv (13%); Xcourt drv (13%); V Xcourt drv (38%); V Stdrv (21%); V St drop (11%)
96
V Xcourt drv(23%)
V Xcourt drv e (43%); V St drv (25%); St drop (11%); V Stdrop (11%)
90
V St drv (10%) St drv (39%); Xcourt drv (21%) V Xcourt drive (18%); Stdrop (15%)
93
(Sample = 87%)
Key: St = straight; drv = drive; V = volley; Xcourt = crosscourt; drop = dropshot.
8 G. Vuckovic et al. / Human Movement Science xxx (2014) xxx–xxx
shot tended to be a straight drive (48% into area 3 and 51% into area 4). Shot responses however,tended to be straight (63%) shots (straight drive, volley straight drive and volley straight drop) fromthe backhand side (area 4) whereas crosscourt shots (crosscourt drive and volley crosscourt drive)were more prominent (63%) on the forehand side (area 3). When the preceding shot was not so tight(into areas 9 and 10) no clear pattern of shot responses was evident. In contrast shots responses weretypically straight drop shots (30%) or crosscourt shots played to the back of the court (lobs or drives)from the front left corner of the court (area 6).
Please cite this article in press as: Vuckovic, G., et al. A new method for assessing squash tactics using 15 courtareas for ball locations. Human Movement Science (2014), http://dx.doi.org/10.1016/j.humov.2014.01.002
G. Vuckovic et al. / Human Movement Science xxx (2014) xxx–xxx 9
4. Discussion
Before analyzing any performance some consideration must be given to the methods being usedand whether they are sufficiently robust to enable reliable and accurate data collection. When analyz-ing squash performance, it is typical to divide the court into areas for analysis but little attention hasbeen devoted to the size and shape of these areas. A new approach was presented which was based onthe area of the court and bounce of the ball in squash and a new method for determining the reliabilityassociated with each cell presented. Since the percentage agreement was shown to be typically around95% or higher it was suggested that this was an acceptable method for squash analysis. This comparesvery favourably with McGarry and Franks (1996) who found a weighted Kappa coefficient greater than0.8 when comparing the same operator assessing 60 rallies using the traditional 16 rectangular cellsfor court location with a six week gap between analyses.
The distributions of shot types found in this study were not directly comparable with previousstudies because of the difference in cell shapes and sizes. However changing the cell dimensionswas thought necessary as the previous 16 rectangular cell method didn’t distinguish between shotsthat were played close to the sidewalls (labeled areas 1–6 in this paper) from shots that were playedfrom similar positions but not close to the sidewalls (areas 7–12). Future studies are needed to fullytest whether this logic is an improvement over the previous method but these results have shown thatsquash tactics can be reliably discerned.
In order to determine the extent to which typical shot responses could be determined this studyselected shots under strict conditions. This was in response to McGarry and Franks (1996) who sug-gested that invariant patterns of play were difficult to ascertain but who also pointed out that thepreceding shot alone is likely to be insufficient to predict the subsequent shot. Consequently a num-ber of conditions were required before the shot response was considered in this paper. Previous shottype, time between shots, court location and the handedness of the players were controlled to re-duce the number of factors that would be likely to determine shot selection. Having done thisthe results suggested that in some areas (tight back left and right corners) players were highly likelyto play one of two shot responses when the preceding shot was a straight or crosscourt drive. If theball was not so tight (the adjacent areas 11 and 12) the shot responses tended to become morevaried. Further analysis of shot responses in other areas of the court tended to back up this findingwith tight shots (responses from close to the corners of the court) tending to be more predictable(two or three typical shots played) than loose ones (up to seven different shot responses to the samepreceding shot when nearer the middle of the court). However there also appeared to be tacticaldifferences based on the side of the court the shot was being played from with a tendency to playthe ball towards the back left of the court (to the right handed player’s backhand). This was evidentfor the back and middle areas of the court only, as shot responses at the front of the court appearedto utilize the diagonal of the court i.e., shots were played to the opposite sides of the front and backof the court.
5. Conclusions
This paper has provided a novel method for splitting the squash floor area into cells for shot anal-ysis. The cells were determined by the knowledge of how the ball typically bounces and the logic ofusing the proximity of the sidewalls to determine areas that were deemed as tight, loose and downthe middle. The subsequent analysis tended to confirm that these areas were discriminating differentconditions since shot selections varied between the areas (tactics were thus evident). While this paperhas only considered a small subset of conditions under which shots were played, the results tend tosuggest that other conditions should be analyzed to determine how well tactics can be determined.For example individual player profiles may be determined, which may be opponent specific. Winningand losing performances may also be analyzed to assess tactical profiles in favorable and unfavorablesituations. In summary this paper presents a more detailed approach to analyzing tactics by control-ling for a number of variables although further research is required to determine the extent to whichthese and other factors affect shot selection.
Please cite this article in press as: Vuckovic, G., et al. A new method for assessing squash tactics using 15 courtareas for ball locations. Human Movement Science (2014), http://dx.doi.org/10.1016/j.humov.2014.01.002

10 G. Vuckovic et al. / Human Movement Science xxx (2014) xxx–xxx
References
Atkinson, G., & Nevill, A. M. (1998). Statistical methods for assessing measurement error (reliability) in variables relevant tosports medicine. Sports medicine, 26, 217–238.
Chan, W. K., & Hong, Y. (1996). A comparison of the game strategies employed by national and international squash players incompetitive situation by notational analysis. Journal of Human Movement Studies, 31, 89–104.
Hong, Y., Robinson, P., Chan, W., Clark, C., & Choi, T. (1996). Notational analysis on game strategy used by the world’s top malesquash players in international competition. Australian Journal of Science and Medicine in Sport, 28, 18.
Hughes, M. (1985). A comparison of the patterns of play of squash. International Ergonomics, 85, 139–141.Hughes, M. (1998). 30 the application of notational analysis to racket sports. In Science and racket sports, 2. Second world congress
of science and racket sports and the 5th international table tennis federation sports science congress, 22–25 April 1997 (pp. 211).The National Sports Centre Lilleshall, Shropshire, UK: Spon Press.
Hughes, M., Cooper, S., & Nevill, A. (2002). Analysis procedures for non-parametric data from performance analysis. InternationalJournal of Performance Analysis in Sport, 2, 6–20.
James, N., Jones, N., & Hollely, C. (2002). Reliability of selected performance analysis systems in football and rugby. InProceedings of the 4th international conference on methods and techniques in behavioural research (pp. 116–118). Netherland:University of Amsterdam.
James, N., Taylor, J., & Stanley, S. (2007). Reliability procedures for categorical data in performance analysis. International Journalof Performance Analysis in Sport, 7, 1–11.
McGarry, T., & Franks, I. M. (1996). In search of invariant athletic behaviour in sport: An example from championship squashmatch-play. Journal of Sports Sciences, 14, 445–456.
Perš, J., Bon, M., Kovacic, S., Šibila, M., & Dezman, B. (2002). Observation and analysis of large-scale human motion. HumanMovement Science, 21, 295–311.
Vuckovic, G., Dezman, B., Erculj, F., Kovacic, S., & Perš, J. (2003). Comparative movement analysis of winning and losing playersin men’s elite squash. Kinesiologia Slovenica, 9, 74–84.
Vuckovic, G., Dezman, B., Erculj, F., Kovacic, S., & Perš, J. (2005). Position error analysis of Sagit/squash system in manual strokeannotation. In Proceedings of the 10th annual congress of the European college of sport science (pp. 265). Belgrade: SportMedicine Association of Serbia.
Vuckovic, G., Perš, J., James, N., & Hughes, M. (2009). Tactical use of the T area in squash by players of differing standard. Journalof Sports Sciences, 27, 863–871.
Vuckovic, G., Perš, J., James, N., & Hughes, M. (2010). Measurement error associated with the SAGIT/squash computer trackingsoftware. European Journal of Sport Science, 10, 129–140.
Vuckovic, G., Perš, J., James, N., & Hughes, M. (2008). Automated tracking system assessments of player distances from the T atthe moment the ball is hit for winners and losers of games in elite squash. In A. Hökelmann & M. Brummund (Eds.),Proceedings of the world congress of performance analysis of sport VIII. Magdeburg: Otto-von-Guericke-Universität.
Please cite this article in press as: Vuckovic, G., et al. A new method for assessing squash tactics using 15 courtareas for ball locations. Human Movement Science (2014), http://dx.doi.org/10.1016/j.humov.2014.01.002