A NEW MEASURE OF PERCEIVED MOTOR COMPETENCE FOR CHILDREN AGED 4 TO 6 YEARS1
31
1 Perceptual and Motor Skills, 2005, 101, 131-148 A NEW MEASURE OF PERCEIVED MOTOR COMPETENCE FOR CHILDREN AGED 4 TO 6 YEARS 1 LUIS MIGUEL RUIZ PÉREZ Castilla La Mancha University. Toledo JOSÉ LUIS GRAUPERA SANZ Alcalá de Henares University. Madrid 1 Address correspondence to Prof. Dr. Luis M. Ruiz, Facultad de Ciencias del Deporte, Universidad de Castilla La Mancha, Campus Universitario “Antigua Fábrica de Armas”, Avda. Carlos III s/n. 45071 Toledo, España, mail ([email protected])
Transcript of A NEW MEASURE OF PERCEIVED MOTOR COMPETENCE FOR CHILDREN AGED 4 TO 6 YEARS1
1
Perceptual and Motor Skills, 2005, 101, 131-148
A NEW MEASURE OF PERCEIVED MOTOR COMPETENCE FOR CHILDREN
AGED 4 TO 6 YEARS1
LUIS MIGUEL RUIZ PÉREZ
Castilla La Mancha University. Toledo
JOSÉ LUIS GRAUPERA SANZ Alcalá de Henares University. Madrid
1 Address correspondence to Prof. Dr. Luis M. Ruiz, Facultad de Ciencias del Deporte, Universidad de Castilla La Mancha, Campus Universitario “Antigua Fábrica de Armas”, Avda. Carlos III s/n. 45071 Toledo, España, mail ([email protected])
2
A NEW MEASURE OF PERCEIVED MOTOR COMPETENCE FOR CHILDREN
AGED 4 TO 6 YEARS
3
Summary: The purpose of this study was to develop and validate an instrument for the assessment of perceived motor competence in young children aged 4 to 6 years old. The structure of the Children’s Perception of Motor Competence Scale (CMPI) was analyzed through exploratory and confirmatory factor analysis with 495 children between 4 and 6 years of age. A second order model was selected and consisted of one scale of Perceived General Motor Competence and two subscales: Perceived Gross Motor Competence and Perceived Fine Motor Competence. The number of items was 22. This instrument seems to possess acceptable internal reliability: global scale (α = .81, Perceived Gross Motor Competence (α = .80) and Perceived Fine Motor Competence (α = .65). Children manifested accuracy in the assessment of the competence. Perceived motor competence was related to actual motor competence as measured by the Movement ABC Test and by an observational scale used by Physical Education teachers. There were no gender differences. The Children’s Perception of Motor Competence Scale could be considered an interesting assessment instrument for physical and movement educators for identifying current self-perceptions of motor competence in young children.

4
Competence is defined as a general capability of an individual to interact effectively
with his environment (White, 1959). Competence is a perceived mastery of skills in different
domains: motor, cognitive and social. Play, curiosity and exploratory behaviors of children are
based on the need to interact effectively with the environment. It is a functional notion which
refers to the effective participation of a subject in his or her environment. The literature about
the concept of competence makes a broad distinction between a cognitive approach,
emphasizing the development and mastery of skills in general, and motor skills in particular,
and a motivational approach in which competence is related to behavioral and personality
development (Connolly & Bruner, 1974; Van der Steen & Vermeer, 1987).
According to Harter’s competence theory (Harter, 1978), there are several
achievement domains: Cognitive competence, which concerns school and intellectual
results, being successful in class, being bright, appreciating good school results; social
competence, which describes the relationship of the child with his or her peers, having a lot
of friends, being pleasant, being someone in the class; and physical competence, which
brings together the results in games and sporting activities which need great motor
commitment, being good at sport, improving easily in physical education, preferring to
practice rather than be a spectator in physical and sporting tasks. Children do not perceive
their competence as being identical in all domains. The feeling of competence is the
complex result of these three components.
With regard to the term motor competence, different authors have used it to express
what common sense and daily observation of physical education sessions make it possible
to witness, i.e. the behavior of schoolchildren when they carry out a complex motor task
(Connolly, 1980; Keogh & Sugden, 1985). Physical education sessions involve a constant
interaction between the context, the task and the pupil, and children must move effectively
and efficiently to achieve and solve constantly changing objectives and problems. Children
are motivated to have an effect on their environment and to engage in attempts at mastery.
When attempts result in competent or successful motor performance, children experience
intrinsic pleasure, thereby maintaining or enhancing their competence (Shapiro, Yun &
Ulrich, 2002).

5
Being competent in physical education implies a dynamic and complex process
characterized by a progression of change in the control of one's actions with others or with
objects in the environment, a process which means acquiring the capability to obtain the
objectives one sets oneself that are often impossible to measure with classical procedures of
skills evaluation. This concept has a global aspect comprising knowledge, procedures,
attitudes and feelings which intervene in the many motor behaviors which the subject
carries out in his or her environment and with others and, on the other hand, has a concrete
aspect which is translated into specific competencies which the schoolchild should be able
to demonstrate at each stage of the curriculum, and which permit evaluating and
determining his or her motor status in physical education (Ruiz, 1995).
As Delignières (1992) indicates, competence in physical education means the
possession of a repertoire of pertinent responses for situations which are to a large extent new;
to possess, in fact, a body of knowledge, procedures and attitudes which permit autonomous
practice. Schoolchildren learn to be competent because they learn to better interpret situations
which demand performance and because they develop the necessary resources to respond
adequately to the demands of the situation, which means developing a feeling of ability to act,
of confidence in being able to cope with the problem situations which arise and of joy at being
able to transform one's environment (Harter, 1981).
The construct of perceived competence or ability has been highlighted in both
psychological and sport psychological research as one that is intimately related to
motivational indicators such as choosing to participate, sustaining effort, and continuing
interest in tasks or activities (Harter, 1982; Ulrich, 1987; Hagger, Asford, & Stambulova,
1998). Harter and Pike (1984) found that children aged 4 to 7 years make reliable
judgments about their competence across the different domains (cognitive, physical, social
and behavioral) if they are pictorially depicted as concrete observable behaviors (Harter,
1990), but they can have problems in differentiating competences across these four
domains. If we apply this model to the learning of motor skills and physical education, it
may be supposed that enhanced motor skills will result in feelings of motor competence
that could promote participation in physical education classes.
6
Perceptions of motor competence by children
An analysis of the different measures of perceptions of competence, self-concept,
self-regard, self-esteem, etc., show different perspectives and approaches. Villa &
Auzmendi (1992, pp. 39-54) reviewed these measures and found that the majority were
made for older children. If we consider our main interest, there are not many measures of
self-perceptions of motor competence in children younger than 6 years old, though a few of
them have some items or subscales designed to measure this dimension.
The Martinek-Zaichkowsky Self-concept Scale for Children (Martinek &
Zaichkowsky, 1977) and The Pictorial Scale of Perceived Competence and Social Acceptance
for Young Children (Harter & Pike, 1984) are two of the scales that present physical and
motor competence items together with pictures about other domains, but these instruments
were not developed for physical education settings. Ulrich & Collier’s (1990) Modified
Pictorial Scale of Perceived Physical Competence for Children was developed specifically to
measure perceived gross motor competence in children between 7 and 12 years of age in the
physical education setting. This measure consists of different items representing skills like
kicking a ball, rolling a ball, throwing a ball, etc. These scales contain pictures that depict a
competent child (boy or girl) on one side and another not very skilled child on the other side.
For each skill, children are asked to select the child in the picture most like him or her
(Shapiro et al, 2002).
The notion of motor competence involves a motivational and affective dimension
which should not be overlooked and which mediates children’s performance and influences
the choice of tasks, persistence in practice and performance in movement contexts (Griffith &
Keogh, 1982). Therefore, one could ask: what are the perceptions of their physical or motor
competence in young children?, what role do these perceptions play in school physical
education? and can we get information about these self-perceptions in young children?.
The purpose of this investigation was to provide evidence for validity and reliability of
a new scale, the Children’s Perception of Motor Competence Scale (CMPI) for measuring
young children’s perceptions of gross and fine motor competence (4 to 6 years old) in the
physical education settings.
7
Method
Participants
A total of 495 children, ranging from 4 to 6 years (247 boys and 248 girls) provided
data for this study: 142 children were four years old (78 boys and 64 girls), 147 children
were five years old (74 boys and 73 girls) and 206 children were six years old (95 boys and
111 girls). All of them attended state and private schools in Madrid, Spain. Principals and
parents were informed about this study and they accepted to participate in it.
Children’s Perception of Motor Competence Scale (CMPI)
The first task in the development of this scale was to analyze physical education
classes of young children (4 to 6 years old), to classify the kind of tasks and skills that
children usually practice in these contexts. The first selection was based on a report that
twenty school physical education teachers made about the most common tasks at this
physical education level. The analysis of this report shown that 33 skills were the most
common. As a second step, these skills were considered and validated by three physical
education experts who accepted that 23 of the skills and behaviors were typical and
representative of physical education and movement sessions in this age range.
These skills were prepared as a booklet with pictures, where boys and girls were
shown performing, or not performing, these diverse basic perceptual-motor tasks: running,
jumping, balancing, swimming, throwing, catching, posting coins, threading, etc., in a
bipolar fashion as previously explained. At the same time, scenes related to the subject and
the teacher were added These items were administered to a group of children of this age
range to assess the understanding the drawings and expressions. After analysis, item
number 4 (kicking task) was eliminated because the drawings were confusing for these
children. The final version had 22 items; the first item served as an example to explain how
to respond. To respond to the scale, children pointed out with his or her finger or a pencil,
which boy or girl in each scene is most like what the child felt or would do themselves (Fig.
1).
INSERT FIG.1 HERE
8
Movement ABC Test and Children’s Motor Competence Observation Scale
In order to examine the relationship of perceived and actual motor competence, after
completing the scale, subject’s actual motor competence was measured using the Movement
ABC test (Henderson & Sudgen, 1992). This test was designed for use with children aged 4
to12 years and older. A total of 32 items are divided into four sets of eight tasks, each set
intended for use with children of specific ages. The first set of items, labeled Age Band 1,
is designed for use with 4 to 6 year-old children. The second set, Age Band 2, for 7 and 8
years old children, the third set for 9 to 10 year-olds and the fourth set for children 11 year
old and older. The test is identical in its structure in each age band. Three items involve the
use of the hands, two items require the children to catch or throw a bean bag or small ball
and three items assess static and dynamic balance. In this investigation, items of Age Band
1 were used for 4 to 6 year-olds (Table 1).
INSERT TABLE 1 HERE
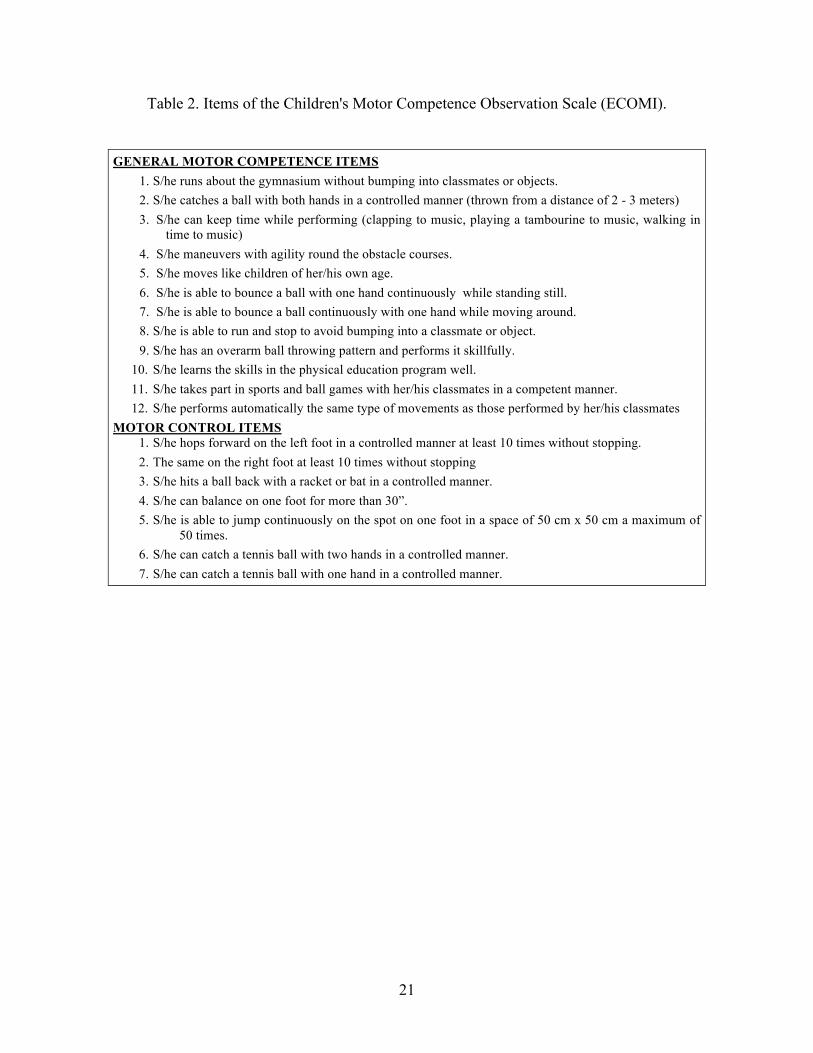
Other strategy was to ask physical education teachers to observe children’s motor
competence in classes, by means of the Children's Motor Competence Observation Scale
(ECOMI) designed as an observational tool (Ruiz, Graupera, & Gutiérrez, 2001). This scale
depicts different items representing situations of differing complexities by grouping in two
factors, General Motor Competence and Motor Control, which frequently occur in physical
education sessions and indicate children’s motor competence. The presentation of each of the
items used a Likert scale of 4 points, in which 1=the absence of the behavior and 4=presence
(Table 2).
INSERT TABLE 2 HERE
Procedures
The Children’s Perception of Motor Competence Scale (CMPI) was administered
individually in a separate part of the school (office or empty classroom) and lasted a
variable length of time. Each boy or girl was shown each of the 22 scenes and asked which
boy or girl of the scene he or she identified most with. After answering this scale, subjects
performed individually the Movement ABC test (MABC) and during the next two weeks
their teachers observed them in the physical education classes and completed the Children's
Motor Competence Observation Scale (ECOMI).
9
Results
Exploratory Factor Analysis
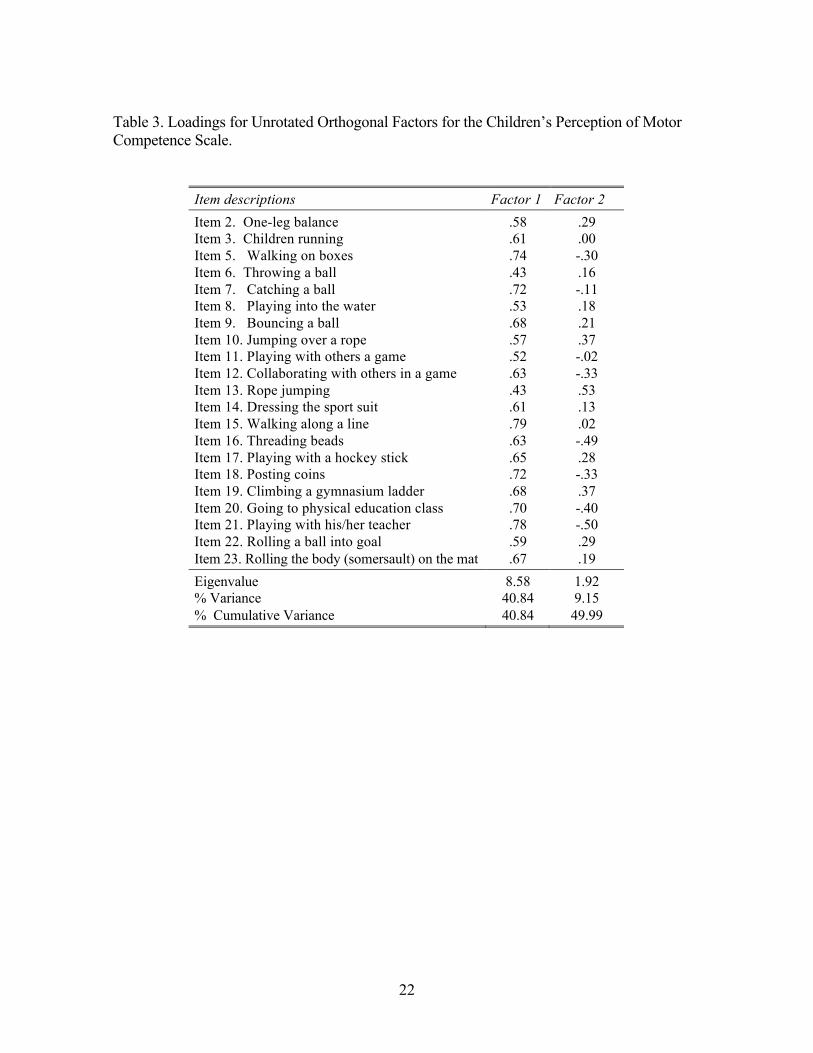
Exploratory factor analysis was conducted on the scale to examine the internal
structure of the instrument and its principal dimensions. The maximum likelihood method was
used, making all calculations with the PRELIS 2.51 program (Sörbom & Jöreskog, 1999). One
main component was extracted from this analysis (Eigenvalue = 8.58; % Variance = 40.84)
and a second component was extracted with lower factor loadings (Eigenvalue=1.92; %
Variance=9.15). All factor loadings in the first factor were higher than .40. These data suggest
that the items of the CMPI scale measure a single construct than we could call: Perception of
Motor Competence (Table 3).
INSERT TABLE 3 HERE
Factor loadings of the majority of items in the second factor was lower than .30, and
when these loadings were higher, still were far below loadings on the first factor. These
higher coefficients in the second factor were of opposite sign, item 13 (rope jumping), item
10 (jumping over a rope) and item19 (Climbing a gym ladder) showed positive loadings,
but item 16 or item 18 (threading beads and posting coins) had negative correlations. It is
possible that there is a secondary factor that comprising the fine-motor items, in contrast
with the gross motor competence items. In conclusion, Factor 1 accounted for 40% of the
variance, and factor loadings on all items were higher than for the second factor (except
item 13). This suggested that the Children’s Perception of Motor Competence Scale is one-
dimensional and measures a general first-order factor (Carmines & Zeller, 1979). As an
alternative model, it is possible to accept that this general factor corresponds to a second-
order dimension with the inclusion of other first-order factors, differentiated by perceptions
of competence in gross and fine motor tasks.
Confirmatory factor analysis
The adequacy of the factor structure of the Children’s Perception of Motor
Competence Scale was examined using confirmatory factor analysis. Two alternative models
were examined to assess their effectiveness in representing the perception of motor
competence responses in young children. These analyses were made with the LISREL 8.51
program (Jöreskog & Sörbom, 1996). The single-factor model specifies all the CMPI items

10
loading on one first-order factor (Table 3). Such a model tests a one-dimensional
conceptualization of the Perceived Motor Competence construct; that is, it tests the
assumption that all items measured a single construct, rejecting the theory that perceived
motor competence in young children consists of distinct gross and fine motor elements.
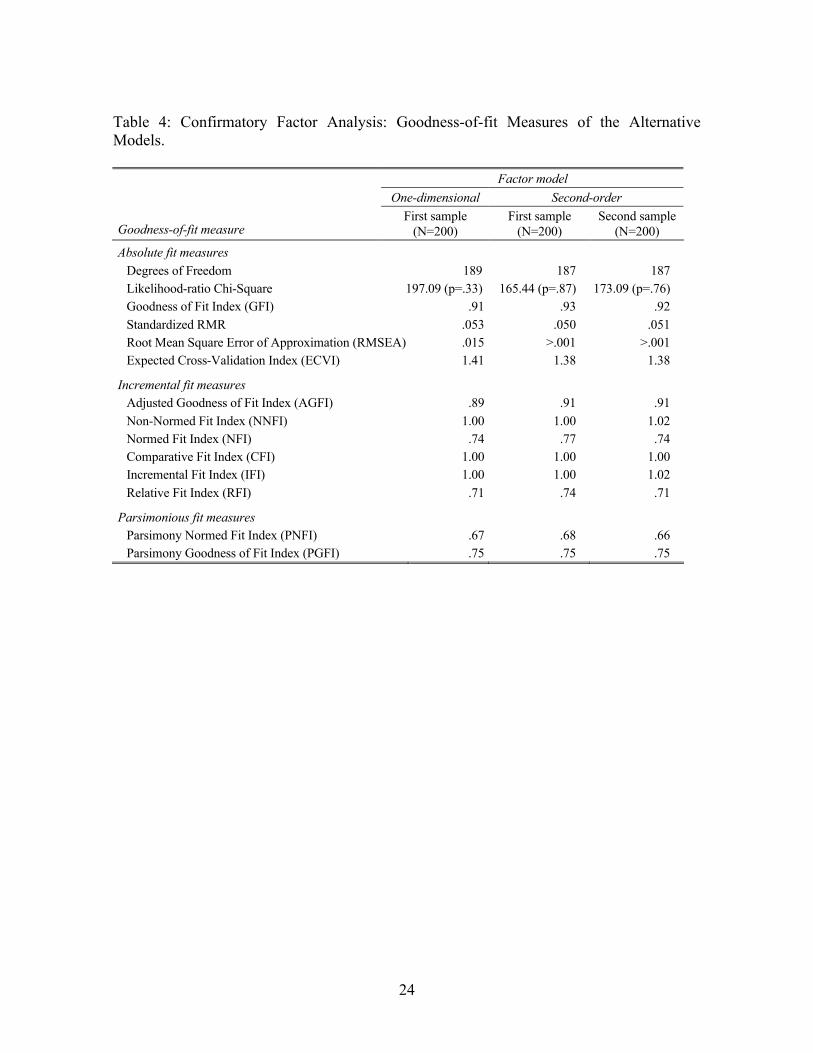
Examination of goodness-of-fit measures showed that the model had a satisfactory fit to data,
as the non-normed fit index, comparative fit index and the root mean squared error of
approximation reach the desirable cut-off values (Chi square not significant: p=.33, GFI>.90,
RMSEA<.05; AGFI near .90; NNFI=1, CFI=1 and PGFI=.75) (Table 4). This one-
dimensional goodness-of-fit model was analyzed with a sample of 200 children, as different
authors recommend for estimating these kind of models (Hair et al., 1998) and that is proposed
as being the critical sample size (Hoelter, 1983).
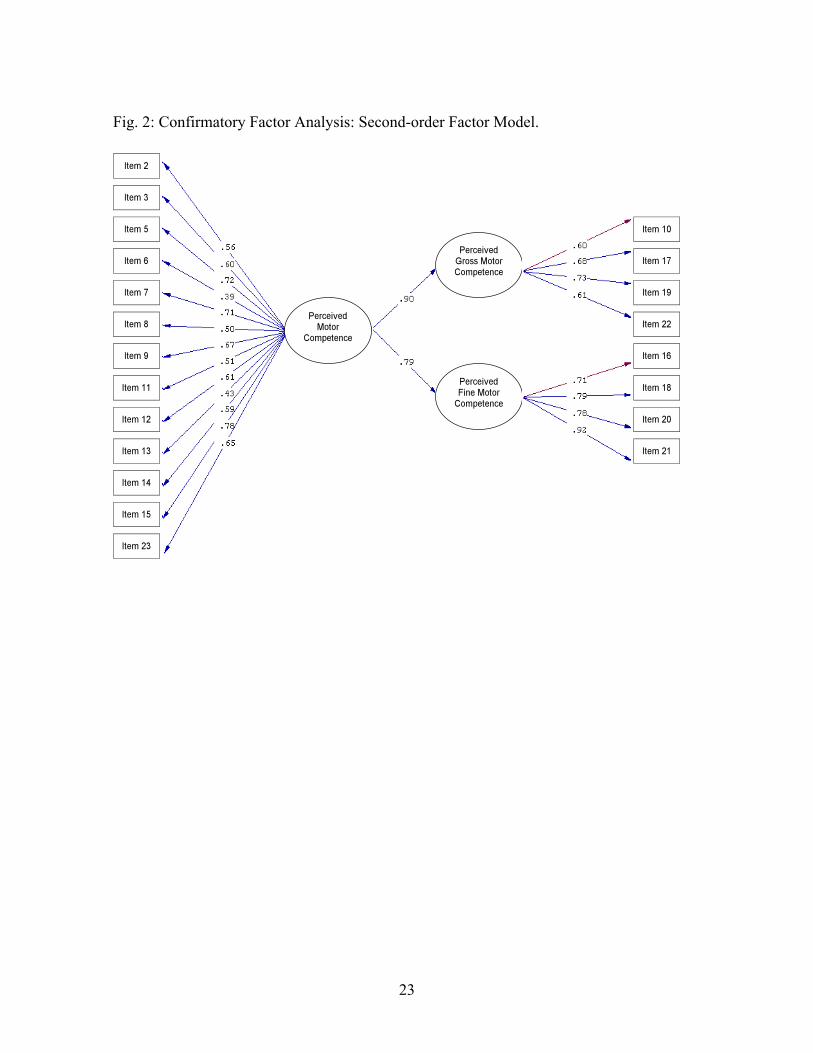
Higher order factor analysis model was considered as an alternative, with a second-
order factor that assessed Perceived Motor Competence and two first-order factors that
differentiated the perceived motor competence into fine or manipulative tasks and gross
motor tasks. This model is represented in Fig. 2 with correlation coefficients between the
factors and variables.
INSERT FIGURE 2 HERE
The second order model had all of the main fit requisites, but showed better indexes
than the one-dimensional model. Goodness-of-fit model was analyzed in this case with the
same 200 children. Then, absolute fit measures, Chi-square value was lower (p=.87), GFI
higher (.93), standardized RMR and RMSEA better, and the ECVI was a little lower,
something that is particularly interesting when we talk about alternative models. Indexes of the
incremental fit measures are equivalents into the two models but the AGFI of the higher-order
model is better, and surpass the recommended value of .90 (AGFI=.91), this measure in the
one-dimensional model was lower (AGFI=.89). The indexes of parsimonious fit measures
were very similar into the two models (Table 4). As a consequence of this comparison, we
selected the second-order factor model as the theoretical structure of The Children’s
Perception of Motor Competence Scale. The measure comprises one scale of Perceived Motor
Competence (PMC) and two subscales, Perceived Gross Motor Competence (PGMC) and
Perceived Fine Motor Competence (PFMC). The score would be calculated by summing items
responses for the subscales.
11
INSERT TABLE 4 HERE
The final estimation process was a cross-validation procedure of dividing the sample
into two parts with the objective of validating the results of the selected second-order factor
analysis. Goodness-of-fit measure of the second sample were very similar to the first sample.
The absolute fit measures showed a Chi-square value highest but very satisfactory (p=.76), the
GFI, standardized RMR and RMSEA were very similar and the ECVI was identical. Indexes
of the incremental fit measures were equivalents into the two models, AGFI y CFI were
identical with the two samples, indexes of parsimonious fit measures were very similar into
the two samples, though PNFI was slightly lower in the second sample (Table 4). In
conclusion, internal validity of the second-order factor model was satisfactory and indicative
of its power.
External Validity
One of the main aspects in the development of a test of perceived competence is the
level of accuracy in representing the actual competence of the subjects. In this case, it was
necessary to consider the relationships among the results of Children’s Perception of Motor
Competence Scale (CMPI) and the Movement ABC Test (Henderson & Sudgen, 1992) and
teachers’ perceptions of children’s actual competence as measured by the Motor
Competence Observation Scale (ECOMI; Ruiz et al., 2001). These results showed that
scores on the scales of the CMPI, Perceived Gross Motor Competence, Perceived Fine
Motor Competence and the total score had significant relationships with some of the actual
motor competence variables. These relationships were low and moderate (ranging from .10
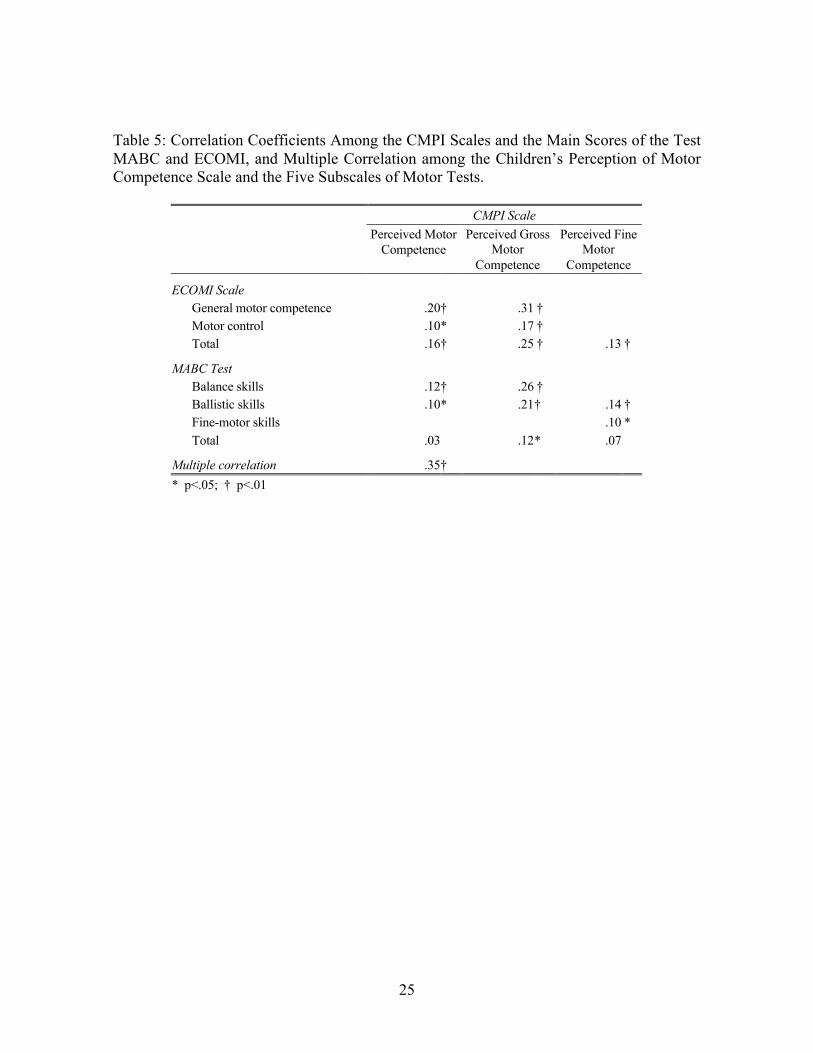
to .31) (Table 5).
INSERT TABLE 5 HERE
The Perceived Gross Motor Competence Scale had significant relationships with the
two ECOMI subscales, General Motor Competence and Motor Control and with the global
result of the scale. There were significant relationships with two components of the
Movement ABC test, Gross-motor Skills and Ballistic Skills, and with the total score, too.
These coefficients ranged between .31 and .12. The Perceived Fine Motor Competence
Scale had significant relationships with the two components of the Movement ABC test
that employed hands in their performance, Ballistic Skills and Fine-motor skills, and with
12
the total score of the ECOMI scale. These coefficients were lower and ranged from .14 to
.10. The global index of the Perceived Motor Competence had significant relationships
with all items of the General Motor Competence dimension of the ECOMI scale, and with
Balance skills and Ballistic skills measures of the Movement ABC test. These coefficients
were between .20 y .10. It is interesting to emphasize, specifically, correlations between the
general and gross-motor competence, and Balance skills of the two motor instruments, the
Movement ABC and the ECOMI scale, with the Perceived Gross Motor Competence
subscale of the CMPI (ranging from .26 to .31). Finally, multiple correlations were
calculated between the Children’s Perception of Motor Competence Scale (CMPI) with the
five partial measures of the two motor tests. This result was R= .35 (p< .001), 12%
common variance.
Reliability
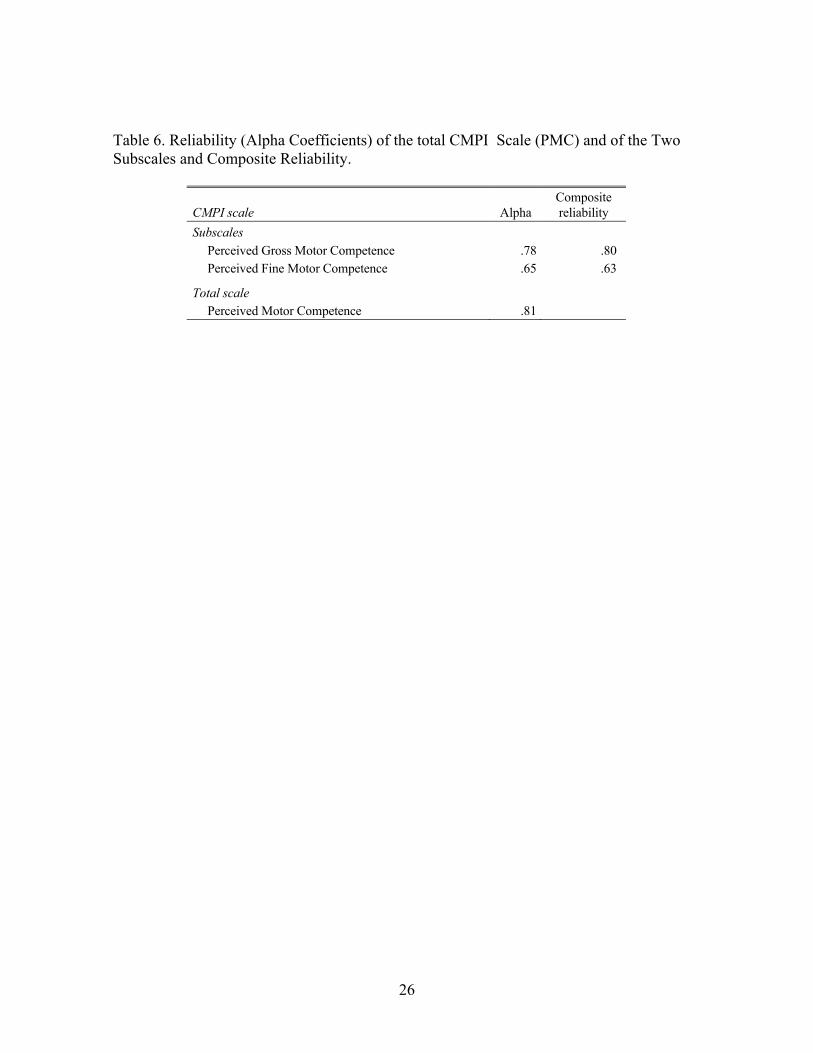
Evidence of reliability was determined using internal consistency reliability and
complementarily, was calculated as the composite reliability of the two subscales (Jöreskog
& Sörbom, 1996).The estimate of the internal consistency of the global Children’s
Perception of Motor Competence Scale (CMPI) indicated that this instrument was reliable
(α = .81) and showed that the responses of these young children were consistent. Reliability
estimates of the two subscales were lower: Perceived Gross Motor Competence .78 and
Perceived Gross Motor Competence Scale .65. The reliability estimates of the composite
reliability coefficients were very similar to alpha coefficients (Table 6).
INSERT TABLE 6 HERE
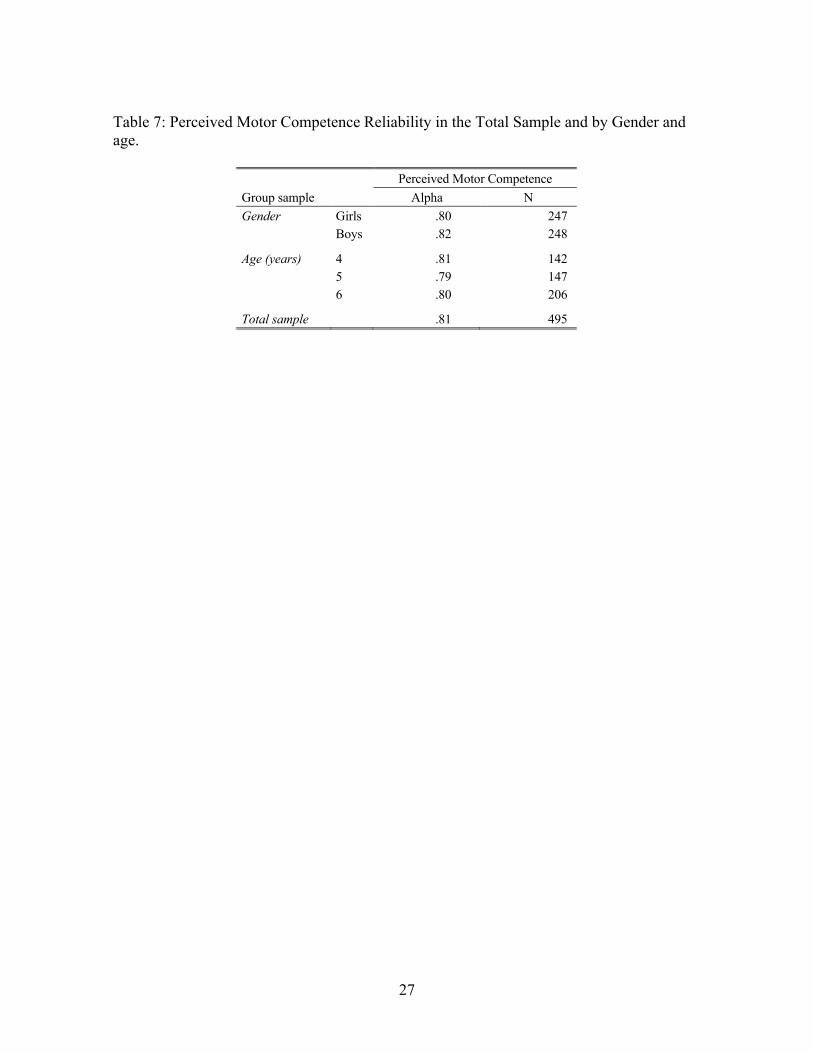
As a complement of these analyses, the reliability of the global scale was calculated
(alpha coefficients) for the different age and gender samples of this study. There were no
differences in the consistency of the responses across age groups, and there were no gender
differences (Table 7). All of these coefficients were near .81 or between .79 and .82. This is
particularly important because these results suggest that children as young as 4 years old can
respond to this kind of scale with so reliability as older children.
INSERT TABLE 7 HERE
13
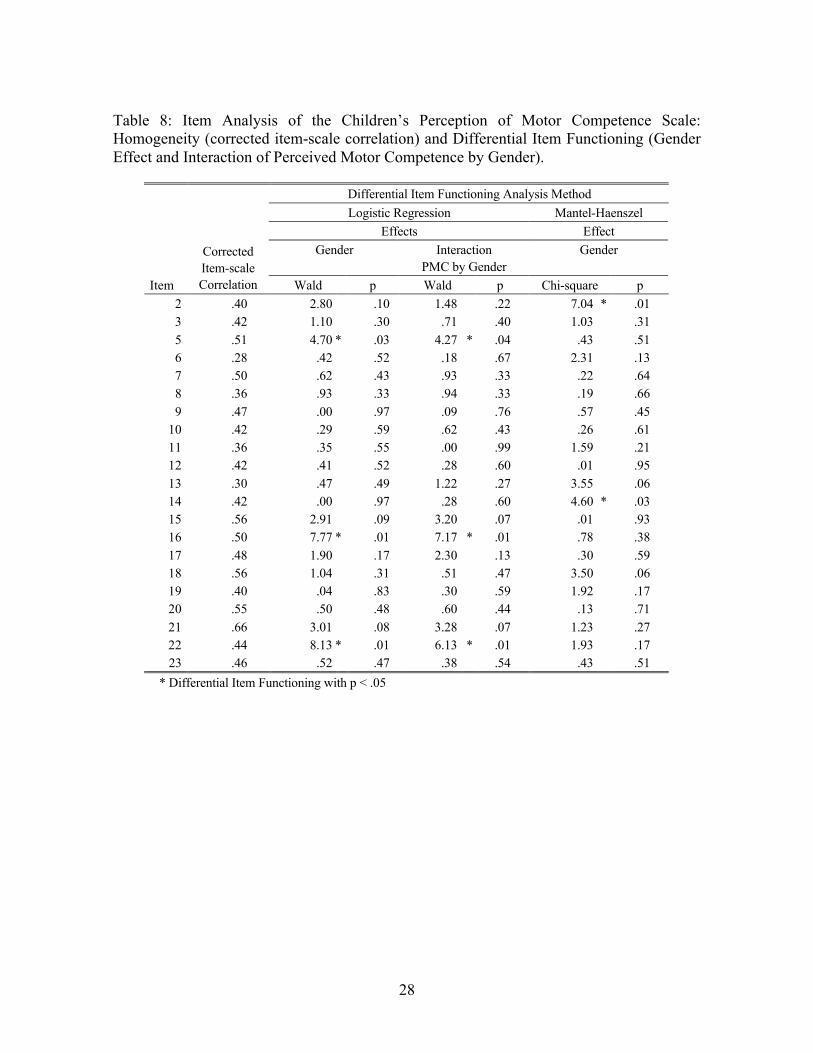
Item analysis
Item analysis demonstrated a good homogeneity for the total Perceived Motor
Competence scale, all items having correlations item-total higher than .30. Only item 6 had a
lower coefficient (Table 8). It is important to remember that all items had loadings higher than
a .40 on the first factor of the exploratory analysis (Table 3), and all items had item-subscale
correlations higher than .60 on the Perceived Gross Motor Competence subscale, .71 on the
Perceived Fine Motor Competence and .43 on the Perceived Motor Competence (except item
6 that was .39) in the confirmatory analysis (Fig. 2).
INSERT TABLE 8 HERE
Differential Item Functioning (DIF) was calculated by two methods, the Mantel-
Haenszel method (Holland & Thayer, 1988) and logistic regression method (Swaminathan &
Rogers, 1990). The first method analyzed the possibility of a differential functioning by
gender in each item. Only two items (9.5%) showed this effect, one in favor of girls (item 2)
and the other in favor of boys (item 14). These items form part of the general scale but not of
the two subscales. In conclusion, gender’s Differential Item Functioning effect in the general
score was not significant (Table 8). When we analyzed the gender effect with the logistic
regression method, we observed that there was no coincidence with the results of the other
method because this test is stronger when the differential item functioning is not uniform
(Rogers & Swaminathan, 1993). In this case there were no significant differential effects in the
two items identified by the other test (item 2 and 14), nevertheless, this procedure found three
items with a non uniform Differential Item Functioning. The effect must be considered small
because it was not detected with the other test. Item 5 is slightly favorable to girls and the
other two items (numbers 16 and 22) to boys. In our opinion there is no global gender effect.
In order to analyze if item differences by gender had the same direction than the total
score, it was estimated a non uniform Differential Item Functioning (interaction gender by
scale), as a result of this analysis the same three items showed an opposite direction to the total
scale, thus this effect were balanced and an small proportion of items (14%), had a satisfactory
homogeneity and good factorial loads, and it was not necessary to eliminate them.
14
Differences by age group and gender in CMPI scales.
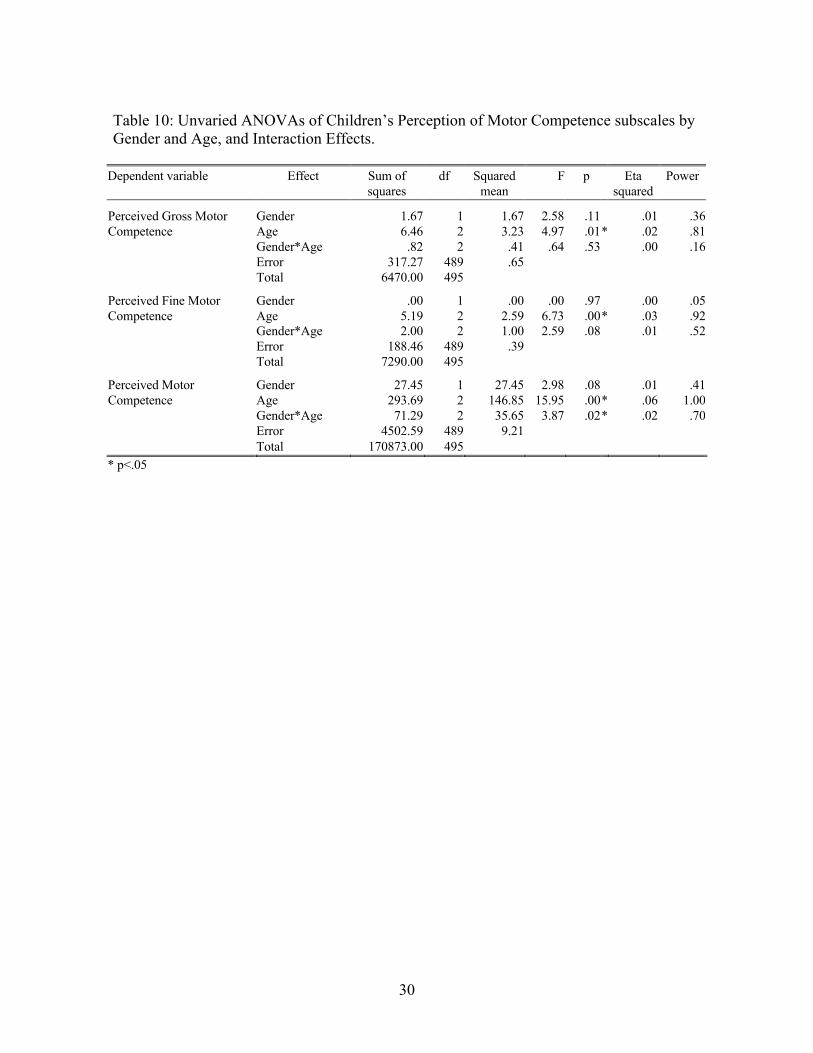
As a part of this analysis the effects of gender and age group were assessed. Three
unvaried ANOVA (SPSS 11.01) was applied with the two independent factors: gender and
age, and Perception of Gross Motor Competence, Perception of Fine Motor Competence and
the global factor, Perception of Motor Competence of the CMPI Scale as dependent variables,
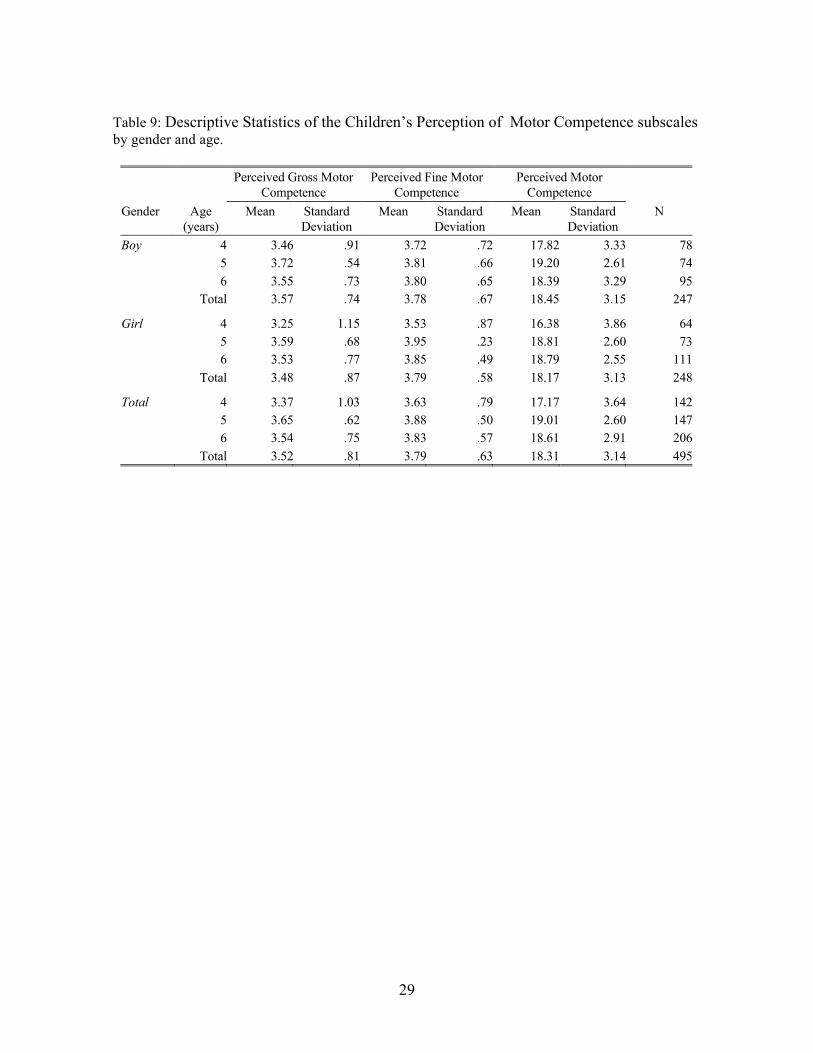
since CMPI subscales were related among them. Table 9 gives means and standard deviations
contrasted by gender and age for the three dependent variables.
INSERT TABLE 9 AND TABLE 10 HERE
There were no significant effects by gender in the every three subscales. However, if
we consider age, there were significant effects for each subscale, and a significant interaction
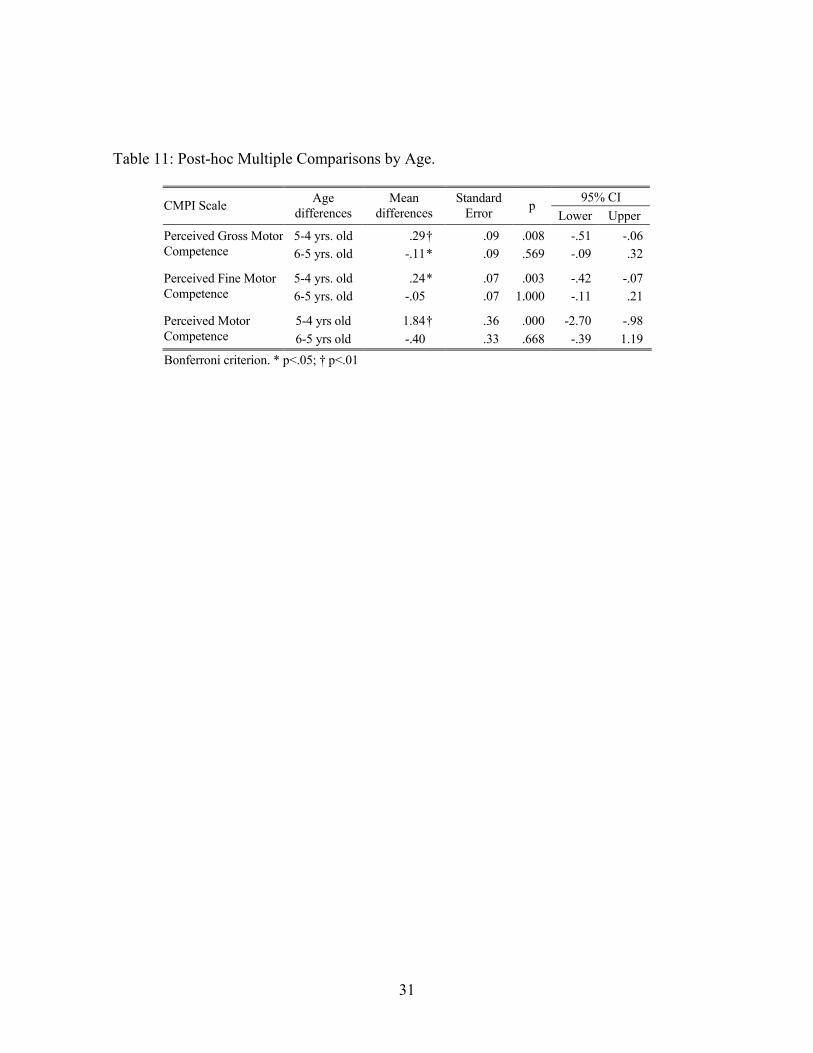
gender by age effect in relation to the Perception of Motor Competence scale (Table 10).
Perception of motor competence increase with age, and particularly between four and five
years old, differences were significant on the three measures (Table 11). This effect was larger
in girls between 4 and 5 years old, specifically on the general Perception of Motor
Competence, where the interaction effect was significant.
INSERT TABLE 11 HERE
Discussion
The focus of this study was on a first construct validation of the measurement of 4 to 6
year-olds children perceived motor competence based on the responses from the Children’s
Perception of Motor Competence Scale (CMPI). It is interesting that young children can
respond consistently if they are confronted with scenes of their life like a gymnasium,
swimming pool or physical activity settings. Another interesting result was that there were no
differential functioning by sex. It is a question of debate and occasionally causes criticisms
when measures do not have male and female versions. In this case, it is possible to say that
children observed and decided about these scenes in terms of the skill levels and not in terms
of the sex of the figures.
In relation to gender differences, the results of this study were different with other
studies made in the U.S.A. (Harter, 1985) or in the Netherlands (Van Rossum et al., 1999). In
these studies perceived motor competence was higher in boys than in girls, but these
investigations were made with children older than children of this study.
15
This study also assessed the relationships between perceived and actual motor
competence in this age range. Some studies have showed that there are positive and significant
correlations between actual and perceived motor competence (see McKiddie & Maynard,
1997), by contrast others had not found this relationships (Goodway & Rudisill, 1997; Yun &
Ulrich, 1997; Raudsepp & Liblik, 2002). All of these studies were made with children of ages
over 7 years. Dutch adaptations of Harter’s measures obtained similar findings with positive
correlations, .36 for younger children, between perceived motor competence and the
performance on a motor skills test. It is interesting to point out that the results of multiple
correlations in this study with young children was .35, therefore we can say that the
covariation between perceived and actual motor competence in younger children was about
12% (Van Rossum et al., 1999). In our study, children 4 to 6 years of age showed accuracy in
evaluating their own motor competence, Children’s Perception of Motor Competence Scale
(CMPI) results were related with their actual competence measured by a motor test and a
motor competence observational scale.
The practical significance of this study is related to the interest in self perceptions
among motor behavior scientists, psychologists and physical education teachers. The popular
notion of perceived motor competence as tied to self-esteem and healthy psychosocial
function, has empirical support. It is possible to think that low perceived motor competence in
these ages could be the origin of future motivational problems, emotional difficulties in
physical activity contexts and sports participation as in the case of Developmental
Coordination Disorders (Causgrove & Watkinson, 2002). Physical education teachers could
use the scale to assess self-perceptions of motor competence in their pupils and design
developmental tasks and activities to improve skills and self-perceptions.
Given that motor self-perceptions are an important component of self-esteem, more
research is needed in the near future, as to the potential of the Children’s Perception of Motor
Competence Scale (CMPI) as a measure instrument in younger children. As with any measure,
establishing validity is a never-ending process, and hence further research is warranted to
replicate the current results. At this time, however, these data indicate that it has promise.
16
References
Carmines, E. G., & Zeller, R. A. (1979) Reliability and Validity Assessment. Newbury Park,
CA: Sage.
Causgrove, J., & Watkinson, E. (2002) Considering motivation theory in the study of
developmental coordination disorders. In S. Cermark & D. Larkin (Eds.)
Developmental coordination disorders. Albany, NY: Delmar, Thompson Learning. Pp.
185-199.
Connolly, K. (1980) The development of motor competence. In C. Nadeau, W. Haliwell,
K.M. Newell & G. Roberts. (Eds.), Psychology of motor behavior and sport-1979.
Champaign: Human Kinetics. Pp. 229-252 .
Connolly, K. & Bruner, J. (1973) Competence: its nature and nurture. In K. Connolly & J.
Bruner (Eds.), The growth of Competence. London: Academic Press. Pp. 3-7.
Delignières, D. (1992) Risque préférentiel, risque perçu et prise de risque. In J. Famose (Dir.),
Cognition et performance. Paris: INSEP. Pp. 79-103.
Goodway, J., & Rudisill, M. (1997) Perceived physical competence and actual motor skill
competence of African American preschool children. Adapted Physical Activity, 14,
314-326.
Griffith, N., & Keogh, J. (1982) A model of movement confidence. In J. Scott Kelso, & J.
Clark (Eds.), The development of movement control and co-ordination. New York:
Wiley. Pp. 213-236.
Hagger, M., Ashford, B., & Stambulova, N. (1998) Russian and British children’s physical
self-perceptions and physical activity participation. Pediatric Exercise Science, 10,
137-152.
Hair, J., Anderson, R., Tatham, R., & Black, W. (1998) Multivariate data analysis (Fith
edition). Upper Saddle River, NJ: Prentice-Hall, Inc.
Harter, S. (1978) Effectance motivation reconsidered: toward a developmental model. Human
Development, 21,34-64.
Harter, S. (1981) The development of competence motivation in the mastery of cognitive and
physical skills: is there still a place for joy?. In G. Roberts, & D. Landers (Eds.),
Psychology of motor behavior and sport. Greenwich, CT: JAI Press. Pp. 3-29.
17
Harter, S. (1982) The Perceived Competence Scale for Children. Child Development, 53, 87-
97.
Harter, S. (1985) Manual for the self-perception profile for children. Denver: University of
Denver.
Harter, S. (1990) Causes, correlates and the functional role of global self worth: A lifespan
perspective. In R. Stemberg, & J. Kolligian, Jr. (Eds.) Competence considered. New
Haven, CT: Yale Unive. Press. Pp. 67-97.
Harter, S., & Pike, R. (1984) The Pictorial Scale of Perceived Competence and Social
Acceptance for Young Children. Child development, 55, 1969-1982.
Henderson, S., & Sudgen, D. (1992) Movement Assessment Battery for Children. London:
Psychological Corp.
Hoelter, J. (1983) The analysis of covariance structures: Goodness-of-fit indices. Sociological
Methods and Research, 11, 325-344.
Holland, P., & Thayer, D. (1988) Differential item performance and the Mantel-Haenszel
procedure. In H. Wainer, & H. I. Braun (Eds.) Test validity Hillsdale, NJ: Erlbaum.
Pp.129-145.
Jöreskog, K., & Sörbom, D. (1996) LISREL 8: user’s reference guide. Chicago, IL:
Scientific Software International.
Keogh, J., & Sudgen, D. (1985) Movement skill development. New York: Macmillan.
Martinek, T., & Zaichkowsky, L. (1977) Manual for the Martinek-Zaichkowsky Self-concept
Sacle for Children. Jacksonville, Il.: Psychologists & Educators, Inc.
McKiddie, B., & Maynard, I. (1997) Perceived competence of schoolchildren in Physical
Education. Journal of Teaching in Physical Education, 16, 324-339.
Raudsepp, L., & Liblik, R. (2002) Relationship of perceived and actual motor competence in
children. Perceptual and Motor Skills, 94, 1059-1070.
Rogers, H. & Swaminathan, H. (1993) A comparison of logistic regression and Mantel-
Haenszel procedures for detecting differential item functioning. Applied Psychological
Measurement, 17, 105-116.
Ruiz, L. (1995) Competencia Motriz. Madrid: Gymnos.
18
Ruiz, L., Graupera, J., & Gutiérrez, M. (2001) Observing and detecting pupils with low motor
competence in physical education: ECOMI scale in the gymnasium. International
Journal of Physical Education, XXXVIII, (2), 73-77.
Shapiro, D., Yun, J., & Ulrich, D.A. (2002) Measuring perceived gross motor skill
competence in children. International Journal of Sport Psychology, 33, 391-409.
Swaminathan, H., & Rogers, H. (1990) Detecting differential item functioning using logistic
regression procedures. Journal of Educational Measurement, 27, 361-370.
Sórbom, D., & Jöreskog, K. (1999) PRELIS 2: user’s reference guide. Chicago, IL: Scientific
Software International.
Ulrich, B. (1987) Perceptions of physical competence, motor competence, and participation
in organized sport: their interrelationships among young children. Research
Quarterly for Exercise and Sport, 58, (1), 57-67.
Ulrich, B., & Collier, D. (1990) Perceived physical competence in children with mental
retardation: modification of a pictorial scale. Adapted Physical Activity Quarterly, 1,
338-354.
Van der Steen, M., & Vermeer, A. (1987) Competence and movement training. Bewegen &
Hulpverlening, 4, 92-111.
Van Rossum, J., Musch, E. & Vermeer, A (1999) Perceived motor competence: Self-
referent thinking in physical education. In Y. Vanden, F. Bakker, S. Biddle, M.
Durand, & R. Seiler (Eds.) Psychology for physical educators. Champaign, IL.:
Human Kinetics. Pp. 187-210.
Villa, A., & Auzmendi, E.(1992) Medición del autoconcepto en la edad infantil (5-6 años).
Bilbao: Mensajero.
White, R. (1959) (1959) Motivation reconsidered: the concept of competence. Psychological
Review, 66, (5), 297-323.
Yun, J., & Ulrich, D. (1997) Perceived and actual physical competence in children with
mild mental retardation. Adapted Physical Activity Quarterly,14, 285-297
19
Fig. 1. Selected items of the Children’s Perception of Motor Competence Scale: left, item 7; right, item 22.
20
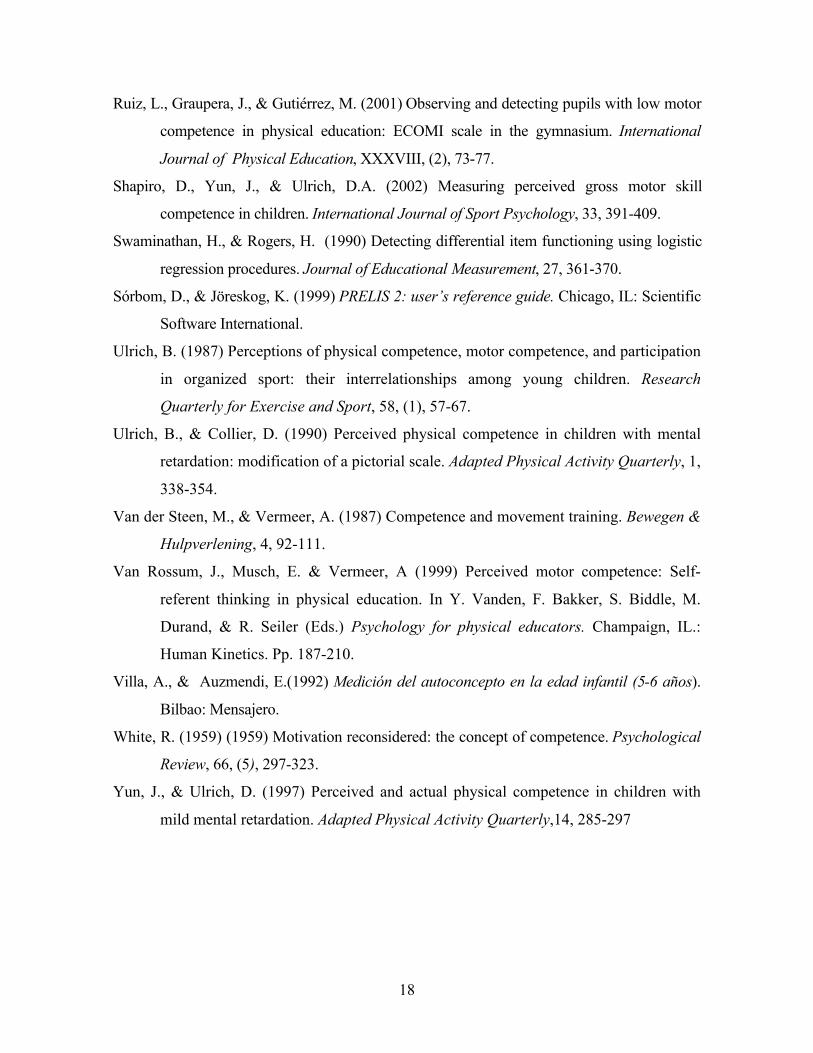
Table 1: Test Items of Age Band of the MABC Test.
DOMAIN ITEM DESCRIPTION MEASURE Manual- dexterity skills Posting coins Place coins through the slot in a bank
box as quickly as possible (preferred and non- preferred hand)
Time (s)
Threading beads Thread beads on a string as quickly as possible.
Time (s)
Bicycle trail Draw with a pen a single continuous line, following the trail without crossing its boundaries
Number of errors
Ball skills Catching a bean bag Catching a bean bag with two hands Number of catches
Rolling a ball into goal Roll a ball along the floor between two jumping stands.
Number of goals
Static/dynamic balance skills
One-leg balance Stand on one leg with the free leg bent at the knee (preferred and non preferred leg)
Time (s)
Jumping over the cord Jump over a cord with feet together Successful jump
Walking heels raised (tip-toe) Walk along a line, with heels raised, without stepping off the line.
Number of correct consecutive steps (up to 15)
21
Table 2. Items of the Children's Motor Competence Observation Scale (ECOMI).
GENERAL MOTOR COMPETENCE ITEMS 1. S/he runs about the gymnasium without bumping into classmates or objects. 2. S/he catches a ball with both hands in a controlled manner (thrown from a distance of 2 - 3 meters) 3. S/he can keep time while performing (clapping to music, playing a tambourine to music, walking in
time to music) 4. S/he maneuvers with agility round the obstacle courses. 5. S/he moves like children of her/his own age. 6. S/he is able to bounce a ball with one hand continuously while standing still. 7. S/he is able to bounce a ball continuously with one hand while moving around. 8. S/he is able to run and stop to avoid bumping into a classmate or object. 9. S/he has an overarm ball throwing pattern and performs it skillfully.
10. S/he learns the skills in the physical education program well. 11. S/he takes part in sports and ball games with her/his classmates in a competent manner. 12. S/he performs automatically the same type of movements as those performed by her/his classmates
MOTOR CONTROL ITEMS 1. S/he hops forward on the left foot in a controlled manner at least 10 times without stopping. 2. The same on the right foot at least 10 times without stopping 3. S/he hits a ball back with a racket or bat in a controlled manner. 4. S/he can balance on one foot for more than 30”. 5. S/he is able to jump continuously on the spot on one foot in a space of 50 cm x 50 cm a maximum of
50 times. 6. S/he can catch a tennis ball with two hands in a controlled manner. 7. S/he can catch a tennis ball with one hand in a controlled manner.
22
Table 3. Loadings for Unrotated Orthogonal Factors for the Children’s Perception of Motor Competence Scale.
Item descriptions Factor 1 Factor 2 Item 2. One-leg balance .58 .29 Item 3. Children running .61 .00 Item 5. Walking on boxes .74 -.30 Item 6. Throwing a ball .43 .16 Item 7. Catching a ball .72 -.11 Item 8. Playing into the water .53 .18 Item 9. Bouncing a ball .68 .21 Item 10. Jumping over a rope .57 .37 Item 11. Playing with others a game .52 -.02 Item 12. Collaborating with others in a game .63 -.33 Item 13. Rope jumping .43 .53 Item 14. Dressing the sport suit .61 .13 Item 15. Walking along a line .79 .02 Item 16. Threading beads .63 -.49 Item 17. Playing with a hockey stick .65 .28 Item 18. Posting coins .72 -.33 Item 19. Climbing a gymnasium ladder .68 .37 Item 20. Going to physical education class .70 -.40 Item 21. Playing with his/her teacher .78 -.50 Item 22. Rolling a ball into goal .59 .29 Item 23. Rolling the body (somersault) on the mat .67 .19 Eigenvalue 8.58 1.92 % Variance 40.84 9.15 % Cumulative Variance 40.84 49.99
23
Fig. 2: Confirmatory Factor Analysis: Second-order Factor Model.
24
Table 4: Confirmatory Factor Analysis: Goodness-of-fit Measures of the Alternative Models.
Factor model One-dimensional Second-order
Goodness-of-fit measure First sample
(N=200) First sample
(N=200) Second sample
(N=200) Absolute fit measures
Degrees of Freedom 189 187 187 Likelihood-ratio Chi-Square 197.09 (p=.33) 165.44 (p=.87) 173.09 (p=.76) Goodness of Fit Index (GFI) .91 .93 .92 Standardized RMR .053 .050 .051 Root Mean Square Error of Approximation (RMSEA) .015 >.001 >.001 Expected Cross-Validation Index (ECVI) 1.41 1.38 1.38
Incremental fit measures
Adjusted Goodness of Fit Index (AGFI) .89 .91 .91 Non-Normed Fit Index (NNFI) 1.00 1.00 1.02 Normed Fit Index (NFI) .74 .77 .74 Comparative Fit Index (CFI) 1.00 1.00 1.00 Incremental Fit Index (IFI) 1.00 1.00 1.02 Relative Fit Index (RFI) .71 .74 .71
Parsimonious fit measures
Parsimony Normed Fit Index (PNFI) .67 .68 .66 Parsimony Goodness of Fit Index (PGFI) .75 .75 .75
25
Table 5: Correlation Coefficients Among the CMPI Scales and the Main Scores of the Test MABC and ECOMI, and Multiple Correlation among the Children’s Perception of Motor Competence Scale and the Five Subscales of Motor Tests.
CMPI Scale Perceived Motor
Competence Perceived Gross
Motor Competence
Perceived Fine Motor
Competence
ECOMI Scale
General motor competence .20 † .31 † Motor control .10 * .17 † Total .16 † .25 † .13 †
MABC Test
Balance skills .12 † .26 † Ballistic skills .10 * .21 † .14 † Fine-motor skills .10 * Total .03 .12 * .07
Multiple correlation .35 † * p<.05; † p<.01
26
Table 6. Reliability (Alpha Coefficients) of the total CMPI Scale (PMC) and of the Two Subscales and Composite Reliability.
CMPI scale Alpha Composite reliability
Subscales Perceived Gross Motor Competence .78 .80 Perceived Fine Motor Competence .65 .63
Total scale
Perceived Motor Competence .81
27
Table 7: Perceived Motor Competence Reliability in the Total Sample and by Gender and age.
Perceived Motor Competence Group sample Alpha N Gender Girls .80 247 Boys .82 248
Age (years) 4 .81 142 5 .79 147 6 .80 206
Total sample .81 495
28
Table 8: Item Analysis of the Children’s Perception of Motor Competence Scale: Homogeneity (corrected item-scale correlation) and Differential Item Functioning (Gender Effect and Interaction of Perceived Motor Competence by Gender).
Differential Item Functioning Analysis Method Logistic Regression Mantel-Haenszel Effects Effect Gender Interaction
PMC by Gender Gender
Item
Corrected Item-scale Correlation Wald p Wald p Chi-square p
2 .40 2.80 .10 1.48 .22 7.04 * .01 3 .42 1.10 .30 .71 .40 1.03 .31 5 .51 4.70 * .03 4.27 * .04 .43 .51 6 .28 .42 .52 .18 .67 2.31 .13 7 .50 .62 .43 .93 .33 .22 .64 8 .36 .93 .33 .94 .33 .19 .66 9 .47 .00 .97 .09 .76 .57 .45
10 .42 .29 .59 .62 .43 .26 .61 11 .36 .35 .55 .00 .99 1.59 .21 12 .42 .41 .52 .28 .60 .01 .95 13 .30 .47 .49 1.22 .27 3.55 .06 14 .42 .00 .97 .28 .60 4.60 * .03 15 .56 2.91 .09 3.20 .07 .01 .93 16 .50 7.77 * .01 7.17 * .01 .78 .38 17 .48 1.90 .17 2.30 .13 .30 .59 18 .56 1.04 .31 .51 .47 3.50 .06 19 .40 .04 .83 .30 .59 1.92 .17 20 .55 .50 .48 .60 .44 .13 .71 21 .66 3.01 .08 3.28 .07 1.23 .27 22 .44 8.13 * .01 6.13 * .01 1.93 .17 23 .46 .52 .47 .38 .54 .43 .51
* Differential Item Functioning with p < .05
29
Table 9: Descriptive Statistics of the Children’s Perception of Motor Competence subscales by gender and age.
Perceived Gross Motor Competence
Perceived Fine Motor Competence
Perceived Motor Competence
Gender Age (years)
Mean Standard Deviation
Mean Standard Deviation
Mean Standard Deviation
N
Boy 4 3.46 .91 3.72 .72 17.82 3.33 78 5 3.72 .54 3.81 .66 19.20 2.61 74 6 3.55 .73 3.80 .65 18.39 3.29 95 Total 3.57 .74 3.78 .67 18.45 3.15 247
Girl 4 3.25 1.15 3.53 .87 16.38 3.86 64 5 3.59 .68 3.95 .23 18.81 2.60 73 6 3.53 .77 3.85 .49 18.79 2.55 111 Total 3.48 .87 3.79 .58 18.17 3.13 248
Total 4 3.37 1.03 3.63 .79 17.17 3.64 142 5 3.65 .62 3.88 .50 19.01 2.60 147
6 3.54 .75 3.83 .57 18.61 2.91 206 Total 3.52 .81 3.79 .63 18.31 3.14 495
30
Table 10: Unvaried ANOVAs of Children’s Perception of Motor Competence subscales by Gender and Age, and Interaction Effects.
Dependent variable Effect Sum of squares
df Squared mean
F p Eta squared
Power
Gender 1.67 1 1.67 2.58 .11 .01 .36 Age 6.46 2 3.23 4.97 .01 * .02 .81 Gender*Age .82 2 .41 .64 .53 .00 .16 Error 317.27 489 .65
Perceived Gross Motor Competence
Total 6470.00 495
Gender .00 1 .00 .00 .97 .00 .05 Age 5.19 2 2.59 6.73 .00 * .03 .92 Gender*Age 2.00 2 1.00 2.59 .08 .01 .52 Error 188.46 489 .39
Perceived Fine Motor Competence
Total 7290.00 495
Gender 27.45 1 27.45 2.98 .08 .01 .41 Age 293.69 2 146.85 15.95 .00 * .06 1.00 Gender*Age 71.29 2 35.65 3.87 .02 * .02 .70 Error 4502.59 489 9.21
Perceived Motor Competence
Total 170873.00 495 * p<.05
31
Table 11: Post-hoc Multiple Comparisons by Age.
95% CI CMPI Scale Age differences
Mean differences
Standard Error p
Lower Upper 5-4 yrs. old .29 † .09 .008 -.51 -.06 Perceived Gross Motor
Competence 6-5 yrs. old -.11 * .09 .569 -.09 .32
5-4 yrs. old .24 * .07 .003 -.42 -.07 Perceived Fine Motor Competence 6-5 yrs. old -.05 .07 1.000 -.11 .21
5-4 yrs old 1.84 † .36 .000 -2.70 -.98 Perceived Motor Competence 6-5 yrs old -.40 .33 .668 -.39 1.19 Bonferroni criterion. * p<.05; † p<.01