A Monthly Double-Blind Peer Reviewed Refereed Open Access International e-Journal -Included in the...
15
International Journals of Multidisciplinary Research Academy Editorial Board Dr. CRAIG E. REESE Professor, School of Business, St. Thomas University, Miami Gardens Dr. S. N. TAKALIKAR Principal, St. Johns Institute of Engineering, PALGHAR (M.S.) Dr. RAMPRATAP SINGH Professor, Bangalore Institute of International Management, KARNATAKA Dr. P. MALYADRI Principal, Government Degree College, Osmania University, TANDUR Dr. Y. LOKESWARA CHOUDARY Asst. Professor Cum, SRM B-School, SRM University, CHENNAI Prof. Dr. TEKI SURAYYA Professor, Adikavi Nannaya University, ANDHRA PRADESH, INDIA Dr. T. DULABABU Principal, The Oxford College of Business Management,BANGALORE Dr. A. ARUL LAWRENCE SELVAKUMAR Professor, Adhiparasakthi Engineering College, MELMARAVATHUR, TN Dr. S. D. SURYAWANSHI Lecturer, College of Engineering Pune, SHIVAJINAGAR Mr. PIYUSH TIWARI Ir. Executive, Dispatch (Supply Chain), SAB Miller India (Skal Brewaries Ltd.)
-
Upload
independent -
Category
Documents
-
view
1 -
download
0
Transcript of A Monthly Double-Blind Peer Reviewed Refereed Open Access International e-Journal -Included in the...

IJMT Volume 1, Issue 1 ISSN: 2249-1058 __________________________________________________________
A Monthly Double-Blind Peer Reviewed Refereed Open Access International e-Journal - Included in the International Serial Directories Indexed & Listed at: Ulrich's Periodicals Directory ©, U.S.A.
International Journal of Marketing and Technology http://www.ijmra.us Page 87
June 2011
International Journals of Multidisciplinary Research Academy
Editorial Board Dr. CRAIG E. REESE
Professor, School of Business, St. Thomas University, Miami Gardens
Dr. S. N. TAKALIKAR Principal, St. Johns Institute of Engineering, PALGHAR (M.S.)
Dr. RAMPRATAP SINGH Professor, Bangalore Institute of International Management, KARNATAKA
Dr. P. MALYADRI Principal, Government Degree College, Osmania University, TANDUR
Dr. Y. LOKESWARA CHOUDARY Asst. Professor Cum, SRM B-School, SRM University, CHENNAI
Prof. Dr. TEKI SURAYYA Professor, Adikavi Nannaya University, ANDHRA PRADESH, INDIA
Dr. T. DULABABU Principal, The Oxford College of Business Management,BANGALORE
Dr. A. ARUL LAWRENCE SELVAKUMAR Professor, Adhiparasakthi Engineering College, MELMARAVATHUR, TN
Dr. S. D. SURYAWANSHI Lecturer, College of Engineering Pune, SHIVAJINAGAR
Mr. PIYUSH TIWARI Ir. Executive, Dispatch (Supply Chain), SAB Miller India (Skal Brewaries Ltd.)

IJMT Volume 1, Issue 2 ISSN: 2249-1058 __________________________________________________________
A Monthly Double-Blind Peer Reviewed Refereed Open Access International e-Journal - Included in the International Serial Directories Indexed & Listed at: Ulrich's Periodicals Directory ©, U.S.A.
International Journal of Marketing and Technology http://www.ijmra.us Page 88
July 2011
Prof S. R. BADRINARAYAN Sinhgad Institute for Management & Computer Applications, PUNE
Mr. GURSEL ILIPINAR ESADE Business School, Department of Marketing, SPAIN
Mr. ZEESHAN AHMED Software Research Eng, Department of Bioinformatics, GERMANY
Mr. SANJAY ASATI
Dept of ME, M. Patel Institute of Engg. & Tech., GONDIA(M.S.)
Mr. G. Y. KUDALE
N.M.D. College of Management and Research, GONDIA(M.S.)
Editorial Advisory Board
Dr.MANJIT DAS Assitant Professor, Deptt. of Economics, M.C.College, ASSAM
Dr. ROLI PRADHAN Maulana Azad National Institute of Technology, BHOPAL
Dr. N. KAVITHA Assistant Professor, Department of Management, Mekelle University, ETHIOPIA
Prof C. M. MARAN Assistant Professor (Senior), VIT Business School, TAMIL NADU
DR. RAJIV KHOSLA Associate Professor and Head, Chandigarh Business School, MOHALI
Dr. S. K. SINGH Asst. Professor and Head of the Dept. of Humanities, R. D. Foundation Group of Institutions,
MODINAGAR
Dr. (Mrs.) MANISHA N. PALIWAL Associate Professor, Sinhgad Institute of Management, PUNE

IJMT Volume 1, Issue 2 ISSN: 2249-1058 __________________________________________________________
A Monthly Double-Blind Peer Reviewed Refereed Open Access International e-Journal - Included in the International Serial Directories Indexed & Listed at: Ulrich's Periodicals Directory ©, U.S.A.
International Journal of Marketing and Technology http://www.ijmra.us Page 89
July 2011
DR. (Mrs.) ARCHANA ARJUN GHATULE Director, SPSPM, SKN Sinhgad Business School, MAHARASHTRA
DR. NEELAM RANI DHANDA Associate Professor, Department of Commerce, kuk, HARYANA
Dr. FARAH NAAZ GAURI Associate Professor, Department of Commerce, Dr. Babasaheb Ambedkar Marathwada
University, AURANGABAD
Prof. Dr. BADAR ALAM IQBAL Associate Professor, Department of Commerce,Aligarh Muslim University, UP
Associate Editors
Dr. SANJAY J. BHAYANI Associate Professor ,Department of Business Management,RAJKOT (INDIA)
MOID UDDIN AHMAD Assistant Professor, Jaipuria Institute of Management, NOIDA
Dr. SUNEEL ARORA Assistant Professor, G D Goenka World Institute, Lancaster University, NEW DELHI
Mr. P. PRABHU Assistant Professor, Alagappa University, KARAIKUDI
Mr. MANISH KUMAR Assistant Professor, DBIT, Deptt. Of MBA, DEHRADUN
Mrs. BABITA VERMA Assistant Professor ,Bhilai Institute Of Technology, INDORE
Ms. MONIKA BHATNAGAR Assistant Professor, Technocrat Institute of Technology, BHOPAL
Ms. SUPRIYA RAHEJA Assistant Professor, CSE Department of ITM University, GURGAON

IJMT Volume 1, Issue 2 ISSN: 2249-1058 __________________________________________________________
A Monthly Double-Blind Peer Reviewed Refereed Open Access International e-Journal - Included in the International Serial Directories Indexed & Listed at: Ulrich's Periodicals Directory ©, U.S.A.
International Journal of Marketing and Technology http://www.ijmra.us Page 90
July 2011
Enhanced Productivity through
Standardized Work Cell-
A Case of Standard Work Kaizen Applied to Valve
Assembly Process w.r.t to a valve manufacturing
organization in Pune.
S.R Badrinarayan
Asst. Professor
Sinhgad Institute for Management
& Computer Applications,
Pune-411041
Shalabh Sharma
Asst. Professor
Sinhgad Institute for Management
& Computer Applications,
Pune-411041
Title
Authors

IJMT Volume 1, Issue 1 ISSN: 2249-1058 __________________________________________________________
A Monthly Double-Blind Peer Reviewed Refereed Open Access International e-Journal - Included in the International Serial Directories Indexed & Listed at: Ulrich's Periodicals Directory ©, U.S.A.
International Journal of Marketing and Technology http://www.ijmra.us Page 91
June 2011
Abstract:
This paper would provide us with an overview of concepts like „Standardized work kaizen‟,
„Overall Equipment Effectiveness‟ and „Structured On-The Job Training‟ and its implications on
manufacturing processes. This paper would also give an account of successful standardized work
concept as applied to a valve assembly process and its effect on the Business Unit as a whole on
various parameters. All the necessary steps, formulas and concepts are detailed out and explained
in their respective topics.
Also, hypothesis test has been carried out to determine whether there was a significant difference
in measurable parameters after replacing the traditional assembly cell / process with standard
work cell.
Conceptual Framework:
In today‟s agile manufacturing facilities, worker accuracy, consistency and flexibility is more
important than ever. Organisations have realized that it is necessary to structure & standardize
any tangible process within their purview to ensure that they are able to utilize the resources
effectively & efficiently. This means optimum utilization of resources. Effective utilization of
resources would mean the extent to which an individual / organization is able to meets its goal /
objective. Efficiency would mean how well are we able to utilize our limited resources i.e.
minimum use of resources to achieve maximum output. „Productivity‟ as a whole depends on
both effectiveness & efficiency.
Productivity= (Effectiveness) X (Efficiency)
For example: Let us take an example of a process „X‟.
Process: „X‟
Monthly Target: 500 units of product „Y‟
Maximum Resources Required: 1000 units of part „Z‟.
Minimum Resources Required: 500 units of part „Z‟
Resources Available: 750 units of part „Z‟
IJMT Volume 1, Issue 2 ISSN: 2249-1058 __________________________________________________________
A Monthly Double-Blind Peer Reviewed Refereed Open Access International e-Journal - Included in the International Serial Directories Indexed & Listed at: Ulrich's Periodicals Directory ©, U.S.A.
International Journal of Marketing and Technology http://www.ijmra.us Page 92
July 2011
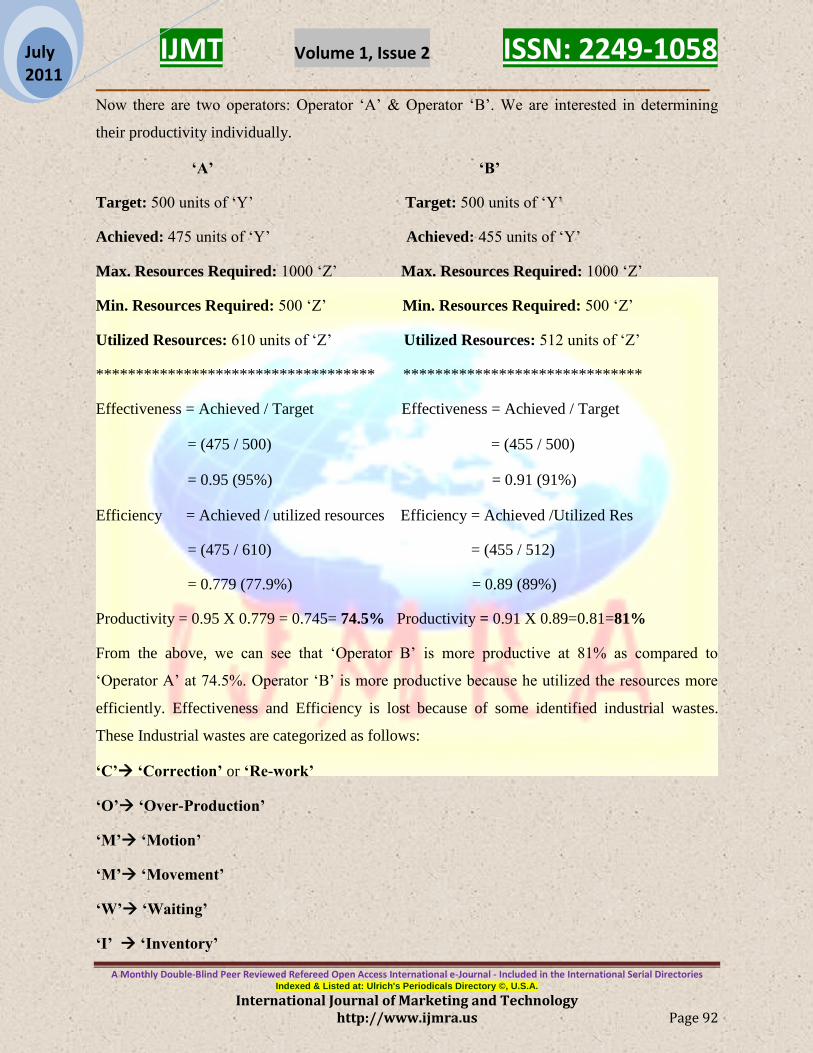
Now there are two operators: Operator „A‟ & Operator „B‟. We are interested in determining
their productivity individually.
‘A’ ‘B’
Target: 500 units of „Y‟ Target: 500 units of „Y‟
Achieved: 475 units of „Y‟ Achieved: 455 units of „Y‟
Max. Resources Required: 1000 „Z‟ Max. Resources Required: 1000 „Z‟
Min. Resources Required: 500 „Z‟ Min. Resources Required: 500 „Z‟
Utilized Resources: 610 units of „Z‟ Utilized Resources: 512 units of „Z‟
*********************************** ******************************
Effectiveness = Achieved / Target Effectiveness = Achieved / Target
= (475 / 500) = (455 / 500)
= 0.95 (95%) = 0.91 (91%)
Efficiency = Achieved / utilized resources Efficiency = Achieved /Utilized Res
= (475 / 610) = (455 / 512)
= 0.779 (77.9%) = 0.89 (89%)
Productivity = 0.95 X 0.779 = 0.745= 74.5% Productivity = 0.91 X 0.89=0.81=81%
From the above, we can see that „Operator B‟ is more productive at 81% as compared to
„Operator A‟ at 74.5%. Operator „B‟ is more productive because he utilized the resources more
efficiently. Effectiveness and Efficiency is lost because of some identified industrial wastes.
These Industrial wastes are categorized as follows:
‘C’ ‘Correction’ or ‘Re-work’
‘O’ ‘Over-Production’
‘M’ ‘Motion’
‘M’ ‘Movement’
‘W’ ‘Waiting’
‘I’ ‘Inventory’
IJMT Volume 1, Issue 2 ISSN: 2249-1058 __________________________________________________________
A Monthly Double-Blind Peer Reviewed Refereed Open Access International e-Journal - Included in the International Serial Directories Indexed & Listed at: Ulrich's Periodicals Directory ©, U.S.A.
International Journal of Marketing and Technology http://www.ijmra.us Page 93
July 2011
‘P’ ‘Over-Processing’
Hence, If we are able to identify and eliminate these wastes in every tangible process, then there
would be considerable improvement in productivity which in turn would help the business unit
as a whole. Hence irrespective of any area / field / department, there is always a scope to identify
opportunities for waste reduction & productivity improvement.
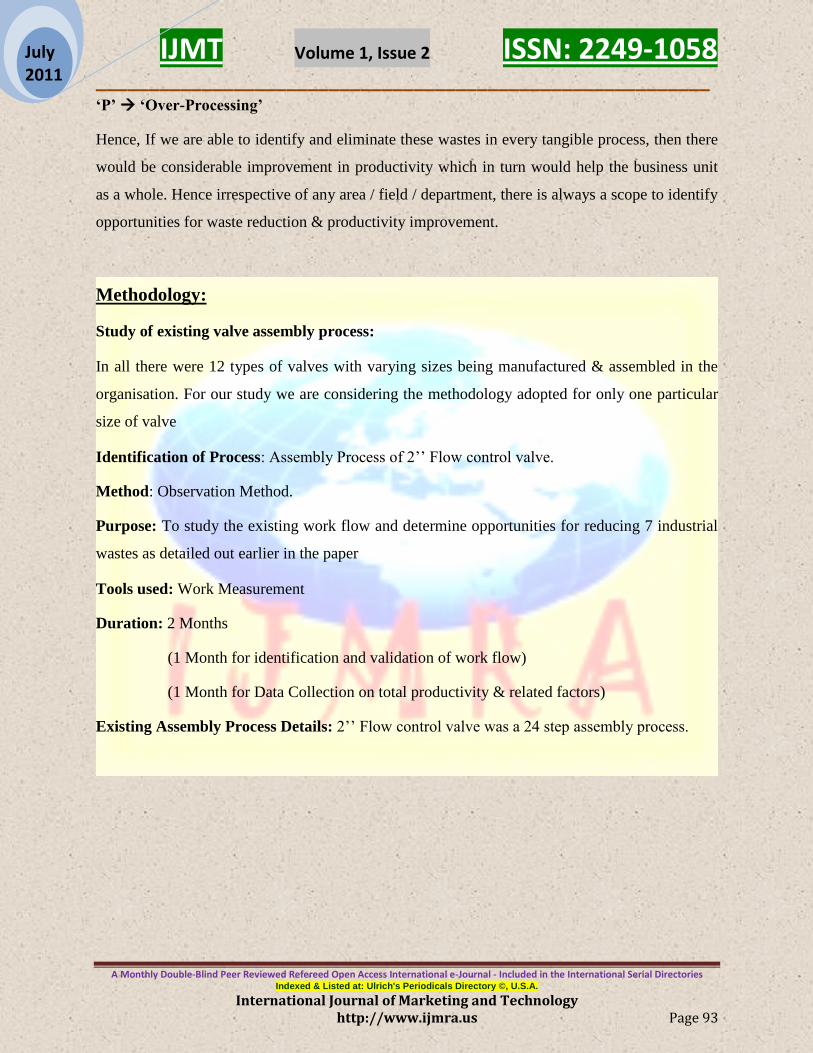
Methodology:
Study of existing valve assembly process:
In all there were 12 types of valves with varying sizes being manufactured & assembled in the
organisation. For our study we are considering the methodology adopted for only one particular
size of valve
Identification of Process: Assembly Process of 2‟‟ Flow control valve.
Method: Observation Method.
Purpose: To study the existing work flow and determine opportunities for reducing 7 industrial
wastes as detailed out earlier in the paper
Tools used: Work Measurement
Duration: 2 Months
(1 Month for identification and validation of work flow)
(1 Month for Data Collection on total productivity & related factors)
Existing Assembly Process Details: 2‟‟ Flow control valve was a 24 step assembly process.

IJMT Volume 1, Issue 2 ISSN: 2249-1058 __________________________________________________________
A Monthly Double-Blind Peer Reviewed Refereed Open Access International e-Journal - Included in the International Serial Directories Indexed & Listed at: Ulrich's Periodicals Directory ©, U.S.A.
International Journal of Marketing and Technology http://www.ijmra.us Page 94
July 2011
Operator 1 Operator 2 Operator 3
BEFORE WORK FLOW- Assembly of 2” Flow control Valve
Key Findings:
24 step Assembly process was divided by 3 operators
All the 3 operators had to setup the raw-material individually before starting the
assembly process.
1 Casual operator was required for rework and setup
All the scrap was collected at extreme corner of the assembly table.
The distance between raw material storage area and assembly table was significant
All the data related to assembly was recorded in an Assembly Register. This was
filled at the end of the shift.
Not verified or validated by supervisor
No exact details of the exact causes of bottleneck in the assembly process or rework
of valves recorded.
The Total Area of Assembly Line was 2.25 Sq.mtrs
Total No of Valves assembled by 1 person in 1st shift was 25.
Total Time Available in 1st Shift= 420 minutes
Total time taken by 1 Operator for Assembly of 1 valve = 16.8 minutes
ASA
ASSEMBLY TABLE
14 step of
Assembly
6 steps of
Assembly
4 steps of
Assembly
Raw Material Assembled Product
Testing
Setup Setup Scrap Setup

IJMT Volume 1, Issue 2 ISSN: 2249-1058 __________________________________________________________
A Monthly Double-Blind Peer Reviewed Refereed Open Access International e-Journal - Included in the International Serial Directories Indexed & Listed at: Ulrich's Periodicals Directory ©, U.S.A.
International Journal of Marketing and Technology http://www.ijmra.us Page 95
July 2011
Brainstorming session to identify opportunities for productivity improvement by
focussing on the following areas:
1. Idea to introduce 5‟S‟ Kaizen to ensure operator has all the necessary resources in the
required numbers and kind within his reach
2. Focus on Cellular Manufacturing.
3. Principle of 1 Operator 1 Cell
4. Streamline the flow of raw-material.
5. Identify value adding & non-value adding activities in the existing assembly process and
try to eliminate the same.
6. Identify the existing capacity of assembly line against the actual demand
7. Design and commission a Cellular Manufacturing Assembly table with the concept of 1
operator 1 cell
8. Test run the same for 1 month
9. Introduce Cell 1 (Cellular Mfg) after successful completion of tests.
10. Record the data and do comparative analysis of before & after standard work cell.
Valve
Assembly
Table
Cell 1
Raw Material setup 5‘s’
Raw Material from stores
INPUT
Adaptor & Body
for Assembly
Output
Assembled
Valves
SCRAP
INPUT
Assembled
Valves for
TESTING
TEST RIG
Cell No: 1
Output
TESTED
Valves
TPI

IJMT Volume 1, Issue 2 ISSN: 2249-1058 __________________________________________________________
A Monthly Double-Blind Peer Reviewed Refereed Open Access International e-Journal - Included in the International Serial Directories Indexed & Listed at: Ulrich's Periodicals Directory ©, U.S.A.
International Journal of Marketing and Technology http://www.ijmra.us Page 96
July 2011
AFTER Standard Work Kaizen- Streamlined Work Flow of Valve Assembly Process.
Key Results:
1. Area of Assembly Line: 1.28 Sq.mtrs
2. No: of person per Cell / Assembly: 1 operator
3. No causal required for individual material setup
4. 1st half an hour of the shift devoted for raw material setup on the assembly table. To be
done by the operator himself under the guidance of supervisor
5. Targets, standard procedure for assembly of valves and hourly activity sheet displayed on
the Assembly table itself.
6. Hourly data of assembly / rework / causes of stoppage and rework recorded by the
operators
7. Documentation & validation of the same by the supervisors
8. Daily meetings to discuss the causes behind the bottleneck in assembly with the
respective department heads / authorities.
9. Total No: of valves assembled by 1 operator in 1 shift was 42 Nos
10. Capacity of Cell 1 in shift 1 set to 42 nos
11. Process Time for Valve assembly reduced to 10 minutes.
Hypothesis Testing:
Data was recorded on some critical parameters for 15 days before implementing standardized
work kaizen, and subsequently data was collected for 15 days after implementing standardized
work kaizen to observe any significant changes in productivity.
The basic idea behind carrying out paired hypothesis test was to prove the effectiveness of
standardized work cell for valve assembly process.

IJMT Volume 1, Issue 2 ISSN: 2249-1058 __________________________________________________________
A Monthly Double-Blind Peer Reviewed Refereed Open Access International e-Journal - Included in the International Serial Directories Indexed & Listed at: Ulrich's Periodicals Directory ©, U.S.A.
International Journal of Marketing and Technology http://www.ijmra.us Page 97
July 2011
CAPACITY & UTILIZATION:
Hypothesis: Standard work cell improves capacity & Utilization of assembly line.
Ho: There is no significant improvement in capacity & utilization of assembly line after
commissioning of standard work cell.
H1: There is significant improvement in capacity & utilization of Assembly line after
commissioning of standard work cell.
t-Test: Two-Sample Assuming Equal
Variances
Before After
Mean 22.26666 38.8
Variance 7.06666 13.45714
Observations 15 15
Pooled Variance 10.26190
Hypothesized Mean Difference 0
Df 28
t Stat
-
4.13438
P(T<=t) one-tail
0.024602
t Critical one-tail
1.701132
As P-Value is 2.4 %, there is significant improvement in capacity & utilization of assembly
line after commissioning of standard work cell as against significance of 5 %.
We reject Null Hypothesis and accept alternate hypothesis at 5% level of significance.

IJMT Volume 1, Issue 2 ISSN: 2249-1058 __________________________________________________________
A Monthly Double-Blind Peer Reviewed Refereed Open Access International e-Journal - Included in the International Serial Directories Indexed & Listed at: Ulrich's Periodicals Directory ©, U.S.A.
International Journal of Marketing and Technology http://www.ijmra.us Page 98
July 2011
TOTAL PRODUCTIVITY:
Hypothesis: Standard work cell improves productivity
Ho: There is no significant improvement in productivity after commissioning standard work cell
H1: There is significant improvement in productivity after commissioning standard work cell
t-Test: Two-Sample Assuming Equal
Variances
Before After
Mean 17 36.4
Variance 3.428571429 19.25714
Observations 15 15
Pooled Variance 11.34285714
Hypothesized Mean Difference 0
Df 28
t Stat -5.77506402
P(T<=t) one-tail 0.019298
t Critical one-tail 1.701130908
For all the above cases, 1 tail is applicable. There is significant improvement in total productivity
as P value is 1.9% against 5% level of significance. Hence we reject Null hypothesis and accept
alternate hypothesis at 5% level of significance.

IJMT Volume 1, Issue 2 ISSN: 2249-1058 __________________________________________________________
A Monthly Double-Blind Peer Reviewed Refereed Open Access International e-Journal - Included in the International Serial Directories Indexed & Listed at: Ulrich's Periodicals Directory ©, U.S.A.
International Journal of Marketing and Technology http://www.ijmra.us Page 99
July 2011
REWORK:
Hypothesis: Standard work reduces the no of rework in an valve assembly process.
Ho: There is no significant reduction in the no. of rework after commissioning of standard work
cell.
H1: There is significant reduction in the no. of rework after commissioning of standard work
cell.
t-Test: Two-Sample Assuming Equal Variances
Before After
Mean 5.266666667 2.4
Variance 4.20952381 1.828571429
Observations 15 15
Pooled Variance 3.019047619
Hypothesized Mean
Difference 0
Df 28
t Stat 4.518276939
P(T<=t) one-tail 0.013016894
t Critical one-tail 1.701130908
P(T<=t) two-tail 0.026033789
t Critical two-tail 2.048407115
There is significant reduction in total no. of rework as P value is 2.6% against 5% level of
significance. Hence we reject Null hypothesis and accept alternate hypothesis at 5% level of
significance.
IJMT Volume 1, Issue 2 ISSN: 2249-1058 __________________________________________________________
A Monthly Double-Blind Peer Reviewed Refereed Open Access International e-Journal - Included in the International Serial Directories Indexed & Listed at: Ulrich's Periodicals Directory ©, U.S.A.
International Journal of Marketing and Technology http://www.ijmra.us Page 100
July 2011
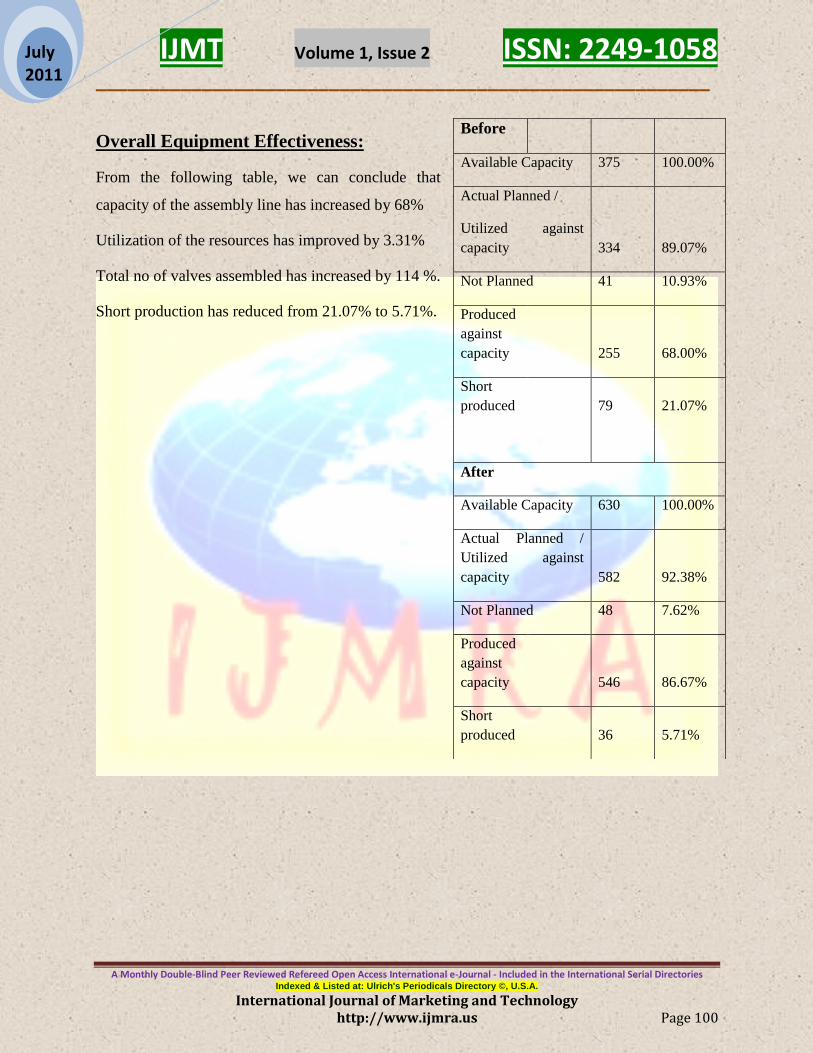
Overall Equipment Effectiveness:
From the following table, we can conclude that
capacity of the assembly line has increased by 68%
Utilization of the resources has improved by 3.31%
Total no of valves assembled has increased by 114 %.
Short production has reduced from 21.07% to 5.71%.
Before
Available Capacity 375 100.00%
Actual Planned /
Utilized against
capacity 334 89.07%
Not Planned 41 10.93%
Produced
against
capacity 255 68.00%
Short
produced 79 21.07%
After
Available Capacity 630 100.00%
Actual Planned /
Utilized against
capacity 582 92.38%
Not Planned 48 7.62%
Produced
against
capacity 546 86.67%
Short
produced 36 5.71%

IJMT Volume 1, Issue 2 ISSN: 2249-1058 __________________________________________________________
A Monthly Double-Blind Peer Reviewed Refereed Open Access International e-Journal - Included in the International Serial Directories Indexed & Listed at: Ulrich's Periodicals Directory ©, U.S.A.
International Journal of Marketing and Technology http://www.ijmra.us Page 101
July 2011
Summary Chart:
Area Improvement Before After
Space 44% 2.25 sq.mtrs 1.28 sq.mtrs
Manpower 67% 3 persons per cell 1 person per cell
Productivity 60% 25 Nos per person per shift 42 Nos
From the following table, we can infer that there is 44% space reduction in the valve assembly
coupled with 67% reduction in manpower and an overall of 60% improvement in total
productivity.
Concluding Remarks:
The activity of standardizing work may, at times, be painful to start, but the benefits in learning
by all will certainly outweigh the costs and become welcome place and expected by everyone.
The key is to understand the important variables for which you wish to measure. As you stabilize
and improve your process, you will understand the barriers that had traditionally kept you from
meeting your expectations. Remember, as Taiichi Ohno pointed out, “Where there is no
standard, there can be no kaizen.”
References:
If you want to be successful with standard work, read on, By Jim Huntzinger.
OEE Pocket Guide.
„Standardized Work‟, Document your process and make problems visible, Tim Whitmore.
Six Sigma Tool Masters- Dr R.S Chalapathi.