a cross-sectional study on the health status of rubber tappers ...
80
A CROSS‐SECTIONAL STUDY ON THE HEALTH STATUS OF RUBBER TAPPERS OF SULLIA IN SOUTH INDIA by Dr. SURULIRAMAN SURULIYANDIGOWDER MAKUDAPATHY Dissertation submitted to the Rajiv Gandhi University of Health Sciences, Bangalore, Karnataka in partial fulfillment of the requirements for the degree of M. D. (COMMUNITY MEDICINE) Under the guidance of Dr. A G KULKARNI, MD Department of Community Medicine Kurunji Venkataramana Gowda Medical College, Sullia 2010 Rajiv Gandhi University of Health Sciences i
-
Upload
khangminh22 -
Category
Documents
-
view
1 -
download
0
Transcript of a cross-sectional study on the health status of rubber tappers ...
A CROSS‐SECTIONAL STUDY ON THE HEALTH STATUS
OF RUBBER TAPPERS OF SULLIA IN SOUTH INDIA
by
Dr. SURULIRAMAN SURULIYANDIGOWDER MAKUDAPATHY
Dissertation submitted to the Rajiv Gandhi University of Health Sciences, Bangalore, Karnataka
in partial fulfillment of the requirements for the degree of
M. D. (COMMUNITY MEDICINE)
Under the guidance of
Dr. A G KULKARNI, MD
Department of Community Medicine Kurunji Venkataramana Gowda Medical College, Sullia
2010
Rajiv Gandhi University of Health Sciences
i
DECLARATION BY THE CANDIDATE
I hereby declare that this dissertation entitled “A CROSS‐SECTIONAL
STUDY ON THE HEALTH STATUS OF RUBBER TAPPERS OF SULLIA IN
SOUTH INDIA” is a bonafide and genuine research work carried out by
me under the guidance of Dr. A G KULKARNI, MD., Professor and Head,
Department of Community Medicine, K V G Medical College, Sullia.
Date: Signature of the Candidate
Place: Sullia Dr. SURULIRAMAN S M
ii
CERTIFICATE BY THE GUIDE
This is to certify that the dissertation entitled “A CROSS‐SECTIONAL STUDY ON THE
HEALTH STATUS OF RUBBER TAPPERS OF SULLIA IN SOUTH INDIA” is a bonafide
research work done by Dr. SURULIRAMAN S M, in partial fulfillment of the
requirement for the degree of M. D. in Community Medicine.
Date: Signature of the Guide
Place: Sullia Dr. A G KULKARNI, MD
Professor and Head of Department
Department of Community Medicine
K V G Medical College
Sullia.
iii
ENDORSEMENT BY THE HOD, PRINCIPAL/ HEAD OF THE INSTITUTION
This is to certify that the dissertation entitled “A CROSS‐SECTIONAL
STUDY ON THE HEALTH STATUS OF RUBBER TAPPERS OF SULLIA IN
SOUTH INDIA” is a bonafide research work done by Dr. SURULIRAMAN S
M, under guidance of Dr. A G KULKARNI, MD., Professor, Department of
Community Medicine, Kurunji Venkataramana Gowda Medical College,
Sullia.
Seal and signature of the HOD Seal and signature of the Dean & Principal
Dr. A G KULKARNI, MD Dr. SHEELA G NAYAK, MS
Professor and Head, K V G Medical College, Sullia
Department of Community Medicine
Date: Date: Place: Sullia Place: Sullia
iv
COPYRIGHT
DECLARATION BY THE CANDIDATE
I hereby declare that the Rajiv Gandhi University of Health Sciences,
Karnataka shall have the rights to preserve, use and disseminate this
dissertation/ thesis in print or electronic format for academic/ research
purpose.
Date: Signature of the Candidate
Place: Sullia Dr. SURULIRAMAN S M
© Rajiv Gandhi University of Health Sciences, Karnataka
v
ACKNOWLEDGEMENT
First and foremost, I would like to express my deep sense of gratitude and
appreciation towards Dr. A G Kulkarni, Professor and Head of Department of
Community Medicine for his invaluable guidance, constant encouragement, expert
suggestions, constructive criticism and supervision which was most crucial in
completing this thesis work.
I am extremely grateful to, Dr. Anand D Meundi, Professor, Department of
Community Medicine for his keen interest, guidance, supervision, and valuable
advice for thesis improvement.
I am extremely grateful to Dr. Arvind Athavale, Professor in community medicine for
his valuable guidance and help.
My heartfelt thanks to Dr.Rahul C Bedre, Assistant Professor in Community Medicine
for his unrelenting support, help and advice.
I am indebted to Dr. Sai Geetha, MS and Dr. Rangayya, Medical Officers, KFDC
Garden Hospital for their continuous support and kind help throughout the study
period.
My special thanks to all the other Senior Officers and staff of KFDC for permitting
and helping me in every possible way during the entire study period.
vi
I would also like to thank our statistician Mrs.Rekha for helping me analyze the data.
My thanks are due to the staff of the Department of Community Medicine.
I am grateful to all my friends and colleagues for their untiring support. I thank all
others who have assisted me in some form or the other in the preparation of this
work.
Last but not least I would like to thank all my subjects without whose cooperation
this dissertation would never have seen the light of the day.
Date: Signature of the Candidate
Place: Sullia Dr. Suruliraman S M
December 2010
vii
LIST OF ABBREVIATIONS
CRC Cenex Rubber Colony
DK Dakshina Kannada
KFDC Karnataka Forest Development Corporation
DRC Dry Rubber Content
NFHS National Family Health Survey
LPG Liquefied petroleum gas
ILO International Labor Organization
NRC National Research Centre
IOM Institute of Medicine
NRCIM National Research Centre and Institute of Medicine
WHO World Health Organization
MSD Musculoskeletal Disorders
NIOSH National Institute for Occupational Safety and Health
BLS Bureau of Labor Statistics
RSI Repetitive strain injury
ARI Acute Respiratory Infections
WHOQOL World Health Organization Quality of Life
WHOQOL-BREF World Health Organization Quality of Life-Best reference
viii
ABSTRACT
Background and Objectives
Agricultural workers have a multitude of health problems, a fact often forgotten
because of the widespread misconception that occupational health is mainly
concerned with industry and industrialized countries. There is no study available on
the health profile of rubber tappers in India to our knowledge. Hence the present study
was undertaken with the objectives to describe socio-demographic profile, living and
working environment of rubber tappers and also to assess their health profile and
quality of life.
Material and methods
The study area included four randomly selected colonies which had a total of 135
households. All 171 permanent employees of KFDC working as rubber tappers
residing in these four colonies constituted the study population. House-to-house visits
and visits to the place of work were made and required information was obtained by
interview using a semi-structured pre-tested questionnaire and conducting a thorough
clinical examination. The QOL was assessed using QOL-BREF questionnaire.
Results
Among the 171 tappers 70.2% were females and 29.8% were males. Body mass index
in 43.86% of the subjects was not ideal where 26.9% were underweight and 16.96%
were overweight. 45.1% of males consumed alcohol. There was no access to
sanitation facilities at the workplace among 87.1% of the population. Musculoskeletal
disorders were the most commonly observed health problem among 30.4% of the
rubber tappers. Accidents at work were reported by 22.8% of the subjects and there
were no use Personal Protective Equipments by any rubber tapper. The mean QOL
score was highest for social relationships domain. Males had higher mean QOL scores
ix
for physical and environment domains and QOL scores decreased as age advanced
which was found to be statistically significant only for the social relationships
domain.
Conclusion
Musculoskeletal disorders were more common among those with > 2 visits made to
shed with manual load and among those with a work experience of > 20 years in the
rubber tapping occupation.
Key words
Rubber, tappers, musculoskeletal, rural, occupational health, quality of life.
x
CONTENTS
SERIAL NUMBER PARTICULARS PAGE
NUMBER
1 INTRODUCTION 1
2 OBJECTIVES 11
3 REVIEW OF LITERATURE 12
4 MATERIALS & METHODS 21
5 RESULTS 25
6 DISCUSSION 40
7 CONCLUSION 46
8 SUMMARY 47
9 RECOMMENDATIONS 49
10 BIBLIOGRAPHY 50
11 ANNEXURES 55
xi
LIST OF TABLES
Table number Title Page
number
1 Demographic characteristic of Rubber tappers. 27
2 Socio economic characteristic of Rubber tappers based on modified BG Prasad’s classification (2009) 28
3 Distribution of households based on family size and dependant individuals. 28
4 Distribution of substance abuse among the study population 28
5 Housing conditions 30
6 Housing characteristics. 30
7 Work posture and distance of workspace from eyes 31
8 Other characteristics pertaining to occupation of rubber tappers 31
9 Work Experience among rubber tappers 32
10 Self-reported health status of rubber tappers 32
11 Comparison of Body Mass Index between male and female rubber tappers 33
12 General examination findings among rubber tappers 33
13 Health problems assessed from history and clinical examination of rubber tappers 34
14 Age wise distribution of musculoskeletal disorders 34
15 Sex wise distribution of musculoskeletal disorders 35
16 Difference between distances of work area from eyes and its relation to myopia. 35
17 Obstetric history among women rubber tappers 36
18 Logistic regression predicting the likelihood of rubber tappers reporting musculoskeletal disorders. 37
19 Mean Quality of Life scores of the rubber tappers 39
20 Comparison of Mean Quality of Life scores among the genders. 39
21 Comparison of Mean Quality of Life scores among different age groups. 40
xii
LIST OF FIGURES
Figure number Title Page
number
1 Leaning posture 4
2 Standing posture 4
3 Rubber tapping knife 5
4 Latex extraction 8
5 Tapping technique 9
6 Location of a Cenex rubber colony 20
xiii
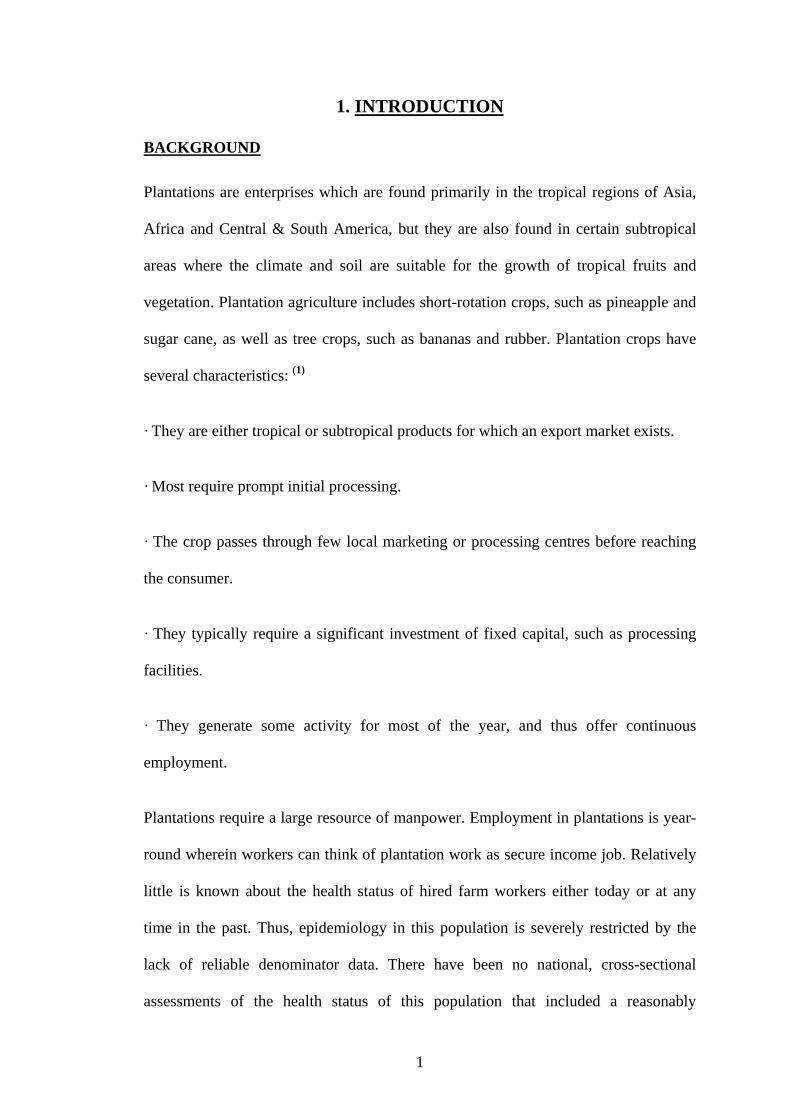
1. INTRODUCTION
BACKGROUND
Plantations are enterprises which are found primarily in the tropical regions of Asia,
Africa and Central & South America, but they are also found in certain subtropical
areas where the climate and soil are suitable for the growth of tropical fruits and
vegetation. Plantation agriculture includes short-rotation crops, such as pineapple and
sugar cane, as well as tree crops, such as bananas and rubber. Plantation crops have
several characteristics: (1)
· They are either tropical or subtropical products for which an export market exists.
· Most require prompt initial processing.
· The crop passes through few local marketing or processing centres before reaching
the consumer.
· They typically require a significant investment of fixed capital, such as processing
facilities.
· They generate some activity for most of the year, and thus offer continuous
employment.
Plantations require a large resource of manpower. Employment in plantations is year-
round wherein workers can think of plantation work as secure income job. Relatively
little is known about the health status of hired farm workers either today or at any
time in the past. Thus, epidemiology in this population is severely restricted by the
lack of reliable denominator data. There have been no national, cross-sectional
assessments of the health status of this population that included a reasonably
1
comprehensive physical examination but few studies have been done on some aspects
of agricultural workers. (2) Many of the aspects of agricultural work are applicable to
rubber tapping.
There have been many studies on industrial sector workers. However, studies on
health of other industrial sectors may not reflect the status of farm workers because of
differences in age, ethnicity, economic status, work conditions, family structure, and
health-related behaviors. (2)
Until recently the concept of occupational diseases denoted a specific clinical and
pathological syndrome caused by a hazard specific to a particular type of work or the
work environment. Today this concept has changed. We know that occurrence of
occupational diseases may be affected by non-occupational factors such as nutritional
state and on the other hand the prevalence and incidence of several common diseases
may also be influenced by occupation. (3) The contribution of poor housing conditions
to adverse health outcomes among farm workers is unknown, but is likely to be
significant. (2) Occupational health in the agricultural sector is a new concept. From
the standpoint of capital investment and number of persons employed, agriculture
may be termed as a ‘big industry’. Agricultural workers have a multitude of health
problems – a fact which is often forgotten because of the widespread misconception
that occupational health is mainly concerned with industry and industrialized
countries (4).
With modern technology, many hazardous exposures at work have been reduced .The
workload and the intensity of activity is the ergonomic factor that largely determines
the effects on health. Harmful effects at work may not necessarily occur
simultaneously but may be consecutive or intermittent. Evaluation of the adverse
health effects of long term exposure to low level of harmful factors at work is
2
currently the most pressing problem in occupational health. (4) The adverse effects
defined by a WHO study group, as harmful effects are:
- those that indicate early changes of clinical diseases.
- those that are not readily reversible and indicate a decrement in the body’s ability to
maintain homeostasis.
- those that enhance the susceptibility of the individual to the deleterious effects of
their environmental influences.
- those that cause relevant measurement to be outside the ‘normal’ range if they are
considered as an early indication of decreased functional capacity.
- those that indicate important metabolic and biochemical changes.
The health hazards prevalent in agricultural occupation have failed to draw the
attention of the experts. The health hazards involved in it are totally of different
pattern in comparison to the hazards involved in other industries where heavy loads
are moved or dangerous chemicals are handled.
The health hazards produced in such agricultural occupation are therefore of different
nature since they appear to be originating from various interacting factors working
over a large span of time. Such hazards are likely to go unnoticed. This in itself
underlines the need to approach such occupation with conscious efforts to see that
these hazards are brought into focus. The chief hazards to field workers are exposure
to the elements, animal and insect bites and hazards related to the sharp tools. Injuries
that result should be treated promptly to reduce the risk of infection. Preventive and
therapeutic measures can reduce the hazards related to climate and pests. The
incidences of malaria and gastro-enteric diseases have been reduced on modern
plantations through prophylaxis, mosquito control and sanitary measures. (5)
3
Electricity is used on plantations for processing crops and lighting buildings.
Improper use of electric installations or equipment can expose workers to severe
shocks, burns or electrocutions. The danger is more acute in damp places or when
working with wet hands or clothing. Electricity as well as open flames or smoldering
cigarettes can provide the ignition source for fuel or organic dust. Kerosene, gasoline
or diesel fuel can cause fires or explosions if mishandled or improperly stored. Greasy
and combustible waste poses a risk of fire.
The use of toxic agrochemicals is a major concern, particularly during the intensive
use of pesticides, including herbicides, fungicides and insecticides. Exposures can
take place during agricultural production, packaging, storage, transport, retailing,
application (often by hand or aerial spraying), recycling or disposal. Risk of exposure
to pesticides can be aggravated by illiteracy, poor or faulty labeling, leaking
containers, poor or no protective gear, dangerous reformulations, ignorance of the
hazard, disregard of rules and a lack of supervision or technical training.
Poisonous snakes may be present on the ground or some species may fall from trees
onto workers. Infectious diseases can be transmitted to plantation workers by insects,
pests or by drinking water or food. Unsanitary water leads to dysentery, a common
problem among plantation workers. Confined spaces can pose problems of toxic gases
or oxygen deficiency.
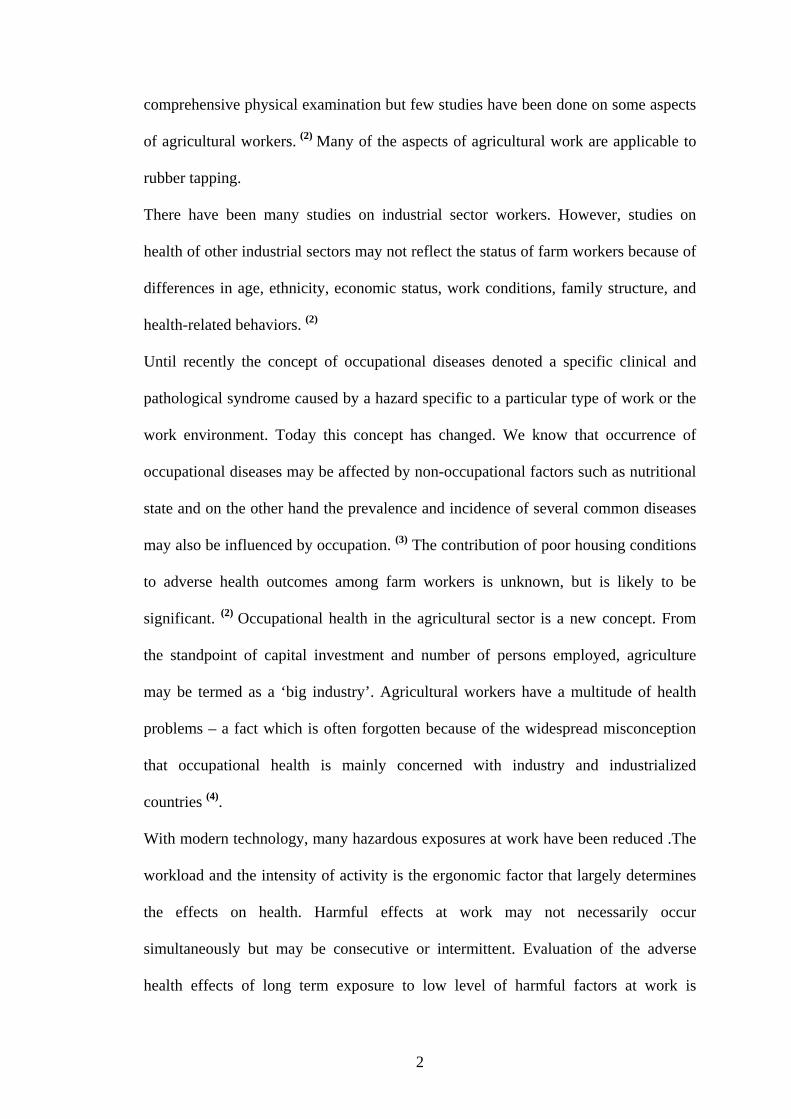
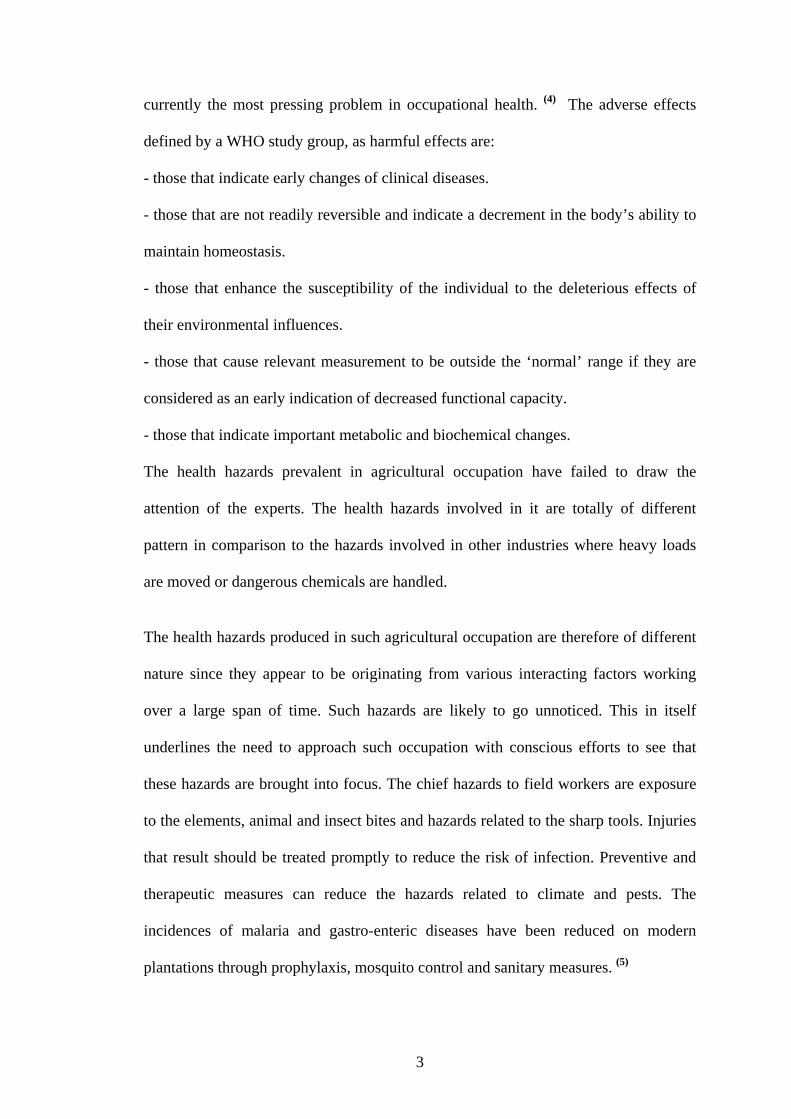
Rubber tappers like agricultural workers are exposed to the elements as they have to
mostly work outdoors. The climate in Sullia taluk is highly humid. The rubber tappers
assume a leaning forward (Fig. 1) or standing upright (Fig. 2) posture while tapping
and most of the times they are subject to near work to make precise incisions on the
tree barks. Working in a bent or stooping position and lifting heavy loads imposes
4
strain on the back. Working with arms above the shoulder can cause upper-extremity
musculoskeletal disorders.
Figure 1. Leaning forward posture. Figure 2. Standing posture.
Average duration of work for a day lasts from anywhere between six to eight hours a
day. The long hours and demanding work make fatigue a major concern. Fatigued
workers may be unable to make safe judgments; this may lead to incidents that can
result in injuries or other inadvertent exposures. Physical stress is increased by heat
and relative humidity.
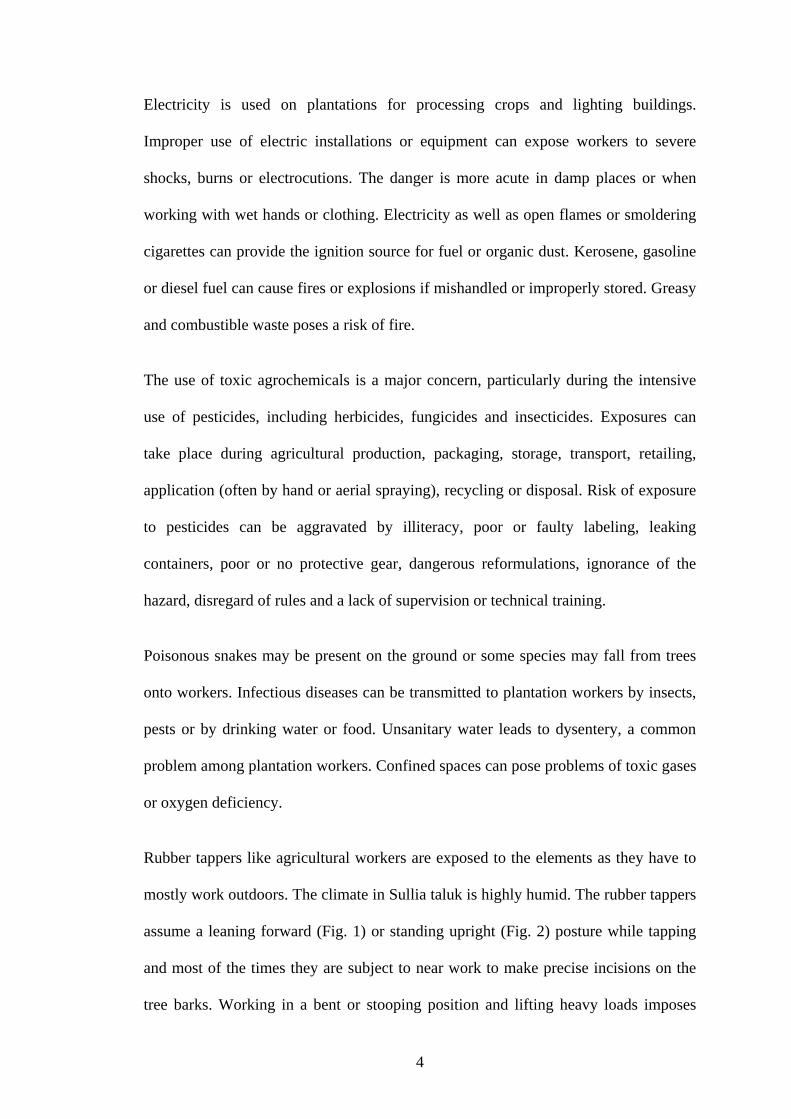
Figure 3. Rubber tapping knife
5
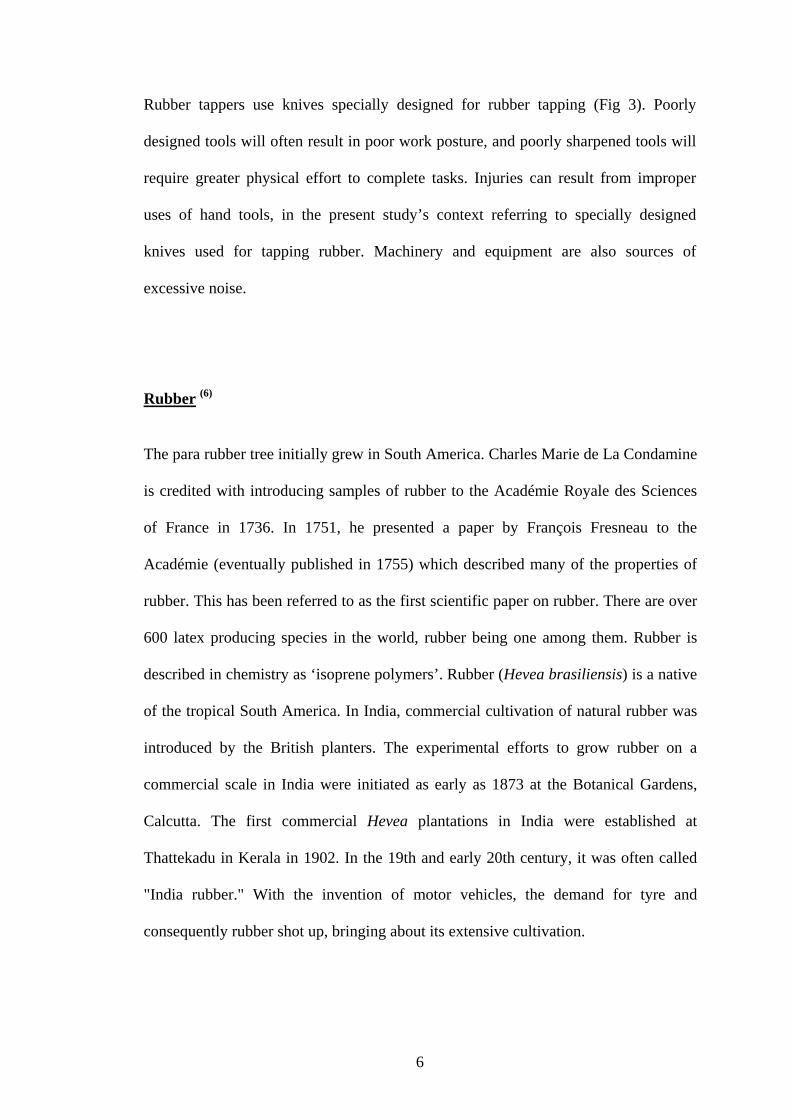
Rubber tappers use knives specially designed for rubber tapping (Fig 3). Poorly
designed tools will often result in poor work posture, and poorly sharpened tools will
require greater physical effort to complete tasks. Injuries can result from improper
uses of hand tools, in the present study’s context referring to specially designed
knives used for tapping rubber. Machinery and equipment are also sources of
excessive noise.
Rubber (6)
The para rubber tree initially grew in South America. Charles Marie de La Condamine
is credited with introducing samples of rubber to the Académie Royale des Sciences
of France in 1736. In 1751, he presented a paper by François Fresneau to the
Académie (eventually published in 1755) which described many of the properties of
rubber. This has been referred to as the first scientific paper on rubber. There are over
600 latex producing species in the world, rubber being one among them. Rubber is
described in chemistry as ‘isoprene polymers’. Rubber (Hevea brasiliensis) is a native
of the tropical South America. In India, commercial cultivation of natural rubber was
introduced by the British planters. The experimental efforts to grow rubber on a
commercial scale in India were initiated as early as 1873 at the Botanical Gardens,
Calcutta. The first commercial Hevea plantations in India were established at
Thattekadu in Kerala in 1902. In the 19th and early 20th century, it was often called
"India rubber." With the invention of motor vehicles, the demand for tyre and
consequently rubber shot up, bringing about its extensive cultivation.
6
Rubber in Karnataka & Birth of KFDC
According to the bilateral agreement in October 1964 between the Governments of
India and Sri Lanka, popularly known as the Sirimavo-Shastri Pact, (6) India agreed to
confer citizenship on 5.25 lakh persons from Sri Lanka, with their natural increase,
over a period of fifteen years. This was followed by another agreement in 1974
(Sirimavo-Indra Gandhi Pact, 1974) as a result of which India was to receive another
75,000 persons of Indian origin, within a period of two years, after those under the
first agreement had been repatriated. The entire process was expected to be completed
by October 1981. Of these 22,000 were trained only in rubber plantation work.
Rubber was introduced in Karnataka by the Forest Department in 1961 as an
experiment, which proved to be successful. This eventually became a rehabilitation
project for the Sri Lankan repatriates (Annexure V), many of whom had previous
knowledge of rubber tapping while in Sri Lanka. (7) Rubber plantations were started as
a joint venture by the Central and State governments in 1972 who opted Kerala and
Karnataka for rehabilitation. In the spirit of the pact between Sri Lanka and India, the
Union Government had directed the respective State Governments to bring forest land
under rubber cultivation. This was followed by the Karnataka State Government's
initiative in bringing 2,000 hectares under rubber cultivation in 1971. Plantation had
expanded to 4,443 hectares of land consisting of 11, 07,882 rubber trees by 2003. On
their part, the Sri Lankan Tamil repatriates took it as a challenge and converted what
were once dense deciduous forests in Dakshina Kannada (DK) district into a thriving
rubber growing area.
According to the corporation records, there are 1,960 employed permanently in the
rubber plantations and 95 per cent of them are of Sri Lankan Tamil origins. Two
7

persons per family were given employment in the rubber plantations. The job could be
transferred to anyone that the job holder wishes to transfer it to. Retirement age for
rubber tappers is 58 completed years. Jobs could be transferred at any time during
their employment to any individual they wish to nominate.
The Forest Department transferred to the Karnataka Forest Development Corporation
(KFDC) by lease 4,443 hectares of standing rubber plantations located in several
Reserve Forests in Sullia and Puttur talukas of DK, vide Government Order dated 27-
9-1980. (7) The intention of transfer was to manage the plantations more efficiently
and in a business like manner, by availing institutional finance. The main product of
KFDC is centrifuged latex (Cenex). In order to make centrifuged latex, the Dry
Rubber Content (DRC) of the field latex which contains about 30% of DRC is
concentrated to the extent of 60% DRC, by removing water through high speed
centrifugal action. The centrifuged latex is called as Cenex rubber.
Apart from the government-owned rubber plantations, the district has 3,900 hectares
of private plantations in smallholdings spread over Sullia, Puttur and Kundapur taluks
(now in Udupi district). They too employ Tamil repatriates, who are experts in the
profession.
Latex extraction method from the rubber tree
Latex is the milky sap of the rubber tree, Hevea
brasiliensis. Rubber trees are tapped for latex by
cutting a spiral groove in the bark and placing a
spout and collection cup at the base. (Fig. 4) Figure 4. Latex extraction.
8
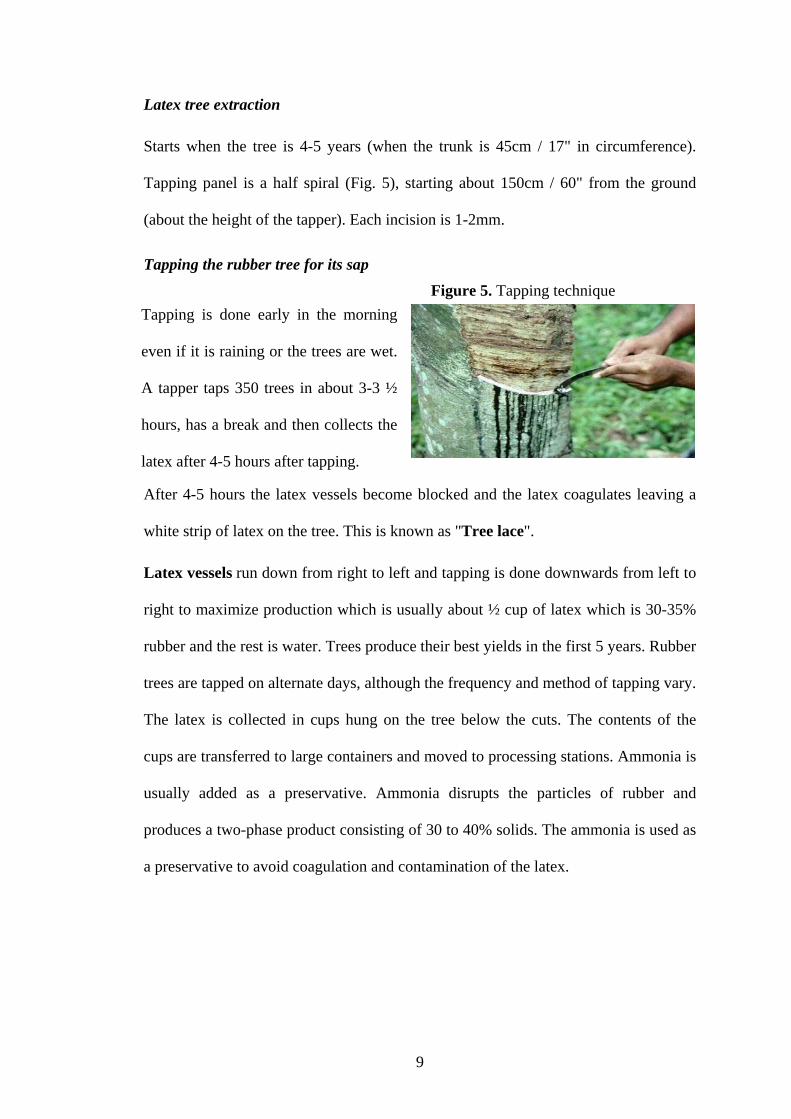
Latex tree extraction
Starts when the tree is 4-5 years (when the trunk is 45cm / 17" in circumference).
Tapping panel is a half spiral (Fig. 5), starting about 150cm / 60" from the ground
(about the height of the tapper). Each incision is 1-2mm.
Tapping the rubber tree for its sap Figure 5. Tapping technique
Tapping is done early in the morning
even if it is raining or the trees are wet.
A tapper taps 350 trees in about 3-3 ½
hours, has a break and then collects the
latex after 4-5 hours after tapping.
After 4-5 hours the latex vessels become blocked and the latex coagulates leaving a
white strip of latex on the tree. This is known as "Tree lace".
Latex vessels run down from right to left and tapping is done downwards from left to
right to maximize production which is usually about ½ cup of latex which is 30-35%
rubber and the rest is water. Trees produce their best yields in the first 5 years. Rubber
trees are tapped on alternate days, although the frequency and method of tapping vary.
The latex is collected in cups hung on the tree below the cuts. The contents of the
cups are transferred to large containers and moved to processing stations. Ammonia is
usually added as a preservative. Ammonia disrupts the particles of rubber and
produces a two-phase product consisting of 30 to 40% solids. The ammonia is used as
a preservative to avoid coagulation and contamination of the latex.
9
Need and rationale
Occupational health should aim at the promotion and maintenance of the highest
degree of physical, mental and social well being of workers in all occupations; the
prevention among workers of departures from health caused by their working
conditions; the protection of workers in their employment from risks resulting from
factors adverse to health; the placing and maintenance of the worker in an
occupational environment adapted to his physiological and psychological equipment,
and, to summarize, the adaptation of work to man and of each man to his job. (8)
By “occupational environment” is meant the sum of external conditions and
influences which prevail at the place of work and which have a bearing on the health
of working population. The industrial worker is placed in a highly complicated
environment which is getting more complicated as man is becoming more ingenious.
There are three types of interactions in a working environment
1. Man and physical, chemical, and biological agents.
2. Man and machine
3. Man and man.
Little has been published about the health status of workers employed in rubber
tapping occupation, despite the fact that this occupation is a way of livelihood for
many people. It is disappointing that the rubber tapping occupation has not been given
the appropriate attention by the research workers with particulars to study the living
conditions, working conditions and the health hazards. One such attempt has been
made here to assess the health profile of rubber tappers.
10
2. OBJECTIVES
1. To describe the demographic and socioeconomic characteristics of rubber tappers.
2. To assess the living conditions of rubber tappers.
3. To describe the occupational environment of rubber tappers and related hazards.
4. To assess the health profile of rubber tappers.
5. To assess the Quality of life of the study population.
6. To suggest recommendations based on the study.
11
3. REVIEW OF LITERATURE
Read not to contradict and confute, not to believe and take for granted, not to find talk
and discourse, but to weigh and consider. (9)
It is the foundation stone based on which are built strong research methods. This in
turn forms the crux of effective programs and policy structures.
‘When you come to a patient’s house, you should ask him what sort of pain he has,
what caused them, how many days he has been ill, whether the bowels are working
and what sort of food he eats’, said Hippocrates in his work Affections. “I may
venture to add one more question, what occupation does he follow?” wrote
Bernardini Ramazzini (1700), (10) implying the role of occupation on health of an
individual.
From the review of various literatures it was understood that little research has been
conducted on the health status of rubber tappers. Therefore with the available
literature on rubber tappers and other literature on similar populations (agricultural
workers, rural populations) a study to assess the health status of rubber tappers was
attempted. These studies are to some extent applicable to rubber tappers as well.
Review on Socio-demographic characteristics
In a study done by T.V.Ushadevi and V.N.Jayachandran among rubber tappers in
Kerala in 2001 with a sample of 200, 4.5% were illiterates and 33% dropped out of
their studies at the primary level itself. Percentage of tappers having educational
qualifications of SSLC and above was 8.5%. Percentage of tappers with debts were
86.5. (11)
12
C Nancy et al described the socio demographic profile of a sample of 180 rubber
tappers in Sumatra, Indonesia where 59.66% had secondary jobs ranging from
farming, mechanic, carpentry, brick making and livestock raising. Age of the tappers
ranged from 33 – 40 years. Education levels were 60.5%, 9.75% and 29.75% for
primary, secondary high and high school respectively among the sample tappers. (12)
Review on housing conditions
National Family Health Survey 3 (NFHS-3) (2005-06) reported that
• 7% lived in kachha, 55% lived in semi-pucca (Annexure V) and 37.6% lived
in pucca houses in rural Karnataka. 85% of rural households had improved
source of drinking water. 16% of rural households had piped water into their
dwelling, yard, or plot. In urban and rural Karnataka, 43% of households treat
their drinking water to make it potable.
• Nationwide about 25% of households had drinking water piped into their
homes or yards. Other households rely on public taps, tube wells, or borewells.
About 33% of households treated their drinking water by boiling or other
methods to make it safer to drink.
• Sanitation facility in rural Karnataka was observed to be 78% as open space
defecation and 14.4% as flush/pour flush leading to piped sewer system, septic
tank, or pit latrine. Nationwide, only 29% of households have improved toilet
facilities.
• Cooking fuel used was wood in 87.8% of rural households; LPG/natural gas in
7.9%; 1.5% used kerosene in rural Karnataka.
• In rural Karnataka, cigarettes or bidis smokers were 0.1% of females and
28.7% of males. Paan masala, gutkha, or tobacco chewers were 6.0% of
13
females and 25.8% of males. Alcohol drinking was observed in 1.5% of
females and 27.5% of males.
• Adults in rural Karnataka suffer from a dual burden of malnutrition; over one-
third of adults were too thin, and 15 percent of women and 11 percent of men
were overweight or obese. Only 49 percent of women and 55 percent of men
were at a healthy weight for their height.
• The contraceptive prevalence rate among currently married women was 64%
(both urban and rural). Among the ever-married women, 37.3% had a birth
order of 1, 33.9% had 2 children 16.0% had 3 children and 12.8% had more
than 4 children. (13)
According to a study conducted by C U Thersia (2004) in Kerala among women
workers in agriculture, it was revealed that more than one-fifth (20.6%) of the ever-
married women in a sample of 165 had undergone abortion. Stillbirths were reported
in 2.4% of them. (14)
Review on Occupation related observations
The General Conference of the International Labor Organization (ILO), convened at
Geneva in 1967 and decided upon the adoption of certain proposals with regard to
maximum permissible weight to be carried by one worker which may be cited as the
Maximum Weight Recommendation, 1967. The recommendations mentioned that one
adult male worker may transport manually not more than 55 kilograms and where,
adult women workers are concerned, the maximum weight of such loads should be
substantially less than that permitted for adult male workers or should not be assigned
to regular manual transport of loads. Measures should be taken as speedily as possible
14
to reduce it to that level. This Recommendation applies to all branches of economic
activity. (15)
Agriculture has been rated as one of the most dangerous occupations (Mazza
1997).(16) The National Research Council and Institute of Medicine (NRCIM), (2001)
defines work related illness as being caused by, aggravated, accelerated or
exacerbated by workplace exposures, which result in impaired work capacity.
WHO report in 1985 stated that work environment, performance of work,
(17)
personal
characteristics, environmental and socio-cultural factors contribute to the cause or
aggravation of the disorder. (18) Also it was found that the incidence of farm
workplace injury during the twelve-month study period was reported to be 6% in male
workers and 2% in female workers. (18)
Generally, an estate with a predominantly hilly terrain will be more difficult to
work.(19) Gordon J E studied about the traumatic accidents in rural tropical regions
and reported that there were 116 injuries per thousand farm workers per year in rural
India in Punjab. (20)
A study was carried out in Madhya Pradesh (Central India) by Tiwari P S et al to
collect data on injury-causing agricultural incidents during the period 1995-1999. The
overall incidence rate was 1.25/1000 workers/year. (21)
H.Y. Umar et al (2008) showed that 53.85% of the respondents were victims of bites
and stings among rubber tappers in Edo and Abia States in Nigeria. (22)
Review on health problems
Based on the description of musculoskeletal disorders (MSD) by National Institute of
Occupational Safety and Health (NIOSH, 1997a) back pain and pain in the shoulders,
arms and hands are the most common symptoms reported by farmers (NIOSH,
15
2001).(23) Unfortunately, the majority of studies investigating MSD are completed in
settings other than agriculture. (24) Bobick and Myers, 1994 investigated agriculture–
related strains and sprains and found that injuries to the back and extremities were
quite common. (25)
More than 1 million workers annually sustain injuries severe enough to result in lost
time from work due to overexertion or repetitive motion (BLS, 1999). (26) The main
groups are back pain and injuries, and Work Related Upper Limb Disorders,
commonly known as “repetitive strain injuries” (RSI). (27) Musculoskeletal disorders
have been reported from all sectors of society. They are common to both the workers
in the organized industries, in the unorganized industries and have been reported even
among sedentary workers. A majority of these are either due to ergonomic stress or to
work load. The etiology may differ in different situations but the predominant cause
of these disorders is invariably a wrong ergonomic posture during work. In
unorganized industries, incorrect working posture often results in musculoskeletal
disorders in more than 1/4th of the employees. This may be well defined organic
lesions or may manifest as subjective symptoms. In both the cases industrial workers
are prone to suffer from painful conditions. This often results in decreased efficiency
and hampered production.
In a study conducted by Villarejo D et al on agricultural workers, significant numbers
of both male (41%) and female (40%) workers reported persistent pain (every day for
more than one week) in the back, neck, knees, shoulders, hands, feet, or multiple body
parts. (28)
Doyne (1923) stated that myopia was common among the educated and those engaged
in near work. (29)
16
Infection of the respiratory tract is perhaps the most common human ailment. It is
well known that the traditional domestic practice of cooking in primitive stoves with
low-grade fuels and in badly ventilated kitchens can have serious implications for the
health of women and children (Bruce et al., 2000).(30)
Many risk factors for respiratory tract infections have been identified. They include
not only the climatic conditions but also the housing, level of industrialization and
socio-economic development. In developing countries overcrowded dwellings and
intense indoor smoke pollution underline the high rates of respiratory infections.
United Nations Development Programme (UNDP) has recently pointed out that as
many as 2.8 million deaths per year result from breathing elevated levels of indoor
smoke from dirty fuels around the world. (31) The finding translates to about 6% of all
deaths per year. With this kind of effect indoor air pollution would be responsible for
one of the largest single risk factors for health and economy of any country.
Epidemiological studies have indicated that indoor air pollution due to bio-fuels is
linked to at least four major groups of illness which are acute respiratory infection
(ARI) in children, chronic obstructive lung diseases like asthma and bronchitis, lung
cancer, still births and other birth related problems.
There are no well-defined systems of recording agricultural injuries, as a standard
definition of agricultural injury does not exist (Howell and Smith, 1973). (32)
In the study done by T.V.Ushadevi and V.N.Jayachandran in Kerala in 2001 among
rubber tappers, 24.5% of rubber tappers use head light while tapping during
twilight.(11)
17
Review on Quality of Life
Increasingly, health care planners are recognizing that measures of disease alone are
insufficient determinants of health status. Over the past decades, two classes of
complementary health status measures have emerged to fill the information gap –
objective measures of functional health status and subjective measures of health and
well-being. (33–36) These measures are multilevel and multi-dimensional. There are
many published Quality of Life (QOL) measures but there is still a lack of consensus
among researchers about its definition and this is reflected in the choice of items for
their instruments. The WHO defines QOL as ‘an individual’s perception of their
position in life in the context of the culture and value systems in which they live, and
in relation to their goals, expectations, standards and concerns’. (37) In measuring QOL
therefore, the WHOQOL Group takes the view that it is important to know how
satisfied or bothered people are by important aspects of their life, and this
interpretation will be a highly individual matter. The World Health Organisation
Quality of Life assessment – the WHOQOL-100 – is a cross-culturally valid
assessment of well-being. Assessment is operationalized through 100 items
representing 25 facets organized in six domains. (38, 39) The tool was developed
through a collaboration of 15 sites around the world working in their own national
language. The WHOQOL-BREF was developed as a short version of the WHOQOL-
100 for use in situations where time is restricted, where respondent burden must be
minimized and where facet-level detail is unnecessary. Using data from 15 centres
collected for the WHOQOL-100 field trials, items for the WHOQOL-BREF were
selected for their ability to explain a substantial proportion of variance within their
parent facet and domain, for their relationship with the overall WHOQOL model and
for their discriminant validity. Analysis of these extracted items showed that a four-
18
factor structure best fitted the data. (40) Although this contrasted with the original
concept of a 6-domain model for the WHOQOL, it was consistent with empirical
results from the previous WHOQOL-100 field trials. (41) Based on these results, the
WHOQOL-BREF was developed in the context of four domains of QOL: physical,
psychological, social and environment. It was predicted that sick participants would
report poorer QOL than well participants but no predictions were made for other
socio-demographic differences. (40)
WHOQOL-BREF domains and Domain Facets incorporated within domains
1. Physical health
Activities of daily living
Dependence on medicinal substances and medical aids
Energy and fatigue
Mobility
Pain and discomfort
Sleep and rest
Work Capacity
2. Psychological
Bodily image and appearance
Negative feelings and Positive feelings
Self-esteem
Spirituality / Religion / Personal beliefs
Thinking, learning, memory and concentration
3. Social relationships
Personal relationships, Social support and Sexual activity.
19
4. Environment
Financial resources, freedom, physical safety and security
Health and social care: accessibility and quality
Home environment, physical environment (pollution / noise / traffic / climate)
Opportunities for acquiring new information and skills
Participation in and opportunities for recreation / leisure activities, transport
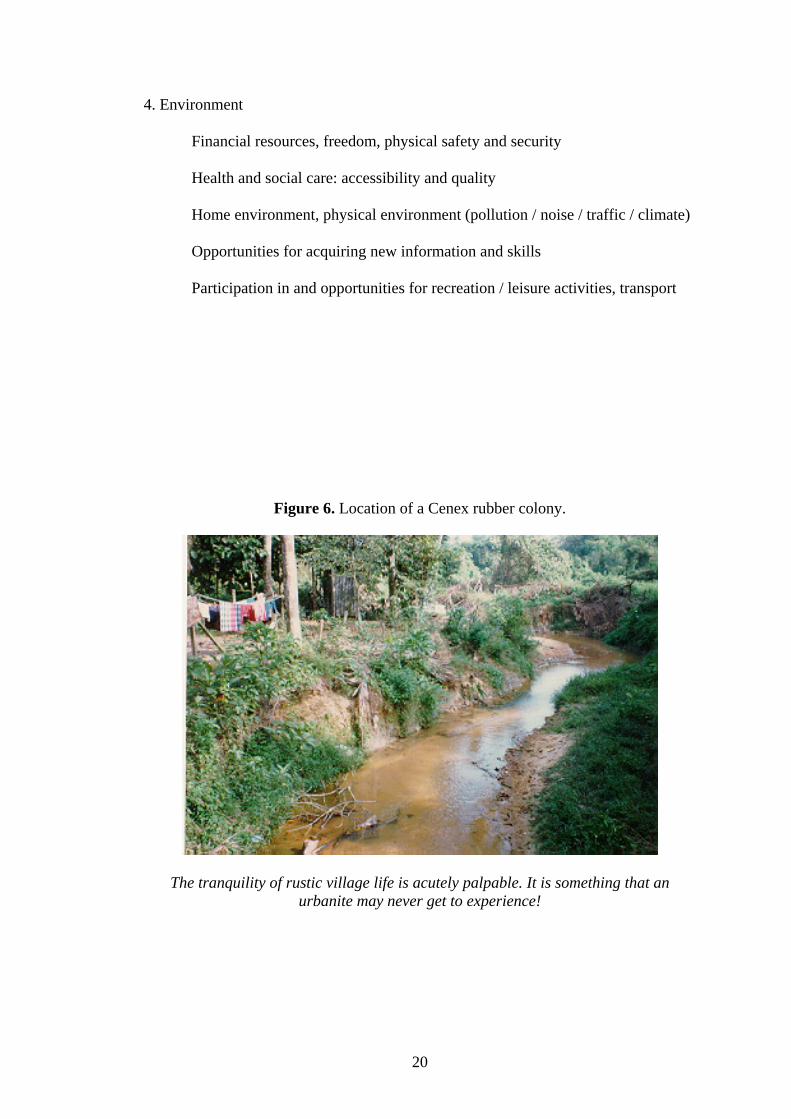
Figure 6. Location of a Cenex rubber colony.
The tranquility of rustic village life is acutely palpable. It is something that an urbanite may never get to experience!
20
4. MATERIAL AND METHODS
Study area
The rubber tappers with their families have been sheltered in settlements called as
Cenex Rubber Colony (CRC) situated in the forest areas converted as rubber
plantations since 1975. The Karnataka Forest Development Corporation (KFDC) has
established a total of 42 colonies for its permanent employees situated in various parts
of the 4,443 hectares of plantations in DK, Karnataka. Four of these 42 colonies were
selected randomly. There were a total of 135 households in these four colonies and all
135 houses were included in the study.
Study Population
The study population consisted of all rubber tappers residing in the selected four
colonies, who were engaged in rubber tapping for more than one year with KFDC
only.
Study Design
A cross-sectional study
Sampling
The KFDC has established 42 colonies for its permanent employees situated in
various parts of the 4,443 hectares of plantations in DK, Karnataka. Four of these 42
colonies were selected randomly. There were a total of 135 households in these four
colonies and all 135 households were included in the study. The total number of
21

rubber tappers employed by KFDC residing in the selected four colonies was 171. All
the 171 rubber tappers were included in the study.
Inclusion and exclusion criteria
Schematic representation of study design
Inclusion and exclusion criteria
Inclusion Criteria 1) Rubber tappers who are permanent residents of the selected four colonies. 2) Tappers must be employed by KFDC. 3) Tappers with experience > 1year. 4) Persons willing to participate in the study.
Exclusion Criteria 1) Tappers not employed by KFDC 2) If employed by KFDC, those with experience < 1year. 3) Persons not willing to participate in the study.
Study group 1) Interview of rubber tappers. 2) Physical examination of subjects. 3) Observational assessment of work and work site.
Selected study population
22
IMPLEMENTATION OF STUDY
It consisted of following four phases:
1. Preparatory phase
2. Phase of data collection
3. Phase of data analysis
4. Phase of documentation
Preparatory phase
Seeking administrative approval
The necessary approval was obtained from following authorities to conduct the study:
1) The Professor and Head, Department of Communiy Medicine, K V G Medical
College, Sullia.
2) Ethics Committee, K V G Medical College, Sullia.
3) Managing Director, KFDC, Bangalore (See Annexure I)
4) Executive Director, KFDC, Mangalore
5) Divisional Manager, KFDC (Sullia Division), Sullia
Constructing tools for the data collection
A semi-structured, pretested questionnaire was used for collection of data.
Questionnaire (See Annexure II) included,
1) Socio-demographic details like name, age, sex, religion, education status,
residential address, work-site address, total family members, income.
2) Housing conditions like natural lighting, ventilation, overcrowding, source of
drinking water, sanitation, cooking fuel used
23
3) Work details like total years of experience in rubber tapping, means of transport to
work, distance to work, working hours, work posture, preventive measures, and
distance to delivery point with load.
4) Work site observation of light, noise, drinking water and sanitation facility.
5) Detailed history with general and systemic examination.
6) World Health Organization, Quality of life questionnaire. (WHOQOL-BREF) was
used to assess the quality of life of the study subjects. (See Annexure III)
Arranging tools needed for study
The necessary arrangements were made to ensure the availability of the weighing
scale, measuring tape, torch, B.P. instrument, stethoscope for the study.
Phase of data collection
The study population was surveyed by house-to-house visit. Visits to place of work
were made. The data collection was carried out from April 2009 after obtaining
permission from KFDC to December 2009. (Annexure I)
Phase of data analysis
The data collected was entered, analyzed and tabulated using a Microsoft Excel
package of MS Office and SPSS 11.5 package of statistics. Statistical tests used were
Chi-square test, multiple logistic regression, unpaired t-test, ANOVA and LSD as
post-hoc test. The QOL scores of the WHOQOL- BREF version questionnaire (42)
were calculated as one overall score and four domains scores. These score were later
transformed to 0–100 scale which represents the scores if the respondents would have
been subject to the WHOQOL-100 questionnaire.
24
5. RESULTS
This cross sectional study was conducted to assess the health status of rubber tappers.
A total of 171 rubber tappers were assessed and the following results were observed.
The results obtained are discussed under the following headings.
5.1. Socio-demographic profile
5.2. Housing and living environment
5.3. Occupation related observations
5.4. Health profile
5.5. Quality of life
25
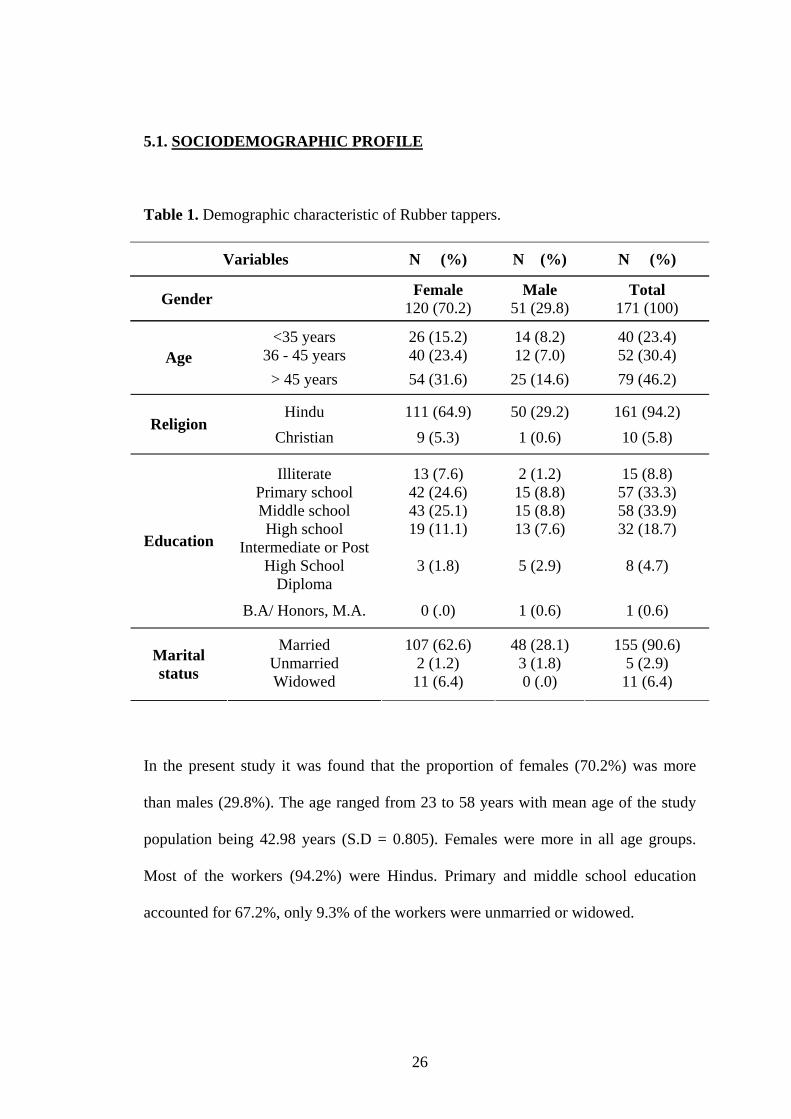
5.1. SOCIODEMOGRAPHIC PROFILE
Table 1. Demographic characteristic of Rubber tappers.
Variables N (%) N (%) N (%)
Gender Female 120 (70.2)
Male 51 (29.8)
Total 171 (100)
<35 years 26 (15.2) 14 (8.2) 40 (23.4) 36 - 45 years 40 (23.4) 12 (7.0) 52 (30.4) Age
> 45 years 54 (31.6) 25 (14.6) 79 (46.2)
Hindu 111 (64.9) 50 (29.2) 161 (94.2) Religion
Christian 9 (5.3) 1 (0.6) 10 (5.8)
Illiterate 13 (7.6) 2 (1.2) 15 (8.8) Primary school 42 (24.6) 15 (8.8) 57 (33.3) Middle school 43 (25.1) 15 (8.8) 58 (33.9) High school 19 (11.1) 13 (7.6) 32 (18.7)
Intermediate or Post High School
Diploma 3 (1.8) 5 (2.9) 8 (4.7)
Education
B.A/ Honors, M.A. 0 (.0) 1 (0.6) 1 (0.6)
Married 107 (62.6) 48 (28.1) 155 (90.6) Unmarried 2 (1.2) 3 (1.8) 5 (2.9) Marital
status Widowed 11 (6.4) 0 (.0) 11 (6.4)
In the present study it was found that the proportion of females (70.2%) was more
than males (29.8%). The age ranged from 23 to 58 years with mean age of the study
population being 42.98 years (S.D = 0.805). Females were more in all age groups.
Most of the workers (94.2%) were Hindus. Primary and middle school education
accounted for 67.2%, only 9.3% of the workers were unmarried or widowed.
26
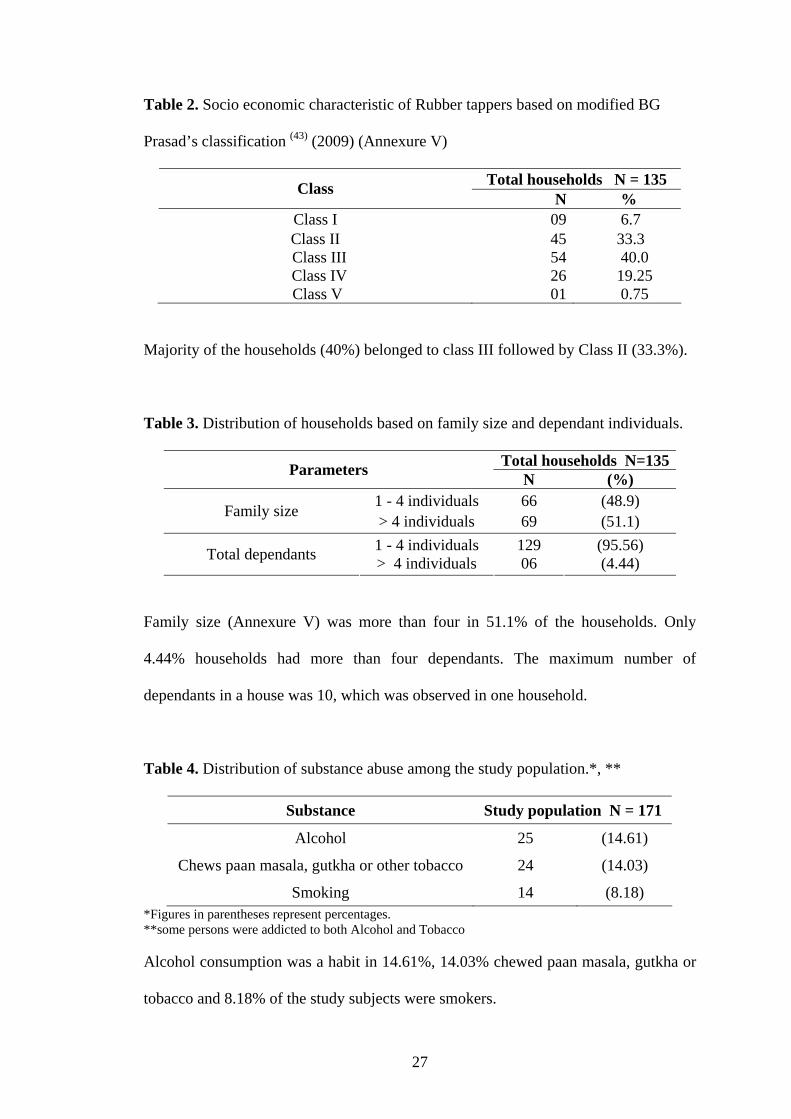
Table 2. Socio economic characteristic of Rubber tappers based on modified BG
Prasad’s classification (43) (2009) (Annexure V)
Total households N = 135 Class N %
Class I 09 6.7 Class II 45 33.3
Class III 54 40.0 Class IV 26 19.25 Class V 01 0.75
Majority of the households (40%) belonged to class III followed by Class II (33.3%).
Table 3. Distribution of households based on family size and dependant individuals.
Total households N=135Parameters N (%) 1 - 4 individuals 66 (48.9) Family size > 4 individuals 69 (51.1) 1 - 4 individuals 129 (95.56) Total dependants > 4 individuals 06 (4.44)
Family size (Annexure V) was more than four in 51.1% of the households. Only
4.44% households had more than four dependants. The maximum number of
dependants in a house was 10, which was observed in one household.
Table 4. Distribution of substance abuse among the study population.*, **
Substance Study population N = 171
Alcohol 25 (14.61)
Chews paan masala, gutkha or other tobacco 24 (14.03)
Smoking 14 (8.18) *Figures in parentheses represent percentages. **some persons were addicted to both Alcohol and Tobacco
Alcohol consumption was a habit in 14.61%, 14.03% chewed paan masala, gutkha or
tobacco and 8.18% of the study subjects were smokers.
27
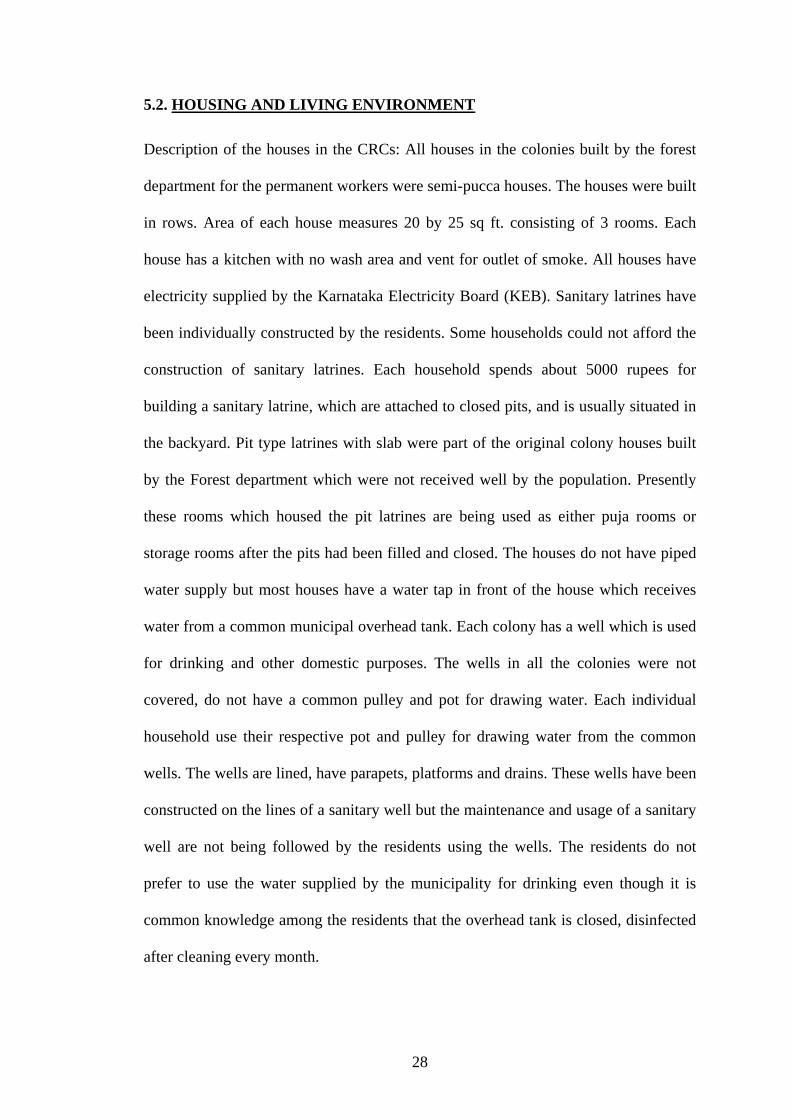
5.2. HOUSING AND LIVING ENVIRONMENT
Description of the houses in the CRCs: All houses in the colonies built by the forest
department for the permanent workers were semi-pucca houses. The houses were built
in rows. Area of each house measures 20 by 25 sq ft. consisting of 3 rooms. Each
house has a kitchen with no wash area and vent for outlet of smoke. All houses have
electricity supplied by the Karnataka Electricity Board (KEB). Sanitary latrines have
been individually constructed by the residents. Some households could not afford the
construction of sanitary latrines. Each household spends about 5000 rupees for
building a sanitary latrine, which are attached to closed pits, and is usually situated in
the backyard. Pit type latrines with slab were part of the original colony houses built
by the Forest department which were not received well by the population. Presently
these rooms which housed the pit latrines are being used as either puja rooms or
storage rooms after the pits had been filled and closed. The houses do not have piped
water supply but most houses have a water tap in front of the house which receives
water from a common municipal overhead tank. Each colony has a well which is used
for drinking and other domestic purposes. The wells in all the colonies were not
covered, do not have a common pulley and pot for drawing water. Each individual
household use their respective pot and pulley for drawing water from the common
wells. The wells are lined, have parapets, platforms and drains. These wells have been
constructed on the lines of a sanitary well but the maintenance and usage of a sanitary
well are not being followed by the residents using the wells. The residents do not
prefer to use the water supplied by the municipality for drinking even though it is
common knowledge among the residents that the overhead tank is closed, disinfected
after cleaning every month.
28
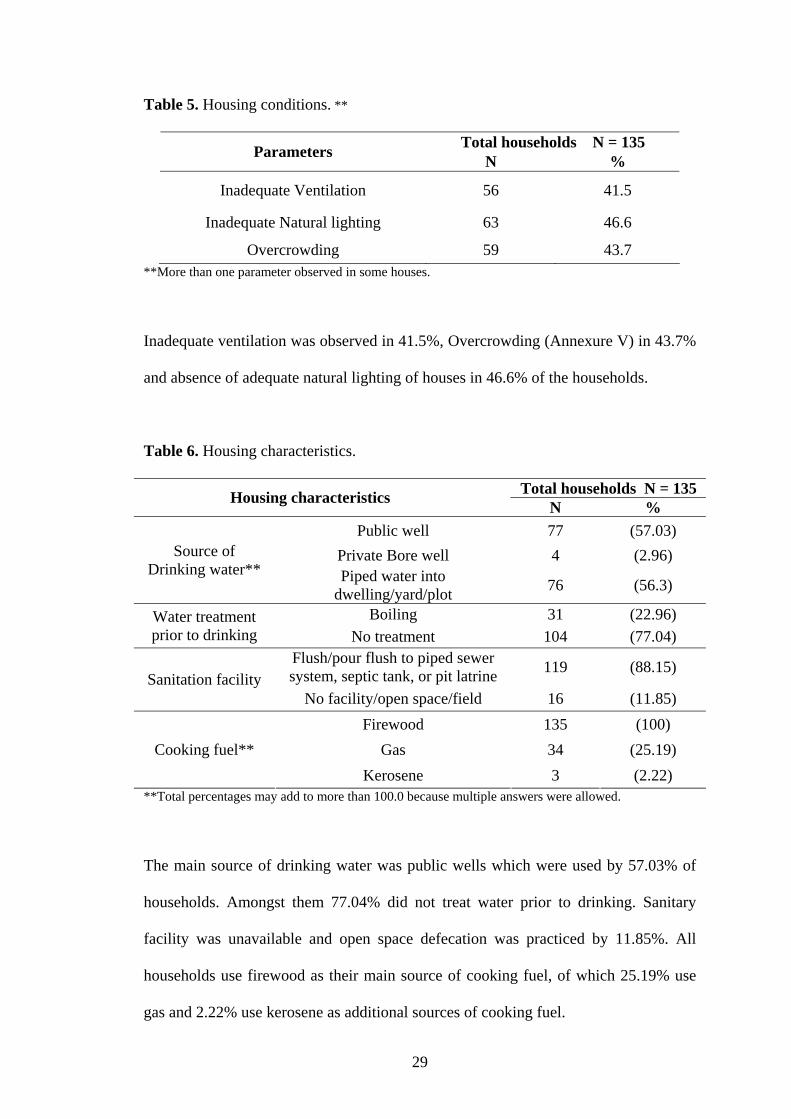
Table 5. Housing conditions. **
Total households N = 135 Parameters N %
Inadequate Ventilation 56 41.5
Inadequate Natural lighting 63 46.6
Overcrowding 59 43.7 **More than one parameter observed in some houses.
Inadequate ventilation was observed in 41.5%, Overcrowding (Annexure V) in 43.7%
and absence of adequate natural lighting of houses in 46.6% of the households.
Table 6. Housing characteristics.
Total households N = 135 Housing characteristics N % Public well 77 (57.03)
Private Bore well 4 (2.96) Source of Drinking water** Piped water into
dwelling/yard/plot 76 (56.3)
Boiling 31 (22.96) Water treatment prior to drinking No treatment 104 (77.04)
Flush/pour flush to piped sewer system, septic tank, or pit latrine 119 (88.15)
Sanitation facility No facility/open space/field 16 (11.85)
Firewood 135 (100) Gas 34 (25.19) Cooking fuel**
Kerosene 3 (2.22) **Total percentages may add to more than 100.0 because multiple answers were allowed.
The main source of drinking water was public wells which were used by 57.03% of
households. Amongst them 77.04% did not treat water prior to drinking. Sanitary
facility was unavailable and open space defecation was practiced by 11.85%. All
households use firewood as their main source of cooking fuel, of which 25.19% use
gas and 2.22% use kerosene as additional sources of cooking fuel.
29
5.3. OCCUPATION RELATED OBSERVATIONS
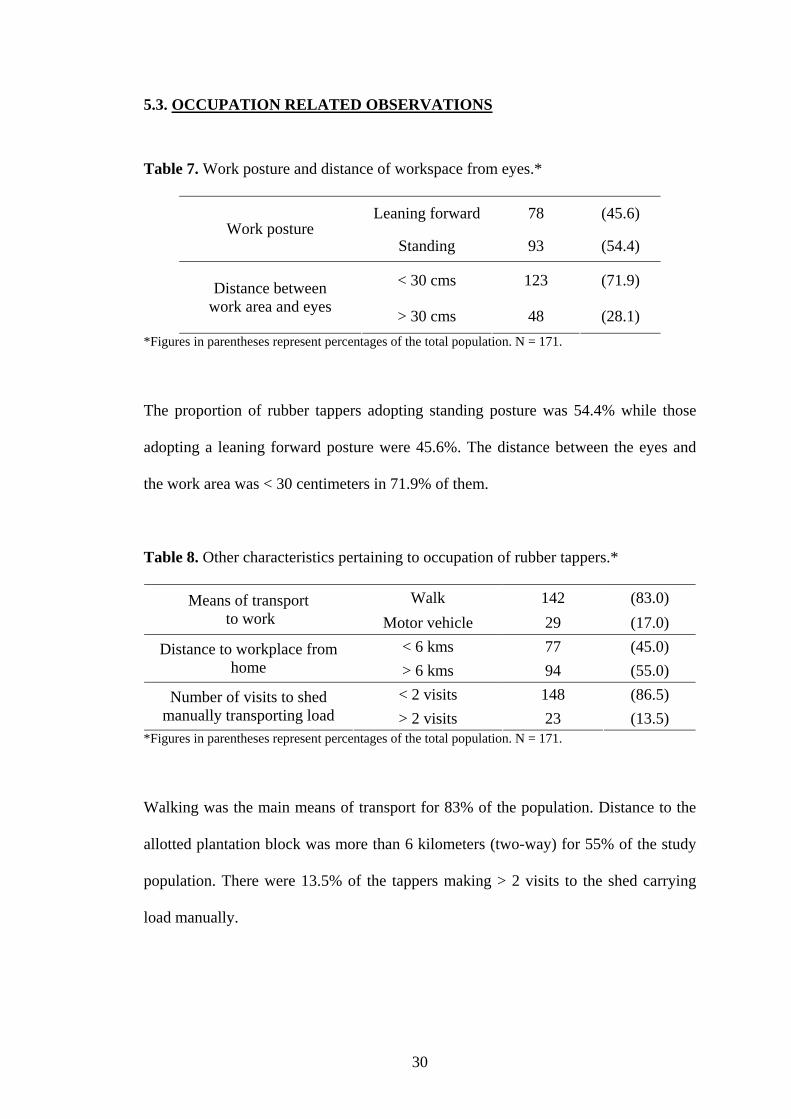
Table 7. Work posture and distance of workspace from eyes.*
Leaning forward 78 (45.6) Work posture
Standing 93 (54.4)
< 30 cms 123 (71.9) Distance between work area and eyes > 30 cms 48 (28.1)
*Figures in parentheses represent percentages of the total population. N = 171.
The proportion of rubber tappers adopting standing posture was 54.4% while those
adopting a leaning forward posture were 45.6%. The distance between the eyes and
the work area was < 30 centimeters in 71.9% of them.
Table 8. Other characteristics pertaining to occupation of rubber tappers.*
Walk 142 (83.0) Means of transport to work Motor vehicle 29 (17.0)
< 6 kms 77 (45.0) Distance to workplace from home > 6 kms 94 (55.0)
< 2 visits 148 (86.5) Number of visits to shed manually transporting load > 2 visits 23 (13.5)
*Figures in parentheses represent percentages of the total population. N = 171.
Walking was the main means of transport for 83% of the population. Distance to the
allotted plantation block was more than 6 kilometers (two-way) for 55% of the study
population. There were 13.5% of the tappers making > 2 visits to the shed carrying
load manually.
30
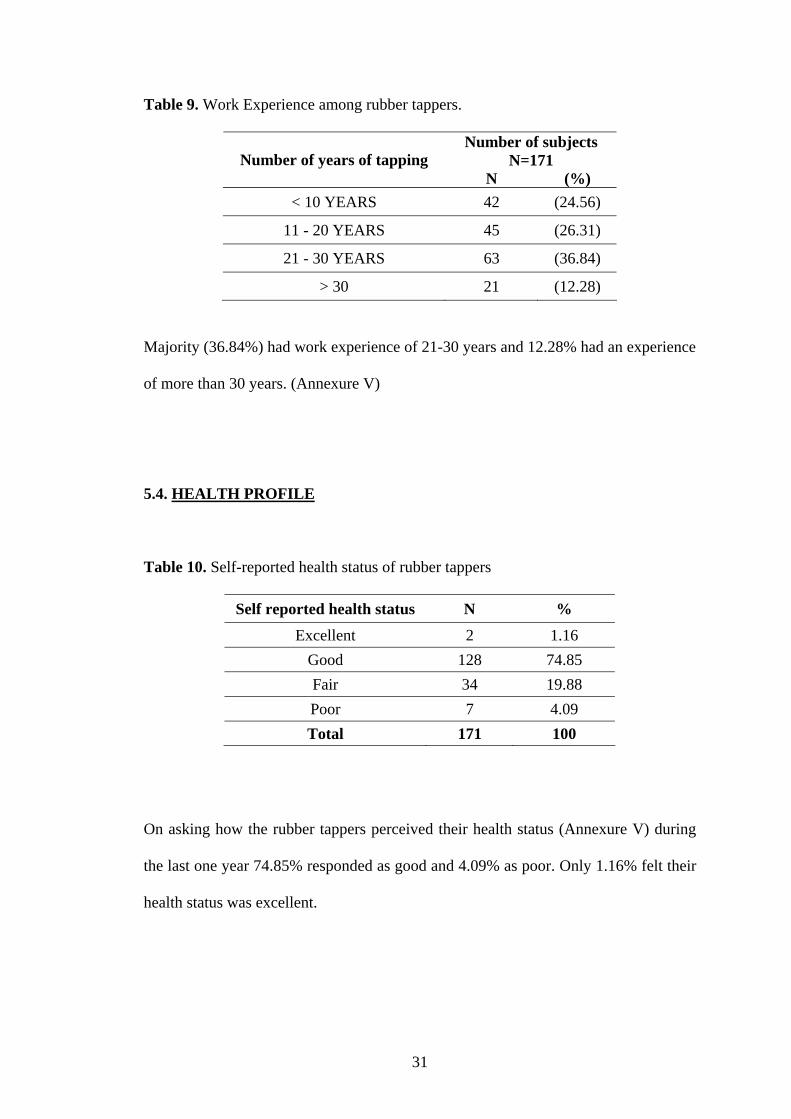
Table 9. Work Experience among rubber tappers.
Number of subjects N=171 Number of years of tapping
N (%) < 10 YEARS 42 (24.56)
11 - 20 YEARS 45 (26.31)
21 - 30 YEARS 63 (36.84)
> 30 21 (12.28)
Majority (36.84%) had work experience of 21-30 years and 12.28% had an experience
of more than 30 years. (Annexure V)
5.4. HEALTH PROFILE
Table 10. Self-reported health status of rubber tappers
Self reported health status N %
Excellent 2 1.16 Good 128 74.85 Fair 34 19.88 Poor 7 4.09 Total 171 100
On asking how the rubber tappers perceived their health status (Annexure V) during
the last one year 74.85% responded as good and 4.09% as poor. Only 1.16% felt their
health status was excellent.
31

Table 11. Comparison of Body Mass Index between male and female rubber tappers.
Sex Body Mass Index Females N=120
N (%) Males N=51 N (%)
Total N = 171 N (%)
Underweight 35 (29.16) 11 (21.56) 46 (26.90)
Normal range 62 (51.66) 34 (66.66) 96 (56.14)
Pre-obese 17 (14.61) 6 (11.76) 23 (13.45)
Obese class I 06 (5.0) 0 (.0) 06 (3.50)
BMI (Annexure V) in 56.14% of the population were in normal range. However more
percentage of females were underweight and pre-obese compared to males. Of the
obese class I all were females.
Table 12. General examination findings among rubber tappers.
Study population N = 171 Category N (%)
Pallor 49 (28.65)
Oral lesions 48 (28.07)
Skin lesions 18 (10.5)
High blood pressure 16 (9.35)
Eye lesions 13 (7.6)
Scalp lesions 11 (6.4)
Nose lesions 07 (4.1)
Ear lesions 05 (2.9)
Clubbing 04 (2.34)
Icterus 03 (1.75)
Pallor was seen in 28.65% and oral lesions predominantly dental caries was seen in
28.07% of the subjects. Skin lesions mainly dermatitis and callosity were observed in
10.5% and High blood pressure(Annexure V) was seen in 9.35% of the study subjects.
32
Table 13. Health problems assessed from history and clinical examination of rubber
tappers.
Study population N = 171 Category N (%) Musculoskeletal disorders 52 (30.40) Accidents at work 39 (22.8) Tuberculosis 1 (0.58) Hypertension 9 (5.26) Asthma 5 (2.9) Chronic gastritis 4 (2.34) Diabetes Mellitus 3 (1.75) Myocardial Infarction 1 (0.58) Congenital anomaly of CVS 1 (0.58) Epilepsy 1 (0.58) Thyrotoxicosis 1 (0.58)
Musculoskeletal disorders (Annexure V) were the most common clinical finding
among 30.40% of the rubber tappers. Among chronic conditions, Hypertension was
seen in 5.26% and Diabetes was seen in 1.75% of the study subjects. 2.9% of the
subjects were asthmatic.
Table 14. Age wise distribution of musculoskeletal disorders.
Musculoskeletal disorders
Age groups
Present
N (%)
Absent
N (%)
Total
N (%) <35 years 5 (12.5) 35 (87.5) 40 (100)
36 - 45 years 16 (30.8) 36 (69.2) 52 (100)
> 45 years 31 (39.24) 48 (60.76) 79 (100)
Total 52 (30.40) 119 (69.60) 171 (100)
X2= 8.97 Df= 2
p value=0.01
There was significant difference between the age groups and presence of
musculoskeletal disorders. Musculoskeletal disorders were more common in older
individuals compared to the younger age groups.
33
Table 15. Sex wise distribution of musculoskeletal disorders.
Musculoskeletal disorders
Sex
Present
N (%)
Absent
N (%)
Total
N (%) Chi square
Female 37 (29.41) 83 (70.6) 120 (100)
Male 15 (30.83) 36 (69.17) 51 (100)
Total 52 (30.40) 119 (69.6) 171 (100)
X2= 0.034 Df= 1
p value=0.85
Musculoskeletal disorders were more common among the males compared to females.
However, this difference was not statistically significant.
Table 16. Difference between distances of work area from eyes and its relation to
myopia.
Myopia Distance between eye and work area
Present
N (%)
Absent
N (%)
Total
N (%)
Chi square
Less than 30 cms 19 (79.2) 104 (70.7) 123 (71.9)
More than 30 cms 5 (20.8) 43 (29.3) 48 (28.1)
Total 24 (100) 147 (100) 171 (100)
X2= 0.724 Df= 1
p value=0.395
Myopia was present among 14.03% of the subjects and in Table 16 among the
myopics it was more common (79.2%) in those who worked at a distance < 30
centimeters between eyes and work area compared to those working at a distance > 30
centimeters. But this difference was not statistically significant.
34
Table 17. Obstetric history among women rubber tappers.
Parameters N %
Women who have attained menopause N = 120 42 (35.0)
Nulliparous 07 (5.93)
1 12 (10.17)
2 43 (36.44)
3 47 (39.83)
Births to ever-married women N = 118
4+ 09 (7.63)
History of Abortion in among the ever-married women N = 118 14 (11.86)
History of Stillbirths among the ever-married women N = 118 04 (3.38)
Contraception not used by currently married women N = 76 44 (57.89)
The total number of women in this study was 120 of which 118 were ever-married
women. Of the 118 ever-married women 5.93% were nulliparous, and most (39.83%)
of them had a birth order of 3. One woman had a birth order of 10 which was the
highest. Abortions in ever-married women were reported in 11.86% and stillbirths in
3.38%. There were a total of 107 currently married women. Excluding the
menopausal and unmarried women there were 76 women who were currently married
and were eligible for contraception use. But 57.69% of them were not adopting any
method of contraception at the time of the study.
35
Table 18. Logistic regression predicting the likelihood of the study population
reporting musculoskeletal disorders.
95% Confidence
Interval Predictors b S.E. Wald df Sig. Odds Ratio Upper Lower
Workplace distance 0.646 0.387 2.788 1 0.095 0.867 0.292 2.572
Means of transport -0.397 0.563 0.498 1 0.481 0.544 0.207 1.428
Number of visits with
manual load 1.413 0.497 8.087 1 0.004 4.502 1.803 11.242
Number of years in tapping 1.083 0.371 8.538 1 0.003 2.941 1.482 5.833
Work posture -0.271 0.374 0.524 1 0.469 0.555 0.288 1.072
Constant -4.286 1.361 9.914 1 0.002
b is the coefficient of the predictor variables S.E is Standard error Wald test is used to test the statistical significance of each coefficient (b) in the model. df is the degree of freedom Sig denotes Significance
The above table shows the relationship between different work-related factors
(predictor variables) and musculoskeletal disorders. In comparison to the workers
working for > 20 years with those working for < 20 years it was found that occurrence
of musculoskeletal disorders were significantly more in those working for > 20 years.
Comparing those workers making > 2 visits to the shed carrying manual load and
those making lesser visits, the occurrence of musculoskeletal disorders were
significantly more among those making >2 visits. Occurrence of musculoskeletal
36
disorders between those subjects adopting standing work posture while tapping to
those adopting leaning posture was not found to be significant. Similarly there was
no significant difference between those walking to work and travelling by any motor
vehicle, and also between those subjects who walked a distance of >6 kilometers and
<6 kilometers to their respective workplace from their homes.
Health care services
The rubber tappers have health insurance provided by KFDC. A hospital that caters
only to KFDC employees, with both male and female Medical Officers are available
providing inpatient and outpatient services. Weekly visits by one of the Medical
Officers’ are made to the colonies providing consultation and treatment. Medications
are distributed free of charge to all employees of the Corporation. Medical
reimbursement from employer can be availed after treatment from designated referral
hospitals. KVG Medical College Hospital is the designated referral hospital.
37
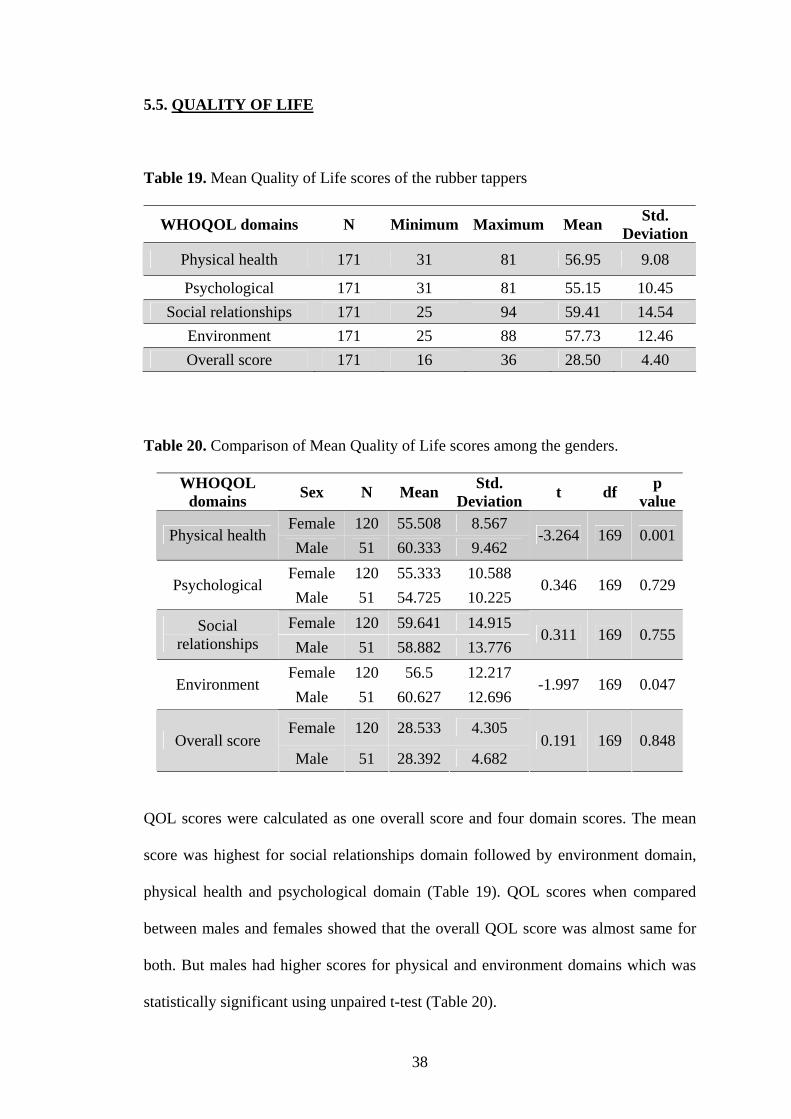
5.5. QUALITY OF LIFE
Table 19. Mean Quality of Life scores of the rubber tappers
WHOQOL domains N Minimum Maximum Mean Std. Deviation
Physical health 171 31 81 56.95 9.08
Psychological 171 31 81 55.15 10.45 Social relationships 171 25 94 59.41 14.54
Environment 171 25 88 57.73 12.46 Overall score 171 16 36 28.50 4.40
Table 20. Comparison of Mean Quality of Life scores among the genders.
WHOQOL domains Sex N Mean Std.
Deviation t df p value
Female 120 55.508 8.567 Physical health
Male 51 60.333 9.462 -3.264 169 0.001
Female 120 55.333 10.588 Psychological
Male 51 54.725 10.225 0.346 169 0.729
Female 120 59.641 14.915 Social relationships Male 51 58.882 13.776
0.311 169 0.755
Female 120 56.5 12.217 Environment
Male 51 60.627 12.696 -1.997 169 0.047
Female 120 28.533 4.305 Overall score
Male 51 28.392 4.682 0.191 169 0.848
QOL scores were calculated as one overall score and four domain scores. The mean
score was highest for social relationships domain followed by environment domain,
physical health and psychological domain (Table 19). QOL scores when compared
between males and females showed that the overall QOL score was almost same for
both. But males had higher scores for physical and environment domains which was
statistically significant using unpaired t-test (Table 20).
38
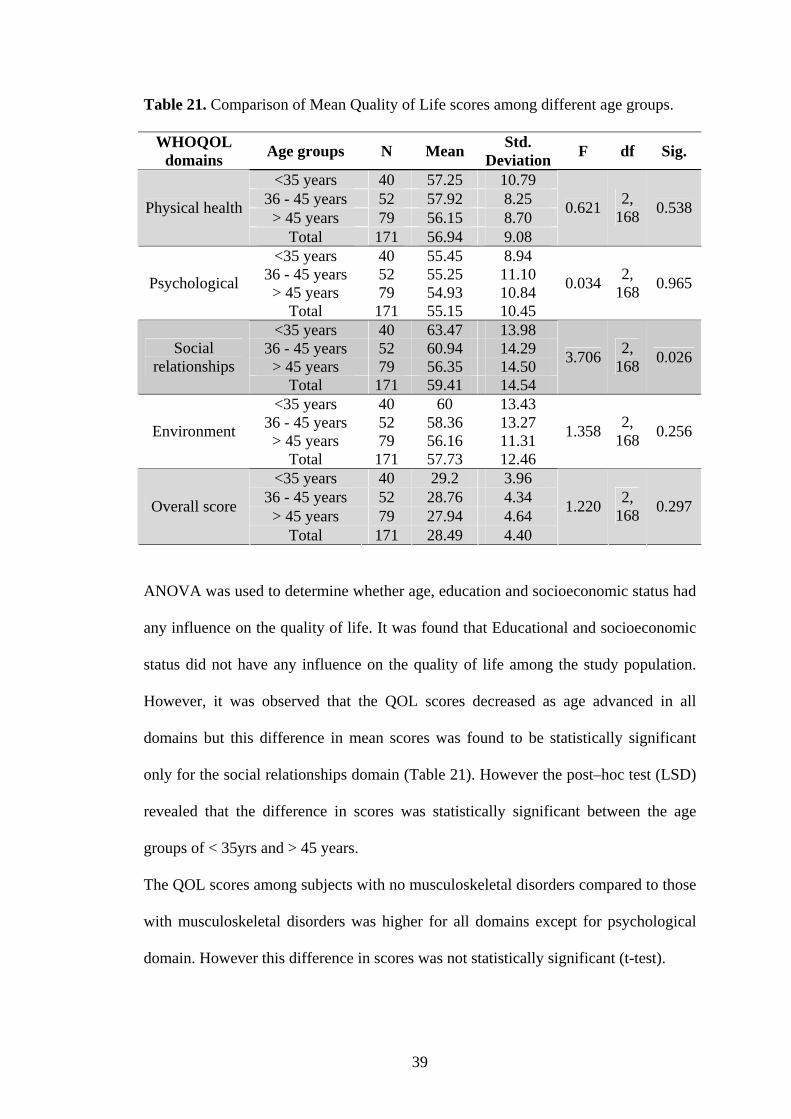
Table 21. Comparison of Mean Quality of Life scores among different age groups.
WHOQOL domains Age groups N Mean Std.
Deviation F df Sig.
<35 years 40 57.25 10.79 36 - 45 years 52 57.92 8.25
> 45 years 79 56.15 8.70 Physical health
Total 171 56.94 9.08
0.621 2, 168 0.538
<35 years 40 55.45 8.94 36 - 45 years 52 55.25 11.10
> 45 years 79 54.93 10.84 Psychological
Total 171 55.15 10.45
0.034 2, 168 0.965
<35 years 40 63.47 13.98 36 - 45 years 52 60.94 14.29
> 45 years 79 56.35 14.50 Social
relationships Total 171 59.41 14.54
3.706 2, 168 0.026
<35 years 40 60 13.43 36 - 45 years 52 58.36 13.27
> 45 years 79 56.16 11.31 Environment
Total 171 57.73 12.46
1.358 2, 168 0.256
<35 years 40 29.2 3.96 36 - 45 years 52 28.76 4.34
> 45 years 79 27.94 4.64 Overall score
Total 171 28.49 4.40
1.220 2, 168 0.297
ANOVA was used to determine whether age, education and socioeconomic status had
any influence on the quality of life. It was found that Educational and socioeconomic
status did not have any influence on the quality of life among the study population.
However, it was observed that the QOL scores decreased as age advanced in all
domains but this difference in mean scores was found to be statistically significant
only for the social relationships domain (Table 21). However the post–hoc test (LSD)
revealed that the difference in scores was statistically significant between the age
groups of < 35yrs and > 45 years.
The QOL scores among subjects with no musculoskeletal disorders compared to those
with musculoskeletal disorders was higher for all domains except for psychological
domain. However this difference in scores was not statistically significant (t-test).
39
6. DISCUSSION
This study was conducted on 171 rubber tappers to assess their health status and
quality of life.
Socio-demographic characteristics
The average age of the study population was 42.98 years and the ages ranged from 23
– 58 years. KFDC employed individuals over the age of 18 and age of retirement is 58
years. This is because of the strict implementation of the Child Labor (Prohibition and
Regulation) Act [Act No. 61, 1986]. (44) But in a study done by C Nancy et al (12)
among rubber tappers in Indonesia the age ranged from 33 – 40 years.
The proportion of females (70.2%) was greater than males (29.8%) in this study
which was in contrast to the study done by T V Ushadevi et al (11) among rubber
tappers in Kerala where only 4% of the tappers were women. This is because the work
type, salary and timings in the KFDC plantations are fixed and the hired farm workers
employed by the KFDC finish work by 2 pm in the afternoon. This allows the women
to return home early and take care of the children and household chores. The men do
work but on rubber farms owned by private owners.
In the present study 8.8% were illiterates and 5.3% had qualifications of SSLC and
above which was lower compared to the study done by T.V.Ushadevi et al (11) where
4.5% were illiterates and 8.5% of tappers had educational qualifications of SSLC and
above. This may be because of the known fact that literacy rates in Kerala are high.
The level of education was also higher among rubber tappers in Indonesia where none
were illiterates and 29.5% had qualifications above high school level.
Majority (40.93%) of the rubber tappers belonged to the upper middle class based on
the BG Prasad’s classification (43) for socioeconomic status in rural India. Rubber
40
tapping was the major source of income in the present study but 7.7% of the tappers
had other sources of income ranging from working as daily wage hired farm workers
in other private farms and masonry. This was lower compared to other studies. (11, 12)
Indonesian rubber tappers in the study by C Nancy et al (12) described 59.66% had
secondary jobs ranging from farming, mechanic, carpenter, brick maker and livestock
raiser. Ushadevi et al (11) reported that 45.8% tappers had other sources of income
which were agriculture, animal husbandry and casual labor. Loans were availed by
74.85% in the present study whereas in a study done by T.V.Ushadevi et al (11) 86.5%
were indebted.
Substance abuse was seen in 29.82% of the study population. Tobacco in either
smoke or chewable form was the most common substance abused by 22.21%
followed by alcohol (14.61%). NFHS 3 (13) reported 0.1% of females and 28.7%
males were smoking, 6.0% females and 25.8% males were chewing tobacco, paan, or
gutkha and 1.5% females and 27.5% males were consuming alcohol in rural
Karnataka. Comparing this with the present study all findings was similar except for
higher consumption of alcohol by males (45.1%).
Living conditions
All the households in the present study had electricity and improved source of water
supply whereas only 84% households had electricity and 85% had improved source of
drinking water in rural Karnataka according to NFHS 3. (13) Treatment of drinking
water was lower in the present study (22.96%) compared that of rural Karnataka
(43%). Nationwide about 25% of households had improved sources of drinking water
and 33% treat their drinking water.
41
All houses were semi-pucca (Annexure V). NFHS-3 (13) reported 55% lived in semi-
pucca houses in rural Karnataka. Outdoor defecation was practiced by 11.85%
whereas NFHS-3 (13) reported outdoor defecation to be 78% in rural Karnataka.
NFHS-3 (13) reported 87.8% used wood, 7.9% used LPG and 1.5% used kerosene as
cooking fuel in rural Karnataka. But in the present study all households use firewood
as their main source of cooking fuel, of which 25.19% use gas and 2.22% use
kerosene as additional sources of cooking fuel. There is a risk of smoke accumulating
in the houses. Adding to this 44.44% of study subjects lived in ill ventilated houses,
47.36% in houses with inadequate natural lighting and 43.7% lived in overcrowded
conditions. This exposes the inmates of the households to various respiratory
disorders.
Occupation related observations
In the present study 50.87% had a work experience of >20 years but C Nancy et al (12)
reported that 7.25% of the sample Indonesian rubber tappers had a work experience of
more than 20 years.
Walking was the main means of transport for 83%. Distance to the allotted plantation
block was more than 6 kilometers two-way for 55% of the study population. Among
those who walked to work, nearly half (46.5%) of them walked more than 6
kilometers to work and back home.
In the study done by T.V.Ushadevi et al (11) in Kerala (2001) among rubber tappers,
24.5% of rubber tappers use head light while tapping whereas only 7.6% in the
present study used head light. It is essential to use head light as all tappers are
exposed to working under poor light during early hours. This is the time when
42
pressure of the latex vessels in the rubber trees is highest helping in maximum
productivity.
The present study revealed that 45.6% adopted a leaning forward posture and 54.6%
adopted a standing posture while tapping rubber. But it is important to consider that
posture is decided by the part of the tree which is being tapped rather than the
individuals’ preferred posture.
Myopia was common among those rubber tappers who work at a distance <30
centimeters between eyes and work area. This was not statistically significant. But
Doyne (25) demonstrated that myopia was common among those engaged in near
work. Therefore attention must be drawn to this fact and necessary precautions must
be adopted.
It is important to use Personal Protective Equipments (PPE) in the rubber tapping
occupation like gloves to avoid injuries from knives. It was observed that none of the
tappers were using any kind of protective equipments.
Health profile
The health status was perceived as good by 74.85% of tappers and by 7% as poor.
Only 1.16% felt their health status was excellent.
.NFHS 3 (13) reported that among adults in rural Karnataka over 37% were
underweight, and 15% of women and 11% of men were overweight or obese. Only
49% of women and 55% of men were at a healthy weight for their height. In the
present study 26.90% were underweight and 19.61% of women and 11.76% of men
were overweight or obese. Only 51.66% of women and 66.66% of men were at a
healthy weight for their height. Both underweight and obesity were a problem in
females.
43

Musculoskeletal disorders were the most common disorder observed in 29.4% male
and 30.8% female in the present study. In the study conducted by Villarejo D et al (28)
on agricultural workers, 41% male and 40% female workers reported musculoskeletal
disorders which were higher.
Accidents at work within the last year were reported by 39 tappers at a rate of 228
injuries/1000 workers per year. Gordon J E (20) in Punjab (1962) studied that traumatic
accidents among farm workers and reported 116 injuries/1000 workers per year which
is much lesser than what was observed in our study. A study was carried out in
Madhya Pradesh (Central India) by Tiwari P S et al (21) from 1995-1999 reported an
overall incidence of 1.25 injuries/1000 workers/year agricultural injuries. This was
also lesser than what was observed in our study. A farm workplace injury during the
twelve-month period was reported as 40/1000 workers by WHO (1985) (18) which is
also lesser than our study. The high number of accidents at work in the present study
may be attributed to the non use of PPE. Skin lesions mainly dermatitis and callosity
was observed in 10.5% of the population. This can also be because none of the rubber
tappers use gloves while tapping.
Abortions were reported in 11.7% and stillbirths in 3.3% among the ever-married
women who were part of the present study. According to the study conducted by C U
Thersia (14) in Kerala among agricultural workers in 2004 revealed that 20.6% of the
ever-married women had undergone abortions, higher than our study. Stillbirths were
reported in 2.4% of them which is lesser than our study. Of the 118 ever-married
women 5.93% were nulliparous and 47.46% had >2 children whereas the NFHS 3 (13)
reported that 28.8% had a birth order of >2 among women in rural Karnataka. This
may be attributed to the finding that 57.69% of women who were currently married
44
had not been practicing any method of contraception at the time of our study which
was higher compared to the NFHS 3 (13) report where 36% currently married women
were not using any methods of contraception in rural Karnataka.
Quality of life
A WHO (38) report (1995) predicted that sick participants would report poorer QOL
than well participants but no predictions were made for other socio-demographic
differences. But in the present study, socio-demographic characteristics like gender
and age showed significant differences in QOL. Males had higher scores for physical
and environment domains. Also it was observed that the QOL scores decreased as age
advanced in all domains but this difference in mean scores was found to be
statistically significant only for the social relationships domain.
45

7. CONCLUSION
Some issues of concern to the health of rubber tappers were revealed in the present
study. Musculoskeletal disorders were more common among those making > 2 visits
to the shed carrying load manually and among those with a work experience of > 20
years in the rubber tapping occupation. Other environmental and occupational health
issues are relevant for future interventions or further studies. Analysis has
demonstrated that Body mass Index, oral lesions, skin lesions and work place injuries
as also, working in hot humid weather, long hours of work with odd postures, long
distance of travel with load etc. are some issues of concern.
Some of the results may provide an opportunity to collaborate with local and state
institutions to develop and test health and safety interventions. Studies such as this
may influence community awareness about important issues and prime people to take
action to promote health.
This study is unique in that in addition to describing demographic & socioeconomic
characteristics and health of rubber tappers it brings out certain occupational and
environmental issues, of an occupation about which not many studies are published.
In addition to its strengths, this study had a number of limitations.
• As there were not many published studies on health status of Rubber Tappers,
it was necessary to review other similar studies on similar occupations (Farm
workers, Plantation workers etc).
• Lighting noise level and temperature at workplace were not measured but the
perceptions of the workers were recorded.
46
8. SUMMARY
Very few studies are available regarding the rubber tappers health status. In this
background, an exploratory epidemiological study was carried out with the objectives
to describe socio-demographic profile, living, and working environment of rubber
tappers and also to assess their health profile and quality of life. The total population
of rubber tappers fulfilling the inclusion criteria living in the four colonies randomly
selected was included in the study. There were a total of 171 rubber tappers living in
135 households who were surveyed by house-to-house visit. Necessary information
was obtained by interviewing the rubber tappers using a semi-structured pre-tested
questionnaire and conducting a thorough clinical examination. The rubber tappers
were subjected to QOL-BREF questionnaire for assessment for QOL. The data was
compiled and analyzed using SPSS software.
Among the 171 individuals, 120 (70.2%) were females and 51 (29.8%) were males.
Illiteracy was seen in 8.8% and educational qualification more than high school level
was observed in 5.3% of the population. Majority, 40.9% belonged to BG Prasad’s
socioeconomic class III. Body mass index for 43.86% of the subjects was not ideal
where 26.9% were underweight and 16.96% were overweight. Tobacco abuse in
either smoke or chewable form was the highest substance abused by 22.21% and
alcohol was consumed by 14.61% of the population. All individuals were exposed to
domestic indoor air pollution as firewood was the main source of cooking fuel. There
was no sanitation facility at the workplace for 87.1% of the population and in 11.85%
of households. Only 22.96% households treated water prior to drinking. The
prevalence of musculoskeletal disorders among the study population was 30.4%. This
was found to be associated with the number of years of experience in the rubber
47
tapping occupation and the number of visits made by a rubber tapper with manual
load. Only 7.6% were using headlights at work. Accidents at work were experienced
by 22.8% of the subjects. There was no use of boots and gloves by any of the subjects.
Myopia was present in 14% which was more common among those engaged in near
work but was not statistically significant. High blood pressure was observed in 9.35%
and skin lesions were present in 10.5% of the subjects. Among the ever-married
women abortions were reported in 11.7% and stillbirths in 3.3%. The mean QOL
score was highest for social relationships domain followed by environment domain,
physical health and psychological domains. Males had higher mean QOL scores for
physical and environment domains which was statistically significant. It was observed
that the QOL scores decreased as age advanced but was found to be statistically
significant only for the social relationships domain.
48
9. RECOMMENDATIONS
1. Preventive measures to curb musculoskeletal disorders through IEC and by
organizing group exercise activities.
2. Health education to effectively address alcohol and other substance abuse.
3. At the individual level, clinicians may need to spend more time with workers
to teach them about the unique risks they face at work and approaches they
can take to mitigate those risks.
4. Understanding different levels of concern about environmental and
occupational health risks that exist within a workforce or community may
allow for more effective research studies, educational materials, and
occupational and environmental risk reduction interventions to be developed.
5. Similar studies involving larger samples and geographical areas are needed for
generalization of the results.
49
10. BIBLIOGRAPHY
1. Melvin L Meyers, I T Cabrera. Agriculture and Natural resources based
industries. Encyclopedia of Occupational health and Safety. Volume 3, 4th
edition. International Labor Organization: 1998.
2. Don Villarejo, Marc B. Schenker. The Health of Hired Farmworkers. Maxcy-
Rosenau-Last Public Health & Preventive Medicine. 15th edn. McGraw-Hill:
2008; 819.
3. T.A.Lloyd Davies. The practice of industrial Medicine. 2nd edition. 1957: 1;
1-2.
4. WHO. Epidemiology of Occupational Health. Geneva. World Health
Organisation: 1985; 69.
5. Alan Echt. Chemical Industries: Rubber tree cultivation in Rubber Industry.
Encyclopedia of Occupational health and Safety. Volume 3. 4th edition.
Geneva .International Labor Organization: 1998.
6. V. Suryanarayan. National Seminar on International Treaties, Federalism and
Indian Constitution organized by the Institute of Parliamentary Affairs,
Government of Kerala in Malabar Christian College, Kozhikode on February
4-5, 2010. Available from: http://www.srilankaguardian.org/2010/02/indias-
bilateral-agreements-and-centre.html. Accessed on June.2009.
7. Rubber wing, Karnataka Forest Development Corporation 2002, Available at:
http://www.kfdcl.com/rubber.asp, Accessed on July 2009.
8. K.Park. Occupational health. Park’s textbook of Preventive and Social
Medicine. 20 ed. Jabalpur. Banarsidas Bhanot Publishers: 2009; 708.th
50
9. Francis Bacon. Quotes. 14th century English philosopher, Parliamentarian and
Attorney General. Available at URL http://www.quotes.net/quotes/R/1.
Accessed on October 2009.
10. Ramazzini B. Diseases of Workers (translated from Latin text, De Morbis
Artificum), Wright WC (trans). New York, London. Hafner Publishing Co,:
1964; 14.
11. T.V.Ushadevi, V.N.Jayachandran. Socio-economic profile of rubber tappers in
the small holding sector. A study at kanjirappally panchayath. Final Report. A
project of Kerala Research Programme on Local Level Development
(KRPLLD). Centre for Development Studies: Thiruvananthapuram; 2001.
12. C Nancy, C Anwar, U Junaedi, S Hehdratno. Availability and welfare of
rubber tappers. Indonesian J. Nat. Rubb. Res. 1997; 15(1): 23- 41.
13. International Institute for Population Sciences (IIPS) and Macro International.
National Family Health Survey (NFHS-3), India, 2005-06: Karnataka.
Mumbai: IIPS; 2008.
14. C U Thersia. Women workers in Agriculture: Gender discrimination, working
conditions, and health status. A discussion paper. Kerala Research Programme
on Local Level Development (KRPLLD). Centre for Development Studies:
Thiruvananthapuram; 2004.
15. ILO. Maximum Weight Convention. International Labor Organization.
Geneva 1967. Available at URL http://www.ilo.org/ilolex/cgilex/
convde.pl?C127. Accessed on October 2009.
16. Mazza JJ, Lee BC, Gunderson PD, Stueland DT. Rural health care providers’
educational needs related to agricultural exposures. Journal of Agricultural
Health and Safety 1997; 3(4): 207-215.
51
17. NRCIM. Panel on Musculoskeletal Disorders and the Workplace Commission
on Behavioral and Social Sciences and Education. National Research Council
and Institute of Medicine. National Academy Press,Washington.D.C.:2001; 37
18. WHO. Identification and control of work related diseases. Technical Report
Series 714. World Health Organisation : Geneva; 1985.
19. Mohamad Bakri, Abdullah, Wan Salleh. The effects of age, sex and tenure on
the job performance of rubber tappers. Journal of Occupational and
Organizational Psychology 1991; 9: 128-130.
20. Gordon J.E, Gulari P.V, Wayon J.B. Traumatic accidents in rural tropical
regions: An epidemiological field study in Punjab, India. American Journal of
the Medical Sciences 1962; 243: 158–178.
21. Tiwari, P.S., Gite, L.P., Dubey, A.K., Kot, L.S. Agricultural injuries in Central
India: nature, magnitude, and economic impact. Journal of Agricultural Safety
and Health 2002; 8: 95–111.
22. Umar, H.Y., I.K. Ugwa, M. Abubakar and D.Y. Giroh. Analysis of bites and
stings by snakes, insects and other animals among rubber (Hevea brasiliensis)
tappers in Southern Nigeria. J Agr Soc Sci 2008; 4: 174–76.
23. BP Bernard. Musculoskeletal Disorders and Workplace Factors. National
Institute for Occupational Safety and Health: Cincinnati OH; 1997a.
24. Baron S, Estill C, Steege A, Lalich N. Simple solutions: Ergonomics for farm
workers. Cincinnati OH: US National Institute for Occupational Safety and
Health, (in press 2001).
25. Bobick TG and Meyers JR. Agriculture-related sprain and strain injuries.
International Journal of Industrial Ergonomics 1994; 14: 223-232.
52
26. Bureau of Labor Statistics. Occupational Injuries and Illnesses: Counts, Rates
and Characteristics, 1997. Washington DC: US Department of Labor, BLS,
1999.
27. Brooks P. Repetitive strain injury. BMJ (November 1993); 307 (6915): 1298.
28. Villarejo D, McCurdy SA. The California Agricultural Workers Health
Survey. J Agric Saf Health 2008 ; 14(2):135-46.
29. Doyne P.G. The myopic child. Clin. J. (1923).52: 157.
30. Bruce N, Perez-Padilla R, Albalak R. Indoor air pollution in developing
countries: a major environmental and public health challenge. Bull WHO
2000: 78 (9): 1078–1092.
31. Anon. Indoor pollution due to biomass fuels, World Resources Report. The
World Resources Institute. The United Nations Environment Programme. The
United Nations Development Programme. The World Bank, 1998-99.
32. Howell JM, Smith EOS. An agricultural accident survey in Alberta. Can J
Public Health 1973; 64: 36-43.
33. Wood-Dauphine S. Assessing quality of life in clinical research: From where
have we come and where are we going? J Clin Epidemiol 1999; 52: 355–363.
34. McHorney CA. Health status assessment methods for adults: Past
accomplishments and future challenges. Ann Rev Public Health 1999; 20:
309–335.
35. Muldoon MF, Barger SD, Flory JD, Manuck SB. What are quality of life
measurements measuring? Br Med J 1998; 316: 542–545.
36. Guyatt GH, Naylor CD, Juniper E, et al. Users’ guide to the medical literature
XII: How to use articles about health–related quality of life. J Am Med Assoc
1997; 277: 1232–1237.
53
37. WHOQOL Group. Development of the WHOQOL: Rationale and current
status. Int J Mental Health 1994; 23: 24–56.
38. WHOQOL Group. The World Health Organization Quality of Life assessment
(WHOQOL): Position paper from the World Health Organization. Soc Sci
Med 1995; 41: 1403– 1409.
39. WHOQOL Group. The World Health Organization Quality of Life assessment
(WHOQOL): Development and general psychometric properties. Soc Sci Med
1998a; 46: 1569–1585.
40. WHOQOL Group. Development of the World Health Organization
WHOQOL-BREF quality of life assessment. Psychol Med 1998b; 28: 551–8.
41. Skevington SM. Measuring quality of life in Britain: Introducing the
WHOQOL-100. J Psychosom Res 1999; 47: 5449–5459.
42. WHO. The World Health Organisation Quality of Life (WHOQOL) - BREF
2004. Available from URL http://www.who.int/substance_abuse/research
_tools/en/english_whoqol.pdf. Accessed on December 2008
43. M.C Gupta, B.K Mahajan. Social environment. Textbook of Preventive and
Social Medicine.3rd edition. Delhi: Jaypee brothers medical publishers; 2003:
117-18.
44. Legislations, National Institute of Health and Family Welfare. Available from
URL http://nihfw.org/NDC/DocumentationServices/Legislations.html.
Accesed on April 2009.
45. B.S.Chimni. The Meaning of Words and the Role of UNHCR in Voluntary
Repatriation. International Journal of Refugee Law; 5 (3): 442-460.
46. K Park. Environment and health. Park’s textbook of Preventive and Social
Medicine. 19th edition. Jabalpur: Banarsidas Bhanot Publishers; 2007: 608.
54
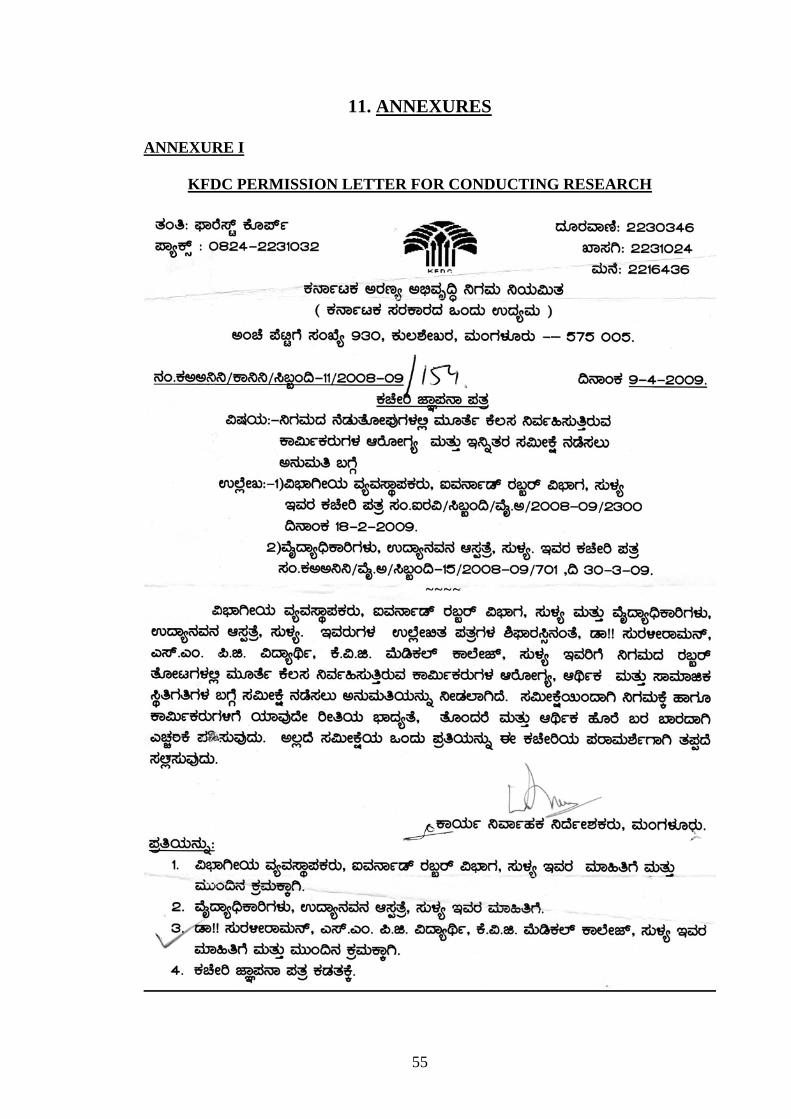
11. ANNEXURES
ANNEXURE I
KFDC PERMISSION LETTER FOR CONDUCTING RESEARCH
55
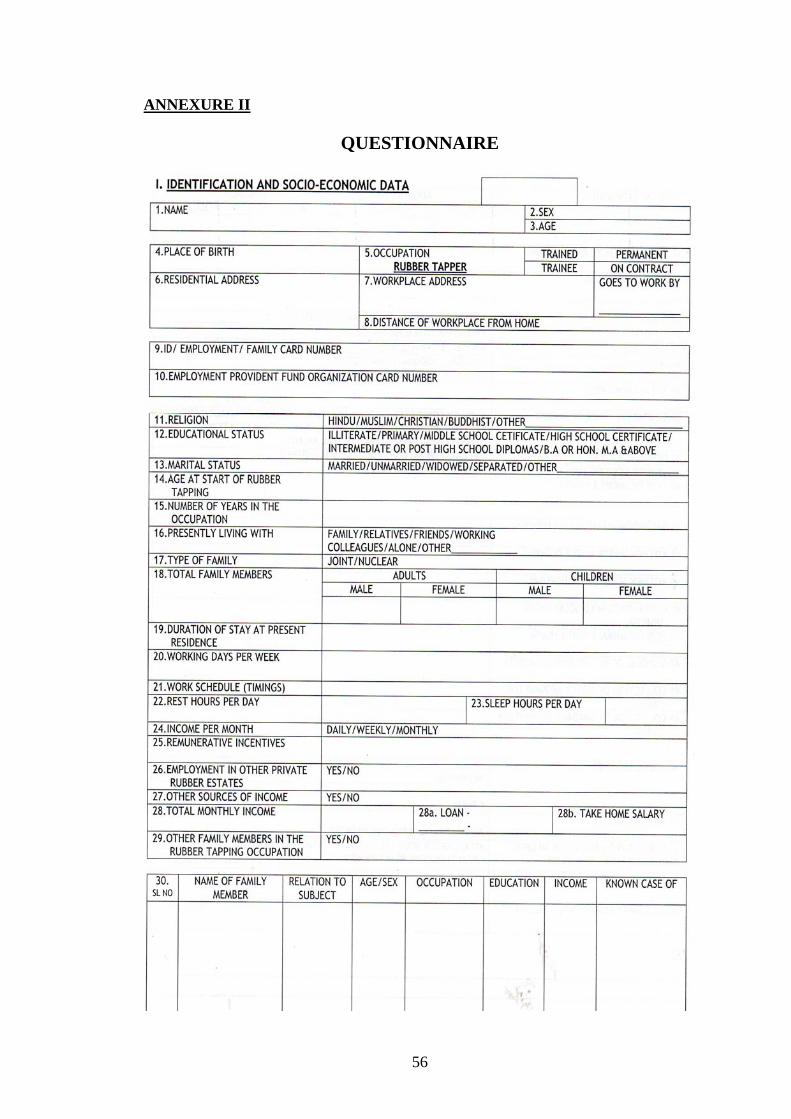
ANNEXURE II
QUESTIONNAIRE
56
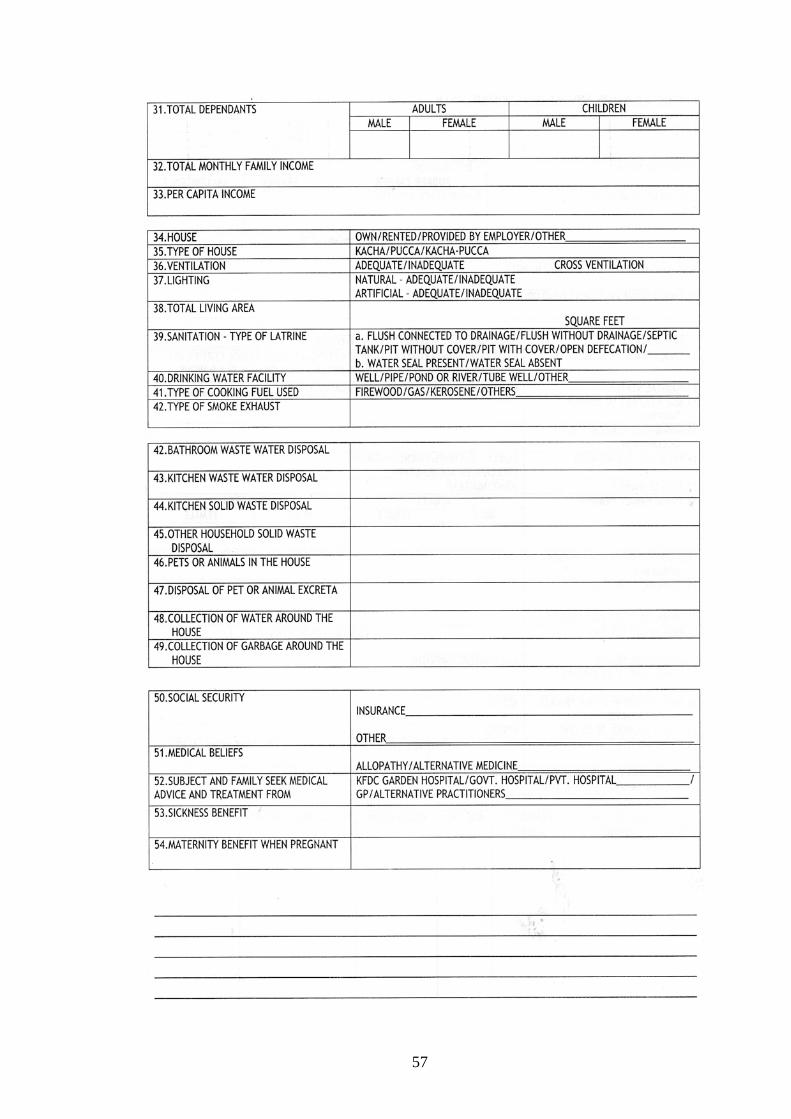
57
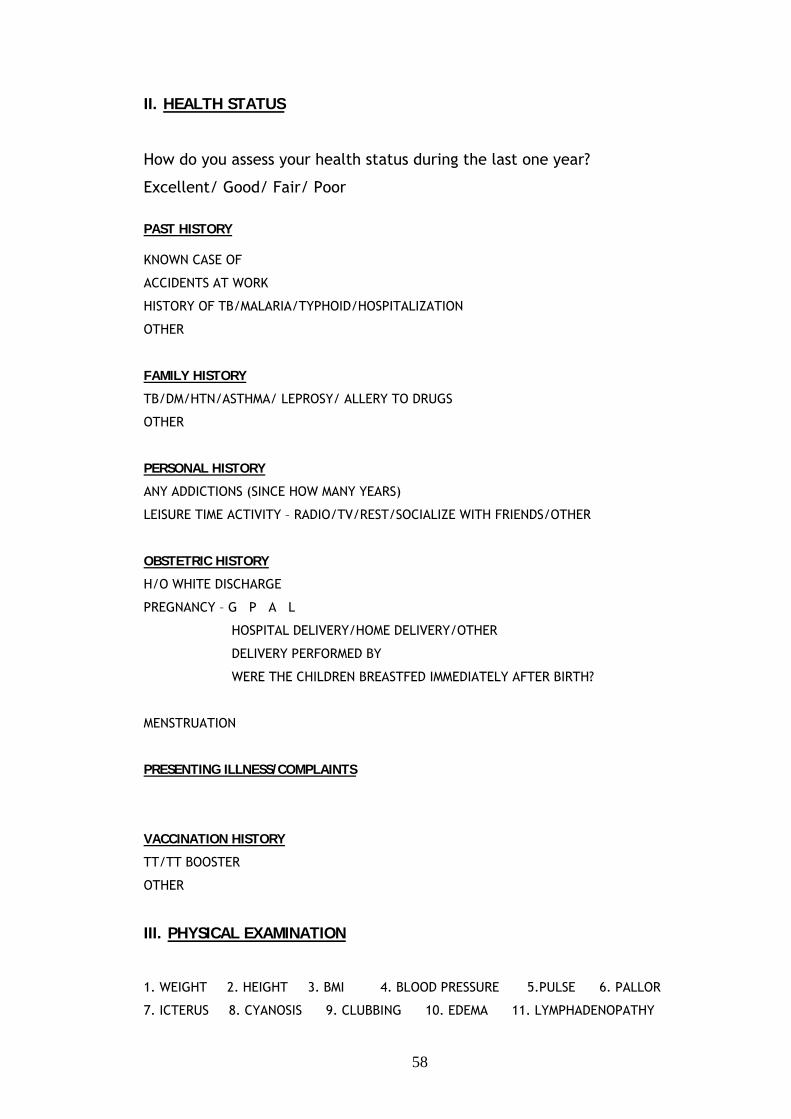
II. HEALTH STATUS
How do you assess your health status during the last one year?
Excellent/ Good/ Fair/ Poor
PAST HISTORY KNOWN CASE OF
ACCIDENTS AT WORK
HISTORY OF TB/MALARIA/TYPHOID/HOSPITALIZATION
OTHER
FAMILY HISTORY
TB/DM/HTN/ASTHMA/ LEPROSY/ ALLERY TO DRUGS
OTHER
PERSONAL HISTORY
ANY ADDICTIONS (SINCE HOW MANY YEARS)
LEISURE TIME ACTIVITY – RADIO/TV/REST/SOCIALIZE WITH FRIENDS/OTHER
OBSTETRIC HISTORY
H/O WHITE DISCHARGE
PREGNANCY – G P A L
HOSPITAL DELIVERY/HOME DELIVERY/OTHER
DELIVERY PERFORMED BY
WERE THE CHILDREN BREASTFED IMMEDIATELY AFTER BIRTH?
MENSTRUATION
PRESENTING ILLNESS/COMPLAINTS
VACCINATION HISTORY
TT/TT BOOSTER
OTHER
III. PHYSICAL EXAMINATION
1. WEIGHT 2. HEIGHT 3. BMI 4. BLOOD PRESSURE 5.PULSE 6. PALLOR
7. ICTERUS 8. CYANOSIS 9. CLUBBING 10. EDEMA 11. LYMPHADENOPATHY
58
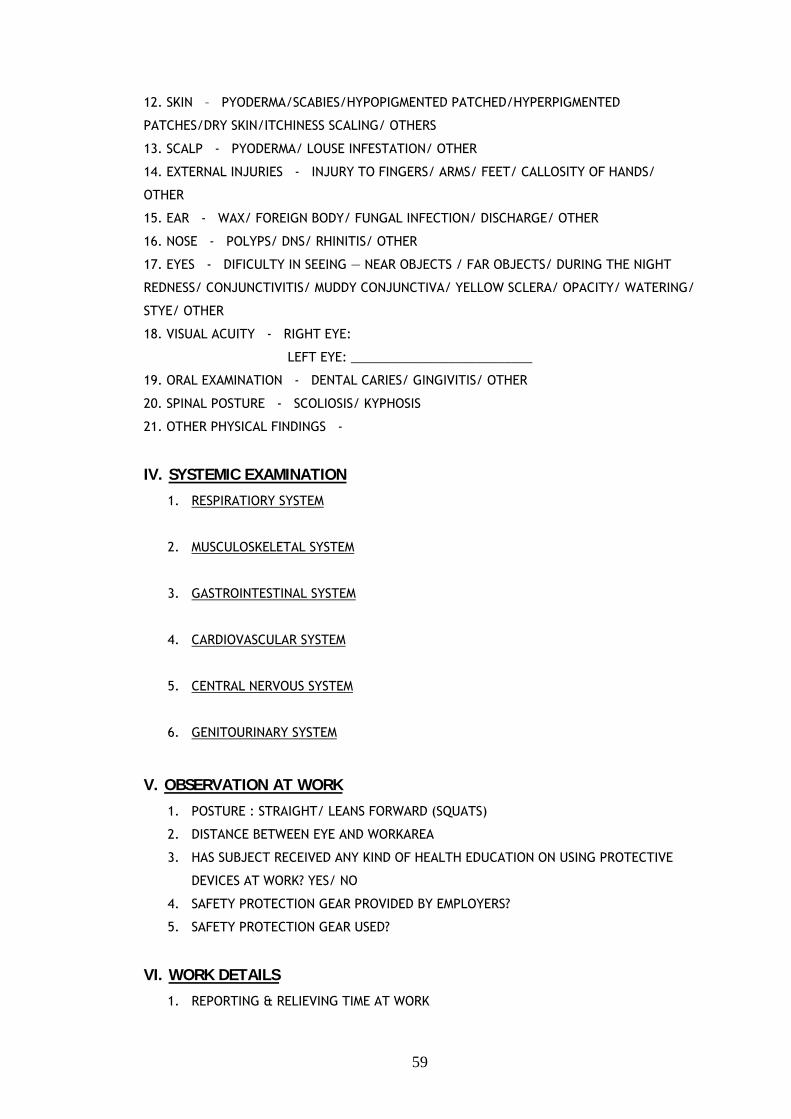
12. SKIN – PYODERMA/SCABIES/HYPOPIGMENTED PATCHED/HYPERPIGMENTED
PATCHES/DRY SKIN/ITCHINESS SCALING/ OTHERS
13. SCALP - PYODERMA/ LOUSE INFESTATION/ OTHER
14. EXTERNAL INJURIES - INJURY TO FINGERS/ ARMS/ FEET/ CALLOSITY OF HANDS/
OTHER
15. EAR - WAX/ FOREIGN BODY/ FUNGAL INFECTION/ DISCHARGE/ OTHER
16. NOSE - POLYPS/ DNS/ RHINITIS/ OTHER
17. EYES - DIFICULTY IN SEEING ― NEAR OBJECTS / FAR OBJECTS/ DURING THE NIGHT
REDNESS/ CONJUNCTIVITIS/ MUDDY CONJUNCTIVA/ YELLOW SCLERA/ OPACITY/ WATERING/
STYE/ OTHER
18. VISUAL ACUITY - RIGHT EYE:
LEFT EYE: __________________________
19. ORAL EXAMINATION - DENTAL CARIES/ GINGIVITIS/ OTHER
20. SPINAL POSTURE - SCOLIOSIS/ KYPHOSIS
21. OTHER PHYSICAL FINDINGS -
IV. SYSTEMIC EXAMINATION
1. RESPIRATIORY SYSTEM
2. MUSCULOSKELETAL SYSTEM
3. GASTROINTESTINAL SYSTEM
4. CARDIOVASCULAR SYSTEM
5. CENTRAL NERVOUS SYSTEM
6. GENITOURINARY SYSTEM
V. OBSERVATION AT WORK
1. POSTURE : STRAIGHT/ LEANS FORWARD (SQUATS)
2. DISTANCE BETWEEN EYE AND WORKAREA
3. HAS SUBJECT RECEIVED ANY KIND OF HEALTH EDUCATION ON USING PROTECTIVE
DEVICES AT WORK? YES/ NO
4. SAFETY PROTECTION GEAR PROVIDED BY EMPLOYERS?
5. SAFETY PROTECTION GEAR USED?
VI. WORK DETAILS
1. REPORTING & RELIEVING TIME AT WORK
59
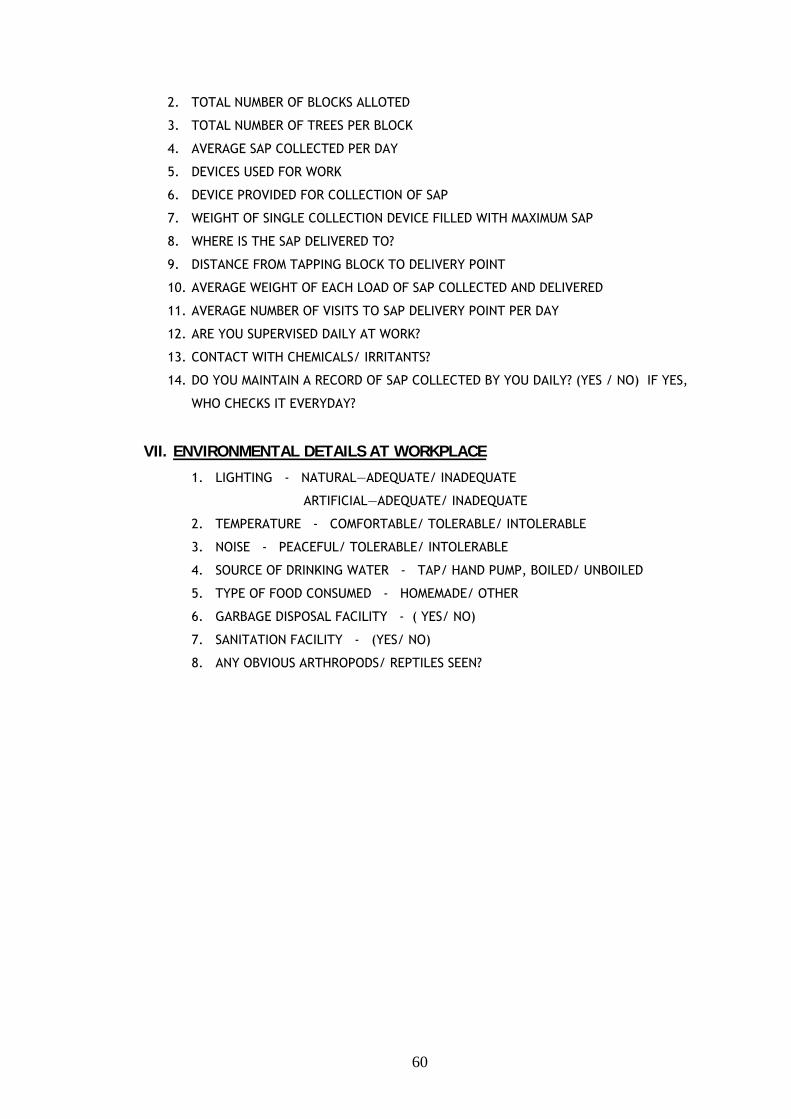
2. TOTAL NUMBER OF BLOCKS ALLOTED
3. TOTAL NUMBER OF TREES PER BLOCK
4. AVERAGE SAP COLLECTED PER DAY
5. DEVICES USED FOR WORK
6. DEVICE PROVIDED FOR COLLECTION OF SAP
7. WEIGHT OF SINGLE COLLECTION DEVICE FILLED WITH MAXIMUM SAP
8. WHERE IS THE SAP DELIVERED TO?
9. DISTANCE FROM TAPPING BLOCK TO DELIVERY POINT
10. AVERAGE WEIGHT OF EACH LOAD OF SAP COLLECTED AND DELIVERED
11. AVERAGE NUMBER OF VISITS TO SAP DELIVERY POINT PER DAY
12. ARE YOU SUPERVISED DAILY AT WORK?
13. CONTACT WITH CHEMICALS/ IRRITANTS?
14. DO YOU MAINTAIN A RECORD OF SAP COLLECTED BY YOU DAILY? (YES / NO) IF YES,
WHO CHECKS IT EVERYDAY?
VII. ENVIRONMENTAL DETAILS AT WORKPLACE
1. LIGHTING - NATURAL―ADEQUATE/ INADEQUATE
ARTIFICIAL―ADEQUATE/ INADEQUATE
2. TEMPERATURE - COMFORTABLE/ TOLERABLE/ INTOLERABLE
3. NOISE - PEACEFUL/ TOLERABLE/ INTOLERABLE
4. SOURCE OF DRINKING WATER - TAP/ HAND PUMP, BOILED/ UNBOILED
5. TYPE OF FOOD CONSUMED - HOMEMADE/ OTHER
6. GARBAGE DISPOSAL FACILITY - ( YES/ NO)
7. SANITATION FACILITY - (YES/ NO)
8. ANY OBVIOUS ARTHROPODS/ REPTILES SEEN?
60
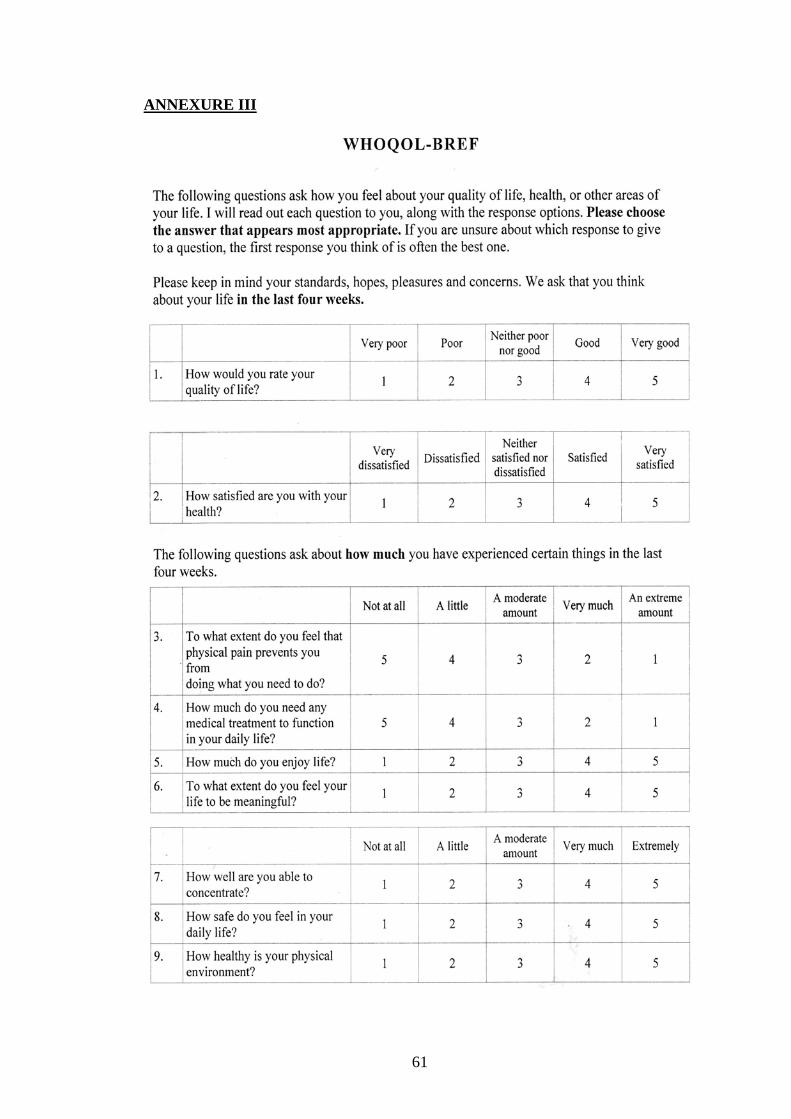
ANNEXURE III
61
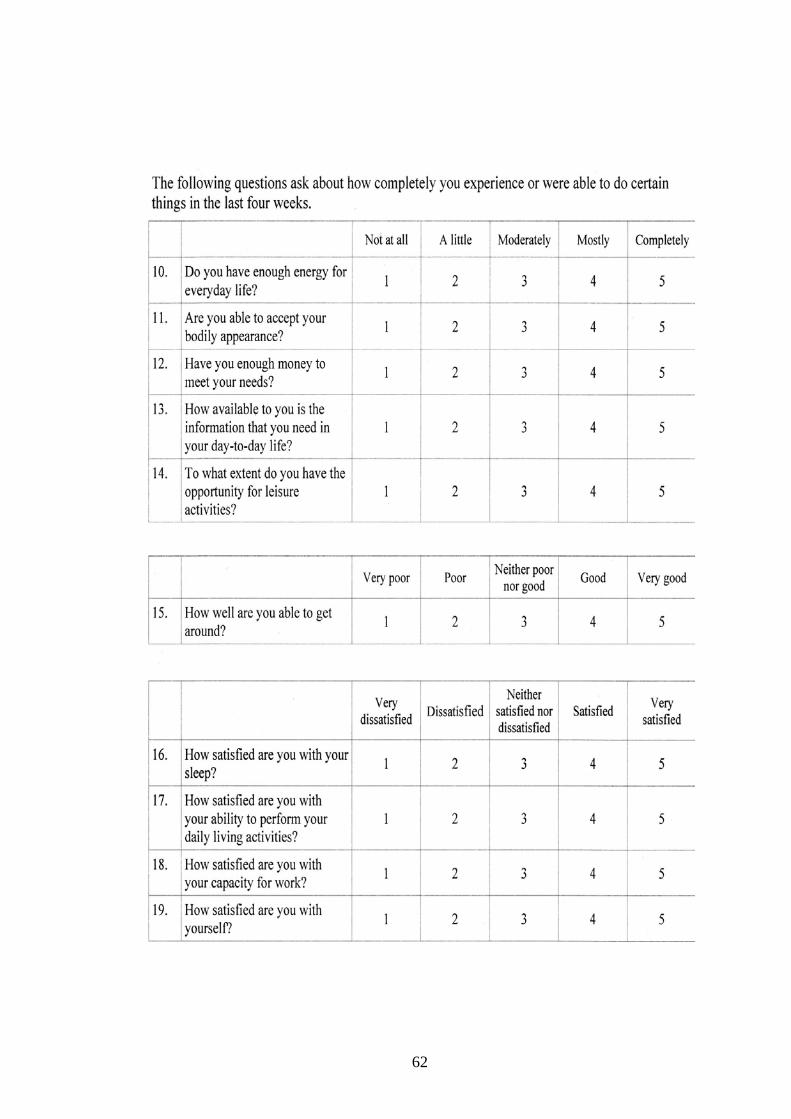
62
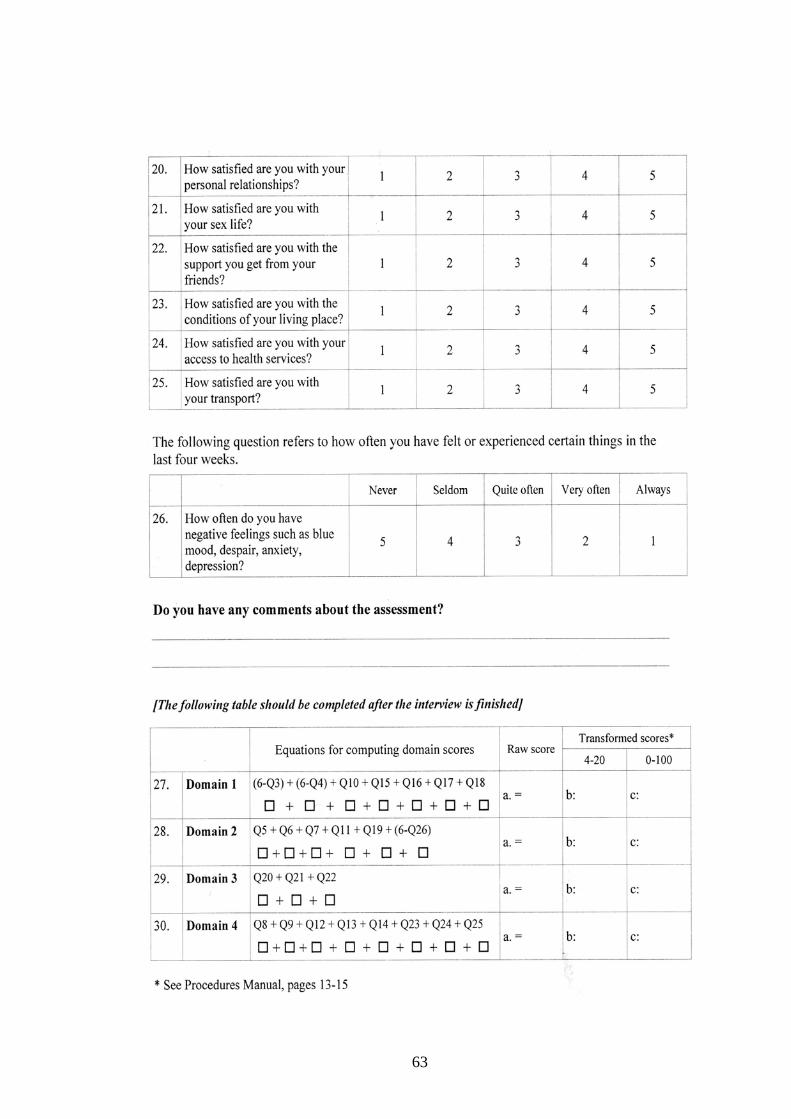
63
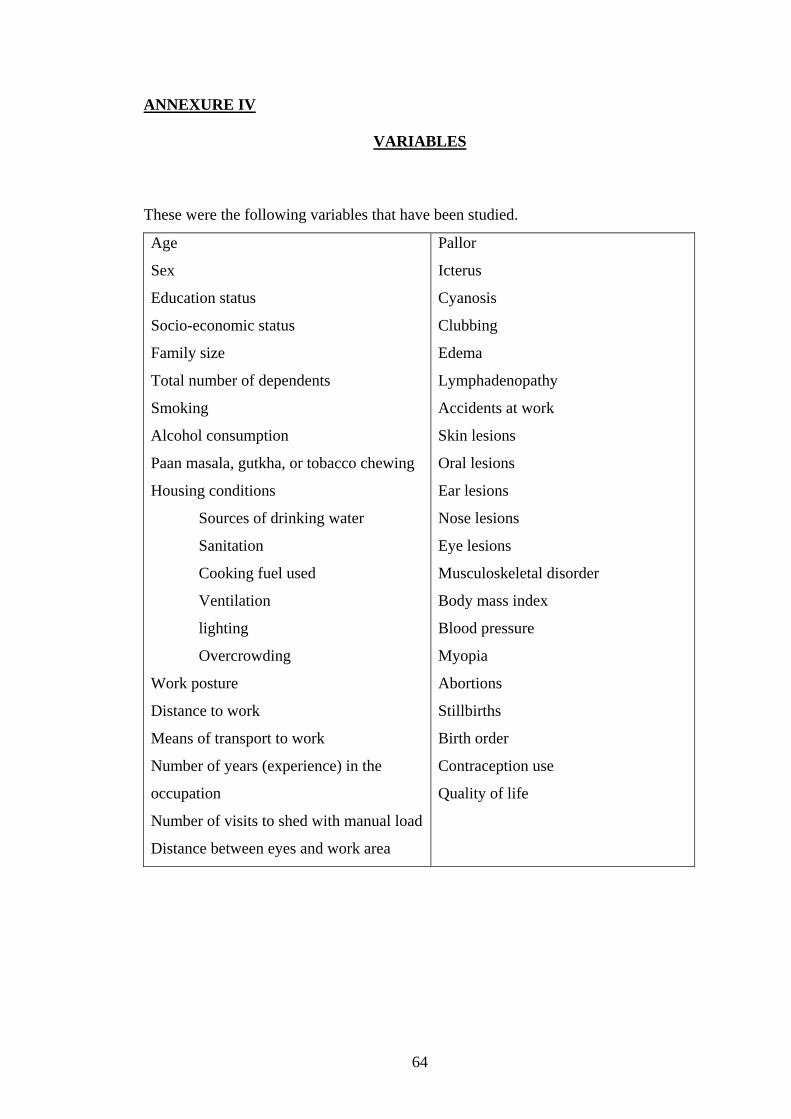
ANNEXURE IV
VARIABLES
These were the following variables that have been studied.
Age
Sex
Education status
Socio-economic status
Family size
Total number of dependents
Smoking
Alcohol consumption
Paan masala, gutkha, or tobacco chewing
Housing conditions
Sources of drinking water
Sanitation
Cooking fuel used
Ventilation
lighting
Overcrowding
Work posture
Distance to work
Means of transport to work
Number of years (experience) in the
occupation
Number of visits to shed with manual load
Distance between eyes and work area
Pallor
Icterus
Cyanosis
Clubbing
Edema
Lymphadenopathy
Accidents at work
Skin lesions
Oral lesions
Ear lesions
Nose lesions
Eye lesions
Musculoskeletal disorder
Body mass index
Blood pressure
Myopia
Abortions
Stillbirths
Birth order
Contraception use
Quality of life
64
ANNEXURE V
OPERATIONAL DEFINITIONS
HEALTH STATUS: was assessed
1. as perceived and reported by the rubber tappers.
2. based on history and clinical examination.
REPATRIATE: Any individual who by informed choice returns to his or her country
of origin in conditions of safety and dignity. (45)
FAMILY SIZE: It is defined as total number of biologically related family members,
adults and children under one roof and sharing the same kitchen. It reflects the
standard of living and over crowding in the house.
ANTHROPOMETRICS MEASUREMENTS
a) WEIGHT
It is measurement of total body mass using a portable Krups flat spring balance
weighing scale and recorded in kilograms.
b) HEIGHT
It is measure of linear growth and recorded in centimeters. Height was recorded on a
plane vertical wall. Subject’s shoes, footwear were removed and person was made to
stand parallel with heels, buttocks, shoulders and back of head touching the upright
surface. The head was held comfortably erect and the height was marked on the wall
with help of right angled, touching the top of head horizontally with its side flat
against the wall. Height was then measured in centimeters using a tailor’s tape.
65
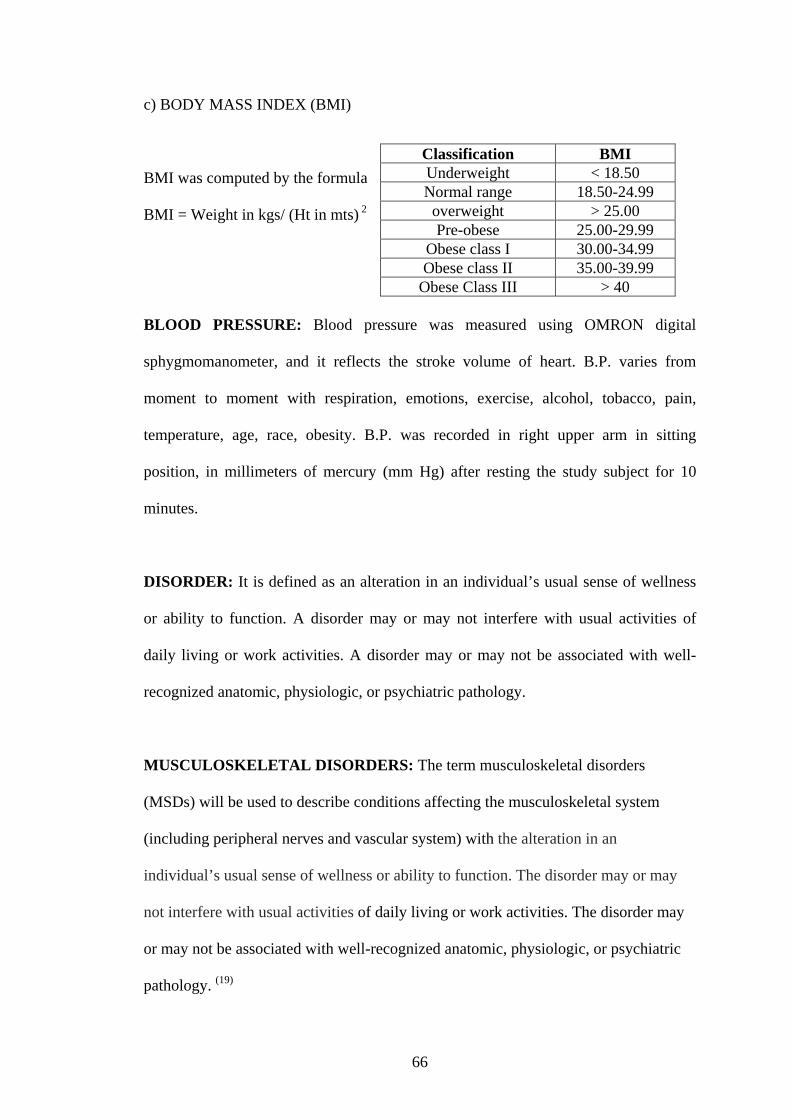
c) BODY MASS INDEX (BMI)
Classification BMI Underweight < 18.50 Normal range 18.50-24.99
overweight > 25.00 Pre-obese 25.00-29.99
Obese class I 30.00-34.99 Obese class II 35.00-39.99
Obese Class III > 40
BMI was computed by the formula
BMI = Weight in kgs/ (Ht in mts) 2
BLOOD PRESSURE: Blood pressure was measured using OMRON digital
sphygmomanometer, and it reflects the stroke volume of heart. B.P. varies from
moment to moment with respiration, emotions, exercise, alcohol, tobacco, pain,
temperature, age, race, obesity. B.P. was recorded in right upper arm in sitting
position, in millimeters of mercury (mm Hg) after resting the study subject for 10
minutes.
DISORDER: It is defined as an alteration in an individual’s usual sense of wellness
or ability to function. A disorder may or may not interfere with usual activities of
daily living or work activities. A disorder may or may not be associated with well-
recognized anatomic, physiologic, or psychiatric pathology.
MUSCULOSKELETAL DISORDERS: The term musculoskeletal disorders
(MSDs) will be used to describe conditions affecting the musculoskeletal system
(including peripheral nerves and vascular system) with the alteration in an
individual’s usual sense of wellness or ability to function. The disorder may or may
not interfere with usual activities of daily living or work activities. The disorder may
or may not be associated with well-recognized anatomic, physiologic, or psychiatric
pathology. (19)
66
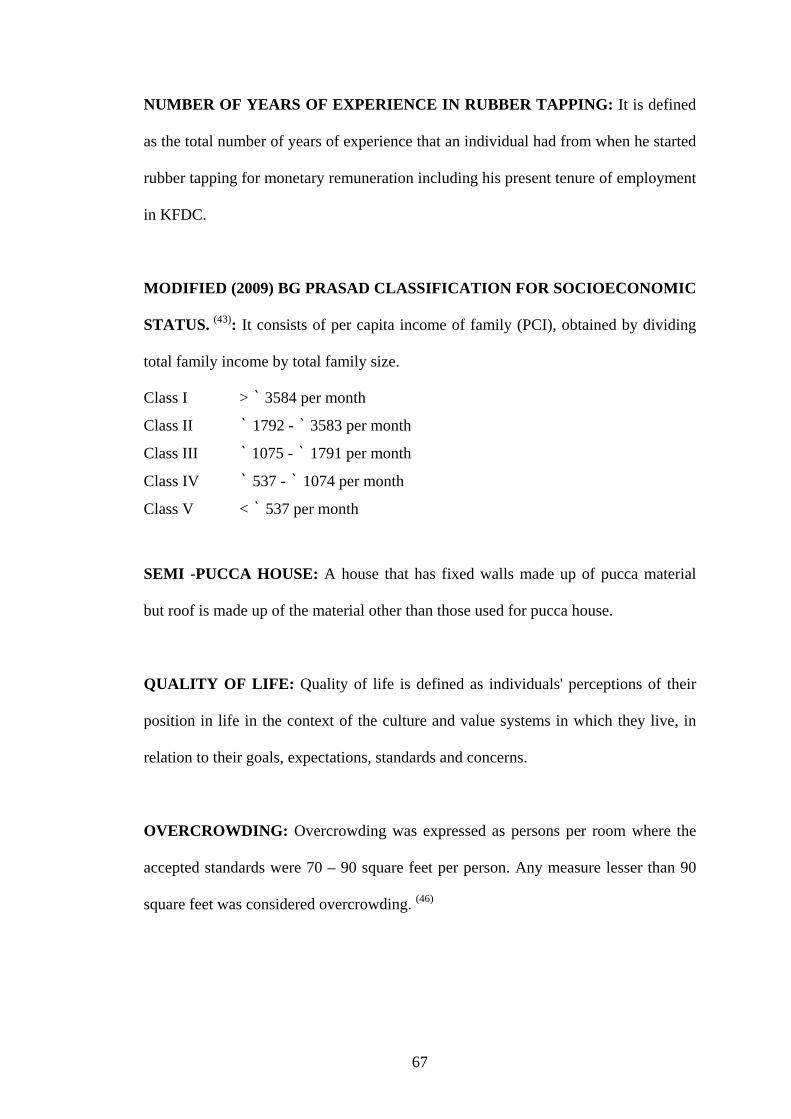
NUMBER OF YEARS OF EXPERIENCE IN RUBBER TAPPING: It is defined
as the total number of years of experience that an individual had from when he started
rubber tapping for monetary remuneration including his present tenure of employment
in KFDC.
MODIFIED (2009) BG PRASAD CLASSIFICATION FOR SOCIOECONOMIC
STATUS. (43): It consists of per capita income of family (PCI), obtained by dividing
total family income by total family size.
Class I > ` 3584 per month
Class II ` 1792 - ` 3583 per month
Class III ` 1075 - ` 1791 per month
Class IV ` 537 - ` 1074 per month
Class V < ` 537 per month
SEMI -PUCCA HOUSE: A house that has fixed walls made up of pucca material
but roof is made up of the material other than those used for pucca house.
QUALITY OF LIFE: Quality of life is defined as individuals' perceptions of their
position in life in the context of the culture and value systems in which they live, in
relation to their goals, expectations, standards and concerns.
OVERCROWDING: Overcrowding was expressed as persons per room where the
accepted standards were 70 – 90 square feet per person. Any measure lesser than 90
square feet was considered overcrowding. (46)
67