
A Comparison Between Combustion Phase Indicators for Optimal Spark Timing
11
Emiliano Pipitone Dipartimento di Meccanica, University of Palermo, Vialle delle Scienze, Palermo 90128, Italy e-mail: [email protected] A Comparison Between Combustion Phase Indicators for Optimal Spark Timing The closed-loop control of internal combustion engine spark timing may be accomplished by means of a combustion phase indicator, i.e., a parameter, derived from in-cylinder pressure analysis, whose variation is mainly referable to combustion phase shift and assumes a fixed reference value under optimal spark timing operation. The aim of the present work is a comparison between different combustion phase indicators, focusing on the performance attainable by a feedback spark timing control, which uses the indicator as pilot variable. An extensive experimental investigation has been carried out, verifying the relationship between indicators’ optimal values and the main engine running param- eters: engine speed, load, and mixture strength. Moreover, assessment on the effect of the most common pressure measurement problems (which are mainly related to pressure referencing, sampling resolution, top dead center determination, and cycle-by-cycle variations) on the indicators’ values and on the performance attainable by the spark timing control is included. The results of the comparison point out two indicators as the most suitable: the location of pressure peak and the location of maximum heat release rate. The latter, not available in literature, has been introduced by the author as an alternative to the 50% of mass fraction burned. DOI: 10.1115/1.2939012 Introduction Modern spark ignition engines must meet both rising fuel cost and CO 2 reduction policy by increasing as much as possible en- ergy conversion efficiency; as is known, one of the key parameters for engine performance is spark advance, which is normally con- trolled in open loop by means of tables stored in the ECU. These tables are drawn up during the ECU calibration process, trying to obtain the maximum output maximum brake torque, MBT on the engine test bed for different speed and load conditions; some other tables account for spark advance change due to variation in air and coolant temperature, and absolute pressure. The ECU cali- bration becomes therefore a time consuming phase, which, how- ever, does not guarantee to obtain always the best performances for the whole engine life: The stored tables, in fact, cannot con- sider all the possible operative conditions, and, moreover, optimal spark timing can also strongly depend on air humidity, engine wear, and fuel properties 1,2; for these reasons, a closed-loop control on spark advance, capable to maximize the engine output for every engine operative condition, is preferable; it can also be employed to realize a cost effective calibration process, quickly reaching the best spark timing value. Many techniques are pro- posed in literature for spark advance feedback control, and most of them make use of the in-cylinder pressure history to obtain the feedback variable. Sometimes, the cylinder pressure is recon- structed by means of analysis performed on another variable, for example, engine speed fluctuation or block vibration, but as far as the spark timing control is concerned, the cylinder pressure analy- sis remains a fundamental step. The most of these techniques rest on a single parameter derived from in-cylinder pressure, which almost assumes a fixed value under MBT timing: Such parameters are called combustion phase indicators, since their variation is mainly referable to combustion phase shift. The work here pre- sented aims at making a comparison between five combustion phase indicators, to evaluate their qualities and weakness as pilot variables for MBT spark timing control. Combustion Phase Indicators This section gives a general outline of the five combustion phase indicators here taken into consideration: 1 location of pressure peak LPP 2 location of maximum pressure rise LMPR 3 location of 50% of mass fraction burned MFB50 4 location of maximum heat release rate LMHR 5 value of relative pressure ratio 10 crank angle degree ATDC PRM10 Location of Pressure Peak (LPP). According to this criterion, spark advance is set to its best value when the pressure peak is found to be 14–16 crank angle degrees CAD after top dead center ATDC, apart from engine speed and load, and from other variables. This is one of the most encountered combustion phase indicators in literature 1,3–7, and requires pressure sampling at least for 30 deg ATDC see Fig. 1. The set point value is 14–16 crank angle degrees ATDC, and, as for all the other indicators, has been determined empirically and has not yet been theoretically explained. Location of Maximum Pressure Rise (LMPR). Cook et al. in 1947 8 showed that under optimal spark advance, the maximum pressure rise occurs about 3 deg ATDC. Rarely encountered in literature among the combustion phase indicators, its evaluation requires pressure sampling in the interval 20 deg around top dead center TDC. Location of 50% of Mass Fraction Burned (MFB50). It is well known to internal combustion engine researchers that in- cylinder pressure allows the evaluation of the fuel MFB 9–14: This can be accomplished following the procedure proposed by Rassweiler and Withrow, simple yet reliable, or by means of ther- modynamic analysis, which instead requires to know wall heat transfer law. According to this criterion, spark timing is set to the best value when MFB reaches 50% about 9 deg ATDC 15,16. Contributed by the Internal Combustion Engine Division of ASME for publication in the JOURNAL OF ENGINEERING FOR GAS TURBINES AND POWER. Manuscript received September 25, 2007; final manuscript received January 15, 2008; published online June 19, 2008. Review conducted by Margaret Wooldridge. Journal of Engineering for Gas Turbines and Power SEPTEMBER 2008, Vol. 130 / 052808-1 Copyright © 2008 by ASME
Transcript of A Comparison Between Combustion Phase Indicators for Optimal Spark Timing

I
aefttotoabefsswcferpofsetsoaam
iSJ
J
Emiliano PipitoneDipartimento di Meccanica,
University of Palermo,Vialle delle Scienze,
Palermo 90128, Italye-mail: [email protected]
A Comparison BetweenCombustion Phase Indicators forOptimal Spark TimingThe closed-loop control of internal combustion engine spark timing may be accomplishedby means of a combustion phase indicator, i.e., a parameter, derived from in-cylinderpressure analysis, whose variation is mainly referable to combustion phase shift andassumes a fixed reference value under optimal spark timing operation. The aim of thepresent work is a comparison between different combustion phase indicators, focusing onthe performance attainable by a feedback spark timing control, which uses the indicatoras pilot variable. An extensive experimental investigation has been carried out, verifyingthe relationship between indicators’ optimal values and the main engine running param-eters: engine speed, load, and mixture strength. Moreover, assessment on the effect of themost common pressure measurement problems (which are mainly related to pressurereferencing, sampling resolution, top dead center determination, and cycle-by-cyclevariations) on the indicators’ values and on the performance attainable by the sparktiming control is included. The results of the comparison point out two indicators as themost suitable: the location of pressure peak and the location of maximum heat releaserate. The latter, not available in literature, has been introduced by the author as analternative to the 50% of mass fraction burned. �DOI: 10.1115/1.2939012�
ntroduction
Modern spark ignition engines must meet both rising fuel costnd CO2 reduction policy by increasing as much as possible en-rgy conversion efficiency; as is known, one of the key parametersor engine performance is spark advance, which is normally con-rolled in open loop by means of tables stored in the ECU. Theseables are drawn up during the ECU calibration process, trying tobtain the maximum output �maximum brake torque, MBT� onhe engine test bed for different speed and load conditions; somether tables account for spark advance change due to variation inir and coolant temperature, and absolute pressure. The ECU cali-ration becomes therefore a time consuming phase, which, how-ver, does not guarantee to obtain always the best performancesor the whole engine life: The stored tables, in fact, cannot con-ider all the possible operative conditions, and, moreover, optimalpark timing can also strongly depend on air humidity, engineear, and fuel properties �1,2�; for these reasons, a closed-loop
ontrol on spark advance, capable to maximize the engine outputor every engine operative condition, is preferable; it can also bemployed to realize a cost effective calibration process, quicklyeaching the best spark timing value. Many techniques are pro-osed in literature for spark advance feedback control, and mostf them make use of the in-cylinder pressure history to obtain theeedback variable. Sometimes, the cylinder pressure is recon-tructed by means of analysis performed on another variable, forxample, engine speed fluctuation or block vibration, but as far ashe spark timing control is concerned, the cylinder pressure analy-is remains a fundamental step. The most of these techniques restn a single parameter derived from in-cylinder pressure, whichlmost assumes a fixed value under MBT timing: Such parametersre called combustion phase indicators, since their variation isainly referable to combustion phase shift. The work here pre-
Contributed by the Internal Combustion Engine Division of ASME for publicationn the JOURNAL OF ENGINEERING FOR GAS TURBINES AND POWER. Manuscript receivedeptember 25, 2007; final manuscript received January 15, 2008; published online
une 19, 2008. Review conducted by Margaret Wooldridge.ournal of Engineering for Gas Turbines and PowerCopyright © 20
sented aims at making a comparison between five combustionphase indicators, to evaluate their qualities and weakness as pilotvariables for MBT spark timing control.
Combustion Phase IndicatorsThis section gives a general outline of the five combustion
phase indicators here taken into consideration:
�1� location of pressure peak �LPP��2� location of maximum pressure rise �LMPR��3� location of 50% of mass fraction burned �MFB50��4� location of maximum heat release rate �LMHR��5� value of relative pressure ratio 10 crank angle degree
ATDC �PRM10�
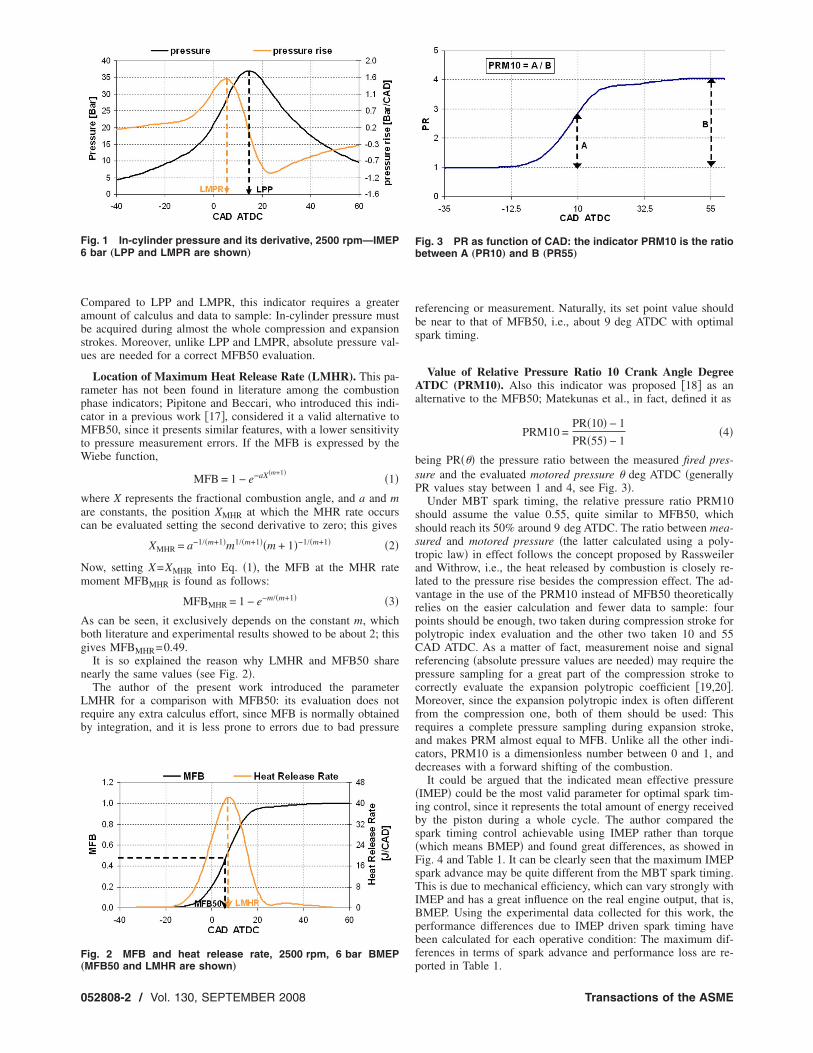
Location of Pressure Peak (LPP). According to this criterion,spark advance is set to its best value when the pressure peak isfound to be 14–16 crank angle degrees �CAD� after top deadcenter �ATDC�, apart from engine speed and load, and from othervariables. This is one of the most encountered combustion phaseindicators in literature �1,3–7�, and requires pressure sampling atleast for 30 deg ATDC �see Fig. 1�. The set point value is 14–16crank angle degrees ATDC, and, as for all the other indicators, hasbeen determined empirically and has not yet been theoreticallyexplained.
Location of Maximum Pressure Rise (LMPR). Cook et al. in1947 �8� showed that under optimal spark advance, the maximumpressure rise occurs about 3 deg ATDC. Rarely encountered inliterature among the combustion phase indicators, its evaluationrequires pressure sampling in the interval �20 deg around topdead center �TDC�.
Location of 50% of Mass Fraction Burned (MFB50). It iswell known to internal combustion engine researchers that in-cylinder pressure allows the evaluation of the fuel MFB �9–14�:This can be accomplished following the procedure proposed byRassweiler and Withrow, simple yet reliable, or by means of ther-modynamic analysis, which instead requires to know wall heattransfer law. According to this criterion, spark timing is set to the
best value when MFB reaches 50% about 9 deg ATDC �15,16�.SEPTEMBER 2008, Vol. 130 / 052808-108 by ASME
Cabsu
rpcMtW
wac
Nm
Abg
n
Lrb
F6
F„
0
ompared to LPP and LMPR, this indicator requires a greatermount of calculus and data to sample: In-cylinder pressure muste acquired during almost the whole compression and expansiontrokes. Moreover, unlike LPP and LMPR, absolute pressure val-es are needed for a correct MFB50 evaluation.
Location of Maximum Heat Release Rate (LMHR). This pa-ameter has not been found in literature among the combustionhase indicators; Pipitone and Beccari, who introduced this indi-ator in a previous work �17�, considered it a valid alternative toFB50, since it presents similar features, with a lower sensitivity
o pressure measurement errors. If the MFB is expressed by theiebe function,
MFB = 1 − e−aX�m+1��1�
here X represents the fractional combustion angle, and a and mre constants, the position XMHR at which the MHR rate occursan be evaluated setting the second derivative to zero; this gives
XMHR = a−1/�m+1�m1/�m+1��m + 1�−1/�m+1� �2�
ow, setting X=XMHR into Eq. �1�, the MFB at the MHR rateoment MFBMHR is found as follows:
MFBMHR = 1 − e−m/�m+1� �3�
s can be seen, it exclusively depends on the constant m, whichoth literature and experimental results showed to be about 2; thisives MFBMHR=0.49.
It is so explained the reason why LMHR and MFB50 shareearly the same values �see Fig. 2�.
The author of the present work introduced the parameterMHR for a comparison with MFB50: its evaluation does not
equire any extra calculus effort, since MFB is normally obtainedy integration, and it is less prone to errors due to bad pressure
ig. 1 In-cylinder pressure and its derivative, 2500 rpm—IMEPbar „LPP and LMPR are shown…
ig. 2 MFB and heat release rate, 2500 rpm, 6 bar BMEP
MFB50 and LMHR are shown…52808-2 / Vol. 130, SEPTEMBER 2008
referencing or measurement. Naturally, its set point value shouldbe near to that of MFB50, i.e., about 9 deg ATDC with optimalspark timing.
Value of Relative Pressure Ratio 10 Crank Angle DegreeATDC (PRM10). Also this indicator was proposed �18� as analternative to the MFB50; Matekunas et al., in fact, defined it as
PRM10 =PR�10� − 1
PR�55� − 1�4�
being PR��� the pressure ratio between the measured fired pres-sure and the evaluated motored pressure � deg ATDC �generallyPR values stay between 1 and 4, see Fig. 3�.
Under MBT spark timing, the relative pressure ratio PRM10should assume the value 0.55, quite similar to MFB50, whichshould reach its 50% around 9 deg ATDC. The ratio between mea-sured and motored pressure �the latter calculated using a poly-tropic law� in effect follows the concept proposed by Rassweilerand Withrow, i.e., the heat released by combustion is closely re-lated to the pressure rise besides the compression effect. The ad-vantage in the use of the PRM10 instead of MFB50 theoreticallyrelies on the easier calculation and fewer data to sample: fourpoints should be enough, two taken during compression stroke forpolytropic index evaluation and the other two taken 10 and 55CAD ATDC. As a matter of fact, measurement noise and signalreferencing �absolute pressure values are needed� may require thepressure sampling for a great part of the compression stroke tocorrectly evaluate the expansion polytropic coefficient �19,20�.Moreover, since the expansion polytropic index is often differentfrom the compression one, both of them should be used: Thisrequires a complete pressure sampling during expansion stroke,and makes PRM almost equal to MFB. Unlike all the other indi-cators, PRM10 is a dimensionless number between 0 and 1, anddecreases with a forward shifting of the combustion.
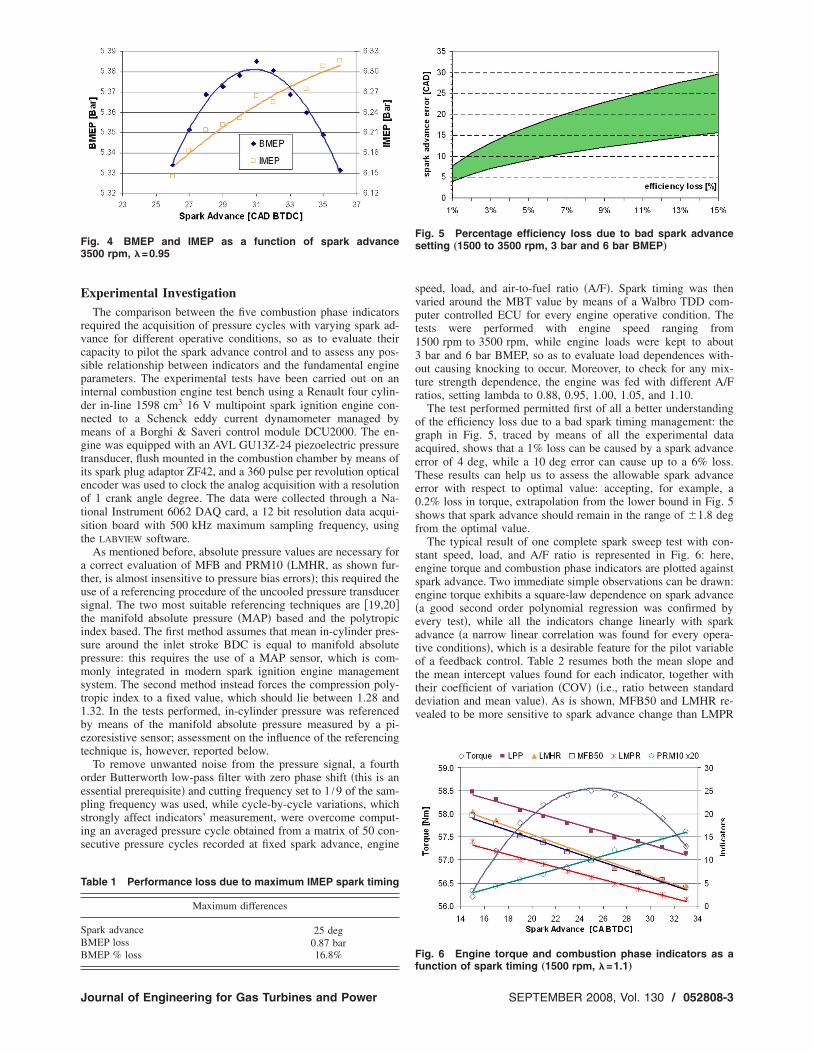
It could be argued that the indicated mean effective pressure�IMEP� could be the most valid parameter for optimal spark tim-ing control, since it represents the total amount of energy receivedby the piston during a whole cycle. The author compared thespark timing control achievable using IMEP rather than torque�which means BMEP� and found great differences, as showed inFig. 4 and Table 1. It can be clearly seen that the maximum IMEPspark advance may be quite different from the MBT spark timing.This is due to mechanical efficiency, which can vary strongly withIMEP and has a great influence on the real engine output, that is,BMEP. Using the experimental data collected for this work, theperformance differences due to IMEP driven spark timing havebeen calculated for each operative condition: The maximum dif-ferences in terms of spark advance and performance loss are re-
Fig. 3 PR as function of CAD: the indicator PRM10 is the ratiobetween A „PR10… and B „PR55…
ported in Table 1.
Transactions of the ASME
E
rvcspidnmgtieotst
atustispmst1bet
oepsis
F3
T
SBB
J
xperimental InvestigationThe comparison between the five combustion phase indicators
equired the acquisition of pressure cycles with varying spark ad-ance for different operative conditions, so as to evaluate theirapacity to pilot the spark advance control and to assess any pos-ible relationship between indicators and the fundamental enginearameters. The experimental tests have been carried out on annternal combustion engine test bench using a Renault four cylin-er in-line 1598 cm3 16 V multipoint spark ignition engine con-ected to a Schenck eddy current dynamometer managed byeans of a Borghi & Saveri control module DCU2000. The en-
ine was equipped with an AVL GU13Z-24 piezoelectric pressureransducer, flush mounted in the combustion chamber by means ofts spark plug adaptor ZF42, and a 360 pulse per revolution opticalncoder was used to clock the analog acquisition with a resolutionf 1 crank angle degree. The data were collected through a Na-ional Instrument 6062 DAQ card, a 12 bit resolution data acqui-ition board with 500 kHz maximum sampling frequency, usinghe LABVIEW software.
As mentioned before, absolute pressure values are necessary forcorrect evaluation of MFB and PRM10 �LMHR, as shown fur-
her, is almost insensitive to pressure bias errors�; this required these of a referencing procedure of the uncooled pressure transducerignal. The two most suitable referencing techniques are �19,20�he manifold absolute pressure �MAP� based and the polytropicndex based. The first method assumes that mean in-cylinder pres-ure around the inlet stroke BDC is equal to manifold absoluteressure: this requires the use of a MAP sensor, which is com-only integrated in modern spark ignition engine management
ystem. The second method instead forces the compression poly-ropic index to a fixed value, which should lie between 1.28 and.32. In the tests performed, in-cylinder pressure was referencedy means of the manifold absolute pressure measured by a pi-zoresistive sensor; assessment on the influence of the referencingechnique is, however, reported below.
To remove unwanted noise from the pressure signal, a fourthrder Butterworth low-pass filter with zero phase shift �this is anssential prerequisite� and cutting frequency set to 1 /9 of the sam-ling frequency was used, while cycle-by-cycle variations, whichtrongly affect indicators’ measurement, were overcome comput-ng an averaged pressure cycle obtained from a matrix of 50 con-ecutive pressure cycles recorded at fixed spark advance, engine
ig. 4 BMEP and IMEP as a function of spark advance500 rpm, �=0.95
able 1 Performance loss due to maximum IMEP spark timing
Maximum differences
park advance 25 degMEP loss 0.87 barMEP % loss 16.8%
ournal of Engineering for Gas Turbines and Power
speed, load, and air-to-fuel ratio �A/F�. Spark timing was thenvaried around the MBT value by means of a Walbro TDD com-puter controlled ECU for every engine operative condition. Thetests were performed with engine speed ranging from1500 rpm to 3500 rpm, while engine loads were kept to about3 bar and 6 bar BMEP, so as to evaluate load dependences with-out causing knocking to occur. Moreover, to check for any mix-ture strength dependence, the engine was fed with different A/Fratios, setting lambda to 0.88, 0.95, 1.00, 1.05, and 1.10.
The test performed permitted first of all a better understandingof the efficiency loss due to a bad spark timing management: thegraph in Fig. 5, traced by means of all the experimental dataacquired, shows that a 1% loss can be caused by a spark advanceerror of 4 deg, while a 10 deg error can cause up to a 6% loss.These results can help us to assess the allowable spark advanceerror with respect to optimal value: accepting, for example, a0.2% loss in torque, extrapolation from the lower bound in Fig. 5shows that spark advance should remain in the range of �1.8 degfrom the optimal value.
The typical result of one complete spark sweep test with con-stant speed, load, and A/F ratio is represented in Fig. 6: here,engine torque and combustion phase indicators are plotted againstspark advance. Two immediate simple observations can be drawn:engine torque exhibits a square-law dependence on spark advance�a good second order polynomial regression was confirmed byevery test�, while all the indicators change linearly with sparkadvance �a narrow linear correlation was found for every opera-tive conditions�, which is a desirable feature for the pilot variableof a feedback control. Table 2 resumes both the mean slope andthe mean intercept values found for each indicator, together withtheir coefficient of variation �COV� �i.e., ratio between standarddeviation and mean value�. As is shown, MFB50 and LMHR re-vealed to be more sensitive to spark advance change than LMPR
Fig. 5 Percentage efficiency loss due to bad spark advancesetting „1500 to 3500 rpm, 3 bar and 6 bar BMEP…
Fig. 6 Engine torque and combustion phase indicators as a
function of spark timing „1500 rpm, �=1.1…SEPTEMBER 2008, Vol. 130 / 052808-3
aaatmasfibaas�tpt�ew
ttoesvmehwtd
eiioic
iAc
LLPML
0
nd LPP. Naturally, from the point of view of a feedback control,higher sensitiveness of the pilot variable to the controlled vari-
ble is desirable, so as to obtain a fast response. It is worthwhileo mention that the linear regression coefficients in Table 2 are
ean values evaluated over all the tests, with a certain dispersion,s pointed out by the COV. However, even considering everyingle test, the above mentioned relation between the slope coef-cients remains true. These linear regression coefficients can alsoe used to model the indicators’ behavior as function of sparkdvance in the feedback controller development. As mentionedbove, the PRM10 is the only indicator that exhibits a positivelope with respect to spark advance. The spark advance for MBTfor example, 25 CAD BTDC in Fig. 6� was then assessed to findhe corresponding optimal value for each of the indicators. Thisrocedure was followed for every operative condition, thus ob-aining indicators’ mean optimal values and their variation rangei.e., the difference between the maximum and the minimum valuencountered�: In Table 3, the overall results are resumed togetherith those obtained with stoichiometric mixture.The ideal pilot variable of a feedback spark timing control sys-
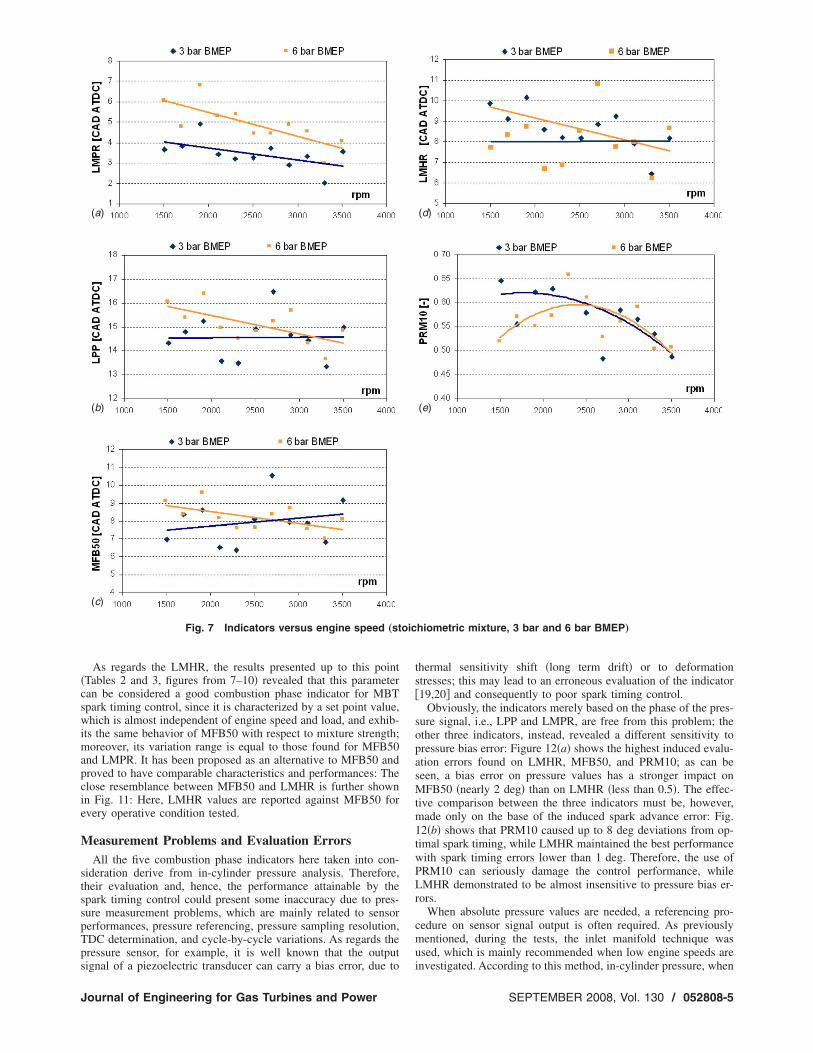
em should depend exclusively on spark advance; for this reason,he author verified any possible correlation between each indicatorptimal value and the most important running parameters, such asngine speed, load, and mixture strength. The graphs in Fig. 7how the measured optimal values for each of the indicators witharying engine speed, two load conditions, and stoichiometricixture: As can be seen, and confirmed by closer examinations,
ngine speed has a certain influence on every indicator in theigher load case, while for the lower load case a clear relationshipith engine speed can be found only for LMPR and PRM10;
he latter, moreover, is the only one that showed a quadraticependence.
Assessment on the effect of engine load shows a feeble influ-nce on the indicators’ optimal values; the indicator, which exhib-ts the highest dependence from engine load, is LMPR, as after alls pointed out by the graphs of Fig. 7: Here, a sort of separationccurs between the medium and the low load points. A negligiblenfluence was found on the other indicators, which can be thenonsidered independent of engine load.
The data recorded at different A/F permitted also to evaluate thenfluence of mixture strength on the combustion phase indicators:s pointed out by the left graphs in Fig. 8, all of them showed a
ertain dependence on A/F at low engine speed and medium load;
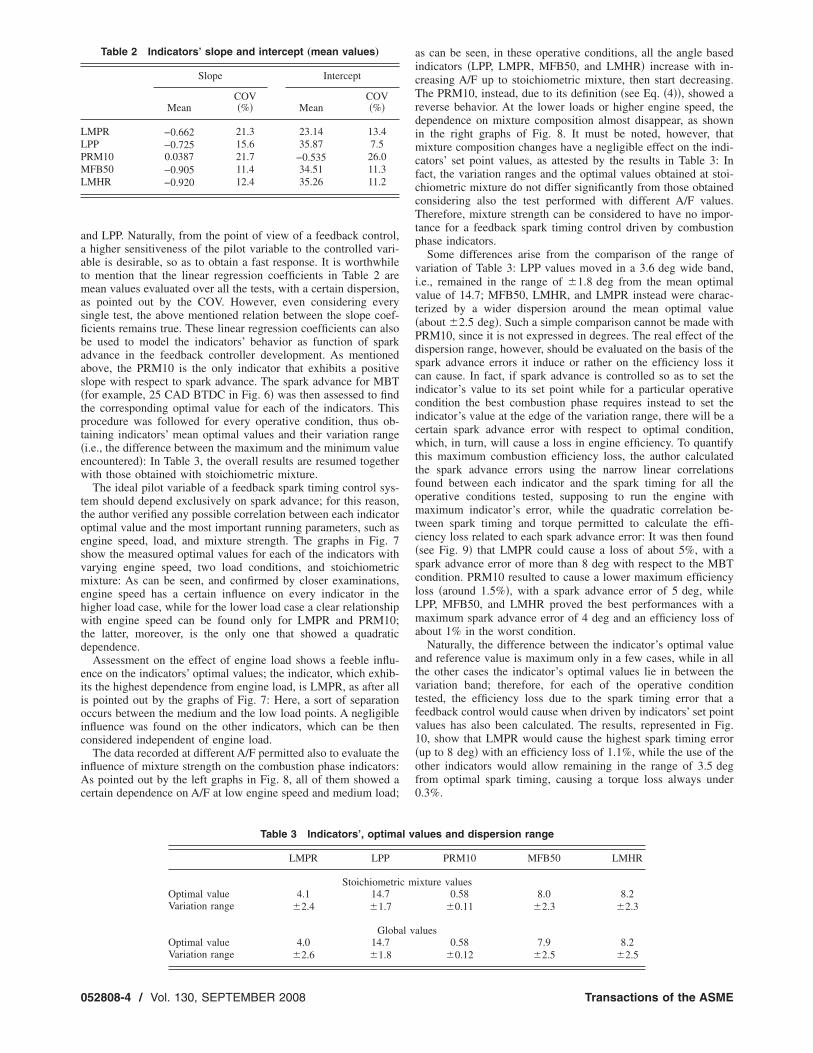
Table 2 Indicators’ slope and intercept „mean values…
Slope Intercept
MeanCOV�%� Mean
COV�%�
MPR −0.662 21.3 23.14 13.4PP −0.725 15.6 35.87 7.5RM10 0.0387 21.7 −0.535 26.0FB50 −0.905 11.4 34.51 11.3
MHR −0.920 12.4 35.26 11.2
Table 3 Indicators’, optima
LMPR LPP
StoichiometriOptimal value 4.1 14.7Variation range �2.4 �1.7
GlobaOptimal value 4.0 14.7Variation range �2.6 �1.8
52808-4 / Vol. 130, SEPTEMBER 2008
as can be seen, in these operative conditions, all the angle basedindicators �LPP, LMPR, MFB50, and LMHR� increase with in-creasing A/F up to stoichiometric mixture, then start decreasing.The PRM10, instead, due to its definition �see Eq. �4��, showed areverse behavior. At the lower loads or higher engine speed, thedependence on mixture composition almost disappear, as shownin the right graphs of Fig. 8. It must be noted, however, thatmixture composition changes have a negligible effect on the indi-cators’ set point values, as attested by the results in Table 3: Infact, the variation ranges and the optimal values obtained at stoi-chiometric mixture do not differ significantly from those obtainedconsidering also the test performed with different A/F values.Therefore, mixture strength can be considered to have no impor-tance for a feedback spark timing control driven by combustionphase indicators.
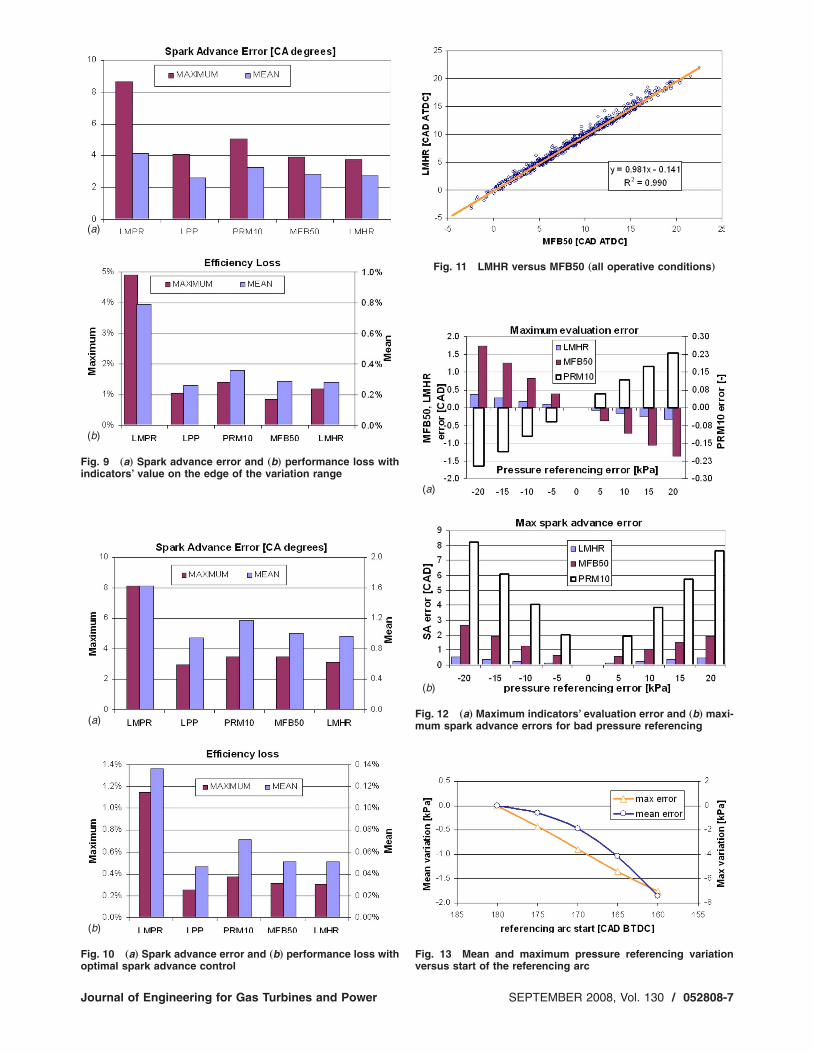
Some differences arise from the comparison of the range ofvariation of Table 3: LPP values moved in a 3.6 deg wide band,i.e., remained in the range of �1.8 deg from the mean optimalvalue of 14.7; MFB50, LMHR, and LMPR instead were charac-terized by a wider dispersion around the mean optimal value�about �2.5 deg�. Such a simple comparison cannot be made withPRM10, since it is not expressed in degrees. The real effect of thedispersion range, however, should be evaluated on the basis of thespark advance errors it induce or rather on the efficiency loss itcan cause. In fact, if spark advance is controlled so as to set theindicator’s value to its set point while for a particular operativecondition the best combustion phase requires instead to set theindicator’s value at the edge of the variation range, there will be acertain spark advance error with respect to optimal condition,which, in turn, will cause a loss in engine efficiency. To quantifythis maximum combustion efficiency loss, the author calculatedthe spark advance errors using the narrow linear correlationsfound between each indicator and the spark timing for all theoperative conditions tested, supposing to run the engine withmaximum indicator’s error, while the quadratic correlation be-tween spark timing and torque permitted to calculate the effi-ciency loss related to each spark advance error: It was then found�see Fig. 9� that LMPR could cause a loss of about 5%, with aspark advance error of more than 8 deg with respect to the MBTcondition. PRM10 resulted to cause a lower maximum efficiencyloss �around 1.5%�, with a spark advance error of 5 deg, whileLPP, MFB50, and LMHR proved the best performances with amaximum spark advance error of 4 deg and an efficiency loss ofabout 1% in the worst condition.
Naturally, the difference between the indicator’s optimal valueand reference value is maximum only in a few cases, while in allthe other cases the indicator’s optimal values lie in between thevariation band; therefore, for each of the operative conditiontested, the efficiency loss due to the spark timing error that afeedback control would cause when driven by indicators’ set pointvalues has also been calculated. The results, represented in Fig.10, show that LMPR would cause the highest spark timing error�up to 8 deg� with an efficiency loss of 1.1%, while the use of theother indicators would allow remaining in the range of 3.5 degfrom optimal spark timing, causing a torque loss always under0.3%.
lues and dispersion range
PRM10 MFB50 LMHR
ixture values0.58 8.0 8.2
�0.11 �2.3 �2.3
alues0.58 7.9 8.2
�0.12 �2.5 �2.5
l va
c m
l v
Transactions of the ASME
�cswimapcie
M
stsspTps
J
As regards the LMHR, the results presented up to this pointTables 2 and 3, figures from 7–10� revealed that this parameteran be considered a good combustion phase indicator for MBTpark timing control, since it is characterized by a set point value,hich is almost independent of engine speed and load, and exhib-
ts the same behavior of MFB50 with respect to mixture strength;oreover, its variation range is equal to those found for MFB50
nd LMPR. It has been proposed as an alternative to MFB50 androved to have comparable characteristics and performances: Thelose resemblance between MFB50 and LMHR is further shownn Fig. 11: Here, LMHR values are reported against MFB50 forvery operative condition tested.
easurement Problems and Evaluation ErrorsAll the five combustion phase indicators here taken into con-
ideration derive from in-cylinder pressure analysis. Therefore,heir evaluation and, hence, the performance attainable by thepark timing control could present some inaccuracy due to pres-ure measurement problems, which are mainly related to sensorerformances, pressure referencing, pressure sampling resolution,DC determination, and cycle-by-cycle variations. As regards theressure sensor, for example, it is well known that the output
(a)
(b)
(c)
Fig. 7 Indicators versus engine speed „st
ignal of a piezoelectric transducer can carry a bias error, due to
ournal of Engineering for Gas Turbines and Power
thermal sensitivity shift �long term drift� or to deformationstresses; this may lead to an erroneous evaluation of the indicator�19,20� and consequently to poor spark timing control.
Obviously, the indicators merely based on the phase of the pres-sure signal, i.e., LPP and LMPR, are free from this problem; theother three indicators, instead, revealed a different sensitivity topressure bias error: Figure 12�a� shows the highest induced evalu-ation errors found on LMHR, MFB50, and PRM10; as can beseen, a bias error on pressure values has a stronger impact onMFB50 �nearly 2 deg� than on LMHR �less than 0.5�. The effec-tive comparison between the three indicators must be, however,made only on the base of the induced spark advance error: Fig.12�b� shows that PRM10 caused up to 8 deg deviations from op-timal spark timing, while LMHR maintained the best performancewith spark timing errors lower than 1 deg. Therefore, the use ofPRM10 can seriously damage the control performance, whileLMHR demonstrated to be almost insensitive to pressure bias er-rors.
When absolute pressure values are needed, a referencing pro-cedure on sensor signal output is often required. As previouslymentioned, during the tests, the inlet manifold technique wasused, which is mainly recommended when low engine speeds are
(d)
(e)
hiometric mixture, 3 bar and 6 bar BMEP…
oicinvestigated. According to this method, in-cylinder pressure, when
SEPTEMBER 2008, Vol. 130 / 052808-5
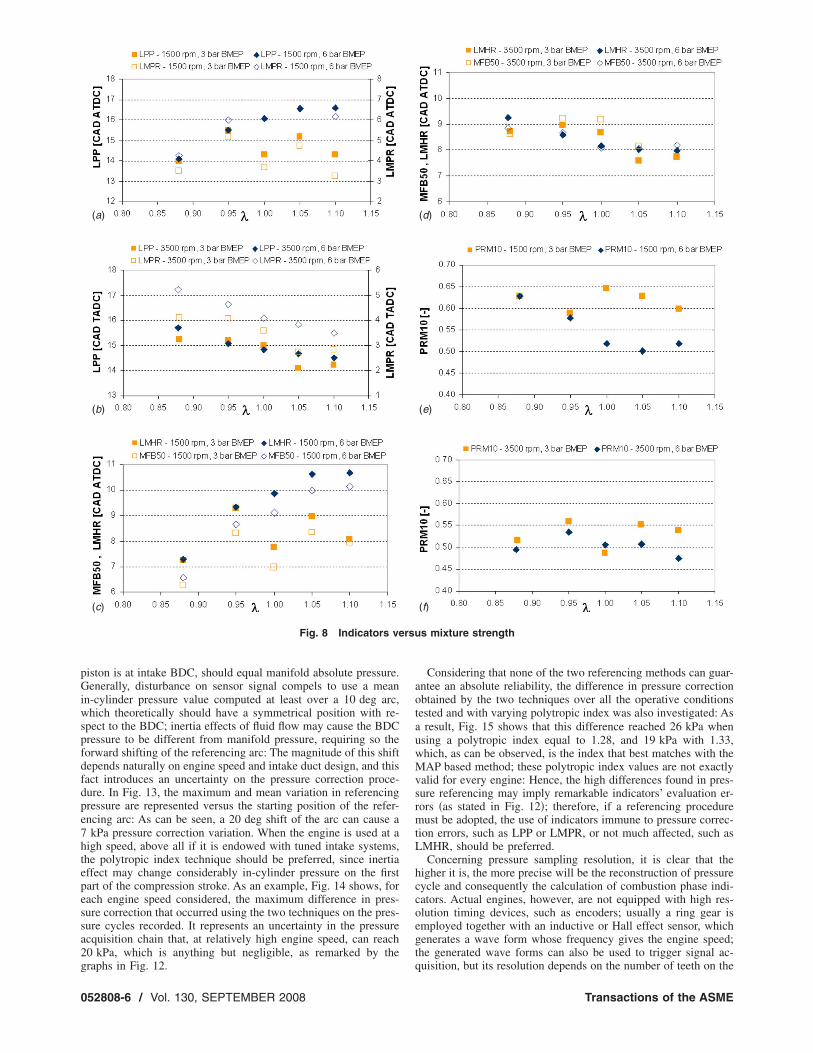
pGiwspfdfdpe7htepessa2g
0
iston is at intake BDC, should equal manifold absolute pressure.enerally, disturbance on sensor signal compels to use a mean
n-cylinder pressure value computed at least over a 10 deg arc,hich theoretically should have a symmetrical position with re-
pect to the BDC; inertia effects of fluid flow may cause the BDCressure to be different from manifold pressure, requiring so theorward shifting of the referencing arc: The magnitude of this shiftepends naturally on engine speed and intake duct design, and thisact introduces an uncertainty on the pressure correction proce-ure. In Fig. 13, the maximum and mean variation in referencingressure are represented versus the starting position of the refer-ncing arc: As can be seen, a 20 deg shift of the arc can cause akPa pressure correction variation. When the engine is used at a
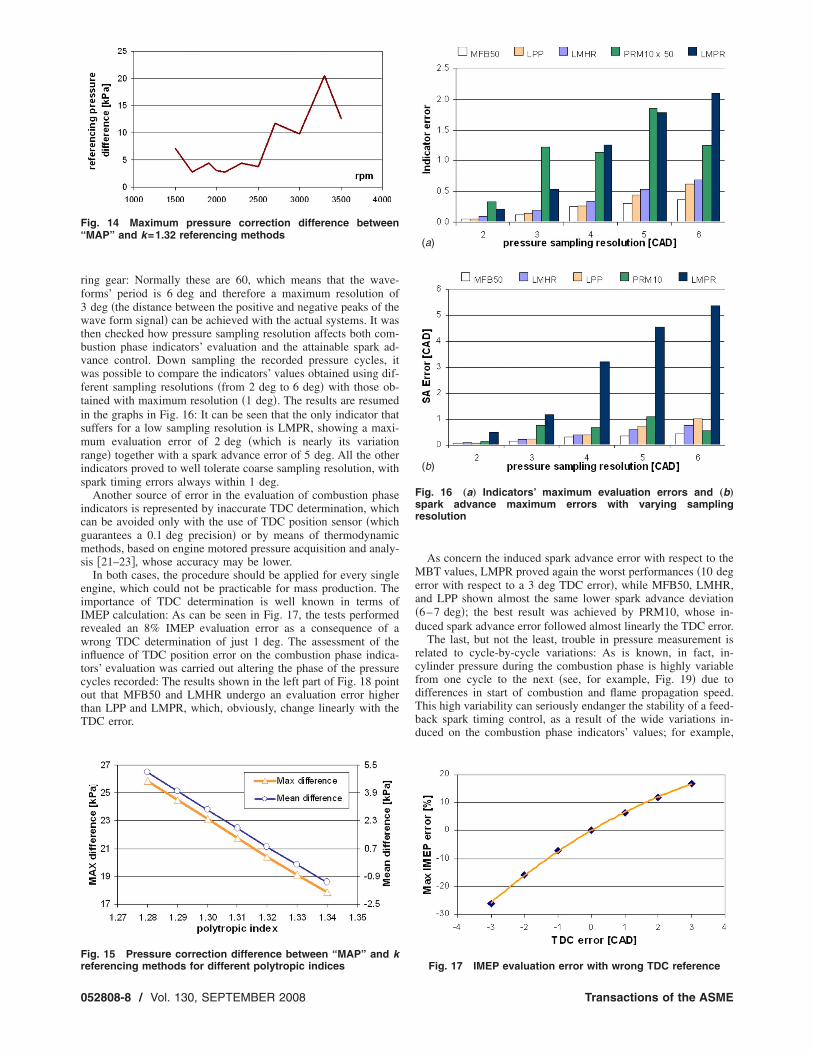
igh speed, above all if it is endowed with tuned intake systems,he polytropic index technique should be preferred, since inertiaffect may change considerably in-cylinder pressure on the firstart of the compression stroke. As an example, Fig. 14 shows, forach engine speed considered, the maximum difference in pres-ure correction that occurred using the two techniques on the pres-ure cycles recorded. It represents an uncertainty in the pressurecquisition chain that, at relatively high engine speed, can reach0 kPa, which is anything but negligible, as remarked by the
(a)
(b)
(c)
Fig. 8 Indicators ve
raphs in Fig. 12.
52808-6 / Vol. 130, SEPTEMBER 2008
Considering that none of the two referencing methods can guar-antee an absolute reliability, the difference in pressure correctionobtained by the two techniques over all the operative conditionstested and with varying polytropic index was also investigated: Asa result, Fig. 15 shows that this difference reached 26 kPa whenusing a polytropic index equal to 1.28, and 19 kPa with 1.33,which, as can be observed, is the index that best matches with theMAP based method; these polytropic index values are not exactlyvalid for every engine: Hence, the high differences found in pres-sure referencing may imply remarkable indicators’ evaluation er-rors �as stated in Fig. 12�; therefore, if a referencing proceduremust be adopted, the use of indicators immune to pressure correc-tion errors, such as LPP or LMPR, or not much affected, such asLMHR, should be preferred.
Concerning pressure sampling resolution, it is clear that thehigher it is, the more precise will be the reconstruction of pressurecycle and consequently the calculation of combustion phase indi-cators. Actual engines, however, are not equipped with high res-olution timing devices, such as encoders; usually a ring gear isemployed together with an inductive or Hall effect sensor, whichgenerates a wave form whose frequency gives the engine speed;the generated wave forms can also be used to trigger signal ac-
(d)
(e)
(f)
s mixture strength
rsuquisition, but its resolution depends on the number of teeth on the
Transactions of the ASME
Fi
Fo
Fig. 11 LMHR versus MFB50 „all operative conditions…
J
(a)
(b)
ig. 9 „a… Spark advance error and „b… performance loss with
ndicators’ value on the edge of the variation range(a)
(b)
ig. 10 „a… Spark advance error and „b… performance loss with
ptimal spark advance controlournal of Engineering for Gas Turbines and Power
(a)
(b)
Fig. 12 „a… Maximum indicators’ evaluation error and „b… maxi-mum spark advance errors for bad pressure referencing
Fig. 13 Mean and maximum pressure referencing variation
versus start of the referencing arcSEPTEMBER 2008, Vol. 130 / 052808-7
rf3wtbvwftismris
icgms
eiIrwitcotT
F“
Fr
0
ing gear: Normally these are 60, which means that the wave-orms’ period is 6 deg and therefore a maximum resolution of
deg �the distance between the positive and negative peaks of theave form signal� can be achieved with the actual systems. It was
hen checked how pressure sampling resolution affects both com-ustion phase indicators’ evaluation and the attainable spark ad-ance control. Down sampling the recorded pressure cycles, itas possible to compare the indicators’ values obtained using dif-
erent sampling resolutions �from 2 deg to 6 deg� with those ob-ained with maximum resolution �1 deg�. The results are resumedn the graphs in Fig. 16: It can be seen that the only indicator thatuffers for a low sampling resolution is LMPR, showing a maxi-um evaluation error of 2 deg �which is nearly its variation
ange� together with a spark advance error of 5 deg. All the otherndicators proved to well tolerate coarse sampling resolution, withpark timing errors always within 1 deg.
Another source of error in the evaluation of combustion phasendicators is represented by inaccurate TDC determination, whichan be avoided only with the use of TDC position sensor �whichuarantees a 0.1 deg precision� or by means of thermodynamicethods, based on engine motored pressure acquisition and analy-
is �21–23�, whose accuracy may be lower.In both cases, the procedure should be applied for every single
ngine, which could not be practicable for mass production. Themportance of TDC determination is well known in terms ofMEP calculation: As can be seen in Fig. 17, the tests performedevealed an 8% IMEP evaluation error as a consequence of arong TDC determination of just 1 deg. The assessment of the
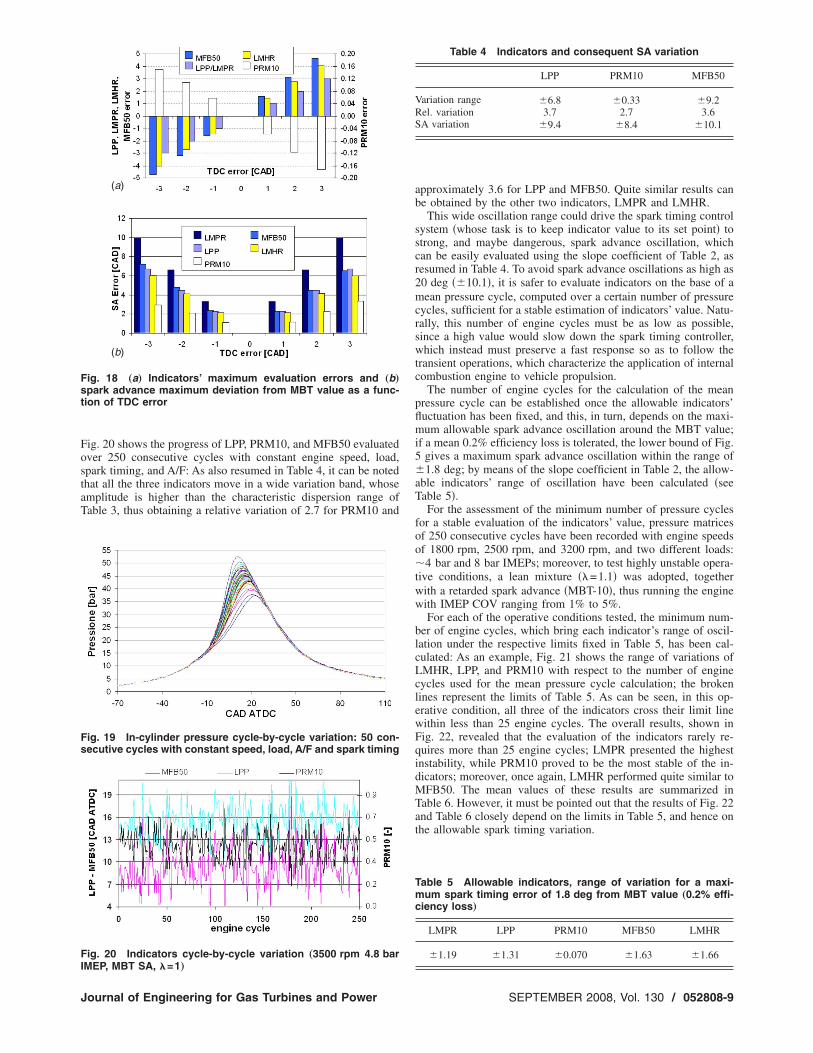
nfluence of TDC position error on the combustion phase indica-ors’ evaluation was carried out altering the phase of the pressureycles recorded: The results shown in the left part of Fig. 18 pointut that MFB50 and LMHR undergo an evaluation error higherhan LPP and LMPR, which, obviously, change linearly with theDC error.
ig. 14 Maximum pressure correction difference betweenMAP” and k=1.32 referencing methods
ig. 15 Pressure correction difference between “MAP” and k
eferencing methods for different polytropic indices52808-8 / Vol. 130, SEPTEMBER 2008
As concern the induced spark advance error with respect to theMBT values, LMPR proved again the worst performances �10 degerror with respect to a 3 deg TDC error�, while MFB50, LMHR,and LPP shown almost the same lower spark advance deviation�6–7 deg�; the best result was achieved by PRM10, whose in-duced spark advance error followed almost linearly the TDC error.
The last, but not the least, trouble in pressure measurement isrelated to cycle-by-cycle variations: As is known, in fact, in-cylinder pressure during the combustion phase is highly variablefrom one cycle to the next �see, for example, Fig. 19� due todifferences in start of combustion and flame propagation speed.This high variability can seriously endanger the stability of a feed-back spark timing control, as a result of the wide variations in-duced on the combustion phase indicators’ values; for example,
(a)
(b)
Fig. 16 „a… Indicators’ maximum evaluation errors and „b…spark advance maximum errors with varying samplingresolution
Fig. 17 IMEP evaluation error with wrong TDC reference
Transactions of the ASME
FostaT
Fst
Fs
FI
J
ig. 20 shows the progress of LPP, PRM10, and MFB50 evaluatedver 250 consecutive cycles with constant engine speed, load,park timing, and A/F: As also resumed in Table 4, it can be notedhat all the three indicators move in a wide variation band, whosemplitude is higher than the characteristic dispersion range ofable 3, thus obtaining a relative variation of 2.7 for PRM10 and
(a)
(b)
ig. 18 „a… Indicators’ maximum evaluation errors and „b…park advance maximum deviation from MBT value as a func-ion of TDC error
ig. 19 In-cylinder pressure cycle-by-cycle variation: 50 con-ecutive cycles with constant speed, load, A/F and spark timing
ig. 20 Indicators cycle-by-cycle variation „3500 rpm 4.8 bar
MEP, MBT SA, �=1…ournal of Engineering for Gas Turbines and Power
approximately 3.6 for LPP and MFB50. Quite similar results canbe obtained by the other two indicators, LMPR and LMHR.
This wide oscillation range could drive the spark timing controlsystem �whose task is to keep indicator value to its set point� tostrong, and maybe dangerous, spark advance oscillation, whichcan be easily evaluated using the slope coefficient of Table 2, asresumed in Table 4. To avoid spark advance oscillations as high as20 deg ��10.1�, it is safer to evaluate indicators on the base of amean pressure cycle, computed over a certain number of pressurecycles, sufficient for a stable estimation of indicators’ value. Natu-rally, this number of engine cycles must be as low as possible,since a high value would slow down the spark timing controller,which instead must preserve a fast response so as to follow thetransient operations, which characterize the application of internalcombustion engine to vehicle propulsion.
The number of engine cycles for the calculation of the meanpressure cycle can be established once the allowable indicators’fluctuation has been fixed, and this, in turn, depends on the maxi-mum allowable spark advance oscillation around the MBT value;if a mean 0.2% efficiency loss is tolerated, the lower bound of Fig.5 gives a maximum spark advance oscillation within the range of�1.8 deg; by means of the slope coefficient in Table 2, the allow-able indicators’ range of oscillation have been calculated �seeTable 5�.
For the assessment of the minimum number of pressure cyclesfor a stable evaluation of the indicators’ value, pressure matricesof 250 consecutive cycles have been recorded with engine speedsof 1800 rpm, 2500 rpm, and 3200 rpm, and two different loads:�4 bar and 8 bar IMEPs; moreover, to test highly unstable opera-tive conditions, a lean mixture ��=1.1� was adopted, togetherwith a retarded spark advance �MBT-10�, thus running the enginewith IMEP COV ranging from 1% to 5%.
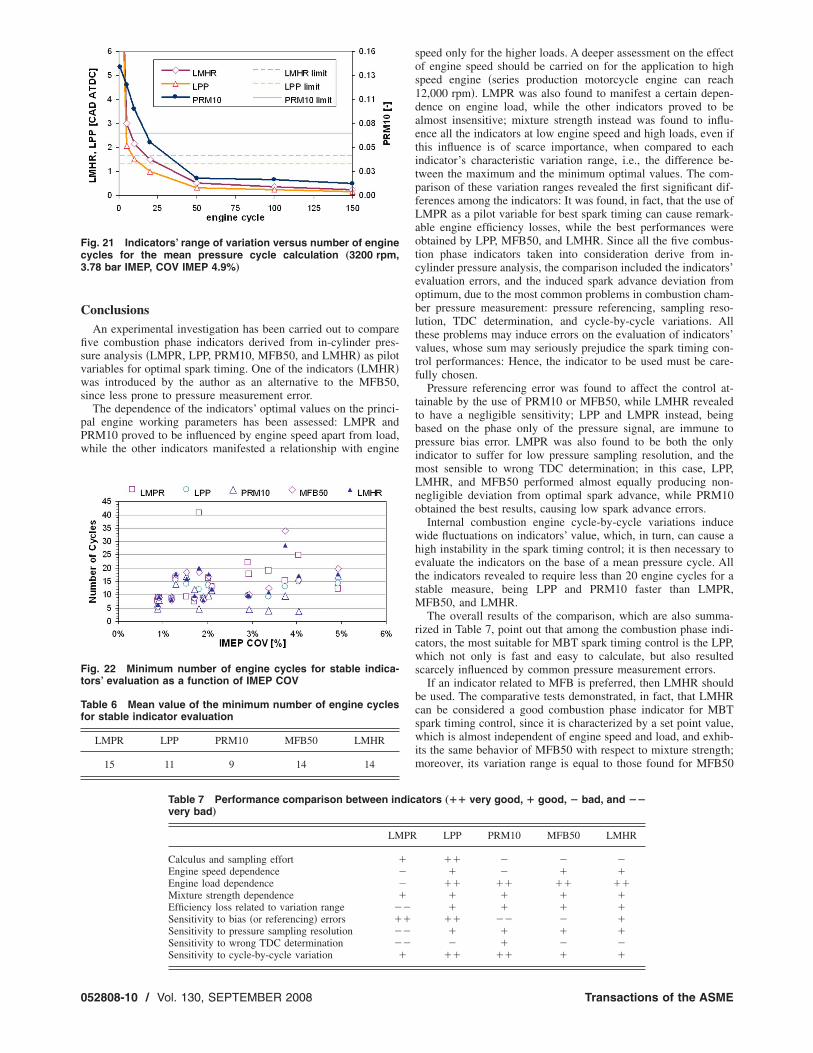
For each of the operative conditions tested, the minimum num-ber of engine cycles, which bring each indicator’s range of oscil-lation under the respective limits fixed in Table 5, has been cal-culated: As an example, Fig. 21 shows the range of variations ofLMHR, LPP, and PRM10 with respect to the number of enginecycles used for the mean pressure cycle calculation; the brokenlines represent the limits of Table 5. As can be seen, in this op-erative condition, all three of the indicators cross their limit linewithin less than 25 engine cycles. The overall results, shown inFig. 22, revealed that the evaluation of the indicators rarely re-quires more than 25 engine cycles; LMPR presented the highestinstability, while PRM10 proved to be the most stable of the in-dicators; moreover, once again, LMHR performed quite similar toMFB50. The mean values of these results are summarized inTable 6. However, it must be pointed out that the results of Fig. 22and Table 6 closely depend on the limits in Table 5, and hence onthe allowable spark timing variation.
Table 4 Indicators and consequent SA variation
LPP PRM10 MFB50
Variation range �6.8 �0.33 �9.2Rel. variation 3.7 2.7 3.6SA variation �9.4 �8.4 �10.1
Table 5 Allowable indicators, range of variation for a maxi-mum spark timing error of 1.8 deg from MBT value „0.2% effi-ciency loss…
LMPR LPP PRM10 MFB50 LMHR
�1.19 �1.31 �0.070 �1.63 �1.66
SEPTEMBER 2008, Vol. 130 / 052808-9
C
fisvws
pPw
Fc3
Ft
Tf
0
onclusionsAn experimental investigation has been carried out to compare
ve combustion phase indicators derived from in-cylinder pres-ure analysis �LMPR, LPP, PRM10, MFB50, and LMHR� as pilotariables for optimal spark timing. One of the indicators �LMHR�as introduced by the author as an alternative to the MFB50,
ince less prone to pressure measurement error.The dependence of the indicators’ optimal values on the princi-
al engine working parameters has been assessed: LMPR andRM10 proved to be influenced by engine speed apart from load,hile the other indicators manifested a relationship with engine
ig. 21 Indicators’ range of variation versus number of engineycles for the mean pressure cycle calculation „3200 rpm,.78 bar IMEP, COV IMEP 4.9%…
ig. 22 Minimum number of engine cycles for stable indica-ors’ evaluation as a function of IMEP COV
able 6 Mean value of the minimum number of engine cyclesor stable indicator evaluation
LMPR LPP PRM10 MFB50 LMHR
15 11 9 14 14
Table 7 Performance comparison between invery bad…
LM
Calculus and sampling effort �Engine speed dependence �Engine load dependence �Mixture strength dependence �Efficiency loss related to variation range �Sensitivity to bias �or referencing� errors �Sensitivity to pressure sampling resolution �Sensitivity to wrong TDC determination �Sensitivity to cycle-by-cycle variation �
52808-10 / Vol. 130, SEPTEMBER 2008
speed only for the higher loads. A deeper assessment on the effectof engine speed should be carried on for the application to highspeed engine �series production motorcycle engine can reach12,000 rpm�. LMPR was also found to manifest a certain depen-dence on engine load, while the other indicators proved to bealmost insensitive; mixture strength instead was found to influ-ence all the indicators at low engine speed and high loads, even ifthis influence is of scarce importance, when compared to eachindicator’s characteristic variation range, i.e., the difference be-tween the maximum and the minimum optimal values. The com-parison of these variation ranges revealed the first significant dif-ferences among the indicators: It was found, in fact, that the use ofLMPR as a pilot variable for best spark timing can cause remark-able engine efficiency losses, while the best performances wereobtained by LPP, MFB50, and LMHR. Since all the five combus-tion phase indicators taken into consideration derive from in-cylinder pressure analysis, the comparison included the indicators’evaluation errors, and the induced spark advance deviation fromoptimum, due to the most common problems in combustion cham-ber pressure measurement: pressure referencing, sampling reso-lution, TDC determination, and cycle-by-cycle variations. Allthese problems may induce errors on the evaluation of indicators’values, whose sum may seriously prejudice the spark timing con-trol performances: Hence, the indicator to be used must be care-fully chosen.
Pressure referencing error was found to affect the control at-tainable by the use of PRM10 or MFB50, while LMHR revealedto have a negligible sensitivity; LPP and LMPR instead, beingbased on the phase only of the pressure signal, are immune topressure bias error. LMPR was also found to be both the onlyindicator to suffer for low pressure sampling resolution, and themost sensible to wrong TDC determination; in this case, LPP,LMHR, and MFB50 performed almost equally producing non-negligible deviation from optimal spark advance, while PRM10obtained the best results, causing low spark advance errors.
Internal combustion engine cycle-by-cycle variations inducewide fluctuations on indicators’ value, which, in turn, can cause ahigh instability in the spark timing control; it is then necessary toevaluate the indicators on the base of a mean pressure cycle. Allthe indicators revealed to require less than 20 engine cycles for astable measure, being LPP and PRM10 faster than LMPR,MFB50, and LMHR.
The overall results of the comparison, which are also summa-rized in Table 7, point out that among the combustion phase indi-cators, the most suitable for MBT spark timing control is the LPP,which not only is fast and easy to calculate, but also resultedscarcely influenced by common pressure measurement errors.
If an indicator related to MFB is preferred, then LMHR shouldbe used. The comparative tests demonstrated, in fact, that LMHRcan be considered a good combustion phase indicator for MBTspark timing control, since it is characterized by a set point value,which is almost independent of engine speed and load, and exhib-its the same behavior of MFB50 with respect to mixture strength;moreover, its variation range is equal to those found for MFB50
ators „�� very good, � good, � bad, and ��
LPP PRM10 MFB50 LMHR
�� � � �� � � �
�� �� �� ��� � � �� � � �
�� �� � �� � � �� � � �
�� �� � �
dic
PR
����
Transactions of the ASME
arpptcoopbl
A
Rsh
N
J
nd LMPR, allowing a high efficiency spark timing control. Itepresents a valid alternative above all for its lower sensitivity toressure bias or referencing errors, which make unnecessary theressure measurement accuracy required by MFB50 and PRM10,hus allowing us to use cost effective pressure transducers. Theost of pressure transducers is at present the only drawback in thenboard use of combustion phase indicators; their use can bevercome if in-cylinder pressure is obtained by means of analysiserformed on other quantities, such as ionization current, enginelock vibration, or engine speed, whose measure is neither prob-ematic nor expensive.
cknowledgmentThe author would like to express his acknowledgment to
enault Italia in the person of Engineer Federico Fantozzi for theupport and the engine donation, and to Mr. Beniamino Drago foris indispensable technical contribution.
omenclature� � air excess index= �A /F� / �A /F�stoichiometric
A/F � air to fuel rationATDC � after top dead center
BDC � bottom dead centerBMEP � brake mean effective pressureBTDC � before top dead center
CA � crank angleCAD � crank angle degreeCOV � coefficient of variation ��standard deviation/
mean value�ECU � electronic control unit
IMEP � indicated mean effective pressureLMHR � location of maximum heat release rateLMPR � location of maximum pressure rise
LPP � location of pressure peakMAP � manifold absolute pressureMBT � maximum brake torqueMFB � mass fraction burnt
MFB50 � location of 50% of mass fraction burntMHR � maximum heat release rate
PR � pressure ratioPRM � pressure ratio management
PRM10 � pressure ratio management value 10 crankangle degrees ATDC
SA � spark advanceTDC � top dead center
ournal of Engineering for Gas Turbines and Power
References�1� Pestana, G. W., 1989, “Engine Control Methods Using Combustion Pressure
Feedback,” SAE Paper No. 890758.�2� Plint, M., and Martyr, A., 1999, Engine Testing—Theory and Practice, 2nd ed.,
Butterworth & Heinemann, Oxford.�3� Kawamura, Y., Shinshi, M., Sato, H., Takahashi, N., and Iriyama, M., 1988,
“MBT Control Through Individual Cylinder Pressure Detection,” SAE PaperNo. 881779.
�4� Powell, J. D., 1993, “Engine Control Using Cylinder Pressure: Past, Presentand Future,” ASME J. Dyn. Syst., Meas., Control, 115, pp. 343–350.
�5� Muller, R., Hart, M., Truscott, A., Noble, A., Krotz, G., Eickhoff, M., Caval-loni, C., and Gnielka, M., 2000, “Combustion Pressure Based Engine Manage-ment System,” SAE Paper No. 2000-01-0928.
�6� Yoon, P., Park, S., Sunwoo, M., Ohm, I., and Yoon, K. J., 2000, “Closed-LoopControl of Spark Advance and Air-Fuel Ratio in, SI Engines Using CylinderPressure,” SAE Paper No. 2000-01-0933.
�7� Eriksson, L., 1999, “Spark Advance Modeling and Control,” Dssertation N°580, Linköping University, www.vehicular.isy.liu.se.
�8� Cook, H. A., Heinicke, O. H., and Haynie, W. H., 1947, “Spark-Timing Con-trol Based on Correlation of Maximum-Economy Spark Timing, Flame-FrontTravel, and Cylinder Pressure Rise,” NACA Technical Note 1217.
�9� Rassweiler, G. M., and Withrow, L., 1980, “Motion Pictures of Engine FlamesCorrelated With Pressure Cards,” SAE Paper No. 800131.
�10� Amann, C. A., 1985, “Cylinder Pressure Measurement and Its Use in EngineResearch,” SAE Paper No. 852067.
�11� Stone, C. R., and Green-Armytage, D. I., 1987, “Comparison of Methods forthe Calculation of Mass Fraction Burnt From Engine Pressure-Time Dia-grams,” Proc. Inst. Mech. Eng., Part D �J. Automob. Eng.�, 201�D1�, pp.61–67.
�12� Shayler, P. J., Wiseman, M. W., and Ma, T., 1990, “Improving the Determina-tion of Mass Fraction Burnt,” SAE Paper No. 900351.
�13� Brunt, M. F., Rai, H., and Emtage, A. L., 1998, “The Calculation of HeatRelease From Engine Pressure Data,” SAE Paper No. 981052.
�14� Ball, J. K., Raine, R. R., and Stone, C. R., 1998, “Combustion Analysis andCycle-By-Cycle Variations in Spark Ignition Engine Combustion: Part 1 and2,” Proc. Inst. Mech. Eng., Part D �J. Automob. Eng.�, 212, pp. 381–389 �Part1� and pp. 507–523 �Part 2�.
�15� Bargende, M., 1995, “Most Optimal Location of 50% Mass Fraction Burnedand Automatic Knock Detection Components for Automatic Optimization ofSI-Engine Calibrations,” Motortech. Z., 56, pp. 632–638.
�16� Leonhardt, S., Muller, N., and Isermann, R., 1999, “Methods for Engine Su-pervision and Control Based on Cylinder Pressure Information,” IEEE/ASMETrans. Mechatron., 4�3�, pp. 235–245.
�17� Pipitone, E., and Beccari, A., 2003, “A real time platform for feedback sparkadvance control" 58° ATI Congress, Padova, Italy, 2003
�18� Matekunas, F. A., Battiston, P. A., Chang, C. F., Sellnau, M. C., and Lancaster,D. R., 2000, “Cylinder-Pressure-Based Engine Control Using Pressure-Ratio-management and Low-Cost Non-Intrusive Cylinder Pressure Sensor,” SAEPaper No. 2000-01-0932.
�19� Randolph, A. L., 1990, “Methods of Processing Cylinder-Pressure TransducerSignals to Maximize Data Accuracy,” SAE Paper No. 900170.
�20� Brunt, M. F. J., and Pond, C. R., 1997, “Evaluation of Techniques for AbsoluteCylinder Pressure Correction,” SAE Paper No. 970036.
�21� Nilsson, Y., and Eriksson, L., 2004, “Determining TDC Position Using Sym-metry and Other Methods,” SAE Paper No. 2004-01-1458.
�22� Stas, M. J., 1996, “Thermodynamic Determination of T.D.C. in Piston Com-bustion Engines,” SAE Paper No. 960610.
�23� Pipitone, E., Beccari, A., and Beccari, S., 2007, “The Experimental Validationof a New Thermodynamic Method for TDC Determination,” SAE Paper No.2007-24-052, DOI: 10.4271/2007-24-0052.
SEPTEMBER 2008, Vol. 130 / 052808-11