440 033 NAGPUR - ICAR-NBSS&LUP
194
Ukkxi qj – 440 033 NAGPUR – 440 033 www.nbsslup.in
-
Upload
khangminh22 -
Category
Documents
-
view
0 -
download
0
Transcript of 440 033 NAGPUR - ICAR-NBSS&LUP

Ukkxiqj – 440 033
NAGPUR – 440 033www.nbsslup.in
Ukkxiqj – 440 033
NAGPUR – 440 033www.nbsslup.in
For further information and to obtain copies of this reportPlease write to:
National Bureau of Soil Survey and Land Use Planning (NBSS&LUP)Amravati Road, NAGPUR-440 033
Telephone : (0712) 2500386; 2500226; 2500545; 2500664Telefax : +91(0)712-2500534
E-mail : [email protected] ; [email protected] : www.nbsslup.in
ISSN : 0970-9460
July, 2012
DIRECTOR
CITATION
NBSS&LUP Annual Report (2011-12), National Bureau of Soil Survey and Land Use Planning, Nagpur – 440 033, India
COMPILATION AND EDITING
CARTOGRAPHY
PRINTING
TECHNICAL ASSISTANCE
LAYOUT AND DESIGN
WORD PROCESSING
Director and ScientistsNational Bureau of Soil Survey and
Land Use Planning
Cartography and GIS Staff
S.K. Arora
A.P. NagarS.S. Nimkhedkar
P.N. DubeySunil Meshram
P.S. Butte
Prakash Ambekar
Vaishali ArbatD.K. NandanwarRohini Watekar
M.M. Khan
COVER PAGE
NBSS&LUP in the service of science and society (2011-12)
he year 2011-12 has certainly been one of the momentous years in the history of the Bureau and it can look back with pride on what it has achieved in the last year. Significant T
achievements have been, among others, a Georeferenced Soil Information System developed for major food growing zones (the Indo-Ganagetic Plain and Black Soil Region) of the country, a Decision Support System for Land Use Planning of Mysore district, Karnataka and a Farmers’ Advisory developed for the farmers of West Bengal on soil, crop and fertility management (keeping in mind that farmers are our first and most important stakeholders). Further, the Bureau has emerged as a technology leader in providing software solutions to a number of research activities, such as, soil correlation and land evaluation. The year has also been remarkable in that we reached out to our stakeholders in a more purposeful manner to involve them in planning as well as implementation of our programmes. The Bureau has never lagged behind in using new science and emerging technology in its research activities. It launched a project on nanotechnology applications in pedological studies and another on use of soft computing techniques in land evaluation.
The year also witnessed the culmination of XI Plan and I am extremely pleased to put on record that all the RD&T programmes earmarked for execution were undertaken and completed in time. We have sensitized our staff on the importance of Results Framework Document (RFD) in improving their performance and accountability to the Council, citizens of the country and our clients.
Human resource development through education and training continued to be a major activity. The Bureau organized a number of training programmes in its mandated areas of work. Two scientists visited abroad to equip themselves with latest developments in their fields of research. Besides, a number of staff underwent national training in varied fields.
The Bureau brought out a total of 118 publications including 35 research papers (27 in national and 8 in international referred journals). Compared to last year, there has been a decline in the number of research papers published in referred journals. This has been largely due to involvement of scientists in a good number of long term externally funded mega projects and some long term institutional projects and their commitment to completing the projects in time. I am confident, with the 2 NAIP projects (one under component-3 and the other under component-4) and 3 of the subprojects under the National Network Project on District Level Land Use Planning nearing completion, we shall see a promising increase in the total number of (quality) research publications in the coming year. The 3 publications brought out, namely, NBSS&LUP Glorious 30 Years (1976-2006), Annual Report (2010-2011) and Vision 2030 drew a connectivity among the past achievements, the current scenario and the future thrust
PrefacePreface
areas in RD&T and hence reaffirmed Bureau’s continued commitment towards functioning as National Research Development and Training System in soil survey, land use planning and allied areas of work to address larger issues of sustainability of natural resources and food and nutritional security.
I am thankful to the Chairman and members of Research Advisory Committee (RAC), the Chairman and members of Institute Management Committee (IMC)) and the Member-Secretary of Institute Research Council (IRC) for the guidance and support provided in formulating and pursuing our RD&T programmes.
I am highly grateful to Dr. S. Ayyappan, Esteemed Secretary, DARE and Director General, Dr. A.K. Singh, Deputy Director General (NRM) and Dr. P. Minhas, Assistant Director General (Soils), ICAR, New Delhi for the guidance and support provided and also for encouraging new research initiatives.
I appreciate the sincere and dedicated efforts put in by the scientists in the huge task of compiling and editing the report. I am more than contented in placing the Annual Report (2011-12) for public scrutiny. I welcome suggestions and feedback from the readers. The same will provide valuable inputs towards raising the bar in Annual Report writing in years to come.
(DIPAK SARKAR)DIRECTOR

ContentsContents
Preface
List of Acronyms and Abbreviation
List of Tables
List of Figures
i
Executive Summary vii
1. NBSS&LUP : A Profile 1
2. Research Achievements 5
2.1 Inventorying Natural Resources 7
2.2 Remote Sensing, GIS and Cartography 40
2.3 Basic Pedological Research 56
2.4 Soil Survey Data Interpretations and Applications 64
2.5 Land Evaluation and Land Use Planning 77
3. Education and Training 106
4. Technology Assessed and Transferred 113
5. Sections and Units 114
5.1 Prioritization, Monitoring and Evaluation (PME) Cell 114
5.2 Library and Documentation Unit 115
5.3 Printing Section 116
5.4 Publication Sale Unit 117
5.5 Agricultural Knowledge Management Unit (AKMU) 118
5.6 Cartography Unit 119
5.7 fgUnh vuqHkkx 120
6. Linkages 121
7. Budget: A Comparative Analysis 122
8. Awards and Recognitions 123
9. List of Publications 124
10. Participation of Scientists in Seminars, Symposia, Conferences, Workshops, Trainings and Meetings in India and abroad 131
11. Consultancy, Patents, Commercialization of Technology 135
12. Meetings Organized 136
13. Workshops/Seminars/Summer and Winter Schools/Farmer’s Day and Other Events 139
dk;Zdkjh lkjak'k
Appendices
Appendix 1 On-going and completed projects 142
Appendix 2 Distinguished Visitors 148
Appendix 3 Important Committees 152
Appendix 4 Lectures Delivered by Scientists 153
Appendix 5 Personnel (Managerial Position) 156
Appendix 6 Staff-related General Information 157
Appendix 7 RFD-related information 159
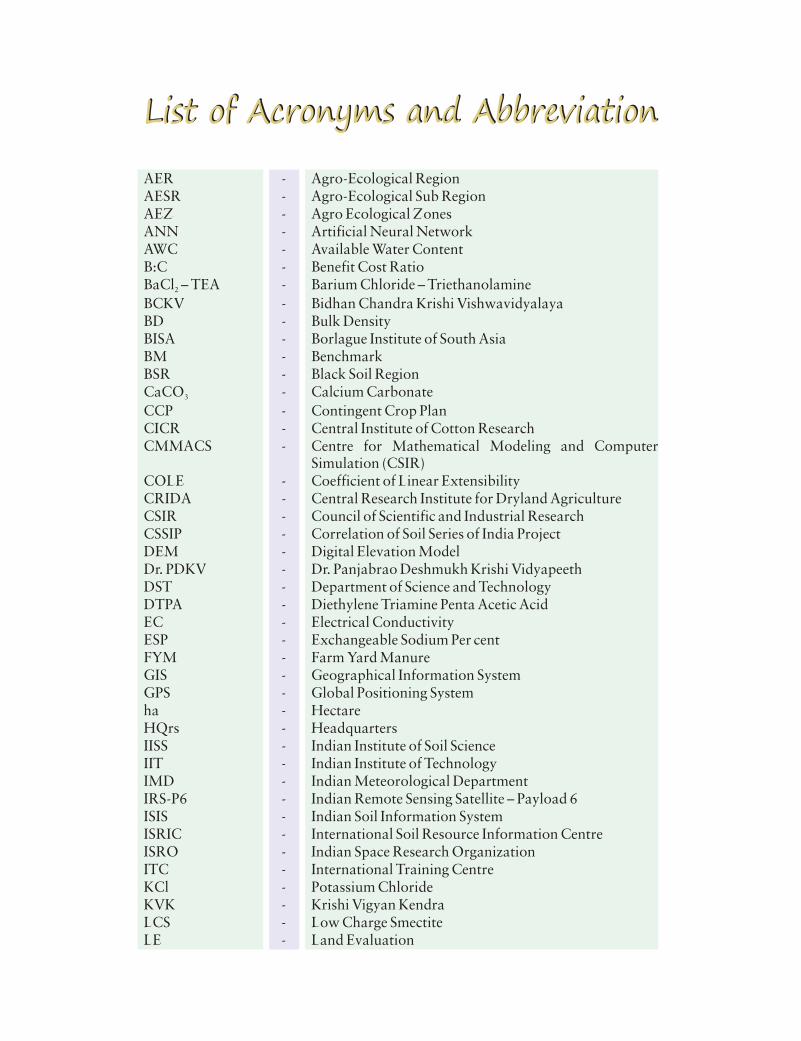
List of Acronyms and AbbreviationList of Acronyms and Abbreviation
AER - Agro-Ecological RegionAESR - Agro-Ecological Sub RegionAEZ - Agro Ecological ZonesANN - Artificial Neural NetworkAWC - Available Water ContentB:C - Benefit Cost RatioBaCl – TEA - Barium Chloride – Triethanolamine2
BCKV - Bidhan Chandra Krishi VishwavidyalayaBD - Bulk DensityBISA - Borlague Institute of South Asia BM - BenchmarkBSR - Black Soil RegionCaCO - Calcium Carbonate3
CCP - Contingent Crop PlanCICR - Central Institute of Cotton ResearchCMMACS - Centre for Mathematical Modeling and Computer
Simulation (CSIR)COLE - Coefficient of Linear ExtensibilityCRIDA - Central Research Institute for Dryland AgricultureCSIR - Council of Scientific and Industrial ResearchCSSIP - Correlation of Soil Series of India ProjectDEM - Digital Elevation ModelDr. PDKV - Dr. Panjabrao Deshmukh Krishi VidyapeethDST - Department of Science and TechnologyDTPA - Diethylene Triamine Penta Acetic AcidEC - Electrical ConductivityESP - Exchangeable Sodium Per centFYM - Farm Yard ManureGIS - Geographical Information SystemGPS - Global Positioning Systemha - HectareHQrs - HeadquartersIISS - Indian Institute of Soil ScienceIIT - Indian Institute of TechnologyIMD - Indian Meteorological DepartmentIRS-P6 - Indian Remote Sensing Satellite – Payload 6ISIS - Indian Soil Information SystemISRIC - International Soil Resource Information CentreISRO - Indian Space Research OrganizationITC - International Training CentreKCl - Potassium ChlorideKVK - Krishi Vigyan KendraLCS - Low Charge SmectiteLE - Land Evaluation

LGP - Length of Growing PeriodLISS - Linear Imaging Self ScannerLMU - Land Management UnitsLPP - Land Productivity PotentialLRI - Land Resource InventoryLRI-FP - Land Resource Inventory for Farm PlanningLTFE - Long Term Fertilizer ExperimentLUT - Land Utilization TypeMAP - Medicinal and Aromatic PlantMBC - Microbial Biomass CarbonMBN - Microbial Biomass NitrogenMGLP - Multiple Goal Linear ProgrammingMPL - Maximum Permissible LimitMSL - Mean Sea LevelMSS - Multi Spectral ScannerNCR - National Capital RegionNePDiLUP - Network Project on District Level Land Use PlanningNICRA - National Initiative on Climatic Resilient AgricultureNR - Net ReturnsNRCC - National Research Centre for CitrusNRSC, Hyderabad - National Remote Sensing Centre, HyderabadNSDI - National Spatial Data InfrastructureNTFP - Non-Timber Forest ProduceOC - Organic CarbonPAN - PanchromaticPET - Potential EvapotranspirationPEU - Pedo-Ecological UnitsPLS - Partial Least SquarePM - Poultry ManurePTF - Pedo Transfer FunctionPWP - Permanent Wilting PointRMSE - Root Mean Square ErrorRMSEP - Root Mean Square Error of PredictionRPD - Root Performance to DeviationRRSC, Nagpur - Regional Remote Sensing Centre, NagpurRSC - Residual Sodium CarbonateSAC - Space Application CentreSAUs - State Agricultural UniversitiesSLU - Suggested Land UnitsSOC - Soil Organic CarbonSRM - Soil Resource MappingTGA - Total Geographical AreaTM - Thematic MapperTOC - Total Organic CarbonTWI - Topographic Wetness IndexUSLE - Universal Soil Loss EquationWD - Water DeficitWS - Water SurplusXRD - X-ray Diffraction
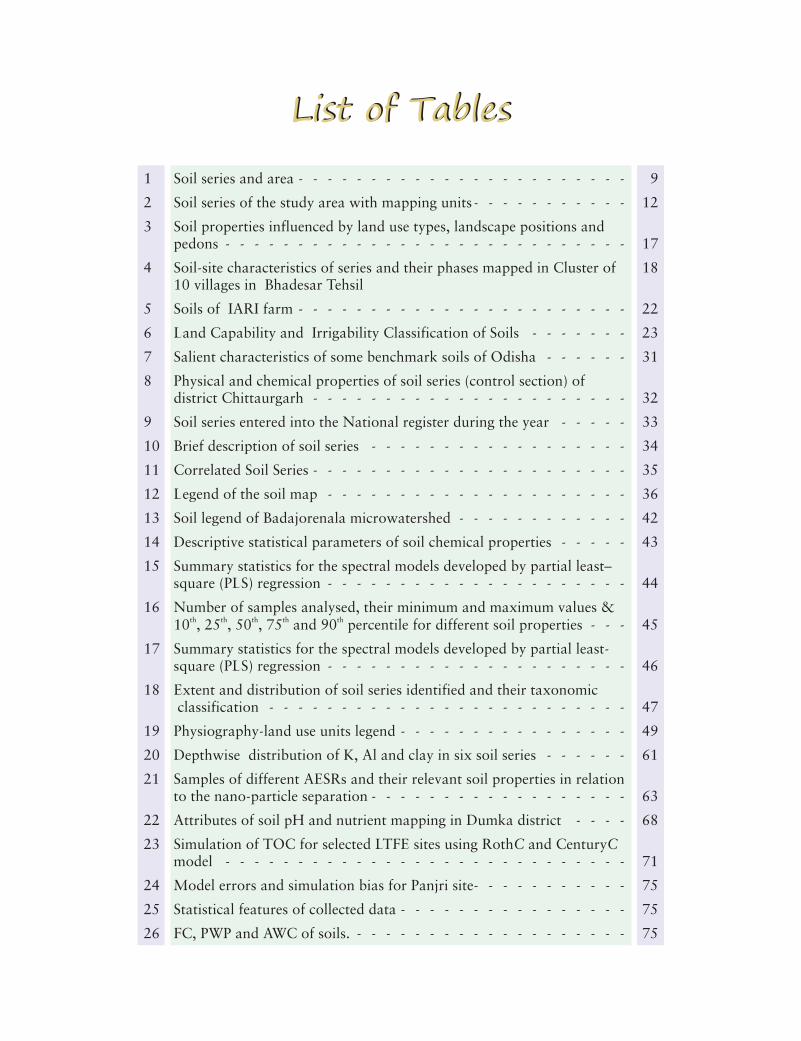
List of TablesList of Tables
1 Soil series and area - - - - - - - - - - - - - - - - - - - - - - - 9
2 Soil series of the study area with mapping units - - - - - - - - - - - 12
3 Soil properties influenced by land use types, landscape positions and pedons - - - - - - - - - - - - - - - - - - - - - - - - - - - - 17
4 Soil-site characteristics of series and their phases mapped in Cluster of 1810 villages in Bhadesar Tehsil
5 Soils of IARI farm - - - - - - - - - - - - - - - - - - - - - - - 22
6 Land Capability and Irrigability Classification of Soils - - - - - - - 23
7 Salient characteristics of some benchmark soils of Odisha - - - - - - 31
8 Physical and chemical properties of soil series (control section) of district Chittaurgarh - - - - - - - - - - - - - - - - - - - - - - 32
9 Soil series entered into the National register during the year - - - - - 33
10 Brief description of soil series - - - - - - - - - - - - - - - - - - 34
11 Correlated Soil Series - - - - - - - - - - - - - - - - - - - - - - 35
12 Legend of the soil map - - - - - - - - - - - - - - - - - - - - - 36
13 Soil legend of Badajorenala microwatershed - - - - - - - - - - - - 42
14 Descriptive statistical parameters of soil chemical properties - - - - - 43
15 Summary statistics for the spectral models developed by partial least–square (PLS) regression - - - - - - - - - - - - - - - - - - - - - 44
16 Number of samples analysed, their minimum and maximum values &th th th th th10 , 25 , 50 , 75 and 90 percentile for different soil properties - - - 45
17 Summary statistics for the spectral models developed by partial least-square (PLS) regression - - - - - - - - - - - - - - - - - - - - - 46
18 Extent and distribution of soil series identified and their taxonomic classification - - - - - - - - - - - - - - - - - - - - - - - - - 47
19 Physiography-land use units legend - - - - - - - - - - - - - - - - 49
20 Depthwise distribution of K, Al and clay in six soil series - - - - - - 61
21 Samples of different AESRs and their relevant soil properties in relationto the nano-particle separation - - - - - - - - - - - - - - - - - - 63
22 Attributes of soil pH and nutrient mapping in Dumka district - - - - 68
23 Simulation of TOC for selected LTFE sites using RothC and CenturyC model - - - - - - - - - - - - - - - - - - - - - - - - - - - - 71
24 Model errors and simulation bias for Panjri site- - - - - - - - - - - 75
25 Statistical features of collected data - - - - - - - - - - - - - - - - 75
26 FC, PWP and AWC of soils. - - - - - - - - - - - - - - - - - - - 75
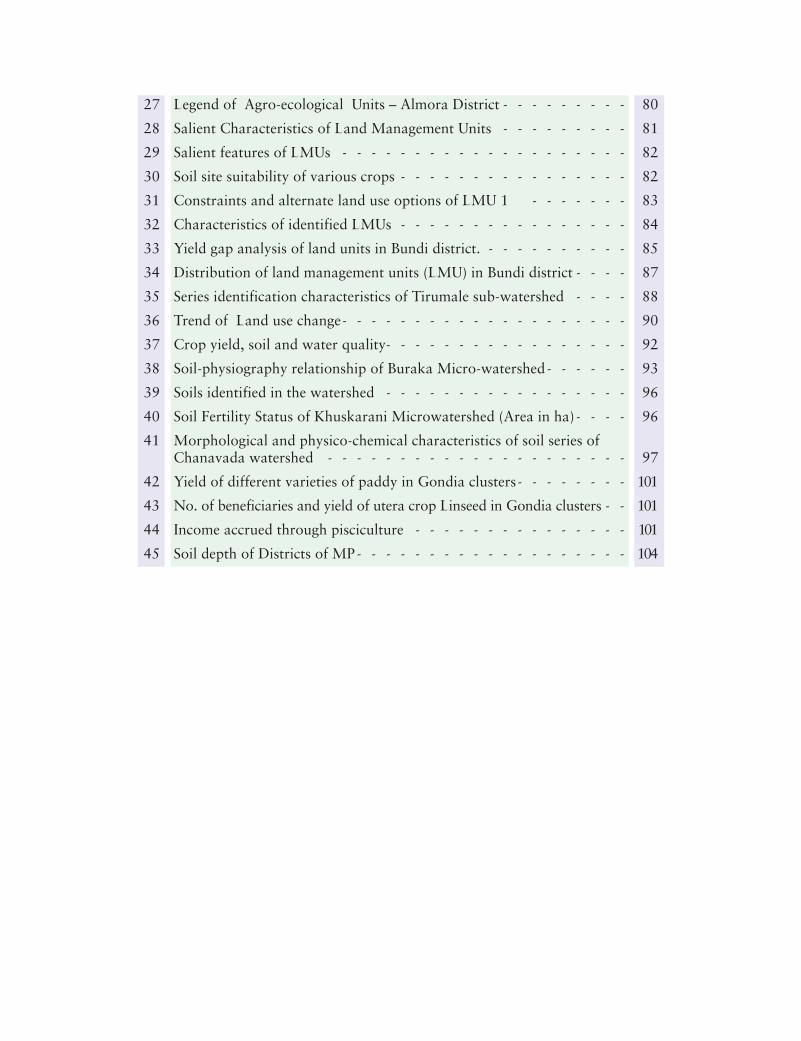
27 Legend of Agro-ecological Units – Almora District - - - - - - - - - 80
28 Salient Characteristics of Land Management Units - - - - - - - - - 81
29 Salient features of LMUs - - - - - - - - - - - - - - - - - - - - 82
30 Soil site suitability of various crops - - - - - - - - - - - - - - - - 82
31 Constraints and alternate land use options of LMU 1 - - - - - - - 83
32 Characteristics of identified LMUs - - - - - - - - - - - - - - - - 84
33 Yield gap analysis of land units in Bundi district. - - - - - - - - - - 85
34 Distribution of land management units (LMU) in Bundi district - - - - 87
35 Series identification characteristics of Tirumale sub-watershed - - - - 88
36 Trend of Land use change- - - - - - - - - - - - - - - - - - - - 90
37 Crop yield, soil and water quality- - - - - - - - - - - - - - - - - 92
38 Soil-physiography relationship of Buraka Micro-watershed- - - - - - 93
39 Soils identified in the watershed - - - - - - - - - - - - - - - - - 96
40 Soil Fertility Status of Khuskarani Microwatershed (Area in ha)- - - - 96
41 Morphological and physico-chemical characteristics of soil series ofChanavada watershed - - - - - - - - - - - - - - - - - - - - - 97
42 Yield of different varieties of paddy in Gondia clusters- - - - - - - - 101
43 No. of beneficiaries and yield of utera crop Linseed in Gondia clusters - - 101
44 Income accrued through pisciculture - - - - - - - - - - - - - - - 101
45 Soil depth of Districts of MP- - - - - - - - - - - - - - - - - - - 104
List of FiguresList of Figures
1 Soil map of Malappuram district - - - - - - - - - - - - - - - - - - 72 Distribution of soil phases in D. Nagenahalli village - - - - - - - - - - 93 Land suitability of soils of D. Nagenahalli for Mango - - - - - - - - - 104 Salt affected areas seen as grey tones on the imagery in
Torabommanahalli village - - - - - - - - - - - - - - - - - - - - - 115 Soil-physiographic relationship in Lakhan Majra block, Rohtak - - - - - 116 Soil salinity/sodicity, Lakhan Majra - - - - - - - - - - - - - - - - - 127 Soil map of the study area under Katonigaon - - - - - - - - - - - - - 138 Land suitability map for tea in Katonigaon Panchayat - - - - - - - - - 149 Soil map of East Lahing Gaon panchayat, Jorhat district - - - - - - - - 1510 Soil resource database for farm planning in Gotu cluster (*mineralogy
mixed, temperature regime-hyperthermic) with brief description of soils- - - 1611 Soils of cluster villages of Bhadesar tehsil, Chittaurgarh district - - - - - 1912 Suggested land use plan for cluster villages, Bhadesar tehsil - - - - - - - 2013 Major soils and land use in Namkhana and Hasnabad blocks in
24 Pgs(S), West Bengal - - - - - - - - - - - - - - - - - - - - - - - 2114 Suggested land use, Sultanpur district - - - - - - - - - - - - - - - - 2515 Hydrological soil groups, Dwarkeswar microwatershed-1 - - - - - - - - 2516 Moisture retention characteristics of soils of watershed - - - - - - - - - 2617 Soil and management units with brief description - - - - - - - - - - - 2718 Land capability sub-classes in Aurangabad district, Bihar with
brief description - - - - - - - - - - - - - - - - - - - - - - - - - 2819 Soil map(part) of Rohtas district, Bihar with brief description of soils - - 2920 Physiographic delineation (Part) of Patnagarh subdivision, Bolangir
district, Odisha - - - - - - - - - - - - - - - - - - - - - - - - - - 3021 Physiography map (Part) (1:50,000 scale) of Bolangir subdivision in
Bolangir district, Odisha - - - - - - - - - - - - - - - - - - - - - - 3022 Soil map of Khamaria farm, Jabalpur - - - - - - - - - - - - - - - - 3623 Proposed plan for BISA, Khamaria farm - - - - - - - - - - - - - - - 3624 Soil site suitability for maize crop in soils of Hayatnagar farm - - - - - 3825 Digital Elevation model - - - - - - - - - - - - - - - - - - - - - - 4026 Soil map of the study area - - - - - - - - - - - - - - - - - - - - - 4127 Soil map of Badajorenala Microwatershed - - - - - - - - - - - - - - 4128 Scatter-plot comparison of measured and predicted values of ECe for
validation datasets - - - - - - - - - - - - - - - - - - - - - - - - 4529 Soil reflectance spectra of soils - - - - - - - - - - - - - - - - - - - 4630 Soil series map of Parsori watershed, Nagpur - - - - - - - - - - - - - 4731 Phases of soil series map of Parsori watershed, Nagpur - - - - - - - - - 4732 Cartosat-1 sharpened LISS-IV data of Savli Village - - - - - - - - - - - 4833 DEM generated from Cartosat-I stereo pair - - - - - - - - - - - - - - 4834 Physiography-Land use integrated map - - - - - - - - - - - - - - - - 4935 DEM and topographic wetness Index of Maharashtra extracted from
SRTM data - - - - - - - - - - - - - - - - - - - - - - - - - - - 5036 Present status of District Soil Information System (DSIS) of India- - - - - 52
37 Changes in area under total oilseeds in Maharashtra - - - - - - - - - 5338 Soil loss map of Goa and Mizoram states - - - - - - - - - - - - - - 5439 Enriched land degradation map of Maharashtra state- - - - - - - - - - 5540 Landform-soils relationship in (a) Schistone terrain near Chitradurga,
and (b) Bidar plateau - - - - - - - - - - - - - - - - - - - - - - - 5741 Basalt flow junction near Alanda (a) and columnar structures at
St. Mary’s island, Malpe(b) - - - - - - - - - - - - - - - - - - - - - 5842 Horizonwise water retention characteristics of Kharbi series - - - - - - - 5943 Water retention curves of Sindola series - - - - - - - - - - - - - - - 5944 Relation between Al concentration and clay in shrink-swell soils - - - - - 6245 Lubinites (L) presence in Kalwan soils (61-69 cm), an indication of
precipitation of Carbonate crystals due to aridity. - - - - - - - - - - - 6346 Zeolite (Z) presence in Koneri soils, a boon due to its capacity to
supply bases in soils and help to improve hydraulic properties and resist to develop high ESP. - - - - - - - - - - - - - - - - - - - - - 63
47 Risk assessment map of Cd of Jagiroad paper mill area - - - - - - - - - 6548 Risk assessment map of Ni of Jagiroad paper mill area - - - - - - - - - 6549 User interface for visualizing the database and selection of desired attributes - - 6650 Dissemination of information through mobile services - - - - - - - - - 6651 Organic carbon map of Nagaon district of Assam - - - - - - - - - - - 6752 (a) Organic carbon, and (b) available potassium maps of Dumka
district, Jharkhand - - - - - - - - - - - - - - - - - - - - - - - - 6853 Depth distribution in Rania core in terms of (a) pH, (b) EC,
(c) CaCO , (d) Organic carbon and (e) particle size distribution - - - - - 693
54 Simulation of organic carbon contents of the surface horizon (0-23 cm) of soils from four treatments on the LTFE site of Sarol - - - - - - - - - 71
55 Modified AESR map for IGP: an example of AESR 9.2 - - - - - - - - - 7256 Soil organic carbon maps of (a) Sehore (b) Nalgonda and
(c) Warangal districts - - - - - - - - - - - - - - - - - - - - - - - 7357 Modelled organic carbon contents for the surface horizon (0-23 cm)
of soils of treatments on the LTFE site of CICR, Panjri farm, Nagpur - - - 7458 Frequency distribution of (a) soil reaction (pH) and (b) available
potassium classes - - - - - - - - - - - - - - - - - - - - - - - - - 7659 Methodology for district level land use planning - - - - - - - - - - - - 7760 Net returns (Rs per ha) from suggested land use plans for Mysore District - - 7961 Agro-ecological units, Almora district - - - - - - - - - - - - - - - - 8062 Land management units, Gondia district, Maharashtra - - - - - - - - - 8363 Land categorization in Bundi district - - - - - - - - - - - - - - - - - 8664 Soils of Tirumale sub-watershed - - - - - - - - - - - - - - - - - - - 8965 Temporal change in organic carbon in soils of Tut Kalan series- - - - - - 9166 Changes in land utilization of NCT Delhi - - - - - - - - - - - - - - - 9367 Methodology of Soil Survey of Diring-Thanglong Micro-watershed- - - - 9468 Land Use-Land Cover map of Diring-Thenglong Watershed - - - - - - - 9569 Net Area Irrigated (NAI) and Agricultural productivity in Irrigated districts - 9870 Inverse and exponential relationship between amla yield and rainfall - - - 10071 Farmers in a cluster village of Gondia district discuss crop plan to
utilize residual soil moisture in drying bed of tank - - - - - - - - - - - 10172 Main menu software for Land Suitability for crops- - - - - - - - - - - 10373 Agro-climatic analysis and water balance calculation from monthly data - - - 104

AN
NU
AL R
EP
OR
T 2
011-1
2
vii
Executive Summary
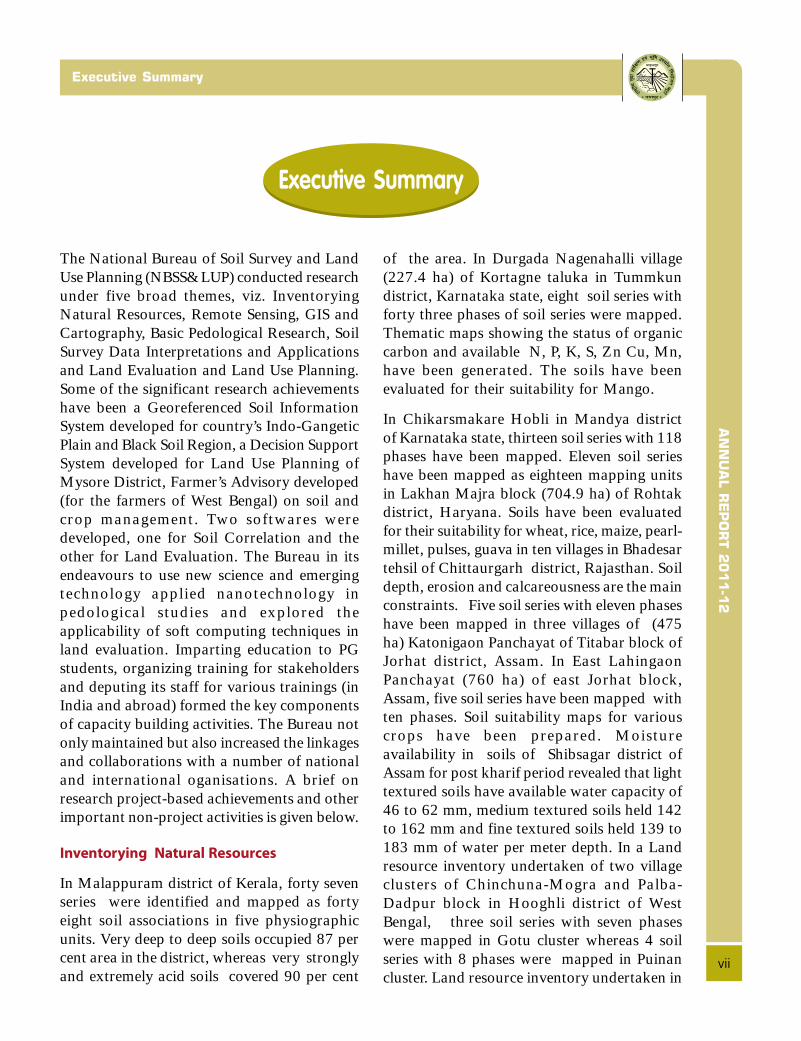
The National Bureau of Soil Survey and LandUse Planning (NBSS&LUP) conducted researchunder five broad themes, viz. InventoryingNatural Resources, Remote Sensing, GIS andCartography, Basic Pedological Research, SoilSurvey Data Interpretations and Applicationsand Land Evaluation and Land Use Planning.Some of the significant research achievementshave been a Georeferenced Soil InformationSystem developed for country’s Indo-GangeticPlain and Black Soil Region, a Decision SupportSystem developed for Land Use Planning ofMysore District, Farmer’s Advisory developed(for the farmers of West Bengal) on soil andcrop management. Two softwares weredeveloped, one for Soil Correlation and theother for Land Evaluation. The Bureau in itsendeavours to use new science and emergingtechnology applied nanotechnology inpedological studies and explored theapplicability of soft computing techniques inland evaluation. Imparting education to PGstudents, organizing training for stakeholdersand deputing its staff for various trainings (inIndia and abroad) formed the key componentsof capacity building activities. The Bureau notonly maintained but also increased the linkagesand collaborations with a number of nationaland international oganisations. A brief onresearch project-based achievements and otherimportant non-project activities is given below.
Inventorying Natural Resources
In Malappuram district of Kerala, forty sevenseries were identified and mapped as fortyeight soil associations in five physiographicunits. Very deep to deep soils occupied 87 percent area in the district, whereas very stronglyand extremely acid soils covered 90 per cent
of the area. In Durgada Nagenahalli village(227.4 ha) of Kortagne taluka in Tummkundistrict, Karnataka state, eight soil series withforty three phases of soil series were mapped.Thematic maps showing the status of organiccarbon and available N, P, K, S, Zn Cu, Mn,have been generated. The soils have beenevaluated for their suitability for Mango.
In Chikarsmakare Hobli in Mandya districtof Karnataka state, thirteen soil series with 118phases have been mapped. Eleven soil serieshave been mapped as eighteen mapping unitsin Lakhan Majra block (704.9 ha) of Rohtakdistrict, Haryana. Soils have been evaluatedfor their suitability for wheat, rice, maize, pearl-millet, pulses, guava in ten villages in Bhadesartehsil of Chittaurgarh district, Rajasthan. Soildepth, erosion and calcareousness are the mainconstraints. Five soil series with eleven phaseshave been mapped in three villages of (475ha) Katonigaon Panchayat of Titabar block ofJorhat district, Assam. In East LahingaonPanchayat (760 ha) of east Jorhat block,Assam, five soil series have been mapped withten phases. Soil suitability maps for variouscrops have been prepared. Moistureavailability in soils of Shibsagar district ofAssam for post kharif period revealed that lighttextured soils have available water capacity of46 to 62 mm, medium textured soils held 142to 162 mm and fine textured soils held 139 to183 mm of water per meter depth. In a Landresource inventory undertaken of two villageclusters of Chinchuna-Mogra and Palba-Dadpur block in Hooghli district of WestBengal, three soil series with seven phaseswere mapped in Gotu cluster whereas 4 soilseries with 8 phases were mapped in Puinancluster. Land resource inventory undertaken in
Executive Summary
AN
NU
AL R
EP
OR
T 2
011-1
2
viii
Executive Summary
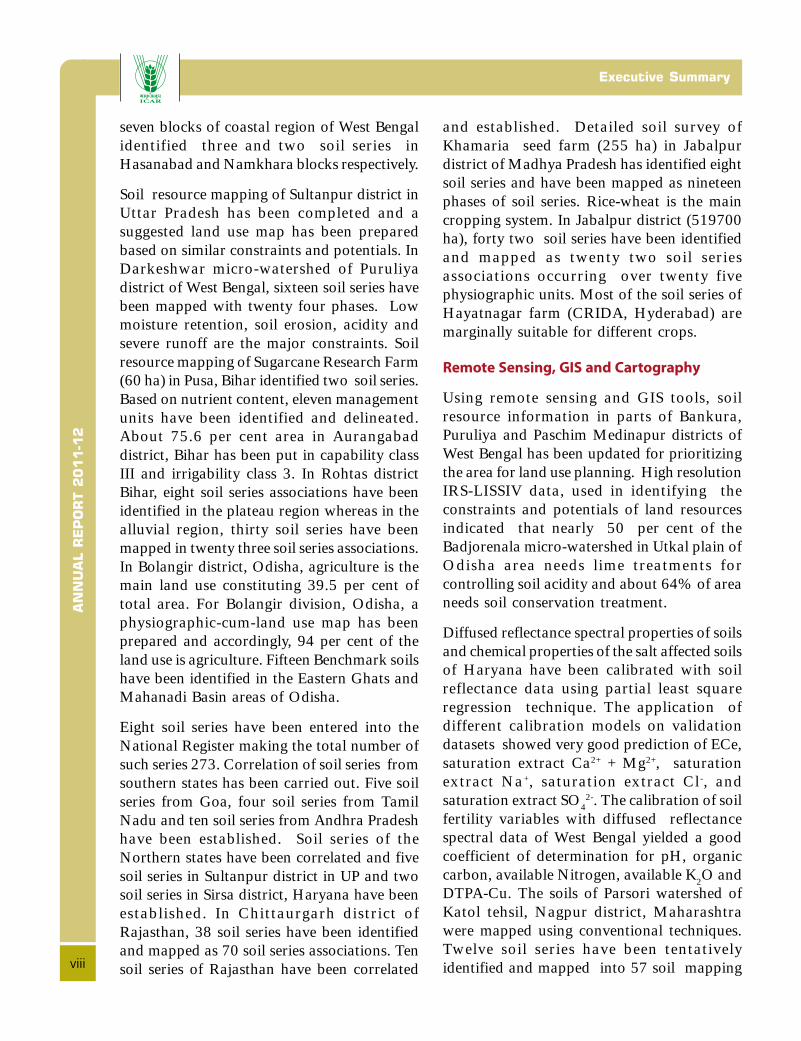
seven blocks of coastal region of West Bengalidentified three and two soil series inHasanabad and Namkhara blocks respectively.
Soil resource mapping of Sultanpur district inUttar Pradesh has been completed and asuggested land use map has been preparedbased on similar constraints and potentials. InDarkeshwar micro-watershed of Puruliyadistrict of West Bengal, sixteen soil series havebeen mapped with twenty four phases. Lowmoisture retention, soil erosion, acidity andsevere runoff are the major constraints. Soilresource mapping of Sugarcane Research Farm(60 ha) in Pusa, Bihar identified two soil series.Based on nutrient content, eleven managementunits have been identified and delineated.About 75.6 per cent area in Aurangabaddistrict, Bihar has been put in capability classIII and irrigability class 3. In Rohtas districtBihar, eight soil series associations have beenidentified in the plateau region whereas in thealluvial region, thirty soil series have beenmapped in twenty three soil series associations.In Bolangir district, Odisha, agriculture is themain land use constituting 39.5 per cent oftotal area. For Bolangir division, Odisha, aphysiographic-cum-land use map has beenprepared and accordingly, 94 per cent of theland use is agriculture. Fifteen Benchmark soilshave been identified in the Eastern Ghats andMahanadi Basin areas of Odisha.
Eight soil series have been entered into theNational Register making the total number ofsuch series 273. Correlation of soil series fromsouthern states has been carried out. Five soilseries from Goa, four soil series from TamilNadu and ten soil series from Andhra Pradeshhave been established. Soil series of theNorthern states have been correlated and fivesoil series in Sultanpur district in UP and twosoil series in Sirsa district, Haryana have beenestablished. In Chittaurgarh district ofRajasthan, 38 soil series have been identifiedand mapped as 70 soil series associations. Tensoil series of Rajasthan have been correlated
and established. Detailed soil survey ofKhamaria seed farm (255 ha) in Jabalpurdistrict of Madhya Pradesh has identified eightsoil series and have been mapped as nineteenphases of soil series. Rice-wheat is the maincropping system. In Jabalpur district (519700ha), forty two soil series have been identifiedand mapped as twenty two soil seriesassociations occurring over twenty fivephysiographic units. Most of the soil series ofHayatnagar farm (CRIDA, Hyderabad) aremarginally suitable for different crops.
Remote Sensing, GIS and Cartography
Using remote sensing and GIS tools, soilresource information in parts of Bankura,Puruliya and Paschim Medinapur districts ofWest Bengal has been updated for prioritizingthe area for land use planning. High resolutionIRS-LISSIV data, used in identifying theconstraints and potentials of land resourcesindicated that nearly 50 per cent of theBadjorenala micro-watershed in Utkal plain ofOdisha area needs lime treatments forcontrolling soil acidity and about 64% of areaneeds soil conservation treatment.
Diffused reflectance spectral properties of soilsand chemical properties of the salt affected soilsof Haryana have been calibrated with soilreflectance data using partial least squareregression technique. The application ofdifferent calibration models on validationdatasets showed very good prediction of ECe,saturation extract Ca2+ + Mg2+, saturationextract Na+, saturation extract Cl-, andsaturation extract SO4
2-. The calibration of soilfertility variables with diffused reflectancespectral data of West Bengal yielded a goodcoefficient of determination for pH, organiccarbon, available Nitrogen, available K2O andDTPA-Cu. The soils of Parsori watershed ofKatol tehsil, Nagpur district, Maharashtrawere mapped using conventional techniques.Twelve soil series have been tentativelyidentified and mapped into 57 soil mapping
AN
NU
AL R
EP
OR
T 2
011-1
2
ix
Executive Summary
units. To explore the potential of highresolution (2.5 m) Cartosat-1 data in cadastrallevel soil mapping, stereo pairs of the Cartosat-1 data were used to generate digital elevationmodel (DEM) of the Savli village, Nagpur.Using Shuttle Radar Topographic Mission(SRTM) 90 m elevation data, a seamlessmosaic of digital elevation model of India wasdeveloped and a number of theme maps ongeomorphometric parameters were generatedat country, state and AER levels. Fordeveloping Indian soil information system,digital database of river basin and sub-basinsof India was generated in GIS environment.In order to develop District soil informationsystem (DSIS) on 1:50,000 scale, soil databasefor fifteen districts have been digitized andconverted into uniform projection system andbrought under India district database. Pedo-Ecological Units (PEUs) were delineated forWardha district, Maharashtra to predict theLand Productivity Potential (LPP) for majorcrops using GIS. The preliminary study ofspatio-temporal variability of different cropareas indicated that area under total oilseedsand pulses in Maharashtra has increased during1975-76 to 2005-2006. Soil erosion maps ofGoa and Mizoram states were prepared using10 km grid data. Land degradation maps anddatasets of the country on 1:50,000 scaleprepared by NRSC were enriched with soilinformation viz. erosion, parent material, soildepth, surface soil texture, surface stoniness,calcareousness, pH, salinity / sodicity. Underthe project on National Spatial DataInfrastructure – Soil Resource database of thecountry, a draft report was prepared on ‘DataContent Standards – Soils (Ver. 2.0)’. Digitaldatabase system for storage and retrieval ofmaps and photographs and data transmissionwas developed.
Basic Pedological Research
Geomorphological analysis of CentralKarnataka Plateau indicates that low granitehills with tor and domal structure are
characteristics of clospet granite and gneisswhereas very low level ridges and undulatingtopography are restricted to schist terrains. Onmetamorphosed sandstone/shale beds,differential weathering was noticed. Shale bedsare easily weathered, eroded and depositeddown to form black soils leaving quartzite bedsas ridge tops. On Western Ghats, granite topswere observed with moderately deep red soilsin foot slopes. In St. Many’s Islands, perfectcolumns of hexagonal and polygonal structureare formed when lava is dammed up andcooled. The soils in the landscape varied dueto differential weathering and geomorphicdevelopment of the area.
A protocol has been developed for digestionand methods to determine different elementsin soils using ICP-Es indicates that hard lineelements like As, Hg, Si, and Mo can beanalysed with hydride generator and Si and Scan be analysed singly to avoid problem.Traditional digestion techniques are better thanmicrowave digestion for material containingSi and Al. Studies on water retention characteristicsof Yavatmal soils indicate that changes inmoisture content after 800 kPa were small andAWC varied widely among the pedons.
The abundance of non-exchangeable K indifferent soil types could be due to thedifference in illitic /mica content. The presenceof Kaoline in shrink-swell soils is an indicationof earlier humid climate. The presence of lubinitesin some shrink-swell soils of Maharashtra arethe ill effects of acidity whereas the presence ofzeolite is a boon that indirectly enhances thequality of soil. In an attempt to develop standardprotocols for separation of naturally occurringnon-particles, soil samples were collected toacross the agro-ecological subregions in thecountry so as to accommodate variability.
Soil Survey Data Interpretation and
Applications
Soil survey data found wide applications inquantifying effect of microbiological activity
AN
NU
AL R
EP
OR
T 2
011-1
2
x
Executive Summary
as evidenced from quantitative value ofmicrobial biomass carbon (MBC) andmicrobial biomass nitrogen (MBN) in differentland use systems. In extremely humid climatein the north-eastern region of the country,population of micro-organisms drasticallyreduced even just below 40 cm soil depth. Highconcentrations of heavy metals (Ni, Cr, Cd,Pb) are reported in the low lying areas ofBrahmaputra valley, Assam. Soil nutrientdatabase has been used in West Bengal todevelop the Farmers’ Advisory which is madeavailable through mobile service. Selectedsoybean-growing areas of Madhya Pradesh(Dhar district) have been characterized andevaluated using soil information. Correlatedsoil series have been found to be widely usedfor predicting soil carbon changes in the eventof climate change using different models. Ingeneral, Roth C and Century carbon modelsare found to capture the observations made indifferent long term fertilizer trials. Soilinformation has been geo-referenced to developa georeferenced soil information system(Geosis) for the Black Soil Region and Indo-Gangetic Plains of the country, modify agro-ecological sub region map, develop thememaps to ascertain exact soil quality parametersand various indices for soil and landquality. Soil survey data found an extremelyimportant application in finding out paleo-climate through pedological signatures in theform of soil physical, chemical andmineralogical parameters in the sediments ofCentral and Southern Ganga Plains. Significantvariations in textural composition and organiccarbon content could result in similarvariations in the pedotransfer functions (PTFs)developed out of these attributes. Robust PTFscould be obtained with use of additionaldatasets.
Soil fertility and plant nutrient managementadvisories were made available to farmers andmodel nutrient management plans weredeveloped for a village panchayat anddevelopment block in Sreekandapuram village
panchayat. High organic carbon content wasa predominant feature in the soils of Nagaondistrict, Assam. In Morigaon district,deficiency of available zinc and in Lakhimpurdistrict low nitrogen low to mediumphosphorous and potentials were observed.Kale land soils of Thrissur and Malappuramdistricts, Kerala were low in pH, high in OCand deficient in boron.
Land Evaluation and Land Use Planning
For development of district land use plan forMysore district, Karnataka, twelve landmanagement units (LMUs) were delineated inMysore district, Karnataka out of which 9 werein rainfed situation and 3 were in irrigatedsituation. Allotment of areas to different cropswas done using the Multiple Goal LinearProgramming (MGLP) model. A DecisionSupport System was developed for land useplanning in MS-ACCESS. The assessment ofstakeholders’ needs and economic evaluationof land utilization types (LUTs) for land useplanning of Mysore and North Goa districtsrevealed that from the present net income ofRs. 34188/ ha, it is possible to achieve a netincome of Rs. 1,57,553 ha. For thedevelopment of district land use plan ofAlmora district, Uttarakhand under Hill andMountain ecosystem, 8 agro-ecological subunits (AESR) were identified based on theNBSS&LUP agro-ecological zoning criteria.Eight land management units were identifiedin Jorhat district, Assam and cropping optionswere suggested based on socio-economicanalysis and biophysical land evaluation.LMU-4 under rabi vegetables gave the highestnet returns of Rs. 60243 per hectare.
Nine LMUs were identified and evaluated fortheir suitability for crops like rice, jute,mustard/rapeseed, wheat, sesame, sugarcaneand groundnut in Nadia district, West Bengal.LMUs 5 and 8 were found highly suitable forrice, LMUs 1 and 6 for June and LMU 1 and 7were highly for rapeseed/mustard and

AN
NU
AL R
EP
OR
T 2
011-1
2
xi
Executive Summary
groundnut. Six LMUs were identified inGondia district, Maharashtra and in all theLMUs, paddy is the main kharif crop and forestis the subsidiary land use. Bundi district,Rajasthan has been delineated in 11 LMUs.LMU 9 gave the highest net return ofRs. 37722/- per acre whereas LMU 11 gavethe lowest return of Rs. 4067 per acre.
In Nawansahar district of Punjab a significantchange in land use has occurred since 1959that has imparted soil properties. Soil organicmatter content increased in surface soils underrice-wheat system, whereas EC, pH, CaCO3
decreased in surface soils. Bulk density washigher in sub-surface soils and there was analarming rate in the fall of the ground watertable. Jalandhar district of Punjab revealed (ascompared to 1983) increase in the organiccarbon content in 2009. An integrated landuse plan was prepared for each LMU inTirumala sub-watershed in Magadi taluka ofRamanagar district of Karnataka state. About40 per cent area is under prime farm landswith rest of the 60 per cent under varioususes. Four soil series were mapped andevaluated for the suitability of crops like ragi,redgram, caster, arecanut, coconut, banana andmango. Land use dynamics in rural/urbaninterface of National Capital Region (NCR)falling under Delhi and Haryana sub-regionsrevealed significant reduction in area underforest which has since been restored.
Diring – Thanglong micro watershed of KarbiAnglong and Golaghat districts of Assamrevealed that 54.1% area is in under forestwhereas 18.5 per cent area is under cultivation.Ten soil series were mapped with 15 mappingunits as phases of soil series. In Khuskaranimicro-watershed, Birbhum district of WestBengal, six soil series were indentified and with7 mapping units as phases of soil series. Threesoil series of Dzonga farms, North Sikkimdistrict, Sikkim were largely suitable fortomato and ginger. In Jhalarapaton block ofJhalawar district in Rajasthan three soil series
were identified. In Chanavada watershed inGirva tehsil of Udaipur district, Rajasthan eightsoil series with eighteen soil mapping units asphases of soil series were mapped.
Integrated farming system approach to ensurerural livelihood security for a cluster of villagesin Aurangabad, Gondia and Dhule districtsincreased paddy yield of all varieties by 30per cent with reduced seed rate of 5 kg acre.Fish farming as a component of sustainablefarming system and effective water use resultedin fish farming farmers netting an averageincome of Rs. 40000 during 2011-12. Lackof rain water management is to be the majorissue of concern in the backward districts ofIndia. Fuzzy modelling was validated as aneffective land evaluation tool toll for the soilsof Nagpur district, Maharashtra for rainfedBt cotton. Computer based software moduleshave been developed and tested for assessingthe suitability of soils for different crops andestimating soil-water balance. A contingentcrop plan for the selected districts ofMaharashtra has been prepared and for MP,soil depth maps for 50 districts have beengenerated. Soil maps of UP, Haryana, andUttarakhand were generalized based oninformation on different themes forpreparation of contingency plan for thesestates.
Post Graduate Education
• Five M.Sc. (LRM) and one Ph.D. (LRM)students submitted their thesis during thecurrent academic session, in the Post-Graduate Education and Researchprogramme undertaken at the Hqrs. withDr. PDKV, Akola.
Training Organised
• Nine trainings were organized in the fieldof latest techniques of Remote Sensing,GIS, Carbon Modelling, Soil Surveyand Mapping and Land ResourceManagement.
AN
NU
AL R
EP
OR
T 2
011-1
2
xii
Executive Summary
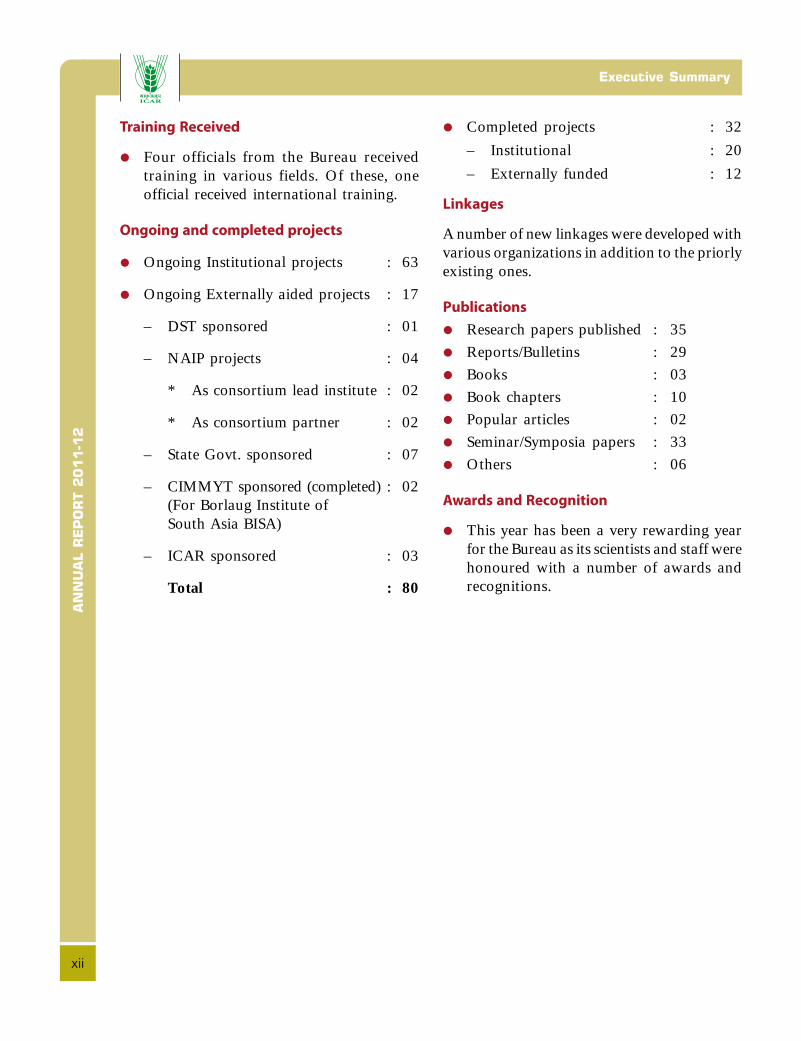
Training Received
• Four officials from the Bureau receivedtraining in various fields. Of these, oneofficial received international training.
Ongoing and completed projects
• Ongoing Institutional projects : 63
• Ongoing Externally aided projects : 17
– DST sponsored : 01
– NAIP projects : 04
* As consortium lead institute : 02
* As consortium partner : 02
– State Govt. sponsored : 07
– CIMMYT sponsored (completed) : 02(For Borlaug Institute ofSouth Asia BISA)
– ICAR sponsored : 03
Total : 80
• Completed projects : 32
– Institutional : 20
– Externally funded : 12
Linkages
A number of new linkages were developed withvarious organizations in addition to the priorlyexisting ones.
Publications
• Research papers published : 35
• Reports/Bulletins : 29
• Books : 03
• Book chapters : 10• Popular articles : 02
• Seminar/Symposia papers : 33
• Others : 06
Awards and Recognition
• This year has been a very rewarding yearfor the Bureau as its scientists and staff werehonoured with a number of awards andrecognitions.
AN
NU
AL R
EP
OR
T 2
011-1
2
i
dk;Zdkjh lkjka'kdk;Zdkjh lkjka'kdk;Zdkjh lkjka'kdk;Zdkjh lkjka'kdk;Zdkjh lkjka'k
dk;Zdkjh lkjka'kdk;Zdkjh lkjka'kdk;Zdkjh lkjka'kdk;Zdkjh lkjka'kdk;Zdkjh lkjka'k
jk"V™h; e`nk losZ{k.k ,oa Hkwfe mi;ksx fu;kstu C;wjks(jk-e`-losZ-,oa- Hkw-m-fu-C;wjks) }kjk foLr`r :i ls ikap fo"k;ksatSls Ákœfrd lalkËku vkdyu] lqnwj laosnu] HkkSxksfydlwpuk Á.kkyh ,oa ekufp=.k] vkËkkjHkwr e`nkfoKku lacafËkrvuqlaËkku] e`nk losZ{k.k vkadM+ksa dk fuoZpu ,oa mi;ksxvkSj Hkwfe ewY;kadu ,oa Hkwfe mi;ksx fu;kstu lacafËkrvuqlaËkku dk;ks± dk fu"iknu fd;k tkrk gSA vuqlaËkku lslacafËkr oqGN egRoiw.kZ miyfCËk;ksa esa xaxk osG eSnkuh Hkkxdh tyks<+ fefV~V;ka ,oa dkyh e`nk {ks=ksa dh Hkw&lanZHkh;e`nk lwpuk Á.kkyh] eSlwj ftys esa Hkwfe mi;ksx fu;kstu gsrqfu.kZ;@vkËkkj Á.kkyh] if'pe caxky osG fdlkuksa gsrq e`nk,oa Qly ÁcaËku gsrq ijke'kZ lfefr cukuk gSA e`nklg&lacaËku ,oa Hkwfe ewY;kadu gsrq nks lk∂Vos;j fodflrfd, x, gSaA C;wjks vius e`nk vuqlaËkku esa uohu oSKkfudh;rduhdh tSls uSuks&rduhdh dks Á;ksx esa ykus tk jgh gSaALukrdksŸkj f'k{kk vkSj e`nk lalkËku vkdyu es alk∂V&lax.kdh; rduhdh osG mi;ksx osG lkFk&lkFk rFkkHkkxhnkjh gsrq fofHkUu Áf'k{k.k dk;Zÿeksa dk vk;kstu djukrFkk vius deZpkfj;ksa dks ns'k&fons'k esa Hkstuk muosG dkS'kY;dks c<+kus dh vksj ,d dne gSA C;wjks us vius fofHkUujk"V™h; ,oa varjjk"V™h; laLFkkuksa osG lkFk py jgs viusvuqcaËk dks dk;e j[kus osG lkFk&gh&lkFk vius bl nk;jsdks vkSj Hkh O;kid cuk;kA vuqlaËkku ÁdYiksa ij vkËkkfjrmiyfCËk;ks a ,oa vU; egRoiw.kZ xSj&ÁdYi lacafËkrxfrfofËk;ksa dk fooj.k fuEukuqlkj gSA
Ákœfrd lalkËku vkdyu
osGjy Áns'k osG eYykiqje ftys esa lSarkyhl e`nk Jsf.k;ksadh ikap Hkw&vkœfr ij igpku dh x;h gS vkSj budkvM+rkfyl e`nk&oxZ esa ekufp=.k fd;k x;k gSA bl {ks=esa cgqr xgjh vkSj xgjh enk,a lŸkklh Áfr'kr rFkk cgqr T;knkvEyh; e`nk,a uCcs Áfr'kr ik;h x;h gSaA dukZVd Áns'k
osG rqeoqGj ftyk (dksVkXus rkyqdk) esa nwjxknk ukxsukgYyhxkao (227-4 gsDVs;j) dh e`nkvksa osG losZ{k.k }kjk vkBe`nk Jsf.k;ksa dks rSarkyhl e`nk bdkbZ;ksa esa ekufpf=r fd;kx;k rFkk bu enkvksa esa ik;h tkus okyh ukbV™kstu] QkLQksjl]ikSVsf'k;e] lYQj] ftad] dkWij vkSj eSaxuht osG fo"k;dekufp= cuk, x, gSaA bu e`nkvksa dk vke Qy dh mi;qDrkosG fy, Hkh ewY;kadu fd;k x;kA blh Ádkj dukZVdjkT; osG ek.M;k ftys esa fpdkjlekdjs gkscyh esa rsjge`nk Jsf.k;ksa dh igpku dh x;h vkSj ,d lkS vBkjg e`nkbdkbZ }kjk ekufp= esa n'kkZ;k x;k gSA bu e`nkvksa dks xsgwa]Ëkku] eDdk] cktjk] nyguh Qlyksa vkSj ve:n dhmi;qDrrk vuqlkj oxhZœr fd;k x;k gSA jktLFkku Áns'kosG fpŸkkSM+x<+ ftys (Hksnlj rglhy) esa e`nk dh xgjkbZ]vijnu rFkk pwus dh leL;k dh vfËkdrk gSA vle osGtksjgkV ftys esa iwohZ ykghuxkao iapk;r (760 gsDVs;j)dk losZ{k.k fd;k x;kA bl iapk;r dh Hkwfe esa ikap e`nkJsf.k;ksa dh igpku dh x;h vkSj bu e`nk Jsf.k;ksa dks nle`nk lewg esa Ánf'kZr dj budk ekufp=.k fd;k x;kAfofHkUu Qlyksa osG fy, e`nk&mi;qDrrk ekufp= rS;kjfd, x,A f'kclkxj ftyk (vle) esa [kjhQ osG ckne`nk esa ueh dk vkdyu fd;k x;k ftlesa gYdh e`nkvksaesa fN;kyhl ls cklB feeh- ikuh] eË;e xBu okyh feV~Vhesa ,d lkS c;kyhl ls ,d lkS cklB feeh- ikuh rFkkvPNh xBu okyh e`nk esa ,d lkS mupkyhl ls ,d lkSfrjklh fe-eh- ikuh Áfr ehVj xgjkbZ esa ik;k x;kA gqxyhftyk (if'pe caxky) osG fpapquk&eksxjk ,oa iYok&nkniqjCykWd osG nks xkaoksa osG lewg dk e`nk lalkËku vkdyufd;k x;k ftlesa rhu e`nk Jsf.k;ksa dks lkr e`nk bdkbZ;ksa}kjk ekufpf=r dj n'kkZ;k x;kA blh rjg if'pe caxkyosG rVh; Hkw&Hkkx esa lkr CykWd osG losZ{k.k }kjk glukcknesa rhu vkSj uke[kkuk CykWd esa nks e`nk Jsf.k;ka feyhAlqYrkuiqj ftyk (mŸkj Áns'k) dk e`nk lalkËku vkdyu

AN
NU
AL R
EP
OR
T 2
011-1
2
ii
dk;Zdkjh lkjka'kdk;Zdkjh lkjka'kdk;Zdkjh lkjka'kdk;Zdkjh lkjka'kdk;Zdkjh lkjka'k
fd;k x;k vkSj e`nk leL;k ,oa {kerk osG vkËkkj ij e`nkmi;ksx dk lq>ko fn;k x;k gSA nkjosG'oj lw{e&tykxe]iq:fy;k ftyk (if'pe caxky) esa lksyg e`nk Jsf.k;ksadks pkSchl e`nk bdkbZ;ksa }kjk n'kkZ;k x;k gSA ;gka dhe`nkvksa dh eq[; leL;kvksa de ueh Ëkkj.k] e`nk vijnu]vEyh;rk ,oa cgqr T;knk ikuh dk cgko gSaA iwlk (fcgkj)esa xUuk vuqlaËkku {ks= (60 gsDVs;j) esa e`nk losZ{k.k osGnkSjku nks e`nk Jsf.k;ka ik;h x;h gSaA e`nk iks"kd rRoksa osGvkËkkj ij X;kjg ÁcaËku Hkwfe ,dd (;wfuV) cuk;h x;hvkSj ekufp= }kjk mUgsa Ánf'kZr fd;k x;kA vkSjaxkcknftyk (fcgkj) esa 75-6 Áfr'kr e`nk dks e`nk lkeF;ZJs.kh&III vkSj flapkbZ lkeFkZ oxZ&3 esa j[kk x;kA jksgrklftyk (fcgkj) osG iBkjh Hkkx esa vkB e`nkvksa osG lkgp;ZvkSj tyks<+h; Hkkx esa rhl e`nk Jsf.k;ksa dks iPphl e`nklkgp;Z }kjk Ánf'kZr fd;k x;k gSA cksykafxj laHkkx(mM+hlk) Hkw&lajpuk&Hkwfe mi;ksx ekufp= cukus ls ;girk yxk fd ;gka fd pkSjkucs Áfr'kr Hkwfe {ks= œf"k esagSaA iwohZ ?kkV vkSj egkunh dh ?kkVh esa iUÊg csapekoZGe`nkvksa dks igpkuk x;k gSA bl lky jk"V™h; iqfLrdk esavkB csapekoZG e`nkvksa dk lekos'k fd;k x;k gSA vcbudh la[;k c<+dj nks lkS frgŸkj gks x;h gSA e`nklg&lacaËku dk;Z nf{k.kh izns'kksa esa Hkh fd;k x;k gSA xksokdh ikap e`nk Jsf.k;ka] rfeyukMw dh pkj Jsf.k;ka vkSjvkUËkz Áns'k dh nl e`nk Jsf.k;ksa dks csapekoZG e`nk dk ntkZÁnku fd;k x;kA mŸkjh Áns'kksa esa e`nk lg&lacaËku dk;Z osGnkSjku lqYrkuiqj (mŸkj Áns'k) ls ikap vkSj fljlk ftyk(gfj;k.kk) ls nks e`nk Jsf.k;kas dks csapekoZG osG :i esaLFkkfir fd;k x;kA fprkS<+x<+ ftyk (jktLFkku) esa 38e`nk Jsf.k;ksa dh igpku dh x;h vkSj mudk lŸkj e`nkJs.kh&lkgp;Z esa ekufp=.k fd;k x;kA jktLFkku dh nle`nk Jsf.k;ksa dk e`nk lg&lacaËku fd;k x;k vkSj mudksLFkkfir fd;k x;kA [kefj;k] tcyiqj (eË; Áns'k) chtÁs{ks= (255 gsDVs;j) dk foLr`r e`nk losZ{k.k fd;k x;kvkSj vkB e`nk Jsf.k;ksa dh igpku dh x;h vkSj mUuhle`nk ekufpf=r bdkb;ksa esa mudk ekufp=.k fd;k x;kAbl {ks= esa xsgwa&pkoy eq[; Qly Á.kkyh gSA tcyiqjftyk esa (519700 gsDVs;j) 42 e`nk Jsf.k;ksa dh igpkudh x;h vkSj 21 e`nk&lkgp;Z dks 25 Hkw&lajpuk osG lkFk
fn[kk;k x;kA osGUÊh; ckjkuh œf"k vuqlaËkku laLFkku]gSnjkckn osG g;kr uxj (gSnjkckn) esa o"kZ 2011&12 osGnkSjku igpku dh x;h e`nk Jsf.k;ka] Qly dh mi;qDrrkgsrq d"Vœ"; gSaA
lqnwj laosnu] HkkSxksfyd lwpuk Á.kkyh vkSjekufp=.k
lqnwj laosnu vkSj HkkSxksfyd lwpuk Á.kkyh dk Á;ksx djosGckaoqGjk] iq:fy;k vkSj if'pe fenukiqj ftyk (if'pecaxky) osG oqGN Hkkxksa osG enk&lalkËku lwpuk dks mUufr'khycuk;k x;k] ftlls Hkwfe mi;ksx dks ÁkFkfedrk nh tklosGA ckM+tksjsukyk lw{e&tykxe (mRdy leryh; Hkkx)mM+hlk esa mPp&fjtksywlu (vkbZ-vkj-&,y- fyl- IV
vkadM+k) dk Á;ksx djosG e`nk lalkËku esa ckËkd rRoksavkSj {kerk dks igpkuk x;kA djhcu 50 Áfr'kr {ks= esavEyh; e`nkvksa esa pwuk Mkyuk rFkk 64 Áfr'kr {ks= esa e`nklaj{k.k mipkj dh flQkfj'k (laLrqfr) dh x;h gSA
lqnwj laosnu Á.kkyh dh fodh.kZ LisDV™y xq.kËkeZ }kjk yo.kÁHkkfor feV~V;ksa (gfj;k.kk) osG vkSj e`nk osG jklk;fudxq.kËkeZ dks fofHkUu lkaf[;dh; ?kVdksa }kjk va'kkadu fd;kx;kA lkaf[;dh; va'kkadu ls irk pyk fd lar`Ir lr esafo|qr pkydrk oSGfY'k;e] eSfXuf'k;e] lksfM;e] DyksjkbMvkSj lYisGV dk fodh.kZ LisDV™y xq.kËkeZ ls vPNk lacaËkgSA if'pe caxky esa e`nk moZjrk la'kksËku esa fodh.kZ LisDV™yxq.kËkeZ dk ih-,p- eku] vkxsZfud dkcZu miyCËk ukbV™kstu]iksVk'k vkSj Mh-Vh-ih-,- dkij esa vPNk lg&lacaº feykAikjlksjh tykxe dkVksy rglhy (ukxiqj) esa ikjEikfjdrduhdh dk mi;ksx dj ckjg e`nk Jsf.k;ksa dk lŸkkoue`nk bdkbZ;ksa esa ekufp=.k fd;k x;kA lkoyh xkao esa2-5 ehVj osG fjtksywlu okys vkadM+k dk Hkwdj ekufp=.kcukus gsrq mi;ksx fd;k x;kA 'kVy jMky VksiksxzkQh fe'kudh lgk;rk ls ,d lheysl ekstSd cuk;k x;k vkSj ns'k]jkT;ksa vkSj œf"k ikfjfLFkdh; {ks=ksa osG fo"k; ij ekufp=cuk, x,A Hkkjrh; e`nk lwpuk Á.kkyh fodflr djus osGrgr unh;&?kkVh vkSj unh;&mi?kkVh dk fMthVy vkadM+krS;kj fd;k x;kA pkj ftyksa dk fMthVy vkadM+k(1%50]000 iSekuk ij) rS;kj fd;k x;kA oËkkZ ftys osG50 txgksa esa Hkw&ikfjfLFkfrdh; {kerk dks fn[kk;k x;k gSA
AN
NU
AL R
EP
OR
T 2
011-1
2
iii
dk;Zdkjh lkjka'kdk;Zdkjh lkjka'kdk;Zdkjh lkjka'kdk;Zdkjh lkjka'kdk;Zdkjh lkjka'k
LFkkuh;≤varjky vË;;u ls irk pyk fd egkjk"V™esa 1975&76 ls 2005&2006 osG nkSjku nyguh vkSj fryguhQlyksa dk {ks=Qy c<+k gSA xksok vkSj fetksje osG e`nkvijnu ekufp= 10 fd-eh- tkyh (xzhM) vkadM+ksa dksysdj cuk, x,A jk"V™h; lqnwj laosnu osGUÊ] gSnjkckn }kjkcuk;k x;k e`nk&fuEuhdj.k ekufp= (1%50]000 iSekuk)dks vijnu] e`nk&iSr`d inkFkZ] e`nk xgjkbZ] lrgh e`nkxgu] lrgh iRFkjiu] pwukiu] ih-,p-eku] yo.krk@{kkjh;rk osG vkadM+ksa }kjk leº cuk;k x;kA jk"V™h; LFkkfudvkadM+k lajpuk&ns'k osG Hkwfe lalkËku vkadM+k ifj;kstukosG rgr ,d elkSnk fjiksVZ dks Hkw&LFkkfud vkadM+ksa osGfy, rS;kj fd;k x;kA laxzg.k ,oa ekufp=ksa osG lqËkkj]Nk;kfp=ksa rFkk vkadM+ksa osG lapkj.k gsrq fMthVy vkadM+kvkËkkfjr Á.kkyh fodflr dh x;hA
vkËkkjHkwr e`nkoSKkfud vuqlaËkkuHkw&vkœfr osG vË;;u ls irk pyk fd dukZVd osG osGUÊh;iBkj ij de ≈apkbZ osG xzsukbV ioZr esa Vksj (xzsukbV osGiRFkj) vkSj xqEcnh; lajpuk DykslisV xzsukbV vkSj fulosG gSa vkSj cgqr de m°Gph ioZr Js.kh vkSj ≈°ph&uhphtehu flLV ls lEcfËkr Hkw&Hkkx gSA :ikUrfjr lSUMLVksu@'ksy lrg ij vi{kuh; fofHkUurk gSA 'ksy lrg vklkuhls vi{k;u gksdj uhps tek gks tkrk gS vkSj blls dkyhfeV~Vh curh gS ysfdu LQfVd m°Gps ioZr Js.kh ij fVdkjg tkrk gSA if'peh ?kkV esa xzsukbV Vki ij eË;e xgjkbZdh yky fefV~V;ka igkM+ osG ry ij gSaA lsaV eSjh }hi esa"kV~dks.kh; vkSj cgqHkqth; LrEHk osG rjg dh lajpuk cuhgS tks ykok osG ue vkSj BaMk gksus osG dkj.k gSA fofHkUu rjgosG vi{k;u vkSj Hkw&vkœfr osG pyrs ;gka dh e`nk,acuh gSaA vkbZ-lh-ih- esa vklsZfud] eoZGjh] flYdku vkSjekfyCMsue dk fo'ys"k.k djus gsrq ,d ÁksVksdky fodflrfd;k x;k gS ftlesa , rRo gkbM™kbM tujsVj osG }kjk rFkkflydku vkSj lYQj dks vosGys esa fo'ysf"kr fd;k tkldrk gSA ikjEikfjd rduhdh] flYdkWu vkSj ,Y;wfefu;eosG fo'ys"k.k gsrq ekbÿksoso ikpu ls vPNh gSA ;orekyftys dh e`nkvksa dk ty Ëkkj.k osG vË;;u ls irk yxkfd buesa 800 osG-ih-,- osG ckn cnyko de gS vkSj miyCËkty {kerk fofHkUu e`nk ifjPNsfndk esa fofHkUu gSA fofHkUue`nkvksa esa vfofue;h iksVSf'k;e dh ek=k bykbZV@ekbdk
dh mifLFkfr crkrk gSA dk;ksfyu dh dkyh fefV~V;ksa esamifLFkfr fiNys tyok;q ifjorZu dks n'kkZrk gSA egkjk"V™dh oqGN iwGyus&floqGM+us okyh fefV~V;ksa esa yqchukbZV dhmifLFkfr Ákœfrd fuEuhdj.k dks n'kkZrh gS tcfdft;ksykbV feV~Vh osG fy, Ákœfrd ojnku gS fofHkUuœf"k ikfjfLFkfrdh; mi&Hkkx dh e`nkvksa ls uSuksikfVZdyosG i`Fkd~dhdj.k gsrq ,d ÁksVksdky osG rgr e`nk uewuksa dks,df=r fd;k x;k gS ftlls muesa fofoËkrk ns[kh tk losGA
e`nk losZ{k.k vkadM+ksa dh O;k[;k ,oa vuqÁ;ksx
fofHkUu Hkwfe fu;kstu Á.kkyh esa e`nk losZ{k.k vkadM+s e`nkesa lw{e tSfodh; fÿ;k dks lw{e tSoh; dkcZu <s+j rFkklw{e tSoh; u=tu dh ek=k dks irk yxkus esa dkQhlgk;d gSaA ns'k osG mŸkj&iwohZ {ks= esa tks dkQh vkÊZ gSmuesa lw{e thoksa dh tula[;k dkQh rsth ls de (40 ls-eh- xgjkbZ osG uhps) gqbZ gSA vle cz„iq= ?kkVh esa HkkjhËkkrq tSls fufdy] ÿksfe;e] oSGMfe;e] ysM dh mPplkUÊrk ik;h x;hA e`nk iks"kd rRoksa osG vkËkkjHkwr vkadM+ksadks if'pe caxky esa fdlkuksa osG lykg gsrq mi;ksx esayk;k x;k vkSj eksckby lsok ij miyCËk djk;k x;kA Ëkkjftyk (eË; Áns'k) lks;kchu&mxkus okyh e`nkvksa dkvkdyu e`nk lwpuk osG rgr fd;k x;kA lg&lacafËkre`nk Jsf.k;ksa osG e`nk dkcZu dks okrkoj.k cnyko esa fofHkUuekWMyksa osG }kjk vË;;u esa Á;ksx fd;k x;kA lsUpqjh dkcZuekWMy vkSj jksFk&lh ekWMy nh?kZdkyhu moZjd osG voyksdudks vPNh rjg idM+kA ns'k osG dkyh feV~Vh okys {ks= ,oaxaxk osG eSnkuh Hkkx dh e`nk lwpukvksa osG lanHkZ gsrq œf"k&ikfjfLFkfrdh; mi&{ks=ksa osG ekufp=ksa dk lqËkkj] fo"k;dekufp=ksa dk fodkl] e`nk xq.koŸkk dk irk yxkuk ,oae`nk rFkk Hkwfe xq.koŸkk laosGrksa dks fodflr fd;k x;k gS]ftlls Hkw&lanZHkh; e`nk lwpuk Á.kkyh dk fodkl gks losGAe`nk losZ{k.k ls eË; vkSj nf{k.kh xaxk osG tyks<+h; Hkkx lsvolkn esa ÁkIr HkkSfrd] jklk;fud ,oa [kfuth; xq.kËkeZ]iwoZ osG tyok;q cnyko osG vË;;u esa lg;ksxh lkfcrgq,A e`nk osG xBu vkSj dkcZfud inkFkZ esa fofHkUurk] ih-Vh-,Q,l- esa Hkh fn[kk;h nhA mPp xq.koŸkk dk ih-Vh-,Q,l- cukus esa vkSj vkadM+ksa dh t:jr gSA
JhoaGniqje esa fdlkuksa dks ikni iks"kd rRoksa dh tkudkjhgsrq ekWMy iks"kd rRo ;kstuk cukbZ x;h gSA ukoxkao ftyk
AN
NU
AL R
EP
OR
T 2
011-1
2
iv
dk;Zdkjh lkjka'kdk;Zdkjh lkjka'kdk;Zdkjh lkjka'kdk;Zdkjh lkjka'kdk;Zdkjh lkjka'k
(vle) dh e`nkvksa esa vfËkd ek=k esa dkcZfud inkFkZfeykA eksjbZxkao (vle) esa ftad miyCËkrk esa deh ns[khx;h vkSj y[kheiqj ftyk esa ukbV™kstu dh deh] QkLQksjldh de ls eË;e miyCËkrk fn[kk;h nhA eSlwj ,oaeYykiqje dh dksy Hkwfe de vEyh;] de ih-,p-eku]mPp dkcZu inkFkZ rFkk cksjku dh dfe;ksa ls xzflr gSaA
Hkwfe ewY;kadu ,oa Hkwfe mi;ksx fu;kstu
eSlwj ftyk (dukZVd) osG Hkwfe mi;ksx ;kstuk dks fodflrdjus esa ckjg Hkwfe ÁcaËku bdkbZ;ksa dh :ijs[kk cukbZ x;hftuesa 9 ckjkuh {ks= esa gSa vkSj 3 flafpr {ks= esa gSA fofHkUuQlyksa dk {ks=h; vkoaVu djus gsrq ,e-th-,y-ih- ekWMydk Á;ksx fd;k x;kA Hkwfe mi;ksx fu;kstu gsrq ,e-,l-&,-lh-lh-bZ-,l-,l- esa ,d fu.kZ;kRed vkËkkjHkwr Á.kkyhfodflr dh x;hA lgHkkfx;ksa dh t:jrksa] Hkwfe mi;ksfxrkÁdkj }kjk Hkwfe mi;ksx fu;kstu dk vkfFkZd ewY;kadu lsirk pyk dh orZeku vk; (#i;s 34188@&) Áfr gsDVs;jls #i;s 157533@& Áfr gsDVs;j gks ldrh gSA igkM+ vkSjioZrh; ikfjfLFkfrdh Á.kkyh osG varxZr vYeksM+k ftyk(mŸkjk[kaM) esa vkB ikfjfLFkfrdh; mi&bdkbZ igpkuhx;hA tksjgkV ftyk (vle) esa vkB Hkwfe ÁcaËku bdkbZ;ksadh igpku dh x;h vkSj lkekftd&vkfFkZd foospuvkSj tSo&HkkSfrdh; Hkwfe ewY;kadu osG vkËkkj ij mi;qDrQly Á.kkyh dh laLrqfr dh x;hA Hkwfe ÁcaËku bdkbZ&4esa joh lfCt;ksa }kjk lcls T;knk #i;s 60243@& ÁfrgsDVs;j ÁkIr gq,A iatkc osG uok'kgj ftyk esa Hkwfe mi;ksxdk e`nk xq.kËkeZ ij 1959 ls dkQh ÁHkko iM+kA Ëkku&xsgwaQly Á.kkyh esa e`nk dkcZfud inkFkZ lrgh Hkkx esa c<+kysfdu fo|qr pkydrk] ih-,p-eku] pwus dh ek=k ?kVx;hA e`nk l?kurk e`nk osG mi&lrg esa c<+ x;h ysfdutehuh; ty dh ek=k dkQh ?kV jgh gSA iatkc osG tkyaËkjftys esa 1983 osG lanHkZ esa e`nk dkcZfud inkFkZ dh 2009esa c<+ksŸkjh ik;h x;hA jkekuxj ftyk (dukZVd) osG ekxM+hrkyqdk osG varxZr fr:ekyk mi&tykxe esa ÁR;sd HkwfeÁcaËku bdkbZ osG fy, ledfyr Hkwfe mi;ksx cuk;k x;kAdjhcu 40 Áfr'kr Hkwfe mRœ"V gS vkSj 'ks"k Hkwfe fofHkUurjg osG Á;ksxksa esa gSA pkj e`nk Jsf.k;ksa dks ekufpf=rdjosG mudks jkxh] vjgj] vjaMh] lqikM+h] ukfj;y] osGyk
rFkk vke osG mi;qDrk osG fy, ewY;kafdr fd;k x;kAfnYyh vkSj gfj;k.kk mi&laHkkx dk xzkeh.k vkSj 'kgjhvUrj i`"B (jk"V™h; jktËkkuh laHkkx) esa Hkwfe mi;ksx osGcnyko osG vË;;u ls irk pyk fd taxy osG {ks=Qy esadkQh deh vk;h gSA ftlesa vc lqËkkj vk;k gSA
dchZ ,axykax vkSj xksyk?kkV ftyksa (vle) osG Mhfjax&FkkUxyksx lw{e tykxe esa 54-1 Áfr'kr {ks=Qy taxy rFkk18-5 Áfr'kr {ks=Qy œf"k&tksr osG vanj ik;k x;kA nle`nk Jsf.k;ksa dks 15 ekufp=.k bdkb;ksa }kjk ekufp= esan'kkZ;k x;kA chjHkwe ftyk (if'pe caxky) osG [kq'kdkjuhlw{e tykxe esa 6 e`nk Jsf.k;ksa dks 7 ekufp= bdkb;ksa}kjk ekufpf=r fd;k x;kA ntvksaxk Á{ks= (mŸkjhflfDde)] flfDde esa nks e`nk Jsf.k;ka VekVj vkSj vnjdosG fy, dkQh mi;qDr ik;h x;hA >kykokj ftyk(jktLFkku) osG >kykj iVku CykWd esa rhu e`nk Jsf.k;ksadh igpku dh x;h gSA mn;iqj (jktLFkku) osG fxjok rglhyesa vkB e`nk Jsf.k;ksa dks vBkjg ekufp=.k bdkb;ksa esaekufpf=r fd;k x;k gSA
vkSjaxkckn] xksfUn;k vkSj Ëkqys ftyksa (egkjk"V™) osG oqGNxkaoksa osG lewgksa esa ledkfyr [ksrh Á.kkyh osG Á;ksx }kjkxzkeh.kksa dh thfodk dks lqjf{kr djus osG rgr ;g ns[kkx;k fd Ëkku dh lHkh tkfr;ksa dh iSnkokj esa djhcu 30Áfr'kr dk btkQk gqvk vkSj lkFk esa cht nj esa 5 fdyksÁfr ,dM+ esa deh gqbZA nh?kZdkyhu [ksrh Á.kkyh esa eNyhikyu vkSj ikuh osG leqfpr mi;ksx osG rgr xzkeh.k dks#i;s 40000@& dh vkSlr vk; gqbZA fiNM+s ftyksa esa cjlkrhikuh dk ÁcaËku cgqr egRoiw.kZ gSA ch-Vh- dikl gsrq Hkwfevkdyu esa Qth ykftd dk Á;ksx fd;k gSA lax.kdvkËkkfjr lk∂Vos;j ekikadksa dk fodkl fd;k x;k vkSjfofHkUu Qlyksa dks mi;qDrrk rFkk e`nk ty larqyu ekiuosG fy, ijh{k.k fd, x,A
LukrdksŸkj f'k{kk• bl 'kS{kf.kd o"kZ esa ,e-,l-lh- (,y-vkj-,e-) osG
ikap vkSj ih-,p-Mh (,y-vkj-,e-) osG ,d Nk= usviuk 'kksËk&ÁcaËk tek fd;kA ;g MkW- iatkc jkons[keq[k œf"k fo'ofo|ky;] vdksyk osG lg;ksx lsfd;k x;kA
AN
NU
AL R
EP
OR
T 2
011-1
2
v
dk;Zdkjh lkjka'kdk;Zdkjh lkjka'kdk;Zdkjh lkjka'kdk;Zdkjh lkjka'kdk;Zdkjh lkjka'k
Áf'k{k.k dk;Zÿe dk vk;kstu
• lqnwj laosnu ,oa th-vkbZ-,l-] dkcZu ekWMfyax] e`nklosZ{k.k ekufp=.k ,oa Hkwfe ÁcaËku {ks= ls lacafËkrvkËkqfud rduhdh tkudkjh Ánku djus okys 9Áf'k{k.k dk;Zÿeksa dk vk;kstu fd;k x;k ftlesafofHkUu laLFkkuksa osG dkfeZdksa us Hkkx fy;kA
Áf'k{k.k dk;Zÿeksa esa lgHkkfxrk
• C;wjks osG 04 vfËkdkfj;ksa us fofHkUu {ks=ksa esa Áf'k{k.kÁkIr fd;k vkSj mlesa ls ,d vfËkdkjh us varjkZ"V™h;Lrj ij Áf'k{k.k ÁkIr fd;kA
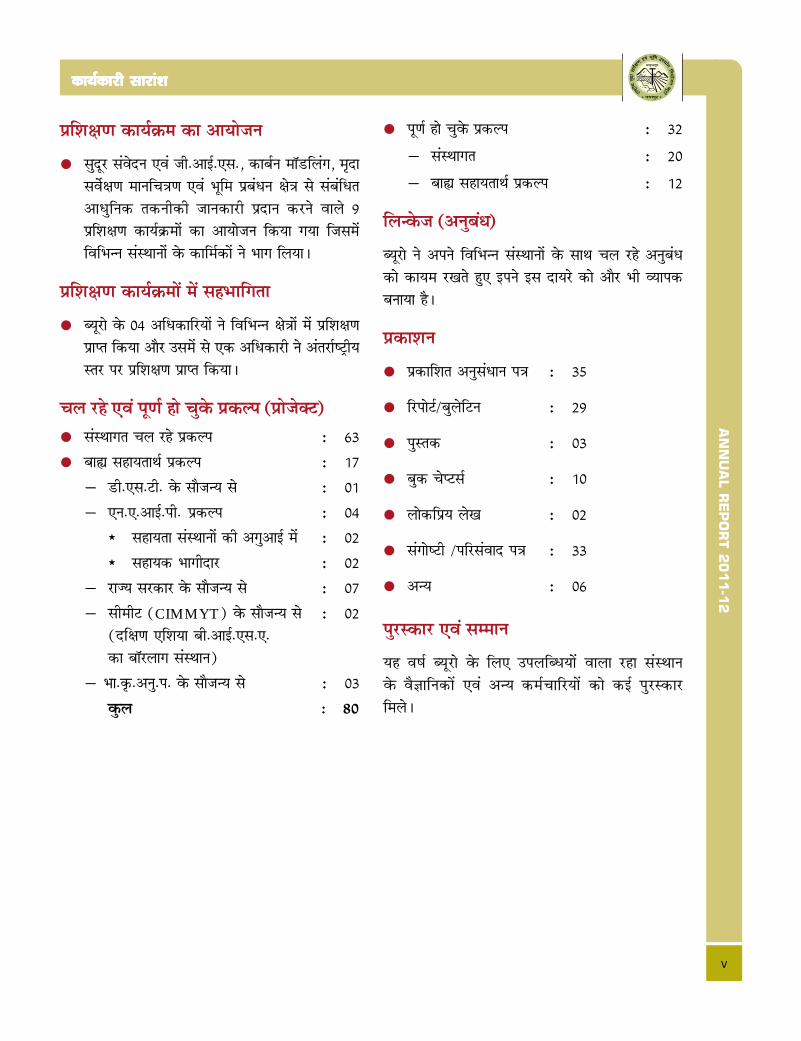
py jgs ,oa iw.kZ gks pqosG ÁdYi (ÁkstsDV)
• laLFkkxr py jgs ÁdYi % 63
• ck· lgk;rkFkZ ÁdYi % 17
µ Mh-,l-Vh- osG lkStU; ls % 01
µ ,u-,-vkbZ-ih- ÁdYi % 04
π lgk;rk laLFkkuksa dh vxqvkbZ esa % 02
π lgk;d Hkkxhnkj % 02
µ jkT; ljdkj osG lkStU; ls % 07
µ lhehV (CIMMYT) osG lkStU; ls % 02(nf{k.k ,f'k;k ch-vkbZ-,l-,-dk ckWjykx laLFkku)
µ Hkk-œ-vuq-i- osG lkStU; ls % 03
oqGy % 80
• iw.kZ gks pqosG ÁdYi % 32
µ laLFkkxr % 20
µ ck· lgk;rkFkZ ÁdYi % 12
fyUosGt (vuqcaËk)
C;wjks us vius fofHkUu laLFkkuksa osG lkFk py jgs vuqcaËkdks dk;e j[krs gq, bius bl nk;js dks vkSj Hkh O;kidcuk;k gSA
Ádk'ku
• Ádkf'kr vuqla/kku i= % 35
• fjiksVZ@cqysfVu % 29
• iqLrd % 03
• cqd psIVlZ % 10
• yksdfÁ; ys[k % 02
• laxks"Vh @ifjlaokn i= % 33
• vU; % 06
iqjLdkj ,oa lEeku
;g o"kZ C;wjks osG fy, miyfCËk;ksa okyk jgk laLFkkuosG oSKkfudksa ,oa vU; deZpkfj;ksa dks dbZ iqjLdkjfeysA

AN
NU
AL R
EP
OR
T 2
011-1
2
1
NBSS&LUP: A Profile
NBSS&LUP : A Profile
1
Genesis
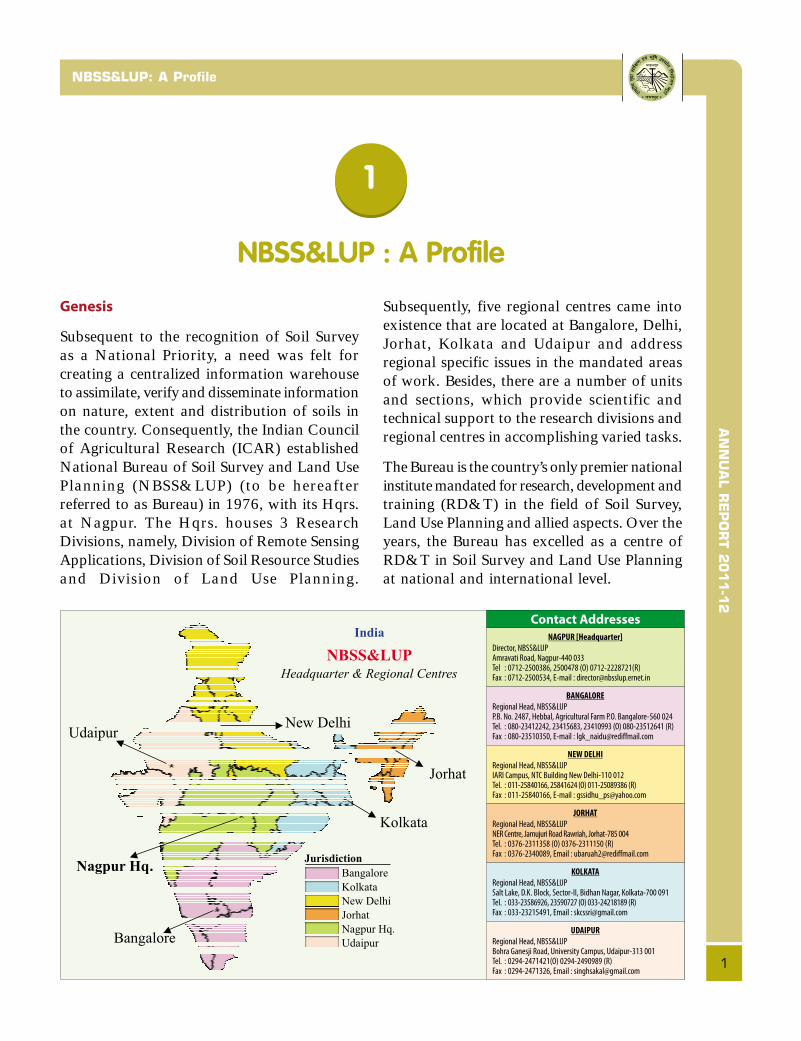
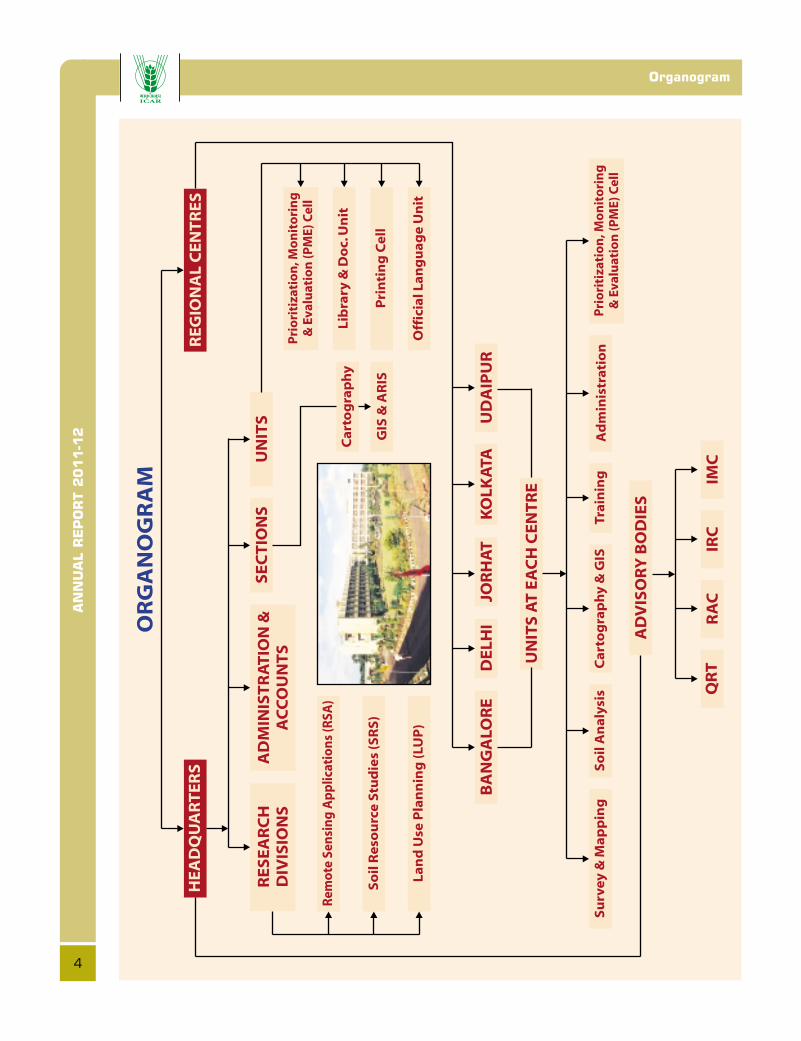
Subsequent to the recognition of Soil Surveyas a National Priority, a need was felt forcreating a centralized information warehouseto assimilate, verify and disseminate informationon nature, extent and distribution of soils inthe country. Consequently, the Indian Councilof Agricultural Research (ICAR) establishedNational Bureau of Soil Survey and Land UsePlanning (NBSS&LUP) (to be hereafterreferred to as Bureau) in 1976, with its Hqrs.at Nagpur. The Hqrs. houses 3 ResearchDivisions, namely, Division of Remote SensingApplications, Division of Soil Resource Studiesand Division of Land Use Planning.
Subsequently, five regional centres came intoexistence that are located at Bangalore, Delhi,Jorhat, Kolkata and Udaipur and addressregional specific issues in the mandated areasof work. Besides, there are a number of unitsand sections, which provide scientific andtechnical support to the research divisions andregional centres in accomplishing varied tasks.
The Bureau is the country’s only premier nationalinstitute mandated for research, development andtraining (RD&T) in the field of Soil Survey,Land Use Planning and allied aspects. Over theyears, the Bureau has excelled as a centre ofRD&T in Soil Survey and Land Use Planningat national and international level.

AN
NU
AL R
EP
OR
T 2
011-1
2NBSS&LUP: A Profile
2
Location
The Hqrs. is located on Amravati Road(Kolkata-Mumbai National Highway 6). It hasin its close vicinity the ICAR-affiliated NationalResearch Centre for Citrus (NRCC), GinningTraining Centre (GTC) a regional centre ofCentral Institute for Research on CottonTechnology (CIRCOT), and RegionalRemote Sensing Centre (RRSC) (ISRO).The campus of the Bureau is also quiteclose to Nagpur University. The Hqrs.,therefore, has locational advantagewhich facilitates multidisciplinary studies,inter-institutional interactions and researchlinkages, etc.
Mandate
� To conduct soil survey and mapping of thesoils of the country to promote scientificand optimal land use programmes incollaboration with relevant institutions andagencies.
� To conduct and promote research in theNational Agricultural Research System inthe areas of Pedology, Soil survey, Remotesensing applications, Land degradation,Land evaluation and Land use planning,in collaboration with other relevantagencies.
� To impart training and education to createawareness on soil and land resources andtheir state of health.
Major Research Themes
• Inventorying Natural Resources
• Remote Sensing, GIS and Cartography
• Basic Pedological Research
• Soil Survey Data Interpretation andApplications
• Land Evaluation and Land Use Planning
Training Areas
• Soil Survey and Land Evaluation for LandUse Planning
• Remote Sensing and GIS Applications inSoil Resources mapping
Management
A high powered Research Advisory Committee(RAC) comprising eminent professionals,mostly from outside the ICAR system guidesthe Bureau on its research policies. The RACprovides guidance to the centre in planningresearch thrusts and strategies.
The Institute Management Committee (IMC),constituted and mandated by the ICAR,supervises the functioning of the Bureau.Internal Committees, such as, InstituteResearch Council, Purchase Committee,Library and Publication Committee, OfficialLanguage Committee and a Grievance Cell, toname a few, are operating for decentralizationof management. The Institute Joint StaffCouncil promotes healthy interaction andcongenial work environment.
Infrastructural Facilities
• Laboratories
The Bureau has various state-of-artlaboratories. Some of the modern andsophisticated equipments are listed below.
� X-ray diffractogram
� Scamming Electron Microscope
� Inductively coupled Plasma Spectrometre
� Atomic Absorption Spectrophotometer
� Spectroradiometer
� Latest Remote Sensing and GISsoftwares
The facilities available in micromorphologyand GIS laboratories are the best in the countryand match international standards.

AN
NU
AL R
EP
OR
T 2
011-1
2
3
NBSS&LUP: A Profile
• Library
The Bureau houses a fully computerized librarylocated at the Hqrs. that has a comprehensivecollection of books, reports and periodicals.The regional centres also have computerizedlibraries.
NBSS&LUP Website
The Bureau posts all important informationabout its activities, particularly about researchprojects, publications, linkages, educationaltrainings, staff and infrastructure on its Website(http://www.nbsslup.in). The year 2011-12 hasbeen particularly a very momentous year forthe Bureau as traffic to its website increasedsignificantly.
Major Achievements
The Bureau, through its journey over last 4decades, has every reason to feel proud for itstremendous accomplishments in the domainsof research and development.
• An outstanding achievement has been ingenerating the Soil Resource Map of theCountry on 1:1 million scale and itsdifferent states (on 1:500,000 scale).
• A 20-Unit Agro-ecological region and a60-unit Agro-ecological sub-region map ofthe country.
• 273 soil series have been entered into theNational Register.
• A method has been developed for usingremote sensing data, namely IRS-1C PANmerged data for large scale mapping of soilsat village and watershed level.
• Soil reflectance properties have beensuccessfully used as a potential tool toprovide information on a wide range of soilproperties.
• The Bureau has been an active partner ingenerating harmonized statistics of thedegraded lands/wastelands according towhich the country has about 121 m ha areaunder different forms.
• As per estimates made by the Bureau, thetotal carbon stocks in Indian soils at 150cm depth is up to 64 pentagrams (pg)(1 Pg = 10 to the power of 15 g) withconsiderable amount of inorganic form.This is the first ever estimate made on SOCstocks at national level.
• The Bureau developed land use options for5 agro-ecosystems, namely, Rainfed,Irrigated, Arid, Hill and Mountain andCoastal.
Plan Budget (XI Plan)
Funds Received : Rs. 2375 lakhs
Funds Utilized : Rs. 2368.50 lakhs
Staff Strength (as on 31.03.2012)
Sl. No. Name of Post Total
S F V
1. RMP 01 01 00
2. Scientific 99 66 33
3. Technical 189 174 15
4. Administrative 67 59 08
5. Skilled Sup. Staff 84 75 09
Grand Total 440 375 65
S: Sanctioned; F-Filled; V-Vacant
AN
NU
AL R
EP
OR
T 2
011-1
2Organogram
4


AN
NU
AL R
EP
OR
T 2
011-1
2
7
Inventorying Natural Resources
• Soil and Land Resource Inventory
• Issue-based Survey: Soil Nutrients,Degradation and Desertification
• Soil Correlation and Classification
Inventorying Natural Resources
2.1
Assessment of land and soil
resources of Malappuram district of
Kerala at 1;50,000 scale for land use
planning
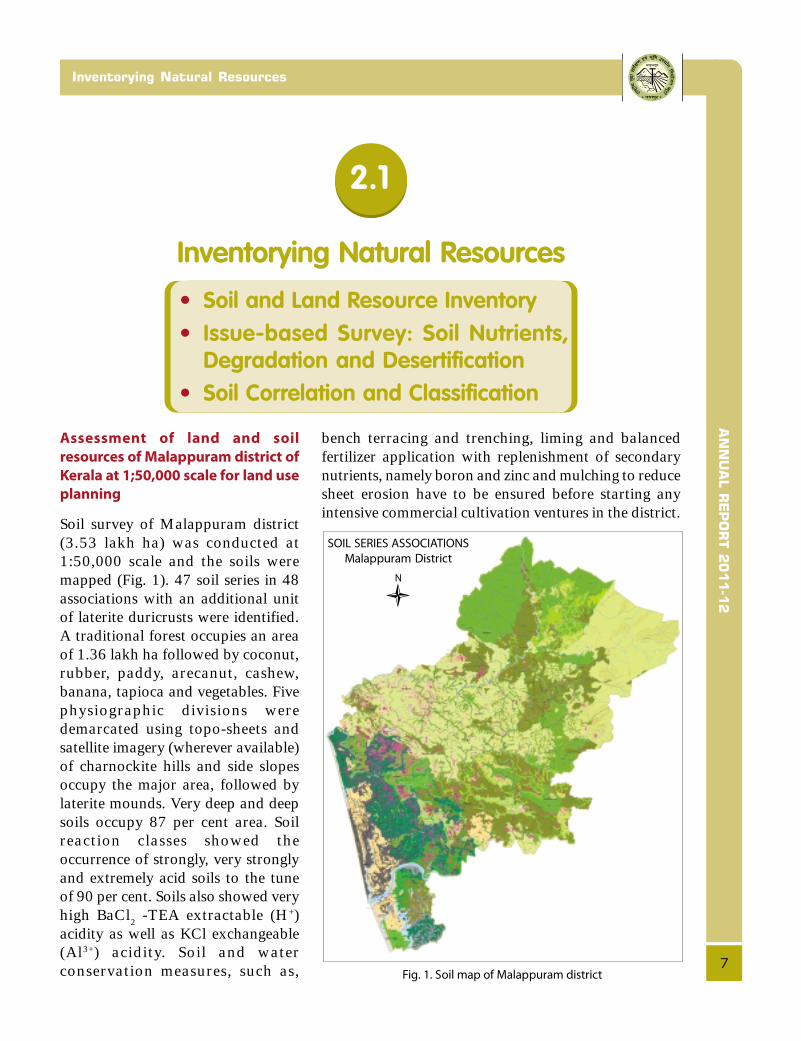
Soil survey of Malappuram district(3.53 lakh ha) was conducted at1:50,000 scale and the soils weremapped (Fig. 1). 47 soil series in 48associations with an additional unitof laterite duricrusts were identified.A traditional forest occupies an areaof 1.36 lakh ha followed by coconut,rubber, paddy, arecanut, cashew,banana, tapioca and vegetables. Fivephysiographic divisions weredemarcated using topo-sheets andsatellite imagery (wherever available)of charnockite hills and side slopesoccupy the major area, followed bylaterite mounds. Very deep and deepsoils occupy 87 per cent area. Soilreaction classes showed theoccurrence of strongly, very stronglyand extremely acid soils to the tuneof 90 per cent. Soils also showed veryhigh BaCl2 -TEA extractable (H+)acidity as well as KCl exchangeable(Al3+) acidity. Soil and waterconservation measures, such as, Fig. 1. Soil map of Malappuram district
bench terracing and trenching, liming and balancedfertilizer application with replenishment of secondarynutrients, namely boron and zinc and mulching to reducesheet erosion have to be ensured before starting anyintensive commercial cultivation ventures in the district.
SOIL SERIES ASSOCIATIONS
Malappuram District
AN
NU
AL R
EP
OR
T 2
011-1
2Research Achievements
8
Land resource inventory of Durgada
Nagenahalli village, Kortagere taluk, Tumkur
district, Karnataka for integrated
development
This project was undertaken in February 2012in collaboration with Krishi Vigyana Kendra,Hirehalli, Institute of Horticultural Research,Bangalore. The NICRA interventions like soiland water conservation measures, selection ofsuitable crops and cropping patterns for thearea and introduction of appropriate livelihood
measures are being carried out by KVK,based on the LRI database generated by theBureau.
The climate is semi arid with averagemaximum and minimum temperatures of 33°Cand 14°C, respectively. Though the averagerainfall is around 800 mm with extremities andPET of 1261 mm.
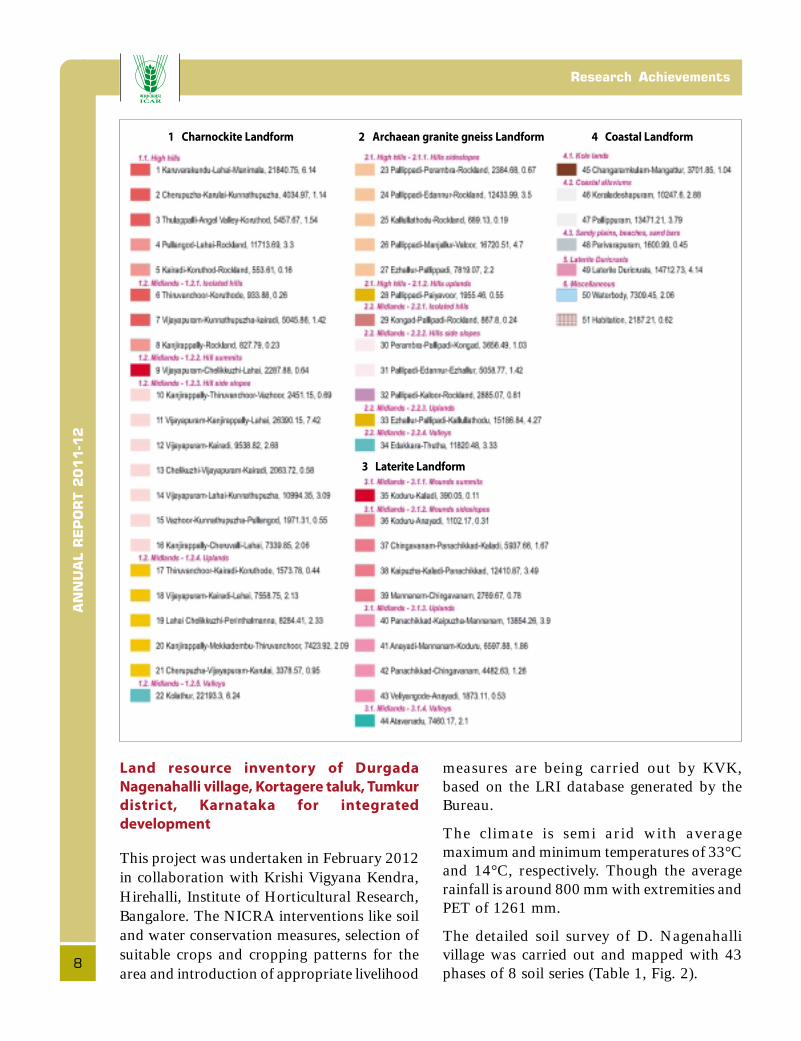
The detailed soil survey of D. Nagenahallivillage was carried out and mapped with 43phases of 8 soil series (Table 1, Fig. 2).
1 Charnockite Landform 2 Archaean granite gneiss Landform 4 Coastal Landform
3 Laterite Landform

AN
NU
AL R
EP
OR
T 2
011-1
2
9
Inventorying Natural Resources
Fig. 2. Distribution of soil phases in D. Nagenahalli village
Table 1. Soil series and area
Soil Series Taxonomy at family level Area in ha Area in ha
(%)
Hills and Uplands
1. N1 Series Loamy-skeletal, mixed, isohyperthermic Typic Haplustalfs 5.56 1.47
2. N2 Series Fine, mixed, isohyperthermic Rhodic Paleustalfs 59.51 15.74
3. N3 Series Fine, mixed, isohyperthermic Rhodic Paleustalfs 27.58 7.30
4. N4 Series Clayey-skeletal, mixed, isohyperthermic Typic/Rhodic Paleustalfs 15.45 4.09
5. N5 Series Fine, mixed, isohyperthermic Rhodic Paleustalfs 49.41 13.07
Lowlands/Valleys
1. N6 Series Fine, mixed, calcareous, isohyperthermic Typic Haplustepts 19.73 5.22
2. N7 Series Fine, mixed, calcareous, isohyperthermic Typic Haplustepts 31.91 8.44
3. N8 Series Coarse-loamy, mixed, isohyperthermic Typic Ustifluvents 18.29 4.84
D NAGENAHALLI
Kortage Taluk
AN
NU
AL R
EP
OR
T 2
011-1
2Research Achievements
10
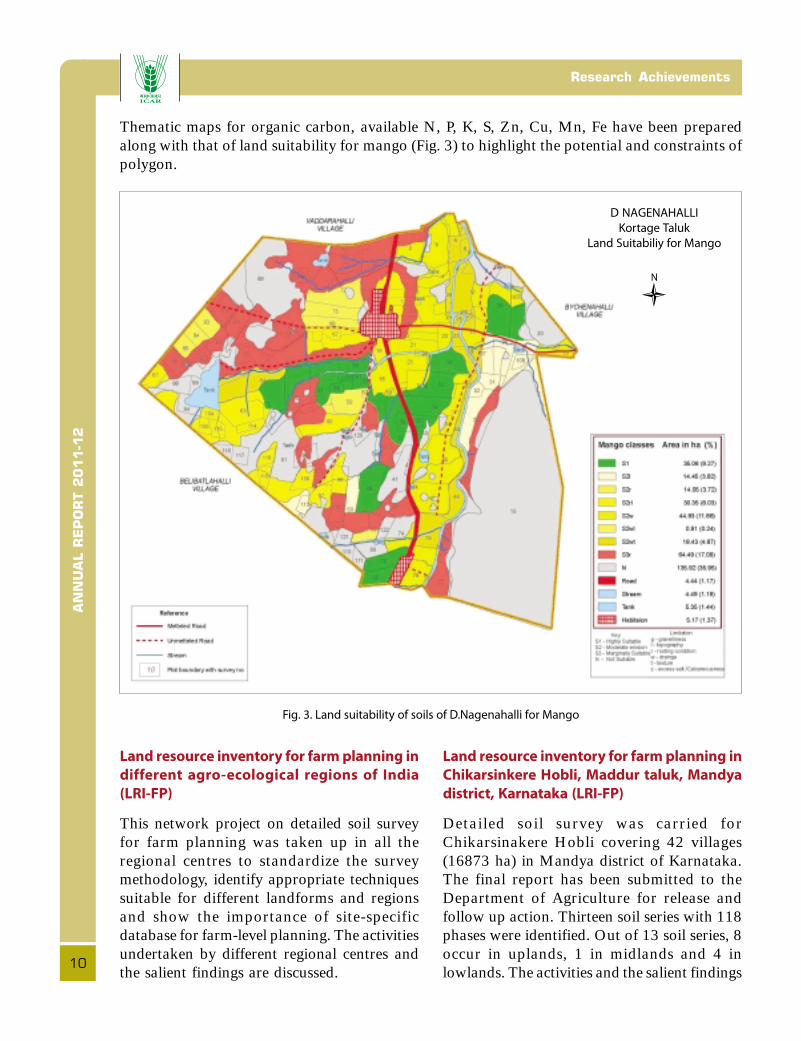
Thematic maps for organic carbon, available N, P, K, S, Zn, Cu, Mn, Fe have been preparedalong with that of land suitability for mango (Fig. 3) to highlight the potential and constraints ofpolygon.
Fig. 3. Land suitability of soils of D.Nagenahalli for Mango
Land resource inventory for farm planning in
different agro-ecological regions of India
(LRI-FP)
This network project on detailed soil surveyfor farm planning was taken up in all theregional centres to standardize the surveymethodology, identify appropriate techniquessuitable for different landforms and regionsand show the importance of site-specificdatabase for farm-level planning. The activitiesundertaken by different regional centres andthe salient findings are discussed.
Land resource inventory for farm planning in
Chikarsinkere Hobli, Maddur taluk, Mandya
district, Karnataka (LRI-FP)
Detailed soil survey was carried forChikarsinakere Hobli covering 42 villages(16873 ha) in Mandya district of Karnataka.The final report has been submitted to theDepartment of Agriculture for release andfollow up action. Thirteen soil series with 118phases were identified. Out of 13 soil series, 8occur in uplands, 1 in midlands and 4 inlowlands. The activities and the salient findings
D NAGENAHALLI
Kortage Taluk
Land Suitabiliy for Mango
AN
NU
AL R
EP
OR
T 2
011-1
2
11
Inventorying Natural Resources
reported by different regional centres arepresented below:
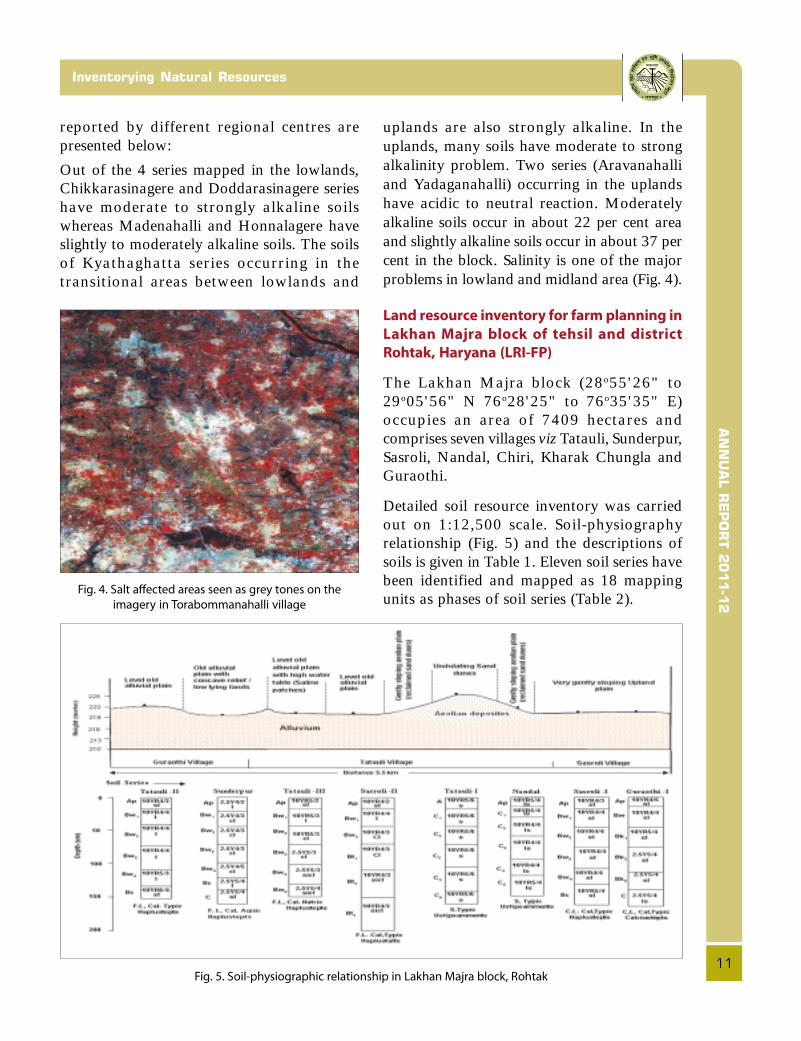
Out of the 4 series mapped in the lowlands,Chikkarasinagere and Doddarasinagere serieshave moderate to strongly alkaline soilswhereas Madenahalli and Honnalagere haveslightly to moderately alkaline soils. The soilsof Kyathaghatta series occurring in thetransitional areas between lowlands and
uplands are also strongly alkaline. In theuplands, many soils have moderate to strongalkalinity problem. Two series (Aravanahalliand Yadaganahalli) occurring in the uplandshave acidic to neutral reaction. Moderatelyalkaline soils occur in about 22 per cent areaand slightly alkaline soils occur in about 37 percent in the block. Salinity is one of the majorproblems in lowland and midland area (Fig. 4).
Land resource inventory for farm planning in
Lakhan Majra block of tehsil and district
Rohtak, Haryana (LRI-FP)
The Lakhan Majra block (28o55'26" to29o05'56" N 76o28'25" to 76o35'35" E)occupies an area of 7409 hectares andcomprises seven villages viz Tatauli, Sunderpur,Sasroli, Nandal, Chiri, Kharak Chungla andGuraothi.
Detailed soil resource inventory was carriedout on 1:12,500 scale. Soil-physiographyrelationship (Fig. 5) and the descriptions ofsoils is given in Table 1. Eleven soil series havebeen identified and mapped as 18 mappingunits as phases of soil series (Table 2).
Fig. 5. Soil-physiographic relationship in Lakhan Majra block, Rohtak
Fig. 4. Salt affected areas seen as grey tones on the
imagery in Torabommanahalli village
AN
NU
AL R
EP
OR
T 2
011-1
2Research Achievements
12
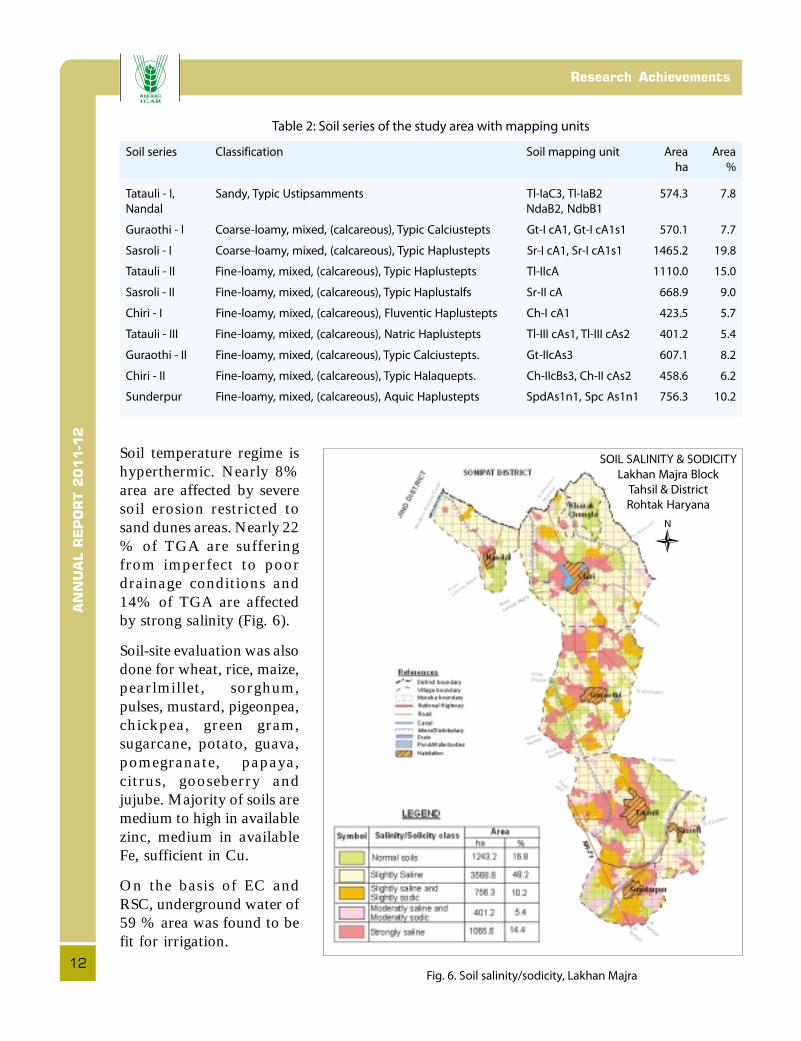
Soil temperature regime ishyperthermic. Nearly 8%area are affected by severesoil erosion restricted tosand dunes areas. Nearly 22% of TGA are sufferingfrom imperfect to poordrainage conditions and14% of TGA are affectedby strong salinity (Fig. 6).
Soil-site evaluation was alsodone for wheat, rice, maize,pearlmillet, sorghum,pulses, mustard, pigeonpea,chickpea, green gram,sugarcane, potato, guava,pomegranate, papaya,citrus, gooseberry andjujube. Majority of soils aremedium to high in availablezinc, medium in availableFe, sufficient in Cu.
On the basis of EC andRSC, underground water of59 % area was found to befit for irrigation.
Fig. 6. Soil salinity/sodicity, Lakhan Majra
Table 2: Soil series of the study area with mapping units
Soil series Classification Soil mapping unit Area Area
ha %
Tatauli - I, Sandy, Typic Ustipsamments Tl-IaC3, Tl-IaB2 574.3 7.8
Nandal NdaB2, NdbB1
Guraothi - I Coarse-loamy, mixed, (calcareous), Typic Calciustepts Gt-I cA1, Gt-I cA1s1 570.1 7.7
Sasroli - I Coarse-loamy, mixed, (calcareous), Typic Haplustepts Sr-I cA1, Sr-I cA1s1 1465.2 19.8
Tatauli - II Fine-loamy, mixed, (calcareous), Typic Haplustepts Tl-IIcA 1110.0 15.0
Sasroli - II Fine-loamy, mixed, (calcareous), Typic Haplustalfs Sr-II cA 668.9 9.0
Chiri - I Fine-loamy, mixed, (calcareous), Fluventic Haplustepts Ch-I cA1 423.5 5.7
Tatauli - III Fine-loamy, mixed, (calcareous), Natric Haplustepts Tl-III cAs1, Tl-III cAs2 401.2 5.4
Guraothi - II Fine-loamy, mixed, (calcareous), Typic Calciustepts. Gt-IIcAs3 607.1 8.2
Chiri - II Fine-loamy, mixed, (calcareous), Typic Halaquepts. Ch-IIcBs3, Ch-II cAs2 458.6 6.2
Sunderpur Fine-loamy, mixed, (calcareous), Aquic Haplustepts SpdAs1n1, Spc As1n1 756.3 10.2
SOIL SALINITY & SODICITY
Lakhan Majra Block
Tahsil & District
Rohtak Haryana

AN
NU
AL R
EP
OR
T 2
011-1
2
13
Inventorying Natural Resources
Land resource inventory of Katonigaon
panchayat of Titabar block of Jorhat district
of Assam (LRI-FP)
Detailed soil survey has been carried out usingavailable village level cadastral maps (1:4,000
scale) in conjunction with IRS P6 LISS-IVsatellite imagery (1: 12,500 scale). Five soilseries with eleven phases were identified(Fig. 7). Nagajanka3, Nagajanka4 andBachabihari series occur extensively andremaining two soil series (Nagajanka1 and
Fig. 7. Soil map of the study area
SOILS
Katonigaon
AN
NU
AL R
EP
OR
T 2
011-1
2Research Achievements
14
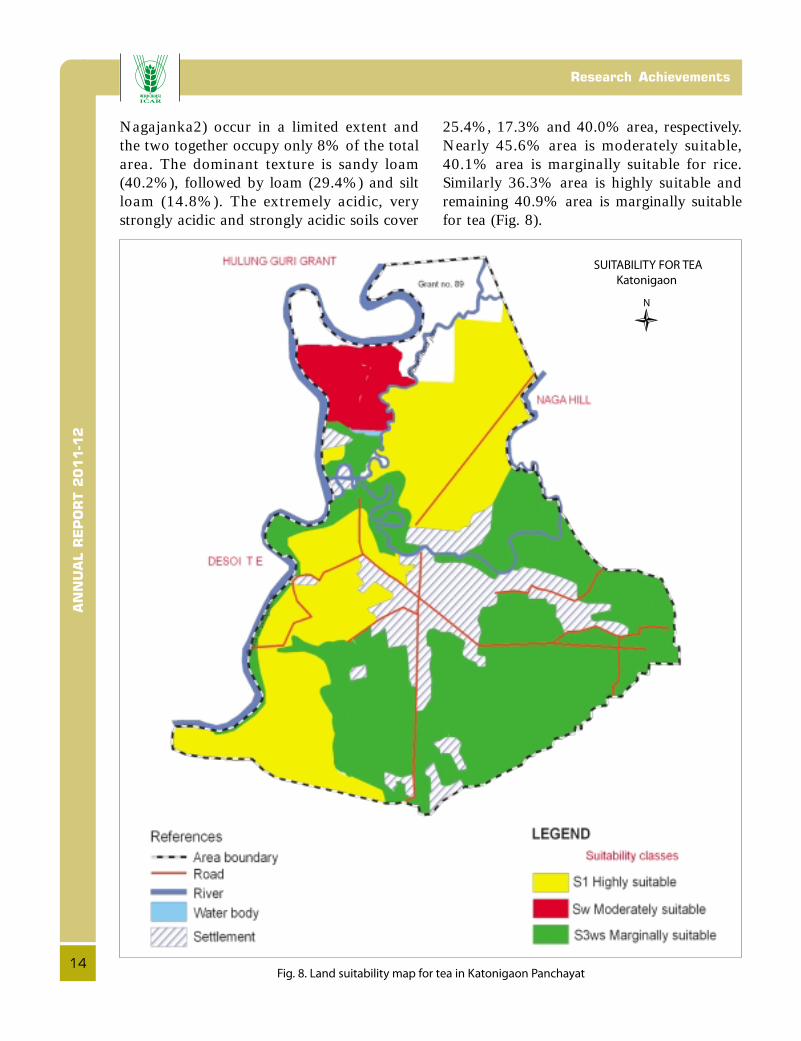
Nagajanka2) occur in a limited extent andthe two together occupy only 8% of the totalarea. The dominant texture is sandy loam(40.2%), followed by loam (29.4%) and siltloam (14.8%). The extremely acidic, verystrongly acidic and strongly acidic soils cover
Fig. 8. Land suitability map for tea in Katonigaon Panchayat
25.4%, 17.3% and 40.0% area, respectively.Nearly 45.6% area is moderately suitable,40.1% area is marginally suitable for rice.Similarly 36.3% area is highly suitable andremaining 40.9% area is marginally suitablefor tea (Fig. 8).
SUITABILITY FOR TEA
Katonigaon
AN
NU
AL R
EP
OR
T 2
011-1
2
15
Inventorying Natural Resources
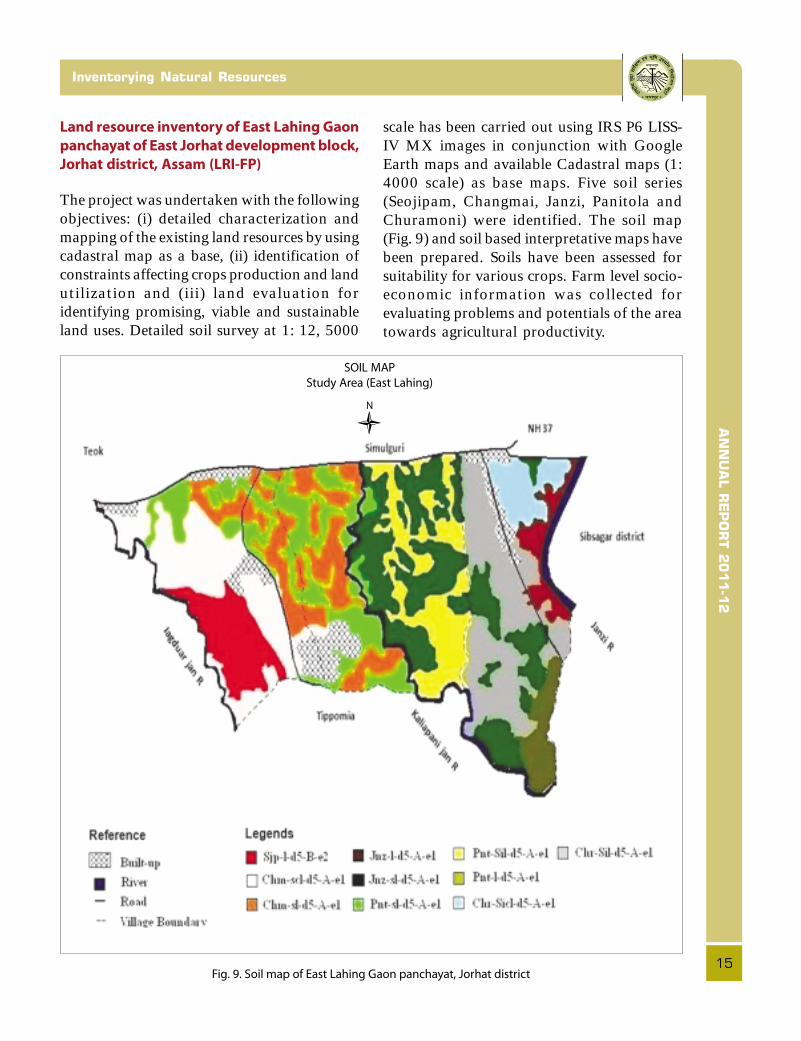
Land resource inventory of East Lahing Gaon
panchayat of East Jorhat development block,
Jorhat district, Assam (LRI-FP)
The project was undertaken with the followingobjectives: (i) detailed characterization andmapping of the existing land resources by usingcadastral map as a base, (ii) identification ofconstraints affecting crops production and landutilization and (iii) land evaluation foridentifying promising, viable and sustainableland uses. Detailed soil survey at 1: 12, 5000
scale has been carried out using IRS P6 LISS-IV MX images in conjunction with GoogleEarth maps and available Cadastral maps (1:4000 scale) as base maps. Five soil series(Seojipam, Changmai, Janzi, Panitola andChuramoni) were identified. The soil map(Fig. 9) and soil based interpretative maps havebeen prepared. Soils have been assessed forsuitability for various crops. Farm level socio-economic information was collected forevaluating problems and potentials of the areatowards agricultural productivity.
Fig. 9. Soil map of East Lahing Gaon panchayat, Jorhat district
SOIL MAP
Study Area (East Lahing)

AN
NU
AL R
EP
OR
T 2
011-1
2Research Achievements
16
Land resource inventory for farm planning in
Chinchura-Mogra and Polba-Dadpur block,
Hugli district, West Bengal (LRI-FP)
To standardize the methodology of soil surveyon 1: 12, 500 scales in the lower Indo-Gangeticplain, a study was conducted in two clustersof villages, Gotu and Puinan in Polba-Dadpurblock of Hugli district, West Bengal. The basemap was prepared by integrating cadastral mapof 1:12,500 scales with satellite Imagery (IRSP6 LISS IV). Land use/land cover categorieswere correlated with altitude; using digitalelevation model. Horticulture/plantationsoccupied the highest position on the landscape.Paddy is the lowest segment of the landscape.Paddy-vegetables-based cropping system wascommon in the middle part of the landscape.
Three physiographic units, levee, upland andlowland were delineated in two land usesystems, agriculture and horticulture.Horticultural land use system across the soiltype had significantly (p<0.0001) higher silt,clay, organic carbon and available watercontent than agriculture. The uplands acrossthe land use systems had significantly(p<0.0001) lower clay, organic carbon andhigher content of sand than the lowlands andlevees (Table 3). Soils of Gotu cluster weremapped in seven phases of three soil series (Fig.10), whereas soils in Puinan cluster weremapped in eight phases of four soil series. Thesoil database and map were integrated withcadastral information for developing plot-wise/farmer-wise information.
Fig. 10. Soil resource database for farm planning in Gotu cluster (* mineralogy-mixed, temperature regime-
hyperthermic) with brief description of soils
Mapunit
1
2
3
4
5
6
7
Description
Very deep, poorly drained, finesoils with clay surface texture onnearly level concave slope lowlandwith very slight erosion
Very deep, poorly drained, finesoils with clay surface texture onnearly level concave slope lowlandwith very slight erosion
Very deep, poorly drained, finesoils with silty clay loam surfacetexture on nearly level concaveslope lowland with very slighterosion
Very deep, well drained, fine-loamy soils with loam surfacetexture on nearly level convexslope upland with slight erosion
Very deep, well drained, fine-loamy soils with silt loam surfacetexture on nearly level convexslope upland with slight erosion
Very deep, well drained, fine siltysoils with silt loam surface textureon nearly level to very gentlysloping levee with slight erosion
Very deep, well drained, fine siltysoils with silty clay loam surfacetexture on nearly level to verygently sloping levee with slighterosion
*SoilTaxonomy
Fine, TypicEndoaquepts
Fine-silty,Fluventic
Haplustepts
Fine-silty,Fluventic
Haplustepts
Fine-loamy,Fluventic
Haplustepts
Fine-loamy,Fluventic
Haplustepts
Fine-silty,Fluventic
Haplustepts
Fine-silty,Fluventic
Haplustepts
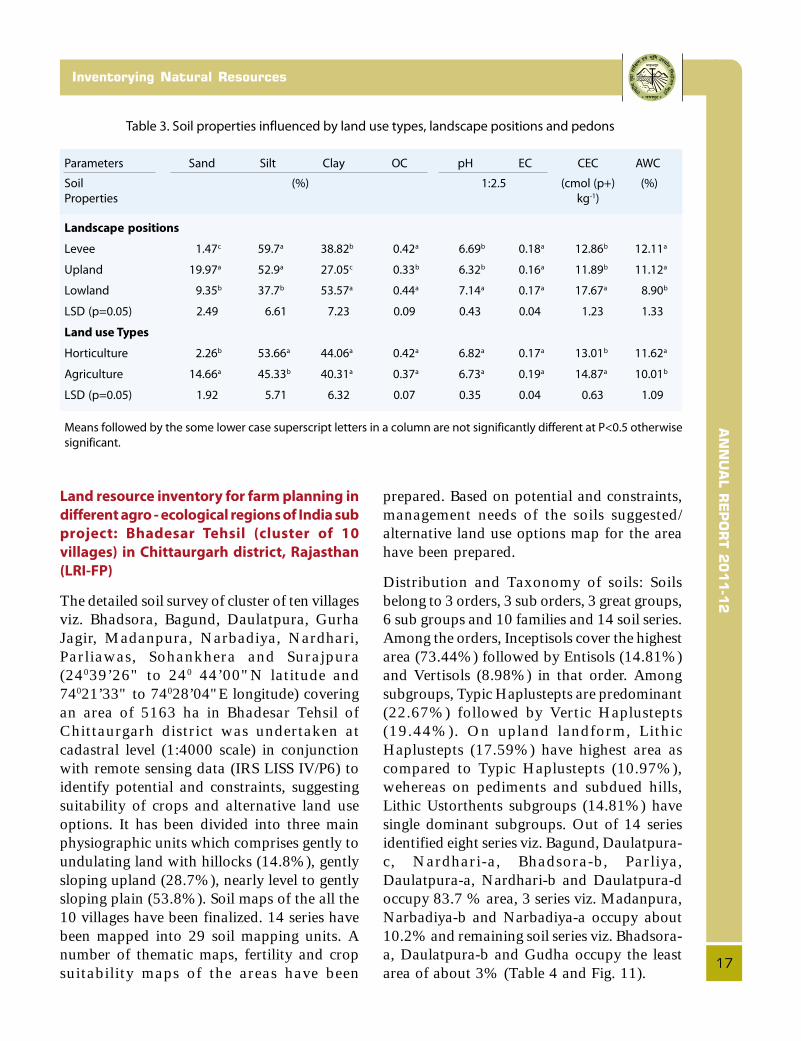
AN
NU
AL R
EP
OR
T 2
011-1
2
17
Inventorying Natural Resources
Land resource inventory for farm planning in
different agro - ecological regions of India sub
project: Bhadesar Tehsil (cluster of 10
villages) in Chittaurgarh district, Rajasthan
(LRI-FP)
The detailed soil survey of cluster of ten villagesviz. Bhadsora, Bagund, Daulatpura, GurhaJagir, Madanpura, Narbadiya, Nardhari,Parliawas, Sohankhera and Surajpura(24039’26" to 240 44’00"N latitude and74021’33" to 74028’04"E longitude) coveringan area of 5163 ha in Bhadesar Tehsil ofChittaurgarh district was undertaken atcadastral level (1:4000 scale) in conjunctionwith remote sensing data (IRS LISS IV/P6) toidentify potential and constraints, suggestingsuitability of crops and alternative land useoptions. It has been divided into three mainphysiographic units which comprises gently toundulating land with hillocks (14.8%), gentlysloping upland (28.7%), nearly level to gentlysloping plain (53.8%). Soil maps of the all the10 villages have been finalized. 14 series havebeen mapped into 29 soil mapping units. Anumber of thematic maps, fertility and cropsuitability maps of the areas have been
prepared. Based on potential and constraints,management needs of the soils suggested/alternative land use options map for the areahave been prepared.
Distribution and Taxonomy of soils: Soilsbelong to 3 orders, 3 sub orders, 3 great groups,6 sub groups and 10 families and 14 soil series.Among the orders, Inceptisols cover the highestarea (73.44%) followed by Entisols (14.81%)and Vertisols (8.98%) in that order. Amongsubgroups, Typic Haplustepts are predominant(22.67%) followed by Vertic Haplustepts(19.44%). On upland landform, LithicHaplustepts (17.59%) have highest area ascompared to Typic Haplustepts (10.97%),wehereas on pediments and subdued hills,Lithic Ustorthents subgroups (14.81%) havesingle dominant subgroups. Out of 14 seriesidentified eight series viz. Bagund, Daulatpura-c, Nardhari-a, Bhadsora-b, Parliya,Daulatpura-a, Nardhari-b and Daulatpura-doccupy 83.7 % area, 3 series viz. Madanpura,Narbadiya-b and Narbadiya-a occupy about10.2% and remaining soil series viz. Bhadsora-a, Daulatpura-b and Gudha occupy the leastarea of about 3% (Table 4 and Fig. 11).
Table 3. Soil properties influenced by land use types, landscape positions and pedons
Parameters Sand Silt Clay OC pH EC CEC AWC
Soil (%) 1:2.5 (cmol (p+) (%)
Properties kg-1)
Landscape positions
Levee 1.47c 59.7a 38.82b 0.42a 6.69b 0.18a 12.86b 12.11a
Upland 19.97a 52.9a 27.05c 0.33b 6.32b 0.16a 11.89b 11.12a
Lowland 9.35b 37.7b 53.57a 0.44a 7.14a 0.17a 17.67a 8.90b
LSD (p=0.05) 2.49 6.61 7.23 0.09 0.43 0.04 1.23 1.33
Land use Types
Horticulture 2.26b 53.66a 44.06a 0.42a 6.82a 0.17a 13.01b 11.62a
Agriculture 14.66a 45.33b 40.31a 0.37a 6.73a 0.19a 14.87a 10.01b
LSD (p=0.05) 1.92 5.71 6.32 0.07 0.35 0.04 0.63 1.09
Means followed by the some lower case superscript letters in a column are not significantly different at P<0.5 otherwise
significant.
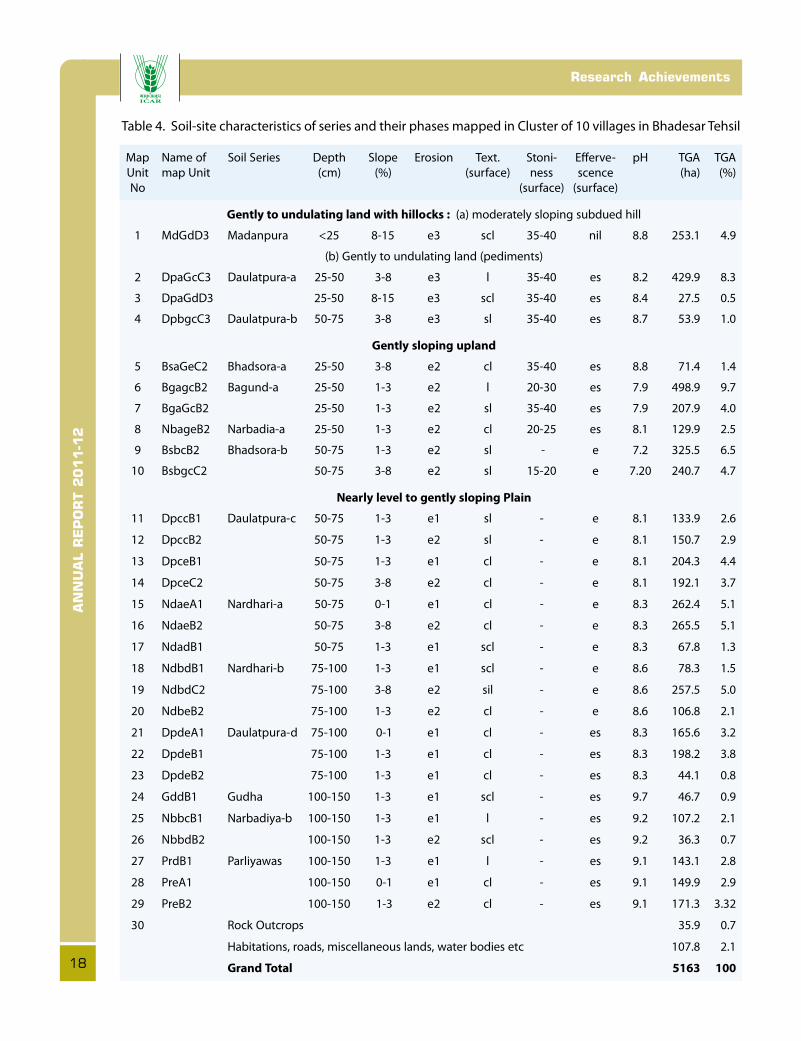
AN
NU
AL R
EP
OR
T 2
011-1
2Research Achievements
18
Table 4. Soil-site characteristics of series and their phases mapped in Cluster of 10 villages in Bhadesar Tehsil
Map Name of Soil Series Depth Slope Erosion Text. Stoni- Efferve- pH TGA TGA
Unit map Unit (cm) (%) (surface) ness scence (ha) (%)
No (surface) (surface)
Gently to undulating land with hillocks : (a) moderately sloping subdued hill
1 MdGdD3 Madanpura <25 8-15 e3 scl 35-40 nil 8.8 253.1 4.9
(b) Gently to undulating land (pediments)
2 DpaGcC3 Daulatpura-a 25-50 3-8 e3 l 35-40 es 8.2 429.9 8.3
3 DpaGdD3 25-50 8-15 e3 scl 35-40 es 8.4 27.5 0.5
4 DpbgcC3 Daulatpura-b 50-75 3-8 e3 sl 35-40 es 8.7 53.9 1.0
Gently sloping upland
5 BsaGeC2 Bhadsora-a 25-50 3-8 e2 cl 35-40 es 8.8 71.4 1.4
6 BgagcB2 Bagund-a 25-50 1-3 e2 l 20-30 es 7.9 498.9 9.7
7 BgaGcB2 25-50 1-3 e2 sl 35-40 es 7.9 207.9 4.0
8 NbageB2 Narbadia-a 25-50 1-3 e2 cl 20-25 es 8.1 129.9 2.5
9 BsbcB2 Bhadsora-b 50-75 1-3 e2 sl - e 7.2 325.5 6.5
10 BsbgcC2 50-75 3-8 e2 sl 15-20 e 7.20 240.7 4.7
Nearly level to gently sloping Plain
11 DpccB1 Daulatpura-c 50-75 1-3 e1 sl - e 8.1 133.9 2.6
12 DpccB2 50-75 1-3 e2 sl - e 8.1 150.7 2.9
13 DpceB1 50-75 1-3 e1 cl - e 8.1 204.3 4.4
14 DpceC2 50-75 3-8 e2 cl - e 8.1 192.1 3.7
15 NdaeA1 Nardhari-a 50-75 0-1 e1 cl - e 8.3 262.4 5.1
16 NdaeB2 50-75 3-8 e2 cl - e 8.3 265.5 5.1
17 NdadB1 50-75 1-3 e1 scl - e 8.3 67.8 1.3
18 NdbdB1 Nardhari-b 75-100 1-3 e1 scl - e 8.6 78.3 1.5
19 NdbdC2 75-100 3-8 e2 sil - e 8.6 257.5 5.0
20 NdbeB2 75-100 1-3 e2 cl - e 8.6 106.8 2.1
21 DpdeA1 Daulatpura-d 75-100 0-1 e1 cl - es 8.3 165.6 3.2
22 DpdeB1 75-100 1-3 e1 cl - es 8.3 198.2 3.8
23 DpdeB2 75-100 1-3 e1 cl - es 8.3 44.1 0.8
24 GddB1 Gudha 100-150 1-3 e1 scl - es 9.7 46.7 0.9
25 NbbcB1 Narbadiya-b 100-150 1-3 e1 l - es 9.2 107.2 2.1
26 NbbdB2 100-150 1-3 e2 scl - es 9.2 36.3 0.7
27 PrdB1 Parliyawas 100-150 1-3 e1 l - es 9.1 143.1 2.8
28 PreA1 100-150 0-1 e1 cl - es 9.1 149.9 2.9
29 PreB2 100-150 1-3 e2 cl - es 9.1 171.3 3.32
30 Rock Outcrops 35.9 0.7
Habitations, roads, miscellaneous lands, water bodies etc 107.8 2.1
Grand Total 5163 100
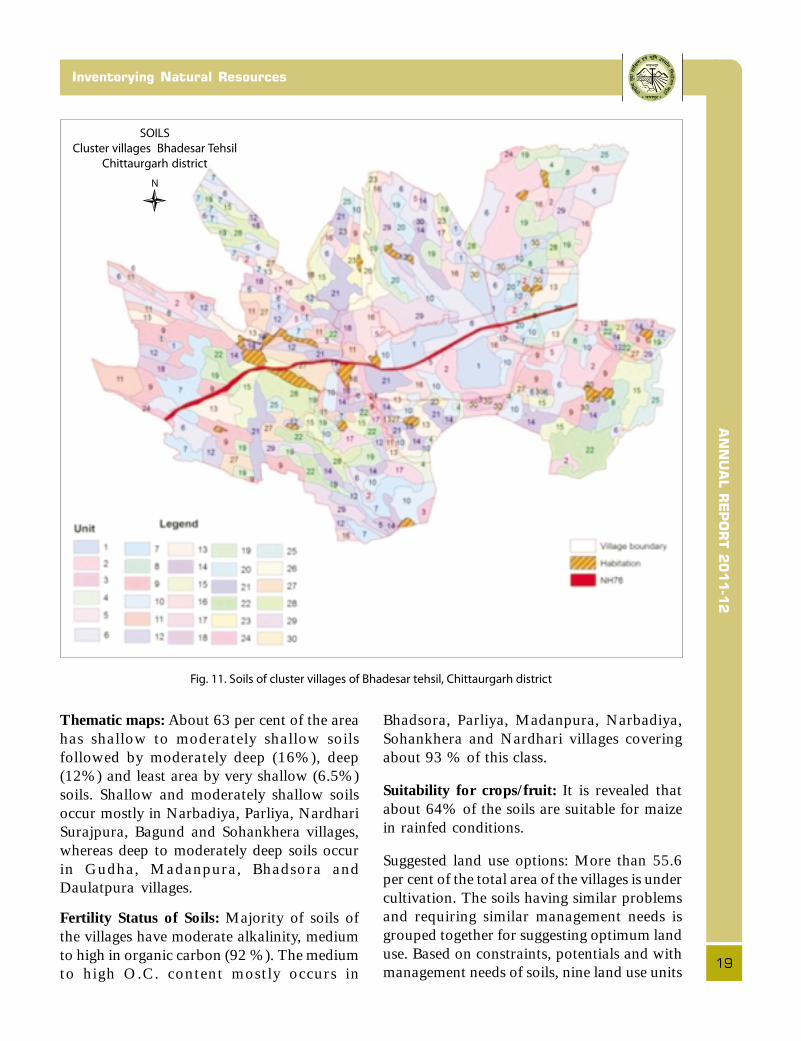
AN
NU
AL R
EP
OR
T 2
011-1
2
19
Inventorying Natural Resources
Thematic maps: About 63 per cent of the areahas shallow to moderately shallow soilsfollowed by moderately deep (16%), deep(12%) and least area by very shallow (6.5%)soils. Shallow and moderately shallow soilsoccur mostly in Narbadiya, Parliya, NardhariSurajpura, Bagund and Sohankhera villages,whereas deep to moderately deep soils occurin Gudha, Madanpura, Bhadsora andDaulatpura villages.
Fertility Status of Soils: Majority of soils ofthe villages have moderate alkalinity, mediumto high in organic carbon (92 %). The mediumto high O.C. content mostly occurs in
Bhadsora, Parliya, Madanpura, Narbadiya,Sohankhera and Nardhari villages coveringabout 93 % of this class.
Suitability for crops/fruit: It is revealed thatabout 64% of the soils are suitable for maizein rainfed conditions.
Suggested land use options: More than 55.6per cent of the total area of the villages is undercultivation. The soils having similar problemsand requiring similar management needs isgrouped together for suggesting optimum landuse. Based on constraints, potentials and withmanagement needs of soils, nine land use units
Fig. 11. Soils of cluster villages of Bhadesar tehsil, Chittaurgarh district
SOILS
Cluster villages Bhadesar Tehsil
Chittaurgarh district
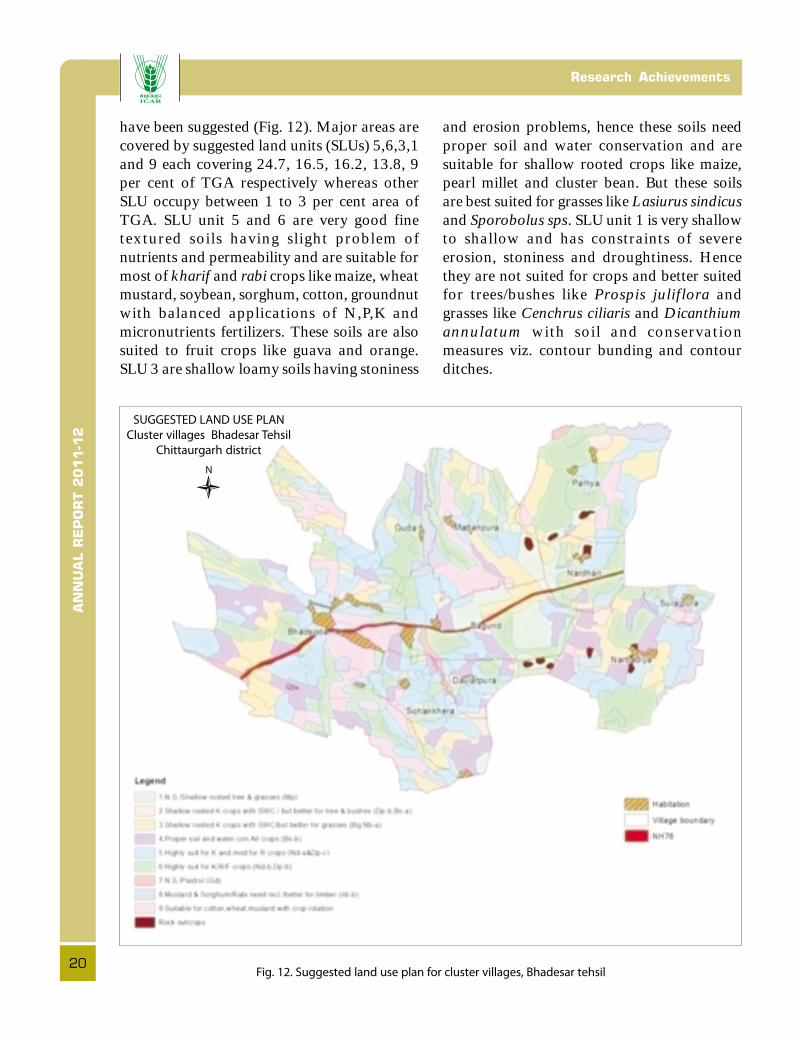
AN
NU
AL R
EP
OR
T 2
011-1
2Research Achievements
20
have been suggested (Fig. 12). Major areas arecovered by suggested land units (SLUs) 5,6,3,1and 9 each covering 24.7, 16.5, 16.2, 13.8, 9per cent of TGA respectively whereas otherSLU occupy between 1 to 3 per cent area ofTGA. SLU unit 5 and 6 are very good finetextured soils having slight problem ofnutrients and permeability and are suitable formost of kharif and rabi crops like maize, wheatmustard, soybean, sorghum, cotton, groundnutwith balanced applications of N,P,K andmicronutrients fertilizers. These soils are alsosuited to fruit crops like guava and orange.SLU 3 are shallow loamy soils having stoniness
and erosion problems, hence these soils needproper soil and water conservation and aresuitable for shallow rooted crops like maize,pearl millet and cluster bean. But these soilsare best suited for grasses like Lasiurus sindicusand Sporobolus sps. SLU unit 1 is very shallowto shallow and has constraints of severeerosion, stoniness and droughtiness. Hencethey are not suited for crops and better suitedfor trees/bushes like Prospis juliflora andgrasses like Cenchrus ciliaris and Dicanthiumannulatum with soil and conservationmeasures viz. contour bunding and contourditches.
Fig. 12. Suggested land use plan for cluster villages, Bhadesar tehsil
SUGGESTED LAND USE PLAN
Cluster villages Bhadesar Tehsil
Chittaurgarh district
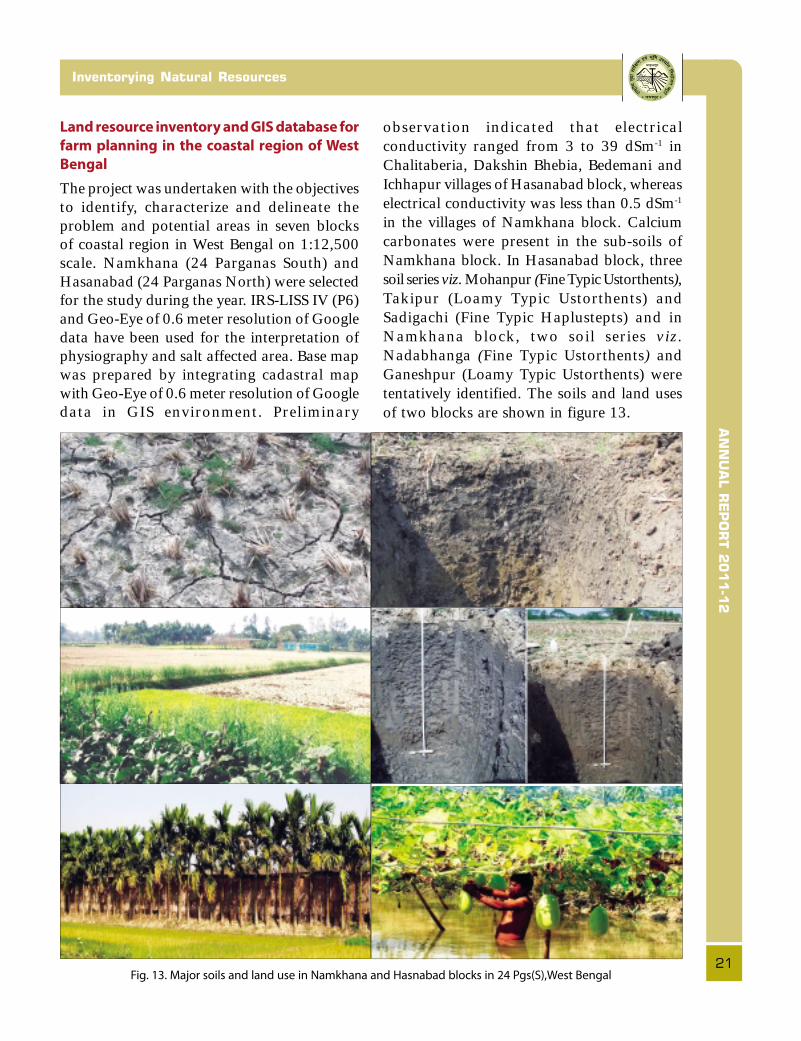
AN
NU
AL R
EP
OR
T 2
011-1
2
21
Inventorying Natural Resources
Land resource inventory and GIS database for
farm planning in the coastal region of West
Bengal
The project was undertaken with the objectivesto identify, characterize and delineate theproblem and potential areas in seven blocksof coastal region in West Bengal on 1:12,500scale. Namkhana (24 Parganas South) andHasanabad (24 Parganas North) were selectedfor the study during the year. IRS-LISS IV (P6)and Geo-Eye of 0.6 meter resolution of Googledata have been used for the interpretation ofphysiography and salt affected area. Base mapwas prepared by integrating cadastral mapwith Geo-Eye of 0.6 meter resolution of Googledata in GIS environment. Preliminary
observation indicated that electricalconductivity ranged from 3 to 39 dSm-1 inChalitaberia, Dakshin Bhebia, Bedemani andIchhapur villages of Hasanabad block, whereaselectrical conductivity was less than 0.5 dSm-1
in the villages of Namkhana block. Calciumcarbonates were present in the sub-soils ofNamkhana block. In Hasanabad block, threesoil series viz. Mohanpur (Fine Typic Ustorthents),Takipur (Loamy Typic Ustorthents) andSadigachi (Fine Typic Haplustepts) and inNamkhana block, two soil series viz.Nadabhanga (Fine Typic Ustorthents) andGaneshpur (Loamy Typic Ustorthents) weretentatively identified. The soils and land usesof two blocks are shown in figure 13.
Fig. 13. Major soils and land use in Namkhana and Hasnabad blocks in 24 Pgs(S),West Bengal
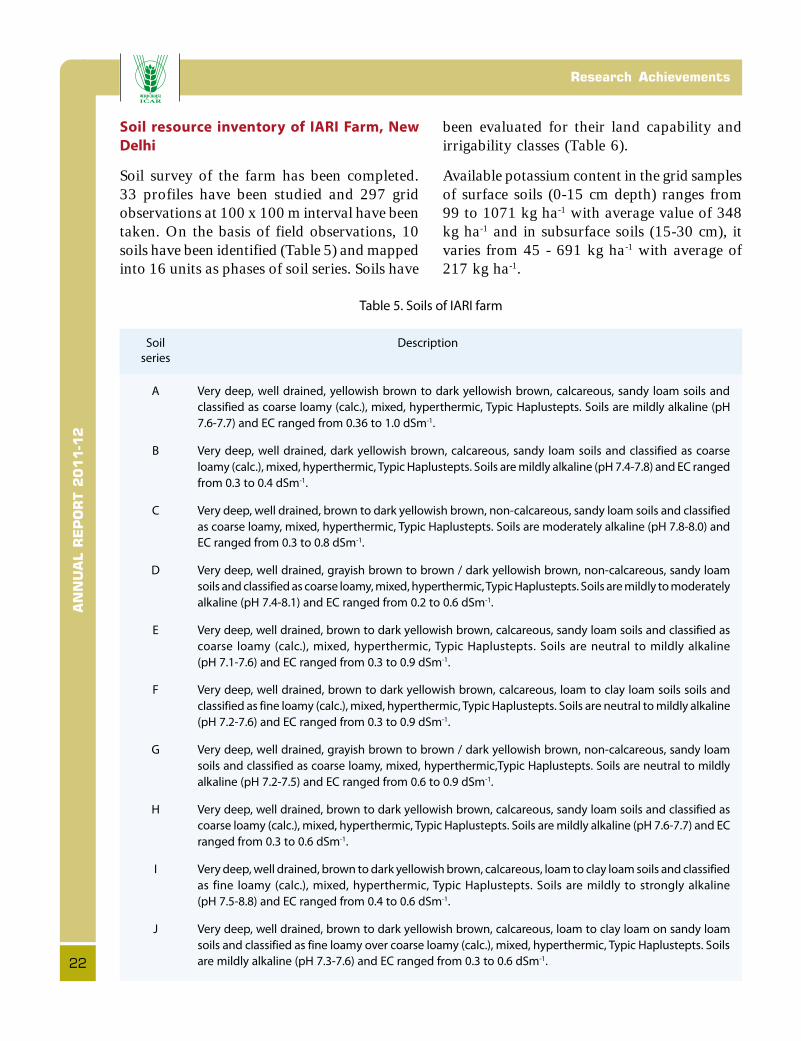
AN
NU
AL R
EP
OR
T 2
011-1
2Research Achievements
22
Soil resource inventory of IARI Farm, New
Delhi
Soil survey of the farm has been completed.33 profiles have been studied and 297 gridobservations at 100 x 100 m interval have beentaken. On the basis of field observations, 10soils have been identified (Table 5) and mappedinto 16 units as phases of soil series. Soils have
been evaluated for their land capability andirrigability classes (Table 6).
Available potassium content in the grid samplesof surface soils (0-15 cm depth) ranges from99 to 1071 kg ha-1 with average value of 348kg ha-1 and in subsurface soils (15-30 cm), itvaries from 45 - 691 kg ha-1 with average of217 kg ha-1.
Table 5. Soils of IARI farm
Soil Description
series
A Very deep, well drained, yellowish brown to dark yellowish brown, calcareous, sandy loam soils and
classified as coarse loamy (calc.), mixed, hyperthermic, Typic Haplustepts. Soils are mildly alkaline (pH
7.6-7.7) and EC ranged from 0.36 to 1.0 dSm-1.
B Very deep, well drained, dark yellowish brown, calcareous, sandy loam soils and classified as coarse
loamy (calc.), mixed, hyperthermic, Typic Haplustepts. Soils are mildly alkaline (pH 7.4-7.8) and EC ranged
from 0.3 to 0.4 dSm-1.
C Very deep, well drained, brown to dark yellowish brown, non-calcareous, sandy loam soils and classified
as coarse loamy, mixed, hyperthermic, Typic Haplustepts. Soils are moderately alkaline (pH 7.8-8.0) and
EC ranged from 0.3 to 0.8 dSm-1.
D Very deep, well drained, grayish brown to brown / dark yellowish brown, non-calcareous, sandy loam
soils and classified as coarse loamy, mixed, hyperthermic, Typic Haplustepts. Soils are mildly to moderately
alkaline (pH 7.4-8.1) and EC ranged from 0.2 to 0.6 dSm-1.
E Very deep, well drained, brown to dark yellowish brown, calcareous, sandy loam soils and classified as
coarse loamy (calc.), mixed, hyperthermic, Typic Haplustepts. Soils are neutral to mildly alkaline
(pH 7.1-7.6) and EC ranged from 0.3 to 0.9 dSm-1.
F Very deep, well drained, brown to dark yellowish brown, calcareous, loam to clay loam soils soils and
classified as fine loamy (calc.), mixed, hyperthermic, Typic Haplustepts. Soils are neutral to mildly alkaline
(pH 7.2-7.6) and EC ranged from 0.3 to 0.9 dSm-1.
G Very deep, well drained, grayish brown to brown / dark yellowish brown, non-calcareous, sandy loam
soils and classified as coarse loamy, mixed, hyperthermic,Typic Haplustepts. Soils are neutral to mildly
alkaline (pH 7.2-7.5) and EC ranged from 0.6 to 0.9 dSm-1.
H Very deep, well drained, brown to dark yellowish brown, calcareous, sandy loam soils and classified as
coarse loamy (calc.), mixed, hyperthermic, Typic Haplustepts. Soils are mildly alkaline (pH 7.6-7.7) and EC
ranged from 0.3 to 0.6 dSm-1.
I Very deep, well drained, brown to dark yellowish brown, calcareous, loam to clay loam soils and classified
as fine loamy (calc.), mixed, hyperthermic, Typic Haplustepts. Soils are mildly to strongly alkaline
(pH 7.5-8.8) and EC ranged from 0.4 to 0.6 dSm-1.
J Very deep, well drained, brown to dark yellowish brown, calcareous, loam to clay loam on sandy loam
soils and classified as fine loamy over coarse loamy (calc.), mixed, hyperthermic, Typic Haplustepts. Soils
are mildly alkaline (pH 7.3-7.6) and EC ranged from 0.3 to 0.6 dSm-1.
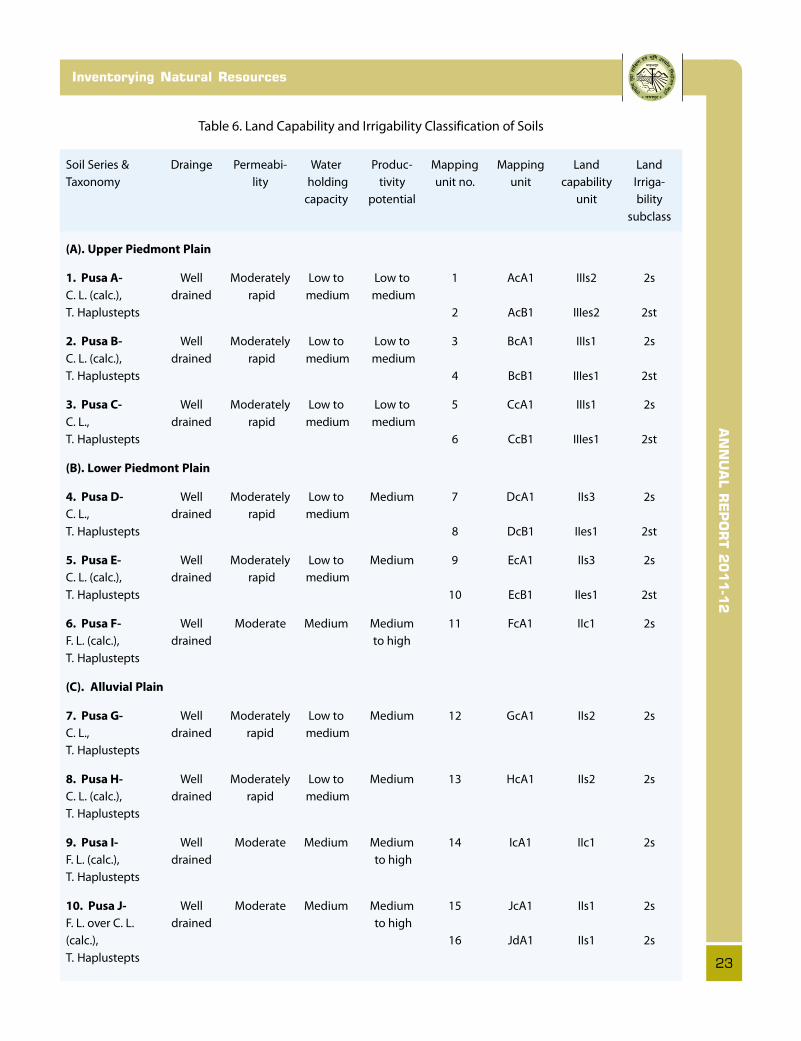
AN
NU
AL R
EP
OR
T 2
011-1
2
23
Inventorying Natural Resources
Table 6. Land Capability and Irrigability Classification of Soils
Soil Series & Drainge Permeabi- Water Produc- Mapping Mapping Land Land
Taxonomy lity holding tivity unit no. unit capability Irriga-
capacity potential unit bility
subclass
(A). Upper Piedmont Plain
1. Pusa A- Well Moderately Low to Low to 1 AcA1 IIIs2 2s
C. L. (calc.), drained rapid medium medium
T. Haplustepts 2 AcB1 IIIes2 2st
2. Pusa B- Well Moderately Low to Low to 3 BcA1 IIIs1 2s
C. L. (calc.), drained rapid medium medium
T. Haplustepts 4 BcB1 IIIes1 2st
3. Pusa C- Well Moderately Low to Low to 5 CcA1 IIIs1 2s
C. L., drained rapid medium medium
T. Haplustepts 6 CcB1 IIIes1 2st
(B). Lower Piedmont Plain
4. Pusa D- Well Moderately Low to Medium 7 DcA1 IIs3 2s
C. L., drained rapid medium
T. Haplustepts 8 DcB1 IIes1 2st
5. Pusa E- Well Moderately Low to Medium 9 EcA1 IIs3 2s
C. L. (calc.), drained rapid medium
T. Haplustepts 10 EcB1 IIes1 2st
6. Pusa F- Well Moderate Medium Medium 11 FcA1 IIc1 2s
F. L. (calc.), drained to high
T. Haplustepts
(C). Alluvial Plain
7. Pusa G- Well Moderately Low to Medium 12 GcA1 IIs2 2s
C. L., drained rapid medium
T. Haplustepts
8. Pusa H- Well Moderately Low to Medium 13 HcA1 IIs2 2s
C. L. (calc.), drained rapid medium
T. Haplustepts
9. Pusa I- Well Moderate Medium Medium 14 IcA1 IIc1 2s
F. L. (calc.), drained to high
T. Haplustepts
10. Pusa J- Well Moderate Medium Medium 15 JcA1 IIs1 2s
F. L. over C. L. drained to high
(calc.), 16 JdA1 IIs1 2s
T. Haplustepts

AN
NU
AL R
EP
OR
T 2
011-1
2Research Achievements
24
Land resource inventory for farm planning in
Jhalarapatan block of Jhalawar district of
Rajasthan
The present project (as pilot project) aims toprovide the required site-specific databaseneeded for farm planning in Jhalarapatanblock. Total area of Jhalarapatan block is10,9182 ha. Out of TGA, forest is covering31.4 % area, net sown area is 39.55 % and4.8 % area is under saline and non cultivableland. The area lies in the south-east corner ofRajasthan at the edge of Malwa plateau witharea of small hills and shallow plains. Thegeology of area is dominantly of basaltic rocksconsisting sandstone and shales with a bandof limestone. Wheat, mustard, methi, garlic,gram, coriander, kalongi and barley are grownin Rabi season and maize, jowar, til andsoybean are grown in Kharif season. Orangeis a major fruit crop in this block.
The detailed survey of soils and land resourceswas conducted in 10 villages covering an areaof 2500 ha. Three soil series have beenidentified and mapped into phases.
Neemoda : Very deep (>150 cm), well drained,very dark brown clay loam surface followedby caly texture and dark grayish brown insubsurface clay, calcareous with 15 to 20 %gravels, developed on weathered sandstone andshales occurring on very gently sloping lands.
Khanpuriya : Shallow (25-50 cm), welldrained, very dark grayish brown clay loam insurface and clay in subsurface, stronglycalcareous, non gravelly developed onweathered sandstone occurring on nearly levelto gently sloping lands.
Gopalpura : Deep (100-150 cm), dark brownsandy loam in surface and sandy clay loamin subsurface, strongly calcareous with 30 to35 % gravels developed on weatheredsandstone an shale occurring on undulatingtopography.
Study of crop moisture availability of soils
during post – kharif period in Shibsagar
district of Assam
The objectives of the project were i) to quantifythe moisture status of soils during post- kharifperiod , ii) to explore the possibility of growinga 2nd crop (rabi) in the rice -fallows and iii) toestablish the relationship between various soilproperties (organic carbon, particle-size, fieldcapacity and also wilting point).
Samples were collected at an incremental depthof 0-0.20 m, 0.20-0.40 m, 0.40-0.60m, 0.60-0.80 m and 0.80 – 1.00 m. Soil moisture atvarious tensions (3, 100, 300, 500 1500 kPa)was determined using the Pressure PlateApparatus.
The available water ranges from 46 mm/m forloamy sand to 183mm/m for clayey soils.Profile-wise determination of available watershows that moderately fine soils have averageavailable water of 11.63cm, fine soils 13.32cm, moderately fine loamy soils 14.51cm anda very fine soil have 15.21 cm per 100 cmdepth. Bulk density holds a negative correlationwith O.C (-0.277*). Soil moisture tension bothat 0.30 and 15 bar are negatively correlatedwith all the sand fractions and positivelycorrelated with clay and O.C while silt did notshow any significant relationship. Variation of75.62% (R2) in 1/3 bar and 70.95 % (R2 ) in15 bar with independent soil variables ( B.D.,O.C., sand, silt , clay and very fine sand) isexplained by the regression model. It isestimated that the actual soil moisturesupplying capacity of light textured soils variesfrom 46 mm to 62 mm, medium textured soilsfrom 142 to 166 mm and of fine textured soilsfrom 139 to 183 mm. At an average soilmoisture removal rate of 3mm/day (underwinter condition), these soils could hold waterfor a period of only 15 to 21 days for lightsoils, 47 to 55 days for medium soils and from46 to 61 days for heavy soils.
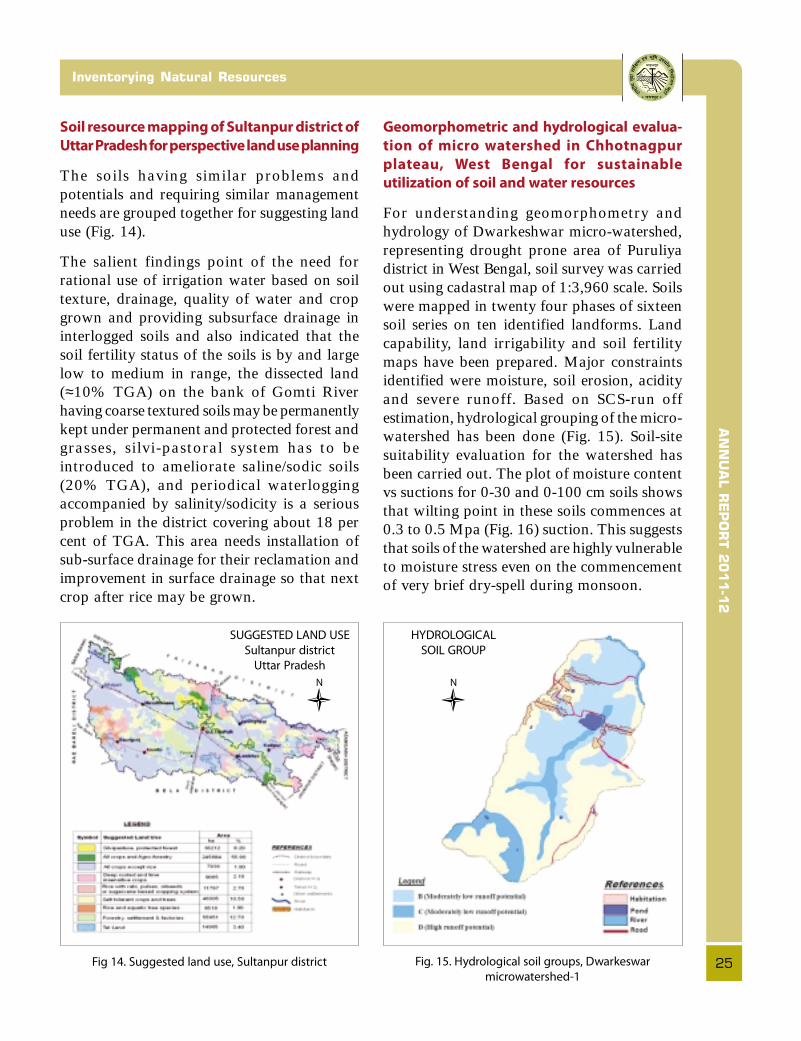
AN
NU
AL R
EP
OR
T 2
011-1
2
25
Inventorying Natural Resources
Soil resource mapping of Sultanpur district of
Uttar Pradesh for perspective land use planning
The soils having similar problems andpotentials and requiring similar managementneeds are grouped together for suggesting landuse (Fig. 14).
The salient findings point of the need forrational use of irrigation water based on soiltexture, drainage, quality of water and cropgrown and providing subsurface drainage ininterlogged soils and also indicated that thesoil fertility status of the soils is by and largelow to medium in range, the dissected land(≈10% TGA) on the bank of Gomti Riverhaving coarse textured soils may be permanentlykept under permanent and protected forest andgrasses, silvi-pastoral system has to beintroduced to ameliorate saline/sodic soils(20% TGA), and periodical waterloggingaccompanied by salinity/sodicity is a seriousproblem in the district covering about 18 percent of TGA. This area needs installation ofsub-surface drainage for their reclamation andimprovement in surface drainage so that nextcrop after rice may be grown.
Geomorphometric and hydrological evalua-
tion of micro watershed in Chhotnagpur
plateau, West Bengal for sustainable
utilization of soil and water resources
For understanding geomorphometry andhydrology of Dwarkeshwar micro-watershed,representing drought prone area of Puruliyadistrict in West Bengal, soil survey was carriedout using cadastral map of 1:3,960 scale. Soilswere mapped in twenty four phases of sixteensoil series on ten identified landforms. Landcapability, land irrigability and soil fertilitymaps have been prepared. Major constraintsidentified were moisture, soil erosion, acidityand severe runoff. Based on SCS-run offestimation, hydrological grouping of the micro-watershed has been done (Fig. 15). Soil-sitesuitability evaluation for the watershed hasbeen carried out. The plot of moisture contentvs suctions for 0-30 and 0-100 cm soils showsthat wilting point in these soils commences at0.3 to 0.5 Mpa (Fig. 16) suction. This suggeststhat soils of the watershed are highly vulnerableto moisture stress even on the commencementof very brief dry-spell during monsoon.
Fig. 15. Hydrological soil groups, Dwarkeswar
microwatershed-1
Fig 14. Suggested land use, Sultanpur district
SUGGESTED LAND USE
Sultanpur district
Uttar Pradesh
HYDROLOGICAL
SOIL GROUP
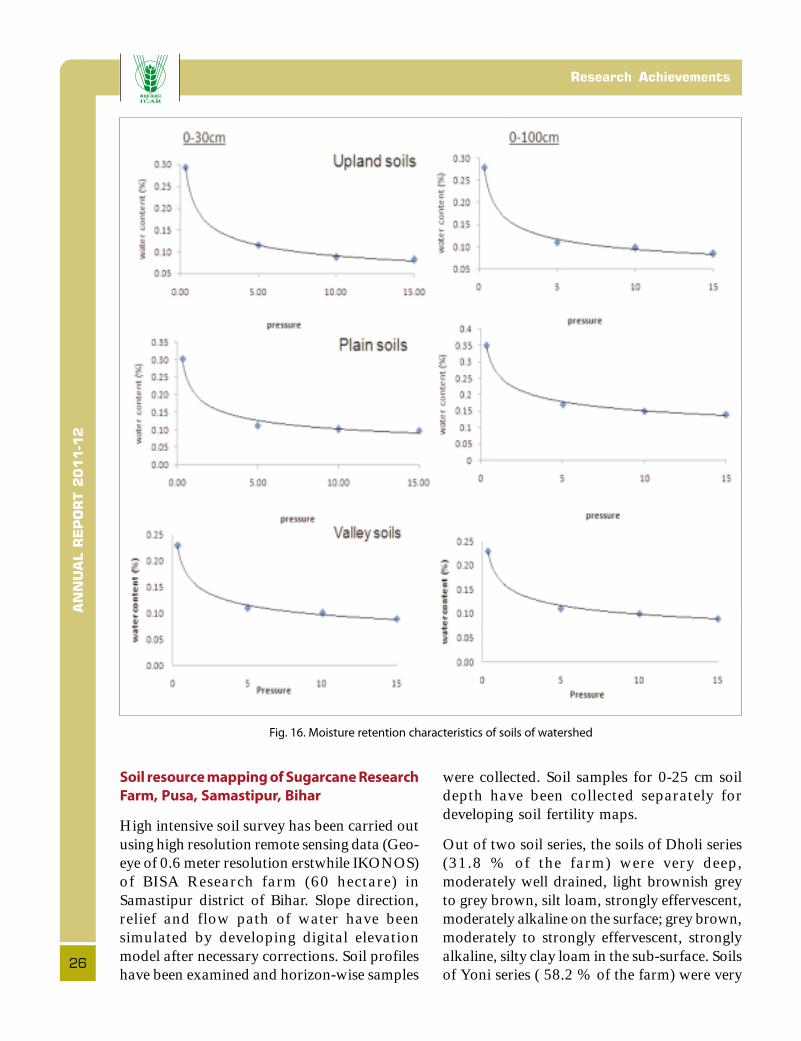
AN
NU
AL R
EP
OR
T 2
011-1
2Research Achievements
26
Soil resource mapping of Sugarcane Research
Farm, Pusa, Samastipur, Bihar
High intensive soil survey has been carried outusing high resolution remote sensing data (Geo-eye of 0.6 meter resolution erstwhile IKONOS)of BISA Research farm (60 hectare) inSamastipur district of Bihar. Slope direction,relief and flow path of water have beensimulated by developing digital elevationmodel after necessary corrections. Soil profileshave been examined and horizon-wise samples
were collected. Soil samples for 0-25 cm soildepth have been collected separately fordeveloping soil fertility maps.
Out of two soil series, the soils of Dholi series(31.8 % of the farm) were very deep,moderately well drained, light brownish greyto grey brown, silt loam, strongly effervescent,moderately alkaline on the surface; grey brown,moderately to strongly effervescent, stronglyalkaline, silty clay loam in the sub-surface. Soilsof Yoni series ( 58.2 % of the farm) were very
Fig. 16. Moisture retention characteristics of soils of watershed
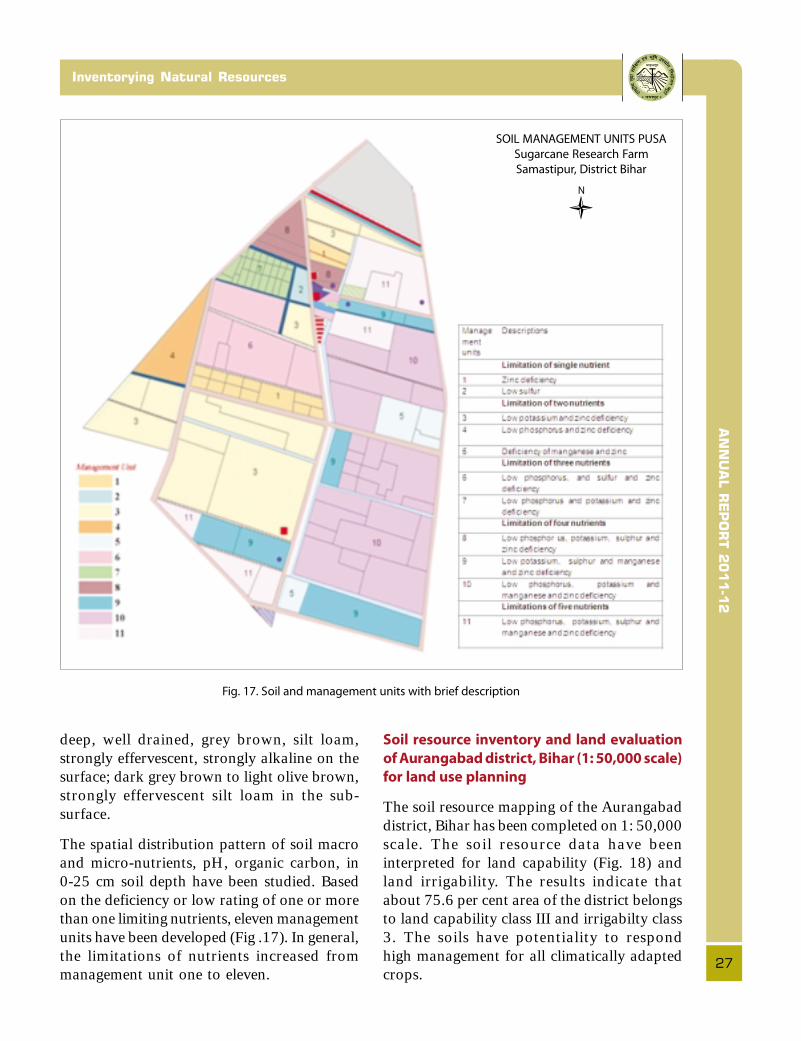
AN
NU
AL R
EP
OR
T 2
011-1
2
27
Inventorying Natural Resources
Fig. 17. Soil and management units with brief description
deep, well drained, grey brown, silt loam,strongly effervescent, strongly alkaline on thesurface; dark grey brown to light olive brown,strongly effervescent silt loam in the sub-surface.
The spatial distribution pattern of soil macroand micro-nutrients, pH, organic carbon, in0-25 cm soil depth have been studied. Basedon the deficiency or low rating of one or morethan one limiting nutrients, eleven managementunits have been developed (Fig .17). In general,the limitations of nutrients increased frommanagement unit one to eleven.
Soil resource inventory and land evaluation
of Aurangabad district, Bihar (1: 50,000 scale)
for land use planning
The soil resource mapping of the Aurangabaddistrict, Bihar has been completed on 1: 50,000scale. The soil resource data have beeninterpreted for land capability (Fig. 18) andland irrigability. The results indicate thatabout 75.6 per cent area of the district belongsto land capability class III and irrigabilty class3. The soils have potentiality to respondhigh management for all climatically adaptedcrops.
SOIL MANAGEMENT UNITS PUSA
Sugarcane Research Farm
Samastipur, District Bihar
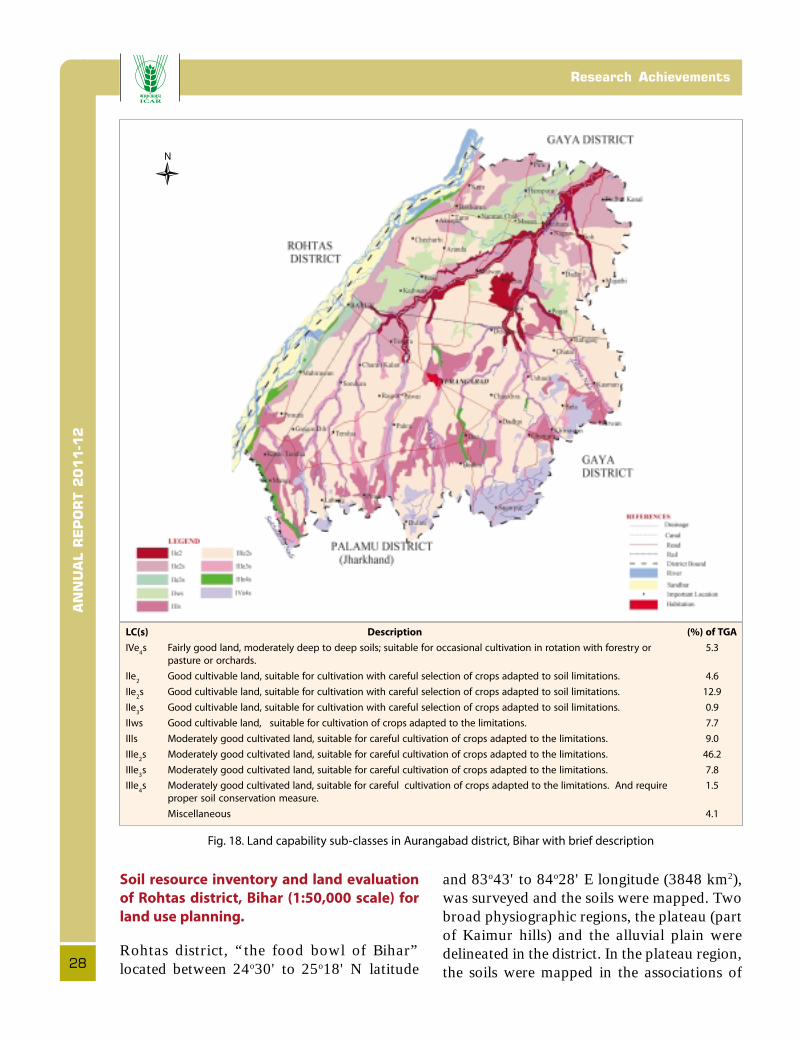
AN
NU
AL R
EP
OR
T 2
011-1
2Research Achievements
28
Soil resource inventory and land evaluation
of Rohtas district, Bihar (1:50,000 scale) for
land use planning.
Rohtas district, “the food bowl of Bihar”located between 24o30' to 25o18' N latitude
Fig. 18. Land capability sub-classes in Aurangabad district, Bihar with brief description
and 83o43' to 84o28' E longitude (3848 km2),was surveyed and the soils were mapped. Twobroad physiographic regions, the plateau (partof Kaimur hills) and the alluvial plain weredelineated in the district. In the plateau region,the soils were mapped in the associations of
LC(s) Description (%) of TGA
IVe4s Fairly good land, moderately deep to deep soils; suitable for occasional cultivation in rotation with forestry or 5.3
pasture or orchards.
IIe2
Good cultivable land, suitable for cultivation with careful selection of crops adapted to soil limitations. 4.6
IIe2s Good cultivable land, suitable for cultivation with careful selection of crops adapted to soil limitations. 12.9
IIe3s Good cultivable land, suitable for cultivation with careful selection of crops adapted to soil limitations. 0.9
IIws Good cultivable land, suitable for cultivation of crops adapted to the limitations. 7.7
IIIs Moderately good cultivated land, suitable for careful cultivation of crops adapted to the limitations. 9.0
IIIe2s Moderately good cultivated land, suitable for careful cultivation of crops adapted to the limitations. 46.2
IIIe3s Moderately good cultivated land, suitable for careful cultivation of crops adapted to the limitations. 7.8
IIIe4s Moderately good cultivated land, suitable for careful cultivation of crops adapted to the limitations. And require 1.5
proper soil conservation measure.
Miscellaneous 4.1
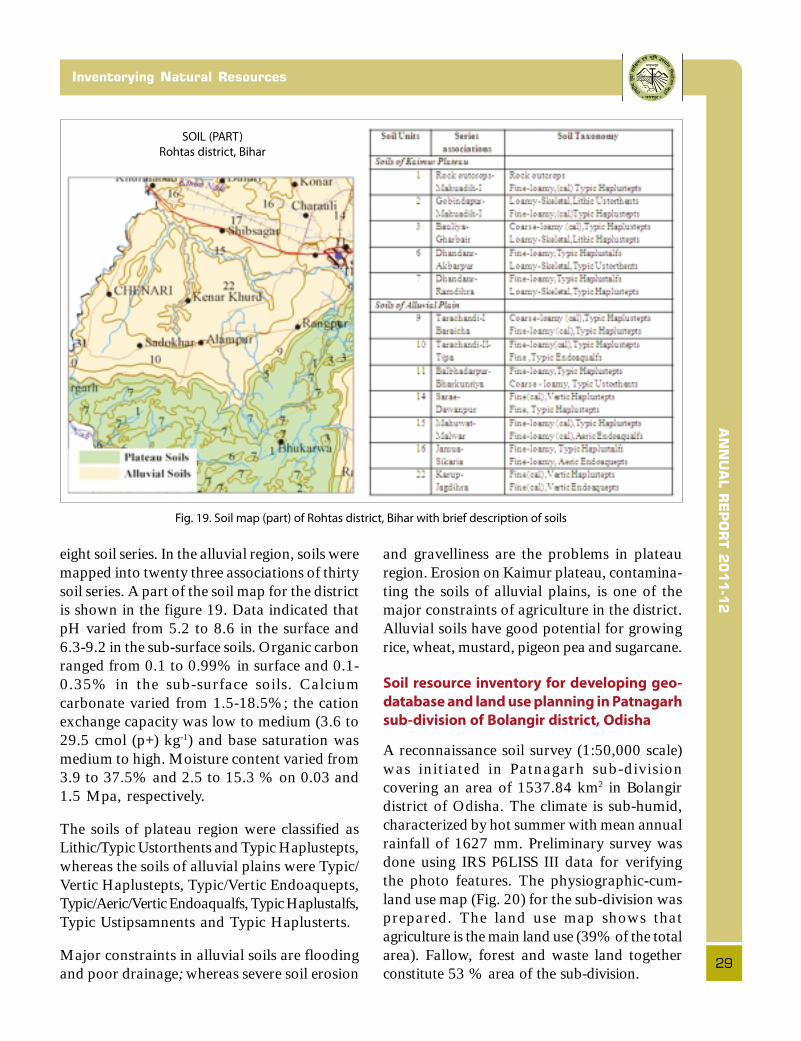
AN
NU
AL R
EP
OR
T 2
011-1
2
29
Inventorying Natural Resources
eight soil series. In the alluvial region, soils weremapped into twenty three associations of thirtysoil series. A part of the soil map for the districtis shown in the figure 19. Data indicated thatpH varied from 5.2 to 8.6 in the surface and6.3-9.2 in the sub-surface soils. Organic carbonranged from 0.1 to 0.99% in surface and 0.1-0.35% in the sub-surface soils. Calciumcarbonate varied from 1.5-18.5%; the cationexchange capacity was low to medium (3.6 to29.5 cmol (p+) kg-1) and base saturation wasmedium to high. Moisture content varied from3.9 to 37.5% and 2.5 to 15.3 % on 0.03 and1.5 Mpa, respectively.
The soils of plateau region were classified asLithic/Typic Ustorthents and Typic Haplustepts,whereas the soils of alluvial plains were Typic/Vertic Haplustepts, Typic/Vertic Endoaquepts,Typic/Aeric/Vertic Endoaqualfs, Typic Haplustalfs,Typic Ustipsamnents and Typic Haplusterts.
Major constraints in alluvial soils are floodingand poor drainage; whereas severe soil erosion
and gravelliness are the problems in plateauregion. Erosion on Kaimur plateau, contamina-ting the soils of alluvial plains, is one of themajor constraints of agriculture in the district.Alluvial soils have good potential for growingrice, wheat, mustard, pigeon pea and sugarcane.
Soil resource inventory for developing geo-
database and land use planning in Patnagarh
sub-division of Bolangir district, Odisha
A reconnaissance soil survey (1:50,000 scale)was initiated in Patnagarh sub-divisioncovering an area of 1537.84 km2 in Bolangirdistrict of Odisha. The climate is sub-humid,characterized by hot summer with mean annualrainfall of 1627 mm. Preliminary survey wasdone using IRS P6LISS III data for verifyingthe photo features. The physiographic-cum-land use map (Fig. 20) for the sub-division wasprepared. The land use map shows thatagriculture is the main land use (39% of the totalarea). Fallow, forest and waste land togetherconstitute 53 % area of the sub-division.
Fig. 19. Soil map (part) of Rohtas district, Bihar with brief description of soils
SOIL (PART)
Rohtas district, Bihar
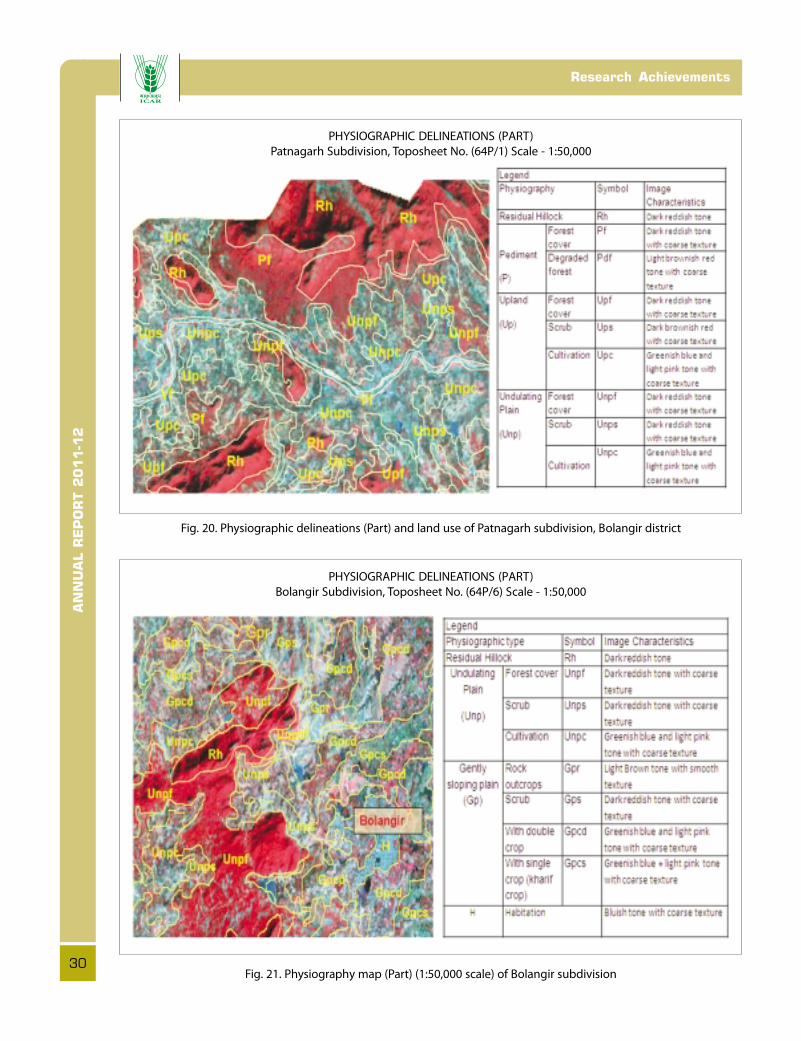
AN
NU
AL R
EP
OR
T 2
011-1
2Research Achievements
30
Fig. 20. Physiographic delineations (Part) and land use of Patnagarh subdivision, Bolangir district
Fig. 21. Physiography map (Part) (1:50,000 scale) of Bolangir subdivision
PHYSIOGRAPHIC DELINEATIONS (PART)
Patnagarh Subdivision, Toposheet No. (64P/1) Scale - 1:50,000
PHYSIOGRAPHIC DELINEATIONS (PART)
Bolangir Subdivision, Toposheet No. (64P/6) Scale - 1:50,000
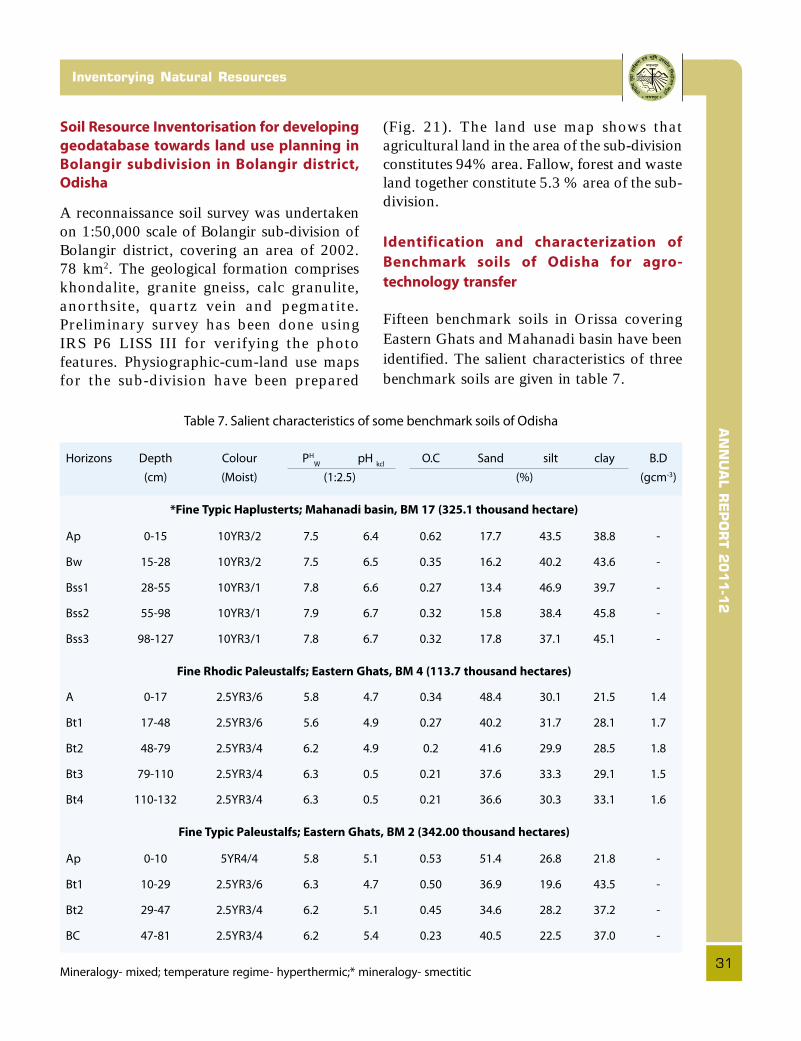
AN
NU
AL R
EP
OR
T 2
011-1
2
31
Inventorying Natural Resources
Soil Resource Inventorisation for developing
geodatabase towards land use planning in
Bolangir subdivision in Bolangir district,
Odisha
A reconnaissance soil survey was undertakenon 1:50,000 scale of Bolangir sub-division ofBolangir district, covering an area of 2002.78 km2. The geological formation compriseskhondalite, granite gneiss, calc granulite,anorthsite, quartz vein and pegmatite.Preliminary survey has been done usingIRS P6 LISS III for verifying the photofeatures. Physiographic-cum-land use mapsfor the sub-division have been prepared
(Fig. 21). The land use map shows thatagricultural land in the area of the sub-divisionconstitutes 94% area. Fallow, forest and wasteland together constitute 5.3 % area of the sub-division.
Identification and characterization of
Benchmark soils of Odisha for agro-
technology transfer
Fifteen benchmark soils in Orissa coveringEastern Ghats and Mahanadi basin have beenidentified. The salient characteristics of threebenchmark soils are given in table 7.
Table 7. Salient characteristics of some benchmark soils of Odisha
Horizons Depth Colour PH
WpH
kclO.C Sand silt clay B.D
(cm) (Moist) (1:2.5) (%) (gcm-3)
*Fine Typic Haplusterts; Mahanadi basin, BM 17 (325.1 thousand hectare)
Ap 0-15 10YR3/2 7.5 6.4 0.62 17.7 43.5 38.8 -
Bw 15-28 10YR3/2 7.5 6.5 0.35 16.2 40.2 43.6 -
Bss1 28-55 10YR3/1 7.8 6.6 0.27 13.4 46.9 39.7 -
Bss2 55-98 10YR3/1 7.9 6.7 0.32 15.8 38.4 45.8 -
Bss3 98-127 10YR3/1 7.8 6.7 0.32 17.8 37.1 45.1 -
Fine Rhodic Paleustalfs; Eastern Ghats, BM 4 (113.7 thousand hectares)
A 0-17 2.5YR3/6 5.8 4.7 0.34 48.4 30.1 21.5 1.4
Bt1 17-48 2.5YR3/6 5.6 4.9 0.27 40.2 31.7 28.1 1.7
Bt2 48-79 2.5YR3/4 6.2 4.9 0.2 41.6 29.9 28.5 1.8
Bt3 79-110 2.5YR3/4 6.3 0.5 0.21 37.6 33.3 29.1 1.5
Bt4 110-132 2.5YR3/4 6.3 0.5 0.21 36.6 30.3 33.1 1.6
Fine Typic Paleustalfs; Eastern Ghats, BM 2 (342.00 thousand hectares)
Ap 0-10 5YR4/4 5.8 5.1 0.53 51.4 26.8 21.8 -
Bt1 10-29 2.5YR3/6 6.3 4.7 0.50 36.9 19.6 43.5 -
Bt2 29-47 2.5YR3/4 6.2 5.1 0.45 34.6 28.2 37.2 -
BC 47-81 2.5YR3/4 6.2 5.4 0.23 40.5 22.5 37.0 -
Mineralogy- mixed; temperature regime- hyperthermic;* mineralogy- smectitic
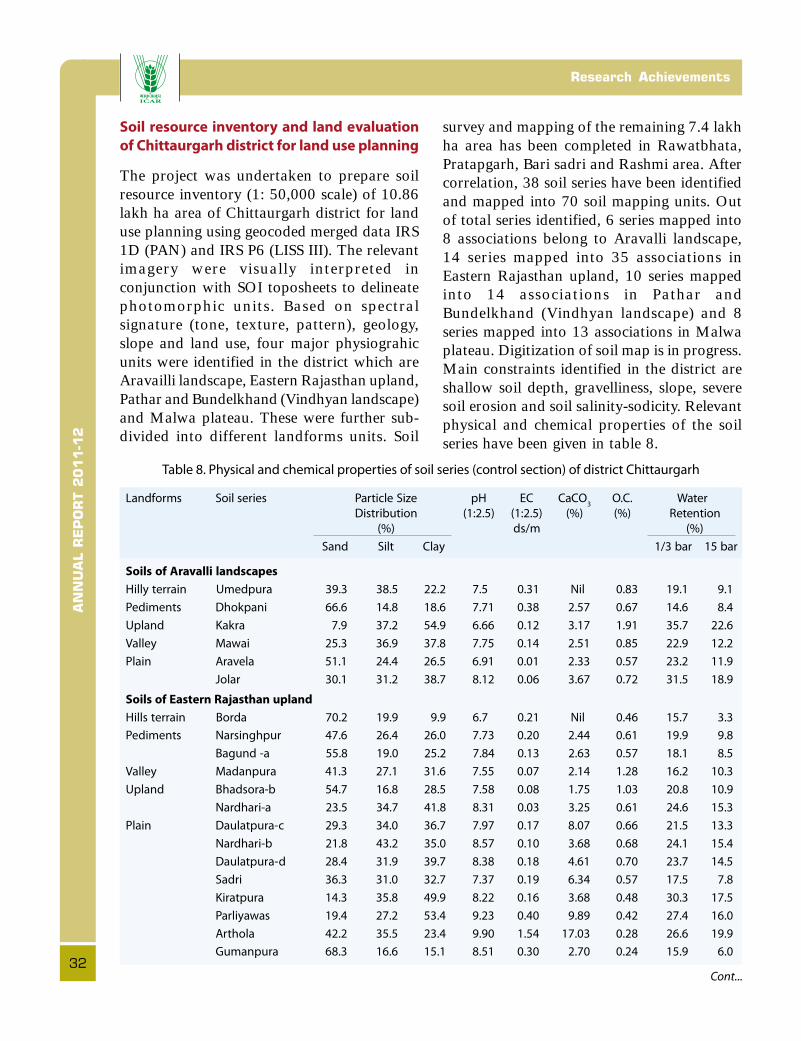
AN
NU
AL R
EP
OR
T 2
011-1
2Research Achievements
32
Soil resource inventory and land evaluation
of Chittaurgarh district for land use planning
The project was undertaken to prepare soilresource inventory (1: 50,000 scale) of 10.86lakh ha area of Chittaurgarh district for landuse planning using geocoded merged data IRS1D (PAN) and IRS P6 (LISS III). The relevantimagery were visually interpreted inconjunction with SOI toposheets to delineatephotomorphic units. Based on spectralsignature (tone, texture, pattern), geology,slope and land use, four major physiograhicunits were identified in the district which areAravailli landscape, Eastern Rajasthan upland,Pathar and Bundelkhand (Vindhyan landscape)and Malwa plateau. These were further sub-divided into different landforms units. Soil
survey and mapping of the remaining 7.4 lakhha area has been completed in Rawatbhata,Pratapgarh, Bari sadri and Rashmi area. Aftercorrelation, 38 soil series have been identifiedand mapped into 70 soil mapping units. Outof total series identified, 6 series mapped into8 associations belong to Aravalli landscape,14 series mapped into 35 associations inEastern Rajasthan upland, 10 series mappedinto 14 associations in Pathar andBundelkhand (Vindhyan landscape) and 8series mapped into 13 associations in Malwaplateau. Digitization of soil map is in progress.Main constraints identified in the district areshallow soil depth, gravelliness, slope, severesoil erosion and soil salinity-sodicity. Relevantphysical and chemical properties of the soilseries have been given in table 8.
Table 8. Physical and chemical properties of soil series (control section) of district Chittaurgarh
Landforms Soil series Particle Size pH EC CaCO3
O.C. Water
Distribution (1:2.5) (1:2.5) (%) (%) Retention
(%) ds/m (%)
Sand Silt Clay 1/3 bar 15 bar
Soils of Aravalli landscapes
Hilly terrain Umedpura 39.3 38.5 22.2 7.5 0.31 Nil 0.83 19.1 9.1
Pediments Dhokpani 66.6 14.8 18.6 7.71 0.38 2.57 0.67 14.6 8.4
Upland Kakra 7.9 37.2 54.9 6.66 0.12 3.17 1.91 35.7 22.6
Valley Mawai 25.3 36.9 37.8 7.75 0.14 2.51 0.85 22.9 12.2
Plain Aravela 51.1 24.4 26.5 6.91 0.01 2.33 0.57 23.2 11.9
Jolar 30.1 31.2 38.7 8.12 0.06 3.67 0.72 31.5 18.9
Soils of Eastern Rajasthan upland
Hills terrain Borda 70.2 19.9 9.9 6.7 0.21 Nil 0.46 15.7 3.3
Pediments Narsinghpur 47.6 26.4 26.0 7.73 0.20 2.44 0.61 19.9 9.8
Bagund -a 55.8 19.0 25.2 7.84 0.13 2.63 0.57 18.1 8.5
Valley Madanpura 41.3 27.1 31.6 7.55 0.07 2.14 1.28 16.2 10.3
Upland Bhadsora-b 54.7 16.8 28.5 7.58 0.08 1.75 1.03 20.8 10.9
Nardhari-a 23.5 34.7 41.8 8.31 0.03 3.25 0.61 24.6 15.3
Plain Daulatpura-c 29.3 34.0 36.7 7.97 0.17 8.07 0.66 21.5 13.3
Nardhari-b 21.8 43.2 35.0 8.57 0.10 3.68 0.68 24.1 15.4
Daulatpura-d 28.4 31.9 39.7 8.38 0.18 4.61 0.70 23.7 14.5
Sadri 36.3 31.0 32.7 7.37 0.19 6.34 0.57 17.5 7.8
Kiratpura 14.3 35.8 49.9 8.22 0.16 3.68 0.48 30.3 17.5
Parliyawas 19.4 27.2 53.4 9.23 0.40 9.89 0.42 27.4 16.0
Arthola 42.2 35.5 23.4 9.90 1.54 17.03 0.28 26.6 19.9
Gumanpura 68.3 16.6 15.1 8.51 0.30 2.70 0.24 15.9 6.0
Cont...
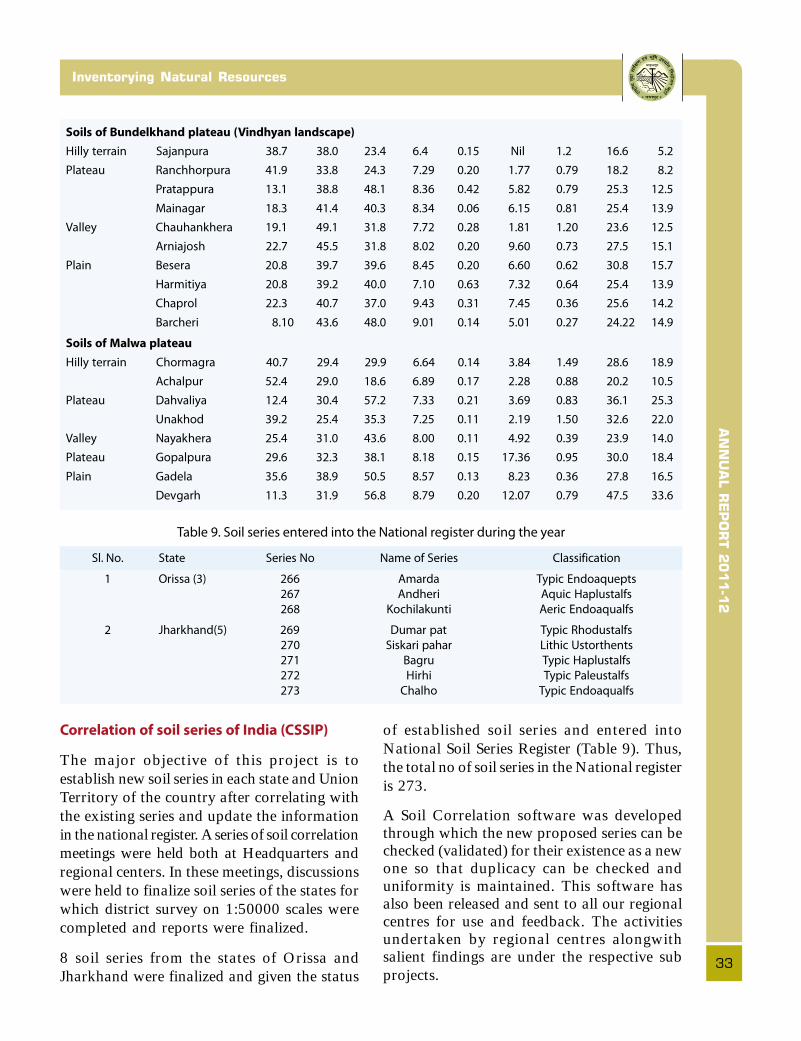
AN
NU
AL R
EP
OR
T 2
011-1
2
33
Inventorying Natural Resources
of established soil series and entered intoNational Soil Series Register (Table 9). Thus,the total no of soil series in the National registeris 273.
A Soil Correlation software was developedthrough which the new proposed series can bechecked (validated) for their existence as a newone so that duplicacy can be checked anduniformity is maintained. This software hasalso been released and sent to all our regionalcentres for use and feedback. The activitiesundertaken by regional centres alongwithsalient findings are under the respective subprojects.
Correlation of soil series of India (CSSIP)
The major objective of this project is toestablish new soil series in each state and UnionTerritory of the country after correlating withthe existing series and update the informationin the national register. A series of soil correlationmeetings were held both at Headquarters andregional centers. In these meetings, discussionswere held to finalize soil series of the states forwhich district survey on 1:50000 scales werecompleted and reports were finalized.
8 soil series from the states of Orissa andJharkhand were finalized and given the status
Soils of Bundelkhand plateau (Vindhyan landscape)
Hilly terrain Sajanpura 38.7 38.0 23.4 6.4 0.15 Nil 1.2 16.6 5.2
Plateau Ranchhorpura 41.9 33.8 24.3 7.29 0.20 1.77 0.79 18.2 8.2
Pratappura 13.1 38.8 48.1 8.36 0.42 5.82 0.79 25.3 12.5
Mainagar 18.3 41.4 40.3 8.34 0.06 6.15 0.81 25.4 13.9
Valley Chauhankhera 19.1 49.1 31.8 7.72 0.28 1.81 1.20 23.6 12.5
Arniajosh 22.7 45.5 31.8 8.02 0.20 9.60 0.73 27.5 15.1
Plain Besera 20.8 39.7 39.6 8.45 0.20 6.60 0.62 30.8 15.7
Harmitiya 20.8 39.2 40.0 7.10 0.63 7.32 0.64 25.4 13.9
Chaprol 22.3 40.7 37.0 9.43 0.31 7.45 0.36 25.6 14.2
Barcheri 8.10 43.6 48.0 9.01 0.14 5.01 0.27 24.22 14.9
Soils of Malwa plateau
Hilly terrain Chormagra 40.7 29.4 29.9 6.64 0.14 3.84 1.49 28.6 18.9
Achalpur 52.4 29.0 18.6 6.89 0.17 2.28 0.88 20.2 10.5
Plateau Dahvaliya 12.4 30.4 57.2 7.33 0.21 3.69 0.83 36.1 25.3
Unakhod 39.2 25.4 35.3 7.25 0.11 2.19 1.50 32.6 22.0
Valley Nayakhera 25.4 31.0 43.6 8.00 0.11 4.92 0.39 23.9 14.0
Plateau Gopalpura 29.6 32.3 38.1 8.18 0.15 17.36 0.95 30.0 18.4
Plain Gadela 35.6 38.9 50.5 8.57 0.13 8.23 0.36 27.8 16.5
Devgarh 11.3 31.9 56.8 8.79 0.20 12.07 0.79 47.5 33.6
Table 9. Soil series entered into the National register during the year
Sl. No. State Series No Name of Series Classification
1 Orissa (3) 266 Amarda Typic Endoaquepts
267 Andheri Aquic Haplustalfs
268 Kochilakunti Aeric Endoaqualfs
2 Jharkhand(5) 269 Dumar pat Typic Rhodustalfs
270 Siskari pahar Lithic Ustorthents
271 Bagru Typic Haplustalfs
272 Hirhi Typic Paleustalfs
273 Chalho Typic Endoaqualfs
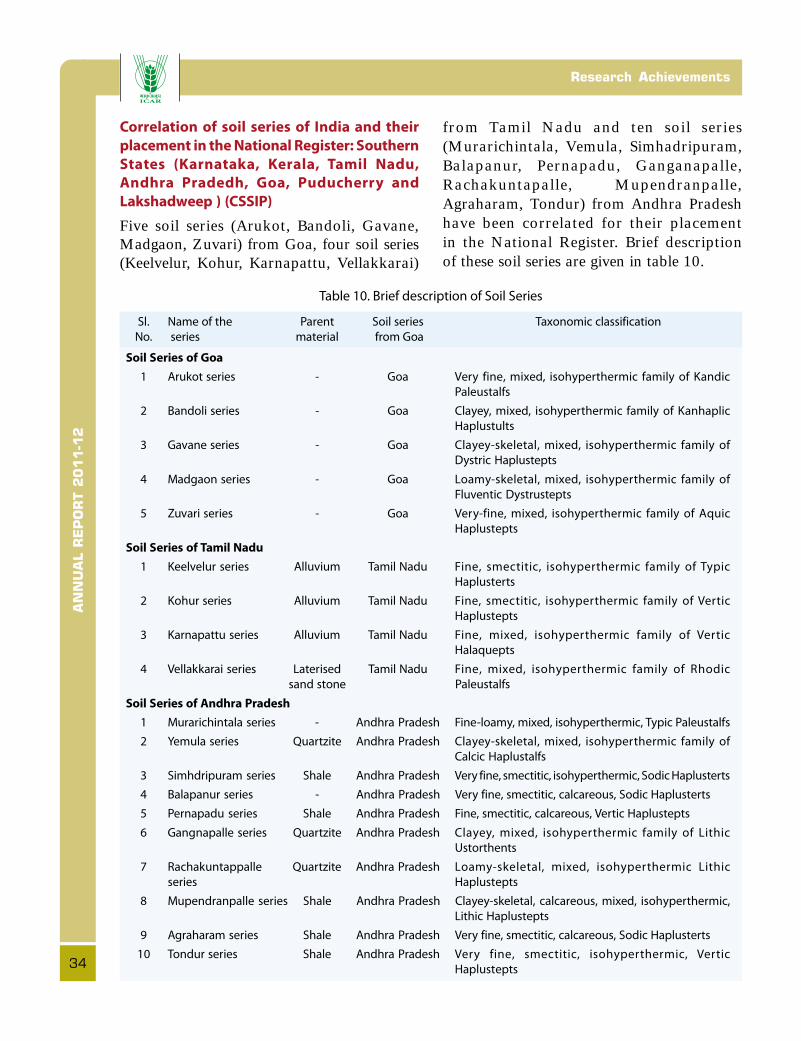
AN
NU
AL R
EP
OR
T 2
011-1
2Research Achievements
34
Correlation of soil series of India and their
placement in the National Register: Southern
States (Karnataka, Kerala, Tamil Nadu,
Andhra Pradedh, Goa, Puducherry and
Lakshadweep ) (CSSIP)
Five soil series (Arukot, Bandoli, Gavane,Madgaon, Zuvari) from Goa, four soil series(Keelvelur, Kohur, Karnapattu, Vellakkarai)
from Tamil Nadu and ten soil series(Murarichintala, Vemula, Simhadripuram,Balapanur, Pernapadu, Ganganapalle,Rachakuntapalle, Mupendranpalle,Agraharam, Tondur) from Andhra Pradeshhave been correlated for their placementin the National Register. Brief descriptionof these soil series are given in table 10.
Table 10. Brief description of Soil Series
Sl. Name of the Parent Soil series Taxonomic classification
No. series material from Goa
Soil Series of Goa
1 Arukot series - Goa Very fine, mixed, isohyperthermic family of Kandic
Paleustalfs
2 Bandoli series - Goa Clayey, mixed, isohyperthermic family of Kanhaplic
Haplustults
3 Gavane series - Goa Clayey-skeletal, mixed, isohyperthermic family of
Dystric Haplustepts
4 Madgaon series - Goa Loamy-skeletal, mixed, isohyperthermic family of
Fluventic Dystrustepts
5 Zuvari series - Goa Very-fine, mixed, isohyperthermic family of Aquic
Haplustepts
Soil Series of Tamil Nadu
1 Keelvelur series Alluvium Tamil Nadu Fine, smectitic, isohyperthermic family of Typic
Haplusterts
2 Kohur series Alluvium Tamil Nadu Fine, smectitic, isohyperthermic family of Vertic
Haplustepts
3 Karnapattu series Alluvium Tamil Nadu Fine, mixed, isohyperthermic family of Vertic
Halaquepts
4 Vellakkarai series Laterised Tamil Nadu Fine, mixed, isohyperthermic family of Rhodic
sand stone Paleustalfs
Soil Series of Andhra Pradesh
1 Murarichintala series - Andhra Pradesh Fine-loamy, mixed, isohyperthermic, Typic Paleustalfs
2 Yemula series Quartzite Andhra Pradesh Clayey-skeletal, mixed, isohyperthermic family of
Calcic Haplustalfs
3 Simhdripuram series Shale Andhra Pradesh Very fine, smectitic, isohyperthermic, Sodic Haplusterts
4 Balapanur series - Andhra Pradesh Very fine, smectitic, calcareous, Sodic Haplusterts
5 Pernapadu series Shale Andhra Pradesh Fine, smectitic, calcareous, Vertic Haplustepts
6 Gangnapalle series Quartzite Andhra Pradesh Clayey, mixed, isohyperthermic family of Lithic
Ustorthents
7 Rachakuntappalle Quartzite Andhra Pradesh Loamy-skeletal, mixed, isohyperthermic Lithic
series Haplustepts
8 Mupendranpalle series Shale Andhra Pradesh Clayey-skeletal, calcareous, mixed, isohyperthermic,
Lithic Haplustepts
9 Agraharam series Shale Andhra Pradesh Very fine, smectitic, calcareous, Sodic Haplusterts
10 Tondur series Shale Andhra Pradesh Very fine, smectitic, isohyperthermic, Vertic
Haplustepts
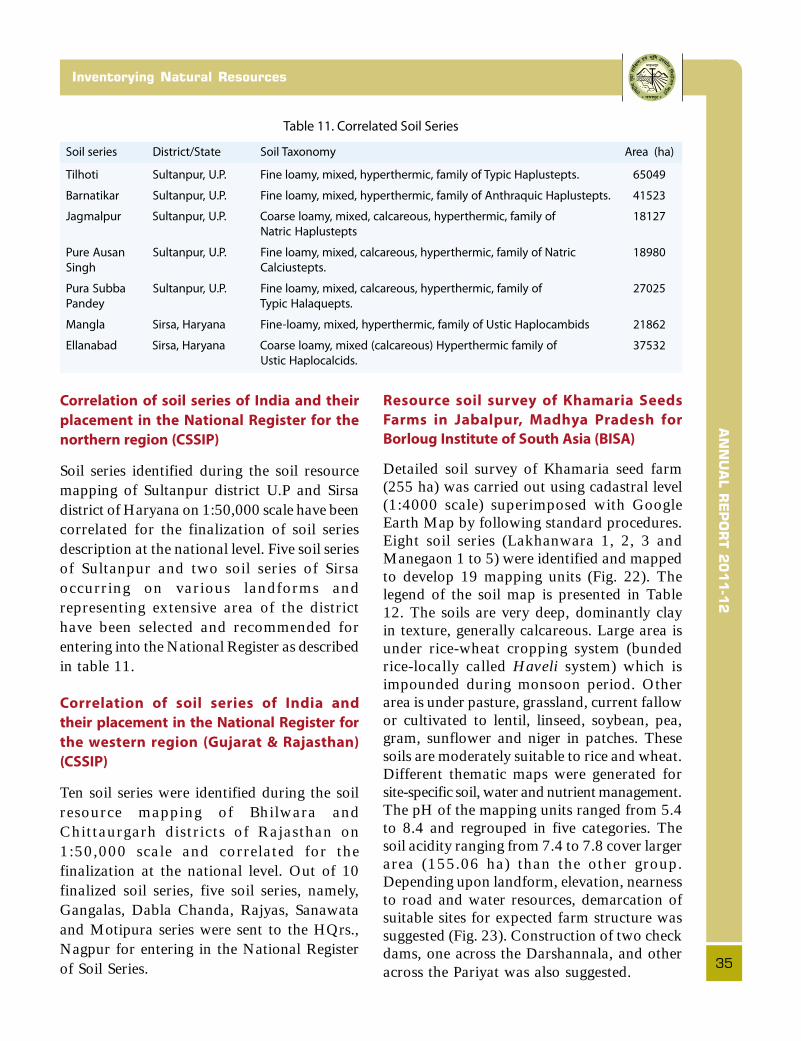
AN
NU
AL R
EP
OR
T 2
011-1
2
35
Inventorying Natural Resources
Correlation of soil series of India and their
placement in the National Register for the
northern region (CSSIP)
Soil series identified during the soil resourcemapping of Sultanpur district U.P and Sirsadistrict of Haryana on 1:50,000 scale have beencorrelated for the finalization of soil seriesdescription at the national level. Five soil seriesof Sultanpur and two soil series of Sirsaoccurring on various landforms andrepresenting extensive area of the districthave been selected and recommended forentering into the National Register as describedin table 11.
Correlation of soil series of India and
their placement in the National Register for
the western region (Gujarat & Rajasthan)
(CSSIP)
Ten soil series were identified during the soilresource mapping of Bhilwara andChittaurgarh districts of Rajasthan on1:50,000 scale and correlated for thefinalization at the national level. Out of 10finalized soil series, five soil series, namely,Gangalas, Dabla Chanda, Rajyas, Sanawataand Motipura series were sent to the HQrs.,Nagpur for entering in the National Registerof Soil Series.
Resource soil survey of Khamaria Seeds
Farms in Jabalpur, Madhya Pradesh for
Borloug Institute of South Asia (BISA)
Detailed soil survey of Khamaria seed farm(255 ha) was carried out using cadastral level(1:4000 scale) superimposed with GoogleEarth Map by following standard procedures.Eight soil series (Lakhanwara 1, 2, 3 andManegaon 1 to 5) were identified and mappedto develop 19 mapping units (Fig. 22). Thelegend of the soil map is presented in Table12. The soils are very deep, dominantly clayin texture, generally calcareous. Large area isunder rice-wheat cropping system (bundedrice-locally called Haveli system) which isimpounded during monsoon period. Otherarea is under pasture, grassland, current fallowor cultivated to lentil, linseed, soybean, pea,gram, sunflower and niger in patches. Thesesoils are moderately suitable to rice and wheat.Different thematic maps were generated forsite-specific soil, water and nutrient management.The pH of the mapping units ranged from 5.4to 8.4 and regrouped in five categories. Thesoil acidity ranging from 7.4 to 7.8 cover largerarea (155.06 ha) than the other group.Depending upon landform, elevation, nearnessto road and water resources, demarcation ofsuitable sites for expected farm structure wassuggested (Fig. 23). Construction of two checkdams, one across the Darshannala, and otheracross the Pariyat was also suggested.
Table 11. Correlated Soil Series
Soil series District/State Soil Taxonomy Area (ha)
Tilhoti Sultanpur, U.P. Fine loamy, mixed, hyperthermic, family of Typic Haplustepts. 65049
Barnatikar Sultanpur, U.P. Fine loamy, mixed, hyperthermic, family of Anthraquic Haplustepts. 41523
Jagmalpur Sultanpur, U.P. Coarse loamy, mixed, calcareous, hyperthermic, family of 18127
Natric Haplustepts
Pure Ausan Sultanpur, U.P. Fine loamy, mixed, calcareous, hyperthermic, family of Natric 18980
Singh Calciustepts.
Pura Subba Sultanpur, U.P. Fine loamy, mixed, calcareous, hyperthermic, family of 27025
Pandey Typic Halaquepts.
Mangla Sirsa, Haryana Fine-loamy, mixed, hyperthermic, family of Ustic Haplocambids 21862
Ellanabad Sirsa, Haryana Coarse loamy, mixed (calcareous) Hyperthermic family of 37532
Ustic Haplocalcids.

AN
NU
AL R
EP
OR
T 2
011-1
2Research Achievements
36
Fig. 22. Soil map of Khamaria farm, Jabalpur Fig. 23. Proposed plan for BISA, Khamaria farm
Table 12. Legend of the soil map
Soil Mapping Soil Taxonomy Description Area Capability Irrigability
Units1 (ha) subclass subclass
Lk1mA1 Typic Haplusterts Lakhanwara1: very deep, clay, level to nearly 40.23 IIs 2ds
level land (0-1%), slight erosion.
Lk1mB2 Typic Haplusterts Lakhanwara 1: very deep, clay, very gently 14.74 IIes 2ds
sloping (1-3%), moderate erosion.
Lk1mC2 Typic Haplusterts Lakhanwara1: very deep, clay, gently 32.56 IIes 3tds
sloping (3-8%), moderate erosion.
Lk2fB2 Typic Haplustepts Lakhanwara 2: very deep, clay loam, very 8.94 IIIs 2ds
gently sloping (1-3%), moderate erosion.
Lk2mC3 Typic Haplustepts Lakhanwara 2: very deep, clay, gently 2.27 IIIse 3st
sloping (3-8%), severe erosion.
Lk3 mD3 Vertic Haplustepts Lakhanwara 3: very deep, clay, mod. 4.87 IIIes 2ds
sloping (8-15%), severe erosion.
Lk3mC3 Vertic Haplustepts Lakhanwara 3: very deep, clay, gently sloping 3.83 IIes 3tds
(3-8%), severe erosion.
Lk3mB2 Vertic Haplustepts Lakhanwara 3: very deep, clay, moderately 2.48 IIes 5t
sloping (1-3), moderate erosion.
Mng1mA1 Typic Haplusterts Manegaon 1: very deep, clay level to nearly 20.72 IIs 2ds
level (0-1%), slight erosion.
Mng1mB2 Typic Haplusterts Manageon 1: very deep, clay, very gently 17.36 IIes 2ds
sloping (1-3%), moderate erosion.
cont...
KHAMARIA FARM
Jabalpur District,
Madhya Pradesh
KHAMARIA FARM BISA PLAN
Jabalpur District,
Madhya Pradesh
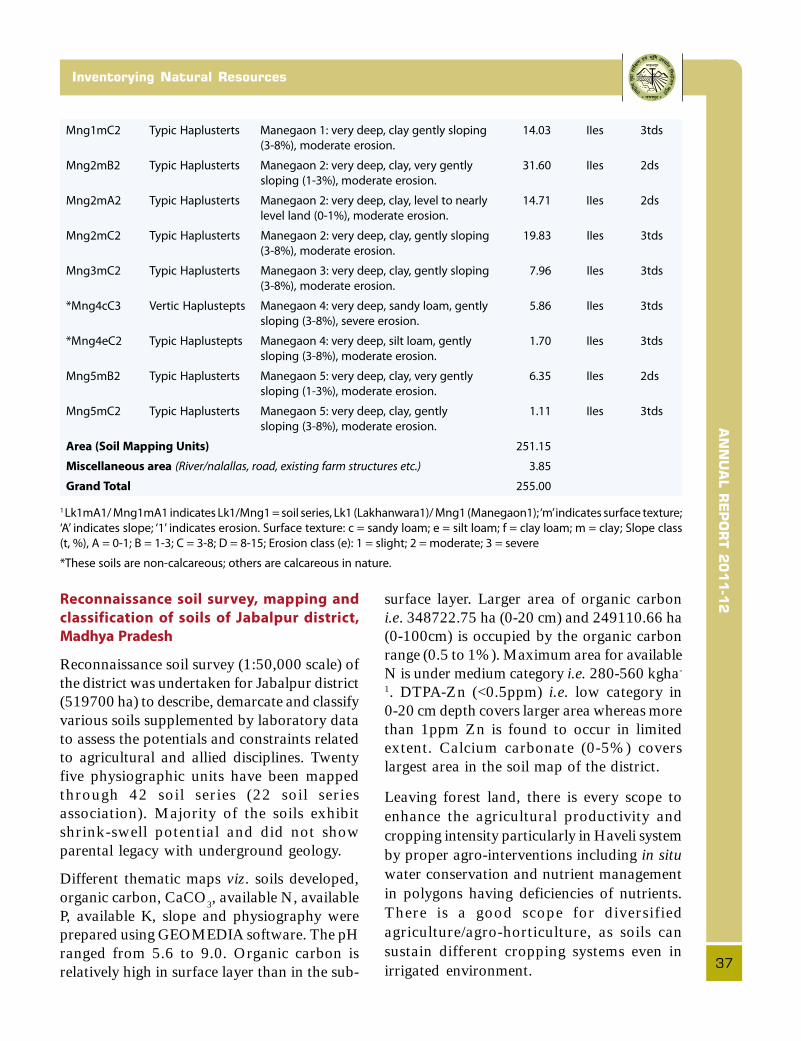
AN
NU
AL R
EP
OR
T 2
011-1
2
37
Inventorying Natural Resources
Mng1mC2 Typic Haplusterts Manegaon 1: very deep, clay gently sloping 14.03 IIes 3tds
(3-8%), moderate erosion.
Mng2mB2 Typic Haplusterts Manegaon 2: very deep, clay, very gently 31.60 IIes 2ds
sloping (1-3%), moderate erosion.
Mng2mA2 Typic Haplusterts Manegaon 2: very deep, clay, level to nearly 14.71 IIes 2ds
level land (0-1%), moderate erosion.
Mng2mC2 Typic Haplusterts Manegaon 2: very deep, clay, gently sloping 19.83 IIes 3tds
(3-8%), moderate erosion.
Mng3mC2 Typic Haplusterts Manegaon 3: very deep, clay, gently sloping 7.96 IIes 3tds
(3-8%), moderate erosion.
*Mng4cC3 Vertic Haplustepts Manegaon 4: very deep, sandy loam, gently 5.86 IIes 3tds
sloping (3-8%), severe erosion.
*Mng4eC2 Typic Haplustepts Manegaon 4: very deep, silt loam, gently 1.70 IIes 3tds
sloping (3-8%), moderate erosion.
Mng5mB2 Typic Haplusterts Manegaon 5: very deep, clay, very gently 6.35 IIes 2ds
sloping (1-3%), moderate erosion.
Mng5mC2 Typic Haplusterts Manegaon 5: very deep, clay, gently 1.11 IIes 3tds
sloping (3-8%), moderate erosion.
Area (Soil Mapping Units) 251.15
Miscellaneous area (River/nalallas, road, existing farm structures etc.) 3.85
Grand Total 255.00
1 Lk1mA1/ Mng1mA1 indicates Lk1/Mng1 = soil series, Lk1 (Lakhanwara1)/ Mng1 (Manegaon1); ‘m’ indicates surface texture;
‘A’ indicates slope; ‘1’ indicates erosion. Surface texture: c = sandy loam; e = silt loam; f = clay loam; m = clay; Slope class
(t, %), A = 0-1; B = 1-3; C = 3-8; D = 8-15; Erosion class (e): 1 = slight; 2 = moderate; 3 = severe
*These soils are non-calcareous; others are calcareous in nature.
Reconnaissance soil survey, mapping and
classification of soils of Jabalpur district,
Madhya Pradesh
Reconnaissance soil survey (1:50,000 scale) ofthe district was undertaken for Jabalpur district(519700 ha) to describe, demarcate and classifyvarious soils supplemented by laboratory datato assess the potentials and constraints relatedto agricultural and allied disciplines. Twentyfive physiographic units have been mappedthrough 42 soil series (22 soil seriesassociation). Majority of the soils exhibitshrink-swell potential and did not showparental legacy with underground geology.
Different thematic maps viz. soils developed,organic carbon, CaCO3, available N, availableP, available K, slope and physiography wereprepared using GEOMEDIA software. The pHranged from 5.6 to 9.0. Organic carbon isrelatively high in surface layer than in the sub-
surface layer. Larger area of organic carboni.e. 348722.75 ha (0-20 cm) and 249110.66 ha(0-100cm) is occupied by the organic carbonrange (0.5 to 1%). Maximum area for availableN is under medium category i.e. 280-560 kgha-
1. DTPA-Zn (<0.5ppm) i.e. low category in0-20 cm depth covers larger area whereas morethan 1ppm Zn is found to occur in limitedextent. Calcium carbonate (0-5%) coverslargest area in the soil map of the district.
Leaving forest land, there is every scope toenhance the agricultural productivity andcropping intensity particularly in Haveli systemby proper agro-interventions including in situwater conservation and nutrient managementin polygons having deficiencies of nutrients.There is a good scope for diversifiedagriculture/agro-horticulture, as soils cansustain different cropping systems even inirrigated environment.

AN
NU
AL R
EP
OR
T 2
011-1
2Research Achievements
38
Detailed resource soil survey of Hayatnagar
research farm of CRIDA, Hyderabad
The detailed soil survey of HayatnagarResearch Farm of CRIDA, Hyderabad wascarried out (activity reported in AR 2010-11)for characterizing soil resources and developingsoil and various thematic maps. Interpretationsmade of information obtained thereof arereported below.
The soils of the farm have a wide range ofpH varying from strongly acid to stronglyalkaline but majority (76%) of the soils are
neutral to moderately acid. The generalperception that red soils are devoid of freecalcium carbonates is not true for the soils ofsemi-arid climate. Therefore, laboratorydeterminations of CaCO3 should be includedin the laboratory protocol of soil analysis forthe soils of semi-arid climate. The studyindicates that soils are becoming calcareousand ESP in the subsoil is increasing. Thisdevelopment of alkalinity may be a threat infuture agriculture. Therefore efforts should beinitiated to grow cover crops to protect the soilfrom vagaries of climatic aridity.
Fig. 24. Soil site suitability for maize crop in soils of Hayatnagar farm
HAYATNAGAR RESEARCH FARM
CRIDA (ICAR), Hyderabad
Andhara Pradesh
SOIL SUITABILITY FOR MAIZE

AN
NU
AL R
EP
OR
T 2
011-1
2
39
Inventorying Natural Resources
The research farm has a good potential forgrowing agricultural crops. However,according to the criteria set for suitability ofdifferent crops, most of these soils aremarginally suitable. The farm area is prone towater erosion due to undulating and slopinglandforms. This can be checked by adoptingproper erosion control measures such as gradedbunding, alley cropping and protection byraised bunds and raising vetivar grasses oragave at proper intervals. This has becomemore important due to high intensity shortduration rainfall, a characteristic of semi-aridclimate. These soils have light textures (loamysand and sandy loam) and therefore inherentlylow in water holding capacity. The use ofsprinkler or drip irrigation can thereforeincrease the water user efficiency of the soils.Organic carbon in the soil is low and thereforemulching, use of leguminous crops in rotationor growing crops/grasses with high root densitycan the increase organic carbon status as wellas improves physical and chemical properties.The soils are now becoming calcareous andthe root exudates of cover crops can dissolve
CaCO3 and this soluble calcium can improve
the availability of calcium for plants andphysical properties of soils.
Horticultural crops like ber, amla, custardapple, pomegranate, mango, guava, citrus,tamarind, etc. can be grown successfully. Theplantation of Jatropha is another option whichcan survive well in these soils. Apart fromassured annual returns, these perennialplantations can induce a micro-climateconducive for decreased evapo-transpiration,improved organic matter status and alsodecreased soil erosion.
Each soil map unit was evaluated for itssuitability to grow maize (Fig. 24). The unitscan be further evaluated by conducting trialswith recommended package of practices. Thereyield of crops in each soil mapping unit is scopefor retiming the suitability classes bycorrelating with its soil and site characteristics.Such an exercise could facilitate improved useof soil survey information in recommendingbetter land use and management in similar soilsof semi arid bio-climate.

AN
NU
AL R
EP
OR
T 2
011-1
2Research Achievements
40
• Remote Sensing and its Applications
• Digital Database and Thematic Mapping
Remote Sensing, GIS and Cartography
2.2
Area prioritisation for land use planning in
some selected blocks of Bankura, Puruliya
and West Medinipur districts - a remote
sensing and GIS approach
The study was undertaken in the southern partof the Bankura, Puruliya and western part ofPaschim Medinipur districts of West Bengalto prioritize the area for land use planningusing remote sensing and GIS. Thehydrologically corrected DEM was developedfrom contours and spot height for altitude,
slope and aspect determination (Fig. 25).
Digital elevation model and the satelliteimagery (IRS P6 LISS III data) were used todelineate physiographic units. Soils wereidentified from the available reports ofBankura and Puruliya districts and werefurther extrapolated for the Binpur block ofPaschim Medinipur district (Fig 26). Based onthe presently identified physiography, soil-physiography relationship was developed andsoil boundaries were refined.
Fig. 25. Digital elevation model
Fill
Filling Sinks in DEM

AN
NU
AL R
EP
OR
T 2
011-1
2
41
Remote Sensing, GIS and Cartography
Fig. 26. Soil map of the study area
Fig. 27. Soil map of Badajorenala microwatershed
SOIL SERIES
ASSOCIATION
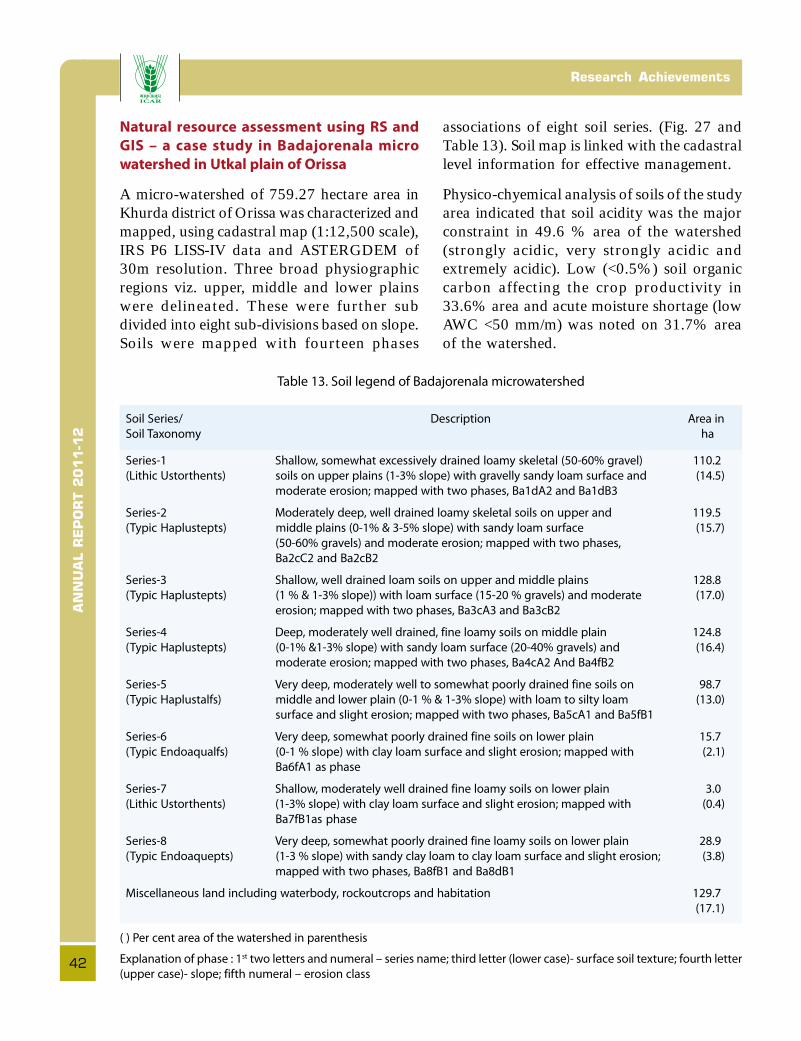
AN
NU
AL R
EP
OR
T 2
011-1
2Research Achievements
42
Natural resource assessment using RS and
GIS – a case study in Badajorenala micro
watershed in Utkal plain of Orissa
A micro-watershed of 759.27 hectare area inKhurda district of Orissa was characterized andmapped, using cadastral map (1:12,500 scale),IRS P6 LISS-IV data and ASTERGDEM of30m resolution. Three broad physiographicregions viz. upper, middle and lower plainswere delineated. These were further subdivided into eight sub-divisions based on slope.Soils were mapped with fourteen phases
associations of eight soil series. (Fig. 27 andTable 13). Soil map is linked with the cadastrallevel information for effective management.
Physico-chyemical analysis of soils of the studyarea indicated that soil acidity was the majorconstraint in 49.6 % area of the watershed(strongly acidic, very strongly acidic andextremely acidic). Low (<0.5%) soil organiccarbon affecting the crop productivity in33.6% area and acute moisture shortage (lowAWC <50 mm/m) was noted on 31.7% areaof the watershed.
Table 13. Soil legend of Badajorenala microwatershed
Soil Series/ Description Area in
Soil Taxonomy ha
Series-1 Shallow, somewhat excessively drained loamy skeletal (50-60% gravel) 110.2
(Lithic Ustorthents) soils on upper plains (1-3% slope) with gravelly sandy loam surface and (14.5)
moderate erosion; mapped with two phases, Ba1dA2 and Ba1dB3
Series-2 Moderately deep, well drained loamy skeletal soils on upper and 119.5
(Typic Haplustepts) middle plains (0-1% & 3-5% slope) with sandy loam surface (15.7)
(50-60% gravels) and moderate erosion; mapped with two phases,
Ba2cC2 and Ba2cB2
Series-3 Shallow, well drained loam soils on upper and middle plains 128.8
(Typic Haplustepts) (1 % & 1-3% slope)) with loam surface (15-20 % gravels) and moderate (17.0)
erosion; mapped with two phases, Ba3cA3 and Ba3cB2
Series-4 Deep, moderately well drained, fine loamy soils on middle plain 124.8
(Typic Haplustepts) (0-1% &1-3% slope) with sandy loam surface (20-40% gravels) and (16.4)
moderate erosion; mapped with two phases, Ba4cA2 And Ba4fB2
Series-5 Very deep, moderately well to somewhat poorly drained fine soils on 98.7
(Typic Haplustalfs) middle and lower plain (0-1 % & 1-3% slope) with loam to silty loam (13.0)
surface and slight erosion; mapped with two phases, Ba5cA1 and Ba5fB1
Series-6 Very deep, somewhat poorly drained fine soils on lower plain 15.7
(Typic Endoaqualfs) (0-1 % slope) with clay loam surface and slight erosion; mapped with (2.1)
Ba6fA1 as phase
Series-7 Shallow, moderately well drained fine loamy soils on lower plain 3.0
(Lithic Ustorthents) (1-3% slope) with clay loam surface and slight erosion; mapped with (0.4)
Ba7fB1as phase
Series-8 Very deep, somewhat poorly drained fine loamy soils on lower plain 28.9
(Typic Endoaquepts) (1-3 % slope) with sandy clay loam to clay loam surface and slight erosion; (3.8)
mapped with two phases, Ba8fB1 and Ba8dB1
Miscellaneous land including waterbody, rockoutcrops and habitation 129.7
(17.1)
( ) Per cent area of the watershed in parenthesis
Explanation of phase : 1st two letters and numeral – series name; third letter (lower case)- surface soil texture; fourth letter
(upper case)- slope; fifth numeral – erosion class
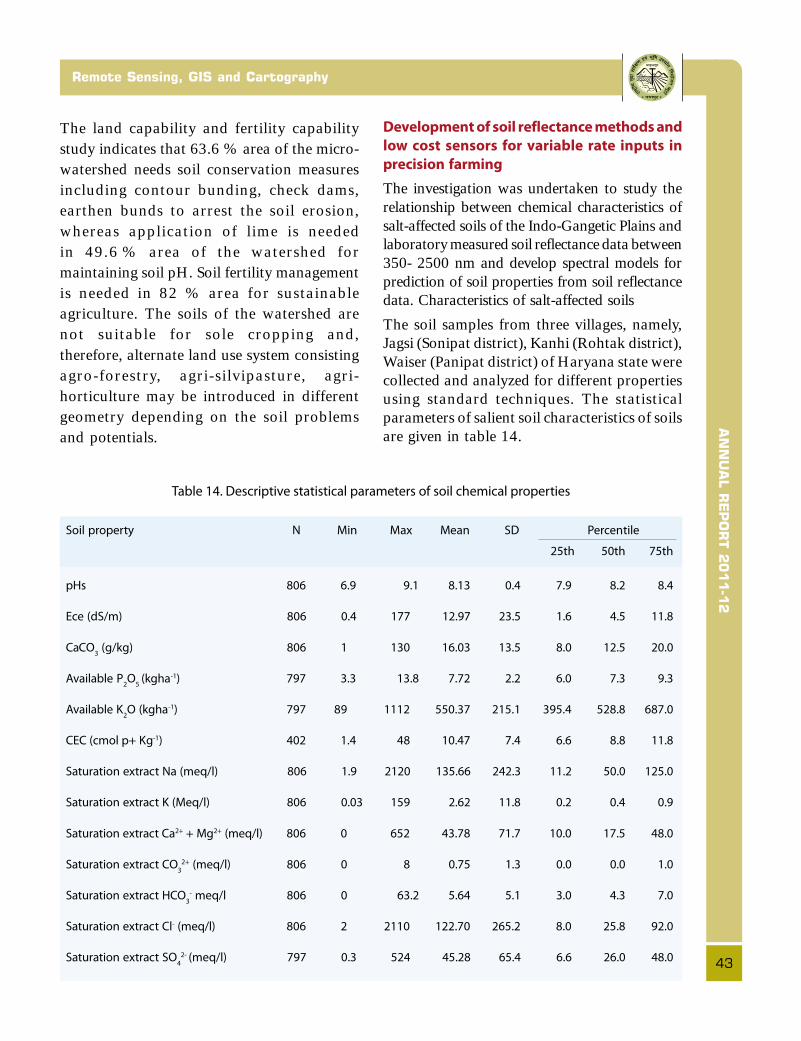
AN
NU
AL R
EP
OR
T 2
011-1
2
43
Remote Sensing, GIS and Cartography
The land capability and fertility capabilitystudy indicates that 63.6 % area of the micro-watershed needs soil conservation measuresincluding contour bunding, check dams,earthen bunds to arrest the soil erosion,whereas application of lime is neededin 49.6 % area of the watershed formaintaining soil pH. Soil fertility managementis needed in 82 % area for sustainableagriculture. The soils of the watershed arenot suitable for sole cropping and,therefore, alternate land use system consistingagro-forestry, agri-silvipasture, agri-horticulture may be introduced in differentgeometry depending on the soil problemsand potentials.
Development of soil reflectance methods and
low cost sensors for variable rate inputs in
precision farming
The investigation was undertaken to study therelationship between chemical characteristics ofsalt-affected soils of the Indo-Gangetic Plains andlaboratory measured soil reflectance data between350- 2500 nm and develop spectral models forprediction of soil properties from soil reflectancedata. Characteristics of salt-affected soils
The soil samples from three villages, namely,Jagsi (Sonipat district), Kanhi (Rohtak district),Waiser (Panipat district) of Haryana state werecollected and analyzed for different propertiesusing standard techniques. The statisticalparameters of salient soil characteristics of soilsare given in table 14.
Table 14. Descriptive statistical parameters of soil chemical properties
Soil property N Min Max Mean SD Percentile
25th 50th 75th
pHs 806 6.9 9.1 8.13 0.4 7.9 8.2 8.4
Ece (dS/m) 806 0.4 177 12.97 23.5 1.6 4.5 11.8
CaCO3 (g/kg) 806 1 130 16.03 13.5 8.0 12.5 20.0
Available P2O
5 (kgha-1) 797 3.3 13.8 7.72 2.2 6.0 7.3 9.3
Available K2O (kgha-1) 797 89 1112 550.37 215.1 395.4 528.8 687.0
CEC (cmol p+ Kg-1) 402 1.4 48 10.47 7.4 6.6 8.8 11.8
Saturation extract Na (meq/l) 806 1.9 2120 135.66 242.3 11.2 50.0 125.0
Saturation extract K (Meq/l) 806 0.03 159 2.62 11.8 0.2 0.4 0.9
Saturation extract Ca2+ + Mg2+ (meq/l) 806 0 652 43.78 71.7 10.0 17.5 48.0
Saturation extract CO3
2+ (meq/l) 806 0 8 0.75 1.3 0.0 0.0 1.0
Saturation extract HCO3
- meq/l 806 0 63.2 5.64 5.1 3.0 4.3 7.0
Saturation extract Cl- (meq/l) 806 2 2110 122.70 265.2 8.0 25.8 92.0
Saturation extract SO4
2- (meq/l) 797 0.3 524 45.28 65.4 6.6 26.0 48.0

AN
NU
AL R
EP
OR
T 2
011-1
2Research Achievements
44
Spectral data modelling
Partial least square (PLS) regression techniquewas used to develop spectral models forprediction of different soil chemicalparameters. The best spectral model waschosen based on coefficient of determinationof validation (r2), root mean square error ofprediction (RMSEP) and ratio of performanceto deviation (RPD).
Salt-affected soil properties viz., pHs(saturation extract pH), ECe (saturationextract EC) and saturated extract cations(Na+ and Ca2+ + Mg2+) and anions (Cl- andSO4
2_, CO32- and HCO3
-) were calibratedagainst the derivative reflectance wavebands.Good calibrations were obtained for ECe(r2 = 0.94, RMSE= 5.86), saturation extractCa2+ +Mg2+ (r2 = 0.89, RMSE= 1.23), saturation
extract Na+ (r2= 0.91, 2.29), saturation extractCl- (r2= 0.93, RMSE= 2.19) and saturationextract SO4
2- (r2= 0.76, RMSE= 1.69). Theapplication of calibration modelfor given soil attribute also resulted in high r2
and low RMSE in the independent validationsets (Table 15). However, the calibration ofsoil pH (r2= 0.57), saturation extract CO3
2-
(r2= 0.28) and HCO3- (r2= 0.35) with derivative
soil reflectance data did not show goodrelationship due to low variability in thedatasets. The high RPD (ratio of performanceto deviation) values (> 2.0) for ECe, saturatedextract Na+, Ca2+ + Mg2+ and Cl- indicatethat these properties can be reliably predictedfrom the spectral models (Fig. 28) whereasthe spectral model of saturation extract SO4
2-
needs further improvement with largerdatasets.
Table 15. Summary statistics for the spectral models developed by
partial least-square (PLS) regression
S. No. Soil fertility Number Calibration set Validation set
parameter* of
factors N r2 RMSE N SD r2 RMSE RPD
1 pH (Saturation 10 394 0.57 0.24 402 0.39 0.50 0.27 1.41
extract)
2 ECe (Saturation 4 404 0.94 5.86 402 21.3 0.94 5.33 3.99
extract) mS/m
3 Saturation extract 2 397 0.89 1.23 401 3.63 0.81 1.51 2.40
Ca2+ +Mg2+ (meq/l)
4 Saturation extract 5 402 0.91 2.29 402 7.09 0.88 2.45 2.89
Na+ (meq/l)
5 Saturation extract 5 404 0.93 2.19 402 7.44 0.92 2.16 3.44
Cl- (meq/l)
6 Saturation extract 8 380 0.76 1.69 402 3.55 0.67 2.21 1.60
SO4
2- (meq/l)
7 Saturation extract 6 397 0.28 0.59 402 0.70 0.21 1.11 0.63
CO3
2- (meq/l)
8 Saturation extract 5 381 0.35 2.45 395 0.70 0.15 0.645 1.08
HCO3
- (meq/l)
*Square root transformation was applied before PLS modelling on all the datasets except pH
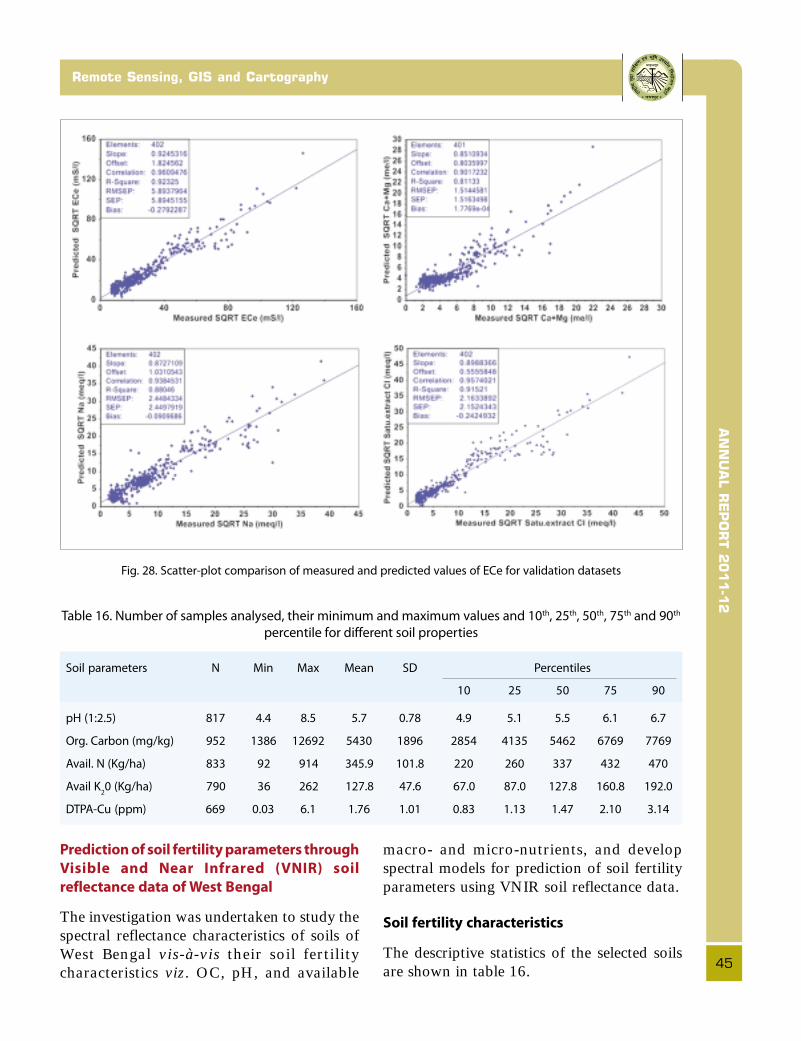
AN
NU
AL R
EP
OR
T 2
011-1
2
45
Remote Sensing, GIS and Cartography
Prediction of soil fertility parameters through
Visible and Near Infrared (VNIR) soil
reflectance data of West Bengal
The investigation was undertaken to study thespectral reflectance characteristics of soils ofWest Bengal vis-à-vis their soil fertilitycharacteristics viz. OC, pH, and available
macro- and micro-nutrients, and developspectral models for prediction of soil fertilityparameters using VNIR soil reflectance data.
Soil fertility characteristics
The descriptive statistics of the selected soilsare shown in table 16.
Fig. 28. Scatter-plot comparison of measured and predicted values of ECe for validation datasets
Table 16. Number of samples analysed, their minimum and maximum values and 10th, 25th, 50th, 75th and 90th
percentile for different soil properties
Soil parameters N Min Max Mean SD Percentiles
10 25 50 75 90
pH (1:2.5) 817 4.4 8.5 5.7 0.78 4.9 5.1 5.5 6.1 6.7
Org. Carbon (mg/kg) 952 1386 12692 5430 1896 2854 4135 5462 6769 7769
Avail. N (Kg/ha) 833 92 914 345.9 101.8 220 260 337 432 470
Avail K20 (Kg/ha) 790 36 262 127.8 47.6 67.0 87.0 127.8 160.8 192.0
DTPA-Cu (ppm) 669 0.03 6.1 1.76 1.01 0.83 1.13 1.47 2.10 3.14
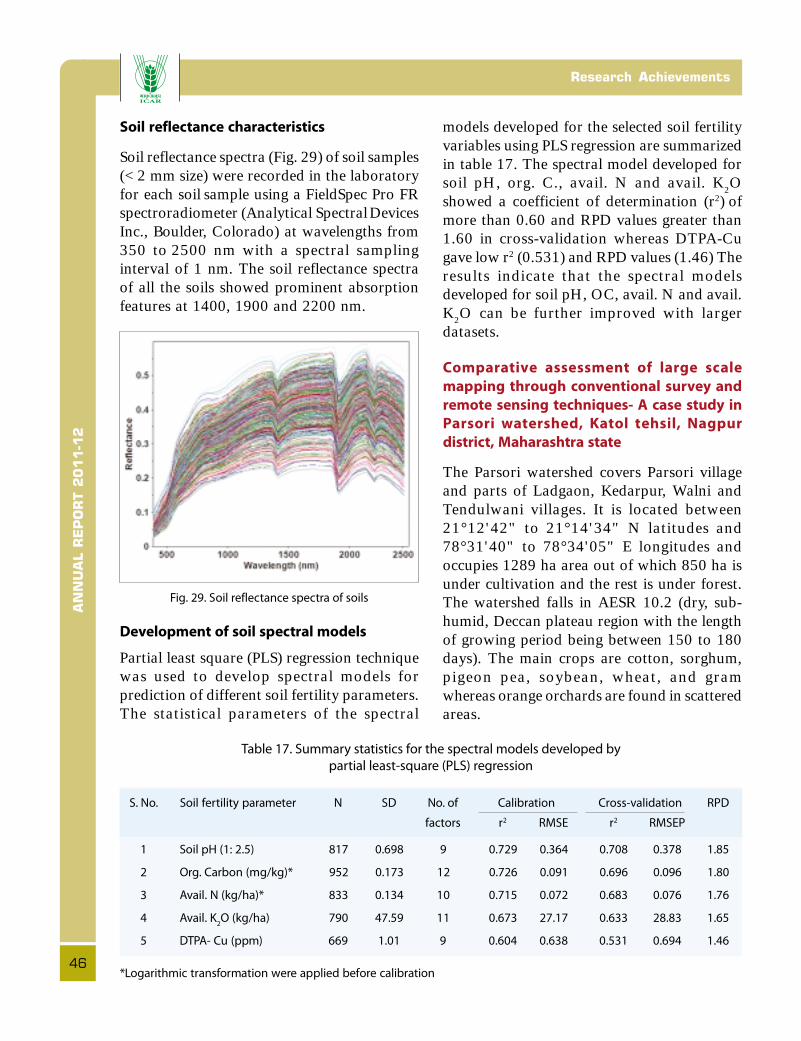
AN
NU
AL R
EP
OR
T 2
011-1
2Research Achievements
46
Soil reflectance characteristics
Soil reflectance spectra (Fig. 29) of soil samples(< 2 mm size) were recorded in the laboratoryfor each soil sample using a FieldSpec Pro FRspectroradiometer (Analytical Spectral DevicesInc., Boulder, Colorado) at wavelengths from350 to 2500 nm with a spectral samplinginterval of 1 nm. The soil reflectance spectraof all the soils showed prominent absorptionfeatures at 1400, 1900 and 2200 nm.
Fig. 29. Soil reflectance spectra of soils
Development of soil spectral models
Partial least square (PLS) regression techniquewas used to develop spectral models forprediction of different soil fertility parameters.The statistical parameters of the spectral
models developed for the selected soil fertilityvariables using PLS regression are summarizedin table 17. The spectral model developed forsoil pH, org. C., avail. N and avail. K
2O
showed a coefficient of determination (r2) ofmore than 0.60 and RPD values greater than1.60 in cross-validation whereas DTPA-Cugave low r2 (0.531) and RPD values (1.46) Theresults indicate that the spectral modelsdeveloped for soil pH, OC, avail. N and avail.K2O can be further improved with largerdatasets.
Comparative assessment of large scale
mapping through conventional survey and
remote sensing techniques- A case study in
Parsori watershed, Katol tehsil, Nagpur
district, Maharashtra state
The Parsori watershed covers Parsori villageand parts of Ladgaon, Kedarpur, Walni andTendulwani villages. It is located between21°12'42" to 21°14'34" N latitudes and78°31'40" to 78°34'05" E longitudes andoccupies 1289 ha area out of which 850 ha isunder cultivation and the rest is under forest.The watershed falls in AESR 10.2 (dry, sub-humid, Deccan plateau region with the lengthof growing period being between 150 to 180days). The main crops are cotton, sorghum,pigeon pea, soybean, wheat, and gramwhereas orange orchards are found in scatteredareas.
Table 17. Summary statistics for the spectral models developed by
partial least-square (PLS) regression
S. No. Soil fertility parameter N SD No. of Calibration Cross-validation RPD
factors r2 RMSE r2 RMSEP
1 Soil pH (1: 2.5) 817 0.698 9 0.729 0.364 0.708 0.378 1.85
2 Org. Carbon (mg/kg)* 952 0.173 12 0.726 0.091 0.696 0.096 1.80
3 Avail. N (kg/ha)* 833 0.134 10 0.715 0.072 0.683 0.076 1.76
4 Avail. K2O (kg/ha) 790 47.59 11 0.673 27.17 0.633 28.83 1.65
5 DTPA- Cu (ppm) 669 1.01 9 0.604 0.638 0.531 0.694 1.46
*Logarithmic transformation were applied before calibration
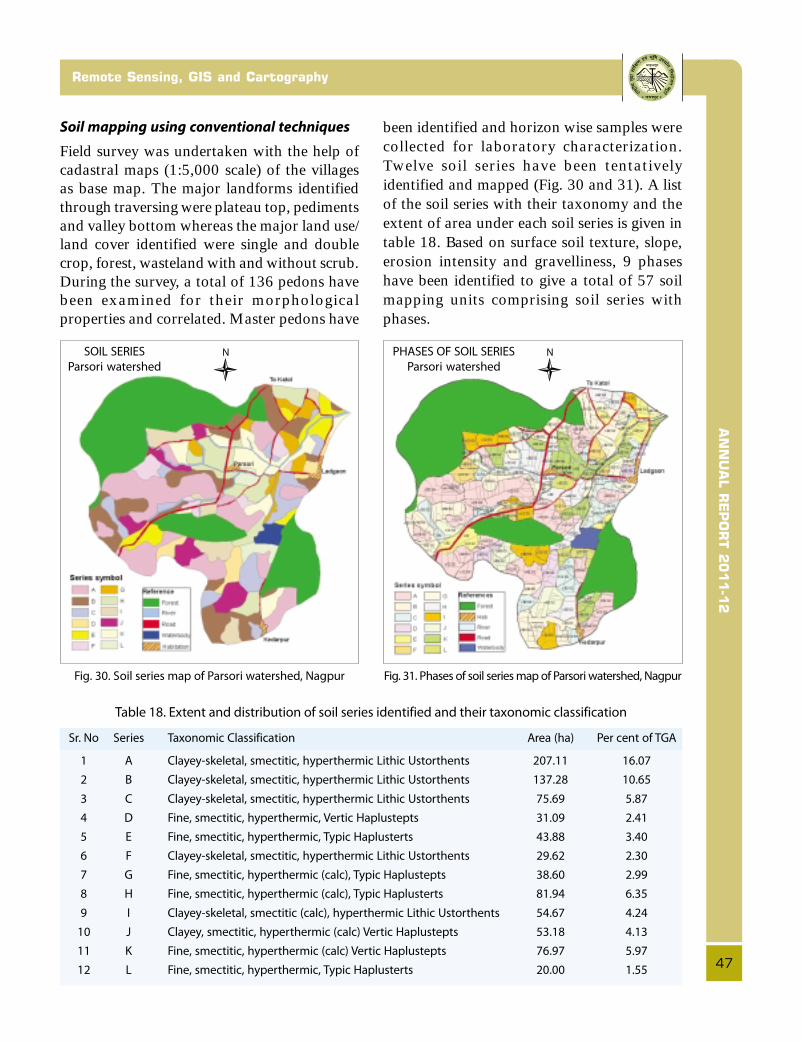
AN
NU
AL R
EP
OR
T 2
011-1
2
47
Remote Sensing, GIS and Cartography
Soil mapping using conventional techniques
Field survey was undertaken with the help ofcadastral maps (1:5,000 scale) of the villagesas base map. The major landforms identifiedthrough traversing were plateau top, pedimentsand valley bottom whereas the major land use/land cover identified were single and doublecrop, forest, wasteland with and without scrub.During the survey, a total of 136 pedons havebeen examined for their morphologicalproperties and correlated. Master pedons have
been identified and horizon wise samples werecollected for laboratory characterization.Twelve soil series have been tentativelyidentified and mapped (Fig. 30 and 31). A listof the soil series with their taxonomy and theextent of area under each soil series is given intable 18. Based on surface soil texture, slope,erosion intensity and gravelliness, 9 phaseshave been identified to give a total of 57 soilmapping units comprising soil series withphases.
Table 18. Extent and distribution of soil series identified and their taxonomic classification
Sr. No Series Taxonomic Classification Area (ha) Per cent of TGA
1 A Clayey-skeletal, smectitic, hyperthermic Lithic Ustorthents 207.11 16.07
2 B Clayey-skeletal, smectitic, hyperthermic Lithic Ustorthents 137.28 10.65
3 C Clayey-skeletal, smectitic, hyperthermic Lithic Ustorthents 75.69 5.87
4 D Fine, smectitic, hyperthermic, Vertic Haplustepts 31.09 2.41
5 E Fine, smectitic, hyperthermic, Typic Haplusterts 43.88 3.40
6 F Clayey-skeletal, smectitic, hyperthermic Lithic Ustorthents 29.62 2.30
7 G Fine, smectitic, hyperthermic (calc), Typic Haplustepts 38.60 2.99
8 H Fine, smectitic, hyperthermic (calc), Typic Haplusterts 81.94 6.35
9 I Clayey-skeletal, smectitic (calc), hyperthermic Lithic Ustorthents 54.67 4.24
10 J Clayey, smectitic, hyperthermic (calc) Vertic Haplustepts 53.18 4.13
11 K Fine, smectitic, hyperthermic (calc) Vertic Haplustepts 76.97 5.97
12 L Fine, smectitic, hyperthermic, Typic Haplusterts 20.00 1.55
Fig. 30. Soil series map of Parsori watershed, Nagpur Fig. 31. Phases of soil series map of Parsori watershed, Nagpur
SOIL SERIES
Parsori watershed
PHASES OF SOIL SERIES
Parsori watershed
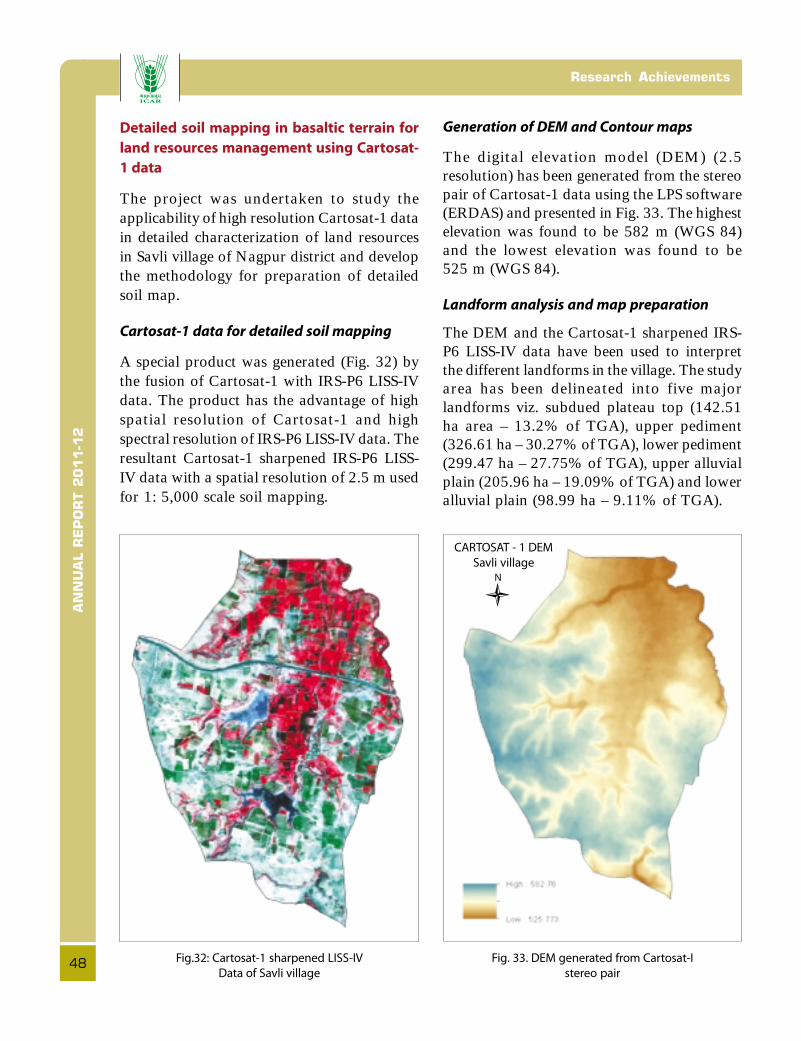
AN
NU
AL R
EP
OR
T 2
011-1
2Research Achievements
48
Detailed soil mapping in basaltic terrain for
land resources management using Cartosat-
1 data
The project was undertaken to study theapplicability of high resolution Cartosat-1 datain detailed characterization of land resourcesin Savli village of Nagpur district and developthe methodology for preparation of detailedsoil map.
Cartosat-1 data for detailed soil mapping
A special product was generated (Fig. 32) bythe fusion of Cartosat-1 with IRS-P6 LISS-IVdata. The product has the advantage of highspatial resolution of Cartosat-1 and highspectral resolution of IRS-P6 LISS-IV data. Theresultant Cartosat-1 sharpened IRS-P6 LISS-IV data with a spatial resolution of 2.5 m usedfor 1: 5,000 scale soil mapping.
Generation of DEM and Contour maps
The digital elevation model (DEM) (2.5resolution) has been generated from the stereopair of Cartosat-1 data using the LPS software(ERDAS) and presented in Fig. 33. The highestelevation was found to be 582 m (WGS 84)and the lowest elevation was found to be525 m (WGS 84).
Landform analysis and map preparation
The DEM and the Cartosat-1 sharpened IRS-P6 LISS-IV data have been used to interpretthe different landforms in the village. The studyarea has been delineated into five majorlandforms viz. subdued plateau top (142.51ha area – 13.2% of TGA), upper pediment(326.61 ha – 30.27% of TGA), lower pediment(299.47 ha – 27.75% of TGA), upper alluvialplain (205.96 ha – 19.09% of TGA) and loweralluvial plain (98.99 ha – 9.11% of TGA).
Fig.32: Cartosat-1 sharpened LISS-IV
Data of Savli village
Fig. 33. DEM generated from Cartosat-I
stereo pair
CARTOSAT - 1 DEM
Savli village
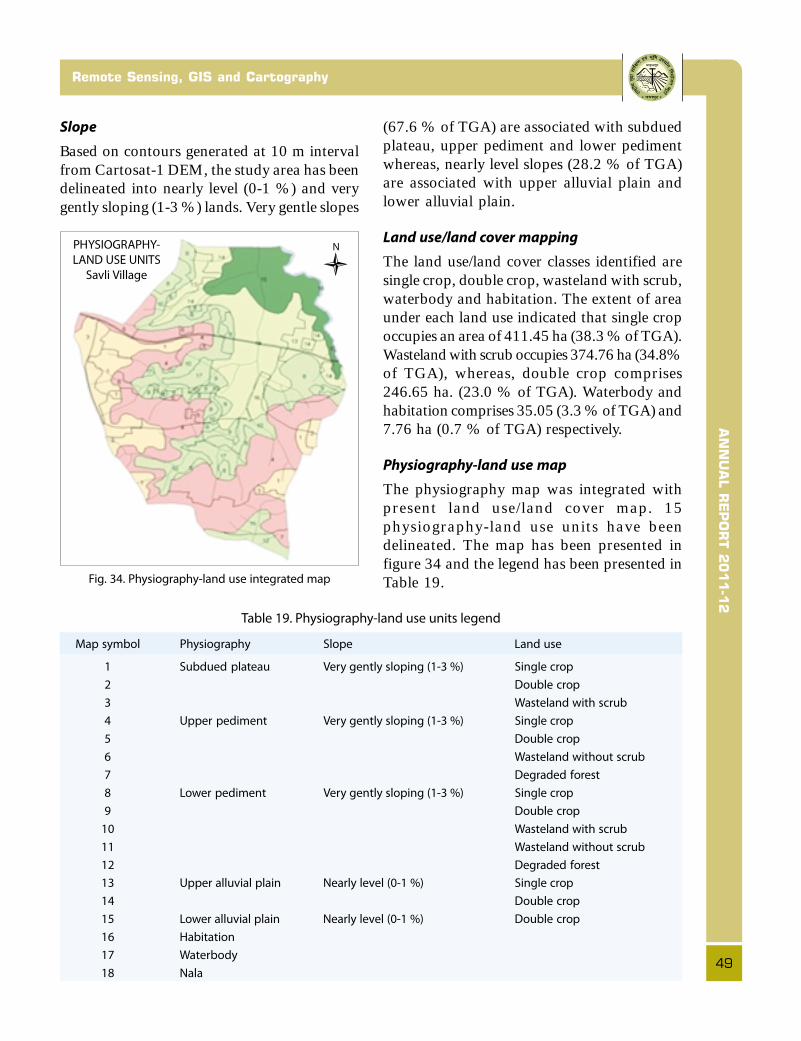
AN
NU
AL R
EP
OR
T 2
011-1
2
49
Remote Sensing, GIS and Cartography
Slope
Based on contours generated at 10 m intervalfrom Cartosat-1 DEM, the study area has beendelineated into nearly level (0-1 %) and verygently sloping (1-3 %) lands. Very gentle slopes
(67.6 % of TGA) are associated with subduedplateau, upper pediment and lower pedimentwhereas, nearly level slopes (28.2 % of TGA)are associated with upper alluvial plain andlower alluvial plain.
Land use/land cover mapping
The land use/land cover classes identified aresingle crop, double crop, wasteland with scrub,waterbody and habitation. The extent of areaunder each land use indicated that single cropoccupies an area of 411.45 ha (38.3 % of TGA).Wasteland with scrub occupies 374.76 ha (34.8%of TGA), whereas, double crop comprises246.65 ha. (23.0 % of TGA). Waterbody andhabitation comprises 35.05 (3.3 % of TGA) and7.76 ha (0.7 % of TGA) respectively.
Physiography-land use map
The physiography map was integrated withpresent land use/land cover map. 15physiography-land use units have beendelineated. The map has been presented infigure 34 and the legend has been presented inTable 19.Fig. 34. Physiography-land use integrated map
Table 19. Physiography-land use units legend
Map symbol Physiography Slope Land use
1 Subdued plateau Very gently sloping (1-3 %) Single crop
2 Double crop
3 Wasteland with scrub
4 Upper pediment Very gently sloping (1-3 %) Single crop
5 Double crop
6 Wasteland without scrub
7 Degraded forest
8 Lower pediment Very gently sloping (1-3 %) Single crop
9 Double crop
10 Wasteland with scrub
11 Wasteland without scrub
12 Degraded forest
13 Upper alluvial plain Nearly level (0-1 %) Single crop
14 Double crop
15 Lower alluvial plain Nearly level (0-1 %) Double crop
16 Habitation
17 Waterbody
18 Nala
PHYSIOGRAPHY-
LAND USE UNITS
Savli Village
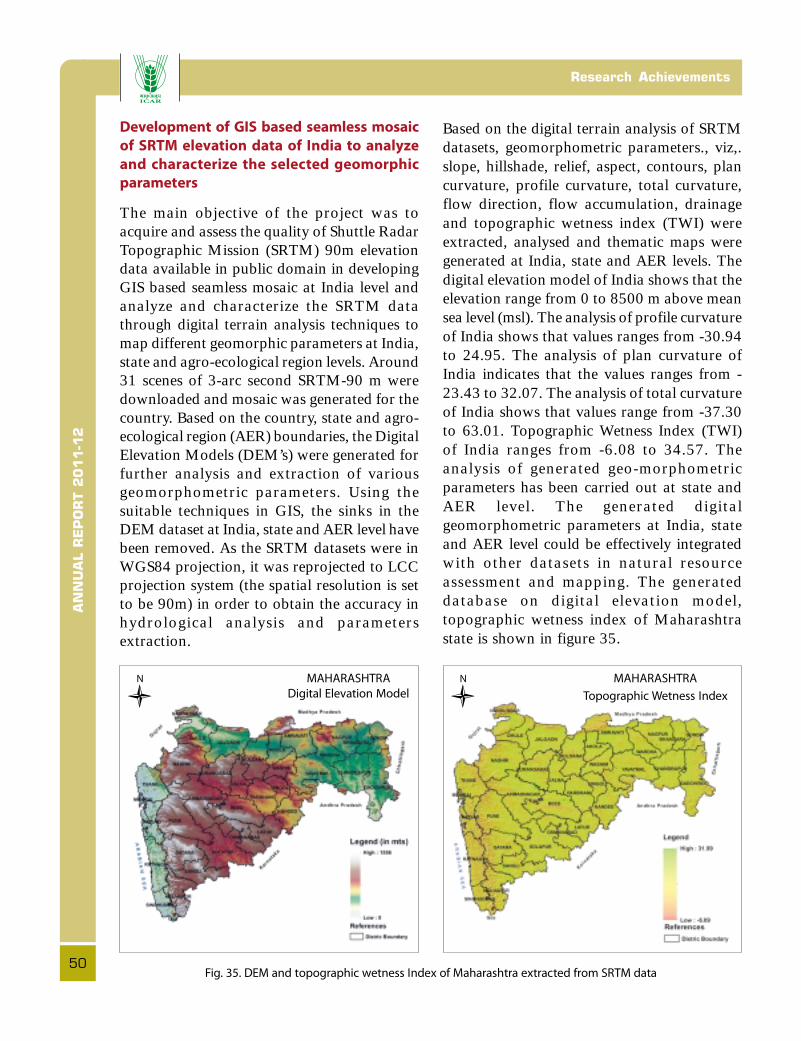
AN
NU
AL R
EP
OR
T 2
011-1
2Research Achievements
50
Development of GIS based seamless mosaic
of SRTM elevation data of India to analyze
and characterize the selected geomorphic
parameters
The main objective of the project was toacquire and assess the quality of Shuttle RadarTopographic Mission (SRTM) 90m elevationdata available in public domain in developingGIS based seamless mosaic at India level andanalyze and characterize the SRTM datathrough digital terrain analysis techniques tomap different geomorphic parameters at India,state and agro-ecological region levels. Around31 scenes of 3-arc second SRTM-90 m weredownloaded and mosaic was generated for thecountry. Based on the country, state and agro-ecological region (AER) boundaries, the DigitalElevation Models (DEM’s) were generated forfurther analysis and extraction of variousgeomorphometric parameters. Using thesuitable techniques in GIS, the sinks in theDEM dataset at India, state and AER level havebeen removed. As the SRTM datasets were inWGS84 projection, it was reprojected to LCCprojection system (the spatial resolution is setto be 90m) in order to obtain the accuracy inhydrological analysis and parametersextraction.
Based on the digital terrain analysis of SRTMdatasets, geomorphometric parameters., viz,.slope, hillshade, relief, aspect, contours, plancurvature, profile curvature, total curvature,flow direction, flow accumulation, drainageand topographic wetness index (TWI) wereextracted, analysed and thematic maps weregenerated at India, state and AER levels. Thedigital elevation model of India shows that theelevation range from 0 to 8500 m above meansea level (msl). The analysis of profile curvatureof India shows that values ranges from -30.94to 24.95. The analysis of plan curvature ofIndia indicates that the values ranges from -23.43 to 32.07. The analysis of total curvatureof India shows that values range from -37.30to 63.01. Topographic Wetness Index (TWI)of India ranges from -6.08 to 34.57. Theanalysis of generated geo-morphometricparameters has been carried out at state andAER level. The generated digitalgeomorphometric parameters at India, stateand AER level could be effectively integratedwith other datasets in natural resourceassessment and mapping. The generateddatabase on digital elevation model,topographic wetness index of Maharashtrastate is shown in figure 35.
Fig. 35. DEM and topographic wetness Index of Maharashtra extracted from SRTM data
MAHARASHTRA
Digital Elevation Model
MAHARASHTRA
Topographic Wetness Index
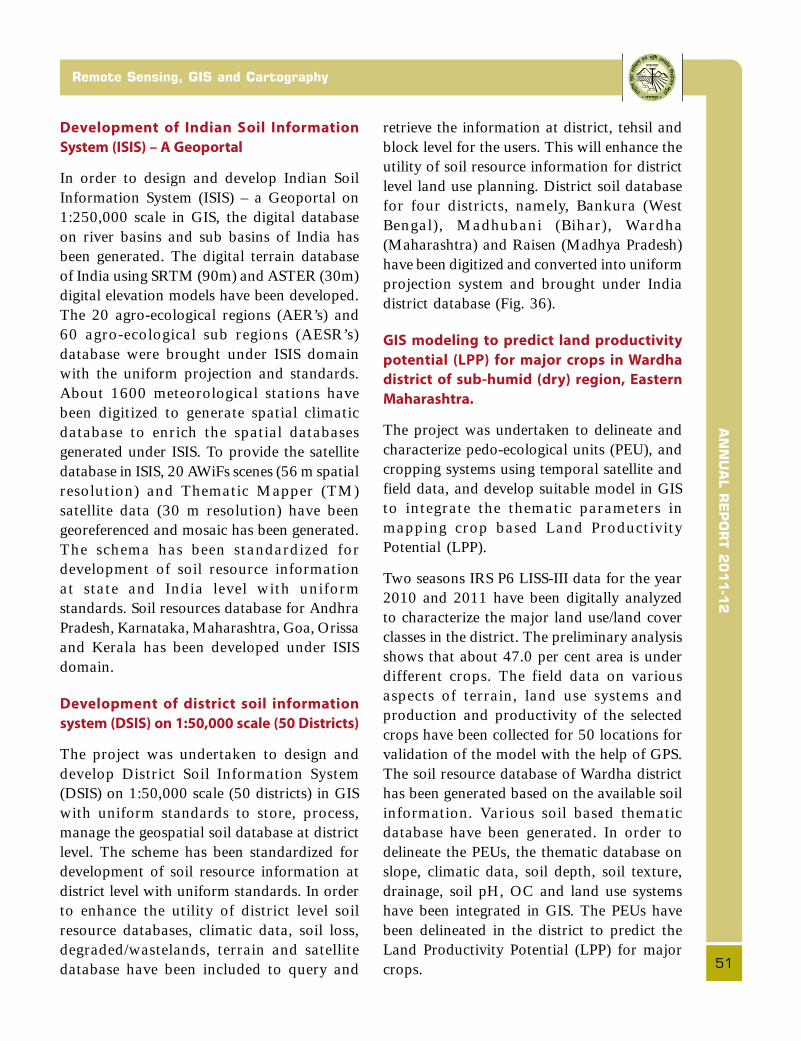
AN
NU
AL R
EP
OR
T 2
011-1
2
51
Remote Sensing, GIS and Cartography
Development of Indian Soil Information
System (ISIS) – A Geoportal
In order to design and develop Indian SoilInformation System (ISIS) – a Geoportal on1:250,000 scale in GIS, the digital databaseon river basins and sub basins of India hasbeen generated. The digital terrain databaseof India using SRTM (90m) and ASTER (30m)digital elevation models have been developed.The 20 agro-ecological regions (AER’s) and60 agro-ecological sub regions (AESR’s)database were brought under ISIS domainwith the uniform projection and standards.About 1600 meteorological stations havebeen digitized to generate spatial climaticdatabase to enrich the spatial databasesgenerated under ISIS. To provide the satellitedatabase in ISIS, 20 AWiFs scenes (56 m spatialresolution) and Thematic Mapper (TM)satellite data (30 m resolution) have beengeoreferenced and mosaic has been generated.The schema has been standardized fordevelopment of soil resource informationat state and India level with uniformstandards. Soil resources database for AndhraPradesh, Karnataka, Maharashtra, Goa, Orissaand Kerala has been developed under ISISdomain.
Development of district soil information
system (DSIS) on 1:50,000 scale (50 Districts)
The project was undertaken to design anddevelop District Soil Information System(DSIS) on 1:50,000 scale (50 districts) in GISwith uniform standards to store, process,manage the geospatial soil database at districtlevel. The scheme has been standardized fordevelopment of soil resource information atdistrict level with uniform standards. In orderto enhance the utility of district level soilresource databases, climatic data, soil loss,degraded/wastelands, terrain and satellitedatabase have been included to query and
retrieve the information at district, tehsil andblock level for the users. This will enhance theutility of soil resource information for districtlevel land use planning. District soil databasefor four districts, namely, Bankura (WestBengal), Madhubani (Bihar), Wardha(Maharashtra) and Raisen (Madhya Pradesh)have been digitized and converted into uniformprojection system and brought under Indiadistrict database (Fig. 36).
GIS modeling to predict land productivity
potential (LPP) for major crops in Wardha
district of sub-humid (dry) region, Eastern
Maharashtra.
The project was undertaken to delineate andcharacterize pedo-ecological units (PEU), andcropping systems using temporal satellite andfield data, and develop suitable model in GISto integrate the thematic parameters inmapping crop based Land ProductivityPotential (LPP).
Two seasons IRS P6 LISS-III data for the year2010 and 2011 have been digitally analyzedto characterize the major land use/land coverclasses in the district. The preliminary analysisshows that about 47.0 per cent area is underdifferent crops. The field data on variousaspects of terrain, land use systems andproduction and productivity of the selectedcrops have been collected for 50 locations forvalidation of the model with the help of GPS.The soil resource database of Wardha districthas been generated based on the available soilinformation. Various soil based thematicdatabase have been generated. In order todelineate the PEUs, the thematic database onslope, climatic data, soil depth, soil texture,drainage, soil pH, OC and land use systemshave been integrated in GIS. The PEUs havebeen delineated in the district to predict theLand Productivity Potential (LPP) for majorcrops.
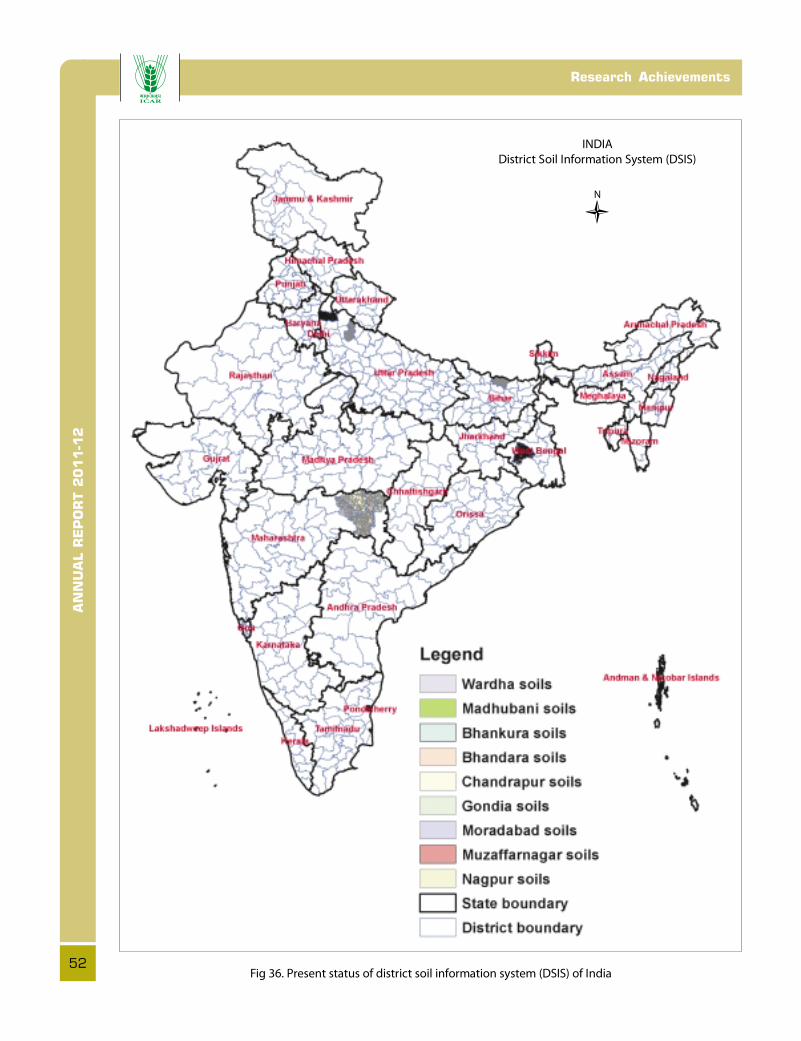
AN
NU
AL R
EP
OR
T 2
011-1
2Research Achievements
52Fig 36. Present status of district soil information system (DSIS) of India
INDIA
District Soil Information System (DSIS)
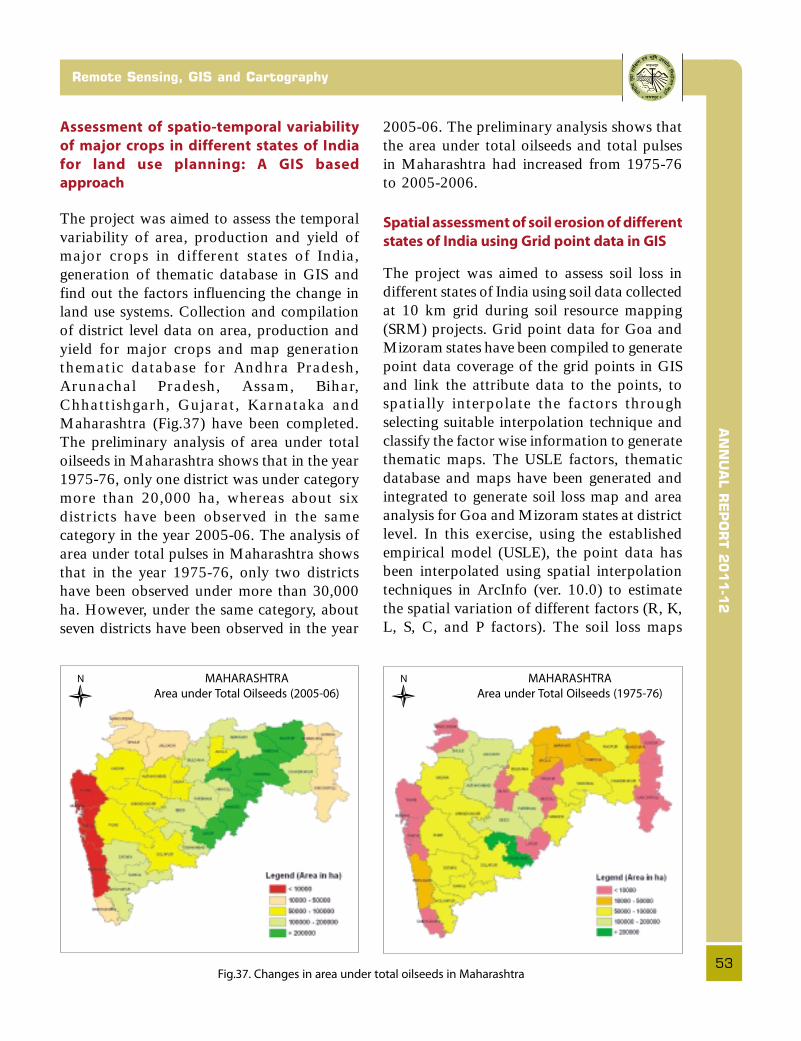
AN
NU
AL R
EP
OR
T 2
011-1
2
53
Remote Sensing, GIS and Cartography
Assessment of spatio-temporal variability
of major crops in different states of India
for land use planning: A GIS based
approach
The project was aimed to assess the temporalvariability of area, production and yield ofmajor crops in different states of India,generation of thematic database in GIS andfind out the factors influencing the change inland use systems. Collection and compilationof district level data on area, production andyield for major crops and map generationthematic database for Andhra Pradesh,Arunachal Pradesh, Assam, Bihar,Chhattishgarh, Gujarat, Karnataka andMaharashtra (Fig.37) have been completed.The preliminary analysis of area under totaloilseeds in Maharashtra shows that in the year1975-76, only one district was under categorymore than 20,000 ha, whereas about sixdistricts have been observed in the samecategory in the year 2005-06. The analysis ofarea under total pulses in Maharashtra showsthat in the year 1975-76, only two districtshave been observed under more than 30,000ha. However, under the same category, aboutseven districts have been observed in the year
2005-06. The preliminary analysis shows thatthe area under total oilseeds and total pulsesin Maharashtra had increased from 1975-76to 2005-2006.
Spatial assessment of soil erosion of different
states of India using Grid point data in GIS
The project was aimed to assess soil loss indifferent states of India using soil data collectedat 10 km grid during soil resource mapping(SRM) projects. Grid point data for Goa andMizoram states have been compiled to generatepoint data coverage of the grid points in GISand link the attribute data to the points, tospatially interpolate the factors throughselecting suitable interpolation technique andclassify the factor wise information to generatethematic maps. The USLE factors, thematicdatabase and maps have been generated andintegrated to generate soil loss map and areaanalysis for Goa and Mizoram states at districtlevel. In this exercise, using the establishedempirical model (USLE), the point data hasbeen interpolated using spatial interpolationtechniques in ArcInfo (ver. 10.0) to estimatethe spatial variation of different factors (R, K,L, S, C, and P factors). The soil loss maps
Fig.37. Changes in area under total oilseeds in Maharashtra
MAHARASHTRA
Area under Total Oilseeds (2005-06)
MAHARASHTRA
Area under Total Oilseeds (1975-76)

AN
NU
AL R
EP
OR
T 2
011-1
2Research Achievements
54
(Fig. 38) generated for Goa and Mizoramstates. The area under very slight (<5 t/ha/yr),slight (5-10 t/ha/yr), moderate (10-15 t/ha/yr),moderately severe (15-20 t/ha/yr), severe (20-40 t/ha/yr), very severe (40-80 t/ha/yr) andextremely severe (>80 t/ha/yr) classes have beengenerated for Goa and Mizoram states. Thesoil loss map of India has been generated bycompiling statewise soil loss maps.
Enrichment of land degradation datasets
with soils dataset of different states of
India
This project was undertaken to enrich theinformation available in land degradationmaps (1:50,000 scale) prepared by NRSC withselected soil parameters and finalize the statewise land degradation maps of India. The mainactivities involved in the project are (i)projection transformation of soil/soil lossdatasets to make it compatible with landdegradation datasets, (ii) appending the
identified ten soil parameters contributingtowards the land degradation using the suitableoption in GIS, (iii) reconciliation of theenriched land degradation datasets, and (iv)finalization of the state wise enriched landdegradation maps with suitable legends. Thesoil parameters pertinent to land degradationlike slope, erosion, parent material, soil depth,surface texture, surface stoniness,calcareousness, soil reaction (pH) and soilsalinity/sodicity were identified to enrich theland degradation datasets. The GIS basedmethodology was standardized to enrich theland degradation datasets with soils datasetsof different states of India.
The generated enriched datasets werereconciled and unique codes were generatedat national scale for representation of LDclasses at India level. Class wise area statisticswere generated for each state. The enrichedland degradation map of Maharashtra isshown in Fig. 39.
Fig. 38. Soil loss map of Goa and Mizoram states
GOA
Soil Loss
MIZORAM
Soil Loss

AN
NU
AL R
EP
OR
T 2
011-1
2
55
Remote Sensing, GIS and Cartography
Documentation and storing of maps
and photographs - concept of digital map
library
The project was undertaken with the objectiveto develop a digital data base system for storageand retrieval of maps and photograph andpreparation of web-based library for datatransmission.
Fig. 39. Enriched land degradation map of Maharashtra state
About 100 soil survey report and maps weresegregated and scanned and their imagequalities were checked and enhanced. Inaddition, many soil scapes, land use andphotographs have been scanned at 300 dpi,and quality of these photographs wereimproved using photographic tools. All thesedocuments have been uploaded in the maincabinet (NBSS and LUP) for further use.
MAHARASHTRA
Enriched land degradation map
AN
NU
AL R
EP
OR
T 2
011-1
2Research Achievements
56
•· Landform-soil relationship
•· Methods of soil analysis
•· Soil genesis and mineral transformation
Basic Pedological Research
2.3
Geomorphological analysis and study on
landform-soils-land use relationships in
Karnataka
Geomorphological analysis was carried out inCentral Karnataka Plateau coveringChitradurga, the Northern Plateau consistingof Bidar, Gulbarga and Bijapur areas and onthe Western coast covering the St. Mary’s Islandoff Malpe beach, Udipi.
The Chitradurga areas consist of a boundaryfault running NW – SE separating Dharwarsupergroups and that of peninsular gneisses.Low granite hills with tors and domalstructures of castellated nature arecharacteristics of Clospet granites and gneisses,whereas very low level ridges and undulatingtopography are restricted to schistose terrainof Dharwars. Slope analysis indicated shallowslopes with short slope lengths. Weathering,alteration and enrichment of Precambrianbanded iron formations have producedabundant haematite rich supergene iron ores,containing 60 to 70 % Fe. Soils on ridges arefragmental and stony; on footslopes they arevery shallow to shallow-skeletal. Fringes andvalley floors consist of medium deep red soils.Minor subsidence and faults are responsiblefor severe erosion and removal of weatheredproducts.
A quartzite ridge consisting of metamorphosedsandstone/shale beds near Navalgund showedinfluence of high grade metamorphism to formglassy textures. Sandstone beds are convertedto very hard quartzite, whereas shale beds arebrittle and flaky. Thus, differential weatheringis noticed, shale beds are easily weathered,eroded and washed away, leaving quartzitebeds as ridge tops. They are tilted and foldedduring regional metamorphism and thus,anticlines and synclines are observed. Up tothe quartzite ridges the soils are black due tothe influence of basalt and towards Narkund,only red soils are formed.
Around Bidar, laterite landforms formed bythe laterization of basalt lava flows. The basaltflows that are above 600 m above MSL areconverted to laterites and below that normalweathering of basalt is observed, indicating theexistence of a plantation surface at 600 melevation in most of the basaltic plateaux. Theknife edge contacts of different flow junctionsand inter-trappeans are also distinguished(Fig. 40).
A slope profile near Babileshwar was studiedfrom a low summit crest to the valley floors.With short slope measurements, it was possibleto identify three smaller segments, viz, convex,convexo-concave and concave. A sandstone/
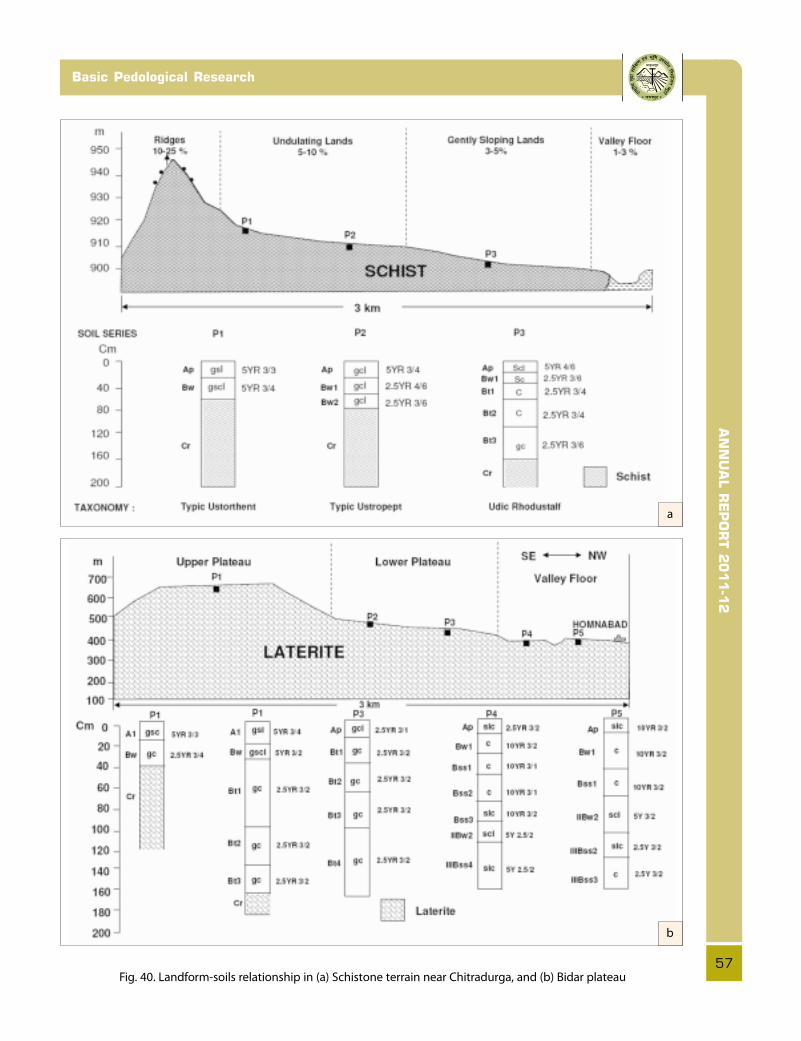
AN
NU
AL R
EP
OR
T 2
011-1
2
57
Basic Pedological Research
Fig. 40. Landform-soils relationship in (a) Schistone terrain near Chitradurga, and (b) Bidar plateau
a
b

AN
NU
AL R
EP
OR
T 2
011-1
2Research Achievements
58
shale ridge was studied at Jamkhandi town.The sandstone is ferruginous and differentialerosion is responsible for removal of shale beds.The whole bedding plan is slightly inclined andtilted with gentle folds. A very deep (200 cm)red soil profile developed on laterites wasstudied after Belgaum. Clay cutans and conirsare the important morphological charactersthat distinguish this soil. On entering WesternGhats, granite tors and domal structures wereencountered. The soils on the footslopes
showed the influence of organic matter onepipedons followed by moderately deep, verygravelly red soils in subsurface horizons.
Basalt outcrops at St. Mary’s Island off Malpebeach, Udupi have columnar structures, whichare more exposed on the windward-side of theisland. Perfect columns of hexagonal andpolygonal structures are formed when the lavais dammed up and cooled. However, thepresence of glassy structures indicates it wascooled down very rapidly. Figure 41 shows theflow junctions of basalts near Alanda (a) andcolumnar structures at St. Mary’s island,Malpe (b).
Development of protocols for digestion,
standards and methods to determine
elements in soils and sediments using
inductively coupled plasma spectrometry
(ICP-AES).
The microwave (MW) digestion technique wasused to check the evaporation loss as thesamples were digested in a closed Teflon vessel.Efficient dissolution is achieved due toincreased vapour pressure in a relatively smalltime. However, Si and Al cannot be accuratelydetermined by this method because theseelements are highly volatile as the fluoridecompound as shown by the following equation:
HF + Al2O3 + SiO2 � H2SiF6 + H2AlF3 + H2O
H3BO3 + 3 HF� HBF3OH +2H2O
HBF3OH + HF� HBF4 + H2O
Adding boric acid in the second stage of thedigestion not only complexes the free fluorideions in the solution but also facilitates thedissolution of the precipitated fluorides. Butwhile adding boric acid, the Si and Al in thefluoride form may be lost as these are highlyvolatile in these forms. Therefore we suggestthat Si and Al should be solubilized by NaOH/Na2CO3 digestion and then analysed.
Internal standards for about 30 elements weredeveloped for ICP-AES. These were validated
a
b
Fig. 41. Basalt flow junction near Alanda (a)
and columnar structures at St. Mary’s island, Malpe (b)

AN
NU
AL R
EP
OR
T 2
011-1
2
59
Basic Pedological Research
with respect to the various matrix solutions.All the elements were mapped throughpreparation of echellograms which is essentialto familiarise the instrument with respect to aparticular element, so that, normal distributioncould be obtained for standardization. In viewof the fact that the purpose of analyzing aparticular element or a group of elements differ,the methods of analyzing them also varies.Thus, several methods were developed toanalyse a particular element or group ofelements. Specific torches and nebulizers werechosen for a particular type of analysis.Methods were developed for analyzingsolutions containing high solids (viz. 0.25 NEDTA, 1N Sodium acetate, 1N ammoniumoxalate, 1N sodium citrate, 1N sodiumtartarate, 1N MgCl2, 1N CaCl2, 1N BaCl2
solution) using v-groove nebulizer. Hard lineelements, particularly, As, Hg, Se and Mo wereanalysed using hydride generator. Similarly Sand Si were analyzed singly to avoid problem.Different sets of matrixes were experimentedfor the similar elemental composition.Experimental set up with reference of differentcoolant flow, auxiliary flow, RF power, sampleflow rate etc., were established for differenttypes of aqueous solutions.
The ICP was standardized to enable it todetermine multiple elements in a single run,thereby decreasing the cost and time ofanalysis. Digestion procedures should becarefully monitored and microwave digestionprocedure is not a prescription for materialscontaining Si and Al which should be digestedfollowing traditional digestion techniques.
Water retention characteristics and saturated
hydraulic conductivity of dominant soil series
of Yavatmal district, Maharashtra
About one hundred and twenty samplespertaining to twenty eight pedons of Yavatmaldistrict were selected. The retention of moisturein soils at 33, 100, 300, 500, 800, 1200 and1500 kPa was determined using pressure plate
membrane apparatus. The available watercapacity (AWC) of soils was calculated usingthe data on water retained between 33 and1500 kPa. The saturated hydraulicconductivity was determined using a constanthead permeameter.
The moisture retention characteristics of thesoils indicate that among the 28 dominant soilseries, the amount of moisture held at 33 Paand 1500 kPa was highest in Bss3 horizon ofKharbi series (56.22 and 32.33 per cent,respectively) whereas the Ap horizon ofMaregaon soil series held lowest amount ofmoisture (3.29% at 33 kPa and 1.64% at 1500kPa). The water retention decreased withincreasing soil water suction. The retention ofmoisture at different suctions increases withdepth i.e. deep soils (e.g. Kharbi series,Fig. 42) moderately deep soils (e.g. Sindolaseries, Fig. 43) and shallow soils. The change
Fig. 42. Horizonwise water retention characteristics of
Kharbi series
Fig. 43. Water retention curves of Sindola series

AN
NU
AL R
EP
OR
T 2
011-1
2Research Achievements
60
in moisture content for these soils after 800kPa was quite small. The AWC varied widelyamong the pedons ranging from 1.65 to 23.89per cent. Weighted means were calculated forhydraulic conductivity values to classify theconductivity class as very slow (<0.8 cm hr-1),slow (0.8-2.0 cm hr-1) and moderate (2.0 – 6.0cm hr-1).
Geochemical characterization for
reconstruction of physical and chemical
properties of shrink-swell soils of Yavatmal
district, Maharashtra
The HNO3
soluble aluminum and potassiumcontents in six major soil series viz. Chanoda(lime stone), Wani (sandstone), Selodi (basalt),Nagdhari (basalt), Kharbi (granite) andLoni (basalt) of Yavatmal were determined.Non-exchangeable K is that portion of total Kwhich is extractable with nitric acid, exhibitingexchangeable K plus K extracted from withinphyllosilicates (mainly K trapped in theinterlayer of non-expanding 2:1 clay minerals),and from the tectosilicate minerals. Theabundance of nonexchangeable K in differentsoil types could be due to the presence ofdifferent levels of illite/mica.
Clay: The horizon wise clay distributionshows that the Bss horizons have meanclay 54.86±12.01 per cent with coefficientof variation of 21.90 whereas clay in Bwhorizons is 44.96±16.61 per cent withvariation of 36.95 per cent and 45.36±7.85per cent in Ap with variation of 17.31 per cent.The shape of the clay distribution curvewas found to be closely related to thedifferences in the soils and are developedon heterogeneous parent material. The claycurve in Nagdhari and Loni series reflects thesudden increase or decrease in the claypercentage followed again by either increaseor decrease. It often occurs in combinationwith admixture from allochthonous materialfrom differences in the dynamism ofsedimentation.
Aluminium: The series wise variations inweighted averages of aluminium shows trendsof ascending order. Horizon wise aluminumdistribution shows that aluminum content ishigh in Ap (mean of 21265.33±3918.73 mg/kg) as compared to Bw (20219±4415.55 mg/kg) and Bss horizons(18631.67±5318.05 mg/kg). The coefficient of variation for aluminumcontent is 28.5 per cent for Bss horizons; 22 percent for Bw and 18.4 per cent for Ap horizons.
Potassium: These soils have medium non-exchangeable K but closer to low K contentsin Loni series (P6) indicating exhaustion of Kreserves due to replenishment of K to non-exchangeable pools. Based on weightedaverage for K contents , the series are arrangedin ascending order as Loni series (397mg/kg)< Selodi series (568mg/kg) < Chanoda series(670mg/kg) < Wani (751mg/kg) < Nagdhari(795mg/kg) and < Kharbhi (1088mg/kg). Thehorizonwise mean contents are high in Ap(823±252mg/kg) as compared to Bw (749±176.9mg/kg) and Bss horizons (650±264mg/kg). The coefficient of variation of K contentsis 40 per cent in Bss horizons, 31 per cent inAp and 24 per cent for Bw horizons.
K/Al ratio: The K/Al ratio is high in Aphorizons with mean of 3.85 but showsdecreasing trend in Bw horizons to 3.77 and3.67 in Bss horizons (Table 20). The coefficientof variation is high in Bss horizon with 38.52per cent, 22.87 per cent in Bw horizon and23.64 per cent in Ap horizon. Based onweighted mean of K/Al ratio, the soils areranked in ascending order as : Selodi (2.29) <Loni (3.38) < Wani (3.88) < Chanoda (3.94) <Nagadhari (4.07) and Kharbhi (4.91).
The relationship between the elements and thegrain size fractions may provide usefulindication for the evaluation of the soils. Theexponential relation between Al and K in thesesoils yielded R2 value of 0.341, significant at5% level. There is 4th order polynominalrelation between Al concentration and clayhaving R2 value of 0.41 (Fig 44).
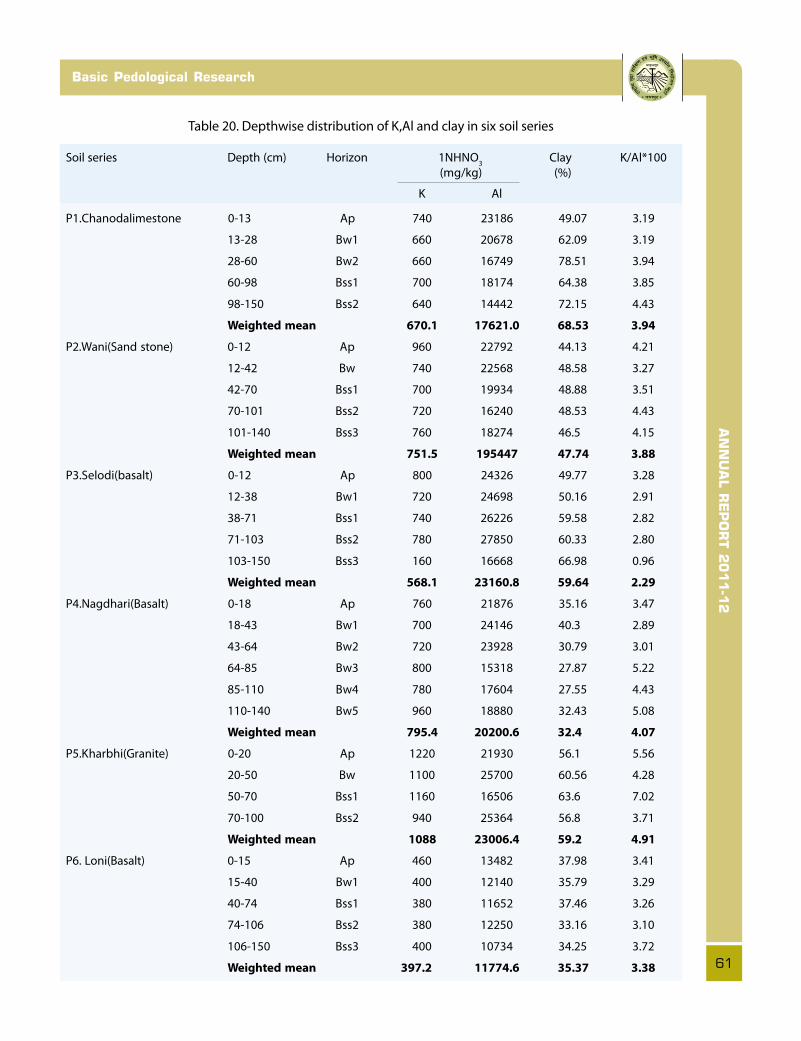
AN
NU
AL R
EP
OR
T 2
011-1
2
61
Basic Pedological Research
Table 20. Depthwise distribution of K,Al and clay in six soil series
Soil series Depth (cm) Horizon 1NHNO3
Clay K/Al*100
(mg/kg) (%)
K Al
P1.Chanodalimestone 0-13 Ap 740 23186 49.07 3.19
13-28 Bw1 660 20678 62.09 3.19
28-60 Bw2 660 16749 78.51 3.94
60-98 Bss1 700 18174 64.38 3.85
98-150 Bss2 640 14442 72.15 4.43
Weighted mean 670.1 17621.0 68.53 3.94
P2.Wani(Sand stone) 0-12 Ap 960 22792 44.13 4.21
12-42 Bw 740 22568 48.58 3.27
42-70 Bss1 700 19934 48.88 3.51
70-101 Bss2 720 16240 48.53 4.43
101-140 Bss3 760 18274 46.5 4.15
Weighted mean 751.5 195447 47.74 3.88
P3.Selodi(basalt) 0-12 Ap 800 24326 49.77 3.28
12-38 Bw1 720 24698 50.16 2.91
38-71 Bss1 740 26226 59.58 2.82
71-103 Bss2 780 27850 60.33 2.80
103-150 Bss3 160 16668 66.98 0.96
Weighted mean 568.1 23160.8 59.64 2.29
P4.Nagdhari(Basalt) 0-18 Ap 760 21876 35.16 3.47
18-43 Bw1 700 24146 40.3 2.89
43-64 Bw2 720 23928 30.79 3.01
64-85 Bw3 800 15318 27.87 5.22
85-110 Bw4 780 17604 27.55 4.43
110-140 Bw5 960 18880 32.43 5.08
Weighted mean 795.4 20200.6 32.4 4.07
P5.Kharbhi(Granite) 0-20 Ap 1220 21930 56.1 5.56
20-50 Bw 1100 25700 60.56 4.28
50-70 Bss1 1160 16506 63.6 7.02
70-100 Bss2 940 25364 56.8 3.71
Weighted mean 1088 23006.4 59.2 4.91
P6. Loni(Basalt) 0-15 Ap 460 13482 37.98 3.41
15-40 Bw1 400 12140 35.79 3.29
40-74 Bss1 380 11652 37.46 3.26
74-106 Bss2 380 12250 33.16 3.10
106-150 Bss3 400 10734 34.25 3.72
Weighted mean 397.2 11774.6 35.37 3.38

AN
NU
AL R
EP
OR
T 2
011-1
2Research Achievements
62
Fig. 44. Relation between Al concentration and clay in
shrink-swell soils
Studies on soil minerals and their genesis in
selected benchmark spots representing
different agro-eco subregions of India
The information on weathering andquantification of soil minerals in theBenchmark sites is not available in anorganized manner and whatever available, isnot complete. Therefore, the pedo-mineralogical investigations were undertakenthrough microscopic, submicroscopic andXRD techniques for complete understandingof the different physical, chemical and mineralweathering processes involved during the soildevelopment. A complete knowledge andunderstanding of the minerals present in thesoils is very important to evaluate the problemsand potentials of the soils. Study of soil mineralweathering is essential to understand nutrientavailability in the soils which is significant forthe sustenance of their productivity.
The main project is therefore undertaken withthe objectives to collate available data and newdatasets in appropriate format, identify andquantify the mineral assemblages in differentfractions of soils, develop a protocol forquantifying biotite mica in Indian soils andtheir K reserves in various size fractions anddevelop a comprehensive Mineral Atlasalongwith a detailed report of minerals inmajor benchmark soils of India.
10 dominant soils from AER 6 (i.e. DeccanPlateau, hot semiarid ecoregion with 90-180days LGP) were selected for the study. The areabelongs to black soil region (BSR) under semi
arid dry climate and covers Maharashtra, andnorth and west Karnataka Plateau. The soilsare moderately deep to very deep Vertisols. Thesoils are dark grayish brown to dark brownand fine textured. All the soils have slickensidesclosely to intersect and are characterized bystrong and coarse to medium sub angularblocky structure.
All the soils are alkaline and the pH rangesfrom 7.9 to 9.3. The soils are calcareous andCaCO3 is more than 10% in almost all soilsexcept a few cases wherein it is less than 10%.The soils are clayey in texture and fine clay(<0.2 mm) dominates in the total clay fractions.The sand fraction of these soils are very less(except in Kalwan soils) because of theirdevelopment from Deccan basalt. The soils havea high shrink-swell potential as indicated bytheir high COLE values. CEC of these Vertisolsis also high as expected in Vertisols of India andbase saturation is high (>65%) in all soils.
Mineralogical properties indicated that all thesoils are dominated by smectite. The siltfraction also contains smectite as dominantmineral followed by mica, kaolin in smallamounts. The silt fractions of Konheri andBhatumbra soils showed the presence of zeolite.The total clay and fine clay fraction of all thesoils are dominated by smectite. Kaolin isfound in subdominant quantities in many soils(Asra, Paral, Kalwan & Bhatumbra) alongwithmica, chlorite and feldspar. Presence of kaolinis an indication of earlier humid climate.
Scanning electron microscopy studies of soilsindicate the presence of lubinites in Kalwansoils (Fig. 45). The Vertisols contain bothpedogenic and non-pedogenic carbonates
.
Pedogenic carbonates are present at >30 cm insemi arid moist climate and throughout the soildepth in semi arid (dry) climate. Due to theprecipitation of Ca+2, the ESP and EMP of thesoil increases which impairs the hydraulicproperties. The presence of zeolite in Konerisoils (Fig. 46) as a soil modifier is a boon in

AN
NU
AL R
EP
OR
T 2
011-1
2
63
Basic Pedological Research
such soils as it supplies bases and retards therate of degradation. Strong parallel striatedb-fabric in some soils is indicative of betterhydraulic properties because of the presence ofsoil modifiers. However, the ill effects of aridityhad already surfaced in the soils of Kalwan inthe form of lubinite mineral which could haveonly occurred due to super-saturation of CaCO3
due to aridity. The compilation of available dataand acquiring new information for developmentof a database on mineralogy is in progress.
Nano-clay minerals of typical shrink swell
soils: their separation and characterization
Soils contain many kinds of naturally occurringinorganic particles with atleast one dimensionin the nano-scale or colloidal range (<100 nm).These nano-size particles are highly reactiveportions of clay fractions, which is moredynamic and can be modified for thebetterment of agricultural growth andproduction. Standard protocols for separationof naturally occurring nano-particles are yetto be developed. In an attempt to do so,samples across the AESR of our country werecollected to have variability and only theundisturbed horizon was selected for extractingthe nano-particles (Table 21).
Different soil properties have been analyzedwhich need to be correlated with the nano-particles.
Fig. 45. Lubinites (L) presence in Kalwan soils (61-69 cm),
an indication of precipitation of Carbonate crystals due to
aridity.
Fig. 46. Zeolite (Z) presence in Koneri soils, a boon due to
its capacity to supply bases in soils and help to improve
hydraulic properties and resist to develop high ESP.
Table 21. Samples of different AESRs and their relevant soil properties in relation to the nano-particle separation
Area AESR MAR Depth Horizon Total Fine OC CaCO3
CEC BS(%) ESP
(mm) clay clay (%) (%) (C mol
(%) (%) (p+)kg-1)
Kovilpatti 8.1 660 55-79 Bss 60.7 51.9 (84) 0.4 14.5 65.2 92 1.0
Fetehpur 9.1 680 73-95 Bt3 12.1 6.1 (50) 0.23 1.2 11.3 92 2
Linga 10.2 1011 41-70 Bss1 71.1 56.0 (78.7) 0.5 6.8 49.1 78 1.2
Simri 4.4 1052 89-115 Bt4 25.1 17.3 (70) 0.30 1.3 11.1 91 7
Sarol 5.2 1053 66-90 Bss1 60.1 46.3 (76.9) 0.7 6.5 43.5 110 4.5
Madhpur 15.1 1404 56-80 Bt4 41.6 32.0 (80) 0.13 3.8 23.5 98 1
Values in the parenthesis show the per cent fine clay to the total clay
AN
NU
AL R
EP
OR
T 2
011-1
2Research Achievements
64
2.4
•· Agro-Ecological Zoning
• Land Resource Management
•· Soil Health/Quality and Monitoring
•· Soil and Crop Modelling
Soil Survey Data Interpretationand Applications
Soil microbial biomass carbon and nitrogen
in selected soil series of north-eastern region
as affected by different land uses and varied
agro- ecological conditions
The project aimed to determine microbialbiomass carbon (MBC) and microbial biomassnitrogen (MBN) in selected soil series of NEregion under different land use systems andagro-climatic conditions and establishrelationship between MBC and NBN withdifferent soil properties. Representative soilswere studied in Jorhat and Sibsagar districtsof Assam, West Kameng district of ArunachalPradesh, Dimapur and Kohima districts ofNagaland and Ri-Bhoi and East Khasi Hillsdistricts of Meghalaya. Microbial biomasscontent was highest at the surface (0-20 cm)and decreased with soil depth in all the landuse systems. It was found that in Assam, MBCcontent ranged from 120.21 µg/g-1 to 12.35µg/g-1 in soils of cultivated land, 184.26 µg/g-1
to 15.10 µg/g-1 in soils of tea garden and 248.16to 17.10 µg/g-1 in forest soils. MBN content inthe soils of the cultivated land ranged from41.45 to 0.81 µg/g-1 soils and from 51.10 to1.15 µg/g-1, soils in tea garden and 68.12 µg/g-1
to 1.01 µg/g-1 in series of forest system. Similar
trends of MBC were observed in other threestates. It was also found that microbial biomassconcentration decreased drastically below 40cm of soil depth for all the soils.
Seasonal variation of microbial biomasscontent in Jorhat soils showed that theconcentration of soil microbial biomass ismaximum in summer and minimum in rainyseason. The lower value of soil organic carbonand total nitrogen during the rainy seasonreduce microbial biomass due to higher uptakeof soil nutrients. MBC and SOC was positivelycorrelated (r= 0.957**). Similar trend wasobserved between MBN and total N (r=0.946**) in forest soil whereas in cultivatedsoil, the correlations between MBC and SOCand between MBN and total N werer=0.845** and 0.941** respectively.
Assessment of heavy metal pollution and its
mapping in soils of contaminated areas of
Morigaon, Dibrugarh and Tinsukia districts of
Assam
The present study was attempted (i) to identifythe heavy metal contaminated areas and itsspatial distribution and (ii) to assess risk of

AN
NU
AL R
EP
OR
T 2
011-1
2
65
Soil Survey Data Interpretation and Applications
heavy metals contamination usinggeostatistical technique. Four contaminatedareas were identified namely, Jagiroad(Morigaon district), Ledo and Digboi (Tinsukiadistrict) and Namrup (Dibrugarh district) ofAssam. Grid-wise surface soil samples (0 to25 cm) at 500 m interval were collected andanalysed for pH and organic carbon. Aquaregia extracts were used to estimate pseudototal soil metals (International Organizationfor Standardization, ISO 11466-2002). Soilsamples (0.25 g) were digested in a microwavedigester (model Start D, Milestone) at 190°Cand determined by Atomic AbsorptionSpectrophotometer (model AA-6300,Shimadzu).
Summary statistics showed that highest andthe lowest mean concentrations were observedin Digboi oil refinery and Ledo coal miningareas for Fe and Cd, respectively. In Digboi,OC, Cd and Pb exhibited high variability(>50% CV) whereas, in Ledo only OC and Cdshowed the similar trend. Pearson correlationshowed that all the heavy metals weresignificantly and positively correlated witheach other. There exist significant negativecorrelations between heavy metal and pH andsignificant positive correlations between heavymetals and organic carbon. Spatial distributionmaps of these pollutants (Ni, Cr, Cd, and Pb)were generated using the ordinary kriggingprocedure. High concentration of heavy metalsare found in low lying areas like bills, namely,donga, jan, khar and taranga for Jagiroad andnearby coal mining area of Ledo. Probabilitymaps of Cd and Ni concentration of Jagiroadarea exceeding the respective FAO (2000) MPL(Maximum Permissible Limit) value of 3 and30 mg kg-1 respectively were also prepared.These maps showed that a smaller area in theJan and Taranga bils had higher concentrationthan MPL value of Cd (Fig. 47) and for Ni, itwas found that more than 80% area had higherprobability (>50%) to exceed this MPL value(Fig. 48).
Fig. 47. Risk assessment map of Cd of
Jagiroad paper mill area
Fig. 48. Risk assessment map of Ni of Jagiroad
paper mill area
RISK ASSESSMENT MAP OF CD
Jagiroad paper mill
RISK ASSESSMENT MAP OF NI
Jagiroad paper mill
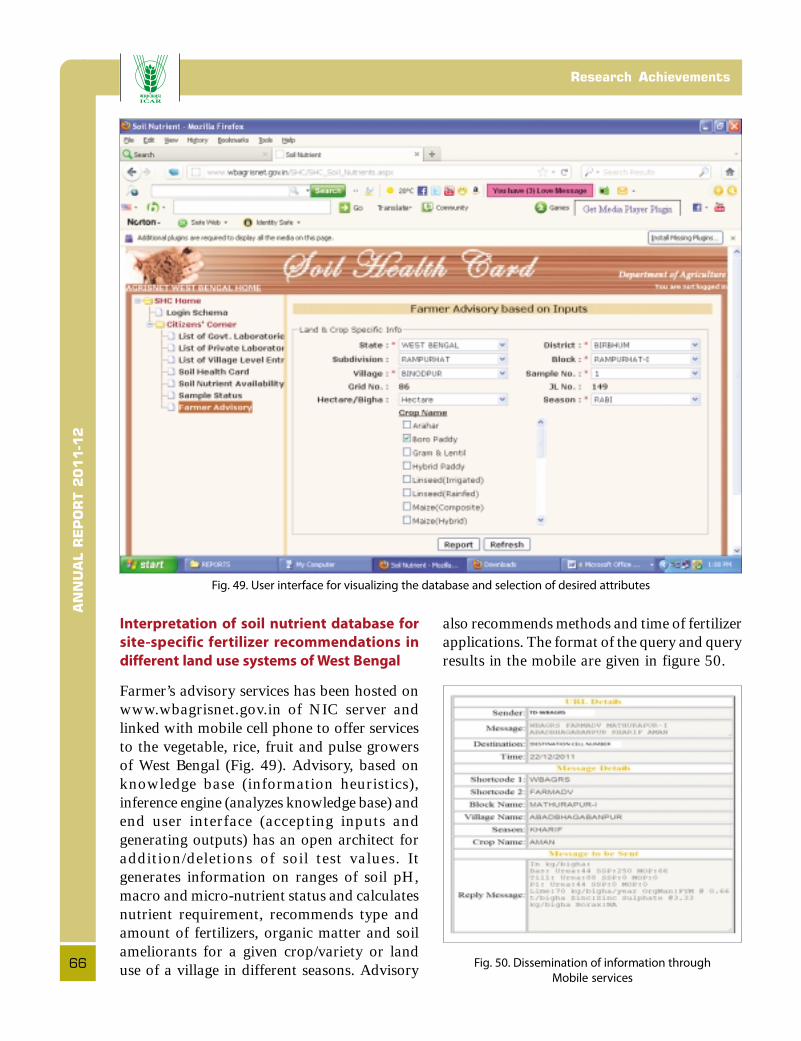
AN
NU
AL R
EP
OR
T 2
011-1
2Research Achievements
66
Interpretation of soil nutrient database for
site-specific fertilizer recommendations in
different land use systems of West Bengal
Farmer’s advisory services has been hosted onwww.wbagrisnet.gov.in of NIC server andlinked with mobile cell phone to offer servicesto the vegetable, rice, fruit and pulse growersof West Bengal (Fig. 49). Advisory, based onknowledge base (information heuristics),inference engine (analyzes knowledge base) andend user interface (accepting inputs andgenerating outputs) has an open architect foraddition/deletions of soil test values. Itgenerates information on ranges of soil pH,macro and micro-nutrient status and calculatesnutrient requirement, recommends type andamount of fertilizers, organic matter and soilameliorants for a given crop/variety or landuse of a village in different seasons. Advisory
also recommends methods and time of fertilizerapplications. The format of the query and queryresults in the mobile are given in figure 50.
Fig. 50. Dissemination of information through
Mobile services
Fig. 49. User interface for visualizing the database and selection of desired attributes

AN
NU
AL R
EP
OR
T 2
011-1
2
67
Soil Survey Data Interpretation and Applications
Assessment and mapping of some important
soil parameters including macro and micro
nutrients for the thirteen (13) priority districts
of Assam state (1:50,000 scale) towards
optimum land use planning
The project was undertaken with the followingobjectives: (i) to assess nutrient status of soilsof Assam on a spatial mode, (ii) to create aGIS based data of soil parameters includingmacro and micronutrients and (iii) to preparedistrict wise soil fertility map for 13 prioritydistricts of Assam State on 1: 50,000 scale. Thebase maps (at 1 km interval grid points) wereprepared showing village boundaries publishedby Assam Survey, Govt. of Assam inconjunction with Survey of IndiaTopographical Sheets at 1:50,000 scale. Thesoil samples were analyzed for 9 parametersviz, pH, organic carbon, available nitrogen,phosphorus and potassium and cationicmicronutrients (Fe, Mn, Zn and Cu) by DTPA-micronutrient soil test using atomic absorptionspectrophotometer. Individual nutrient statusmaps have been generated for the abovementioned soil parameters.
Soil nutrient mapping of Nagaon Districtshowed that high soil organic carbon(> 0.75%) was predominant (Fig.51) in thedistrict covering 90.4 % of total geographicalarea (TGA). Major parts of the districtcomprised low to medium level of availablenitrogen. In Morigaon district, it was observedthat very strongly to strongly acidic soils werepredominant covering 27.0 % and 24.3 % ofTGA respectively. It was also found that anarea of 64.4 % of TGA was deficient inavailable zinc, whereas, 35.6 % of TGA wasunder sufficient status. In Lakhimpur district,low nitrogen status and low to mediumphosphorus and potassium status werepredominant.
Assessment and mapping of some important
soil parameters including macro and
micro nutrients at block levels of Dumka,
Jamtara and Hazaribag districts for optimum
land use plan
26,273 samples (0-20 cm) were collected at500 m interval in three blocks (Saraiyahat,Kathikund and Gopikandar) of Dumka districtand 22 blocks of Hazaribag district, Jharkhand.Soil samples were analyzed and database mapson macro and micro nutrients was preparedblock-wise in GIS. Two maps, one on OC andthe other on available K are presented in figure52 (a and b). Statistics on soil pH, organiccarbon, available phosphorus and potassiumstatus of different blocks of Dumka district arepresented in table 22. The results show thatlow soil pH, low organic carbon were the mainconstraints in addition to low balance ofphosphorus and potassium (Table 22).
Fig. 51. Organic carbon map of Nagaon district of Assam
ORGANIC CARBON
Nagaon district
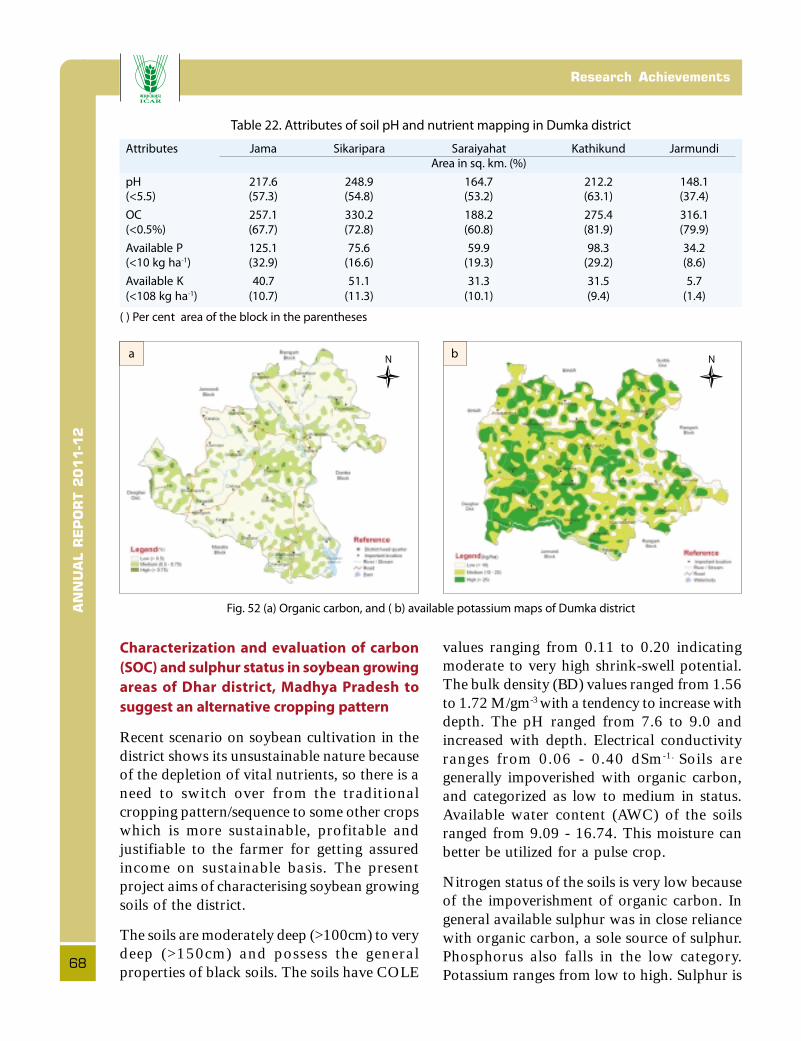
AN
NU
AL R
EP
OR
T 2
011-1
2Research Achievements
68
Characterization and evaluation of carbon
(SOC) and sulphur status in soybean growing
areas of Dhar district, Madhya Pradesh to
suggest an alternative cropping pattern
Recent scenario on soybean cultivation in thedistrict shows its unsustainable nature becauseof the depletion of vital nutrients, so there is aneed to switch over from the traditionalcropping pattern/sequence to some other cropswhich is more sustainable, profitable andjustifiable to the farmer for getting assuredincome on sustainable basis. The presentproject aims of characterising soybean growingsoils of the district.
The soils are moderately deep (>100cm) to verydeep (>150cm) and possess the generalproperties of black soils. The soils have COLE
values ranging from 0.11 to 0.20 indicatingmoderate to very high shrink-swell potential.The bulk density (BD) values ranged from 1.56to 1.72 M/gm-3 with a tendency to increase withdepth. The pH ranged from 7.6 to 9.0 andincreased with depth. Electrical conductivityranges from 0.06 - 0.40 dSm-1. Soils aregenerally impoverished with organic carbon,and categorized as low to medium in status.Available water content (AWC) of the soilsranged from 9.09 - 16.74. This moisture canbetter be utilized for a pulse crop.
Nitrogen status of the soils is very low becauseof the impoverishment of organic carbon. Ingeneral available sulphur was in close reliancewith organic carbon, a sole source of sulphur.Phosphorus also falls in the low category.Potassium ranges from low to high. Sulphur is
Fig. 52 (a) Organic carbon, and ( b) available potassium maps of Dumka district
a b
Table 22. Attributes of soil pH and nutrient mapping in Dumka district
Attributes Jama Sikaripara Saraiyahat Kathikund JarmundiArea in sq. km. (%)
pH 217.6 248.9 164.7 212.2 148.1(<5.5) (57.3) (54.8) (53.2) (63.1) (37.4)
OC 257.1 330.2 188.2 275.4 316.1(<0.5%) (67.7) (72.8) (60.8) (81.9) (79.9)
Available P 125.1 75.6 59.9 98.3 34.2(<10 kg ha-1) (32.9) (16.6) (19.3) (29.2) (8.6)
Available K 40.7 51.1 31.3 31.5 5.7
(<108 kg ha-1) (10.7) (11.3) (10.1) (9.4) (1.4)
( ) Per cent area of the block in the parentheses
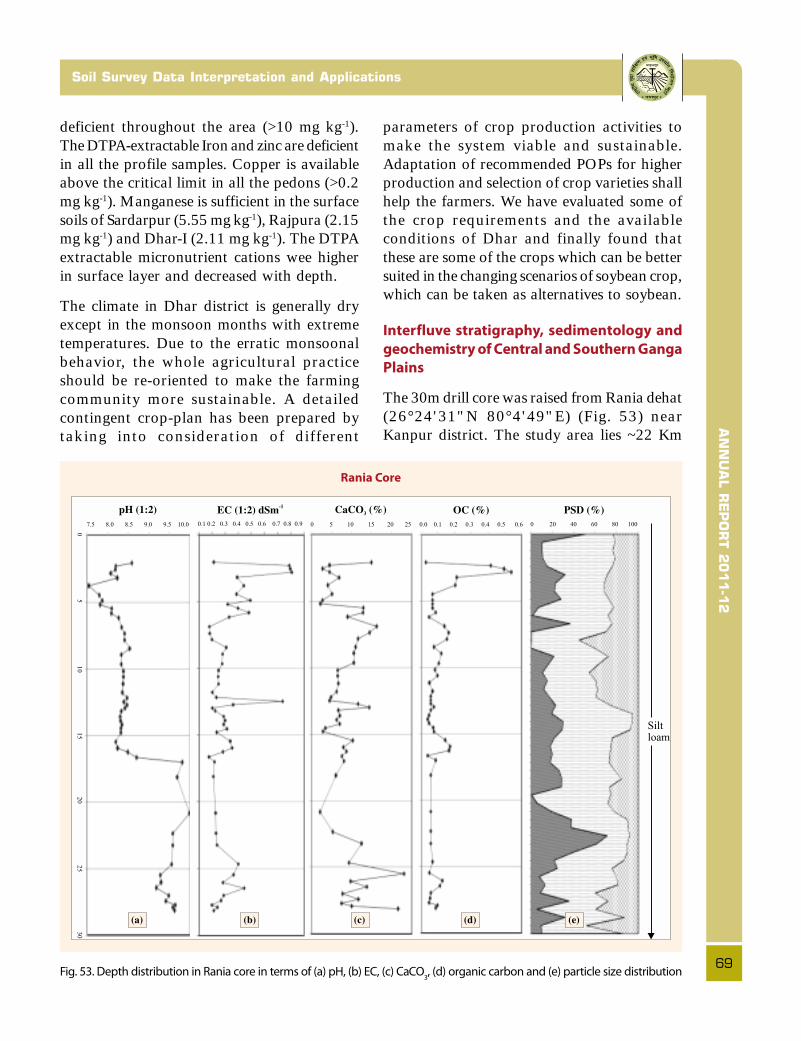
AN
NU
AL R
EP
OR
T 2
011-1
2
69
Soil Survey Data Interpretation and Applications
deficient throughout the area (>10 mg kg-1).The DTPA-extractable Iron and zinc are deficientin all the profile samples. Copper is availableabove the critical limit in all the pedons (>0.2mg kg-1). Manganese is sufficient in the surfacesoils of Sardarpur (5.55 mg kg-1), Rajpura (2.15mg kg-1) and Dhar-I (2.11 mg kg-1). The DTPAextractable micronutrient cations wee higherin surface layer and decreased with depth.
The climate in Dhar district is generally dryexcept in the monsoon months with extremetemperatures. Due to the erratic monsoonalbehavior, the whole agricultural practiceshould be re-oriented to make the farmingcommunity more sustainable. A detailedcontingent crop-plan has been prepared bytaking into consideration of different
parameters of crop production activities tomake the system viable and sustainable.Adaptation of recommended POPs for higherproduction and selection of crop varieties shallhelp the farmers. We have evaluated some ofthe crop requirements and the availableconditions of Dhar and finally found thatthese are some of the crops which can be bettersuited in the changing scenarios of soybean crop,which can be taken as alternatives to soybean.
Interfluve stratigraphy, sedimentology and
geochemistry of Central and Southern Ganga
Plains
The 30m drill core was raised from Rania dehat(26°24'31"N 80°4'49"E) (Fig. 53) nearKanpur district. The study area lies ~22 Km
Fig. 53. Depth distribution in Rania core in terms of (a) pH, (b) EC, (c) CaCO3, (d) organic carbon and (e) particle size distribution
AN
NU
AL R
EP
OR
T 2
011-1
2Research Achievements
70
from the southern margin of Ganga river valley.The drill site constitutes a part of GangaYamuna interfluves, which is around 130 mabove mean sea level. Annual Precipitation inthis location is 800–1000 mm/year and themaximum temperature ranges from 35–45°C.The depth distribution of pH, EC, CaCO3, OC,bulk density and particle-size distribution ofRania core were studied. Core samples up to adepth of about 16.56 m are moderately tostrongly alkaline in reaction. Below thisdepth, core is very strongly to extremelyalkaline in reaction up to 28.37 m depthwith very low concentration of soluble salts.The entire core is calcareous. Organic carbonis considerably low (<0.5 %). Bulk density ofcore ranges between 1.1 to 1.5 Mgm-3. Thetexture of the core is silt loam throughout thedepth. The impoverishment of OC,calcareousness of the sediments, and alkalinepH suggest that both the cores experienced drysub-humid climate during the post depositionalperiod.
Subtle spatial differences in clay mineralogyand their depth distribution in cores fromnorthern and southern parts of the Ganga–Yamuna interfluves are manifestations ofcoupling of sediment source and climatictransitions. The influence of micaceoussediments of the Himalayan orogen in theupper part of both the cores is reflected indominance of high charge smectites whereasthe lower part of the core from the southernpart of the interfluve is characteristically richin low charge smetities (LCS). Since theformation of large amounts of LCS at theexpense of biotite from either Himalayan orcratonic sources is not possible and also thehydroxy-interlayering in smectite is improbablein the alkaline soil environment of the present-day semi-arid climate, this reflects a majorchange in sediment supply in the southerninterfluve from cratonic to the Himalayansource.
Predicting soil carbon changes under
different cropping systems in soils of selected
benchmark spots in different bioclimatic
systems in India
Rothamsted Carbon (RothC) model was usedto simulate the total organic carbon (TOC) forthe surface horizon (0-23 cm) for selected LongTerm Fertilizer Experiment (LTFE) sitesrepresenting Black Soil Region (BSR), i.e., Sarol(Indore, Madhya Pradesh), Teligi (Bellary,Karnataka), Nabibagh (Bhopal, MadhyaPradesh), Panjri (Nagpur, Maharashtra),Mulegaon-4 (Solapur, Maharashtra) andRajendranagar (Andhra Pradesh). The resultsof the simulation exercise undertaken for Sarolare presented in figure 54. For the Indo-Gangetic Plains (IGP), the total organic carbon(TOC) was simulated for the LTFE sitesrepresenting Mohanpur (West Bengal), Goupur(Pusa, Bihar), Zarifa Viran (Karnal, Haryana)and Holambi (New Delhi). The simulatedresults indicated that organic fertilizers whencompared with control. Significant increase inTOC was observed due to the addition of FYMin combination with inorganic fertilizer. Asimilar trend was obtained while comparingthe LTFE data during the experimental periodindicating that the model is able to capture theTOC built-up in the surface horizon underdifferent treatments. Moreover, addition ofinorganic fertilizers alone did not bring anappreciable increase in TOC content over theyears. Century carbon model was able tosimulate TOC correctly for surface horizon(0-20 cm) under different treatments for theselected sites of BSR and IGP (Table 23).
The performance of RothC and Century modelwas evaluated using various statisticalparameters such as simulation correlationcoefficient (r), root mean square error(RMSE)for simulation error; mean differencebetween simulated and measured values (M)for simulation bias Student’s t-test and t-testof M. The RMSE values found to be withinthe satisfactory level for all the treatments.

AN
NU
AL R
EP
OR
T 2
011-1
2
71
Soil Survey Data Interpretation and Applications
Fig. 54. Simulation of organic carbon contents of the surface horizon (0-23 cm) of soils from four treatments on the
LTFE site of Sarol
Table 23. Simulation of TOC for selected LTFE sites using RothC and Century C model
RothC (tCha-1)BM spots and cropping systems
Century (tCha-1)
Years Years
1990 2000 2050 Sarol (Soybean-Safflower) 1990 2000 2050
6.25 6.24 6.15 Control 6.99 6.30 5.93
6.27 6.27 6.31 NPK 6.60 5.95 5.76
12.97 18.20 31.88 NPK+FYM 18.12 24.21 34.11
Teligi (Paddy-Paddy)
6.13 6.08 6.05 Control 15.66 14.67 11.33
6.13 6.14 6.20 NPK 15.57 14.61 14.82
8.84 13.83 27.86 NPK+FYM 17.46 17.98 19.58
Akola (Soybean-Wheat)
7.920 6.9683 5.5525 Control 9.81 4.00 2.64
8.26 7.79 7.46 NPK 10.08 6.51 7.47
13.74 21.76 40.50 NPK+FYM 12.08 14.00 20.60
Mohanpur (Rice-Wheat)
26.66 23.79 21.14 Control 24.8 23.76 21.98
26.66 23.80 23.40 NPK 24.55 25.24 28.34
33.81 36.69 50.37 NPK+FYM 25.7 26.38 28.03

AN
NU
AL R
EP
OR
T 2
011-1
2Research Achievements
72
Georeferenced soil information system for
land use planning and monitoring soil and
land quality for agriculture
Georeferenced Soil Information System(GeoSIS) was developed using information onthe physical and chemical properties of 842soils (point data) representing 36 agro-ecological subregions (AESRs) of Black SoilRegion (BSR) with a total geographical area(TGA) of 76.4 mha, and 17 AESRs of the Indo-Gangetic Plains (IGP) with TGA of 52.01 mha.Multiple microbial diversity indices [(Shannonindex (H´), Simpson index (D), Simpsonreciprocal index (1/D), Shannon evenness (E)and Simpson evenness (E)] were derived fromdifferent microbiological parameters for 32 hotspots from these two regions. TemporalDatasets on physical, chemical andmicrobiological properties of the soils, climateand crop yields from 32 BM spots (soil series)was created and linked in SOTER-GISenvironment for monitoring soil and landquality. Development of Pedo-Transfer
Function (PTF) for estimating saturatedhydraulic conductivity (sHC) as thequantitative parameter for soil drainage wasused as land quality index for the soils of BSRand IGP. The estimated values of sHC was usedfor generating the quantitative soil drainagemap for modification of the length of growingperiod (LGP). Based on the soil type and LGP,various AESRs were modified (Fig. 55). Yieldgap analysis was carried for cotton, soybeanand wheat crops for the BSR using InfoCropmodel. Ratio of InfoCrop cotton modelledwater limited (rainfed) and potential yieldswere simulated based on historical weather files(7-31 years) for BSR for Bt cotton and soybean.This ratio ranged from 0.08 in Nimone soils(Ahmadnagar) to 0.808 in Panjri soils (Nagpur)for rainfed Bt cotton indicating the land qualityfor cotton as best on Panjri soils. Similarly forsoybean, it ranged from 0.302 in Coimbatoresoils to 0.90 in Vasmat soils (Parbhani) tosuggest that the land quality parameters forsoybean were most suited in Vasmat soils(Parbhani).
Fig. 55. Modified AESR map for IGP: an example of AESR 9.2
INDIA
Indo-Gangetic Plains (IGP)
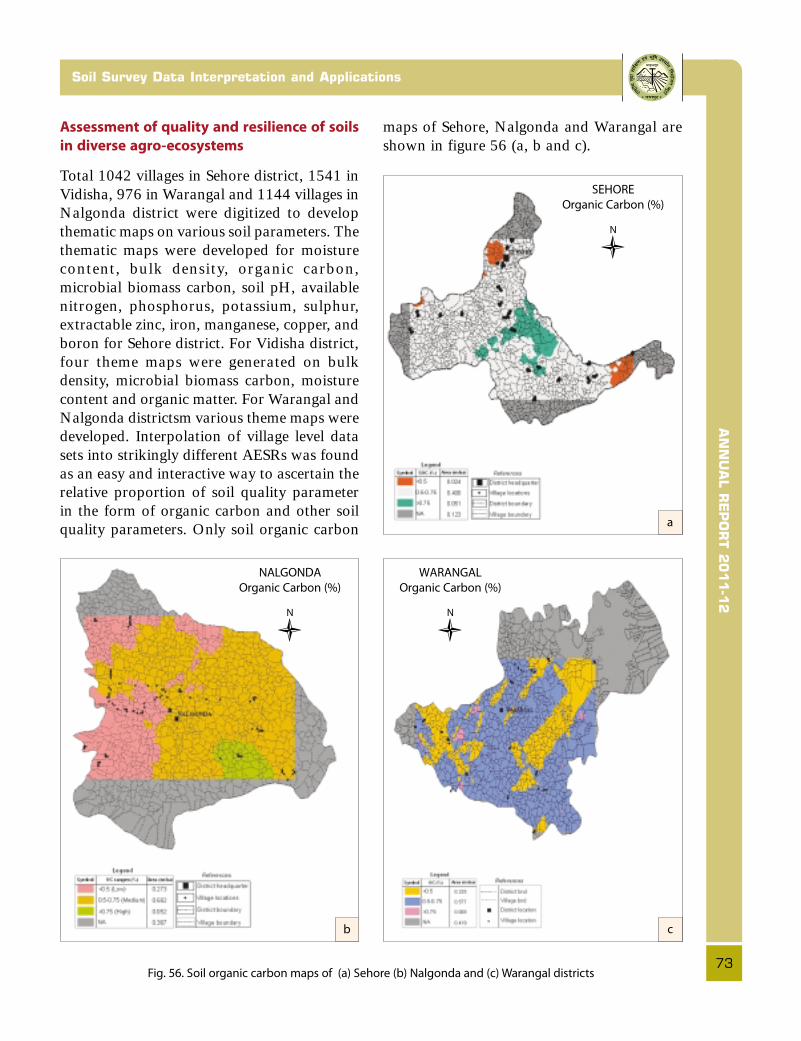
AN
NU
AL R
EP
OR
T 2
011-1
2
73
Soil Survey Data Interpretation and Applications
Assessment of quality and resilience of soils
in diverse agro-ecosystems
Total 1042 villages in Sehore district, 1541 inVidisha, 976 in Warangal and 1144 villages inNalgonda district were digitized to developthematic maps on various soil parameters. Thethematic maps were developed for moisturecontent, bulk density, organic carbon,microbial biomass carbon, soil pH, availablenitrogen, phosphorus, potassium, sulphur,extractable zinc, iron, manganese, copper, andboron for Sehore district. For Vidisha district,four theme maps were generated on bulkdensity, microbial biomass carbon, moisturecontent and organic matter. For Warangal andNalgonda districtsm various theme maps weredeveloped. Interpolation of village level datasets into strikingly different AESRs was foundas an easy and interactive way to ascertain therelative proportion of soil quality parameterin the form of organic carbon and other soilquality parameters. Only soil organic carbon
Fig. 56. Soil organic carbon maps of (a) Sehore (b) Nalgonda and (c) Warangal districts
maps of Sehore, Nalgonda and Warangal areshown in figure 56 (a, b and c).
a
SEHORE
Organic Carbon (%)
cb
WARANGAL
Organic Carbon (%)
NALGONDA
Organic Carbon (%)
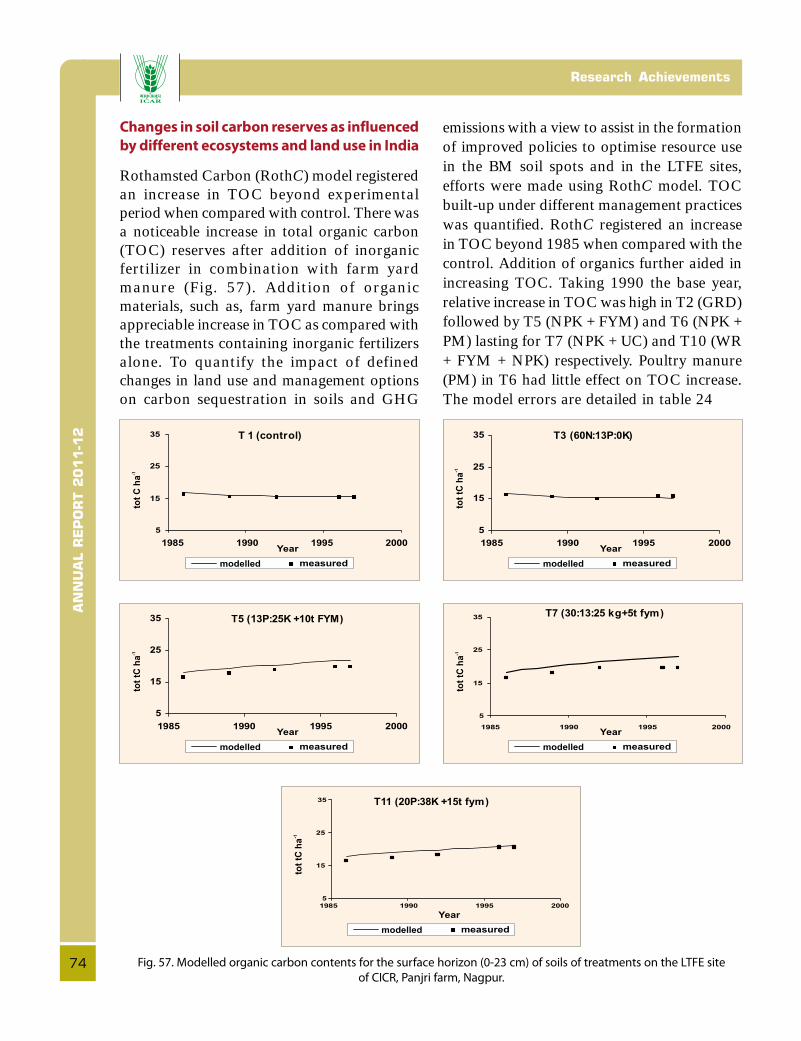
AN
NU
AL R
EP
OR
T 2
011-1
2Research Achievements
74
Changes in soil carbon reserves as influenced
by different ecosystems and land use in India
Rothamsted Carbon (RothC) model registeredan increase in TOC beyond experimentalperiod when compared with control. There wasa noticeable increase in total organic carbon(TOC) reserves after addition of inorganicfertilizer in combination with farm yardmanure (Fig. 57). Addition of organicmaterials, such as, farm yard manure bringsappreciable increase in TOC as compared withthe treatments containing inorganic fertilizersalone. To quantify the impact of definedchanges in land use and management optionson carbon sequestration in soils and GHG
emissions with a view to assist in the formationof improved policies to optimise resource usein the BM soil spots and in the LTFE sites,efforts were made using RothC model. TOCbuilt-up under different management practiceswas quantified. RothC registered an increasein TOC beyond 1985 when compared with thecontrol. Addition of organics further aided inincreasing TOC. Taking 1990 the base year,relative increase in TOC was high in T2 (GRD)followed by T5 (NPK + FYM) and T6 (NPK +PM) lasting for T7 (NPK + UC) and T10 (WR+ FYM + NPK) respectively. Poultry manure(PM) in T6 had little effect on TOC increase.The model errors are detailed in table 24
Fig. 57. Modelled organic carbon contents for the surface horizon (0-23 cm) of soils of treatments on the LTFE site
of CICR, Panjri farm, Nagpur.
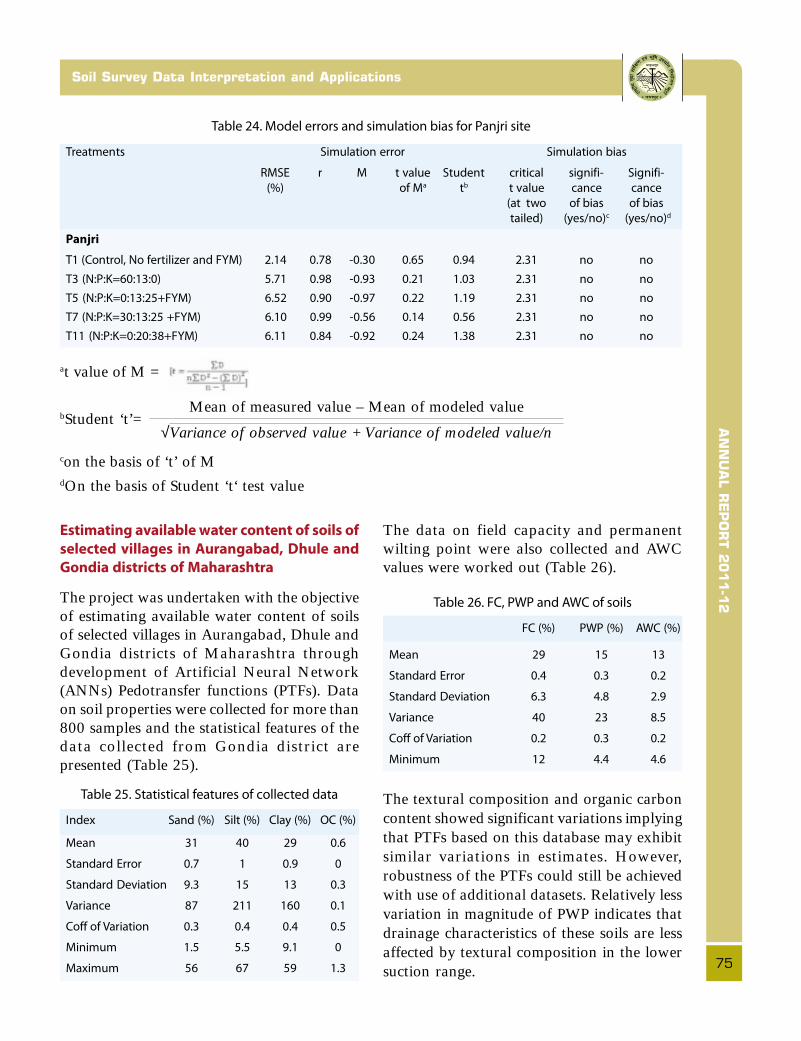
AN
NU
AL R
EP
OR
T 2
011-1
2
75
Soil Survey Data Interpretation and Applications
The data on field capacity and permanentwilting point were also collected and AWCvalues were worked out (Table 26).
Table 26. FC, PWP and AWC of soils
FC (%) PWP (%) AWC (%)
Mean 29 15 13
Standard Error 0.4 0.3 0.2
Standard Deviation 6.3 4.8 2.9
Variance 40 23 8.5
Coff of Variation 0.2 0.3 0.2
Minimum 12 4.4 4.6
The textural composition and organic carboncontent showed significant variations implyingthat PTFs based on this database may exhibitsimilar variations in estimates. However,robustness of the PTFs could still be achievedwith use of additional datasets. Relatively lessvariation in magnitude of PWP indicates thatdrainage characteristics of these soils are lessaffected by textural composition in the lowersuction range.
Table 24. Model errors and simulation bias for Panjri site
Treatments Simulation error Simulation bias
RMSE r M t value Student critical signifi- Signifi-
(%) of Ma tb t value cance cance
(at two of bias of bias
tailed) (yes/no)c (yes/no)d
Panjri
T1 (Control, No fertilizer and FYM) 2.14 0.78 -0.30 0.65 0.94 2.31 no no
T3 (N:P:K=60:13:0) 5.71 0.98 -0.93 0.21 1.03 2.31 no no
T5 (N:P:K=0:13:25+FYM) 6.52 0.90 -0.97 0.22 1.19 2.31 no no
T7 (N:P:K=30:13:25 +FYM) 6.10 0.99 -0.56 0.14 0.56 2.31 no no
T11 (N:P:K=0:20:38+FYM) 6.11 0.84 -0.92 0.24 1.38 2.31 no no
at value of M =
bStudent ‘t’=
con the basis of ‘t’ of MdOn the basis of Student ‘t‘ test value
Mean of measured value – Mean of modeled value
√Variance of observed value + Variance of modeled value/n
Estimating available water content of soils of
selected villages in Aurangabad, Dhule and
Gondia districts of Maharashtra
The project was undertaken with the objectiveof estimating available water content of soilsof selected villages in Aurangabad, Dhule andGondia districts of Maharashtra throughdevelopment of Artificial Neural Network(ANNs) Pedotransfer functions (PTFs). Dataon soil properties were collected for more than800 samples and the statistical features of thedata collected from Gondia district arepresented (Table 25).
Table 25. Statistical features of collected data
Index Sand (%) Silt (%) Clay (%) OC (%)
Mean 31 40 29 0.6
Standard Error 0.7 1 0.9 0
Standard Deviation 9.3 15 13 0.3
Variance 87 211 160 0.1
Coff of Variation 0.3 0.4 0.4 0.5
Minimum 1.5 5.5 9.1 0
Maximum 56 67 59 1.3
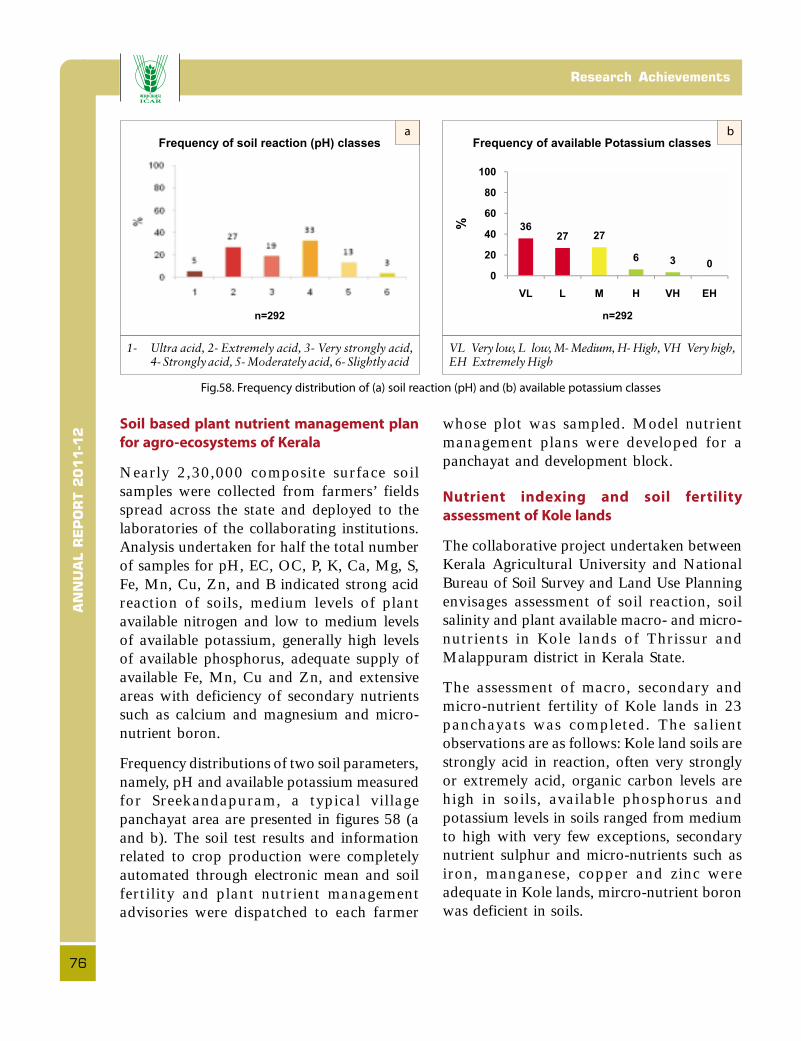
AN
NU
AL R
EP
OR
T 2
011-1
2Research Achievements
76
Soil based plant nutrient management plan
for agro-ecosystems of Kerala
Nearly 2,30,000 composite surface soilsamples were collected from farmers’ fieldsspread across the state and deployed to thelaboratories of the collaborating institutions.Analysis undertaken for half the total numberof samples for pH, EC, OC, P, K, Ca, Mg, S,Fe, Mn, Cu, Zn, and B indicated strong acidreaction of soils, medium levels of plantavailable nitrogen and low to medium levelsof available potassium, generally high levelsof available phosphorus, adequate supply ofavailable Fe, Mn, Cu and Zn, and extensiveareas with deficiency of secondary nutrientssuch as calcium and magnesium and micro-nutrient boron.
Frequency distributions of two soil parameters,namely, pH and available potassium measuredfor Sreekandapuram, a typical villagepanchayat area are presented in figures 58 (aand b). The soil test results and informationrelated to crop production were completelyautomated through electronic mean and soilfertility and plant nutrient managementadvisories were dispatched to each farmer
whose plot was sampled. Model nutrientmanagement plans were developed for apanchayat and development block.
Nutrient indexing and soil fertility
assessment of Kole lands
The collaborative project undertaken betweenKerala Agricultural University and NationalBureau of Soil Survey and Land Use Planningenvisages assessment of soil reaction, soilsalinity and plant available macro- and micro-nutrients in Kole lands of Thrissur andMalappuram district in Kerala State.
The assessment of macro, secondary andmicro-nutrient fertility of Kole lands in 23panchayats was completed. The salientobservations are as follows: Kole land soils arestrongly acid in reaction, often very stronglyor extremely acid, organic carbon levels arehigh in soils, available phosphorus andpotassium levels in soils ranged from mediumto high with very few exceptions, secondarynutrient sulphur and micro-nutrients such asiron, manganese, copper and zinc wereadequate in Kole lands, mircro-nutrient boronwas deficient in soils.
Fig.58. Frequency distribution of (a) soil reaction (pH) and (b) available potassium classes

AN
NU
AL R
EP
OR
T 2
011-1
2
77
Land Evaluation and Land Use Planning
2.5
• Farm/Watershed/District/Region/State/Country
• Soil and Land Use Model
Land Evaluation and Land Use Planning
Development of district level land use plan for
Mysore district, Karnataka state (A subproject
of network project on district level land use
planning – NePDiLUP)
The project aims at developing land use planfor Mysore district. Methodology followed in
developing the district land use plan ispresented in figure 59. Twelve LandManagement Units (LMU) consisting of threeunder irrigated and nine under rainfedsituations were delineated. The soil map unitsdelineating using satellite data.
Fig. 59. Methodology for district level land use planning

AN
NU
AL R
EP
OR
T 2
011-1
2Research Achievements
78
Some of the important input information fordeveloping the plan is discussed below.
1. Irrigated (Command area): Rice/sugarcane/banana/vegetables production systems onred shallow, moderately deep and deep soilsoccurring in AEU II,III & IV
2. Irrigated (Command area): Rice/sugarcane/Banana/Vegetables production systems onblack moderately deep to deep clayey soilsin AEU II, III and IV
3. Irrigated (Ground water): Rice/maizeproduction systems on red shallow,moderately deep and deep soils in AEU I
4. Rainfed: Tobacco -Ragi/pulses productionsystems on red shallow soils in AEU I
5. Rainfed: Tobacco-Ragi/pulse productionsystems on red moderately deep to deepsoils in AEU I
6. Rainfed: ragi based production systems onred shallow soils in AEU II
7. Rainfed: Tobacco-ragi/pulses/cottonproduction systems on red moderately deepto deep soils in AEU II
8. Rainfed: Ragi/Jowar/Cotton productionsystems on red shallow soils in AEU III
9. Rainfed: Cotton/ragi/Jowar productionsystems on red moderately deep to deepsoils in AEU III
10. Rainfed: Ragi/Jowar/Maize productionsystems on red shallow soils in AEU IV
11. Rainfed: Pulses-Ragi/Jowar/cottonproduction systems on red moderately deepto deep soils in AEU IV
12. Rainfed: Cotton/Ragi/maize/Jowar produc-tion systems on black moderately deep todeep clayey soils in AEU III & IV
Evaluated all the LMUs for identifyingeconomically viable and bio-physicallysuitable crops and cropping systems. Alsoidentified different constraints in eachfarming system and suggested options toimprove the productivity. Mysore district ishaving 26.9% prime irrigated, 43.5%prime rainfed agricultural lands and 4.5%marginal lands. Highest prime irrigated landsare in T.Narsipura taluk (5.72%) and rainfedlands in Nanjanagudu taluk (8.71%). Marginallands are scattered in Hunsur and Piriyapatnataluks.
� Multiple Goal Linear programme wasused underlying a set of given constraintsfor agricultural development in the districtto evolve land use options. The followingare the goals set for area allocation todifferent components of agriculture in thedistrict.
1. Maximum Net returns (No constraintson minimum area crop allocation)
2. Maximum Net Returns (NR) withminimum area under cereals
3. Max. NR with minimum area undercereals + pulses
4. Max. NR with minimum area undercereals + pulses + Oilseeds
5. Max. NR with minimum area undercereals + pulses + oilseeds + commercialcrops (excluding Field bean & horsegram)
6. Max. NR with fertilizer constraints
� The model has allocated area for differentcrops with respect to each goal. Expectednet returns for the district varied fromRs. 65,713 to 28, 384 million (underdifferent objectives) and to achieve thisdifferent combination of crops have beensuggested.
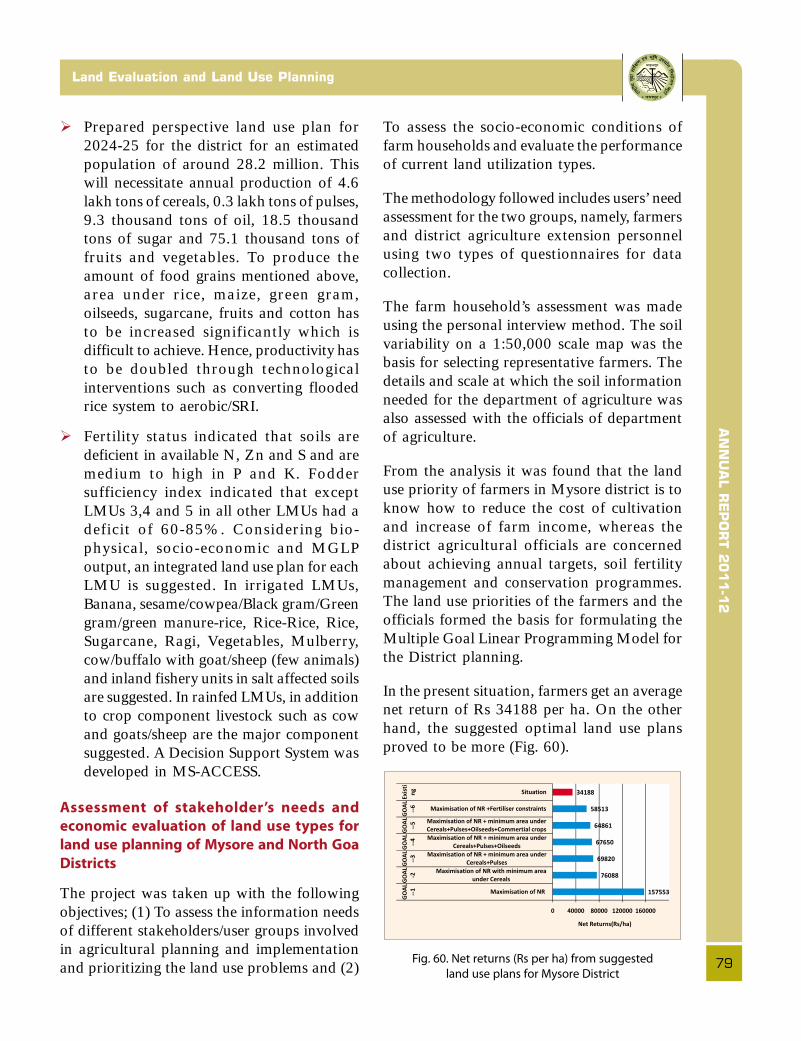
AN
NU
AL R
EP
OR
T 2
011-1
2
79
Land Evaluation and Land Use Planning
� Prepared perspective land use plan for2024-25 for the district for an estimatedpopulation of around 28.2 million. Thiswill necessitate annual production of 4.6lakh tons of cereals, 0.3 lakh tons of pulses,9.3 thousand tons of oil, 18.5 thousandtons of sugar and 75.1 thousand tons offruits and vegetables. To produce theamount of food grains mentioned above,area under rice, maize, green gram,oilseeds, sugarcane, fruits and cotton hasto be increased significantly which isdifficult to achieve. Hence, productivity hasto be doubled through technologicalinterventions such as converting floodedrice system to aerobic/SRI.
� Fertility status indicated that soils aredeficient in available N, Zn and S and aremedium to high in P and K. Foddersufficiency index indicated that exceptLMUs 3,4 and 5 in all other LMUs had adeficit of 60-85%. Considering bio-physical, socio-economic and MGLPoutput, an integrated land use plan for eachLMU is suggested. In irrigated LMUs,Banana, sesame/cowpea/Black gram/Greengram/green manure-rice, Rice-Rice, Rice,Sugarcane, Ragi, Vegetables, Mulberry,cow/buffalo with goat/sheep (few animals)and inland fishery units in salt affected soilsare suggested. In rainfed LMUs, in additionto crop component livestock such as cowand goats/sheep are the major componentsuggested. A Decision Support System wasdeveloped in MS-ACCESS.
Assessment of stakeholder’s needs and
economic evaluation of land use types for
land use planning of Mysore and North Goa
Districts
The project was taken up with the followingobjectives; (1) To assess the information needsof different stakeholders/user groups involvedin agricultural planning and implementationand prioritizing the land use problems and (2)
To assess the socio-economic conditions offarm households and evaluate the performanceof current land utilization types.
The methodology followed includes users’ needassessment for the two groups, namely, farmersand district agriculture extension personnelusing two types of questionnaires for datacollection.
The farm household’s assessment was madeusing the personal interview method. The soilvariability on a 1:50,000 scale map was thebasis for selecting representative farmers. Thedetails and scale at which the soil informationneeded for the department of agriculture wasalso assessed with the officials of departmentof agriculture.
From the analysis it was found that the landuse priority of farmers in Mysore district is toknow how to reduce the cost of cultivationand increase of farm income, whereas thedistrict agricultural officials are concernedabout achieving annual targets, soil fertilitymanagement and conservation programmes.The land use priorities of the farmers and theofficials formed the basis for formulating theMultiple Goal Linear Programming Model forthe District planning.
In the present situation, farmers get an averagenet return of Rs 34188 per ha. On the otherhand, the suggested optimal land use plansproved to be more (Fig. 60).
Fig. 60. Net returns (Rs per ha) from suggested
land use plans for Mysore District
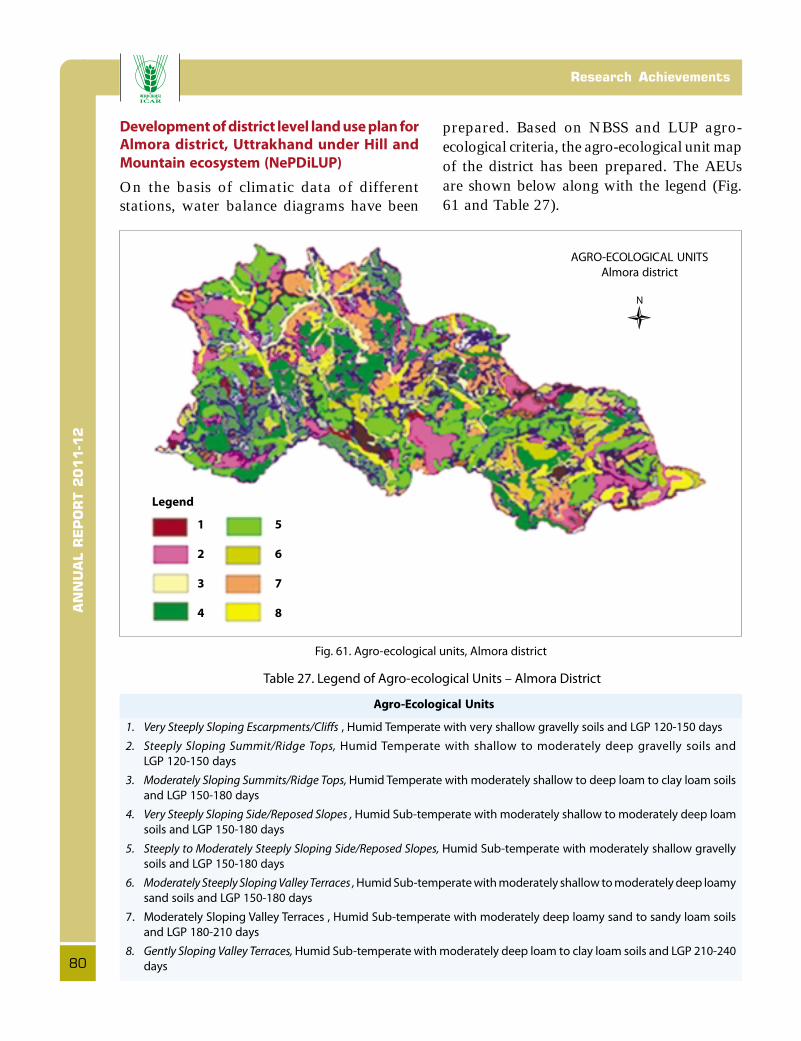
AN
NU
AL R
EP
OR
T 2
011-1
2Research Achievements
80
Development of district level land use plan forAlmora district, Uttrakhand under Hill and
Mountain ecosystem (NePDiLUP)
On the basis of climatic data of differentstations, water balance diagrams have been
prepared. Based on NBSS and LUP agro-ecological criteria, the agro-ecological unit mapof the district has been prepared. The AEUsare shown below along with the legend (Fig.61 and Table 27).
Fig. 61. Agro-ecological units, Almora district
Table 27. Legend of Agro-ecological Units – Almora District
Agro-Ecological Units
1. Very Steeply Sloping Escarpments/Cliffs , Humid Temperate with very shallow gravelly soils and LGP 120-150 days
2. Steeply Sloping Summit/Ridge Tops, Humid Temperate with shallow to moderately deep gravelly soils and
LGP 120-150 days
3. Moderately Sloping Summits/Ridge Tops, Humid Temperate with moderately shallow to deep loam to clay loam soils
and LGP 150-180 days
4. Very Steeply Sloping Side/Reposed Slopes , Humid Sub-temperate with moderately shallow to moderately deep loam
soils and LGP 150-180 days
5. Steeply to Moderately Steeply Sloping Side/Reposed Slopes, Humid Sub-temperate with moderately shallow gravelly
soils and LGP 150-180 days
6. Moderately Steeply Sloping Valley Terraces , Humid Sub-temperate with moderately shallow to moderately deep loamy
sand soils and LGP 150-180 days
7. Moderately Sloping Valley Terraces , Humid Sub-temperate with moderately deep loamy sand to sandy loam soils
and LGP 180-210 days
8. Gently Sloping Valley Terraces, Humid Sub-temperate with moderately deep loam to clay loam soils and LGP 210-240
days
AGRO-ECOLOGICAL UNITS
Almora district
1
2
3
4
5
6
7
8
Legend
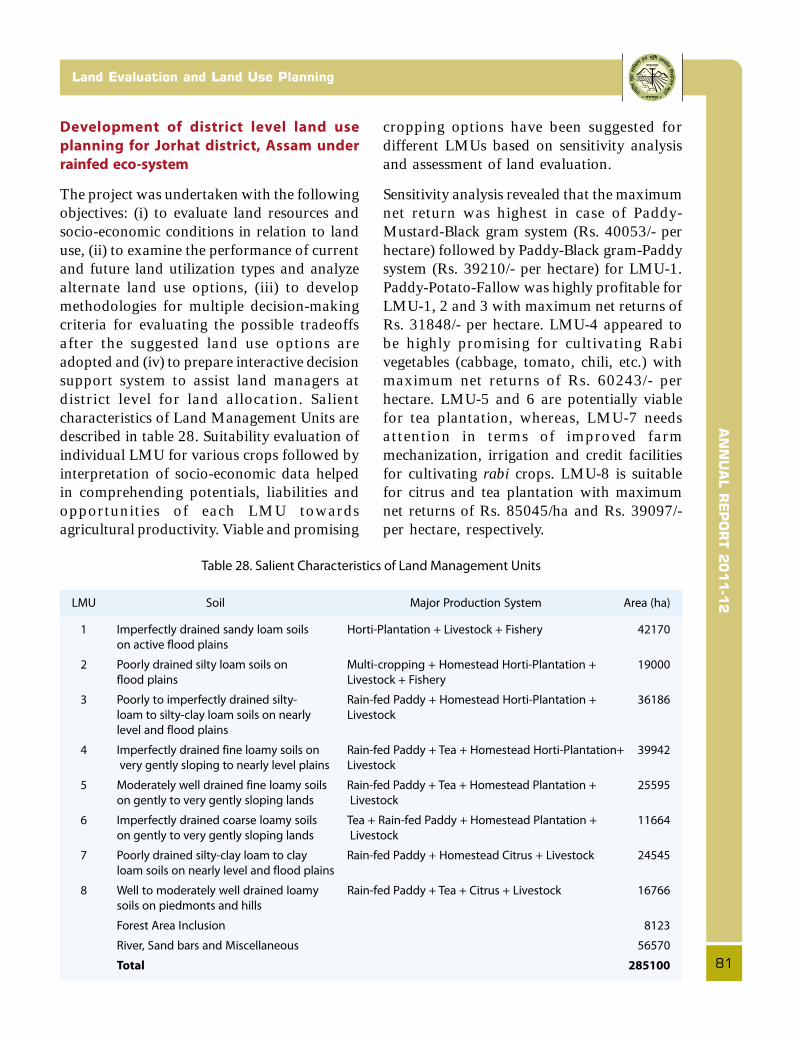
AN
NU
AL R
EP
OR
T 2
011-1
2
81
Land Evaluation and Land Use Planning
Development of district level land use
planning for Jorhat district, Assam under
rainfed eco-system
The project was undertaken with the followingobjectives: (i) to evaluate land resources andsocio-economic conditions in relation to landuse, (ii) to examine the performance of currentand future land utilization types and analyzealternate land use options, (iii) to developmethodologies for multiple decision-makingcriteria for evaluating the possible tradeoffsafter the suggested land use options areadopted and (iv) to prepare interactive decisionsupport system to assist land managers atdistrict level for land allocation. Salientcharacteristics of Land Management Units aredescribed in table 28. Suitability evaluation ofindividual LMU for various crops followed byinterpretation of socio-economic data helpedin comprehending potentials, liabilities andopportunities of each LMU towardsagricultural productivity. Viable and promising
cropping options have been suggested fordifferent LMUs based on sensitivity analysisand assessment of land evaluation.
Sensitivity analysis revealed that the maximumnet return was highest in case of Paddy-Mustard-Black gram system (Rs. 40053/- perhectare) followed by Paddy-Black gram-Paddysystem (Rs. 39210/- per hectare) for LMU-1.Paddy-Potato-Fallow was highly profitable forLMU-1, 2 and 3 with maximum net returns ofRs. 31848/- per hectare. LMU-4 appeared tobe highly promising for cultivating Rabivegetables (cabbage, tomato, chili, etc.) withmaximum net returns of Rs. 60243/- perhectare. LMU-5 and 6 are potentially viablefor tea plantation, whereas, LMU-7 needsattention in terms of improved farmmechanization, irrigation and credit facilitiesfor cultivating rabi crops. LMU-8 is suitablefor citrus and tea plantation with maximumnet returns of Rs. 85045/ha and Rs. 39097/-per hectare, respectively.
Table 28. Salient Characteristics of Land Management Units
LMU Soil Major Production System Area (ha)
1 Imperfectly drained sandy loam soils Horti-Plantation + Livestock + Fishery 42170
on active flood plains
2 Poorly drained silty loam soils on Multi-cropping + Homestead Horti-Plantation + 19000
flood plains Livestock + Fishery
3 Poorly to imperfectly drained silty- Rain-fed Paddy + Homestead Horti-Plantation + 36186
loam to silty-clay loam soils on nearly Livestock
level and flood plains
4 Imperfectly drained fine loamy soils on Rain-fed Paddy + Tea + Homestead Horti-Plantation+ 39942
very gently sloping to nearly level plains Livestock
5 Moderately well drained fine loamy soils Rain-fed Paddy + Tea + Homestead Plantation + 25595
on gently to very gently sloping lands Livestock
6 Imperfectly drained coarse loamy soils Tea + Rain-fed Paddy + Homestead Plantation + 11664
on gently to very gently sloping lands Livestock
7 Poorly drained silty-clay loam to clay Rain-fed Paddy + Homestead Citrus + Livestock 24545
loam soils on nearly level and flood plains
8 Well to moderately well drained loamy Rain-fed Paddy + Tea + Citrus + Livestock 16766
soils on piedmonts and hills
Forest Area Inclusion 8123
River, Sand bars and Miscellaneous 56570
Total 285100

AN
NU
AL R
EP
OR
T 2
011-1
2Research Achievements
82
Development of district level land use plan for
Nadia district in West Bengal under irrigated
ecosystem (NePDiLUP)
Nine Land Management Units (LMUs) wereidentified in Nadia district by integrating24 land units with prevailing four majorproduction systems viz. Cropping system(Jute-rice-rice, Jute-rice / rice-rice / mustard/sesame / wheat / gram / black gram / lentil /vegetables / flowers, sugarcane, banana etc.);
Livestock (Dairy, poultry, duckery, goatery);Aquaculture (Fishery) and Homestead(vegetables, fruits, flowers, betel-vine etc).The salient features of 9 Land Manage-ment Units (LMU) are presented intable 29.
Soils of each land management units (LMUs)were evaluated for soil site suitability of variouscrops in relation to the cropping pattern ofNadia district (table 30).
Table 29. Salient features of LMUs
LMU Area (ha) Soil Characteristics
1 13476 Moderately well to imperfectly drained calcareous fine silty soils with silt loam surface on
nearly level to very gently sloping flood plain
2 52463 Imperfectly drained calcareous coarse silty soils with silt loam surface on nearly level flood
plain
3 33939 Moderately well drained calcareous fine soils with silty clay loam to silty clay surface on
nearly level to very gently sloping meander plain
4 113478 Poor to imperfectly drained fine soil with silty clay surface on very gently sloping meander
plain
5 62238 Poorly drained calcareous fine loamy soils with silt loam surface on very gently sloping
meander plain
6 46844 Poorly drained fine silty soils with silty loam to loam surface on nearly level to very gently
sloping meander plain
7 6356 Poorly drained calcareous fine silty soils with silt loam surface on very gently sloping meander
plain
8 23986 Poorly drained fine soils with severe flooding with silty clay surface on nearly level to very
gently sloping marshy land
9 17482 Poorly drained fine loamy soils with silt loam to silty clay loam surface on very gently sloping
river valley
Table 30. Soil site suitability of various crops
LMU Rice Jute Mustard/ Wheat Sesame Sugarcane Groundnut
Rapeseed
1 S3 S1 S1 S2 S2 S2 S1
2 S3 S2 S2 S3 S2 S3 S2
3 S2 S2 S2 S3 S2 S3 S3
4 S2 S2 S2 S3 S3 S3 S3
5 S1 S2 S2 S2 S3 S3 S3
6 S3 S1 S2 S3 S2 S2 S2
7 S2 S2 S1 S3 S3 S3 S1
8 S1 S2 S3 S3 S3 S3 S3
9 S2 S2 S1 S3 S2 S2 S2
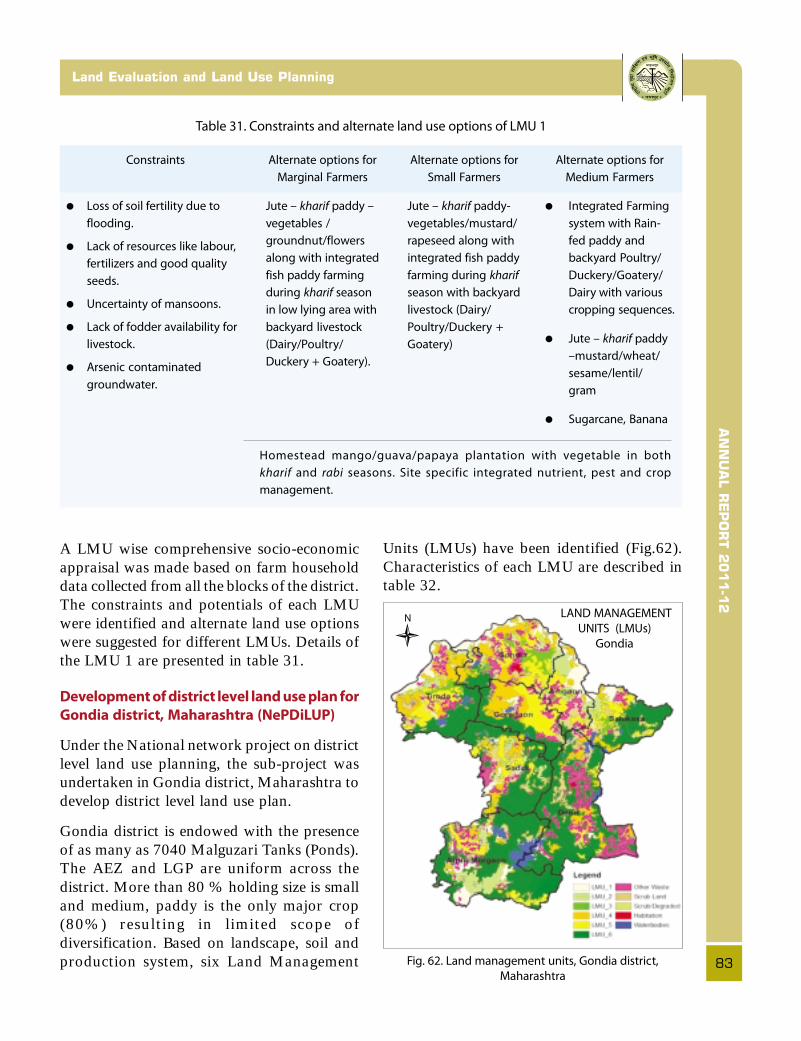
AN
NU
AL R
EP
OR
T 2
011-1
2
83
Land Evaluation and Land Use Planning
Units (LMUs) have been identified (Fig.62).Characteristics of each LMU are described intable 32.
A LMU wise comprehensive socio-economicappraisal was made based on farm householddata collected from all the blocks of the district.The constraints and potentials of each LMUwere identified and alternate land use optionswere suggested for different LMUs. Details ofthe LMU 1 are presented in table 31.
Development of district level land use plan for
Gondia district, Maharashtra (NePDiLUP)
Under the National network project on districtlevel land use planning, the sub-project wasundertaken in Gondia district, Maharashtra todevelop district level land use plan.
Gondia district is endowed with the presenceof as many as 7040 Malguzari Tanks (Ponds).The AEZ and LGP are uniform across thedistrict. More than 80 % holding size is smalland medium, paddy is the only major crop(80%) resulting in limited scope ofdiversification. Based on landscape, soil andproduction system, six Land Management Fig. 62. Land management units, Gondia district,
Maharashtra
Table 31. Constraints and alternate land use options of LMU 1
LAND MANAGEMENT
UNITS (LMUs)
Gondia
Homestead mango/guava/papaya plantation with vegetable in both
kharif and rabi seasons. Site specific integrated nutrient, pest and crop
management.
Constraints
• Loss of soil fertility due to
flooding.
• Lack of resources like labour,
fertilizers and good quality
seeds.
• Uncertainty of mansoons.
• Lack of fodder availability for
livestock.
• Arsenic contaminated
groundwater.
Alternate options for
Marginal Farmers
Jute – kharif paddy –
vegetables /
groundnut/flowers
along with integrated
fish paddy farming
during kharif season
in low lying area with
backyard livestock
(Dairy/Poultry/
Duckery + Goatery).
Alternate options for
Medium Farmers
• Integrated Farming
system with Rain-
fed paddy and
backyard Poultry/
Duckery/Goatery/
Dairy with various
cropping sequences.
• Jute – kharif paddy
–mustard/wheat/
sesame/lentil/
gram
• Sugarcane, Banana
Alternate options for
Small Farmers
Jute – kharif paddy-
vegetables/mustard/
rapeseed along with
integrated fish paddy
farming during kharif
season with backyard
livestock (Dairy/
Poultry/Duckery +
Goatery)
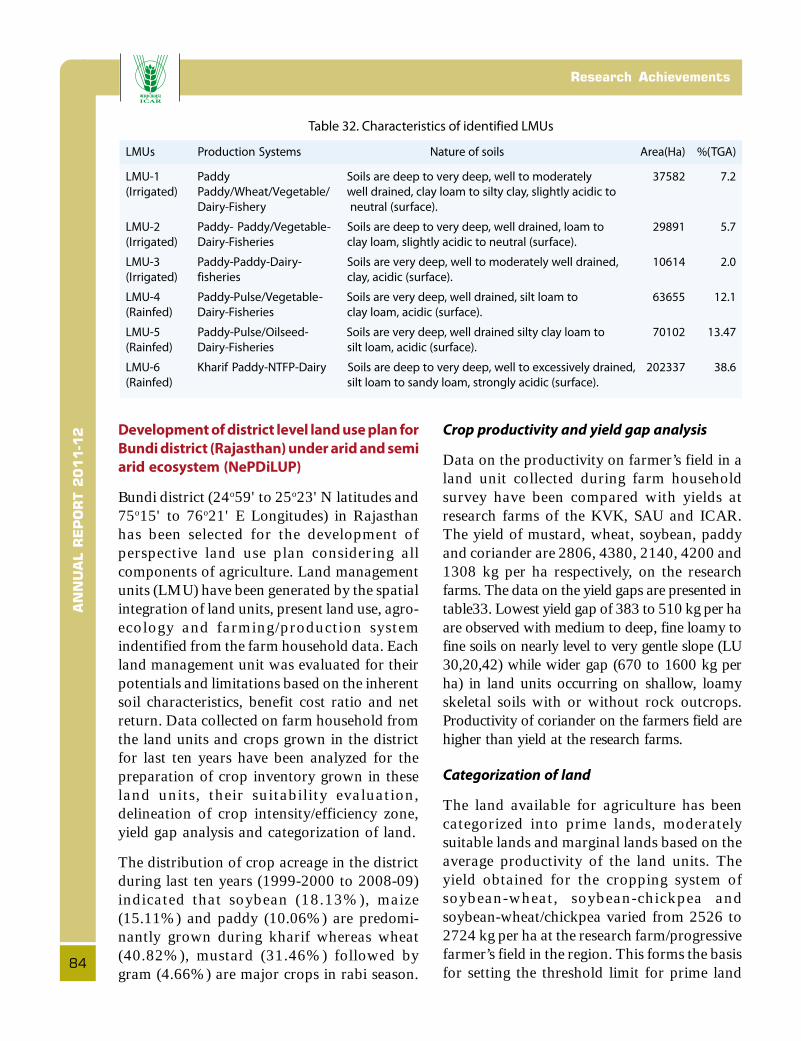
AN
NU
AL R
EP
OR
T 2
011-1
2Research Achievements
84
Table 32. Characteristics of identified LMUs
LMUs Production Systems Nature of soils Area(Ha) %(TGA)
LMU-1 Paddy Soils are deep to very deep, well to moderately 37582 7.2
(Irrigated) Paddy/Wheat/Vegetable/ well drained, clay loam to silty clay, slightly acidic to
Dairy-Fishery neutral (surface).
LMU-2 Paddy- Paddy/Vegetable- Soils are deep to very deep, well drained, loam to 29891 5.7
(Irrigated) Dairy-Fisheries clay loam, slightly acidic to neutral (surface).
LMU-3 Paddy-Paddy-Dairy- Soils are very deep, well to moderately well drained, 10614 2.0
(Irrigated) fisheries clay, acidic (surface).
LMU-4 Paddy-Pulse/Vegetable- Soils are very deep, well drained, silt loam to 63655 12.1
(Rainfed) Dairy-Fisheries clay loam, acidic (surface).
LMU-5 Paddy-Pulse/Oilseed- Soils are very deep, well drained silty clay loam to 70102 13.47
(Rainfed) Dairy-Fisheries silt loam, acidic (surface).
LMU-6 Kharif Paddy-NTFP-Dairy Soils are deep to very deep, well to excessively drained, 202337 38.6
(Rainfed) silt loam to sandy loam, strongly acidic (surface).
Crop productivity and yield gap analysis
Data on the productivity on farmer’s field in aland unit collected during farm householdsurvey have been compared with yields atresearch farms of the KVK, SAU and ICAR.The yield of mustard, wheat, soybean, paddyand coriander are 2806, 4380, 2140, 4200 and1308 kg per ha respectively, on the researchfarms. The data on the yield gaps are presented intable33. Lowest yield gap of 383 to 510 kg per haare observed with medium to deep, fine loamy tofine soils on nearly level to very gentle slope (LU30,20,42) while wider gap (670 to 1600 kg perha) in land units occurring on shallow, loamyskeletal soils with or without rock outcrops.Productivity of coriander on the farmers field arehigher than yield at the research farms.
Categorization of land
The land available for agriculture has beencategorized into prime lands, moderatelysuitable lands and marginal lands based on theaverage productivity of the land units. Theyield obtained for the cropping system ofsoybean-wheat, soybean-chickpea andsoybean-wheat/chickpea varied from 2526 to2724 kg per ha at the research farm/progressivefarmer’s field in the region. This forms the basisfor setting the threshold limit for prime land
Development of district level land use plan for
Bundi district (Rajasthan) under arid and semi
arid ecosystem (NePDiLUP)
Bundi district (24o59' to 25o23' N latitudes and75o15' to 76o21' E Longitudes) in Rajasthanhas been selected for the development ofperspective land use plan considering allcomponents of agriculture. Land managementunits (LMU) have been generated by the spatialintegration of land units, present land use, agro-ecology and farming/production systemindentified from the farm household data. Eachland management unit was evaluated for theirpotentials and limitations based on the inherentsoil characteristics, benefit cost ratio and netreturn. Data collected on farm household fromthe land units and crops grown in the districtfor last ten years have been analyzed for thepreparation of crop inventory grown in theseland units, their suitability evaluation,delineation of crop intensity/efficiency zone,yield gap analysis and categorization of land.
The distribution of crop acreage in the districtduring last ten years (1999-2000 to 2008-09)indicated that soybean (18.13%), maize(15.11%) and paddy (10.06%) are predomi-nantly grown during kharif whereas wheat(40.82%), mustard (31.46%) followed bygram (4.66%) are major crops in rabi season.

AN
NU
AL R
EP
OR
T 2
011-1
2
85
Land Evaluation and Land Use Planning
Table 33. Yield gap analysis of land units in Bundi district.
Land Unit Description of land units Crops Yield at Yield Gap
(LU) farmers
Soils Land Use fields
———kg per ha———
2 Shallow (<50), Loamy skeletal & 3-8% Agriculture Mustard 2030 (-) 776
slope with LGP of 90-105 days Wheat 3818 (-) 562
5 Shallow (<50), Loamy skeletal & 8-15% Ravinous Mustard 1250 (-) 1556
slope with LGP of 90-105 days Wheat 3750 (-) 630
7 Shallow (<50 cm), loamy-skeletal on 8-15% Open scrub Wheat 3400 (-) 980
slope with LGP of 90-105 days with agriculture Mustard 1600 (-) 1206
14 Shallow (<50 cm), loamy on 3-8 % Agriculture Mustard 1250 (-) 1556
slope with LGP of 105-120 days Wheat 3337 (-) 1043
15 Shallow (<50 cm), loamy on 3-8 % Open scrub Soybean 860 (-) 1280
slope with LGP of 105-120 days with agriculture Mustard 1877 (-) 929
Wheat 4170 (-) 210
19 Medium (50-100 cm), fine-loamy on Agriculture Mustard 1520 (-) 1286
<3% slope with LGP of 105-135 days Wheat 3977 (-) 403
20 Medium (50-100 cm), fine-loamy on Open scrub Soybean 1960 (-) 180
<3% slope with LGP of 105-135 days with agriculture Mustard 1880 (-) 926
Wheat 4280 (-) 100
30 Deep (>100 cm), fine-loamy on <3% Agriculture Paddy 3770 (-) 430
slope with LGP of 120-135days Soybean 1570 (-) 570
Wheat 4230 (-) 150
31 Deep (>100 cm), fine-loamy on <3% Open scrub Mustard 1650 (-) 1156
slope with LGP of 120-135days with agriculture Wheat 4510 (+) 130
34 Deep (>100 cm), fine-loamy on 3-8% Ravinous Soybean 860 (-) 1280
slope with LGP of 105-135days Wheat 2950 (-) 1430
35 Deep (>100 cm), fine-loamy on 3-8% Agriculture Soybean 1530 (-) 610
slope with LGP of 105-135days Mustard 1290 (-)1516
Wheat 3900 (-)480
37 Deep (>100 cm), fine-loamy on 8-15% Ravinous Mustard 1560 (-) 1246
slope with LGP of 120-135days Wheat 3130 (-) 1250
41 Deep (>100 cm), fine on <3% Ravinous Soybean 1070 (-)1070
slope with LGP of 120-135days Coriander 1500 (+) 192
Wheat 3880 (-) 500
42 Deep (>100 cm), fine on <3% Agriculture Soybean 1560 (-) 580
slope with LGP of 120-135days Wheat 3940 (-) 440
44 Deep (>100 cm), fine on 3-8% Ravinous Coriander 1450 (+) 142
slope with LGP of 120-135days Wheat 3330 (-) 1050
49 Rock outcrops on 3-8% slope Open scrub Mustard 1250 (-) 1556
with LGP of 90-105days with agriculture Wheat 2735 (-) 1645
(>30q/ha), moderately suitable land (20-30q/ha) and marginal land (<20q/ha). Accordingly,land units of the district have been grouped inthese classes (Fig. 63). Productivity of crops
grown in the district ranged between 13.2 q/ha for gravelly shallow soils associated withrock outcrops and 36.0 q/ha on deep, fineloamy soils.
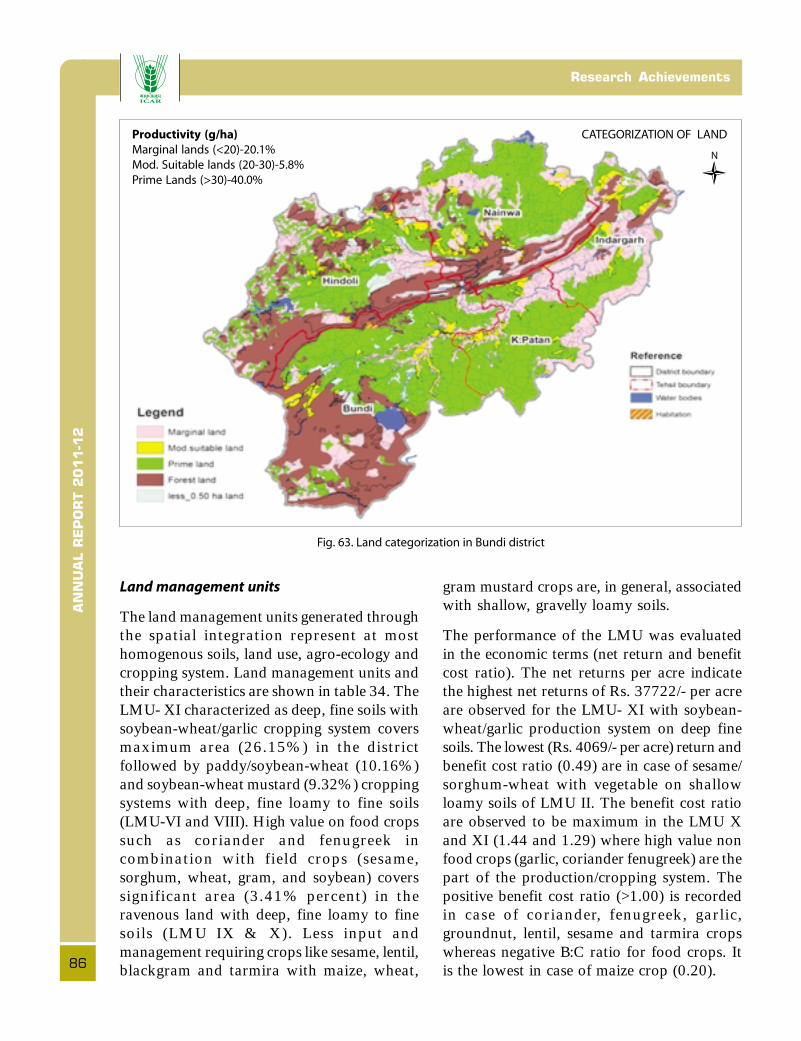
AN
NU
AL R
EP
OR
T 2
011-1
2Research Achievements
86
Land management units
The land management units generated throughthe spatial integration represent at mosthomogenous soils, land use, agro-ecology andcropping system. Land management units andtheir characteristics are shown in table 34. TheLMU- XI characterized as deep, fine soils withsoybean-wheat/garlic cropping system coversmaximum area (26.15%) in the districtfollowed by paddy/soybean-wheat (10.16%)and soybean-wheat mustard (9.32%) croppingsystems with deep, fine loamy to fine soils(LMU-VI and VIII). High value on food cropssuch as coriander and fenugreek incombination with field crops (sesame,sorghum, wheat, gram, and soybean) coverssignificant area (3.41% percent) in theravenous land with deep, fine loamy to finesoils (LMU IX & X). Less input andmanagement requiring crops like sesame, lentil,blackgram and tarmira with maize, wheat,
gram mustard crops are, in general, associatedwith shallow, gravelly loamy soils.
The performance of the LMU was evaluatedin the economic terms (net return and benefitcost ratio). The net returns per acre indicatethe highest net returns of Rs. 37722/- per acreare observed for the LMU- XI with soybean-wheat/garlic production system on deep finesoils. The lowest (Rs. 4069/- per acre) return andbenefit cost ratio (0.49) are in case of sesame/sorghum-wheat with vegetable on shallowloamy soils of LMU II. The benefit cost ratioare observed to be maximum in the LMU Xand XI (1.44 and 1.29) where high value nonfood crops (garlic, coriander fenugreek) are thepart of the production/cropping system. Thepositive benefit cost ratio (>1.00) is recordedin case of coriander, fenugreek, garlic,groundnut, lentil, sesame and tarmira cropswhereas negative B:C ratio for food crops. Itis the lowest in case of maize crop (0.20).
Fig. 63. Land categorization in Bundi district
CATEGORIZATION OF LANDProductivity (g/ha)
Marginal lands (<20)-20.1%
Mod. Suitable lands (20-30)-5.8%
Prime Lands (>30)-40.0%

AN
NU
AL R
EP
OR
T 2
011-1
2
87
Land Evaluation and Land Use PlanningTa
ble
34
. Dis
trib
uti
on
of
lan
d m
an
ag
em
en
t u
nit
s (L
MU
) in
Bu
nd
i dis
tric
t.
LMU
Lan
dD
esc
rip
tio
nLa
nd
Use
Pro
du
ctio
n S
yste
mA
rea
(h
a)
Targ
et
teh
sil
Un
it&
Pe
r ce
nt
(Pe
r c
en
t e
xte
nt
of
LMU
in t
eh
sil)
I2
, 5, 6
,S
ha
llow
(<
50
cm
), l
oa
my-
ske
leta
l o
n 3
-8A
gri
cult
ure
/Op
en
Ma
ize
/bla
ckg
ram
/se
sam
e-
31
68
4H
ind
oli
(59
.2),
Na
inw
a (
28
.0)
7, 4
9a
nd
8-1
5%
slo
pe
wit
h L
GP
of
90
-10
5 d
ays
scru
b w
ith
wh
ea
t/m
ust
ard
/le
nti
l/g
ram
(5.4
4)
Ind
arg
arh
(1
0.1
), B
un
di
(2.4
)
ag
ricu
ltu
re/r
av
ine
s
II1
4S
ha
llow
(<
50
cm
), lo
am
y o
n 3
-8 %
Ag
ricu
ltu
reS
esa
me
/so
rgh
um
-wh
ea
t/1
16
60
Bu
nd
i (3
1.7
), N
ain
wa
(2
4.7
),
slo
pe
wit
h L
GP
of
10
5-1
20
da
ysp
ap
aya
/oth
er
ve
g.
(2.0
0)
Ind
arg
arh
(2
1.4
), H
ind
oli
(16
.5),
Ke
sho
raip
ata
n (
5.8
)
III1
5S
ha
llow
(<
50
cm
), lo
am
y o
n 3
-8 %
slo
pe
Op
en
scr
ub
Ma
ize
/so
rgh
um
/se
sam
e-
24
59
5B
un
di (
39
.4),
) N
ain
wa
(3
8.0
),
wit
h L
GP
of
10
5-1
20
da
ysw
ith
ag
ricu
ltu
rew
he
at/
len
til/
mu
sta
rd(4
.23
)H
ind
oli
(20
.5),
In
da
rga
rh (
2.2
)
IV1
9M
ed
ium
(5
0-1
00
cm
), f
ine
-lo
am
y o
nA
gri
cult
ure
Ma
ize
/bla
ckg
ram
/so
rgh
um
-1
14
65
Na
inw
a (
87
.9),
In
da
rga
rh (
10
.2),
<3
% s
lop
e w
ith
LG
P o
f 1
05
-13
5 d
ays
wh
ea
t/le
nti
l/m
ust
ard
(1.9
7)
Bu
nd
i (1
.9)
V2
0M
ed
ium
(5
0-1
00
cm
), f
ine
-lo
am
y o
nO
pe
n s
cru
b w
ith
Ma
ize
/so
ybe
an
/se
sam
e/
55
77
Bu
nd
i (9
7.9
), N
ain
wa
(2
.1)
<3
% s
lop
e w
ith
LG
P o
f 1
05
-13
5 d
ays
ag
ricu
ltu
reG
rou
nd
nu
t/w
he
at/
gra
m/
(0.9
6)
mu
sta
rd/t
ara
mir
a/p
ota
to/g
arl
ic
VI
30
De
ep
(>
10
0 c
m),
fin
e-l
oa
my
on
<3
%A
gri
cult
ure
Pa
dd
y/s
oy
be
an
-wh
ea
t5
88
49
Na
inw
a (
34
.8),
Hin
do
li (3
4.3
),
slo
pe
wit
h L
GP
of
12
0-1
35
da
ys(1
0.1
1)
Bu
nd
i (2
4.4
), I
nd
arg
arh
(6
.3),
VII
31
De
ep
(>
10
0 c
m),
fin
e-l
oa
my
on
<3
%O
pe
n s
cru
b w
ith
Ma
ize
-Wh
ea
t/m
ust
ard
/le
nti
l1
53
76
Hin
do
li (9
1.6
), N
ain
wa
(8
.4)
slo
pe
wit
h L
GP
of
12
0-1
35
da
ysa
gri
cult
ure
(2.6
4)
VIII
34
&D
ee
p (
>1
00
cm
), f
ine
-lo
am
y o
n 3
-8%
Rav
ino
us
&S
oyb
ea
n-w
he
at/
mu
sta
rd5
32
22
Ke
sho
raip
ata
n (
31
.6),
In
da
rga
rh
35
slo
pe
wit
h L
GP
of
10
5-1
35
da
ysA
gri
cult
ure
(9.1
5)
(27
.5),
Bu
nd
i (2
6.0
), N
ain
wa
(9
.1),
Hin
do
li (5
.9)
IX3
7 &
De
ep
(>
10
0 c
m),
fin
e-l
oa
my/
fin
e o
n 3
-8R
avin
ou
sS
esa
me
/so
rgh
um
-wh
ea
t/9
32
2In
da
rga
rh (
70
.1),
Ke
sho
raip
ata
n
44
an
d 8
-15
% s
lop
e w
ith
LG
P o
f 1
20
-13
5d
ays
gra
m/f
en
ug
ree
k/co
ria
nd
er
(1.6
0)
(25
.6),
Bu
nd
i (4
.3),
X4
1D
ee
p (
>1
00
cm
), f
ine
on
<3
%R
avin
ou
sS
oyb
ea
n/s
esa
me
-wh
ea
t/8
87
9In
da
rga
rh (
54
.7),
Ke
sho
raip
ata
n
slo
pe
wit
h L
GP
of
12
0-1
35
da
ysco
ria
nd
er/
fen
ug
ree
k/g
ram
(1.5
3)
(3
1.0
) ),
Hin
do
li (8
.4),
Bu
nd
i (5
.5)
XI
42
De
ep
(>
10
0 c
m),
fin
e o
n <
3%
Ag
ricu
ltu
reS
oyb
ea
n-w
he
at/
ga
rlic
14
78
30
Bu
nd
i (3
4.4
), K
esh
ora
ipa
tan
slo
pe
wit
h L
GP
of
12
0-1
35
da
ys(2
6.4
3)
(28
.5)
, Na
inw
a (
25
.2),
In
da
rga
rh
(10
.3),
Hin
do
li (1
.6),
Fore
stA
ny
Fore
st1
57
42
(26
.93
)
LU <
0.5
% A
rea
An
yA
ny
An
y2
05
86
(3.5
4)
Ha
bit
ati
on
(0
.67
%)
an
d W
ate
r b
od
ies
(2.8
1%
)
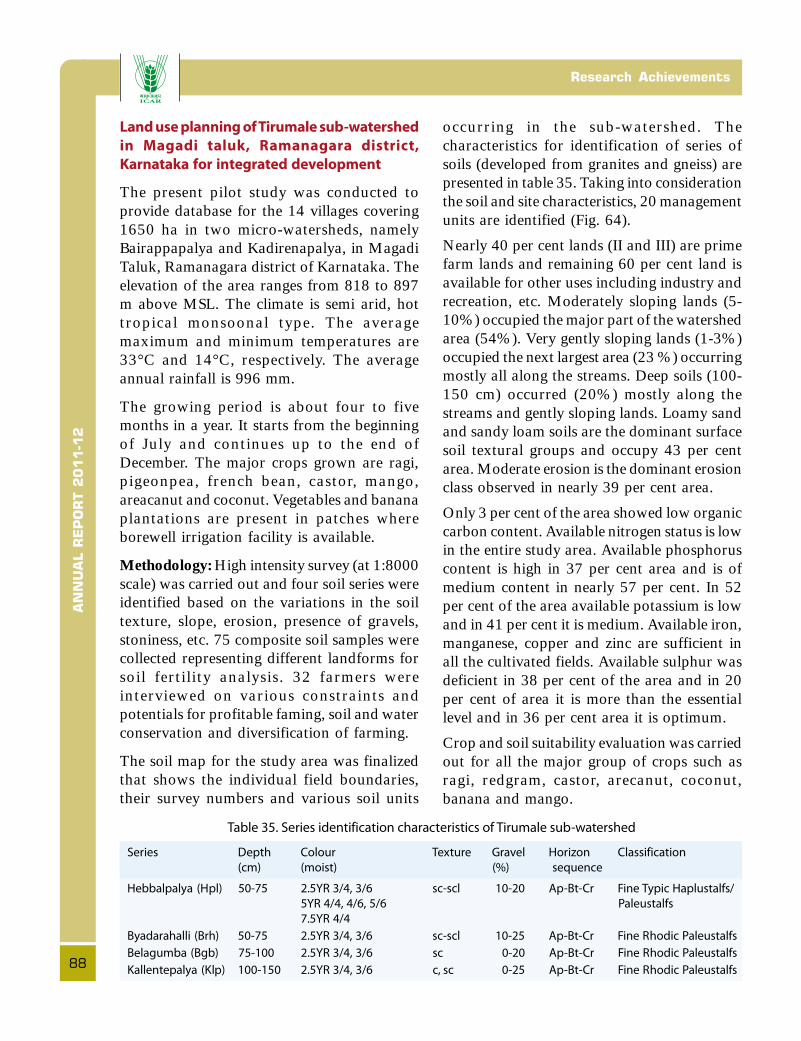
AN
NU
AL R
EP
OR
T 2
011-1
2Research Achievements
88
Land use planning of Tirumale sub-watershed
in Magadi taluk, Ramanagara district,
Karnataka for integrated development
The present pilot study was conducted toprovide database for the 14 villages covering1650 ha in two micro-watersheds, namelyBairappapalya and Kadirenapalya, in MagadiTaluk, Ramanagara district of Karnataka. Theelevation of the area ranges from 818 to 897m above MSL. The climate is semi arid, hottropical monsoonal type. The averagemaximum and minimum temperatures are33°C and 14°C, respectively. The averageannual rainfall is 996 mm.
The growing period is about four to fivemonths in a year. It starts from the beginningof July and continues up to the end ofDecember. The major crops grown are ragi,pigeonpea, french bean, castor, mango,areacanut and coconut. Vegetables and bananaplantations are present in patches whereborewell irrigation facility is available.
Methodology: High intensity survey (at 1:8000scale) was carried out and four soil series wereidentified based on the variations in the soiltexture, slope, erosion, presence of gravels,stoniness, etc. 75 composite soil samples werecollected representing different landforms forsoil fertility analysis. 32 farmers wereinterviewed on various constraints andpotentials for profitable faming, soil and waterconservation and diversification of farming.
The soil map for the study area was finalizedthat shows the individual field boundaries,their survey numbers and various soil units
occurring in the sub-watershed. Thecharacteristics for identification of series ofsoils (developed from granites and gneiss) arepresented in table 35. Taking into considerationthe soil and site characteristics, 20 managementunits are identified (Fig. 64).
Nearly 40 per cent lands (II and III) are primefarm lands and remaining 60 per cent land isavailable for other uses including industry andrecreation, etc. Moderately sloping lands (5-10%) occupied the major part of the watershedarea (54%). Very gently sloping lands (1-3%)occupied the next largest area (23 %) occurringmostly all along the streams. Deep soils (100-150 cm) occurred (20%) mostly along thestreams and gently sloping lands. Loamy sandand sandy loam soils are the dominant surfacesoil textural groups and occupy 43 per centarea. Moderate erosion is the dominant erosionclass observed in nearly 39 per cent area.
Only 3 per cent of the area showed low organiccarbon content. Available nitrogen status is lowin the entire study area. Available phosphoruscontent is high in 37 per cent area and is ofmedium content in nearly 57 per cent. In 52per cent of the area available potassium is lowand in 41 per cent it is medium. Available iron,manganese, copper and zinc are sufficient inall the cultivated fields. Available sulphur wasdeficient in 38 per cent of the area and in 20per cent of area it is more than the essentiallevel and in 36 per cent area it is optimum.
Crop and soil suitability evaluation was carriedout for all the major group of crops such asragi, redgram, castor, arecanut, coconut,banana and mango.
Table 35. Series identification characteristics of Tirumale sub-watershed
Series Depth Colour Texture Gravel Horizon Classification
(cm) (moist) (%) sequence
Hebbalpalya (Hpl) 50-75 2.5YR 3/4, 3/6 sc-scl 10-20 Ap-Bt-Cr Fine Typic Haplustalfs/
5YR 4/4, 4/6, 5/6 Paleustalfs
7.5YR 4/4
Byadarahalli (Brh) 50-75 2.5YR 3/4, 3/6 sc-scl 10-25 Ap-Bt-Cr Fine Rhodic Paleustalfs
Belagumba (Bgb) 75-100 2.5YR 3/4, 3/6 sc 0-20 Ap-Bt-Cr Fine Rhodic Paleustalfs
Kallentepalya (Klp) 100-150 2.5YR 3/4, 3/6 c, sc 0-25 Ap-Bt-Cr Fine Rhodic Paleustalfs

AN
NU
AL R
EP
OR
T 2
011-1
2
89
Land Evaluation and Land Use Planning
Fig. 64. Soils of Tirumale sub-watershed
SOILS
Tirumale Sub-watershed
Magadi Taluk, Ramnagar District

AN
NU
AL R
EP
OR
T 2
011-1
2Research Achievements
90
III. Impact of land use change on soil
properties
• Compared to rice-wheat areas decreasein pH in hilly areas was less.
• EC of surface soils decreased in ricewheat area the increase in sub-surfacesoils, may be due to addition offertilisers.
• Water quality was good for irrigationpurpose in most of soils.
• Underground water table is decreasingat an alarming rate of one meter perannum in rice wheat areas whichrequire immediate attention. Changein land use or delay in transplantingtime coinciding with onset ofmonsoon could arrest the fall in watertable.
It is observed that there is perceptiblechange in land use/cropping pattern in thedistrict during the last 4 to 5 decades. Ricecrop has replaced maize and sugarcane. Itresulted in change of soil properties resultingin increase in OC and EC in surface soils,decrease of soil pH in surface soils, increase ofsoil bulk density in sub surface layerimmediately below the plough layer. Theharmful effects of high bulk density insub surface soils may hinder proper soilaeration-water-plant continuum resulting inless yield of wheat crop. However, build upof OC and decrease of pH in surface soilsand leaching of CaCO3 in lower depths aregood signs to improve the soil quality.Lowering of underground water table atalarming rate of about 1 meter per annumis a real threat in the future for agriculture inthe district for which pro- active measuresshould be taken which may be either bychanging land use or by delaying thetransplanting time coinciding with the onsetof monsoon.
Dynamics of land use and its impact on soil
properties in Nawanshahr district, Punjab
state
The present study was undertaken inNawanshahr (Now Shahid Bhagat SinghNagar) district of Punjab state, with thefollowing objectives, (i) to prepare the charterof soil information; (ii) to know the type andextent of land use/cropping systems changes;(iii) impact of change of land use/croppingsystem on soil qualities/health and soildevelopment and (iv) to chalk out options forcrop diversification for betterment of farmers.Significant achievements of the project aregiven below:
I. Trend of land use change
The land use in the district has changeddrastically from the year 1959 to 2006-07(Table 36).
Table 36. Trend of Land use change
Crop Area (%) Area (%) % increase/
(1959) (2006-2007) decrease
Rice 9 40 (+) 31
Maize 42 11 (-) 31
Sugarcane 18 4 (-) 14
Wheat 78 45 (-) 33
The reason of change of cropping system ismore mainly out of economic considerationsand shut down of some sugar mills.
II. Soil resources
• The soil map was prepared andnineteen soil series have been identifiedand mapped into 21 soil seriesassociations as map units which havebeen grouped under 3 Soil Orders, 7sub-orders, 7 Great groups, and 10 Subgroups.
• Entisols occupy maximum area(57.8%) followed by Inceptisols(32.1%) and Alfisols (8.6%).
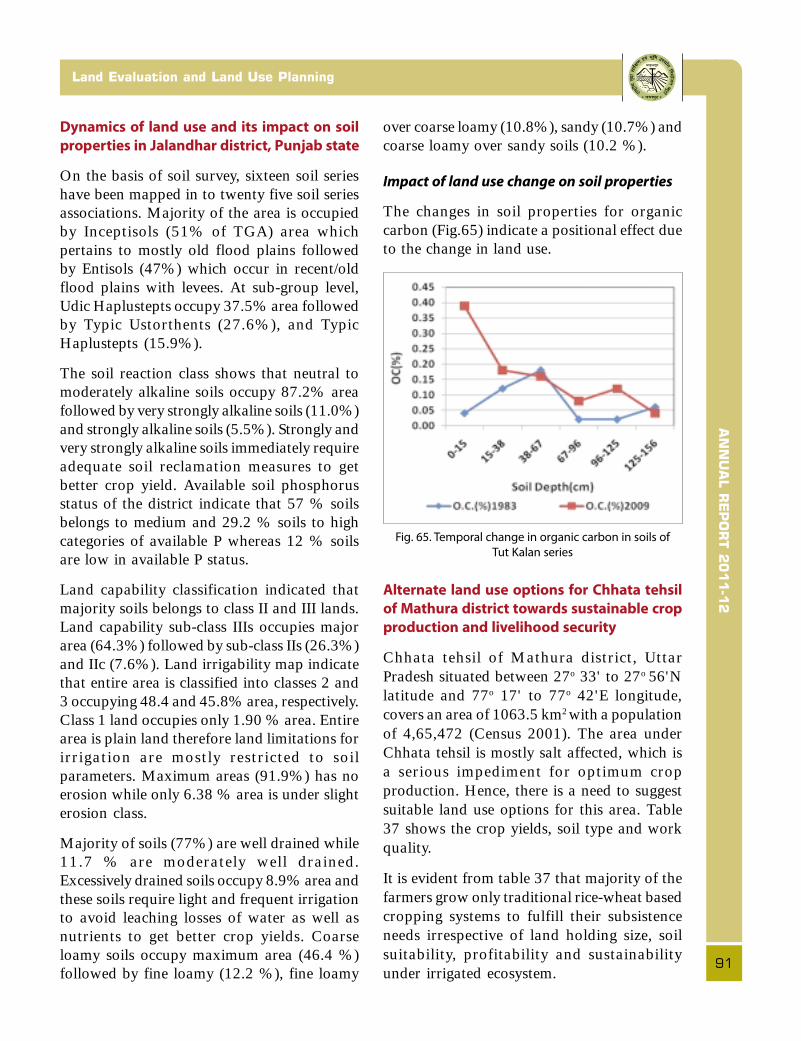
AN
NU
AL R
EP
OR
T 2
011-1
2
91
Land Evaluation and Land Use Planning
Dynamics of land use and its impact on soil
properties in Jalandhar district, Punjab state
On the basis of soil survey, sixteen soil serieshave been mapped in to twenty five soil seriesassociations. Majority of the area is occupiedby Inceptisols (51% of TGA) area whichpertains to mostly old flood plains followedby Entisols (47%) which occur in recent/oldflood plains with levees. At sub-group level,Udic Haplustepts occupy 37.5% area followedby Typic Ustorthents (27.6%), and TypicHaplustepts (15.9%).
The soil reaction class shows that neutral tomoderately alkaline soils occupy 87.2% areafollowed by very strongly alkaline soils (11.0%)and strongly alkaline soils (5.5%). Strongly andvery strongly alkaline soils immediately requireadequate soil reclamation measures to getbetter crop yield. Available soil phosphorusstatus of the district indicate that 57 % soilsbelongs to medium and 29.2 % soils to highcategories of available P whereas 12 % soilsare low in available P status.
Land capability classification indicated thatmajority soils belongs to class II and III lands.Land capability sub-class IIIs occupies majorarea (64.3%) followed by sub-class IIs (26.3%)and IIc (7.6%). Land irrigability map indicatethat entire area is classified into classes 2 and3 occupying 48.4 and 45.8% area, respectively.Class 1 land occupies only 1.90 % area. Entirearea is plain land therefore land limitations forirrigation are mostly restricted to soilparameters. Maximum areas (91.9%) has noerosion while only 6.38 % area is under slighterosion class.
Majority of soils (77%) are well drained while11.7 % are moderately well drained.Excessively drained soils occupy 8.9% area andthese soils require light and frequent irrigationto avoid leaching losses of water as well asnutrients to get better crop yields. Coarseloamy soils occupy maximum area (46.4 %)followed by fine loamy (12.2 %), fine loamy
over coarse loamy (10.8%), sandy (10.7%) andcoarse loamy over sandy soils (10.2 %).
Impact of land use change on soil properties
The changes in soil properties for organiccarbon (Fig.65) indicate a positional effect dueto the change in land use.
Fig. 65. Temporal change in organic carbon in soils of
Tut Kalan series
Alternate land use options for Chhata tehsil
of Mathura district towards sustainable crop
production and livelihood security
Chhata tehsil of Mathura district, UttarPradesh situated between 27o 33' to 27o 56'Nlatitude and 77o 17' to 77o 42'E longitude,covers an area of 1063.5 km2 with a populationof 4,65,472 (Census 2001). The area underChhata tehsil is mostly salt affected, which isa serious impediment for optimum cropproduction. Hence, there is a need to suggestsuitable land use options for this area. Table37 shows the crop yields, soil type and workquality.
It is evident from table 37 that majority of thefarmers grow only traditional rice-wheat basedcropping systems to fulfill their subsistenceneeds irrespective of land holding size, soilsuitability, profitability and sustainabilityunder irrigated ecosystem.
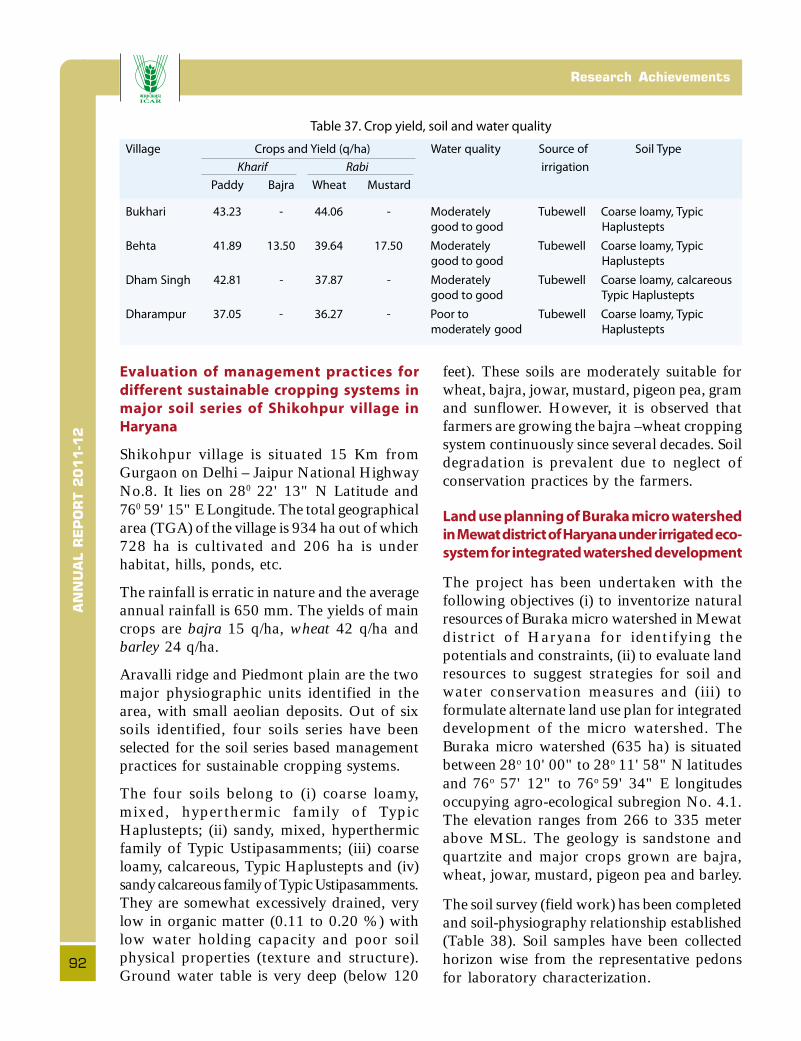
AN
NU
AL R
EP
OR
T 2
011-1
2Research Achievements
92
Evaluation of management practices for
different sustainable cropping systems in
major soil series of Shikohpur village in
Haryana
Shikohpur village is situated 15 Km fromGurgaon on Delhi – Jaipur National HighwayNo.8. It lies on 280 22' 13" N Latitude and760 59' 15" E Longitude. The total geographicalarea (TGA) of the village is 934 ha out of which728 ha is cultivated and 206 ha is underhabitat, hills, ponds, etc.
The rainfall is erratic in nature and the averageannual rainfall is 650 mm. The yields of maincrops are bajra 15 q/ha, wheat 42 q/ha andbarley 24 q/ha.
Aravalli ridge and Piedmont plain are the twomajor physiographic units identified in thearea, with small aeolian deposits. Out of sixsoils identified, four soils series have beenselected for the soil series based managementpractices for sustainable cropping systems.
The four soils belong to (i) coarse loamy,mixed, hyperthermic family of TypicHaplustepts; (ii) sandy, mixed, hyperthermicfamily of Typic Ustipasamments; (iii) coarseloamy, calcareous, Typic Haplustepts and (iv)sandy calcareous family of Typic Ustipasamments.They are somewhat excessively drained, verylow in organic matter (0.11 to 0.20 %) withlow water holding capacity and poor soilphysical properties (texture and structure).Ground water table is very deep (below 120
feet). These soils are moderately suitable forwheat, bajra, jowar, mustard, pigeon pea, gramand sunflower. However, it is observed thatfarmers are growing the bajra –wheat croppingsystem continuously since several decades. Soildegradation is prevalent due to neglect ofconservation practices by the farmers.
Land use planning of Buraka micro watershed
in Mewat district of Haryana under irrigated eco-
system for integrated watershed development
The project has been undertaken with thefollowing objectives (i) to inventorize naturalresources of Buraka micro watershed in Mewatdistrict of Haryana for identifying thepotentials and constraints, (ii) to evaluate landresources to suggest strategies for soil andwater conservation measures and (iii) toformulate alternate land use plan for integrateddevelopment of the micro watershed. TheBuraka micro watershed (635 ha) is situatedbetween 28o 10' 00" to 28o 11' 58" N latitudesand 76o 57' 12" to 76o 59' 34" E longitudesoccupying agro-ecological subregion No. 4.1.The elevation ranges from 266 to 335 meterabove MSL. The geology is sandstone andquartzite and major crops grown are bajra,wheat, jowar, mustard, pigeon pea and barley.
The soil survey (field work) has been completedand soil-physiography relationship established(Table 38). Soil samples have been collectedhorizon wise from the representative pedonsfor laboratory characterization.
Table 37. Crop yield, soil and water quality
Village Crops and Yield (q/ha) Water quality Source of Soil Type
Kharif Rabi irrigation
Paddy Bajra Wheat Mustard
Bukhari 43.23 - 44.06 - Moderately Tubewell Coarse loamy, Typic
good to good Haplustepts
Behta 41.89 13.50 39.64 17.50 Moderately Tubewell Coarse loamy, Typic
good to good Haplustepts
Dham Singh 42.81 - 37.87 - Moderately Tubewell Coarse loamy, calcareous
good to good Typic Haplustepts
Dharampur 37.05 - 36.27 - Poor to Tubewell Coarse loamy, Typic
moderately good Haplustepts
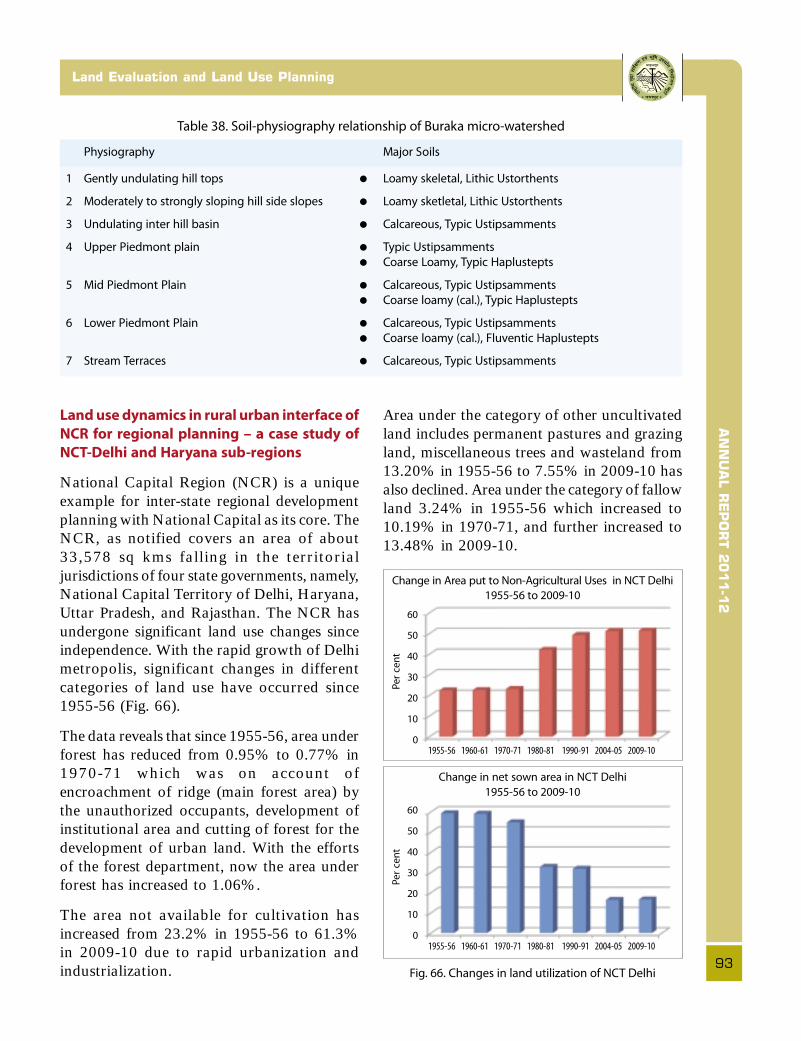
AN
NU
AL R
EP
OR
T 2
011-1
2
93
Land Evaluation and Land Use Planning
Land use dynamics in rural urban interface of
NCR for regional planning – a case study of
NCT-Delhi and Haryana sub-regions
National Capital Region (NCR) is a uniqueexample for inter-state regional developmentplanning with National Capital as its core. TheNCR, as notified covers an area of about33,578 sq kms falling in the territorialjurisdictions of four state governments, namely,National Capital Territory of Delhi, Haryana,Uttar Pradesh, and Rajasthan. The NCR hasundergone significant land use changes sinceindependence. With the rapid growth of Delhimetropolis, significant changes in differentcategories of land use have occurred since1955-56 (Fig. 66).
The data reveals that since 1955-56, area underforest has reduced from 0.95% to 0.77% in1970-71 which was on account ofencroachment of ridge (main forest area) bythe unauthorized occupants, development ofinstitutional area and cutting of forest for thedevelopment of urban land. With the effortsof the forest department, now the area underforest has increased to 1.06%.
The area not available for cultivation hasincreased from 23.2% in 1955-56 to 61.3%in 2009-10 due to rapid urbanization andindustrialization.
Area under the category of other uncultivatedland includes permanent pastures and grazingland, miscellaneous trees and wasteland from13.20% in 1955-56 to 7.55% in 2009-10 hasalso declined. Area under the category of fallowland 3.24% in 1955-56 which increased to10.19% in 1970-71, and further increased to13.48% in 2009-10.
Table 38. Soil-physiography relationship of Buraka micro-watershed
Physiography Major Soils
1 Gently undulating hill tops • Loamy skeletal, Lithic Ustorthents
2 Moderately to strongly sloping hill side slopes • Loamy sketletal, Lithic Ustorthents
3 Undulating inter hill basin • Calcareous, Typic Ustipsamments
4 Upper Piedmont plain • Typic Ustipsamments
• Coarse Loamy, Typic Haplustepts
5 Mid Piedmont Plain • Calcareous, Typic Ustipsamments
• Coarse loamy (cal.), Typic Haplustepts
6 Lower Piedmont Plain • Calcareous, Typic Ustipsamments
• Coarse loamy (cal.), Fluventic Haplustepts
7 Stream Terraces • Calcareous, Typic Ustipsamments
Fig. 66. Changes in land utilization of NCT Delhi
Change in Area put to Non-Agricultural Uses in NCT Delhi
1955-56 to 2009-10
60
50
40
30
20
10
0
1955-56 1960-61 1970-71 1980-81 1990-91 2004-05 2009-10
Pe
r c
en
t
Change in net sown area in NCT Delhi
1955-56 to 2009-10
60
50
40
30
20
10
0
1955-56 1960-61 1970-71 1980-81 1990-91 2004-05 2009-10
Pe
r c
en
t

AN
NU
AL R
EP
OR
T 2
011-1
2Research Achievements
94
Area under net sown category was 59.32%which declined to 32.79% in 1990-91 and16.63% in 2009-10. Reduction of net sownarea at a significant rate is on account ofgrowing population, industrial and commercialactivities.
Land use planning of Diring-Thanglong
micro-watershed of Karbi-Anglong and
Golaghat districts of Assam under hill and
mountain ecosystem for integrated
development
The project has following objectives (i) toprepare the inventory of natural resources ofthe micro-watershed, (ii) to identify thepotentials and constraints, (iii) to evaluate landresources to suggest strategies for soil andwater conservation measures and (iv) toformulate alternate land use options forintegrated development of the micro
watershed. The detailed methodology of soilsurvey is shown in figure 67.
Eight land use-land cover units have beenidentified in the watershed (Fig. 68). It wasobserved that 54.1% area of the watershed wasunder forest cover, whereas 18.5% of area wasunder cultivation. Area under tea and rubberplantation were 13.8% and 3.0%, respectively,whereas, homestead orchards plantationcovered 7.8% of area and only 2.8% of areawas under shifting cultivation. The watershedhas 5th order complex drainage system withboth parallel and dendritic pattern. Ten soilseries were recognized in the watershed withfifteen mapping units as phases of series basedon slope, erosion and surface texture of soils.The soils developed on piedmonts and gentlysloping uplands belong to Ultisols and thosedeveloped on plains were classified asInceptisols
Fig. 67. Methodology of Soil Survey of Diring-Thanglong Micro-watershed
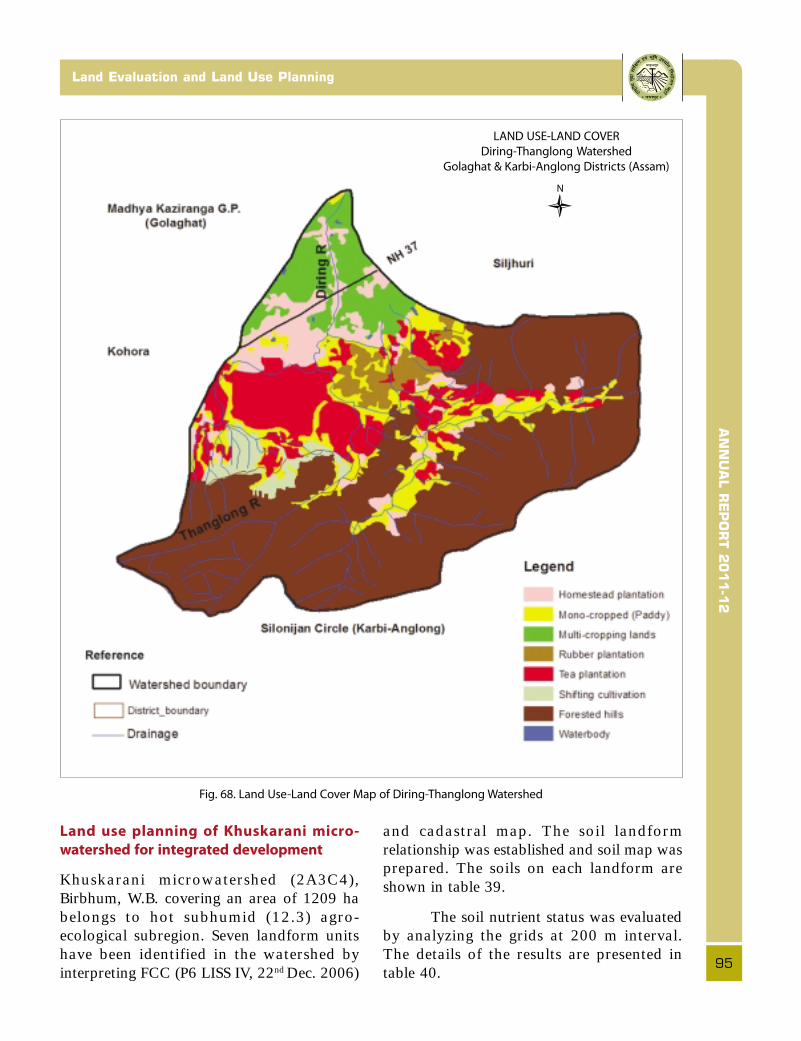
AN
NU
AL R
EP
OR
T 2
011-1
2
95
Land Evaluation and Land Use Planning
Land use planning of Khuskarani micro-
watershed for integrated development
Khuskarani microwatershed (2A3C4),Birbhum, W.B. covering an area of 1209 habelongs to hot subhumid (12.3) agro-ecological subregion. Seven landform unitshave been identified in the watershed byinterpreting FCC (P6 LISS IV, 22nd Dec. 2006)
Fig. 68. Land Use-Land Cover Map of Diring-Thanglong Watershed
and cadastral map. The soil landformrelationship was established and soil map wasprepared. The soils on each landform areshown in table 39.
The soil nutrient status was evaluatedby analyzing the grids at 200 m interval.The details of the results are presented intable 40.
LAND USE-LAND COVER
Diring-Thanglong Watershed
Golaghat & Karbi-Anglong Districts (Assam)
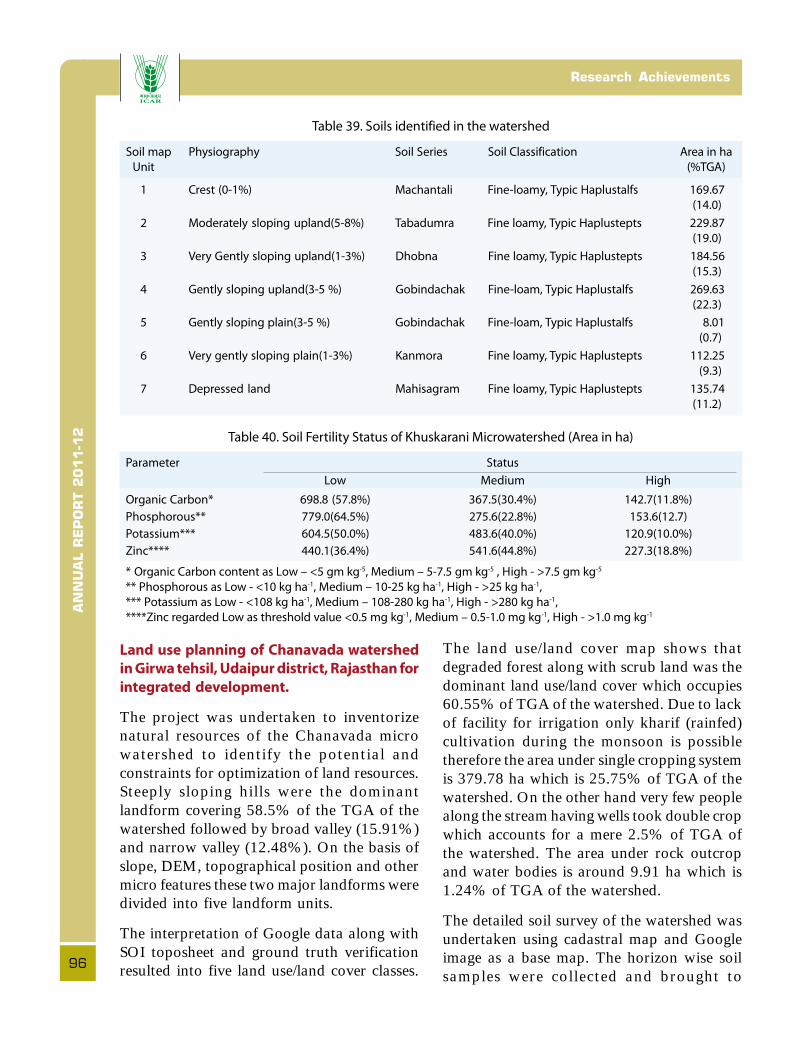
AN
NU
AL R
EP
OR
T 2
011-1
2Research Achievements
96
Table 39. Soils identified in the watershed
Soil map Physiography Soil Series Soil Classification Area in ha
Unit (%TGA)
1 Crest (0-1%) Machantali Fine-loamy, Typic Haplustalfs 169.67
(14.0)
2 Moderately sloping upland(5-8%) Tabadumra Fine loamy, Typic Haplustepts 229.87
(19.0)
3 Very Gently sloping upland(1-3%) Dhobna Fine loamy, Typic Haplustepts 184.56
(15.3)
4 Gently sloping upland(3-5 %) Gobindachak Fine-loam, Typic Haplustalfs 269.63
(22.3)
5 Gently sloping plain(3-5 %) Gobindachak Fine-loam, Typic Haplustalfs 8.01
(0.7)
6 Very gently sloping plain(1-3%) Kanmora Fine loamy, Typic Haplustepts 112.25
(9.3)
7 Depressed land Mahisagram Fine loamy, Typic Haplustepts 135.74
(11.2)
Table 40. Soil Fertility Status of Khuskarani Microwatershed (Area in ha)
Parameter Status
Low Medium High
Organic Carbon* 698.8 (57.8%) 367.5(30.4%) 142.7(11.8%)
Phosphorous** 779.0(64.5%) 275.6(22.8%) 153.6(12.7)
Potassium*** 604.5(50.0%) 483.6(40.0%) 120.9(10.0%)
Zinc**** 440.1(36.4%) 541.6(44.8%) 227.3(18.8%)
* Organic Carbon content as Low – <5 gm kg-5, Medium – 5-7.5 gm kg-5 , High - >7.5 gm kg-5
** Phosphorous as Low - <10 kg ha-1, Medium – 10-25 kg ha-1, High - >25 kg ha-1,
*** Potassium as Low - <108 kg ha-1, Medium – 108-280 kg ha-1, High - >280 kg ha-1,
****Zinc regarded Low as threshold value <0.5 mg kg-1, Medium – 0.5-1.0 mg kg-1, High - >1.0 mg kg-1
Land use planning of Chanavada watershed
in Girwa tehsil, Udaipur district, Rajasthan for
integrated development.
The project was undertaken to inventorizenatural resources of the Chanavada microwatershed to identify the potential andconstraints for optimization of land resources.Steeply sloping hills were the dominantlandform covering 58.5% of the TGA of thewatershed followed by broad valley (15.91%)and narrow valley (12.48%). On the basis ofslope, DEM, topographical position and othermicro features these two major landforms weredivided into five landform units.
The interpretation of Google data along withSOI toposheet and ground truth verificationresulted into five land use/land cover classes.
The land use/land cover map shows thatdegraded forest along with scrub land was thedominant land use/land cover which occupies60.55% of TGA of the watershed. Due to lackof facility for irrigation only kharif (rainfed)cultivation during the monsoon is possibletherefore the area under single cropping systemis 379.78 ha which is 25.75% of TGA of thewatershed. On the other hand very few peoplealong the stream having wells took double cropwhich accounts for a mere 2.5% of TGA ofthe watershed. The area under rock outcropand water bodies is around 9.91 ha which is1.24% of TGA of the watershed.
The detailed soil survey of the watershed wasundertaken using cadastral map and Googleimage as a base map. The horizon wise soilsamples were collected and brought to

AN
NU
AL R
EP
OR
T 2
011-1
2
97
Land Evaluation and Land Use Planning
Table 41.Morphological and physico-chemical characteristics of soil series of Chanavada watershed
Horizon Depth Colour Particle-size distribution pH EC CaCO3
OC
(cm) (Moist) (%) (1:2.5) ds/m % %
Sand Silt Clay
Series: Chanavada 1- Very shallow ,loamy skeletal, Lithic Ustorthents (Hill top)
A1 0-9 10YR3/4 40.3 41.1 18.6 6.17 0.10 Nil 2.02
A2 9-17 10YR3/4 34.9 43.0 22.1 6.12 0.04 Nil 1.28
Cr 17+
Series: Chanavada 2 - Moderately shallow, loamy skeletal, Typic Ustorthents (Hill side slope)
A1 0-14 7.5YR4/3 33.5 44.0 22.5 6.09 0.06 Nil 1.92
A2 14-44 10YR4/4 28.7 47.7 23.6 6.48 0.03 Nil 1.20
Cr 44-70 10YR5/3 24.9 56.6 18.5 6.84 0.03 Nil 0.44
Series: Chanavada 3- Moderately deep, loamy skeletal, calcareous, Typic Haplustepts (Foot slope)
Ap 0-14 10YR3/4 48.4 34.0 17.6 7.10 0.19 0.9 1.86
Bw1 14-38 10YR3/4 37.8 38.1 24.0 7.53 0.16 1.4 1.18
Bw2 38-56 10YR3/4 36.8 38.9 24.3 8.42 0.09 1.2 1.07
Bw3 56-75 10YR3/2 38.8 38.0 23.2 8.72 0.15 1.6 0.89
Cr 75-95 10YR4/2 34.2 51.0 14.8 9.21 0.20 2.8 0.42
Series: Chanavada 4 - Deep,loamy skeletal, calcareous ,Typic Haplustepts (Inter hill Valley)
Ap 0-18 10YR4/3 40.0 51.8 8.2 7.55 0.42 1.3 2.26
A1 18-43 10YR3/3 41.7 48.0 10.3 7.40 0.09 1.3 0.63
A2 43-67 10YR3/3 38.1 50.3 11.6 7.16 0.10 0.9 0.50
Bw1 67-100 7.5YR3/4 37.7 46.5 15.8 7.08 0.19 1.2 0.43
Bw2 100-135 7.5YR3/4 33.2 48.0 18.8 7.06 0.18 1.3 0.47
Cr 135+
Series: Chanavada 5 - Very deep, fine, calcareous ,Typic Haplustepts (Narrow Valley)
Ap 0-14 10YR3/3 51.6 34.8 13.6 7.08 0.33 0.9 2.16
Bw1 14-34 7.5YR3/2 48.3 38.5 13.2 7.35 0.12 1.2 1.63
Bw2 34-70 7.5YR3/1 24.0 55.3 20.7 7.91 0.09 2.0 1.24
Bw3 70-105 7.5YR3/1 25.8 56.0 18.2 8.05 0.12 1.6 1.07
Bw4 105-145 10YR4/3 20.2 55.8 23.9 8.26 0.10 1.8 0.92
BC1 145-170 10YR4/3 13.1 62.8 24.1 8.41 0.11 2.2 0.84
BC2 170-200 10YR4/3 16.3 58.9 24.8 8.47 0.16 2.4 0.87
Series: Chanavada 6 - Very deep, loamy skeletal, calcareous Typic Haplustept (Broad Valley)
Ap 0-17 10YR3/3 29.2 53.8 17.0 5.67 0.34 0.7 1.08
Bw1 17-40 10YR3/3 16.8 62.3 20.9 6.59 0.03 1.1 1.12
Bw2 40-70 10YR3/2 24.1 53.7 22.2 7.03 0.03 1.4 1.22
laboratory for physical and chemical charact-erization. After the field correlation, eight soilseries were tentatively identified and mappedin to 18 soil mapping units at the level of phasesof soil series of which Lithic Ustorthents coversmaximum area (53.46%) followed by TypicUstorthents (24.95%). The selected morpholo-gical, physical and chemical properties of
identified soil series of Chanavada watershedare given in table 41. Simultaneously, thewatershed was studied for its socio-economicstatus and it reveals that all the villages weresmall and scattered with very low populationdensity (84/Km2). Overall poor B/C ratio forfarmers for all the crops is due to conventionaland primitive methods of cultivation practices.
cont...
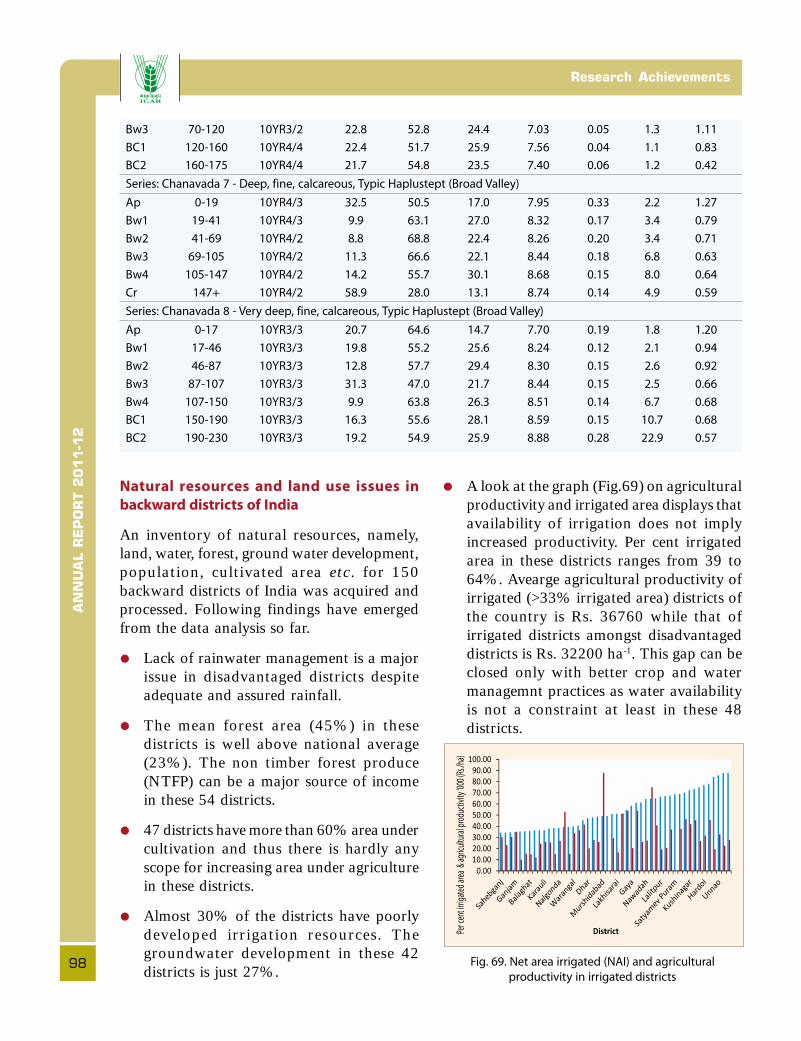
AN
NU
AL R
EP
OR
T 2
011-1
2Research Achievements
98
Bw3 70-120 10YR3/2 22.8 52.8 24.4 7.03 0.05 1.3 1.11
BC1 120-160 10YR4/4 22.4 51.7 25.9 7.56 0.04 1.1 0.83
BC2 160-175 10YR4/4 21.7 54.8 23.5 7.40 0.06 1.2 0.42
Series: Chanavada 7 - Deep, fine, calcareous, Typic Haplustept (Broad Valley)
Ap 0-19 10YR4/3 32.5 50.5 17.0 7.95 0.33 2.2 1.27
Bw1 19-41 10YR4/3 9.9 63.1 27.0 8.32 0.17 3.4 0.79
Bw2 41-69 10YR4/2 8.8 68.8 22.4 8.26 0.20 3.4 0.71
Bw3 69-105 10YR4/2 11.3 66.6 22.1 8.44 0.18 6.8 0.63
Bw4 105-147 10YR4/2 14.2 55.7 30.1 8.68 0.15 8.0 0.64
Cr 147+ 10YR4/2 58.9 28.0 13.1 8.74 0.14 4.9 0.59
Series: Chanavada 8 - Very deep, fine, calcareous, Typic Haplustept (Broad Valley)
Ap 0-17 10YR3/3 20.7 64.6 14.7 7.70 0.19 1.8 1.20
Bw1 17-46 10YR3/3 19.8 55.2 25.6 8.24 0.12 2.1 0.94
Bw2 46-87 10YR3/3 12.8 57.7 29.4 8.30 0.15 2.6 0.92
Bw3 87-107 10YR3/3 31.3 47.0 21.7 8.44 0.15 2.5 0.66
Bw4 107-150 10YR3/3 9.9 63.8 26.3 8.51 0.14 6.7 0.68
BC1 150-190 10YR3/3 16.3 55.6 28.1 8.59 0.15 10.7 0.68
BC2 190-230 10YR3/3 19.2 54.9 25.9 8.88 0.28 22.9 0.57
• A look at the graph (Fig.69) on agriculturalproductivity and irrigated area displays thatavailability of irrigation does not implyincreased productivity. Per cent irrigatedarea in these districts ranges from 39 to64%. Avearge agricultural productivity ofirrigated (>33% irrigated area) districts ofthe country is Rs. 36760 while that ofirrigated districts amongst disadvantageddistricts is Rs. 32200 ha-1. This gap can beclosed only with better crop and watermanagemnt practices as water availabilityis not a constraint at least in these 48districts.
Natural resources and land use issues in
backward districts of India
An inventory of natural resources, namely,land, water, forest, ground water development,population, cultivated area etc. for 150backward districts of India was acquired andprocessed. Following findings have emergedfrom the data analysis so far.
• Lack of rainwater management is a majorissue in disadvantaged districts despiteadequate and assured rainfall.
• The mean forest area (45%) in thesedistricts is well above national average(23%). The non timber forest produce(NTFP) can be a major source of incomein these 54 districts.
• 47 districts have more than 60% area undercultivation and thus there is hardly anyscope for increasing area under agriculturein these districts.
• Almost 30% of the districts have poorlydeveloped irrigation resources. Thegroundwater development in these 42districts is just 27%.
Fig. 69. Net area irrigated (NAI) and agricultural
productivity in irrigated districts

AN
NU
AL R
EP
OR
T 2
011-1
2
99
Land Evaluation and Land Use Planning
Land Evaluation for rainfed Bt Cotton in soils
of Nagpur district, Maharashtra using soft
computing techniques
The project was undertaken with the objectivesof (i) developing effective, standard andutilitarian land evaluation criteria andtechniques for rainfed Bt cotton and (ii)applying two soft computing tools, namely,Fuzzy logic and Artificial Neural Networks toevaluate suitability of soils for the landutilization type (LUT).
Fuzzy Modelling in Land Evaluation
Fuzzy modelling – based approach was usedin Land Evaluation (LE) for rainfed Bt cottonin the 24 selected soils of Nagpur district usingthe approach of Burrough (1991) and Chatterji(2000). Correlation between land indices andcrop yield gave a significant positive value of r= 0.70 thereby validating the performance ofthe LE method.
ANNs in Land Evaluation
Land evaluation of the selected soils usingANNs was undertaken using NeuroIntelligence software and the trainingalgorithm used was Hyperbolic tangent.Neural networks were trained with a subsetof 18 points to establish relationship betweensHC, ESP, growing period rainfall, Depth andYield Forward stepwise network training wasdone. The trained networks were tested(validated)with a subset of 6 points. The useof ANNs in Land Evaluation for Bt cottonindicated the algorithm understood fairly wellthe relationship between yield and MDSconstituents in that the fitting accuracy was0.9 and the error in yield prediction was 2.5q/ha. Since only 6 points could be used fortesting the trained networks, more number ofpoints will have to be used for meaningful forvalidation.
Delineation of potential areas for commer-
cially important medicinal and aromatic
plants in different agro-ecological zones of
Karnataka using GIS tools
Medicinal and Aromatic Plants (MAPs) playan important role in the subsistence economyof the rural people. At present, MAPs are notevaluated for their suitability on different soilsand agro-ecological zones of Karnataka.Hence, there is a need to identify suitablepotential areas with modern agro-techniquesto increase the productivity and quality of thesespecies.
Karnataka state has been demarcated into 17Agro-Ecological Zones. This forms the basisfor inventorization and characterization of bio-physical, chemical and climatic factors of theareas, where commercially importantmedicinal and aromatic plants are cultivated.The medicinal and aromatic plants chosen forthe study are as follows:
Medicinal Plants
1. Amla- Emblica officinalis2. Ashvagandha- Withania somanifera3. Tulsi- Ocimum sanctum4. Sweet flag (Baje)- Acorus calamus5. Sonamukhi- Cassia angustifolia
Aromatic Plants
1. Eucalyptus- Eucalyptus citriodora2. Rosemary- Rosmarinus officinalis3. Davana- Artemisia pallens4. Vetiver- Vetiveria zizanioides5. Scented geranium- Pelargonium graveolens
Information on spatial extent of area underabove crops was obtained from statehorticulture department, Krishi VignanaKendra (KVK) located in each district and fromfarmers beside the data base available withCIMAP resource centre, Bangalore. Soil andplant samples (economic part) were collectedfor laboratory studies. Data on climaticparameters such as total rainfall and itsdistribution were collected for each taluk.
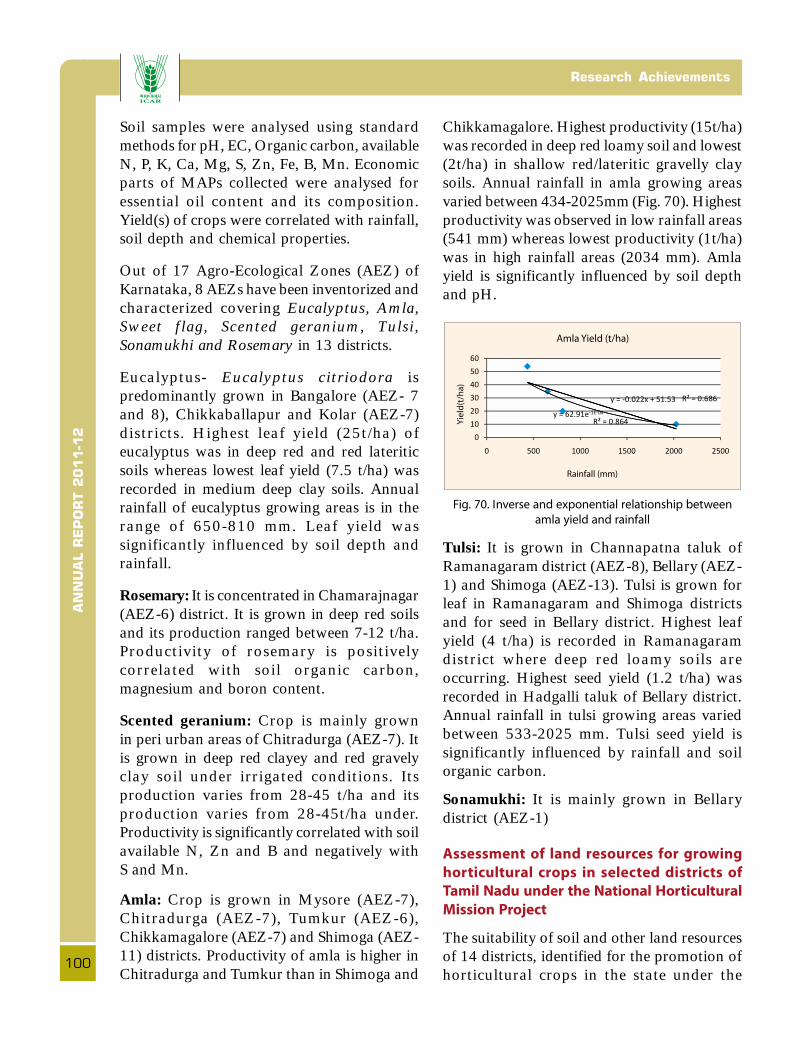
AN
NU
AL R
EP
OR
T 2
011-1
2Research Achievements
100
Soil samples were analysed using standardmethods for pH, EC, Organic carbon, availableN, P, K, Ca, Mg, S, Zn, Fe, B, Mn. Economicparts of MAPs collected were analysed foressential oil content and its composition.Yield(s) of crops were correlated with rainfall,soil depth and chemical properties.
Out of 17 Agro-Ecological Zones (AEZ) ofKarnataka, 8 AEZs have been inventorized andcharacterized covering Eucalyptus, Amla,Sweet flag, Scented geranium, Tulsi,Sonamukhi and Rosemary in 13 districts.
Eucalyptus- Eucalyptus citriodora ispredominantly grown in Bangalore (AEZ- 7and 8), Chikkaballapur and Kolar (AEZ-7)districts. Highest leaf yield (25t/ha) ofeucalyptus was in deep red and red lateriticsoils whereas lowest leaf yield (7.5 t/ha) wasrecorded in medium deep clay soils. Annualrainfall of eucalyptus growing areas is in therange of 650-810 mm. Leaf yield wassignificantly influenced by soil depth andrainfall.
Rosemary: It is concentrated in Chamarajnagar(AEZ-6) district. It is grown in deep red soilsand its production ranged between 7-12 t/ha.Productivity of rosemary is positivelycorrelated with soil organic carbon,magnesium and boron content.
Scented geranium: Crop is mainly grownin peri urban areas of Chitradurga (AEZ-7). Itis grown in deep red clayey and red gravelyclay soil under irrigated conditions. Itsproduction varies from 28-45 t/ha and itsproduction varies from 28-45t/ha under.Productivity is significantly correlated with soilavailable N, Zn and B and negatively withS and Mn.
Amla: Crop is grown in Mysore (AEZ-7),Chitradurga (AEZ-7), Tumkur (AEZ-6),Chikkamagalore (AEZ-7) and Shimoga (AEZ-11) districts. Productivity of amla is higher inChitradurga and Tumkur than in Shimoga and
Chikkamagalore. Highest productivity (15t/ha)was recorded in deep red loamy soil and lowest(2t/ha) in shallow red/lateritic gravelly claysoils. Annual rainfall in amla growing areasvaried between 434-2025mm (Fig. 70). Highestproductivity was observed in low rainfall areas(541 mm) whereas lowest productivity (1t/ha)was in high rainfall areas (2034 mm). Amlayield is significantly influenced by soil depthand pH.
Fig. 70. Inverse and exponential relationship between
amla yield and rainfall
Tulsi: It is grown in Channapatna taluk ofRamanagaram district (AEZ-8), Bellary (AEZ-1) and Shimoga (AEZ-13). Tulsi is grown forleaf in Ramanagaram and Shimoga districtsand for seed in Bellary district. Highest leafyield (4 t/ha) is recorded in Ramanagaramdistrict where deep red loamy soils areoccurring. Highest seed yield (1.2 t/ha) wasrecorded in Hadgalli taluk of Bellary district.Annual rainfall in tulsi growing areas variedbetween 533-2025 mm. Tulsi seed yield issignificantly influenced by rainfall and soilorganic carbon.
Sonamukhi: It is mainly grown in Bellarydistrict (AEZ-1)
Assessment of land resources for growing
horticultural crops in selected districts of
Tamil Nadu under the National Horticultural
Mission Project
The suitability of soil and other land resourcesof 14 districts, identified for the promotion ofhorticultural crops in the state under the
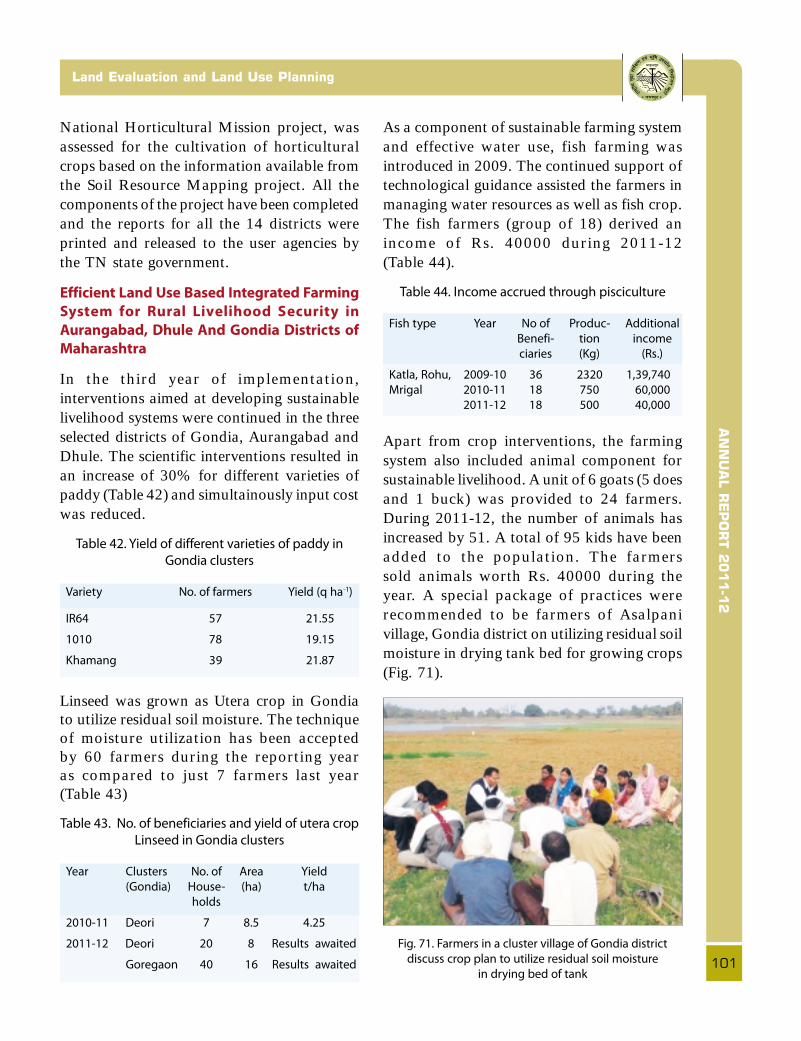
AN
NU
AL R
EP
OR
T 2
011-1
2
101
Land Evaluation and Land Use Planning
As a component of sustainable farming systemand effective water use, fish farming wasintroduced in 2009. The continued support oftechnological guidance assisted the farmers inmanaging water resources as well as fish crop.The fish farmers (group of 18) derived anincome of Rs. 40000 during 2011-12(Table 44).
Table 44. Income accrued through pisciculture
Fish type Year No of Produc- Additional
Benefi- tion income
ciaries (Kg) (Rs.)
Katla, Rohu, 2009-10 36 2320 1,39,740
Mrigal 2010-11 18 750 60,000
2011-12 18 500 40,000
Apart from crop interventions, the farmingsystem also included animal component forsustainable livelihood. A unit of 6 goats (5 doesand 1 buck) was provided to 24 farmers.During 2011-12, the number of animals hasincreased by 51. A total of 95 kids have beenadded to the population. The farmerssold animals worth Rs. 40000 during theyear. A special package of practices wererecommended to be farmers of Asalpanivillage, Gondia district on utilizing residual soilmoisture in drying tank bed for growing crops(Fig. 71).
Fig. 71. Farmers in a cluster village of Gondia district
discuss crop plan to utilize residual soil moisture
in drying bed of tank
National Horticultural Mission project, wasassessed for the cultivation of horticulturalcrops based on the information available fromthe Soil Resource Mapping project. All thecomponents of the project have been completedand the reports for all the 14 districts wereprinted and released to the user agencies bythe TN state government.
Efficient Land Use Based Integrated Farming
System for Rural Livelihood Security in
Aurangabad, Dhule And Gondia Districts of
Maharashtra
In the third year of implementation,interventions aimed at developing sustainablelivelihood systems were continued in the threeselected districts of Gondia, Aurangabad andDhule. The scientific interventions resulted inan increase of 30% for different varieties ofpaddy (Table 42) and simultainously input costwas reduced.
Table 42. Yield of different varieties of paddy in
Gondia clusters
Variety No. of farmers Yield (q ha-1)
IR64 57 21.55
1010 78 19.15
Khamang 39 21.87
Linseed was grown as Utera crop in Gondiato utilize residual soil moisture. The techniqueof moisture utilization has been acceptedby 60 farmers during the reporting yearas compared to just 7 farmers last year(Table 43)
Table 43. No. of beneficiaries and yield of utera crop
Linseed in Gondia clusters
Year Clusters No. of Area Yield
(Gondia) House- (ha) t/ha
holds
2010-11 Deori 7 8.5 4.25
2011-12 Deori 20 8 Results awaited
Goregaon 40 16 Results awaited
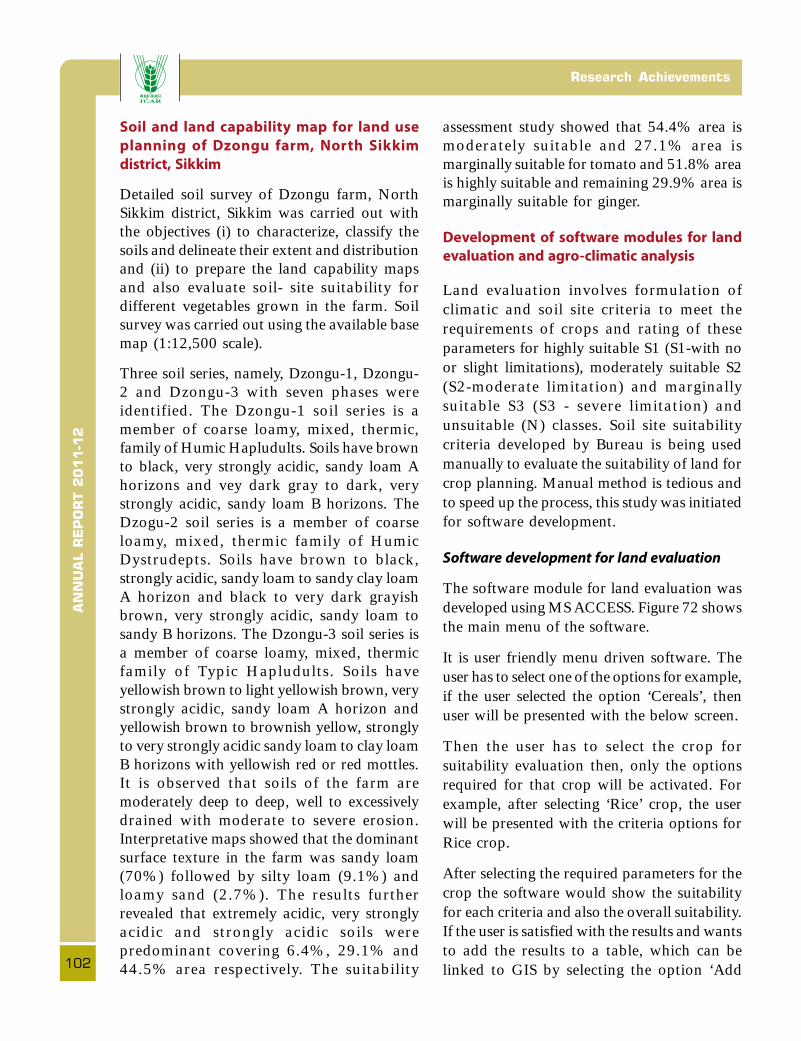
AN
NU
AL R
EP
OR
T 2
011-1
2Research Achievements
102
Soil and land capability map for land use
planning of Dzongu farm, North Sikkim
district, Sikkim
Detailed soil survey of Dzongu farm, NorthSikkim district, Sikkim was carried out withthe objectives (i) to characterize, classify thesoils and delineate their extent and distributionand (ii) to prepare the land capability mapsand also evaluate soil- site suitability fordifferent vegetables grown in the farm. Soilsurvey was carried out using the available basemap (1:12,500 scale).
Three soil series, namely, Dzongu-1, Dzongu-2 and Dzongu-3 with seven phases wereidentified. The Dzongu-1 soil series is amember of coarse loamy, mixed, thermic,family of Humic Hapludults. Soils have brownto black, very strongly acidic, sandy loam Ahorizons and vey dark gray to dark, verystrongly acidic, sandy loam B horizons. TheDzogu-2 soil series is a member of coarseloamy, mixed, thermic family of HumicDystrudepts. Soils have brown to black,strongly acidic, sandy loam to sandy clay loamA horizon and black to very dark grayishbrown, very strongly acidic, sandy loam tosandy B horizons. The Dzongu-3 soil series isa member of coarse loamy, mixed, thermicfamily of Typic Hapludults. Soils haveyellowish brown to light yellowish brown, verystrongly acidic, sandy loam A horizon andyellowish brown to brownish yellow, stronglyto very strongly acidic sandy loam to clay loamB horizons with yellowish red or red mottles.It is observed that soils of the farm aremoderately deep to deep, well to excessivelydrained with moderate to severe erosion.Interpretative maps showed that the dominantsurface texture in the farm was sandy loam(70%) followed by silty loam (9.1%) andloamy sand (2.7%). The results furtherrevealed that extremely acidic, very stronglyacidic and strongly acidic soils werepredominant covering 6.4%, 29.1% and44.5% area respectively. The suitability
assessment study showed that 54.4% area ismoderately suitable and 27.1% area ismarginally suitable for tomato and 51.8% areais highly suitable and remaining 29.9% area ismarginally suitable for ginger.
Development of software modules for land
evaluation and agro-climatic analysis
Land evaluation involves formulation ofclimatic and soil site criteria to meet therequirements of crops and rating of theseparameters for highly suitable S1 (S1-with noor slight limitations), moderately suitable S2(S2-moderate limitation) and marginallysuitable S3 (S3 - severe limitation) andunsuitable (N) classes. Soil site suitabilitycriteria developed by Bureau is being usedmanually to evaluate the suitability of land forcrop planning. Manual method is tedious andto speed up the process, this study was initiatedfor software development.
Software development for land evaluation
The software module for land evaluation wasdeveloped using MS ACCESS. Figure 72 showsthe main menu of the software.
It is user friendly menu driven software. Theuser has to select one of the options for example,if the user selected the option ‘Cereals’, thenuser will be presented with the below screen.
Then the user has to select the crop forsuitability evaluation then, only the optionsrequired for that crop will be activated. Forexample, after selecting ‘Rice’ crop, the userwill be presented with the criteria options forRice crop.
After selecting the required parameters for thecrop the software would show the suitabilityfor each criteria and also the overall suitability.If the user is satisfied with the results and wantsto add the results to a table, which can belinked to GIS by selecting the option ‘Add

AN
NU
AL R
EP
OR
T 2
011-1
2
103
Land Evaluation and Land Use Planning
selection. The result will be added to the tablenamed ‘gis’ which can be linked to GIS map.
Software development for soil water balance
Water balance procedure is highly useful inthe determination of crop water requirementsand classification of bio-climate and forhydrological calculations of river water basins.Manual estimations of water budgeting istedious especially when the time step isover weekly periods and when a large numberof locations are involved. A software hasbeen developed and tested with climaticdata on rainfall, evapotranspiration from IMDand soil data from NBSS & LUP forthe estimation of water balance on monthly/weekly basis.
Method of estimation of climatic water
balance
The water budgeting estimations are madefollowing the methodology of Thornthwaiteand Mather (1955) and Subrahmanyam (1983).The water balance equation is solved in monthlyand weekly time steps to evaluate the waterdeficit (WD) or water surplus (WS) components.
In using the software, if the user desires to selectthe data entry on monthly basis, the followingscreen will appear. (Fig. 73). The user can enterthe data for Rainfall (P), PotentialEvapotranspiration (Pe) and field capacity(FC). By clicking the ‘Calculate Water Balance’button, the user can see the results and cansave the data by clicking the button ‘CreateFile’. In the same way, the user can carry out
Fig. 72. Main menu software for land suitability for crops
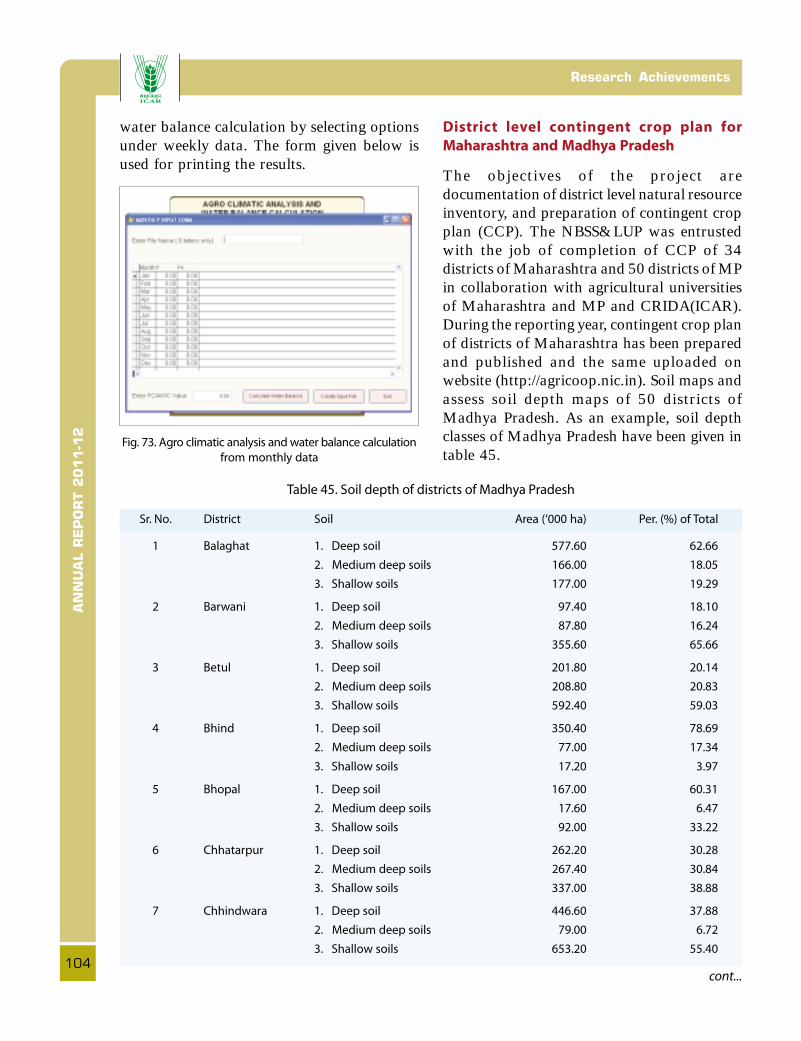
AN
NU
AL R
EP
OR
T 2
011-1
2Research Achievements
104
water balance calculation by selecting optionsunder weekly data. The form given below isused for printing the results.
Fig. 73. Agro climatic analysis and water balance calculation
from monthly data
District level contingent crop plan for
Maharashtra and Madhya Pradesh
The objectives of the project aredocumentation of district level natural resourceinventory, and preparation of contingent cropplan (CCP). The NBSS&LUP was entrustedwith the job of completion of CCP of 34districts of Maharashtra and 50 districts of MPin collaboration with agricultural universitiesof Maharashtra and MP and CRIDA(ICAR).During the reporting year, contingent crop planof districts of Maharashtra has been preparedand published and the same uploaded onwebsite (http://agricoop.nic.in). Soil maps andassess soil depth maps of 50 districts ofMadhya Pradesh. As an example, soil depthclasses of Madhya Pradesh have been given intable 45.
cont...
Table 45. Soil depth of districts of Madhya Pradesh
Sr. No. District Soil Area (‘000 ha) Per. (%) of Total
1 Balaghat 1. Deep soil 577.60 62.66
2. Medium deep soils 166.00 18.05
3. Shallow soils 177.00 19.29
2 Barwani 1. Deep soil 97.40 18.10
2. Medium deep soils 87.80 16.24
3. Shallow soils 355.60 65.66
3 Betul 1. Deep soil 201.80 20.14
2. Medium deep soils 208.80 20.83
3. Shallow soils 592.40 59.03
4 Bhind 1. Deep soil 350.40 78.69
2. Medium deep soils 77.00 17.34
3. Shallow soils 17.20 3.97
5 Bhopal 1. Deep soil 167.00 60.31
2. Medium deep soils 17.60 6.47
3. Shallow soils 92.00 33.22
6 Chhatarpur 1. Deep soil 262.20 30.28
2. Medium deep soils 267.40 30.84
3. Shallow soils 337.00 38.88
7 Chhindwara 1. Deep soil 446.60 37.88
2. Medium deep soils 79.00 6.72
3. Shallow soils 653.20 55.40
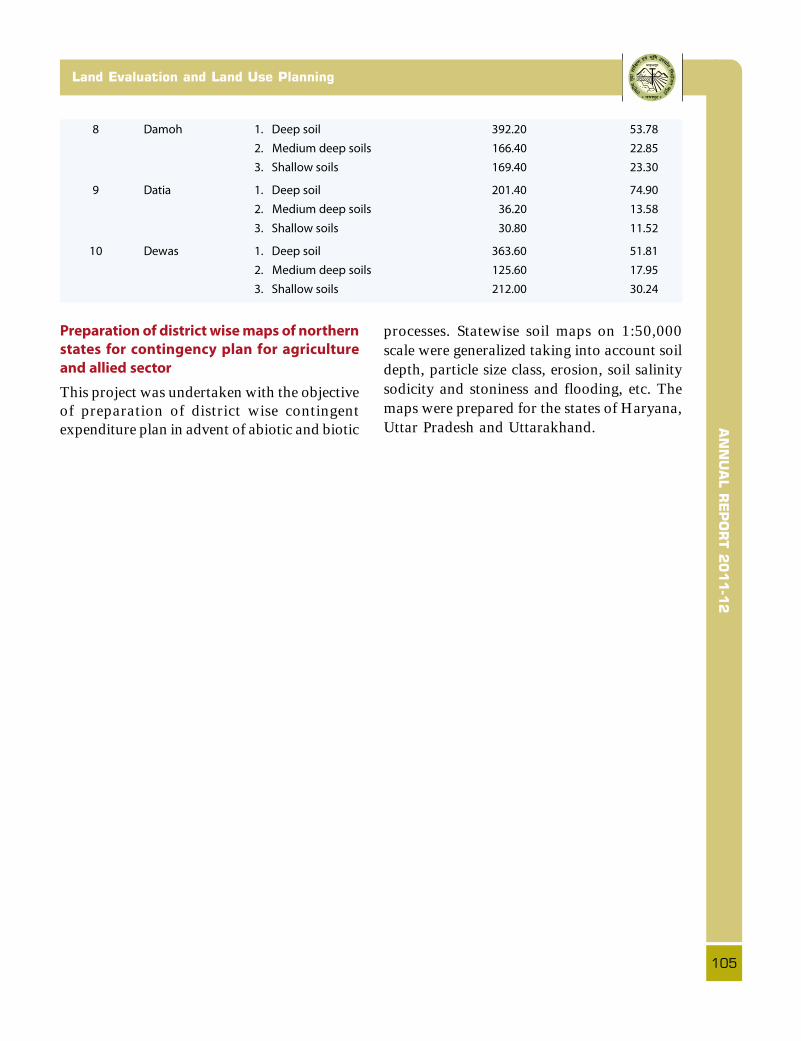
AN
NU
AL R
EP
OR
T 2
011-1
2
105
Land Evaluation and Land Use Planning
8 Damoh 1. Deep soil 392.20 53.78
2. Medium deep soils 166.40 22.85
3. Shallow soils 169.40 23.30
9 Datia 1. Deep soil 201.40 74.90
2. Medium deep soils 36.20 13.58
3. Shallow soils 30.80 11.52
10 Dewas 1. Deep soil 363.60 51.81
2. Medium deep soils 125.60 17.95
3. Shallow soils 212.00 30.24
Preparation of district wise maps of northern
states for contingency plan for agriculture
and allied sector
This project was undertaken with the objectiveof preparation of district wise contingentexpenditure plan in advent of abiotic and biotic
processes. Statewise soil maps on 1:50,000scale were generalized taking into account soildepth, particle size class, erosion, soil salinitysodicity and stoniness and flooding, etc. Themaps were prepared for the states of Haryana,Uttar Pradesh and Uttarakhand.
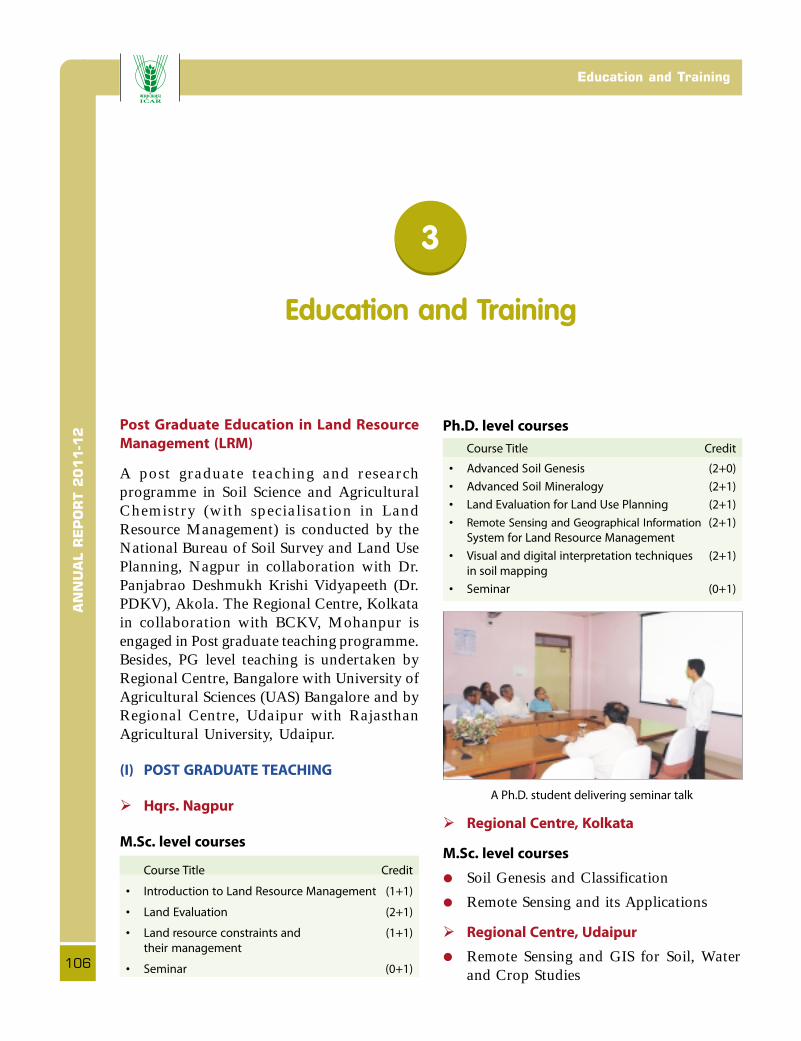
AN
NU
AL R
EP
OR
T 2
011-1
2Education and Training
106
3
Education and Training
Ph.D. level courses
Course Title Credit
• Advanced Soil Genesis (2+0)
• Advanced Soil Mineralogy (2+1)
• Land Evaluation for Land Use Planning (2+1)
• Remote Sensing and Geographical Information (2+1)
System for Land Resource Management
• Visual and digital interpretation techniques (2+1)
in soil mapping
• Seminar (0+1)
A Ph.D. student delivering seminar talk
� Regional Centre, Kolkata
M.Sc. level courses
• Soil Genesis and Classification
• Remote Sensing and its Applications
� Regional Centre, Udaipur
• Remote Sensing and GIS for Soil, Waterand Crop Studies
Post Graduate Education in Land Resource
Management (LRM)
A post graduate teaching and researchprogramme in Soil Science and AgriculturalChemistry (with specialisation in LandResource Management) is conducted by theNational Bureau of Soil Survey and Land UsePlanning, Nagpur in collaboration with Dr.Panjabrao Deshmukh Krishi Vidyapeeth (Dr.PDKV), Akola. The Regional Centre, Kolkatain collaboration with BCKV, Mohanpur isengaged in Post graduate teaching programme.Besides, PG level teaching is undertaken byRegional Centre, Bangalore with University ofAgricultural Sciences (UAS) Bangalore and byRegional Centre, Udaipur with RajasthanAgricultural University, Udaipur.
(I) POST GRADUATE TEACHING
� Hqrs. Nagpur
M.Sc. level courses
Course Title Credit
• Introduction to Land Resource Management (1+1)
• Land Evaluation (2+1)
• Land resource constraints and (1+1)
their management
• Seminar (0+1)

AN
NU
AL R
EP
OR
T 2
011-1
2
107
Education and Training
RESEARCH
� Hqrs. Nagpur
M.Sc. Programme
Four students were admitted in 2009 atDr. PDKV, Akola who later joined the Bureauin July 2010 for their specialized course inLRM. They also completed their courses,submitted their theses and were awardeddegrees. The titles of the theses are mentionedbelow:
• Bulk density and its relationship with otherparameters of soils of Vidarbha,Maharashtra.
• Characterization and evaluation of landresources for management of SavaliWatershed of Wardha district ofMaharashtra using IR6-P6 Resources-at1 data and GIS.
• Yield gap analysis of Soybean of someselected soils of Nagpur district,Maharashtra.
• Characteristics and spectral reflectanceproperties of typical Vertisols of Vidarbha,Maharashtra. 1 student (of 2007) batchsubmitted his thesis in May 2011.
• Yield gap analysis of Rice in some selectedsoils of Bhandara district.
7 students were admitted in 2010 at Dr. PDKV,Akola who later joined NBSS&LUP in June,2011 for their specialized courses in LRM.They have completed their course work andare at present engaged in research work fortheir theses. The thesis titles of the theses arementioned below:
• Composition of interlayer materials of soilclay smectites.
• Assessment of sewage irrigated land usesystems in Nagpur, Maharashtra.
• Spatial variability of soil properties inSavli village of Wardha district ofMaharashtra.
• Appraisal of land resources of Tandul-wani watershed in Nagpur district,Maharashtra using Remote Sensing andGIS techniques.
• Developing a model of understanding forsoil quality parameters in representativeblack soil regions of Maharashtra.
• Characterization and evaluation of landresources of Kedarpur village in Katol tahsilof Nagpur district, Maharashtra usingIRS-P6.
• Effect of management practices on soilsunder long-term cotton crop in CICRresearch farm, Nagpur
Ph.D. Programme
Hqrs., Nagpur
Three Ph.D. (LRM) students were admitted in2010 at Dr. PDKV, Akola, who later joinedthe Bureau in August, 2011 for their specializedcourses in LRM. They are undertaking thecourses besides being engaged in researchwork. The titles of their theses are mentionedbelow:
• Soil quality assessment in rainfed cottongrowing environs of two agro-ecologicalregions of Vidarbha, Maharashtra.
• Evaluation of land quality indicators formajor cotton growing soils of Jalgaondistrict.
• Characterization, genesis and evaluation ofsoils in a topo-sequence in Raipur districtof Chhattisgarh.
RESEARCH HIGHLIGHTS
A brief on the research work carried out bythe M.Sc. (LRM) students of 2009 batch atHqrs., Nagpur is given below:
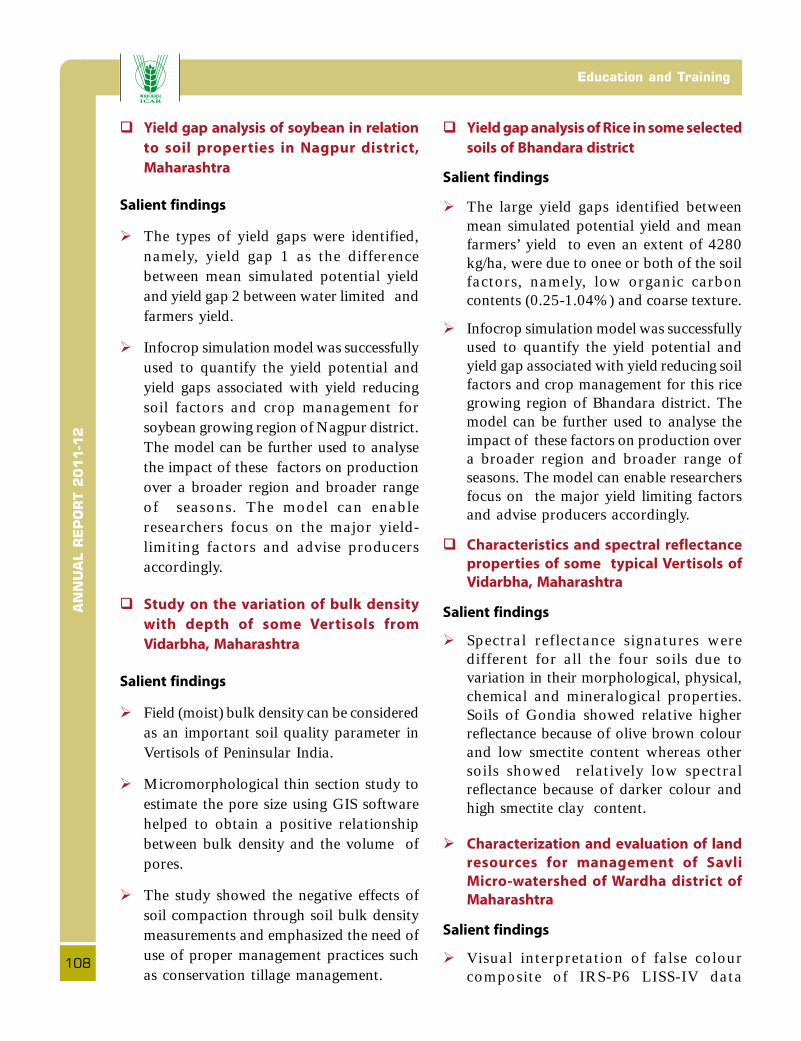
AN
NU
AL R
EP
OR
T 2
011-1
2Education and Training
108
� Yield gap analysis of soybean in relation
to soil properties in Nagpur district,
Maharashtra
Salient findings
� The types of yield gaps were identified,namely, yield gap 1 as the differencebetween mean simulated potential yieldand yield gap 2 between water limited andfarmers yield.
� Infocrop simulation model was successfullyused to quantify the yield potential andyield gaps associated with yield reducingsoil factors and crop management forsoybean growing region of Nagpur district.The model can be further used to analysethe impact of these factors on productionover a broader region and broader rangeof seasons. The model can enableresearchers focus on the major yield-limiting factors and advise producersaccordingly.
� Study on the variation of bulk density
with depth of some Vertisols from
Vidarbha, Maharashtra
Salient findings
� Field (moist) bulk density can be consideredas an important soil quality parameter inVertisols of Peninsular India.
� Micromorphological thin section study toestimate the pore size using GIS softwarehelped to obtain a positive relationshipbetween bulk density and the volume ofpores.
� The study showed the negative effects ofsoil compaction through soil bulk densitymeasurements and emphasized the need ofuse of proper management practices suchas conservation tillage management.
� Yield gap analysis of Rice in some selected
soils of Bhandara district
Salient findings
� The large yield gaps identified betweenmean simulated potential yield and meanfarmers’ yield to even an extent of 4280kg/ha, were due to onee or both of the soilfactors, namely, low organic carboncontents (0.25-1.04%) and coarse texture.
� Infocrop simulation model was successfullyused to quantify the yield potential andyield gap associated with yield reducing soilfactors and crop management for this ricegrowing region of Bhandara district. Themodel can be further used to analyse theimpact of these factors on production overa broader region and broader range ofseasons. The model can enable researchersfocus on the major yield limiting factorsand advise producers accordingly.
� Characteristics and spectral reflectance
properties of some typical Vertisols of
Vidarbha, Maharashtra
Salient findings
� Spectral reflectance signatures weredifferent for all the four soils due tovariation in their morphological, physical,chemical and mineralogical properties.Soils of Gondia showed relative higherreflectance because of olive brown colourand low smectite content whereas othersoils showed relatively low spectralreflectance because of darker colour andhigh smectite clay content.
� Characterization and evaluation of land
resources for management of Savli
Micro-watershed of Wardha district of
Maharashtra
Salient findings
� Visual interpretation of false colourcomposite of IRS-P6 LISS-IV data

AN
NU
AL R
EP
OR
T 2
011-1
2
109
Education and Training
supported by adequate field checks is foundto be most useful for mappingphysiography, soils and land use/land coverin Savli micro-watershed and theinformation generated from remote sensingdata is integrated with geographicalinformation system (GIS) for generation ofvarious thematic maps in the micro-watershed which helps in land resourcesmanagement and agricultural planning ofthe watershed.
ACHIEVEMENTS
• Degrees Awarded : 108 M.Sc. and 15(up to 2011-12) Ph.D.
• Students on roll : 9 M.Sc. and 6 Ph.D.(as on 31.03.12)
Regional Centre, Bangalore
Scientists of the centre were involved in guidingresearch work of students of differentuniversities.
TRAININGS IMPARTED
• Organized Training program forthe District watershed developmentofficers of Govt. of Karnataka on“Inventorization of land resources forwatershed development” from 13 to 22ndJune 2011 in two batches at NBSS & LUP,Bangalore
Field work at Tirumale sub-watershed in Magadi taluk
for trainees
• A 21 days training programme on “SoilSurvey and Land Use Planning” wasorganized for 15 survey personnel of KeralaState Soil Survey and Land UseOrganization during 08.11.2011 to28.11.2011
Dr. Dipak Sarkar, Director interacts with trainees during
field work (at Thriuvananthapuram) undertaken as a
part of training organised by Regional Centre, Bangalore
on ‘Soil Survey and Land Use Planning”
• 25 foreign visitors from 14 countriesundergoing international training on“Watershed Development for Agriculturaland Environmental Protection” visited theMagadi watershed on 29.11.2011.
Field work at Magadi watershed undertaken as a part of
international training on “Watershed Development for
Agricultural and Environmental Protection”
A training programme on “Application ofRemote Sensing and GIS for Watershedcharacterization and Resource Planning” underTribal Sub Plan was organized during theperiod, 20.02.2012 to 11.03.2012.
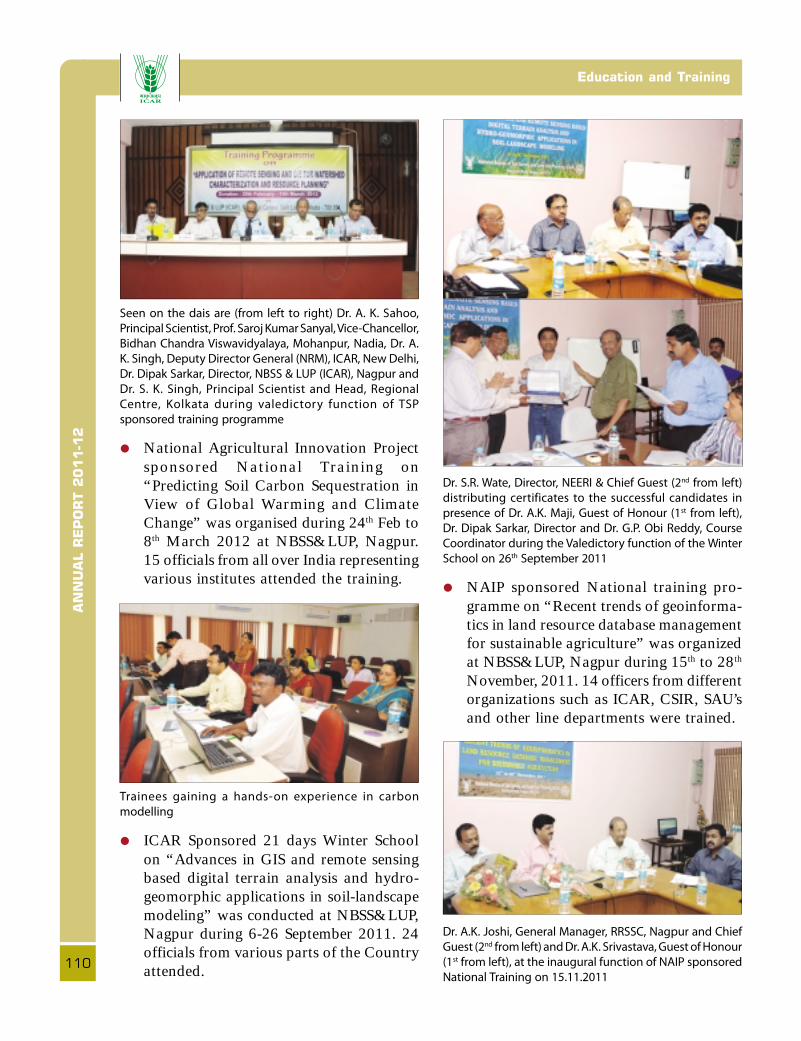
AN
NU
AL R
EP
OR
T 2
011-1
2Education and Training
110
Seen on the dais are (from left to right) Dr. A. K. Sahoo,
Principal Scientist, Prof. Saroj Kumar Sanyal, Vice-Chancellor,
Bidhan Chandra Viswavidyalaya, Mohanpur, Nadia, Dr. A.
K. Singh, Deputy Director General (NRM), ICAR, New Delhi,
Dr. Dipak Sarkar, Director, NBSS & LUP (ICAR), Nagpur and
Dr. S. K. Singh, Principal Scientist and Head, Regional
Centre, Kolkata during valedictory function of TSP
sponsored training programme
• National Agricultural Innovation Projectsponsored National Training on“Predicting Soil Carbon Sequestration inView of Global Warming and ClimateChange” was organised during 24th Feb to8th March 2012 at NBSS&LUP, Nagpur.15 officials from all over India representingvarious institutes attended the training.
Trainees gaining a hands-on experience in carbon
modelling
• ICAR Sponsored 21 days Winter Schoolon “Advances in GIS and remote sensingbased digital terrain analysis and hydro-geomorphic applications in soil-landscapemodeling” was conducted at NBSS&LUP,Nagpur during 6-26 September 2011. 24officials from various parts of the Countryattended.
Dr. S.R. Wate, Director, NEERI & Chief Guest (2nd from left)
distributing certificates to the successful candidates in
presence of Dr. A.K. Maji, Guest of Honour (1st from left),
Dr. Dipak Sarkar, Director and Dr. G.P. Obi Reddy, Course
Coordinator during the Valedictory function of the Winter
School on 26th September 2011
• NAIP sponsored National training pro-gramme on “Recent trends of geoinforma-tics in land resource database managementfor sustainable agriculture” was organizedat NBSS&LUP, Nagpur during 15th to 28th
November, 2011. 14 officers from differentorganizations such as ICAR, CSIR, SAU’sand other line departments were trained.
Dr. A.K. Joshi, General Manager, RRSSC, Nagpur and Chief
Guest (2nd from left) and Dr. A.K. Srivastava, Guest of Honour
(1st from left), at the inaugural function of NAIP sponsored
National Training on 15.11.2011
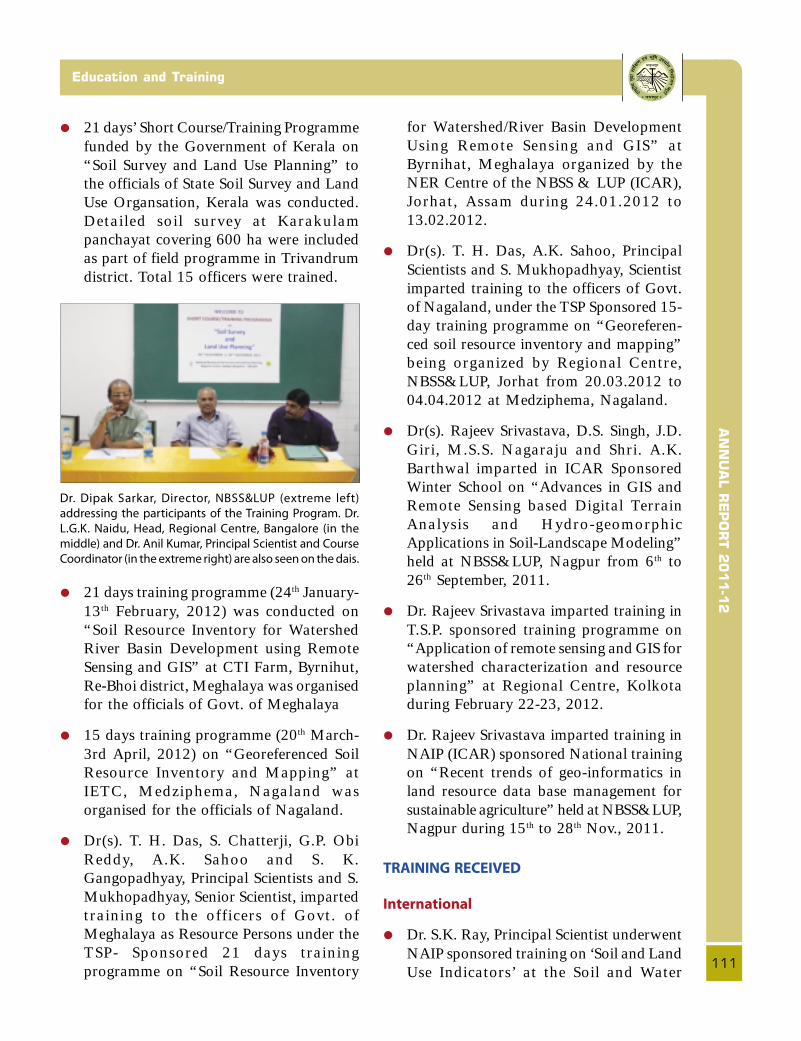
AN
NU
AL R
EP
OR
T 2
011-1
2
111
Education and Training
• 21 days’ Short Course/Training Programmefunded by the Government of Kerala on“Soil Survey and Land Use Planning” tothe officials of State Soil Survey and LandUse Organsation, Kerala was conducted.Detailed soil survey at Karakulampanchayat covering 600 ha were includedas part of field programme in Trivandrumdistrict. Total 15 officers were trained.
Dr. Dipak Sarkar, Director, NBSS&LUP (extreme left)
addressing the participants of the Training Program. Dr.
L.G.K. Naidu, Head, Regional Centre, Bangalore (in the
middle) and Dr. Anil Kumar, Principal Scientist and Course
Coordinator (in the extreme right) are also seen on the dais.
• 21 days training programme (24th January-13th February, 2012) was conducted on“Soil Resource Inventory for WatershedRiver Basin Development using RemoteSensing and GIS” at CTI Farm, Byrnihut,Re-Bhoi district, Meghalaya was organisedfor the officials of Govt. of Meghalaya
• 15 days training programme (20th March-3rd April, 2012) on “Georeferenced SoilResource Inventory and Mapping” atIETC, Medziphema, Nagaland wasorganised for the officials of Nagaland.
• Dr(s). T. H. Das, S. Chatterji, G.P. ObiReddy, A.K. Sahoo and S. K.Gangopadhyay, Principal Scientists and S.Mukhopadhyay, Senior Scientist, impartedtraining to the officers of Govt. ofMeghalaya as Resource Persons under theTSP- Sponsored 21 days trainingprogramme on “Soil Resource Inventory
for Watershed/River Basin DevelopmentUsing Remote Sensing and GIS” atByrnihat, Meghalaya organized by theNER Centre of the NBSS & LUP (ICAR),Jorhat, Assam during 24.01.2012 to13.02.2012.
• Dr(s). T. H. Das, A.K. Sahoo, PrincipalScientists and S. Mukhopadhyay, Scientistimparted training to the officers of Govt.of Nagaland, under the TSP Sponsored 15-day training programme on “Georeferen-ced soil resource inventory and mapping”being organized by Regional Centre,NBSS&LUP, Jorhat from 20.03.2012 to04.04.2012 at Medziphema, Nagaland.
• Dr(s). Rajeev Srivastava, D.S. Singh, J.D.Giri, M.S.S. Nagaraju and Shri. A.K.Barthwal imparted in ICAR SponsoredWinter School on “Advances in GIS andRemote Sensing based Digital TerrainAnalysis and Hydro-geomorphicApplications in Soil-Landscape Modeling”held at NBSS&LUP, Nagpur from 6th to26th September, 2011.
• Dr. Rajeev Srivastava imparted training inT.S.P. sponsored training programme on“Application of remote sensing and GIS forwatershed characterization and resourceplanning” at Regional Centre, Kolkotaduring February 22-23, 2012.
• Dr. Rajeev Srivastava imparted training inNAIP (ICAR) sponsored National trainingon “Recent trends of geo-informatics inland resource data base management forsustainable agriculture” held at NBSS&LUP,Nagpur during 15th to 28th Nov., 2011.
TRAINING RECEIVED
International
• Dr. S.K. Ray, Principal Scientist underwentNAIP sponsored training on ‘Soil and LandUse Indicators’ at the Soil and Water
AN
NU
AL R
EP
OR
T 2
011-1
2Education and Training
112
Science Department, Institute of Food andAgricultural Sciences, University of Florida,Gainesville, Florida, USA during 19th Oct.to 21st Dec. 2011.
National
• Dr. M.S.S. Nagaraju and Dr. R.A. Nasreattended short course on “HyperspectralRemote sensing for Agriculture(HYPERAGRI 2011)” at IARI New Delhiduring 2-11 August 2011.
• Dr. K. Karthikeyan attended a ten days soilcarbon modeling workshop on Roth C,Century C, Infocrop and DNDC under thebanner of ICAR National Project ofClimate Change and DST-IS-STAC (from26th April to 5th May, 2011)
• Mrs. Malathi Bommidi attended trainingprogramme on “Data Mining Using SAS”at IASRI, New Delhi from 06th to 11th
February, 2012.

AN
NU
AL R
EP
OR
T 2
011-1
2
113
Technology Assessed and Transferred
4
Technology Assessed and Transferred
• The database developed from the soilnutrient mapping project of West Bengalhas been utilised for developing an userinterface in form of an Advisory for thefarmers of West Bengal. This software isbeing widely used by the farmers to takedecision on management practices.
• A Decision Support System has beendeveloped for Land Use Planning ofMysore district, Karnataka that would help
the district authorities and otherstakeholders, including very much thefarmers, in planning sustainable use of theland resources.
• Evaluation of soil-site suitability for specificcrops undertaken at the levels of village isguiding the farmers in selecting suitablecrops at the levels of watershed, block anddistricts in different agro-ecologicalsubregions of the country.
AN
NU
AL R
EP
OR
T 2
011-1
2Sections and Units
114
The following jobs were undertaken andaccomplished during the period
• Monitoring day-to-day Technical/Scientificwork and achievements of the Bureau.
• Collection, storing and dissemination ofscientific and technical information on soilsto the various institutes as per demand.
• Maintenance of scientific/technical files,consultancy projects and QRT and RACfiles and RPFs
• Necessary action on various technicalpapers/letters.
• Preparation of Bureau’s reports for DARE,ICAR Annual Report, monthly, quarterlytarget and progress report.
• Monitoring of progress of researchprojects.
• Compilation of six monthly targets andresearch progress of scientist and timelysubmission to ICAR.
• Organization of IRC, Heads of RegionalCentres/Division meetings, project reviewmeetings and development of proceedings.
• Development of background informationfor QRT, IMC, IRC and EFC.
• Preparation of scientific papers and slidesfor presentation by the Director at
Sections and Units
5
5.1 Prioritization, Monitoring and Evaluation (PME) Cell
National/International seminars andworkshops organized by the differentScientific Societies/Institutions.
• Preparation of material for Directors’Conference, Regional Committee meetingsand other meetings.
• Providing audio visual support duringseminars/workshops.
• Preparation of tables, charts and otherdisplay materials on the activities of theInstitute.
• Preparation of ATR on decisions takenduring different meetings and proceedingsof such meetings.
• Finalization of Annual Report andbackground information of Annual Plan ofthe Institute.
• Technical inputs for finalization ofpublications of the research bulletins,technical reports.
• Undertaking RFD related activities.
• Preparation of newsletters (half yearly) ofthe Institute.
• Preparation of material for ICAR Newsand Reporter.
• Organization of research review and othermeetings at Institute level.
AN
NU
AL R
EP
OR
T 2
011-1
2
115
Sections and Units
Library resources development
The library procured 338 documents including257 books; and 81 annual reports. The totalcollection of the library as on 31.3.2012 was15715.
The library subscribed to 15 foreign and 31Indian journals for Hqrs., besides 16 journalsfor Regional Centre libraries. Collection ofbound journals as on 31.3.2012 was 3171.
During the reporting period, 585 readersvisited the library. Total of 3594 documentswere issued, 3756 documents were returnedand 5629 documents were consulted.
Documentation services
Current information is disseminated to thescientists through inhouse services.
Current Titles Announcement Service (CTAS)
CTAS a fortnightly inhouse publication basedon receipt of current journals in the librarykept scientific and technical staff abreast oflatest information received in the library.Twenty four issues were brought out during2011-12. However, CTAS was replaced byCTA (Current Titles Alert) from Jan 2012through which the library gives “Alert” to allthe 5 RCs and all divisions and sections of theBureau on receipt of current journals in thelibrary via email.
• Library Automation Software
Library Automation Software SOUL (Softwarefor University Libraries) developed by UGC isbeing used for library automation work. Datainput of each book in the software iscompleted. Generation of Barcode labels foreach book is also completed. Computerisedissue – return service is in operation. It is acontinuous process.
• CD-ROM Service
International bibliographic database vizCABI, AGRIS, and AGRICOLA in CD-ROMis available in the library. Tulsient CD MirrorServer has been installed and under LAN,the CD-ROM databases are accessed by 10nodes spread over in two buildings of theBureau.
• CABI Database (1972 to present) — CABI,U.K.
• AGRIS Database (1975 to present)—FAO, Rome.
• AGRICOLA Database (1970 to present)—USDA, USA.
• SOIL CD (1973 to present)—CABI,U.K.
These databases have been extensively usedby research staff, M.Sc., Ph.D. students andothers from Nagpur City. Various useragencies in the Country make use of thesedatabases. CD ROM- based search andretrieval services have been provided withnominal charges; in print form or through CDs/Pen drives.
• ISBN to NBSSLUP Publications
NBSSLUP publishes wide variety ofpublications in the form of annual report;research/technical bulletins, various scale mapsof India and different States.
The ISBN/ISSN numbers are allocated to 149NBSS publications till this period and copiesof each publication are sent to concernedagencies for inclusion in their database. Thepublications are sent to prominent journals,abstracting/indexing services for reviewpurpose in order to achieve wider informationdissemination.
5.2 Library & Documentation Unit
AN
NU
AL R
EP
OR
T 2
011-1
2Sections and Units
116
• News Paper Clipping Service
The library is receiving 7 newspapers and twoperiodicals. The relevant cuttings pertaining totopical interest were brought to the notice ofstaff of the Bureau by displaying on librarynotice board.
• Centralised Services
The Unit provides centralised services likephotocopying comb/thermal binding andlamination of documents/maps sheets, etc.
Photocopying Services were extended to libraryvisitors and cost of charges received wasRs. 1769.00.
• Library Services through LAN
Local Area Network (LAN) has beenestablished in the Bureau. Five Computer nodeshave been provided for access to libraryinformation system from where bibliographicsearching with various query modes isavailable. E-Mail and Internet facility has alsobeen provided to two computers.
Browsing of international libraries throughInternet is in full operation. Subscribed onlineelectronic journals and down loading was doneusing Internet facility. It is planned to go forsubscription of more number of electronicjournals in the coming years.
CD-ROM Reading/Writing facility has beeninstalled in the library for downloadingelectronic journals, articles and access topublisher’s catalogues.
Online agricultural statistics database“Indiastat.com” was subscribed during theperiod. The readers have made extensive useof this database.
On-line Portals/Journals through CeRA (NAIP)
Through CeRA (Consortium of e-Resources inAgriculture), a Consortium of e-journals (fulltext),a project under NAIP, ICAR that providedaccess to the library of the Bureau. The Bureauaccessed a total of 1342 on-line full textjournals available on CeRA of variouspublishers namely, Springer link, AnnualReviews, CSIRO (Australia), ASA, OxfordUniversity Press and Wiley & Blackwell.
Document Delivery System under CeRA
As per guidelines of CeRA, photocopy of thearticle requested by the participating institutesis being provided to the libraries/members. Itis a continuous process. This facility is alsoextended to our five Regional Centres.
The above e-resources can be accessed byvisiting URL: http://www.cera.jccc.in throughNBSS&LUP LAN.
5.3 Printing Section
A. Atlas
Land Resource Atlas Vidarbha Region,Maharashtra
B. Technical Bulletin
1. Planning and Management of LandResources
– Print Order – 300 copies
– Report No. 1033
– Volume of work – X + 217 pages
2. Agro-ecological Regional of Uttar Pradesh
– Print Order – 300 copies
– Report No. 148
– Volume of work – XX + 112 pages
3. Soil Erosion in Haryana
– Print Order – 200 copies
– Report No. 149
– Volume of work – X + 50 pages
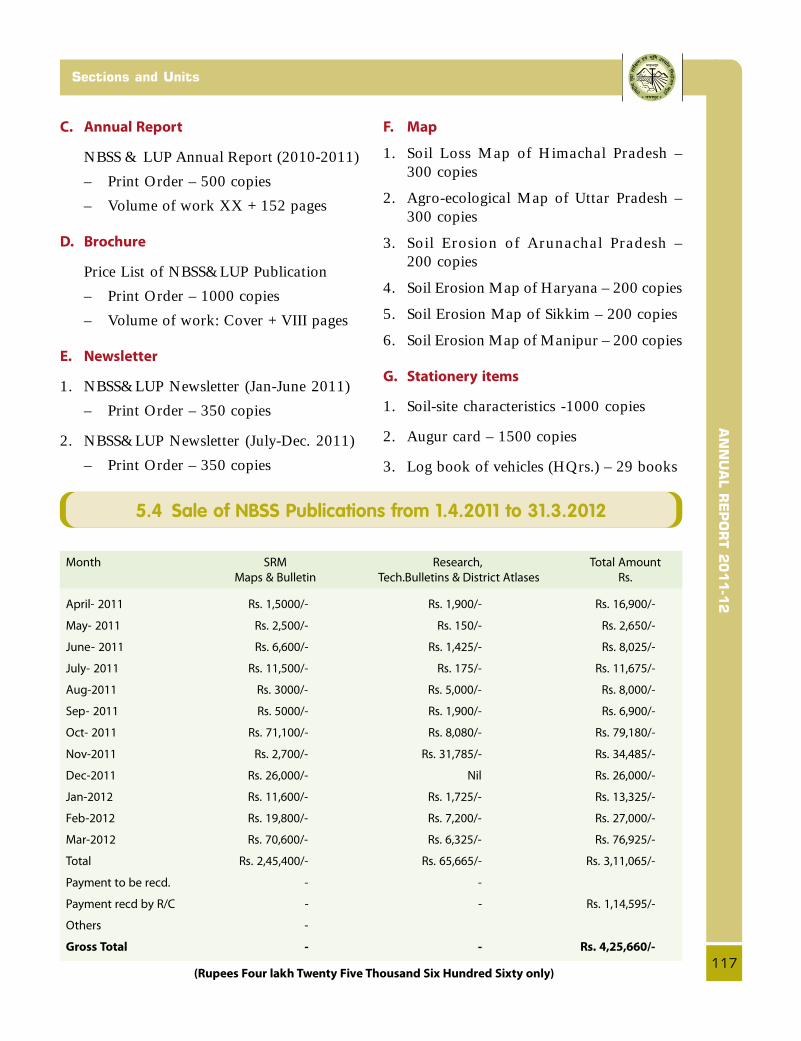
AN
NU
AL R
EP
OR
T 2
011-1
2
117
Sections and Units
C. Annual Report
NBSS & LUP Annual Report (2010-2011)
– Print Order – 500 copies
– Volume of work XX + 152 pages
D. Brochure
Price List of NBSS&LUP Publication
– Print Order – 1000 copies
– Volume of work: Cover + VIII pages
E. Newsletter
1. NBSS&LUP Newsletter (Jan-June 2011)
– Print Order – 350 copies
2. NBSS&LUP Newsletter (July-Dec. 2011)
– Print Order – 350 copies
F. Map
1. Soil Loss Map of Himachal Pradesh –300 copies
2. Agro-ecological Map of Uttar Pradesh –300 copies
3. Soil Erosion of Arunachal Pradesh –200 copies
4. Soil Erosion Map of Haryana – 200 copies
5. Soil Erosion Map of Sikkim – 200 copies
6. Soil Erosion Map of Manipur – 200 copies
G. Stationery items
1. Soil-site characteristics -1000 copies
2. Augur card – 1500 copies
3. Log book of vehicles (HQrs.) – 29 books
5.4 Sale of NBSS Publications from 1.4.2011 to 31.3.2012
Month SRM Research, Total Amount
Maps & Bulletin Tech.Bulletins & District Atlases Rs.
April- 2011 Rs. 1,5000/- Rs. 1,900/- Rs. 16,900/-
May- 2011 Rs. 2,500/- Rs. 150/- Rs. 2,650/-
June- 2011 Rs. 6,600/- Rs. 1,425/- Rs. 8,025/-
July- 2011 Rs. 11,500/- Rs. 175/- Rs. 11,675/-
Aug-2011 Rs. 3000/- Rs. 5,000/- Rs. 8,000/-
Sep- 2011 Rs. 5000/- Rs. 1,900/- Rs. 6,900/-
Oct- 2011 Rs. 71,100/- Rs. 8,080/- Rs. 79,180/-
Nov-2011 Rs. 2,700/- Rs. 31,785/- Rs. 34,485/-
Dec-2011 Rs. 26,000/- Nil Rs. 26,000/-
Jan-2012 Rs. 11,600/- Rs. 1,725/- Rs. 13,325/-
Feb-2012 Rs. 19,800/- Rs. 7,200/- Rs. 27,000/-
Mar-2012 Rs. 70,600/- Rs. 6,325/- Rs. 76,925/-
Total Rs. 2,45,400/- Rs. 65,665/- Rs. 3,11,065/-
Payment to be recd. - -
Payment recd by R/C - - Rs. 1,14,595/-
Others -
Gross Total - - Rs. 4,25,660/-
(Rupees Four lakh Twenty Five Thousand Six Hundred Sixty only)
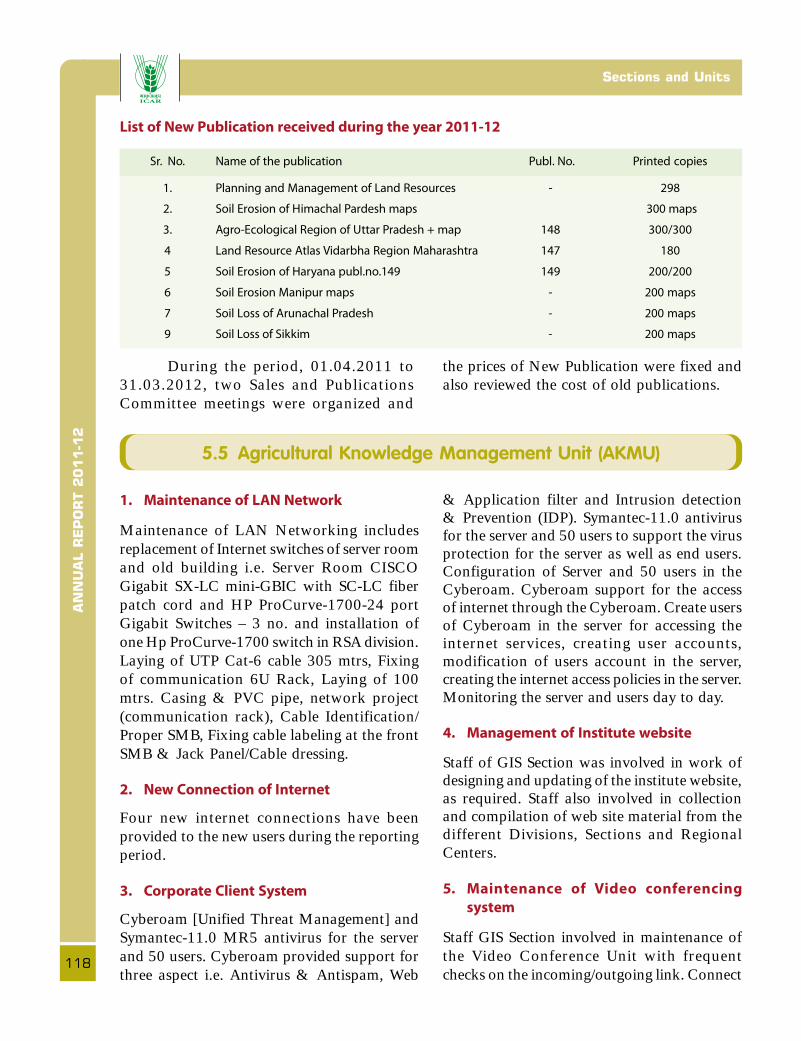
AN
NU
AL R
EP
OR
T 2
011-1
2Sections and Units
118
List of New Publication received during the year 2011-12
Sr. No. Name of the publication Publ. No. Printed copies
1. Planning and Management of Land Resources - 298
2. Soil Erosion of Himachal Pardesh maps 300 maps
3. Agro-Ecological Region of Uttar Pradesh + map 148 300/300
4 Land Resource Atlas Vidarbha Region Maharashtra 147 180
5 Soil Erosion of Haryana publ.no.149 149 200/200
6 Soil Erosion Manipur maps - 200 maps
7 Soil Loss of Arunachal Pradesh - 200 maps
9 Soil Loss of Sikkim - 200 maps
1. Maintenance of LAN Network
Maintenance of LAN Networking includesreplacement of Internet switches of server roomand old building i.e. Server Room CISCOGigabit SX-LC mini-GBIC with SC-LC fiberpatch cord and HP ProCurve-1700-24 portGigabit Switches – 3 no. and installation ofone Hp ProCurve-1700 switch in RSA division.Laying of UTP Cat-6 cable 305 mtrs, Fixingof communication 6U Rack, Laying of 100mtrs. Casing & PVC pipe, network project(communication rack), Cable Identification/Proper SMB, Fixing cable labeling at the frontSMB & Jack Panel/Cable dressing.
2. New Connection of Internet
Four new internet connections have beenprovided to the new users during the reportingperiod.
3. Corporate Client System
Cyberoam [Unified Threat Management] andSymantec-11.0 MR5 antivirus for the serverand 50 users. Cyberoam provided support forthree aspect i.e. Antivirus & Antispam, Web
5.5 Agricultural Knowledge Management Unit (AKMU)
& Application filter and Intrusion detection& Prevention (IDP). Symantec-11.0 antivirusfor the server and 50 users to support the virusprotection for the server as well as end users.Configuration of Server and 50 users in theCyberoam. Cyberoam support for the accessof internet through the Cyberoam. Create usersof Cyberoam in the server for accessing theinternet services, creating user accounts,modification of users account in the server,creating the internet access policies in the server.Monitoring the server and users day to day.
4. Management of Institute website
Staff of GIS Section was involved in work ofdesigning and updating of the institute website,as required. Staff also involved in collectionand compilation of web site material from thedifferent Divisions, Sections and RegionalCenters.
5. Maintenance of Video conferencing
system
Staff GIS Section involved in maintenance ofthe Video Conference Unit with frequentchecks on the incoming/outgoing link. Connect
During the period, 01.04.2011 to31.03.2012, two Sales and PublicationsCommittee meetings were organized and
the prices of New Publication were fixed andalso reviewed the cost of old publications.

AN
NU
AL R
EP
OR
T 2
011-1
2
119
Sections and Units
Video Conference Unit to the network foronline communication. The IP based videoconferencing system was installed in theinstitute. Under the system signal receiver atARIS cell, Video codec and plasma panel wereinstalled in the committee room. Under this
system two locations can be connected to seeand hear the other end of the communicationsite. This installed systems help in end-to-endinteraction during the important meetings/conferences. Use 128kbps x 4 total 512kbpslease line.
5.6 Cartography Unit
In addition to being engaged in research work(project achievement reported under researchtheme), the unit provided support services forthe following activities:
• Land Recourse Atlas of Vidarbha Region
• Agro-ecological region of Uttar Pradesh
• District contingent plan
As a centralized services centre, the followingwork has been undertaken:
Final art work / cover page design of followingdocuments:—
• Perspective plan 2030
• NBSS and LUP publication – catalogue2011
• Acid soils of India
• Soil loss of Haryana
• Soil of Hayatnagar
• Dharti 2010• Annual Report 2010-11
Maps redesigned for offset printing (CMYK)
• Soil loss map of Sikkim, Manipur, Meghalaya,Nagaland and Arunachal Pradesh of northeastern states, were completed.
• Soil loss map of Haryana, Punjab andHimachal Pradesh.
Maps Published
• Soil loss map of Himachal Pradesh,Haryana, Manipur, Arunachal Pradesh andSikkim.
• Agro-Ecological Region map of UttarPradesh.
Atlas Published
• Land Resource Atlas of Vidarbha Region.
Bulletin Published
• Agro-ecological Regions of Uttar Pradesh.
Digitization Work
• Base map of India showing districtboundaries on 1:4 m scale
• Diagrams of soil scape showing soil-physiographic relationship of Bengal basin,North-eastern Region, Malwa plateau,Vindhyan landscape, Narmada valley.
• Soil depth map at district level of differentdivisions of Madhya Pradesh
Plotting, scanning and other printing jobs
undertaken during the reported period
includes
• Total 53395 colour/monocolour prints (A3and A4 size) were brought out of differentproject documents, Annual report,Technical report, ppts, maps and diagrams,media coverage and research papers.
Document Reproduction
• About 220928 copies were reproduced.
Other Activities
• Maintenance of classified documents andsending their annual safe custody.
• Correspondence with Survey of India andMinistry of Defence regarding securityclearance of published maps.
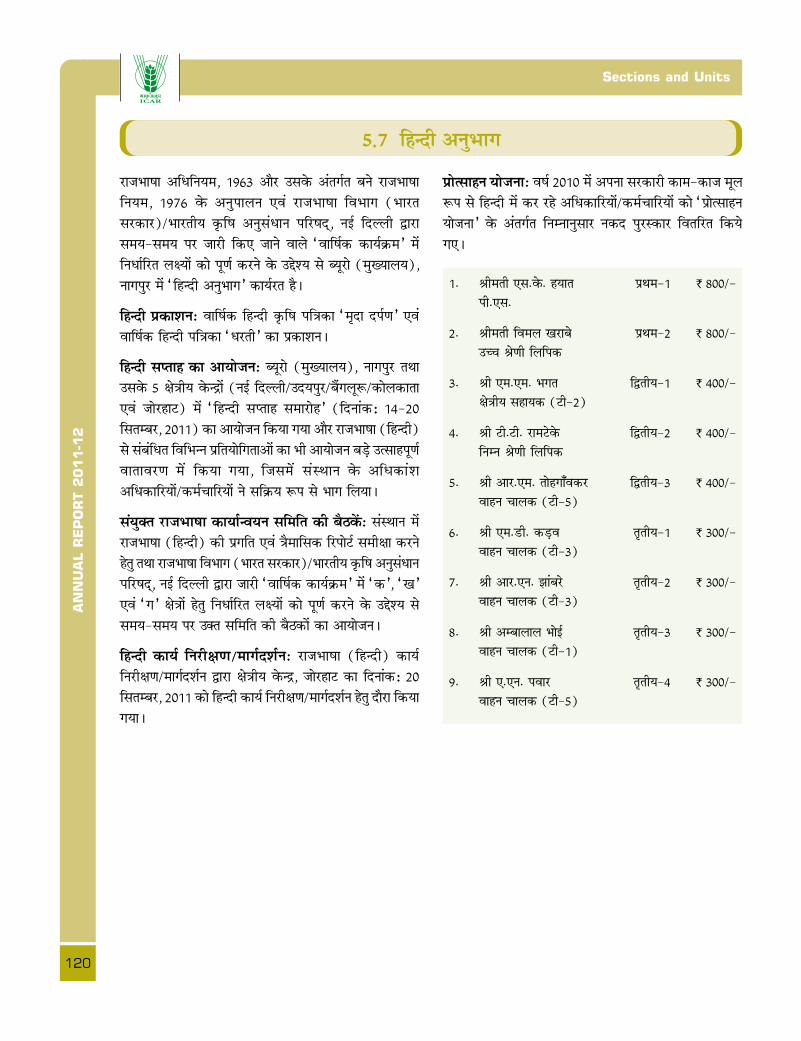
AN
NU
AL R
EP
OR
T 2
011-1
2Sections and Units
120
5-7 fgUnh vuqHkkx
jktHkk"kk vfËkfu;e] 1963 vkSj mlosG varxZr cus jktHkk"kkfu;e] 1976 osG vuqikyu ,oa jktHkk"kk foHkkx (Hkkjrljdkj)@Hkkjrh; œf"k vuqlaËkku ifj"kn~] ubZ fnYyh }kjkle;≤ ij tkjh fd, tkus okys ^okf"kZd dk;Zÿe* esafuËkkZfjr y{;ksa dks iw.kZ djus osG mÌs'; ls C;wjks (eq[;ky;)]ukxiqj esa ^fgUnh vuqHkkx* dk;Zjr gSA
fgUnh Ádk'ku% okf"kZd fgUnh œf"k if=dk ^e`nk niZ.k* ,oaokf"kZd fgUnh if=dk ^Ëkjrh* dk Ádk'kuA
fgUnh lIrkg dk vk;kstu% C;wjks (eq[;ky;)] ukxiqj rFkkmlosG 5 {ks=h; osGUÊksa (ubZ fnYyh@mn;iqj@cSaxyw:@dksydkrk,oa tksjgkV) esa ^fgUnh lIrkg lekjksg* (fnukad% 14&20flrEcj] 2011) dk vk;kstu fd;k x;k vkSj jktHkk"kk (fgUnh)ls lacafËkr fofHkUu Áfr;ksfxrkvksa dk Hkh vk;kstu cM+s mRlkgiw.kZokrkoj.k es a fd;k x;k] ftlesa laLFkku osG vfËkdka'kvfËkdkfj;ksa@deZpkfj;ksa us lfÿ; :i ls Hkkx fy;kA
la;qDr jktHkk"kk dk;kZUo;u lfefr dh cSBosaG% laLFkku esajktHkk"kk (fgUnh) dh Áxfr ,oa =Sekfld fjiksVZ leh{kk djusgsrq rFkk jktHkk"kk foHkkx (Hkkjr ljdkj)@Hkkjrh; œf"k vuqlaËkkuifj"kn~] ubZ fnYyh }kjk tkjh ^okf"kZd dk;Zÿe* esa ^d*] ^[k*,oa ^x* {ks=ksa gsrq fuËkkZfjr y{;ksa dks iw.kZ djus osG mÌs'; lsle;≤ ij mDr lfefr dh cSBdksa dk vk;kstuA
fgUnh dk;Z fujh{k.k@ekxZn'kZu% jktHkk"kk (fgUnh) dk;Zfujh{k.k@ekxZn'kZu }kjk {ks=h; osGUÊ] tksjgkV dk fnukad% 20flrEcj] 2011 dks fgUnh dk;Z fujh{k.k@ekxZn'kZu gsrq nkSjk fd;kx;kA
ÁksRlkgu ;kstuk% o"kZ 2010 esa viuk ljdkjh dke&dkt ewy:i ls fgUnh esa dj jgs vfËkdkfj;ksa@deZpkfj;ksa dks ^ÁksRlkgu;kstuk* osG varxZr fuEukuqlkj udn iqjLdkj forfjr fd;sx,A
1- Jherh ,l-osG- g;kr ÁFke&1 ` 800@&ih-,l-
2- Jherh foey [kjkcs ÁFke&2 ` 800@&mPp Js.kh fyfid
3- Jh ,e-,e- Hkxr f}rh;&1 ` 400@&{ks=h; lgk;d (Vh&2)
4- Jh Vh-Vh- jkeVsosG f}rh;&2 ` 400@&fuEu Js.kh fyfid
5- Jh vkj-,e- rksgxk°odj f}rh;&3 ` 400@&okgu pkyd (Vh&5)
6- Jh ,e-Mh- dM+o r`rh;&1 ` 300@&okgu pkyd (Vh&3)
7- Jh vkj-,u- >kacjs r`rh;&2 ` 300@&okgu pkyd (Vh&3)
8- Jh vEckyky HkksbZ r`rh;&3 ` 300@&okgu pkyd (Vh&1)
9- Jh ,-,u- iokj r`rh;&4 ` 300@&okgu pkyd (Vh&5)

AN
NU
AL R
EP
OR
T 2
011-1
2
121
Sections and UnitsLinkages
Linkages
6
Name of Institution Area/Purpose of Linkage
• NRSC, Hyderabad Procurement of satellite data and project implementation(as a collaborator).
• Department of Space/ISRO - do -
• SAC, Ahemadabad - do -
• RRSSC, Nagpur - do -
• IIT, Kanpur Collaboration in undertaking studies on fluvial cycle inthe IGP.
• SAUs Collaboration in implementation of research programmes.
• BCKV, Mohanpur (West Bengal) and Implementation of Research, Teaching and TrainingDr. P.D.K.V., Akola (Maharashtra) programmes.
• ICRISAT, Patancheru Soil reflectance studies (collaboration in projectimplementation).
• IISS, Bhopal, CICR, Nagpur, NRCC, Nagpur and Collaboration in implementation of research programmesICAR crop institutes in other states on assessment / land reconcilement of degradation
(database of) and crop suitability evaluation.
• State Agricultural Departments Collaboration in Soil Survey and Correlation activitiesand land use plan development and implementation ofresearch programmes.
• CMMACS, CSIR Collaboration in research project on SuitabilityEvaluation of Aromatic and Medicinal plants.
• CYMMIT, New Delhi Development of soil resource inventory for BorlougInstitute for South Asia (BISA).
• ISRIC, ITC, The Netherlands Development of Geo-referenced Indian Soil ResourceInformation System.
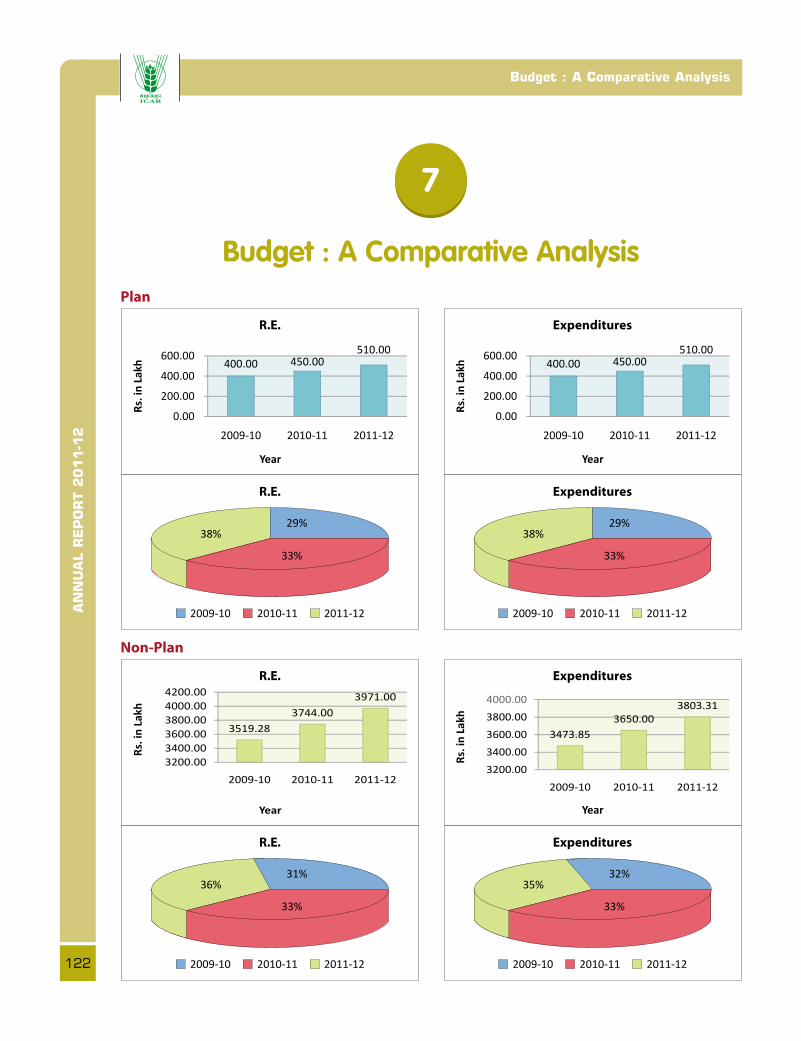
AN
NU
AL R
EP
OR
T 2
011-1
2Sections and Units
122
Budget : A Comparative Analysis
Budget : A Comparative Analysis
7
AN
NU
AL R
EP
OR
T 2
011-1
2
123
Sections and Units
• Dr. Dipak Sarkar, Director was nominated by HisExcellency, the Governor of West Bengal to be oneof the Members of Agricultural Advisory Committeeto prepare a Draft Agricultural Policy of West BengalState. He is one of the members of a 13-membercommittee to work on formulating New AgriculturalPolicy of the state for sustained productivity of the landtowards increasing crop and livestock production aswell as livelihood security of the farmers of the state.
• Dr. Rajeev Srivastava, Pr. Scientist & Head, Divisionof Remote Sensing Applications was nominated asMember, Institute Mana-gement Committee (IMC)of NBSS&LUP, Nagpur for the period, 31-10-2011to 30-01-2014 and CSSRI, Karnal for the period from5-12-2011 to 4-12- 2014 by the ICAR.
• Dr. T. Bhattacharyya was nominated as a memberof the Editorial Board of the Indian Society of SoilScience, New Delhi.
• Dr. Jagdish Prasad, Principal Scientist was nominatedas an expert in the State Project Sanctioning andMonitoring Committee (SPSMC) of Chhattisgarh byDr. S. Ayyappan, Hon’ble Secretary, DARE andDirector General, ICAR.
• Dr. S.K. Mahapatra, Principal Scientist was electedas Vice President, Indian Society of Soil Survey andLand Use Planning for the years 2011 and 2012.
Awards and Recognitions
8
• Dr. Jagdish Prasad, Principal Scientist was electedVice-President, Indian Society of Soil Science for2012-13.
• Dr. Jagdish Prasad, Principal Scientist was nominatedas a Member of the Editorial Board, Indian Societyof Soil Science for 2012-13.
• Dr. Krishnendu Das, Principal Scientist, RegionalCentre, Kolkata was elected as recorder of theSection of Agriculture and Forestry Sciences for2012-2013 and 2013-14 (100th and 101st Sessionof the Indian Science Congress).
• Dr. Rajendra Hegde, Principal Scientist received bestpaper presentation award at “National Seminar onInnovative Technologies to Enhance AgriculturalProduction” held at Mangalore, Karnataka, July21-22, 2011.
• The paper presented on “Soil Resource Mappingfor Command Area Development – A Case Study inChikkasinakere Hobli, Maddur Taluk, MandayaDistrict, Karnataka” by Dr.A. Natarajan and otherswas adjudged the best paper in the National Seminaron “Geospatial Solutions for Resources Conservationand Management”, organized by KSRSAC during18-19th January, 2012 at Bangalore.
Awards and Recognitions


AN
NU
AL R
EP
OR
T 2
011-1
2
125
List of Publications
List of Publications
9
Research Papers
Anil Kumar, K.S. Nair, K.M. and. Gaddi, A.V.(2011). Characterization of soils ofTalaulim watershed, North Goa and theirsuitability for cashew production. Journalof Plantation Crops 39:363-369.
Anil Kumar, K.S., Hegde, Rajendra, RameshKumar, S.C. (2010). Characteraisation ofsoils of micro watershed in eastern dryzone of Karnataka. Agropedology20:182-188
Anil Kumar, K.S., Krishnan, P., Natarajan, A.and Nair, K.M., (2010). Land and soilattributes and their evaluation for coffee-growing in Karnataka, Mysore Journalof Agricultural Sciences 44:793-802
Bhaskar, B.P., Sarkar, Dipak, Bobade, S.V.,Gaikwad, M.S., Gaikwad, S.S., Nimkar,A.M., Anantwar, S.G., Patil, S.V. andBhattacharyya, T. (2011). Land resourceevaluation for optimal land use plans incotton growing Yavatmal district,Maharashtra. The Ecoscan 1:251-259
Bhattacharyya, T., Pal, D.K., Deshmukh, A.S.,Deshmukh, R.R., Ray, S.K., Chandran,P., Mandal, C., Telpande, B., Nimje,A.M. and Tiwary, P. (2011). Evaluationof RothC Model using four long termfertilizer experiments in black soils, India.Agriculture, Ecosystems andEnvironment 144:222-34
Bhople, Balkrishna S., Pal, D.K., Ray, S.K.,Bhattacharyya, T. and Chandran,
P. (2011). Seat of charge in clay smectitesof some Vertisols from Mahrashtra. ClayResearch 30:15-27
Dhanorkar, B.A., Niranjana, K.V., Koyal, Arti,Naidu, L.G.K., Reddy, R.S., and Sarkar,Dipak (2010). Soil resources inventoryof lateritic terrain of Medak district,Andhra Pradesh for sustainable cropplanning. Agropedology 20:97-102
Dongare, Vishakha T., Obi Reddy, G.P., Maji,A.K. and Ramteke, I.K. (2012).Characterization of landforms and soilsin complex geological formations—A remote sensing and GIS approach,Journal of The Indian Society of RemoteSensing, DOI: 10.1007/s12524-011-0195-y
Jat, R.S., Meena, H.N., Singh A.L., Surya, JayaN. and Misra, J.B. (2011). Weedmanagement in Groundnut (Arachiahypogaea L.) in India – A Review.Agricultural Reviews 32:155-171
Karthikeyan, K. and Shukla, L.M. (2011).Different forms of boron and sulphur andtheir effect on B and S contents inmustard (Brassica juncea L.) andsunflower (Helianthus annus L.).Agropedology 21: 28-34
Kumar, Mahesh, Singh, S.K., Raina, P. andSharma, B.K. (2011). Status of availablemajor and micronutrients in arid soils ofChuru district of Western Rajasthan.Journal of the Indian Society of SoilScience 59: 188-192
AN
NU
AL R
EP
OR
T 2
011-1
2List of Publications
126
Likhar, Chetna K. and Jagdish Prasad (2011).Productivity and suitability assessment oforange (Citrus reticulata)-growing soilsin Nagpur. Indian Journal of AgriculturalSciences 81:16-21
Likhar, Chetna, K. and Jagdish Prasad (2011).Characterization and classification oforange- growing soils developed fromdifferent parent materials in Nagpurdistrict, Maharashtra. Journal of theIndian Society of Soil Science 59:209-217
Mandal, D.K., Goswami, S.N., Mandal, C. andSarkar, Dipak (2011). Potential areas fordiversified pulses production- An agro-eco based study. Indian Journal ofFertilisers 7:32-44
Mandal, D.K., Goswami, S.N., Mandal, C.,Sarkar, Dipak and Jagdish Prasad (2012).Sustainable use of shallow soils in thecontext of global climate change. IndianJournal of Fertilisers 8:32-44
Nagaraju, M.S.S., Obi Reddy, G.P., Maji, A.K.Srivastava, Rajeev, Raja, P. and Barthwal,A.K. (2011). Soil loss mapping forsustainable development and managementof land resources in Warora Tehsil ofChandrapur district of Maharashtra: Anintegrated approach using remote sensingand GIS Journal of the Indian Society ofRemote Sensing 39:51-61
Naidu, L.G.K., Ramamurthy, V., Sidhu, G.S.and Sarkar, Dipak (2011). Emergingdeficiency of potassium in soils and cropsof India. Karnataka Journal ofAgricultural Sciences 24: 12-19
Niranjana, K.V., Ramamurthy, V., Hegde,Rajendra, Srinivas, S., Koyal, Arti,Naidu, L.G.K. and Sarkar, Dipak (2011).Characterization, classification andsuitability evaluation of banana growingsoils of Pulivendla Region, AndhraPradesh. Journal of the Indian Society ofSoil Science 59:1-5.
Pandey, C.B., Singh, Lalita, and Singh, S.K.(2011). Buttresses induced habitat hetero-geneity increases nitrogen availability intropical rainforests. Forest Ecology andManagement 262: 1679-1685
Panwar, P., Pal, S., Reza, S.K. and Sharma, B.(2011). Soil fertility index, soil evaluationfactor, and microbial indices underdifferent land uses in acidic soil of humidsubtropical India. Communications inSoil Science and Plant Analysis, 42: 2724-2730
Patil N. G., Chaturvedi, A. (2012). Pedotransferfunctions based on nearest neighbour andneural networks approach to estimateavailable water capacity of shrink-swellsoils. Indian Journal of AgriculturalSciences 82:35-38
Patil, N.G. and Chaturvedi, A. (2011).Estimation of bulk density of waterloggedsoils from basic properties. Archives ofAgronomy and Soil Science DOI10.1080/03650340.2010.530254
Patil, N.G., Pal, D.K., Mandal, C. and Mandal,D.K. (2011). On describing soil waterretention characteristics of Vertisols andpedo-transfer functions based on nearestneighbour and neural networks approachto estimate AWC. Journal of Irrigationand Drainage Engineering (DOI.10.1061/(ASCE) IR.1943-4774.0000375)
Patil, N.G., Ramamurthy, V. and Parhad, V.N.(2012). Optimal irrigation regime andsoil moisture dynamics of cotton crop inVidarbha region of Maharashtra. Journalof Cotton Research and Development26:41-46
Ramamurthy, V., Naidu, L.G.K., Srinivas, S.,Obi Reddy, G.P. and Sarkar, Dipak(2012). Delineation of potential areasfor safflower production in DeccanPlateau. Journal of Oilseeds Research 29:226-233
AN
NU
AL R
EP
OR
T 2
011-1
2
127
List of Publications
Reza, S.K., Ahmed, N. and Pal, S. (2010).Characterization, classification andmapping of soils of Panja-Rao watershed,Saharanpur, Uttar Pradesh. Agropedology20:124-132
Reza, S.K., Baruah, U., Sarkar, Dipak andDutta, D.P. (2011). Influence of slopepositions on soil fertility index, soilevaluation factor and microbial indices inacid soil of humid subtropical India. IndianJournal of Soil Conservation 39: 44-49
Sarkar, Dipak and Haldar, Abhijit (2011).Extraction of boron using differentextractants in soils of two agro-ecologicalsubregions, West Bengal – A comparativestudy. Agropedology 21:40-43
Sarkar, Dipak and Singh, S.K. (2011). State-wise distribution of soils, land useplanning under coastal ecosystem: Assessand way forward. Journal of the IndianSociety of Coastal Agricultural Research29:19-25
Sharma, B.D., Sidhu, G.S., Sarkar, D. andKukal, S.S. (2012). Soil organic carbon,phosphorous and potassium status inrice-wheat soils of different agro-climaticzones in Indo-Gangetic plains of India.Communication in Soil Science and PlantAnalysis 43:1-19
Shivaramu, H.S. and Niranjana, K.V. (2010).Soil-site suitability evaluation of Alfisols forfinger millet. Agropedology 20:139-144
Singh, Ashok K., Ram, H. and Jagdish Prasad(2011). Urea transformation and yield ofrice as influenced by neem products inthree soil types. Indian Journal ofFertilisers 7:12-15
Singh, S.K., Pandey, C.B., Sidhu, G.S., Sarkar,Dipak and Sagar, R. (2011). Concentrationand stock of carbon in the soils affectedby land uses and climates in the WesternHimalaya, India. Catena 87 : 78-89
Srinivasan, R., Natarajan, A., Anil Kumar, K.S.and. Kalaivanan, D. (2011). Landsuitability evaluation of soils of DakshinKannada district of Karnataka for cashewproduction, Journal of Plantation Crops39: 325-329
Walke, N. Obi Reddy, G.P., Maji, A.K.Thayalan, S. (2012). GIS-basedmulticriteria overlay analysis in soil-suitability evaluation for cotton(Gossypium spp.): A case study in theblack soil region of Central India.Computers and Geosciences 41:108-118
Reports/Bulletins
Anil Kumar, K.S., Ramesh Kumar, S.C.,Dhanorkar, B.A., Vadivelu, S., Naidu,L.G.K. and Sarkar, Dipak (2010).Detailed assessment of land and soilresources of Kuppam mandal, ChittoorDistrict, Andhra Pradesh, NBSS Publ.No.1030, NBSS&LUP, Nagpur.
Bhattacharyya, T., Chandran, P., Venugopalan,M.V., Pal, D.K., Ray, S.K., Mandal, C.,Tiwary, P., Sarkar, Dipak, Singh, A.K.,Aggarwal, P.K., Pathak, H., Kumar, S.N.,Venkateswaralu, B., Dasgupta, D.,Balbuddhe, D., and Nimje, A.M. (2011).Indigenous Technical Knowledge (ITK)for Climate Change in Indian Agriculture.Special Publication for the NationalProject on Climate Change (NPCC),ICAR on “Changes in soil carbonreserves as influenced by differentecosystems and land use in India” NBSS& LUP, Nagpur, 27 p.
Bhattacharyya, T., Ray, S.K., Sarkar, Dipak,Balbuddhe, D.V., Dasgupta, D.,Chandran, P., Tiwari, P., Pal, D.K.,Mandal, C., Nimje, A.M., Deshmukh,A.S., Deshmukh, R.R., Telpande, B.A.,Lokhande, M.A., Wadhai, K.N.,Dongare, V.T., Thakre, S.W., Likhar,C.K., Sheikh, S.M., Aggarwal,
AN
NU
AL R
EP
OR
T 2
011-1
2List of Publications
128
P.K., Pathak, H., Venkateswarlu, B., Rao,V.U.M., Naresh Kumar Soora and Singh,A.K. (2011). Soil resource informationof different agro-eco subregions of Indiafor crop and soil modelling. NationalProject on climate change (ICARNetwork Project), National Bureau ofSoil Survey and Land Use Planning,Nagpur, Maharashtra, p302 and 188pages annexure.
Giridhar, K, Elanagovan, A.D., Khandekar, P.,Sharanagouda, P., Hegde, Rajendra andSampth, K.T. (2011). Azolla, a novelgreen feed for animals. Technical Bulletinno 5. NAIP (ICAR) Bangalore.
Maji, A.K., Obi Reddy, G.P. and Sarkar, Dipak(2012). Acid Soils of India- Their extentand Spatial Distribution, NBSS Publ.145,NBSS&LUP, Nagpur p.138.
Nagaraju, M.S.S., Srivastava, R., Maji, A.K.and Barthwal, A.K. (2011). IntegratedApproach of Remote Sensing and GIS inLand Resources Characterization,Evaluation and Mapping in SaraswatiWatershed in Buldhana District ofMaharashtra. (Project Report) NationalBureau of Soil Survey and Land UsePlanning (ICAR), Nagpur. 54p.
Naidu, L.G.K., Niranjana, K.V., Anil Kumar,K.S., Thayalan, S., Ramesh Kumar, S.C.,Ramamurthy, V., Hegde, Rajendra,Srinivas, S., Natarajan, A. and Vadivelu,S. (2011). Planning optimum land usebased on bio-physical and economicresources in Pulivendula agriculturaldivision – Kadappa district, AP, NBSSPubl. 1029 NBSS&LUP, Nagpur, India,184 p.
Nair, K.M., Anil Kumar, K.S., Naidu, L.G.K.,Sarkar, Dipak and Rajasekharan, P.(2012). Agro-ecology of Thiruvanatha-puram District, Kerala. NBSS Publ. No.1038 (A), NBSS&LUP, Nagpur, India,145 p.
Nair, K.M., Anil Kumar, K.S., Naidu, L.G.K.,Sarkar, Dipak and Rajasekharan, P.(2012). Agro-ecology of Kollam District,Kerala. NBSS Publ. No. 1038 (B),National Bureau of Soil Survey and LandUse Planning, Nagpur, India, 146 p.
Nair, K.M., Anil Kumar, K.S., Naidu, L.G.K.,Sarkar, Dipak and Rajasekharan, P.(2012). Agro-ecology of PathanamthittaDistrict, Kerala. NBSS Publ. No. 1038(C), National Bureau of Soil Survey andLand Use Planning, Nagpur, India, 132 p.
Nair, K.M., Anil Kumar, K.S., Naidu, L.G.K.,Sarkar, Dipak and Rajasekharan, P.(2012). Agro-ecology of AlappuzhaDistrict, Kerala. NBSS Publ. No.1038(D), National Bureau of Soil Surveyand Land Use Planning, Nagpur, India,139 p.
Nair, K.M., Anil Kumar, K.S., Naidu, L.G.K.,Sarkar, Dipak and Rajasekharan, P.(2012). Agro-ecology of KottayamDistrict, Kerala. NBSS Publ. No. 1038(E),National Bureau of Soil Survey and LandUse Planning, Nagpur, India, 126 p.
Nair, K.M., Anil Kumar, K.S., Naidu, L.G.K.,Sarkar, Dipak and Rajasekharan, P.(2012). Agro-ecology of Idukki District,Kerala. NBSS Publ. No. 1038(F),National Bureau of Soil Survey and LandUse Planning, Nagpur, India, 137 p.
Nair, K.M., Anil Kumar, K.S., Naidu, L.G.K.,Sarkar, Dipak and Rajasekharan, P.(2012). Agro-ecology of EranakulamDistrict, Kerala. NBSS Publ. No. 1038(G),National Bureau of Soil Survey and LandUse Planning, Nagpur, India, 126 p.
Nair, K.M., Anil Kumar, K.S., Naidu, L.G.K.,Sarkar, Dipak and Rajasekharan, P.(2012). Agro-ecology of Thrissur District,Kerala. NBSS Publ. No. 1038(H),National Bureau of Soil Survey and LandUse Planning, Nagpur, India, 149 p.
AN
NU
AL R
EP
OR
T 2
011-1
2
129
List of Publications
Nair, K.M., Anil Kumar, K.S., Naidu, L.G.K.,Sarkar, Dipak and Rajasekharan, P.(2012). Agro-ecology of PalakkadDistrict, Kerala. NBSS Publ. No. 1038(I),National Bureau of Soil Survey and LandUse Planning, Nagpur, India, 222 p.
Nair, K.M., Anil Kumar, K.S., Naidu, L.G.K.,Sarkar, Dipak and Rajasekharan, P.(2012). Agro-ecology of MalappuramDistrict, Kerala. NBSS Publ. No. 1038(J),National Bureau of Soil Survey and LandUse Planning, Nagpur, India, 154 p.
Nair, K.M., Anil Kumar, K.S., Naidu, L.G.K.,Sarkar, Dipak and Rajasekharan, P.(2012). Agro-ecology of KozhikkodeDistrict, Kerala. NBSS Publ. No. 1038(K),National Bureau of Soil Survey and LandUse Planning, Nagpur, India, 130 p.
Nair, K.M., Anil Kumar, K.S., Naidu, L.G.K.,Sarkar, Dipak and Rajasekharan, P.(2012). Agro-ecology of WayanadDistrict, Kerala. NBSS Publ. No. 1038(L),National Bureau of Soil Survey and LandUse Planning, Nagpur, India, 118 p.
Nair, K.M., Anil Kumar, K.S., Naidu, L.G.K.,Sarkar, Dipak and Rajasekharan, P.(2012). Agro-ecology of Kannur District,Kerala. NBSS Publ. No. 1038(M),National Bureau of Soil Survey and LandUse Planning, Nagpur, India, 146 p.
Nair, K.M., Anil Kumar, K.S., Naidu, L.G.K.,Sarkar, Dipak and Rajasekharan, P.(2012). Agro-ecology of KasargodDistrict, Kerala. NBSS Publ. No. 1038(N),National Bureau of Soil Survey and LandUse Planning, Nagpur, India, 150 p.
Nair, K.M., Anil Kumar, K.S., Srinivas, S.,Sujatha, K., Venkatesh, D.H., Naidu,L.G.K., Sarkar, Deepak andRajasekharan, P. (2011). Agro-ecology ofKerala. NBSS Publ. No. 962, NationalBureau of Soil Survey and Land UsePlanning, Nagpur, India
Nair, K.M., Thayalan, S. Anil Kumar, K.S.,Naidu, L.G.K. and Sarkar, Dipak (2011)..Soils of Thirupuram, Kanjiramkulam,and Kadinamkulam Panchayats ofThiruvanathapuram District, Kerala.National Agricultural Innovation Project-A Value chain for coconut fiber and itsbyproducts: Manufacture of diversifiedproducts of higher value and bettermarketability to enhance the economicreturns to farmers, NBSS&LUP Publ.1032., National Bureau of Soil Survey andLand Use Planning, Nagpur, India 65 p.
Natrajan, A., Hegde, Rajendra, Srinivas, S.,Anil Kumar, K.S, Naidu, L.G.K. andSarkar, Dipak (2012). Land ResourceInventory of Durgada Nagenahallivillage, Ellerampura Panchayat,Korategere taluk, Tumkur District,Karnataka for Integrated Developmentunder NICRA Project, NBSS Publ.National Bureau of Soil Survey and LandUse Planning, Nagpur, India 108 p.
Obi Reddy, G.P., Maji, A.K., Das, S.N. andSrivastava, Rajeev (2012). Developmentof GIS based seamless mosaic of SRTMelevation data of India to analyze andcharacterize the selected geomorphicparameters. (Project Report), NationalBureau of Soil Survey and Land UsePlanning (ICAR), Nagpur. 54p.
Ray, S.K., Bhattacharyya, T., Sarkar, D.,Mandal C., Sidhu, G.S., Sahoo, A.K.,Nair, K.M., Singh, R.S., Dutta, D.,Chandran, P., Pal, D.K., Tiwary, P.,Mandal, D.K., Jagdish Prasad,Venugopalan, M.V., Srivastava, A.K.,Rayachaudhury, M., Vemourougane, K.,Srivastava, R., Sen, T.K., Chatterji, S.,Obireddy, G.P., Patil, N.G., Mahapatra,S.K., Das, K., Singh, A.K., Shrinivas S.,Reza, S.K., Balbuddhe, D.V., MrunmayeeLokhande, Wadhai, K.N., Dongare,Vishakha, Mohanty, B., Majumadar, S.,Ganjanna, K.V., Garhwar, R.S., Meena,

AN
NU
AL R
EP
OR
T 2
011-1
2List of Publications
130
K.K., Hazarika, D., Sahu, A., Mahapatra,S. and Ashutosh Kumar, Nimje, A.N.,Deshmukh, R.R.., Deshmukh, A.D.,Thakre S.W., Dasgupta, D., Telpande,B.A., Likhar, C.K., Sheikh, S., (2011). “Gereferenced Soil Information System forLand Use Planning and Monitoring Soiland Land Quality for Agriculture”Baseline Data for the Indo-Ganetic Plainsand the Back Soil Region, Vol-I IGP,Division of soil Resouce Studies,NBSS&LUP, Nagpur, p563.
Ray, S.K., Bhattacharyya, T., Sarkar, D.,Mandal C., Sidhu, G.S., Sahoo, A.K.,Nair, K.M., Singh, R.S., Dutta, D.,Chandran, P., Pal, D.K., Tiwary, P.,Mandal, D.K., Jagdish Prasad,Venugopalan, M.V., Srivastava, A.K.,Rayachaudhury, M., Vemourougane, K.,Srivastava, R., Sen, T.K., Chatterji, S.,Obireddy, G.P., Patil, N.G., Mahapatra,S.K., Das, K., Singh, A.K., Shrinivas S.,Reza, S.K., Balbuddhe, D.V., MrunmayeeLokhande, Wadhai, K.N., Dongare,Vishakha, Mohanty, B., Majumadar, S.,Ganjanna, K.V., Garhwar, R.S., Meena,K.K., Hazarika, D., Sahu, A., Mahapatra,S. and Ashutosh Kumar, Nimje, A.N.,Deshmukh, R.R.., Deshmukh, A.D.,Thakre S.W., Dasgupta, D., Telpande,B.A., Likhar, C. K., Sheikh, S., (2011). “Gereferenced Soil Information System forLand Use Planning and Monitoring Soiland Land Quality for Agriculture”Baseline Data for the Indo-Ganetic Plainsand the Back Soil Region, Vol-II BSR,Division of soil Resouce Studies,NBSS&LUP, Nagpur, p548.
Sohan Lal, Mandal, C., Mandal, D.K.,Rathore, R.S., Gajbhiye, K.S., Sarkar,Dipak (2011). Agro-Ecological Regionsof Uttar Pradesh. NBSS & LUP Publno.148, 112 p.
Soil Erosion in Haryana. Technical Bulletin No.149. NBSS&LUP, Nagpur
Books
NBSS&LUP (ICAR) (2011). NBSS&LUPGlorious 30 Years, National Bureau ofSoil Survey and Land Use Planning(Indian Council of AgriculturalResearch), Nagpur-440033
SAARC Agricultural Centre (2011). Strategiesfor Arresting Land Degradation in SouthAsian Countries. (Sarkar, Dipak, Azad,Abul Kalam, Singh, S. K. and AkhterNasrin Eds.), BARC Complex, Farmgate,Dhaka -1215, Bangladesh
Singh, A.K. and Singh, R.S. (2011). CropModelling for Land Use Planning.Agrotech Publishing House, Udaipur
Book Chapters
Bhattacharyya, T., Pal, D.K., Chandran, P.,Ray, S.K., Mandal, C., Wani, S.P. andSahrawat, K.L. (2011). Carbon status ofIndian soils : an overview. In : SoilCarbon Sequestration for ClimateChange Mitigation and Food Security(Srinivasa Rao et al., Eds.) pp.11-30,CRIDA, Hyderabad, India.
Hegde, Rajendra Natarajan, A., Naidu, L.G.K.and Sarkar, Dipak (2011). SoilDegradation in “Soil Erosion Issues inAgriculture” edited by Danilo Godoneand Silvia Stanchi, open access book byInTech. org publishers, Croatia, pp348.
Natarajan A., Hegde, Rajendra, Naidu, L.G.K.and Sarkar, Dipak (2011). Manual on“Land resources inventorization forintegrated watershed development inKarnataka”. Published by Karnatakastate watershed development department.
Pushpanjali and Karthikeyan, K. (2011).Hyperspectral remote sensing for soilorganic carbon prediction: An overview.In : Soil Carbon Sequestration forClimate Change Mitigation and FoodSecurity (Srinivasa Rao et al., Eds.)pp.142-160, CRIDA, Hyderabad, India.

AN
NU
AL R
EP
OR
T 2
011-1
2
131
List of Publications
Ramamurthy, V. (2011). Participatory andIntegrated Agricultural land usePlanning-Concepts, methodology andimpact. In: Planning and Management ofLand resources (Ed.by Ramamurthy,V.and Dipak Sarkar), NBSS pub. No.1033,113-121p.
Ramamurthy,V. and Sarkar, Dipak (2011).(Ed.) Planning and Management of Landresources. NBSS Publ. No.1033, 217pp.
Ramesh Kumar, S.C. (2011). Stakeholderanalysis for Land Use Planning InPlanning and Management of LandResources (edited by Ramamurthy andDipak Sarkar), NBSS&LUP report No1033, NBSS&LUP, Nagpur.
Sarkar, Dipak and Ramamurthy, V. (2011).Present status of land use and land useplanning in India. In: Planning andManagement of Land resources (Ed.Ramamurthy,V. and Dipak Sarkar),NBSS pub. No.1033, 6-14p.
Sarkar, Dipak and Ramamurthy, V. (2011).Present status of land use and land useplanning in India. In: Planning andManagement of Land resources (Ed.byRamamurthy, V. and Dipak Sarkar),NBSS pub. No.1033, 6-14p
Singh, A.K. and Singh, S.K. (2011). Strategiesfor Arresting Land Degradation in SouthAsian Countries. In (Sarkar, Dipak, Azad,Abul Kalam, Singh, S. K. and AkterNasrin Eds.) Strategies for Arresting LandDegradation in South Asian Countries.SAARC Agricultural Centre, BARCComplex, Farmgate, Dhaka -1215,Bangladesh.
Popular Articles/Other Documents
Chaturvedi A, Patil N.G. and Goswami, S.N.(2011). Reorienting land use strategiesfor socio-economic development in UttarPradesh. Economic and Political WeeklyJune 25 - July 8, 2011.
Ramamurthy,V. (2011). Manninda Kayamanninda (Kannada). VokkaligaraPatrike, 2 (1): 18-19.
Seminars/Symposia
Banerjee, Tapati , Dharumarajan, S., Singh,S.K. and Sarkar, Dipak (2011). Largescale mapping of alluvial plain using highresolution satellite data and GIS. 33rdIndian Geography Congress hosted byDepartment of Geography, The Universityof Burdwan, Barddhaman, West Bengalduring November 11-13, 2011.
Bhaskar, B.P., Sarkar, Dipak, Gaikwad, M.S.,Bobade, S.V., Gaikwad, S.S., Anantwar,S.G., Nimkar, A.M., Parad, V.N. andPatil, S.V. (2011). Land resourceevaluation for optimal land use plans incotton growing Yavatmal district,Maharashtra. 3rd InternationalConference on Climate Change, ForestResources and Environment. December9th to 11, 2011. Department ofEnvironmental Sciences of KerelaUniversity, Thiruvananthapuram.
Bhattacharyya, T., Kundu, S., Benbi, D.K.,Mandal, B., Mandal, U., Subba Rao, A.,Sarkar, D., Ray., S.K., Chandran, P., Pal,D.K., Mandal, C., Telpande, B.A.,Tiwary, P., Lokhande, M.A., Deshmukh,A.S. and Sonali Verma. (2012).Interpolation of Village Level Datasetsthrough Krigging in Different Agro-EcoSub-regions. National Seminar onGeospatial Solutions for ResourceConservation and Management. 18-19January, 2012, Indian Institute of Science,Bengaluru (Abstracted).
Chandran, P., Mandal, C., Bhattacharyya, T.,Sarkar, D., Pal, D.K., Ray, S.K., JagdishPrasad, Tiwary, P., Srivastava, R.,Lokhande, M., Wadhai, K., Donagre, V.,Dijkshoorn, J.A., Batjes, N.H., andBrindaban, P.S. (2012). Soil and Terrain
AN
NU
AL R
EP
OR
T 2
011-1
2List of Publications
132
Information System of the Indo-GangeticPlains, India for Resource Planning.National Seminar on GeospatialSolutions for resource Conservation andManagement, Indian Institute of Science,Bengaluru, 18-19 January, 2012. P4
Chaturvedi, A, Patil, N.G., Hajare, T.N,Mungole, Arvind, Borkar, Layant,Gattani, Anand, Mokde, Mamta andBhangale, Gajendra (2012).Technological options for forest basedrural livelihoods in Gondia. Paperpresented during ‘National Conferenceon ‘Demonstrated Options for ImprovedLivelihood in Disadvantaged Areas ofIndia’ 20-21 January 2012. IGKV Raipur.
Chaturvedi, Arun, Hajare, Trilok and Patil,N.G. (2012). Participatory Land UsePlanning A Tool for Successful RuralDevelopment. Paper presented during‘National Seminar on WatershedManagement for Natural ResourceManagement’ organized by Kerala StateLand Use Board at Thiruvanantpuram,Feb. 2012
Chaturvedi, Arun, Patil, N.G. and Hajare, T.N.(2011). Forests: Livelihood and PovertyIssues. Paper presented during NationalSeminar on “Forests for People” jointlyorganized by Post Graduate Departmentof Botany, RTM Nagpur University,Nagpur and Department of Forests,Government of Maharashtra, 28th – 29th
December, 2011
Das, Krishnendu, Singh, S.K., Banerjee, T.andSarkar, Dipak (2012). Erodibilitycharacteristics of soils of Badjorenalamicro watershed, Khurda, Orissa andtheir interrelationship with different soilproperties. 99th Indian Science Congress”held at KIIT University, Bhubaneswar,Odisha during 3 to 7th January, 2012.
Dharumarajan, S., Singh, S.K., Banerjee, T. andSarkar, Dipak (2011). Soil resourcedatabase for farm planning in lower Indo-Gangetic Alluvial Plains. 76th AnnualConvention and National Seminar on“Developments in Soil Science 2011”organized by Indian Society of SoilScience held at Agricultural Sciences,Dharwad during November 16-19, 2011
Hegde, R., Niranjan, K.V., Natarajan, A.,Thayalan, S., Naidu,L.G.K. and Sarkar,Deepak (2012). Efficient Technologies forDetailed Land Resources Inventorisationusing Remote sensing and ConventionalTools: A case study of Tirumale Sub –Watershed in Magadi Taluk, Karnataka.
Hegde, Rajendra, Niranajan, K.V., Natarajan,A., Naidu, L.G.K., Sarkar, Dipak (2011).Detailed land resources inventorization:the basic need for application ofinnovative technologies in all the landbased developmental programs: a casestudy of Tirumale sub-watershed. Oralpresentation during the National seminarby Society for Applied Bio-Technologyon July 2011 at Mangalore.
Mandal, C., Mandal, D.K., Jagdish Prasad,Sarkar,Dipak, Chandran, P., Tiwary, P.,Patil, N.G., Reddy, G. P. Obi., Lokhande,M.A., Wadhai, K.N., Dongare, V.T.,Sidhu, G.S., Sahoo, A.K., Nair, K.M.,Singh, R.S., Pal D. K., Ray S.K. andBhattacharyya, T. (2012). Revision ofBlack Soil Map of India for Enhancementof Crop Production, presented inNational Seminar on “Geospatial
AN
NU
AL R
EP
OR
T 2
011-1
2
133
List of Publications
Solutions for resource Conservation andManagement”, Indian Institute ofScience, Bengaluru, 18-19 January, 2012.P3.
Nagaraju, M.S.S. (2011). Characterization andevaluation of land resources forManagement of Savli Micro-Watershedin Wardha District of Maharashtra usingRemote Sensing and GIS. NationalSeminar on “Empowering Rural Indiathrough Space Technology” held duringOctober 9-11, 2011at MPCST, Bhopal.
Naidu, L.G.K, Ramesh Kumar, S.C., Srinivas,S., and Sarkar, Dipak (2012). Use of soilsand Climatic Information for Delineationof Potential Areas for forest Developmentin Karnataka using GIS and RS tools.
Nair, K.M., Rajasekharan, P., Anil Kumar,K.S., Naidu, L.G.K. and Sarkar, Dipak(2012). Agro-Ecology of Kerala, Proce.Nat. Seminar Watershed planningfor natural resources management,Kerala State Land Use Board,Thiruvananthapuram, February 15-16,2012. 83-89 pp.
Natarajan, A., Meena, R.S., Thayalan, S.,Hegde, R., Niranjan, K.V., Dhanorkar,B.A., Naidu L.G.K. and Sarkar, Deepak(2012). Soil Resource Mapping forcommand area development – A casestudy in Chikkasinakere Hobli, MaddurTaluk, Mandaya District, Karnataka.
Nayak, D.C, Singh, S.K., Sahoo, A.K. andSarkar, Dipak (2011). Characteristics,classification and suitability evaluationof soils of Rohtas district, Bihar. 76th
Annual Convention and NationalSeminar on “Developments in SoilScience-2011” organized by IndianSociety of Soil Science held at Universityof Agricultural Sciences, Dharwad duringNovember 16-19, 2011.
Obi Reddy, G.P. and Sarkar, Dipak (2012). GISfor assessment of spatial variability ofcarrying capacity at watershed level - Acase study presented in InternationalConference on “Spatial Technologies forRural development to be held on 5th-7th
January, 2012 held at National Instituteof Rural development (NIRD),Hyderabad.
Prakasa Rao, E.V.S., Goswami, P.,Ramamurthy, V. and Naidu, L.G.K.(2011). Climate change vis-a-vis soilsystem modeling possibilities for Vetiverbased land use in West Coast ofKarnataka, India. In: 5th InternationalConference on Vetiver and climatechange from 28-30 Oct., 2011 at CIMAP,Luknow.pp6-7.
Ramamurthy, V., Naidu, L.G.K., Srinivas, S.,Obi Reddy, G.P. and Sarkar, Dipak(2012). Delineation of potential areas forsafflower production in Deccan Plateaupresented in 8th International SafflowerConference Safflower Research andDevelopment in the World: Status andStrategies from 19th to 23rd January, 2012-Hyderabad, India.
Ramamurthy,V., Nair,K.M. Naidu, L.G.K.,Sarkar, Dipak, Prakasa Rao, E.V.S.,Goswami, P., Kantha Rao, B. (2011).Impact of rainfall pattern on some soilproperties. In: National Workshop onClimate Observation and Regionalmodeling for Multi-disciplinaryApplications (CORMMA) from 9-10thDec., 2011 at CSIR Centre forMathematical modeling and ComputerSimulations (CMMACS), Bangalore
Ramesh Kumar, S.C. Naidu, L.G.K.,Niranjana, K.V. and Sarkar, Dipak(2012). Assessment of the EconomicValue of Soil Resource Information.
Sahoo, K. and Sarkar, Dipak (2012).Evaluation of critical areas in upper Kasai

AN
NU
AL R
EP
OR
T 2
011-1
2List of Publications
134
watershed of Puruliya District, WestBengal for optimizing land use. 99th
Indian Science Congress” held at KIITUniversity, Bhubaneswar, Odisha during3 to 7th January, 2012.
Thayalan, Sundararaj, Chadurvedi, Arun andSarkar, Deepak (2012). Assessment ofLand use/land cover dynamics inChandrapur District of Maharastra usingRemote Sensing for Planning SustainableAgricultural Development.
Papers abstracted (Full papers)
Bhattacharyya, T., Chandran, P., Ray, S.K.,Tiwary, P., Pal, D.K., Mandal, C.,Deshmukh, A.S., Nimje, A.M.,Deshmukh, R.R., Dasgupta, D.,Balbuddhe, D.V. and Telpande, B.A.,(2012). Predicting changes in soil organiccarbon and crop yield due to climatechange in two important food growingzones of India, Karnataka State RemoteSensing Applications Centre (KSRSAC)and GEOSOL 2012, Bangalore, Jan 18-20, 2012, (Oral presentation).
Chandran, P., Mandal, C., Bhattacharyya, T.,Sarkar, D., Pal, D.K., Ray, S.K., JagdishPrasad, Tiwary, P., Srivastava, R.,Lokhande, M., Wadhai, K., Donagre, V.,Dijkshoorn, J.A., Batjes, N.H., andBrindaban, P.S. (2012). Soil and TerrainInformation System of the Indo-GangeticPlains, India for Resource Planning.National Seminar on GeospatialSolutions for resource Conservation andManagement, Indian Institute of Science,Bengaluru, 18-19 January, 2012.
Jagdish Prasad, Tiwary, P., Sarkar,Dipak,Sidhu, G.S., Singh, R.S., Sahoo, A.K.,Mahapatra, S.K., Mandal, C., Ray, S.K.,Chandran, P., Pal, D.K. andBhattacharyya, T. (2012). SuitabilityEvaluation of representative soils of theIndo-Gangetic Plains for Wheat.
National Seminar on GeospatialSolutions for resource Conservation andManagement, Indian Institute of Science,Bengaluru, 18-19 January, 2012.
Mandal, C., Mandal, D.K., Jagdish Prasad,Sarkar, Dipak, Chandran, P., Tiwary, P.,Patil, N.G., Reddy, G.P.Obi., Lokhande,M.A., Wadhai, K.N., Dongare, V.T.,Sidhu, G.S., Sahoo, A.K., Nair, K.M.,Singh, R.S., Pal, D.K., Ray, S.K. andBhattacharyya, T. (2012). Revision ofBlack Soil Map of India for Enhancementof Crop Production. National Seminar onGeospatial Solutions for resourceConservation and Management, IndianInstitute of Science, Bengaluru, 18-19January, 2012.
Naitam, R.K., Tailor, B.L., Singh, R.S. andVerma, T.P. (2011). Morphometricanalysis of Chanavada Micro-watershedin Southern Rajasthan, India usingremote sensing and GIS Technique.Presented in National Symposium on“Resource Utilization through IntegratedFarming System and BiodiversityConservation in Drylands” held atRRS,CAZRI, Kukma, Bhuj fromDecember 20-22,2011 Abs.p.30.
Verma, T.P., Singh,R.S., Naitam, R.K., Meena,R.S., Sharma, S.S.,Singh,R and Tailor, B.L.(2011) Soil Resource Potential in SouthEastern Part of Rajasthan for SustainableDevelopment. Presented in NationalSymposium on “Resource Utilizationthrough Integrated Farming System andBiodiversity Conservation in Drylands”held at RRS, CAZRI, Kukma, Bhuj fromDecember 20-22,2011. Abs.p.31.
Walia, C.S., Ram J., Katiyar D.K., Lal, T. andSidhu G.S. (2012). Distribution andcharacterization of salt affected soils ofSultanlpur district, Uttar Pradesh.National Seminar on Management of SaltAffected Soils and Waters, p 135.
AN
NU
AL R
EP
OR
T 2
011-1
2
135
List of Publications
Walia, C.S., Surya, Jaya N, Dhankar, R.P.,Singh, Harjit, Goyal, Vishal, Khajuria,Vishal and Sharma, J.P. (2011). Evaluationof soil resource data of Khulgad watershedfor land use planning. Proceedings of 75th
Annual Convention of the Indian Societyof Soil Science. pp 58-59.
Other Publications
Mandal, C., Sarkar, Dipak, Mandal, D.K.,Goswami, S.N. (2011). Land ResourceAtlas Vidarbha Region Maharashtra.NBSS & LUP Publ. No. 147, 212 p.
NBSS&LUP (ICAR) (2011). Vision 2030,National Bureau of Soil Survey and LandUse Planning (Indian Council ofAgricultural Research), Nagpur-440033.
Obi Reddy, G.P. and Sarkar, Dipak (2011).Geoinformatics in Land ResourceManagement (Eds) Lecture notes ofNNRMS (ISRO) sponsored trainingprogramme organized from 9th- 29th
March, 2011 at GIS Section, NBSS&LUP,Nagpur, pp 1-230.
Obi Reddy, G.P. and Sarkar, Dipak (Eds.)(2011) Advances of GIS and RemoteSensing in Digital Terrain Analysis andSoil Landscape Modeling. Lecture notesof ICAR sponsored Winter Schoolorganized from 6th - 26th September, 2011,NBSS&LUP, Nagpur, pp 1-338.
Obi Reddy, G.P.. Sarkar. Dipak and Raj Khosla(Eds.) (2011). Recent Trends ofGeoinformatics in Land ResourceDatabase Management for SustainableAgriculture. Training Manual of NAIP(ICAR) sponsored training programmeorganized from 15th - 28th November,2011, NBSS&LUP, Nagpur, pp 1-245.
Ramamurthy, V. (2011). Participated in Secondstate level Science and TechnologyConference-2011 on “Initiatives forHuman Resource development in Scienceand Technology” from 26-28 May, 2011

AN
NU
AL R
EP
OR
T 2
011-1
2
131
Participation of Scientists in Seminars, Symposia,
Conferences, Workshops, Trainings and Meetings in India
Participation of Scientists in Seminars, Symposia, Conferences,Workshops, Trainings and Meetings in India and abroad
10
Seminars/Symposia/Conferences
Second State Level Science and Technology Conference2011 on “Initiatives for Human Resource developmentin Science and Technology” from 26-28 May, 2011.
Dr. V. Ramamurthy
National Seminar organized by Society for Applied Bio-technology on July 2011 at Mangalore.
Dr(s). Rajendra Hegde, K V Niranajan, A. Natarajan,L.G.K. Naidu and Dipak Sarkar
National Seminar on “Empowering Rural India throughSpace Technology” held at MPCST, Bhopal from 9-11October, 2011
Dr. M.S.S. Nagaraju
33rd Indian Geography Congress hosted by Departmentof Geography, The University of Burdwan, Barddhaman,West Bengal during November 11-13 2011.
Dr(s). Tapati Banerjee, S. Dharumarajan, S. K. Singhand Dipak Sarkar.
76th Annual Convention and National Seminar on“Developments in Soil Science-2011” organized byIndian Society of Soil Science held at University ofAgricultural Sciences, Dharwad during 16-19 November2011.
Dr(s). D. C, Nayak, S. K. Singh, A. K. Sahoo, DipakSarkar, S. Dharumarajan, T. Banerjee, D.K. Mandal, C.Mandal, Jagdish Prasad, N.G. Patil, P. Tiwary, T.Bhattacharya, S.K. Mahapatra
3rd International Conference on Climate Change, ForestResources and Environment. 9 to 11 December 2011.Department of Environmental Sciences of KerelaUniversity, Thiruvananthapuram
Dr(s). B.P. Bhaskar and Dipak Sarkar
National Symposium on “Resource Utilization throughIntegrated Farming System and BiodiversityConservation in Drylands” held at RRS,CAZRI, Kukma,Bhuj from 20-22 December 2011
Dr(s). R.S. Singh, T.P. Verma, R.S. Meena, R.K. Naitamand B.L. Tailor
National Seminar on Geospatial Solutions for resourceConservation and Management, Indian Institute ofScience, Bengaluru, 18-19 January, 2012.
Dr(s). Dipak Sarkar, Mrs. C. Mandal, Dr. D.K. Mandal,Jagdish Prasad, P. Tiwary, G.S. Sidhu, R.S. Singh, A.K.Sahoo, S.K. Mahapatra, S.K. Ray, P. Chandran, and T.Bhattacharyya
99th Indian Science Congress held at KIIT University,Bhubaneswar, Odisha during 3 to 7th January, 2012.
Dr(s.) A.K. Sahoo and Dipak Sarkar, Krishnendu Das,S. K. Singh, and T. Banerjee
National Seminar on “Geospatial Solution for ResourceConservation and Management” held at J.N.TATAauditorium, IISC, 18-19 January 2012.
Dr(s). L.G.K. Naidu, A.Natarajan, S. Thayalan, RajendraHegde, and S.C. Ramesh KumarDr(s). A. Natarajan, R.S. Meena, S. Thayalan, R. Hegde,K.V. Niranjan, B.A. Dhanorkar, L.G.K. Naidu andDeepak Sarkar.Dr(s). R. Hegde, K.V. Niranjan, A. Natarajan, S.Thayalan, L.G.K. Naidu and Deepak SarkarDr(s). S. Thayalan, Arun Chadurvedi and Deepak SarkarDr(s). S.C. Ramesh Kumar, L.G.K. Naidu, K.V.Niranjana, and Dipak SarkarDr(s). L.G.K. Naidu, S.C. Ramesh Kumar, S. Srinivas,and Dipak SarkarDr(s). K.M. Nair, P. Rajasekharan, Anil Kumar, K.S.,Naidu, L.G.K. and Dipak Sarkar
International Safflower Conference “Safflower researchand development in the world: Status and Strategies” inJanuary 2012 at Hyderabad organized by Directorateof Oilseed research.
Dr. V. Ramamurthy
Workshops
Workshop called by World Bank team on “Wealthaccounting and valuation of ecosystem services (WAVES)under the Karnataka watershed development projectSujala-III on 20th July 2011 at Bangalore.
Dr. S.C. Ramesh Kumar

AN
NU
AL R
EP
OR
T 2
011-1
2Participation of Scientists in Seminars, Symposia, Conferences,
Workshops, Trainings and Meetings in India and abroad
132
Vetting workshop of district contigent crop planningfor Marathwada region on 21st September, 2011Drs. D.K. Mandal, S.N.Goswami and N.C. Khandare
“Awareness campaign on IPR in Agriculture” held atNRCC, Nagpur on 4th November 2011Drs. Jagdish Prasad, S. Chatterji, J.D. Giri and M.S.S.Nagaraju
Final Workshop of Component-4 NAIP sub projectsNAAS Complex, New Delhi during 19-20th March, 2012Drs. T. Bhattacharyya, G.S. Sidhu, S.K. Ray, and P. Tiwary
Vetting workshop of district contingent crop planningfor Madhya Pradesh held at RVSKVV University,Gwalior from 27-28 March, 2012.Drs. D.K.Mandal, S.N.Goswami and N.C. Khandare
Karnataka State Remote Sensing Applications Centre(KSRSAC) and GEOSOL 2012, Bangalore, 18-20January 2012.
Dr(s). Dr. T. Bhattacharyya, P. Chandran, P., S.K. Ray,P. Tiwary, and Mrs. C. Mandal
“Soil C Modeling Workshop” during 26th April to 5th
of May, 2011 at Hqrs., Nagpur.
Dr. S.K. Reza
Capacity Building Workshop on “Using ClimateScenarios and Analogues for Designing AdaptationStrategies in Agriculture” during 19-23rd September,2011 at Kathmandu, Nepal.
Dr. S.K. Reza
Meetings
Name of the Scientist Meetings attended Venue and date
Dr. G.P. Obi Reddy Project Review meeting of project Enrichment of land NRSC, Hyderabaddegradation datasets with soils datasets of different 30-31, May 2011states of India
Meeting on National GIS: Government Users Ministry of Earth Sciences,Consultation New Delhi
20th June 2011
NNRMS Standing Committee on Training Bangaloreand Technology 29th June, 2011
NSDI 8th Nodal Officers meeting New Delhi26th July, 2011
5th NSDI Executive Committee meeting Hyderabad5th August, 2011
NAIP (ICAR) organized Interaction Meet with New Delhiscientists Trained abroad in Frontier Areas of 29th to 30th November, 2011Agricultural Sciences
9th NSDI, Nodal Officer New Delhi9th Dec., 2011
Enrichment of land degradation datasets with soils NRSC, Hyderabaddatasets of different states of India 4th Jan. 2012
Institute Management Committee IISS, Bhopal14th Feb. 2012
Dr. Rajeev Srivastava Project Finalisation meeting on ‘Enrichment of land NRSC, Hyderabaddegradation datasets in the soil datasets 4th Jan., 2011
Meeting-cum-workshop of Heads of Divisions/ CIAE, BhopalRegional Stations 14th to 15th Jan., 2011
Institute Management Committee CSSRI, Karnal24th Dec. 2011
Institute Management Committee NBSS&LUP, Nagpur25th Feb., 2012
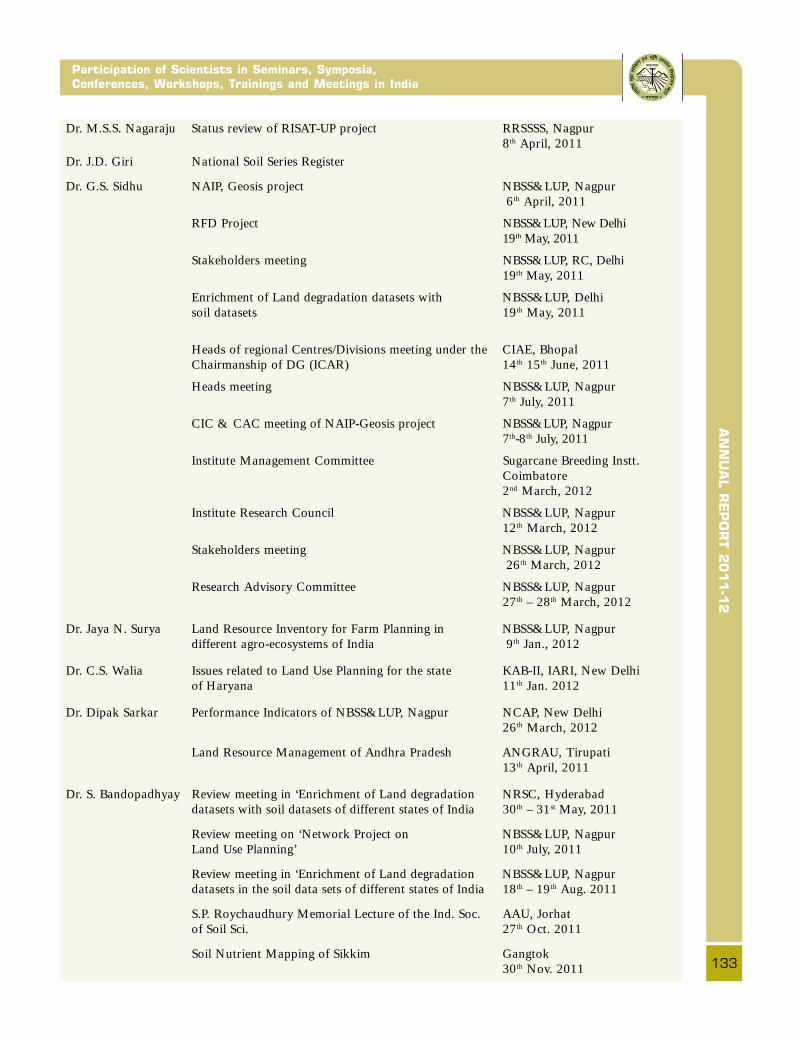
AN
NU
AL R
EP
OR
T 2
011-1
2
133
Participation of Scientists in Seminars, Symposia,
Conferences, Workshops, Trainings and Meetings in India
Dr. M.S.S. Nagaraju Status review of RISAT-UP project RRSSSS, Nagpur8th April, 2011
Dr. J.D. Giri National Soil Series Register
Dr. G.S. Sidhu NAIP, Geosis project NBSS&LUP, Nagpur 6th April, 2011
RFD Project NBSS&LUP, New Delhi19th May, 2011
Stakeholders meeting NBSS&LUP, RC, Delhi19th May, 2011
Enrichment of Land degradation datasets with NBSS&LUP, Delhisoil datasets 19th May, 2011
Heads of regional Centres/Divisions meeting under the CIAE, BhopalChairmanship of DG (ICAR) 14th 15th June, 2011
Heads meeting NBSS&LUP, Nagpur7th July, 2011
CIC & CAC meeting of NAIP-Geosis project NBSS&LUP, Nagpur7th-8th July, 2011
Institute Management Committee Sugarcane Breeding Instt.Coimbatore2nd March, 2012
Institute Research Council NBSS&LUP, Nagpur12th March, 2012
Stakeholders meeting NBSS&LUP, Nagpur 26th March, 2012
Research Advisory Committee NBSS&LUP, Nagpur27th – 28th March, 2012
Dr. Jaya N. Surya Land Resource Inventory for Farm Planning in NBSS&LUP, Nagpurdifferent agro-ecosystems of India 9th Jan., 2012
Dr. C.S. Walia Issues related to Land Use Planning for the state KAB-II, IARI, New Delhiof Haryana 11th Jan. 2012
Dr. Dipak Sarkar Performance Indicators of NBSS&LUP, Nagpur NCAP, New Delhi26th March, 2012
Land Resource Management of Andhra Pradesh ANGRAU, Tirupati13th April, 2011
Dr. S. Bandopadhyay Review meeting in ‘Enrichment of Land degradation NRSC, Hyderabaddatasets with soil datasets of different states of India 30th – 31st May, 2011
Review meeting on ‘Network Project on NBSS&LUP, NagpurLand Use Planning’ 10th July, 2011
Review meeting in ‘Enrichment of Land degradation NBSS&LUP, Nagpurdatasets in the soil data sets of different states of India 18th – 19th Aug. 2011
S.P. Roychaudhury Memorial Lecture of the Ind. Soc. AAU, Jorhatof Soil Sci. 27th Oct. 2011
Soil Nutrient Mapping of Sikkim Gangtok30th Nov. 2011
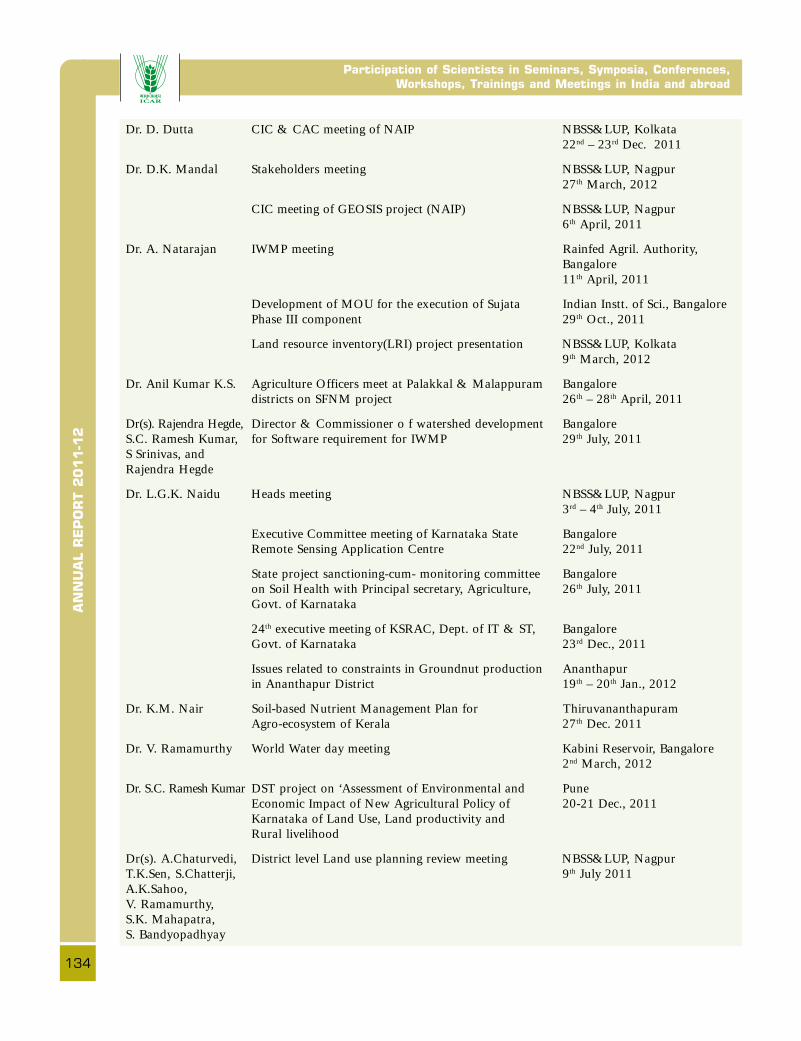
AN
NU
AL R
EP
OR
T 2
011-1
2Participation of Scientists in Seminars, Symposia, Conferences,
Workshops, Trainings and Meetings in India and abroad
134
Dr. D. Dutta CIC & CAC meeting of NAIP NBSS&LUP, Kolkata22nd – 23rd Dec. 2011
Dr. D.K. Mandal Stakeholders meeting NBSS&LUP, Nagpur27th March, 2012
CIC meeting of GEOSIS project (NAIP) NBSS&LUP, Nagpur6th April, 2011
Dr. A. Natarajan IWMP meeting Rainfed Agril. Authority,Bangalore11th April, 2011
Development of MOU for the execution of Sujata Indian Instt. of Sci., BangalorePhase III component 29th Oct., 2011
Land resource inventory(LRI) project presentation NBSS&LUP, Kolkata9th March, 2012
Dr. Anil Kumar K.S. Agriculture Officers meet at Palakkal & Malappuram Bangaloredistricts on SFNM project 26th – 28th April, 2011
Dr(s). Rajendra Hegde, Director & Commissioner o f watershed development BangaloreS.C. Ramesh Kumar, for Software requirement for IWMP 29th July, 2011S Srinivas, andRajendra Hegde
Dr. L.G.K. Naidu Heads meeting NBSS&LUP, Nagpur3rd – 4th July, 2011
Executive Committee meeting of Karnataka State BangaloreRemote Sensing Application Centre 22nd July, 2011
State project sanctioning-cum- monitoring committee Bangaloreon Soil Health with Principal secretary, Agriculture, 26th July, 2011Govt. of Karnataka
24th executive meeting of KSRAC, Dept. of IT & ST, BangaloreGovt. of Karnataka 23rd Dec., 2011
Issues related to constraints in Groundnut production Ananthapurin Ananthapur District 19th – 20th Jan., 2012
Dr. K.M. Nair Soil-based Nutrient Management Plan for ThiruvananthapuramAgro-ecosystem of Kerala 27th Dec. 2011
Dr. V. Ramamurthy World Water day meeting Kabini Reservoir, Bangalore2nd March, 2012
Dr. S.C. Ramesh Kumar DST project on ‘Assessment of Environmental and PuneEconomic Impact of New Agricultural Policy of 20-21 Dec., 2011Karnataka of Land Use, Land productivity andRural livelihood
Dr(s). A.Chaturvedi, District level Land use planning review meeting NBSS&LUP, NagpurT.K.Sen, S.Chatterji, 9th July 2011A.K.Sahoo,V. Ramamurthy,S.K. Mahapatra,S. Bandyopadhyay
AN
NU
AL R
EP
OR
T 2
011-1
2
135
Participation of Scientists in Seminars, Symposia,
Conferences, Workshops, Trainings and Meetings in India
The Bureau is undertaking the Soil NutrientMapping in different states on a consultancymode (at different levels) at 1 to 2 km gridintervals. All the samples are geo-referenced.Important soil nutrient maps, such as, organiccarbon, available nitrogen, phosphorusand potassium, micro nutrients and otherthematic maps are being prepared and supplied
Consultancy, Patents, Commercialisationof Technology
11
to the sponsoring agencies. These maps andreports are used by the concerned agriculturaldepartments for input supply regulations andcreating awareness among the farmers to usethe precious fertilizers according to the soil/crop requirements. These consultancy projectswere operated for the states of Jharkhandand Assam.
Consultancy, Patents, Commercialisation of Technology
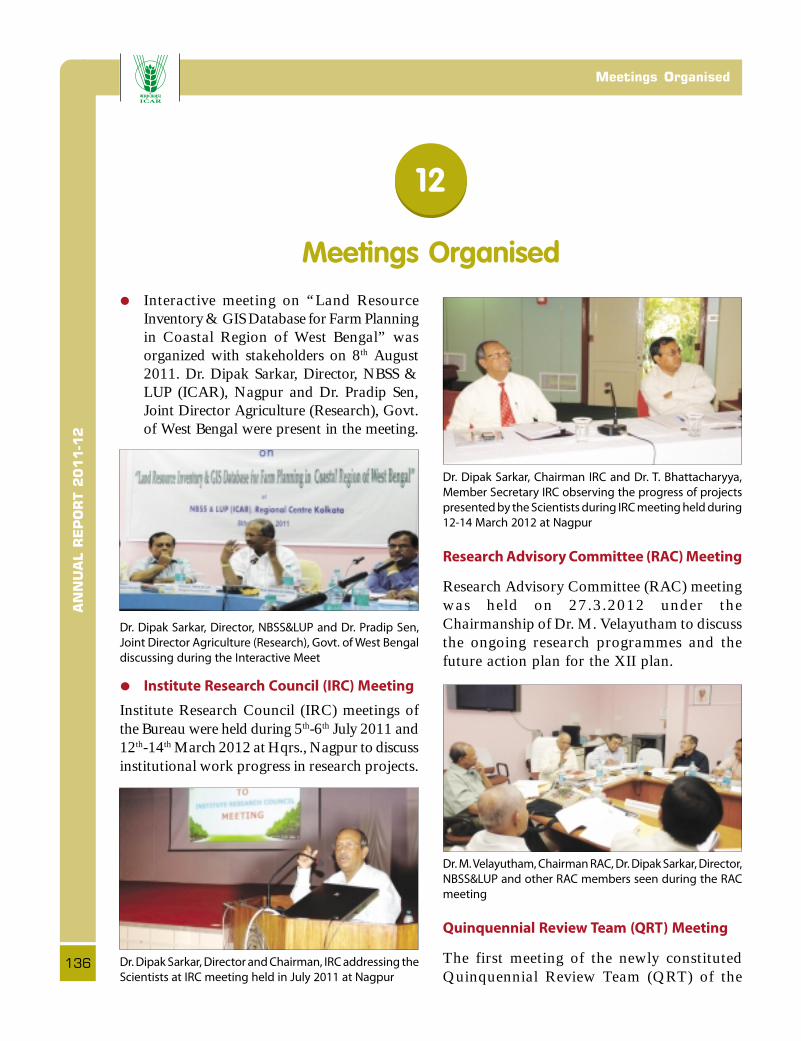
AN
NU
AL R
EP
OR
T 2
011-1
2Meetings Organised
136
Meetings Organised
12
• Interactive meeting on “Land ResourceInventory & GIS Database for Farm Planningin Coastal Region of West Bengal” wasorganized with stakeholders on 8th August2011. Dr. Dipak Sarkar, Director, NBSS &LUP (ICAR), Nagpur and Dr. Pradip Sen,Joint Director Agriculture (Research), Govt.of West Bengal were present in the meeting.
Dr. Dipak Sarkar, Director, NBSS&LUP and Dr. Pradip Sen,
Joint Director Agriculture (Research), Govt. of West Bengal
discussing during the Interactive Meet
• Institute Research Council (IRC) Meeting
Institute Research Council (IRC) meetings ofthe Bureau were held during 5th-6th July 2011 and12th-14th March 2012 at Hqrs., Nagpur to discussinstitutional work progress in research projects.
Dr. Dipak Sarkar, Director and Chairman, IRC addressing the
Scientists at IRC meeting held in July 2011 at Nagpur
Dr. Dipak Sarkar, Chairman IRC and Dr. T. Bhattacharyya,
Member Secretary IRC observing the progress of projects
presented by the Scientists during IRC meeting held during
12-14 March 2012 at Nagpur
Research Advisory Committee (RAC) Meeting
Research Advisory Committee (RAC) meetingwas held on 27.3.2012 under theChairmanship of Dr. M. Velayutham to discussthe ongoing research programmes and thefuture action plan for the XII plan.
Dr. M. Velayutham, Chairman RAC, Dr. Dipak Sarkar, Director,
NBSS&LUP and other RAC members seen during the RAC
meeting
Quinquennial Review Team (QRT) Meeting
The first meeting of the newly constitutedQuinquennial Review Team (QRT) of the

AN
NU
AL R
EP
OR
T 2
011-1
2
137
Meetings Organised
Bureau for the period 2007-2011 was held on31.3.2012 at New Delhi under theChairmanship of Dr. A.K. Singh, DDG (NRM),ICAR to discuss the work done by the Bureau.
QRT Meeting in progress at Delhi under the Chairmanship
of Dr. A.K. Singh, DDG (NRM), ICAR
Institute Management Committee (IMC)
Meeting
• 42nd Institute Management Committee(IMC) meeting of the Bureau was held on25th Feb. 2012 at Nagpur under theChairmanship of Dr. Dipak Sarkar,Director and in presence of IMC membersto review the research/technical/ administrativeprogress and related matters of the Bureaufor the period April 2011 to January 2012.
Dr. Dipak Sarkar, Chairman, IMC addressing the IMC
Meeting
Stakeholders’ meetings
Stakeholders’ meeting were organized at theNBSS&LUP, Regional Centre, Kolkata on 21st
May, 2011 during preparation of Vision-2030document under the Chairmanship of Prof.Saroj Kumar Sanyal, Hon’ble Vice-Chancellor,Bidhan Chandra Krishi Viswavidyalaya,Mohanpur, Nadia. Dr. Dipak Sarkar, Director,NBSS & LUP (ICAR), Nagpur and Shri A.K.Singh, IAS, Principal Secretary, Department ofAgriculture and Cane Development, Govt. ofJharkhand were also present in the meeting.Twenty six delegates from different states ofEastern India participated in the programme.
A view of Stakeholders Meeting (21.5.2011) at NBSS&LUP,
Regional Centre, Kolkata,
A stakeholders’ interaction meet was organizedby NBSS & LUP (ICAR) at Regional Centre,Jorhat (Assam) on 24.05.2011 for preparationof document for Vision 2030 of the Bureauunder the chairmanship of Dr. N.N. Sharma,Director of Research, Assam AgriculturalUniversity). Invitees from different statesgovernment departments as well as CentralAgricultural Universities of NER were presentin the meeting and interacted.
Dr. N.N Sarmah, Director of Research, AAU, Dr. Dipak Sarkar,
Director, NBSS&LUP, Nagpur and Dr. M. Rohini Kumar Singh,
Director (Research), CAU, Imphal were discussing with other
Scientists of NER during the Stakeholders’ Meet for Preparation
of Vision 2030 Document at Regional Centre, Jorhat
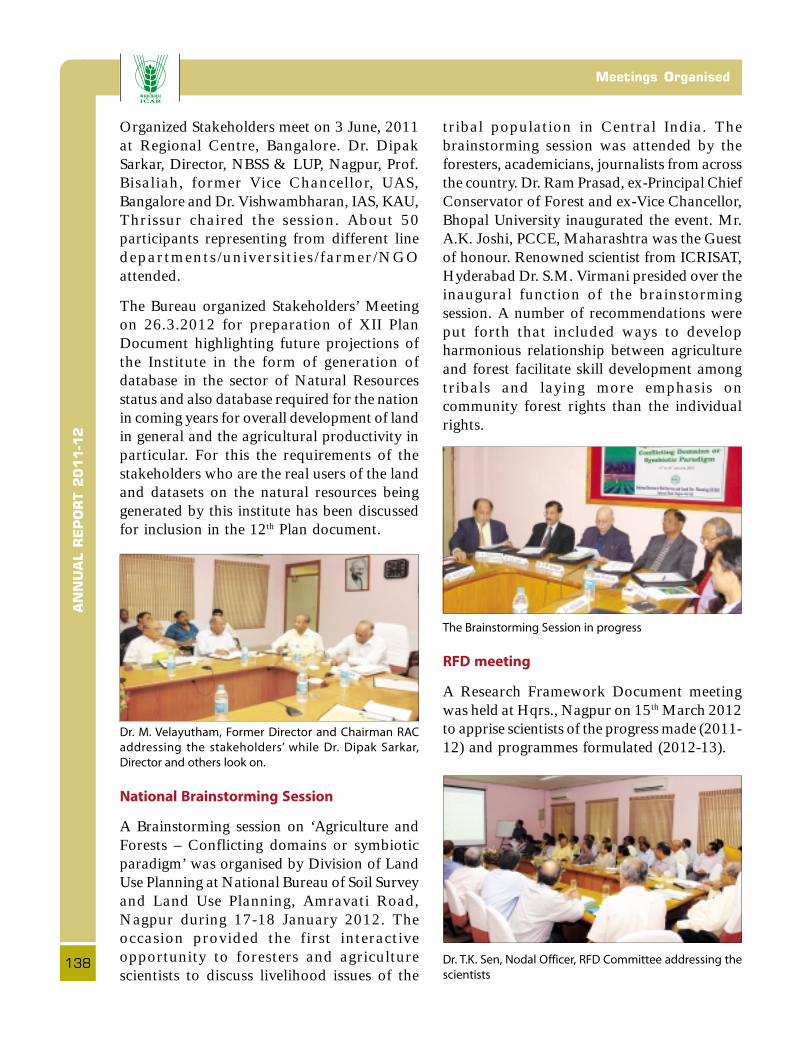
AN
NU
AL R
EP
OR
T 2
011-1
2Meetings Organised
138
Organized Stakeholders meet on 3 June, 2011at Regional Centre, Bangalore. Dr. DipakSarkar, Director, NBSS & LUP, Nagpur, Prof.Bisaliah, former Vice Chancellor, UAS,Bangalore and Dr. Vishwambharan, IAS, KAU,Thrissur chaired the session. About 50participants representing from different linedepartments/universit ies/farmer/NGOattended.
The Bureau organized Stakeholders’ Meetingon 26.3.2012 for preparation of XII PlanDocument highlighting future projections ofthe Institute in the form of generation ofdatabase in the sector of Natural Resourcesstatus and also database required for the nationin coming years for overall development of landin general and the agricultural productivity inparticular. For this the requirements of thestakeholders who are the real users of the landand datasets on the natural resources beinggenerated by this institute has been discussedfor inclusion in the 12th Plan document.
Dr. M. Velayutham, Former Director and Chairman RAC
addressing the stakeholders’ while Dr. Dipak Sarkar,
Director and others look on.
National Brainstorming Session
A Brainstorming session on ‘Agriculture andForests – Conflicting domains or symbioticparadigm’ was organised by Division of LandUse Planning at National Bureau of Soil Surveyand Land Use Planning, Amravati Road,Nagpur during 17-18 January 2012. Theoccasion provided the first interactiveopportunity to foresters and agriculturescientists to discuss livelihood issues of the
tribal population in Central India. Thebrainstorming session was attended by theforesters, academicians, journalists from acrossthe country. Dr. Ram Prasad, ex-Principal ChiefConservator of Forest and ex-Vice Chancellor,Bhopal University inaugurated the event. Mr.A.K. Joshi, PCCE, Maharashtra was the Guestof honour. Renowned scientist from ICRISAT,Hyderabad Dr. S.M. Virmani presided over theinaugural function of the brainstormingsession. A number of recommendations wereput forth that included ways to developharmonious relationship between agricultureand forest facilitate skill development amongtribals and laying more emphasis oncommunity forest rights than the individualrights.
The Brainstorming Session in progress
RFD meeting
A Research Framework Document meetingwas held at Hqrs., Nagpur on 15th March 2012to apprise scientists of the progress made (2011-12) and programmes formulated (2012-13).
Dr. T.K. Sen, Nodal Officer, RFD Committee addressing the
scientists
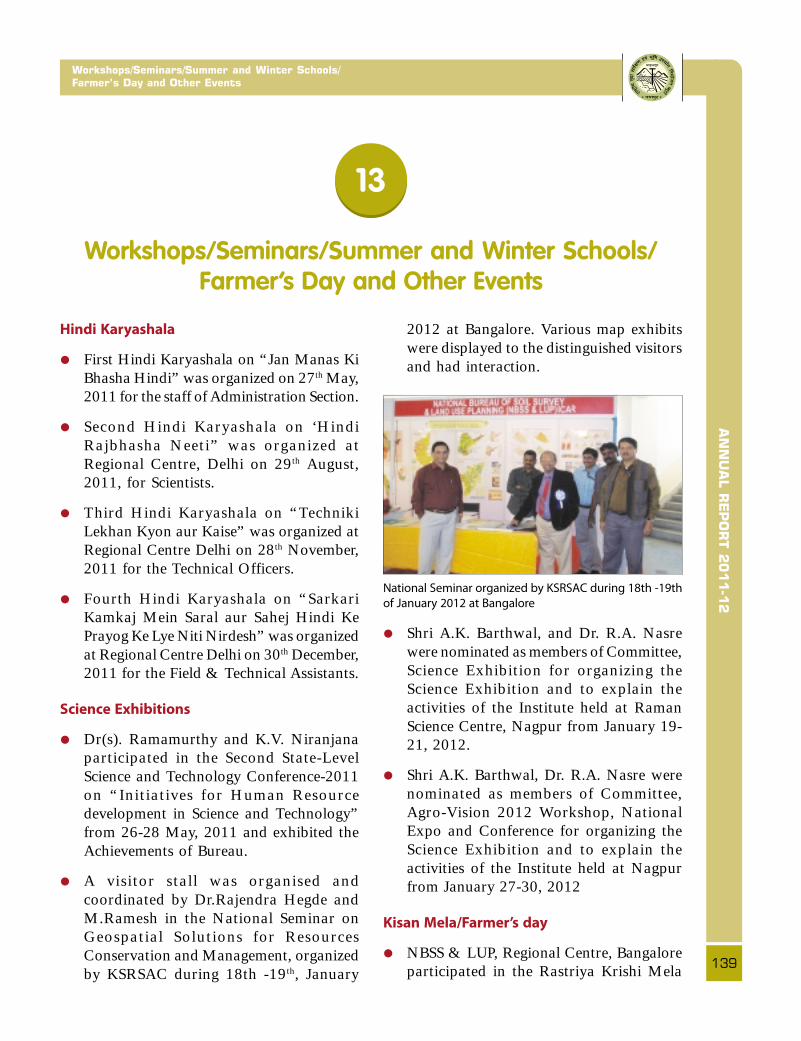
AN
NU
AL R
EP
OR
T 2
011-1
2
139
Workshops/Seminars/Summer and Winter Schools/
Farmer’s Day and Other Events
Workshops/Seminars/Summer and Winter Schools/Farmer’s Day and Other Events
13
Hindi Karyashala
• First Hindi Karyashala on “Jan Manas KiBhasha Hindi” was organized on 27th May,2011 for the staff of Administration Section.
• Second Hindi Karyashala on ‘HindiRajbhasha Neeti” was organized atRegional Centre, Delhi on 29th August,2011, for Scientists.
• Third Hindi Karyashala on “TechnikiLekhan Kyon aur Kaise” was organized atRegional Centre Delhi on 28th November,2011 for the Technical Officers.
• Fourth Hindi Karyashala on “SarkariKamkaj Mein Saral aur Sahej Hindi KePrayog Ke Lye Niti Nirdesh” was organizedat Regional Centre Delhi on 30th December,2011 for the Field & Technical Assistants.
Science Exhibitions
• Dr(s). Ramamurthy and K.V. Niranjanaparticipated in the Second State-LevelScience and Technology Conference-2011on “Initiatives for Human Resourcedevelopment in Science and Technology”from 26-28 May, 2011 and exhibited theAchievements of Bureau.
• A visitor stall was organised andcoordinated by Dr.Rajendra Hegde andM.Ramesh in the National Seminar onGeospatial Solutions for ResourcesConservation and Management, organizedby KSRSAC during 18th -19th, January
2012 at Bangalore. Various map exhibitswere displayed to the distinguished visitorsand had interaction.
National Seminar organized by KSRSAC during 18th -19th
of January 2012 at Bangalore
• Shri A.K. Barthwal, and Dr. R.A. Nasrewere nominated as members of Committee,Science Exhibition for organizing theScience Exhibition and to explain theactivities of the Institute held at RamanScience Centre, Nagpur from January 19-21, 2012.
• Shri A.K. Barthwal, Dr. R.A. Nasre werenominated as members of Committee,Agro-Vision 2012 Workshop, NationalExpo and Conference for organizing theScience Exhibition and to explain theactivities of the Institute held at Nagpurfrom January 27-30, 2012
Kisan Mela/Farmer’s day
• NBSS & LUP, Regional Centre, Bangaloreparticipated in the Rastriya Krishi Mela
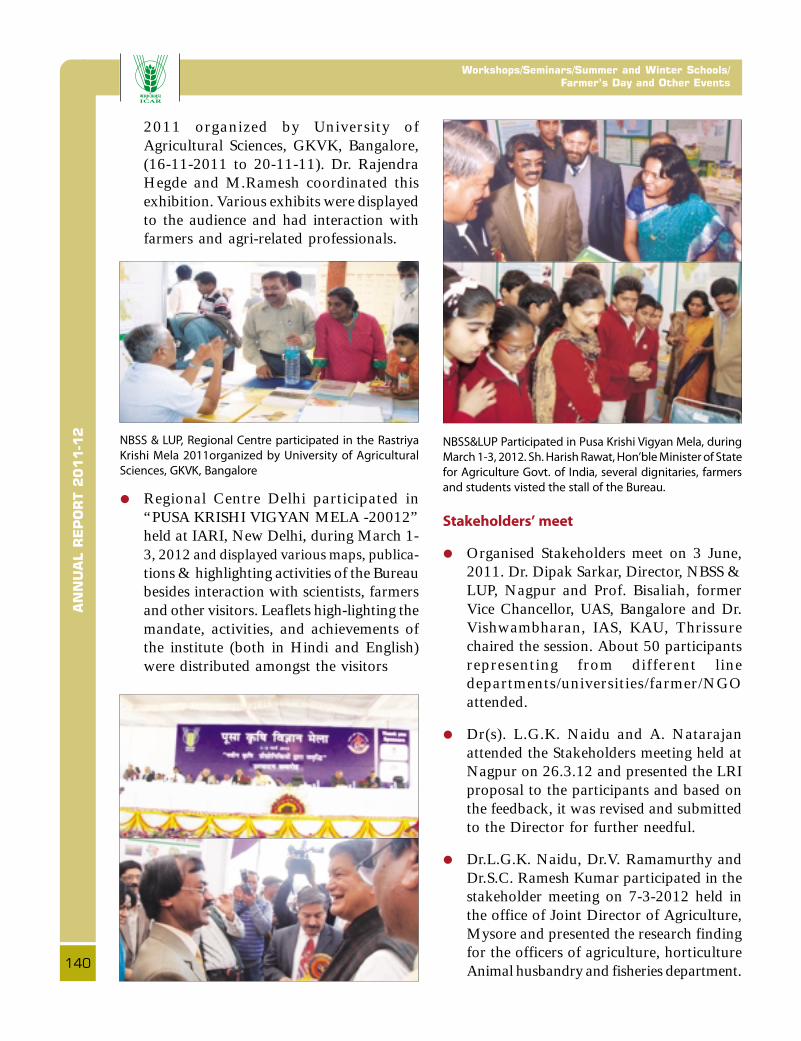
AN
NU
AL R
EP
OR
T 2
011-1
2Workshops/Seminars/Summer and Winter Schools/
Farmer’s Day and Other Events
140
2011 organized by University ofAgricultural Sciences, GKVK, Bangalore,(16-11-2011 to 20-11-11). Dr. RajendraHegde and M.Ramesh coordinated thisexhibition. Various exhibits were displayedto the audience and had interaction withfarmers and agri-related professionals.
NBSS & LUP, Regional Centre participated in the Rastriya
Krishi Mela 2011organized by University of Agricultural
Sciences, GKVK, Bangalore
• Regional Centre Delhi participated in“PUSA KRISHI VIGYAN MELA -20012”held at IARI, New Delhi, during March 1-3, 2012 and displayed various maps, publica-tions & highlighting activities of the Bureaubesides interaction with scientists, farmersand other visitors. Leaflets high-lighting themandate, activities, and achievements ofthe institute (both in Hindi and English)were distributed amongst the visitors
NBSS&LUP Participated in Pusa Krishi Vigyan Mela, during
March 1-3, 2012. Sh. Harish Rawat, Hon’ble Minister of State
for Agriculture Govt. of India, several dignitaries, farmers
and students visted the stall of the Bureau.
Stakeholders’ meet
• Organised Stakeholders meet on 3 June,2011. Dr. Dipak Sarkar, Director, NBSS &LUP, Nagpur and Prof. Bisaliah, formerVice Chancellor, UAS, Bangalore and Dr.Vishwambharan, IAS, KAU, Thrissurechaired the session. About 50 participantsrepresenting from different linedepartments/universities/farmer/NGOattended.
• Dr(s). L.G.K. Naidu and A. Natarajanattended the Stakeholders meeting held atNagpur on 26.3.12 and presented the LRIproposal to the participants and based onthe feedback, it was revised and submittedto the Director for further needful.
• Dr.L.G.K. Naidu, Dr.V. Ramamurthy andDr.S.C. Ramesh Kumar participated in thestakeholder meeting on 7-3-2012 held inthe office of Joint Director of Agriculture,Mysore and presented the research findingfor the officers of agriculture, horticultureAnimal husbandry and fisheries department.
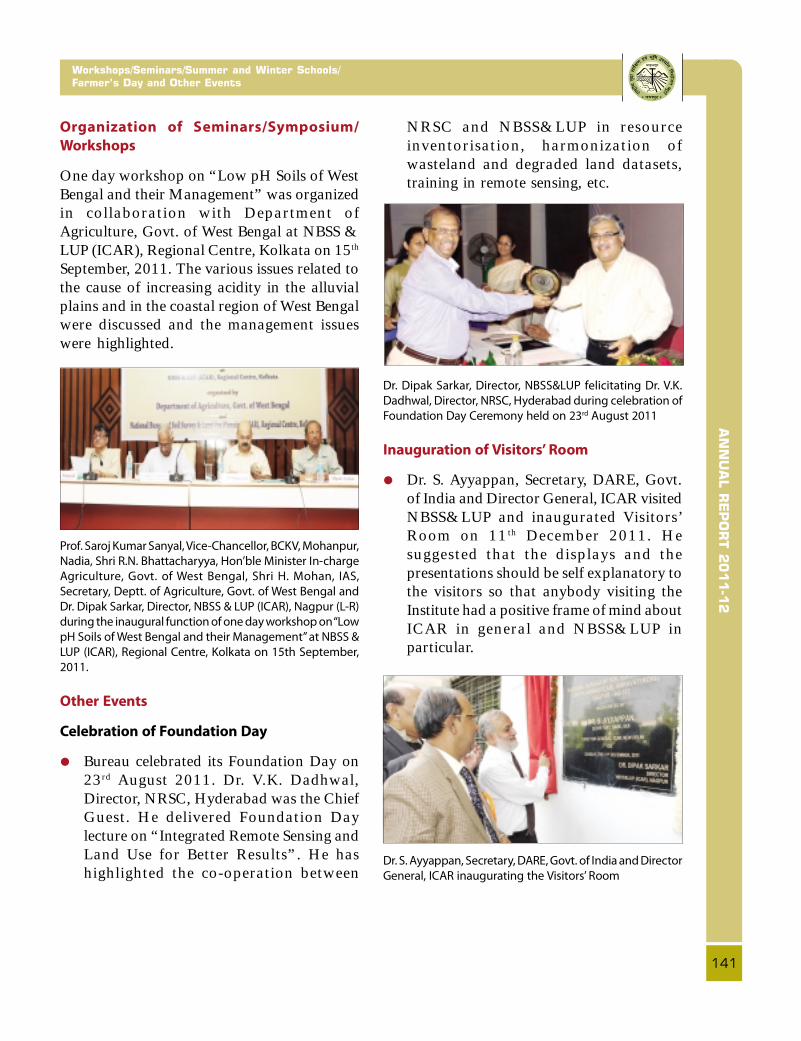
AN
NU
AL R
EP
OR
T 2
011-1
2
141
Workshops/Seminars/Summer and Winter Schools/
Farmer’s Day and Other Events
Organization of Seminars/Symposium/
Workshops
One day workshop on “Low pH Soils of WestBengal and their Management” was organizedin collaboration with Department ofAgriculture, Govt. of West Bengal at NBSS &LUP (ICAR), Regional Centre, Kolkata on 15th
September, 2011. The various issues related tothe cause of increasing acidity in the alluvialplains and in the coastal region of West Bengalwere discussed and the management issueswere highlighted.
Prof. Saroj Kumar Sanyal, Vice-Chancellor, BCKV, Mohanpur,
Nadia, Shri R.N. Bhattacharyya, Hon’ble Minister In-charge
Agriculture, Govt. of West Bengal, Shri H. Mohan, IAS,
Secretary, Deptt. of Agriculture, Govt. of West Bengal and
Dr. Dipak Sarkar, Director, NBSS & LUP (ICAR), Nagpur (L-R)
during the inaugural function of one day workshop on “Low
pH Soils of West Bengal and their Management” at NBSS &
LUP (ICAR), Regional Centre, Kolkata on 15th September,
2011.
Other Events
Celebration of Foundation Day
• Bureau celebrated its Foundation Day on23rd August 2011. Dr. V.K. Dadhwal,Director, NRSC, Hyderabad was the ChiefGuest. He delivered Foundation Daylecture on “Integrated Remote Sensing andLand Use for Better Results”. He hashighlighted the co-operation between
NRSC and NBSS&LUP in resourceinventorisation, harmonization ofwasteland and degraded land datasets,training in remote sensing, etc.
Dr. Dipak Sarkar, Director, NBSS&LUP felicitating Dr. V.K.
Dadhwal, Director, NRSC, Hyderabad during celebration of
Foundation Day Ceremony held on 23rd August 2011
Inauguration of Visitors’ Room
• Dr. S. Ayyappan, Secretary, DARE, Govt.of India and Director General, ICAR visitedNBSS&LUP and inaugurated Visitors’Room on 11th December 2011. Hesuggested that the displays and thepresentations should be self explanatory tothe visitors so that anybody visiting theInstitute had a positive frame of mind aboutICAR in general and NBSS&LUP inparticular.
Dr. S. Ayyappan, Secretary, DARE, Govt. of India and Director
General, ICAR inaugurating the Visitors’ Room

AN
NU
AL R
EP
OR
T 2
011-1
2
142
On-going and Completed Projects
On-going and Completed Projects
ONGOING INSTITUTIONAL PROJECTS
Inventorying Natural Resources
1. Assessment of land and soil resources ofMalappuram district of Kerala at 1;50,000 scalefor land use planning
K.S. Anil Kumar, L.G.K. Naidu, S. Thayalan, K.M.Nair, Rajendra Hegde, S.C. Ramesh Kumar andS. Srinivas
2. Land resource inventory of Durgada Nagenahallivillage, Kortagere taluk, Tumkur district,Karnataka for integrated development underNICRA project
A Natarajan, Rajendra Hegde, S Srinivas and K.S.Anil Kumar
3. Land resource inventory for farm planning indifferent agro-ecological regions of India
A. Natarajan, Jaya N. Surya, R.S. Meena S.K. Reza,S. Bandyopadhyay, S. Dharmarajan, Pushpanjali, K.Karthikeyan, T.P. Verma and Dipak Sarkar
4. Land resource inventory for farm planning inChikarsinkere Hobli, Maddur taluk, Mandyadistrict, Karnataka
R.S. Meena, A.Natarajan, S. Thayalan, S.C.Ramesh Kumar, V. Ramamurthy and S. Srinivas
5. Land resource inventory for farm planning inLakhan Majra block of tehsil and district Rohtak,Haryana
Jaya N. Surya, G.S. Sidhu, Tarsem Lal, C.S. Walia,Dharam Singh, S.K. Mahapatra, Ram Gopal andD.K. Katiyar
6. Land resource inventory for farm plan Landresource inventory of Katonigaon Panchayat ofTitabar block of Jorhat district of Assam
S.K. Reza, S. Bandyopadhyay and Utpal Baruah
7. Land resource inventory of East Lahing Gaonpanchayat of East Jorhat development block,Jorhat district, Assam
S. Bandyopadhyay, S.K. Reza and U. Baruah
8. Land resource inventory for farm planning inChinchura - Mogra and Polba-Dadpur Block,Hugli District, West Bengal
S. Dharumarajan, S.K. Gangopadhyay, T. Banerjeeand S.K. Singh
9. Land resource inventory for farm planning indifferent agro - ecological regions of India subproject: Bhadesar Tehsil (cluster of 10 villages) inChittaurgarh district (Rajasthan).
T.P. Verma and R.S.Singh
10. Soil Resource Inventory of IARI Farm, New Delhi
S.K. Mahapatra, C.S.Walia, Tarsem Lal and G.S.Sidhu
11. Land resource inventory for farm planning inJhalarapatan block of Jhalawar district ofRajasthan
R.S. Meena
12. Study of crop moisture availability of soils duringpost – kharif period in Shibsagar district of Assam
D. Dutta., S.K. Reza and U. Baruah
13. Soil resource mapping of Sultanpur district of UttarPradesh for perspective land use planning
C.S.Walia, Jagat Ram, Tarsem Lal, G.S. Sidhu,R.P.Dhankar and S.P. Singh
14. Geomorphometric and hydrological evaluation ofmicro watershed in Chhotnagpur plateau, WestBengal for sustainable utilization of soil and waterresources
Tapati Banerjee, S.K. Singh and K. Das
15. Soil resource inventory and land evaluation ofRohtas district, Bihar (1:50,000 scale) for land useplanning.
D.C. Nayak and S.K. Singh
16. Soil resource inventory and land evaluation ofAurangabad district, Bihar (1: 50,000 scale) forland use planning
S.K. Gangopadhyay, D.C. Nayak and S.K. Singh
Appendix
1
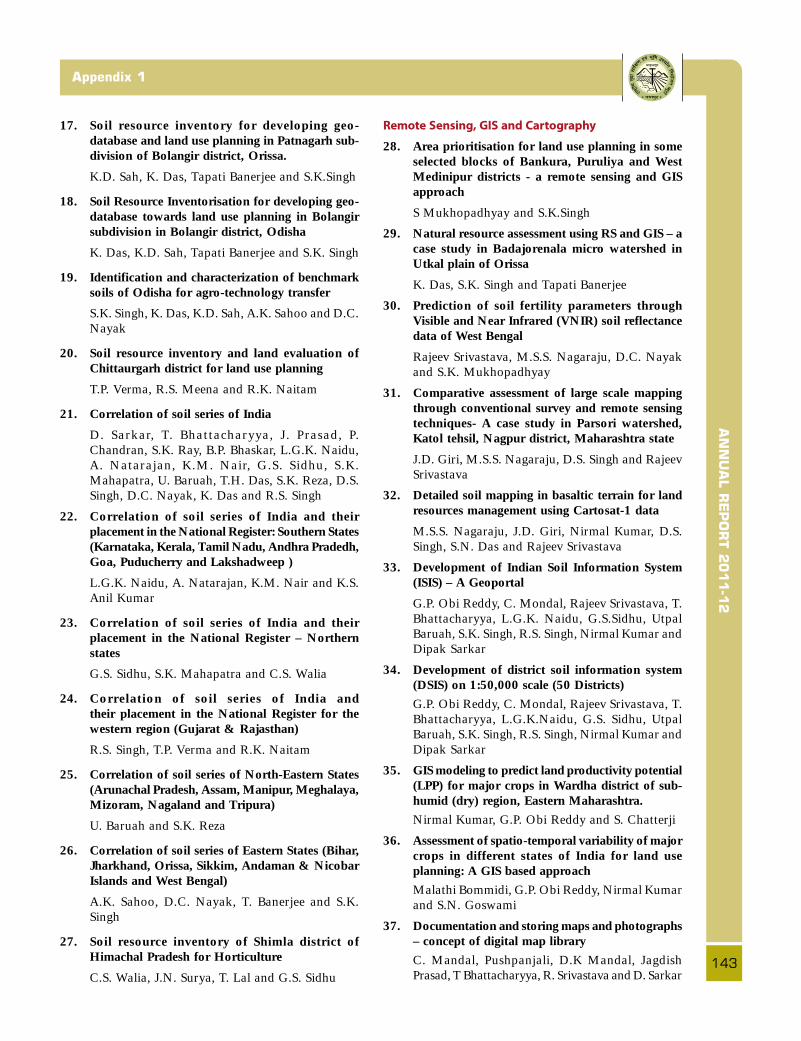
AN
NU
AL R
EP
OR
T 2
011-1
2
143
Appendix 1
17. Soil resource inventory for developing geo-database and land use planning in Patnagarh sub-division of Bolangir district, Orissa.
K.D. Sah, K. Das, Tapati Banerjee and S.K.Singh
18. Soil Resource Inventorisation for developing geo-database towards land use planning in Bolangirsubdivision in Bolangir district, Odisha
K. Das, K.D. Sah, Tapati Banerjee and S.K. Singh
19. Identification and characterization of benchmarksoils of Odisha for agro-technology transfer
S.K. Singh, K. Das, K.D. Sah, A.K. Sahoo and D.C.Nayak
20. Soil resource inventory and land evaluation ofChittaurgarh district for land use planning
T.P. Verma, R.S. Meena and R.K. Naitam
21. Correlation of soil series of India
D. Sarkar, T. Bhattacharyya, J. Prasad, P.Chandran, S.K. Ray, B.P. Bhaskar, L.G.K. Naidu,A. Natarajan, K.M. Nair, G.S. Sidhu, S.K.Mahapatra, U. Baruah, T.H. Das, S.K. Reza, D.S.Singh, D.C. Nayak, K. Das and R.S. Singh
22. Correlation of soil series of India and theirplacement in the National Register: Southern States(Karnataka, Kerala, Tamil Nadu, Andhra Pradedh,Goa, Puducherry and Lakshadweep )
L.G.K. Naidu, A. Natarajan, K.M. Nair and K.S.Anil Kumar
23. Correlation of soil series of India and theirplacement in the National Register – Northernstates
G.S. Sidhu, S.K. Mahapatra and C.S. Walia
24. Correlation of soil series of India andtheir placement in the National Register for thewestern region (Gujarat & Rajasthan)
R.S. Singh, T.P. Verma and R.K. Naitam
25. Correlation of soil series of North-Eastern States(Arunachal Pradesh, Assam, Manipur, Meghalaya,Mizoram, Nagaland and Tripura)
U. Baruah and S.K. Reza
26. Correlation of soil series of Eastern States (Bihar,Jharkhand, Orissa, Sikkim, Andaman & NicobarIslands and West Bengal)
A.K. Sahoo, D.C. Nayak, T. Banerjee and S.K.Singh
27. Soil resource inventory of Shimla district ofHimachal Pradesh for Horticulture
C.S. Walia, J.N. Surya, T. Lal and G.S. Sidhu
Remote Sensing, GIS and Cartography
28. Area prioritisation for land use planning in someselected blocks of Bankura, Puruliya and WestMedinipur districts - a remote sensing and GISapproach
S Mukhopadhyay and S.K.Singh
29. Natural resource assessment using RS and GIS – acase study in Badajorenala micro watershed inUtkal plain of Orissa
K. Das, S.K. Singh and Tapati Banerjee
30. Prediction of soil fertility parameters throughVisible and Near Infrared (VNIR) soil reflectancedata of West Bengal
Rajeev Srivastava, M.S.S. Nagaraju, D.C. Nayakand S.K. Mukhopadhyay
31. Comparative assessment of large scale mappingthrough conventional survey and remote sensingtechniques- A case study in Parsori watershed,Katol tehsil, Nagpur district, Maharashtra state
J.D. Giri, M.S.S. Nagaraju, D.S. Singh and RajeevSrivastava
32. Detailed soil mapping in basaltic terrain for landresources management using Cartosat-1 data
M.S.S. Nagaraju, J.D. Giri, Nirmal Kumar, D.S.Singh, S.N. Das and Rajeev Srivastava
33. Development of Indian Soil Information System(ISIS) – A Geoportal
G.P. Obi Reddy, C. Mondal, Rajeev Srivastava, T.Bhattacharyya, L.G.K. Naidu, G.S.Sidhu, UtpalBaruah, S.K. Singh, R.S. Singh, Nirmal Kumar andDipak Sarkar
34. Development of district soil information system(DSIS) on 1:50,000 scale (50 Districts)
G.P. Obi Reddy, C. Mondal, Rajeev Srivastava, T.Bhattacharyya, L.G.K.Naidu, G.S. Sidhu, UtpalBaruah, S.K. Singh, R.S. Singh, Nirmal Kumar andDipak Sarkar
35. GIS modeling to predict land productivity potential(LPP) for major crops in Wardha district of sub-humid (dry) region, Eastern Maharashtra.
Nirmal Kumar, G.P. Obi Reddy and S. Chatterji
36. Assessment of spatio-temporal variability of majorcrops in different states of India for land useplanning: A GIS based approach
Malathi Bommidi, G.P. Obi Reddy, Nirmal Kumarand S.N. Goswami
37. Documentation and storing maps and photographs– concept of digital map library
C. Mandal, Pushpanjali, D.K Mandal, JagdishPrasad, T Bhattacharyya, R. Srivastava and D. Sarkar
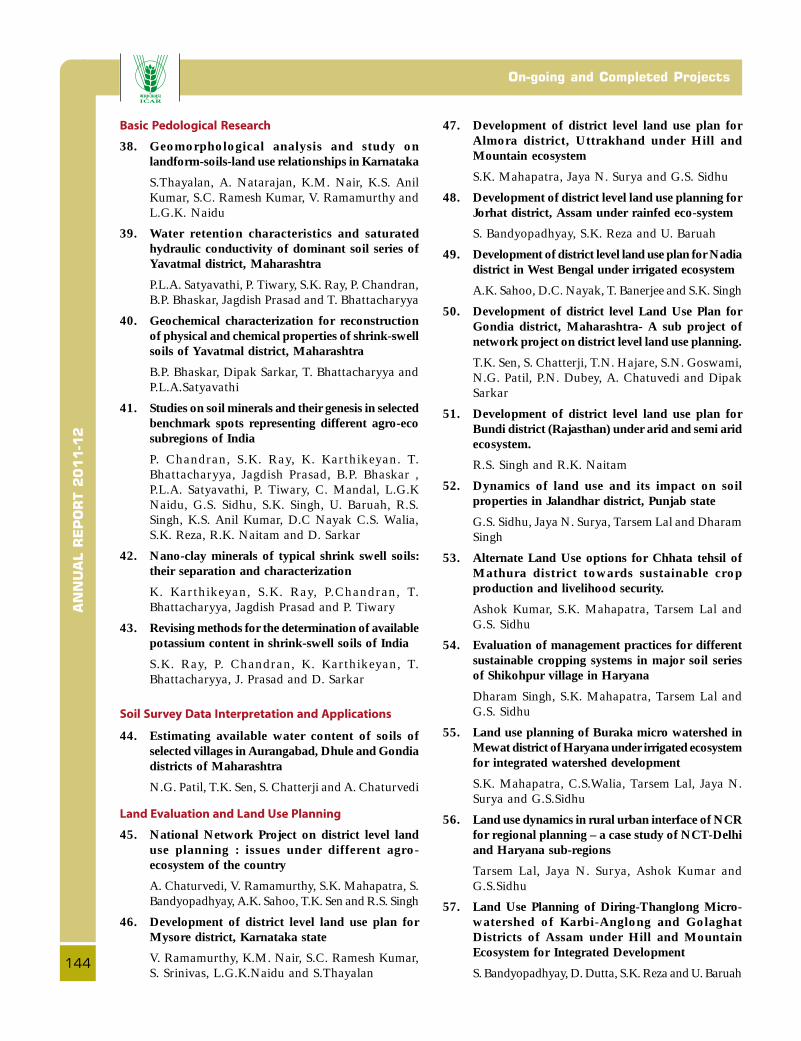
AN
NU
AL R
EP
OR
T 2
011-1
2
144
On-going and Completed Projects
Basic Pedological Research
38. Geomorphological analysis and study onlandform-soils-land use relationships in Karnataka
S.Thayalan, A. Natarajan, K.M. Nair, K.S. AnilKumar, S.C. Ramesh Kumar, V. Ramamurthy andL.G.K. Naidu
39. Water retention characteristics and saturatedhydraulic conductivity of dominant soil series ofYavatmal district, Maharashtra
P.L.A. Satyavathi, P. Tiwary, S.K. Ray, P. Chandran,B.P. Bhaskar, Jagdish Prasad and T. Bhattacharyya
40. Geochemical characterization for reconstructionof physical and chemical properties of shrink-swellsoils of Yavatmal district, Maharashtra
B.P. Bhaskar, Dipak Sarkar, T. Bhattacharyya andP.L.A.Satyavathi
41. Studies on soil minerals and their genesis in selectedbenchmark spots representing different agro-ecosubregions of India
P. Chandran, S.K. Ray, K. Karthikeyan. T.Bhattacharyya, Jagdish Prasad, B.P. Bhaskar ,P.L.A. Satyavathi, P. Tiwary, C. Mandal, L.G.KNaidu, G.S. Sidhu, S.K. Singh, U. Baruah, R.S.Singh, K.S. Anil Kumar, D.C Nayak C.S. Walia,S.K. Reza, R.K. Naitam and D. Sarkar
42. Nano-clay minerals of typical shrink swell soils:their separation and characterization
K. Karthikeyan, S.K. Ray, P.Chandran, T.Bhattacharyya, Jagdish Prasad and P. Tiwary
43. Revising methods for the determination of availablepotassium content in shrink-swell soils of India
S.K. Ray, P. Chandran, K. Karthikeyan, T.Bhattacharyya, J. Prasad and D. Sarkar
Soil Survey Data Interpretation and Applications
44. Estimating available water content of soils ofselected villages in Aurangabad, Dhule and Gondiadistricts of Maharashtra
N.G. Patil, T.K. Sen, S. Chatterji and A. Chaturvedi
Land Evaluation and Land Use Planning
45. National Network Project on district level landuse planning : issues under different agro-ecosystem of the country
A. Chaturvedi, V. Ramamurthy, S.K. Mahapatra, S.Bandyopadhyay, A.K. Sahoo, T.K. Sen and R.S. Singh
46. Development of district level land use plan forMysore district, Karnataka state
V. Ramamurthy, K.M. Nair, S.C. Ramesh Kumar,S. Srinivas, L.G.K.Naidu and S.Thayalan
47. Development of district level land use plan forAlmora district, Uttrakhand under Hill andMountain ecosystem
S.K. Mahapatra, Jaya N. Surya and G.S. Sidhu
48. Development of district level land use planning forJorhat district, Assam under rainfed eco-system
S. Bandyopadhyay, S.K. Reza and U. Baruah
49. Development of district level land use plan for Nadiadistrict in West Bengal under irrigated ecosystem
A.K. Sahoo, D.C. Nayak, T. Banerjee and S.K. Singh
50. Development of district level Land Use Plan forGondia district, Maharashtra- A sub project ofnetwork project on district level land use planning.
T.K. Sen, S. Chatterji, T.N. Hajare, S.N. Goswami,N.G. Patil, P.N. Dubey, A. Chatuvedi and DipakSarkar
51. Development of district level land use plan forBundi district (Rajasthan) under arid and semi aridecosystem.
R.S. Singh and R.K. Naitam
52. Dynamics of land use and its impact on soilproperties in Jalandhar district, Punjab state
G.S. Sidhu, Jaya N. Surya, Tarsem Lal and DharamSingh
53. Alternate Land Use options for Chhata tehsil ofMathura district towards sustainable cropproduction and livelihood security.
Ashok Kumar, S.K. Mahapatra, Tarsem Lal andG.S. Sidhu
54. Evaluation of management practices for differentsustainable cropping systems in major soil seriesof Shikohpur village in Haryana
Dharam Singh, S.K. Mahapatra, Tarsem Lal andG.S. Sidhu
55. Land use planning of Buraka micro watershed inMewat district of Haryana under irrigated ecosystemfor integrated watershed development
S.K. Mahapatra, C.S.Walia, Tarsem Lal, Jaya N.Surya and G.S.Sidhu
56. Land use dynamics in rural urban interface of NCRfor regional planning – a case study of NCT-Delhiand Haryana sub-regions
Tarsem Lal, Jaya N. Surya, Ashok Kumar andG.S.Sidhu
57. Land Use Planning of Diring-Thanglong Micro-watershed of Karbi-Anglong and GolaghatDistricts of Assam under Hill and MountainEcosystem for Integrated Development
S. Bandyopadhyay, D. Dutta, S.K. Reza and U. Baruah

AN
NU
AL R
EP
OR
T 2
011-1
2
145
Appendix 1
58. Land use planning of Khuskarani microwatershedfor integrated development
T.H. Das, S. Mukhopadhyay and S.K. Singh
59. Land use planning of Chanavada watershed inGirwa tehsil, Udaipur district, Rajasthan forintegrated development.
R.K. Naitam and T. P. Verma
60. Natural Resources and Land Use Issues inBackward Districts of India
Chaturvedi, N.G. Patil and T.N. Hajare
61. Land Evaluation for rainfed Bt Cotton in soils ofNagpur district, Maharashtra using soft computingtechniques
S. Chatterji, T.K. Sen, N.G. Patil, T.N. Hajare andArun Chaturvedi
62. Assessment of land resources for growing horticul-tural crops in selected districts of Tamil Naduunder the National Horticultural Mission ProjectA. Natarajan, V. Ramamurthy, S. Thayalan, S.Srinivas, K.V. Niranjana, M. Ramesh, D.H.Venkatesh and L.G.K.Naidu
Completed Projects (Institutional)
1. Land use planning for North Goa District, GoaRajendra Hegde, S. Srinivas and S.C. Ramesh Kumar
2. Agro-ecological zoning of Tamil NaduL.G.K. Naidu, S. Srinivas, A. Natarajan, S. Thayalanand V. Ramamurthy
3. Land use planning for Tirumale sub-watershed(Motaganhalli watershed) in Magadi taluk, Ramangardistrict, KarnatakaRajendra Hegde, S. S. Srinivas and A. Natarajan
4. Development of software modules for landevaluation and agro-climatic analysis
S. Srinivas, K.M. Nair, L.G.K. Naidu, RajendraHegde and V. Ramamurthy
5. Assessment of stakeholders needs and economicevaluation of land use types for land use planningof Mysore and North Goa Districts
S.C. Ramesh Kumar, V.Ramamurthy and RajendraHegde
6. Dynamics of land use and its impact on soilproperties in Nawanshahr district, Punjab stateG.S. Sidhu, Tarsem Lal, Jaya N. Surya, J.P. Sharmaand D.K. Katiyar
7. Soil resource mapping of Tehri Garhwal districtof Uttaranchal on 1:50,000 scale for perspectiveland use planning
C. B. Sachdev, S.K. Mahapatra, D. Martin, JagatRam, T. Lal, S. P. Singh and J.P. Sharma
8. Soil resource mapping of Pauri Garhwal districtof Uttarakhand on 1:50,000 scale for perspectiveland use planningS.K. Mahapatra, D. Martin, Jagat Ram, R. P.Dhankar, S. P. Singh and J.P. Sharma
9. Soil resource mapping of Almora district ofUttarakhand on 1:50,000 scale for perspective landuse planningS.K. Mahapatra, D. Martin, Jagat Ram, R. P.Dhankar, S. P. Singh and J.P. Sharma
10. Integrated approach of remote sensing and GIS inland resources characterization, evaluation andmapping in Saraswati watershed in Buldhanadistrict of MaharashtraM.S.S. Nagaraju, Rajeev Srivastava, A.K. Maji andA.K. Barthwal
11. Estimating saturated hydraulic conductivity andother physical properties of the Vertisols and verticintergrades from Published Research and SoilSurvey DataN.G. Patil, D.K. Pal, C. Mandal and D.K. Mandal
12. Development of protocols for digestion, standardsand methods to determine elements in soils andsediments using Inductively Coupled PlasmaSpectrometry (ICP-AES).S.K. Ray, P. Chandran, T. Bhattacharyya, P.L.A.Satyavathi, D. Sarkar, S. G. Anantawar and P. Raja
13. Effect of different land uses on total soil organiccarbon (SOC) and its active pools in humid to perhumid ecoregion of West BengalD. Dutta, D.C. Nayak, Dipak Sarkar
14. Development of GIS based seamless mosaic ofSRTM elevation data of India to analyze andcharacterize the selected geomorphic parametersG.P. Obi Reddy, A.K. Maji, S.N. Das and RajeevSrivastava
15. Spatial assessment of soil erosion of different statesof India using Grid point data in GIS
A.K. Maji, G.P. Obi Reddy, Sunil Meshram andSPC’s of the Respective states and project leaderof CSWCR&TI
16. Soil microbial biomass Carbon and Nitrogen inselected soil series of north-eastern region asaffected by different land uses and varied agro-ecological conditions
T. Chattopadhyay, D.J. Nath, S.K. Reza and U.Baruah
17. Assessment of heavy metal pollution and itsmapping in soils of contaminated areas of Morigoan,Dibrugarh and Tinsukia districts of Assam
S.K. Reza, S.K. Ray and Utpal Baruah
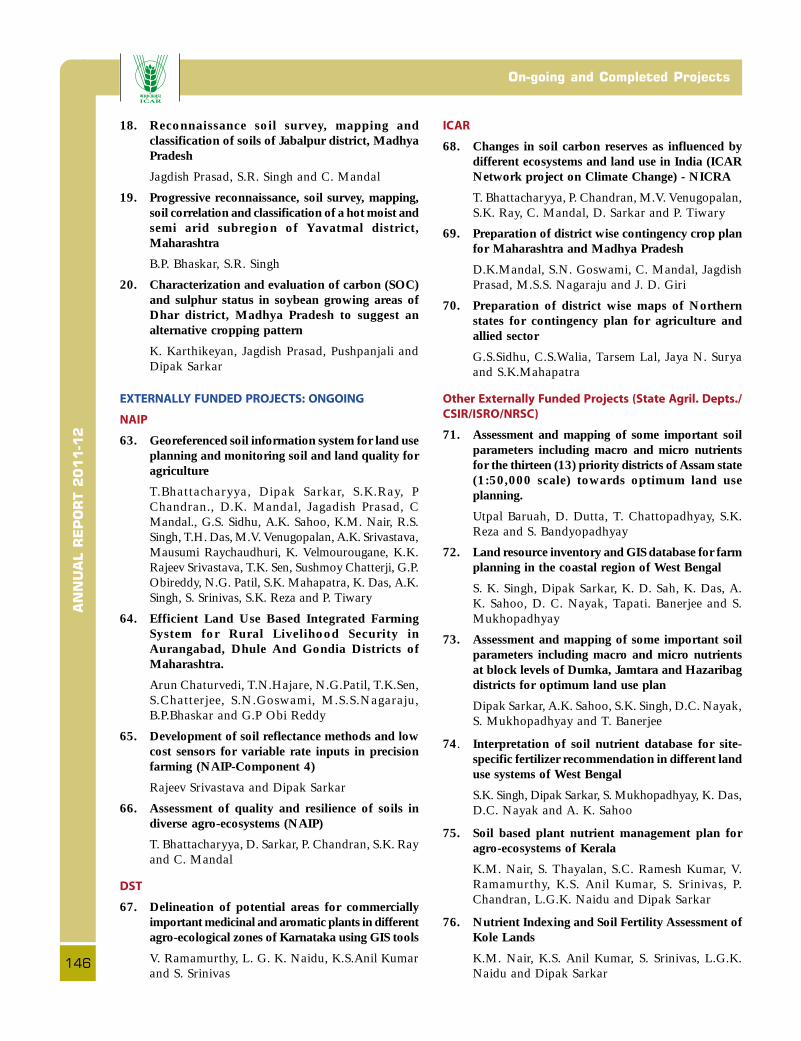
AN
NU
AL R
EP
OR
T 2
011-1
2
146
On-going and Completed Projects
18. Reconnaissance soil survey, mapping andclassification of soils of Jabalpur district, MadhyaPradesh
Jagdish Prasad, S.R. Singh and C. Mandal
19. Progressive reconnaissance, soil survey, mapping,soil correlation and classification of a hot moist andsemi arid subregion of Yavatmal district,Maharashtra
B.P. Bhaskar, S.R. Singh
20. Characterization and evaluation of carbon (SOC)and sulphur status in soybean growing areas ofDhar district, Madhya Pradesh to suggest analternative cropping pattern
K. Karthikeyan, Jagdish Prasad, Pushpanjali andDipak Sarkar
EXTERNALLY FUNDED PROJECTS: ONGOING
NAIP
63. Georeferenced soil information system for land useplanning and monitoring soil and land quality foragriculture
T.Bhattacharyya, Dipak Sarkar, S.K.Ray, PChandran., D.K. Mandal, Jagadish Prasad, CMandal., G.S. Sidhu, A.K. Sahoo, K.M. Nair, R.S.Singh, T.H. Das, M.V. Venugopalan, A.K. Srivastava,Mausumi Raychaudhuri, K. Velmourougane, K.K.Rajeev Srivastava, T.K. Sen, Sushmoy Chatterji, G.P.Obireddy, N.G. Patil, S.K. Mahapatra, K. Das, A.K.Singh, S. Srinivas, S.K. Reza and P. Tiwary
64. Efficient Land Use Based Integrated FarmingSystem for Rural Livelihood Security inAurangabad, Dhule And Gondia Districts ofMaharashtra.
Arun Chaturvedi, T.N.Hajare, N.G.Patil, T.K.Sen,S.Chatterjee, S.N.Goswami, M.S.S.Nagaraju,B.P.Bhaskar and G.P Obi Reddy
65. Development of soil reflectance methods and lowcost sensors for variable rate inputs in precisionfarming (NAIP-Component 4)
Rajeev Srivastava and Dipak Sarkar
66. Assessment of quality and resilience of soils indiverse agro-ecosystems (NAIP)
T. Bhattacharyya, D. Sarkar, P. Chandran, S.K. Rayand C. Mandal
DST
67. Delineation of potential areas for commerciallyimportant medicinal and aromatic plants in differentagro-ecological zones of Karnataka using GIS tools
V. Ramamurthy, L. G. K. Naidu, K.S.Anil Kumarand S. Srinivas
ICAR
68. Changes in soil carbon reserves as influenced bydifferent ecosystems and land use in India (ICARNetwork project on Climate Change) - NICRA
T. Bhattacharyya, P. Chandran, M.V. Venugopalan,S.K. Ray, C. Mandal, D. Sarkar and P. Tiwary
69. Preparation of district wise contingency crop planfor Maharashtra and Madhya Pradesh
D.K.Mandal, S.N. Goswami, C. Mandal, JagdishPrasad, M.S.S. Nagaraju and J. D. Giri
70. Preparation of district wise maps of Northernstates for contingency plan for agriculture andallied sector
G.S.Sidhu, C.S.Walia, Tarsem Lal, Jaya N. Suryaand S.K.Mahapatra
Other Externally Funded Projects (State Agril. Depts./
CSIR/ISRO/NRSC)
71. Assessment and mapping of some important soilparameters including macro and micro nutrientsfor the thirteen (13) priority districts of Assam state(1:50,000 scale) towards optimum land useplanning.
Utpal Baruah, D. Dutta, T. Chattopadhyay, S.K.Reza and S. Bandyopadhyay
72. Land resource inventory and GIS database for farmplanning in the coastal region of West Bengal
S. K. Singh, Dipak Sarkar, K. D. Sah, K. Das, A.K. Sahoo, D. C. Nayak, Tapati. Banerjee and S.Mukhopadhyay
73. Assessment and mapping of some important soilparameters including macro and micro nutrientsat block levels of Dumka, Jamtara and Hazaribagdistricts for optimum land use plan
Dipak Sarkar, A.K. Sahoo, S.K. Singh, D.C. Nayak,S. Mukhopadhyay and T. Banerjee
74. Interpretation of soil nutrient database for site-specific fertilizer recommendation in different landuse systems of West Bengal
S.K. Singh, Dipak Sarkar, S. Mukhopadhyay, K. Das,D.C. Nayak and A. K. Sahoo
75. Soil based plant nutrient management plan foragro-ecosystems of Kerala
K.M. Nair, S. Thayalan, S.C. Ramesh Kumar, V.Ramamurthy, K.S. Anil Kumar, S. Srinivas, P.Chandran, L.G.K. Naidu and Dipak Sarkar
76. Nutrient Indexing and Soil Fertility Assessment ofKole Lands
K.M. Nair, K.S. Anil Kumar, S. Srinivas, L.G.K.Naidu and Dipak Sarkar
AN
NU
AL R
EP
OR
T 2
011-1
2
147
Appendix 1
77. Soil and land capability map for land use planningof Dzongu farm, North Sikkim district, Sikkim
S.K. Reza, Utpal Baruah and Dipak Dutta
78. Modelling impact of climate change on soil qualityand land use in arid, semi-arid and sub-humidregions of Karnataka for agricultural sustainability(C-MMACS-CSIR sponsored)
V. Ramamurthy, K.M.Nair, L.G.K.Naidu and D.Sarkar
79. Greenhouse gas budgets of South and SoutheastAsia : APN Project (International Project)
T. Bhattacharyya D. Sarkar and P. Tiwari
Externally Funded Projects : Completed
21. Soils of Thirupuram, Kanjramkulam and Kodina-nankklam Panchayats of Thiruvananthapuramdistrict, Kerala. (NAIP: NBSS&LUP as a ConsortiumPartner)
K.M. Nair, S. Thayalan, K.S. Anil Kumar,D. Sarkar and L.G.K. Naidu
22. Interfluve stratigraphy, sedimentology and geo-chemistry of Central and Southern Ganga Plains(DST- ESS Project)
T. Bhattacharyya, P. Chandran, S.K. Ray and P.L.A.Satyavathi
23. Predicting soil carbon changes under differentcropping system in soils of selected benchmarkspots in different bioclimatic systems in India
T. Bhattacharyya, S.K. Ray, P. Chandran and C.Mandal
24. Generation of soil database for Khulgad watersheddevelopment in Almora district of Uttarakhand(DST sponsored )
C.S Walia, R.P.Dhankar, J.N Surya and J.P. Sharma
25. Detailed resource soil survey of Hayatnagarresearch farm of CRIDA, Hyderabad
P. Chandran, S.K. Ray, D. K. Pal, T. Bhattacharyya,C. Mandal, M.S.S. Nagaraju and D. Sarkar
26. Soil resource mapping of sugarcane research farm,Pusa, Samastipur, Bihar
S.K.Gangopadhyay, S.K.Singh and Dipak Sarkar
27. Resource soil survey of Khamaria Seeds Farms inJabalpur, Madhya Pradesh for Borlaug Instituteof South Asia (BISA)
Jagdish Prasad, Dipak Sarkar, Raj. K. Gupta, P.Tiwary, B.P. Bhaskar, P. Chandran, S.K. Ray, T.Bhattacharyya
28. Enrichment of land degradation datasets with soilsdataset of different states of India
NBSS&LUP: G.P. Obi Reddy, Rajeev Srivastava,G.S. Sidhu, A.K. Sahoo, K.S. Anil Kumar, SiladityaBandyopadhyay, R.S. Singh, Nirmal Kumar,Ravindra Naitam
NRSC: T. Ravisankar, K. Srinivas, G. Sujatha andM.A. Fiazy
Coordinators: Dipak Sarkar, NBSS&LUP and P.S. Roy & G. Behra, NRSC
29. Assessment and mapping of some important soilparameters including macro and micronutrients forthe state of West Bengal (1:50,000) towardsoptimum land use plan
Dipak Sarkar, K. Das, A.K. Sahoo, D.S. Singh, D.C.Nayak, S. Mukhopadhyay, M. Swamiathan
30. Agro-Ecological units of 14 districts of Kerala(Govt. of Kerala Sponsored)
K.M. Nair, Champa Mandal, Arun Chaturvedi,S.Thayalan, S.C. Ramesh Kumar, V. Ramamurthy,K.S. Anil Kumar, S. Srinivas, L.G.K. Naidu andDipak Sarkar
31. Detailed assessment of land and soil resources ofKuppam Mandal in Chhitoor district of AndhraPradesh (Govt. of Andhra Pradesh Sponsored)
K.S. Anil Kumar, S.C. Ramesh Kumar, B.A.Dhanorkar
32. Human Resource Development in Remote sensingand GIS in Natural Resource Management.(NNRMS – ISRO Sponsored)
G.P. Obi Reddy, A.K. Maji and A. Chaturvedi
AN
NU
AL R
EP
OR
T 2
011-1
2
148
Distinguished Visitors
Headquarters, Nagpur
• Dr. S. Ayyappan, Secretary, DARE, Govt.of India and Director General, ICAR, NewDelhi visited the Bureau on 11th December2011
• Dr. A.K. Singh, Deputy Director General(NRM) on 24th February 2012.
• Dr. Saraswati Raju, Professor, JNU, NewDelhi on 16th – 18th October 2011.
• Dr. Smita Sengupta, Professor, IIT Mumbaion 16th – 18th October 2011.
• Prof. Raj Khosla, Colarado State University,USA on 19th to 23rd November 2011
• Dr. Y.V.N. Krishnamurthy, Dy. Director,NRSC on 15th November 2011.
• Dr. Asis Bhattacharyya, Dy. Director,NRSC on 16th November 2011.
• Dr. K.N. Singh, Pr. Scientist & Head IASRI,New Delhi on 26th November 2011.
• Dr. Bundela, Pr. Scientist CSSRI, Karnal on27th November 2011.
• Dr. Ansu Bharadwaj, Sr. Scientist, IASRI,New Delhi on 15h – 28th November 2011.
• Prof. G.N. Chattopadhyay, Viswa BharatiSanthiniketan (WB) on 14th December2011.
• Dr. Ansu Bharadwaj, Sr. Scientist, IASRI,New Delhi.
• A group of 20 officers from NGOs fromTiruvannamali, Tamil Nadu the GISSection on 30th November 2011.
• Prof. G.N. Chattopadhyay, Viswa BharatiSanthiniketan, West Bengal GIS Section on14th December 2011.
• Library Science students (Post Graduate)of Department of Library & InformationScience, Nagpur University, Nagpur thelibrary for their project work.
Regional Centre, Bangalore
• Dr. Hendrickx, Professor of HydrologyNew Mexico University visited RegionalCentre on 18-5-2011.
• World Bank officials.
• Dr. Ayyappan, Director General, ICAR on8-4-2011 and interacted with Scientists andother staff members.
• Watershed Director Dr. Rajanna visit toLUP project site along with Regional centreScientists
• Dr. Dipak Sarkar, Director NBSS & LUPduring 9-4-2011 to 16-4-2011 to reviewresearch projects.
• Dr. A.K. Singh, DDG -NRM (ICAR) on19-11-2011.
• Dr. Velayutham, Chairman RAC (NBSS&LUP) on 15-11-2011.
Distinguished Visitors
Appendix
2

AN
NU
AL R
EP
OR
T 2
011-1
2
149
Appendix 2
• Dr.Rajanna, Director of WatershedDepartment, Government of Karnataka.
• About 54 B.Sc.(Agri) students and 4teachers of Agricultural college, Kasargod,Kerala on 6-3-2012.
• Dr. Moni, DDG, NIC, New Delhi alongwith other officials.
• Dr. Veeraraju, Joint Director, KarnatakaWatershed Development Department.
• Sri Yellappa Reddy, Member, KarnatakaLok Adalath.
• Sri. Satish, G., Chief Conservator of Forestsand Executive Director, Sujala-III.
• Dr. Grant Milne, Team Leader, WorldBank, Washington D.C.
• Dr. P.M. Sobarad, JD (Hort.), WDD,Bangalore.
• Dr. Anju Gour, Hydrologist, World Bank,New Delhi.
• Dr. Benjamin Obrien, FAO expert,Bangkok.
• Dr. Selvarajan, Economist, World Bank,New Delhi.
• Dr. Nutan, Associate Director of Researchand his team of Scientists from UAS(B).
• Dr. G. Dasog, Professor, Soil Science, UAS,Dharwad and his team.
• Dr. Satish Kumar, Prof. Agrl. Engineering,UAS, Raichur and his team.
• Dr. Laxmikanth, Senior Scientist, KSRSACand his team.
• Dr. Lingappa, Professor of Horticulture,UHS, Bhagalkot & his team.
• Dr.U. Krishna Murthy, Professor ofVeterinary Sciences, Karnataka Veterinary,University, Bidar & his team.
• Sri R.L. Meena, Soil Survey Officer & histeam from SLUSI, Bangalore.
• Dr. G. V. Hegde , Senior Geologist, WaterResources, and his team from Departmentof Mines and Geology, (GoK).
• Dr. Anupam Joshi, EnvironmentalSpecialist, World Bank, New Delhi.
• Sri M.S. Goudar, IFS, Commissioner,Department of Watershed Development,Karnataka.
• Dr. Hendrickx, Professor of HydrologyNew Mexico University and Member ofWorld bank expert for Sujala watershed(GoK).(May 2011).
• Sri Srinivas, Asst. Conservator of Forests,Department of Watershed Development,Karnataka.
• 25 participants from South-East Asiancountries of the International Trainingprogram on “Watershed management foragriculture growth and environmental forconservation. (29-11-2011).
• 60 students of final year B.Tech (Agri.)from UAS (B), ( 1-12-2011).
• Dr. Satyanarayana, Scientist, InternationalPlant Nutrition Institute, Hydrabad(May2011).
• Dr. L B Naik, Principal Scientist and Head,Seed Science IIHR, Bangalore and Trainingorganizer, KVK Hirehalli, Tumkur district.
• Dr. Sameena, Director, NIC, New Delhi(March 2012).
Regional Centre, Delhi
• Dr. A. K. Singh, Deputy Director General(NRM), ICAR, New Delhi.
• Dr. S.S. Khanna, Ex Vice Chancellor, NDUAT,Faizabad, Former Advisor (Agriculture),Planning Commission, Govt. of India.

AN
NU
AL R
EP
OR
T 2
011-1
2
150
Distinguished Visitors
• Dr. N.N.Goswami, Former ViceChancellor, CSAUA&T, Kanpur.
• Dr. P.K. Sharma, Ex Director, PunjabRemote Sensing Application Centre,Ludhiana.
• Dr. M. Velayutham, Chairman, ResearchAdvisory Council, NBSS&LUP.
• Dr. Pratap Naryana, Ex Vice Chancellor,SKRAU, Bikaner.
Regional Centre, Jorhat
• Dr. N.N. Sarmah, Director of Research,AAU, Jorhat.
• Dr. M. Rohini Kr. Singh, Director ofResearch, Central Agricultural University,Manipur, Imphal.
• Dr. B. C. Bhowmick, Director of ExtensionEducation, AAU, Jorhat.
• Dr. R.K. Rajan, Director, Central Muga EriResearch and Training Institute, Jorhat.
• Dr. Durgeswar Das, Director of PostGraduate Studies, AAU, Jorhat.
• Mr. A.K. Purakayastha, Director, Dept. ofAgriculture, Arunachal Pradesh.
• Dr. L.K. Hazarika, Dean, Faculty ofAgricultural science AAU, Jorhat.
• Dr. S. Patgiri, Professor, Dept. of SoilScience, AAU.
• Dr. A. . Basumutari, Professor, Dept. of SoilScience, AAU.
• Mr. G. Kharmujai, Joint Director, Dept. ofSoil & Water Conservation, Meghalaya.
• Dr. Mrinmoy Dutta, Joint Director, ICARComplex, Regional Centre, Lembuchera,Tripura.
• Mr. D. Gogoi, Divisional Officer, SoilConservation Department of Jorhat.
• Mr. T.P. Hazarika, Divisional Officer,Eastern Assam Soil Conservation Department
• Dr. Anup Baruah, Head, Dept. of Soils,Tocklai Experimental Station.
• Dr. B.U. Choudhury Senior Scientist, ICARComplex, NEHR, Barapani, Meghalaya.
• Dr. Anup Das, Senior Scientist, ICARComplex, NEHR, Barapani, Meghalaya.
Regional Centre, Kolkata
• Shri R.N. Bhattacharyya, Hon’ble MICAgriculture, Govt. of West Bengal
• Dr. A. K. Singh, DDG (NRM), ICAR, NewDelhi.
Dr. A.K. Singh, Deputy Director General (NRM), ICAR
inaugurating the renovated library of Regional Centre,
Kolkata in presence of Dr. Dipak Sarkar, Director and
Dr. S.K. Singh, Head, Regional Centre
• Prof. Saroj Kr. Sanyal, Vice-Chancellor,Bidhan Chandra Krishi Viswavidyalaya,Mohanpur, Nadia.
• Shri H. Mohan, IAS, Secretary, Deptt. ofAgriculture, Govt. of West Bengal.
• Shri A.K. Singh, Principal Secretary, IAS,Govt. of Jharkhand.
• Dr. Pradip Sen, Jt. Director (Research),Department of Agriculture, Govt. of WestBengal
• Dr. Pritish Nag, Director, NATMO,Kolkata.
AN
NU
AL R
EP
OR
T 2
011-1
2
151
Appendix 2
• Dr. A.K.Sarkar, Dean (Agriculture), BirsaAgricultural University, Ranchi.
• Dr. D. Pradhan, Director, Doppler WeatherRadar, Indian Meterological Department,Kolkata.
• Dr. Saugato Hazra, Director, School ofOceanographic Studies, JadavpurUniversity, Kolkata.
• Dr. Amal Kar, Head, Division of NaturalResource and Environment, CAZRI,Jodhpur.
Regional Centre, Udaipur
22.06.2011
• Dr. M. Velauthum, Ex. DirectorNBSS&LUP, Nagpur.
• Prof. S. C. Mukhopadhyay, Ex. HeadDeptt. Geography.
• Dr. U. C. Sharma, Ex. NationalCoordinator NATP.
• Dr. S. S. Magar, Ex. Vice Chancellor,Konkan Krishi Vidyapeeth.
24.06.2011
• Dr. K.V. Kathiria, Director of Research &Dean P.G. Studies AAU, Anand, Gujarat.
• Dr. Bhawani Singh Rathore, Joint Director(Range), Deptt. Animal Husbandry Govt.Raj.
• Dr. M. P. Bagada, Deputy Director, Agric.Director of Agric. Gujarat StateGandhinagar.
• Mr. C.S. Mehta, Additional Director,Watershed Development & soilConservation Govt. Rajasthan, Jaipur.
• Dr. S. S. Rajput, Asstt. Director, Directorateof Ext. Education, MPUAT, Udaipur.
• Mr. Madan Chhajed, Ex. Engineer, LandResources, Udaipur.
• Dr. K.P. Patel, Res. Scientist(Micronutrients), AAU, Anand, Gujarat.
• Dr. K.N. Akbari, Res. Scientist (drylandfarming), JAU, Janagarh.
• Dr. I.J. Gulati, Sr. Soil Chemist, OSD&Tech. Advisor to V.C.,SKRAU, Bikaner.

AN
NU
AL R
EP
OR
T 2
011-1
2
152
Distinguished Visitors
Important Committees
Appendix
3
Institute Research Council (IRC)
1. Dr. Dipak Sarkar, Director Chairman
2. Heads of Divisions/Regional Centres Members
3. All Principal Investigators Members
4. Dr. P. Chandran, Principal Scientist & In-charge, PME Cell Member
5. Dr. T. Bhattacharyya, Pr. Scientist and Head, Div. of SRS Member Secretary
Research Advisory Committee (RAC)
1. Dr. M. Velayutham Chairman
2. Prof.S.C. Mukhopadhyay Member
3. Dr. U.C. Sharma Member
4. Dr. T. Ravishankar Member
5. Dr. S.S. Magar Member
6. Dr. T. Bhattacharyya, Pr. Scientist and Head, Div. of SRS Member Secretary
Institute Management Council (IMC)
1. Dr. Dipak Sarkar, Director Chairman
2. Dr. Rajeev Srivastava, Pr. Scientist & Head, Division of RSA Member
3. Dr. V. Ramamurthy, Pr. Scientist, Regional Centre, Bangalore Member
4. Dr. M.V. Venugopalan, Pr. Scientist, CICR, Nagpur Member
5. Dr.A.K. Biswas, Pr. Scientist & Head, Soil Chemistry, IISS, Bhopal Member
6. Shri B.D. Phansal, Chief Administrative Officer Member Secretary
Important Committees
AN
NU
AL R
EP
OR
T 2
011-1
2
153
Appendix 4
Lectures Delivered by the Scientists
Appendix
4
Name of the Scientist Event/Topic Venue and Date
Dr. Rajendra Hegde Importance of generating and using land resources Regional Centre, NBSS&LUP,database in the integrated watershed development at Bangalore on 11th April 2011.the meeting of IWMP: District watershed officials andAdditional Secretary, Rainfed Agriculture Authority,Govt. of India
Land resources of Tirumale sub-watershed for integrated Regional Centre, NBSS&LUP,development and post project evaluation in the meeting Bangalore on 12th July 2011.at Karnataka watershed development department,Bangalore in the presence of Commissioner and directorof Watershed department.
Guest lecture on “ Utility and the need for detailed Regional Centre, NBSS&LUP,land resources inventory for the implementation and Bangalore on 20th July 2011.evaluation of watershed development programs- a casestudy of Tirumale sub-watershed in the workshoporganized by World Bank team on “Wealth accountingand valuation of ecosystem services under the Karnatakawatershed development project (Sujala-III)”(WAVES).
Dr. G. P. Obi Reddy ICAR Sponsored Winter School “Advances in GIS and GIS Section, NBSS&LUP,Remote sensing based Digital Terrain Analysis and Nagpur from 6th to 26th
Hydro-geomorphic Applications in Soil-Landscape September 2011.Modeling”
DST sponsored Data Users’ Workshop and training GIS Section NBSS&LUP fromprogramme organized by NBSS&LUP and LIGHTS 16th to 18th October, 2011.organization, New Delhi
NAIP (ICAR) sponsored two weeks national training GIS Section, NBSS&LUP,on“Recent Trends of Geoinformatics in Land Resource Nagpur from 15th to 28th
Database Management for Sustainable Agriculture” November 2011.
State level training programme on Remote sensing and Vasantarao Naik GovernmentGeographic Information System” Institute of Arts and Science,
Nagpur on 3rd December 2011.
Training programme “Soil Resource Inventory for CTI, Department of SoilWatershed/ River Basin Development using Remote Conservation, Byrnihat,Sensing and Geographical Information System” Meghalaya during 27th to 28th
organized by NBSS&LUP Regional Centre, Jorhat January, 2012
Training programme “Application of Remote Sensing NBSS&LUP, Kolkata duringand GIS for watershed Characterization and 1st and 2nd March, 2012.Resource Planning”
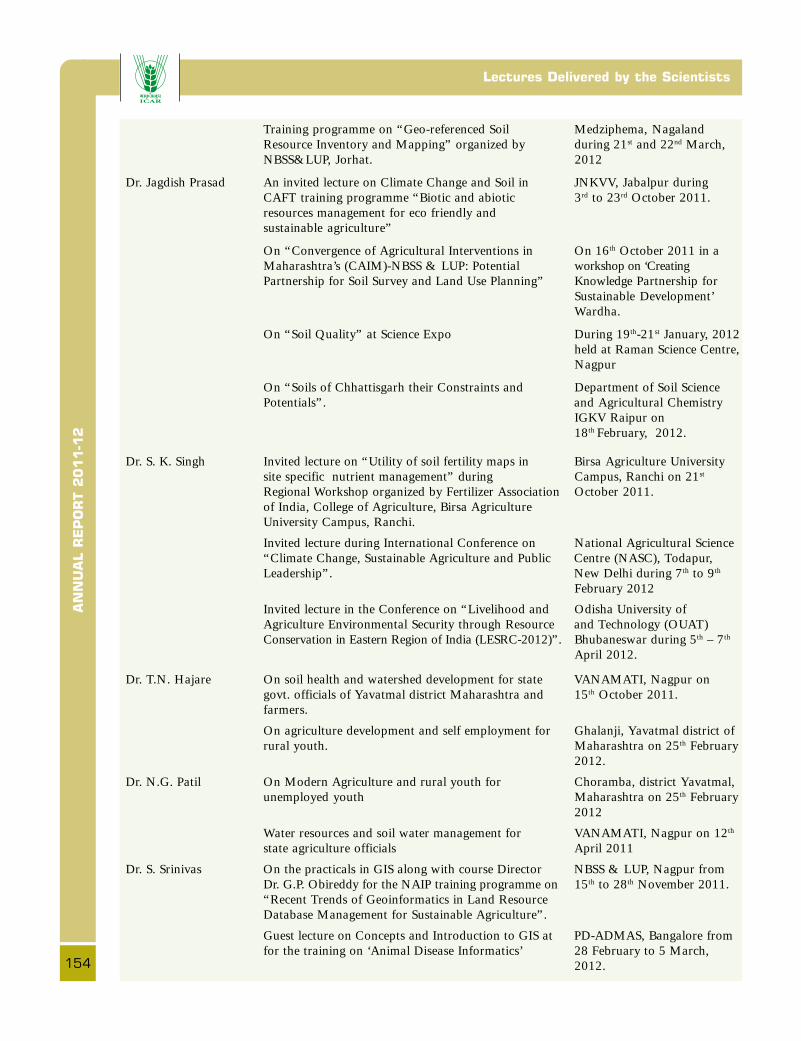
AN
NU
AL R
EP
OR
T 2
011-1
2
154
Lectures Delivered by the Scientists
Training programme on “Geo-referenced Soil Medziphema, NagalandResource Inventory and Mapping” organized by during 21st and 22nd March,NBSS&LUP, Jorhat. 2012
Dr. Jagdish Prasad An invited lecture on Climate Change and Soil in JNKVV, Jabalpur duringCAFT training programme “Biotic and abiotic 3rd to 23rd October 2011.resources management for eco friendly andsustainable agriculture”
On “Convergence of Agricultural Interventions in On 16th October 2011 in aMaharashtra’s (CAIM)-NBSS & LUP: Potential workshop on ‘CreatingPartnership for Soil Survey and Land Use Planning” Knowledge Partnership for
Sustainable Development’Wardha.
On “Soil Quality” at Science Expo During 19th-21st January, 2012held at Raman Science Centre,Nagpur
On “Soils of Chhattisgarh their Constraints and Department of Soil SciencePotentials”. and Agricultural Chemistry
IGKV Raipur on18th February, 2012.
Dr. S. K. Singh Invited lecture on “Utility of soil fertility maps in Birsa Agriculture Universitysite specific nutrient management” during Campus, Ranchi on 21st
Regional Workshop organized by Fertilizer Association October 2011.of India, College of Agriculture, Birsa AgricultureUniversity Campus, Ranchi.
Invited lecture during International Conference on National Agricultural Science“Climate Change, Sustainable Agriculture and Public Centre (NASC), Todapur,Leadership”. New Delhi during 7th to 9th
February 2012
Invited lecture in the Conference on “Livelihood and Odisha University ofAgriculture Environmental Security through Resource and Technology (OUAT)Conservation in Eastern Region of India (LESRC-2012)”. Bhubaneswar during 5th – 7th
April 2012.
Dr. T.N. Hajare On soil health and watershed development for state VANAMATI, Nagpur ongovt. officials of Yavatmal district Maharashtra and 15th October 2011.farmers.
On agriculture development and self employment for Ghalanji, Yavatmal district ofrural youth. Maharashtra on 25th February
2012.
Dr. N.G. Patil On Modern Agriculture and rural youth for Choramba, district Yavatmal,unemployed youth Maharashtra on 25th February
2012
Water resources and soil water management for VANAMATI, Nagpur on 12th
state agriculture officials April 2011
Dr. S. Srinivas On the practicals in GIS along with course Director NBSS & LUP, Nagpur fromDr. G.P. Obireddy for the NAIP training programme on 15th to 28th November 2011.“Recent Trends of Geoinformatics in Land ResourceDatabase Management for Sustainable Agriculture”.
Guest lecture on Concepts and Introduction to GIS at PD-ADMAS, Bangalore fromfor the training on ‘Animal Disease Informatics’ 28 February to 5 March,
2012.
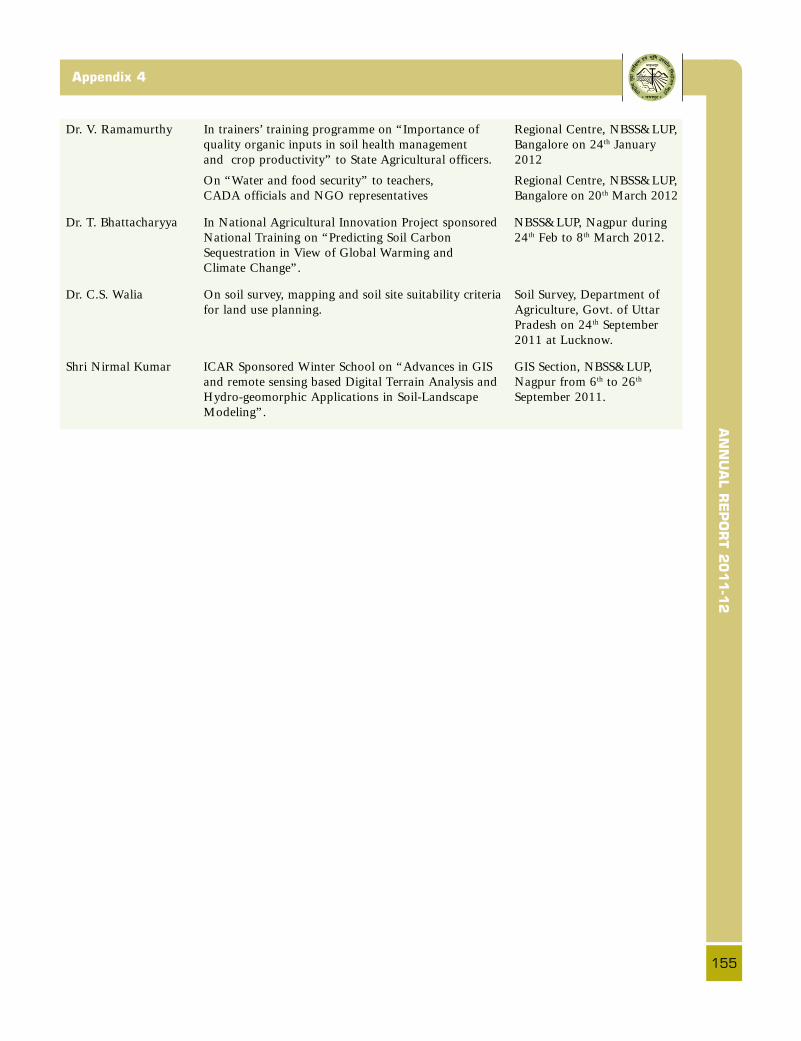
AN
NU
AL R
EP
OR
T 2
011-1
2
155
Appendix 4
Dr. V. Ramamurthy In trainers’ training programme on “Importance of Regional Centre, NBSS&LUP,quality organic inputs in soil health management Bangalore on 24th Januaryand crop productivity” to State Agricultural officers. 2012
On “Water and food security” to teachers, Regional Centre, NBSS&LUP,CADA officials and NGO representatives Bangalore on 20th March 2012
Dr. T. Bhattacharyya In National Agricultural Innovation Project sponsored NBSS&LUP, Nagpur duringNational Training on “Predicting Soil Carbon 24th Feb to 8th March 2012.Sequestration in View of Global Warming andClimate Change”.
Dr. C.S. Walia On soil survey, mapping and soil site suitability criteria Soil Survey, Department offor land use planning. Agriculture, Govt. of Uttar
Pradesh on 24th September2011 at Lucknow.
Shri Nirmal Kumar ICAR Sponsored Winter School on “Advances in GIS GIS Section, NBSS&LUP,and remote sensing based Digital Terrain Analysis and Nagpur from 6th to 26th
Hydro-geomorphic Applications in Soil-Landscape September 2011.Modeling”.

AN
NU
AL R
EP
OR
T 2
011-1
2
156
Lectures Delivered by the ScientistsPersonnel (Managerial Position)
Dr. A Chaturvedi : Division of Land Use PlanningPrincipal Scientist (Geography) and Head
Dr. Rajeev Srivastava : Division of Remote Sensing ApplicationsPrincipal Scientist (Pedology) and Head
Dr. T. Bhattacharyya : Division of Soil Resource StudiesPrincipal Scientist (Pedology) and Head
Dr. L.G.K. Naidu : Regional Centre, BangalorePrincipal Scientist (Pedology) and Head
Dr. G.S. Sidhu : Regional Centre, DelhiPrincipal Scientist (Pedology) and Head
Dr. Utpal Baruah : Regional Centre, JorhatPrincipal Scientist (Geography) and Head
Dr. S.K. Singh : Regional Centre, KolkataPrincipal Scientist (Pedology) and Head
Dr. R.S. Singh : Regional Centre, UdaipurPrincipal Scientist (Pedology) and Head
Dr. (Mrs) C. Mandal : Cartography UnitPrincipal Scientist (Geography) and In-charge
Dr. G.P. Obi Reddy : Geographical Information System Unit (GIS)Senior Scientist and In-charge
Dr. P. Chandran : Prioritization, Monitoring and EvaluationPrincipal Scientist (Pedology) and In-charge (PME) Cell
Sh. G.R. Deshmukh : Library and Documentation UnitTechnical Officer (T-9) and In-charge
(Upto 31.7.2011)Dr. (Mrs.) Jiji Cyriac
(from 1.8.2011) In-charge (Acting)Dr. N.C. Khandare : Sale and Publication Unit
Technical Officer (T-9) and In-chargeSh. S.K. Arora : Printing Section
Printing Officer (T-9) and In-chargeSh. B.D. Phansal : Administration
Chief Administrative OfficerSh. O.P. Nagar : Finance and Accounts
Senior Finance and Accounts OfficerMrs. Bhanu Narayanan : Administration
Administrative Officer
Personnel (Managerial Position)
DR. DIPAK SARKARDirector
Appendix
5

AN
NU
AL R
EP
OR
T 2
011-1
2
157
Appendix 4
Staff-related General Information
Appendix
6
Appendix 6
Visits Abroad
• Dr. S.K. Ray, Principal Scientist has beenon foreign assignment at the Soil and WaterScience Department, Institute of Foodand Agricultural Sciences, University ofFlorida, Gainesville, Florida, USA from19 October, 2011 to 30 November,2011 for a training on” Soil and LandQuality Indicators under “NationalAgricultural Innovation Project (NAIP),Component-4, Sub project “DevelopmentGeoreferenced Soil Information System forMonitoring Soil and Land Quality forAgriculture.
• Dr. S.K. Reza, Scientist of the RegionalCentre, Jorhat participated in a 5 dayscapacity building workshop on “Usingclimate scenarios and analogues fordesigning adaption strategies inAgricultures “held during 19-23 September2011 at Kathmandu, Nepal.
New Entrants
• Sh. R. Srinivasan, Scientist (Soil Science-Pedology) joined in Dec. 2011
• Dr. (Ms.) Lalitha M., Scientist (Soil Physics)joined in Dec. 2011
• Dr. Shelton Padua, Scientist (Soil Physics)joined in Dec. 2011
• Sh. Shiv Pal Singh, joined Regional Centre,Udaipur in August 2011 as Field Assistant(T-1)
• Dr. S.S Rao, Sr. Scientist(Agronomy) joinedRegional Centre, Udaipur in December2011 from the CAZRI, Jodhpur
Staff Retirement/Superannuation/Deputation
• Sh. G.R. Deshmukh, Technical Officer(T-9), HQrs, Nagpur retired onsuperannuation on 31.07.2011
• Sh. Rameshwar Singh,T-3, RegionalCentre, Delhi retired on superannuation on31.07.2011
• Sh. K.S.Sathyanarayan,T-5,Regionalcentre, Bangalore retired onsuperannuation on 30.11.2011
• Mr.P.D. Dutta T-5 Regional Centre, Jorhatretired on superannuation on 30.11.2011
• Sh. C.Pande, UDC HQrs, Nagpur retiredon superannuation on superannuation on30.11.2011
• Sh. Ashwasthappa, Supporting Staff,Regional Centre, Bangalore retired on31.08.2011
• Sh. G.Devraj, Supporting Staff, RegionalCentre, Bangalore retired on 31.08.2011
• Sh. B.K Borkar, Supporting staff, HQrs,Nagpur retired on superannuation on30.11.2011
• Smt. Shikha Majumdar, Assitant has beenrelieved to join at Zonal ProjectDirectorate, Zone-II, Kolkata as AssistantAdministrative Officer on deputation

AN
NU
AL R
EP
OR
T 2
011-1
2
158
Lectures Delivered by the Scientists
• Shri Hemo Dutta (T-5) Regional Centre,Jorhat retired from service on 31.01.2012on superannuation
• Shri. Lakshmaiah, SSS of Regional,Banglore superannuated in Februay2012
Obituaries
• Sh. C.N. Gajbhiye, Technical Assistant(T-2), HQrs, Nagpur
• Mr.P. Ramesha, Sr. Technical Assistant,Regional Centre, Bangalore passed awayon 29 May, 2011 after prolonged illness
Staff-related General Information

AN
NU
AL R
EP
OR
T 2
011-1
2
159
Appendix 4
RFD-Related InformationAnnual (April 1 to March 31, 2012) Performance Evaluation Report of RSCs
i.e. Institutions for the year 2011-12
Appendix
7
Name of the Division : Natural Resource Management (NRM)Name of the Institutions : National Bureau of Soil Survey and Land Use Planning, NagpurRFD Nodal Officer : Dr. T.K. Sen.
Objective Wei- Action Success Unit Wei- Target/Criteria Values Achie- Performance
ght Indicator ght Excellent Very Good Fair Poor vements Raw Wei-
Good Score ghted
100% 90% 80% 70% 60% Score
Soil re- 25 Soil District level No. 15 2 1 0 0 0 2 100 15
source inven- survey soil resource
torisation at and maps
different scales mapping developed
Block level soil No. 7 3 2 1 0 0 3 100 7
resource maps
developed
Soil resource No. 3 2 1 0 0 0 2 100 3
maps of farms
developed
Optimization 20 Land use District level No. 20 2 1 0 0 0 2 100 20
of land use planning land use plans
developed
Human 14 Capacity Training/ No. 8 5 4 3 2 1 5 100 8.0
resource building workshop
development conducted
Students No. 6 4 3 2 1 0 4 100 6.0
awarded degree
Identification 12 Soil Benchmark No. 12 10 8 6 4 2 8 90 10.8
of Benchmark correla- soil series
soil series tion identified
Preparation 10 Soil District level No. 7 7 6 5 4 3 7 100 7.0
of soil nutrient soil nutrient
nutrient maps mapping maps developed
Block level soil No. 3 3 2 1 0 0 3 100 3.0
nutrient maps
developed
Enrichment 8 Enrichment Enriched land No. 8 35 32 30 28 25 35 100 8.0
of land of land degradation
degradation degradation datasets and
datasets of datasets maps of
India with soil different states
datasets and Union
through GIS Territories
Cont...
Appendix 7
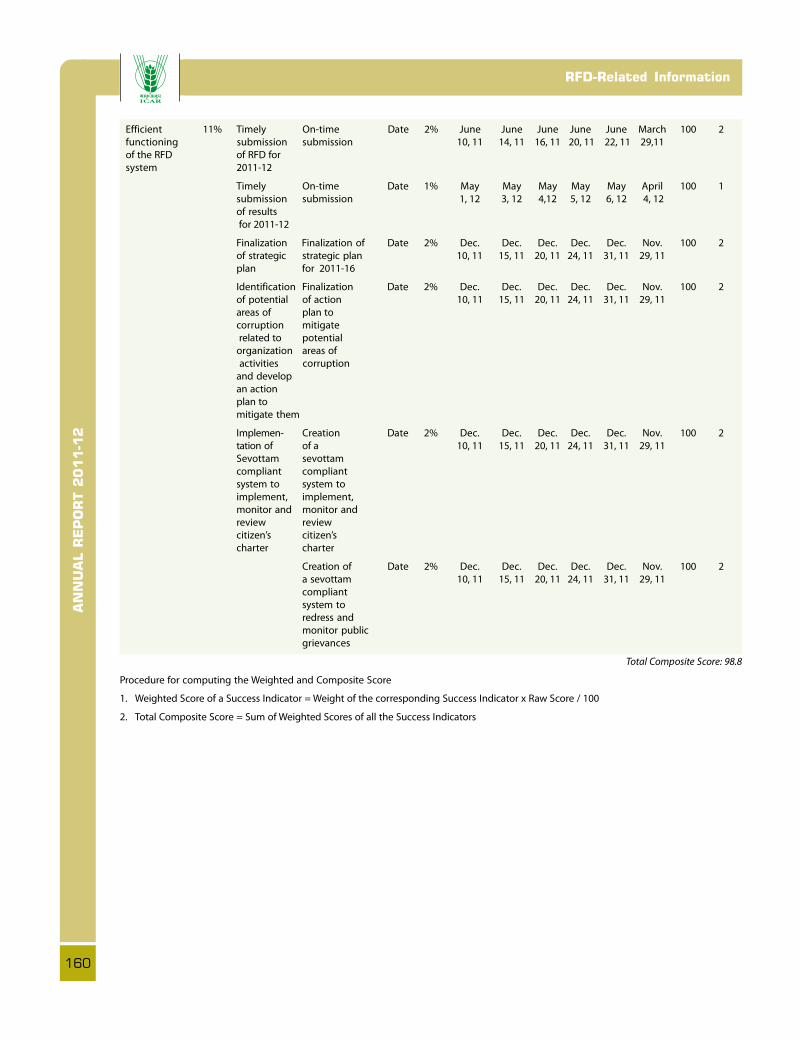
AN
NU
AL R
EP
OR
T 2
011-1
2
160
Lectures Delivered by the Scientists
Efficient 11% Timely On-time Date 2% June June June June June March 100 2
functioning submission submission 10, 11 14, 11 16, 11 20, 11 22, 11 29,11
of the RFD of RFD for
system 2011-12
Timely On-time Date 1% May May May May May April 100 1
submission submission 1, 12 3, 12 4,12 5, 12 6, 12 4, 12
of results
for 2011-12
Finalization Finalization of Date 2% Dec. Dec. Dec. Dec. Dec. Nov. 100 2
of strategic strategic plan 10, 11 15, 11 20, 11 24, 11 31, 11 29, 11
plan for 2011-16
Identification Finalization Date 2% Dec. Dec. Dec. Dec. Dec. Nov. 100 2
of potential of action 10, 11 15, 11 20, 11 24, 11 31, 11 29, 11
areas of plan to
corruption mitigate
related to potential
organization areas of
activities corruption
and develop
an action
plan to
mitigate them
Implemen- Creation Date 2% Dec. Dec. Dec. Dec. Dec. Nov. 100 2
tation of of a 10, 11 15, 11 20, 11 24, 11 31, 11 29, 11
Sevottam sevottam
compliant compliant
system to system to
implement, implement,
monitor and monitor and
review review
citizen’s citizen’s
charter charter
Creation of Date 2% Dec. Dec. Dec. Dec. Dec. Nov. 100 2
a sevottam 10, 11 15, 11 20, 11 24, 11 31, 11 29, 11
compliant
system to
redress and
monitor public
grievances
Total Composite Score: 98.8
Procedure for computing the Weighted and Composite Score
1. Weighted Score of a Success Indicator = Weight of the corresponding Success Indicator x Raw Score / 100
2. Total Composite Score = Sum of Weighted Scores of all the Success Indicators
RFD-Related Information

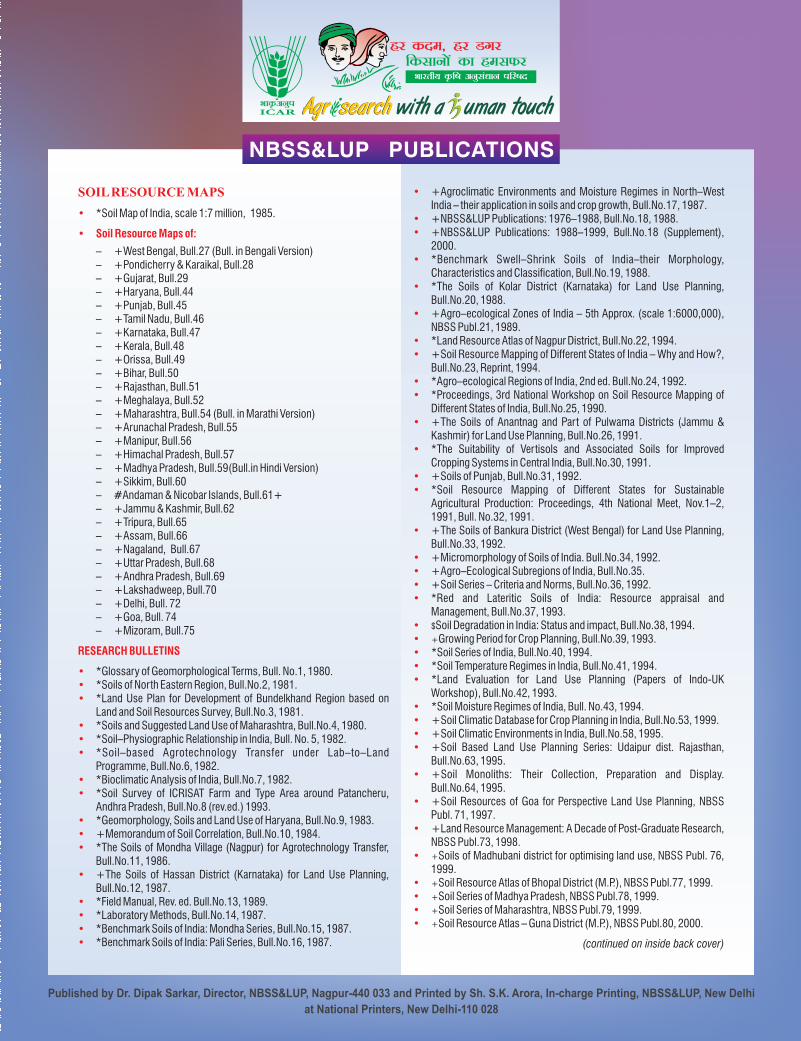
Published by Dr. Dipak Sarkar, Director, NBSS&LUP, Nagpur-440 033 and Printed by Sh. S.K. Arora, In-charge Printing, NBSS&LUP, New Delhi
at National Printers, New Delhi-110 028
NBSS&LUP PUBLICATIONS
SOIL RESOURCE MAPS
•
• Soil Resource Maps of:
RESEARCH BULLETINS
•••
•••
••
•••
•
••••
*Soil Map of India, scale 1:7 million, 1985.
– +West Bengal, Bull.27 (Bull. in Bengali Version)– +Pondicherry & Karaikal, Bull.28– +Gujarat, Bull.29– +Haryana, Bull.44– +Punjab, Bull.45– +Tamil Nadu, Bull.46– +Karnataka, Bull.47– +Kerala, Bull.48– +Orissa, Bull.49– +Bihar, Bull.50– +Rajasthan, Bull.51– +Meghalaya, Bull.52– +Maharashtra, Bull.54 (Bull. in Marathi Version)– +Arunachal Pradesh, Bull.55– +Manipur, Bull.56– +Himachal Pradesh, Bull.57– +Madhya Pradesh, Bull.59(Bull.in Hindi Version)– +Sikkim, Bull.60– #Andaman & Nicobar Islands, Bull.61+– +Jammu & Kashmir, Bull.62– +Tripura, Bull.65– +Assam, Bull.66– +Nagaland, Bull.67– +Uttar Pradesh, Bull.68– +Andhra Pradesh, Bull.69– +Lakshadweep, Bull.70– +Delhi, Bull. 72– +Goa, Bull. 74– +Mizoram, Bull.75
*Glossary of Geomorphological Terms, Bull. No.1, 1980.*Soils of North Eastern Region, Bull.No.2, 1981.*Land Use Plan for Development of Bundelkhand Region based on Land and Soil Resources Survey, Bull.No.3, 1981.*Soils and Suggested Land Use of Maharashtra, Bull.No.4, 1980.*Soil–Physiographic Relationship in India, Bull. No. 5, 1982.*Soil–based Agrotechnology Transfer under Lab–to–Land Programme, Bull.No.6, 1982.*Bioclimatic Analysis of India, Bull.No.7, 1982.*Soil Survey of ICRISAT Farm and Type Area around Patancheru, Andhra Pradesh, Bull.No.8 (rev.ed.) 1993.*Geomorphology, Soils and Land Use of Haryana, Bull.No.9, 1983. +Memorandum of Soil Correlation, Bull.No.10, 1984.*The Soils of Mondha Village (Nagpur) for Agrotechnology Transfer, Bull.No.11, 1986.+The Soils of Hassan District (Karnataka) for Land Use Planning, Bull.No.12, 1987.*Field Manual, Rev. ed. Bull.No.13, 1989.*Laboratory Methods, Bull.No.14, 1987.*Benchmark Soils of India: Mondha Series, Bull.No.15, 1987.*Benchmark Soils of India: Pali Series, Bull.No.16, 1987.
•
••
•
•
•
••
••
•
•
••
•
••••
•••••
••••
•
•
•
•
••••
+Agroclimatic Environments and Moisture Regimes in North–West India – their application in soils and crop growth, Bull.No.17, 1987.+NBSS&LUP Publications: 1976–1988, Bull.No.18, 1988.+NBSS&LUP Publications: 1988–1999, Bull.No.18 (Supplement), 2000.*Benchmark Swell–Shrink Soils of India–their Morphology, Characteristics and Classification, Bull.No.19, 1988.*The Soils of Kolar District (Karnataka) for Land Use Planning, Bull.No.20, 1988.+Agro–ecological Zones of India – 5th Approx. (scale 1:6000,000), NBSS Publ.21, 1989.*Land Resource Atlas of Nagpur District, Bull.No.22, 1994.+Soil Resource Mapping of Different States of India – Why and How?, Bull.No.23, Reprint, 1994.*Agro–ecological Regions of India, 2nd ed. Bull.No.24, 1992. *Proceedings, 3rd National Workshop on Soil Resource Mapping of Different States of India, Bull.No.25, 1990.+The Soils of Anantnag and Part of Pulwama Districts (Jammu & Kashmir) for Land Use Planning, Bull.No.26, 1991.*The Suitability of Vertisols and Associated Soils for Improved Cropping Systems in Central India, Bull.No.30, 1991. +Soils of Punjab, Bull.No.31, 1992.*Soil Resource Mapping of Different States for Sustainable Agricultural Production: Proceedings, 4th National Meet, Nov.1–2, 1991, Bull. No.32, 1991.+The Soils of Bankura District (West Bengal) for Land Use Planning, Bull.No.33, 1992. +Micromorphology of Soils of India. Bull.No.34, 1992.+Agro–Ecological Subregions of India, Bull.No.35.+Soil Series – Criteria and Norms, Bull.No.36, 1992. *Red and Lateritic Soils of India: Resource appraisal and Management, Bull.No.37, 1993.$Soil Degradation in India: Status and impact, Bull.No.38, 1994.+Growing Period for Crop Planning, Bull.No.39, 1993.*Soil Series of India, Bull.No.40, 1994.*Soil Temperature Regimes in India, Bull.No.41, 1994.*Land Evaluation for Land Use Planning (Papers of Indo-UK Workshop), Bull.No.42, 1993.*Soil Moisture Regimes of India, Bull. No.43, 1994.+Soil Climatic Database for Crop Planning in India, Bull.No.53, 1999.+Soil Climatic Environments in India, Bull.No.58, 1995.+Soil Based Land Use Planning Series: Udaipur dist. Rajasthan, Bull.No.63, 1995.+Soil Monoliths: Their Collection, Preparation and Display. Bull.No.64, 1995.+Soil Resources of Goa for Perspective Land Use Planning, NBSS Publ. 71, 1997.+Land Resource Management: A Decade of Post-Graduate Research, NBSS Publ.73, 1998.+Soils of Madhubani district for optimising land use, NBSS Publ. 76, 1999.+Soil Resource Atlas of Bhopal District (M.P.), NBSS Publ.77, 1999. +Soil Series of Madhya Pradesh, NBSS Publ.78, 1999.+Soil Series of Maharashtra, NBSS Publ.79, 1999.+Soil Resource Atlas – Guna District (M.P.), NBSS Publ.80, 2000.
(continued on inside back cover)