2016 Web CAFR - City of San Pablo
163
C OMPREHENSIVE ANNUAL FI NANC I AL R EPORT City of San Pablo, CA Fiscal Year Ended June 30th 2016
-
Upload
khangminh22 -
Category
Documents
-
view
0 -
download
0
Transcript of 2016 Web CAFR - City of San Pablo

C O M P R E H E N S I V E A N N U A L F I N A N C I A L R E P O R T C i t y o f S a n P a b l o , C A F iscal Year Ended June 30th 2016

CITY OF SAN PABLO, CALIFORNIA
COMPREHENSIVE ANNUAL FINANCIAL REPORT FOR THE YEAR ENDED JUNE 30, 2016
PREPARED BY THE FINANCE DEPARTMENT
COVER PHOTOS CITY OF SAN PABLO:
SAN PABLO ARCHWAY


CITY OF SAN PABLO, CALIFORNIA Comprehensive Annual Financial Report For the Year Ended June 30, 2016 Table of Contents Page
INTRODUCTORY SECTION: Table of Contents ................................................................................................................................................... i Letter of Transmittal ................................................................................................................................................ v Elected Officials and Administrative Personnel .............................................................................................. xxvii Organization Chart .......................................................................................................................................... xxviii GFOA Award .................................................................................................................................................. xxix San Pablo Zoning District Map ........................................................................................................................... xxx FINANCIAL SECTION: Independent Auditor’s Report ............................................................................................................................. 1 Management’s Discussion and Analysis ............................................................................................................. 5 Basic Financial Statements: Government-wide Financial Statements: Statement of Net Position ..................................................................................................................... 20 Statement of Activities .......................................................................................................................... 21 Fund Financial Statements: Governmental Funds: Balance Sheet .................................................................................................................................... 24 Statement of Revenues, Expenditures, and Changes in Fund Balances ........................................... 25
Reconciliation of the Net Change in Fund Balances – Total Governmental Funds with the Statement of Activities ......................................................................................... 26
Statement of Revenues, Expenditures, and Changes in Fund Balance - Budget and Actual: General Fund ................................................................................................................................. 27
i
CITY OF SAN PABLO, CALIFORNIA Comprehensive Annual Financial Report For the Year Ended June 30, 2016 Table of Contents Page
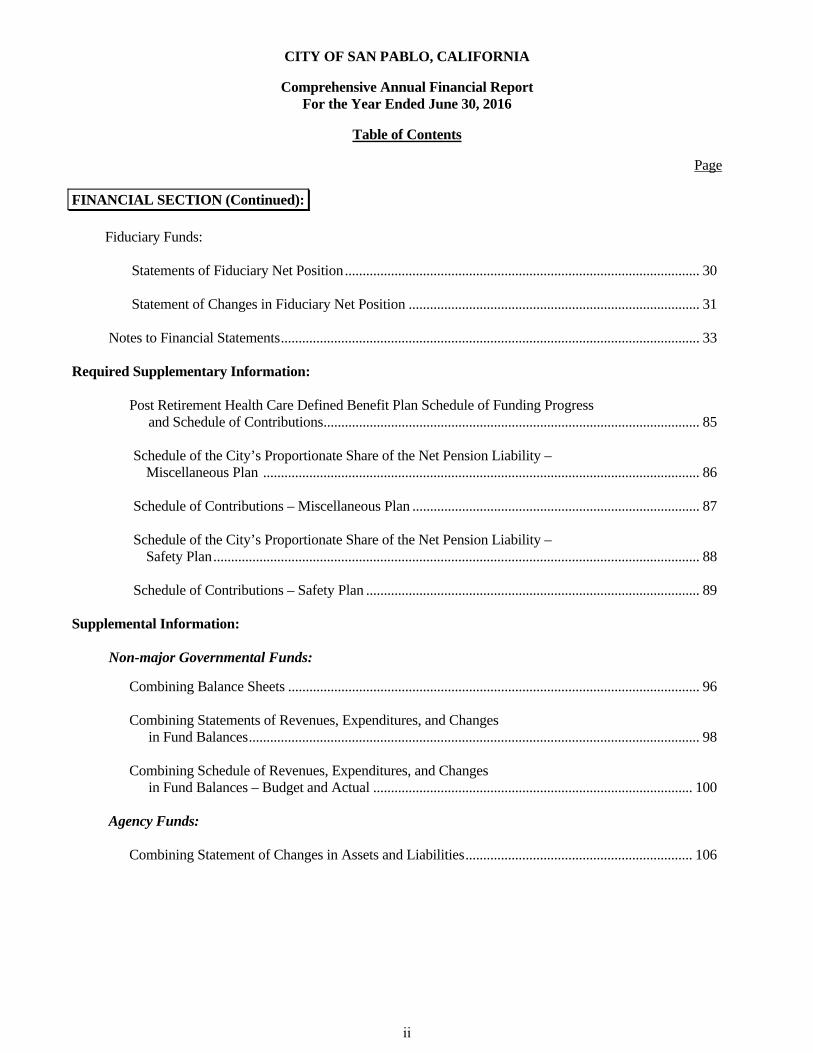
FINANCIAL SECTION (Continued):
Fiduciary Funds: Statements of Fiduciary Net Position .................................................................................................... 30 Statement of Changes in Fiduciary Net Position .................................................................................. 31 Notes to Financial Statements ...................................................................................................................... 33 Required Supplementary Information: Post Retirement Health Care Defined Benefit Plan Schedule of Funding Progress and Schedule of Contributions .......................................................................................................... 85 Schedule of the City’s Proportionate Share of the Net Pension Liability – Miscellaneous Plan ........................................................................................................................... 86 Schedule of Contributions – Miscellaneous Plan ................................................................................. 87 Schedule of the City’s Proportionate Share of the Net Pension Liability – Safety Plan ......................................................................................................................................... 88 Schedule of Contributions – Safety Plan .............................................................................................. 89 Supplemental Information: Non-major Governmental Funds:
Combining Balance Sheets .................................................................................................................... 96 Combining Statements of Revenues, Expenditures, and Changes in Fund Balances ............................................................................................................................... 98 Combining Schedule of Revenues, Expenditures, and Changes in Fund Balances – Budget and Actual .......................................................................................... 100 Agency Funds: Combining Statement of Changes in Assets and Liabilities ................................................................ 106
ii

CITY OF SAN PABLO, CALIFORNIA
Comprehensive Annual Financial Report For the Year Ended June 30, 2016
Table of Contents
Page
STATISTICAL SECTION:
Net Position by Component - Last Ten Fiscal Years ............................................................................ 109
Changes in Net Position - Last Ten Fiscal Years .................................................................................. 110
Fund Balances of Governmental Funds - Last Ten Fiscal Years .......................................................... 113
Changes in Fund Balance of Governmental Funds – Last Ten Fiscal Years ........................................ 114
Assessed and Estimated Actual Value of Taxable Property - Last Ten Fiscal Years ......................................................................................................................... 116
Property Tax Rates - All Overlapping Governments - Last Ten Fiscal Years ...................................... 117
Principal Property Taxpayers – Current Year and Nine Years Ago ..................................................... 118
Property Tax Levies and Collections – Last Ten Fiscal Years ............................................................. 119
Ratio of Outstanding Debt by Type – Last Ten Fiscal Years ................................................................ 120
Computation of Direct and Overlapping Debt ...................................................................................... 121
Computation of Legal Bonded Debt Margin ......................................................................................... 122
Bonded Debt Pledged Revenue Coverage, Redevelopment Agency Tax Allocation Bonds - Last Ten Fiscal Years ........................................ 123
Debt Service Coverage Schedule – Tenth Township and Legacy Project Areas ................................. 124
Demographic and Economic Statistics - Last Ten Fiscal Years ........................................................... 125
Principal Employers – Current Year and Nine Years Ago .................................................................... 126
Full-Time Equivalent City Government Employees by Function – Last Ten Fiscal Years ............................................................................................... 127
Operating Indicators by Function/Program ........................................................................................... 128
Capital Asset Statistics by Function/Program ....................................................................................... 129
iii


City of San Pablo 2015/16 CAFR
Letter of Transmittal
City Hall: 13831 San Pablo Ave., San Pablo, California 94806
Phone: (510) 215-3020 ~ Fax: (510) 231-0223
December 9, 2016 Dear Mayor, Members of the City Council and Citizens of the City of San Pablo: State law requires all general-purpose local governments to publish a complete set of financial statements, presented in conformity with Generally Accepted Accounting Principles (GAAP) within six months of the close of each fiscal year. Therefore, we are pleased to submit the Comprehensive Annual Financial Report (CAFR) for the City of San Pablo, California for the fiscal year ended June 30, 2016. Responsibility for both the accuracy of the data and the completeness and fairness of the information—including all disclosures—rests with the City. To the best of the City staff’s knowledge and belief, the enclosed data is accurate in all material respects and is reported in a manner designed to fairly present the financial position and results of the operations of the various entities of the City of San Pablo. All disclosures necessary to enable the reader to gain an understanding of the City's financial activities have been included. Generally accepted accounting principles require that management provide a narrative introduction, overview and analysis to accompany the basic financial statements in the form of a Management Discussion and Analysis (MD&A). This letter of transmittal is designed to complement the MD&A and should be read in conjunction with it. The MD&A can be found immediately following the report of the independent auditors.
INTERNAL CONTROLS
Accounting for all of the City's activities is centralized under the Finance Department. The department has been delegated the responsibility for maintaining the integrity of the City's recorded financial data. The Finance Department, in conjunction with the City's management team, is also responsible for establishing and maintaining an internal control structure designed to ensure that the City' s assets are protected from loss, theft or misuse. The internal control structure is designed to provide reasonable assurance that these objectives are met, while recognizing that this assurance is not absolute. The concept of reasonable assurance recognizes that: 1) the cost of a control should not exceed the benefits likely to be derived; and 2) the valuation of costs and benefits requires estimates and judgments by management. City administration believes the existing internal control systems are adequate to provide reasonable assurance that the City's assets are safeguarded against loss and that the financial records are reliable for preparing financial statements and maintaining accountability for assets. This belief is supported by the City's "unmodified" auditor's report issued in 2016.
v

City of San Pablo 2015/16 CAFR
Letter of Transmittal
City Hall: 13831 San Pablo Ave., San Pablo, California 94806
Phone: (510) 215-3020 ~ Fax: (510) 231-0223
INDEPENDENT AUDIT
The City Council is responsible for: 1) assuring the City administration fulfills its responsibilities in the preparation of the financial statements; and 2) engaging certified public accountants with whom the City Council reviews the scope of the audits and the accounting principles to be applied in financial reporting. The Government Code of the State of California requires general law cities, which includes the City of San Pablo, to have its financial statements audited by an independent certified public accountant. Accordingly, this year's audit was completed by the accounting firm of Maze & Associates. The firm was engaged by the City Council to render an opinion on the City's financial statements in accordance with auditing standards generally accepted in the United States of America. To ensure complete independence, Maze & Associates Corporation has full and complete access to meet with the City Council and to discuss the results of their assessment of the adequacy of internal accounting controls and the quality of financial reporting. The auditor's report on the basic financial statements is the first item in the accompanying Financial Section. In addition to meeting the requirements set forth in State statutes, the audit was also designed to meet the requirements of the Federal Single Audit Act Amendments of 1996 and related requirements identified in the Office of Management and Budget Circular A-133. The standards governing Single Audit engagements require the independent auditor to report not only on the fair presentation of the financial statements but also on the audited government's internal controls and compliance with legal requirements.
Profile of San Pablo
The City of San Pablo was incorporated in 1948 as a general law city under the laws of the State of California. Located in West Contra Costa County off Interstate 80, San Pablo is just minutes away from the Bay Area cultural centers of Berkeley, Oakland and San Francisco. The City is governed by a five member City Council, under the Council-Manager form of government. As of January 1, 2016, the City had a population estimated at 30,829 encompassed within its 2.6 square miles. The City maintains a 2016/17 Total Operating Funds Budget of $35.0 million with 180.4 full-time equivalent (FTE) employees. Over the years, the City has become a thriving residential and business community. San Pablo is home to Contra Costa Community College and is fortunate to have a wealth of community resources, including a library, computer education center, a childcare facility, a regional healthcare facility and a career center. Many multilingual nonprofits, like First 5 and Lao Family Community Development, round out the diverse support services offered to residents. The City also offers youth programs at the award-winning San Pablo Community Center and senior services at the Senior Center to meet a variety of needs and interests, in addition to being recognized nationally and regionally for innovative and cutting-edge programs. Historically one of the oldest Spanish settlements in the region, San Pablo’s city hall with fountains and plazas reflects that heritage.
vi
City of San Pablo 2015/16 CAFR
Letter of Transmittal
City Hall: 13831 San Pablo Ave., San Pablo, California 94806
Phone: (510) 215-3020 ~ Fax: (510) 231-0223
The City provides a full range of services including: Police, Public Works, Economic Development, Planning, Building, Engineering and Inspection, Parks and Recreation and General Administrative services. Each of these services is funded through the City’s annual budget and can be found in this document.
BUDGET POLICIES / PROCESS
The City’s biennial budget serves as the foundation for planning and controlling the City’s finances. As such, the City maintains extensive budgetary controls. The objective of these budgetary controls is to ensure compliance with legal provisions embodied in the biennial appropriated budget approved by the City Council. Budgetary control is established at the fund level. Budgets are prepared and expenditures recorded at the object of expenditure level. The accounting records are maintained using either the accrual basis or modified accrual basis of accounting, as appropriate. The City also maintains an encumbrance accounting system as one technique for accomplishing budgetary control. The biennial budget process begins every other January with a strategic planning meeting. The individual departments then prioritize and recommend the budgetary funding requirements necessary to perform both their objectives and the City Council’s strategic goals and initiatives. These funding requests are then balanced and prioritized to fit within the constraints of projected revenue assumptions. The City Manager’s Office and the Finance Department review all budget proposals and revenue assumptions, as well as all current financial obligations, before preparing the document that is proposed to the City Council. In May, an in-depth review first takes place at a meeting of the Budget, Fiscal and Legislative Standing Committee. In June, the City Council holds a public hearing and workshop to review the proposed budget before final budget adoption occurs later that month by a resolution of the City Council pursuant to the City’s Municipal Code requirements.
Activities of the General Fund, Special Revenue Funds, Debt Service Funds and Capital Project Funds are included in the biennial appropriated budget. Budget-to-actual comparisons are included in the Summary Schedules Section for the General Fund, certain Special Revenue Funds and certain Debt Service Funds.
vii

City of San Pablo 2015/16 CAFR
Letter of Transmittal
City Hall: 13831 San Pablo Ave., San Pablo, California 94806
Phone: (510) 215-3020 ~ Fax: (510) 231-0223
The following funds are not legally required to adopt biennial operating budgets as their appropriations are either: (1) established by the related bond documentation, (2) other legal agreements, or (3) are multi-year projects covered through the Capital Improvement Program Budget whose budget cycle exceeds one fiscal year. The Fund which meets this requirement is the Public Works Construction Capital Projects Fund.
ECONOMIC OUTLOOK
The City can be characterized as a mature community that is mostly built out. During the last ten years, the City population has remained relatively constant with little residential development activity. Residential property values which dropped precipitously after their peak in FY 2007/08 have increased in value by 40 percent over the last three years. Indeed, at $320,000, median home prices are up 14.3% over the first nine months of 2016 compared to all 12 months of 2015; this is the second largest percentage increase in the County, second only to the City of Oakley. In general, the recession had far greater impacts in communities such as San Pablo’s, which experienced high property appreciation during the previous decade. Significantly, foreclosure rates across the county and in San Pablo are now approaching their pre-recession norm. Assessed values are also up. The City experienced 7.7 percent growth from FY 2015/16 to FY 2016/17, the fourth largest increase in Contra Costa County. Moreover, the City is well poised for more growth for the next two or three years: the County Assessor restored $28.8 million in previously reduced property values which was just 21 percent of the value awaiting restoration at the beginning of FY 2015/16. An additional 882 homes are awaiting review and upward adjustment since the assessed value of these homes was reduced sometime between 2008 and 2012 and remains below the trended Proposition 13 value.
As the local economy continues to improve, unemployment rates continue to drop. The unemployment rate for Contra Costa County was at 4.5 percent in October 2016 and 6.9 percent for City of San Pablo, giving residents more incentive to go shopping. Indeed, San Pablo’s share of the Contra Costa County sales tax pool increased by 21.1 percent over the previous year, while San Pablo sales were up 5.7 percent over second quarter sales tax from the previous year after factoring out reported aberrations.
Despite the recovering economy, interest rates continue to be at all-time low or near record-low levels, thus keeping investment income at very low levels. The low interest rates and subsequent low returns are not expected to change in the short-term. This low interest rate environment will have a greater negative impact on San Pablo than other jurisdictions, because of the large cash reserves maintained to meet reserve policy requirements. Only a few short years ago, the City was able to earn nearly 5% on its cash reserves. Over the next year, rates of return are expected to remain in the 0.7 – 1.2% range.
viii

City of San Pablo 2015/16 CAFR
Letter of Transmittal
City Hall: 13831 San Pablo Ave., San Pablo, California 94806
Phone: (510) 215-3020 ~ Fax: (510) 231-0223
FINANCIAL MANAGEMENT & SUSTAINABILITY
Exercising Fiscal Restraint: During and immediately after the Great Recession, the City made a concerted effort to lower expenditures in the near- and long-term, including reduced employee benefits and labor givebacks. During the last two budget cycles, this strategy paid off as the City was able to propose a balanced budget without the need to dip into reserve accounts. This is especially significant, since the City has been able to fund capital projects at $2 million annually, despite the loss of approximately $3 million in annual revenue with the dissolution of the redevelopment agency. To ensure San Pablo’s continued positive prognosis, the City will need to continue on this path of prudent fiscal practices to ensure the ability to meet future obligations, including increased pension costs, capital outlays and, emergency medical services, etc. Improved Financial Management: The City has developed a solid financial management system comprised of several key components, including conservative budgeting and spending practices; fiscal policies and procedures to guide future action with adequate cash reserve requirements to weather coming financial storms, future liabilities and unexpected emergencies; and regular short-term and long-term budgetary performance reviews and monitoring. These actions have resulted in the following:
A credit rating of “AA-“ by Standard & Poor’s Rating Services (S&P) on January 9, 2015. S&P cited the City’s strong financial performance supported by strong fiscal management practices as key credit positives.
Net increases to fund balance for the past several years, leading to healthy cash reserves. In 2016, the net increase to the General Fund balance was $14,295,244.
Adoption of the “Fiscal Resiliency Reserve Policy” in October 2013 which created additional framework, usage, and payback requirements when dipping into cash reserves. Perhaps most importantly, the policy created designated cash reserves to fund known large expenditures, which have not yet materialized, such as vehicle replacements, OPEB liabilities, capital projects, etc. These designated reserves are updated annually. Additionally, the City added the Casino Revenue Stability Reserve in June 2016, allowing the City to set aside up to 50% of unused audited fund balance as a rainy day fund to guard against the sudden loss of casino revenue.
Introduction of the Chameleon budgeting system in July 2013 with monthly financial reports prepared for managers citywide, in addition to updating the City‘s Five-Year Financial Plan.
Addition of a comprehensive set of written Financial Policies and Procedures to standardize Finance Department procedures, strengthen internal controls and ensure compliance with City regulations.
ix

City of San Pablo 2015/16 CAFR
Letter of Transmittal
City Hall: 13831 San Pablo Ave., San Pablo, California 94806
Phone: (510) 215-3020 ~ Fax: (510) 231-0223
Compensation & Labor Negotiation Strategy: This initiative attempts to implement a fiscally responsible cost reduction and containment strategy which will allow the City to remain competitive in recruiting and retaining valuable employees while allowing for long-term fiscal sustainability for the City. With this framework, management staff met with employee labor groups throughout the spring of 2014 to
develop labor agreements which were set to expire on June 30, 2014 for both public safety and non-public safety employees. With the help of City Council members and city employees and their respective bargaining units, the City was able to eliminate retiree medical benefits for elected officials, as well as reduce the City’s long-term retiree medical costs for employees. Ultimately, labor agreements were struck which called for modest and sustainable salary increases of 2.0% per year for the next three years. Coupled with previous concessions in which employees contribute 10.3% or 12.3% of their salary depending on job title to fund a significant portion of their retirement cost, the City is now in a good place to maintain fiscal stability, while remaining an attractive and desirable place to work. All City labor agreements expire again in June 2016, and management staff again intends to maintain the same fiscal constraint in the upcoming negotiations.
Other Post-Employment Benefits (OPEB): Governmental Accounting Standards Board (GASB) Statement No. 45 was established in 2004 and requires the City to report the costs of OPEB as the employee earns the benefit, rather than as the benefit is paid. While there is no requirement that the City pre-fund, or set aside the full Annual Required Contribution (A.R.C.) on an annual basis, the City Council established a funding strategy which includes pay-as-you-go financing plus an additional amount to pre-fund benefits. Pre-funding OPEB obligations is projected to provide the City with savings over the long-term, as pre-funding contributions will be invested on a long-term basis until they are needed to pay for OPEB obligations. Pre-funding will ultimately allow for investment income, rather than City contributions, to provide the majority of funds needed to cover OPEB obligations in the future. This funding strategy has resulted in the City having plan assets of $ $7,244,815 as of June 30, 2016. Revenue Enhancement Strategies:
Measure Q: In December 2012, the City received its first tax receipts from Measure Q, a voter-approved ½ cent sales tax measure passed in June 2012. Measure Q generated $1,512,936 in FY 2015/16, outperforming budget of $1,370,821 by over 10 percent. As a general—not special—tax, these revenues flow into the general fund and are not limited to specific uses. They are, however, designed to augment City economic development efforts, programming for youth services, and enhancing police activities. Measure Q drops to ¼ cent in November 2017 and expires in November 2022. In June 2012, San Pablo residents turned out in record numbers to support Measure Q. At 73.6%, Measure received the second highest voter support in all the State.
x

City of San Pablo 2015/16 CAFR
Letter of Transmittal
City Hall: 13831 San Pablo Ave., San Pablo, California 94806
Phone: (510) 215-3020 ~ Fax: (510) 231-0223
Measure K: In December 2014, the City began receiving its first tax receipts from Measure K, another voter-approved sales tax measure. Measure K, however, is a special tax collected in perpetuity that can only be used to fund emergency medical services in the City of San Pablo. At a rate of one-quarter cent of all taxable sales, the tax generated $754,366 during FY 2015/16,
outperforming its budgeted figure of $650,000 by over 16 percent. San Pablo voters passed
Measure K in June 2014 with a 71% approval rating, increasing the sales tax rate from 9.0% to
9.25%.
Fees for Planning, Building, and Public Works: The City contracts with an outside consultant to review and analyze the City’s Planning, Building, and Public Works fee structure to determine: (1) an appropriate fee which will allow the City to recover the costs of providing specific services to the public; (2) a fee structure that is reasonable when compared to other local agencies; and (3) whether or not the City has established a fee for all services provided. The first major update to the fee structure took effect in July 2012 and regular updates have happened ever since. Charges for service hit a high in FY 2013/14 at $1.73 million, falling to $1.38 million in FY 2014/15 and decreasing again in FY 2015/16 to $1.11 million. The most recent update to the Master Fee Schedule took place in May 2016, so that impacts of fee increases will be evident in FY 2016/17.
COMMUNITY ENGAGEMENT
A pillar for any community is the ability to engage its residents in worthwhile community activities. In 2014, the National Civic League announced San Pablo as a winner of the 2014 All-America City Award, the country’s most prestigious award for outstanding, community-based civic accomplishments. Created
in 1949, the All-America City Award is the oldest community recognition program in the nation.
The 2014 awards focused on successful efforts to address the underlying conditions that affect the health of America’s communities. City of San Pablo submitted an application listing three examples of successful community exchange, civic engagement, collaboration, and innovation: the Health Element & the Childhood Obesity Prevention Task Force; the San Pablo Economic Development Corporation (SPEDC); and the San Pablo Police Department's Community Partnership Programs.
The City of San Pablo also understands the importance of keeping the community informed of important information. The City created new virtual and in-person
sources for information pertaining to the City through the programs below:
Government Outreach: The City’s website provides access to City services and City officials, 24-hours a day, 7-days a week, from the comfort and convenience of home. Through this system, residents can report graffiti, street lights that may be out of service, illegal dumping, and can also post questions and/or concerns that will then be routed to the appropriate staff person for response.
xi
City of San Pablo 2015/16 CAFR
Letter of Transmittal
City Hall: 13831 San Pablo Ave., San Pablo, California 94806
Phone: (510) 215-3020 ~ Fax: (510) 231-0223
Neighborhood Engagement Team (N.E.T.): The Neighborhood Engagement Team is comprised of City Staff from various departments. The intent of this team is to provide a “Mobile City Hall” that is accessible to all residents. The N.E.T. booth is set up at various City events to distribute information about City Hall services. Most recently the N.E.T. was present at an Easter egg hunt, summer Farmer’s Markets, a Halloween/Open House event, and a 4th of July celebration. E-newsletter Subscription: Residents and interested parties can now sign up to receive a weekly electronic newsletter informing them of current events and news in San Pablo. Subscribing through the City’s website is easy and the user can select the e-mail topics that they are interested in receiving. Community Outreach - New Methods: Since November 2012, the City Council has maintained a contract with a social media professional services provider to administer all City social media accounts to actively promote City activities, programs and services. Community engagement vis-à-vis social media such as the City’s Facebook page and Twitter account continues to rise exponentially. Community members can also subscribe online to receive various electronic communications, including bid postings, job announcements and news flashes.
ECONOMIC DEVELOPMENT
The City of San Pablo works cooperatively with the San Pablo Economic Development Corporation (SPEDC), a 501(c) (3), to develop job training and readiness programs and to eliminate barriers to employment for San Pablo residents. The program also provides business attraction and site development services geared toward creating local jobs and reducing the unemployment rate. Although these are complex problems, the City has made tremendous progress through partnerships and refocusing available resources. SPEDC partners with Contra Costa College to provide grants to San Pablo residents to provide vocational training for specific technical jobs such as automotive mechanic, EMT and medical assistant. SPEDC also partners with Moler Barber College to assist students to earn a barbering license, with RichmondBUILD to assist in construction training and job placement, and with “FLOW” to provide a nine-week technical course in forklift, logistics, operations, and warehouse training. The SPEDC partnership with the Stride Center helps prepare residents to work in the Bay Area’s information and communication technology sector. “Removing Barriers,” one of SPEDC’s most recognizable programs, has garnered international attention. This program is a partnership with New Skin to remove unwanted tattoos, which may also be a barrier to productive employment. As a result of these activities and an improving economy, the unemployment rate in San Pablo has fallen to 6.9% in October 2016. While still somewhat higher than the rest of Contra Costa County at 4.5%, this is a far cry from the unemployment rate of over 20% that the City reached at the height of the Great Recession.
xii

City of San Pablo 2015/16 CAFR
Letter of Transmittal
City Hall: 13831 San Pablo Ave., San Pablo, California 94806
Phone: (510) 215-3020 ~ Fax: (510) 231-0223
LOCAL SUCCESSOR AGENCY
Redevelopment Agency: For decades, San Pablo relied on its redevelopment agency as a tool to revitalize blighted areas and provide funding for much needed infrastructure projects throughout the City. This practice ended on January 31, 2012 after State legislation dissolved all local redevelopment agencies (RDA’s) in California and required that all RDA assets be transferred to the State. Since then, the City has had to acquire alternative funding sources for redevelopment projects, including general fund revenues, and federal, state and local grants.
As a result, the City took on the role of “Successor Agency” to finalize transfer of RDA assets and to manage and administer ongoing financial obligations that were put into place before dissolution. In September 2013, the City obtained a Finding of Completion approving transfer of assets and authorizing execution of the “recognized obligation payment schedule” (ROPS). Going forward, this status allows the Successor Agency to spend the remainder of the bond proceeds as well as provide flexibility for the disposition / use of the real property transferred from the Redevelopment Agency to the Successor Agency. In 2014, the Successor Agency completed a refinancing of outstanding Redevelopment Agency bond debt. By combining multiple issues of bond debt into Series 2014A and Series 2014B Tax Allocation Bonds (TAB’s), the Successor Agency was able to issue bonds totaling $54,565,000, which saved taxpayers over $5,000,000 in debt service payments over the life of the bonds. While the vast majority of the savings was realized by other taxing entities (about 10 percent of savings was realized by the City), this transaction helped the City consolidate loan payments and simplify loan administration. On November 1, 2016, City staff further issued $2.685 million in Successor Agency Tax Allocation Refunding Bonds, again to reduce bond interest rates on all outstanding Successor Agency debt issuances except for the 2004 series bonds which mature on June 1, 2019. The City will save approximately $10,000 annually in debt service expense.
xiii
City of San Pablo 2015/16 CAFR
Letter of Transmittal
City Hall: 13831 San Pablo Ave., San Pablo, California 94806
Phone: (510) 215-3020 ~ Fax: (510) 231-0223
MAJOR CAPITAL PROJECTS IN PROGRESS
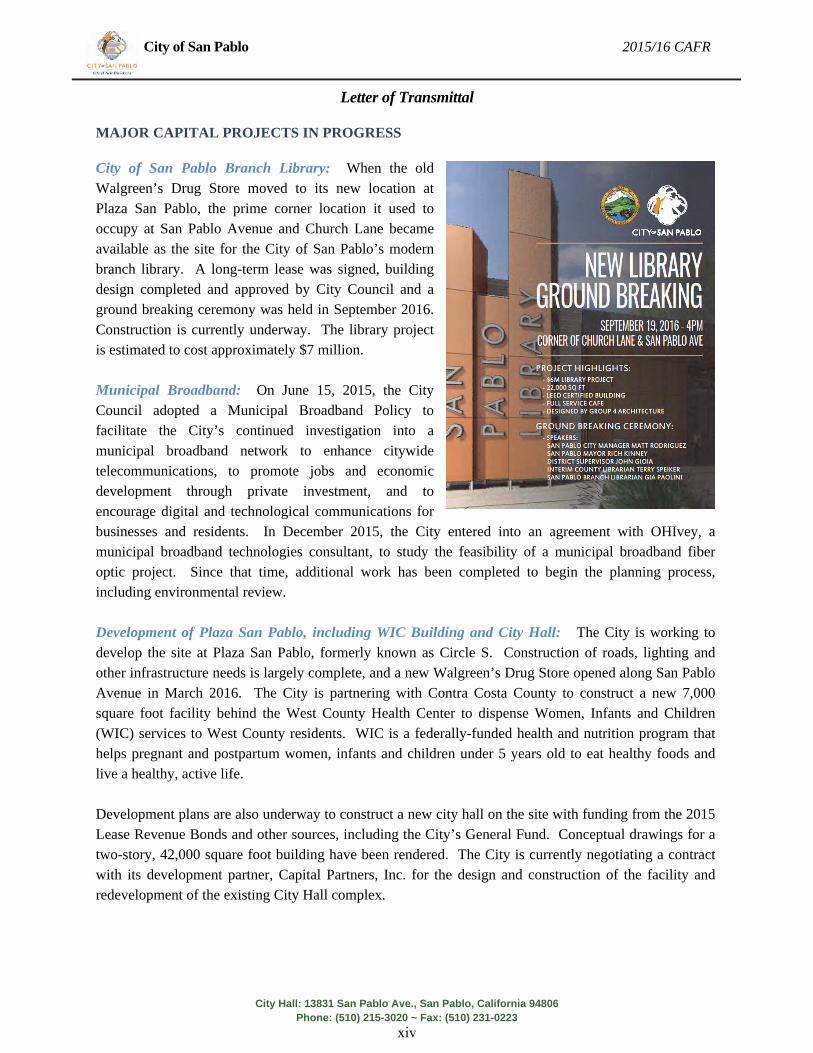
City of San Pablo Branch Library: When the old Walgreen’s Drug Store moved to its new location at Plaza San Pablo, the prime corner location it used to occupy at San Pablo Avenue and Church Lane became available as the site for the City of San Pablo’s modern branch library. A long-term lease was signed, building design completed and approved by City Council and a ground breaking ceremony was held in September 2016. Construction is currently underway. The library project is estimated to cost approximately $7 million. Municipal Broadband: On June 15, 2015, the City Council adopted a Municipal Broadband Policy to facilitate the City’s continued investigation into a municipal broadband network to enhance citywide telecommunications, to promote jobs and economic development through private investment, and to encourage digital and technological communications for businesses and residents. In December 2015, the City entered into an agreement with OHIvey, a municipal broadband technologies consultant, to study the feasibility of a municipal broadband fiber optic project. Since that time, additional work has been completed to begin the planning process, including environmental review. Development of Plaza San Pablo, including WIC Building and City Hall: The City is working to develop the site at Plaza San Pablo, formerly known as Circle S. Construction of roads, lighting and other infrastructure needs is largely complete, and a new Walgreen’s Drug Store opened along San Pablo Avenue in March 2016. The City is partnering with Contra Costa County to construct a new 7,000 square foot facility behind the West County Health Center to dispense Women, Infants and Children (WIC) services to West County residents. WIC is a federally-funded health and nutrition program that helps pregnant and postpartum women, infants and children under 5 years old to eat healthy foods and live a healthy, active life. Development plans are also underway to construct a new city hall on the site with funding from the 2015 Lease Revenue Bonds and other sources, including the City’s General Fund. Conceptual drawings for a two-story, 42,000 square foot building have been rendered. The City is currently negotiating a contract with its development partner, Capital Partners, Inc. for the design and construction of the facility and redevelopment of the existing City Hall complex.
xiv

City of San Pablo 2015/16 CAFR
Letter of Transmittal
City Hall: 13831 San Pablo Ave., San Pablo, California 94806
Phone: (510) 215-3020 ~ Fax: (510) 231-0223
Undergrounding of Utilities on El Portal West: With Rule 20A funding from local utility companies, the City took the lead in preparing plans and construction documents to underground utilities along El Portal West. The City will front the money for project construction estimated at approximately $1,000,000, and the utility companies will reimburse the City for their portion of the cost, currently totaling $872,296. Remaining costs will be covered by the City’s general fund. The construction contract was awarded in November 2016 and construction began in December 2016.
MAJOR TRANSPORTATION INFRASTRUCTURE PROJECTS Complete Streets Plan: The San Pablo Avenue Complete Streets Study focuses on improving multimodal access, safety and connections along the San Pablo corridor by identifying needs and prioritizing improvements that will facilitate pedestrian, bicycle and transit trips. Funded by a CalTrans Environmental Justice Transportation Planning Grant, the heart of this process is a public outreach effort to bring together surrounding residents, business owners, partner agencies, and other key stakeholders to ensure that the final plan recommendations are both relevant to, and supported by, the local community. A project design consultant was secured, beginning design work in July 2015 and completing it in October 2016. Construction documents are currently under review by CalTrans with an estimated E76 approval (authorization to proceed for work involving federal funds) in February 2017. Once received, construction can begin. Major Interchange Improvements: The cities of San Pablo and Richmond co-sponsored this project, which involves replacement and widening of the San Pablo Dam Road overcrossing, relocation of the McBryde Avenue access from westbound I-80, relocation of the El Portal access to westbound I-80, realignment of Amador Street, and replacement of the I-80/Riverside Avenue pedestrian overcrossing serving Riverside Elementary School. Design of this $113 million project is now complete with construction being separated into phases. Phase One construction is currently underway using $29 million in funding secured in part from the Contra Costa Measure J transportation sales tax. Phase Two construction is not ready yet as funding is still being secured. The project, managed by the Contra Costa Transportation Authority (CCTA), included a public outreach component with design input from the community. The project went out to bid in January 2015 and is scheduled for completion by May 2017.
xv

City of San Pablo 2015/16 CAFR
Letter of Transmittal
City Hall: 13831 San Pablo Ave., San Pablo, California 94806
Phone: (510) 215-3020 ~ Fax: (510) 231-0223
Wayfinding Signage and Installation: In conjunction with a West Contra Costa Transportation Advisory Commission (WCCTAC) project, the City of San Pablo secured $330,000 in funding to install wayfinding signs using Contra Costa County Measure J transportation sales tax, and secured a grant from the Metropolitan Transportation Commission to develop wayfinding signage to transit centers in West Contra Costa and other major destinations. Once design was complete, a construction contract was approved in December 2014 with construction beginning in February 2015. Construction was completed in May 2016. I-80 ICM: The City has participated in the “Smart Corridor” project through its membership in the West Contra Costa Transportation Advisory Committee (WCCTAC). This project implements advanced traffic management along I-80 from the Carquinez Bridge to the MacArthur Maze, San Pablo Avenue, and the major arterials that connect the two. This project includes adaptive ramp metering; lane-use signals on the freeway; variable advisory speeds; and special traffic signal timing to handle diversion to local streets due to freeway incidents as well as trailblazer signs to direct diverted traffic back onto the freeway downstream of incidents. This is a multi-agency project involving the jurisdictions along the corridor, CalTrans, transit agencies, and regional agencies. Construction of the project was completed in 2014 with the system becoming fully activated in September 2016.
OTHER CAPITAL PROJECTS
Capital Projects Completed: Many significant projects were completed during FY 2015/16:
2015 Pavement Rehabilitation Project
Miscellaneous Park Improvements Recommended by First 5
Yuba Avenue Drainage Diversion
Drain Pipe Replacement under Hillcrest Road
Playground Equipment at Davis Park
Sub-drain Inspection/Cleaning by Princeton Plaza
Monitor/Replace Hydraugers by Princeton Plaza
Roof Repairs at Church Lane Senior Center, Davis Park Senior Center, Davis Park Multi-Use Room
xvi

City of San Pablo 2015/16 CAFR
Letter of Transmittal
City Hall: 13831 San Pablo Ave., San Pablo, California 94806
Phone: (510) 215-3020 ~ Fax: (510) 231-0223
Other significant CIP projects started during FY 2015/16, but not yet completed include: Randy Lane Drainage Relocation; the Hazard Mitigation Plan, the Storm Drain Upgrade Program, and Installation of a Playground Structure at Davis Park as recommended by First 5.
MAJOR CAPITAL PROJECTS RECENTLY COMPLETED
Rumrill Sports Park: The former Burlington Northern & Santa Fe (BNSF) Railroad Corporation yard, a brownfield, was sold to the City of San Pablo and developed into a much-needed multi-use sports park
(Rumrill Sports Park). The 4.5-acre park features three synthetic turf youth playing fields with lighting for night games and a smaller practice field available for youth leagues, pick-up games, and practices. The park also contains a picnic/barbeque area, tot lot, offices, restrooms, 62 parking spaces, security cameras and vendor kiosks. This park concept was developed through a series of community outreach meetings in which San Pablo residents identified the need for more open space structured for youth play.
The City received a total of $6.96 million in funding from several sources: State of California Proposition 84 Statewide Parks Program ($3,000,000); New Markets Tax Credits ($2,817,360); Federal Environmental Protection Agency ($600,000); East Bay Regional Park Measure WW ($425,538); and a Department of Resources, Recycling and Recovery (Cal Recycle) grant ($125,064). The City then loaned $5,329,000 to Healthy Eating Activing Living, LLC (HEAL) to construct and operate the park.
Because the park sits atop an old rail yard, contaminated dirt had to be removed and mitigated. Working with environmental consultants and the California State Department of Toxic Substance Control, City staff developed a plan to clean the site. Once approved, remediation of contaminated dirt began in late August 2014 and construction was completed in August 2015.
Wildcat Creek Trail Project: This project involves the construction of a paved pedestrian / bicycle trail along the north bank of Wildcat Creek between Davis Park and 23rd Street (approximately 900 lineal feet). The trail will be an extension of the existing trail system from Davis Park to the Bay, and a crucial link in the future Wildcat Creek Regional Trail connecting the Bay and Ridge Trails. Included in the project scope is a pocket park at the trail head on 23rd Street, and lighting and creek restoration along the trail. Funding sources include a Transportation Development Act (TDA) grant, Environmental Enhancement and Mitigation Program grant, Bay Trail Project grant, and Redevelopment Agency Bond Proceeds. The trail was dedicated in March 2015.
xvii

City of San Pablo 2015/16 CAFR
Letter of Transmittal
City Hall: 13831 San Pablo Ave., San Pablo, California 94806
Phone: (510) 215-3020 ~ Fax: (510) 231-0223
San Pablo Community Center (PW 535): In 2014, the City of San Pablo and the SPEDC completed construction of the San Pablo Community Center (SPCC), a 10,500 square foot facility that includes a large multi-purpose space with a kitchen, two smaller meeting/class rooms, a teen lounge, a computer room, and a fitness room. Located on a 20,000 square foot site adjacent to the Helms Middle School, the City partnered with the West Contra Costa Unified School District City to develop a ground lease and a joint use
agreement for the exterior fields and the gymnasium when school is not in session. The Community Center, however, is entirely a City-operated facility. The project was funded using a variety of sources, including a New Market Tax Credits grant application and grant funds from the Safe Drinking Water, Water Quality and Supply, Flood Control, River and Coastal Protection Bond Act of 2006 (Proposition 84). The facility is LEED-certified (Leadership in Energy and Environmental Design, an internationally-recognized green building certification system). The Community Center was honored as the Outstanding Facility for 2014 by the California Park & Recreation Society’s District 3 (Alameda and Contra Costa Counties. Municipal Solar Project: The Municipal Solar Project is a 325.62 kW-DC solar installation at City Hall, the Police Department and the Church Lane Senior Center. Developed as a collaboration of the four member cities of the Small Cities Climate Action Partnership (San Pablo, El Cerrito, Albany and Piedmont), the group awarded the contract as a design-build proposal for each City site. The final approved cost of the City of San Pablo project was $1,703,995. The City received a 15-year, 1% interest rate loan of $1,150,000 from the California Energy Commission to cover construction costs with the balance coming from the City’s General Fund. In addition, the City has reserved California Solar Initiative Rebates totaling $250,000 to be disbursed over the first five years. The Project will offset 24% of the City’s total electricity usage and reduce greenhouse gas emissions by 18%, thus helping the City reach its Climate Action Plan goals. Construction of the project was completed in early 2014, and electric vehicle charging stations became operational later that fall.
xviii

City of San Pablo 2015/16 CAFR
Letter of Transmittal
City Hall: 13831 San Pablo Ave., San Pablo, California 94806
Phone: (510) 215-3020 ~ Fax: (510) 231-0223
COMMUNITY SERVICE INITIATIVES
Services for Families and Youth: The Community Services Division is comprised of four divisions; Recreation, Youth Services, Seniors & Paratransit. These services are committed to the healthy development of children, youth, families and seniors. The Division focuses on developing positive opportunities, programs and partnerships that will provide children, youth, and seniors with skills, knowledge, support, and resources leading to healthy and productive lives. Our Community Services Department offers a wide variety of programs, services, and some initiatives that support a community where government, families, schools, law enforcement, volunteerism, and organizations work together to create an environment conducive to support people of all ages. Full Service Community Schools: The San Pablo City Council adopted an initiative with the goal of transforming all schools in the City into Full Service Community Schools (FSCS). In a Full Service Community School (Community School), the school district, city, county, community and faith-based organizations, businesses, families and philanthropists form a strong, deep and transparent partnership. They can jointly address the identified needs of students, families and the community in a comprehensive, integrated and accountable way. The group shares leadership, works toward a common vision and agenda, and shares responsibility for results. A Community School focuses on the needs of the whole child – physical, emotional, social and academic – to create the conditions necessary for all children to learn and to be successful. Unlike traditional schools, a Community School strengthens families and communities so that they are better able to support student success. These connections will align both the academic and service elements of the initiative to promote student success, healthy and prosperous families and a healthy community. Community Schools Collaborative: In 2015, the Community Schools Collaborative replaced the Youth Futures Task Force in order to align efforts with the Full Service Community Schools Initiative. The Community Schools Collaborative brings various agencies and systems together to address the whole child through comprehensive school-based services. Team members meet for professional development and as a learning community to share resources and best practices for working with children, youth, and families in San Pablo. The Collaborative works to sustain violence prevention efforts, while also supporting and enhancing services in the Community Schools Coordination, Out of School Time, and Youth Leadership and Development service areas.
xix

City of San Pablo 2015/16 CAFR
Letter of Transmittal
City Hall: 13831 San Pablo Ave., San Pablo, California 94806 Phone: (510) 215-3020 ~ Fax: (510) 231-0223
San Pablo Team for Youth: San Pablo Team for Youth (TFY) is the funding arm of the Community Schools Initiative. TFY provides funds to public and non-profit agencies to expand and/or enhance school-based programs and services for children, youth, and families in alignment with the San Pablo Community Schools Initiative.
Childhood Obesity Prevention Task Force: The San Pablo City Council hosted its first Childhood Obesity Prevention Task Force meeting in March 2012 to bring awareness to the growing childhood obesity epidemic in the community. Representatives from over 20 agencies and programs attended, including County, City, non-profit, community-based and faith-based agencies, schools, and medical organizations. The convening of the Task Force represented the first step towards strengthening partnerships in the fight against the growing childhood obesity epidemic in the community. Since then, the Task Force has worked collaboratively with stakeholders to develop a Community Action Plan (CAP) that was adopted by City Council in April 2014. The CAP focused on increasing community awareness of the obesity epidemic, increasing accessibility to healthy food and physical activity opportunities, and expanding healthy eating active living programs. The Community Action Plan identifies program and policy priority areas, which will guide collaborative efforts towards a healthier San Pablo. The City has provided regular funding of up to $50,000 each year since 2014 to support the implementation of health and physical activity programming for residents, particularly children and young adults.
Community Events: The City of San Pablo Community Services Department provides community events throughout the year and has added events over the past two years. Community Services now offers a total of seven events including City Hall-O-Ween, Veterans Day Celebration, Egg Hunt, Holiday Tree
Lighting, Punt Pass & Kick Competition, Family Dance, and the 4th of July Celebration. In addition to these community events the department also offers a mobile farmers' market through Freshest Cargo and Movies in the Park in the summer months. The City also provides sponsorship and logistical support for the collaborative Cinco de Mayo event that is a collaborative effort with the City of Richmond.
xx
City of San Pablo 2015/16 CAFR
Letter of Transmittal
City Hall: 13831 San Pablo Ave., San Pablo, California 94806
Phone: (510) 215-3020 ~ Fax: (510) 231-0223
San Pablo Community Center: The San Pablo Community Center (SPCC) has been open since June 2014 and is thriving with new programs, meeting spaces, services, and activities. The center serves as the
local hub and focal point for offering a variety of programs and services that are affordable and target children and adults of all ages. These programs are designed to provide opportunities that will foster lifelong learning, promote personal development, and enhance the quality of life for San Pablo residents. In August 2016, a coffee shop, East Bay Coffee Company, joined the Community Center and is open Monday through Saturday. The Recreation Division has seen a significant increase in program offerings with new clients coming in weekly.
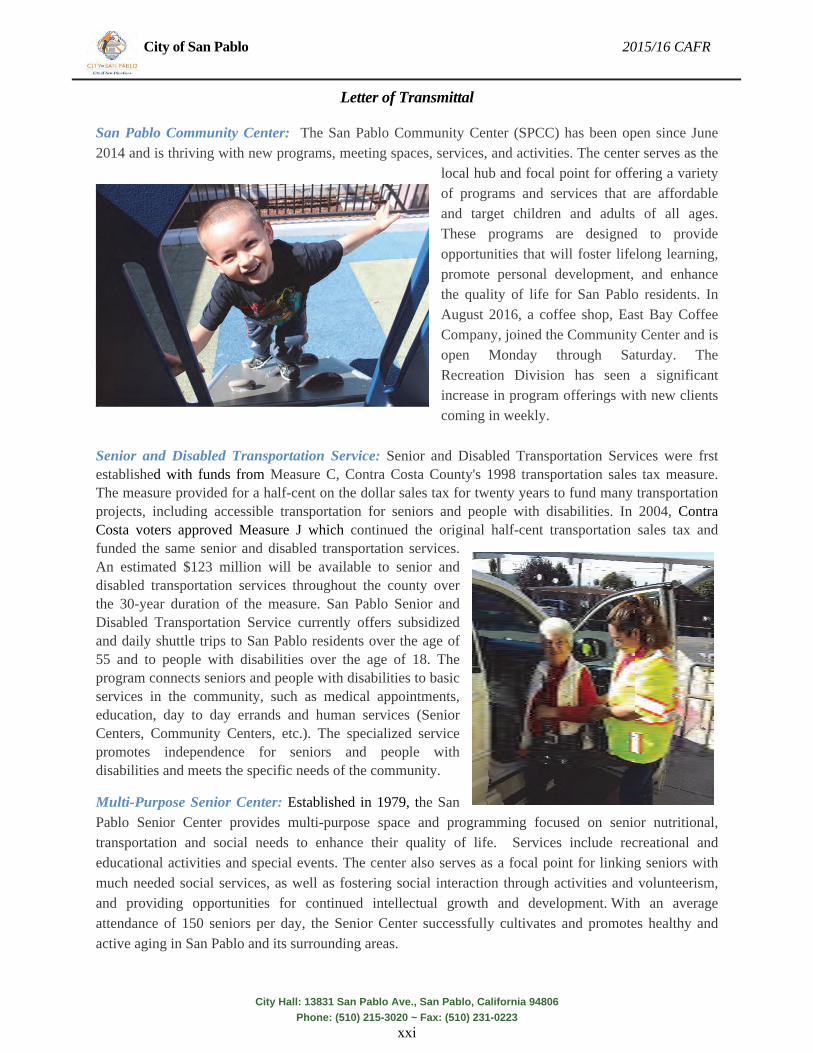
Senior and Disabled Transportation Service: Senior and Disabled Transportation Services were frst established with funds from Measure C, Contra Costa County's 1998 transportation sales tax measure. The measure provided for a half-cent on the dollar sales tax for twenty years to fund many transportation projects, including accessible transportation for seniors and people with disabilities. In 2004, Contra Costa voters approved Measure J which continued the original half-cent transportation sales tax and funded the same senior and disabled transportation services. An estimated $123 million will be available to senior and disabled transportation services throughout the county over the 30-year duration of the measure. San Pablo Senior and Disabled Transportation Service currently offers subsidized and daily shuttle trips to San Pablo residents over the age of 55 and to people with disabilities over the age of 18. The program connects seniors and people with disabilities to basic services in the community, such as medical appointments, education, day to day errands and human services (Senior Centers, Community Centers, etc.). The specialized service promotes independence for seniors and people with disabilities and meets the specific needs of the community.
Multi-Purpose Senior Center: Established in 1979, the San Pablo Senior Center provides multi-purpose space and programming focused on senior nutritional, transportation and social needs to enhance their quality of life. Services include recreational and educational activities and special events. The center also serves as a focal point for linking seniors with much needed social services, as well as fostering social interaction through activities and volunteerism, and providing opportunities for continued intellectual growth and development. With an average attendance of 150 seniors per day, the Senior Center successfully cultivates and promotes healthy and active aging in San Pablo and its surrounding areas.
xxi

City of San Pablo 2015/16 CAFR
Letter of Transmittal
City Hall: 13831 San Pablo Ave., San Pablo, California 94806
Phone: (510) 215-3020 ~ Fax: (510) 231-0223
Rumrill Sports Complex: The Rumrill Sports Complex opened in June 2015 and has three lighted synthetic-turf fields. This sports park is filled daily with local youth sports organizations, adult leagues and city-run programs and camps. PUBLIC SAFETY
Bicycle Patrol Unit: The Bicycle Patrol Unit consists of twelve officers specially trained in bike patrol operations. The Bike Unit augments the Patrol Division; offering a “greener” more approachable alternative to vehicle patrol. The Unit provides additional patrols to parks, business districts and shopping centers and expanded the program to include patrols of our local schools.
Graffiti Abatement Team: The Graffiti Abatement Team aggressively investigates incidents of graffiti by obtaining search and arrest warrants and by deploying plainclothes officers to apprehend offenders caught in the act. The Team upgraded the technology for graffiti sensors and cameras.
Priority Oriented Policing Unit: The Priority Oriented Policing (P.O.P.) Unit, formerly known as the Y.E.S. unit, provides classes to San Pablo children, grades 3 through 7, as well as a part-time police officer at the elementary school and a full-time one at the middle school. Discussion topics include the proper use of 911, 'Good Touch, Bad Touch', bullying, drug and gang prevention, goal setting, life skills and leadership.
G.R.E.A.T. Program: P.O.P. officers teach the Gang Resistance Education and Training (G.R.E.A.T.) program to San Pablo sixth graders. G.R.E.A.T. is a school-based, law enforcement, officer-instructed classroom program that teaches life skills and encourages student participation. In order to graduate, the students in the program must complete a community project. At the end of each school year, the top students from the G.R.E.A.T. program are recognized at our annual Community Awards Dinner. The purpose of the event is to bring our community closer, create stronger police/community understanding and recognize positive efforts of our youth.
G.R.E.A.T. Summer Program: This is a two week summer program staffed by police and school resource officers. The program accepts local youths and provides them with a classroom course of life skills instruction. The students are taken on a three-day/two-night camping trip with members of the police department who volunteer their time to provide a positive and structured camping experience.
xxii

City of San Pablo 2015/16 CAFR
Letter of Transmittal
City Hall: 13831 San Pablo Ave., San Pablo, California 94806
Phone: (510) 215-3020 ~ Fax: (510) 231-0223
Community Police Academy: The Community Police Academy (formerly known as the Citizen’s Police Academy) provides San Pablo residents an opportunity to learn the inner workings of the Police Department. The class is held one night a week for 10 weeks. Students are exposed to Police Administration, Patrol, Investigations, Y.E.S. and Gang Unit operations. The classes are taught in both English and Spanish by sworn members of the Police Department and police administration. Students also participate in a ride-along with an on-duty patrol officer. This free course of instruction has served to clarify the role of the police department in the community further building community trust. Parent Project: The Parent Project is a nationally recognized 10-week parent training program designed specifically for parents of strong-willed or out-of-control adolescent children. Parents meet one night per week, two to three hours per night for 10 weeks. The curriculum teaches concrete prevention, identification, and intervention strategies for the most destructive of adolescent behaviors (poor school attendance and performance, alcohol and other drug use, gangs, runaways, and violent teens). Community Emergency Response Team: The Community Emergency Response Team (CERT) is a training program that provides basic disaster response skills to assist neighborhood volunteers in offering vital support to family, associates, and local community members while they await help from first responders due to large-scale emergencies. This 20-hour FEMA-approved course is offered in a classroom setting followed by hands-on exercises discussing the following topics:
Disaster Preparedness
Fire Safety
Light Search & Rescue
Team Organization
Disaster Medical Operations: Triage, Assessment and Basic Treatment
Disaster Psychology
Terrorism and CERT Listos: Listos is a basic emergency and disaster readiness public education program with a grass-roots approach that specifically targets Spanish-speaking populations. Listos' culturally appropriate Spanish language curriculum uses the strengths and bonds within the Latino community to educate and prepare its members for emergencies or disasters.
xxiii

City of San Pablo 2015/16 CAFR
Letter of Transmittal
City Hall: 13831 San Pablo Ave., San Pablo, California 94806
Phone: (510) 215-3020 ~ Fax: (510) 231-0223
Homicide Clearance Rates: The San Pablo Police Department has historically enjoyed a high homicide clearance rate when compared to the national average. The Detective Division is comprised of highly trained and motivated individuals with a proven track record of conducting in-depth criminal investigations. Using a collaborative approach, investigators work closely with our P.O.P. Unit and other local agencies to solve unsolved murder cases. Recent history confirms the Department’s reputation. From January 1, 2015 through December 31, 2015, the City experienced two homicides, clearing one to date.
Surveillance Program: The Surveillance Program deploys a combination of pan, tilt and zoom (PTZ), fixed high-definition and automatic license plate recognition (ALPR) cameras, some of which are integrated with gunshot and/or graffiti detection sensors to provide alerts for gunshots, wanted and/or stolen vehicles and graffiti, with both fixed and mobile solutions.
Shot Spotter: The Shot Spotter Gunshot Location System uses a system of acoustic sensors, designed to detect, locate and report gunshots at various locations within the City.
SPECIAL PROJECTS / TECHNOLOGY
Information Technology (IT): IT manages the City’s information and computer infrastructure by providing network computer and telephone communications support. The work is primarily divided into three parts: network and system planning and management, database maintenance and management, and helpdesk and end-user support.
Major Projects: During FY 2015/16, IT completed several major projects. (1) Network servers reached end-of-life and were replaced with new servers with upgraded operating systems and services; old network servers were decommissioned. (2) IT also installed ESET anti-virus software on the network, since Microsoft stopped promoting their network Endpoint anti-virus solution. (3) Windows email service was upgraded and transferred to a Generation 9 Network Server. (4) IT provided support to issue new ID cards for all employees to improve campus security. (5) Staff replaced antiquated audio equipment in Maple Hall and Council Chambers and acquired tablet computers for City Councilmember use at City Council meetings.
Major Projects In-Process: IT staff helped lead a research team investigating body-worn cameras for all Police interactions and how best to store and retrieve the video. This project is scheduled for completion in FY 2016/17. Staff also began a major telephone system upgrade as well as replacement of all laptop computers with tablet computers in Police patrol cars.
xxiv

City of San Pablo 2015/16 CAFR
Letter of Transmittal
City Hall: 13831 San Pablo Ave., San Pablo, California 94806
Phone: (510) 215-3020 ~ Fax: (510) 231-0223
PLANNING & DEVELOPMENT SERVICES
Review of Citywide Public Buildings: Fiscal Year 2015/16 was a busy year for Development Services. The department completed design review, building plan check, and inspection services for several projects, including the San Pablo Community Center, Rumrill Soccer Complex, Senior Center roof, Maple Hall entry doors, Davis Park concession stand, the San Pablo Public Library, Fire Station #70 and City Hall.
Adoption of Building Codes: The City worked collaboratively with the Contra Costa Fire Department to adopt the 2016 State Building Codes.
Long-Range Planning: City staff participated in the development of the regional Plan Bay Area on behalf of the Association of Bay Area Governments (ABAG) and the Metropolitan Transportation Commission (MTC). Staff also completed and implemented the Targeted Industries Study, an economic development tool, the Bicycle and Pedestrian Master Plan, and an annual report on the status of the Housing Element to the State of California. Current Planning: During FY 2015/16, Development Services rezoned the Doctor’s Medical Center site to commercial mixed-use and oversaw the Moose Lodge demolition and re-use project review. Additionally, the department conducted planning review and/or site layout feedback for construction of the new Walgreens; Wyman Slide roadway repair; Plaza San Pablo roadway infrastructure; El Portal gas station construction; Women, Infants and Children building construction; and Plaza San Pablo Parcel map review. Current planning services was also provided to among many other smaller projects. Additionally, the Planning Commission held public hearings on various current and long-range planning projects.
California Environmental Quality Act (CEQA): Development Services participated in CEQA review for several large citywide and regional projects, including the Municipal Broadband Master Plan, La Quinta Hotel Mitigation Monitoring, Community Choice Electric Aggregation, the Chevron Refinery Modernization project and the Richmond Rail Connector.
Rumrill Complete Streets: The City received a $250,000 Department of Transportation grant to complete a multi-jurisdictional plan on Rumrill Boulevard between Contra Costa Community College, and thru the City of Richmond to their Bart Station. The purpose of the plan is to identify public improvements to increase walking, bicycling, access to public transportation.
xxv

City of San Pablo 2015116 CAFR
� ... ol .... p;...._.
Letter of Transmittal
ACKNOWLEDGEMENTS
We wish to thank City Council for providing the clear policy direction and goals which have been used to
prepare this Comprehensive Annual Financial Report. A great deal of effort and attention to detail,
representing many hours of work by staff members throughout the organization, is required to produce a
report of this quality. We would like to express our appreciation to all City of San Pablo staff members
who have taken the time to participate in the development of this year's Comprehensive Annual Financial
Report. We also express our appreciation to the Mayor and the City Council for their interest and support
in planning and conducting the financial activities of the City in a responsible and responsive manner.
Respectfully submitted,
Matt Rodrigu
City Manager
-
City Hall: 13831 San Pablo Ave., San Pablo, California 94806
Phone: (510) 215-3020- Fax: (510) 231-0223
xxvi

City of San Pablo 2015/16 CAFR
Letter of Transmittal
City Hall: 13831 San Pablo Ave., San Pablo, California 94806
Phone: (510) 215-3020 ~ Fax: (510) 231-0223
CITYOFSANPABLO
ELECTEDOFFICIALSAND
ADMINISTRATIVEPERSONNEL
JULY1,2016
ELECTEDPERSONNEL
Mayor Rich Kinney
Vice Mayor Cecilia Valdez
Council Member Kathy Chao Rothberg
Council Member Genoveva Garcia-Calloway
Council Member Paul V. Morris
City Clerk Ted J. Denney
City Treasurer Viviana Toledo
ADMINISTRATIVEPERSONNEL
City Manager Matt Rodriguez
City Attorney Lynn Tracy Nerland
Assistant City Manager Reina Schwartz
Assistant to the City Manager/Economic Development Charles Ching
Assistant to the City Manager/Personnel Tina Gallegos
Chief of Police Lisa Rosales
Community Services Director Greg Dwyer
Development Services Director Michele Rodriguez
Finance Director J. Kelly Sessions
Information Technology Manager Larry Johnson
Public Works Director Barbara Hawkins
xxvii

CITY OF SAN PABLO ORGANIZATIONAL CHART, FY 2015/16 (last revised Feb 16, 2016) TOTAL FTE: 180.4
CITY MANAGER 1.01.0 Executive Assistant to CM
1.0 Deputy City Clerk
CHIEF OF POLICE 1.0
SAN PABLO CITY COUNCIL
CITY ATTORNEY 1.0 1.0 Secretary to the City Attorney
2.0 FTE
SWORN STAFF
10.0 Sergeant
41.0 Police Officer
NON-SWORN STAFF
1.0 Police Executive Assistant
5.0 Police Services Technician
2.0 Jailer 3.0 Police Services Assistant
7.0 Police Admin. Clerk
1.0 Maintenance Worker III
0.5 Background invest. (P/T)
1.5 School Crossing Guard (P/T)
2.0 Police Cadet (P/T)
CODE ENFORCEMENT
1.0 Building Inspector
BUDGET & FISCAL SERVICES
1.0 Finance Supervisor
1.0 Management Assistant
1.0 Fiscal Clerk II 2.0 Fiscal Clerk I
RECREATION SERVICES
1.0 Rec. Supervisor
2.0 Rec Coordinator 1.0 Admin. Clerk II
0.5 ProgramAssistant (P/T)
7.0 Building Attendant (P/T)
8.0 Rec. Leader I (P/T)
4.9 Rec Leader II (P/T)
3.0 Rec Specialist I (P/T)
0.7 Rec Specialist II
1.0 Sr. Rec Specialist (P/T)
0.4 Art Curator (P/T) 1.6 Admin Intern (P/T)
SENIOR SERVICES
0.5 Rec. Supervisor
0.8 Sr. Ctr. Services Aide
1.5 Building Attendant (P/T)
1.0 Admin Intern (P/T)
YOUTH SERVICES
1.0 Comm. Servs. Coordinator 1.0 Program Coordinator
0.5 Prog. Assistant (P/T)
PARATRANSIT
0.5 Rec. Supervisor
1.0 Sr. Ctr. Services Aide
2.5 Paratransit Driver
BUILDING SERVICES
(Contract Services)
1.0 Building Inspector
PLANNING SERVICES
1.0 Planning Aide
1.0 Assistant Planner
1.0 Assistant/Associate Planner
0.5 Admin. Intern(P/T)
PERMIT SERVICES
1.0 Sr. Permit Tech. 1.0 Admin. Secretary
1.0 Admin. Clerk
0.5 Admin. Intern (P/T)
INFO. TECHNOLOGY SERVICES
1.0 Info. Tech. Administrator
1.0 Info. Tech. Technician
0.5 Info. Tech. Intern (P/T)
ENGINEERING 0.5 Management Analyst
1.0 Sr. Civil Engineer
1.0 Sr. PW Inspector
1.0 Assistant Engineer
1.0 Admin. Clerk
1.0 Engineering Aide
ENVIRONMENTAL SERVICES
1.0 Maintenance Worker III 0.5 Maintenance Worker I
1.5 Environmental Prog. Analyst
BUILDING & FLEET MAINTENANCE
1.0 Maintenance Worker I
1.0 Maintenance Worker III
1.0 Sr. Maintenance Worker
STREET LIGHTING & LANDSCAPE 1.0 Administrative Clerk
0.5 Maintenance Aide
0.5 Maintenance Operations Sup.
2.0 Maintenance Worker I
.25 Management Analyst
1.0 Sr. Maintenance Worker
STREET MAINT. & GRAFFITI
0.5 Maintenance Operations Sup.
2.0 Maintenance Worker III 3.5 Maintenance Worker I
1.5 Maintenance Aide (P/T)
.25 Management Analyst
ASSISTANT CITY MANAGER 1.0 (PERSONNEL ADMINISTRATOR)
1.0 Administrative Clerk
RISK MANAGEMENT
Municipal Pooling Authority (MPA)
2.0
ASSISTANT TO THE CITY MANAGER 1.0
HR FUNCTIONS/ MANAGEMENT SUPPORT
ASSISTANT TO THE CITY MANAGER 1.0
ECONOMIC DEVELOPMENT/
SUCCESSOR AGENCY
POLICE
COMMANDERS 3.0
POLICE DEPARTMENT
DEVELOPMENT SERVS.
MANAGER 1.0
DEVELOPMENT SERVS.
FINANCE
DIRECTOR 1.0
FINANCE DEPARTMENT
INFORMATION TECH.
MANAGER 1.0
INFO. TECH. SERVS.
COMM. SERVS.
MANAGER 1.0
COMMUNITY SERVS.
CITY
ENGINEER 1.0
ENG., ENV. SERVS. & MAINT.
6.0 FTE9.0 FTE 3.5 FTE 25.5 FTE 42.4 FTE
42.4 FTE
33.85 FTE
7.0 FTE
79.0 FTE
xxviii

xxix

! ! ! ! ! !
! ! ! ! ! !
! ! ! ! ! !
! ! ! ! ! !
! !
! !
! !
! !
! !
! ! !
! ! !
! ! !
! ! !
! ! !
! ! !
! ! !
! ! ! ! ! ! ! ! ! ! ! ! ! ! ! ! ! ! ! ! ! ! ! ! ! ! ! ! ! ! ! ! ! ! ! ! ! ! ! ! ! ! ! ! ! ! ! ! ! ! ! !
! ! ! ! ! ! ! ! ! ! ! ! ! ! ! ! ! ! ! ! ! ! ! ! ! ! ! ! ! ! ! ! ! ! ! ! ! ! ! ! ! ! ! ! ! ! ! ! ! ! ! !
! ! ! ! ! ! ! ! ! ! ! ! ! ! ! ! ! ! ! ! ! ! ! ! ! ! ! ! ! ! ! ! ! ! ! ! ! ! ! ! ! ! ! ! ! ! ! ! ! ! ! !
! ! ! ! ! ! ! ! ! ! ! ! ! ! ! ! ! ! ! ! ! ! ! ! ! ! ! ! ! ! ! ! ! ! ! ! ! ! ! ! ! ! ! ! ! ! ! ! ! ! ! !
! ! ! ! ! ! ! ! ! ! ! ! ! ! ! ! ! ! ! ! ! ! ! ! ! ! ! ! ! ! ! ! ! ! ! ! ! ! ! ! ! ! ! ! ! ! ! ! ! ! ! !
! ! ! ! ! ! ! ! ! ! ! ! ! ! ! ! ! ! ! ! ! ! ! ! ! ! ! ! ! ! ! ! ! ! ! ! ! ! ! ! ! ! ! ! ! ! ! ! ! ! ! !
! ! ! ! ! ! ! ! ! ! ! ! ! ! ! ! ! ! ! ! ! ! ! ! ! ! ! ! ! ! ! ! ! ! ! ! ! ! ! ! ! ! ! ! ! ! ! ! ! ! ! !
! ! ! ! ! ! ! ! ! ! ! ! ! ! ! ! ! ! ! ! ! ! ! ! ! ! ! ! ! ! ! ! ! ! ! ! ! ! ! ! ! ! ! ! ! ! ! ! ! ! ! !
! ! ! ! ! ! ! ! ! ! ! ! ! ! ! ! ! ! ! ! ! ! ! ! ! ! ! ! ! ! ! ! ! ! ! ! ! ! ! ! ! ! ! ! ! ! ! ! ! ! ! !
! ! ! ! ! ! ! ! ! ! ! ! ! ! ! ! ! ! ! ! ! ! ! ! ! ! ! ! ! ! ! ! ! ! ! ! ! ! ! ! ! ! ! ! ! ! ! ! ! ! ! !
! ! ! ! ! ! ! ! ! ! ! ! ! ! ! ! ! ! ! ! ! ! ! ! ! ! ! ! ! ! ! ! ! ! ! ! ! ! ! ! ! ! ! ! ! ! ! ! ! ! ! !
! ! ! ! ! ! ! ! ! ! ! ! ! ! ! ! ! ! ! ! ! ! ! ! ! ! ! ! ! ! ! ! ! ! ! ! ! ! ! ! ! ! ! ! ! ! ! ! ! ! ! !
! ! ! ! ! ! ! ! ! ! ! ! ! ! ! ! ! ! ! ! ! ! ! ! ! ! ! ! ! ! ! ! ! ! ! ! ! ! ! ! ! ! ! ! ! ! ! ! ! ! ! !
! ! ! ! ! ! ! ! ! ! ! ! ! ! ! ! ! ! ! ! ! ! ! ! ! ! ! ! ! ! ! ! ! ! ! ! ! ! ! ! ! ! ! ! ! ! ! ! ! ! ! !
! ! ! ! ! ! ! ! ! ! ! ! ! ! ! ! ! ! ! ! ! ! ! ! ! ! ! ! ! ! ! ! ! ! ! ! ! ! ! ! ! ! ! ! ! ! ! ! ! ! ! !
! ! ! ! ! ! ! ! ! ! ! ! ! ! ! ! ! ! ! ! ! ! ! ! ! ! ! ! ! ! ! ! ! ! ! ! ! ! ! ! ! ! ! ! ! ! ! ! ! ! ! !
! ! ! ! ! ! ! ! ! ! ! ! ! ! ! ! ! ! ! ! ! ! ! ! ! ! ! ! ! ! ! ! ! ! ! ! ! ! ! ! ! ! ! ! ! ! ! ! ! ! ! !
! ! ! ! ! ! ! ! ! ! ! ! ! ! ! ! ! ! ! ! ! ! ! ! ! ! ! ! ! ! ! ! ! ! ! ! ! ! ! ! ! ! ! ! ! ! ! ! ! ! ! !
! ! ! ! ! ! ! ! ! ! ! ! ! ! ! ! ! ! ! ! ! ! ! ! ! ! ! ! ! ! ! ! ! ! ! ! ! ! ! ! ! ! ! ! ! ! ! ! ! ! ! !
! ! ! ! ! ! ! ! ! ! ! ! ! ! ! ! ! ! ! ! ! ! ! ! ! ! ! ! ! ! ! ! ! ! ! ! ! ! ! ! ! ! ! ! ! ! ! ! ! ! ! !
! ! ! ! ! ! ! ! ! ! ! ! ! ! ! ! ! ! ! ! ! ! ! ! ! ! ! ! ! ! ! ! ! ! ! ! ! ! ! ! ! ! ! ! ! ! ! ! ! ! ! !
! ! ! ! ! ! ! ! ! ! ! ! ! ! ! ! ! ! ! ! ! ! ! ! ! ! ! ! ! ! ! ! ! ! ! ! ! ! ! ! ! ! ! ! ! ! ! ! ! ! ! !
! ! ! ! ! ! ! ! ! ! ! ! ! ! ! ! ! ! ! ! ! ! ! ! ! ! ! ! ! ! ! ! ! ! ! ! ! ! ! ! ! ! ! ! ! ! ! ! ! ! ! !
! ! ! ! ! ! ! ! ! ! ! ! ! ! ! ! ! ! ! ! ! ! ! ! ! ! ! ! ! ! ! ! ! ! ! ! ! ! ! ! ! ! ! ! ! ! ! ! ! ! ! !
! ! ! ! ! ! ! ! ! ! ! ! ! ! ! ! ! ! ! ! ! ! ! ! ! ! ! ! ! ! ! ! ! ! ! ! ! ! ! ! ! ! ! ! ! ! ! ! ! ! ! !
! ! ! ! ! ! ! ! ! ! ! ! ! ! ! ! ! ! ! ! ! ! ! ! ! ! ! ! ! ! ! ! ! ! ! ! ! ! ! ! ! ! ! ! ! ! ! ! ! ! ! !
! ! ! ! ! ! ! ! ! ! ! ! ! ! ! ! ! ! ! ! ! ! ! ! ! ! ! ! ! ! ! ! ! ! ! ! ! ! ! ! ! ! ! ! ! ! ! ! ! ! ! !
! ! ! ! ! ! ! ! ! ! ! ! ! ! ! ! ! ! ! ! ! ! ! ! ! ! ! ! ! ! ! ! ! ! ! ! ! ! ! ! ! ! ! ! ! ! ! ! ! ! ! !
! ! ! ! ! ! ! ! ! ! ! ! ! ! ! ! ! ! ! ! ! ! ! ! ! ! ! ! ! ! ! ! ! ! ! ! ! ! ! ! ! ! ! ! ! ! ! ! ! ! ! !
! ! ! ! ! ! ! ! ! ! ! ! ! ! ! ! ! ! ! ! ! ! ! ! ! ! ! ! ! ! ! ! ! ! ! ! ! ! ! ! ! ! ! ! ! ! ! ! ! ! ! !
! ! ! ! ! ! ! ! ! ! ! ! ! ! ! ! ! ! ! ! ! ! ! ! ! ! ! ! ! ! ! ! ! ! ! ! ! ! ! ! ! ! ! ! ! ! ! ! ! ! ! !
! ! ! ! ! ! ! ! ! ! ! ! ! ! ! ! ! ! ! ! ! ! ! ! ! ! ! ! ! ! ! ! ! ! ! ! ! ! ! ! ! ! ! ! ! ! ! ! ! ! ! !
! ! ! ! ! ! ! ! ! ! ! ! ! ! ! ! ! ! ! ! ! ! ! ! ! ! ! ! ! ! ! ! ! ! ! ! ! ! ! ! ! ! ! ! ! ! ! ! ! ! ! !
! ! ! ! ! ! ! ! ! ! ! ! ! ! ! ! ! ! ! ! ! ! ! ! ! ! ! ! ! ! ! ! ! ! ! ! ! ! ! ! ! ! ! ! ! ! ! ! ! ! ! !
! ! ! ! ! ! ! ! ! ! ! ! ! ! ! ! ! ! ! ! ! ! ! ! ! ! ! ! ! ! ! ! ! ! ! ! ! ! ! ! ! ! ! ! ! ! ! ! ! ! ! !
! ! ! ! ! ! ! ! ! ! ! ! ! ! ! ! ! ! ! ! ! ! ! ! ! ! ! ! ! ! ! ! ! ! ! ! ! ! ! ! ! ! ! ! ! ! ! ! ! ! ! !
! ! ! ! ! ! ! ! ! ! ! ! ! ! ! ! ! ! ! ! ! ! ! ! ! ! ! ! ! ! ! ! ! ! ! ! ! ! ! ! ! ! ! ! ! ! ! ! ! ! ! !
! ! ! ! ! ! ! ! ! ! ! ! ! ! ! ! ! ! ! ! ! ! ! ! ! ! ! ! ! ! ! ! ! ! ! ! ! ! ! ! ! ! ! ! ! ! ! ! ! ! ! !
! ! ! ! ! ! ! ! ! ! ! ! ! ! ! ! ! ! ! ! ! ! ! ! ! ! ! ! ! ! ! ! ! ! ! ! ! ! ! ! ! ! ! ! ! ! ! ! ! ! ! !
! ! ! ! ! ! ! ! ! ! ! ! ! ! ! ! ! ! ! ! ! ! ! ! ! ! ! ! ! ! ! ! ! ! ! ! ! ! ! ! ! ! ! ! ! ! ! ! ! ! ! !
! ! ! ! ! ! ! ! ! ! ! ! ! ! ! ! ! ! ! ! ! ! ! ! ! ! ! ! ! ! ! ! ! ! ! ! ! ! ! ! ! ! ! ! ! ! ! ! ! ! ! !
! ! ! ! ! ! ! ! ! ! ! ! ! ! ! ! ! ! ! ! ! ! ! ! ! ! ! ! ! ! ! ! ! ! ! ! ! ! ! ! ! ! ! ! ! ! ! ! ! ! ! !
! ! ! ! ! ! ! ! ! ! ! ! ! ! ! ! ! ! ! ! ! ! ! ! ! ! ! ! ! ! ! ! ! ! ! ! ! ! ! ! ! ! ! ! ! ! ! ! ! ! ! !
! ! ! ! ! ! ! ! ! ! ! ! ! ! ! ! ! ! ! ! ! ! ! ! ! ! ! ! ! ! ! ! ! ! ! ! ! ! ! ! ! ! ! ! ! ! ! ! ! ! ! !
! ! ! ! ! ! ! ! ! ! ! ! ! ! ! ! ! ! ! ! ! ! ! ! ! ! ! ! ! ! ! ! ! ! ! ! ! ! ! ! ! ! ! ! ! ! ! ! ! ! ! !
! ! ! ! ! ! ! ! ! ! ! ! ! ! ! ! ! ! ! ! ! ! ! ! ! ! ! ! ! ! ! ! ! ! ! ! ! ! ! ! ! ! ! ! ! ! ! ! ! ! ! !
! ! ! ! ! ! ! ! ! ! ! ! ! ! ! ! ! ! ! ! ! ! ! ! ! ! ! ! ! ! ! ! ! ! ! ! ! ! ! ! ! ! ! ! ! ! ! ! ! ! ! !
! ! ! ! ! ! ! ! ! ! ! ! ! ! ! ! ! ! ! ! ! ! ! ! ! ! ! ! ! ! ! ! ! ! ! ! ! ! ! ! ! ! ! ! ! ! ! ! ! ! ! !
! ! ! ! ! ! ! ! ! ! ! ! ! ! ! ! ! ! ! ! ! ! ! ! ! ! ! ! ! ! ! ! ! ! ! ! ! ! ! ! ! ! ! ! ! ! ! ! ! ! ! !
! ! ! ! ! ! ! ! ! ! ! ! ! ! ! ! ! ! ! ! ! ! ! ! ! ! ! ! ! ! ! ! ! ! ! ! ! ! ! ! ! ! ! ! ! ! ! ! ! ! ! !
! ! ! ! ! ! ! ! ! ! ! ! ! ! ! ! ! ! ! ! ! ! ! ! ! ! ! ! ! ! ! ! ! ! ! ! ! ! ! ! ! ! ! ! ! ! ! ! ! ! ! !
! ! ! ! ! ! ! ! ! ! ! ! ! ! ! ! ! ! ! ! ! ! ! ! ! ! ! ! ! ! ! ! ! ! ! ! ! ! ! ! ! ! ! ! ! ! ! ! ! ! ! !
! ! ! ! ! ! ! ! ! ! ! ! ! ! ! ! ! ! ! ! ! ! ! ! ! ! ! ! ! ! ! ! ! ! ! ! ! ! ! ! ! ! ! ! ! ! ! ! ! ! ! !
! ! ! ! ! ! ! ! ! ! ! ! ! ! ! ! ! ! ! ! ! ! ! ! ! ! ! ! ! ! ! ! ! ! ! ! ! ! ! ! ! ! ! ! ! ! ! ! ! ! ! !
! ! ! ! ! ! ! ! ! ! ! ! ! ! ! ! ! ! ! ! ! ! ! ! ! ! ! ! ! ! ! ! ! ! ! ! ! ! ! ! ! ! ! ! ! ! ! ! ! ! ! !
! ! ! ! ! ! ! ! ! ! ! ! ! ! ! ! ! ! ! ! ! ! ! ! ! ! ! ! ! ! ! ! ! ! ! ! ! ! ! ! ! ! ! ! ! ! ! ! ! ! ! !
! ! ! ! ! ! ! ! ! ! ! ! ! ! ! ! ! ! ! ! ! ! ! ! ! ! ! ! ! ! ! ! ! ! ! ! ! ! ! ! ! ! ! ! ! ! ! ! ! ! ! !
! ! ! ! ! ! ! ! ! ! ! ! ! ! ! ! ! ! ! ! ! ! ! ! ! ! ! ! ! ! ! ! ! ! ! ! ! ! ! ! ! ! ! ! ! ! ! ! ! ! ! !
! ! ! ! ! ! ! ! ! ! ! ! ! ! ! ! ! ! ! ! ! ! ! ! ! ! ! ! ! ! ! ! ! ! ! ! ! ! ! ! ! ! ! ! ! ! ! ! ! ! ! !
! ! ! ! ! ! ! ! ! ! ! ! ! ! ! ! ! ! ! ! ! ! ! ! ! ! ! ! ! ! ! ! ! ! ! ! ! ! ! ! ! ! ! ! ! ! ! ! ! ! ! !
! ! ! ! ! ! ! ! ! ! ! ! ! ! ! ! ! ! ! ! ! ! ! ! ! ! ! ! ! ! ! ! ! ! ! ! ! ! ! ! ! ! ! ! ! ! ! ! ! ! ! !
! ! ! ! ! ! ! ! ! ! ! ! ! ! ! ! ! ! ! ! ! ! ! ! ! ! ! ! ! ! ! ! ! ! ! ! ! ! ! ! ! ! ! ! ! ! ! ! ! ! ! !
! ! ! ! ! ! ! ! ! ! ! ! ! ! ! ! ! ! ! ! ! ! ! ! ! ! ! ! ! ! ! ! ! ! ! ! ! ! ! ! ! ! ! ! ! ! ! ! ! ! ! !
! ! ! ! ! ! ! ! ! ! ! ! ! ! ! ! ! ! ! ! ! ! ! ! ! ! ! ! ! ! ! ! ! ! ! ! ! ! ! ! ! ! ! ! ! ! ! ! ! ! ! !
! ! ! ! ! ! ! ! ! ! ! ! ! ! ! ! ! ! ! ! ! ! ! ! ! ! ! ! ! ! ! ! ! ! ! ! ! ! ! ! ! ! ! ! ! ! ! ! ! ! ! !
! ! ! ! ! ! ! ! ! ! ! ! ! ! ! ! ! ! ! ! ! ! ! ! ! ! ! ! ! ! ! ! ! ! ! ! ! ! ! ! ! ! ! ! ! ! ! ! ! ! ! !
! ! ! ! ! ! ! ! ! ! ! ! ! ! ! ! ! ! ! ! ! ! ! ! ! ! ! ! ! ! ! ! ! ! ! ! ! ! ! ! ! ! ! ! ! ! ! ! ! ! ! !
! ! ! ! ! ! ! ! ! ! ! ! ! ! ! ! ! ! ! ! ! ! ! ! ! ! ! ! ! ! ! ! ! ! ! ! ! ! ! ! ! ! ! ! ! ! ! ! ! ! ! !
! ! ! ! ! ! ! ! ! ! ! ! ! ! ! ! ! ! ! ! ! ! ! ! ! ! ! ! ! ! ! ! ! ! ! ! ! ! ! ! ! ! ! ! ! ! ! ! ! ! ! !
! ! ! ! ! ! ! ! ! ! ! ! ! ! ! ! ! ! ! ! ! ! ! ! ! ! ! ! ! ! ! ! ! ! ! ! ! ! ! ! ! ! ! ! ! ! ! ! ! ! ! !
! ! ! ! ! ! ! ! ! ! ! ! ! ! ! ! ! ! ! ! ! ! ! ! ! ! ! ! ! ! ! ! ! ! ! ! ! ! ! ! ! ! ! ! ! ! ! ! ! ! ! !
! ! ! ! ! ! ! ! ! ! ! ! ! ! ! ! ! ! ! ! ! ! ! ! ! ! ! ! ! ! ! ! ! ! ! ! ! ! ! ! ! ! ! ! ! ! ! ! ! ! ! !
! ! ! ! ! ! ! ! ! ! ! ! ! ! ! ! ! ! ! ! ! ! ! ! ! ! ! ! ! ! ! ! ! ! ! ! ! ! ! ! ! ! ! ! ! ! ! ! ! ! ! !
! ! ! ! ! ! ! ! ! ! ! ! ! ! ! ! ! ! ! ! ! ! ! ! ! ! ! ! ! ! ! ! ! ! ! ! ! ! ! ! ! ! ! ! ! ! ! ! ! ! ! !
! ! ! ! ! ! ! ! ! ! ! ! ! ! ! ! ! ! ! ! ! ! ! ! ! ! ! ! ! ! ! ! ! ! ! ! ! ! ! ! ! ! ! ! ! ! ! ! ! ! ! !
! ! ! ! ! ! ! ! ! ! ! ! ! ! ! ! ! ! ! ! ! ! ! ! ! ! ! ! ! ! ! ! ! ! ! ! ! ! ! ! ! ! ! ! ! ! ! ! ! ! ! !
! ! ! ! ! ! ! ! ! ! ! ! ! ! ! ! ! ! ! ! ! ! ! ! ! ! ! ! ! ! ! ! ! ! ! ! ! ! ! ! ! ! ! ! ! ! ! ! ! ! ! !
! ! ! ! ! ! ! ! ! ! ! ! ! ! ! ! ! ! ! ! ! ! ! ! ! ! ! ! ! ! ! ! ! ! ! ! ! ! ! ! ! ! ! ! ! ! ! ! ! ! ! !
! ! ! ! ! ! ! ! ! ! ! ! ! ! ! ! ! ! ! ! ! ! ! ! ! ! ! ! ! ! ! ! ! ! ! ! ! ! ! ! ! ! ! ! ! ! ! ! ! ! ! !
! ! ! ! ! ! ! ! ! ! ! ! ! ! ! ! ! ! ! ! ! ! ! ! ! ! ! ! ! ! ! ! ! ! ! ! ! ! ! ! ! ! ! ! ! ! ! ! ! ! ! !
! ! ! ! ! ! ! ! ! ! ! ! ! ! ! ! ! ! ! ! ! ! ! ! ! ! ! ! ! ! ! ! ! ! ! ! ! ! ! ! ! ! ! ! ! ! ! ! ! ! ! !
! ! ! ! ! ! ! ! ! ! ! ! ! ! ! ! ! ! ! ! ! ! ! ! ! ! ! ! ! ! ! ! ! ! ! ! ! ! ! ! ! ! ! ! ! ! ! ! ! ! ! !
! ! ! ! ! ! ! ! ! ! ! ! ! ! ! ! ! ! ! ! ! ! ! ! ! ! ! ! ! ! ! ! ! ! ! ! ! ! ! ! ! ! ! ! ! ! ! ! ! ! ! !
! ! ! ! ! ! ! ! ! ! ! ! ! ! ! ! ! ! ! ! ! ! ! ! ! ! ! ! ! ! ! ! ! ! ! ! ! ! ! ! ! ! ! ! ! ! ! ! ! ! ! !
! ! ! ! ! ! ! ! ! ! ! ! ! ! ! ! ! ! ! ! ! ! ! ! ! ! ! ! ! ! ! ! ! ! ! ! ! ! ! ! ! ! ! ! ! ! ! ! ! ! ! !
! ! ! ! ! ! ! ! ! ! ! ! ! ! ! ! ! ! ! ! ! ! ! ! ! ! ! ! ! ! ! ! ! ! ! ! ! ! ! ! ! ! ! ! ! ! ! ! ! ! ! !
! ! ! ! ! ! ! ! ! ! ! ! ! ! ! ! ! ! ! ! ! ! ! ! ! ! ! ! ! ! ! ! ! ! ! ! ! ! ! ! ! ! ! ! ! ! ! ! ! ! ! !
! ! ! ! ! ! ! ! ! ! ! ! ! ! ! ! ! ! ! ! ! ! ! ! ! ! ! ! ! ! ! ! ! ! ! ! ! ! ! ! ! ! ! ! ! ! ! ! ! ! ! !
! ! ! ! ! ! ! ! ! ! ! ! ! ! ! ! ! ! ! ! ! ! ! ! ! ! ! ! ! ! ! ! ! ! ! ! ! ! ! ! ! ! ! ! ! ! ! ! ! ! ! !
! ! ! ! ! ! ! ! ! ! ! ! ! ! ! ! ! ! ! ! ! ! ! ! ! ! ! ! ! ! ! ! ! ! ! ! ! ! ! ! ! ! ! ! ! ! ! ! ! ! ! !
! ! ! ! ! ! ! ! ! ! ! ! ! ! ! ! ! ! ! ! ! ! ! ! ! ! ! ! ! ! ! ! ! ! ! ! ! ! ! ! ! ! ! ! ! ! ! ! ! ! ! !
! ! ! ! ! ! ! ! ! ! ! ! ! ! ! ! ! ! ! ! ! ! ! ! ! ! ! ! ! ! ! ! ! ! ! ! ! ! ! ! ! ! ! ! ! ! ! ! ! ! ! !
! ! ! ! ! ! ! ! ! ! ! ! ! ! ! ! ! ! ! ! ! ! ! ! ! ! ! ! ! ! ! ! ! ! ! ! ! ! ! ! ! ! ! ! ! ! ! ! ! ! ! !
! ! ! ! ! ! ! ! ! ! ! ! ! ! ! ! ! ! ! ! ! ! ! ! ! ! ! ! ! ! ! ! ! ! ! ! ! ! ! ! ! ! ! ! ! ! ! ! ! ! ! !
! ! ! ! ! ! ! ! ! ! ! ! ! ! ! ! ! ! ! ! ! ! ! ! ! ! ! ! ! ! ! ! ! ! ! ! ! ! ! ! ! ! ! ! ! ! ! ! ! ! ! !
! ! ! ! ! ! ! ! ! ! ! ! ! ! ! ! ! ! ! ! ! ! ! ! ! ! ! ! ! ! ! ! ! ! ! ! ! ! ! ! ! ! ! ! ! ! ! ! ! ! ! !
! ! ! ! ! ! ! ! ! ! ! ! ! ! ! ! ! ! ! ! ! ! ! ! ! ! ! ! ! ! ! ! ! ! ! ! ! ! ! ! ! ! ! ! ! ! ! ! ! ! ! !
! ! ! ! ! ! ! ! ! ! ! ! ! ! ! ! ! ! ! ! ! ! ! ! ! ! ! ! ! ! ! ! ! ! ! ! ! ! ! ! ! ! ! ! ! ! ! ! ! ! ! !
! ! ! ! ! ! ! ! ! ! ! ! ! ! ! ! ! ! ! ! ! ! ! ! ! ! ! ! ! ! ! ! ! ! ! ! ! ! ! ! ! ! ! ! ! ! ! ! ! ! ! !
! ! ! ! ! ! ! ! ! ! ! ! ! ! ! ! ! ! ! ! ! ! ! ! ! ! ! ! ! ! ! ! ! ! ! ! ! ! ! ! ! ! ! ! ! ! ! ! ! ! ! !
! ! ! ! ! ! ! ! ! ! ! ! ! ! ! ! ! ! ! ! ! ! ! ! ! ! ! ! ! ! ! ! ! ! ! ! ! ! ! ! ! ! ! ! ! ! ! ! ! ! ! !
! ! ! ! ! ! ! ! ! ! ! ! ! ! ! ! ! ! ! ! ! ! ! ! ! ! ! ! ! ! ! ! ! ! ! ! ! ! ! ! ! ! ! ! ! ! ! ! ! ! ! !
! ! ! ! ! ! ! ! ! ! ! ! ! ! ! ! ! ! ! ! ! ! ! ! ! ! ! ! ! ! ! ! ! ! ! ! ! ! ! ! ! ! ! ! ! ! ! ! ! ! ! !
! ! ! ! ! ! ! ! ! ! ! ! ! ! ! ! ! ! ! ! ! ! ! ! ! ! ! ! ! ! ! ! ! ! ! ! ! ! ! ! ! ! ! ! ! ! ! ! ! ! ! !
! ! ! ! ! ! ! ! ! ! ! ! ! ! ! ! ! ! ! ! ! ! ! ! ! ! ! ! ! ! ! ! ! ! ! ! ! ! ! ! ! ! ! ! ! ! ! ! ! ! ! !
! ! ! ! ! ! ! ! ! ! ! ! ! ! ! ! ! ! ! ! ! ! ! ! ! ! ! ! ! ! ! ! ! ! ! ! ! ! ! ! ! ! ! ! ! ! ! ! ! ! ! !
! ! ! ! ! ! ! ! ! ! ! ! ! ! ! ! ! ! ! ! ! ! ! ! ! ! ! ! ! ! ! ! ! ! ! ! ! ! ! ! ! ! ! ! ! ! ! ! ! ! ! !
! ! ! ! ! ! ! ! ! ! ! ! ! ! ! ! ! ! ! ! ! ! ! ! ! ! ! ! ! ! ! ! ! ! ! ! ! ! ! ! ! ! ! ! ! ! ! ! ! ! ! !
! ! ! ! ! ! ! ! ! ! ! ! ! ! ! ! ! ! ! ! ! ! ! ! ! ! ! ! ! ! ! ! ! ! ! ! ! ! ! ! ! ! ! ! ! ! ! ! ! ! ! !
! ! ! ! ! ! ! ! ! ! ! ! ! ! ! ! ! ! ! ! ! ! ! ! ! ! ! ! ! ! ! ! ! ! ! ! ! ! ! ! ! ! ! ! ! ! ! ! ! ! ! !
! ! ! ! ! ! ! ! ! ! ! ! ! ! ! ! ! ! ! ! ! ! ! ! ! ! ! ! ! ! ! ! ! ! ! ! ! ! ! ! ! ! ! ! ! ! ! ! ! ! ! !
! ! ! ! ! ! ! ! ! ! ! ! ! ! ! ! ! ! ! ! ! ! ! ! ! ! ! ! ! ! ! ! ! ! ! ! ! ! ! ! ! ! ! ! ! ! ! ! ! ! ! !
D D D D D D D D D D D D D D D D D D D D D D D D D D D D D D D D D D D D D D D D D D D D D D D D D D D D D D D D D D D D D D D
D D D D D D D D D D D D D D D D D D D D D D D D D D D D D D D D D D D D D D D D D D D D D D D D D D D D D D D D D D D D D D D
D D D D D D D D D D D D D D D D D D D D D D D D D D D D D D D D D D D D D D D D D D D D D D D D D D D D D D D D D D D D D D D
D D D D D D D D D D D D D D D D D D D D D D D D D D D D D D D D D D D D D D D D D D D D D D D D D D D D D D D D D D D D D D D
D D D D D D D D D D D D D D D D D D D D D D D D D D D D D D D D D D D D D D D D D D D D D D D D D D D D D D D D D D D D D D D
D D D D D D D D D D D D D D D D D D D D D D D D D D D D D D D D D D D D D D D D D D D D D D D D D D D D D D D D D D D D D D D
D D D D D D D D D D D D D D D D D D D D D D D D D D D D D D D D D D D D D D D D D D D D D D D D D D D D D D D D D D D D D D D
D D D D D D D D D D D D D D D D D D D D D D D D D D D D D D D D D D D D D D D D D D D D D D D D D D D D D D D D D D D D D D D
D D D D D D D D D D D D D D D D D D D D D D D D D D D D D D D D D D D D D D D D D D D D D D D D D D D D D D D D D D D D D D D
D D D D D D D D D D D D D D D D D D D D D D D D D D D D D D D D D D D D D D D D D D D D D D D D D D D D D D D D D D D D D D D
D D D D D D D D D D D D D D D D D D D D D D D D D D D D D D D D D D D D D D D D D D D D D D D D D D D D D D D D D D D D D D D
D D D D D D D D D D D D D D D D D D D D D D D D D D D D D D D D D D D D D D D D D D D D D D D D D D D D D D D D D D D D D D D
D D D D D D D D D D D D D D D D D D D D D D D D D D D D D D D D D D D D D D D D D D D D D D D D D D D D D D D D D D D D D D D
D D D D D D D D D D D D D D D D D D D D D D D D D D D D D D D D D D D D D D D D D D D D D D D D D D D D D D D D D D D D D D D
D D D D D D D D D D D D D D D D D D D D D D D D D D D D D D D D D D D D D D D D D D D D D D D D D D D D D D D D D D D D D D D
D D D D D D D D D D D D D D D D D D D D D D D D D D D D D D D D D D D D D D D D D D D D D D D D D D D D D D D D D D D D D D D
D D D D D D D D D D D D D D D D D D D D D D D D D D D D D D D D D D D D D D D D D D D D D D D D D D D D D D D D D D D D D D D
D D D D D D D D D D D D D D D D D D D D D D D D D D D D D D D D D D D D D D D D D D D D D D D D D D D D D D D D D D D D D D D
D D D D D D D D D D D D D D D D D D D D D D D D D D D D D D D D D D D D D D D D D D D D D D D D D D D D D D D D D D D D D D D
D D D D D D D D D D D D D D D D D D D D D D D D D D D D D D D D D D D D D D D D D D D D D D D D D D D D D D D D D D D D D D D
D D D D D D D D D D D D D D D D D D D D D D D D D D D D D D D D D D D D D D D D D D D D D D D D D D D D D D D D D D D D D D D
D D D D D D D D D D D D D D D D D D D D D D D D D D D D D D D D D D D D D D D D D D D D D D D D D D D D D D D D D D D D D D D
D D D D D D D D D D D D D D D D D D D D D D D D D D D D D D D D D D D D D D D D D D D D D D D D D D D D D D D D D D D D D D D
D D D D D D D D D D D D D D D D D D D D D D D D D D D D D D D D D D D D D D D D D D D D D D D D D D D D D D D D D D D D D D D
D D D D D D D D D D D D D D D D D D D D D D D D D D D D D D D D D D D D D D D D D D D D D D D D D D D D D D D D D D D D D D D
D D D D D D D D D D D D D D D D D D D D D D D D D D D D D D D D D D D D D D D D D D D D D D D D D D D D D D D D D D D D D D D
D D D D D D D D D D D D D D D D D D D D D D D D D D D D D D D D D D D D D D D D D D D D D D D D D D D D D D D D D D D D D D D
D D D D D D D D D D D D D D D D D D D D D D D D D D D D D D D D D D D D D D D D D D D D D D D D D D D D D D D D D D D D D D D
D D D D D D D D D D D D D D D D D D D D D D D D D D D D D D D D D D D D D D D D D D D D D D D D D D D D D D D D D D D D D D D
D D D D D D D D D D D D D D D D D D D D D D D D D D D D D D D D D D D D D D D D D D D D D D D D D D D D D D D D D D D D D D D
D D D D D D D D D D D D D D D D D D D D D D D D D D D D D D D D D D D D D D D D D D D D D D D D D D D D D D D D D D D D D D D
D D D D D D D D D D D D D D D D D D D D D D D D D D D D D D D D D D D D D D D D D D D D D D D D D D D D D D D D D D D D D D D
D D D D D D D D D D D D D D D D D D D D D D D D D D D D D D D D D D D D D D D D D D D D D D D D D D D D D D D D D D D D D D D
D D D D D D D D D D D D D D D D D D D D D D D D D D D D D D D D D D D D D D D D D D D D D D D D D D D D D D D D D D D D D D D
D D D D D D D D D D D D D D D D D D D D D D D D D D D D D D D D D D D D D D D D D D D D D D D D D D D D D D D D D D D D D D D
D D D D D D D D D D D D D D D D D D D D D D D D D D D D D D D D D D D D D D D D D D D D D D D D D D D D D D D D D D D D D D D
D D D D D D D D D D D D D D D D D D D D D D D D D D D D D D D D D D D D D D D D D D D D D D D D D D D D D D D D D D D D D D D
D D D D D D D D D D D D D D D D D D D D D D D D D D D D D D D D D D D D D D D D D D D D D D D D D D D D D D D D D D D D D D D
D D D D D D D D D D D D D D D D D D D D D D D D D D D D D D D D D D D D D D D D D D D D D D D D D D D D D D D D D D D D D D D
D D D D D D D D D D D D D D D D D D D D D D D D D D D D D D D D D D D D D D D D D D D D D D D D D D D D D D D D D D D D D D D
D D D D D D D D D D D D D D D D D D D D D D D D D D D D D D D D D D D D D D D D D D D D D D D D D D D D D D D D D D D D D D D
D D D D D D D D D D D D D D D D D D D D D D D D D D D D D D D D D D D D D D D D D D D D D D D D D D D D D D D D D D D D D D D
D D D D D D D D D D D D D D D D D D D D D D D D D D D D D D D D D D D D D D D D D D D D D D D D D D D D D D D D D D D D D D D
D D D D D D D D D D D D D D D D D D D D D D D D D D D D D D D D D D D D D D D D D D D D D D D D D D D D D D D D D D D D D D D
D D D D D D D D D D D D D D D D D D D D D D D D D D D D D D D D D D D D D D D D D D D D D D D D D D D D D D D D D D D D D D D
D D D D D D D D D D D D D D D D D D D D D D D D D D D D D D D D D D D D D D D D D D D D D D D D D D D D D D D D D D D D D D D
D D D D D D D D D D D D D D D D D D D D D D D D D D D D D D D D D D D D D D D D D D D D D D D D D D D D D D D D D D D D D D D
D D D D D D D D D D D D D D D D D D D D D D D D D D D D D D D D D D D D D D D D D D D D D D D D D D D D D D D D D D D D D D D
D D D D D D D D D D D D D D D D D D D D D D D D D D D D D D D D D D D D D D D D D D D D D D D D D D D D D D D D D D D D D D D
D D D D D D D D D D D D D D D D D D D D D D D D D D D D D D D D D D D D D D D D D D D D D D D D D D D D D D D D D D D D D D D
D D D D D D D D D D D D D D D D D D D D D D D D D D D D D D D D D D D D D D D D D D D D D D D D D D D D D D D D D D D D D D D
D D D D D D D D D D D D D D D D D D D D D D D D D D D D D D D D D D D D D D D D D D D D D D D D D D D D D D D D D D D D D D D
D D D D D D D D D D D D D D D D D D D D D D D D D D D D D D D D D D D D D D D D D D D D D D D D D D D D D D D D D D D D D D D
D D D D D D D D D D D D D D D D D D D D D D D D D D D D D D D D D D D D D D D D D D D D D D D D D D D D D D D D D D D D D D D
D D D D D D D D D D D D D D D D D D D D D D D D D D D D D D D D D D D D D D D D D D D D D D D D D D D D D D D D D D D D D D D
D D D D D D D D D D D D D D D D D D D D D D D D D D D D D D D D D D D D D D D D D D D D D D D D D D D D D D D D D D D D D D D
D D D D D D D D D D D D D D D D D D D D D D D D D D D D D D D D D D D D D D D D D D D D D D D D D D D D D D D D D D D D D D D
D D D D D D D D D D D D D D D D D D D D D D D D D D D D D D D D D D D D D D D D D D D D D D D D D D D D D D D D D D D D D D D
D D D D D D D D D D D D D D D D D D D D D D D D D D D D D D D D D D D D D D D D D D D D D D D D D D D D D D D D D D D D D D D
D D D D D D D D D D D D D D D D D D D D D D D D D D D D D D D D D D D D D D D D D D D D D D D D D D D D D D D D D D D D D D D
D D D D D D D D D D D D D D D D D D D D D D D D D D D D D D D D D D D D D D D D D D D D D D D D D D D D D D D D D D D D D D D
D D D D D D D D D D D D D D D D D D D D D D D D D D D D D D D D D D D D D D D D D D D D D D D D D D D D D D D D D D D D D D D
D D D D D D D D D D D D D D D D D D D D D D D D D D D D D D D D D D D D D D D D D D D D D D D D D D D D D D D D D D D D D D D
D D D D D D D D D D D D D D D D D D D D D D D D D D D D D D D D D D D D D D D D D D D D D D D D D D D D D D D D D D D D D D D
D D D D D D D D D D D D D D D D D D D D D D D D D D D D D D D D D D D D D D D D D D D D D D D D D D D D D D D D D D D D D D D
D D D D D D D D D D D D D D D D D D D D D D D D D D D D D D D D D D D D D D D D D D D D D D D D D D D D D D D D D D D D D D D
D D D D D D D D D D D D D D D D D D D D D D D D D D D D D D D D D D D D D D D D D D D D D D D D D D D D D D D D D D D D D D D
D D D D D D D D D D D D D D D D D D D D D D D D D D D D D D D D D D D D D D D D D D D D D D D D D D D D D D D D D D D D D D D
D D D D D D D D D D D D D D D D D D D D D D D D D D D D D D D D D D D D D D D D D D D D D D D D D D D D D D D D D D D D D D D
D D D D D D D D D D D D D D D D D D D D D D D D D D D D D D D D D D D D D D D D D D D D D D D D D D D D D D D D D D D D D D D
D D D D D D D D D D D D D D D D D D D D D D D D D D D D D D D D D D D D D D D D D D D D D D D D D D D D D D D D D D D D D D D
D D D D D D D D D D D D D D D D D D D D D D D D D D D D D D D D D D D D D D D D D D D D D D D D D D D D D D D D D D D D D D D
D D D D D D D D D D D D D D D D D D D D D D D D D D D D D D D D D D D D D D D D D D D D D D D D D D D D D D D D D D D D D D D
D D D D D D D D D D D D D D D D D D D D D D D D D D D D D D D D D D D D D D D D D D D D D D D D D D D D D D D D D D D D D D D
D D D D D D D D D D D D D D D D D D D D D D D D D D D D D D D D D D D D D D D D D D D D D D D D D D D D D D D D D D D D D D D
D D D D D D D D D D D D D D D D D D D D D D D D D D D D D D D D D D D D D D D D D D D D D D D D D D D D D D D D D D D D D D D
D D D D D D D D D D D D D D D D D D D D D D D D D D D D D D D D D D D D D D D D D D D D D D D D D D D D D D D D D D D D D D D
D D D D D D D D D D D D D D D D D D D D D D D D D D D D D D D D D D D D D D D D D D D D D D D D D D D D D D D D D D D D D D D
D D D D D D D D D D D D D D D D D D D D D D D D D D D D D D D D D D D D D D D D D D D D D D D D D D D D D D D D D D D D D D D
D D D D D D D D D D D D D D D D D D D D D D D D D D D D D D D D D D D D D D D D D D D D D D D D D D D D D D D D D D D D D D D
D D D D D D D D D D D D D D D D D D D D D D D D D D D D D D D D D D D D D D D D D D D D D D D D D D D D D D D D D D D D D D D
D D D D D D D D D D D D D D D D D D D D D D D D D D D D D D D D D D D D D D D D D D D D D D D D D D D D D D D D D D D D D D D
D D D D D D D D D D D D D D D D D D D D D D D D D D D D D D D D D D D D D D D D D D D D D D D D D D D D D D D D D D D D D D D
D D D D D D D D D D D D D D D D D D D D D D D D D D D D D D D D D D D D D D D D D D D D D D D D D D D D D D D D D D D D D D D
D D D D D D D D D D D D D D D D D D D D D D D D D D D D D D D D D D D D D D D D D D D D D D D D D D D D D D D D D D D D D D D
D D D D D D D D D D D D D D D D D D D D D D D D D D D D D D D D D D D D D D D D D D D D D D D D D D D D D D D D D D D D D D D
D D D D D D D D D D D D D D D D D D D D D D D D D D D D D D D D D D D D D D D D D D D D D D D D D D D D D D D D D D D D D D D
D D D D D D D D D D D D D D D D D D D D D D D D D D D D D D D D D D D D D D D D D D D D D D D D D D D D D D D D D D D D D D D
D D D D D D D D D D D D D D D D D D D D D D D D D D D D D D D D D D D D D D D D D D D D D D D D D D D D D D D D D D D D D D D
D D D D D D D D D D D D D D D D D D D D D D D D D D D D D D D D D D D D D D D D D D D D D D D D D D D D D D D D D D D D D D D
D D D D D D D D D D D D D D D D D D D D D D D D D D D D D D D D D D D D D D D D D D D D D D D D D D D D D D D D D D D D D D D
D D D D D D D D D D D D D D D D D D D D D D D D D D D D D D D D D D D D D D D D D D D D D D D D D D D D D D D D D D D D D D D
D D D D D D D D D D D D D D D D D D D D D D D D D D D D D D D D D D D D D D D D D D D D D D D D D D D D D D D D D D D D D D D
D D D D D D D D D D D D D D D D D D D D D D D D D D D D D D D D D D D D D D D D D D D D D D D D D D D D D D D D D D D D D D D
D D D D D D D D D D D D D D D D D D D D D D D D D D D D D D D D D D D D D D D D D D D D D D D D D D D D D D D D D D D D D D D
D D D D D D D D D D D D D D D D D D D D D D D D D D D D D D D D D D D D D D D D D D D D D D D D D D D D D D D D D D D D D D D
D D D D D D D D D D D D D D D D D D D D D D D D D D D D D D D D D D D D D D D D D D D D D D D D D D D D D D D D D D D D D D D
D D D D D D D D D D D D D D D D D D D D D D D D D D D D D D D D D D D D D D D D D D D D D D D D D D D D D D D D D D D D D D D
D D D D D D D D D D D D D D D D D D D D D D D D D D D D D D D D D D D D D D D D D D D D D D D D D D D D D D D D D D D D D D D
D D D D D D D D D D D D D D D D D D D D D D D D D D D D D D D D D D D D D D D D D D D D D D D D D D D D D D D D D D D D D D D
D D D D D D D D D D D D D D D D D D D D D D D D D D D D D D D D D D D D D D D D D D D D D D D D D D D D D D D D D D D D D D D
D D D D D D D D D D D D D D D D D D D D D D D D D D D D D D D D D D D D D D D D D D D D D D D D D D D D D D D D D D D D D D D
D D D D D D D D D D D D D D D D D D D D D D D D D D D D D D D D D D D D D D D D D D D D D D D D D D D D D D D D D D D D D D D
D D D D D D D D D D D D D D D D D D D D D D D D D D D D D D D D D D D D D D D D D D D D D D D D D D D D D D D D D D D D D D D
D D D D D D D D D D D D D D D D D D D D D D D D D D D D D D D D D D D D D D D D D D D D D D D D D D D D D D D D D D D D D D D
D D D D D D D D D D D D D D D D D D D D D D D D D D D D D D D D D D D D D D D D D D D D D D D D D D D D D D D D D D D D D D D
D D D D D D D D D D D D D D D D D D D D D D D D D D D D D D D D D D D D D D D D D D D D D D D D D D D D D D D D D D D D D D D
D D D D D D D D D D D D D D D D D D D D D D D D D D D D D D D D D D D D D D D D D D D D D D D D D D D D D D D D D D D D D D D
D D D D D D D D D D D D D D D D D D D D D D D D D D D D D D D D D D D D D D D D D D D D D D D D D D D D D D D D D D D D D D D
D D D D D D D D D D D D D D D D D D D D D D D D D D D D D D D D D D D D D D D D D D D D D D D D D D D D D D D D D D D D D D D
D D D D D D D D D D D D D D D D D D D D D D D D D D D D D D D D D D D D D D D D D D D D D D D D D D D D D D D D D D D D D D D
D D D D D D D D D D D D D D D D D D D D D D D D D D D D D D D D D D D D D D D D D D D D D D D D D D D D D D D D D D D D D D D
D D D D D D D D D D D D D D D D D D D D D D D D D D D D D D D D D D D D D D D D D D D D D D D D D D D D D D D D D D D D D D D
D D D D D D D D D D D D D D D D D D D D D D D D D D D D D D D D D D D D D D D D D D D D D D D D D D D D D D D D D D D D D D D
D D D D D D D D D D D D D D D D D D D D D D D D D D D D D D D D D D D D D D D D D D D D D D D D D D D D D D D D D D D D D D D
D D D D D D D D D D D D D D D D D D D D D D D D D D D D D D D D D D D D D D D D D D D D D D D D D D D D D D D D D D D D D D D
D D D D D D D D D D D D D D D D D D D D D D D D D D D D D D D D D D D D D D D D D D D D D D D D D D D D D D D D D D D D D D D
D D D D D D D D D D D D D D D D D D D D D D D D D D D D D D D D D D D D D D D D D D D D D D D D D D D D D D D D D D D D D D D
D D D D D D D D D D D D D D D D D D D D D D D D D D D D D D D D D D D D D D D D D D D D D D D D D D D D D D D D D D D D D D D
D D D D D D D D D D D D D D D D D D D D D D D D D D D D D D D D D D D D D D D D D D D D D D D D D D D D D D D D D D D D D D D
D D D D D D D D D D D D D D D D D D D D D D D D D D D D D D D D D D D D D D D D D D D D D D D D D D D D D D D D D D D D D D D
D D D D D D D D D D D D D D D D D D D D D D D D D D D D D D D D D D D D D D D D D D D D D D D D D D D D D D D D D D D D D D D
D D D D D D D D D D D D D D D D D D D D D D D D D D D D D D D D D D D D D D D D D D D D D D D D D D D D D D D D D D D D D D D
D D D D D D D D D D D D D D D D D D D D D D D D D D D D D D D D D D D D D D D D D D D D D D D D D D D D D D D D D D D D D D D
D D D D D D D D D D D D D D D D D D D D D D D D D D D D D D D D D D D D D D D D D D D D D D D D D D D D D D D D D D D D D D D
D D D D D D D D D D D D D D D D D D D D D D D D D D D D D D D D D D D D D D D D D D D D D D D D D D D D D D D D D D D D D D D
D D D D D D D D D D D D D D D D D D D D D D D D D D D D D D D D D D D D D D D D D D D D D D D D D D D D D D D D D D D D D D D
D D D D D D D D D D D D D D D D D D D D D D D D D D D D D D D D D D D D D D D D D D D D D D D D D D D D D D D D D D D D D D D
D D D D D D D D D D D D D D D D D D D D D D D D D D D D D D D D D D D D D D D D D D D D D D D D D D D D D D D D D D D D D D D
D D D D D D D D D D D D D D D D D D D D D D D D D D D D D D D D D D D D D D D D D D D D D D D D D D D D D D D D D D D D D D D
D D D D D D D D D D D D D D D D D D D D D D D D D D D D D D D D D D D D D D D D D D D D D D D D D D D D D D D D D D D D D D D
D D D D D D D D D D D D D D D D D D D D D D D D D D D D D D D D D D D D D D D D D D D D D D D D D D D D D D D D D D D D D D D
D D D D D D D D D D D D D D D D D D D D D D D D D D D D D D D D D D D D D D D D D D D D D D D D D D D D D D D D D D D D D D D
D D D D D D D D D D D D D D D D D D D D D D D D D D D D D D D D D D D D D D D D D D D D D D D D D D D D D D D D D D D D D D D
D D D D D D D D D D D D D D D D D D D D D D D D D D D D D D D D D D D D D D D D D D D D D D D D D D D D D D D D D D D D D D D
D D D D D D D D D D D D D D D D D D D D D D D D D D D D D D D D D D D D D D D D D D D D D D D D D D D D D D D D D D D D D D D
D D D D D D D D D D D D D D D D D D D D D D D D D D D D D D D D D D D D D D D D D D D D D D D D D D D D D D D D D D D D D D D
D D D D D D D D D D D D D D D D D D D D D D D D D D D D D D D D D D D D D D D D D D D D D D D D D D D D D D D D D D D D D D D
D D D D D D D D D D D D D D D D D D D D D D D D D D D D D D D D D D D D D D D D D D D D D D D D D D D D D D D D D D D D D D D
D D D D D D D D D D D D D D D D D D D D D D D D D D D D D D D D D D D D D D D D D D D D D D D D D D D D D D D D D D D D D D D
D D D D D D D D D D D D D D D D D D D D D D D D D D D D D D D D D D D D D D D D D D D D D D D D D D D D D D D D D D D D D D D
D D D D D D D D D D D D D D D D D D D D D D D D D D D D D D D D D D D D D D D D D D D D D D D D D D D D D D D D D D D D D D D
D D D D D D D D D D D D D D D D D D D D D D D D D D D D D D D D D D D D D D D D D D D D D D D D D D D D D D D D D D D D D D D
D D D D D D D D D D D D D D D D D D D D D D D D D D D D D D D D D D D D D D D D D D D D D D D D D D D D D D D D D D D D D D D
D D D D D D D D D D D D D D D D D D D D D D D D D D D D D D D D D D D D D D D D D D D D D D D D D D D D D D D D D D D D D D D
D D D D D D D D D D D D D D D D D D D D D D D D D D D D D D D D D D D D D D D D D D D D D D D D D D D D D D D D D D D D D D D
D D D D D D D D D D D D D D D D D D D D D D D D D D D D D D D D D D D D D D D D D D D D D D D D D D D D D D D D D D D D D D D
D D D D D D D D D D D D D D D D D D D D D D D D D D D D D D D D D D D D D D D D D D D D D D D D D D D D D D D D D D D D D D D
RICHMO
NDSAN PABLO
SAN PABLO
RIC
HM
ON
D
SAN PABLO
SAN
PABLO
RIC
HM
ON
D
RICHMOND
SAN PABLO
SAN
PAB
LO
RIC
HM
ON
D
RICHMOND
SAN PABLO
C.C
.C.
SAN
PA
BLO
RIC
HM
ON
D
RICHMOND
SAN PABLO
SAN
PA
BLO
RIC
HM
ON
D
NA
2801
NA
2775NA
A.T.
& S
.F. R
.R. R
/W
GIA
NT
RD
SAN PABLO CREEK
GIA
NT
RD
19TH
ST
18TH
ST
ST ST
AVE
SANFORD AVE.
REGINA
17891757
NA
1665
1527
1621
1509
1503
1621
1533
1200
1441
NA
1405
1375
1303
1343
1411
NA
1309
1321
1329
1203
1334
1212 NA
13171318
1314
1301-09
1327
1159
1145
1250
1240
1230
1200
1260 1291
1148
NA
1320
1336
1340
1415
1405
-07
1327
1317
1160
1141
1370
1498
1488
1425
1500
1510
1518
1606
1614
1616
1133
1617
1613
1605
1515
1509
1140
1621
1526
1530
1610
1531
1608
1700
1708
1710
1714
1716 NA
1720
1722 17
92
1197
1767
1763
1755
1747
1741
1735
1721
1719
1711
1701
1800
1814
1818
1850
1900
1908
1914
1984
1988
1990
1939
1929
1921
1915
1907
1835
1827
1817
1811
1801
2004
2016
2018
2026
2100
2108
2112
2134
2138
2140
2190
2200 1183
1173
1167
2209
2201
2135
2125
2117
2109
2101
2033
2029
2019
2011
1144 NA
NA
2000
2010
2012
2024
2100
2104
2120
2124
2136
2226
2232
2234 1229
NA1217
1203-13
2227
2207
2143
2139
2127
2121
2115
2027
2025
2009
2003
2001
1800
1810
1818
1826
1834
1908
1912
1922
1930
12131211
1999
1937
1927
1917
1903
1827
1817
1811
1801
2000
2010
2020
2050
2100
2106
2112
2116
2130
2126
2134
2206
2212
2216
12651249
1247
1249124922
3322
31
2215
2211
2199
2123
2117
2113
2105
2101
2025
2019
2009
1254
2045
NA
2039
2001
2005 1305
NA
2215
2211
2207
2137
2131
2125
2119
NA
2109
2103
1949
1943
1935
1923
1919
1905
1901
1306
1819
1825
1805
1801
1806
1810
1818
1826
1900
1904
1916
1928
1932 1279
1265
1939
1933
1925
1915
1911
1905
1835
1827
1825
1823
1809
1803
17771202
1208
12161220
12301240
1252
1260
12661272
1278128412
90145314
45
1439
1431
1421
1411
1401
129112871283
1277
12711265
1259
1251
1241
1349
1341
1331
1325
1315
1307
1318
1310
14991200
1304
1312
1322
1328
1338
1346
1356
1402
1408
1418 14
28
1438
1207
1347
1325
1335
1345
NA
123114351220
1240
1250
1256
1264
1270
12761430
1275
1269
1263
1257
1251
1241
1330
1422
1426
1314
1326
1320
NA
13201305
1305130513051305130513051305
13051305130513051305130513051305 13
2913
1513
3713
4113
5113
6114
0914
1514
2114
2714
9814
2014
1414
1214
0414
0013
2813
3613
34
1432
1502
1508
1516
1524
1528
1536
1540
1544
1614
1618
1622
1632 NA
1627
1625
1621
1615
1613
1611
1609
1607
1605
1533
1529
1525
1521
1515
1509
1501
1500
1504
1514
1528
1532
1536
1540
1618
1624
1630
1520
1524
1612
1600
1702
1708
1718
1722
1724
1726
1736
1754
1820
1818
1822N
A17
50
1825
1805
1801
1753
1747
1745
1739
1723
1721
1715
1713
1705
1700
1706
1720
1722
1734
1736
1800
1808
1814
1816
1754
1748
1744
1738
1726
1900
1910
1920
1924
1928 NA
1934
2000
2002
2090
2092
2094
2096
2098
1349134520
21
2011
NA1923
1917
1915
1913
1911
1909
1907
1901
1900
1912
1914
1916
1922
1930
1938
1944
2002
2004
2010
2020
2022
2024
2015
2013
1939
2104
2106
2108
2118
2126
2128
2132
2214
2216
2200
2140 1321
1357NA
2225
2217
2213
2211
NA2133
2127
2125
2117
2107
-13
2105
2101
2100
2110
2112
2132
2208
2212 1371
2122 NA
2215
2207
2207
2205
2133
2203
2201
2115
2109
2101
2100
2134
2136
2200
2216 1439
2204
1405
2110
1425
NA
2118
2029
2015
2011
2005
2001
1953
1941
1935
1929
1923
1919
1913
1909
1901
1900
1916
1924
1932
1938
1944
2006
2010
2016
2024
2028
1912
2019
2023
2000
1817
1813
1807
1755
1751
1745
1743
1735
1725
1723
1721
1717
1713
1701
1700
1708
1712
1718
1724
1730
1740
1742
1800
18081425
1782
1762
1629
1630
1626
1622
1616
1606
1600
1540
1538
1536
1524
1510
1508
1506
1500
1501
1509
1513
1525
1527
1529
1531
1533
1601
1609
1613
1619
1621
1411
1452
1302
1424
1420
1414
1408
1404
1340
1338
1336
1332
1326
1316
1472
1454
1484
1321
NA
1311
1327
1329
1401
1491
1493
1499
15171515
1509141514
05-0
714
01-0
313
3913
3713
3513
3313
31
1532
1550
1400
1404
1524
1318
1522
1542
1338
1340
1408
1617
1613
1605
1601
1541
1537
1540
1529
1521
1507
1512
15161524
1522
1528
1533
1536
15051631
15081503
1652
NA
1320
1328
1637
1627162316171600
1327
1610
1620
1645
16491634
1640
1646
1631
1400
1410
1414
1432
16571645164316291625
16151609
1421
16081606
16141620
16261632
16401646
1621
1650
1528
1530
1643
1629162316051603160115
231501
16141620
16281630
16401648
1641
1542
1540
1602
1604
1606
1608
1610
1527-291521
1604
1606
1608
1634
16401642
1617
1623
1531
1535
1601
1615
1600
1602
1724171617081700
1611
1707
1709
1620
1724171017081704
1725
1727
1539
NA
1412171217061700
17011709
17151733
1732171817121700
17011709
1715
1723
1608
1616
NA
17391737
1750174817461740
1621
1753
1761
1524
1526
1753175517491737
1736
1752
1506
1418
1420
1424
NA
175517531747173714
131736
1750
1760
1746
1780
1770
1300
17611753
1752
1742
NA
1737-391745
1810
1713
1703
1700
1714
1721
1724
1727
1729
1731
1804
1802
1800
1816N
A18
1718
1118
0117
4917
4317
3717
2917
2317
1717
1117
01
1706
1706
1710
1716
1726
1734
1800
1810
1740
1746
1712
1727
2029
2021
2017
2009
2001
1949
1933
1929
1925
1921
1911
1724 NA
1900
NA
1912
1922
1928
1930
1934
1946
2000
2010
2016
2024
2030
1901
NA2001
1947
NA
1929
1927
1923
1917
1911
1600
1900
1910
1916
1928
1934
1944
1948
2000
2004
2006
1922
20171817
1811
1801
1749
1743
1735
1729
1727
1719
1713
1701
1640
1710
1716
1722
1728
1736
1740
1748
1800
1810
1817
1809
1743
1737
1725
1723
1719
1707
1500
1702
1708
1716
1726
1732
1738
1744
1750
1800
1810
1807
1803
1627
15172021
2019
2011
2003
1945
1939
1933
1927
1919
1900
1908
1916
1922
1942
1948
2000
2010 1527
1915
1510
2018
2024
1934
1928
2200
2138
2134
21291708
2100
2110
2118
2122
2130
1700 NA 22
1822
1722
0922
0121
3521
3321
2921
27
2101
2100
2110
2114
2116
2118
2136
2142
2220
2222 1637
16131607
16012109
2125
-28
2210
2200
2213
2209
2201
2137
2135
2119
2113
2109
2101
2100
2136
2142
2200
2210
2212 1529
1521
151515071503
2114 NA
2120
23R
D S
T
SANFORD AVE
FILL
MO
RE
ST
RU
MR
ILL
BLV
D S. VICTORIA CT
W. V
ICTO
RIA
CT
N. VICTORIA CT
E. V
ICTO
RIA
CT
SUTTER AVE
BUSH AVE
PINE AVE
21S
T S
T
EMERIC AVE
CALIFORNIA AVE
ALFREDA BLVD
WILCOX AVE
SANFORD AVE
20TH
ST
20TH
ST
WILCOX AVE
SANFORD AVE
COSTA AVE
18TH
ST
ALFREDA BLVD
CALIFORNIA AVE
EMERIC AVE
19TH
ST
21S
T S
T
17TH
ST
15TH
ST
CALIFORNIA AVE
EMERIC AVE
PINE AVE
BUSH AVE
PINE AVE
BUSH AVE
SUTTER AVERU
MR
ILL
BLV
D
14TH
ST
15TH
ST
16TH
ST
17TH
ST
SUTTER AVE
POST AVE
POST AVE
19TH
ST
MARKET AVE
MARKET AVE
COSTA AVECOSTA AVE
23R
D S
T
CHESLEY AVE
1914
21 S
T ST
AVE
DOVER
12511239
122512
19121312
07
21802190
22002210
22202230
900
906
910
914
NA
918
NA
922
921
91791
3909
905901
1000
1010
1014
1020
1024
1030
1036
1044
1052
1058
111110
51104310
331029102310
17101310051000
1010
1012
1020
1024
1030
1036
1044
1052
123012
00
2001
1150
NA
2141
NA
2025
2031
2037
NA
NA
NA
18311801
1841
1333NA
18301820
18191829
1835NA
1833NA
1819
143314
2514
01
1816
1824
1832
1412
152218411835
182718191801
1523
151515
07
18161818
1832 1510
1841183318271821
1623
1815
1601
1816
1828
18341842
1612
1617
1613
18811873
18611855
18761872
1852
1864
1850
1872NA
188118731865
1529
1521
1872
-02
1879
NA
1852
18751865
1852
1868 1328
18731861
133313
21
1700
187418691864
1858185418471836
1831
18291827
1701
NA1873
1712
1879
1824-26
1828
1874
1890 NA
1728
1732
1736
1740
18771875187118651859
1855185118451841
1839NA
18251823
173717
2317
17
1729
18601830
1818182418301834
185018541858
18641872
18781886 18
0618
1418
2018
26
18771869
1865
183318291823NA
1829181918
0118
11-2
1
1844
18491857
18391845 1870
NA
2100
2110
2114
2118
2132
1879
2133
2125
NA
18561854
2122
2126
1824
182018261830NA1842184818541858
186818721876
-84 2208
2216
2218
18851885
NA
18351831
2205
2201
1841
1873
NA 1832
18361842
1848
1862
1864186618761890 23
1623
28
1865-7518591851
18471837
183118231821
1820
1850
1874
1884
1890
2346
2362
2368
2376
18751865
1859185518511847
18351829
18271811
2373
2371
236523
41
18641854
18421828
1820182618301842
NA18501858
18681878
2400
2410
2418
2422
18711867
18631853
18491843
183718271821
2433
NANA2419
NA
1808-14
2428
2434
1820
1826183018361846
18501854
186418721876
2500
2508
2512
2516
2522
2528
2532
18751865
18591855
18471841
1837183518231821
2531
2529
2527
2525
2515
2503
1814
2635
NANA2615
2611
2601
182618301834184018441848
18681874
2600
2608
2614
2622
2628
2632
2634
NA
1825NA
1822
18581862
NA
1917
2707
19361944
19241920
1943
NA
1901
19411937
1909
2621
261319
00
1920
1930
1962
1972
19361926
19271921
1975
19671963195919491929
19271925
253325
152509
2501
19381940
194819541958196419661970
1976
2525
1989
19691963
19531947
19451937
2435
2431
2427
24232415
24112401
1932
1940
1950195419581964
1968
1976NA
1983
1985
1935
NA2371
2367
2363
2359
2353
2347
1936193619461950
1998
1970
1980
1966
1976
1956
1943
19791971-75
19611959
1951
1990
1989
1949
-15
2329
2323
2319
NANA
1960NANA1982
NANA
1979
1985
1963
20011993
20062012
19371943
NA -12
198719791971NA1961
1949
NA
1927222922
152211
2201
1936NA1940
1964
19741948
198419881994
199820002002
20142022
2030
20342044
2013
1942
1944
2001
2033
203120192011-13
2001
197919751971
1961
195319451939NA
2133
212721
09
1936
19701974
1978
19881990
1998
2000
2016
2036
2040
2044
20482037
19461940
1964195819541950
-092005
2101
2105
2123
19951999
20122006
20432035
20252021
2013
20051997
19871981197519711965
195719531951194919471945
NA2025
2023
2017
1924
194019481950
19521954
1958
1984
198819921996
1998
2010
20242028203420382042
2050
2053
1989
2056
20142018
1900
2011
20292023NA
20112001199919971995
1985
19711969
19591949
1947194319391935
1933
193119
231915
1901
NA1962
1972
1976
198019861988
19982000
20162020
2024
19441942
1950NA
2033
200720051999
1997
19871977
19711965
196319531949194319391935
18252347
1815
1934193819421948195219581962
19661980
1982
1986
2000
2015
19941992
1813
19991997
19871983
196519591945
194319391935
1759
175117
43
1735
1731
1936
19421950
1958196219661974
1980NA19881994NA
19731971
NA1993
19891985
19691963
19431939
NA
171517
01
19771974
194819491955
1972
1655
19641965
19571953
19491939
1921
1619
1918
1920
1930
1938
1952
1958
1944
1601
1611
19651955
1945
19271923
191919021908
1914
1926
1932
1938
1944
1952
1958
1958
1511
1519
1533
1525
19371935
1962-41965
19571951
19431931
19311931
19211911
143314
251415
14111401
1924
1932
1936
1942
1952
195619511941
19391935
1353
1323
1940
1942
1964
1934
1938
1920
1301
1305
1309
1313
1317
1919
151115
07
150114771465
145314411427141314
01
134313
29
1970
1313
NA
2012
1304
1324
1334
1346
1410
1422
1430
1442
1450
1460
1470
14821490
1500
1520
1530
1540
1600
1610
1620
1630
1640
1652
1352 1422
1436
1495
1485143314
21
1336
1305
2114
2126
2140
1300
13121324
13361400
1412
1424
1436
1551
1501143314
211411
1381
1371
13631355
13451335
1552 1510
1520
1530
1540
1600
1610
1620
1630
1640
1683
1695
1641163116
21161116
01154115
31152115
11
1502
16011605
2210
2220
2230
2240
22502260
2265
2255
224522352225
22152205
159515
21151515
111445
133513
31
2210
2220
2230
2240
2250
2260
2270 1300
1308
1314
1318
1324
1330
1336
1342
NA17
20
1724
1764
1772
1776
1780
1804
1808
1341
1447
1345
1301
1305
1327
NA
1666
1674
16821698 17
1217
24
1736
1800
1820
1830
1900
1912
1922
1934
1946
1958
2000
2012
2024
2036
2048
2050
1974
193319211911
1914
1969
1961195519
4919
431939
1931
19251919
1909
1811
180117
33
172117
1117
011699
2007
2021
NA
NA
NA
2060
2025
NANA
NA
NA
NA
NANA
2090
2395
1411
7
2100
20802040
2022 2133
242124
09
2101 NA21082102
1396
51399
32135
NA
2433
2435
2437
2439
2115
2429
2431
2425
242724
0024
06
2426
2432
2450
20372033
242224
18
244624
40
2401
2403
2405
2407
2409
2411
2413
2415
2417
2419
2421
2423
2425
2427
2000
2026
2032
2031
20222006 2023
-50
NA
2402
NA
1390
1
1392
1-29
5
NA1
24992451
NA2425
2635
NA
1390
0
1390
8
NA
2405
2411
1388
0
1383
0
2215
NA
1392
81395
6
1400
81400
01402
0
1396
8
1-60
2011-31
ROAD 20
MARKET ST
RANDY LN
BARBARA LN
BROOKSIDE DR
RUM
RILL
BLV
D
MANOR DRMAR
ELIA
CT
MANOR DR
MANOR DR
BROOKSIDE DR
ROAD 20
REGELLO CT
BROOKSIDE DR
SAN PABLO AVE
UNIVERSITY AVE
STANDARD AVE
MASON ST
VAN N
ESS ST
23R
D S
T
23R
D S
T
POW
ELL
ST
22N
D S
T
21ST
ST
20TH
ST
19TH
ST
TYLE
R S
T
17TH
ST
18TH
ST
19TH
ST
PULL
MAN
ST
DO
DSO
N S
T
PULL
MAN
ST
VAN
NES
S S
T
MAS
ON
ST
DOVER AVE
DOVER AVE
POW
ELL
ST
TYLE
R S
T
18TH
ST
19TH
ST
DOVER AVE
17TH
ST
16TH
ST
15TH
ST
14TH
ST
FOLSOM AVE
MISSION AVE
GIA
NT
RD
22N
D S
T
CHURCH LN
CHURCH LN
MARKET AVE
MARKET AVE
1900-1910
1849-1883
19501946
A.T.
& S
.F.
BRO
OKH
AVEN
CT
WILDCAT CREEK
1871
IOLA AVE
JAMES AVE
SHIRLEY AVEBEVERLEY AVE
KATHLEEN AVE
CT
SHE
FFIE
LD
KELL
EY
AVE
O'H
ARE
AVE
DR
AVE
MAN
CH
ESTE
R
BAKER ST
989
1011
1015
1025
24252435
24452455
24652475
2485
1013
1023
1033
2493
901
919
2496
2494
2488
24822476
24702464
2452
2446
2449
24532465
24772489
24902478
24662454
24422430
1069
1125
NA
1101
1013
1014 25292515
NA2501
2541255310
09
1002
1004
920
924
NA
958
1004
1024
1034
104010
16
946
94091
6
930NA90
0
935
933
2680
911
919
929
933
941
2666
945
1011
959
1019
1021
1031
1039
2502
2518
2542
2552
25602600
2618
1108
1116
1124
2610
1210
12002650
1201
1205 12
0712
11112111
0111
09
1123
28322812
294729432933
2911
2905
290929091/2
1120
29152907
2901
29002906
29162930
1110
1240
2802
1000
1006
28892885
28732867
28612855
2849
28252819
28012815
28262818
2810
28272829
980
2800280428082812
28182820
28302840
28562862
28662874
28822892
28732865
28472841
2843283928312817
2813
28092805
28242828
1130
NANA
2772NA
1000
1006
27972795
27772775
2769
27812779
27622764
27662768
2774
2798
11182797
279127812775
27712769
2745
2784
2796
2765
27382742
27602764
2768NA
2772NA
27942798
27992797
277927752773
27652763
27612759
27692771
27662768
27722784
2780279427961300
1320278927852779
27712759
27552745
2741
28852881
28752865
28632853
28472849
28332827
28212817NA2801
2804
28102816
28262832
2838284028422844
28462868
28702882
1248
1324
284328372829
28212815281128092800
2808
28162820
28282838
28442862
28642866
2855
1474
NA2807
28012802
28122822
28362828
1414
2800NA15
16
1500
27992789
27872785
27792775
2769276727632759
27532747
27482754
2762276627702782
27842788
1410
2783
27452737273527312722
275027522758
27622766
277027782782
27862790
1500
27632759
27232717
2777
1628
1628
NA274927432739
NA27072706
27002726
27282732
27522754
2768
1618
2780
1700
1728
2729272527232721
NA
27342738
2703
NA
2708
2720
1826
27092707
NA2722
2702-2706
1922
1936
2685
2689
2670
2622
2030
2020
2611
2000
2600
2116
25592547
253925312523
1941
1937
2517
2577256925652559
25472533
252525172501
25382546
25602564
NA2570
2510
25322528
25062500
2075
-77
2050
2579257125672559
25512543
2533252325152509
2501
25182526
25282546
25542566
25722578
2500
1446514461NA14451
NANA
NA1443314427
14409144012201
2508
25202524
25322542
25462554
25602570
14417
2250
14341
14301
2211
2201
2422
2457
24002412
2414
2450
14317
14395
24922482
24722462
2140
2240
14375
14345
NA
2473246324572449
2435243324252417
24132401
2404
24162428
24462450
24602464
24702476
24782488
NA 2489248524812477247324672463
24532443
24332425
241724031909
1905
23752365
2355
1907
23142322
2336
NA
1900
1910
2351
2342
23452339
23292333
1919
1929
2323
2330-2334
2306
2020
2028
23492341
23352331
2319
2009
2003
23342340
2348
23602376
2342
2320
2029
2021
2317
23652349
23432339
233123272323
2131
211721
01A
2101
2312
23362342
NA2364
23322322
14273
14237
2326
23302332
NA
2342
2348
2200
14205
142591426142491425
2300
236323572351
1780
2354
2360
2400
2406
2410
2416
2422
2428
2432
2438
2442
1750
1760
1770
2399239323872381
23752369
2465245924532449
2443243924332429
2423241724112407
24012361
23552349
2343
2337
2331
1781
2327232123152301
177317
65
2300
2306
2314
2320
2328
2334
2340
2348
2356
2360
2400
2406
2414
2420
2428
2432
2438
2617
2460
2450
1715
1721
1739
1739
1751
2435242124152407
2401236123552349
2341233523292321
231523072301
2441243524292423
24172411
2460
2466
2472
2372
2378
2384
2390
2396
2402
2408
2414
2420
2426
2432
2438
2444
2450
2456
2462
2468
2300
1825
2318
2324
2330
2336
2342
2348
2354
NA
1879
-188
9
2600
2610
2620
2930
2640
2650
2660
2670
NA
26692659
26492639
26292619
26152609
26052571
2531
2520
2532
2540
2546
2600
2610
2618
2628
26362644
2650
2658
26622668
267226802690
2670
2676
267726712665
2661265726512647
2641263526292623
2617261126072601
2585257925712565
2559255125452539
2531252325172511
2505
2671266126552647
2639263126232617
2609260125452539
2531252525192511
2501
2526
2532
2540
2546
2552
2560
2568
2574
2584
2600
2604
2608
2612
2618
2624
2632
2636
2642
2648
2652
2660
2500
2510
2518
2526
2532
2540
2548
2556
2564
2570
2578
2600
2608
2616
2624
2630
2648
2656
2664
2672
2680
2686
2690
15411531152115
111501
1400
1414
1420
1430
1440
1450
1500
1510
26812675
26692661
26512633
26252617
26092601
25792571
256525572541
2537
25312525
25152505
2520
26002606
26122614
2616
2620
26262630
26342638
2644
2648
26522656
26602666267026
762680
26702676
26542675
2661
26452641
26372633
26272621
2611
2606
26142624
26302636
26402646
2650
144114
31142114
15140914
01
269726932691
NA
2687
26832679
26752671
26672661
26552651
26472641
26372631
26252617
26112605
26012541
25312521
2509
2471
2536
251725092449
24412435
24292423
241524042414
2420
2428
24362470
24782500
25102518
2526
246524592451
24412435
24292423
24172411
2405
233923312323
23102320
23282332
23382344
24002410
24182424
24302436
2442
2501
2361
23492343
2337
2331
23272321
2315
1313
1347
134113
3513
29
23002324
23302338
23422346
23502356
23602366
23702380
1213141516171819
40393837
36353433
202122
32 31 30 29 28 27 26 25 24 23
2 3 4 5 6 7 8 9 10 11
11141516
1718
19
2122
23 24 3130
20
160162164166
168170172174
176178
182184
186188
102104
106108
110112114116
120122124126
134132130128
142140138136
150148146144
158156154152
NA
171173
179181
183185
111113115117119121
137
139
141143
145
147NA
260026
002600
2600
260026
002600
2600
260026
002600
26002600
260026
00
26002600260026
00
2600
26002600
26002600
2600
2600
2600
2600
260026
0026002600260026
00
2600
260026
00
26002600
26002600
260026002600
260026002600
26002600
26002600
2630
2100
2114
2200
2208
2216
2134
NA2232
1888
NA
2022
2028
NA
HANNON
RIVERS ST
LAKE ST
10TH
ST
11TH
ST
11TH
ST
12TH
ST
12TH
ST
13TH
ST
13TH
ST
14TH
ST
14TH
ST
LAKE ST
15TH
ST
16TH
ST
17TH
ST
18TH
ST
COLIN ST
COLIN ST
TRENTON BLVD
TRENTON BLVD
HAVILANDCT
COALPORT ST
MAC
ARTH
UR A
VE
MER
RIT
T AV
E
19TH
ST
20TH
ST
MAC
ART
HUR
AVE
CLARE ST
KELL
EY A
VE
DOUGLAS ST
FRIE
DA
CT 17
TH S
T
WES
TGAT
E C
IR
WES
TGATE
CIR
GIA
NT
RD
GIA
NT
RD
RUMRILL BLVD
RUMRILL RD
17TH
ST
18TH
ST
18TH
ST
19TH
ST
20TH
ST
MER
RIT
T AV
E
MER
RIT
T A
VE
19TH
ST
20TH
ST
RUMRILL BLVD
21ST
ST
MUIR ST
22N
D S
T20TH
ST
STONE ST
LOVEGROVE ST
21ST
ST
22N
D S
T
ROAD 20
RO
AD
20
ROAD 20
ROAD 20
ROAD 20
A.T.
& S
.F. R
.R. R
/W
BROADWAY AVE
BROADWAY AVE
BROADWAY AVE
BROADWAY AVE
GIA
NT
REDWOODCIRAVE
MESA
BUENA
LA PUERTADR
TASCO CT
SHORT AVE
HOWARDST
MADRONECT
BLVD
216121
512141
2011
2001
1951
1931
1921191111
15
2041
2031
2021
2051
2101
2111
2121
2131
2120
2130
2140
2150
2200
2210
222022
212211
205120
312021
2011
2001
1941
193119
21
1901
1930
1940
1950
2000
2010
2100
2110
2120
2130
2140
215020
4020
50
2020
2030
2010
2020
2030
21412121
2111
1614
1941
-45
1881186118711861185118
4118
3118211811
18201830
1880
1821181118011751
10
14
16
1817
15
1820
1014
16 18
1917
15
1860
1900
1910
1920
1930
1861
1801
1741
18001810
18201830
18401850
18601880
2101
206120512041
2031
20212011
20011951
1941
193119
21191119
01
1730
1731
1721
1711
185118
31182118
11
1710
1720
1730
1650
1800
1810
1820
1830
1840
1850
1860
1900
1910
1920
1930
1940
19501960
20002010
20202030
20402050
103
NA
104
2110
17411731
17211711
173117
11
1710
1720
1730
1740
17501760
18001810
11
1516
1410
175117411517
1921
2324
2220
1816
14
17111701166116
511641163116
211611
1610
1511 16
2016
30
1640
1650
1660
1670
1700
1710
1720
1730
1740
1651
1416
10
16111601
162015
151511
150114
15
140914
01
131513
11
130913
051219
1215
1209
34003401
1131
1134
1138
1200
1206
1210
1214
1300
1308
1314
1400
1410
1416
1500
1510
1517
14211415
13211319
131513
09
130512
191217
1213
1209
1205
1201
1200
1204
1208
1212
1222
1300
13181305
1243
1237
1233
1225
1217
1216
1224
1232
1236
1240
1300
1308
1312
1400
1410
1420
1426
15001518
16181622
16261632
16361642
16481652
1700
1704
1708
1710
1714
1800
1808
1810
3201
1900
1906
1910
1914
1918
1922
1926
1930
1934
1938
19403200
3206
3210
3300
3306
3310
3314
3316
193519
31192719231919191519111905182118
15
181118
05
180117
21
1717
1939
3320
1711
1617
1939
1927
1923
1919
1915
1911
1907
1901
1821
1815
1811
1805
17111707
17011649
16451639
16351629
1700
18001810
1818
1824
1836
18503305
1931
NA 192719
2319
19
1915
1909
19051901
18311819
1809 1808
1818
1900
1910
1914
1918
1922
1926
1930
3311
NA
2999
2988
2990
2992
2994
2996
2998
19331929192519
21191719
13190919
05
NA
NA2999
29972995
29932991
29892987
2983 2984
29882992
29942996
2998
1916
29972995
29932991
29892987
NANA
1121
1127112311153500
3510
3520
3524
3528
1116
1124
352735193511
35011029
10211017
1009
1005
94594
193
3
34273421
3415340934053401
1075
1071
1069
100592
391
892
493
294
094
410
0410
0810
1610
2010
28
94791
591
1
927
933
NA3420 NA
33273315
3309330510
2110
19
1015
1011
100510
0393
5925
919911
3300
914
918
926
934
940
1042
1004
1068
1070
1026
3322
11391125
34003402
3420
1104
1120
1111
1115
11321126
1125
1115
3300
3312
3318
1108
1120
1126
1132
1140
1131
1213
1201
113111
231117
32003206
1126
1210
32103208
1102
1223
1215
32293221
32133209
32051045
1011
1001
991
981
971961
951941
931
921
911901
910
960
978
980
1000
1002
1008
1020
1026
906
904
116
1022
1026 3169
31633157
31513145
1011
1015
1225
1221
121511
331129
112711
113150
31523160
3166
1118
1126
1132
1140
1214
1220
1201
120911
19
1229
122312
0512
031201
113511
211101
31263136
1114
1116
1140
1206
1208
1212
1218
1228
11191115
1127
1130
31253119
3111
1010
1014
1009
1013
3069NA
3058
30603062
1120
1122
306530693065
1216
1206
-08
3070
2951
NA
3002-60
NA2969
2945
110911
05
3054
2941
29892981
1125
30183012
3024
2925
2953NA
2985NA
29752965
296129512947
29392927
2925
2909
1205
29482958
29602960NA
2919
29322926
29422938
29902968
1291
2989
29832975
29652961
29512943
29332929
2919291113
01
2918
2926
2936
2944
2952
2968
2976
29822990
2960
2998
2903
1309
295129452937
2935
29112905
2900
2910
29182924
29362940
2950
2919
2923
29732945
29392933
2923
2906
2916
2924
2934
2944
29502970
2930
29092901
29192913NA
NANA2891
2879
2882
2886
2894
1411
2883-85
1441
28952891
28852877
2867
2853
1525
2856
2868
288428902892
28652857
1501
2876
2878
2841
2564
2893
28672861
28492841
161516
01
283428382842
28442854
2858
2864
2878
289228842880 2887
28372831
2883
28252821
28172811
1780
2885288328812873
2867
28612857
28192809
281828222826
285028582860
28801/2
288428882894
28402830
2862
1705
28372835
2877
2867
2875
28552849
2843
2817
28152805
28022812
28142830
2836
2844
28702874
2876
288228852881
1840
1800
2860285828562852
29572955
29452943
29372929
29022904
2920
2932
2940
2960
29012909
291529212908
2916
29642962 2987
29372935
29332919
29112903
29222930
2940
2966
29322932
295929582956
2944
2904
1845
29652948294229362928
2918291229062900
29152921
2927
2935
29432949
2979
2949
29522960
29722976
29612955
NANA
2946294029342928
29222916
290829002903
2909
29172925
29332939
2945
2951
28952889
28692859
28412835
2825
28192805
2810
2816
2830
2846
2852
2858
2868
28822884
28432834
2838
NA
29092909
29032015
2005
2914
2924
2958
2978
2982
2986
2833NA
2823
20952029
2800
2816
2826
2840
2846
2854
2870
28822880
2890
2843
2863
2871
2853
14771
14761
14701
14789
1480014820
2821
28132805
14700
14726
14772-788
14748
284714734
14760
14718NA
NA
14640
NA14622
NA14650
1466814660
NA
1455914501
2750NA
NA
14673NA
14655
1462014625
2724
2736
NA2746
2764
14641
27742768
146212718
2701
2024
2030
27732759
27512747
27312727
271727112705
2023NA
NANA
2001
27202726
2730
2742
27522754
2760
2776 2016
27812775
27552741
273527312737
193719
23
2742
2746
2752
2754
NA2782
1901
2736
2721
27792765
27552749
181518
03
27642776
1800
1808
1814
1835
174917
15
1245
1301
1319
1337
1355
1371
1393
1401
1409
1417
1429
3190
3184
31783166
31603152
31443138
31303126
31203114
31083100
1474
1462
1456
1448
1432
1424
1416
1410
1404
1443
1461
14021414
14261440
3165
3143
3139
31373135
3133
3131
1471
1465
1451
1433
1419
1411
3110
3122
31343146
31583170
13241318
1306
1315 1321
1329
1348
1336
13221316
13101302
13111323
1335 3141
3163
3175
31871344
1328
1312
1300
1250
2830-2830
RUMRILL
RD
DEL
CAM
INO
DR
COLLEGELN
20TH
ST
21ST
ST
LAKE ST
19TH
ST
18TH
ST
SAN
PA
BLO
AV
E
RIVERS ST
RIVERS ST
18TH
ST
19TH
ST
20TH
ST
21ST
ST
17TH
ST
16TH
ST
15TH
ST
14TH
ST
13TH
ST
12TH
ST
11 T
H S
T
STANTON AVE
CRUCERO
CT
CRUCERO AVE
ESPA
NO C
T
ACAPULCO DR
ESPANOLA DR
MANZANILLA
CT
HIDALGO CT
ESPA
NOLA D
R
ESPANILLOCT
JUAR
EZ
CT
MANZANILLA DR
11TH
ST
MINER AVE
MU
RR
A C
T
STANTON AVEJOHN AVE
STANTON AVE
PALMER AVE
LAR
CH
MO
NT
LN
MADRONE WAY
14TH
ST
PABLO VISTA AVE
MINER AVE
MO
NTA
BU
ENA
DR
WANLASS AVE
CONNECTICUT AVECONNECTICUTAVE
STONINGTON AVESTONINGTON AVE
PALMER AVE
STANTON AVE
JOHN AVE
MINER AVE
11TH
ST
SAN P
ABLO
AVE
SAN
PAB
LO A
VE
BROADWAY AVE
BROADWAY AVE
BROADWAY AVE
BROADWAY AVE
RHEEM CREEK
3001
28272833
VALE
NCIA
WAY
COLLEGELN
EASTSHORE
FREEWAY
80
EL PORTAL DR
EL PORTA
L DR
2846N
A
286028
34
2876
2697
-99
2655
NA
2645
26982690
2646
NA
2716
2732
2716
2708
2700
250023
76
14260
2364
2392
2394
2422
2600
2801
NA
2900
100
2600
2929
2600
2550
14330
14400
1448014402
2550
2390
2601
924
950
800
NA
NA14510
14520
NA
14616
14600
NA
2561-95
AUSTIN CT
DEL
CAM
INO
DR
MIS
SIO
N BE
LL D
R
SAN
PA
BLO
AV
E
EL PORTAL DR
EL POR
TAL DR
MIS
SIO
N BE
LL D
R
CASTRO RD
MORAGA ST
MO
RAG
A ST
ROAD 20
EL PORTAL DR
VILLA
DR
VILLADR
FREE
WAY
80
VENTU
RA
HU
MBO
LDT
AVE
AVE
FREEW
AY
EASTSHO
RE
80
VILLADR
MARIA VEGA C
T
1130
11401150
1160
NANA
11801175
11671161
11551145
11351125
11171103
52031100
1104
1108
1112
1116
1120
1124
1128
1132
11361137
1133
11291125
11251121
11171113
11091105
1101 1100
1120
11104948
5049
5037
4942
5021
-31
NA
4936
5036
5097
4972
1311013122
4908
5005
NA
5100
NA
49165012
50365060
1330
5310
5303
14241432
1539
1533
1529
1515
1507
1447
1441
1443
1425
52835247
14481456
15001520
5269
5261
5261
1528
3634-38
25262500
52485250
52725276
52825286
53005310
5240
5232
5224
136013701380
1501
1457
1447
1441
1433
1425
5235
5229
5221
5213
5201
14241430
1440
14461454
2400
2525
2606
2614
2620
2632
2638
NA
27262734
2808
2826
2832
2837
2825
NA
24242426
NA
2524NA
2885
2560
2428
24322510
2640 26662670
NA
27022710
27182724
2703
2699
2421
2525
2905
2913
2919
2925
2929
2933
2939
2943
2909
2522
2524
2526
2528
25302532
2534
2610
2620
13
5
7 9
108
64
2
13
57
9
11
15
17
192503
1614
64
2
NA
NA
NA2520
2601
2611
26212631
26412651
26282628
265626562648
2648A
1364
4
2914
2920
2924
293429
30
NA
2330
1374
2
NA
1372
813
717
NA13
723-2
9
NA28
42-64
NA
1900
191619141910
NA
1850
135
7911
13151719212325 2729313335
373941434547
495153555759
6163656769717375777981838587
899193959799101103105107
109111113115117119
121123
125127129
131NA
NA
2 6 1014
18222630
343842465054
586266707478
8286909498102104108112116
120124128132
150
1361
3
1368
5
2023A
2023
1350
1
1356
1
1357
7-361
3
21402000
NA
1340
11356
1
13296
13255
NA
13233
NA
NA
2089
1-76
1000
2121
1002
-1016
1002
-21
2101
NANA
NA
NA
8415
NA
NA
NA
250
1346
413
428
1332
81335
0
1335
2
NA40
50300
NA
NA
3101
3107
3111
25342522
2525
NA
OA
KWO
OD
CT
CO
NTR
A CO
STA AVE
EAST
SH
OR
E
RIDGE RD
RIDGE RD
VALE RDCHERRYW
OOD CT
WILLOW RD
SAN PABLO AVE
SAN PABLO
AVE
EVANS AVE
SAN P
ABLO D
AM RD
CO
NTR
A CO
STA AVE RIVERSIDE AVE
KIRK LN
MONTOYA AVE
BRO
OKS
IDE
CT
JOE
L C
T
GLENN AVE
VALE
RD
CHURCH LN
CHURCH LN
CHATTLETON LN (PRIVATE)
RIVERSIDE AVE NORTHARLINGTON
SHASTA
AVE
5711
1312
1306
135413
70
13301340
5650563656325628
562656065600
1300
1351
1331
5654
5660
NA
5680
1275
12311215
5421
542312001210
12201230
12421246
1283
1291
12631253
1211
5447
1253
1249
1243
1237
1231
1229
1225
1221
5624NA120412181220
125412641270
56195623
5635
1234
1234
1224
1200
12645667
1265
1261
1253
1249
1243
1237
1231
1229
1225
1219
12175663
56515643
1228123012341238
1242124612501254
57415739
1216
12201224
1230123212361240
1246
5727
5735
5430
5446
5450
11115555
5523
5441
5431
5421
5411
5401
5345
11001140
11601180
5470
5480
5490
56235631
56455647
5655
5665
5735
56655663
56535643
563356255601
5600
1140
1120
1130
5429
5421
10081026
5435
5426
55005501
5502
551755195403
5411
5521
5659
56595659
5659
56595659NA
MARIN AVE
CASINO AV
E
CASINO
AVE
GERALD AVE
SHASTA AVE
YUBA AVE
YUBA AVE
GLENN AVE
MC
BR
YDE
AVE
MARIN AVE
RIDGE RD
ALPINE
YUBA
AVE
RD
MAR
INAVE
HIL
LCR
EST
RD
RIVERSIDE AVE
CAPITOLAVE
BEAU RIVAGE
5401
NA1414
14201430
14401450
15001506
15161524
15361540
5400
5428
5434
1539
1535
1531
1527
1465
1427
5429
5425
15111459
14471455
5517
1420
1430144214741504
1510151615241530
NA
NANA
NANA
NANA
1400
NA
5531 NA
NANA
NA
146014665612
5700
NA
1505NA
5555
5549
5501
NA
5457
5451
5417
5425
1670
5433
5433AN
A
1610
2990
NA
29992923
29212905
17211717
NA
1605
1531
NA
1701
1515
1517
1724
NA
AMAD
OR
ST
13201
13139
NANA
13041
NA
13021
NA
13013
NA 129721299012996 1093
1087
1089
NA
10801090 1100
1079
10751064
10741080 5120
10751065
1064
52025210
5220
GLENN AVE
13221330
1338
1344
1346
1350
2316
NA1408
1414
1420
1424
1436 2316
1500
1516
1524
2314
2316
1544
1610-14
1616
1634
16401691 23
6423
70
2380
2388
2358
2408
2420
2430
2432
2488
2526
2532
2538
2540
1651
1680
2618
2626
2650
1646
1250
MARKET ST
23R
D S
T23
RD
ST
27TH ST
BEAU RIVAGE
BAYO
VIST
AAV
E
34013575
3255
3363NA
NA3131
NA
3415
5350
5370 5420
5442
5460
17931791
17331729
10
48
24
47
5480
-5482
3523
NA
NANA
NANA
NA NA
NA
5841
58335821
58115801
558955
53
NA5511
18021812
NANA
NA
NANA1813
18051801
549154
75
546154
455431
5415
5405
NA
1764
17701800
1810
58025820
17911771
1768
5900
5908
5918
5926
5936
5944
5954
5962
5972
5980 5990
5989
59635955
594559
3159
255917
59071792
59005902
5914 5926
5938
5950
5962
NA NA
NA
3625
NANA
NA
NA
3320
3508
35163548 3560
3550
NA
3500
34363440
3410-3420
25 2321 19 17 15
2 4 6 81012
1416
1820
2224
2628
303234
3638
404244
46485052
5456586062
5557596163 NA
53 51 49 47 45
102104
106
NA
NA
3430-3430
SAN PABLO DAM RD
HILLCREST RD
WYMAN ST
HILLCREST R
D
ALAN
CT
SAN
PA
BLO
DA
M R
D
MORROW DR
BRE
NTZ
LN
BRENTZ LN
NA
AUSTIN CT
COSTA AVECOSTA AVE
NANA
SAN
PAB
LO A
VE
SAN P
ABLO
AVE
MIS
SIO
N B
ELL
DR
1
2454
23662360
246024482436
2424
24512449
24412433
24252417
24092401
1410
1414
301-700
DOWNERSCHOOL
DOVER SCHOOL
GRANDPA'S MOBILEHOME PARK
1519-21
DOCTOR'S MEDICAL HOSPITAL
(FORMER)BECK'S CIRCLE "S"MOBILEHOMEPARK
ALVARADO MOBILEHOMEPARK
CASTLE'S MOBILEHOMEPARK
WILLOW MOBILEHOMEPARK
KJHKJH
KJHKJH
IDLE WHEELS MOBILEHOMEPARK
GERKEN'SMOBILEHOMEPARK
KIMBALL'S MOBILEHOME PARK
HELM'S JUNIOR HIGH SCHOOL
FRONTIER MOBILEHOME PARK
RIVERSIDE ELEMENTARY SCHOOL
JOHN HERBERTDAVIS PARK
CONTRA COSTA JUNIOR COLLEGE
MIDDLE COLLEGEHIGH SCHOOL
LAKE ELEMENTARYSCHOOL
BAYVIEWELEMENTARY SCHOOL
A B E L L A
D E V O N S Q U A R E
KENNEDY PLAZA
LAURIE LN (PRIVATE)
PADUA ST (PRIVATE)
ALPINE C
T
(PRIVATE)
CALIFORNIA AVE
EVERGREEN TER. (PRIVA
TE)
2230
2260
1515
14280
14270
HO
LLY
ST.
(PR
IVAT
E)(P
RIV
ATE
ST.
)
(PR
IVAT
E S
T.)
(PR
IVAT
E S
T.)
(PRIVATE ST.)
(PRIVATE ST.)
(PRIVATE ST.)
(PRIVATE ST.)
(PRIVATE ST.)
(PRIVATE ST.)
(PRIVATE ST.)
(PRIVATE ST.)
(PRIVATE )
Zoning District Map
Adopted: May 18, 2015
CITYOF SAN PABLO
LegendSan Pablo City Limit
ZoningZoning Districts
R-1 Single-Family Residential District
R-2 Two-Family Residential District
R-3 Multifamily Residential
R-4 High-Density Multifamily Residential
! ! ! ! ! ! !
! ! ! ! ! ! !
! ! ! ! ! ! !
! ! ! ! ! ! !
! ! ! ! ! ! !
RMU - Residential Mixed-Use District
NC - Neighborhood Commercial District
CR - Regional Commercial District
CMU - Commercial Mixed-Use District
IMU - Industrial Mixed-Use District
I - Institutional District
OS - Open Space District
Specific Plans
SP1 - 23rd Street Specific Plan
SP2 - San Pablo Avenue Specific Plan
Specific Plan BoundarySpecific Plans
SP1 - 23rd Street Specific Plan
SP2 - San Pablo Avenue Specific Plan
23rd Street/San Pablo Avenue Overlap
Overlay DistrictsOverlay Districts
! ! ! ! !
! ! ! ! !
! ! ! ! !
! ! ! ! !
Air Quality Health Risk Overlay
Hillside Overlay
D D D D D D D D D
D D D D D D D D D
D D D D D D D D D
D D D D D D D D D
D D D D D D D D D
Multifamily Overlay
xxx

INDEPENDENT AUDITOR’S REPORT To the Honorable Mayor and City Council City of San Pablo, California Report on Financial Statements We have audited the accompanying financial statements of the governmental activities, each major fund and the aggregate remaining fund information and discretely presented component unit of the City of San Pablo, California, as of and for the year ended June 30, 2016, and the related notes to the financial statements, which collectively comprise the City’s basic financial statements as listed in the Table of Contents. Management’s Responsibility for the Financial Statements Management is responsible for the preparation and fair presentation of these financial statements in accordance with accounting principles generally accepted in the United States of America; this includes the design, implementation, and maintenance of internal control relevant to the preparation and fair presentation of the financial statements that are free from material misstatement, whether due to fraud or error. Auditor’s Responsibility Our responsibility is to express opinions on these financial statements based on our audit. We conducted our audit in accordance with auditing standards generally accepted in the United States of America and the standards applicable to financial audits contained in Government Auditing Standards, issued by the Comptroller General of the United States. Those standards require that we plan and perform the audit to obtain reasonable assurance about whether the financial statements are free from material misstatement. An audit involves performing procedures to obtain audit evidence about the amounts and disclosures in the financial statements. The procedures selected depend on the auditor’s judgment, including the assessment of the risks of material misstatement of the financial statements, whether due to fraud or error. In making those risk assessments, the auditor considers internal control relevant to the City’s preparation and fair presentation of the financial statements in order to design audit procedures that are appropriate in the circumstances, but not for the purpose of expressing an opinion on the effectiveness of the City’s internal control. Accordingly, we express no such opinion. An audit also includes evaluating the appropriateness of accounting policies used and the reasonableness of significant accounting estimates made by management, as well as evaluating the overall presentation of the financial statements. We believe that the audit evidence we have obtained is sufficient and appropriate to provide a basis for our audit opinions. Opinions In our opinion, the financial statements referred to above present fairly, in all material respects, the respective financial position of the governmental activities, each major fund, the aggregate remaining fund information and discretely presented component unit of the City as of June 30, 2016, and the respective changes in financial position and the respective budgetary comparisons listed as part of the basic financial statements for the year then ended in conformity with accounting principles generally accepted in the United States of America.
1

Emphasis of a Matter Management adopted the provisions of the Governmental Accounting Standards Board Statement No. 72 – Fair Value Measurement and Application, which became effective during the year ended June 30, 2016 as discussed in Note 1K and 3I to the financial statements. The emphasis of this matter does not constitute a modification to our opinions. Other Matters Required Supplementary Information Accounting principles generally accepted in the United States of America require that Management’s Discussion and Analysis and the Required Supplementary Information listed in the Table of Contents be presented to supplement the basic financial statements. Such information, although not a part of the basic financial statements, is required by the Governmental Accounting Standards Board, who considers it to be an essential part of financial reporting for placing the basic financial statements in an appropriate operational, economic or historical context. We have applied certain limited procedures to the required supplementary information in accordance with auditing standards generally accepted in the United States of America, which consisted of inquiries of management about the methods of preparing the information and comparing the information for consistency with management’s responses to our inquiries, the basic financial statements, and other knowledge we obtained during our audit of the basic financial statements. We do not express an opinion or provide any assurance on the information because the limited procedures do not provide us with sufficient evidence to express an opinion or provide any assurance. Other Information Our audit was conducted for the purpose of forming opinions on the financial statements that collectively comprise the City’s basic financial statements as a whole. The Introductory Section, Supplemental Information and Statistical Section listed in the Table of Contents are presented for purposes of additional analysis and are not a required part of the financial statements. The Supplemental Information is the responsibility of management and was derived from and relates directly to the underlying accounting and other records used to prepare the financial statements. The information has been subjected to the auditing procedures applied in the audit of the financial statements and certain additional procedures, including comparing and reconciling such information directly to the underlying accounting and other records used to prepare the financial statements or to the financial statements themselves, and other additional procedures in accordance with auditing standards generally accepted in the United States of America. In our opinion, the Supplemental Information is fairly stated, in all material respects, in relation to the financial statements as a whole. The Introductory and Statistical Sections have not been subjected to the auditing procedures applied in the audit of the basic financial statements and, accordingly, we do not express an opinion or provide any assurance on them.
2

Other Reporting Required by Government Auditing Standards In accordance with Government Auditing Standards, we have also issued our report dated December 2, 2016, on our consideration of the City’s internal control over financial reporting and on our tests of its compliance with certain provisions of laws, regulations, contracts, and grant agreements and other matters. The purpose of that report is to describe the scope of our testing of internal control over financial reporting and compliance and the results of that testing, and not to provide an opinion on internal control over financial reporting or on compliance. That report is an integral part of an audit performed in accordance with Government Auditing Standards in considering the City’s internal control over financial reporting and compliance. Pleasant Hill, California December 2, 2016
3


City of San Pablo 2015/16 CAFR
Management’s Discussion and Analysis
City Hall: 13831 San Pablo Ave., San Pablo, California 94806
Phone: (510) 215-3020 ~ Fax: (510) 231-0223
This discussion and analysis of the City of San Pablo’s financial performance provides an overview of the City’s financial activities for the fiscal year ended June 30, 2016. Please read it in conjunction with the Letter of Transmittal, the Basic Financial Statements and the accompanying Notes to the Basic Financial Statements.
FINANCIAL HIGHLIGHTS
• The assets of the City exceeded its liabilities at the close of the most recent fiscal year by $127.0million. Of this amount, $42.0 million is unrestricted and may be used to meet the City’s ongoingobligations to citizens and creditors.
• The City’s total net position increased by $11.8 million primarily because revenues exceededexpenditures by $15.7 million in the General Fund and by $0.2 million in the Low and ModerateIncome Housing Assets Fund, while expenditures exceeded revenues by $3.0 million in the PublicWorks Construction Fund and by $1.4 million in the Lease Revenue Bonds Fund, plus the net ofcapital assets transactions and other adjustments.
• At the close of the current fiscal year, the City’s governmental funds reported combined ending fundbalances of $75.5 million, an increase of $11.1 million from the prior fiscal year. This growth isdue to increases in business license tax of $3.3 million, sales taxes of $0.8 million, GeneralGovernmental revenue of $4.6 million, and reductions in capital outlay expense of $4.3 million,offset by reductions in intergovernmental revenue of $1.8 million.
OVERVIEW OF THE FINANCIAL STATEMENTS
The financial statements presented herein include all of the activities of the City of San Pablo (“the City”) and its component units using the blended approach or discrete presentation approach as prescribed by government accounting standards. The City’s basic financial statements are comprised of three components: (1) City-Wide Financial Statements, (2) Fund Financial Statements, and (3) Notes to the Basic Financial Statements.
The Government-Wide Financial Statements present the financial picture of the City from the economic resources measurement focus using the accrual basis of accounting. These statements include all assets of the City, including infrastructure, as well as all liabilities. Additionally, certain eliminations have occurred in regards to inter-fund activity, payables and receivables.
The Statement of Net Position and the Statement of Activities report information about the City. All of the current year’s revenues and expenses are taken into account, regardless of when cash is received or paid. In addition, these two statements report the City’s net positions and changes in them. Over time, increases or decreases in the City’s net positions are one indicator of whether their financial health is improving or deteriorating. Other factors to consider are changes in the City’s property tax base and the condition of the City’s roads. Currently the City’s roads are rated “good” by the Metropolitan
5
City of San Pablo 2015/16 CAFR
Management’s Discussion and Analysis
City Hall: 13831 San Pablo Ave., San Pablo, California 94806
Phone: (510) 215-3020 ~ Fax: (510) 231-0223
Transportation Commission. In order to maintain this status, the City will need to increase its expenditure from the General Fund.
The Fund Financial Statements provide detailed information about each of the City’s most significant funds, called Major Funds. Each Major Fund is presented individually, with all Non-major Funds summarized and presented only in a single column. Subordinate schedules present the detail of these Non-major funds. Major Funds present the major activities of the City for the year. The General Fund is always a Major Fund, but other funds may change from year to year as a result of changes in the pattern of the City’s activities.
The City had three Major Funds in 2016 in addition to the General Fund: the Low and Moderate Income Housing Assets Fund, the Public Works Construction Fund and the 2015 Lease Revenue Bonds Fund.
The City’s Fund Financial Statements are divided into three categories: Governmental Funds, Non-Major Governmental Funds, and Fiduciary Funds. The Governmental Fund financials are prepared using the current financial resources measurement focus and modified accrual basis of accounting. Fiduciary Funds are reported using the economic resources measurement focus and full accrual basis of accounting. Agency funds are custodial in nature (assets equal liabilities) and do not involve measurement of results of operations.
Governmental Funds. All of the City’s basic services are reported in Governmental Funds, which focus on how money flows into and out of those funds and the balances remaining at year-end that are available for spending. The Governmental Fund statements provide a detailed, short-term view of the City’s general government operations and the basic services it provides which include: general government, community development, public safety, public works and engineering, and recreation. Governmental Fund information helps determine whether there are more or fewer financial resources that can be spent in the near future to finance the City’s programs. The difference in results of the Governmental Fund Financial Statements to those in the City-Wide Financial Statements are explained in a reconciliation that is below each Governmental Fund Financial Statement.
Non-Major Governmental Funds. Non-Major Governmental Funds are comprised of Special Revenue Funds which are established by State law to account for specific revenues that are legally restricted to expenditures for particular purposes.
Fiduciary Funds. The City is the trustee, or fiduciary, for certain amounts held on behalf of property owners, other government entities, and others. The City’s fiduciary activities are reported in a separate Statement of Fiduciary Net Position. We exclude these activities from the Government-Wide Financial Statements because the City cannot use these assets to finance its operations. The City is responsible for ensuring that the assets reported in these funds are used for their intended purposes.
6

City of San Pablo 2015/16 CAFR
Management’s Discussion and Analysis
City Hall: 13831 San Pablo Ave., San Pablo, California 94806
Phone: (510) 215-3020 ~ Fax: (510) 231-0223
Notes to the Basic Financial Statements. The Notes to the Basic Financial Statements provide additional information that is essential to a full understanding of the data provided in the Government-Wide and Fund Financial Statements.
GOVERNMENT-WIDE FINANCIAL ANALYSIS
This analysis focuses on the net position and changes in net position of the City, presented in the City-wide Statement of Net Position and Statement of Activities that follow (the City has no proprietary activities).
The City’s net position increased by $11.8 million in 2016, from $115.0 million to $126.9 million. This year over year upturn derives from the change in net position as recorded in the Statement of Activities, which flows through the Statement of Net Position. Net position increased in FY 2015/16 as a result of several transactions:
Sales tax increased by $0.8 million, primarily due to the full-year collection Measure K sales tax
Casino revenue increased by $3.3 million
Other miscellaneous revenue increased by $0.2 million
Capital grant revenues decreased by $0.6 million;
Expenditures decreased by $10.8 million.
A portion of the City’s net position represents resources which are subject to external restrictions on use. This restricted amount is $25.3 million as of June 30, 2016. The remaining balance of unrestricted net assets of $42.0 million may be used to meet the City’s ongoing obligations to citizens and creditors.
7

City of San Pablo 2015/16 CAFR
Management’s Discussion and Analysis
City Hall: 13831 San Pablo Ave., San Pablo, California 94806
Phone: (510) 215-3020 ~ Fax: (510) 231-0223
Governmental Net Position at June 30
Government Activities
2016 2015
Current Assets 106,566,288 94,099,485
Capital Assets 77,914,177 78,085,388
Total Assets $ 184,480,465 $ 172,184,873
Deferred Outflows of Resources
Related to pensions 4,208,951 2,665,181
Current Liabilities 6,870,174 4,889,529
Long-Term Liabilities 52,585,772 47,990,248
Total Liabilities $ 59,455,946 $ 52,879,777
Deferred Inflows of Resources
Related to pensions 2,403,072 6,947,231
Net Position:
Net Investment in Capital Assets 59,552,820 59,671,326
Restricted 25,307,852 24,843,522
Unrestricted 41,969,726 30,508,198
Total Net Position $ 126,830,398 $ 115,023,046
8

City of San Pablo 2015/16 CAFR
Management’s Discussion and Analysis
City Hall: 13831 San Pablo Ave., San Pablo, California 94806
Phone: (510) 215-3020 ~ Fax: (510) 231-0223
Changes in Governmental Net Position at June 30
Revenues: 2016 2015
Program revenues
Charges for Services $ 2,031,684 $ 2,308,858
Operating Contributions and Grants 1,679,873 2,064,275
Capital Grants 4,562,945 5,202,454
Gereral Revenues:
Property Tax 1,562,739 1,676,678
Sales Taxes 4,168,439 3,803,069
In‐lieu Sales Tax 406,799 490,239
Utility Taxes 2,572,145 2,467,509
Transient Occupancy Taxes 523,213 455,006
Franchise Taxes 790,828 884,123
Payment in Lieu of Taxes 1,902,362 1,865,060
Other Taxes 157,190 132,130
Motor Vehicle Taxes 2,158,330 1,961,310
Business Licenses (non‐regulatory) 22,986,063 19,701,338
Investment Earnings 865,048 633,516
Miscellaneous 705,407 545,773
Total Revenues 47,073,065 44,191,338
Expenses
General Government 10,749,217 5,868,035
Community:
Recreation 1,613,344 1,417,109
Development 1,351,207 1,538,176
Housing 23,000 0
Public Works & Engineering 7,253,853 9,591,938
Police 13,239,813 15,207,587
Interest on long‐term debt 1,035,279 1,069,642
Total Expenses 35,265,713 34,692,487
Extra/Special Item‐Asset transfers 206,625
Change in Net Position 11,807,352 9,705,476
Net Position 7/1 115,023,046 105,317,570
Net Position 6/30 $ 126,830,398 $ 115,023,046
9

City of San Pablo 2015/16 CAFR
Management’s Discussion and Analysis
City Hall: 13831 San Pablo Ave., San Pablo, California 94806
Phone: (510) 215-3020 ~ Fax: (510) 231-0223
The cost of all Governmental activities this year was $35.2 million. Net expenses, as shown in the Statement of Activities, were $26.9 million. A portion of the cost for these activities was paid either by those directly benefitting from the programs through service charges ($2.1 million), by other governments and organizations that subsidized certain programs with operating grants and contributions ($1.7 million), or capital grants and contributions ($4.6 million). Overall, the City received $8.3 million in governmental program revenues.
Total resources available during the year to finance governmental operations were $162.3 million, consisting of net assets at July 1, 2015 of $115.0 million, program revenues of $8.3 million and general revenues of $39.0 million. Total Governmental activities during the year were $35.2 million, thus net position increased from $115.0 million to $126.9 million, a net increase of $11.8 million.
Property Taxes, 4%
Sales Taxes, 11%
In‐lieu Sales Tax, 1%
Utility Taxes, 7%
Transient Occupancy Taxes, 1%
Franchise Taxes, 2%
Payment in Lieu of Taxes, 5%
Other Taxes, 0%
Motor Vehicle Taxes, 6%
Business Licenses (non‐regulatory), 62%
Sources of Revenue
10

City of San Pablo 2015/16 CAFR
Management’s Discussion and Analysis
City Hall: 13831 San Pablo Ave., San Pablo, California 94806
Phone: (510) 215-3020 ~ Fax: (510) 231-0223
As shown in the Sources of Revenue chart on the opposite page, Business Licenses accounted for 62% of the City’s Fiscal Year 2016 revenue, which came primarily from Casino San Pablo. Sales taxes accounted for 11%, which included the voter-approved Measure Q rate increase of ½%. On the year, Functional Expenses totaled $35.2 million, an increase of $0.5 million from the previous year. Likewise, all Functional Expense categories decreased from the previous year with the exception of General Government expenses which increased by $4.8 million to 30% of total expenses. Expense levels increased over last year in large part because of $1.2 million increase in annual PERS smoothing payments, plus increases in citywide utilities, fuel, and liability insurance. Police expenditures decreased by $2.0 million to 37% of total expenses because of a change in the way the City pays for pension expenses. Public Works and Engineering decreased by $2.3 million to 21% of total expenses because of reduced expenditures on large projects that were completed in FY 2015. Recreation expenditures increased by $0.2 to 4.5% of total expenses, while Community Services and Development Services, decreased by $0.2 million and $0.4 million respectively, each at 4% of total expense.
General Government30%
Community Recreation
4%
Community Development
4%
Housing0%
Public Works & Engineering
21%
Police38%
Interest on long‐term
debt3%
EDC0%
Functional Expenses
11

City of San Pablo 2015/16 CAFR
Management’s Discussion and Analysis
City Hall: 13831 San Pablo Ave., San Pablo, California 94806
Phone: (510) 215-3020 ~ Fax: (510) 231-0223
FINANCIAL ANALYSIS OF THE GOVERNMENT’S FUNDS
At year end, the City’s General Fund had a balance of $57.4 million. This represents an increase of $14.3 million compared to 2015. The increase can be attributed to the $15.7 million in excess of revenues over expenditures, which were offset by a transfer of $0.3 million to capital projects and debt payment. Total General Fund revenues increased by $5.4 million over the previous fiscal year mainly due to increased Casino revenue of $3.2 million and grant drawdowns of $1.6 million for the completion of Rumrill Sports Park.
The Low and Moderate Income Housing Assets Fund had a fund balance of $7.3 million.
The Public Works Construction Fund balance decreased by $3.7 million as a result of the completion of $10.1 million in projects, offset by project grant funding of $0.4 million, and transfers from the General Fund of $7.0 million.
The 2015 Lease Revenue Bond Fund was established in fiscal year 2015 to account for the activities related to the issuance of the 2015 Lease Revenue Bonds in the principal amount of $15.8 million. Current year activities of $1.4 million included $0.5 million release of hold back on property acquisitions and debt payment. Unspent proceeds were $7.5 million at fiscal year-end, which are restricted for use on capital improvement projects.
Other Governmental Funds increased by $0.8 million, primarily due to a $0.2 million increase in revenue, $0.5 million increase in expenditures, and transfers-in which exceeded transfers-out by $1.5 million.
GENERAL FUND BUDGETARY HIGHLIGHTS
The City adopts a biennial budget every other year at which time revenues are projected for the first year of the budget with minor adjustments for the second year. The fiscal year ending June 30, 2016 was the second year of the two-year budget process. Differences between the actual results and the original General Fund budget and the final General Fund budget are as follows:
Sales Taxes. In June 2012, the voters passed Measure Q, which increased the sales tax base by 0.5%. The City projects for the increase conservatively, such that actuals received were $142,116 over the budget.
Business License. Because the nationwide economic recovery has been slow, the City budgeted conservatively for Business License Tax, which primarily comes from Casino San Pablo, thinking that perhaps there would be a slowdown in Casino revenue. A slowdown never did materialize, such that casino revenue ended the year with a positive variance of totaled $4.6 million, or 31% over budget.
12

City of San Pablo 2015/16 CAFR
Management’s Discussion and Analysis
City Hall: 13831 San Pablo Ave., San Pablo, California 94806
Phone: (510) 215-3020 ~ Fax: (510) 231-0223
Other Taxes. The Hotel Occupancy Tax and Franchise Tax attributed to the increase in this category. Hotel occupancy rates were up, contributing approximately $46,000 over budget. Moreover, the City did not budget for the additional revenue generated by restructuring the Franchise Tax Agreement for solid waste services with Republic Sanitary Service. The positive variance equaled $121,555, or 18% over budgeted figures.
Charges for Services. Actual receipts over budget amounts of $187,997 in Charges for Services was attributable to increased police service, while recreation and senior service revenues increased because of increased fees.
Intergovernmental/Other. The City received unbudgeted grant funds totaling $3.2 million. $3.0 million of this revenue was from the State of California for construction of the Rumrill Sports Park, and $0.2 million from Contra Costa County for the Wayfinding Signage grant.
Expenditures. Expenditures totaling $25.6 million were 10% less than original budgeted figures and 12% less than the final budgeted figures of $30.5 million, resulting in expenditure savings of $4.9 million. $0.8 million of this gap is attributable to salary and benefit savings, because of many position vacancies throughout the year and conservative budgeting practices of the City. The City also experienced savings in the following line-items: Community Grants & Special Events, $1.3 million; Special Department Expenditures, $1.4 million, Professional Services, $0.8 million, and Capital Improvements of $0.3 million. This is a result of careful spending practices, conservative budgeting, and work that was not completed.
Transfers. Final budgeted figures for net transfers out were $9.1 million, which was $7.7 million higher than what was actually transferred. The difference is due to various Capital Improvement Projects that were completed and closed, while excess funds were transferred into the General Fund.
CAPITAL ASSETS AND DEBT ADMINISTRATION
Capital Assets - Capital assets of the City are those assets which are used in the performance of the City’s functions. At June 30, 2016, capital assets net of accumulated amortization and depreciation of the Governmental activities totaled $66.6 million. Amortization and depreciation on capital assets is recognized in the Government-Wide financial statements. Refer to Note 6 of this report for detailed information regarding capital assets. The City has elected to use the amortization and depreciation method as allowed by GASB Statement No. 34 for infrastructure reporting.
13

City of San Pablo 2015/16 CAFR
Management’s Discussion and Analysis
City Hall: 13831 San Pablo Ave., San Pablo, California 94806
Phone: (510) 215-3020 ~ Fax: (510) 231-0223
Original Accumulated Book
Cost Depreciation Value
Capital Assets - Governmental:
Land and land improvements $8,409,744 $8,409,744
Construction in progress 4,263,622 4,263,622
Buildings and improvements 23,950,030 $5,868,498 18,081,532 Machinery and equipment 3,820,427 1,811,859 2,008,568 Vehicles 2,911,163 2,161,641 749,522 Park and trail improvements 13,801,816 3,208,258 10,593,558 Sports fields 1,506,986 1,144,839 362,147 Roads & streets including sidewalks 73,688,108 43,263,622 30,424,486 Bridges 5,486,753 4,544,940 941,813 Street lights 361,078 327,526 33,552 Storm drains 2,202,142 1,707,873 494,269 Traffic signals 2,931,742 2,001,825 929,917
Trees 1,227,462 606,015 621,447
Total Capital Assets - Governmental $144,561,073 $66,646,896 $77,914,177
Debt Administration. As of February 1, 2012, outstanding debt of the former Redevelopment Agency was transferred to the Successor Agency, which is presented as a Private Purpose Trust Fund on the Statement of Fiduciary Net Position.
The City entered into an agreement with the San Pablo Economic Development Corporation (SPEDC) in December 2012 to lease the San Pablo Community Center. Construction of the Community Center was completed in June 2014. Prior to the completion of construction, the lease was accounted for as an operating lease. With the completion of construction, the lease was converted into a capital lease, and using the $8,764,917 final cost of the project, the City recorded a lease payable in that amount. The imputed interest rate on the lease is 3.32% and lease payments are due semi-annually each June 30 and December 31 through the year 2053.
On February 8, 2013, the City entered into a 15-year, 1.0% interest rate loan agreement with the California Energy Resources Conservation and Development Commission to borrow $1,141,738 for various solar panel projects at the City Hall complex. Principal and interest payments are payable semiannually with the first loan payment due December 22, 2015 and the last due in December 2029.
The City of San Pablo Joint Powers Financing Authority issued the Lease Revenue Bonds, Series A (Tax-Exempt) for $4,255,000 and Series 2015B (Taxable) for $11,555,000 to provide funds to finance certain capital projects within the City. Principal and interest payments on the 2015A and 2015B Bonds are due semi-annually through 2044 and 2040, respectively.
Refer to Note 7 of this report for detailed information regarding long term debt.
14

City of San Pablo 2015/16 CAFR
Management’s Discussion and Analysis
City Hall: 13831 San Pablo Ave., San Pablo, California 94806
Phone: (510) 215-3020 ~ Fax: (510) 231-0223
ECONOMIC FACTORS AND NEXT YEAR’S BUDGET
In following best management practices, the City takes a conservative approach relative to the assumptions built into the budget cycle. In the operating budget on the revenue side, revenues are projected to be fairly flat over the course of the budget cycle; indeed the adopted FY 2017 revenue budget is approximately $200,000 less than the FY 2016 budget. In this way, as revenues are increasing over time—assuming that the economy is growing—the budget is balanced at the Year 1 revenue amount, thus building in a structural funding surplus in subsequent fiscal years. On the expenditure side, increasing labor costs and other inflationary factors are built into the multi-year budget according to labor agreements, vendor contracts, etc., thus ensuring sufficient funding.
In an effort to further stabilize the budget and better manage budgetary growth, the City is embarking on a new approach to budgeting. Beginning in the 2017/18 fiscal year, the City will undertake a four-year budget cycle, such that the adopted budget will cover four fiscal years, rather than the usual two. After two years (at mid-cycle), the City will undertake a significant update of the four-year budget to amend that last two fiscal years and add two additional years. This approach will accomplish the following:
Integrate long-term financial planning with the operating budget
Encourage long-term budget planning at the department and division level
Establish ongoing continuity between adopted budgets
Create a venue to foster focus on near-term and long-term big-picture goals and objectives
Manage program and FTE expansion and reduce budget creep
Normalize expenditures over the four-year budget cycle
Acknowledge long-term labor agreements and plan for increasing labor costs
Adopted revenue budgets are based on year end actuals from the previous full fiscal year and year end projections from the current fiscal year, while taking into account local economic conditions and other real world considerations. Moreover, key assumptions made in each fiscal year are conservative, including a continued slow-growth economy that will most likely result in modest increases in taxes, fees and other revenues, but which are not significant enough to change estimates much from one year to the next. In this way, revenue estimates for future fiscal years remain at very sustainable levels with a modest inflationary factor built in. Indeed, in each of the last several fiscal years, actual revenues outpaced budgeted revenues by double-digit amounts, while Year 2 of the 2015-17 Biennial Budget was balanced on a revenue estimate that was 0.1 percent greater than the FY 2016 estimate.
Additionally, the City takes a very conservative approach to budgeting for Casino business license revenues. With actuals of $22.6 million in FY 2016, Casino business licenses are the City’s largest revenue source, comprising 59% of the General Fund. To mitigate this risk and dependence on a single revenue source, the City budgets at figures significantly less than previous fiscal year actuals, even though Casino revenues have increased year over year by at least 5.0% for six of the last nine fiscal years, and with average growth of 8.6%. Indeed, the City’s initial Adopted Biennial Budget for this revenue source was $18.0 million in both Fiscal Years 2016 and 2017, 26.1 percent less than FY 2016 actuals.
15

City of San Pablo 2015/16 CAFR
Management’s Discussion and Analysis
City Hall: 13831 San Pablo Ave., San Pablo, California 94806
Phone: (510) 215-3020 ~ Fax: (510) 231-0223
The same conservative approach holds true for essentially all revenue sources. The Adopted Budget for General Fund revenues in Fiscal Year 2016 and Fiscal Year 2017 is set at $30.9 and $30.7 million respectively, while Fiscal Year 2016 actuals total $41.3 million. From an all funds perspective, $35.6 million is budgeted in both Fiscal Year 2016 and 2017, a full $11.4 million less than the $47.0 million in actuals received in FY 2016. Sales tax in particular was expected to increase significantly during the course of FY 2016. Measure K, a 0.25% sales tax measure for emergency medical services, was approved by voters in June 2014 and Measure K sales tax receipts began flowing into the City in December 2014. Fiscal Year 2016 was the first full year of Measure K sales tax receipts. Budgeted at $650,000 annually in FY 2016 and FY 2017, FY 2016 totaled over $750,000.
On the expenditure side, all job positions, including vacancies, are conservatively budgeted at the fourth step of a five-step range. New positions added during the course of the two-year budget cycle are fully funded in the fiscal year in which they are added and in all subsequent years. A 2.0% cost of living adjustment (COLA) for all employees is added as well, in accordance with labor contracts in force through the remainder of FY 2017. All benefits-eligible employees are budgeted to receive medical insurance at the two-party rate. Additionally, all increasing employee benefit costs are updated annually and added to each fiscal year’s budget for such things as increases to pension costs, medical and dental insurance rates, retiree health costs, etc.
To address fiscal uncertainty, the City adopted the Fiscal Resiliency Reserve Policy in October 2013. The policy requires Catastrophic Reserves at 50% of the General Operating Fund budget, and a Budget Stabilization Reserve at 5.0% of the General Fund budget. The policy also establishes General Fund Designated Reserves which allow the City to allocate funding for large, future expenses, including such things as CalPERS retirement rate increases, unfunded liabilities such as compensated absences, vehicle replacements, etc. Additionally, the policy establishes the Future Capital Projects Reserves for funding large capital projects in the absence of RDA funding. The policy also established the City Manager’s Contingency Account at 1% of the General Fund budget to pay for unbudgeted and unforeseen expenses that arise during the normal course of business. Additionally, the City added the Casino Revenue Stability Reserve in June 2016, allowing the City to set aside up to 50% of unused audited fund balance as a rainy day fund to guard against the sudden loss of casino revenue. The City expects to set aside funds in this new reserve with FY 2016 audited fund balance.
The dissolution of all redevelopment agencies statewide continues to impact San Pablo activities as the City must rely on other revenue sources to fund capital projects rather than RDA bond proceeds. As evidence of the changed environment, all assets of the former RDA were transferred to the Local Successor Agency, which continued to unwind and dissolve all RDA financial and contractual obligations. In June 2014, the State Department of Finance approved the City’s Long Range Property Management Plan, giving the City authority to move forward with the use and disposition of all remaining properties as proposed. The City expects the final unwinding activities to be complete in calendar year 2017.
16

City of San Pablo 2015/16 CAFR
Management’s Discussion and Analysis
City Hall: 13831 San Pablo Ave., San Pablo, California 94806
Phone: (510) 215-3020 ~ Fax: (510) 231-0223
To plan for future capital project needs, in February 2015 the City issued $4.3 million in tax-exempt lease revenue bonds (LRB’s) and $11.6 million in taxable LRB’s. The City’s creditworthiness was reviewed by the credit rating agency Standard & Poor’s, which determined the “city’s recent and expected budgetary performance to be strong” and the “city’s management conditions as strong, supported by financial policies and practices that we consider good.” As such, Standard & Poor’s issued a bond rating of “AA-“, which allowed the City to obtain very favorable interest rates, beating even the City’s most optimistic projections. To date, the City has expended $7.5 million of the taxable bonds to purchase property and medical office buildings from the West Contra Costa Healthcare District. The City is moving forward with various projects that could potentially be funded with the remaining bond funds, including construction of a new branch library and City Hall, installation of municipal broadband throughout the City, and various other Capital Improvement projects.
In Fiscal Year 2014, the San Pablo Community Center was opened. This is a major project that will impact City operations and community livability for many years to come. At a total cost of $9.5 million including land value and hard and soft construction costs, this project was funded through a City partnership with the SPEDC and private lenders accessing the New Market Tax Credits program. Situated on land leased from the West Contra Costa Unified School District, this new facility greatly enhances recreational opportunities and community events held in San Pablo. With construction complete, the City’s Recreation Department moved their offices to the new facility and greatly expanded recreational program offerings to help offset the cost of additional staff required to operate the complex.
In Fiscal Year 2015, a second project was completed that will also impact the San Pablo community for generations to come: the Rumrill Sports Park. The former Burlington Northern & Santa Fe (BNSF) Railroad Corporation yard was sold to the City for development into a much-needed multi-use sports park. The park boasts three lighted youth soccer fields and one smaller field for pick-up games and practices. The park also includes a picnic/barbeque area, play area, office/restrooms and on-site parking. This park concept was developed through a series of community outreach meetings in which the residents of San Pablo identified the need for more open space structured for youth play. Construction began in August 2014 and the grand opening was held on September 8, 2015. The City secured funding of approximately $7.0 million, including $2.8 million from the New Markets Tax Credits program and $1.5 million in grants.
REQUESTS FOR INFORMATION
This financial report is designed to provide our citizens, taxpayers, customers, investors and creditors with a general overview of the City’s finances and to show the City’s accountability for the money it receives. Questions about this report should be directed to the Finance Department, located at 13831 San Pablo Avenue, San Pablo, California 94806.
17


STATEMENT OF NET POSITION AND STATEMENT OF ACTIVITIES
The Statement of Net Position and the Statement of Activities summarize the entire City’s financial activities and financial position. They are prepared on the same basis as is used by most businesses, which means they include all the City’s assets, all its deferred inflows/outflows of resources and all its liabilities, as well as all its revenues and expenses. This is known as the full accrual basis—the effect of all the City’s transactions is taken into account, regardless of whether or when cash changes hands, but all material internal transactions between City funds have been eliminated.
The Statement of Net Position reports the difference between the City’s total assets and deferred outflows of resources and the City’s total liabilities and deferred inflows of resources, including all the City’s capital assets and all its long-term debt. The Statement of Net Position presents information in a way that focuses the reader on the composition of the City’s net position, by subtracting total liabilities and deferred inflows of resources from total assets and deferred outflows of resources.
The Statement of Net Position summarizes the financial position of all of the City’s Governmental Activities in a single column. The City’s Governmental Activities include the activities of its General Fund, along with all its Special Revenue, Capital Projects and Debt Service Funds that present the financial position of the primary government. This column is followed by a column that displays the discretely presented component unit.
The Statement of Activities reports increases and decreases in the City’s net position. It is also prepared on the full accrual basis, which means it includes all the City’s revenues and all its expenses, regardless of when cash changes hands. This differs from the “modified accrual” basis used in the Fund financial statements, which reflect only current assets, current liabilities, available revenues and measurable expenditures.
The Statement of Activities presents the City’s expenses first, listed by program. Program revenues—that is, revenues which are generated directly by these programs—are then deducted from program expenses to arrive at the net expense of each governmental program. The City’s general revenues are then listed in the Governmental Activities or discretely presented component unit and the Change in Net Position is computed and reconciled with the Statement of Net Position.
Both these Statements include the financial activities of the City and the City of San Pablo Joint Powers Financing Authority. The balances and the activities of the discretely present component unit of the San Pablo Economic Development Corporation are included in these statements as separate columns.
19

CITY OF SAN PABLOSTATEMENT OF NET POSITION
JUNE 30, 2016
Primary Government Component UnitEconomic
Governmental DevelopmentActivities Corporation
ASSETSCash and investments available for operations (Note 3) $58,384,405 $1,172,108Restricted cash and investments (Note 3) 7,504,351 559,355Accounts receivable, net 2,661,806 19,765Due from other governments, net 1,754,765Prepaids and deposits (Note 1H) 49,200 10,326Employee loans receivable (Note 5A) 6,795Notes receivable under Redevelopment
Agency programs, net (Note 5B) 19,391,982Helms Community Center and Rumrill Sports
Park leveraged loans (Notes 5I and 5J) 11,839,080Property held for resale (Note 1I) 564,835Net OPEB asset (Note 9D) 4,409,069Capital assets (Note 6):
Land and construction in progress 12,673,366 1,835,000Depreciable capital assets, net 65,240,811 14,728,551
Total assets 184,480,465 18,325,105
DEFERRED OUTFLOWS OF RESOURCESRelated to pensions (Note 9B) 4,208,951
LIABILITIESAccounts payable and accrued liabilities 2,304,862 116,316Deposits payable 705,977Claims payable (Note 11) 40,437Unearned revenue 2,220,928Compensated absences (Note 1G) 1,127,737Net pension liability (Note 9B) 27,190,297Long-term debt (Note 7):
Due in one year 470,233Due in more than one year 25,395,475 16,806,000
Total liabilities 59,455,946 16,922,316
DEFERRED INFLOWS OF RESOURCESRelated to pensions (Note 9B) 2,403,072
NET POSITION (Note 8)Net investment in capital assets 59,552,820 316,906Restricted for:
Capital projects 3,045,746Low and moderate income housing 22,262,106Economic development projects 1,085,883
Total restricted net position 25,307,852 1,085,883
Unrestricted net position 41,969,726
Total net position $126,830,398 $1,402,789
See accompanying notes to financial statements
20

CITY OF SAN PABLOSTATEMENT OF ACTIVITIES
FOR THE YEAR ENDED JUNE 30, 2016
Net (Expense) Net (Expense)Revenue and Revenue andChanges in Changes in
in Net Position in Net Position
Program Revenues Primary Government Component UnitOperating Economic
Charges for Grants and Capital Governmental DevelopmentFunctions/Programs Expenses Services Contributions Grants Activities CorporationPrimary Government:
Governmental Activities:General Government $10,749,217 $435,262 ($10,313,955)Community:
Recreation 1,613,344 334,418 (1,278,926)Development 1,351,207 504,454 $189,574 (657,179)Housing 23,000 220,514 197,514
Public Works & Engineering 7,253,853 187,923 1,000,858 $4,562,945 (1,502,127)Police 13,239,813 569,627 268,927 (12,401,259)Interest on long-term debt 1,035,279 (1,035,279)
Total Governmental Activities $35,265,713 $2,031,684 $1,679,873 $4,562,945 (26,991,211)
Component Unit:Economic Development Corporation $1,558,560 $978,590 ($579,970)
General revenues:Taxes:
Property taxes 1,562,739Sales taxes 4,168,439In-lieu sales tax 406,799Utility taxes 2,572,145Transient occupancy taxes 523,213Franchise taxes 790,828Payment in lieu of taxes 1,902,362Business licenses (nonregulatory) 22,986,063Other taxes 157,190
Intergovernmental unrestricted:Motor vehicle in lieu fees 2,158,330
Use of money and property 865,048 129,903Miscellaneous 705,407
Total general revenues 38,798,563 129,903
Change in Net Position 11,807,352 (450,067)
Net Position-Beginning 115,023,046 1,852,856
Net Position-Ending $126,830,398 $1,402,789
See accompanying notes to financial statements
21


FUND FINANCIAL STATEMENTS
Major funds are defined generally as having significant activities or balances in the current year.
The funds described below were determined to be Major Funds by the City for fiscal 2016. Individual non-major funds may be found in the Supplemental Section.
GENERAL FUND
The General Fund is the general operating fund of the City. It is used to account for all financial resources except those required to be accounted for in another fund. The major revenue sources for this Fund are property taxes, sales taxes, utility users tax, franchise fees, business licenses, unrestricted revenues from the State, fines and forfeitures and interest income. Expenditures are made for public safety, recreation, and the other services described above.
LOW AND MODERATE INCOME HOUSING ASSETS
This fund accounts for the activities related to the housing assets assumed by the City as Housing Successor to the former Redevelopment Agency. The activities are governed by California redevelopment law and all revenues from the collection of loan repayments must be used to provide housing for people with low and moderate incomes.
PUBLIC WORKS CONSTRUCTION
This fund accounts for major City capital improvement projects.
2015 LEASE REVENUE BONDS
This fund accounts for capital improvement projects funded by the proceeds of the 2015 Lease Revenue Bonds.
23

CITY OF SAN PABLOGOVERNMENTAL FUNDS
BALANCE SHEETJUNE 30, 2016
Low andModerate Other Total Income Public Works 2015 Lease Governmental Governmental
General Housing Assets Construction Revenue Bonds Funds Funds
ASSETS
Cash and investments available for operations (Note 3) $52,010,212 $2,214,572 $372,986 $3,786,635 $58,384,405Restricted cash and investments (Note 3) $7,504,351 7,504,351Accounts receivable 2,654,331 7,475 2,661,806Due from other governments 1,326,974 232,631 195,160 1,754,765Prepaids and deposits (Note 1H) 49,200 49,200Employee loans receivable (Note 5A) 6,795 6,795Redevelopment Agency program loans, net (Note 5B) 19,391,982 19,391,982Helms Community Center and Rumrill Sports Park
leveraged loans (Notes 5I and 5J) 11,839,080 11,839,080Property held for resale (Note 1I) 564,835 564,835
Total Assets $67,886,592 $22,171,389 $613,092 $7,504,351 $3,981,795 $102,157,219
LIABILITIES
Accounts payable and accrued liabilities $1,791,153 $3,529 $80,179 $430,001 $2,304,862Deposits payable 180,909 525,068 705,977Unearned revenue 1,563,297 232,631 1,795,928
Total Liabilities 3,535,359 3,529 312,810 955,069 4,806,767
DEFERRED INFLOWS OF RESOURCES
Unavailable revenue - due from other governments 425,000 425,000Unavailable revenue - loans and notes receivable 6,510,080 14,911,308 21,421,388
Total Deferred Inflows of Resources 6,935,080 14,911,308 21,846,388
FUND BALANCES
Fund balance (Note 8)Nonspendable 5,384,995 5,384,995Restricted 7,256,552 $7,504,351 3,139,992 17,900,895Assigned 1,315,623 300,282 1,615,905Unassigned 50,715,535 (113,266) 50,602,269
TOTAL FUND BALANCES 57,416,153 7,256,552 300,282 7,504,351 3,026,726 75,504,064
Total Liabilities, Deferred Inflows of Resources and Fund Balances $67,886,592 $22,171,389 $613,092 $7,504,351 $3,981,795
Amounts reported for Governmental Activities in the Statement of Net Position are different from those reported in the Governmental Funds above because of the following:
CAPITAL ASSETSCapital assets used in Governmental Activities are not current assets or financial resources and therefore are not
reported in the Governmental Funds. 77,914,177
NON-CURRENT REVENUES Revenues which are unavailable on the Fund Balance Sheets because they are not available currently are taken
into revenue in the Statement of Activities. 21,421,388
LONG TERM ASSETS, LIABILITIES AND DEFERRED OUTFLOWS/INFLOWS OF RESOURCESThe assets, deferred outflows of resources, liabilities and deferred inflows of resources below are not due and payable in the
current period and therefore are not reported in the Funds:Net OPEB asset 4,409,069Deferred outflows of resources related to pensions 4,208,951Claims payable (40,437)Compensated absences (1,127,737)Net pension liability (27,190,297)Long term debt (25,865,708)Deferred inflows of resources related to pensions (2,403,072)
NET POSITION OF GOVERNMENTAL ACTIVITIES $126,830,398
See accompanying notes to financial statements
24

CITY OF SAN PABLOGOVERNMENTAL FUNDS
STATEMENT OF REVENUES, EXPENDITURESAND CHANGES IN FUND BALANCESFOR THE YEAR ENDED JUNE 30, 2016
Low andModerate Other TotalIncome Public Works 2015 Lease Governmental Governmental
General Housing Assets Construction Revenue Bonds Funds Funds
REVENUESProperty taxes $719,960 $842,779 $1,562,739
Sales taxes 3,304,334 1,715,412 5,019,746In-lieu sales tax 406,799 406,799Utility users tax 2,572,145 2,572,145Business license tax 22,665,705 22,665,705Other taxes 3,334,876 3,334,876Licenses and permits 320,358 320,358Fines and forfeits 253,290 253,290Intergovernmental 6,125,560 $414,151 1,406,691 7,946,402Charges for services 629,254 717,812 1,347,066Use of money and property 1,063,595 $220,514 $1,163 18,464 1,303,736Miscellaneous 211,478 4,367 80,287 296,132
Total Revenues 41,286,996 220,514 418,518 1,163 5,101,803 47,028,994
EXPENDITURESCurrent: General Government 9,612,295 1,200,000 10,812,295 Community:
Recreation 1,490,995 1,490,995Development 1,417,014 1,417,014Housing 23,000 23,000
Public Works & Engineering 275,565 3,084,862 3,360,427 Police 13,735,117 18,059 13,753,176Capital outlay 308,912 3,390,369 500,000 16,252 4,215,533Debt service:
Principal retirement 144,982 210,000 354,982Interest and fiscal charges 25,882 711,457 737,339
Total Expenditures 25,593,748 23,000 3,390,369 1,421,457 5,736,187 36,164,761
EXCESS OF REVENUESOVER (UNDER) EXPENDITURES 15,693,248 197,514 (2,971,851) (1,420,294) (634,384) 10,864,233
OTHER FINANCING SOURCES (USES)Proceeds from sale of property 206,584 12,000 218,584Transfers in (Note 4A) 2,034,248 1,150,206 915,957 1,620,962 5,721,373Transfers (out) (Note 4A) (3,662,125) (1,888,733) (170,515) (5,721,373)
Total Other Financing Sources (Uses) (1,421,293) (738,527) 915,957 1,462,447 218,584
NET CHANGE IN FUND BALANCES 14,271,955 197,514 (3,710,378) (504,337) 828,063 11,082,817
Fund balances at beginning of period 43,144,198 7,059,038 4,010,660 8,008,688 2,198,663 64,421,247
FUND BALANCES AT END OF PERIOD $57,416,153 $7,256,552 $300,282 $7,504,351 $3,026,726 $75,504,064
See accompanying notes to financial statements
25

CITY OF SAN PABLOReconciliation of the
NET CHANGE IN FUND BALANCES - TOTAL GOVERNMENTAL FUNDS with the
STATEMENT OF ACTIVITIESFOR THE YEAR ENDED JUNE 30, 2016
Revenues, Expenditures and Changes in Fund Balance, which measures only changes in current assets and currentliabilities on the modified accrual basis, with the Change in Net Position of Governmental Activities reported in theStatement of Activities, which is prepared on the full accrual basis.
NET CHANGE IN FUND BALANCES - TOTAL GOVERNMENTAL FUNDS $11,082,817
Amounts reported for governmental activities in the Statement of Activities are different because of the following:
CAPITAL ASSETS TRANSACTIONS
Governmental Funds report capital outlays as expenditures. However,in the Statement of Activities the cost of those assets is capitalized and allocated overtheir estimated useful lives and reported as depreciation expense.
Capital outlay expenditures are added back to fund balance 4,281,182Depreciation expense is deducted from fund balance (4,452,393)
LONG-TERM DEBT PROCEEDS AND PAYMENTS
Debt proceeds provide current financial resources to governmental funds, butissuing debt increases long-term liabilities in the Statement of Net Position.Repayment of debt principal is an expenditure in the governmental funds, butin the Statement of Net Position the repayment reduces long-term liabilities
Repayment of debt principal is added back to fund balance 354,982Interest accrued to principal is deducted from fund balance (297,940)
NON-CURRENT ITEMS
The amounts below included in the Statement of Activities do not provide or (require) the use of current financial resources and therefore are not reported as revenue or expenditures in governmental funds (net change):
Net OPEB asset 137,559Compensated absences (126,406)Claims payable 36,934Unavailable revenue - loans and notes receivable (174,513)Net pension liability and deferred outflows/inflows of resources related to pensions 965,130
CHANGE IN NET POSITION OF GOVERNMENTAL ACTIVITIES $11,807,352
See accompanying notes to financial statements
26

CITY OF SAN PABLOGENERAL FUND
STATEMENT OF REVENUES, EXPENDITURESAND CHANGES IN FUND BALANCE
BUDGET AND ACTUALFOR THE YEAR ENDED JUNE 30, 2016
Variance withBudgeted Amounts Final Budget
PositiveOriginal Final Actual (Negative)
REVENUESProperty taxes $2,066,642 $313,313 $719,960 $406,647Sales taxes 2,909,702 2,909,702 3,304,334 394,632In-lieu sales tax 568,382 568,382 406,799 (161,583)Utility users tax 2,535,693 2,535,693 2,572,145 36,452Business license tax 18,000,000 18,000,000 22,665,705 4,665,705Other taxes 3,101,858 3,101,858 3,334,876 233,018Fines and forfeits 195,071 195,071 253,290 58,219Intergovernmental:
Motor vehicle in lieu 13,167 1,766,496 2,152,285 385,789Other 333,506 438,506 3,973,275 3,534,769
Charges for services 441,257 441,257 629,254 187,997Use of money and property 659,603 659,603 1,063,595 403,992Miscellaneous 36,680 36,680 211,478 174,798
Total Revenues 30,861,561 30,966,561 41,286,996 10,320,435
EXPENDITURESCurrent:
General government 8,345,150 12,786,628 9,612,295 3,174,333Community:
Recreation 1,692,270 1,769,347 1,490,995 278,352Development 2,356,556
Public Works & Engineering 615,383 364,351 275,565 88,786Police 14,770,167 14,860,050 13,735,117 1,124,933
Capital outlay 298,580 601,205 308,912 292,293Debt Service:
Principal 145,000 144,982 18Interest and fiscal charges 25,882 (25,882)
Total Expenditures 28,078,106 30,526,581 25,593,748 4,932,833
EXCESS OF REVENUES OVER EXPENDITURES 2,783,455 439,980 15,693,248 15,253,268
OTHER FINANCING SOURCES (USES) Proceeds from sale of property 206,584 206,584
Transfers in 2,034,248 2,034,248Transfers (out) (2,188,882) (9,113,252) (3,662,125) 5,451,127
Total Other Financing Sources (Uses) (2,188,882) (9,113,252) (1,421,293) 7,691,959
NET CHANGE IN FUND BALANCE $594,573 ($8,673,272) 14,271,955 $22,945,227
Fund balance at beginning of year 43,144,198
FUND BALANCE AT END OF YEAR $57,416,153
See accompanying notes to financial statements
27

FIDUCIARY FUNDS
FIDUCIARY FUNDS
These funds are used to account for assets held by the City as an agent for individuals, private organizations, and other governments. The financial activities of these funds are excluded from the City-wide financial statements, but are presented in separate Fiduciary Fund financial statements.
RETIREE HEALTH SAVINGS PLAN TRUST FUND
The Fund is used to account for the medical and dental benefits for former employees of the City.
SUCCESSOR AGENCY TO THE REDEVELOPMENT AGENCY
The Fund is used to account for the activities of the Successor Agency to the former Redevelopment Agency of the City of San Pablo.
29

CITY OF SAN PABLOFIDUCIARY FUNDS
STATEMENTS OF FIDUCIARY NET POSITIONJUNE 30, 2016
Successor AgencyRetiree Health to the Savings Plan Redevelopment Agency Agency
Trust Fund Private-Purpose Trust Funds
ASSETSInvestments - Mutual Fund (Note 3) $7,244,815Restricted cash and investments (Note 3) $10,069,614 $2,828,596Loans receivable (Note 12B) 1,064,799Property held for resale (Note 12C) 7,537,984Due from other governments 779,793Capital assets (Note 12D):
Land and construction in progress 2,819,393Depreciable capital assets, net 1,287,878
Total assets 7,244,815 22,779,668 $3,608,389
DEFERRED OUTFLOW OF RESOURCES Deferred amount on refunding of debt (Note 12E) 4,091,195
LIABILITIESAccounts payable 5,225 $189,599Deposits held as agent for others 3,418,790Long-term obligations (Note 12E):
Due in one year 4,447,201Due in more than one year 68,717,347
Total liabilities 73,169,773 $3,608,389
NET POSITION (DEFICIT) HELD IN TRUST FOROPEB BENEFITS AND OTHER GOVERNMENTS $7,244,815 ($46,298,910)
See accompanying notes to financial statements
30

CITY OF SAN PABLOSTATEMENT OF CHANGES IN FIDUCIARY NET POSITION
FOR THE YEAR ENDED JUNE 30, 2016
Successor AgencyRetiree Health to the Savings Plan Redevelopment Agency
Trust Fund Private-Purpose Trust
ADDITIONSProperty taxes $8,159,295Employer contributions $495,353Net investment income 171,304Other 78
Total additions 495,353 8,330,677
DEDUCTIONSPremiums paid 662,418Community Development 771,744Depreciation (Note 12D) 65,752Debt service:
Interest and fiscal charges 2,849,011
Total deductions 662,418 3,686,507
Change in net position (167,065) 4,644,170
NET POSITION (DEFICIT) HELD IN TRUST FOR OPEBBENEFITS AND OTHER GOVERNMENTS
Beginning of year 7,411,880 (50,943,080)
End of year $7,244,815 ($46,298,910)
See accompanying notes to financial statements
31


CITY OF SAN PABLO NOTES TO BASIC FINANCIAL STATEMENTS
For the Year Ended June 30, 2016
NOTE 1 - SIGNIFICANT ACCOUNTING POLICIES
A. Reporting Entity
The City of San Pablo was incorporated as a general law city on April 27, 1948. San Pablo is a community of approximately 29,465 residents situated in Contra Costa County on the east side of San Francisco Bay. San Pablo is located approximately 17 miles east of the City of San Francisco and 12 miles north of the City of Oakland and is surrounded by the City of Richmond. The City operates under the Council-Manager form of government and provides the following services: public safety, highways and streets, recreation, public improvements, planning and zoning and general administration services.
The City is governed by a five member council elected by City residents. The City is legally separate and fiscally independent which means it can issue debt, set and modify budgets and fees and sue or be sued. The accompanying basic financial statements include the financial activities of the City as well as separate legal entities which are described below.
The accompanying basic financial statements present the financial activity of the City, which is the primary government presented, along with the financial activities of its component units, which are entities for which the City is financially accountable. Although they are separate legal entities, blended component units are in substance part of the City’s operations and are reported as an integral part of the City’s financial statements. Each discretely presented component unit, on the other hand, is reported in a separate column in the basic financial statements to emphasize it is legally separate from the government.
PRIMARY GOVERNMENT
The financial statements of the primary government of the City of San Pablo include the activities of the City as well as the City of San Pablo Joint Powers Financing Authority, which is controlled by and dependent on the City. While it is a separate legal entity, its financial activities are integral to those of the City. The financial activities have been aggregated and merged (termed “blended”) with those of the primary government of the City in the accompanying financial statements.
Blended Component Unit
The City of San Pablo Joint Powers Financing Authority is a separate governmental entity whose purpose is to assist in the financing and refinancing of certain redevelopment activities of the former Redevelopment Agency and certain programs and projects of the City. The Authority is administered by a Governing Board whose members are the City Council of the City of San Pablo. The Authority does not issue separate financial statements.
The City of San Pablo Retiree Health Savings Plan is governed by the City’s Resolution 2007-024 and is used to account for contributions and investment income restricted to pay medical and dental benefits. Benefit and contribution provisions are established by the City Council. Eligibility, actuarial interest rates, administration and certain other tasks are the responsibility of the Council established by the above Resolution. The financial activities of the Plan have been included in these financial statements in the Retiree Health Savings Plan Trust Fund. The Plan does not issue separate financial statements.
33

CITY OF SAN PABLO NOTES TO BASIC FINANCIAL STATEMENTS
For the Year Ended June 30, 2016
NOTE 1 - SIGNIFICANT ACCOUNTING POLICIES (Continued)
DISCRETELY PRESENTED COMPONENT UNIT
The San Pablo Economic Development Corporation is a California nonprofit public benefit Corporation formed in February 2011 by the City and the Redevelopment Agency under the laws of the State of California. The Corporation was organized for the purpose of providing physical, economic and educational development, redevelopment, and revitalization efforts within the City. The Corporation entered into a Service Agreement with the City under which the City will perform the necessary services on an independent contractor basis to eliminate blight, provide affordable housing, improve the public realm, facilitate public and private developments, stimulate economic development, and create jobs. The Corporation was controlled by the City and had the same governing body as the City, which also performs all accounting and administrative functions for the Corporation. The Corporation was governed by a board of directors consisting of the members of the City Council.
In May 2012 the City Council, serving in its capacity as the governing board of the Corporation, adopted a resolution approving modifications to the governing board. Effective May 16, 2012, the governing board of the Corporation consists of two Councilmembers and three members of the community.
However, for the period May 16, 2012 through September 1, 2012 the Corporation’s operations remained financially integrated with those of the City and City staff continued to provide accounting, administrative and managerial services for the Corporation. As a result of this financial integration, the Corporation continued to be reported as a component unit of the City through September 1, 2012, and the financial activities of the Corporation were previously reported in the Economic Development Special Revenue Fund through that date.
Effective September 1, 2012, the City transferred assets and liabilities of the Corporation to the Corporation’s own administrative staff, and all accounting and managerial functions of the Corporation are now performed by its own staff. However, the City continues to provide the primary funding for the activities of the Corporation. Therefore, the financial activities of the Corporation are discretely presented in the Economic Development Corporation Component Unit column of the Statement of Net Position and the Statement of Activities. Separate financial statements for the Corporation may be obtained by contacting the San Pablo Economic Development Corporation, 13830 San Pablo Avenue, Suite D, San Pablo, CA 94806.
B. Basis of Presentation
The City’s Basic Financial Statements are prepared in conformity with accounting principles generally accepted in the United States of America. The Government Accounting Standards Board is the acknowledged standard setting body for establishing accounting and financial reporting standards followed by governmental entities in the United States.
These Standards require that the financial statements described below be presented.
Government-wide Statements: The Statement of Net Position and the Statement of Activities display information about the primary government (the City) and its blended and discretely presented component units. These statements include the financial activities of the overall City government, except for fiduciary activities. Eliminations have been made to minimize the double counting of internal activities. Governmental activities generally are financed through taxes, intergovernmental revenues, and other nonexchange transactions.
34

CITY OF SAN PABLO NOTES TO BASIC FINANCIAL STATEMENTS
For the Year Ended June 30, 2016
NOTE 1 - SIGNIFICANT ACCOUNTING POLICIES (Continued) The Statement of Activities presents a comparison between direct expenses and program revenues for each function of the City’s governmental activities. Direct expenses are those that are specifically associated with a program or function and, therefore, are clearly identifiable to a particular function. Program revenues include (a) charges paid by the recipients of goods or services offered by the programs, (b) grants and contributions that are restricted to meeting the operational needs of a particular program and (c) capital grants and contributions, all of which are capital grants under California law. Revenues that are not classified as program revenues, including all taxes, are presented as general revenues. Fund Financial Statements: The fund financial statements provide information about the City's funds, including fiduciary funds and blended component units. Separate statements for each fund category—governmental and fiduciary—are presented. The emphasis of fund financial statements is on major individual governmental funds, each of which is displayed in a separate column. All remaining governmental funds are aggregated and reported as nonmajor funds.
C. Major Funds
Major funds are defined as governmental funds which have either assets and deferred outflows of resources, liabilities and deferred inflows of resources, revenues or expenditures equal to ten percent of their fund-type total and five percent of the grand total. The General Fund is always a major fund. The City may select other governmental funds it believes should be presented as major funds. The City reported the following major governmental funds in the accompanying financial statements:
General Fund - This is the City’s primary operating fund. It accounts for all financial resources of the general government, except those required to be accounted for in another fund. Low and Moderate Income Housing Assets - This fund accounts for the activities related to the housing assets assumed by the City as Housing Successor to the former Redevelopment Agency. The activities are governed by California redevelopment law and all revenues from the collection of loan repayments must be used to provide housing for people with low and moderate incomes.
Public Works Construction - This fund accounts for major City capital improvement projects. 2015 Lease Revenue Bonds – This fund accounts for capital improvement projects funded by the proceeds of the 2015 Lease Revenue Bonds. The City also reports the following fiduciary fund types: Trust Funds. These funds account for assets held by the City as an agent for various functions. The Retiree Health Savings Plan Trust Fund accounts for the accumulation of resources to be used for retiree medical and dental benefit payments at appropriate amounts and times in the future. The Successor Agency to the Redevelopment Agency Private-Purpose Trust Fund accounts for the accumulation of resources to be used for payments at appropriate amounts and times in the future. The financial activities of the funds are excluded from the Government-wide financial statements, but are presented in the separate Fiduciary Fund financial statements.
35

CITY OF SAN PABLO NOTES TO BASIC FINANCIAL STATEMENTS
For the Year Ended June 30, 2016
NOTE 1 - SIGNIFICANT ACCOUNTING POLICIES (Continued)
Agency Funds. These funds account for assets held by the City as an agent for the Oak Park Special Assessment District, West Contra Costa Transportation Advisory Committee, and non-public organizations. Agency funds cannot be major funds.
D. Basis of Accounting
The City-wide and fiduciary fund financial statements are reported using the economic resources measurement focus and the full accrual basis of accounting. Revenues are recorded when earned and expenses are recorded at the time liabilities are incurred, regardless of when the related cash flows take place. Agency funds are custodial in nature (assets equal liabilities) and do not involve measurement of results of operations.
Governmental funds are reported using the current financial resources measurement focus and governmental and agency funds are reported using modified accrual basis of accounting. Under this method, revenues are recognized when measurable and available. The City considers all revenues reported in the governmental funds to be available if the revenues are collected within forty-five days after year-end. Expenditures are recorded when the related fund liability is incurred, except for principal and interest on general long-term debt and compensated absences, which are recognized as expenditures when they are paid. General capital asset acquisitions are reported as expenditures in governmental funds. Proceeds from general long-term debt and capital leases are reported as other financing sources.
Those revenues susceptible to accrual include taxes, intergovernmental revenues, interest and charges for services.
Grant revenues are recognized in the fiscal year in which all eligibility requirements are met. Under the terms of grant agreements, the City may fund certain programs with a combination of cost-reimbursement grants, categorical block grants, and general revenues. Thus, both restricted and unrestricted net position may be available to finance program expenditures. The City’s policy is to first apply restricted grant resources to such programs, followed by general revenues if necessary.
Certain indirect costs are included in program expenses reported for individual functions and activities.
Non-exchange transactions, in which the City gives or receives value without directly receiving or giving equal value in exchange, include property taxes, grants, entitlements, and donations.
Revenue from grants, entitlements, and donations is recognized in the fiscal year in which all eligibility requirements have been satisfied.
E. Deferred Outflows/Inflows of Resources
In addition to assets, the statement of net position reports a separate section for deferred outflows of resources. This separate financial statement element, deferred outflows of resources, represents a consumption of net position that applies to a future period(s) and so will not be recognized as an outflow of resources (expense/ expenditure) until then. The City only has one item that qualifies for reporting in this category related to pensions as discussed in Note 9.
36

CITY OF SAN PABLO NOTES TO BASIC FINANCIAL STATEMENTS
For the Year Ended June 30, 2016
NOTE 1 - SIGNIFICANT ACCOUNTING POLICIES (Continued)
In addition to liabilities, the statement of net position and balance sheet report a separate section for deferred inflows of resources. This separate financial statement element, deferred inflows of resources, represents an acquisition of net position that applies to a future period(s) and so will not be recognized as an inflow of resources (revenue) until that time. The City has one item that qualifies for reporting in this category, unavailable revenue, which arises only under a modified accrual basis of accounting. Accordingly, unavailable revenue is reported only in the governmental funds balance sheet. The governmental funds report unavailable revenues from due from other governments, and loans and notes receivable. The City also has deferred inflows of resources related to pensions as discussed in Note 9. These amounts are deferred and recognized as an inflow of resources in the period that the amounts become available.
F. Property Tax
Property tax revenue is recognized in the fiscal year for which the tax and assessment is levied. The County of Contra Costa levies, bills and collects property taxes and special assessments for the City; under the County’s “Teeter Plan” the County remits the entire amount levied and handles all delinquencies, retaining interest and penalties. Secured and unsecured property taxes are levied on January 1. Secured property tax is due in two installments, on November 1 and February 1, becomes a lien on those dates and becomes delinquent on December 10 and April 10, respectively. Unsecured property tax is due on July 1, and becomes delinquent on August 31.
The term “unsecured” refers to taxes on personal property other than real estate, land and buildings. These taxes are secured by liens on the property being taxed. Property tax revenues are recognized by the City in the fiscal year they are assessed.
G. Compensated Absences
Compensated absences comprise unpaid vacation and certain compensated time off, which are accrued as earned. For all governmental funds amounts expected to be paid out for permanent liquidation are recorded as fund liabilities, the long-term portion is recorded in the statement of net position. The liability for compensated absences is determined annually; the net decrease in the liability was $126,406 at June 30, 2016 and was allocated to the General Government, Community Development, Public Works, Engineering, Police and Community Recreation on the Statement of Activities. Sick pay does not vest and therefore is not accrued. The change in compensated absences was as follows:
Beginning Balance $1,001,331Additions 970,037Payments (843,631) Ending Balance $1,127,737
Due in One Year $1,127,737
The long-term portion of governmental activities compensated absences is liquidated primarily by the General Fund.
37

CITY OF SAN PABLO NOTES TO BASIC FINANCIAL STATEMENTS
For the Year Ended June 30, 2016
NOTE 1 - SIGNIFICANT ACCOUNTING POLICIES (Continued)
H. Prepaids and Deposits Certain payments to vendors reflect costs applicable to future fiscal years and are recorded as prepaid
items in both government-wide and fund financial statements. The General Fund had prepaid items of $49,200 at June 30, 2016.
Prepaid items and deposits in governmental funds are equally offset by nonspendable fund balance
which indicates that they do not constitute available spendable resources even though they are a component of net current assets.
I. Property Held for Resale Land parcels held for resale are accounted for at the lower of cost or net realizable value or agreed upon
sales price if a disposition agreement has been made with a developer. J. Estimates and Assumptions
The preparation of financial statements in conformity with generally accepted accounting principles (GAAP) requires management to make estimates and assumptions that affect the reported amounts of assets and liabilities and disclosure of contingent assets and liabilities at the date of the financial statements and the reported amounts of revenues and expenses during the reporting period. Actual results could differ from those estimates.
K. Fair Value Measurements
Fair value is defined as the price that would be received to sell an asset or paid to transfer a liability in an orderly transaction between market participants at the measurement date. The City categorizes its fair value measurements within the fair value hierarchy established by generally accepted accounting principles. The fair value hierarchy categorizes the inputs to valuation techniques used to measure fair value into three levels based on the extent to which inputs used in measuring fair value are observable in the market.
Level 1 inputs are quoted prices (unadjusted) in active markets for identical assets or liabilities. Level 2 inputs are inputs – other than quoted prices included within level 1 – that are observable for an asset or liability, either directly or indirectly. Level 3 inputs are unobservable inputs for an asset or liability.
If the fair value of an asset or liability is measured using inputs from more than one level of the fair value hierarchy, the measurement is considered to be based on the lowest priority level input that is significant to the entire measurement.
38

CITY OF SAN PABLO NOTES TO BASIC FINANCIAL STATEMENTS
For the Year Ended June 30, 2016
NOTE 2 – BUDGETS AND BUDGETARY ACCOUNTING A. Budget Policy
The City follows these procedures in establishing the budgetary data reflected in the financial statements:
1. The City Manager submits to the City Council a proposed operating budget for the fiscal year commencing the following July 1. The operating budget includes proposed expenditures and the means of financing them.
2. Public hearings are conducted to obtain citizen’s comments.
3. The budget is legally enacted by City Council resolution. 4. All budget adjustments and transfers between funds and between departments must be approved
by the City Council by resolution during the fiscal year. The City Manager and Finance Manager are authorized to transfer any unencumbered appropriations within a department. The legally adopted budget requires that expenditures not exceed total appropriations at the department level within each fund.
5. Formal budgetary integration is employed as a management control device during the year for
all budgeted funds.
6. Budgets are adopted on a basis consistent with generally accepted accounting principles (GAAP) for all funds except the Low and Moderate Income Housing Assets, Traffic Congestion Relief, HCD Grant and Measure K Special Revenue Funds. In addition, the Public Works Construction Capital Projects Fund and 2015 Lease Revenue Bonds Capital Projects Fund are budgeted on a project length basis and therefore are not comparable on an annual basis.
B. Excess of Expenditures over Appropriations
The General Fund incurred debt service expenditures in excess of appropriations in the amount of $25,882, and the Law Enforcement Services Special Revenue Fund incurred police expenditures in excess of appropriations in the amount of $18,059. The funds had sufficient revenues to finance these expenditures.
NOTE 3 - CASH AND INVESTMENTS
The City pools cash from all sources and all funds except Cash and Investments held by Trustees so that it can be invested at the maximum yield consistent with safety and liquidity, while individual funds can make expenditures at any time.
A. Policies
California Law requires banks and savings and loan institutions to pledge government securities with a market value of 110% of the City’s cash on deposit, or first trust deed mortgage notes with a market value of 150% of the deposit, as collateral for these deposits. Under California Law this collateral is held in a separate investment pool by another institution in the City’s name and places the City ahead of general creditors of the institution.
39

CITY OF SAN PABLO NOTES TO BASIC FINANCIAL STATEMENTS
For the Year Ended June 30, 2016
NOTE 3 - CASH AND INVESTMENTS
The City and its fiscal agents invest in individual investments and in investment pools. Individual investments are evidenced by specific identifiable securities instruments, or by an electronic entry registering the owner in the records of the institution issuing the security, called the book entry system.
The City’s investments are carried at fair value, as required by generally accepted accounting principles. The City adjusts the carrying value of its investments to reflect their fair value at each fiscal year end, and it includes the effects of these adjustments in income for that fiscal year.
B. Classification
Cash and investments are classified in the financial statements as shown below, based on whether or not their use is restricted under the terms of debt instruments or agency agreements.
Primary Government Cash and Investments Cash and investments available for operations $58,384,405
Restricted cash and investments 7,504,351
Component Unit Cash and InvestmentsCash and investments available for operations 1,172,108Restricted cash and investments 559,355
Fiduciary Funds Cash and Investments
Restricted cash and investments
in Fiduciary Funds (separate statement):
Retiree Health Savings Plan Trust 7,244,815
Successor Agency to the Redevelopment
Agency Private Purpose Trust 10,069,614
Agency Funds 2,828,596
Total cash and investments $87,763,244
40

CITY OF SAN PABLO NOTES TO BASIC FINANCIAL STATEMENTS
For the Year Ended June 30, 2016
NOTE 3 - CASH AND INVESTMENTS (Continued) C. Investments Authorized by the California Government Code and the City’s Investment Policy
The City’s Investment Policy and the California Government Code allow the City to invest in the following, provided the credit ratings of the issuers are acceptable to the City; and approved percentages and maturities are not exceeded. The table below also identifies certain provisions of the California Government Code, or the City’s Investment Policy where the City’s Investment Policy is more restrictive.
Authorized Investment Type
Maximum Maturity
Minimum Credit Quality
Maximum Percentage of Portfolio
Maximum Investment
In One Issuer U.S. Treasury Bills, Notes or Bonds
5 years
N/A
No Limit
No Limit
Federal Instrumentality (government sponsored enterprise)
5 years
N/A
No Limit
No Limit
Federal Agency Mortgage Backed Securities and Debentures
5 years
N/A
20%
No Limit
Medium Term Notes
5 years
A/A2
30%
5%
Negotiable Certificates of Deposit
5 years
FDIC
Insured
30%
5%
Non-Negotiable Certificates of Deposit
5 years
FDIC
Insured
30%
5%
Commercial Paper
270 Days
A/A-1
25%
5%
Banker’s Acceptances
180 days
A-1/P-1
30%
5%
Repurchase Agreements
30 days
A/A-1
20%
No Limit
California Local Agency Investment Fund
N/A
N/A
No Limit
$50 million
Money Market Funds
N/A
AAAm
20%
10%
41

CITY OF SAN PABLO NOTES TO BASIC FINANCIAL STATEMENTS
For the Year Ended June 30, 2016
NOTE 3 - CASH AND INVESTMENTS (Continued) D. Investments Authorized by Debt Agreements
The Successor Agency to the Redevelopment Agency must maintain required amounts of cash and investments with trustees or fiscal agents under the terms of certain debt issues. These funds are unexpended bond proceeds or are pledged as reserves to be used if the Successor Agency fails to meet its obligations under these debt issues. The California Government Code requires these funds to be invested in accordance with City ordinance, bond indentures or State statute. The table below identifies the investment types that are authorized for investments held by fiscal agents. There is no limitation on the maximum percentage of the portfolio that may be invested in any one investment type or in any one issuer. The table also identifies certain provisions of these debt agreements:
Authorized Investment Type
Maximum Maturity
Minimum Credit Quality
U.S. Treasury Obligations 5 years N/A U.S. Agency Securities (A) 5 years N/A State Obligations 5 years A Commercial Paper 270 days A-1 Certificates of Deposit 365 days A-1 Bankers Acceptances 365 days A-1 Bank Deposits 5 years N/A Money Market Mutual Funds N/A AAAm Repurchase Agreements 180 days (B) A Investment Agreements and Guaranteed Investment Contracts
N/A
N/A
Cash Sweep 5 years N/A California Asset Management Program N/A N/A California Local Agency Investment Fund N/A N/A
(A) For the 2015 Lease Revenue Bonds, investments are restricted to the Federal Home Loan Bank
System, Government National Mortgage Association, Farmer’s Home Administration, Federal Home Loan Mortgage Corporation or Federal Housing Administration; provided that with respect to the funds and accounts established under the Indenture, such obligations shall at no time exceed an amount equal to ten percent (10%) of the aggregate principal amount of the Bonds Outstanding.
(B) For the 2015 Lease Revenue Bonds, limited to 30 days.
E. Investments Authorized for Economic Development Corporation
Economic Development Corporation investments conform with the California Government Code. F. Investments Authorized for the Retiree Health Savings Plan Trust
The authorized investments for the Retiree Health Savings Plan Trust were established pursuant to the Declaration of Trust. The City, as trustee, has elected to invest the Trust assets in a mutual fund, however the Trust is authorized to invest in time deposits, shares of common and preferred stock, mortgages, bonds, leases, notes, debentures, equipment or collateral trust certificates, rights, warrants, convertible or exchangeable securities and other corporate, individual or government securities or obligations, annuity, retirement or other insurance contracts, mutual funds, or in units of any other common, collective or commingled trust fund.
42

CITY OF SAN PABLO NOTES TO BASIC FINANCIAL STATEMENTS
For the Year Ended June 30, 2016
NOTE 3 - CASH AND INVESTMENTS (Continued) G. Interest Rate Risk
Interest rate risk is the risk that potential future changes in market interest rates will adversely affect the fair market value of an investment. Normally, the longer the maturity of an investment, the greater the sensitivity of its fair market value to changes in market interest rates. Information about the sensitivity of the fair market values of the investments (including investments held by bond trustees) to market interest rate fluctuations is provided by the following table that shows the distribution of the investments by maturity or earliest call date:
Cash and Investments Restricted
Available for Cash and Maturity Date or CreditOperations Investments Total Earliest Call Date Rating
City Investments:Federal Instrumentalities:
Federal Farm Credit Bank $511,845 $511,845 January 17, 2017 AA+
Federal Farm Credit Bank 600,090 600,090 May 22, 2017 AA+
Federal Farm Credit Bank 1,002,450 1,002,450 September 14, 2018 AA+
Federal Home Loan Bank 1,003,031 1,003,031 September 9, 2016 AA+
Federal Home Loan Bank 602,343 602,343 June 9, 2017 AA+
Federal Home Loan Bank 758,469 758,469 June 8, 2018 AA+
Federal Home Loan Bank 757,778 757,778 August 14, 2018 AA+
Federal National Mortgage Association 500,730 500,730 March 14, 2017 AA+
Federal National Mortgage Association 2,511,785 2,511,785 September 20, 2017 AA+
Federal National Mortgage Association 2,014,520 2,014,520 March 5, 2018 AA+
Federal Home Loan Mortgage Corporation 500,115 500,115 July 28, 2016 AA+
U.S. Treasury Note 1,004,492 1,004,492 January 15, 2018 AA+
U.S. Treasury Note 1,000,977 1,000,977 November 15, 2016 AA+
U.S. Treasury Note 1,002,491 1,002,491 January 31, 2017 AA+
U.S. Treasury Note 1,001,874 1,001,874 March 15, 2017 AA+
U.S. Treasury Note 1,002,305 1,002,305 June 30, 2017 AA+
U.S. Treasury Note 500,469 500,469 September 30, 2017 AA+
Medium Term Notes:
Walt Disney Company 1,009,538 1,009,538 September 15, 2016 A
Toyota Motor Credit 1,002,425 1,002,425 September 15, 2016 AA-
Colgate-Palmolive Company 501,971 501,971 January 15, 2017 AA-
Exxon Mobil Corporation 1,001,189 1,001,189 March 15, 2017 AA+
Berkshire Hathaway Finance Corporation 1,008,295 1,008,295 May 15, 2017 AA
IBM Corporation 1,056,386 1,056,386 September 13, 2017 AA-
Wal-Mart Stores, Inc. 502,533 502,533 April 11, 2018 AA
Apple Inc. 1,002,461 1,002,461 May 3, 2018 AA+
Oracle Corporation 501,866 501,866 October 15, 2017 AA-
Pfizer Inc. 1,002,305 1,002,305 May 15, 2017 AA
Cisco Systems Inc. 710,536 710,536 February 28, 2029 AA-
Local Agency Investment Fund 28,874,685 $2,917,436 31,792,121 167 days average maturity Not Rated
Wells Fargo Advantage Government Money Market Funds 17,461,836 17,461,836 42 days average maturity AAAm
Wells Fargo Advantage Treasury Plus Money Market Funds 1,193,301 1,193,301 46 days average maturity AA+
Retiree Health Savings Plan Trust:
Vantage Point MP Long Term Growth Mutual Fund (Equities) 7,244,815 7,244,815
Cash with Banks and Petty Cash - City of San Pablo 2,764,439 2,764,439
Cash with Banks - Economic Development Corporation 1,172,108 559,355 1,731,463
Total Cash and Investments $59,579,802 $28,183,442 $87,763,244
43

CITY OF SAN PABLO NOTES TO BASIC FINANCIAL STATEMENTS
For the Year Ended June 30, 2016
NOTE 3 - CASH AND INVESTMENTS (Continued)
The City is a participant in the Local Agency Investment Fund (LAIF) that is regulated by California Government Code Section 16429 under the authority of the Treasurer of the State of California and is not registered with the Securities and Exchange Commission as an investment company. The City reports its investment in LAIF at the fair value amount provided by LAIF, which is the same as the value of the pool share. The balance is available for withdrawal on demand, and is based on the accounting records maintained by LAIF, which are recorded on an amortized cost basis. Included in LAIF’s investment portfolio are collateralized mortgage obligations, mortgage-backed securities, other asset-backed securities, loans to certain state funds, and floating rate securities issued by federal agencies, government-sponsored enterprises, United States Treasury Notes and Bills, and corporations. At June 30, 2016 the average maturity was 167 days.
H. Credit Risk
Credit risk is the risk that an issuer of an investment will not fulfill its obligation to the holder of the investment. This is measured by the assignment of a rating by a nationally recognized statistical rating organization. The actual ratings for the City’s investments as of June 30, 2016 are included in the above table.
I. Fair Value Hierarchy
The City categorizes its fair value measurements within the fair value hierarchy established by generally accepted accounting principles. The hierarchy is based on the valuation inputs used to measure fair value of the assets. Level 1 inputs are quoted prices in an active market for identical assets; Level 2 inputs are significant other observable inputs; and Level 3 inputs are significant unobservable inputs.
The following is a summary of the fair value hierarchy of the fair value of investments of the City as of June 30, 2016:
Level 1 Level 2 TotalInvestments by Fair Value:
U.S. Treasury Notes $5,512,608 $5,512,608Federal Agency $10,763,156 10,763,156Medium Term Notes 9,299,505 9,299,505Local Agency Investment Fund 31,792,121 31,792,121
Total Investments at Fair Value $5,512,608 $51,854,782 57,367,390
Investments Measured at Amortized Cost:
Money market mutual funds 1,193,301Held by Bond Trustee:
Money market mutual funds 24,706,651
Total Investments 83,267,342
Cash with Banks and Petty Cash - City of San Pablo 2,764,439Cash with Banks - Economic Development Corporation 1,731,463
Total Cash and Investments $87,763,244
Investment Type
44

CITY OF SAN PABLO NOTES TO BASIC FINANCIAL STATEMENTS
For the Year Ended June 30, 2016
NOTE 3 - CASH AND INVESTMENTS (Continued)
Investments classified in Level 1 of the fair value hierarchy, are valued using quoted prices in active markets. Federal Agency Securities and Medium Term Notes, classified in Level 2 of the fair value hierarchy, are valued using matrix pricing techniques maintained by various pricing vendors. Matrix pricing is used to value securities based on the securities’ relationship to benchmark quoted prices. The California Local Agency Investment Fund, classified in Level 2 of the fair value hierarchy, is valued based on the fair value factor provided by the Treasurer of the State of California, which is calculated as the fair value divided by the amortized cost of the investment pool. Fair value is defined as the quoted market value on the last trading day of the period. These prices are obtained from various pricing sources by our custodian bank.
NOTE 4 – INTERFUND TRANSACTIONS
A. Transfers Between Funds
With Council approval, resources may be transferred from one City fund to another. The purpose of the majority of transfers is to reimburse a fund, which has made an expenditure on behalf of another fund. Less often, a transfer may be made to open or close a fund.
TransferFund Receiving Transfers Fund Making Transfers Amount
Major Funds:General Fund Public Works Construction Capital Projects Fund $1,888,733 (A)
Public Safety Special Revenue Fund 145,515 (B)Public Works Construction Capital Projects Fund General Fund 1,150,206 (C)2015 Lease Revenue Bonds Capital Projects Fund General Fund 915,957 (E)
Non-Major Funds:Gas Tax Special Revenue Fund General Fund 996,687 (D)Street Lighting and Landscaping Special Revenue Fund General Fund 62,194 (D)Measure K Special Revenue Fund General Fund 426,767 (D)Development Services Special Revenue Fund General Fund 110,314 (D)
Measure C/J Special Revenue Fund 25,000 (D)
$5,721,373
The reasons for these transfers are set forth below:(A) Return unspent capital project funds (C) Transfer amounts required to fund capital projects(B) Transfer to fund public safety (D) Transfer to cover revenue shortage(E) Transfer for debt service requirements
45
CITY OF SAN PABLO NOTES TO BASIC FINANCIAL STATEMENTS
For the Year Ended June 30, 2016
NOTE 5 - LOANS AND NOTES RECEIVABLE The City and former Redevelopment Agency engage in programs designed to encourage construction
or improvement in low-to-moderate income housing or other projects. Under these programs, grants or loans are provided under favorable terms to homeowners or developers who agree to spend these funds in accordance with the City’s or Agency’s terms. Although these loans and notes are expected to be repaid in full, their balance has been offset by unavailable revenue in governmental funds, as they are not expected to be repaid during the next fiscal year.
A. Employee Loans Receivable Elected officials and full-time City employees are eligible to obtain an interest free loan up to $3,000 to
purchase a computer. All requests for loans are subject to review and approval by the Finance Manager. Repayment of these loans is handled through payroll deductions, which are spread out equally for up to two years. Employees must pay off any outstanding balance of their loans upon ending employment with the City. As of June 30, 2016, 11 employees had $6,795 in such loans.
B. Notes Receivable under Redevelopment Agency Programs The Agency engaged in programs designed to encourage construction of or improvement to low-to-
moderate income housing. Under these programs, grants or loans are provided under favorable terms to homeowners or developers who agree to expend these funds in accordance with the Agency’s terms. With the dissolution of the Redevelopment Agency as discussed in Note 12, the City agreed to become the successor to the Redevelopment Agency’s housing activities and as a result the Low and Moderate Income Housing Asset Fund assumed the loans receivable of the Redevelopment Agency’s Low and Moderate Income Housing Fund as of February 1, 2012. The balances of the notes receivable in the Low and Moderate Income Housing Asset Fund at June 30, 2016 are set forth below:
Supplemental Education Revenue Augmentation Fund $4,480,674Casa Adobe-Senior Citizen Units 1,112,628Housing Initiative Program 10,589,092San Pablo Housing Investors 1,650,116East Bay Asian Local Development Corporation 1,559,472Lao Family Community Development 600,482
Subtotal 19,992,464Less: Allowance for conditional grant (600,482)
Total $19,391,982
C. Supplemental Education Revenue Augmentation Fund Loans
During the fiscal year ending June 30, 2010 the Agency approved an interfund advance of $3,000,000 from the Agency Low and Moderate Income Housing Fund to the Redevelopment Agency Projects Fund for the purpose of paying the Agency’s share of the countywide Supplemental Education Revenue Augmentation Fund (SERAF). This loan does not bear interest and was to be repaid in five years. With the dissolution of the Agency effective February 1, 2012, the Successor Agency assumed the obligation to repay the advance and has recorded a loan payable to the Low and Moderate Income Housing Asset Fund subject to revised repayment terms as discussed in Note 12 below. The balance of the loan at June 30, 2016 was $1,615,674.
46
CITY OF SAN PABLO NOTES TO BASIC FINANCIAL STATEMENTS
For the Year Ended June 30, 2016
NOTE 5 - LOANS AND NOTES RECEIVABLE (Continued) In August 2011 the Agency approved a second interfund advance for the year ended June 30, 2011 of $2,865,000 from the Agency’s Low and Moderate Income Housing Fund to the Redevelopment Agency Projects Fund for the purpose of funding the full amount of the Agency’s 2010 SERAF payment. This loan does not bear interest and was to be repaid in five years. With the dissolution of the Agency effective February 1, 2012, the Successor Agency assumed the obligation to repay the advance and has recorded a loan payable to the Low and Moderate Income Housing Asset Fund as discussed in Note 12 below. The balance of the loan at June 30, 2016 was $2,865,000. These loans were previously reported as interfund advances. However, the liability has been assumed by the Successor Agency following the dissolution of the former Agency. The State of California Department of Finance has stated that repayment of the loans cannot begin prior to fiscal year 2014-2015 and the maximum annual repayment amount is limited by Health and Safety Code Section 34176(e)(6), as discussed in Note 12.
D. Casa Adobe - Senior Citizen Units Under the terms of a Disposition and Development Agreement dated June 5, 1989 between the Redevelopment Agency and the Developer, Ecumenical Association for Housing (EAH)-San Pablo, the Agency loaned EAH-San Pablo the amount of $824,670 to purchase land and construct the Casa Adobe 55-unit housing complex for low income senior citizens. During fiscal year 2009, the Agency restructured the original agency loan and provided a new loan in the principal amount of $1,232,951 to assist the Developer with financing the acquisition and rehabilitation of the Development. The Agency loan consists of the principal and accrued interest on the original Agency loan as of November 1, 2008. The restructured loan has a fifty-five year term with a zero percent interest rate. Commencing on May 1, 2010 and on each May 1st thereafter, payments are to be made from “residual receipts” as defined in the agreement.
E. Housing Initiative Program
The Redevelopment Agency administered a Housing Initiative Program under which individuals may qualify for first-time home buyer, purchase rehabilitation, second and third trust deed home improvement, dilapidated unit purchase, or foreclosed unit purchase loans. At June 30, 2016 loans outstanding under this Program totaled $10,589,092. In October 2007, the Agency revised its first-time home-buyers loan program, which included increasing the maximum amount of assistance from $75,000 to $200,000 and requiring the homebuyer to enter a shared appreciation agreement as part of the promissory note. Under the shared appreciation, the homebuyer is required to pay the Agency a share of the net appreciated value of the home in connection with a transfer of the home before the end of the program loan term (30 years). The percentage of the shared net appreciation is equal to the Agency’s share of the original purchase price of the home, less a 5% discount. The balance of these loans is included in the Housing Initiative Program Loans. The Agency also administered a State-sponsored CalHome Loan Program under which individuals may qualify for first-time home buyer, purchase rehabilitation, second trust deed home improvement, or foreclosed unit purchase loans.
47

CITY OF SAN PABLO NOTES TO BASIC FINANCIAL STATEMENTS
For the Year Ended June 30, 2016
NOTE 5 - LOANS AND NOTES RECEIVABLE (Continued) F. San Pablo Housing Investors
Under the terms of an Owner Participation Agreement dated January 6, 2003, the Agency made two loans to San Pablo Housing Investors in fiscal 2004 for the construction of eighty-two low-income rental units for seniors. The first loan of $99,690 was used for City development fees, and the second loan of $1,100,000 for construction. The loans carry simple interest rates per annum of 6% and 5.7%, respectively, with loan payments due within twenty years of the Completion Date. The project was completed on June 30, 2003. Payments begin on January 31st following the Completion Date, and then each January 31st thereafter; payments are to be made from fifty percent of “residual receipts” as defined in the agreement. As of June 30, 2016, San Pablo Housing Investors owed principal of $1,098,651 and interest of $551,465.
G. East Bay Asian Local Development Corporation
Under the terms of an Owner Participation Agreement dated September 28, 2004, the Agency made a construction loan of $500,000 to East Bay Asian Local Development Corporation (EBALDC) for the development of 84 affordable rental dwelling units and two onsite non-rent restricted management units, with associated parking and common area spaces. The loan does not bear interest and must be repaid in full no later than 55 years from the date of the agreement. Commencing on May 1, 2008 and on each May 1st thereafter, payments are to be made in an amount equal to seventy-five percent of “residual receipts” as defined in the agreement. On August 16, 2005, an amendment to the Owner Participation Agreement provided EBALDC with a supplemental project loan of up to $1,200,000. Proceeds will facilitate the original construction project. Repayment terms of this additional loan are the same as the terms of the original loan. As of June 30, 2016, EBALDC has drawn down $1,199,513 of the supplemental project loan. The balance of the loans as of June 30, 2016 was $1,559,472.
H. Lao Family Community Development
Under the terms of an Affordable Housing Subsidy Agreement dated December 20, 1993, the Agency made a loan of $82,500 to Lao Family Community Development, Inc. (Lao) for the development of a 32-unit apartment building with three of the units being affordable to moderate income persons. The loan bears interest at the rate of 6.06%, compounded annually. The agreement was amended on January 22, 1996 to provide an additional subsidy of $75,000 which bears interest at the rate of 6.83%, compounded annually and increased the affordable units to 15. Both loans are repayable from “residual receipts” as defined in the agreement, and loans are due immediately upon the sale, assignment or transfer of the property without the consent of the Agency, or the expiration of the 30-year affordability covenant. However, unless the Agency directs otherwise, repayment of the loans is to be made to Contra Costa County under the terms of an Intercreditor Agreement; therefore, the City has accounted for this loan as a conditional grant and provided a reserve against the outstanding balance of the loans. As of June 30, 2016, the balance of the loans, including accrued interest, was $600,482.
48
CITY OF SAN PABLO NOTES TO BASIC FINANCIAL STATEMENTS
For the Year Ended June 30, 2016
NOTE 5 - LOANS AND NOTES RECEIVABLE (Continued)
I. Helms Community Center Leveraged Loan
The New Markets Tax Credit Program (NMTC Program) was established by Congress in 2000 to spur new or increased investments in operating businesses and real estate projects located in low-income communities. The City, in partnership with JP Morgan Chase Bank, has entered into various agreements which provide for the construction of the Helms Community Center by the Economic Development Corporation (EDC). Pursuant to NMTC Program requirements, several financial intermediaries controlled by the Bank have been established to finance this project which is estimated to cost $9.5 million. As required under the agreements with these entities, the City loaned the EDC $6,510,080 and contributed $227,744 to the project, and the bank loaned EDC funds to pay for the remaining project costs. In addition, the City and EDC signed a lease agreement under which the City leases the Community Center from the EDC.
The City’s loan bears simple interest of 1% and is payable in semi-annual interest-only payments from December 30, 2012 through December 20, 2022; thereafter principal and interest payments are due until June 1, 2049. As of June 30, 2016, the balance of the loan was $6,510,080.
The loan receivable was previously recorded in the Public Works Construction Capital Projects Fund. Since the project was complete and the General Fund had provided the funding for the loan to the Public Works Construction Capital Projects Fund, the City transferred the loan receivable and associated unavailable revenue to the General Fund during fiscal year 2016.
J. Rumrill Sports Park Leveraged Loan
The City, in partnership with Bank of America, has entered into various agreements which provide for the construction by the Healthy Eating Active Living, LLC (HEAL) of the Rumrill Sports Park consisting of three sports fields, a practice field, vender kiosks, an office and storage building, a picnic area, a tot-lot and parking. The San Pablo Economic Development Corporation (EDC) is the only member of HEAL. Pursuant to NMTC Program requirements, several financial intermediaries controlled by the Bank have been established to finance this project which is estimated to cost $8.6 million. As required under the agreements with these entities, the City made a loan in the amount of $5,329,000 and provided a capital grant of $1,056,530 to the project, and an affiliate of Northern California Community Loan Fund (NCCLF) has loaned HEAL funds to pay for the remaining project costs.
The City’s loan bears simple interest of 0.5% and is payable in quarterly interest-only payments from March 15, 2015 through February 23, 2022; thereafter principal and interest payments are due until March 15, 2045. As of June 30, 2016, the balance of the loan was $5,329,000.
Related transactions with HEAL/EDC
Concurrent with the above agreements, the City also entered into a ground lease agreement, under which the City will lease the property on which the project is being constructed to HEAL for a term of 55-years, and a Management Agreement under which the City agrees to manage the activities of the sports park through February 23, 2045. The City will not begin receiving management fees until the project is completed, which was expected in fiscal year 2016.
49

CITY OF SAN PABLO NOTES TO BASIC FINANCIAL STATEMENTS
For the Year Ended June 30, 2016
NOTE 5 - LOANS AND NOTES RECEIVABLE (Continued)
Of the loan proceeds provided by the City and the Bank, HEAL reimbursed the City $2,652,508 during fiscal year 2016 for costs previously incurred for the above project and paid the City $1,600,000 to the City cover the rent for the property during the term of the ground lease.
The City also agreed to grant funds to HEAL, as needed, for the purpose of funding the operating expenses for the Sports Park in an amount not to exceed $4,123,559. The agreement terminates on February 23, 2045. No funds were granted under this agreement during fiscal year 2016.
NOTE 6 - CAPITAL ASSETS
All capital assets are valued at historical cost or estimated historical cost if actual historical cost is not available. Contributed capital assets are valued at their estimated fair market value on the date contributed. The City’s policy is to capitalize all assets with costs exceeding certain minimum thresholds and with useful lives exceeding two years.
All capital assets with limited useful lives are depreciated over their estimated useful lives. The purpose of depreciation is to spread the cost of capital assets equitably among all users over the life of these assets. The amount charged to depreciation expense each year represents that year’s pro rata share of the cost of capital assets.
Depreciation of all capital assets is charged as an expense against operations each year and the total amount of depreciation taken over the years, called accumulated depreciation, is reported on the balance sheet as a reduction in the book value of capital assets.
Depreciation is provided using the straight line method, which means the cost of the asset is divided by its expected useful life in years and the result is charged to expense each year until the asset is fully depreciated. The City has assigned the useful lives and capitalization thresholds listed below to capital assets.
UsefulLives Capitalization Years Threshold
Buildings and Improvements 10-50 $25,000Machinery and Equipment 5-10 5,000Vehicles 5-10 5,000Parks and Trails 15-20 25,000Sports Fields 15-20 25,000Roads and Streets 20 25,000Bridges 15-75 25,000Trees 50 25,000Street Lights 20 25,000Storm Drains 20 25,000Traffic Signals 20 25,000
The Economic Development Corporation has assigned the following useful lives to its capital assets: Buildings, 39 years; furniture and equipment, 3-7 years; and Vehicles, 5 years.
Major outlays for capital assets and improvements are capitalized as projects are constructed. Interest incurred during the construction phase is reflected in the capitalized value of the asset constructed, net of interest earned on the invested proceeds over the same period.
50

CITY OF SAN PABLO NOTES TO BASIC FINANCIAL STATEMENTS
For the Year Ended June 30, 2016
NOTE 6 - CAPITAL ASSETS (Continued)
A. Governmental Capital Asset Additions and Retirements
Capital assets recorded at June 30 comprise:
Balance at Balance atJune 30, 2015 Additions Retirements Transfers June 30, 2016
Governmental activities
Capital assets not being depreciated:
Land and land improvements $8,366,015 $43,729 $8,409,744
Construction in progress 11,180,833 3,263,643 ($10,180,854) 4,263,622
Total capital assets not being depreciated 19,546,848 3,307,372 (10,180,854) 12,673,366
Capital assets being depreciated:
Buildings and improvements 23,609,909 540,121 ($200,000) 23,950,030
Machinery and equipment 2,548,485 284,635 987,307 3,820,427
Vehicles 3,029,422 110,154 (228,413) 2,911,163
Park and trail improvements 13,801,816 13,801,816
Sports fields 1,506,986 1,506,986
Roads & streets including sidewalks 64,773,744 38,900 8,875,464 73,688,108
Bridges 5,486,753 5,486,753
Street lights 361,078 361,078
Storm drains 1,884,059 318,083 2,202,142
Traffic signals 2,931,742 2,931,742
Trees 1,227,462 1,227,462
Total capital assets being depreciated 121,161,456 973,810 (428,413) 10,180,854 131,887,707
Less accumulated depreciation for:
Buildings and improvements 5,293,313 775,185 (200,000) 5,868,498
Machinery and equipment 1,587,447 224,412 1,811,859
Vehicles 2,194,889 195,165 (228,413) 2,161,641
Park and trail improvements 2,335,071 873,187 3,208,258
Sports fields 1,064,620 80,219 1,144,839
Roads & streets including sidewalks 41,138,635 2,124,987 43,263,622
Bridges 4,466,385 78,555 4,544,940
Street lights 324,434 3,092 327,526
Storm drains 1,697,673 10,200 1,707,873
Traffic signals 1,938,984 62,841 2,001,825
Trees 581,465 24,550 606,015
Total accumulated depreciation 62,622,916 4,452,393 (428,413) 66,646,896
Net capital assets being depreciated 58,538,540 (3,478,583) 10,180,854 65,240,811
Governmental activity capital assets, net $78,085,388 ($171,211) $77,914,177
51

CITY OF SAN PABLO NOTES TO BASIC FINANCIAL STATEMENTS
For the Year Ended June 30, 2016
NOTE 6 - CAPITAL ASSETS (Continued)
Construction in progress comprised the following at June 30, 2016:
Project Amount
Circle S Infrastructure Improvements $3,515,079San Pablo Avenue Complete Streets 248,821Miscellaneous Park Improvements 209,216Other 290,506
Total construction in progress $4,263,622
B. Economic Development Corporation’s Capital Assets
The following is a summary of the Economic Development Corporation’s changes in capital assets for the fiscal year ended June 30, 2016:
Balance at Balance atJune 30, 2015 Transfers Additions June 30, 2016
Capital assets not being depreciated:
Land - Helms and HEAL $1,835,000 $1,835,000
Construction in progress - HEAL 6,079,490 ($6,079,490)
Total capital assets not being depreciated 7,914,490 (6,079,490) 1,835,000
Capital assets being depreciated:
Building - Helms 8,364,410 8,364,410
Building - HEAL 180,000 180,000
Building improvements - Helms $46,235 46,235
Field Improvements - HEAL 5,899,490 553,551 6,453,041
Equipment - Helms 77,107 77,107
Furniture and fixtures - Helms 445,308 14,476 459,784
Vehicles 13,274 13,274
Total capital assets being depreciated 8,822,992 6,079,490 691,369 15,593,851
Less accumulated depreciation 278,562 586,738 865,300
Net capital assets being depreciated 8,544,430 6,079,490 104,631 14,728,551
Capital assets, net $16,458,920 $104,631 $16,563,551
C. Capital Asset Contributions
Some capital assets may be acquired using federal and State grant funds, or they may be contributed by developers or other governments. Contributed capital assets are valued at their estimated acquisition value on the date contributed.
52

CITY OF SAN PABLO NOTES TO BASIC FINANCIAL STATEMENTS
For the Year Ended June 30, 2016
NOTE 6 - CAPITAL ASSETS (Continued) D. Depreciation Allocation
Depreciation expense is charged to functions and programs based on their usage of the related assets. The amounts allocated to each function or program are as follows:
Governmental Activities:
General Government $72,369Community Recreation 144,740Community Development 17,340Public Works 3,960,354Police 257,590
Total depreciation expense $4,452,393
Discretely Presented Component Unit:
Economic Development Corporation $586,738
NOTE 7 – LONG-TERM DEBT
The City generally incurs long-term debt to finance projects or purchase assets which will have useful lives equal to or greater than the related debt. The City’s long-term debt is recorded only in the government-wide financial statements. In governmental fund types, debt discounts and issuance costs are recognized in the current period.
A. Current Year Transactions and Balances The City’s debt issues and transactions are shown below and discussed in detail thereafter.
OriginalIssue Balance Balance Current
Amount June 30, 2015 Additions Retirement June 30, 2016 PortionLease Revenue Bonds:Lease Revenue Bonds Series 2015A 2.00-4.00%, due 6/30/2044 $4,255,000 $4,255,000 $210,000 $4,045,000 $220,000Lease Revenue Bonds Series 2015B 1.00-4.50%, due 6/30/2040 11,555,000 11,555,000 11,555,000 90,000
Total Lease Revenue Bonds 15,810,000 210,000 15,600,000 310,000
Capital Lease:Helms Community Center
3.32%, due 12/31/2053 8,764,917 8,971,012 $297,940 85,000 9,183,952 85,000Loan:Solar Loan
1.0%, due 12/22/2029 1,141,738 1,141,738 59,982 1,081,756 75,233
Total Capital Leases 10,112,750 297,940 144,982 10,265,708 160,233
Total City Debt $25,922,750 $297,940 $354,982 $25,865,708 $470,233
53

CITY OF SAN PABLO NOTES TO BASIC FINANCIAL STATEMENTS
For the Year Ended June 30, 2016
NOTE 7 – LONG-TERM DEBT (Continued)
B. San Pablo Joint Powers Financing Authority 2015 Lease Revenue Bonds, Series A and Series B
On February 18, 2015, the City of San Pablo Joint Powers Financing Authority issued $4,255,000 and $11,555,000 in 2015 Lease Revenue Bonds, Series A and B, respectively. The proceeds of these bonds will be used to finance certain capital improvement projects and property acquisitions for the City, including a library facility and upgrades to City Hall.
Under a site and facility lease dated March 1, 2015, the Authority will lease the City Hall complex and police department building from the City and pursuant to a lease agreement dated March 1, 2015, the Authority will lease the property to the City. Lease payments from the City to the Authority are pledged for the repayment of the Bonds. Although the lease payments are payable from all legally available funds of the General Fund, the City has agreed that each September, upon the receipt of revenue under the City’s Municipal Services Agreement with the Lytton Band of Pomo Indians, to transfer the full amount of the lease payments for that fiscal year to the Bond Trustee. Annual principal payments on the 2015 A and B Lease Revenue Bonds are due November 1, and semi-annual interest payments are due May 1 and November 1, through 2044 and 2040, respectively.
Debt service requirements are shown below for the bonds:
For the Year Ending June 30 Principal Interest Total2017 $310,000 $603,323 $913,3232018 320,000 594,298 914,2982019 330,000 585,805 915,8052020 335,000 578,652 913,6522021 345,000 570,144 915,144
2022-2026 1,890,000 2,684,101 4,574,1012027-2031 2,285,000 2,287,354 4,572,3542032-2036 2,830,000 1,737,671 4,567,6712037-2041 3,550,000 1,023,227 4,573,2272042-2045 3,405,000 252,573 3,657,573
Total $15,600,000 $10,917,148 $26,517,148
C. Helms Community Center Capital Lease
The City entered into an agreement with the Economic Development Corporation in December 2012 to lease the Helms Community Center. Construction of the Community Center was completed in June 2014. Prior to the completion of construction, the lease was accounted for as an operating lease. With the completion of construction, the lease was converted to a capital lease and using the final cost of the project of $8,764,917, the City recorded a lease payable in that amount and the Economic Development Corporation recorded a lease receivable in the same amount. The Economic Development Corporation has recorded the lease receivable as a component of capital assets as required by its third-party lender related to the financing of the project. The imputed interest rate on the lease is 3.32% and lease payments are due semi-annually each June 30 and December 31 through 2053.
54

CITY OF SAN PABLO NOTES TO BASIC FINANCIAL STATEMENTS
For the Year Ended June 30, 2016
NOTE 7 – LONG-TERM DEBT (Continued) Debt service requirements are shown below for the capital lease:
Fiscal Year
Ended June 30 Payments Due2017 $85,0002018 85,000 2019 86,000 2020 203,113 2021 324,014
2022-2026 1,771,841 2027-2031 2,054,054 2032-2036 2,381,210 2037-2041 2,760,473
2042-2046 3,200,145 2047-2051 3,709,849 2052-2054 2,067,781
Total Payments 18,728,480
Less Imputed Interest (9,544,528)
Principal $9,183,952
D. Solar Panel Loan
The City executed a loan agreement with California Energy Commission on March 3, 2013 to fund the installation of solar panels at five San Pablo facilities, in the amount of $1,141,738. The associated projects started in July 2013 and the proceeds from the loan were drawn down during the year ended June 30, 2014. The loan bears interest of 1.00% and is due in 29 semi-annual installments of $42,932 from December 22, 2015 through December 22, 2029. Debt service requirements are shown below for the loan payable:
Fiscal YearEnded June 30 Principal Interest Total
2017 $75,233 $10,631 $85,8642018 75,988 9,876 85,8642019 76,750 9,114 85,8642020 77,496 8,368 85,8642021 78,296 7,568 85,864
2022-2026 403,396 26,924 430,3202027-2030 294,597 5,927 300,524
Total $1,081,756 $78,408 $1,160,164
55

CITY OF SAN PABLO NOTES TO BASIC FINANCIAL STATEMENTS
For the Year Ended June 30, 2016
NOTE 7 – LONG-TERM DEBT (Continued)
E. EDC Notes Payable
On December 12, 2012, the EDC entered into two loan agreements with New Markets Community Capital XI, LLC (NMCC). The first and second loans are for $6,510,080 and $2,795,920, respectively. Under the terms of the agreements, the loans bear interest of 1.360% and are payable in semi-annual interest-only payments due June 20 and December 20 until fiscal year 2022. Beginning on June 20, 2023, the EDC will begin making principal payments along with interest semi-annually, with a final payment due on December 1, 2052. At June 30, 2016, the outstanding balances on the loans were $6,510,080 and $2,795,920, respectively.
On February 23, 2015, the EDC, through HEAL, LLC, entered into two loan agreements with Northern California Community Capital NMTC Sub-CDE XII, LLC. The first and second loans are in the amounts of $4,947,116 and $2,552,884, respectively. Under the terms of the agreements, the loans bear interest of 0.8619% and are payable in quarterly interest-only payments until fiscal year 2022. Beginning on June 15, 2022, the HEAL, LLC will begin making principal payments along with interest quarter-annually, with a final payment due on June 15, 2045. At June 30, 2016, the outstanding balances of the loans were $4,947,116 and $2,552,884, respectively.
Debt service requirements are shown below for the EDC’s notes payable:
For the Year Ending June 30 Principal Interest Total2017 $191,206 $191,2062018 191,206 191,2062019 191,206 191,2062020 190,886 190,8862021 190,566 190,566
2022-2026 $2,213,807 974,396 3,188,2032027-2031 2,949,077 760,427 3,709,5042032-2036 3,115,131 594,475 3,709,6062037-2041 3,290,823 418,682 3,709,5052042-2046 3,025,245 234,306 3,259,5512047-2051 1,818,109 92,271 1,910,380
2052 393,808 3,433 397,241
Total $16,806,000 $4,033,060 $20,839,060
NOTE 8 – NET POSITION AND FUND BALANCES
Governmental fund balances represent the net current assets of each fund. Net current assets generally represent a fund’s cash and receivables, less its liabilities.
Net Position is measured on the full accrual basis while Fund Balance is measured on the modified accrual basis, as explained in Note 1D.
56

CITY OF SAN PABLO NOTES TO BASIC FINANCIAL STATEMENTS
For the Year Ended June 30, 2016
NOTE 8 – NET POSITION AND FUND BALANCES (Continued)
A. Net Position
Net Position is the excess of all the City’s assets and deferred outflows of resources over all its liabilities and deferred inflows of resources, regardless of fund. Net Position is divided into three captions. These captions apply only to Net Position, which is determined only at the Government-wide level, and are described below:
Net investment in capital assets describes the portion of Net Position which is represented by the current net book value of the City’s capital assets, less the outstanding balance of any debt issued to finance these assets.
Restricted describes the portion of Net Position which is restricted as to use by the terms and conditions of agreements with outside parties, governmental regulations, laws, or other restrictions which the City cannot unilaterally alter. These principally include developer fees received for use on capital projects, debt service requirements, and redevelopment funds restricted to low and moderate income purposes.
Unrestricted describes the portion of Net Position which is not restricted as to use.
B. Fund Balances
Governmental fund balances represent the net current assets of each fund. Net current assets generally represent a fund’s cash and receivables, less its liabilities.
The City’s fund balances are classified based on spending constraints imposed on the use of resources. For programs with multiple funding sources, the City prioritizes and expends funds in the following order: Restricted, Committed, Assigned, and Unassigned. Each category in the following hierarchy is ranked according to the degree of spending constraint:
Nonspendable represents balances set aside to indicate items do not represent available, spendable resources even though they are a component of assets. Fund balances required to be maintained intact, such as Permanent Funds, and assets not expected to be converted to cash, such as prepaids, notes receivable, and land held for redevelopment are included. However, if proceeds realized from the sale or collection of nonspendable assets are restricted, committed or assigned, then nonspendable amounts are required to be presented as a component of the applicable category.
Restricted fund balances have external restrictions imposed by creditors, grantors, contributors, laws, regulations, or enabling legislation which requires the resources to be used only for a specific purpose. Encumbrances and nonspendable amounts subject to restrictions are included along with spendable resources.
Committed fund balances have constraints imposed by formal action of the City Council which may be altered only by formal action by Resolution of the City Council. Encumbrances and nonspendable amounts subject to Council commitments are included along with spendable resources.
Assigned fund balances are amounts constrained by the City’s intent to be used for a specific purpose, but are neither restricted nor committed. Intent is expressed by the City Council or its designee, the Finance Manager, during the adoption of the annual budget and may be changed at the discretion of the City Council or the Finance Manager.
Unassigned fund balance represents residual amounts that have not been restricted, committed, or assigned. This includes the residual general fund balance and residual fund deficits, if any, of other governmental funds.
57

CITY OF SAN PABLO NOTES TO BASIC FINANCIAL STATEMENTS
For the Year Ended June 30, 2016
NOTE 8 – NET POSITION AND FUND BALANCES (Continued)
Detailed classifications of the City’s fund balances, as of June 30, 2016, are below:
Special CapitalRevenue ProjectsLow andModerate Public 2015 Other
General Income Works Lease Revenue Governmental Fund Balance Classifications Fund Housing Assets Construction Bonds Funds Total
Nonspendable: Items not in spendable form:
Prepaids and deposits $49,200 $49,200 Employee loans receivable 6,795 6,795 HEAL loan receivable 5,329,000 5,329,000
Total Nonspendable Fund 5,384,995 5,384,995
Restricted for: Redevelopment Low and Moderate
Income Housing $7,256,552 7,256,552Street Lighting and Landscaping
Local Street and Road Improvements and Maintenance $1,919,000 1,919,000
Law Enforcement 244,015 244,015 National Pollution Discharge
Elimination System 162,766 162,766 Paratransit 603,065 603,065 Housing Grants 94,246 94,246 2015 Lease Revenue Bonds Projects $7,504,351 7,504,351 Emergency Medical Services 116,900 116,900
Total Restricted Fund Balances 7,256,552 7,504,351 3,139,992 17,900,895
Assigned to: Capital Projects:
Other 1,315,623 $300,282 1,615,905
Total Assigned Fund Balances 1,315,623 300,282 1,615,905
Unassigned: General fund 50,715,535 (113,266) 50,602,269
Total Unassigned Fund 50,715,535 (113,266) 50,602,269
Total Fund Balances $57,416,153 $7,256,552 $300,282 $7,504,351 $3,026,726 $75,504,064
58

CITY OF SAN PABLO NOTES TO BASIC FINANCIAL STATEMENTS
For the Year Ended June 30, 2016
NOTE 8 – NET POSITION AND FUND BALANCES (Continued)
C. Stabilization and Contingency Arrangements
The City adopted a Fiscal Resiliency Policy with Resolution 2013-159, which established four types of reserves to address unanticipated, one-time needs as follows:
Catastrophic Reserve: To assist with expenses due to severe, natural, financial, or legal calamities including earthquakes, floods, disruptions in casino income, major legal judgments against the City and would be funded with fifty percent of the annual Total Operating Funds Budget, including transfers to CIP. The Catastrophic Reserve can only be used upon adoption of a Statement of Findings and/or a Declaration of Emergency subject to City Council approval and must be repaid within three fiscal years.
Budget Stabilization Reserve: To replace the prior Budget Stabilization Fund to serve as a budget balancing tool to counteract the impacts of economic downturns and declining revenues in the economic cycle, and the funds would be used for unforeseen, unplanned, one-time expenses that assist the City in developing fiscal resiliency, and the reserve will be funded with the equivalent of five percent of the annual Total Operating Funds budget, including transfers to CIP. The use of the Budget Stabilization Reserve requires approval of the Budget Services Ad-Hoc Subcommittee in addition to a Statement of Findings by the City Council and all uses must be repaid in the following fiscal year to prevent long-term structural deficits.
General Fund Designated Reserves: Identified within the Total Operating Funds and “designated” or earmarked by City Council for particular future uses as a way to prefund large expenditures, including but not limited to replacement of large capital equipment, information technology systems, facilities and infrastructure maintenance and replacement, accrued employee leave costs, PERS rate increases, workers' compensation costs, general liability costs, etc. Future Capital Projects Reserves: Specific fund balances designated within the Total Operating Funds by City Council for future capital projects that Council determines to be in the best, long-term interests of the City.
The required balance of each reserve for the year ended June 30, 2016, and the actual balance for each as of June 30, 2016, which are reported within the unassigned fund balance of the General Fund follows:
Required Beginning
BalanceBalance as of June 30, 2016
Catastrophic $14,587,185 $17,088,368Budget Stabilization Reserve 1,458,718 1,708,837Designated 3,955,297 3,955,297Future Capital Projects 8,550,000 8,550,000Unassigned 19,436,322
Total General Fund Unassigned Fund Balance $50,738,824
59

CITY OF SAN PABLO NOTES TO BASIC FINANCIAL STATEMENTS
For the Year Ended June 30, 2016
NOTE 8 – NET POSITION AND FUND BALANCES (Continued)
D. Fund Equity Deficits
As of June 30, 2016, the Street Lighting and Landscaping and Development Services Special Revenue Funds had fund deficits of $28,903 and $84,363, respectively. These deficits are expected to be eliminated by funding from the General Fund.
NOTE 9 – EMPLOYEE BENEFIT PLANS
For purposes of measuring the net pension liability and deferred outflows/inflows of resources related to pensions, and pension expense, information about the fiduciary net position of the Plans and additions to/deductions from the Plans’ fiduciary net position have been determined on the same basis as they are reported by the CalPERS Financial Office. For this purpose, benefit payments (including refunds of employee contributions) are recognized when currently due and payable in accordance with the benefit terms. Investments are reported at fair value.
A. General Information about the CalPERS Pension Plan
Plan Description – All qualified permanent and probationary employees are eligible to participate in the City’s separate Safety (police) and Miscellaneous (all other) Employee Pension Rate Plans. The City’s Miscellaneous and Safety Rate Plans are part of the public agency cost-sharing multiple-employer defined benefit pension plan (PERF C), which is administered by the California Public Employees’ Retirement System (CalPERS). PERF C consists of a miscellaneous pool and a safety pool (also referred to as “risk pools”), which are comprised of individual employer miscellaneous and safety rate plans, respectively. Individual employers may sponsor more than one miscellaneous and safety rate plan. The employer participates in one cost-sharing multiple-employer defined benefit pension plan regardless of the number of rate plans the employer sponsors. The City sponsors four rate plans (two miscellaneous and two safety). Benefit provisions under the Plan are established by State statute and City resolution. CalPERS issues publicly available reports that include a full description of the pension plan regarding benefit provisions, assumptions and membership information that can be found on the CalPERS website.
60

CITY OF SAN PABLO NOTES TO BASIC FINANCIAL STATEMENTS
For the Year Ended June 30, 2016
NOTE 9 – EMPLOYEE BENEFIT PLANS (Continued)
Benefits Provided – CalPERS provides service retirement and disability benefits, annual cost of living adjustments and death benefits to plan members, who must be public employees and beneficiaries. Benefits are based on years of credited service, equal to one year of full time employment. Members with five years of total service are eligible to retire at age 50 with statutorily reduced benefits. All members are eligible for non-duty disability benefits after 10 years of service. The death benefit is one of the following: the Basic Death Benefit, the 1957 Survivor Benefit, or the Optional Settlement 2W Death Benefit. The cost of living adjustments for each plan are applied as specified by the Public Employees’ Retirement Law.
The Plan’s provisions and benefits in effect at June 30, 2016, are summarized as follows:
Miscellaneous
Classic PEPRA
Hire datePrior to
January 1, 2013On or after
January 1, 2013
Benefit formula 2.5% @ 55 2% @ 62
Benefit vesting schedule 5 years service 5 years service
Benefit payments monthly for life monthly for life
Retirement age 50 - 55 52 - 67
Monthly benefits, as a % of eligible compensation 2.0% to 2.5% 1.0% to 2.5%
Required employee contribution rates 8% 6.25%
Required employer contribution rates 9.671% 6.237%
Safety
Classic PEPRA
Hire date
Prior toJanuary 1, 2013
On or afterJanuary 1, 2013
Benefit formula 3% @ 50 2.7% @ 57
Benefit vesting schedule 5 years service 5 years service
Benefit payments monthly for life monthly for life
Retirement age 50 50 - 57
Monthly benefits, as a % of eligible compensation 3% 2.0% to 2.7%
Required employee contribution rates 9% 11.50%
Required employer contribution rates 18.524% 11.153%
(A) The City’s labor contracts require sworn safety employees hired on or before January 1, 2013 to pay 12.3% of the contributions, consisting of the 9.0% statutorily-required employee share plus 3.3% of the employer share, and all other employees hired on or before January 1, 2013 to pay 10.3% of the contributions, consisting of the 8.0% statutorily-required employee share plus 2.3% of the employer share. Sworn safety and all other employees hired on or after January 1, 2013 are statutorily required to pay the employee share of 11.5% and 6.25%, respectively.
61

CITY OF SAN PABLO NOTES TO BASIC FINANCIAL STATEMENTS
For the Year Ended June 30, 2016
NOTE 9 – EMPLOYEE BENEFIT PLANS (Continued)
Contributions – Section 20814(c) of the California Public Employees’ Retirement Law requires that the employer contribution rates for all public employers be determined on an annual basis by the actuary and shall be effective on the July 1 following notice of a change in the rate. Funding contributions for the Plan are determined annually on an actuarial basis as of June 30 by CalPERS. The actuarially determined rate is the estimated amount necessary to finance the costs of benefits earned by employees during the year, with an additional amount to finance any unfunded accrued liability. The City is required to contribute the difference between the actuarially determined rate and the contribution rate of employees.
For the year ended June 30, 2016, the City’s contributions to the Plan were as follows:
Miscellaneous Safety Total
Contributions - employer $872,009 $1,663,467 $2,535,476
B. Pension Liabilities, Pension Expenses and Deferred Outflows/Inflows of Resources Related to Pensions
For purposes of measuring the net pension liability and deferred outflows/inflows of resources related to pensions, and pension expense, information about the fiduciary net position of the Plan and additions to/deductions from the Plan’s fiduciary net position have been determined on the same basis as they are reported by the CalPERS Financial Office. For this purpose, benefit payments (including refunds of employee contributions) are recognized when currently due and payable in accordance with the benefit terms. Investments are reported at fair value.
As of June 30, 2016, the City reported a net pension liability for its proportionate share of the net pension liability of the Plan as follows:
Proportionate Share
of Net Pension Liability
Miscellaneous $11,275,238
Safety 15,915,059
Total Net Pension Liability $27,190,297
The City’s net pension liability for the Plan is measured as the proportionate share of the net pension liability. The net pension liability of the Plan is measured as of June 30, 2015, and the total pension liability for the Plan used to calculate the net pension liability was determined by an actuarial valuation as of June 30, 2014 rolled forward to June 30, 2015 using standard update procedures. The City’s proportion of the net pension liability was based on a projection of the City’s long-term share of contributions to the pension plan relative to the projected contributions of all participating employers, actuarially determined. The City’s proportionate share of the net pension liability for the Plan as of June 30, 2014 and 2015 was as follows:
62

CITY OF SAN PABLO NOTES TO BASIC FINANCIAL STATEMENTS
For the Year Ended June 30, 2016
NOTE 9 – EMPLOYEE BENEFIT PLANS (Continued)
Miscellaneous
Proportion - June 30, 2014 0.33724%
Proportion - June 30, 2015 0.41099%
Change - Increase (Decrease) 0.07375%
Safety
Proportion - June 30, 2014 0.36611%
Proportion - June 30, 2015 0.38625%
Change - Increase (Decrease) 0.02013%
For the year ended June 30, 2016, the City recognized pension expense of $1,570,346. At June 30, 2016, the City reported deferred outflows of resources and deferred inflows of resources related to pensions from the following sources:
Deferred Outflows Deferred Inflows
of Resources of Resources
Pension contributions subsequent to measurement date $2,535,476
Differences between actual and expected experience 42,202 ($196,704)
Changes in assumptions - (1,303,980)Net differences between projected and actual earnings on plan investments - (658,671)Change in proportion and differences between actual contributions and proportionate share of contributions 1,631,273 (243,717)
Total $4,208,951 ($2,403,072)
$2,535,476 reported as deferred outflows of resources related to contributions subsequent to the measurement date will be recognized as a reduction of the net pension liability in the year ended June 30, 2016. Other amounts reported as deferred outflows of resources and deferred inflows of resources related to pensions will be recognized as pension expense as follows:
Year Ended Annual
June 30 Amortization
2017 ($133,502)
2018 (348,704)
2019 (1,066,096)
2020 818,706
2021 -
Thereafter -
63

CITY OF SAN PABLO NOTES TO BASIC FINANCIAL STATEMENTS
For the Year Ended June 30, 2016
NOTE 9 – EMPLOYEE BENEFIT PLANS (Continued)
Actuarial Assumptions – For the measurement period ended June 30, 2015, the total pension liability was determined by rolling forward the June 30, 2014 total pension liability. The June 30, 2015 and June 30, 2014 total pension liability were based on the following actuarial methods and assumptions:
Valuation Date
Measurement Date
Actuarial Cost Method
Actuarial Assumptions:
Discount Rate
Inflation
Payroll Growth
Projected Salary Increase
Investment Rate of Return
Mortality Rate Table Derived using CalPERS Membership
Data for all Funds (2)
Post Retirement Benefit Increase Contract COLA up to 2.75% until Purchasing
Power Protection Allowance Floor on
Purchasing Power applies, 2.75% thereafter
(1) Net of pension plan investment and administrative expenses; includes inflation
(2) The mortality table used was developed based on CalPERS’ specific data.
The table includes 20 years of mortality improvements using Society of
Actuaries Scale BB. For more details on this table, please refer to the
CalPERS 2014 experience study report available on the CalPERS website.
3.0%
Varies by Entry Age and Service
7.5% (1)
Entry-Age Normal Cost Method
June 30, 2014
June 30, 2015
7.65%
2.75%
All other actuarial assumptions used in the June 30, 2014 valuation were based on the results of a January 2014 actuarial experience study for the period 1997 to 2011, including updates to salary increase, mortality and retirement rates. Further details of the Experience Study can be found on the CalPERS website under Forms and Publications.
Change of Assumptions – GASB 68, paragraph 68 states that the long long-term expected rate of return should be determined net of pension plan investment expense, but without reduction for pension plan administrative expense. The discount rate of 7.50 percent used for the June 30, 2014 measurement date was net of administrative expenses. The discount rate of 7.65 percent used for the June 30, 2015 measurement date is without reduction of pension plan administrative expense. All other assumptions for the June 30, 2014 measurement date were the same as those used for the June 30, 2015 measurement date.
Discount Rate – The discount rate used to measure the total pension liability was 7.65% for the Plan. To determine whether the municipal bond rate should be used in the calculation of a discount rate for each plan, CalPERS stress tested plans that would most likely result in a discount rate that would be different from the actuarially assumed discount rate. Based on the testing, none of the tested plans run out of assets. Therefore, the current 7.65% discount rate is adequate and the use of the municipal bond rate calculation is not necessary. The long term expected discount rate of 7.65% is applied to all plans in the Public Employees Retirement Fund (PERF). The stress test results are presented in a detailed report that can be obtained from the CalPERS website.
64

CITY OF SAN PABLO NOTES TO BASIC FINANCIAL STATEMENTS
For the Year Ended June 30, 2016
NOTE 9 – EMPLOYEE BENEFIT PLANS (Continued)
The long-term expected rate of return on pension plan investments was determined using a building-block method in which best-estimate ranges of expected future real rates of return (expected returns, net of pension plan investment expense and inflation) are developed for each major asset class.
In determining the long-term expected rate of return, CalPERS took into account both short-term and long-term market return expectations as well as the expected pension fund cash flows. Such cash flows were developed assuming that both members and employers will make their required contributions on time and as scheduled in all future years. Using historical returns of all the funds’ asset classes, expected compound (geometric) returns were calculated over the short-term (first 10 years) and the long-term (11-60 years) using a building-block approach. Using the expected nominal returns for both short-term and long-term, the present value of benefits was calculated for each fund. The expected rate of return was set by calculating the single equivalent expected return that arrived at the same present value of benefits for cash flows as the one calculated using both short-term and long-term returns. The expected rate of return was then set equivalent to the single equivalent rate calculated above and rounded down to the nearest one quarter of one percent.
The table below reflects the long-term expected real rate of return by asset class. The rate of return was calculated using the capital market assumptions applied to determine the discount rate and asset allocation. These geometric rates of return are net of administrative expenses.
Asset Class
NewStrategic
AllocationReal Return
Years 1 - 10(a)Real ReturnYears 11+(b)
Global Equity 51.0% 5.25% 5.71%
Global Fixed Income 19.0% 0.99% 2.43%
Inflation Sensitive 6.0% 0.45% 3.36%
Private Equity 10.0% 6.83% 6.95%
Real Estate 10.0% 4.50% 5.13%
Infrastructure and Forestland 2.0% 4.50% 5.09%
Liquidity 2.0% -0.55% -1.05%
Total 100%
(a) An expected inflation of 2.5% used for this period.
(b) An expected inflation of 3.0% used for this period.
65
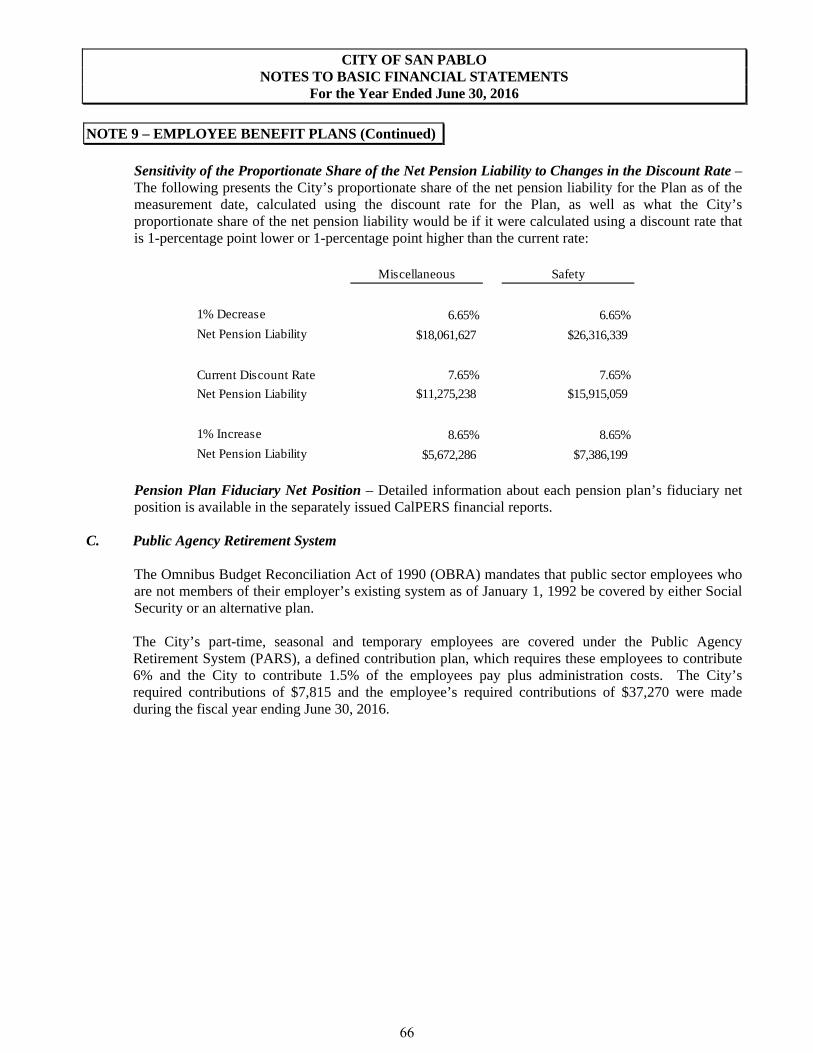
CITY OF SAN PABLO NOTES TO BASIC FINANCIAL STATEMENTS
For the Year Ended June 30, 2016
NOTE 9 – EMPLOYEE BENEFIT PLANS (Continued)
Sensitivity of the Proportionate Share of the Net Pension Liability to Changes in the Discount Rate – The following presents the City’s proportionate share of the net pension liability for the Plan as of the measurement date, calculated using the discount rate for the Plan, as well as what the City’s proportionate share of the net pension liability would be if it were calculated using a discount rate that is 1-percentage point lower or 1-percentage point higher than the current rate:
Miscellaneous Safety
1% Decrease 6.65% 6.65%
Net Pension Liability $18,061,627 $26,316,339
Current Discount Rate 7.65% 7.65%
Net Pension Liability $11,275,238 $15,915,059
1% Increase 8.65% 8.65%
Net Pension Liability $5,672,286 $7,386,199
Pension Plan Fiduciary Net Position – Detailed information about each pension plan’s fiduciary net position is available in the separately issued CalPERS financial reports.
C. Public Agency Retirement System
The Omnibus Budget Reconciliation Act of 1990 (OBRA) mandates that public sector employees who are not members of their employer’s existing system as of January 1, 1992 be covered by either Social Security or an alternative plan.
The City’s part-time, seasonal and temporary employees are covered under the Public Agency Retirement System (PARS), a defined contribution plan, which requires these employees to contribute 6% and the City to contribute 1.5% of the employees pay plus administration costs. The City’s required contributions of $7,815 and the employee’s required contributions of $37,270 were made during the fiscal year ending June 30, 2016.
66

CITY OF SAN PABLO NOTES TO BASIC FINANCIAL STATEMENTS
For the Year Ended June 30, 2016
NOTE 9 – EMPLOYEE BENEFIT PLANS (Continued)
D. Post Retirement Health Care Defined Benefit Plan
Description
In addition to the pension benefits described in A. above, the City provides medical and dental benefits to substantially all retirees under the City of San Pablo Retiree Health Savings Plan, an agent multiple-employer defined benefit healthcare plan. The Plan does not issue separate financial statements. Coverage is also provided for spouses of employees having a minimum of 20 years of service at retirement. As of June 30, 2016 there were 64 participants receiving these health care benefits.
The Plan provisions and benefits in effect at June 30, 2016 are summarized as follows:
San Pablo Police Association Local One
City Manager, City Attorney, Executive
Managers, and Elected Officials (E)
Confidential/Exempt, Division Managers
and AIE
Benefit Types Provided Medical only Medical only Medical and dental Medical only
Duration of Benefits (A) Lifetime (B) Lifetime (B) Lifetime Lifetime (B)
Required Service:Basic (PEMHCA minimum) ****Retirement under CALPERS ( 5 years. Service minimum)****
Supplemental 10 years for single 15 years 10 years 15 years20 years for two party
Minimum Age 50 50 50 50
Dependent CoverageMax one dependent
(20 years) Yes Yes Yes
City Contribution 100% 100% 100% 100% 100%
City Contribution Cap per Month (Basic) (C) $125 $125 $125 $125
City Contribution Cap per Month (Supp) Kaiser (D) 15 yrs. svc: $135 None 15 yrs. svc: $135
25 yrs. svc: $355 (F) 25 yrs. svc: $355 (F)
(A) Duration is subject to limitations as specified in the Memorandum of Understanding with each bargaining unit.(B) Supplemental coverage only to age 65.(C) Subject to minimum contributions under the Public Employees Medical and Hospital Care Act (PEMHCA) should
statutory minimums exceed the rates noted(D) Those hired before May 1, 1986 who have 20+ years of service with the City of San Pablo are entitled to single coverage beyond age 6
(F) $355 per month if receiving 2 party or family coverage
(E) Elected Officials are eligible for retiree medical if served 8 years (2 terms) and were elected prior to 2013, eligible for retiree dental if served 12 years
The City elected to establish an irrevocable trust to provide a funding mechanism for the postemployment benefits (OPEB). The activities of the Trust are accounted for in the Retiree Health Savings Plan Trust Fund.
67

CITY OF SAN PABLO NOTES TO BASIC FINANCIAL STATEMENTS
For the Year Ended June 30, 2016
NOTE 9 – EMPLOYEE BENEFIT PLANS (Continued) Funding Policy and Actuarial Assumptions The City’s policy is to prefund these benefits by accumulating assets in the Trust Fund discussed above pursuant to City Council Resolution 2007-024 (Resolution). The annual required contribution (ARC) was determined as part of a July 1, 2014 actuarial valuation using the entry age normal actuarial cost method. This is a projected benefit cost method, which takes into account those benefits that are expected to be earned in the future as well as those already accrued. The actuarial assumptions included (a) 6.8% investment rate of return, (b) 2.75% projected annual salary increase, (c) 4% health inflation increases, and (d) 2.75% inflation increases. Projections of benefits for financial reporting purposes are based on the substantive plan (the plan as understood by the City and the plan members) an include the types of benefits provided at the time of each valuation and the historical pattern of sharing benefit costs between the City and plan members to that point. The actuarial methods and assumptions used include techniques that smooth the effects of short-term volatility in actuarial accrued liabilities and the actuarial value of assets. Actuarial calculations reflect a long-term perspective and actuarial valuations involve estimates of the value of reported amounts and assumptions about the probability of events far into the future. Actuarially determined amounts are subject to revision at least biannually as results are compared to past expectations and new estimates are made about the future. The actuarial value of assets was determined using a 15-year smoothing formula and a 20% market value corridor. The City’s OPEB unfunded actuarial accrued liability is being amortized as a level percentage of projected payroll on a closed basis using a 30-year amortization period. In accordance with the Resolution, the City’s annual contributions to the Plan are based on pay-as-you-go financing plus an additional amount to prefund benefits as determined by the Council. Generally accepted accounting principles permit assets to be treated as OPEB assets and deducted from the Actuarial Accrued Liability when such assets are placed in an irrevocable trust or equivalent arrangement. Contributions to the City’s Trust began on April 20, 2006, thus these assets were excluded from the July 1, 2005 actuarial study. During the fiscal year ended June 30, 2016, the City contributed $492,879 to the Plan, representing pay-as-you-go premiums. As a result, the City has calculated and recorded the Net OPEB Asset, representing the difference between the ARC, amortization and contributions, as presented below:
Annual required contribution $196,633Interest on net OPEB obligation (asset) (290,463)Adjustment to annual required contribution 449,150
Annual OPEB cost 355,320Contributions made (492,879)
Increase in net OPEB asset (137,559)
Net OPEB asset June 30, 2015 (4,271,510)
Net OPEB asset June 30, 2016 ($4,409,069)
68

CITY OF SAN PABLO NOTES TO BASIC FINANCIAL STATEMENTS
For the Year Ended June 30, 2016
NOTE 9 – EMPLOYEE BENEFIT PLANS (Continued)
The Plan’s annual required contributions and actual contributions for the years ended June 30, 2013, 2014, and 2015 are set forth below:
Percentageof Annual Net OPEB
Annual Actual OPEB Cost ObligationFiscal Year OPEB Cost Contribution Contributed (Asset)
6/30/2014 $458,366 $375,417 82% ($4,100,588)
6/30/2015 339,583 510,505 150% (4,271,510)
6/30/2016 355,320 495,353 139% (4,409,069)
The Schedule of Funding Progress information below and the required supplementary information immediately following the notes to the financial statements presents multi-year trend information about whether the actuarial value of plan assets is increasing or decreasing over time relative to the actuarial accrued liability for benefits. Trend data from the most recent actuarial study is presented below:
OverfundedOverfunded (Underfunded)
Entry Age (Underfunded) ActuarialActuarial Actuarial Actuarial Liability as
Actuarial Value of Accrued Accrued Funded Covered Percentage ofValuation Assets Liability Liability Ratio Payroll Covered Payroll
Date (A) (B) (A – B) (A/B) (C) [(A – B)/C]
7/1/2014 $7,457,704 $7,020,530 $437,174 106.23% $12,503,086 3.5%
NOTE 10 - DEFERRED COMPENSATION PLAN
City employees may defer a portion of their compensation under a City sponsored Deferred Compensation Plan created in accordance with Internal Revenue Code Section 457. Under this plan, participants are not taxed on the deferred portion of their compensation until distributed to them; distributions may be made only at termination, retirement, death or in an emergency as defined by the Plan.
The laws governing deferred compensation plan assets require plan assets to be held by a Trust for the exclusive benefit of plan participants and their beneficiaries. Since the assets held under these plans are not the City’s property and are not subject to City control, they have been excluded from these financial statements.
69

CITY OF SAN PABLO NOTES TO BASIC FINANCIAL STATEMENTS
For the Year Ended June 30, 2016
NOTE 11 – RISK MANAGEMENT
A. Municipal Pooling Authority (MPA)
The City is a member of the Municipal Pooling Authority. The Authority provides coverage against the following types of loss risks under the terms of a joint-powers agreement with the City and several other cities and governmental agencies as follows:
$29,000,000Cyber Liability ($50,000) 2,000,000Public Entity Pollution Liability ($100,000) 1,000,000Vehicle - Physical Damage ($3,000 for police vehicles, $2,000
for all others) 250,000Worker’s Compensation (no deductible) Statutory LimitGovernment Crime Coverage ($10,000) 1,000,000Employment Liability Program ($100,000) 2,000,000Property
All Risk ($25,000) 1,000,000,000Flood* 25,000,000
Boiler & Machinery ($5,000) 100,000,000
* $100,000 minimum deductible, per occurrence, exceptZone A and V, which are subject to a $250,000 deductible,per occurrence
Liability ($10,000)Type of Coverage (Deductible) Coverage Limits
The Authority is governed by a Board consisting of representatives from member municipalities. The Board controls the operations of the Authority, including selection of management and approval of operating budgets, independent of any influence by member municipalities beyond their representation on the Board.
The City’s deposits with the Authority are in accordance with formulas established by the Authority. Actual surpluses or losses are shared according to a formula developed from overall loss costs and spread to member entities on a percentage basis after a retrospective rating.
Audited financial statements for the Authority are available from MPA, 1911 San Miguel Drive, Suite 200, Walnut Creek, CA 94596.
For the years ended June 30, 2016, 2015 and 2014 the amount of settlements did not exceed insurance coverage.
B. Liability for Uninsured Claims
The City provides for the uninsured portion of claims and judgments, including a provision for claims incurred but not reported, when a loss is deemed probable of assertion and the amount of the loss is reasonably determinable.
70

CITY OF SAN PABLO NOTES TO BASIC FINANCIAL STATEMENTS
For the Year Ended June 30, 2016
NOTE 11 – RISK MANAGEMENT (Continued)
The City’s liability for uninsured claims at June 30 was estimated by management based on claims experience reported by MPA and was computed as follows:
2016 2015
Beginning balance $77,371 $28,144
Provision for current fiscal year claims 44,449 47,829
Change in provision for prior fiscal year claims (38,392) 52,301
Claims paid (42,991) (50,903)
Ending balance $40,437 $77,371
June 30,
NOTE 12 – REDEVELOPMENT AGENCY DISSOLUTION AND SUCCESSOR AGENCY ACTIVITIES
A. Redevelopment Dissolution
In an effort to balance its budget, the State of California adopted ABx1 26 on June 28, 2011, amended by AB1484 on June 27, 2012, which suspended all new redevelopment activities except for limited specified activities as of that date and dissolved redevelopment agencies on January 31, 2012.
The suspension provisions prohibited all redevelopment agencies from a wide range of activities, including incurring new indebtedness or obligations, entering into or modifying agreements or contracts, acquiring or disposing of real property, taking actions to adopt or amend redevelopment plans and other similar actions, except actions required by law or to carry out existing enforceable obligations, as defined in ABx1 26.
In addition, ABx1 26 and AB1484 direct the State Controller to review the activities of all redevelopment agencies and successor agencies to determine whether an asset transfer between an agency and any public agency occurred on or after January 1, 2011. If an asset transfer did occur and the public agency that received the asset is not contractually committed to a third party for the expenditure or encumbrance of the asset, the legislation purports to require the State Controller to order the asset returned to the redevelopment agency. The State Controller’s Office completed its asset transfer review during fiscal year 2013 and required the City to make a payment of $213,606 to the Successor Agency to return funds spent on a project the State determined were incurred subsequent to January 1, 2011. The City made the payment to the Successor Agency during fiscal year 2013.
Effective January 31, 2012, the Redevelopment Agency was dissolved. Certain assets of the Redevelopment Agency Low and Moderate Income Housing Fund were distributed to a Housing Successor, and all remaining Redevelopment Agency assets and liabilities were distributed to a Successor Agency.
Under the provisions of AB 1484, the City can elect to become the Housing Successor and retain the housing assets. The City initially declined to become the Housing Successor, however after other agencies refused to assume the responsibility, the City elected to become the temporary Housing Successor and on February 1, 2012, certain housing assets were transferred to the City’s Low and Moderate Income Housing Asset Special Revenue Fund. On February 18, 2014, the Council passed a resolution which will allow the City to operate as the temporary Housing Successor until such time when another agency takes up this responsibility.
71

CITY OF SAN PABLO NOTES TO BASIC FINANCIAL STATEMENTS
For the Year Ended June 30, 2016
NOTE 12 – REDEVELOPMENT AGENCY DISSOLUTION AND SUCCESSOR AGENCY ACTIVITIES (Continued)
The City also elected to become the Successor Agency and on February 1, 2012 the Redevelopment Agency’s remaining assets were distributed to and liabilities were assumed by the Successor Agency. ABx1 26 requires the establishment of an Oversight Board to oversee the activities of the Successor Agency and one was established on April 30, 2012. The activities of the Successor Agency are subject to review and approval of the Oversight Board, which is comprised of seven members, including one member of City Council and one former Redevelopment Agency employee appointed by the Mayor. The activities of the Housing Successor are reported in the Low and Moderate Income Housing Assets Special Revenue Fund as the City has control of those assets, which may be used in accordance with the low and moderate income housing provisions of California Redevelopment Law. The activities of the Successor Agency are reported in the Successor Agency to the Redevelopment Agency Private-Purpose Trust Fund as the activities are under the control of the Oversight Board. The City provides administrative services to the Successor Agency to wind down the affairs of the former Redevelopment Agency. AB1484 required the Successor Agency to complete two due diligence reviews – one for the low and moderate income housing assets of the Successor Agency (Housing DDR), and a second for all other balances of the Successor Agency (Non-housing DDR). The due diligence reviews are to calculate the balance of unencumbered balances as of June 30, 2012 available to be remitted to the County for disbursement to taxing entities. The Successor Agency submitted both due diligence reviews to the State Department of Finance for review and approval. The Department of Finance approved the Housing DDR and the Successor Agency remitted the unencumbered balance of $137,054 to the County in July 2013. The Department of Finance did not initially approve the Non-housing DDR, which indicated that the Successor Agency did not have any unencumbered balances, and the State made adjustments to the Non-housing DDR and instead made a demand for the return of funds totaling $4,614,196. The Successor Agency disputed the demand and requested a meet and confer with the State and the State adjusted the demand to zero. The Successor Agency received its Finding of Completion on September 16, 2013. Cash and investments of the Successor Agency as of June 30, 2016 are discussed in Note 3 above. Information presented in the following footnotes represents other assets and liabilities of the Successor Agency as of June 30, 2016.
72

CITY OF SAN PABLO NOTES TO BASIC FINANCIAL STATEMENTS
For the Year Ended June 30, 2016
NOTE 12 – REDEVELOPMENT AGENCY DISSOLUTION AND SUCCESSOR AGENCY ACTIVITIES (Continued)
B. Loans Receivable
The Successor Agency assumed the non-housing loans receivable of the Redevelopment Agency as of February 1, 2012. The Redevelopment Agency engaged in programs designed to encourage construction of or improvement to low-to-moderate income housing. Under these programs, grants or loans were provided under favorable terms to homeowners or developers who agreed to expend these funds in accordance with the Agency’s terms.
During fiscal year 2016, in conjunction with the sale of Successor Agency-owned property, the Successor Agency agreed to loan the funds necessary for the land purchase to the buyer. The loan is secured by a promissory note and deed of trust on the property. The Note bears simple annual interest of 3.25% and interest payments are due annually each December through 2039. The principal balance of the Note is due on December 10, 2039. The balance of the note receivable was $716,574 as of June 30, 2016.
During fiscal year 2016, the Successor Agency agreed to an additional loan to the buyer. The loan is secured by a promissory note and deed of trust on the property. The Note bears simple annual interest of 3.25% and interest payments are due annually each November through 2040. The principal balance of the Note is due on November 20, 2040. The balance of the note receivable was $264,559 as of June 30, 2016.
The balances of the notes receivable arising from these programs at June 30, 2016 are set forth below:
Plaza Sobrante $16,321Micro Loan Program 67,345Pakpour Loan 981,133
Total $1,064,799
C. Property Held for Resale
The Successor Agency assumed the property held for resale of the Redevelopment Agency as of February 1, 2012. The Redevelopment Agency had purchased parcels of land as part of its efforts to develop or redevelop blighted properties within the Redevelopment areas. Such land parcels are accounted for at the lower of cost or net realizable value or agreed-upon sales price if a disposition agreement has been made with a developer.
D. Capital Assets
The Successor Agency assumed the capital assets of the Redevelopment Agency as of February 1, 2012. All capital assets are valued at historical cost or estimated historical cost if actual historical cost is not available. Contributed capital assets are valued at their estimated fair market value on the date contributed. The Successor Agency’s policy is to capitalize all assets with costs exceeding certain minimum thresholds and with useful lives exceeding two years.
73

CITY OF SAN PABLO NOTES TO BASIC FINANCIAL STATEMENTS
For the Year Ended June 30, 2016
NOTE 12 – REDEVELOPMENT AGENCY DISSOLUTION AND SUCCESSOR AGENCY ACTIVITIES (Continued)
All capital assets with limited useful lives are depreciated over their estimated useful lives. The purpose of depreciation is to spread the cost of capital assets equitably among all users over the life of these assets. The amount charged to depreciation expense each year represents that year’s pro rata share of the cost of capital assets.
Depreciation of all capital assets is charged as an expense against operations each year and the total amount of depreciation taken over the years, called accumulated depreciation, is reported on the balance sheet as a reduction in the book value of capital assets.
Depreciation is provided using the straight line method, which means the cost of the asset is divided by its expected useful life in years and the result is charged to expense each year until the asset is fully depreciated. The Successor Agency has assigned the useful lives and capitalization thresholds listed below to capital assets.
UsefulLives Capitalization Years Threshold
Buildings and Improvements 10-50 $25,000Machinery and Equipment 5-10 5,000Vehicles 5-10 5,000
Major outlays for capital assets and improvements are capitalized as projects are constructed. Interest incurred during the construction phase is reflected in the capitalized value of the asset constructed, net of interest earned on the invested proceeds over the same period.
Capital assets recorded at June 30 comprise:
Balance at Balance atJune 30, 2015 Additions June 30, 2016
Capital assets not being depreciated:
Land and land improvements $2,819,393 $2,819,393
Total capital assets not being depreciated 2,819,393 2,819,393
Capital assets being depreciated:
Buildings and improvements 2,630,082 2,630,082
Machinery and equipment 92,202 92,202
Vehicles 145,213 145,213
Total capital assets being depreciated 2,867,497 2,867,497
Less accumulated depreciation for:
Buildings and improvements 1,278,180 $65,752 1,343,932
Machinery and equipment 92,202 92,202
Vehicles 143,485 143,485
Total accumulated depreciation 1,513,867 65,752 1,579,619
Net capital assets being depreciated 1,353,630 (65,752) 1,287,878
Capital assets, net $4,173,023 ($65,752) $4,107,271
74

CITY OF SAN PABLO NOTES TO BASIC FINANCIAL STATEMENTS
For the Year Ended June 30, 2016
NOTE 12 – REDEVELOPMENT AGENCY DISSOLUTION AND SUCCESSOR AGENCY ACTIVITIES (Continued)
E. Long-Term Obligations The Successor Agency assumed the long-term debt and loans of the Redevelopment Agency as of
February 1, 2012.
Bond premiums and discounts are deferred and amortized over the life of the bonds using the effective interest method. Bonds payable are reported net of the applicable bond discount and gross of the applicable premium. Any differences between refunded debt and the debt issued to refund it are amortized over the remaining life of either the refunded debt or the refunding debt, whichever is shorter. The deferred charge on refunding is reported as a deferred outflow or deferred inflow of resources, as applicable. Bond issuance costs, other than prepaid insurance, are expensed in the year incurred.
1. Tax Allocation Bonds and Loans
All of the long-term debt of the Successor Agency is comprised of Tax Allocation Bonds and loans issued by the Redevelopment Agency. The Bonds and Loans are special obligations of the Agency and are secured only by the Agency’s tax increment revenues. Tax Allocation Bond and loan transactions were as follows:
OriginalIssue Balance Balance Current
Amount June 30, 2015 Additions Retirements June 30, 2016 Portion
Tax Allocation Bonds: Tax Allocation Revenue Bonds Series 2001
Capital Appreciation Bonds 5.66-5.68%, due 12/01/2029 $12,055,000 $2,252,307 $129,446 $2,381,753
Tax Allocation Revenue Bonds Series 20042.00-5.00%, due 12/01/2019 37,755,000 8,610,000 $675,000 7,935,000 $2,555,000
SERAF Loan 2%, due 5/10/2021 1,222,860 1,056,330 85,492 970,838 87,201
Tax Allocation Refunding Bonds Series 2014A2.00-5.00%, due 6/15/2031 47,595,000 46,320,000 850,000 45,470,000 1,805,000
Premium 6,429,385 6,051,186 378,199 5,672,987 Tax Allocation Refunding Bonds Series 2014B
2.00-5.00%, due 6/15/2023 6,970,000 5,585,000 5,585,000Premium 859,238 763,767 95,471 668,296
Total Tax Allocation Bonds 70,638,590 129,446 2,084,162 68,683,874 4,447,201
Housing Successor Loans: 2010 Loan 3,000,000 3,000,000 1,384,326 1,615,674 2011 Loan 2,865,000 2,865,000 2,865,000
Total Housing Successor Loans 5,865,000 1,384,326 4,480,674
Total Successor Agency Debt $76,503,590 $129,446 $3,468,488 $73,164,548 $4,447,201
75

CITY OF SAN PABLO NOTES TO BASIC FINANCIAL STATEMENTS
For the Year Ended June 30, 2016
NOTE 12 – REDEVELOPMENT AGENCY DISSOLUTION AND SUCCESSOR AGENCY ACTIVITIES (Continued)
2. Debt Service Requirements
Debt service requirements are shown below for all long-term debt except the HousingSuccessor loans, because the ultimate repayment terms cannot be determined at this time asdiscussed in 8. below:
For the Year Ending June 30 Principal (1) Interest Total2017 $4,447,201 $2,919,189 $7,366,3902018 4,743,945 2,830,581 $7,574,5262019 1,650,724 2,664,973 $4,315,6972020 7,097,539 2,484,494 $9,582,0332021 4,866,429 2,358,954 $7,225,383
2022-2026 21,470,000 7,144,000 $28,614,0002027-2031 19,985,000 2,526,750 $22,511,750
Total $64,260,838 $22,928,941 $87,189,779
(1) Includes unaccreted discount totaling $1,918,247
3. 1999 Tax Allocation Bonds
On June 10, 1999, the Agency issued $9,850,000 of Subordinate Tax Allocation Bonds, Series1999A to defease $3,950,000 of the 1990 Subordinate Tax Allocation Bonds, and to fundcapital projects in the Tenth Township Project Area. The 1990 Bonds were called on May 1,2001. The 1999 Bonds are special obligations of the Agency and are secured by the Agency’stax increment revenues. Annual principal payments on the 1999 Bonds are due December 1,and semi-annual interest payments are due June 1 and December 1, through 2023. 1999 Bondsmaturing on or after December 1, 2010 are subject to call on any interest payment date at parplus a premium of up to two percent.
On September, 2014, the Agency issued 2014 Series B Refunding Tax Allocation Bonds in theamount of $6,970,000 to refund the remaining $3,380,000 of the 1999 Tax Allocation Bonds.
4. 2001 Tax Allocation Revenue Bonds
On March 22, 2001, the Redevelopment Agency issued $12,997,670 of Tax AllocationRevenue Bonds, Series 2001 to defease $4,665,000 of outstanding 1990 Tax Allocation Bonds,and to fund capital projects in the Legacy and Tenth Township Project Areas. The Bonds arespecial obligations of the Agency and are secured by the Agency’s tax increment revenues.The defeased 1990 Bonds were called May 1, 2001.
The 2001 Bonds consist of $7,855,000 original principal amount of Current Interest SerialBonds, $2,280,000 original principal amount of Current Interest Term Bonds, and $2,862,670of Capital Appreciation Bonds which pay no interest but which accrete in value to $12,055,000at their redemption date. Interest payments on the Term Bonds are payable semiannually onJune 1 and December 1.
76

CITY OF SAN PABLO NOTES TO BASIC FINANCIAL STATEMENTS
For the Year Ended June 30, 2016
NOTE 12 – REDEVELOPMENT AGENCY DISSOLUTION AND SUCCESSOR AGENCY ACTIVITIES (Continued)
During fiscal year 2004 the Agency undertook an internal transaction to substitute new debt in the principal amount of $1,265,000 issued by the Tenth Township Project Area for old debt of the Legacy Project Area.
On June 1, 2014, the Agency issued 2014 Series A Refunding Tax Allocation Bonds in the amount of $47,595,000 to refund $4,345,000 of the Current Interest Serial Bonds, and defease $3,837,533 of the Capital Appreciation Bonds.
As of June 30, 2016, the 2001 Bonds Capital Appreciation Bonds unaccreted discount totaled $1,918,247 and the outstanding balance increased $129,446 due to the annual increase in accreted value. Principal and interest payments of $940,000, $840,000, $840,000, $560,000, $560,000 and $560,000 commence December 1, 2024 and continue through December 1, 2029.
5. 2004 Tax Allocation Revenue Bonds
On March 18, 2004, the Agency issued $37,755,000 of Tax Allocation Revenue Bonds, Series2004 to defease $13,910,000 of outstanding 1993 Tax Allocation Bonds, and to fund capitalprojects in the Legacy and Tenth Township Project Areas. The defeased 1993 Bonds werecalled on December 1, 2004. The 2004 Bonds are special obligations of the Agency and aresecured by the Agency’s tax increment revenues. Annual principal payments on the 2004Bonds are due December 1, and semi-annual interest payments are due June 1 and December 1,through 2019.
On June 1, 2014, the Agency issued 2014 Series A Refunding Tax Allocation Bonds in theamount of $47,595,000 to refund $15,345,000 of the 2004 Tax Allocation Revenue Bonds.
On August 27, 2014, the Agency issued 2014 Series B Refunding Tax Allocation Bonds in theamount of $6,970,000 to refund $5,480,000 of the 2004 Tax Allocation Bonds.
6. 2014 Tax Allocation Bonds, Series A and Series B
On June 1, 2014, the Agency issued $47,595,000 in 2014 Tax Allocation Bonds, Series A. Theproceeds of these bonds, secured by property tax revenues in the Redevelopment Property TaxTrust Fund, were used to refund and defease the outstanding 2001 Tax Allocation RevenueSerial and Term Bonds, a portion of the 2001 Tax Allocation Revenue Capital AppreciationBonds, a portion of the 2004 Tax Allocation Revenue Bonds and the outstanding balance of the2006 Subordinate Tax Allocation Bonds. The refunding reduced the total debt servicepayments over 19 years by $4,048,958 and resulted in an economic gain (difference betweenthe present values of the debt service payments on the old and new debt) of $4,034,727. The2006 Bonds were called on June 27, 2014 and the outstanding balance of the defeased 2004Bonds was $3,114,402 as of June 30, 2016.
With the issuance of the 2014A Bonds, on June 3, 2014 the Successor Agency entered into aForward Delivery Bond Purchase Agreement with the Underwriter for the subsequently issuedSeries 2014B Refunding Bonds. Under the terms of the Agreement, the Underwriter agreed topurchase from the Successor Agency all of the 2014B Bonds.
77

CITY OF SAN PABLO NOTES TO BASIC FINANCIAL STATEMENTS
For the Year Ended June 30, 2016
NOTE 12 – REDEVELOPMENT AGENCY DISSOLUTION AND SUCCESSOR AGENCY ACTIVITIES (Continued)
On August 27, 2014, the Successor Agency issued the 2014 Series B Tax Allocation Bonds in
the principal amount of $6,970,000. The proceeds of these bonds, secured by property tax revenues in the Redevelopment Property Tax Trust Fund, are to be used to refund the total amount outstanding the 1999A Tax Allocations Bonds and a portion of the 2004 Tax Allocation Bonds.
The 2014A and 2014B Bonds are secured by the Successor Agency’s property tax revenues in the Redevelopment Property Tax Trust Fund. Annual principal payments on the 2014A Bonds are due December 15, and semi-annual interest payments are due June 15 and December 15, through 2031. Annual principal payments on the 2014B Bonds are due June 15, 2015, 2021, 2022 and 2023, and semi-annual interest payments are due December 15 and June 15, through 2023.
7. SERAF Loan from State of California
The State of California adopted AB26 4X in July 2009 which directs that a portion of the incremental property taxes received by the redevelopment agencies, be paid instead to the County Supplemental Educational Revenue Augmentation Fund (SERAF) in fiscal years 2010 and 2011. The Agency did not have the resources to make the 2011 payment and instead was able to enter into a structured payment plan agreement with the State Department of Finance that allows the payment to the County to be made over a ten-year period. The Tenth Township and Legacy Project Areas will pay 88.6% and 11.4% of the loan, respectively. The loan bears interest at a rate of 2%. Annual payments commence on May 10, 2011 with one principal and interest payment, followed by two interest-only payments, then payments of principal and interest May 10, 2014 through May 10, 2020, followed by one final principal payment on May 10, 2021.
8. Supplemental Education Revenue Augmentation Fund Loans from Housing Successor During the fiscal year ending June 30, 2010 the Agency approved an interfund advance of $3,000,000 from the Agency Low and Moderate Income Housing Fund to the Redevelopment Agency Projects Fund for the purpose of paying the Agency’s share of the countywide Supplemental Education Revenue Augmentation Fund. In August 2011 the Agency approved a second interfund advance for the year ended June 30, 2011 of $2,865,000 from the Agency Low and Moderate Income Housing Fund to the Redevelopment Agency Projects Fund for the purpose of funding the full amount of the Agency’s 2010 SERAF payment.
78

CITY OF SAN PABLO NOTES TO BASIC FINANCIAL STATEMENTS
For the Year Ended June 30, 2016
NOTE 12 – REDEVELOPMENT AGENCY DISSOLUTION AND SUCCESSOR AGENCY ACTIVITIES (Continued)
The above loans had previously been reported as interfund advances within the Redevelopment Agency, but with the transfer of the Redevelopment Agency’s liabilities to the Successor Agency, the advances are now reported as long-term debt of the Successor Agency, payable to the Low and Moderate Income Housing Asset Fund of the City of San Pablo, serving as the Housing Successor to the former Agency, pursuant to Health and Safety Code Section 34176(d). These loans were originally required to be repaid by June 30, 2015, however, repayment is now governed by Health and Safety Code Section 34176(e)(6).
The State of California Department of Finance has stated that repayment cannot begin prior to fiscal year 2014-2015, and the maximum annual repayment amount is limited based on calculations in Health and Safety Code Section 34176(e)(6). There was $1,384,326 in funds available for repayment in fiscal year 2016.
9. Pledged Revenues
As discussed above, the Agency has pledged all future tax increment revenues, less amountsrequired to be set aside in the Redevelopment Agency Low and Moderate Income HousingFund, for the repayment of the Tax Allocation Bonds. The 1999A, 2001 and 2004 Bonds areconsidered senior parity obligations, while the 2014A and 2014B Bonds are subordinated tothose Bonds. The pledge of all future tax increment revenues ends upon repayment of$87,189,779 remaining debt service on the Bonds above, which is scheduled to occur in 2031.With the issuance of the 2014B Bonds, projected tax increment revenues are expected toprovide coverage over debt service of 149%-241% over the life of the outstanding Bonds. Withthe dissolution of the Redevelopment Agency discussed above, Tax Increment is no longerdistributed, and instead the Successor Agency receives payments from the County’sRedevelopment Property Tax Trust Fund (RPTTF) that are to be used to fund debt service onthe Bonds, with no distinction between housing and non-housing revenues.
Beginning in fiscal year 2012, under the provisions of the laws dissolving the RedevelopmentAgency, the Successor Agency only receives the funds necessary to fulfill its approvedobligations. Total tax increment available for distribution to the Successor Agency and othertaxing entities for fiscal year 2016 calculated by the County Auditor-Controller was$5,370,095, and the total received by the Successor Agency for fiscal year 2016 debt servicewas $8,159,295, which represented coverage of 191% of the $4,267,195 of debt service. Thelesser tax distribution was deemed sufficient, because the Agency had other revenues/resourcesavailable to direct towards debt service.
With the issuance of the 2014A Bonds in June 2014, the Successor Agency entered into aCustody Agreement with the Contra Costa County Auditor-Controller and the Bond trustee,Wells Fargo Bank, under which the County will remit all amounts payable under theRecognized Obligation Payment Schedule (ROPS) to the Bond trustee. Upon receipt of fundsfrom the County, the Bond trustee uses the funds to first pay the debt service on the SeniorBonds, followed by the debt service for the Subordinate Bonds. Any funds remaining ondeposit with the Bond trustee after the debt service payments are then transferred to theSuccessor Agency for payment of its other non-debt-service obligations.
79
CITY OF SAN PABLO NOTES TO BASIC FINANCIAL STATEMENTS
For the Year Ended June 30, 2016
NOTE 12 – REDEVELOPMENT AGENCY DISSOLUTION AND SUCCESSOR AGENCY ACTIVITIES (Continued)
F. Commitments and Contingencies
State Approval of Enforceable Obligations
The Successor Agency prepares a Recognized Obligation Payment Schedule (ROPS) semi-annually that contains all proposed expenditures for the subsequent six-month period. The ROPS is subject to the review and approval of the Oversight Board as well as the State Department of Finance. Although the State Department of Finance may not question items included on the ROPS in one period, they may question the same items in a future period and disallow associated activities. The amount, if any, of current obligations that may be denied by the State Department of Finance cannot be determined at this time. The City expects such amounts, if any, to be immaterial.
G. Subsequent Event
2016 Subordinate Tax Allocation Refunding Bonds
On August 1, 2016, the Successor Agency issued the 2016 Series Tax Allocation Refunding Bonds in the principal amount of $2,685,531. The proceeds of these bonds, secured by property tax revenues in the Redevelopment Property Tax Trust Fund, are to be used to refund the total amount outstanding for the 2001 Tax Allocations Bonds.
NOTE 13 - JOINT POWERS AGREEMENTS
A. West Contra Costa Integrated Waste Management Authority (WCCIWMA)
WCCIWMA was established in 1991 to coordinate landfill use reduction in the West Contra Costa County Area as mandated by the State of California. The City was not required to make any contributions to WCCIWMA during fiscal year 2016. The City is represented by one Director.
Audited financial statements may be obtained from the WCCIWMA, care of the City of Hercules, 111 Civic Drive, Hercules, CA 94547.
B. West Contra Costa Transportation Advisory Committee (WCCTAC)
WCCTAC was established in 1990 to develop regional strategies and meet regional requirements established by Measure C and to cooperatively address West Contra Costa County transportation issues. The City’s payments to WCCTAC are in accordance with a formula under which each member Agency pays a proportionate share of the expenditures based on the number of voting members representing each Agency. The City has one voting member on the WCCTAC and pays 9.1% of the expenditures. For fiscal year 2015-2016, the dues paid to WCCTAC were $36,675.
Audited financial statements may be obtained from the WCCTAC, care of the City of San Pablo, One Alvarado Square, San Pablo, CA 94806.
80

CITY OF SAN PABLO NOTES TO BASIC FINANCIAL STATEMENTS
For the Year Ended June 30, 2016
NOTE 14 – OPERATING LEASES A. Rumrill Sports Park Lease
The City entered into an agreement with the Healthy Eating Active Living, LLC (HEAL), a controlled affiliate of the Economic Development Corporation, in February 2015 to lease the former BNSF property for the Rumrill Sports Park project for a term of 55 years. Under the terms of the lease, HEAL prepaid the rent in the amount of $1,600,000 in fiscal year 2015. During fiscal year 2016, the City recognized lease rental income in the amount of $9,697, and the remaining balance of unearned revenue was $1,590,303 as of June 30, 2016.
B. Office Building Lease
The City entered into an agreement with Lifelong Medical Care in July 2015 to lease an office building for a term of five years starting July 1, 2015, with an option to extend for a period of three years under the same terms of the lease. Monthly rental payments of $26,025 are due from July 1, 2015 through August 1, 2015, increasing to $37,472 from September 1, 2015 to June 1, 2016. Monthly rental payments subsequent to June 1, 2016 will increase annually by the Consumer Price Index for All Urban Consumers U.S. City Average, All Items, as defined in the lease agreement. During the lease term, the building is to be used for professional medical clinic and office purposes, health care associated services, dental services, retail pharmacy and general office purposes
NOTE 15 - COMMITMENTS AND CONTINGENCIES A. Litigation
The City is subject to litigation arising in the normal course of business. In the opinion of the City Attorney there is no presently filed litigation which is likely to have a material adverse effect on the financial position of the City.
B. Pollution Remediation
The City has one known pollution remediation project that the former Redevelopment Agency had undertaken. Under a Voluntary Cleanup Agreement with the California Department of Toxic Substances Control (DTSC), the Redevelopment Agency had planned to clean up the former Burlington Northern Santa Fe Property on Rumrill Boulevard to provide for future unrestricted land use. The property was conveyed by the Redevelopment Agency to the City in fiscal year 2011 and, due to the dissolution of the Agency, the City assumed the remediation project. The City had started a Removal Action Work Plan (RAW), and although the initial cost of the preferred alternative remediation was estimated to be $712,000, an updated RAW was obtained in August 2012 and the current estimated cost of the preferred alternative remediation is estimated to be $1,220,000. The final RAW was obtained in May 2013, and the preferred alternative remediation was $1,220,000. In addition, the City expected to incur other costs associated with the project of approximately $280,000. The City had recorded an accrued liability of $1,500,000. During fiscal year 2015, the City incurred costs totaling $2,105,518 associated with the project and the cleanup was accepted as complete by the DTSC on January 16, 2015. The City does not expect to incur any future costs related to the project.
81
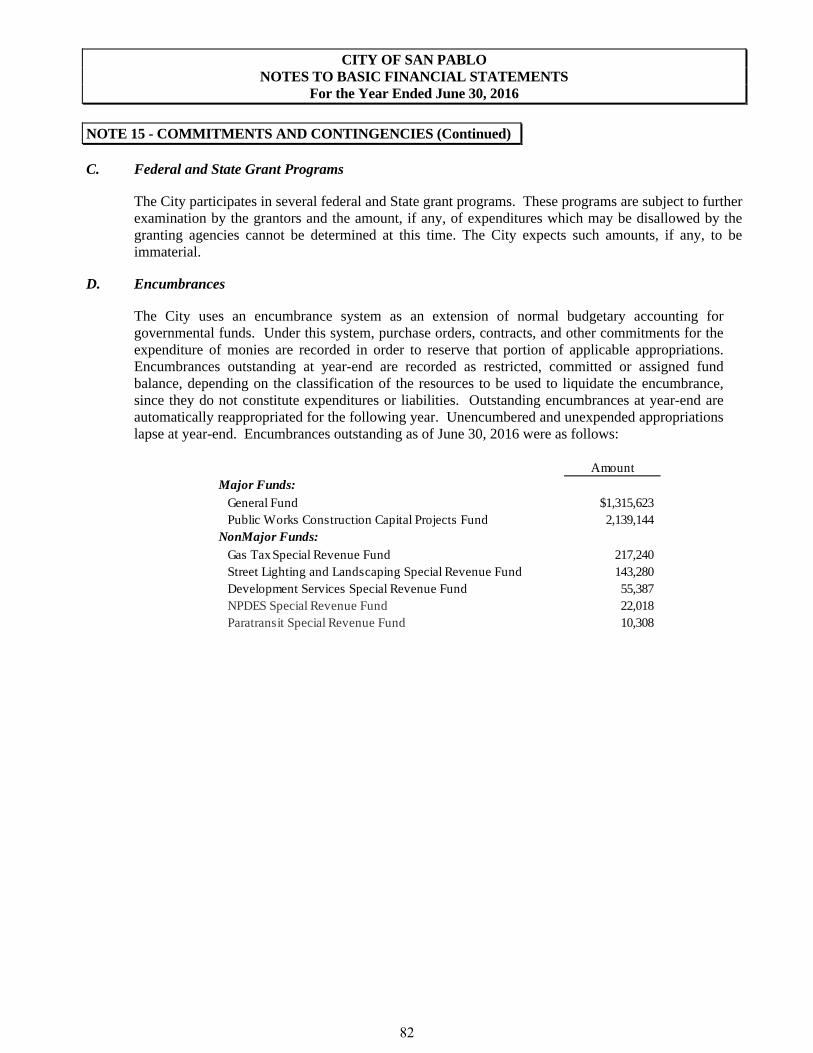
CITY OF SAN PABLO NOTES TO BASIC FINANCIAL STATEMENTS
For the Year Ended June 30, 2016
NOTE 15 - COMMITMENTS AND CONTINGENCIES (Continued)
C. Federal and State Grant Programs
The City participates in several federal and State grant programs. These programs are subject to further examination by the grantors and the amount, if any, of expenditures which may be disallowed by the granting agencies cannot be determined at this time. The City expects such amounts, if any, to be immaterial.
D. Encumbrances
The City uses an encumbrance system as an extension of normal budgetary accounting for governmental funds. Under this system, purchase orders, contracts, and other commitments for the expenditure of monies are recorded in order to reserve that portion of applicable appropriations. Encumbrances outstanding at year-end are recorded as restricted, committed or assigned fund balance, depending on the classification of the resources to be used to liquidate the encumbrance, since they do not constitute expenditures or liabilities. Outstanding encumbrances at year-end are automatically reappropriated for the following year. Unencumbered and unexpended appropriations lapse at year-end. Encumbrances outstanding as of June 30, 2016 were as follows:
AmountMajor Funds:
General Fund $1,315,623Public Works Construction Capital Projects Fund 2,139,144
NonMajor Funds:
Gas Tax Special Revenue Fund 217,240Street Lighting and Landscaping Special Revenue Fund 143,280Development Services Special Revenue Fund 55,387NPDES Special Revenue Fund 22,018Paratransit Special Revenue Fund 10,308
82

REQUIRED SUPPLEMENTARY INFORMATION


REQUIRED SUPPLEMENTARY INFORMATION
POST RETIREMENT HEALTH CARE DEFINED BENEFIT PLAN SCHEDULE OF FUNDING PROGRESS
Overfunded
Overfunded (Underfunded)
Entry Age (Underfunded) Actuarial
Actuarial Actuarial Actuarial Liability as
Actuarial Value of Accrued Accrued Funded Covered Percentage of
Valuation Assets Liability Liability Ratio Payroll Covered Payroll
Date (A) (B) (A – B) (A/B) (C) [(A – B)/C]
7/1/2008 $5,051,901 $4,386,044 $665,857 115.18% $13,455,712 4.9%7/1/2011 6,129,795 6,067,235 62,560 101.03% 12,707,312 0.5%7/1/2014 7,457,704 7,020,530 437,174 106.23% 12,503,086 3.5%
SCHEDULE OF CONTRIBUTIONS
Percentageof Annual Net OPEB
Annual Actual OPEB Cost ObligationFiscal Year OPEB Cost Contribution Contributed (Asset)
6/30/2014 $458,366 $375,417 82% ($4,100,588)
6/30/2015 339,583 510,505 150% (4,271,510)
6/30/2016 355,320 495,353 139% (4,409,069)
85

REQUIRED SUPPLEMENTARY INFORMATION
Measurement Date 6/30/2014 6/30/2015
Plan's Proportion of the Net Pension Liability (Asset) 0.33724% 0.41099%
Plan's Proportionate Share of the Net Pension Liability/(Asset) $8,334,746 $11,275,238
Plan's Covered-Employee Payroll $5,337,473 $5,425,672
Plan's Proportionate Share of the Net Pension Liability/(Asset) as a Percentage of its Covered-Employee Payroll 156.16% 207.81%
Plan's Proportionate Share of the Fiduciary Net Position as a Percentage of the Plan’s Total Pension Liability 0.31101% 0.28268%
* Fiscal year 2015 was the 1st year of implementation, therefore only two years are shown.
City of San Pablo Miscellaneous Rate Plan, a Cost Sharing-Employer Defined Pension PlanLast 10 Years*
SCHEDULE OF THE CITY'S PROPORTIONATE SHARE OF THE NET PENSION LIABILITYMiscellaneous Plan
86

REQUIRED SUPPLEMENTARY INFORMATION
2015 2016
Actuarially determined contribution $658,427 $872,009Contributions in relation to the actuarially determined contributions 658,427 872,009
Contribution deficiency (excess) $0 $0
Covered-employee payroll $5,425,672 $6,288,753
Contributions as a percentage of covered-employee payroll 12.14% 13.87%
* Fiscal year 2015 was the 1st year of implementation, therefore only two years are shown.
City of San Pablo Miscellaneous Rate Plan, a Cost Sharing-Employer Defined Pension PlanLast 10 Years*
SCHEDULE OF CONTRIBUTIONSMiscellaneous Plan
87

REQUIRED SUPPLEMENTARY INFORMATION
Measurement Date 6/30/2014 6/30/2015
Plan's Proportion of the Net Pension Liability (Asset) 0.36611% 0.38625%
Plan's Proportionate Share of the Net Pension Liability/(Asset) $13,732,752 $15,915,059
Plan's Covered-Employee Payroll $6,301,922 $6,333,912
Plan's Proportionate Share of the Net Pension Liability/(Asset) as a Percentage of its Covered-Employee Payroll 217.91% 251.27%
Plan's Proportionate Share of the Fiduciary Net Position as a Percentage of the Plan’s Total Pension Liability 0.33960% 0.33061%
* Fiscal year 2015 was the 1st year of implementation, therefore only two years are shown.
City of San Pablo Safety Rate Plan, a Cost Sharing-Employer Defined Pension PlanLast 10 Years*
SCHEDULE OF THE CITY'S PROPORTIONATE SHARE OF THE NET PENSION LIABILITYSafety Plan
88

REQUIRED SUPPLEMENTARY INFORMATION
2015 2016
Actuarially determined contribution $1,494,686 $1,663,467Contributions in relation to the actuarially determined contributions 1,494,686 1,663,467
Contribution deficiency (excess) $0 $0
Covered-employee payroll $6,333,912 $6,182,357
Contributions as a percentage of covered-employee payroll 23.60% 26.91%
* Fiscal year 2015 was the 1st year of implementation, therefore only two years are shown.
City of San Pablo Safety Rate Plan, a Cost Sharing-Employer Defined Pension PlanLast 10 Years*
SCHEDULE OF CONTRIBUTIONSSafety Plan
89


SUPPLEMENTARY INFORMATION


NON-MAJOR GOVERNMENTAL FUNDS
SPECIAL REVENUE FUNDS
GAS TAX
This fund accounts for revenues and expenditures received from the State of California under Street and Highways Code Section 2105, 2106, 2107 and 2107.5. The allocations must be spent for street maintenance and construction and a limited amount for engineering.
PUBLIC SAFETY
This fund accounts for sales tax allocations required pursuant to Proposition 172. These funds are used to fund public safety activities.
STREET LIGHTING AND LANDSCAPING
This fund accounts for assessments made upon parcels of land within the Street Lighting and Landscaping District and disburses funds in accordance with the provisions of the State of California Streets and Highway Code.
N.P.D.E.S.
This fund accounts for revenues and expenditures from assessments levied on all real property in the City in compliance with the provisions of the National Pollution Discharge Elimination System.
DEVELOPMENT SERVICES
This fund accounts for revenues generated from permit and inspection fees and disburses funds to support this activity.
MEASURE C / J
This fund accounts for the portion of the half-cent County-wide sales tax levied to fund transportation improvements to local streets.
ASSET SEIZURES
This fund accounts for revenues received from both adjudicated and unadjudicated sales of assets seized during drug-related arrests and disburses these funds for authorized public safety activities.
PARATRANSIT
This fund accounts for revenues received from the portion of the half cent County-wide sales tax levied to fund expenditures for paratransit service.
LAW ENFORCEMENT SERVICES
This fund accounts for revenues received from the Supplemental Law Enforcement Services Grant, the Local Law Enforcement Block Grant, and court fines.
93

NON-MAJOR GOVERNMENTAL FUNDS (Continued)
TRAFFIC CONGESTION RELIEF
This fund accounts for the revenues received from the State of California under AB2928. The allocations must be spent on local streets and roads maintenance, rehabilitation and reconstruction projects according to the State’s Traffic Congestion Relief Plan.
HCD GRANT
This fund accounts for revenues received under State Housing of Community Development and for CALHOME activities approved and subject to state regulations.
MEASURE K
This fund accounts for revenues from Sales Tax Measure K that provides a quarter (1/4) cent sales tax in perpetuity to fund emergency medical services at County Fire Station #70 in San Pablo.
94


CITY OF SAN PABLONON-MAJOR GOVERNMENTAL FUNDS
COMBINING BALANCE SHEETSJUNE 30, 2016
SPECIAL REVENUE FUNDS
StreetLighting and Development
Gas Tax Public Safety Landscaping N.P.D.E.S. Services Measure C / J
ASSETS
Cash and investments available for operations $205,095 $162,791 $1,708,637Restricted cash and investmentsAccounts receivableDue from other governments 18,073 $19,465 22,663
Total Assets $223,168 $19,465 $162,791 $1,731,300
LIABILITIES
Accounts payable and accrued liabilities $21,873 $28,903 $25 $77,422Deposits payable 15,195 6,941Due to other funds
Total Liabilities 37,068 28,903 25 84,363
FUND BALANCES
Restricted 186,100 $19,465 162,766 $1,731,300Unassigned (28,903) (84,363)
Total Fund Balance (Deficit) 186,100 19,465 (28,903) 162,766 (84,363) 1,731,300
Total Liabilities and Fund Balances $223,168 $19,465 $162,791 $1,731,300
96

SPECIAL REVENUE FUNDS
TotalLaw Traffic Nonmajor
Asset Enforcement Congestion HCD GovernmentalSeizures Paratransit Services Relief Grant Measure K Funds
$156,310 $614,341 $698,017 $147,198 $94,246 $3,786,635
18,059 $116,900 195,160
$156,310 $614,341 $716,076 $147,198 $94,246 $116,900 $3,981,795
$126,844 $11,276 $18,060 $145,598 $430,001502,932 525,068
126,844 11,276 520,992 145,598 955,069
29,466 603,065 195,084 1,600 $94,246 $116,900 3,139,992(113,266)
29,466 603,065 195,084 1,600 94,246 116,900 3,026,726
$156,310 $614,341 $716,076 $147,198 $94,246 $116,900 $3,981,795
97

CITY OF SAN PABLONON-MAJOR GOVERNMENTAL FUNDS
COMBINING STATEMENTS OF REVENUES, EXPENDITURESAND CHANGES IN FUND BALANCESFOR THE YEAR ENDED JUNE 30, 2016
SPECIAL REVENUE FUNDS
StreetLighting and Development
Gas Tax Public Safety Landscaping N.P.D.E.S. Services Measure C / J
REVENUES Property taxes $842,779 Sales tax $109,739 $851,307 Licenses and permits $320,358 Intergovernmental $670,163 $326,865 62,929 Charges for services 178,588 4,968 534,256 Use of money and property 849 83 8,851 Miscellaneous (17,700) 71,334 1,450 378
Total Revenues 831,051 109,739 914,113 334,132 918,004 860,158
EXPENDITURES Current:
General Government Community: Development 1,154,869 Public Works & Engineering 1,629,468 1,122,009 333,385 Police Capital outlay 12,170 4,082
Total Expenditures 1,641,638 1,126,091 333,385 1,154,869
EXCESS (DEFICIENCY) OF REVENUES OVER EXPENDITURES (810,587) 109,739 (211,978) 747 (236,865) 860,158
OTHER FINANCING SOURCES (USES)Proceeds from sale of assetsTransfers in 996,687 62,194 135,314Transfers (out) (145,515) (25,000)
Total Other Financing Sources (Uses) 996,687 (145,515) 62,194 135,314 (25,000)
NET CHANGE IN FUND BALANCES 186,100 (35,776) (149,784) 747 (101,551) 835,158
Fund balances at beginning of year 55,241 120,881 162,019 17,188 896,142
FUND BALANCES (DEFICITS) AT END OF YEAR $186,100 $19,465 ($28,903) $162,766 ($84,363) $1,731,300
98

SPECIAL REVENUE FUNDS
TotalLaw Traffic Nonmajor
Asset Enforcement Congestion HCD GovernmentalSeizures Paratransit Services Relief Grant Measure K Funds
$842,779$754,366 1,715,412
320,358$214,057 $132,677 1,406,691
717,812$259 5,767 435 $1,354 $866 18,464
16,108 8,717 80,287
16,367 228,541 133,112 1,354 866 754,366 5,101,803
1,200,000 1,200,000
262,145 1,417,0143,084,862
18,059 18,05916,252
262,145 18,059 1,200,000 5,736,187
16,367 (33,604) 115,053 1,354 866 (445,634) (634,384)
12,000 12,000426,767 1,620,962
(170,515)
12,000 426,767 1,462,447
16,367 (21,604) 115,053 1,354 866 (18,867) 828,063
13,099 624,669 80,031 246 93,380 135,767 2,198,663
$29,466 $603,065 $195,084 $1,600 $94,246 $116,900 $3,026,726
99

CITY OF SAN PABLOBUDGETED NON-MAJOR GOVERNMENTAL FUNDS
COMBINING SCHEDULE OF REVENUES, EXPENDITURESAND CHANGES IN FUND BALANCES
BUDGET AND ACTUALFOR THE YEAR ENDED JUNE 30, 2016
SPECIAL REVENUE FUNDS
GAS TAX PUBLIC SAFETYVariance VariancePositive Positive
Budget Actual (Negative) Budget Actual (Negative)
REVENUES Property taxes Sales tax $102,724 $109,739 $7,015
Licenses and permits Intergovernmental $816,435 $670,163 ($146,272) Charges for services 160,713 178,588 17,875 Use of money and property Miscellaneous 320 (17,700) (18,020)
Total Revenues 977,468 831,051 (146,417) 102,724 109,739 7,015
EXPENDITURES Current: Community: Development Public Works & Engineering 2,139,171 1,629,468 509,703 Police Capital outlay 111,008 12,170 98,838
Total Expenditures 2,250,179 1,641,638 608,541
EXCESS (DEFICIENCY) OF REVENUES OVER EXPENDITURES (1,272,711) (810,587) 462,124 102,724 109,739 7,015
OTHER FINANCING SOURCES (USES)Proceeds from sale of propertyTransfers in 1,012,695 996,687 (16,008)Transfers out (145,515) (145,515)
Total Other Financing Sources (Uses) 1,012,695 996,687 (16,008) (145,515) (145,515)
NET CHANGE IN FUND BALANCES ($260,016) 186,100 $446,116 $102,724 (35,776) ($138,500)
Fund balances at beginning of year 55,241
FUND BALANCES (DEFICITS) AT END OF YEAR $186,100 $19,465
100
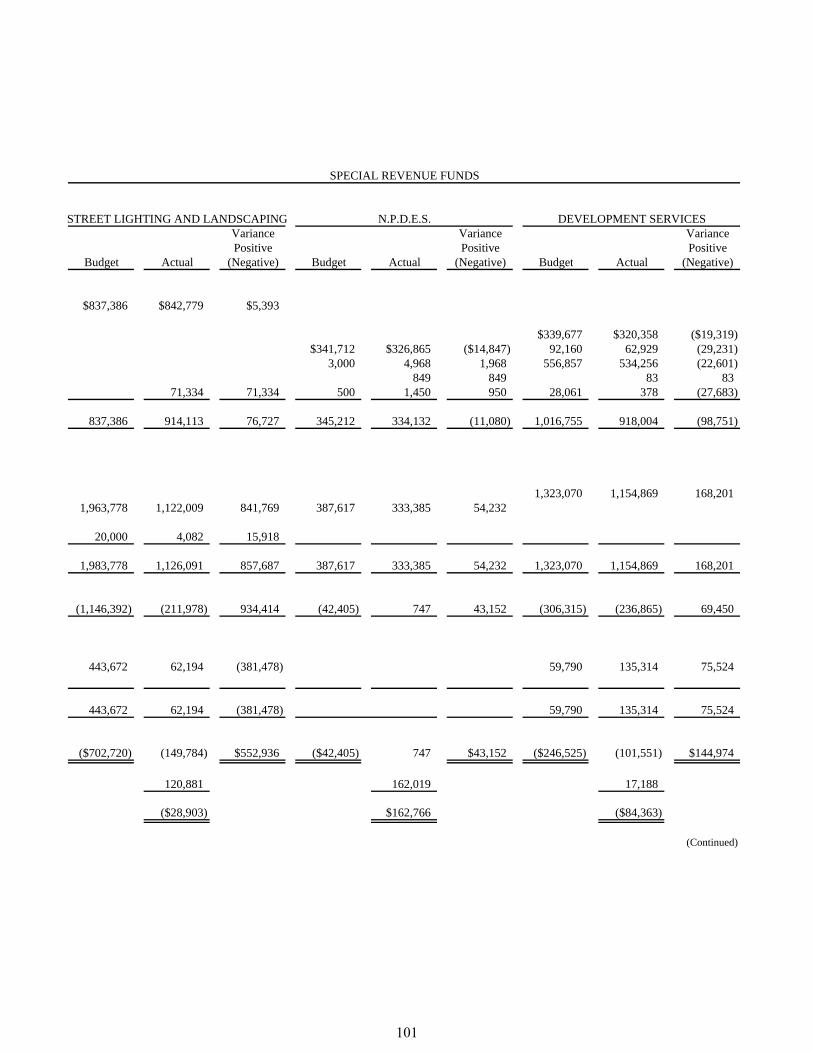
SPECIAL REVENUE FUNDS
STREET LIGHTING AND LANDSCAPING N.P.D.E.S. DEVELOPMENT SERVICESVariance Variance VariancePositive Positive Positive
Budget Actual (Negative) Budget Actual (Negative) Budget Actual (Negative)
$837,386 $842,779 $5,393
$339,677 $320,358 ($19,319)$341,712 $326,865 ($14,847) 92,160 62,929 (29,231)
3,000 4,968 1,968 556,857 534,256 (22,601)849 849 83 83
71,334 71,334 500 1,450 950 28,061 378 (27,683)
837,386 914,113 76,727 345,212 334,132 (11,080) 1,016,755 918,004 (98,751)
1,323,070 1,154,869 168,2011,963,778 1,122,009 841,769 387,617 333,385 54,232
20,000 4,082 15,918
1,983,778 1,126,091 857,687 387,617 333,385 54,232 1,323,070 1,154,869 168,201
(1,146,392) (211,978) 934,414 (42,405) 747 43,152 (306,315) (236,865) 69,450
443,672 62,194 (381,478) 59,790 135,314 75,524
443,672 62,194 (381,478) 59,790 135,314 75,524
($702,720) (149,784) $552,936 ($42,405) 747 $43,152 ($246,525) (101,551) $144,974
120,881 162,019 17,188
($28,903) $162,766 ($84,363)
(Continued)
101

CITY OF SAN PABLOBUDGETED NON-MAJOR GOVERNMENTAL FUNDS
COMBINING SCHEDULE OF REVENUES, EXPENDITURESAND CHANGES IN FUND BALANCES
BUDGET AND ACTUALFOR THE YEAR ENDED JUNE 30, 2016
SPECIAL REVENUE FUNDS
MEASURE C / J ASSET SEIZURESVariance VariancePositive Positive
Budget Actual (Negative) Budget Actual (Negative)
REVENUES Property taxes Sales tax $439,785 $851,307 $411,522
Licenses and permits Intergovernmental Charges for services Use of money and property 3,000 8,851 5,851 $259 $259 Miscellaneous 16,108 16,108
Total Revenues 442,785 860,158 417,373 16,367 16,367
EXPENDITURES Current: Community: Development Public Works & Engineering Police Capital outlay
Total Expenditures
EXCESS (DEFICIENCY) OF REVENUES OVER EXPENDITURES 442,785 860,158 417,373 16,367 16,367
OTHER FINANCING SOURCES (USES)Proceeds from sale of propertyTransfers inTransfers out (96,000) (25,000) 71,000
Total Other Financing Sources (Uses) (96,000) (25,000) 71,000
NET CHANGE IN FUND BALANCES $346,785 835,158 $488,373 16,367 $16,367
Fund balances at beginning of year 896,142 13,099
FUND BALANCES (DEFICITS) AT END OF YEAR $1,731,300 $29,466
102
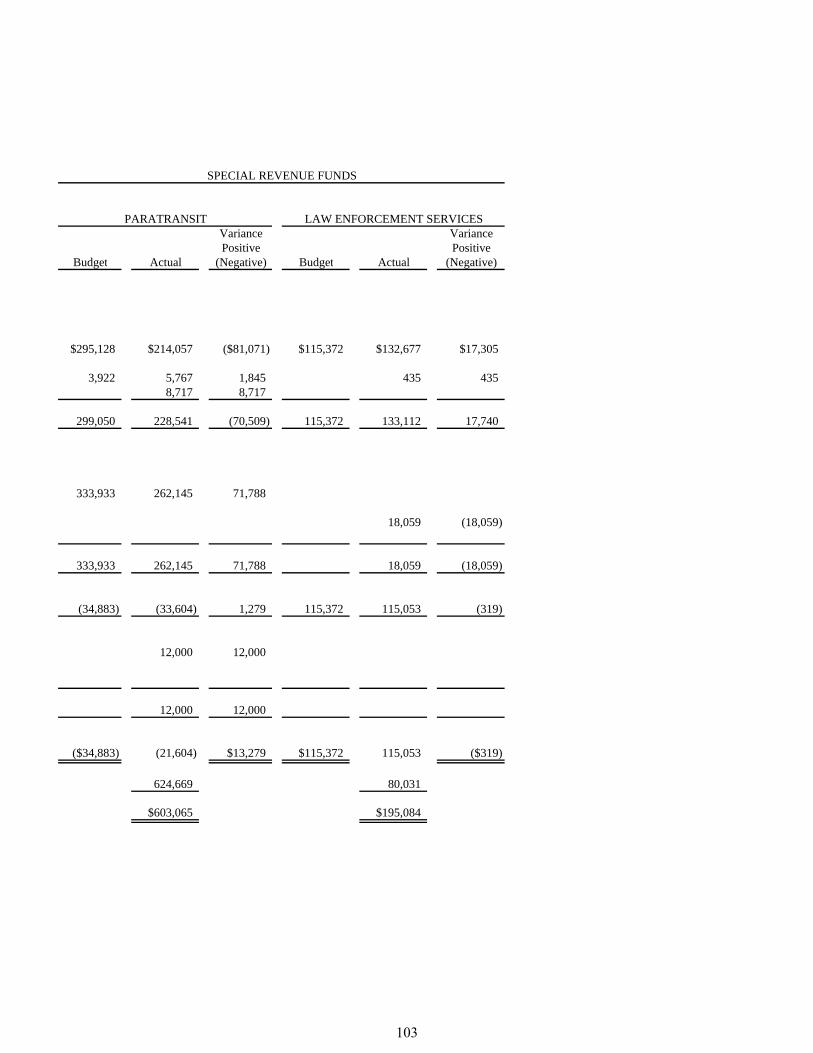
SPECIAL REVENUE FUNDS
PARATRANSIT LAW ENFORCEMENT SERVICESVariance VariancePositive Positive
Budget Actual (Negative) Budget Actual (Negative)
$295,128 $214,057 ($81,071) $115,372 $132,677 $17,305
3,922 5,767 1,845 435 4358,717 8,717
299,050 228,541 (70,509) 115,372 133,112 17,740
333,933 262,145 71,788
18,059 (18,059)
333,933 262,145 71,788 18,059 (18,059)
(34,883) (33,604) 1,279 115,372 115,053 (319)
12,000 12,000
12,000 12,000
($34,883) (21,604) $13,279 $115,372 115,053 ($319)
624,669 80,031
$603,065 $195,084
103


AGENCY FUNDS
GASB Statement 34 requires that Agency Funds be presented separately from the Government-wide and Fund financial statements.
Agency Funds account for assets held by the City as an agent for individuals, governmental entities and non-public organizations.
COMMUNITY ORGANIZATIONS AND ACTIVITIES
This fund accounts for deposits held as an agent for community organizations and activities.
WEST CONTRA COSTA TRANSPORTATION ADVISORY COMMITTEE
This fund accounts for assets belonging to the West Contra Costa Transportation Advisory Committee held as an agent by the City, which maintains the Committee’s books and accounts.
105

CITY OF SAN PABLOAGENCY FUNDS
COMBINING STATEMENT OF CHANGES IN ASSETS AND LIABILITIESFOR THE YEAR ENDED JUNE 30, 2016
Balance BalanceJune 30, 2015 Additions Deductions June 30, 2016
Community Organizations and Activities
Assets Restricted cash and investments $745,259 $189,583 $212,304 $722,538
Total Assets $745,259 $189,583 $212,304 $722,538
Liabilities Accounts payable $82,044 $4,988 $82,044 $4,988
Deposits held as agent for others 663,215 184,595 130,260 717,550
Total Liabilities $745,259 $189,583 $212,304 $722,538
West Contra Costa Transportation Advisory Committee
Assets Restricted cash and investments $2,120,724 $1,747,885 $1,762,551 $2,106,058
Due from other governments 221,744 779,793 221,744 779,793
Total Assets $2,342,468 $2,527,678 $1,984,295 $2,885,851
Liabilities Accounts payable $98,978 $184,611 $98,978 $184,611
Deposits held as agent for others 2,243,490 2,343,067 1,885,317 2,701,240
Total Liabilities $2,342,468 $2,527,678 $1,984,295 $2,885,851
Totals - All Agency Funds
Assets Restricted cash and investments $2,865,983 $1,937,468 $1,974,855 $2,828,596
Due from other governments 221,744 779,793 221,744 779,793
Total Assets $3,087,727 $2,717,261 $2,196,599 $3,608,389
Liabilities Accounts payable $181,022 $189,599 $181,022 $189,599
Deposits held as agent for others 2,906,705 2,527,662 2,015,577 3,418,790
Total Liabilities $3,087,727 $2,717,261 $2,196,599 $3,608,389
106

STATISTICAL SECTION
This part of the City’s Comprehensive Annual Financial Report presents detailed information as a context for understanding what the information in the financial statements, note disclosures, and required supplementary information says about the City’s overall financial health. In contrast to the financial section, the statistical section information is not subject to independent audit.
Financial Trends These schedules contain trend information to help the reader understand how the City’s financial performance and wellbeing have changed over time:
1. Net Position by Component2. Changes in Net Position3. Fund Balances of Governmental Funds4. Changes in Fund Balance of Governmental Funds
Revenue Capacity These schedules contain information to help the reader assess the City’s most significant local revenue source, the property tax:
1. Assessed and Estimated Actual Value of Taxable Property2. Property Tax Rates, All Overlapping Governments3. Principal Property Taxpayers4. Property Tax Levies and Collections
Debt Capacity These schedules present information to help the reader assess the affordability of the City’s current levels of outstanding debt and the City’s ability to issue additional debt in the future:
1. Ratio of Outstanding Debt by Type2. Computation of Direct and Overlapping Debt3. Computation of Legal Bonded Debt Margin4. Bonded Debt Pledged Revenue Coverage, Redevelopment Agency Tax Allocation Bonds5. Continuing Disclosure Requirements - Debt Service Coverage Schedule
Demographic and Economic Information These schedules offer demographic and economic indicators to help the reader understand the environment within which the City’s financial activities take place:
1. Demographic and Economic Statistics2. Principal Employers
Operating Information These schedules contain service and infrastructure data to help the reader understand how the information in the City’s financial report relates to the services the City provides and the activities it performs:
1. Full-Time Equivalent City Government Employees by Function2. Operating Indicators by Function/Program3. Capital Asset Statistics by Function/Program
Sources Unless otherwise noted, the information in these schedules is derived from the Comprehensive Annual Financial Reports for the relevant year.
107


CITY OF SAN PABLONet Position by Component
Last Ten Fiscal Years(accrual basis of accounting)
2007 2008 2009 2010 2011 2012 2013 (A) 2014 (B) 2015 2016
Governmental activitiesNet investment in
capital assets $14,162,898 $17,233,098 $19,236,798 $25,129,231 $39,968,889 $61,548,129 $60,286,124 $58,716,354 $59,671,326 $59,552,820Restricted 28,234,327 31,346,751 17,023,526 8,544,531 12,660,690 23,252,245 23,589,889 24,793,010 24,843,522 25,307,852Unrestricted 21,442,740 25,591,054 28,686,988 22,456,421 8,948,361 33,879,184 35,928,112 21,808,206 30,508,198 41,969,726
Total governmental activities
net position $63,839,965 $74,170,903 $64,947,312 $56,130,183 $61,577,940 $118,679,558 $119,804,125 $105,317,570 $115,023,046 $126,830,398
(A) The City implemented the provisions of GASB Statement 63 in fiscal year 2013, which replaced the term “net assets” with the term “net position.”(B) The City implemented the provisions of GASB Statements 68 and 71 in fiscal year 2015, which required the restatement of net position,
however amounts prior to 2014 have not been restated.
Fiscal Year Ended June 30
$0
$20,000
$40,000
$60,000
$80,000
$100,000
$120,000
$140,000
2007 2008 2009 2010 2011 2012 2013(A)
2014(B)
2015 2016
Th
ousa
nd
s
Net Investment in Capital Assets Restricted Unrestricted
109

CITY OF SAN PABLOChanges in Net PositionLast Ten Fiscal Years
(Accrual Basis of Accounting)
2007 2008 2009 2010 2011
ExpensesGovernmental Activities:
General Government $2,632,986 $2,993,404 $3,200,437 $3,746,905 $3,873,454
CommunityRecreation 989,126 1,217,942 1,132,500 1,260,952 1,296,966
Development 4,140,354 6,428,706 23,541,394 17,744,655 4,482,336
Housing 228,296 194,708 554,770 244,168 86,761
Public Works & Engineering 5,674,920 5,892,638 6,424,687 6,390,441 7,379,061
Police 10,772,050 14,078,285 13,573,473 14,471,506 14,397,742
Interest and fiscal charges 4,498,283 4,220,723 4,035,250 3,894,561 3,813,714
Total Governmental Activities Expenses 28,936,015 35,026,406 52,462,511 47,753,188 35,330,034
Program RevenuesGovernmental Activities:
Charges for Services:General Government 22,805 16,171 31,223 26,562 66,541
Community: Recreation 117,752 127,847 144,942 166,294 251,779
Development 556,322 444,499 438,378 588,719 332,055
Public Works & Engineering 130,443 157,591 57,724 118,661 106,798
Police 724,871 516,367 403,428 338,838 325,909
Operating Grants and Contributions 1,927,514 1,835,557 1,424,555 1,620,850 2,497,146
Capital Grants and Contributions 1,793,276 1,649,247 1,521,513 3,383,502 2,304,659
Total Government Activities Program Revenues 5,272,983 4,747,279 4,021,763 6,243,426 5,884,887
Net (Expense)/RevenueGovernmental Activities (23,663,032) (30,279,127) (48,440,748) (41,509,762) (29,445,147)
General Revenues and Other Changes in Net PositionGovernmental Activities:
Taxes:Property Taxes 1,389,901 1,235,060 1,302,668 1,099,009 1,129,241
Incremental Property Taxes 14,959,091 15,434,058 14,675,932 9,751,633 9,415,129
ERAFSales Taxes 1,304,189 1,400,911 1,342,904 1,250,870 1,313,493
In-Lieu Sales Tax 396,968 411,506 472,411 456,357 316,486
Utility Users Tax 1,594,338 1,632,823 1,366,676 1,512,840 2,083,913
Transient Occupancy Taxes (a) Franchise Taxes (a) Payment in Lieu of taxes (a) Business Licenses (nonregulatory) 326,195 296,836 327,507 321,824 313,623
Other Taxes 12,649,876 13,531,030 14,891,478 15,332,960 16,217,232
Intergovernmental unrestricted:Motor Vehicle In-Lieu Fees 2,476,028 2,634,391 2,532,312 1,937,853 1,881,451
Use of Money and Property 3,306,358 3,815,626 2,032,690 777,955 666,850
Gain on Sale of Property 497,534 13,275 6,091 1,327,416
Miscellaneous 378,792 204,549 266,488 251,332 228,070
Special item - transfer of loans and cash to County
Special item - assets transferred from Successor AgencyExtraordinary item - assets
transferred to/liabilities assumed by Successor Agency
Total Governmental Activities 39,279,270 40,610,065 39,217,157 32,692,633 34,892,904
Change in Net PositionGovernmental Activities $15,616,238 $10,330,938 ($9,223,591) ($8,817,129) $5,447,757
(a) Included in Other Taxes prior to fiscal year 2012.(b) Includes business licenses previously included in Other Taxes.(c) The City implemented the provisions of GASB Statement 63 in fiscal year 2013, which replaced the term “net assets” with the term “net position.”(d) The City implemented the provisions of GASB Statements 68 and 71 in fiscal year 2015, however amounts prior to 2015 have not been restated.
Fiscal Year Ended June 30,
110

2012 2013(c) 2014 2015 (d) 2016
$4,041,867 $5,680,263 $5,918,919 $5,868,035 $10,749,217
1,141,266 1,342,621 1,306,695 1,417,109 1,613,344
2,062,972 1,176,592 1,115,441 1,538,176 1,351,207
6,937 13,600 12,100 23,000
7,447,687 8,064,981 7,304,089 9,591,938 7,253,853
13,676,212 15,393,927 14,959,000 15,207,587 13,239,813
2,175,282 1,069,642 1,035,279
30,552,223 31,671,984 30,616,244 34,692,487 35,265,713
113,227 218,312 522,654 612,276 435,262
204,475 245,934 236,757 321,941 334,418
289,569 527,404 561,699 483,379 504,454
85,258 143,158 168,230 225,034 187,923
303,410 486,569 396,612 666,228 569,627
2,158,891 1,930,939 1,962,725 2,064,275 1,679,873
3,095,927 1,846,299 7,078,669 5,202,454 4,562,945
6,250,757 5,398,615 10,927,346 9,575,587 8,274,502
(24,301,466) (26,273,369) (19,688,898) (25,116,900) (26,991,211)
1,345,016 1,229,599 1,515,310 1,676,678 1,562,739
5,051,415
1,396,988 2,253,736 2,912,396 3,803,069 4,168,439
421,134 468,552 548,465 490,239 406,799
2,339,064 2,473,792 2,553,955 2,467,509 2,572,145
309,167 356,177 424,570 455,006 523,213
540,565 627,473 719,358 884,123 790,828
1,757,473 1,792,638 1,828,490 1,865,060 1,902,362
15,800,631 17,388,179 18,291,111 19,701,338 22,986,063
85,790 109,928 114,542 132,130 157,190
1,688,305 1,654,714 1,713,415 1,961,310 2,158,330
394,790 238,115 246,226 633,516 865,048
344,653 167,902 320,447 545,773 705,407
1,534,820 206,625
49,928,093 (1,176,610)
81,403,084 27,584,195 32,723,105 34,822,376 38,798,563
$57,101,618 $1,310,826 $13,034,207 $9,705,476 $11,807,352
Fiscal Year Ended June 30,
111


CITY OF SAN PABLOFund Balances of Governmental Funds
Last Ten Fiscal Years(Modified Accrual Basis of Accounting)
Fiscal Year Ended June 30, 2007 2008 2009 2010 2011 (b) 2012 2013 2014 2015 2016
General FundReserved $45,330 $55,576 $71,191 $32,630Unreserved 18,012,835 17,378,837 20,125,976 21,359,353Nonspendable $94,156 $4,024,921 $28,503 $45,219 $5,402,621 $5,384,995Restricted 206,626Assigned 20,215 227,579 763,614 145,329 1,315,623Unassigned 24,008,243 21,100,922 23,285,950 31,512,493 37,596,248 50,715,535
Total General Fund $18,058,165 $17,434,413 $20,197,167 $21,391,983 $24,309,025 $25,146,058 $23,542,032 $32,321,326 $43,144,198 $57,416,153 (a)
All Other Governmental FundsReserved $47,633,407 $49,546,081 $34,879,869 $30,555,643Unreserved, reported in:
Special revenue funds 1,366,884 1,385,761 1,570,804 1,829,801Capital project funds 31,423,052 30,104,970 25,252,717 9,611,508
Restricted $29,624,123 $7,862,952 $8,117,456 $9,387,695 $17,266,389 $17,900,895Assigned 11,451,201 6,112,651 4,365,599 9,082,664 4,010,660 300,282Unassigned (10,350) (113,266)
Total all other governmental funds $80,423,343 $81,036,812 $61,703,390 $41,996,952 $41,064,974 $13,975,603 $12,483,055 $18,470,359 $21,277,049 $18,087,911 (a)
(a) The change in total fund balance for the General Fund and other governmental funds is explained in Management's Discussion and Analysis.
(b) The City implemented the provisions of GASB Statement 54 in fiscal year 2011.
$0
$10,000
$20,000
$30,000
$40,000
$50,000
$60,000
$70,000
$80,000
$90,000
$100,000
2007 2008 2009 2010 2011(b)
2012 2013 2014 2015 2016
Th
ousa
nd
s
Reserved Unreserved Nonspendable Restricted Committed Assigned Unassigned
113
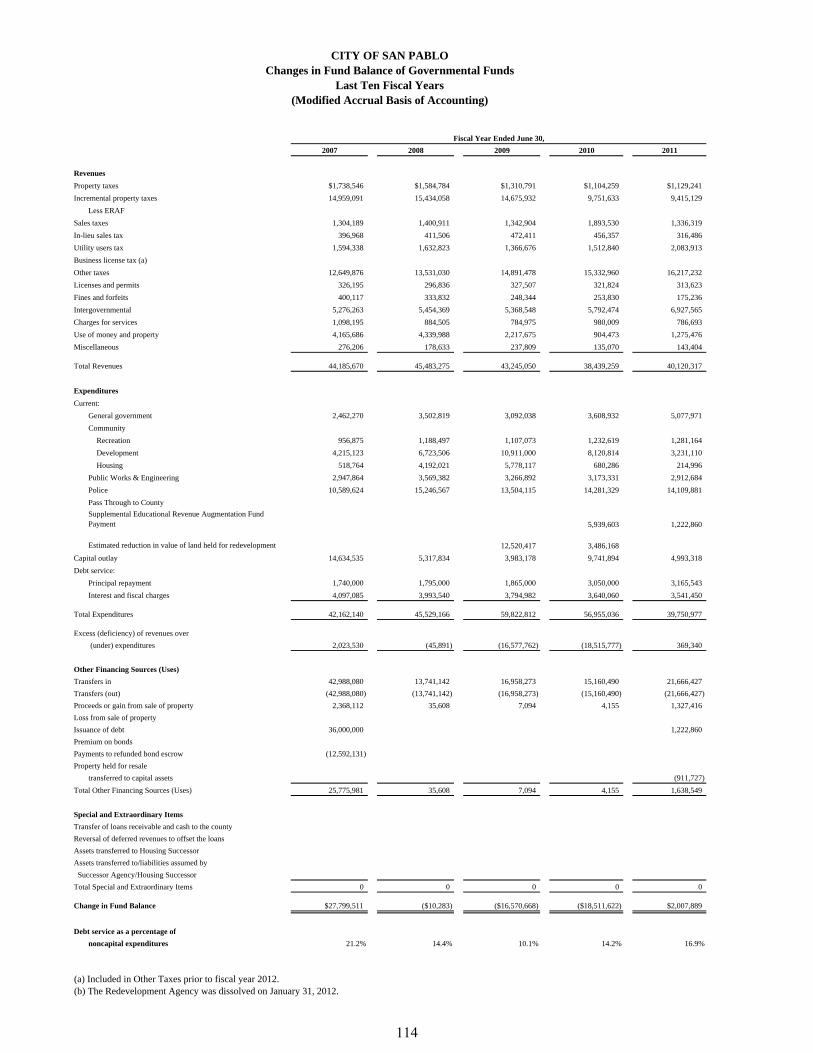
CITY OF SAN PABLOChanges in Fund Balance of Governmental Funds
Last Ten Fiscal Years(Modified Accrual Basis of Accounting)
Fiscal Year Ended June 30,
2007 2008 2009 2010 2011
Revenues
Property taxes $1,738,546 $1,584,784 $1,310,791 $1,104,259 $1,129,241
Incremental property taxes 14,959,091 15,434,058 14,675,932 9,751,633 9,415,129
Less ERAF
Sales taxes 1,304,189 1,400,911 1,342,904 1,893,530 1,336,319
In-lieu sales tax 396,968 411,506 472,411 456,357 316,486
Utility users tax 1,594,338 1,632,823 1,366,676 1,512,840 2,083,913
Business license tax (a)
Other taxes 12,649,876 13,531,030 14,891,478 15,332,960 16,217,232
Licenses and permits 326,195 296,836 327,507 321,824 313,623
Fines and forfeits 400,117 333,832 248,344 253,830 175,236
Intergovernmental 5,276,263 5,454,369 5,368,548 5,792,474 6,927,565
Charges for services 1,098,195 884,505 784,975 980,009 786,693
Use of money and property 4,165,686 4,339,988 2,217,675 904,473 1,275,476
Miscellaneous 276,206 178,633 237,809 135,070 143,404
Total Revenues 44,185,670 45,483,275 43,245,050 38,439,259 40,120,317
Expenditures
Current:
General government 2,462,270 3,502,819 3,092,038 3,608,932 5,077,971
Community
Recreation 956,875 1,188,497 1,107,073 1,232,619 1,281,164
Development 4,215,123 6,723,506 10,911,000 8,120,814 3,231,110
Housing 518,764 4,192,021 5,778,117 680,286 214,996
Public Works & Engineering 2,947,864 3,569,382 3,266,892 3,173,331 2,912,684
Police 10,589,624 15,246,567 13,504,115 14,281,329 14,109,881
Pass Through to County
Supplemental Educational Revenue Augmentation Fund Payment 5,939,603 1,222,860
Estimated reduction in value of land held for redevelopment 12,520,417 3,486,168
Capital outlay 14,634,535 5,317,834 3,983,178 9,741,894 4,993,318
Debt service:
Principal repayment 1,740,000 1,795,000 1,865,000 3,050,000 3,165,543
Interest and fiscal charges 4,097,085 3,993,540 3,794,982 3,640,060 3,541,450
Total Expenditures 42,162,140 45,529,166 59,822,812 56,955,036 39,750,977
Excess (deficiency) of revenues over
(under) expenditures 2,023,530 (45,891) (16,577,762) (18,515,777) 369,340
Other Financing Sources (Uses)
Transfers in 42,988,080 13,741,142 16,958,273 15,160,490 21,666,427
Transfers (out) (42,988,080) (13,741,142) (16,958,273) (15,160,490) (21,666,427)
Proceeds or gain from sale of property 2,368,112 35,608 7,094 4,155 1,327,416
Loss from sale of property
Issuance of debt 36,000,000 1,222,860
Premium on bonds
Payments to refunded bond escrow (12,592,131)
Property held for resale
transferred to capital assets (911,727)
Total Other Financing Sources (Uses) 25,775,981 35,608 7,094 4,155 1,638,549
Special and Extraordinary Items
Transfer of loans receivable and cash to the county
Reversal of deferred revenues to offset the loans
Assets transferred to Housing Successor
Assets transferred to/liabilities assumed by
Successor Agency/Housing Successor
Total Special and Extraordinary Items 0 0 0 0 0
Change in Fund Balance $27,799,511 ($10,283) ($16,570,668) ($18,511,622) $2,007,889
Debt service as a percentage of
noncapital expenditures 21.2% 14.4% 10.1% 14.2% 16.9%
(a) Included in Other Taxes prior to fiscal year 2012.(b) The Redevelopment Agency was dissolved on January 31, 2012.
114

Fiscal Year Ended June 30,
2012 2013 2014 2015 2016
$1,345,016 $1,083,129 $1,515,310 $1,676,678 $1,562,739
5,051,415 (b)
1,774,609 2,561,567 3,272,038 4,188,421 5,019,746
421,134 468,552 548,465 490,239 406,799
2,339,064 2,473,792 2,553,955 2,467,509 2,572,145
15,501,584 17,105,522 17,951,434 19,390,922 22,665,705
2,692,995 2,862,216 3,064,960 3,304,319 3,334,876
299,047 282,657 339,677 310,416 320,358
160,779 199,033 178,497 250,670 253,290
6,732,431 5,341,904 10,466,512 9,707,728 7,946,402
733,972 1,324,955 1,622,447 1,435,849 1,347,066
1,070,834 886,060 494,277 1,076,231 1,303,736
125,916 105,815 265,763 211,850 296,132
38,248,796 34,695,202 42,273,335 44,510,832 47,028,994
4,051,309 5,644,563 5,798,844 6,151,008 10,812,295
1,045,283 1,198,105 1,173,065 1,321,969 1,490,995
1,776,767 1,116,502 1,097,422 1,572,053 1,417,014
6,937 1,850 12,100 23,000
3,039,965 3,108,904 3,153,976 3,458,187 3,360,427
13,601,625 14,879,348 14,858,753 15,435,553 13,753,176
8,925,221 11,656,245 2,912,525 18,095,578 4,215,533
3,290,000 85,000 354,982
2,182,278 778,547 737,339
37,919,385 37,605,517 29,006,685 46,897,895 36,164,761
329,411 (2,910,315) 13,266,650 (2,387,063) 10,864,233
15,145,921 8,671,125 3,904,184 7,075,398 5,721,373
(15,145,921) (8,671,125) (3,904,184) (7,075,398) (5,721,373)
218,584
1,141,738 15,810,000
0 0 1,141,738 15,810,000 218,584
5,865,000 358,210 206,625
(32,469,574)
(26,604,574) 0 358,210 206,625 0
($26,275,163) ($2,910,315) $14,766,598 $13,629,562 $11,082,817
18.6% 0.0% 0.0% 2.9% 3.0%
115
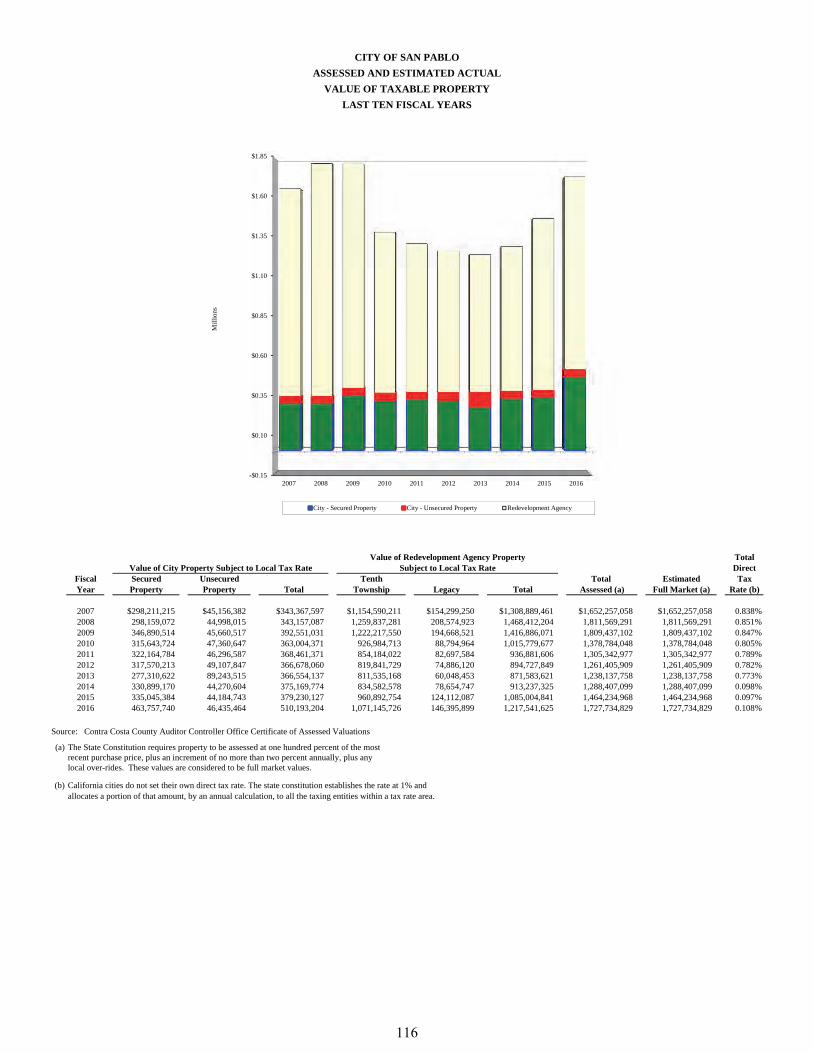
Value of Redevelopment Agency Property TotalValue of City Property Subject to Local Tax Rate Subject to Local Tax Rate Direct
Fiscal Secured Unsecured Tenth Total Estimated TaxYear Property Property Total Township Legacy Total Assessed (a) Full Market (a) Rate (b)
2007 $298,211,215 $45,156,382 $343,367,597 $1,154,590,211 $154,299,250 $1,308,889,461 $1,652,257,058 $1,652,257,058 0.838%2008 298,159,072 44,998,015 343,157,087 1,259,837,281 208,574,923 1,468,412,204 1,811,569,291 1,811,569,291 0.851%2009 346,890,514 45,660,517 392,551,031 1,222,217,550 194,668,521 1,416,886,071 1,809,437,102 1,809,437,102 0.847%2010 315,643,724 47,360,647 363,004,371 926,984,713 88,794,964 1,015,779,677 1,378,784,048 1,378,784,048 0.805%2011 322,164,784 46,296,587 368,461,371 854,184,022 82,697,584 936,881,606 1,305,342,977 1,305,342,977 0.789%2012 317,570,213 49,107,847 366,678,060 819,841,729 74,886,120 894,727,849 1,261,405,909 1,261,405,909 0.782%2013 277,310,622 89,243,515 366,554,137 811,535,168 60,048,453 871,583,621 1,238,137,758 1,238,137,758 0.773%2014 330,899,170 44,270,604 375,169,774 834,582,578 78,654,747 913,237,325 1,288,407,099 1,288,407,099 0.098%2015 335,045,384 44,184,743 379,230,127 960,892,754 124,112,087 1,085,004,841 1,464,234,968 1,464,234,968 0.097%2016 463,757,740 46,435,464 510,193,204 1,071,145,726 146,395,899 1,217,541,625 1,727,734,829 1,727,734,829 0.108%
Source: Contra Costa County Auditor Controller Office Certificate of Assessed Valuations
(a) The State Constitution requires property to be assessed at one hundred percent of the mostrecent purchase price, plus an increment of no more than two percent annually, plus anylocal over-rides. These values are considered to be full market values.
(b) California cities do not set their own direct tax rate. The state constitution establishes the rate at 1% andallocates a portion of that amount, by an annual calculation, to all the taxing entities within a tax rate area.
CITY OF SAN PABLO
ASSESSED AND ESTIMATED ACTUAL
VALUE OF TAXABLE PROPERTY
LAST TEN FISCAL YEARS
-$0.15
$0.10
$0.35
$0.60
$0.85
$1.10
$1.35
$1.60
$1.85
2007 2008 2009 2010 2011 2012 2013 2014 2015 2016
Mil
lion
s
City - Secured Property City - Unsecured Property Redevelopment Agency
116

CITY OF SAN PABLO
PROPERTY TAX RATES
ALL OVERLAPPING GOVERNMENTS
LAST TEN FISCAL YEARS
Direct and Overlapping RatesDirect and Overlapping Rates
Basic Bay East Bay West Total City's Redevelop-County Area Regional Contra Costa Direct and Share of ment Total
Fiscal Wide Rapid Park Unified School Community Overlapping 1% Levy per Agency DirectYear Levy (a) Transit District District College Rates (b) Prop 13 (c) Rate (d) Rate (e)
2007 $1.00000 $0.00500 $0.00850 $0.11430 $0.00430 $1.13210 $0.09828 $1.00850 $0.837512008 1.00000 0.00760 0.00800 0.10350 0.01080 1.12990 0.09828 1.00800 0.850822009 1.00000 0.00900 0.01000 0.12300 0.00660 1.14860 0.09828 1.01000 0.846962010 1.00000 0.00570 0.01080 0.18280 0.01260 1.21190 0.09828 1.01080 0.804722011 1.00000 0.00310 0.00840 0.18690 0.01330 1.21170 0.09828 1.00840 0.789042012 1.00000 0.00410 0.00710 0.23220 0.01440 1.25780 0.09828 1.00710 0.781772013 1.00000 0.00430 0.00510 0.21570 0.00870 1.23380 0.09828 0.00000 0.772652014 1.00000 0.00750 0.00780 0.28180 0.01330 1.31040 0.09828 0.00000 0.097502015 1.00000 0.00450 0.00850 0.28030 0.02520 1.31850 0.09828 0.00000 0.097492016 1.00000 0.00260 0.00670 0.27810 0.02200 1.30940 0.09828 0.00000 0.10805
Source: HdL Coren & Cone, Contra Costa County Assessor
(a) In 1978, California voters passed Proposition 13 which set the property tax rate at a 1% fixed amount. This 1.00% is shared by all taxing agenciesfor which the subject property resides within. In addition to the, 1.00% fixed amount, property owners are charged taxes as a percentage ofassessed property values for the payment of any voter approved bonds.
(b) Overlapping rates are those of local and county governments that apply to property owners within the City. Not all overlapping rates apply to allCity property owners.
(c) City's share of 1% Levy is based on the City's share of the general fund tax rate area with the largest net taxable value within the City.ERAF general fund tax shifts may not be included in tax ratio figures.
(d) Redevelopment Agency (RDA) rate is based on the largest RDA tax rate area (TRA) and includes only rate(s) from indebtedness adopted prior to 1989 per California State statute. RDA direct and overlapping rates are applied only to the incremental property values.The approval of ABX1 26 eliminated Redevelopment from the State of California for fiscal year 2013 and years thereafter.
(e) Total Direct Rate is the weighted average of all individual direct rates applied by the government preparing the statistical section information and excludesrevenues derived from aircraft. Beginning in 2013/14 the Total Direct Rate no longer includes revenue generated from the former redevelopment taxrate areas. Challenges to recognized enforceable obligations are assumed to have been resolved during 2012/2013. For the purposes of this report, residual revenue is assumed to be distributed to the City in the same proportions as general fund revenue.
$0.0
$0.2
$0.4
$0.6
$0.8
$1.0
$1.2
20072008
20092010
20112012
20132014
20152016
Per
Hun
dred
$
Direct and Overlapping Rates
Community College West Contra Costa Unified School District East Bay Regional Park District
Bay Area Rapid Transit Basic County Wide Levy
117

CITY OF SAN PABLOPrincipal Property Taxpayers
Current Year and Nine Years Ago
2015-2016 2006-2007Percentage Percentage
of Total City of Total CityTaxable Taxable Taxable TaxableAssessed Assessed Assessed Assessed
Taxpayer Value Rank Value Value Rank Value
Donahue Schriber Realty Group $19,407,152 1 1.3% $15,062,857 2 0.9%
Public Storage, Inc. 16,405,198 2 1.1% 9,350,632 5 0.6%
San Pablo Retail Partners II 15,350,688 3 1.0%
CC San Pablo LP 15,046,742 4 1.0%
3002 Giant Road LLC 14,395,337 5 1.0%
Save Mart Supermarkets 13,679,482 6 0.9% 11,769,753 3 0.7%
Gordon Creekside LLC 9,630,483 7 0.6%
Vale Property LLC 8,196,885 8 0.5%
CC Home Rentals LLC 7,809,105 9 0.5%
Lucky NoCal Investor LLC 6,671,247 10 0.4% 8,292,181 7 0.5%
Signature at Abella 11,690,327 4 0.7%
San Pablo Retail Partners LLC 16,947,064 1 1.1%
Murray and Janet Gordon Trust 8,469,582 6 0.5%
Comcast of East San Fernando 7,094,280 8 0.4%
Dennis R. and Sandra D. Hill Trust 6,286,498 9 0.4%
WEC 97K-31 Investment Trust 6,185,814 10 0.4%
Subtotal $126,592,319 7.3% $101,148,988 6.1%
Total Net Assessed Valuation:Fiscal Year 2015-2016 $1,727,734,829Fiscal Year 2006-2007 $1,652,257,058
Source: HdL Coren & Cone, Contra Costa County Assessor
118

CITY OF SAN PABLOPROPERTY TAX LEVIES AND COLLECTIONS
LAST TEN FISCAL YEARS
212212213
Redevelopment Total PercentCity Agency Property of Total
Property Tax Property Tax Tax Levied TaxFiscal Levied and Levied and and CollectionsYear Collected (1) Collected Collected (2) to Tax Levy
2007 $541,189 $14,959,091 $15,500,280 100%2008 388,457 15,434,058 15,772,515 100%2009 472,141 14,675,932 15,148,073 100%2010 260,080 9,751,633 10,011,713 100%2011 291,311 9,415,129 9,706,440 100%2012 505,693 5,051,415 (3) 5,557,108 100%2013 248,288 0 (3) 248,288 100%2014 677,924 0 (3) 677,924 100%2015 836,806 0 (3) 836,806 100%2016 719,960 0 (3) 719,960 100%
NOTES: (1) Excludes Street Lighting and Landscaping, N.P.D.E.S., Oak Park Maintenance District Property Tax and
Redevelopment Agency.(2) During fiscal year 1995, the County began providing the City 100% of its tax levy under an agreement
which allows the County to keep all interest and delinquency charges collected.(3) The Redevelopment Agency was dissolved on January 31, 2012.
$0.0
$0.1
$0.2
$0.3
$0.4
$0.5
$0.6
$0.7
$0.8
$0.9
2007 2008 2009 2010 2011 2012 2013 2014 2015 2016
Mil
lion
s
City Property Tax Levied and Collected
119

CITY OF SAN PABLORatio of Outstanding Debt by Type
Last Ten Fiscal Years
Governmental ActivitiesTax Capital Lease Total Percentage
Fiscal Allocation SERAF Leases and Revenue Governmental of Personal PerYear Bonds Loan Loans Bonds Activities Income (a) Capita (a)
2007 $91,927,978 $91,927,978 20.82% $2,9692008 90,365,056 90,365,056 17.58% 2,8972009 88,745,472 88,745,472 16.34% 2,7902010 85,954,993 85,954,993 16.20% 2,6752011 83,064,430 $1,222,317 84,286,747 16.85% 2,9132012 0 (b) 0 (b) 0 0.00% 02013 0 (b) 0 (b) 0 0.00% 02014 0 (b) 0 (b) $9,906,655 9,906,655 1.99% 3392015 0 (b) 0 (b) 10,112,750 $15,810,000 25,922,750 5.03% 8792016 0 (b) 0 (b) 10,265,708 15,600,000 25,865,708 5.19% 839
Note : Debt amounts exclude any premiums, discounts, or other amortization amounts.
Sources: City of San PabloCalifornia Employment Development Department
(a) See Schedule "Demographic and Economic Statistics" for personal income and population data.(b) The Redevelopment Agency was dissolved as of January 31, 2012 and its debt assumed by a Successor Agency as of February 1, 2012.
$0
$10,000,000
$20,000,000
$30,000,000
$40,000,000
$50,000,000
$60,000,000
$70,000,000
$80,000,000
$90,000,000
$100,000,000
2007 2008 2009 2010 2011 2012 2013 2014 2015 2016
Total Governmental Activities
120

CITY OF SAN PABLOCOMPUTATION OF DIRECT AND OVERLAPPING DEBT
JUNE 30, 2016
2015-16 Assessed Valuation $1,727,734,829
Less: Redevelopment Incremental Valuation 1,217,541,625Adjusted Assessed Valuation $510,193,204
Percentage Amount
Net Applicable Applicable
Debt To City of To City of
DIRECT AND OVERLAPPING TAX AND ASSESSMENT DEBT Outstanding San Pablo San Pablo
Direct Debt:
City of San Pablo $25,865,708 100.000% $25,865,708
Overlapping Debt:
Bay Area Rapid Transit District 172,046,226 0.882% 1,518,136
Contra Costa County Pension Debt 212,765,000 0.882% 1,877,438
Contra Costa County Lease Revenue Bonds 320,437,720 0.882% 2,827,542
Contra Costa County Fire Pension Obligation 84,695,000 1.920% 1,625,770
Contra Costa Community College District 578,775,000 0.886% 5,126,645
East Bay Regional Park District 65,804,219 0.882% 580,656
West Contra Costa Unified School District 1,451,541,250 5.701% 82,753,523
Total Overlapping Debt 2,886,064,415 96,309,710
TOTAL DIRECT AND OVERLAPPING TAX AND ASSESSMENT DEBT $2,911,930,123 $122,175,418 (1)
(1) Excludes tax and revenue anticipation notes, revenue, mortgage revenue and tax allocation bonds and non-bonded capital lease obligations.
RATIOS TO 2015-16 ADJUSTED ASSESSED VALUATION:
Direct Debt 5.07%
Total Direct and Overlapping Tax Assessment Debt 23.95%
Source: HdL Coren & Cone, Contra Costa County Assessor and Auditor Combined 2015/16 Lien Date Tax Rolls
NOTE: Overlapping governments are those that coincide, at least in part, with the geographic boundaries of the City. The percentage of overlapping
debt applicable is estimated by using taxable assessed values. Applicable percentages were estimated by determining the portion of another governmental
unit's taxable assessed value that is within the City's boundaries and dividing it by each unit's total taxable assessed value.
121

CITY OF SAN PABLOCOMPUTATION OF LEGAL BONDED DEBT MARGIN
JUNE 30, 2016
ASSESSED VALUATION:
Secured property assessed value, net ofexempt real property $1,727,734,829
BONDED DEBT LIMIT (3.75% OF ASSESSED VALUE) (a) $64,790,056
AMOUNT OF DEBT SUBJECT TO LIMIT:
Total Bonded Debt $9,906,655
Less Tax Allocation Bonds and SERAF Loan
not subject to limit 9,906,655
Amount of debt subject to limit 0
LEGAL BONDED DEBT MARGIN $64,790,056
Total net debt
Total Net Debt Legal applicable to the limit
Fiscal Debt Applicable to Debt as a percentage
Year Limit Limit Margin of debt limit
2007 $61,921,066 0 $61,921,066 0.00%
2008 67,933,848 0 67,933,848 0.00%
2009 67,853,891 0 67,853,891 0.00%
2010 51,704,402 0 51,704,402 0.00%
2011 48,950,362 0 48,950,365 0.00%
2012 47,302,722 0 47,302,722 0.00%
2013 46,430,166 0 46,430,166 0.00%
2014 48,315,266 0 48,315,266 0.00%
2015 54,908,811 0 54,908,811 0.00%
2016 64,790,056 0 64,790,056 0.00%
NOTE:
(a) California Government Code, Section 43605 sets the debt limit at 15%. The
Code section was enacted prior to the change in basing assessed value to full market
value when it was previously 25% of market value. Thus, the limit shown as 3.75%
is one-fourth the limit to account for the adjustment of showing assessed valuation
at full cash value.
122

CITY OF SAN PABLO BONDED DEBT PLEDGED REVENUE COVERAGE
REDEVELOPMENT AGENCY TAX ALLOCATION BONDSLAST TEN FISCAL YEARS
NetRedevelopment Less Low and Tax Debt Service Requirements
Fiscal Agency Property Moderate Income IncrementYear Tax Increments Housing Set-Aside Revenue Principal Interest Total Coverage
2007 $14,959,091 $3,009,430 $11,949,661 $1,740,000 $4,097,085 $5,837,085 2.052008 15,434,058 3,021,571 12,412,487 1,795,000 3,993,540 5,788,540 2.142009 14,675,932 2,965,190 11,710,742 1,865,000 3,794,982 5,659,982 2.072010 9,751,633 1,972,660 7,778,973 3,050,000 3,640,060 6,690,060 1.162011 9,415,129 1,903,187 7,511,942 3,165,000 3,516,993 6,681,993 1.122012 8,952,532 (a) 0 (b) 8,952,532 3,290,000 3,577,017 6,867,017 (c) 1.302013 8,773,589 (d) 0 (b) 8,773,589 3,430,000 3,718,205 7,148,205 (e) 1.23 (d)2014 4,695,660 (d) 0 (b) 4,695,660 3,575,000 3,931,553 7,506,553 (e) 0.63 (d)2015 5,132,531 (d) 0 (b) 5,132,531 3,260,000 3,044,176 6,304,176 (e) 0.81 (d)2016 8,159,295 (d) 0 (b) 8,159,295 1,525,000 2,849,011 4,374,011 (e) 1.87 (d)
(a) The Redevelopment Agency was dissolved effective January 31, 2012 and its liabilities were assumed by a Successor Agency effective February 1, 2012. Includes tax increment collected by the former Redevelopment Agency and property taxes collected by the Successor Agency.
(b) As part of the dissolution, the Redevelopment Agency is no longer required to make the low and moderate income housing set-aside.(c) Includes debt service paid by both the former Redevelopment Agency and the Successor Agency.(d) Beginning in fiscal year 2013, tax increment reported in this table is the amount calculated by the County Auditor-Controller.
Under the provisions of the laws dissolving the Redevelopment Agency, the Successor Agency only receives thefunds necessary to fulfill its approved obligations, and is required to use other resources on hand to fund debt serviceprior to using the tax increment received.
(e) Includes debt service paid by the Successor Agency.
$0
$2,000
$4,000
$6,000
$8,000
$10,000
$12,000
$14,000
2007 2008 2009 2010 2011 2012 2013 2014 2015 2016
Th
ou
san
ds
Net Tax Increment Revenue Debt Service Payment
123

CITY OF SAN PABLODEBT SERVICE COVERAGE SCHEDULE
LAST TEN FISCAL YEARS
TENTH TOWNSHIP PROJECT AREA
Debt Service On
Fiscal Year
Gross Tax Revenues
Housing Set-Aside
Pledged Tax Revenues 1993 Bonds 1999 Bonds
2001 and 2004 Tenth Township
Bonds 2006 Bonds2014 A&B
BondsTotal Debt
ServiceDebt Service
Coverage
2007 $13,186,910 ($2,637,382) $10,549,528 0 $895,583 $2,860,073 $837,054 $4,592,710 2.30
2008 13,230,168 (2,646,034) 10,584,134 0 896,438 2,990,278 1,700,661 5,587,377 1.89
2009 12,802,280 (2,560,456) 10,241,824 0 900,438 2,991,021 1,562,362 5,453,821 1.882010 9,051,332 (1,810,386) 7,240,946 0 897,782 2,553,326 2,963,452 6,414,560 1.132011 8,594,963 (1,737,391) 6,857,572 0 893,292 2,559,633 2,953,843 6,406,768 1.072012 8,529,190 (a) 0 (b) 8,529,190 0 887,070 2,942,173 2,762,899 6,592,142 (c) 1.292013 8,173,104 (d) 0 (b) 8,173,104 0 890,965 3,631,201 2,351,864 6,874,030 (e) 1.192014 4,291,235 (d) 0 (b) 4,291,235 0 893,377 3,652,390 2,683,687 7,229,454 (e) 0.592015 4,545,428 (d) 0 (b) 4,545,428 0 0 843,427 0 $5,186,996 6,030,423 (e) 0.752016 N/A (d) 0 (d) N/A (d) 0 0 1,050,812 0 3,372,250 4,423,062 (e) N/A
LEGACY PROJECT AREA
Fiscal YearGross Tax Revenues
Housing Set Aside
Available Revenue
Debt Service on
2004 Legacy Bonds
Debt Service Coverage
2007 $1,860,196 ($372,048) $1,488,148 $334,225 4.452008 1,877,687 (375,537) 1,502,150 201,163 7.472009 2,023,668 (404,734) 1,618,934 206,161 7.852010 811,369 (162,274) 649,095 275,500 2.362011 820,166 (165,796) 654,370 275,225 2.382012 423,342 (a) 0 (b) 423,342 274,875 (c) 1.542013 600,485 (d) 0 (b) 600,485 274,175 (e) 2.192014 404,425 (d) 0 (b) 404,425 274,099 (e) 1.482015 587,103 (d) 0 (b) 587,103 273,753 (e) 2.142016 N/A (d) N/A (b) N/A N/A (e) N/A
(a) The Redevelopment Agency was dissolved effective January 31, 2012 and its liabilities were assumed by a Successor Agency Agencyeffective February 1, 2012. Includes tax increment collected by the former Redevelopment Agency and property taxes collected by the Successor AgencyAfter January 31, 2012, the distinction between the property taxes collected by the Tenth Township and Legacy Project Areas was not provided, therefore property taxes of $3,901,117 collected by the Successor Agency have been reported in the Tenth Township Project Area total.
(b) As part of the dissolution, the Redevelopment Agency is no longer required to make the low and moderate income housing set-aside.(c) Includes debt service paid by both the former Redevelopment Agency and the Successor Agency.(d) For the fiscal years ended 2013 thru 2015, tax increment reported in this table is the amount calculated by the County Auditor-Controller.
Under the provisions of the laws dissolving the Redevelopment Agency, the Successor Agency only receives the fundsnecessary to fulfill its approved obligations. As of 2016, the County Auditor-Controller no longer tracks this information, therefore, it is Not Available.
(e) Includes debt service paid by the Successor Agency.
Sources: City of San Pablo Financial Statements
124

CITY OF SAN PABLODEMOGRAPHIC AND ECONOMIC STATISTICS
LAST TEN FISCAL YEARS
Total Per Capita Contra Costa CityFiscal City Personal Personal Unemployment County PopulationYear Population Income Income Rate (%) Population % of County
2007 30,965 $441,498,970 (a) $14,258 9.0% 1,042,341 2.97%2008 31,190 514,011,200 (a) 16,480 9.8% 1,051,674 2.97%2009 31,808 543,217,024 (a) 17,078 12.7% 1,060,435 3.00%2010 32,131 530,514,941 (a) 16,511 20.3% 1,072,953 2.99%2011 28,931 500,216,990 (a) 17,290 21.9% 1,056,064 2.74%2012 29,105 503,632,920 17,304 (b) 20.5% (b) 1,065,117 2.73%2013 29,266 498,078,000 17,019 14.4% 1,074,702 2.72%2014 29,465 505,502,000 17,156 12.6% 1,087,008 2.71%2015 29,499 515,554,000 17,477 9.4% 1,102,871 2.67%2016 30,829 498,050,000 16,155 7.7% 1,123,429 2.74%
NOTES: (a) Data not available. Calculated by multiplying City Population by Per Capita Personal Income(b) Data not available for fiscal year, therefore data presented is for prior calendar year
Sources: California State Department of FinanceCalifornia Employment Development Department
0.00%
5.00%
10.00%
15.00%
20.00%
25.00%
2007 2008 2009 2010 2011 2012 2013 2014 2015 2016
Unemployment Rate (%)
2.50%
2.70%
2.90%
3.10%
3.30%
3.50%
2007 2008 2009 2010 2011 2012 2013 2014 2015 2016
City Population as a % of County Population
$0.00
$0.50
$1.00
$1.50
2007 2008 2009 2010 2011 2012 2013 2014 2015 2016
Bil
lion
s
Total Personal Income
$0
$10
$20
$30
$40
$50
2007 2008 2009 2010 2011 2012 2013 2014 2015 2016
Tho
usan
ds
Per Capita Personal Income
125

CITY OF SAN PABLOPrincipal Employers
Current Year and Nine Years Ago
2015-2016 2006-2007Percentage Percentage
Number of of Total City Number of of Total City
Employer Employees Rank Employment Employees Rank Employment
Doctor's Medical Center* Closed 04/21/2015 935 1 N/A
Contra Costa College* 585 1 4.1% 521 2 N/A
Casino San Pablo* 500 2 3.5% 520 3 N/A
Creekside Health Care Center* 243 3 1.7% 73 8 N/A
City of San Pablo* 182 4 1.3% 152 4 N/A
Vale Care Center* 169 5 1.2% 125 5 N/A
San Pablo Health Care Center* 153 6 1.1%
Food Maxx 99 7 0.7% 74 9 N/A
Las Mantanas 91 8 0.6%
Raley's 82 9 0.6% 66 10 N/A
San Pablo Super Market 64 10 0.5%
Brookvue Care Center* 116 6 N/A
Albertson's (Lucky's) 119 7 N/A
Subtotal 2,168 15.4% 2,701 N/A
Total City Day Population 14,100 N/A
Sources: City of San Pablo Finance Department
California Employment Development Department
*includes part time employees
126

CITY OF SAN PABLOFull-Time City Government Employees by Function
Last Ten Fiscal Years
2007 2008 2009 2010 2011 2012 2013 2014 2015 2016
FunctionGeneral Government 14.90 15.95 14.45 15.30 16.60 16.80 16.80 17.80 18.80 18.50 *Development Services 13.30 14.50 13.60 12.60 10.90 8.50 8.50 6.60 7.40 9.00 *Community Services 27.10 38.35 40.85 35.10 39.35 39.50 39.50 35.15 33.85 42.40 *Public Works 22.53 22.53 21.33 26.35 17.45 20.50 20.50 20.80 21.80 25.50Police 75.00 78.00 79.00 79.00 77.00 74.00 74.00 76.50 76.50 79.00
Total City 152.83 169.33 169.23 168.35 161.30 159.30 159.30 156.85 158.35 174.40
City Council 6.00Grand Total 180.40
* These figures include all part-time staff were left out of previous FTE counts in the 2007-2015 CAFR's.
Adopted for Fiscal Year June 30
0.00
20.00
40.00
60.00
80.00
100.00
120.00
140.00
160.00
180.00
200.00
2007 2008 2009 2010 2011 2012 2013 2014 2015 2016
FT
E's
General Government Development Services Community Services Public Works Police City Council
127

CITY OF SAN PABLOOperating Indicators by Function/Program
Fiscal Years2007 2008 2009 2010 2011 2012 2013 2014 2015 2016
Function/ProgramPolice: (calendar year)
Police calls for Service 36,080 25,336 26,106 25,769 32,140 26,009 27,507 35,242 23,239 28,985Crime Reports 8,948 7,502 6,352 6,178 5,925 5,887 5,890 5,695 3,857 3,116Law violations:
Major crimes: homicides/rape 18 16 22 13 9 12 12 10 12 17Other major crimes: robbery/larceny/burglary 1,621 1,530 1,983 1,760 1,455 1,601 1,465 799 522Arrests 1,989 2,083 1,539 1,729 1,688 1,496 1,789 2,008 1,444 1,862Traffic collisions 420 455 323 391 396 440 428 354 123 324Traffic citations 11,979 25,336 4,459 4,229 2,844 2,980 2,851 2,687 1,663 1,813
Public Works:Street resurfacing (miles) N/A 5 8 14 14 0 7 3.3 2.4 1.5Potholes repaired (square miles) N/A N/A 0.75 0.60 1 13 0.62 0.81 0.53 2.47Street Sweeping (miles) 2,865 2,834 2,834 2,234 2,175 2,700 3,144 3,130 2,813 2,813 Volume of material removed (cubic yards) 912 898 878 880 880 965 1,050 822 735 891Storm Drains: Catch basins cleaned 326 326 326 326 326 236 307 349 499 271 Volume of material removed (cubic yards) 470 25 23 29 71 9 29.165 22.310 107.000 147.950
Community Development:Community Services: Recreation class participants 1,229 1,444 1,211 1,331 2,479 2,594 3,057 4,107 7,437 9,433 Senior meals served 20,274 18,717 17,072 18,165 17,726 16,975 18,144 17,519 16,946 18,366 Rentals of Maple Hall 75 130 76 72 82 71 135 119 106 298 Rentals - Other Facilities 37 54 79
Education:Enrollment: Elementary schools (6) 3,547 3,598 3,536 3,114 3,002 3,110 2,960 2,973 2,993 2,697 Middle Schools (1) 767 640 727 930 911 1,660 973 1,040 964 999 High Schools (1) 394 472 467 300 286 400 400 400 400 400
Source: Various City Departments
Notes: N/A denotes information not available.
128
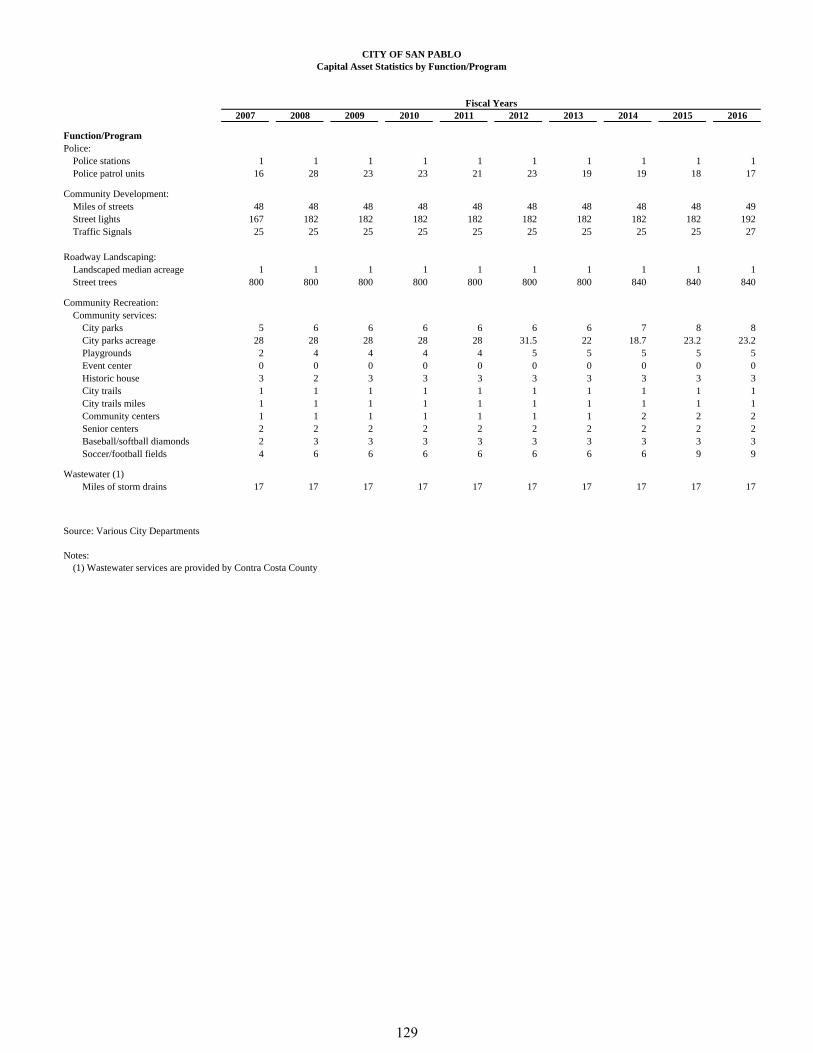
CITY OF SAN PABLOCapital Asset Statistics by Function/Program
Fiscal Years2007 2008 2009 2010 2011 2012 2013 2014 2015 2016
Function/ProgramPolice:
Police stations 1 1 1 1 1 1 1 1 1 1Police patrol units 16 28 23 23 21 23 19 19 18 17
Community Development:Miles of streets 48 48 48 48 48 48 48 48 48 49Street lights 167 182 182 182 182 182 182 182 182 192Traffic Signals 25 25 25 25 25 25 25 25 25 27
Roadway Landscaping:Landscaped median acreage 1 1 1 1 1 1 1 1 1 1Street trees 800 800 800 800 800 800 800 840 840 840
Community Recreation:Community services:
City parks 5 6 6 6 6 6 6 7 8 8City parks acreage 28 28 28 28 28 31.5 22 18.7 23.2 23.2Playgrounds 2 4 4 4 4 5 5 5 5 5Event center 0 0 0 0 0 0 0 0 0 0Historic house 3 2 3 3 3 3 3 3 3 3City trails 1 1 1 1 1 1 1 1 1 1City trails miles 1 1 1 1 1 1 1 1 1 1Community centers 1 1 1 1 1 1 1 2 2 2Senior centers 2 2 2 2 2 2 2 2 2 2Baseball/softball diamonds 2 3 3 3 3 3 3 3 3 3Soccer/football fields 4 6 6 6 6 6 6 6 9 9
Wastewater (1)Miles of storm drains 17 17 17 17 17 17 17 17 17 17
Source: Various City Departments
Notes: (1) Wastewater services are provided by Contra Costa County
129