
2010/11 - The Treasury Annual Report
130
The Treasury Annual Report 2010/11 Presented to the House of Representatives pursuant to section 44 of the Public Finance Act 1989 The Persistent URL for this publication is: http://purl.oclc.org/nzt/a-1410 The URL for this publication on the Treasury website at October 2011 is: http://www.treasury.govt.nz/publications/abouttreasury/annualreport/10-11 978-0-478-37862-7 (Print) 978-0-478-37863-4 (Online)
-
Upload
khangminh22 -
Category
Documents
-
view
0 -
download
0
Transcript of 2010/11 - The Treasury Annual Report

The Treasury Annual Report 2010/11
Presented to the House of Representatives pursuant to section 44 of the Public Finance Act 1989
The Persistent URL for this publication is: http://purl.oclc.org/nzt/a-1410 The URL for this publication on the Treasury website at October 2011 is: http://www.treasury.govt.nz/publications/abouttreasury/annualreport/10-11
978-0-478-37862-7 (Print) 978-0-478-37863-4 (Online)


Page i
Contents
Chief Executive’s Introduction ............................................................................................................ 1
An Eventful Year 1
The New Treasury Board 1
The Tri-Treasury Conference 1
Our Evolving Role 2
Key Achievements for 2010/11 2
Canterbury Earthquake Response ..................................................................................................... 4
What the Treasury Does .................................................................................................................... 5
Nature and Scope of Functions 5
The Treasury’s Performance Framework ........................................................................................... 6
Our Outcome Performance for 2010/11 ............................................................................................. 8
Overview 8
Outcome: Improved Economic Performance 9
Outcome: A High-performing State Sector that Supports New Zealand’s International Competitiveness 12
Outcome: A Stable and Sustainable Macroeconomic Environment 18
Enabling and Supporting a Higher-performing Treasury .................................................................. 21
Maintaining our Organisational Health and Capability 21
Statement of Responsibility ............................................................................................................. 26
The Treasury’s Output Expense Performance for 2010/11 .............................................................. 27
Statement of Objectives and Service Performance 27
Vote Finance Output Expense Performance .................................................................................... 29
Macroeconomic Policy Advice and Management MCOA 29
Policy Advice – Fiscal and Macroeconomic 30
Economic and Tax Forecasting 32
Fiscal Management 33
Fiscal Reporting 34
Management of Crown Lending and Crown Bank Accounts 35
Permanent Legislative Authority Funding for NZDMO 36
State Sector and Economic Performance Policy Advice and Management MCOA 40
Policy Advice – Economic Performance 41
Policy Advice – State Sector Performance 44
New Zealand Export Credit Office 48
Management of Liabilities, Claims Against the Crown and Crown Properties 50
Infrastructure Advice and Coordination 52
Crown Guarantee Schemes 54
Establishment and Monitoring of Crown Investment in AMI 57
Establishment of the New Zealand Productivity Commission 58

Page ii
Vote State-Owned Enterprises......................................................................................................... 59
Vote Crown Research Institutes ....................................................................................................... 61
The Quality of the Treasury’s Policy Advice ..................................................................................... 62
Quality Standards for Policy Advice ................................................................................................. 64
Ministerial Servicing Performance 2010/11 ...................................................................................... 65
Financial Statements – Departmental .............................................................................................. 66
Supplementary Financial Schedules – Non-departmental ............................................................... 86
New Zealand Debt Management Office ......................................................................................... 106
Independent Auditor’s Report ........................................................................................................ 118
Research and Policy Publications .................................................................................................. 121
Legislation ...................................................................................................................................... 122
Monitoring of Crown Agencies ....................................................................................................... 124
List of Acronyms ............................................................................................................................ 125

THE TREASURY ANNUAL REPORT 2010/11 – The Treasury
Page 1
Chief Executive’s Introduction I took up my appointment as Secretary in June 2011 and am delighted, and honoured, to be given the privilege of
leading the Treasury. I look forward to working with everyone in the Treasury to achieve our ambitious objective
of higher living standards for New Zealanders.
We’re at an important historic juncture as the centre of gravity of the world economy moves closer to
New Zealand. The re-emergence of China and India as regional centres of economic strength, the growth in the
Asia-Pacific region in general, the growing demand for our commodity exports and the arrival of technology that
brings us closer to the rest of the world create a “perfect storm of opportunity” for the country’s future.
The Treasury has a vital role to play in helping the country seize these opportunities and improve its living
standards.
We live in interesting times. Earlier this year, the consensus among economists was that the international
economy was recovering nicely. Share prices were rising and financial markets were anticipating that central
banks would shortly return monetary policy settings to something approaching pre-global financial crisis normality.
However, within a matter of weeks, the US economy started to stumble and the focus of the financial markets
again turned to the outlook for Euro-zone economies – serving to reinforce the Treasury’s critical role in providing
quality and timely advice to our Minister.
An Eventful Year
The 2010/11 year was an eventful one. With our advice and assistance being increasingly sought across a range
of activity, the Treasury took on additional roles, and May featured two events of particular note – our flagship
Budget production, and the departure of Secretary John Whitehead.
Budget 2011 was noteworthy for its forecast for a return to surplus in 2014/15 – one year earlier than previously
expected. This was achieved despite the impacts of the Canterbury earthquakes, the slower economic recovery
and various other economic setbacks.
A fortnight later, we farewelled Secretary of eight years, John Whitehead, who has taken up the position of
Executive Director to the World Bank in Washington. The role represents a strategic opportunity for New Zealand,
and will help develop our country’s networks and raise its profile for the wider benefit of our public service.
The year also featured two new initiatives: the establishment of the Treasury Board, and the inaugural Tri-
Treasury Conference.
The New Treasury Board
The first meeting of the Treasury Board was held in October 2010. The Board’s focus on strategic issues affecting
the organisation brings a governance lens to our business, particularly in holding us to account for our
performance. The value of a governance board is in taking decisions on strategic issues, strategic direction and
organisational management.
The Tri-Treasury Conference
In February, we were honoured to host the first Tri-Treasury Conference, a gathering of the heads of the
New Zealand, Australian and United Kingdom Treasuries. The opportunity to canvass a range of pressing
economic and financial issues, and to hear their perspectives on some of the big challenges we are all facing,
was invaluable.

THE TREASURY ANNUAL REPORT 2010/11 – The Treasury
Page 2
Our Evolving Role
The Treasury’s core work is to improve the living standards of New Zealanders through its three outcomes:
Improving New Zealand’s Economic Performance; A High-performing State Sector that Supports New Zealand’s
International Competitiveness; and A Stable and Sustainable Macroeconomic Environment.
Our role is evolving, however, and over 2010/11, the Treasury took on additional responsibilities. Our Earthquake
Coordination Team was established to help with Canterbury response efforts through the provision of information
and advice to Ministers. Work continues on the receivership of South Canterbury Finance (SCF) and the support
package for AMI Insurance (AMI), and the Crown Ownership Monitoring Unit (COMU) has been tasked with
formulating advice on the Mixed Ownership Model.
A small Treasury team performed the establishment work necessary to set up the Productivity Commission, and
Treasury staff supported the Welfare Working Group and Savings Working Group in delivering their final reports.
The National Infrastructure Unit (NIU) completed the second National Infrastructure Plan, which was launched at
a parliamentary reception.
Key Achievements for 2010/11
The Earthquake Coordination Team
Treasury advice enabled Ministers to deal quickly with the financial consequences of the Canterbury earthquakes,
to coordinate recovery actions and to set up a new authority, the Canterbury Earthquake Recovery Authority
(CERA).
This specialist Treasury team has played a crucial role in coordinating the all-of-government response through
advice to Ministers on matters such as the estimated macroeconomic and fiscal impacts, insurance and
Earthquake Commission (EQC) payouts and various funding initiatives (such as earthquake support subsidies).
Budget 2011
Households’ high levels of debt,
New Zealand’s high net external liabilities and
a weak productivity record are symptoms of
an economy that has been underperforming
over a number of years. We need to turn
these indicators around to reduce future risks
to the economy’s equilibrium and, therefore,
to New Zealanders’ living standards.
Decisions announced in Budget 2011 are
designed to facilitate a path toward stronger
national productivity performance and faster
economic growth, underpinned by a credible
fiscal consolidation plan: eliminating the fiscal deficit and returning to surplus on a sustained basis through
lowering operating and capital allowances, finding savings and a process of reprioritisation.
Financial Operations
It has been an eventful year for the Financial Operations Group. The New Zealand Debt Management Office
(NZDMO) took advantage of favourable interest rates by pre-funding significant amounts of future borrowing. This
peaked with a weekly Government Bond tender of $950 million in January, completing several weeks’ worth of the
borrowing programme in one fell swoop.
Current account and net IIP
Sources: Statistics New Zealand, the Treasury

THE TREASURY ANNUAL REPORT 2010/11 – The Treasury
Page 3
The Government announced early in 2011 that the New Zealand Export Credit Office (NZECO), which has
supported more than $1 billion of total exports since it was established, would remain part of the Treasury for the
next three years.
And over the course of the financial year, six government-guaranteed institutions defaulted. By the end of June
2011, all eligible depositors – other than those who had yet to make claims or who could not be traced – had been
paid. The guarantee schemes transitioned from coverage of more than $133 billion in 70 institutions to just seven
institutions with about $2.500 billion worth of deposits.
The Office of the Auditor-General (OAG) has conducted a performance audit of the Treasury’s administration and
management of the Crown Retail Deposit Guarantee Scheme which had not been completed as I write this
foreword.
The National Infrastructure Plan
The Treasury’s NIU published its second National Infrastructure Plan in July following consultation with the
National Infrastructure Advisory Board and a series of regional infrastructure workshops.
It is designed to reduce uncertainty for businesses by outlining the Government’s intentions for infrastructure
development over the next 20 years, provides a framework for infrastructure development and includes a series of
actions, working towards the next release in 2014.
State Sector Reform
Together with the other Central Agencies (the Department of the Prime Minister and Cabinet [DPMC] and the
State Services Commission [SSC]), we prepared advice for Ministers that led to the establishment of a significant
programme of work, resulting in the Government’s Better Public Services programme. This has the following
aims:
Clear priorities: Focusing on the things that matter most for New Zealanders.
High-quality services: Ensuring that services are modern, responsive, business-like and provide good value
for money.
Reducing waste: Ensuring that government administration is efficient, streamlined and well organised.
Raising productivity in the State sector is crucial to any successful effort to raise nationwide performance and,
therefore, the per capita incomes of New Zealanders over time.
Regulatory Reform
The Treasury provides policy advice on key regulatory sectors that matter for growth, and on how to improve the
regulatory management system. We support Ministers to improve the flow of regulation through quality assurance
on regulatory impact statements that relate to significant regulatory proposals, and by building agency capability
to perform good regulatory impact analysis. We coordinate annual regulatory plans, which set out all anticipated
proposals to introduce, amend, repeal or review regulation each year.
In relation to the stock of existing regulation, we provide guidance for agency scanning of the regulation they are
responsible for to ensure that it is fit for purpose. We also develop and apply (and help regulatory agencies
develop and apply) principles for testing whether regulatory regimes are good practice.
Looking to the Future
My vision for the Treasury is that we will be among the most respected and influential organisations in
New Zealand. Our Ministers expect us to provide advice that will shape New Zealand’s economic future, and
they’re looking to us to be more effective State sector leaders.

THE TREASURY ANNUAL REPORT 2010/11 – The Treasury
Page 4
Ultimately, I’d like to see success defined by the strength of our values – open-minded, bold, challenging and
collaborative, passionate and ambitious for our people and our performance – and by a change in the Treasury’s
impact, image and brand.
We will know that we have achieved this when businesses and agencies across the country respect us for the
relevance of what we say, for being good partners, for being able to seize opportunities and solve problems, for
being experts at what we do and for being good navigators for New Zealand.
Gabriel Makhlouf
Secretary to the Treasury
Canterbury Earthquake Response
In the aftermath of the recent Canterbury earthquakes the Treasury supported an effective all-of-government
response involving many other departments and agencies across the public sector. Throughout this process,
the Treasury sought to ensure that advice was well-coordinated, guided by a coherent framework and
included solid assessment of emerging risks, including to the Crown’s fiscal position.
The Treasury has:
reported on the fiscal and economic implications of the earthquakes, advising on the Government’s
response to the Canterbury earthquakes. Working closely with CERA, we advised on fiscal implications,
land remediation, insurance, business recovery and regulatory and other issues
provided advice on the fiscal management of earthquake-related expenditure including utilising, for the first
time, the emergency expenditure provisions of the Public Finance Act 1989, and the management of
infrastructure expenditure
advised on the financial market implications of the earthquakes, in particular insurance markets
worked with CERA, the Christchurch City Council and the Department of Internal Affairs (DIA) on the
sharing of costs of rebuilding infrastructure between central and local government
advised on the capital structure of EQC and the implications of payouts for the Natural Disaster Fund.
This included implications of the EQC Act 1993 in respect of the specific events in Canterbury and the new
functions that EQC took on
working with SSC, advised on the establishment and funding of CERA, and
advised on the Government’s response to requests for financial assistance from the local government
insurance sector.
The demands of this work had a material impact on the Treasury’s work programme, delaying or scaling back
some lower-priority work.

THE TREASURY ANNUAL REPORT 2010/11 – The Treasury
Page 5
What the Treasury Does
Nature and Scope of Functions
Our Purpose
The Treasury is government’s leading economic, financial and regulatory advisor. Our core job is to help the
Government improve New Zealand’s overall economic performance, and increase the living standards of
New Zealanders, through the provision of high-quality advice and services. Our advice contributes to improved
performance by making challenging issues more tractable to effective government decision-making. The Treasury
supports effective delivery of services by the State sector through its policy advice, and delivers some services
directly where it is best placed to do so.
The Scope of Our Work
The Treasury provides advice and services to Ministers, primarily the Minister of Finance, through Vote Finance.
We perform three roles through these portfolios:
providing policy advice direct to Ministers to facilitate government decisions on changes and initiatives that
support better economic performance and higher living standards
raising the quality of advice and service delivery in the State sector, by leading improvements in State sector
management and performance through a shared work programme involving the three Central Agencies – the
Treasury, DPMC and SSC – and providing second-opinion advice on the economic and financial implications
of other government agencies’ proposals, and
providing services directly, such as monitoring and managing the financial affairs of the Crown, including
managing the Crown’s debt through NZDMO, and supporting New Zealand’s economic performance through
the provision of services through NZECO, Crown Wholesale Guarantee Facility and the Retail Deposit
Guarantee Scheme.
These outputs are funded through 20 specific departmental output appropriations.
Outcome Areas
This report sets out the progress we made in our three outcome areas: A Stable and Sustainable Macroeconomic
Environment; Improved Economic Performance; and A High-performing State Sector that supports New Zealand’s
International Competitiveness. These outcomes reflect the areas where we have the greatest influence towards
achieving the Government’s goals.
Success involves engaging effectively, both internally and with our key external customers, providing good-quality
policy advice and operations and being flexible in our approach so that we can respond to changes in our
operating environment.

THE TREASURY ANNUAL REPORT 2010/11 – The Treasury
Page 6
The Treasury’s Performance Framework
The Treasury’s Vision Outcomes and Intermediate Outcomes

THE TREASURY ANNUAL REPORT 2010/11 – The Treasury
Page 7
The Treasury’s Outputs and the Impact on Our Intermediate Outcomes

THE TREASURY ANNUAL REPORT 2010/11 – The Treasury
Page 8
Our Outcome Performance for 2010/11
Overview
Our vision is to be a world class Treasury working towards higher living standards for New Zealanders.
We take account of both current and future living standards to ensure resources are managed efficiently and
sustainably. We also consider how key factors influencing living standards are distributed across the population,
and how opportunities can be promoted for those who are most disadvantaged.
Over the past year we have reviewed the three key Treasury outcomes that support the Government’s priorities
whilst contributing to that vision. We have also reassessed the intermediate outcomes that complement the
Treasury’s primary outcomes, a process that has resulted in a change to how we have articulated the Treasury’s
intermediate outcomes.
Outcome performance is provided against the measures and indicators agreed in the 2011/12 Statement of Intent
(SOI) as the Treasury improved the basis for reviewing performance during the development of the document. In
comparison, the statement of service performance, starting on page 27, includes reporting against the measures
agreed to in the 2010/11 Information Supporting the Estimates documents as well as some of those contained in
the 2011/12 Information Supporting the Estimates documents. The outcomes are: Improved Economic
Performance; a High-performing State Sector that Supports New Zealand’s International Competitiveness; and A
Stable and Sustainable Macroeconomic Environment. These are interconnected and mutually reinforcing. The
New Zealand economy strengthened further in the 2010/11 financial year, building on the post-global financial
crisis recovery that had commenced in June 2009.
For the Treasury, 2010/11 was a productive year in which we assisted the Government to roll out policies
designed to both raise New Zealand’s relative economic performance while assisting the necessarily gradual
process to unwind large macroeconomic imbalances that have afflicted our economy for decades.
The global financial crisis of 2008/09, and developments in international markets since, have highlighted to New
Zealanders that we need to reduce our vulnerability to any future changes in investor sentiment. In particular,
households’ high levels of debt and the country’s high net external liabilities with the world represent a potential
future risk to the economy’s equilibrium, and therefore a degree of ongoing risk also to New Zealanders’ future
living standards.
The Treasury’s view is that large macroeconomic imbalances will continue to present risks to the economy until
they are materially unwound, and that the appropriate Crown response is to strengthen its own balance sheet and
fiscal management framework, to adopt measures that further enhance our monetary, regulatory and fiscal
frameworks and to progress evidence-based policies that will strengthen the national savings rate.
Decisions announced in Budget 2011, which built on measures adopted in Budget 2010, are designed to facilitate
a path toward stronger national productivity performance and faster economic growth, underpinned by a credible
fiscal consolidation plan.
Initial indicators of success are beginning to be evidenced through:
an improvement in growth in tradable sector output compared to the growth in the non-tradable sector
a forecasted reduction in core Crown expenses as a proportion of GDP, and
a forecasted reduction in Crown net debt projections.
Budget decisions to better manage Crown spending will, over time, assist to free up resources for more productive
uses, which will be a key ongoing mechanism to drive both a strengthening in our economic fundamentals and a
reduction in our vulnerability as a society to any unforeseen future external shocks to our economy.

THE TREASURY ANNUAL REPORT 2010/11 – The Treasury
Page 9
Outcome: Improved Economic Performance
New Zealand’s long-term poor economic performance has seen a relative decline in New Zealanders’ living
standards compared with high-income countries.
New Zealand’s poor performance is reflected in
a lower level of labour productivity, which is
associated with relatively low levels of both
capital intensity and multi-factor productivity.
Reversing the decline in New Zealand’s relative
standard of living requires policy changes that
have the potential to lift productivity across the
economy and support a substantial lift in export
performance.
How We Have Contributed to This Outcome
The Treasury has provided advice on key
government policies that relate to growth.
Highlights from the year include:
providing advice on integration of the Youth Guarantee and Youth Pipeline, aimed at better identification of at-
risk young people; better support and pathways into post-school education and training or career; improving
the performance of the student loan scheme; and the provision of high-quality education and training
programmes leading to meaningful qualifications
promoting regulatory reform, providing advice on regulatory sectors that matter for growth and achieving a
shift in the quality of the regulatory management system
developing advice and providing input into the Savings Working Group, resulting in changes to savings and
tax systems in 2011
implementing, with IRD, major tax reforms that were announced in Budget 2010
contributing to the development of economic frameworks that are used by agencies in the natural resource
sector. We advised on New Zealand’s climate change commitments, ensuring that the economic implications
of options were understood as New Zealand negotiated its climate change strategy, including at the United
Nations Climate Change Conference in Cancun, Mexico. We contributed to the secretariat of the Emissions
Trading Schemes led by the Hon David Caygill
contributing to work on how to achieve the greatest value for New Zealand from fresh water, through the
development of inter-agency advice on water policy in the lead-up to and following the mid-2011 Report of the
Land and Water Forum: A Fresh Start for Freshwater
developing the second edition of the National Infrastructure Plan, aiming to give businesses confidence that
the infrastructure environment will be responsive and support their business growth. The plan has been well
received by stakeholders
providing advice on critical international areas, including reviewing the Overseas Investment Act 2005
(resulting in immediate reduction in compliance and administration costs), concluding a Closer Economic
Relations (CER) investment protocol with Australia and supporting ongoing negotiations on the Trans-Pacific
Partnership Free Trade Agreement
engaging in a range of significant international relationships, including new engagements with the US
Treasury and Indian Ministry of Finance
Relative levels of nominal GDP per capita, 1970 to 2009 (OECD Average=100)
Source: OECD

THE TREASURY ANNUAL REPORT 2010/11 – The Treasury
Page 10
providing secretariat support to the Welfare Working Group on how to reduce long-term dependency for
people of working age, and
significant investment in understanding New Zealand’s growth performance, culminating in a growth narrative
that integrates both macro- and microeconomic perspectives and indicates key areas for policy change in
order to shift New Zealand’s growth performance towards a target of 4% per annum.
Outcome and Intermediate Outcome Indicator and Measures: Position in 2010/11
Outcome: Improved Economic Performance
Growth rates sufficient to deliver high incomes to New Zealanders.
Target in 201116 SOI: A strong recovery in 2012 is sustained, lifting five-year average real GDP per capita above the Organisation for Economic Co-operation and Development (OECD) average and ultimately reaching 4% per annum.
Growth in New Zealand’s real GDP per capita was 0.4% for the year to March 2011.
For the five years ending 2009 (latest available data), OECD average real GDP per capita growth was 0.3%. Over the same period, average growth in New Zealand was 0.5%.
The economy rebalances to deliver higher growth. Growth in tradable sector output at least matches that of the non-tradable sector over the next two years, and then significantly exceeds it.
Target in 201116 SOI: Growth in tradable sector output at least matches that of the non-tradable sector over the next two years, and then significantly exceeds it.
Growth in output in New Zealand’s tradable and non-tradable sectors was 0.1% and 2% respectively for the year to March 2011. For the five years ending March 2011, growth in the tradable and non-tradable sectors was -1.9% and 1.6% respectively.
Intermediate outcome: Improved business environment
Business investment as a percentage of GDP.
Target in 201116 SOI: Increases substantially to OECD-average level.
New Zealand business investment (gross private non-residential investment) as a percentage of GDP was 10.4% for calendar year 2010. For the five years ending 2010, the average was 11.2%. The OECD average was 10.6% in 2010, with a five-year average of 12.1%.
Business expenditure on research and development (R&D).
Target in 201116 SOI: Lift business expenditure on R&D substantially to around 1% to 2% of GDP.
New Zealand business expenditure on R&D was 0.5% of GDP in both 2008 and 2010. The OECD average in 2008 (latest available) was 1.6% of GDP.
Regulatory Impact Statements meet most or all of Regulatory Impact Analysis requirements.
Target in 201116 SOI: 75% by 2012 and 90% by 2013.
Of significant proposals requiring a Regulatory Impact Statement, 66% met most or all of the requirements.
The National Infrastructure Plan and annual Infrastructure State of the Nation report provide certainty to business/investors and the public about the performance of New Zealand’s infrastructure.
Target in 201116 SOI: The National Infrastructure Plan and State of Nation report provide investor certainty, with improvement in the World Economic Forum ranking of New Zealand infrastructure quality.
Stakeholder feedback about the 2011 National Infrastructure Plan was positive, with endorsement of the approach and principles, and enthusiasm for the three-year action plan.
New Zealand’s negotiating position in international meetings on climate change.
Target in 201116 SOI: Consistent with the final climate change targets imposing economic impacts no greater than those faced by comparator countries.
The Treasury advised on the economic and financial implications of New Zealand’s climate change negotiating strategy, including at the United Nations Climate Change Conference in Cancun, Mexico.
New Zealand’s export share of world trade.
Target in 201116 SOI (Amended): New Zealand’s export share of world trade increases.
New Zealand’s export share of world trade in 2010 was 0.22%. For the five years ending 2010, the average was 0.21%.
The flow of foreign direct investment (FDI) and outward direct investment (ODI) as a percentage of GDP.
Target in 201116 SOI: ODI as a percentage of GDP increases to half the OECD average and the flow of FDI increases to 30% of foreign investment.
In 2010 New Zealand’s ODI and FDI were both 0.4% of GDP. The OECD average for ODI and FDI was 2.4% and 1.5% respectively. As a percentage of total foreign investment in New Zealand, FDI was 8.7%.

THE TREASURY ANNUAL REPORT 2010/11 – The Treasury
Page 11
Outcome and Intermediate Outcome Indicator and Measures: Position in 2010/11
Better international linkages and relationships.
Target in 201116 SOI: Memoranda of Understanding for Treasury-to-Treasury dialogues with one or more countries of economic significance to New Zealand.
Undertook first set of Treasury-to-Treasury consultations with the US.
Undertook second set of Treasury-to-Treasury consultations with India.
Intermediate outcome: Enhanced human capital and labour supply
Percentage of young people who achieve at least National Certificate of Educational Achievement (NCEA) Level 2 or equivalent by the time they complete their schooling or reach the age of 18.
Target in 201116 SOI: 95% to 98% of young people achieve at least NCEA Level 2 or equivalent by the time they complete their schooling or reach the age of 18.
69.8% of 2009 school leavers achieved NCEA Level 2 or above.
Proportion of young people achieve vocational and tertiary qualifications at Level 4 and above by age 25.
Target in 201116 SOI: A greater proportion of young people achieve vocational and tertiary qualifications at Level 4 and above by age 25.
In 2009, 38% of those 25-year-old and younger had completed a tertiary qualification at Level 4 or above.
OECD mean in the proportion of 15- to 24-year-olds who are not in education, employment or training (NEET).
Target in 201116 SOI: There is a reduction to at least the OECD mean in the proportion of 15- to 24-year-olds who are NEET.
In year to March 2011, the NEET rate for 15- to 24-year-olds was 9.9%, down from 10.8% in the previous year. The OECD 2008 average NEET rate was 12% across 15- to 24-year-olds.

THE TREASURY ANNUAL REPORT 2010/11 – The Treasury
Page 12
Outcome: A High-performing State Sector that Supports New Zealand’s International Competitiveness
The quality of expenditure, regulation and other interventions by State sector agencies has a significant impact,
both good and bad, on the incomes, opportunities and general wellbeing of individuals. It impacts both directly
and indirectly on New Zealand’s economic performance, which is a critical dimension of New Zealanders’ living
standards, particularly through the way it affects individuals’ and firms’ productivity. Government interventions
also have distributional implications; governments have an important role to play in protecting the most vulnerable
in our society in ways that enhance overall economic performance.
The ultimate measure of a high-performing State sector is its success delivering on the economic, social and
environmental objectives of the Government in a way that is effective, efficient and affordable.
How We Have Contributed to This Outcome
The Treasury provided advice to Ministers on potential mechanisms to strengthen the budget process and to
improve incentives for chief executives of agencies to improve medium-term planning. The Treasury focused in
2010/11 on medium-term strategies for the justice and defence sectors. The Treasury provided secretariat
support to the Policy Expenditure Review.
We also released the inaugural benchmarking of back office agency activities, which provided the impetus for
Ministers to confidently pursue faster fiscal consolidation in the 2011 Budget. This benchmarking exercise has
increased the appetite and capability across agencies for better management information regarding services,
including services to the public, and the appetite also for the development of consistent measures for common
functions across agencies.
In December 2010, the inaugural Investment Statement of the Government of New Zealand was published and
this was followed with a Supplement published in May 2011. These enhanced stakeholder knowledge and insight
into the Crown’s investment portfolio and enabled the Treasury to give clear advice on changes to the structure of
the balance sheet and the ways in which the balance sheet is managed.
COMU has published the first in a series of Annual Portfolio Reports, describing the financial performance of the
Crown’s commercial entities. An important priority in the commercial area has been to initiate preparatory work on
commercial transactions to advance mixed ownership of some SOEs.
We have implemented the CAM framework across government which has been adopted by capital-intensive
agencies in the public sector. This framework encourages strong CAM practices which enhance performance
and effectively manage risk from Crown infrastructural assets.
In order to minimise debt costs within an appropriate risk profile, we have continued to emphasise marketing to
domestic and international investors, which, along with other cross-Treasury policy efforts, have achieved an
optimal credit rating for the New Zealand Government. In total, NZDMO issued $19.500 billion worth of bonds with
an annual cost of new borrowing in 2010/11 at 4.31%, lower than the long-run average cost of just over 6%.
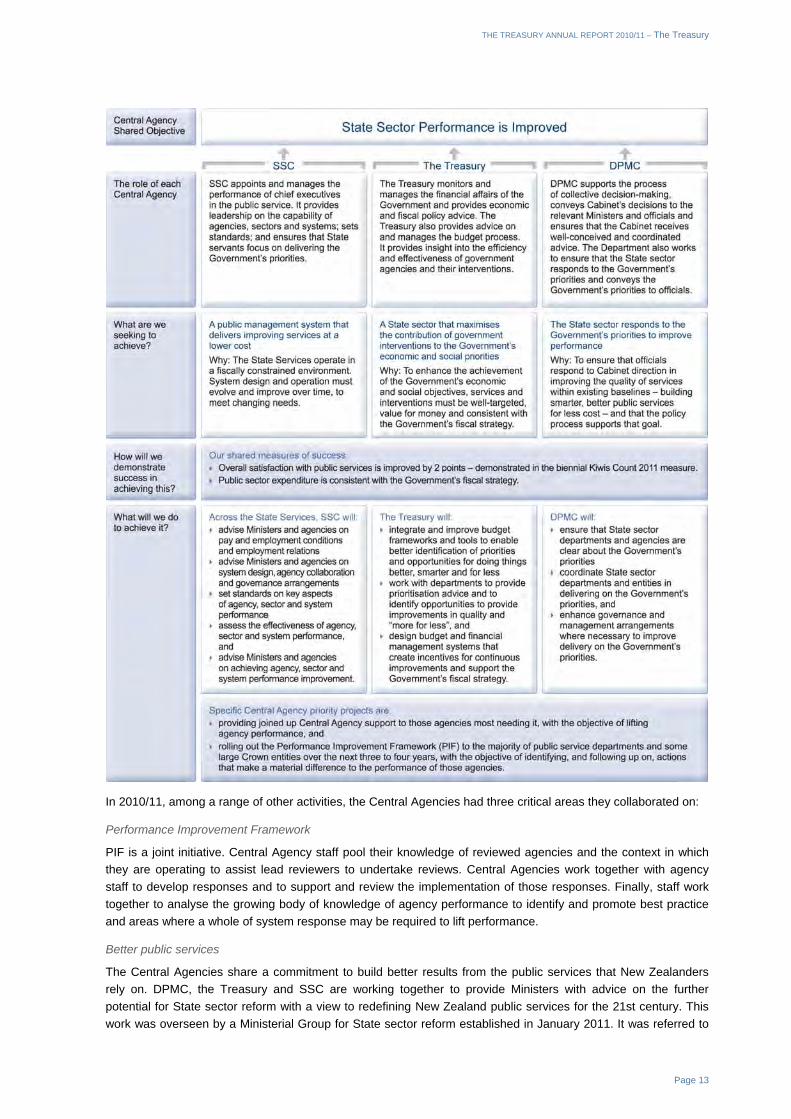
Central Agencies’ shared objective: State sector performance is improved
The Central Agencies (SSC, DPMC and the Treasury) have a shared objective: State sector performance is
improved. This recognises that the Central Agencies are jointly responsible for leading performance
improvements in the State sector, albeit with distinctive roles and perspectives. The three Central Agencies are
committed to ensuring that better services are delivered to New Zealanders, that the State sector’s performance
is improving and that State sector expenditure is more disciplined.
The Central Agencies work individually and collaboratively across agencies, sectors and the public management
system. The Central Agencies’ contributions and outputs to deliver on the shared objective are outlined below.
THE TREASURY ANNUAL REPORT 2010/11 – The Treasury
Page 13
In 2010/11, among a range of other activities, the Central Agencies had three critical areas they collaborated on:
Performance Improvement Framework
PIF is a joint initiative. Central Agency staff pool their knowledge of reviewed agencies and the context in which
they are operating to assist lead reviewers to undertake reviews. Central Agencies work together with agency
staff to develop responses and to support and review the implementation of those responses. Finally, staff work
together to analyse the growing body of knowledge of agency performance to identify and promote best practice
and areas where a whole of system response may be required to lift performance.
Better public services
The Central Agencies share a commitment to build better results from the public services that New Zealanders
rely on. DPMC, the Treasury and SSC are working together to provide Ministers with advice on the further
potential for State sector reform with a view to redefining New Zealand public services for the 21st century. This
work was overseen by a Ministerial Group for State sector reform established in January 2011. It was referred to

THE TREASURY ANNUAL REPORT 2010/11 – The Treasury
Page 14
in the Prime Minister’s statement at the opening of Parliament and in the Deputy Prime Minister’s speech to the
Institute of Public Administration (IPANZ) in March. This work has continued under the governance of the Better
Public Services Advisory Group which met for the first time on 25 May 2011. This work can also be referenced on
the Better Public Services website: www.dpmc.govt.nz/better_public_services
Review of Expenditure on Policy Advice
The efficiency and effectiveness of government interventions depends considerably on the design of those
interventions. The expenses, management and quality of policy advice therefore matters for improving State
sector performance. The Government commissioned the Review of Expenditure on Policy Advice in August 2010
to provide advice on the cost and quality of policy advice, as well as the alignment between policy expenditure
and the Government’s priorities. The Review’s final report was provided to the Government in December 2010.
On 28 April 2011 the Government announced a suite of actions in response to the Review’s recommendations.
The Treasury, SSC and DPMC led the development of an implementation plan and are responsible for delivering
on a number of the recommendations. Most will be completed in the 2011/12 year.
Demonstrating success
Kiwis Count
The Kiwis Count1 survey was conducted in 2007 and 2009. Further assessments of service quality will be conducted
in the 2011/14 period. In 2007, New Zealanders’ overall quality score for public services was 68. In 2009, there was
a small but significant improvement to 69. This improvement, in a fiscally challenging environment, is an
achievement for the State Services. The results compare favourably with a similar Canadian research programme
Citizens First. The results show a comparable increase in satisfaction in its first two years of operation and
demonstrates that our target of a further improvement in service quality is both significant and challenging.
Overall service quality
The methodology for Kiwis Count was reviewed in 2010/11 following the successful surveys in 2007 and 2009.
Starting in 2011, the Kiwis Count biennial point-in-time survey will be upgraded to a continuous survey with fieldwork
50 weeks of the year and quarterly reporting on a six-month rolling average. This more flexible tool can be adapted
to meet future needs and changing priorities.
Results will be consistent with previous Kiwis
Count surveys and Canadian benchmarks.
Public sector expenditure
One of the Central Agencies’ measures of
success regarding improved State sector
performance is for Crown spending to remain
consistent with the Government’s fiscal and
economic growth strategies. The long-term
objective is for core Crown expenses to ease to
around 30% of GDP. Our intention is to support
a return to surplus by controlling the growth in
operating expenses so that core Crown
expenses fall as a percentage of GDP to around
31% of GDP by June 2015 and current forecasts indicate that we are on track to meet this target.
1 www.ssc.govt.nz/nzers-experience
Overall service quality (comparison of New Zealand and Canada)
Source: SSC

THE TREASURY ANNUAL REPORT 2010/11 – The Treasury
Page 15
Core Crown expenses were 33.8% of GDP at June 2010 and forecast to be 35.2% at June 2011. While core
Crown expenses increased over this time as a result of the Canterbury earthquakes, they are forecast to fall to
31.3% of GDP by June 2015.
This decrease reflects the cessation of “one-off”
expenditure such as costs associated with the
Canterbury earthquakes, provision for
weathertight homes payments and the DGS, as
well as a decrease in the amount of new
spending forecast over this time. The current
forecast of core Crown expenses as a proportion
of GDP in 2015 is lower than the forecast
contained in the Half Year Economic and Fiscal
Update (HYEFU). This is primarily as a result of
the 2010/11 net savings package and a
reduction in new spending in the next two
budgets (source: Budget Economic and Fiscal
Update 2011 [BEFU]).
Outcome and Intermediate Outcome Indicators and Measures: Position in 2010/11
Outcome: A High-performing State Sector that Supports New Zealand’s International Competitiveness
Affordability: Core Crown expenses as a proportion of GDP are falling over time.
Target in 201116 SOI: Core Crown expenses as a proportion of GDP reduce over the next three to five years.
Core Crown expenses were 33.8% of GDP at June 2010 and forecast to be 35.2% at June 2011. Over the past decade this ratio had ranged between 29% and 34%. More recently, expenses have risen as a proportion of GDP owing to a number of factors, including the impact on spending and/or GDP from the global financial crisis, domestic recession and policy decisions to increase spending.
Efficiency: Number of State sector employees as a proportion of the working age population is reduced.
Target in 201116 SOI: The number of State Service2 employees as a proportion of the labour force is reducing over the next three to five years.
At June 2010, State Service employees accounted for approximately 225,000 people or about 10% of the total labour force. While as a proportion of the total labour force this figure has not changed significantly over the past decade, approximately 38,000 more people have been employed in the State Services since 2000.
Effectiveness: New Zealand’s ranking in the Energy, Transport and Communications Regulation (ETCR) subset of OECD indicators of Product Market Regulation improves.
Target in 201116 SOI: New Zealand’s score and ranking in the ETCR subset of OECD Indicators of Product Market Regulation improves. The Treasury looks at this indicator as a proxy for the effectiveness of government in supporting economic growth.
New Zealand’s network regulation was rated as one of the least restrictive in the late 1990s and the overall rating has changed little since. Many OECD countries have improved their rating and consistency over time.
Public perception of the quality of public services is improving, despite tight fiscal environment.
Target in 201116 SOI: Kiwis Count quality score for public services will rise from 71 in 2011 to 72 in 2013. (The Treasury’s role in State sector management also gives it an influence over the state of this indicator.)
The Kiwis Count quality score for public services was 68 in 2007 and 69 in 2009. This will be surveyed again in 2011.
Agencies are demonstrating continuous performance improvement for those undergoing the second cycle of PIF reviews from 2013 onwards.
Target in 201116 SOI: The proportion of ratings of “strong” or “well-placed” is above 60% for organisational management (so far 50%) and 66% for results (so far 56%).
PIF has been applied to 14 agencies. An objective of the PIF schedule is to complete reviews for all the major public service agencies by 2013.
2 State Services include public service departments, non-public service departments, Crown entities, the Reserve Bank of New Zealand (RBNZ), district health boards
(DHBs) and entities on the new Public Finance Act Fourth Schedule (such as Fish and Game Councils). It excludes tertiary education institutions and SOEs.
Core Crown expenses (excluding losses) to nominal GDP
Source: The Treasury

THE TREASURY ANNUAL REPORT 2010/11 – The Treasury
Page 16
Outcome and Intermediate Outcome Indicators and Measures: Position in 2010/11
Follow-up processes are in place to monitor progress of PIF action plans.
Target in 201116 SOI: For agencies undergoing the second cycle of PIF reviews from 2013 on, the proportion of ratings of “strong” or “well-placed” is above 60% for organisational management and 70% for results.
Follow-up processes are in place and being implemented to monitor progress on agencies’ strategic responses to their PIF reviews.
State sector reform agenda results in a smaller, sharper set of well-focused and coordinated public agencies with greater contestability of delivery.
Target in 201116 SOI: State sector reform agenda results in a smaller, sharper set of well-focused and coordinated public agencies and greater contestability in the delivery of public services.
Decisions have been taken to merge a number of departments, Crown entities and tribunals. Governance arrangements are in place (including an Advisory Group and Secretariat) to drive the next steps in the reform work.
Intermediate outcome: The State sector allocates resources to where they are most effective and services are delivered in the most efficient way
Health, education and income support spending is well-targeted, shifting towards low-income households.
Target in 201116 SOI: Health, education and income support spending is well-targeted, shifting towards low-income households.
Real average social spending per household increased over the period 1988/89 to 2006/07. Spending remains weighted towards lower-income households. There has been some increase in the proportion of spending distribution directed to higher deciles over the period 1998/99 to 2006/07 (the latest data available).
Agencies deliver services efficiently and effectively, meeting or exceeding the performance of their international peers.
Target in 201116 SOI: A selection of indicators shows agencies deliver services efficiently and effectively, meeting or exceeding the performance of their international peers.
The Treasury will be working on suitable measures during 2011/12.
The Treasury measured back office service performance in 33 selected larger departments and Crown entities against international peers and identified opportunities for improvement.
The long-term liability to the Crown associated with the working-age benefit population is accurately measured (by 12 months), used to inform policy (by 24 months) and appropriate targets for reductions in the liability are established and delivery agencies are accountable for the liability (by 36 months).
Target in 201116 SOI: Progressively, evidence of the costs and benefits of baseline expenditure is built up, with a target set by 2012/13.
Thirteen percent of the working-age population receiving a benefit; one in five of New Zealand’s children in benefit-dependent families (2010 approximate). There were 170,000 people on a benefit for most of the past 10 years; vast majority for reasons other than unemployment (2009 approximate).
All significant new spending proposals are subject to cost benefit analysis.
Target in 201116 SOI: All significant new spending proposals are subject to cost benefit analysis (or similar). Over the next 12 months the Treasury will develop a methodology and process for gathering this information.
This information is currently not systematically collected or published. While not always specifically measuring costs and benefits of expenditure, some evidence will flow through into current decisions.
There were relatively few new operating expenditure proposals in Budget 2011.
Major decisions in Budget 2011, such as changes to KiwiSaver, were based on careful evaluation and cost-effectiveness evidence.
Better business cases are now required for charges against the capital allowance.
All new regulatory proposals include assessment of costs and benefits.
Target in 201116 SOI: Progressively, the stock of regulation is assessed for its costs and benefits; 60% of stock scanned by 2013; 90% of Regulatory Impact Statements meeting most or all Regulatory Impact Analysis requirements by 2013.
Sixty percent of Regulatory Impact Statements currently meet most or all Regulatory Impact Analysis requirements.
Departments scanned the full stock of regulation in 2010, but at a very high level.

THE TREASURY ANNUAL REPORT 2010/11 – The Treasury
Page 17
Outcome and Intermediate Outcome Indicators and Measures: Position in 2010/11
Administrative and support services meet or exceed performance of international peers.
Target in 201116 SOI: Administrative and support services are efficient and effective and they meet or exceed the performance of international peers. Spending on administrative and support services reduces by 15% across the State sector, with equal or improved effectiveness over the next three to five years.
Departments and Crown Agents (not including DHBs) currently spend 9.8% of their operating running costs on administrative and support services.
Intermediate outcome: The Crown’s balance sheet is managed efficiently and effectively
A balance sheet management strategy is in place.
Target in 201116 SOI: Changes made to the composition of the balance sheet to optimise settings and allocate capital to government priorities.
The Government’s investment intentions have been set out in the Investment Statement, with progress reported in the subsequent Supplement.
Appropriate rates of return and dividends are achieved from the Crown’s financial and commercial entities.
Target in 201116 SOI: Financial performance of the Crown’s companies is comparable to private sector benchmarks. Long-term returns of CFIs meeting or exceeding their fund objectives. Appropriate benchmarks around Total Shareholder Return and Dividend Yield developed by December 2011.
Crown’s view on dividend expectations set in letters of expectation to SOEs and past performance reported in Annual Portfolio Report.
Capital asset management practices are enhancing performance.
Target in 201116 SOI: All capital-intensive agencies considered best practice.
Measures of asset performance being in place by 2012 for all the capital-intensive agencies.
Measures of asset performance improving over time.
In July 2010 Cabinet endorsed new CAM rules and expectations. In support of these expectations, the Treasury launched new guidance and support on capital business cases. By year end this methodology was widely understood and accepted across State sector agencies. Latest indications are that agencies are rationalising their capital intentions in response to government policy statements.

THE TREASURY ANNUAL REPORT 2010/11 – The Treasury
Page 18
Outcome: A Stable and Sustainable Macroeconomic Environment
A stable and sustainable macroeconomic
environment is required in order to deliver broad
and enduring prosperity. High private sector
debt levels, built up in tandem with a long-
running low national saving rate and a period of
extended asset prices, conspired to maintain
vulnerabilities for the economy in 2010/11.
Instability can be triggered by both domestic and
external events, both economic and non-
economic, but by maintaining relatively low
Crown debt levels, the Government was able to
adopt a measure of flexibility to manage shocks
to the economy during the year under review.
Minimising significant or abrupt adjustments in
Crown fiscal policy supports efforts to deliver
higher living standards over time.
How We Have Contributed to This Outcome
The Treasury provided advice to the Government on ways to manage risks associated with New Zealand’s high
external debt position in what was at times an uncertain global environment, with a particular emphasis on options
to achieve faster fiscal consolidation.
In Budget 2011, the Government agreed operating and capital allowances based on targeting spending to where there
is most need and benefit, of making sure that the benefits outweigh the costs of interventions and ensuring that
State interventions meet or exceed the performance in other developed countries.
During the year we also continued to effectively undertake economic and fiscal monitoring, reporting and
forecasting, all critical to identifying emerging risks to macroeconomic stability and for identifying timely policy
options where appropriate.
To help deepen our understanding, enhance the quality of public debate and to assist good policy formation, we
published working papers on exchange rate variability, the impact of fiscal policy on the business cycle, modelling of
fiscal risks, the drivers of New Zealand’s relatively high interest rates and a paper on New Zealand’s macroeconomic
imbalances. Much of this work also formed the basis for a savings discussion document, which was produced to
assist the Savings Working Group. We also co-hosted, along with RBNZ and Victoria University of Wellington, a
forum on the causes and possible remedies for New Zealand’s macroeconomic imbalances.
Net core Crown debt to nominal GDP
Source: The Treasury

THE TREASURY ANNUAL REPORT 2010/11 – The Treasury
Page 19
Outcome and Intermediate Outcome Indicators and Measures: Position in 2010/11
Outcome: A Stable and Sustainable Macroeconomic Environment
New Zealand’s sovereign credit ratings are AAA with stable outlook, with current concerns about external vulnerability reduced.
Target in 201116 SOI: By 2015/16 these are increased to AAA with stable outlook (currently AA+).
Moody’s has had New Zealand’s foreign-currency credit rating at AAA since late 2002. Standard and Poor’s has New Zealand on a rating of AA+, and placed that rating on negative outlook in late 2010. Fitch has had the rating at AA+ with a negative outlook since late 2010.
Crown net debt levels.
Target in 201116 SOI: Crown net debt projections trend down to between 10% and 20% of GDP, and indicators of long-term fiscal sustainability show improvement in successive fiscal statements.
Core Crown net debt is currently around 20% of GDP, and is projected to peak at 29.6% in 2014/15, before trending down to under 20% by 2020.
The forecast peak in core Crown net debt is higher for 2014/15 than forecast at the time of the 2010 Fiscal Strategy Report (FSR) as a result of the fiscal costs of the Canterbury earthquakes, but the medium path is lower.
Gross national saving rates.
Target in 201116 SOI: Gross national saving is trending toward 25% of GDP over the next five years and remains elevated.
Gross national saving is estimated to have increased to around 18% in the year ended March 2011, up from a low of around 15% in the 2009 March year.
Inflation and inflation expectations.
Target in 201116 SOI: Inflation and inflation expectations remain anchored within 1% to 3%.
The annual Consumer Price Index (CPI) inflation rate in the year to June 2011 stood at 5.3%, heavily influenced by the rise in GST on 1 October 2010. The five-year average of inflation outturns increased to 3%, the top of the target band. Two-year ahead inflation expectations increased to 3% in the June quarter, up from 2.8% a year ago.
Intermediate outcome: A stable macroeconomic environment
The overall level of financial stability risk does not materially increase above a normal range, as indicated by the cobweb model published in RBNZ’s Financial Stability Reports.
Target in 201116 SOI: Financial stability risks related to New Zealand are either generally falling or are within the normal range (as indicated by the domestic components of the cobweb model published in RBNZ’s Financial Stability Report).
Two dimensions of RBNZ’s financial stability cobweb (financial market conditions and the global environment) improved between May 2010 and May 2011, but four out of five dimensions remain above their normal range.
Variability in GDP growth is in the lowest third of OECD countries and absolute falls in annual real GDP are avoided.
Target in 201116 SOI: Variability in GDP growth is minimised and absolute falls in annual real GDP are avoided. Variability is in the lowest third of OECD countries, and below that recorded in the past three decades.
The standard deviation of New Zealand’s annual real GDP growth was around 2.2 percentage points in the 10 years to 2010 (12th out of 34 OECD economies), compared to 2.1 (13th out of 28) and 2.6 (19th out of 29) in the 1980s and 1990s respectively.
The Treasury’s research and effective and timely advice allows governments to operate fiscal policy that is not excessively pro-cyclical.
Target in 201116 SOI: Effective and timely Treasury advice allow government to operate fiscal policy that is not excessively pro-cyclical (as measured by a range of indicators), especially during the upswing in the business cycle, and does not contribute to build-up and continuation of imbalances. One test is that revenue surprises are used to pay off debt.
Measures of the fiscal stance are subject to significant uncertainty. The Treasury’s fiscal impulse indicator suggests that over the 2011/12, 2012/13 and 2013/14 fiscal years, fiscal policy will subtract from aggregate demand in the economy, at a time when real GDP growth is forecast to be above potential.
Core Crown expenses as a share of GDP are forecast to decrease from 36.4% in 2010/11 to 31.3% in 2014/15, subtracting directly to demand pressures in the economy.
The Treasury’s research identifies the main sources of build- up in New Zealand’s economic imbalances.
Target in 201116 SOI: The Treasury’s research identifies the main sources of economic fluctuations and build-up of imbalances, including the respective roles of micro and macro policy settings. Our advice on fiscal and other settings will assist government accordingly.
Published working papers on: “Economic Imbalances: New Zealand’s Structural Challenge”; “Why are Interest Rates in New Zealand So High: Evidence and Drivers”; “New Zealand’s Exchange Rate Cycles: Impacts and Policy”.
Organised New Zealand’s Macroeconomic Imbalances – Causes and Remedies Policy Forum. Presented paper on “Making Fiscal Policy More Stabilising in the Next Upturn: Challenges and Policy Options”.

THE TREASURY ANNUAL REPORT 2010/11 – The Treasury
Page 20
Outcome and Intermediate Outcome Indicators and Measures: Position in 2010/11
Intermediate outcome: The State sector allocates resources to where they are most effective and delivers services in the most efficient way
The Government accounts return earlier to fiscal surplus.
Target in 201116 SOI: The Treasury’s advice and options assist the Government to return earlier to fiscal surplus.
Budget 2011 forecasts a return to operating surplus (before gains and losses) in 2014/15.
Our advice helps government reduce the long-term fiscal gap, starting with a reduction in the projected peak in net debt during 2013/14.
Target in 201116 SOI: The Treasury’s advice and options assist the Government to return earlier to fiscal surplus. The Treasury’s advice helps government to reduce the long-term fiscal gap, starting with a reduction in the projected peak in net debt during 2013/14.
Core Crown net debt is forecast to peak at 29.6% of GDP in 2014/15.
Cost of borrowing is minimised subject to an acceptable level of risk.
Target in 201116 SOI: The average cost of new core Crown borrowing is less than the long-run borrowing rate of 6%. The nearest bond maturity will be fully funded from NZDMO’s holdings of cash and short-term liquid assets within three months of maturity.
Achieved.

THE TREASURY ANNUAL REPORT 2010/11 – The Treasury
Page 21
Enabling and Supporting a Higher-performing Treasury
Maintaining our Organisational Health and Capability
Achieving the Treasury’s three outcomes requires an ongoing programme to develop the capability of our
systems and staff, and a greater level of attention to measuring and assessing the impact we have on our
outcomes. An effective Treasury also needs to have line of sight between these outcomes and the work that staff
carry out.
Specifically, we have three objectives that reinforce each other:
We strengthen our leadership role and improve our performance.
We are an adaptable and productive workforce.
We are a well-managed public sector organisation focused on continuous improvement.
Impact: We strengthen our leadership role and improve our performance
Developing a shared understanding across the Treasury about how to lift our performance requires a clear vision
from senior leadership. The focus in 2010/11 was on developing systems and structures that support strategic
leadership and strong governance.
The two new Deputy Chief Executives (DCEs) arrived late in 2009/10 (one of the two DCEs was subsequently
appointed as Chief Executive and Secretary to the Treasury). Over 2010/11 the Chief Executive and two DCEs
focused on:
developing a strong Executive Leadership Team (ELT)
establishing the Treasury Board
finding ways to work more closely with the third-tier managers as a joint senior leadership team
refining the decision-making framework, and
articulating their organisational ambition for the Treasury.
The ELT focused in the beginning of 2010/11 on forming a strong shared vision for the Treasury. They built on
this later in the year by working more closely with third-tier managers, to ensure that work under way was well
aligned with the vision. In September 2010, ELT established the Treasury Board. The Board is a governance
advisory board that supports the Chief Executive to set the Treasury’s strategic direction and strengthen its
performance. The seven-member Board is chaired by the Chief Executive and includes three non-executive
members and three Treasury executives.
Beyond systemic changes, senior leaders looked at their own leadership styles to better understand the impact of
their behaviour on others and how to lead in a way that lifts productivity. This involved implementing tools such
as the Leadership Impact Surveys to assess, develop and encourage leadership qualities. These assessments
will be repeated in the next financial year, to determine what changes there have been to the nature of leadership
in the Treasury.
Other key initiatives progressed during 2010/11 were:
an increased focus on external engagement: this has been evidenced by an increased number of speaking
engagements by the Chief Executive, Deputy Chief Executive and Deputy Secretaries
a significant strategic planning exercise to obtain tighter alignment of the activities undertaken by the Treasury
with the Government’s desired outcomes, and translating that “line of sight” into staff work plans

THE TREASURY ANNUAL REPORT 2010/11 – The Treasury
Page 22
evaluation of the Treasury by external PIF reviewers. Key themes raised were that we need to:
- be clear about what we want to achieve for New Zealand and how we will get there
- be a “Team NZ” player by having more explicit and consistent two-way external engagement
- measure our efficiency and effectiveness better
- progress organisational culture change, and
- use external expertise better, and
establishment of a change programme to pace and prioritise the activities under way across the Treasury, to
lift performance. The change programme incorporates themes from the PIF review and led ELT to articulate its
future organisational ambition for the Treasury. This vision is for the Treasury to play four roles as an
organisation – navigator, expert, problem-solver and exemplar. These are set out in more detail in our
2011–2016 SOI.
We measure our progress by:
We measure staff ratings of leadership through the Gallup employee engagement survey. The rating in
September 2010 on the Gallup statement: “I have confidence in the leadership of the Treasury to successfully
manage emerging challenges” was 3.5 out of 5. This was re-measured in August 2011.3
Members of ELT have delivered over a dozen public addresses and many more presentations to interested
groups around the country. Speeches have covered topics such as improving living standards for
New Zealanders, addressing macroeconomic imbalances, raising per-capita growth, strengthening
New Zealand’s international connections and lifting public sector performance. Other senior Treasury leaders
have also been involved in giving speeches and presentations around the country. To measure the effectiveness
of these and our other engagements, in early 2011/12 we will undertake a survey of our stakeholders. This will
give us a better understanding of the role we are currently seen to be playing and what might need to be
improved. Results from the survey will be available early in the next financial year and we intend to repeat the
survey to assess progress over time.
Impact: We are an Adaptable and Productive Workforce
During 2010 we developed a Treasury People Strategy (published in August 2010). After analysing the business
of the Treasury, we developed the principles to inform and guide our decisions around people management – who
we hire; the way we utilise and deploy our people in more effective flexible ways; the support we give our people
to develop and grow; and our expectations about leadership and accountability.
People Strategy pillars
3 Gallup reports movement of 0.1 as a meaningful change to a result (ie, statistically significant).

THE TREASURY ANNUAL REPORT 2010/11 – The Treasury
Page 23
The People Strategy identified three top priorities for action in 2010/11:
Excellence in leadership – development of a clear and measurable leadership framework that will drive the
culture change necessary to achieve excellence.
Workforce planning – understand our needs more precisely and develop a staffing profile that will drive other
people-management levers.
Demanding performance – review of performance management in the Treasury and implementation of
changes to frameworks for both performance management and remuneration.
People Strategy roadmap
Implementing the People Strategy: key projects
The following work streams outlined in the strategy were initiated:
Remuneration strategy and framework
A robust remuneration strategy and framework has been rolled out which will enable the Treasury’s leaders to
evaluate performance and make decisions on remuneration that will attract and retain the diversity of skills we
need and reward excellent performance.
Performance management framework
A revised performance management framework has been implemented that will enable change to both the
performance management system and the behaviours, incentives and skills that shape the way the system is
used. This will continue to be embedded in 2011/12 but has been used to evaluate performance of staff during
2010/11 and to influence the work plans and expectations of staff for 2011/12. A key area of emphasis relates to
establishing a clearer line of sight between individual work plans and the outcomes we aim to achieve.
Workforce planning
The objective of our workforce planning is to ensure that the right numbers of people, with the right skills, are in
place at the right time to enable the Treasury to deliver its short- to medium-term objectives at least cost and

THE TREASURY ANNUAL REPORT 2010/11 – The Treasury
Page 24
risk to the organisation. During 2010/11, the focus was on understanding the outputs we wanted from our
senior people. We are targeting early 2011/12 to make decisions and determine the medium-term “shape” of
the Treasury.
Talent management
A revised approach is being used to identify and develop future leadership talent. This helps the Treasury’s
leadership team ensure that emerging leaders are learning what they need to become excellent leaders.
We have measured our progress by:
The Treasury aims to move its overall result from its employee engagement survey to above the 65th percentile.
This is measured using the Gallup survey tool and benchmarked against the Gallup NZ State Sector database.
In 2009, the Treasury was in the 62nd percentile. Employee engagement survey results were measured in August
2010 at a grand mean of 3.86, which is in the 63rd percentile.
Key people metrics for 2010/11
As at 30 June 2011 2010 2009 2008
Staff Numbers
Total full-time equivalent 363 341 343 324
Full-time staff 319 306 310 298
Part-time staff 59 47 46 35
Total headcount 378 353 356 333
Gender distribution All Staff
Women 50% 49% 52% 51%
Men 50% 51% 48% 49%
Ethnicity Distribution (self-identified, multiple responses possible)
NZ European 70% 69% 72% 73%
NZ Māori 1% 4% 5% 6%
Pacific Islander 1% 2% 2% 2%
Asian 5% 6% 6% 5%
Other European 9% 14% 11% 10%
Other ethnic groups 8% 3% 1% 1%
Undeclared 6% 2% 3% 3%
Turnover 17% 13% 11% 22%
Average length of service (yrs): 6.8 6.4 6.5 6.4
Equal employment opportunities
The Treasury believes that diversity is essential to performing our roles effectively. Diversity is a core part of the
way we do business rather than part of any particular initiative. As a result, the Treasury places strong emphasis
on fostering a diverse workplace and inclusive culture and we are committed to the principle and practice of
equality and diversity in our talent management and performance measurement.
The Treasury continued to participate in processes and surveys to inform equal employment opportunities (EEO)
approaches including contributing to New Zealand’s 2010 report on Convention on the Rights of Persons with
Disabilities and initiatives from SSC. The Treasury continued to operate its Senior Women’s network, to increase
the ability to share ideas and support for initiatives such as mentoring. The Treasury also continued to deliver
development programmes focused on Māori engagement, implications for policy advice and language.
Impact: We are an Exemplar of a Well-managed State Sector Organisation Focused on Continuous Improvement
During 2010/11 we focused on clearly articulating the Treasury’s finance strategy; planning for the integration of
corporate services across the three Central Agencies; initiation of in-house cost-effectiveness measurement and
participation in public sector benchmarking; and the rollout of a risk management framework across the Treasury.

THE TREASURY ANNUAL REPORT 2010/11 – The Treasury
Page 25
We also improved a number of the internal processes and procedures to manage corporate functions. This
improved the Treasury’s Departmental Internal Control Evaluation (DICE) rating from 4.39 to 4.5. DICE
assessments are performed by each government department’s auditors as a way to provide reassurance about
the operation of governance and financial activities across all Crown activities. The Treasury’s auditors reviewed
27 aspects applicable to the Treasury, with 12 assessed as “excellent” (and five of those had improved from
“good” to “excellent” since last year). All other areas were rated as “good”.
Financial strategy
A financial strategy was completed in 2010/11 and was used as the basis for completing the Four-year Budget
Plan submitted to Ministers for approval. Work has progressed to address the fiscal challenges outlined in the
financial strategy. This work aims to manage the Treasury’s work programme within constrained resources.
Understanding the shape of the Treasury and the staff profile we require is critical to the next iteration of the
financial strategy.
Cost effectiveness
The Treasury is committed to improving measurement of its performance, including the cost effectiveness of the
services we deliver. The Treasury has taken a lead in developing guidance on measuring the cost effectiveness of
policy advice and we are involved in a policy advice benchmarking pilot. In April, we commissioned an external
review to assess the quality of the Treasury’s policy briefings, so we had an independent diagnosis of the strengths
and weaknesses of our policy advice. The Treasury was also part of the pilot group for the Better Administrative and
Support Services (BASS) programme. The BASS programme found that the Treasury’s administrative and support
services were 17.3% of total operating costs, which compares relatively well to the median.
The Treasury increased its engagement with business leaders and academics who can share valuable insights on
growth and the levers for growth. This engagement involved a series of meetings with business leaders and academics
and presentations to a wide range of interest groups across New Zealand, those with insights across the economy
(such as professional services firms) and innovative thinkers who can bring new perspectives to the Treasury.
Risk management
The Treasury’s ability to manage in an uncertain and changeable operating environment is enhanced by the
quality of our risk management.4
A risk advisor was appointed during the year, with responsibility for further developing and maintaining an
appropriate enterprise-wide risk management approach, including further refinement of risk assessment,
monitoring and reporting. In addition, the Treasury has recently appointed Deloitte to support our audit work.
We have improved our enterprise risk management approach to ensure there is systematic and regular
assessment and monitoring of key strategic and operational risks facing the Treasury. Our senior leaders
regularly identify and assess the Treasury’s biggest strategic and emerging risks, and ensure that we take
appropriate actions to manage them. The Treasury has also introduced regular operational risk assessments. We
manage risks relating to our various change initiatives and projects to ensure that we anticipate and deal with
uncertainty as effectively as we can.
The Treasury’s risk management practices use an approach modelled on the Joint Australian/New Zealand
International Risk Management Standard. As well as the specific regular risk assessments described above, risk
management at the Treasury is implemented through business processes such as strategic and operational
planning and project management. Risk management functions, roles and frameworks also exist in specific
operational areas, including NZDMO and NZECO.
Our overall set of risks is overseen by a Risk and Audit Committee, which includes three experienced external
members to provide independent perspectives.
4 NZ Risk Management Standard – AS/NZ ISO 31000:2009 defines risk as “the effect of uncertainty on objectives”.

THE TREASURY ANNUAL REPORT 2010/11 – The Treasury
Page 26
Statement of Responsibility Pursuant to sections 45 and 45C of the Public Finance Act 1989, the Secretary to the Treasury is responsible for
the preparation of the Department’s financial statements and non-departmental supplementary schedules, and
the judgements made in the process of producing these financial statements and supplementary schedules.
The Department’s internal control procedures provide reasonable assurance as to the integrity and reliability of its
financial reporting.
In the opinion of the Secretary to the Treasury:
The Department’s financial statements and statements of service performance fairly reflect its financial
position and operations for the financial year ended 30 June 2011.
The supplementary schedules fairly reflect the assets, liabilities, contingencies and commitments managed by
the Treasury on behalf of the Crown as at 30 June 2011 and revenues and expenses managed by the
Treasury on behalf of the Crown for the year ended on that date.
Gabriel Makhlouf
Secretary to the Treasury
Fergus Welsh
Chief Financial Officer
(countersigned)
30 September 2011 30 September 2011

THE TREASURY ANNUAL REPORT 2010/11 – The Treasury
Page 27
The Treasury’s Output Expense Performance for 2010/11
Statement of Objectives and Service Performance
Section 45A of the Public Finance Act 1989
This section provides information about the services and activities (outputs) that the Treasury provided through
20 output appropriations during the 2010/11 year.
The table below provides an overview of the linkages between the impacts that we seek to have (outcomes) and
the appropriations through which we are funded to deliver on those outcomes. The following pages provide
information on the Treasury’s work programme for the year and the standards that applied to key elements of that
work. Performance information, where applicable, is also provided against the measures agreed to in the 2010/11
and 2011/12 Information Supporting the Estimates documents.
Output Appropriations Intermediate Outcomes Outcomes
Macroeconomic Policy Advice and Management – Multi-class Output Appropriations (MCOA)
Policy Advice – Fiscal and Macroeconomic
Economic and Tax Forecasting
Fiscal Management
Fiscal Reporting
A stable macroeconomic environment A stable and sustainable macroeconomic environment The State sector allocates resources where
they are most effective and services are delivered in the most efficient way
The Crown’s balance sheet is managed efficiently and effectively
Management of Crown Lending and Crown Bank Accounts
Improved business environment Improved economic performance
New Zealand is more integrated and connected into the global economy
The Crown’s balance sheet is managed efficiently and effectively
A high-performing State sector that supports New Zealand’s international competitiveness
Administration of Crown Borrowing – Permanent Legislative Authority (PLA)
Administration of Derivative Transactions PLA
Administration of Investment of Public Money PLA
The Crown’s balance sheet is managed efficiently and effectively
A high-performing State sector that supports New Zealand’s international competitiveness
State Sector and Economic Performance Policy Advice and Management MCOA
Policy Advice – Economic Performance
Improved business environment Improved economic performance
New Zealand is more integrated and connected into the global economy
Enhanced human capital and labour supply
Policy Advice – State Sector Performance
State institutions are high quality and support good stewardship
A high-performing State sector that supports New Zealand’s international competitiveness The State sector allocates resources where
they are most effective and services are delivered in the most efficient way
The Crown’s balance sheet is managed efficiently and effectively
NZECO New Zealand is more integrated and connected into the global economy
Improved economic performance
Improved business environment
Management of Liabilities, Claims Against the Crown and Crown Properties
New Zealand is more integrated and connected into the global economy
Improved economic performance
The Crown’s balance sheet is managed efficiently and effectively
A high-performing State sector that supports New Zealand’s international competitiveness

THE TREASURY ANNUAL REPORT 2010/11 – The Treasury
Page 28
Output Appropriations Intermediate Outcomes Outcomes
Infrastructure Advice and Coordination
Improved business environment Improved economic performance
The Crown’s balance sheet is managed efficiently and effectively
A stable and sustainable macroeconomic environment
The State sector allocates resources where they are most effective and services are delivered in the most efficient way
A high-performing State sector that supports New Zealand’s international competitiveness
Crown Guarantee Schemes
Administration of Guarantees and Indemnities Given by the Crown PLA
The Crown’s balance sheet is managed efficiently and effectively
A stable and sustainable macroeconomic environment
Establishment and Monitoring Crown Investment in AMI
The Crown’s balance sheet is managed efficiently and effectively
A stable and sustainable macroeconomic environment
Establishment of the New Zealand Productivity Commission
New Zealand is more integrated and connected into the global economy
Improved economic performance
Crown Company Monitoring Advice to the Minister of Science and Innovation and other Responsible Ministers
Crown Company Monitoring Advice to the Minister for State-Owned Enterprises and other Responsible Ministers
Improved business environment
The Crown’s balance sheet is managed efficiently and effectively
A high-performing State sector that supports New Zealand’s international competitiveness

THE TREASURY ANNUAL REPORT 2010/11 – The Treasury
Page 29
Vote Finance Output Expense Performance
Macroeconomic Policy Advice and Management MCOA
This includes work under the following appropriations:
Policy Advice – Fiscal and Macroeconomic
Economic and Tax Forecasting
Fiscal Management
Fiscal Reporting, and
Management of Crown Lending and Crown Bank Accounts.
The following table shows the overall cost of this MCOA in the 2010/11 fiscal year.
Performance Dimensions for 2010/11 Target Performance for 2010/11
All policy advice complies with the Treasury’s Quality Standards for Policy.
Achieved. Achieved.
Refer to summary of the Review of the Quality of the Treasury’s Policy Advice 2011 on page 62 for further information on application of the policy standard during the 2010/11 year.
2010 Actual
$000
2011Actual$000
2011 Main Estimates
$000
2011Supp. Estimates
$000
13,839 Expenses 13,676 14,910 13,850
Funded by:
13,596 Revenue Crown 13,395 14,674 13,631
243 Other revenue 281 236 219
For the 2011/12 year, the outputs produced under these five appropriations have been integrated into a broader
appropriation called Policy Advice – Finance. This new combined appropriation includes policy advice outputs
relating to economic performance, State sector performance and macroeconomic performance.

THE TREASURY ANNUAL REPORT 2010/11 – The Treasury
Page 30
Policy Advice – Fiscal and Macroeconomic
Scope of Appropriation
This output expense is limited to the provision of fiscal and macroeconomic policy advice.
Significant Work Completed During 2010/11
The fiscal position has been in substantial deficit since 2008/09 in the wake of a domestic recession, the
global financial crisis and prior year spending and tax decisions. The economy and fiscal position were further
impacted by the Canterbury earthquakes. The Treasury provided advice on how to advance the return to
surplus and prudent debt levels, while also providing the necessary resources for the rebuilding of
Christchurch.
Published the Budget Policy Statement (BPS) in December 2010 and the FSR in May 2011. These included
an increased focus on Crown risk reporting and uncertainty.
Provided advice and implemented changes to the Fiscal Management Approach for Budget 2011 that
broadened the net of spending captured in the annual operating allowance.
Provided advice on the Spending Cap (People’s Veto) Bill, including fiscal and economic implications, along
with a Regulatory Impact Statement for Cabinet consideration. The Spending Cap Bill was approved by
Cabinet and introduced to Parliament in August 2011.
The Treasury, along with RBNZ and Victoria University, organised a high-level policy forum on New Zealand’s
economic imbalances. The forum generated extensive media coverage and raised the quality of public
debate. The Treasury delivered a paper on options for managing the fiscal position in extended upturns in
order to avoid procyclicality.
The Treasury provided advice to help clarify a balance sheet policy framework and support the development
of a forward-looking balance sheet strategy. The purpose of this work was to facilitate understanding of the
benefits of increasing the Crown’s net worth.
Published a Supplement to the inaugural Investment Statement alongside Budget 2011, allowing for greater
scrutiny of the Crown’s management of its assets and liabilities and updating the Government’s medium-term
investment intentions and balance sheet strategy.
Quarterly report on CFIs was redesigned to improve the assessment information on CFI performance.
Mixed ownership model decisions announced in Budget 2011 and phase 2 now proceeding with appointment
of advisors underway; Financial Analysis Unit up and running and making early progress (eg, migration to
CFISnet, dividend and comparable company analysis); SOE business planning completed; comprehensive
advice on Electricity Industry Act 2010/EQC/KiwiRail.
Performance Dimensions for 2010/11 Target Performance for 2010/11
Production of advice that provides options which allow the Government to deliver a credible fiscal strategy consistent with the fiscal prudence provisions of the Public Finance Act 1989. Where this advice is underpinned by modelling, the models are externally quality assured and, where appropriate, assumptions are tested with suitably qualified external experts.
Achieved. Achieved.
Fiscal and other macroeconomic advice was underpinned by monitoring and analysis of domestic and international developments and past performance, including via the publication of a number of working papers and Monthly Economic Indicators. Preliminary forecasts were also reviewed by an external panel of experts.

THE TREASURY ANNUAL REPORT 2010/11 – The Treasury
Page 31
2010 Actual
$000 Policy Advice Fiscal and Macroeconomic
2011Actual$000
2011 Main Estimates
$000
2011Supp. Estimates
$000
4,268 Expenses 5,203 4,801 5,407
Funded by:
4,190 Revenue Crown 5,090 4,729 5,315
78 Other revenue 113 72 92
For the 2011/12 year, the outputs produced under this appropriation have been integrated into a broader
appropriation, Policy Advice – Finance. That combined appropriation includes policy advice outputs relating to
economic performance, State sector performance and macroeconomic performance.

THE TREASURY ANNUAL REPORT 2010/11 – The Treasury
Page 32
Economic and Tax Forecasting
Scope of Appropriation
This output expense is limited to the preparation of economic and tax forecasts, monitoring of and reporting on
economic and tax conditions.
Significant Work Completed During 2010/11
The 2010 HYEFU and 2011 BEFU economic and fiscal forecasts were produced within the required
deadlines. This was achieved in spite of the challenges posed by the uncertainty caused by the Canterbury
earthquakes which eroded the quality and availability of data used for forecasting.
Economic and revenue assessments of the effects of the Canterbury earthquakes were provided to Ministers
within a few days of each event occurring.
Improvements were made to several forecasting models such as goods and services tax (GST), pay-as-you-
earn (PAYE) and resident withholding tax (RWT) (interest).
Resources were allocated to monitoring and analysing the economies of other countries including China and
Australia, and international developments such as the European sovereign debt crisis.
Performance Dimensions for 2010/11 Target Performance for 2010/11
Tax revenue forecast error on one-year-ahead forecasts.
Tax revenue forecast root mean square error and mean error over the five years to June 2007 were 4.4% and 4.2% retrospectively.
Less than ±3%.
Not achieved.
Provisional estimate of actual result: -4.3%.
During the year the Canterbury earthquakes had a negative effect on economic activity which, in turn, had a negative effect on tax revenue. The Treasury estimates that if the earthquakes had not occurred our tax forecast error would have been approximately -2%. Prior to the earthquakes, tax revenue was running below forecast, with the largest negative variances being in GST and corporate tax. Household spending slowed more rapidly than we had expected, which directly affected GST. This also affected business profits with a consequential effect on business income taxes.
2010 Actual
$000 Economic and Tax Forecasting
2011Actual$000
2011 Main Estimates
$000
2011Supp. Estimates
$000
2,788 Expenses 2,517 2,691 2,481
Funded by:
2,736 Revenue Crown 2,464 2,641 2,440
52 Other revenue 53 50 41

THE TREASURY ANNUAL REPORT 2010/11 – The Treasury
Page 33
Fiscal Management
Scope of Appropriation
This output expense is limited to the development of the budget strategy and advice, and activities of the annual
budget process.
Significant Work Completed During 2010/11
Supported Ministers with advice on changes to the budget process to help improve fiscal management and to
make decisions about budget package for 2011.
Provided advice on improving the fiscal management framework and assisted the Government to achieve its
fiscal strategy.
Undertook analysis of agencies’ four-year budget plans and provided advice to budget Ministers on whether
plans met expectations, possible actions and fiscal implications.
Performance Dimensions for 2010/11 Target Performance for 2010/11
Advice and processes required as part of annual budget process assist the Government to pursue its policy priorities in accordance with the principles of responsible fiscal management and support effective and efficient management of public financial resources.
Achieved. Achieved.
The Minister of Finance was kept informed on a weekly basis through the year on the balance between budget contingency and the Budget 2011 operating and capital allowances.
The budget process was designed and managed to support the Government to implement policy priorities and deliver the budget consistent with the BPS, and in accordance with the principles of responsible fiscal management and support effective and efficient management of public financial resources.
2010 Actual
$000 Fiscal Management
2011Actual$000
2011 Main Estimates
$000
2011Supp. Estimates
$000
2,972 Expenses 2,294 3,290 2,328
Funded by:
2,925 Revenue Crown 2,255 3,240 2,297
47 Other revenue 39 50 31

THE TREASURY ANNUAL REPORT 2010/11 – The Treasury
Page 34
Fiscal Reporting
Scope of Appropriation
This output expense is limited to preparing fiscal forecasts, monitoring of and reporting on fiscal conditions,
preparing the Financial Statements of the Government, providing advice on the application and development of
generally accepted accounting practice as it applies to the Crown and monitoring the adequacy of departmental
financial management controls.
Significant Work Completed During 2010/11
Provided advice on significant accounting issues across the Crown and provided fiscal input into other
reporting products and advice (eg, the Investment Statement and rating agency reviews). For some months of
the 2010/11 year this work programme was heavily impacted by the demands for information and advice
following the Canterbury earthquakes.
Provided central government leadership on accounting standard-setting frameworks including representation
on international and domestic accounting standard-setting boards. This work included significant input into the
development of a conceptual framework for the International Public Sector Accounting Standards Board and
into the establishment of the New Zealand External Reporting Board.
Performance Dimensions for 2010/11 Target Performance for 2010/11
Audit opinion issued by the Controller and Auditor-General on the Financial Statements of the Government.
Unqualified. An unqualified opinion was achieved for the Financial Statements of the Government for the year ended 30 June 2010.
2010 Actual
$000 Fiscal Reporting
2011Actual$000
2011 Main Estimates
$000
2011Supp. Estimates
$000
3,606 Expenses 3,116 3,588 3,082
Funded by:
3,545 Revenue Crown 3,051 3,530 3,036
61 Other revenue 65 58 46

THE TREASURY ANNUAL REPORT 2010/11 – The Treasury
Page 35
Management of Crown Lending and Crown Bank Accounts
Scope of Appropriation
This output expense is limited to the management of Crown lending and Crown and departmental bank accounts.
Significant Work Completed During 2010/11
Advanced $790.100 million distributed as follows: $394.200 million to DHBs; $185.100 million to Housing
New Zealand; $110 million to the New Zealand Transport Agency (NZTA); $55 million to KiwiRail;
$41.500 million to the Auckland Transition Agency; and $4.300 million to the Civil Aviation Authority.
Managed risk on $180 million of interest-rate swaps transacted for Housing New Zealand.
Established a short-term loan facility to provide the NZTA with flexibility to manage cash flow variations in the
National Land Transport Fund. As at 30 June 2011, NZTA had borrowed a total of $110 million under this
facility.
During August 2010, NZDMO facilitated a range of transactions to manage various Crown cash flows arising
from the SCF receivership.
Performance Dimensions for 2010/11 Target Performance for 2010/11
All policy advice complies with the Treasury’s Quality Standards for Policy.
Achieved. Achieved.
Value-added for Crown lending meets target level. $5 million. Achieved.
Value-added for Crown lending was $11.290 million.
Average value at risk (VaR) for Crown lending, at a 95% confidence level (see note on VaR below).
Average monthly VaR does not exceed $1.400 million.
Achieved.
Average monthly VaR for Crown lending was $250,000.
Compliance with risk management policies and parameters for management of Crown lending and Crown bank accounts.
No breaches. Achieved.
There were no compliance breaches.
2010 Actual
$000 Management of Crown Lending and Crown Bank Accounts
2011Actual$000
2011 Main Estimates
$000
2011Supp. Estimates
$000
205 Expenses 546 540 552
Funded by:
200 Revenue Crown 535 534 543
5 Other revenue 11 6 9
Notes:
Average VaR – performance measure
The Minister of Finance has agreed to a limit for average monthly VaR across the whole of NZDMO’s operations
of $14 million. NZDMO’s performance target for the tactical portfolios is set at 10% of the total limit, or
$1.400 million.
Value-added from Crown lending
NZDMO derives the value-added figure from its management reporting, which is calculated on a different basis
from external Crown financial statement reporting. Historic performance helps guide the establishment of future
targets, which are set annually taking into account changes in the external environment.

THE TREASURY ANNUAL REPORT 2010/11 – The Treasury
Page 36
Permanent Legislative Authority Funding for NZDMO
NZDMO funding for Debt and Related Financial Asset Management is split across four appropriations: the
Management of Crown Lending and Crown Bank Accounts (preceding page) and three PLAs. The PLAs are set
out below:
Scope of Appropriations
Administration of Crown Borrowing PLA This appropriation is limited to expenses incurred in connection with
administering borrowing by the Crown, as authorised by section 61(1) of the Public Finance Act 1989.
Administration of Derivative Transactions PLA This appropriation is limited to expenses incurred in
connection with administering derivative transactions of the Crown, as authorised by section 65H(2) of the
Public Finance Act 1989.
Administration of Investment of Public Money PLA This appropriation is limited to expenses incurred in
connection with administering the investment of public money, as authorised by section 65J(1) of the Public
Finance Act 1989.
Significant Work Completed During 2010/11
Borrowing programme
The bond programme announced at Budget 2010 was initially set at a maximum of $12.500 billion.
Throughout 2010/11, favourable market conditions allowed NZDMO to increase its bond issuance to meet the
Crown’s new funding needs following the two major Canterbury earthquakes and to continue to part pre-fund
future borrowing needs. The upper limit for the bond programme was revised upward four times to $20 billion.
In total, NZDMO issued $19.500 billion worth of bonds and successfully completed the largest ever weekly
bond tender in April 2011, which raised $1 billion. As at 30 June 2011, bonds outstanding in the market were
valued at $51.100 billion.
NZDMO introduced further measures aimed at increasing demand, diversifying funding sources and thus
reducing the cost of the Crown’s borrowing, including:
- increasing the target tranche size from $8 billion to $10 billion for bonds maturing before December 2017
and to $12 billion for bonds maturing on or after December 2017
- introducing two new bond maturities, March 2019 and April 2023, which will lengthen the average maturity
profile and therefore reduce funding risk. In time, these maturities will become liquid benchmark bonds
- launching a four-year Earthquake Kiwi Bond to help fund the recovery in Christchurch and provide retail
investors with a new savings option. As at 30 June 2011, $1.480 million was outstanding
- implementing new funding risk policy measures that: (1) require NZDMO to accumulate cash (and liquid
assets) in advance of a maturing bond and; (2) restricting short-term debt with maturity of less than one
year at issuance to less than 25% of total debt outstanding
- resuming issuance of one-year US-dollar Euro Commercial Paper, and
- undertaking work for the reintroduction of a new inflation-indexed bond, appointing a syndicate to lead
distribution of the bond and monitoring market conditions on an ongoing basis.
Derivatives programme
NZDMO uses a relatively small set of vanilla derivatives to manage interest-rate and currency risk in the
portfolios. During 2010/11, new derivative transactions entered into included currency swaps and interest-rate
swaps as well as foreign-exchange (FX) options.

THE TREASURY ANNUAL REPORT 2010/11 – The Treasury
Page 37
Risk associated with the changing market value of derivative positions was successfully managed within
NZDMO’s average monthly VaR target for the tactical portfolios.
In 2010, NZDMO received approval from the Minister of Finance to transact FX options for departments that
have a special need for better management of foreign currency risk and have obtained separate ministerial
approvals.
There are significant benefits to the Crown by having NZDMO transact FX options on behalf of departments,
as opposed to leaving each to deal with the market separately. The benefits include:
- cost savings in the form of better option pricing given the volume of NZDMO’s FX business
- improved management of credit risk facilitated by NZDMO’s existing credit support agreements, and
- efficiency gains arising from NZDMO’s IT infrastructure.
Up until 30 June 2011, NZDMO had transacted 12 FX options in three currencies for the approved
departments.
NZDMO continued to maintain regular contact with the credit rating agencies during the year to assist them in
their assessment of New Zealand’s credit worthiness, including extensive discussions with Standard & Poor’s
(S&P) following its rating outlook change from “Stable” to “Negative” in November 2010. Following the
Canterbury earthquake in February 2011, NZDMO acted quickly to provide relevant available information,
resulting in affirmations of New Zealand’s sovereign ratings by the three main international credit rating
agencies.
Marketing efforts and interactions with international stakeholders
Throughout the year, NZDMO has been active in promoting bonds and New Zealand more generally. These
efforts include accompanying the Minister of Finance on overseas investor missions, developing and
strengthening investor relations and engaging with sovereign peers.
Investment programme
As at 30 June 2011, NZDMO managed marketable securities valued at $3,286 million, deposits valued at
$117 million and a cash balance of $14,360 million. These assets were used to fund Crown operations, to
provide short-term liquidity if required and to help repay debt maturities as they fell due. Asset holdings
increased during the year as NZDMO pre-funded future borrowing needs owing to uncertainty introduced by
the two major Canterbury earthquakes and the financial position, and changes to funding risk policy.
Assets are invested primarily in AAA and AA-rated securities. The high quality of the asset portfolio, in
conjunction with NZDMO’s asset-liability matching policy, means the portfolio value had very low volatility, as
reflected in an average monthly VaR during 2010/11 of less than $1 million.
Performance Dimensions for 2010/11 Target (see notes) Performance for 2010/11
Cost of new core Crown borrowing is less than the long- term average cost of the New Zealand Government.
Cost of new borrowing is less than 6%.
Achieved.
Average cost of borrowing was 4.31%.
Tender efficiency: Average domestic bond tender cover ratio.
Average tender cover ratio is greater than 2.
Achieved.
Average cover ratio was 2.97 times.
Tender efficiency: Average range of successful bids in domestic bond tenders.
Average range of successful bids is less than 5 basis points.
Achieved.
Average range was 1.91 basis points.
Funding risk: The nearest bond maturity will be at least 50% funded from NZDMO’s holdings of cash and short-term liquid assets within six months of maturity, and fully funded within three months.
Funding target. Target met.

THE TREASURY ANNUAL REPORT 2010/11 – The Treasury
Page 38
Performance Dimensions for 2010/11 Target (see notes) Performance for 2010/11
Compliance with risk management policies and parameters for portfolio management and debt issuance.
No more than four breaches. Achieved.
One liquidity policy breach.
Value-added from management of the Crown’s debt and related financial assets to meet targets for tactical portfolios. See note on Value-added from management of the tactical portfolios below.
$40 to $60 million. Not achieved.
Value-added was $32.720 million. This was a result of NZDMO’s decision to conserve cash following the two major Canterbury earthquakes and changes to funding risk policy.
Average VaR for the tactical portfolios, at a confidence level of 95%. See note on Average VaR below.
Average monthly VaR is less than $1.400 million.
Achieved.
Average monthly VaR was $840,000.
Losses incurred from the credit-related sale of securities, or from default by a counterparty.
No losses. No losses.
Number of settlement errors, and financial value of losses arising from settlement errors.
No more than 12 errors; losses do not exceed $10,000.
Achieved.
Three settlement errors, with no cost.
2010 Actual
$000 Administration of Crown Borrowing PLA
2011Actual$000
2011 Main Estimates
$000
2011Supp. Estimates
$000
Administration of Crown Borrowing PLA:
5,161 Expenses 4,931 5,526 5,231
Funded by:
5,059 Revenue Crown 4,814 5,428 5,138
102 Other revenue 117 98 93
Administration of Derivative Transactions PLA:
1,249 Expenses 1,077 1,258 1,092
Funded by:
1,227 Revenue Crown 1,055 1,236 1,073
22 Other revenue 22 22 19
Administration of Investment of Public Money PLA:
373 Expenses 671 320 803
Funded by:
366 Revenue Crown 657 316 791
7 Other revenue 14 4 12
Expenditure in the Administration of Crown Borrowing PLA was $300,000 (6%) under Supplementary Estimates
owing to lower foreign legal fees owing to exchange rate movements. Expenditure in the Administration of
Investment of Public Money PLA was $132,000 (16%) under Supplementary Estimates owing to lower registry
and custodial charges owing to a lower demand for KiwiBonds than forecast and exchange rate movements.
Notes:
Aggregated performance targets for PLAs
Performance targets for Administration of Crown Borrowing PLA, Administration of Derivative Transactions
PLA and Administration of Public Money PLA have been aggregated. The performance targets were specified
as a total for activity across these output classes because this provided a more meaningful measure of the
outputs produced by NZDMO.

THE TREASURY ANNUAL REPORT 2010/11 – The Treasury
Page 39
Compliance with risk management policies – performance measure
To improve transparency, the 2010/11 target explicitly identifies the number of breaches considered acceptable
under existing NZDMO policy.
Value-added from management of the tactical portfolios meets target level
NZDMO derives the value-added figure from its management reporting, which is calculated on a different basis
from external Crown financial statement reporting. The “tactical” portfolios are those where NZDMO is able to
conduct discretionary transactions to manage risks: specifically, the liquidity, departmental and FX portfolios.
NZDMO values its portfolio(s) by the commonly-used methodology of calculating net present values from all
future cash flows using zero-coupon discount curves which are generated at least daily from current market data.
Generally, no counterparty credit spreads are applied to the curves.
NZDMO uses current spot FX rates to translate foreign-currency net present values to New Zealand dollars. The
value-added measure is primarily used to compare current performance against historic performance. Historic
performance helps guide the establishment of future targets, which are set annually taking into account changes
in the external environment.
Average VaR – performance measure
The Minister of Finance has agreed to a limit of $14 million for average monthly VaR across the whole of
NZDMO’s operations. NZDMO’s performance target for the tactical portfolios is set at 10% of the total limit, or
$1.400 million.

THE TREASURY ANNUAL REPORT 2010/11 – The Treasury
Page 40
State Sector and Economic Performance Policy Advice and Management MCOA
This includes work under the following appropriations:
Policy Advice Economic Performance
Policy Advice State Sector Performance
New Zealand Export Credit Office
Management of Liabilities, Claims Against the Crown and Crown Properties
The following table shows the overall cost of this MCOA.
Performance Dimensions for 2010/11 Target Performance for 2010/11
All policy advice complies with the Treasury’s Quality Standards for Policy.
Achieved. Achieved.
Refer to summary of the Review of the Quality of the Treasury’s Policy Advice 2011 on page 62 for further information on application of the policy standard during the 2010/11 year.
2010 Actual
$000 State Sector and Economic Performance Policy Advice and Management MCOA
2011Actual$000
2011 Main Estimates
$000
2011Supp. Estimates
$000
31,372 Expenses 31,384 34,271 33,401
Funded by:
30,743 Revenue Crown 30,533 33,664 32,379
629 Other revenue 851 607 1,022
For the 2011/12 year, the outputs produced under this appropriation have been integrated into a broader
appropriation, Policy Advice – Finance. That combined appropriation includes policy advice outputs relating to
economic performance, State sector performance and macroeconomic performance.

THE TREASURY ANNUAL REPORT 2010/11 – The Treasury
Page 41
Policy Advice – Economic Performance
Scope of Appropriation
Policy advice on the Government’s economic strategy and policy settings and their effect on New Zealand’s
economic growth.
Significant Work Completed During 2010/11
The Treasury developed a narrative intended to inform and integrate the Treasury’s advice on stable and
sustainable growth and has begun to quantify the potential impact of possible reforms on growth. This narrative
provides the basis for consistent and coherent policy proposals to government and external engagement.
Taxation
Legislation giving effect to Budget 2010 decisions were enacted – GST/taxation changes in place in October.
The Treasury investigated, and provided advice on, taxation changes, including options to improve the
efficiency and fairness of the tax system for consideration in Budget 2011. A programme for considering
capital tax reform is under way.
Implementing the regulatory system
The Treasury provided advice on, and support for, the introduction of the Regulatory Standards Bill and
supported the enactment of the New Zealand Productivity Commission Act 2010, which established the
Productivity Commission.
By year-end the Treasury was focused on the delivery of advice on systems for managing the stock of
regulations, including systems for scanning regulations and planning for improvements and assessing the
regulatory stock against principles for best practice regulation.
Financial regulation and review of the Securities Act 1978
The Treasury worked with Ministry of Economic Development (MED) and other agencies to provide guidance
on the review of the Securities Act 1978 and proposed changes to financial sector regulation. Key changes
agreed to include the establishment of the Financial Markets Authority and changes to disclosure and liability
regimes aimed at building investor confidence in New Zealand’s securities markets.
Improving advice on management of natural resources
The Treasury contributed to the development of economic frameworks used by agencies in the natural
resource sector. We advised on New Zealand’s climate change commitments, ensuring that the economic
implications of options were understood, and contributed to the secretariat of the Emissions Trading Schemes
led by the Hon David Caygill. We also contributed to the development of interagency advice on water policy
leading up to and following the Land and Water Forum’s Report of the Land and Water Forum: A Fresh Start
for Freshwater.
We also provided advice on the natural resource aspects of individual Treaty of Waitangi settlements.
Supporting effective international engagement
The Treasury worked with the Ministry of Foreign Affairs and Trade (MFAT) and MED to enhance
New Zealand’s international connections. In particular, the Treasury:
- completed a review of the Overseas Investment Act 2005
- completed negotiation of the CER Investment Protocol with Australia, supported ongoing work to progress
a Single Economic Market with Australia and contributed to the development of the NZ Inc strategy for
Australia

THE TREASURY ANNUAL REPORT 2010/11 – The Treasury
Page 42
- supported ongoing negotiations of the Trans-Pacific Partnership Free Trade Agreement, particularly in
relation to the investment chapter, and
- supported a range of ministerial international engagement, including with Asia-Pacific Economic Cooperation
(APEC), the International Monetary Fund (IMF) and the World Bank.
Supporting the Welfare Working Group
The Treasury assisted the Welfare Working Group to undertake a comprehensive review of the benefit system
and to deliver its findings and recommendations to the Government in February 2011. Since the Government
received the report, the Treasury has been working with the Ministry of Social Development (MSD) on a
comprehensive programme of work in response to the Welfare Working Group’s recommendations.
Develop policy options supporting savings and investment
The Treasury authored the discussion document Savings in New Zealand: Issues and Options to help set the
scene for the Savings Working Group. We also provided analytical and technical support to the Savings
Working Group. The Treasury and IRD advised on, and implemented reforms to, KiwiSaver’s subsidy
structure in Budget 2011. In 2011/12 we will focus on building on our understanding of the drivers of savings
behaviour in New Zealand and on considering some other recommendations of the Savings Working Group in
the areas of capital taxation, KiwiSaver default providers and asset decumulation.
Supporting improvement in secondary education and youth transitions
In 2010/11 the Treasury provided advice on the Youth Guarantee Scheme, led by the Ministry of Education
(MOE), and the Youth Pipeline, led by MSD. The Youth Guarantee provides fully subsidised tuition and
support to 16- and 17-year-olds who are not in education, to increase educational attainment and to improve
transitions between school, tertiary and work. The Youth Pipeline is aimed at better identification of and
intervention for at-risk young people. The focus of this work for 2010/11 and continuing next year is that
proposals are cost-effective, evidence-based and likely to deliver high-quality educational outcomes.
In June 2011 Cabinet noted the progress to date regarding the implementation of the Youth Guarantee,
agreed to expand the Youth Guarantee scheme and agreed to the next stages of implementation. The
Treasury has been working closely with MOE on a medium-term Schooling Strategy.
Supporting innovation and the public science system
The Treasury assisted with implementing changes in the science sector, including the science agencies’
merger into the new Ministry of Science and Innovation (MSI), the recommendations of the CRI Taskforce and
initiatives to support business R&D/technology transfer. The Treasury has worked with other agencies to
provide advice on key proposed science and innovation initiatives, including the review of R&D support for the
high-value manufacturing and services sector. The Treasury’s work aims to deliver more effective taxpayer
support for business innovation and a more commercial focus of Crown R&D expenditure to deliver greater
economic dividends for New Zealand.
Competition
The Treasury has worked with other agencies to assess competition within the dairy sector.

THE TREASURY ANNUAL REPORT 2010/11 – The Treasury
Page 43
Performance Dimensions for 2010/11 Target Performance in 2010/11
Regulatory Impact Analysis: Number of significant Regulatory Impact Statements assessed.
40. 50.
Of all proposals requiring a Regulatory Impact Statements, 66% met all or most of the Regulatory Impact Analysis requirements.
2010 Actual
$000 Policy Advice – Economic Performance
2011Actual$000
2011 Main Estimates
$000
2011Supp. Estimates
$000
15,242 Expenses 15,442 14,875 15,845
Funded by:
14,951 Revenue Crown 15,112 14,623 15,582
291 Other revenue 330 252 263
Expenditure is $403,000 (3%) under Supplementary estimates as a number of projects designed to increase the
Treasury’s impact on economic performance were delayed. An amount of $400,000 will be transferred into
2011/12.

THE TREASURY ANNUAL REPORT 2010/11 – The Treasury
Page 44
Policy Advice – State Sector Performance
Scope of Appropriation
Policy advice on the effective and efficient use of State resources including improved decision-making and
performance management systems and the efficient management of Crown assets.
Significant Work Completed During 2010/11
The Treasury has actively promoted better State sector performance through a series of system-wide initiatives,
designed to improve performance information/signals, institutions and incentives and to lift agency capability in
key areas (notably policy advice, project/programme management and benchmarking).
Improving performance information, signals, institutions and incentives
Better public services
The Treasury has substantially contributed to joint Central Agency work on “better public services” – which is a
core component of improving the performance of the State sector. This work has included advice on institutional
settings including clustering activity and Crown entities, contestability and creating incentives for continuous
improvement. This work forms the overarching story behind and context for many of the other outputs produced.
Performance improvement framework
The Treasury has supported SSC in the implementation of PIF through funding, secondment of staff, direct
input to review processes and analysis of systemic implications of review findings.
Review of performance management tools
Between October 2010 and May 2011, the Treasury and SSC jointly reviewed the effectiveness of the current
suite of performance management tools in the State sector. The evidence collected through this project, and
the conclusions drawn, are being used to inform ongoing work on State sector reform.
Joint Treasury/OAG work programme on improving the quality of non-financial performance information
In 2009/10 and 2010/11, the Treasury and OAG worked jointly to provide support to selected agencies during
the preparation of their SOI and Information Supporting the Estimates. The purpose of this work programme
is to help agencies improve the quality of their non-financial performance information, in advance of the
revised audit standard for service performance information being applied. The final year of this work
programme will be 2011/12.
Other initiatives to improve transparency
The Treasury provided advice to the Minister on the capital charge regime for departments and Crown entities.
The Treasury developed and implemented new capital charge rules, more consistent than those in place
earlier, and conducted a consultation process with all statutory Crown entities regarding these rules. As a
result, the Crown Entities (Capital Charge Rules) Regulations 2011 were made. These regulations provide a
proper legal basis for the collection of capital charges from Crown entities.
Improving agency capability
Policy expenditure review
The Treasury and SSC established and funded the Review of Expenditure on Policy Advice. The Government
commissioned the Review of Expenditure on Policy Advice in August 2010 to provide advice on the cost and
quality of policy advice, as well as the alignment between policy expenditure and the Government’s priorities.
The Review’s final report was provided to the Government in December 2010.
On 28 April 2011 the Government announced a suite of actions that respond to the Review’s
recommendations. The Treasury, SSC and DPMC developed a detailed implementation plan.
Ten projects arising from the Review of Expenditure on Policy Advice are being implemented by Central
Agencies and/or departments. The Treasury continues to implement two of the projects, which will be
completed during 2011/12: (i) Definition of policy advice/reorganisation of appropriations and (ii) Policy

THE TREASURY ANNUAL REPORT 2010/11 – The Treasury
Page 45
benchmarking. The Treasury commenced work on a third project with SSC: Designing and trialling Heads of
Profession. The Heads of Profession project will run through to December 2011.
Project and programme management
The Treasury gained support for the adoption of an informal standard for project and programme management
across the public sector.
State sector efficiency
The Treasury primarily focused on the following issues to shift resources to where they are most effective and
services delivered efficiently:
- supporting top-down expenditure management mechanisms
- improving the effectiveness of State interventions (particularly in welfare and housing)
- driving greater value for money in big sectors (notably health, justice, defence and ACC), and
- managing big cost pressures (such as remuneration, property and back office functions).
These four considerations drive much of our routine Vote-related work.
Supporting better top-down expenditure management mechanisms
We completed a Treasury Paper on the size of government in New Zealand, and in particular the relationship
between size and economic growth. This work has helped inform the next phase of our Better Aligning
Expenditure and Priorities work – supporting a direction focused on medium-term expenditure choices and
trade-offs to support top-down expenditure management. Empirical work on fiscal incidence was a core
component of this advice.
Improving the effectiveness of State interventions
Housing
The Treasury provided a range of advice to support the Government’s consideration of and response to the
Housing Shareholders’ Advisory Group report. This work contributes to the objectives of achieving more
effective and efficient social housing services through better tenant management, better management of social
housing assets and increased contestability in supply.
This included advice to support Cabinet Strategy Committee (STR) consideration of a new direction for social
housing (September/October), specific proposals for reforms (November) and budget implications (March).
A particular focus for advice in the second half of the year was the establishment of the Social Housing Unit
(April/May).
The Treasury has also played a key role in supporting the development of advice from lead departments
(Department of Building and Housing [DBH] and MSD) on reforms of financial assistance and the integration
of housing needs assessment with assessment for other forms of social support. These two streams of work
will report during 2011/12.
The Treasury has played a role in supporting DBH and CERA’s work on housing implications of the
Canterbury earthquakes (such as the provision of temporary housing). In particular, the Treasury has
provided second-opinion advice and assistance on the fiscal and economic consequences of proposals.
Promoting value for money in major sectors
Health sector
Given the very significant public expenditure on health, its future cost pressures and the importance of health
services to living standards, the Treasury’s priority objective is to maximise health benefits while managing
current and future health spending within the Government’s fiscal strategy.
We played a key role in ensuring that the Ministry of Health’s (MOH) Four-year Budget Plan provided options
to operate within the Vote Health budget allocation and securing a fiscally prudent capital allocation, and in
pushing forward advice on key elements of the system that drive costs and performance.

THE TREASURY ANNUAL REPORT 2010/11 – The Treasury
Page 46
We provided advice and support to MOH on the restructure of its policy function, which took place in late
2010. There has been more limited policy change during 2010/11 compared with the changes to the structure
of the health system made in 2009/10. As a result, we have focused on investigating longer-term options for
supporting better system performance and lower expenditure growth. We expect the value of this work to be
realised in joint work with MOH in 2011/12, including on primary care policy and evaluation of the new health
system structures.
The Treasury engaged with the sector directly in a number of ways, including presenting an economic and
fiscal overview to DHB chairs, board members and chief executives. The purpose of this was to support them
in understanding and managing the sector’s response to the fiscal challenge, and in ensuring future health
system cost-effectiveness and sustainability.
Capital Assessment Guidelines were issued to DHBs to assist the development of capital projects – these are
based on the whole-of-government Better Business Case guidance. However, requests for capital approval
that are not supported by adequate information and analysis continue to be provided to Ministers. DHBs and
MOH rarely consider alternative procurement methods and there is little evidence that regional solutions are
being properly considered. We expect this to improve over time.
Owing to resourcing pressures, some deliverables that the Treasury expected to close late in 2010/11 will be
completed in 2011/12 – this includes advice on overall institutional settings for the public health system and
future directions for primary healthcare.
Justice sector
We worked with justice sector agencies on a range of initiatives to enhance public safety, reduce crime, lower
the number of offenders entering the criminal justice system and improve outcomes such as recidivism rates.
We have paid particular attention to the sector’s ability to deliver improved outcomes within the context of the
Government’s fiscal strategy.
We provided advice on prison capacity planning and the justice sector asset base, which represent significant
investments for government.
Supporting the Defence review
We supported the development of the Defence White Paper which sets the direction of Defence policy for the
next 25 years. The Treasury also focused on the related Value for Money review of the New Zealand Defence
Force, which sought to balance capability within the Government’s fiscal strategy. On the basis of this work,
Ministers agreed an ambitious savings target. The Treasury has since closely engaged with the New Zealand
Defence Force to monitor the implementation of the savings plan and to ensure the savings are realised.
ACC
The policy reform agenda and resources have focused on introducing competition to the Work Account and
options to expand the Accredited Employer Programme. We have provided advice on other options for
improving performance across the Scheme and how the turnaround can be sustained.
ACC continues to improve performance ($3.600 billion surplus projected at 30 June; Non-Earners Account
appropriations reduced by $638 million across the forecast period); significant reductions for earners (17%)
and employers (22%) are expected in 2011/12.
Education
Advice on performance and productivity improvements proposed by the Early Childhood Education Taskforce
and subsequent policy development. We stepped up our focus in the early childhood education (ECE) sector
developments area in order to address emerging issues. The Treasury will be using the four-year budget
planning process, ECE taskforce and Welfare Working Group processes to influence future direction and
spending.
The weathertightness of school property has also been a focus of advice, with MOE progressing work around
its future funding needs and approach to weathertightness.

THE TREASURY ANNUAL REPORT 2010/11 – The Treasury
Page 47
Managing big input cost pressures
Advice on State sector remuneration issues
The Treasury has advised Ministers on how to manage State sector wage demands in accordance with the
Government Expectations for State Sector Wage Settlements. The Treasury works closely with SSC in the
provision of this advice.
In the past year, all collective employment negotiations have met these expectations, so that:
wage settlements for the State sector have been funded from within departmental baselines, and
wage settlements generally are not in advance of private sector settlements.
The Treasury has also provided advice to Ministers on pressures anticipated for 2011/12 and beyond and a
strategy for responding to these pressures, and advised on implications for changes in superannuation policy for
the State as an employer.
BASS programme: The Treasury completed the first annual benchmarking exercise for administrative and
support services designed to increase transparency and scrutiny regarding the cost and quality of internal
services. This work supported agencies in understanding leading practice, identifying opportunities for
improvement and setting targets. This work also supported the establishment of a property centre of expertise
in MSD to strengthen the quality of property management across government, and stakeholder support for the
launch of cross-agency improvement programmes for HR and finance functions. BASS has also increased
agency capability and appetite for better management information regarding service performance, including
services to the public.
Shared ICT initiatives: The Treasury has developed funding mechanisms for DIA’s implementation of the IAAS
(Infrastructure as a Service) shared ICT service to enable it to generate estimated savings of $50 million over
the first five years. We also considered options for accelerating the pace of shared ICT initiatives that will
generate significant savings across the State sector (funding sources for these are still being explored).
Other Treasury initiatives to manage costs
Implementation of the findings from the review of the compliance costs for Crown entities.
Provided advice to the Minister on progress in reducing debt owed to the Crown.
Performance Dimensions for 2010/11 Target Performance for 2010/11
Vote analysis: Supporting the Government by pursuing policy priorities and fiscal policy objectives through the analysis and advice provided as part of the annual budget cycle.
Achieved. Achieved.
The Treasury’s advice across votes helped Ministers deliver the 2011 Budget consistent with their BPS. Our advice has helped Ministers improve Value for Money (VfM) and performance, both within key sectors and across the public sector.
All statutory requirements of the Public Finance Act 1989 have been met.
2010 Actual
$000 Policy Advice – State Sector Performance
2011Actual$000
2011 Main Estimates
$000
2011Supp. Estimates
$000
12,065 Expenses 13,431 13,843 13,648
Funded by:
11,849 Revenue Crown 12,961 13,563 12,980
216 Other revenue 470 280 668

THE TREASURY ANNUAL REPORT 2010/11 – The Treasury
Page 48
New Zealand Export Credit Office
Scope of Appropriation
Implementation of the Government’s Export Credit Guarantees policy and operations of NZECO.
Significant Work Completed During 2010/11
NZECO has exceeded its 2010/11 external engagement target, with a total of 435 one-on-one meetings,
seminars and presentations.
A total of 59 new policies were issued in 2010/11 – with total exposure of $161.870 million supporting exports
of $261.250 million.
NZECO approved an additional $62 million of exposures which are under offer. These transactions are
expected to be completed in 2011/12.
Performance Dimensions for 2010/11 Target5
Performance in 2010/11
Compliance with international guidance lines (OECD and World Trade Organization [WTO]) and Delegated Mandate.
100%. 100%.
Value of new export credit guarantees.
$114.400 million. Achieved: $129.920 million.
Value of new US contract bonds. $52.600 million. Not achieved: $13.730 million.
The result is dependent on the exporters being successful with their bids. NZECO approved 12 contracts totalling over $145 million; however, only three of these have been successful to date.
Value of new non-US contract bonds.
$20 million. Not achieved: $4.260 million.
Target was not met primarily owing to the contract not proceeding, being delayed or bonds not being required. Out of the 11 applications that NZECO approved, four deals totalling $17.900 million have not been taken up to date.
Value of new working capital guarantees.
$4.500 million. Not achieved: $0.
No guarantee was issued owing to these reasons:
There are still only three banks that have accepted the NZECO working capital guarantee.
This is a bank-led guarantee requiring exporters to have secured export contract(s) and banks to have the appetite to lend.
NZECO having the appetite to take on risks associated with funding – being the exporter, their transaction and buyer repayment risk.
Value of short-term trade credit guarantees.
$77.100 million. Not achieved: $13.950 million.
During the year, NZECO issued 32 policies – the exposure of $13.950 million has supported exports of $44.900 million.
The target for this output was affected by continued constrained global demand and an improved appetite by the private sector, compared to the levels anticipated on the basis of 2009/10.
5 It is difficult for NZECO to accurately estimate performance targets for outputs as the results achieved depend on contractors’ success in tenders during the year.

THE TREASURY ANNUAL REPORT 2010/11 – The Treasury
Page 49
2010 Actual
$000 New Zealand Export Credit Office
2011Actual$000
2011 Main Estimates
$000
2011Supp. Estimates
$000
2,103 Expenses 2,064 3,631 3,255
Funded by:
2,063 Revenue Crown 2,021 3,580 3,172
40 Other revenue 43 51 83
NZECO was $1.191 million (37%) under Supplementary estimates. Several bids by NZECO clients for large
overseas contracts were unsuccessful in the later part of the year and, as a result, NZECO year-end expenditure
was under budget, particularly in costs for US surety bonds and legal costs.

THE TREASURY ANNUAL REPORT 2010/11 – The Treasury
Page 50
Management of Liabilities, Claims Against the Crown and Crown Properties
Scope of Appropriation
Management of contractual or Treaty of Waitangi-related claims against the Crown and the management of
New Zealand House, London.
Significant Work Completed During 2010/11
Residual liabilities overseen by Financial Operations:
During 2010/11, Financial Operations commenced responsibility for ensuring the ongoing effective and efficient
management of the Crown’s residual obligations and contingent liabilities relating to:
the obligation to complete the statutory vesting of the elecricity generation assets that were originally sold to
the Electricty Corporation of New Zealand (ECNZ)
the Crown Loan and Grants to Taitokerau Forests Ltd
the remaining Crown-owned Geothermal Wells, and
certain other obligations arising from statute, contract and historic Treaty of Waitangi settlements that the
Crown is still responsible for.
During the period, the following significant pieces of work were undertaken or completed:
Four land assets were vested in a former SOE to discharge an outstanding contractual obligation.
Agreement was reached in respect of the Mount York repeater station site.
Negotiations were advanced for legalisation of the remaining electricity generation assets to be transferred in
the Taupo region.
Ongoing contractual obligations to Taitokerau Forests Ltd were administered effectively and in accordance
with stipulated agreements.
The remaining Crown-owned Geothermal Wells were appropriately maintained.
Building Industry Authority
The Building Industry Authority (BIA) remains a joint defendant in claims before the courts and the Weathertight
Homes Resolution Service relating to BIA’s previous role as regulator of the building industry. BIA has been
disestablished and absorbed into DBH. To prevent conflicts of interest, the Treasury was given responsibility for
managing weathertight claims against BIA on behalf of the Crown from 1 July 2005. The number of such claims
against BIA (and thus the Crown) has reduced over time owing to court decisions for the Crown.
In May 2010, the Crown announced its intention to assist homeowners to get their leaky homes repaired by
contributing 25% of agreed repair costs (with affected local authorities also contributing the same amount). That
project has been advanced by DBH. This package has implications for weathertightness claims.
New Zealand House
Continued to manage New Zealand House in London in a manner that maximises the ongoing return on the
property while managing associated risks.

THE TREASURY ANNUAL REPORT 2010/11 – The Treasury
Page 51
Performance Dimensions for 2010/11 Target Performance in 2010/11
Management and resolution of liabilities and claims within parameters set by Ministers.
Achieved. Achieved.
2010 Actual
$000 Management of Liabilities, Claims Against the Crown and Crown Properties
2011Actual$000
2011 Main Estimates
$000
2011Supp. Estimates
$000
1,384 Expenses 447 1,922 653
Funded by:
1,363 Revenue Crown 439 1,898 645
21 Other revenue 8 24 8
Expenditure is $206,000 (32%) under Supplementary estimates as a contingency was retained for funding for
managing the potential liabilities of the former BIA and $191,000 will be transferred into 2011/12.

THE TREASURY ANNUAL REPORT 2010/11 – The Treasury
Page 52
Infrastructure Advice and Coordination
Scope of Appropriation
This appropriation is limited to the provision of advice to the Government and to government agencies on
infrastructure, ensuring coordination and implementation of the Government’s infrastructure activities, the
formulation and implementation of the National Infrastructure Plan, monitoring of infrastructure investment and
frameworks and operation of the National Infrastructure Advisory Board.
Significant Work Completed During 2010/11
National Infrastructure Plan
The National Infrastructure Plan was completed and ready for publication during the financial year, and
formally launched in early July. The Plan has been well received by Ministers and stakeholders. The Treasury
will now focus on working with other government and non-government agencies to implement the Plan over
the next three years.
Public Private Partnerships
The Treasury continued to invest in the development of the PPP market as part of its core business in order to
build a pipeline of viable projects, thereby giving assurance to both the public and private sectors of the
Government’s commitment to this new form of procurement where it provides value for money for taxpayers.
In relation to potential PPP transactions, the Treasury:
- advanced two projects into procurement phase – the Wiri Prison project and the Hobsonville Schools
project
- advanced two projects into strategic assessment/business case phase – the Whole of Government Radio
Network project and the Defence Base Consolidation project, and
- continued to assess sectoral opportunities for PPPs in relation to social housing, transport and health.
The Treasury continued to work on the PPP Toolkit, which is intended to be a repository of guidance material
available for use by the public sector in relation to PPPs. The draft PPP Standard Contract is the lynchpin of
the PPP Toolkit. The development of the Toolkit, and the draft Contract in particular, is intended to streamline
and improve the consistency of PPP procurement processes across the public sector, and provide the market
with some transparency and comfort around the practice implemented and messages issued during the
procurement process. This is critical to ensuring the integrity of the PPP market in New Zealand.
Capital asset management (CAM)
The Treasury continued its work on improving the effective management of the Crown’s physical assets, in
line with government policy. A notable feature was the rollout in July 2010 of a new set of Cabinet
expectations for capital investment proposals supported by the Better Business Cases guidance for
departments and Crown entities. The guidance is based on material used in the UK and in state of Victoria,
Australia. A significant effort was put into raising awareness of these new expectations and in training officials
from Central Agencies and capital-intensive agencies in the use of the guidance materials.
During the year, the Treasury completed its third survey of capital intentions of 15 capital-intensive agencies. It
reported to Ministers on the potential scale and affordability of agency capital investment requirements over
the next 10 years, under current policy settings. This work resulted in the Cabinet Expenditure Control
Committee inviting six agencies to report back on the drivers of their capital intentions and options for
managing pressures within baselines.

THE TREASURY ANNUAL REPORT 2010/11 – The Treasury
Page 53
Utilities code
The Treasury administers the Utilities Access Act 2010, which came into force on 5 August 2010.
The Treasury is working with an industry group to facilitate the development of a Utilities Access Code.
Following extended industry consultation, the Code is expected to be submitted later in 2011 for Ministers’
approval under the Act.
Ultra-fast broadband
The Treasury worked with MED and Crown Fibre Holdings Ltd to implement the Government’s Ultra-fast
Broadband policy. By the end of May 2011, Crown Fibre Holdings had signed contracts with Telecom,
Enable, Northpower and WEL Networks which together meet the Government’s policy objective of giving 75%
of New Zealanders access to ultra-fast broadband. This involved complex commercial and regulatory policy
issues, and was achieved within the funding the Government has provided. As fibre is progressively
deployed, the Treasury will continue to be involved to oversee the Government’s commercial relationships and
ensure successful completion.
Performance Dimensions for 2010/11 Target Performance for 2010/11
Publication of a revised National Infrastructure Plan by June 2011.
Achieved. Achieved. The Plan was completed by year end. It was formally launched on 4 July 2011.
Successful completion of First Tranche of Fibre to the Home.
Achieved. Achieved.
Completion and implementation of standardised business case requirements for capital-intensive government agencies.
Achieved. Achieved.
Two PPPs in market by 30 June 2011. Achieved. Achieved.
Introduction of Utilities Access Code Bill by 30 June 2011.
Achieved. Achieved. The Utilities Access Act 2010 came into force on 5 August 2010. This Act is enabling legislation for the Utilities Access Code which the industry is now developing. The Treasury expects the Code will be completed within the first half of the 2011/12 year, following an extended period of consultation.
2010 Actual
$000 Infrastructure Advice and Coordination
2011Actual$000
2011 Main Estimates
$000
2011Supp. Estimates
$000
4,675 Expenses 4,577 4,799 4,824
Funded by:
4,587 Revenue Crown 4,477 4,720 4,747
88 Other revenue 100 79 77
Expenditure was $247,000 (5%) under Supplementary estimates owing to delays in completion of projects for
CAM and the development of the PPP Toolkit. This under-expenditure will be transferred into 2011/12.

THE TREASURY ANNUAL REPORT 2010/11 – The Treasury
Page 54
Crown Guarantee Schemes
The Crown Guarantee Schemes work programme was spread across two appropriations in 2010/11, including on
PLA. They were:
Crown Guarantees Schemes, and
Administration of Guarantees and Indemnities Given by the Crown PLA.
Scope of Appropriations
In the order listed above are:
Crown Guarantees Schemes – This appropriation is limited to the implementation and operation of the
Crown’s Deposit Guarantee Scheme (DGS) and Crown’s Wholesale Funding Guarantee Facility (WFGF)
excluding expenses incurred in connection with administering claims under a guarantee or indemnity given
under the Scheme.
Administration of Guarantees and Indemnities Given by the Crown PLA – This appropriation is limited to
expenses incurred in connection with administering of guarantees and indemnities given by the Crown, as
authorised by section 65ZG of the Public Finance Act 1989.
All work related to DGS in the 2010/11 year is captured under the Crown Guarantee Schemes appropriation
following the combination of the previously separate appropriations for Crown Deposit Guarantee Scheme and
Crown Wholesale Guarantee Facility from October 2009.
Significant Work Completed During 2010/11
An accelerated payment process was developed and implemented, to minimise the costs to the Crown when
paying depositors of SCF.
Entities in the Scheme continue to be actively monitored, with the monitoring process being brought in-house
for the extended scheme.
Monitoring processes have been put in place for the receiverships of entities whose investors have been paid
out under the Scheme. Receivers have provided updated estimates of the expected recoveries under the
Scheme.
High-level monitoring of the bonds issued under WFGF continues.
WFGF was closed in April 2010. The value of securities issued with the benefit of the Crown guarantee will
reduce over time as these securities mature. The last guarantee certificate is due to expire in October 2014.
Any remaining work related to these issuances in the 2010/11 year is captured under the Crown Guarantee
Schemes appropriation following the combination of the appropriations for the retail and wholesale schemes
from October 2009.
Administering payments
Payout of investors of all entities that failed under the original guarantee scheme was completed in a timely
manner.
An accelerated payment process was developed and implemented for SCF to enable the costs to the Crown
of failure to be minimised.
In order to address matters of public interest in SCF, documents related to SCF’s inclusion in the Scheme,
monitoring while in the Scheme, its ultimate failure and the Crown’s payout of its investors were proactively
released to the public.

THE TREASURY ANNUAL REPORT 2010/11 – The Treasury
Page 55
Payout processes were updated and refined to reflect the changed nature of the guarantees in the extended
scheme.
As at 30 June 2011, 79% of guaranteed deposits in Equitable Mortgages Ltd (EML), the sole entity under the
extended scheme to have failed, had been paid out. On average, payments were made within 25 days of
receipt of a completed claim form.
Performance Dimensions for 2010/11 Target Performance for 2010/11
Development and implementation of an overall plan for managing the Crown interests including default events.
Achieved. Achieved.
This work is ongoing, with particular attention being paid to minimising the cost of failure, providing smooth and timely payout processes and monitoring of entities in receivership.
Active monitoring of guaranteed institutions is undertaken to minimise Crown exposure.
Achieved. Achieved.
Ongoing with regular reporting from RBNZ under the original scheme having been brought in-house for entities under the extended scheme. Monitoring reports were supplemented by engagement with the entities themselves, requests for information under the Guarantee Deeds and inspections where necessary.
The Treasury actively manages the Crown interests in the event of a specific default.
Within 7 days of default.
Achieved.
A structured plan was implemented to ensure the Crown’s key requirements were met for all entities that defaulted.
Administration of Guarantees and Indemnities Given by the Crown PLA
No unnecessary delays in processing applications.
Achieved. Achieved.
All investors in entities that defaulted under the original scheme were paid out in a timely manner.
Under the extended scheme, timeliness of payment is determined by the speed with which creditors submit their claims. As at 30 June 2011, 79% of depositor funds in EML had been paid out, with claims paid on average within 25 days of receipt of claim, although simple claims are paid on average within 15 days.
Accuracy of payouts. Achieved. Achieved.
Payments have been made to more than 11,000 depositors with no unresolved queries on the amount paid. This number excludes SCF depositors who were paid out by the Trustee.
2010 Actual
$000 Crown Guarantee Schemes
2011Actual$000
2011 Main Estimates
$000
2011Supp. Estimates
$000
2,520 Expenses 1,323 3,717 2,739
Funded by:
2,520 Revenue Crown 1,297 3,674 2,716
- Other revenue 26 43 23
2010 Actual
$000 Crown Deposit Guarantee Scheme
2011Actual$000
2011 Main Estimates
$000
2011Supp. Estimates
$000
437 Expenses - - -
Funded by:
383 Revenue Crown - - -
54 Other revenue - - -
2010 Actual
$000 Crown Wholesale Guarantee Facility
2011Actual$000
2011 Main Estimates
$000
2011Supp. Estimates
$000
141 Expenses - - -
Funded by:
134 Revenue Crown - - -
7 Other revenue - - -

THE TREASURY ANNUAL REPORT 2010/11 – The Treasury
Page 56
2010 Actual
$000 Administration of Guarantees and Indemnities Given by the Crown PLA
2011Actual$000
2011 Main Estimates
$000
2011Supp. Estimates
$000
2,475 Expenses 3,094 4,440 6,551
Funded by:
2,455 Revenue Crown 3,048 4,418 6,475
20 Other revenue 46 22 76
The Crown Deposit Guarantee Schemes was under-spent by $1.416 million (52%) compared to Supplementary
estimates. A contingency of $1 million was retained owing to the inherent uncertainties of the Scheme, the
riskiness of the guaranteed entities and the market in which they operate, and the complexity of the guarantee
itself. This will be transferred to 2011/12.
PLA expenditure was $3.457 million (53%) under-spent owing to slower payout than planned, increased efficiency
of payment by outsourced partner and completing legal analysis within the Treasury. An amount of $1 million will
be transferred to 2011/12.
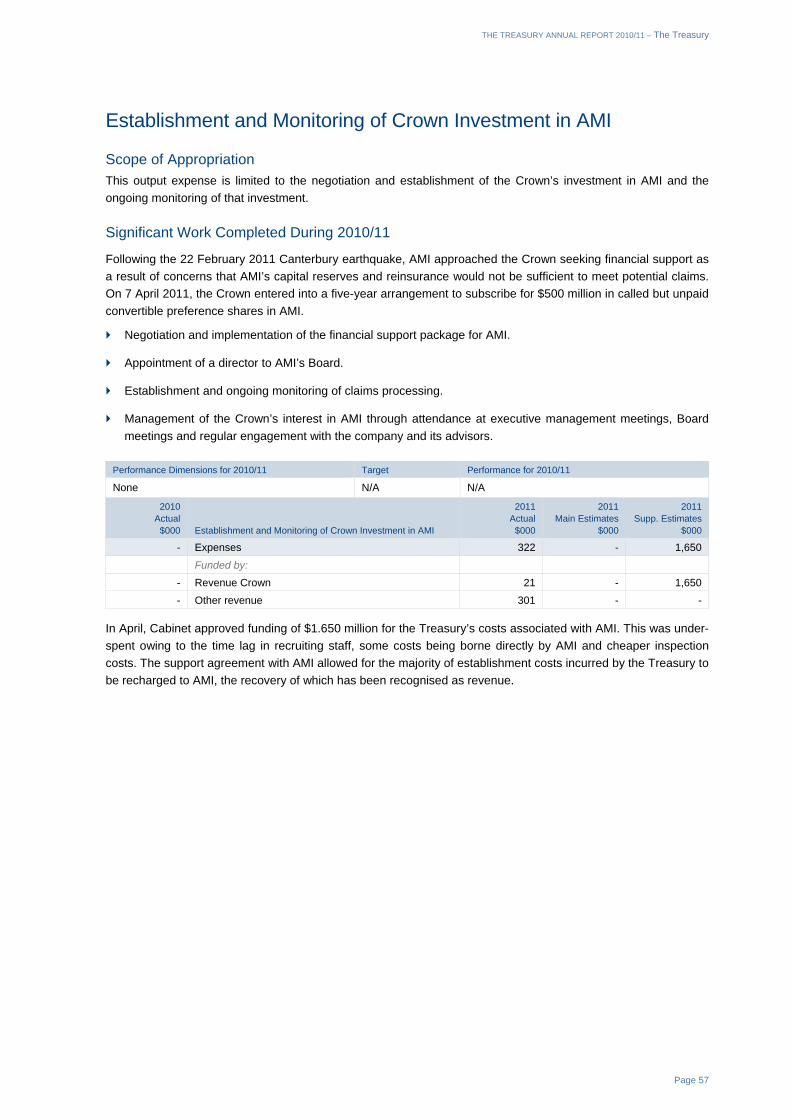
THE TREASURY ANNUAL REPORT 2010/11 – The Treasury
Page 57
Establishment and Monitoring of Crown Investment in AMI
Scope of Appropriation
This output expense is limited to the negotiation and establishment of the Crown’s investment in AMI and the
ongoing monitoring of that investment.
Significant Work Completed During 2010/11
Following the 22 February 2011 Canterbury earthquake, AMI approached the Crown seeking financial support as
a result of concerns that AMI’s capital reserves and reinsurance would not be sufficient to meet potential claims.
On 7 April 2011, the Crown entered into a five-year arrangement to subscribe for $500 million in called but unpaid
convertible preference shares in AMI.
Negotiation and implementation of the financial support package for AMI.
Appointment of a director to AMI’s Board.
Establishment and ongoing monitoring of claims processing.
Management of the Crown’s interest in AMI through attendance at executive management meetings, Board
meetings and regular engagement with the company and its advisors.
Performance Dimensions for 2010/11 Target Performance for 2010/11
None N/A N/A
2010 Actual
$000 Establishment and Monitoring of Crown Investment in AMI
2011Actual$000
2011 Main Estimates
$000
2011Supp. Estimates
$000
- Expenses 322 - 1,650
Funded by:
- Revenue Crown 21 - 1,650
- Other revenue 301 - -
In April, Cabinet approved funding of $1.650 million for the Treasury’s costs associated with AMI. This was under-
spent owing to the time lag in recruiting staff, some costs being borne directly by AMI and cheaper inspection
costs. The support agreement with AMI allowed for the majority of establishment costs incurred by the Treasury to
be recharged to AMI, the recovery of which has been recognised as revenue.

THE TREASURY ANNUAL REPORT 2010/11 – The Treasury
Page 58
Establishment of the New Zealand Productivity Commission
Scope of Appropriation
This appropriation is limited to the establishment costs of the New Zealand Productivity Commission.
Significant Work Completed During 2010/11
The New Zealand Productivity Commission Act received Royal assent on 20 December 2010 following a policy
and Select Committee process spanning much of 2010. The Treasury procured office premises and put in place
an agreement for the provision of back office services with IRD to allow the Commission to be operational on
1 April 2011.
Performance Dimensions for 2010/11 Target Performance for 2010/11
Commissioners are appointed by 28 February 2011.
Achieved. Not achieved within the target timeframe; however, significant progress was made towards making these appointments. The Chair of the Productivity Commission was appointed 30 January 2011. Two further Commissioners were appointed 28 March 2011.
25% of the Commission’s staff have been recruited by April 2011.
Achieved. Not achieved.
Appointment of the General Manager was facilitated, following which responsibility for staff recruitment was transferred to the Commission. Further information on Commission staffing is available in the Commission’s SOI.
The Commission is ready to begin an inquiry in April 2011 in accordance with legislation.
Achieved. Achieved. The Commission commenced operations on 1 April 2011.
2010 Actual
$000 Establishment of the New Zealand Productivity Commission
2011Actual$000
2011 Main Estimates
$000
2011Supp. Estimates
$000
- Expenses 468 1,200 645
Funded by:
- Revenue Crown 451 1,200 628
- Other revenue 17 - 17
Establishment of the New Zealand Productivity Commission was $177,000 (27%) under Supplementary estimates
owing to minor delays in recruiting Commission staff prior to the New Zealand Productivity Commission
establishment date of 1 April 2011.

THE TREASURY ANNUAL REPORT 2010/11 – The Treasury
Page 59
Vote State-Owned Enterprises
Crown Company Monitoring Advice to the Minister for State-Owned Enterprises and Other Responsible Ministers
Scope of Appropriation
This appropriation is limited to the provision of ownership, performance monitoring and governance advice to the
Minister for State-Owned Enterprises and other responsible Ministers in respect of the Ministers’ shareholding
responsibilities or as responsible Ministers for the New Zealand Lotteries Commission and Public Trust.
Significant Work Completed During 2010/11
Performance monitoring of SOEs
Embarked on changes to COMU’s monitoring approach, especially for the commercial portfolio, in order to
increase the level of shareholder engagement with boards about things such as their strategies, financial
forecasts including their capital expenditure plans, and dividend policies.
Continued to increase the level of transparency and accountability by re-launching the COMU website and by
reviewing the Continuous Disclosure Regime. In 2011/12 the Continuous Disclosure Regime is being
extended to cover all SOEs and Television New Zealand Ltd (TVNZ).
Commissioned commercial valuations of six major SOEs (Genesis, Meridian, Mighty River Power,
New Zealand Post, Solid Energy and Transpower) and provided comprehensive advice on a range of issues.
These included coordinating a process to facilitate the transfer of the Tekapo A & B power stations from
Meridian to Genesis under the Electricity Industry Act 2010, ongoing advice about KiwiRail and advice about
establishing an Uncalled Capital Facility in respect of New Zealand Post/Kiwibank.
Published the inaugural Annual Portfolio Report describing the financial performance of government-owned
enterprises that have full or partial commercial objectives.
Created the Financial Analysis Unit as a centre of financial expertise within COMU.
Improving public sector monitoring
Embarked on changes to COMU’s monitoring approach, especially for the commercial portfolio, and looking at
the development of better guidance and tools to support monitoring across the public sector and especially for
the commercial portfolio.
Commenced activity to advance COMU’s role as a Centre of Expertise in ownership monitoring and
governance. This has included the codification of all COMU’s monitoring and board appointment activities,
which are now in the process of being listed on our website. Trial programmes to assist other monitoring
agencies have been put in place. In the 2011/12 year we will build on this establishment work to implement a
structured approach within COMU to ensure our outputs and activities reflect best practice, and that our
assistance to other agencies is delivered in a meaningful and structured manner.
Mixed Ownership Model
The Treasury provided advice, and undertook background work, on ownership of commercial entities. This
culminated in the announcement in the 2011 Budget of the Government’s intention to proceed, following the
General Election, with extending mixed ownership to Genesis, Meridian, Mighty River Power and Solid
Energy, as well as reducing the Crown’s majority stake in Air New Zealand.
Following the Budget announcement, the Treasury has started preliminary preparations so that, should the
new government decide to proceed following the General Election, a programme will be able to be
commenced promptly. This would be a significant new activity for the Treasury, spanning several years.

THE TREASURY ANNUAL REPORT 2010/11 – The Treasury
Page 60
Performance Dimensions for 2010/11 Target Performance for 2010/11
Quality standards for policy advice (refer to conditions of use).
Achieved. Achieved.
Refer to summary of the Review of the Quality of the Treasury’s Policy Advice 2011 on page 62 for further information on application of the policy standard during the 2010/11 year.
Ministerial satisfaction. Achieved. Whilst this performance dimension has not been formally measured in 2010/11, COMU has actively engaged with the nine shareholding Ministers it deals with in respect of the work covered by this vote.
2010 Actual
$000 Crown Company Monitoring Advice to the Minister for State-Owned Enterprises and Other Responsible Ministers
2011Actual$000
2011 Main Estimates
$000
2011Supp. Estimates
$000
2,654 Expenses 3,670 2,739 4,187
Funded by:
2,618 Revenue Crown 3,590 2,705 4,129
36 Other revenue 80 34 58
Expenditure was $517,000 (12%) under Supplementary estimates owing to company scoping work that could not
be completed in 2010/11. This under-expenditure will be transferred into 2011/12.

THE TREASURY ANNUAL REPORT 2010/11 – The Treasury
Page 61
Vote Crown Research Institutes
Crown Company Monitoring Advice to the Minister of Science and Innovation and Other Responsible Ministers
Scope of Appropriation
This appropriation is limited to the provision of ownership, performance monitoring and governance advice to the
Minister of Science and Innovation and other responsible Ministers in respect of the Ministers’ shareholding
responsibilities.
Significant Work Completed During 2010/11
Performance monitoring of CRIs
Built on work and analysis developed in 2010, the Treasury developed a more detailed and comprehensive
set of performance information on the entities that are monitored in the 2011 Annual Portfolio Report,
specifically financial performance measures relating to CRIs.
Ministry of Science and Innovation (MSI)
The Taskforce Review of CRIs saw the development of Statements of Core Purpose for each CRI and a new
focus to the Statements of Corporate Intent. COMU worked with MSI on the development of the new
accountability documents and managed the transition of primary monitoring responsibilities from COMU to MSI.
Performance Dimensions for 2010/11 Target Performance for 2010/11
Quality standards for policy advice. Achieved. Achieved.
Refer to summary of the Review of the Quality of the Treasury’s Policy Advice 2011 on page 62 for further information on application of the policy standard during the 2010/11 year.
Ministerial satisfaction. Achieved. Materially met.
During the year COMU has provided the Minister with six-monthly reports on its service performance, quarterly reports on the performance of entities being monitored and ad hoc reports on other areas of interest. In addition to these reporting channels, regular meetings with the Minister have ensured more real-time opportunities for feedback on COMU’s performance.
2010 Actual
$000 Crown Company Monitoring Advice to the Minister of Science and Innovation and Other Responsible Ministers
2011Actual$000
2011 Main Estimates
$000
2011Supp. Estimates
$000
696 Expenses 595 1,074 626
Funded by:
687 Revenue Crown 583 1,063 615
9 Other revenue 12 11 11

THE TREASURY ANNUAL REPORT 2010/11 – The Treasury
Page 62
The Quality of the Treasury’s Policy Advice
Scope
The Treasury applies a consistent quality standard to policy advice provided through all appropriations. The
policy standard is published in full on page 64 of this Annual Report.
The Quality of the Treasury’s Policy Advice: All Treasury Appropriations
Performance Dimensions Target Performance for 2010/11
All policy outputs comply with the Treasury’s Quality Standards for Policy Advice.
Rated as meeting and frequently exceeding expectations.
Consistent standard of work achieved.
Review of the Quality of the Treasury’s Policy Advice 2011
In 2009 we commissioned an external review of a sample of the Treasury’s advice and in 2011 we conducted a
similar but more focused review using Howard Fancy, a director of economic and policy research firm Motu, as an
independent external reviewer. The intent of the 2011 review was to:
assess the quality of a sample of reports against the published quality standards
provide advice about how the quality of the advice reviewed could have been improved, and
comment on any changes in quality in 2011, compared with a review conducted in 2009.
The review looked at a sample of the Treasury’s work over the year (six work streams).
In addition to assessing the work against our published Quality Standards, the review looked for opportunities for
improvement.
The review found that a consistent standard of work is being achieved and maintained by the Treasury. All six
work streams were assessed as performing between satisfactory and very good. Variability between individual
reports and between work streams was generally low. The review found that Ministers could be confident that the
Treasury achieves and maintains satisfactory levels of quality.
To the extent that comparisons can be made with the 2009 results, the 2011 review found that the Treasury:
has a good breadth of institutional knowledge across both subject matter and the processes of government
uses a robust approach to identifying and contextualising issues and problems in order to provide a clear
basis for analysis
has a strong and appropriate focus on fiscal implications
provides advice that is solution and customer focused
has a clear customer focus on the Minister of Finance
is generally clear and concise in its communication, and
has a strong capability to be reactive.
In order to improve the overall effectiveness and quality of the Treasury’s policy advice, the review recommended
that the Treasury:
have a stronger focus on outcomes, including a more explicit focus on assuring value for money and on the
likely effectiveness of policies
ensure that work is framed by a broad view that looks beyond the immediate policy intent to also consider
wider context and how policy can be most effectively delivered

THE TREASURY ANNUAL REPORT 2010/11 – The Treasury
Page 63
broaden its focus beyond risks to also consider potential opportunities and how these opportunities might be
realised
shift from a focus on issues to looking at broader system approaches that seek to change underlying thinking,
capabilities and practices, and
improve the presentation and usability of material provided to Ministers.
The Treasury is considering the findings and recommendations in order to develop a programme of improvements
that aligns with other performance improvement work already under way.

THE TREASURY ANNUAL REPORT 2010/11 – The Treasury
Page 64
Quality Standards for Policy Advice Quality Policy Advice is Fit for Purpose
This Quality Standard for Policy Advice sets out the characteristics or dimensions of policy advice that will best enable it to promote well-informed high-quality decision-making by Ministers. However, the quality dimensions below are not a checklist and not all dimensions will be equally important in every case – judgements are required at the outset about how to apply and balance the quality dimensions to ensure a particular piece of advice is fit for purpose in achieving the result sought. When undertaking a piece of work, explicit consideration needs to be given to the following:
What point are Ministers at in their decision-making process? Can the Treasury add value? What are our opportunities to have an impact?
What result are we seeking by providing a piece of advice?
How should the quality dimensions below be applied and balanced to achieve this result?
What is the relative priority of this piece of work?
What level of investment is warranted?
Dimensions of Quality Policy Advice
Analytically rigorous (Analysis)
Relevant frameworks
Appropriate analytical frameworks are used, and:
knowledge is up-to-date and informed by recent thinking and literature in the field
assumptions behind the frameworks used are explicit and consideration has been given to how they will be expected to play out in the real world (a world which includes information and transaction costs, market failure, government failure, etc), and
consideration has been given to less traditional frameworks and whether they would add innovative or useful perspectives.
Set in a wider strategic context (Applied analysis)
Strategic
Advice is set in the context of the Treasury’s results and informed by a strategic view about what is important.
We are explicit about the relative importance and materiality of the issue, in fiscal, economic and strategic terms.
Connections across policy issues are made, ensuring that Ministers receive a whole-of-government perspective.
Advice considers the long-term implications of decisions and provides a perspective that goes beyond immediate impacts.
We frame issues and help set the agenda.
Customer focused and persuasive (Advice)
Clear
Advice is compellingly presented. It is:
brief and concise – key messages should be readily apparent to the reader
easy to read – has a clear and logical structure, avoids technical jargon and uses visual devices such as charts and tables where possible
pitched to suit the target audience – uses appropriate language, style and level of detail, and
framed in terms of how it fits with previous advice and communications with the Minister.
Robust reasoning and logic
Advice has a clear purpose, problem definition, evaluation of options against criteria and assessment of risks and opportunities. We come to a conclusion and give action-oriented recommendations.
Practical
Issues of implementation, technical feasibility, practicality and timing are considered and advice accurately identifies compliance, transitional, legislative, revenue and administrative implications and costs.
Timely
Reports should meet Ministers’ need for advice that helps in the decision-making process (even if it means, at times, that advice is not fully developed) and indicate when a decision is required.
Evidence based
Analysis is supported by relevant evidence:
Empirical methods are sound, data gaps are identified and the level of confidence/certainty in our empirical base is explicit.
We draw on New Zealand experience of current and past policy interventions and, where relevant, the experience of other countries.
We give our best judgement despite data imperfections; we acknowledge information limitations and advise within them.
Public sector consultation
Ministers receive advice that enables them to engage with their colleagues on a fully informed basis because:
thorough and timely consultation with other government departments has occurred and points of difference, and the reasons for these, are set out, and
where possible, advice is developed in conjunction with relevant government agencies.
Politically aware
Advice:
demonstrates awareness of the wider environment and political situation
is based on a clear understanding of the desired outcomes of the Minister/Government
relates to the perspectives of Ministers, even if suggesting something that tests those perspectives, and
recognises choices and constraints Ministers face, and includes a range of options to address these.
Free and frank
Our advice is honest, impartial and politically neutral – we have a duty to alert Ministers to the possible consequences of following particular policies, whether or not such advice accords with Ministers’ views. Good free and frank advice is offered with an understanding of its political context and the constraints within which the Minister is operating.
Perspectives of wider stakeholders
We understand and advise Ministers on the perspective of groups outside the public sector, consult with key stakeholders and provide advice on communications where appropriate.
Solution focused
We are proactive, anticipating, as well as responding to, Ministers’ needs. Advice suggests a clear way forward (“Here is what you can do” as well as “Here is a problem”) and includes a range of practical options (first best advice, but also second and third).
Quality Involves Continuous Improvement
At the end:
Did we achieve the result we were seeking?
Were our judgements about what would be fit for purpose correct?
What would we do differently next time?
How can we capture and share this learning?

THE TREASURY ANNUAL REPORT 2010/11 – The Treasury
Page 65
Ministerial Servicing Performance 2010/11 The Treasury drafts responses to Ministerial Correspondence (MCs), Parliamentary Questions (PQs) and Official
Information Act 1982 requests (OIAs) for consultation with, or approval by, the responsible Minister.
The Treasury provides these services to the Minister of Finance, Associate Ministers of Finance and/or other
Ministers, on referral from the Minister of Finance or an Associate Minister of Finance, the Minister for
Infrastructure, the Minister of Science and Innovation and the Minister for State-Owned Enterprises.
There are two categories of OIA requests: OIA requests made to Ministers (MOIAs) and OIA requests made to
the Treasury (TOIAs). The number of PQs listed below relates to written PQs only.
Estimated and actual volumes for MC, PQ and OIA requests referred to the Treasury by the Minister’s Office for
2010/11 are presented below:
PQs MCs MOIAs TOIAs
Total for all Votes 235–365 900–1,005 120–225 195–285
Actual draft replies 181 1314 163 174
% answered by due date 98% 45% 75% 82%
% first draft accepted 100% 92% 98% N/A
Performance Measures for the 2010/11 Financial Year
Measures and Standards Agreed for Vote Finance
Description Timeframe Quality Indicator
Ministerial Correspondence
Unless otherwise agreed with the Minister’s Office, submit a reply to:
correspondence marked “Urgent” by the Minister’s Office within 5 working days of referral
correspondence specified by the Minister’s Office as requiring “Priority” within 10 working days of referral, and
all other correspondence within 15 working days of referral.
At least 95% of replies will be delivered within agreed timeframes.
At least 95% of replies will be acceptable to the Minister and will not require amendment.
Parliamentary Questions
Replies to written PQs will be submitted to the Minister’s Office by 12.00pm on the due date specified by the Office.
Replies will be consistent with Standing Order 377.
Relies to Official Information Act 1982 requests made to the Minister
All MOIA requests and Ombudsman investigations will be handled within the time limits prescribed by the Act.
Replies will be delivered to the Minister at least 5 working days before the relevant statutory time limit, unless otherwise agreed with the Minister’s Office.
All replies will be complete and accurate in the information they convey and will be prepared with appropriate consultation of relevant parties.
Advice on, handling of and replies to, MOIA requests will accord with the provisions of the Official Information Act 1982.
At least 95% of MOIA replies will be acceptable to the Minister and will not require amendment.
All stated timeframes will be met.
Replies to Official Information Act 1982 requests made to the Treasury
All TOIA requests and Ombudsman investigations will be handled within the time limits prescribed by the Act.
The Treasury will consult and inform the Minister, and/or other Ministers, on replies to TOIAs, as appropriate and within agreed timeframes.
All replies will be complete and accurate in the information they convey.
Advice on, handling of and replies to, TOIA requests will accord with the provisions of the Official Information Act 1982.
Consultation on proposed replies will be appropriate and acceptable to the Minister.
All stated timeframes will be met.
Ministerial Servicing will not exceed budgeted costs.

Page 66
Financial Statements – Departmental for the year ended 30 June 2011
Overview of Departmental Financial Results 67
Statement of Comprehensive Income 68
Statement of Changes in Taxpayers’ Funds 68
Statement of Financial Position 69
Statement of Cash Flows 70
Statement of Commitments 71
Statement of Contingent Liabilities and Contingent Assets 72
Departmental Capital Expenditure 73
Statement of Departmental Expenses and Capital Expenditure Against Appropriations 74
Notes to the Financial Statements 75

FINANCIAL STATEMENTS 2010/11 – Departmental
Page 67
Overview of Departmental Financial Results
for the year ended 30 June 2011
The following significant movements in actual results between the 2010/11 and 2009/10 years, and actual results
against the 2010/11 Supplementary Estimates budget, are explained below:
2010 Actual $000
2011Actual$000
2011 Main Estimates
$000
2011Supp. Estimates
$000
Revenue
63,858 Crown 63,921 73,098 73,972
Expenses
43,758 Personnel 43,975 47,114 43,727
13,552 Operating 15,128 18,639 20,545
5,542 Consultants 4,674 6,249 9,261
Current Assets
8,799 Debtor – Crown 6,751 6,696 8,940
Non-current Assets
3,653 Property, plant and equipment 3,328 3,660 3,678
Current Liabilities
5,254 Creditors and other payables 4,802 4,300 4,463
4,810 Provision for employee entitlements 4,903 4,822 4,655
Non-current Liabilities
887 Provision for employee entitlements 809 390 870
Taxpayers’ Funds
6,342 General funds 5,742 5,742 5,742
Movements between Main Estimates Budgets and Supplementary Estimates Budgets are explained in the
published Supplementary Estimates of Appropriation.
Significant Actual Movements Between 2010/11 and 2009/10
Operating expenses increased by $1.600 million mainly owing to costs of processing increased level of
payments to investors as part of the Deposit Guarantee Scheme (DGS).
Consultants expenses decreased by $900,000 mainly owing to a reduction in activity as part of the DGS offset
by increases in projects for BASS, infrastructure and mixed ownership model.
Debtor – Crown has decreased by $2.048 million as the prior year expenditure was significantly higher in June
for the DGS and BASS project.
Taxpayers’ Funds has decreased by $600,000 owing to the repayment of capital provided for the Treasury
accommodation project between 2003 and 2005.
Significant Variances Between 2010/11 Actuals and Supplementary Estimates Budget
Revenue – Crown for departmental outputs was lower by $10.050 million, mainly owing to less demand for the
DGS facility and NZECO and lower costs for establishment of monitoring of AMI.
Consultants expenses are $4.600 million below budget owing to lower costs incurred for DGS, NZECO and
monitoring of AMI.
Debtor – Crown has decreased by $2.100 million mainly owing to lower expenditure in June than forecast for
DGS, NZECO and establishment of AMI.

FINANCIAL STATEMENTS 2010/11 – Departmental
Page 68
Statement of Comprehensive Income
for the year ended 30 June 2011
The Statement of Comprehensive Income details the revenue and expenses relating to all outputs (goods and
services) produced by the Treasury during the financial year ended 30 June 2011. Total expenses equals total
departmental output classes expenditure and appropriations in the Statement of Departmental Expenses and
Capital Expenditure Against Appropriations on page 74.
2010 Actual $000 Notes
2011Actual$000
2011 Main Estimates
$000
2011Supp. Estimates
$000
Revenue
63,858 Revenue Crown 2 63,921 73,098 73,972
1,156 Revenue other 3 1,867 1,156 1,627
65,014 65,788 74,254 75,599
Expenses
43,758 Personnel 4 43,975 47,114 43,727
13,552 Operating 5 15,128 18,639 20,545
5,542 Consultants 4,674 6,249 9,261
1,320 Depreciation 7 1,297 1,345 1,352
343 Amortisation 8 261 423 261
499 Capital charge 6 453 484 453
65,014 65,788 74,254 75,599
- Net Surplus and Comprehensive Income - - -
Explanations of significant variances against budget are detailed in the Overview of Departmental Financial Results
on page 67.
Statement of Changes in Taxpayers’ Funds
for the year ended 30 June 2011
The Statement of Changes in Taxpayers’ Funds combines information about the net surplus with other aspects of
the financial performance of the Treasury, to give a measure of comprehensive income.
2010 Actual $000
2011Actual$000
2011 Main Estimates
$000
2011Supp. Estimates
$000
6,948 Balance at 1 July 6,342 6,342 6,342
- Total comprehensive income - - -
- Return of operating surplus to the Crown - - -
- Capital contributions from the Crown - - -
(606) Capital withdrawal repaid to the Crown (600) (600) (600)
6,342 Balance at 30 June 5,742 5,742 5,742
The accompanying accounting policies and notes form part of these financial statements.

FINANCIAL STATEMENTS 2010/11 – Departmental
Page 69
Statement of Financial Position
as at 30 June 2011
The Statement of Financial Position reports the total assets and liabilities of the Treasury, as at 30 June 2011.
Taxpayers’ funds are represented by the difference between the assets and liabilities.
2010 Actual $000 Notes
2011Actual$000
2011 Main Estimates
$000
2011Supp. Estimates
$000
Taxpayers’ Funds
6,342 General funds 5,742 5,742 5,742
6,342 Total Taxpayers’ Funds 5,742 5,742 5,742
Represented by:
Assets
Current Assets
3,493 Cash and bank balances 4,755 3,557 1,988
438 Prepayments 344 468 418
512 Accounts receivable 875 394 549
8,799 Debtor – Crown 6,751 6,696 8,940
13,242 12,725 11,115 11,895
Non-current Assets
3,653 Property, plant and equipment 7 3,328 3,660 3,678
398 Intangible assets 8 203 479 157
4,051 3,531 4,139 3,835
17,293 Total Assets 16,256 15,254 15,730
Less:
Liabilities
Current Liabilities
5,254 Creditors and other payables 9 4,802 4,300 4,463
4,810 Provision for employee entitlements 10 4,903 4,822 4,655
10,064 9,705 9,122 9,118
Non-current Liabilities
887 Provision for employee entitlements 10 809 390 870
887 809 390 870
10,951 Total Liabilities 10,514 9,512 9,988
6,342 Net Assets 5,742 5,742 5,742
The accompanying accounting policies and notes form part of these financial statements.

FINANCIAL STATEMENTS 2010/11 – Departmental
Page 70
Statement of Cash Flows
for the year ended 30 June 2011
The Statement of Cash Flows summarises the cash movements in and out of the Treasury during the financial
year. It takes no account of money owed to the Treasury or owing by the Treasury and therefore differs from the
Statement of Comprehensive Income on page 68.
2010 Actual $000 Notes
2011Actual$000
2011 Main Estimates
$000
2011Supp. Estimates
$000
Cash Flows from Operating Activities
Cash was provided from:
62,757 Supply of outputs to the Crown 65,969 76,464 73,829
1,185 Supply of outputs to third parties 1,886 1,186 1,539
63,942 67,855 77,650 75,368
Cash was disbursed to:
43,754 Personnel 43,923 44,435 43,829
19,056 Operating and consultants 20,743 30,013 30,360
499 Capital charge 453 484 453
63,309 65,119 74,932 74,642
633 Net Cash Flows from Operating Activities 11 2,736 2,718 726
Cash Flows from Investing Activities
Cash was provided from:
107 Sale of property, plant and equipment - - 60
107 - - 60
Cash was disbursed to:
(562) Purchase of property, plant and equipment (1,130) (868) (1,522)
(22) Purchase of intangible assets (66) (524) (20)
(584) (1,196) (1,392) (1,542)
(477) Net Cash Flows from Investing Activities (1,196) (1,392) (1,482)
Cash Flows from Financing Activities
Cash was provided from:
- Capital contribution - - -
149 Goods and services tax (net) 322 (48) (149)
149 322 (48) (149)
Cash was disbursed to:
(606) Capital withdrawal (600) (600) (600)
(457) Net Cash Flows from Financing Activities (278) (648) (749)
(301) Net movement in cash and bank balances 1,262 678 (1,505)
3,794 Cash and Bank Balances at the Beginning of the Year 3,493 2,879 3,493
3,493 Cash and Bank Balances at the End of the Year 4,755 3,557 1,988
The accompanying accounting policies and notes form part of these financial statements.

FINANCIAL STATEMENTS 2010/11 – Departmental
Page 71
Statement of Commitments
as at 30 June 2011
2010 Actual $000
2011Actual$000
Capital Commitments
- Property, plant and equipment -
Non-cancellable operating lease commitments
3,066 Not later than one year 3,066
12,105 Later than one year and not later than five years 12,105
9,079 Later than five years 9,079
24,250 Total Non-cancellable Operating Lease Commitments 24,250
Other non-cancellable commitments
312 Not later than one year -
312 Total Other Non-cancellable Commitments 262
24,562 Total Commitments 24,512
Capital Commitments
There are no capital commitments for this year.
Non-cancellable Operating Lease Commitments
The Treasury has non-cancellable leases on its principal premises at No 1 The Terrace, Wellington until 2017.
These operating lease commitments have been recorded at their gross values in the Statement of Commitments.
Other Non-cancellable Commitments
The Treasury has other operating commitments consisting of computer maintenance contracts, building services
contracts and contracts for service.
The accompanying accounting policies and notes form part of these financial statements.

FINANCIAL STATEMENTS 2010/11 – Departmental
Page 72
Statement of Contingent Liabilities and Contingent Assets
as at 30 June 2011
Unquantifiable Contingent Liabilities
The Treasury has the following unquantifiable contingent liabilities:
Car park licence (Pastoral House) – In relation to the one car park leased by the Treasury at Pastoral House,
the Crown indemnified AMP NZ Office Pastoral Ltd against certain damages or loss caused by our use of that
car park.
Car park licence (No 3 The Terrace) – In relation to the eight car parks leased by the Treasury at No 3
The Terrace, the Crown indemnified AMP NZ Office 1 The Terrace Ltd against certain damages or loss
caused by our use of those car parks.
Deed of Lease (No 1 The Terrace) – In relation to the lease by the Treasury of levels 5–14, the basement and
the sub-basement of the building at No 1 The Terrace, the Crown indemnified AMP NZ Office 1 The Terrace
Ltd against certain damages or loss in relation to our lease of the premises.
Research in Motion Limited – In accordance with a delegation from the Minister of Finance dated 23 May
2005, the Treasury has granted an indemnity to Research in Motion Limited under a licence agreement for
software used in conjunction with Blackberry mobile email devices, covering breach of the licence agreement,
intellectual property rights, claims arising from incorrect use of the software, defamation-type actions and
breach of export restrictions.
Reuters Services Contract – The Treasury has indemnified Reuters Group PLC and its subsidiaries against
any losses arising from the Treasury’s use of certain Reuters services or arising from a breach of the Services
Contract relating to the provision of financial information services. Further, the Treasury indemnified Lipper
(a Reuters company) in respect of third party copyright and intellectual property rights.
The Treasury has indemnified First NZ Capital against any claims arising from third parties as a result of
contract consultancy work undertaken by the company.
Quantifiable Contingent Liabilities and Assets
As at 30 June 2011, the Treasury had no quantifiable departmental contingent assets and liabilities
(30 June 2010: nil).
The accompanying accounting policies and notes form part of these financial statements.
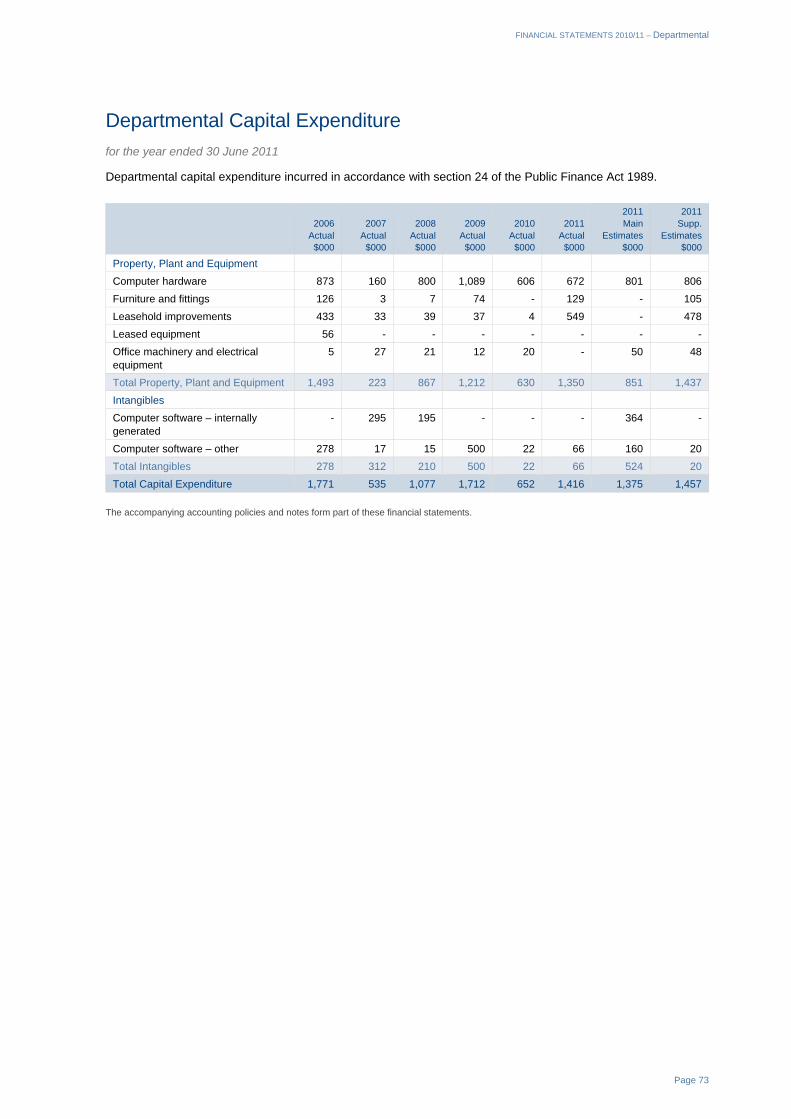
FINANCIAL STATEMENTS 2010/11 – Departmental
Page 73
Departmental Capital Expenditure
for the year ended 30 June 2011
Departmental capital expenditure incurred in accordance with section 24 of the Public Finance Act 1989.
2006Actual$000
2007Actual$000
2008Actual$000
2009Actual$000
2010Actual$000
2011 Actual $000
2011 Main
Estimates $000
2011Supp.
Estimates$000
Property, Plant and Equipment
Computer hardware 873 160 800 1,089 606 672 801 806
Furniture and fittings 126 3 7 74 - 129 - 105
Leasehold improvements 433 33 39 37 4 549 - 478
Leased equipment 56 - - - - - - -
Office machinery and electrical equipment
5 27 21 12 20 - 50 48
Total Property, Plant and Equipment 1,493 223 867 1,212 630 1,350 851 1,437
Intangibles
Computer software – internally generated
- 295 195 - - - 364 -
Computer software – other 278 17 15 500 22 66 160 20
Total Intangibles 278 312 210 500 22 66 524 20
Total Capital Expenditure 1,771 535 1,077 1,712 652 1,416 1,375 1,457
The accompanying accounting policies and notes form part of these financial statements.

FINANCIAL STATEMENTS 2010/11 – Departmental
Page 74
Statement of Departmental Expenses and Capital Expenditure Against Appropriations for the year ended 30 June 2011
The Statement of Expenditure and Appropriations details expenditure against appropriations. Total Departmental
Output Classes Expenditure and Appropriations equals total expenses in the Statement of Comprehensive
Income on page 68.
2010 Actual $000
2011 Actual $000
2011 Main Estimates
$000
2011 Supp. Estimates
$000
Vote Finance: Departmental Output Classes
5,161 Administration of Crown Borrowing6 4,931 5,526 5,231
1,249 Administration of Derivative Transactions6 1,077 1,258 1,092
2,475 Administration of Guarantees and Indemnities Given by the Crown6 3,094 4,440 6,551
373 Administration of Investment of Public Money6 671 320 803
2,520 Crown Guarantee Schemes 1,323 3,717 2,739
- Establishment and Monitoring Crown Investment in AMI 322 - 1,650
- Establishment of the New Zealand Productivity Commission 468 1,200 645
4,675 Infrastructure Advice and Coordination 4,577 4,799 4,824
Macroeconomic Policy Advice and Management (MCOA)
2,788 Economic and Tax Forecasting 2,517 2,691 2,481
2,972 Fiscal Management 2,294 3,290 2,328
3,606 Fiscal Reporting 3,116 3,588 3,082
205 Management of Crown Lending and Crown Bank Accounts 546 540 552
4,268 Policy Advice – F iscal and Macroeconomic 5,203 4,801 5,407
13,839 13,676 14,910 13,850
State Sector and Economic Performance Policy Advice and Management (MCOA)
437 Crown Deposit Guarantee Scheme - - -
141 Crown Wholesale Guarantee Facility - - -
1,384 Management of Liabilities, Claims against the Crown, Contractual Liabilities and Crown Properties
447 1,922 653
2,103 New Zealand Export Office 2,064 3,631 3,255
15,242 Policy Advice – Economic Performance 15,442 14,875 15,845
12,065 Policy Advice – State Sector Performance 13,431 13,843 13,648
31,372 31,384 34,271 33,401
61,664 Total Vote Finance: Departmental Output Classes 61,523 70,441 70,786
Vote Crown Research Institutes: Departmental Output Classes
696 Crown Company Monitoring Advice to the Minister of Science and Innovation and Other Responsible Ministers
595 1,074 626
Vote State-Owned Enterprises: Departmental Output Classes
2,654 Crown Company Monitoring Advice to the Minister for State-Owned Enterprises and Other Responsible Ministers
3,670 2,739 4,187
65,014 Total Departmental Output Classes Expenditure and Appropriation 65,788 74,254 75,599
Capital Expenditure
630 Property, plant and equipment 1,350 851 1,437
22 Intangibles 66 524 20
652 Total Departmental Capital Expenditure6 1,416 1,375 1,457
There was no unappropriated expenditure incurred during 2010/11 (2009/10: nil).
The accompanying accounting policies and notes form part of these financial statements.
6 These expenses or capital expenditures have permanent legislative authority.

FINANCIAL STATEMENTS 2010/11 – Departmental
Page 75
Notes to the Financial Statements
for the year ended 30 June 2011
1 – Statement of Accounting Policies
Reporting entity
The Treasury is a government department (the Department) as defined by section 2 of the Public Finance Act
1989 and is domiciled in New Zealand.
In addition, the Treasury has reported on Crown activities and trust monies which it administers.
The primary objective of the Treasury is to provide services to the public rather than making a financial return.
Accordingly, the Treasury has designated itself as a public benefit entity for the purposes of New Zealand
equivalents to International Financial Reporting Standards (NZ IFRS).
The financial statements of the Treasury are for the year ended 30 June 2011. The financial statements were
authorised for issue by the Secretary to the Treasury on 30 September 2011.
Basis of preparation
These financial statements have been prepared in accordance with, and comply with, NZ IFRS and other financial
reporting standards, as appropriate for public benefit entities.
The financial statements have been prepared on a historical cost basis except for certain financial instruments.
The financial statements are presented in New Zealand dollars and all values are rounded to the nearest
thousand dollars ($000). The functional currency of the Treasury is New Zealand dollars.
There have been no changes in accounting policies during the financial year.
The Treasury has adopted the following revisions to accounting standards during the financial year, which have
had only a presentational or disclosure effect:
NZ IAS 24 Related Party Disclosures (Revised 2009) replaces NZ IAS 24 Related Party Disclosures (Issued
2004). This standard:
i Removes the previous disclosure concessions applied by the Department for arm’s-length transactions
between the Treasury and entities controlled or significantly influenced by the Crown. The effect of the
revised standard is that more information is required to be disclosed about transactions between the
Treasury and entities controlled or significantly influenced by the Crown.
ii Provides clarity on the disclosure of related party transactions with Ministers of the Crown. Further, with
the exception of the Ministers of Finance, State-Owned Enterprises and Crown Research Institutes, the
Treasury will be provided with an exemption from certain disclosure requirements relating to transactions
with other Ministers of the Crown. The clarification results in additional disclosures if there are any related
party transactions with Ministers of the Crown.
iii Clarifies that related party transactions include commitments with related parties.
The Treasury has not adopted the following standards, amendments and interpretations issued but not yet effective:
NZ IFRS 9 Financial Instruments will eventually replace NZ IAS 39 Financial Instruments: Recognition and
Measurement. NZ IAS 39 is being replaced through the following three main phases: Phase 1 Classification
and Measurement, Phase 2 Impairment Methodology and Phase 3 Hedge Accounting. Phase 1 on the
classification and measurement of financial assets has been completed and has been published in the new
financial instrument standard NZ IFRS 9. NZ IFRS 9 uses a single approach to determine whether a financial
asset is measured at amortised cost or fair value, replacing the many different rules in NZ IAS 39. The
approach in NZ IFRS 9 is based on how an entity manages its financial instruments (its business model) and

FINANCIAL STATEMENTS 2010/11 – Departmental
Page 76
the contractual cash flow characteristics of the financial assets. The new standard also requires a single
impairment method to be used, replacing the many different impairment methods in NZ IAS 39.
IFRS 13 replaces the fair value measurement guidance contained in individual IFRSs with a single source of
fair value measurement guidance. It defines fair value, establishes a framework for measuring fair value and
sets out disclosure requirements for fair value measurements. It explains how to measure fair value when it is
required or permitted by other IFRSs. It does not introduce new requirements to measure assets or liabilities
at fair value, nor does it eliminate the practicability exceptions to fair value measurements that currently exist
in certain standards.
Revenue
Revenue is measured at the fair value of consideration received.
Revenue Crown
Revenue earned from the supply of outputs to the Crown is recognised as revenue when earned.
State Sector Retirement Superannuation and KiwiSaver schemes revenue
This revenue included reimbursements by SSC for contributions made by the Treasury to the State Sector
Retirement Superannuation Scheme and the KiwiSaver Scheme, and tax credits for contributions to KiwiSaver
received from IRD.
Sale of publications
Sale of publications is recognised when the product is sold to the customer. The recorded revenue is the gross
amount of the sale.
Capital charge
The capital charge is recognised as an expense in the period to which the charge relates.
Operating lease
The Treasury leased office premises during the year ending 30 June 2011. Substantially all the risks and benefits
of ownership were retained by the lessor, and therefore these leases are classified as operating leases. Operating
lease costs are written off to the Statement of Comprehensive Income over the period of the lease.
Financial instruments
Financial assets and financial liabilities are initially measured at fair value plus transaction costs unless they are
carried at fair value through profit and loss in which case the transaction costs are recognised in the Statement of
Comprehensive Income.
Financial instruments primarily comprise cash and bank balances, accounts receivable and payables. All financial
instruments are recognised in the Statement of Financial Position at cost. Revenues and expenses in relation to
all financial instruments are recognised in the Statement of Comprehensive Income.
The Treasury uses derivative financial instruments to hedge its exposure to FX movements. The Treasury does
not hold or issue derivative financial instruments for trading purposes. The Treasury has not adopted hedge
accounting.
Derivatives are initially recognised at fair value on the date a derivative contract is entered into and are
subsequently re-measured at their fair value at each balance date. Movements in the fair value of derivative
financial instruments are recognised in the surplus or deficit.
The full fair value of a FX derivative is classified as current if the contract is due for settlement within 12 months of
balance date. Otherwise, FX derivatives are classified as non-current.
Cash and cash equivalents
Cash includes cash on hand and funds on deposits with banks.

FINANCIAL STATEMENTS 2010/11 – Departmental
Page 77
Debtors and other receivables
Debtors and other receivables are initially measured at fair value and subsequently measured at amortised cost
using the effective interest rate, less impairment charges.
Impairment of a receivable is established when there is objective evidence that the Treasury will not be able to
collect amounts due according to the original terms of the receivable.
Property, plant and equipment
Property, plant and equipment consists of leasehold improvements, computer hardware, furniture and fittings and
office equipment.
Property, plant and equipment is stated at cost less accumulated depreciation and impairment losses. All
computer equipment assets costing over $1,000 and all other assets costing more than $5,000 are capitalised.
Additions
The cost of an item of property, plant and equipment is recognised as an asset if, and only if, it is probable that
future economic benefits or service potential associated with the item will flow to the Treasury and the cost of the
item can be measured reliably.
Disposals
Gains and losses on disposals are determined by comparing the proceeds with the carrying amount of the asset.
Gains and losses are recorded in the Statement of Comprehensive Income.
Subsequent costs
Costs incurred subsequent to initial acquisition are capitalised only when it is probable that future economic
benefits or service potential associated with the item will flow to the Treasury and the cost of the item can be
measured reliably.
Depreciation
Depreciation of property, plant and equipment is provided on a straight line basis so as to allocate the cost of
property, plant and equipment, less their estimated residual values, over their estimated useful lives. The useful
lives and associated depreciation rates of major classes of assets have been estimated as follows:
Furniture and fittings Shelving 10 years
Other 5 years
Leasehold improvements 12 years
Office machinery and electrical equipment Photocopiers 5 years
Other 5 years
Electronic white boards 3 years
Facsimile machines 3 years
Computer hardware UPS/Air conditioning 5 years
Cabling 5 years
PCs, terminals and printers 3 years
Other hardware 3 years
Leasehold improvements are depreciated over the unexpired period of the lease or the estimated remaining
useful lives of the improvements, whichever is the shorter.
The residual value and useful life of an asset is reviewed, and adjusted if applicable, at each financial year end.
Intangible assets
Software acquisition and development
Acquired computer software licences are capitalised on the basis of the costs incurred to acquire and bring to use
the specific software.

FINANCIAL STATEMENTS 2010/11 – Departmental
Page 78
Costs associated with maintaining computer software are recognised as an expense when incurred. Costs that
are directly associated with the development of software for internal use by the Treasury are recognised as an
intangible asset. Direct costs include the software development and employee costs.
Amortisation
The carrying value of an intangible asset with a finite life is amortised on a straight line basis over its useful life.
Amortisation begins when the asset is available for use and ceases at the date that the asset is derecognised.
The amortisation charge for each period is recognised in the Statement of Comprehensive Income.
The useful lives and associated amortisation rates of major classes of intangible assets have been estimated as
follows:
Computer software Internally generated software 3 years
System software 3 years
Creditors and other payables
Creditors and other payables are measured at cost.
Employee entitlements
Short-term employee entitlements
Employee entitlements that the Treasury expects to be settled within 12 months of balance date are measured
at nominal values based on accrued entitlements at current rates of pay. These include salaries and wages
accrued up to balance date, annual leave earned but not yet taken at balance date, retiring and long service leave
entitlements expected to be settled within 12 months and sick leave.
The Treasury recognises a liability for sick leave to the extent that absences in the coming year are expected to
be greater than the sick leave entitlements earned in the coming year. The amount is calculated based on the
unused sick leave entitlement that can be carried forward at balance date, to the extent that the Treasury
anticipates it will be used by staff to cover those future absences.
The Treasury recognises a liability and an expense for bonuses where it is contractually obliged to pay them, or
where there is a past practice that has created a constructive obligation.
Long-term employee entitlements
Entitlements that are payable beyond 12 months, such as long service leave and retiring leave, have been
calculated on an actuarial basis. The calculations are based on:
likely future entitlements based on years of service, years to entitlement, the likelihood that staff will reach the
point of entitlement and contractual entitlements information, and
the present value of the estimated future cash flows. Discount factors of 2.84% to 6% and salary inflation
factors of 0% to 3.5% were used. The discount rate is based on the weighted average of government bonds
with terms to maturity similar to those of the relevant liabilities. The inflation factor is based on the expected
long-term increase in remuneration for employees.
Superannuation schemes
Defined contribution schemes
Obligations for contributions to the State Sector Retirement Savings Scheme, KiwiSaver and the Government
Superannuation Fund (GSF) are accounted for as defined contribution schemes and are recognised as an
expense in the Statement of Comprehensive Income as incurred.
Provisions
The Treasury recognises a provision for future expenditure of uncertain amount or timing when there is a present
obligation (either legal or constructive) as a result of a past event, it is probable that an outflow of future economic

FINANCIAL STATEMENTS 2010/11 – Departmental
Page 79
benefits will be required to settle the obligation and a reliable estimate can be made of the amount of the
obligation. Provisions are not recognised for future operating losses.
Taxpayers’ funds
Taxpayers’ funds is the Crown’s investment in the Treasury and is measured as the difference between total
assets and total liabilities.
Commitments
Expenses yet to be incurred on non-cancellable contracts that have been entered into on or before balance date
are disclosed as commitments to the extent that there are equally unperformed obligations.
Cancellable commitments that have penalty or exit costs explicit in the agreement on exercising that option to
cancel are included in the Statement of Commitments at the value of that penalty or exit cost.
Goods and services tax
All items in the financial statements, including appropriation statements, are stated exclusive of GST, except for
receivables and payables, which are stated on a GST inclusive basis. Where GST is not recoverable as input tax,
then it is recognised as part of the related asset or expense.
The net amount of GST recoverable from, or payable to, IRD is included as part of receivables or payables in the
Statement of Financial Position.
The net GST paid to, or received from, IRD, including the GST relating to investing and financing activities, is
classified as financing activity cash flow in the Statement of Cash Flows.
Commitments and contingencies are disclosed exclusive of GST.
Income tax
Government departments are exempt from income tax as public authorities. Accordingly, no charge for income
tax has been provided for.
Budget figures
The budget figures are those presented in the Budget Estimates (Main Estimates) and those amended by the
Supplementary Estimates, and associated forecasts included in the Main Estimates and Supplementary
Estimates and reflected in the Statements of Comprehensive Income, Financial Position, Cash Flows and
Changes in Taxpayers’ Funds.
Statement of cost allocation policies
The Statement of Cost Allocation Policies was in place for the 2010/11 year. The details of the policy are outlined
as follows:
Direct costs are costs that can be identified with a single output/result. Where possible, costs are assigned
directly to outputs.
Indirect costs are costs that cannot be identified with an output in an economically feasible manner. They are
incurred for the common benefit of more than one output. Indirect costs are pooled as overhead costs and
allocated to outputs based on the direct staff hours.
Critical accounting estimates and assumptions
In preparing these financial statements the Treasury has made estimates and assumptions concerning the future.
These estimates and judgements may differ from the subsequent actual results. Estimates and judgements are
continually evaluated and are based on historical experience and other factors, including expectations of future
events that are believed to be reasonable under the circumstances. These estimates and judgements do not have
a material impact on the carrying amounts of assets and liabilities.

FINANCIAL STATEMENTS 2010/11 – Departmental
Page 80
2 – Revenue – Crown
This is revenue earned for the supply of outputs to the Crown.
3 – Other Revenue
2010 Actual $000
2011Actual$000
2011 Main Estimates
$000
2011Supp. Estimates
$000
1,032 State Sector Retirement Superannuation and KiwiSaver Schemes
- 1,060 1,141
124 Miscellaneous 1,867 96 486
1,156 Total Other Revenue 1,867 1,156 1,627
4 – Personnel Costs
2010 Actual $000
2011Actual$000
2011 Main Estimates
$000
2011Supp. Estimates
$000
41,024 Salaries and wages 41,147 43,917 40,776
1,499 Employer contributions to defined contribution plans 1,543 1,615 1,469
(327) (Decrease)/Increase in employee entitlements (245) (422) (46)
1,562 Other 1,530 2,004 1,528
43,758 Total Personnel Costs 43,975 47,114 43,727
5 – Operating Expenses
2010 Actual $000
2011Actual$000
2011 Main Estimates
$000
2011Supp. Estimates
$000
3,018 Lease of premises 2,978 3,051 3,039
1,149 Occupancy costs 1,178 1,193 1,191
935 Bank fees, commissions and service charges 1,072 1,087 1,094
314 Fees to KPMG for audit of the Department and NZDMO
377 382 436
785 Fees to KPMG for other services including better administrative and support services (BASS) benchmarking, SOE review, assurance on DGS registry system and project management report
893 600 600
323 Fees to other Auditors for DICE and audit of Crown Financial Statements
506 422 505
1,364 Process management services 1,853 2,621 5,678
1,237 Transport and travel 1,403 1,562 1,695
616 Training and development 738 824 894
1,365 Information and communication costs 1,432 1,426 1,444
638 Data processing costs 728 782 698
821 Office administration costs 823 829 875
17 Furniture/office equipment purchases 65 24 13
969 Other operating costs 1,081 3,817 2,384
13,552 Total Operating Expenses 15,128 18,639 20,545
6 – Capital Charge
The Treasury pays a capital charge to the Crown on its average taxpayers’ funds for the six months ended
30 June and 31 December.
The capital charge rate for the financial year ended 30 June 2011 was 7.5% (30 June 2010: 7.5%).

FINANCIAL STATEMENTS 2010/11 – Departmental
Page 81
7 – Property, Plant and Equipment
The following categories of property, plant and equipment were used by the Treasury:
2010 Actual $000
2011Actual$000
2011 Main Estimates
$000
2011Supp. Estimates
$000
Computer Hardware
Cost
5,238 Opening balance as at 1 July 5,481 5,742 5,481
606 Additions 672 801 806
(363) Disposals (822) (350) (1,142)
5,481 Closing Balance as at 30 June 5,331 6,193 5,145
Accumulated Depreciation
3,922 Opening balance as at 1 July 4,352 4,375 4,351
793 Depreciation 806 775 895
(363) Disposals (763) (350) (1,112)
4,352 Closing Balance as at 30 June 4,395 4,800 4,134
1,129 Carrying Amounts 936 1,393 1,011
Furniture and Fittings
Cost
1,159 Opening balance as at 1 July 1,159 1,184 1,159
- Additions 129 - 105
- Disposals (153) - -
1,159 Closing Balance as at 30 June 1,135 1,184 1,264
Accumulated Depreciation
982 Opening balance as at 1 July 1,082 1,084 1,082
100 Depreciation 39 87 45
- Disposals (54) 0 0
1,082 Closing Balance as at 30 June 1,067 1,171 1,127
77 Carrying Amounts 68 13 137
Leasehold Improvements
Cost
5,134 Opening balance as at 1 July 4,747 5,145 4,747
4 Additions 549 - 478
(391) Disposals (311) - (30)
4,747 Closing Balance as at 30 June 4,985 5,145 5,195
Accumulated Depreciation
2,060 Opening balance as at 1 July 2,342 2,480 2,342
412 Depreciation 437 423 390
(130) Disposals (92) - -
2,342 Closing Balance as at 30 June 2,687 2,903 2,732
2,405 Carrying Amounts 2,298 2,242 2,463
Leased Equipment
Cost
- Opening balance as at 1 July - - -
- Additions - - -
- Disposals - - -
- Closing Balance as at 30 June - - -
Accumulated Depreciation
- Opening balance as at 1 July - - -
- Depreciation - - -
- Disposals - - -
- Closing Balance as at 30 June - - -
- Carrying Amounts - - -

FINANCIAL STATEMENTS 2010/11 – Departmental
Page 82
2010 Actual $000
2011Actual$000
2011 Main Estimates
$000
2011Supp. Estimates
$000
Office Machinery and Electrical Equipment
Cost
647 Opening balance as at 1 July 635 647 635
20 Additions - 50 48
(32) Disposals (9) (200) (30)
635 Closing Balance as at 30 June 626 497 653
Accumulated Depreciation
610 Opening balance as at 1 July 593 624 594
15 Depreciation 15 60 22
(32) Disposals (8) (199) (30)
593 Closing Balance as at 30 June 600 485 586
42 Carrying Amounts 26 12 67
3,653 Total Property, Plant and Equipment 3,328 3,660 3,678
Summary
Cost
12,178 Opening balance as at 1 July 12,022 12,718 12,022
630 Additions 1,350 851 1,437
(786) Disposals (1,295) (550) (1,202)
12,022 Closing Balance as at 30 June 12,077 13,019 12,257
Accumulated Depreciation
7,574 Opening balance as at 1 July 8,369 8,563 8,369
1,320 Depreciation 1,297 1,345 1,352
(525) Disposals (917) (549) (1,142)
8,369 Closing Balance as at 30 June 8,749 9,359 8,579
3,653 Total Property, Plant and Equipment 3,328 3,660 3,678
8 – Intangible Assets
The following categories of intangible assets were used by the Treasury:
2010 Actual $000
2011Actual$000
2011 Main Estimates
$000
2011Supp. Estimates
$000
Computer Software – Internally Generated
Cost
713 Opening balance as at 1 July 713 713 713
- Additions - 364 -
- Disposals - - -
713 Closing Balance as at 30 June 713 1,077 713
Accumulated Amortisation
380 Opening balance as at 1 July 585 598 587
205 Amortisation 116 298 119
- Disposals - - -
585 Closing Balance as at 30 June 701 896 706
128 Carrying Amounts 12 181 7
Computer Software – Acquired
Cost
1,677 Opening balance as at 1 July 1,699 1,679 1,699
22 Additions 66 160 20
- Disposals - (130) -
1,699 Closing Balance as at 30 June 1,765 1,709 1,719

FINANCIAL STATEMENTS 2010/11 – Departmental
Page 83
2010 Actual $000
2011Actual$000
2011 Main Estimates
$000
2011Supp. Estimates
$000
Accumulated Amortisation
1,292 Opening balance as at 1 July 1,429 1,415 1,428
138 Amortisation 145 125 142
(1) Disposals - (129) (1)
1,429 Closing Balance as at 30 June 1,574 1,411 1,569
270 Carrying Amounts 191 298 150
398 Total Intangible Assets 203 479 157
There are no restrictions over the title of the Treasury’s intangible assets. No intangible assets are pledged as
security for liabilities.
9 – Creditors and Other Payables
2010 Actual $000
2011Actual$000
2011 Main Estimates
$000
2011Supp. Estimates
$000
1,044 Creditors 1,158 1,138 1,230
85 Creditors for property, plant and equipment - 17 -
55 Receipts in advance 80 32 12
3,340 Accrued expenses 2,891 2,713 2,641
730 GST payable 673 400 580
5,254 Total Creditors and Other Payables 4,802 4,300 4,463
Creditors and other payables are non-interest-bearing and are normally settled on 30-day terms, therefore the
carrying value of creditors and other payables approximates fair value.
10 – Provision for Employee Entitlements
2010 Actual $000
2011Actual$000
2011 Main Estimates
$000
2011Supp. Estimates
$000
1,219 Retirement, resigning and long service leave 1,106 1,404 1,193
2,811 Annual leave 2,670 2,518 2,766
133 Sick leave 142 87 133
768 Accrued salaries 881 556 768
201 Accrued performance payments 312 122 201
565 Accrued other entitlements 601 525 464
5,697 5,712 5,212 5,525
Represented by:
4,810 Current 4,903 4,822 4,655
887 Non-current (relating to retirement and long service leave)
809 390 870
5,697 Total Provision for Employee Entitlements 5,712 5,212 5,525

FINANCIAL STATEMENTS 2010/11 – Departmental
Page 84
11 – Reconciliation of the Net Surplus to the Net Cash Flows from Operating Activities
This reconciliation discloses the non-cash adjustments applied to the net surplus reported in the Statement of
Comprehensive Income on page 68 to arrive at the net cash flows from operating activities disclosed in the
Statement of Cash Flows on page 70.
2010 Actual $000
2011Actual$000
2011 Main Estimates
$000
2011Supp. Estimates
$000
- Net Surplus from Statement of Comprehensive Income - - -
Non-cash items:
1,663 Depreciation and amortisation 1,558 1,768 1,613
Add/(less) working capital movements:
1 Decrease/(increase) in advances and prepayments 94 84 (20)
115 (Increase)/decrease in accounts receivable (363) (52) 37
(1,101) Decrease/(increase) in Debtor – Crown 2,048 1,263 141
65 Increase/(decrease) in payables, accrued expenses and provisions
(523) (1,002) (1,062)
- Increase/(decrease) in other current liabilities - - -
(264) (Decrease)/increase in non-current liabilities (78) 657 17
Investing activity items:
154 Net loss/(gain) on sale of property, plant and equipment - - -
633 Net Cash Flows from Operating Activities 2,736 2,718 726
12 – Financial Instruments
The Treasury is party to financial instrument arrangements as part of its everyday operations. These financial
instruments include cash and bank balances, advances, accounts receivable, Debtor – Crown and creditors and
other payables.
Credit risk
In the normal course of its business the Treasury is subject to credit risk from debtors other than the Crown.
The Treasury does not require any collateral or security to support financial instruments with financial institutions
with which the Treasury deals, as these entities have high credit ratings. For its other financial instruments the
Treasury does not have significant concentrations of credit risk.
Fair value
The fair value of financial instruments is equivalent to the carrying amount disclosed in the Statement of Financial
Position.
Currency and interest rate risk
The Treasury has no significant exposure to currency exchange loss risk and its financial instruments are not
interest rate sensitive.
Liquidity risk
Liquidity risk is the risk that the Treasury will encounter difficulty raising liquid funds to meet commitments as they
fall due.
In meeting its liquidity requirements, the Treasury closely monitors its forecast cash requirements with expected
cash drawdowns from NZDMO. The Treasury maintains a target level of available cash to meet liquidity
requirements.
All of the Treasury’s financial liabilities (creditors and payables) will be settled in less than six months from the
balance date.

FINANCIAL STATEMENTS 2010/11 – Departmental
Page 85
13 – Related Party Information
The Treasury is a wholly-owned entity of the Crown. The Government significantly influences the roles of the
Treasury as well as being its major source of revenue.
The Treasury enters into transactions with other government departments, Crown entities and SOEs on an arm’s-
length basis. Those transactions that occur within a normal supplier or client relationship on terms and conditions
no more or less favourable than those which it is reasonable to expect the Treasury would have adopted if dealing
with that entity at arm’s length in the same circumstances are not disclosed.
Key management personnel compensation (includes the Chief Executive and his direct reports)
2010 Actual $000
2011Actual$000
2,047 Salaries and other short-term benefits 1,695
- Post-employment benefits 14
1 Other long-term benefits -
- Termination benefits -
- Board member fees 34
2,048 Total Key Management Personnel Compensation 1,743
The 2011 year includes the ELT (Chief Executive and two DCEs) and the Treasury Board fees that were
introduced in November 2010.
The 2010 year includes compensation for Chief Executive and six direct reports (being four Deputy Secretaries,
Acting Executive Director of NIU and Director Crown Company Monitoring Advisory Unit [CCMAU]) until
23 November 2009, when the leadership structure was changed.
Key management personnel compensation excludes the remuneration and other benefits the Ministers of
Finance, State-Owned Enterprises, Infrastructure and Science and Innovation receive. The Ministers’
remuneration and other benefits are not received only for their role as a member of key management personnel of
the Ministry. The Ministers’ remuneration and other benefits are set by the Remuneration Authority under the Civil
List Act 1979 and are paid under PLA, and not paid by the Treasury.
14 – Events Subsequent to Balance Date
There were no events subsequent to balance date that required adjustment to the financial statements or
disclosure (2010: none).
15 – Capital Management
The Treasury’s capital is its equity (or taxpayers’ funds). Equity is represented by net assets. The Treasury
manages its expenses, revenues, assets, liabilities and general financial dealings prudently. The Treasury’s
equity is largely managed as a by-product of managing income, expenses, assets, liabilities and compliance with
the government budget processes and with Treasury Instructions.
The objective of managing the Treasury’s equity is to ensure the Treasury effectively achieves its goals and
objectives for which it has been established, whilst remaining a going concern.
16 – Explanation of Major Variances Against Budget
Refer to Departmental Overview.

Page 86
Supplementary Financial Schedules – Non-departmental for the year ended 30 June 2011
Overview 87
Statement of Accounting Policies 95
Schedule of Expenses 96
Statement of Expenditure and Appropriations 97
Statement of Unappropriated Expenditure 99
Schedule of Earthquake Expenditure under s25 Public Finance Act 1989 99
Schedule of Revenue 100
Schedule of Capital Receipts 101
Schedule of Assets 101
Schedule of Liabilities 102
Schedule of Commitments 103
Schedule of Contingent Liabilities 104
Statement of Trust Monies 105
The following supplementary financial schedules record the expenses, revenue and capital
receipts, assets and liabilities that the Department manages on behalf of the Crown. These
supplementary financial schedules include NZDMO balances reported on pages 106 to 117.
The Department administered $5,017 million of expenses, $4,081 million of revenue, $176 million of
capital receipts, $942 million of capital expenditure, $31,605 million of assets and $90,504 million of
liabilities on behalf of the Crown for the year ended 30 June 2011.
The financial information reported in these schedules is consolidated into the Financial Statements
of the Government, and therefore readers of these schedules should also refer to the Financial
Statements of the Government for the year ended 30 June 2011.

FINANCIAL STATEMENTS 2010/11 – Non-departmental
Page 87
Overview
This overview provides details of significant expenditure and revenue variances between actual results in 2009/10
and 2010/11 and between 2010/11 actual results and 2010/11 Supplementary Estimates.
Asian Development Bank – Increase in Capital
The 5th General Capital Increase was paid to the Asian Development Bank in 2010/11 (page 98). The payment
was $65.125 million compared to the forecast of $71 million owing to changes in exchange rates and a discount
offered.
AMI Insurance Limited (AMI)
On 7 April 2011 the Government provided a financial support package for AMI to give policyholders certainty and
to ensure an orderly rebuild of Christchurch after the earthquakes.
The Government has entered into a five-year arrangement to subscribe for $500 million in convertible called, but
unpaid preference shares in AMI. On the fifth anniversary of the agreement date (7 April 2016) the Government
committed to make the payment of $500 million if the amount is not paid earlier or if AMI has not terminated the
arrangement by that date.
Payment of up to $500 million for the convertible preference shares may happen at any time prior to the fifth
anniversary, either on request from the company or at the option of the Crown. The Crown can require paid-up
preference shares to be converted to ordinary shares if a “trigger event” occurs, or if the Crown decides that it is
necessary or expedient in the public interest to convert the shares. The Crown obtains the power to determine
the board of directors either if a “trigger event” occurs, or if a payment is made on the convertible preference
shares. “Trigger events” include non-compliance with the Crown support arrangement, an insolvency event and a
material adverse event.
For the purposes of financial reporting, AMI has been consolidated into the Financial Statements of the
Government on the basis that the Government has the capacity to direct the operating and governing policies of
AMI (through its option to make a partial payment and take control of the Board) and is directly impacted by the
risks, or benefits from, AMI’s operations.
The fair value of AMI on acquisition was $159 million. This estimate makes use of a valuation of the AMI
business performed by Deutsche Bank Limited and completed in August 2011, and also takes into account the
costs associated with the Canterbury earthquakes.
2010 Actual $000
Summary of AMI Disclosures in the Supplementary Schedules – Non-departmental
2011Actual$000
2011 Main Estimates
$000
2011Supp. Estimates
$000
- Statement of Expenditure and Appropriations – Impairment of Crown’s interest in AMI (page 97)
335,000 - 427,400
- Schedule of Expenses – AMI discounted payable (page 96)
2,000 - -
- Statement of Expenditure and Appropriations – AMI Equity Injection (page 98)
500,000 - 500,000
Statement of Revenue – Other Fees (page 100) 15,000 - 15,000
- Schedule of Liabilities – Payable AMI (page 102) 496,000 - 427,400
As the Crown’s support package of $500 million is not expected to be paid immediately, a discount is made to
adjust for the time value of money.
A commitment fee of $15 million was paid to the Crown by AMI for this facility.

FINANCIAL STATEMENTS 2010/11 – Non-departmental
Page 88
Crown Guarantee Schemes: Crown Deposit Guarantee Scheme and Crown Wholesale Guarantee Facility
The Government provides two guarantee schemes in relation to financial institution deposits: the DGS and the WGF.
Information on the Government’s exposure as a result of these schemes, the management of these exposures and
the impact of these schemes is detailed below.
Crown Deposit Guarantee Scheme
The Government operates an opt-in Retail Deposit Guarantee Scheme for financial institution deposits. On
12 October 2010 the original retail deposit guarantee scheme expired. The Extended Retail Deposit Guarantee
Scheme commenced on 12 October 2010, immediately upon expiry of the previous scheme and will expire on
31 December 2011. The extended scheme has tightened eligibility criteria and additional limitations on coverage
of the Scheme. The Crown guarantee is limited to those entities participating in the extended scheme and
excludes deposits accepted by participating entities without the benefit of the guarantee.
As at 30 June 2011, four financial institutions were actively participating in the extended scheme with deposits
totalling $1.500 billion covered by the guarantee. This is the maximum exposure and does not include any offset
resulting from the recovery of the remaining assets of these financial institutions in the event the guarantee is
called upon. The Crown assesses the risk of default by the entities participating in the extended scheme to be
unlikely and, therefore, as at 30 June 2011 no provision is considered necessary in relation to the amount
guaranteed by the Crown under the extended guarantee.
As at 30 June 2011, nine entities guaranteed under DGS had been placed into receivership; eight of these entities
were guaranteed under the original DGS and one under the extended guarantee scheme. The Crown has met its
obligations to depositors under the original scheme, the residual obligations under the extended scheme are
recognised as liabilities and its rights of recovery from the receivers are recognised as assets (see note on
receivables).
2010 Actual $000
Summary of Crown Deposit Guarantee Scheme Disclosures in the Supplementary Schedules – Non-departmental
2011Actual$000
2011 Mains $000
2011Supps
$000
- Schedule of Expenses – Grossing up7 of Deposit Guarantee Payments (page 96)
(1,140,500) (19,000) (1,204,500)
- Schedule of Expenses – Receivable Revaluation (page 96) 236,436 - -
Statement of Expenditure and Appropriations – Payments in Respect of Guarantees and Indemnities (page 97)
43,357 Expense for entities in default 1,187,761 - 1,549,116
(68,000) Movement in provision for undefaulted entities (2,000) 19,000 (2,000)
Total Reconciles to Retail Deposit Guarantee Scheme Expenses in Financial Statements of the Government for the Year Ended 30 June 2011
281,697 - 342,616
- Statement of Expenditure and Appropriations – Additional Payments to Facilitate Full Payout under the Crown Retail Deposit Guarantee Scheme (page 97)
150,000 - 150,000
- Statement of Expenditure and Appropriations – Loan in Respect to Guarantees and Indemnities for the Crown Retail Deposit Guarantee Scheme (page 98)
175,000 - 175,000
New appropriations
To reduce the fiscal costs under DGS, two new appropriations were approved during 2010/11 in relation to the
default of SCF. A secured loan of $175 million was made to the receivers to remove prior charge holders (see
page 98). This has been repaid in full and appears in the Schedule of Capital Receipts (see page 101). Interest
was also received and is included under Interest from Investments (see page 100). The second new
appropriation of $150 million was required to facilitate a full payout to SCF, in order to reduce interest payable
(see page 97).
7 The provision for payment of Deposit Guarantee Scheme guarantees was initially reported, prior to default of an entity, as a ‘net’ amount (payables less expected
recoveries). On default of an entity, the provision is ‘grossed up’ into the payable and the receivable outstanding.

FINANCIAL STATEMENTS 2010/11 – Non-departmental
Page 89
87,041 Schedule of Revenue – Crown Deposit Guarantee Scheme (Fees) (page 100)
38,075 32,064 35,498
13,740 Schedule of Revenue – Other Current Revenue (Recoveries) (page 100) 141,238 110,000 95,507
13,258 Schedule of Assets – Accounts Receivable (Expected Recoveries) (page 101)
739,394 320,000 723,102
- Schedule of Assets – Accounts Receivable (DGS Fees) (page 101) 827 - 43
24,529 Schedule of Liabilities – Deferred Revenue (Crown Deposit Guarantee Fees) (page 102)
- - -
43,062 Schedule of Liabilities – Guarantee Scheme Payables (Gross) – Defaulted Entities (page 102)
37,314 - 36,320
748,000 Schedule of Liabilities – Guarantee Scheme Provision (Net) – Undefaulted Entities (page 102)
- - -
As a consequence of payments made to depositors of failed finance companies under DGS, the Crown has inherited
the beneficial interest in the proceeds that can be recovered from the sale of the secured assets of the
receiverships. The reported receivables represent the receivers’ best prudent estimates of likely recoveries from the
receiverships. However, the eventual return to the Crown is dependent upon the value that can be realised from
these entities’ assets and the timing of receipts. A range of outcomes for eventual recoveries is possible. The Crown
monitors the receiverships to obtain assurance that optimal proceeds are realised as soon as possible.
Analysis of recoveries from receiverships
30 June 2011$m
30 June 2010 $m
30 June 2009$m
Opening balance of recoveries expected from receiverships 13 34 -
Recoveries expected from entities defaulting during the year 1,104 8 34
Revision of expected recoveries (236) 7 -
Payments received from receivers (142) (35) -
Closing balance of recoveries expected from receiverships 739 13 34
Total Payments to Depositors under the Guarantee Scheme 1,897 43 70
Less change in opening and closing payables 5 (28) (14)
Cash payments made 1,902 15 56
Crown Wholesale Guarantee Facility
In addition to DGS, the Government operated an opt-in WFGF from November 2008 to April 2010. As at 30 June
2011, 24 guarantee certificates remain in place, and the value of wholesale securities guaranteed was $9 billion.
No provision is made for losses under this scheme as the probability of loss is considered remote.
2010 Actual $000
Summary of Crown Wholesale Guarantee Facility Disclosures in the Supplementary Schedules – Non-departmental
2011Actual$000
2011 Main Estimates
$000
2011Supp. Estimates
$000
76,455 Schedule of Revenue – Crown Wholesale Guarantee Facility (Fees) (page 100)
80,356 79,851 80,356
206,298 Schedule of Liabilities – Deferred Revenue – Crown Wholesale Guarantee Facility (Fees) (page 102)
125,941 128,047 125,905
Dividends
Total SOE dividends received this year have increased by $82 million from 2009/10 (page 100). Particular items
to note are that Meridian paid a large special dividend as a result of the sale of Tekapo A and B to Genesis as
required by the Electricity Industry Act 2010 reforms, and that Mighty River Power’s dividend declined compared
to the large special dividend it paid in the previous year.
Dividends from Crown entities (TVNZ) increased by $3 million (page 100) in 2010/11, owing to increased profits
for the 2009/10 financial year.
Other dividends received from the Crown’s share in Airports is $300,000 (page 100) less than those received in
2010/11 primarily owing to the change in the economic climate.

FINANCIAL STATEMENTS 2010/11 – Non-departmental
Page 90
Earthquake Commission
The Government approved two new appropriations during 2010/11 as a result of the Canterbury earthquake in
September 2010 (page 97).
Land remediation
Approval was given for $141.100 million for remediation to residential land affected by the September 2010
earthquake over and above the standard required by EQC. EQC negotiated Memoranda of Understanding
(MOUs) with both Waimakariri District Council (WDC) and Christchurch City Council. Both MOUs were close to
being signed before the 22 February 2011 event. However, as Christchurch sustained substantial land damage in
the 22 February 2011 event, it was determined that Christchurch land remediation should be de-coupled from this
process to allow further time to understand the impacts on Christchurch. The MOU signed by WDC is estimated
to cost $37.200 million and this has been accrued. A further $4.200 million was also expensed under this
appropriation for the Spencerville pilot project.
Land insurance payments
Land insurance payments to owners of damaged land in the Canterbury region where the cost of the land
remediation is greater than the insured value of the land was estimated to be $5 million. Full settlement has been
made to the six worst affected properties for $2.368 million.
New Zealand Export Credit Office
The purpose of NZECO is to assist New Zealand companies to increase exports by providing government-
guaranteed export credit insurance products to New Zealand exporters. NZECO is particularly focused on
providing guarantees in the sectors and countries for which the private sector does not currently provide cover.
2010 Actual $000
Summary of NZECO Disclosures in the Supplementary Schedules – Non-departmental
2011Actual$000
2011 Main Estimates
$000
2011Supp. Estimates
$000
3,044 Schedule of Revenue – NZECO (page 100) 4,386 9,367 4,802
4,993 Schedule of Liabilities – Insurance premiums received in advance (NZECO) (page 102)
12,517 19,354 13,189
Revenue has increased by 44% in 2010/11 as a result of new export deals guaranteed during the year, which
have resulted in an associated increase in contingent liabilities as noted on page 104.
Goodwill
Goodwill in relation to Air New Zealand ($258 million) has been tested for impairment at June 2011 based on a
value in use discounted cash flow valuation. Cash flow forecasts were prepared for five years using the
Air New Zealand Board reviewed business plans. Key assumptions include exchange rates, jet fuel costs,
passenger load factors and route yields. These assumptions have been based on historical data and current
market information. The cash flow forecasts are particularly sensitive to fluctuations in fuel prices and exchange
rates and are extrapolated using an average nominal growth rate of approximately 1.5%. The cash flow
projections are discounted using post-tax discount rate scenarios of 10% to 10.5%. The valuation confirmed that
there was no impairment required to the goodwill asset.
Government Superannuation Fund Unfunded Liabilities
The Government operates a defined benefit superannuation plan for qualifying employees who are members of
GSF. The members’ entitlements are defined in the Government Superannuation Fund Act 1956. Members make
regular payments to GSF and in return, on retirement, receive a defined level of income. GSF is closed to
employees who were not members at 1 July 1992.

FINANCIAL STATEMENTS 2010/11 – Non-departmental
Page 91
The GSF obligation has been calculated by the Government Actuary as at 30 June 2011. A Projected Unit Credit
Method, based on balance-date membership data, is used for the valuation. This method requires the benefits
payable from GSF in respect of past service to be estimated and then discounted back to the valuation date.
GSF unfunded liability as at 30 June 2011 was $10,152 million (page 102), an increase of $215 million compared
with 30 June 2010.
This is primarily owing to:
an actuarial loss recognised in the year (page 96) of $574 million owing to movements in the economic
assumptions used in calculating the liability. This has been partially offset by:
- the current service costs and interest expenses (appropriated under Other Expenses Incurred by the
Crown – GSF Unfunded Liability) (page 97) of $636 million, and
- contributions made by the Crown against the liability (including taxation) during 2010/11 of $993 million.
The Government expects to make a contribution of $679 million to GSF in the year ended 30 June 2012.
In addition to its obligations to past and present employees, because GSF is liable to income tax under section
HJ 1 of the Income Tax Act 2004, the Crown will be required to make additional contributions equivalent to the tax
on future investment income. Additional detailed note disclosures required under New Zealand Generally
Accepted Accounting Practice (NZ GAAP) for this liability are included in the Financial Statements of the
Government.
Government Superannuation Fund Authority – Crown’s Share of Expenses
These are expenses of the Government Superannuation Fund Authority relating to the management and
administration of GSF (page 97). The Crown’s share for 2010/11 was $26 million, $4 million higher than that in
2009/10 and $1 million higher than forecast. The investment manager expenses are dependent upon the portfolio
valuations. For some active investment managers, their performance, and accordingly their fees, exceeded the
forecast. The fund portfolio grew during the year much more than originally forecasted.
Government Superannuation Fund – Employers’ Contribution
The employers’ contribution to GSF has increased from $36 million in 2009/10 to $54 million in 2010/11 as a
result of the Government’s decision to increase the employer contribution rates in certain GSF schemes from
1 July 2010 (page 100).
GST Compensation for GSF and National Provident Fund (NPF) Recipients
This appropriation was approved and applied to compensation for recipients of GSF and NPF owing to an
increase in the GST rate in October 2010 (page 97).
Hawkes Bay Airport
Hawkes Bay Airport Ltd was corporatised on 1 July 2009. The transaction was fiscally neutral with $7.400 million
appearing in the Schedule of Capital Receipts (page 101) and in the Schedule of Expenditure and Appropriations
– Capital Expenditure (page 98). The Crown has a shareholding of 50% in Hawkes Bay Airport.
International Financial Institutions (IFI)
Contributions of $183 million were made to the IMF lending programme in 2010/11 (page 98) against a forecast of
$148 million. Payments have been made to several countries during 2010/11 reflecting the response by IMF to
the current international financial crisis. No contributions were made in the 2009/10 year.

FINANCIAL STATEMENTS 2010/11 – Non-departmental
Page 92
Landcorp Protected Land Agreement
The capital expenditure in relation to the Landcorp Protected Land Agreement for 2010/11 was $17 million
(page 98) against a Supplementary Estimate budget of $27 million. The final payment of $17.347 million for the
Crown’s purchase of redeemable preference shares for land transferred under the Protected Land Agreement
was made this year. The Supplementary Estimates budget included a provision of $9.700 million for the
accumulated capital costs and losses which will be owing to Landcorp when the land held under the Protected
Land Agreement is transferred. Timing of transfers is difficult to ascertain and this budget will be carried forward
to meet commitments when they arise.
National Provident Fund Defined Benefit Plan (DBP) (Annuitants) Scheme Provision
The Government has guaranteed superannuation schemes managed by NPF. As at 30 June 2011, NPF’s DBP
Scheme was in a net deficit position of $981 million (2010: $1,003 million) (page 102), represented by a gross
estimated pension obligation of $1,020 million (2010: $1,053 million) with net investment assets valued at
$39 million (2010: $50 million). No additional provision was required in the year for other pension schemes
managed by NPF under the Government’s guarantee under section 60 of the National Provident Fund
Restructuring Act 1990.
The decrease of $22 million in the Crown’s liability for the NPF DBP(A) Scheme under Crown guarantee as at
30 June 2011 was primarily owing to:
payments made against the liability by the Crown during the year of $75 million.
Offset by:
the actuarial loss recognised for the year (page 96) of $16 million resulting from movements in the economic
assumptions used in calculating the provision, and
the unwinding of the interest expense (appropriated under Other Expenses Incurred by the Crown – NPF
Schemes – Liability under Crown Guarantee) (page 97) of $37 million.
Additional detailed note disclosures required under NZ GAAP are included in the Financial Statements of the
Government for this liability.
National Provident Fund – Crown Liability for Scheme Deficiency
The Crown is liable for the deficiency in the accounts of NPF schemes established pursuant to section 38A(6) of the
National Provident Fund Act 1950, authorised by section 72 of the National Provident Fund Restructuring Act 1990.
There was a call against this appropriation for 2010/11 of $16,000 to 31 March 2011 and a provision of $1.500 million
for the three months to 30 June 2011 (page 97). The scheme deficiency paid for the year to 31 March 2010 was
$28,000. The reduction in the 2010/11 claim was a result of improvements in investment markets over 2011.
New Zealand House – London
2010 Actual $000
Summary of New Zealand House – London Disclosures in the Supplementary Schedules – Non-departmental
2011Actual$000
2011 Main Estimates
$000
2011Supp. Estimates
$000
10,913 Schedule of Revenue – Rentals from Crown Overseas Properties (page 100)
9,598 14,500 10,600
412 Statement of Expenditure and Appropriations – Non-Dept Output Class – Management of NZ House, London (page 97)
291 1,000 600
12,947 Statement of Expenditure and Appropriations – Other Expenses Incurred by the Crown – Crown Overseas Properties (page 97)
11,814 16,200 14,700
Operational costs associated with New Zealand House (including depreciation) are included in Other Expenses
Incurred by the Crown – Crown Overseas Properties (page 97). Expenses and revenue are less than in 2009/10

FINANCIAL STATEMENTS 2010/11 – Non-departmental
Page 93
and less than those forecasted at Supplementary Estimates. This reduction is primarily owing to the change in the
exchange rate between the two years and reduced occupancy rates in 2010/11.
New Zealand Productivity Commission
The New Zealand Productivity Commission was established on 1 April 2011 with an equity injection of $500,000
provided by the Crown (page 98). The operational expenses funded for the first quarter of its operations were
$1.210 million (page 97). A surplus existed at 30 June 2011 and this was returned to the Crown in August 2011.
New Zealand Superannuation Fund
No contributions were made to the New Zealand Superannuation Fund in 2010/11 as a result of the
Government’s decision. A one-off contribution of $250 million was last made on 1 July 2009 (page 98).
New Zealand Debt Management Office
Interest from investments and other income
NZDMO’s interest from investments increased by $71 million primarily owing to changes in investment activity
levels of New Zealand dollar and United States dollar market bonds (page 100).
NZDMO’s other income increased by $12 million primarily owing to increased interest income on lending to DHBs
and Housing New Zealand Limited (page 100).
Other expenses
Other Expenses – NZDMO largely comprises net interest on NZDMO derivatives (excluding fair value and
FX gains/losses) where net revenue has decreased $19 million owing to both interest rate changes and
transactional activity (page 100).
Borrowing costs
Borrowing costs have increased by $755 million primarily owing to significantly increased volumes of
New Zealand Government stock issued to third parties (page 97).
Other Current Revenue
Other current revenue has increased by $126 million in 2010/11. This primarily relates to an increase in the
recovery of government guarantee payments during 2010/11. Funds received from receivers of defaulted entities
were $42 million above the Supplementary Estimates forecast as a result of timing difference only (page 100).
Other Fees
Other fees of $17 million were received in 2010/11. This relates to a commitment fee of $15 million paid by AMI to
the Crown in relation to the Crown’s purchase of equity in AMI. Other fees received were in relation to the Crown
providing an Uncalled Capital facility to New Zealand Post (page 100).
Reserve Bank Surplus
Dividends received by the Crown from RBNZ decreased from $675 million in 2009/10 to $290 million in 2010/11
(page 100). The principal reason for the reduction was that the dividend received during 2009/10 was abnormally
high as a result of RBNZ:
reducing its unhedged FX position, and consequently FX gains of $434 million were realised with $390 million
distributed, and
a voluntary payment of $45 million, comprising retained earnings which were surplus to the Bank’s capital
requirements.

FINANCIAL STATEMENTS 2010/11 – Non-departmental
Page 94
Rugby New Zealand 2011 Limited
There is no expected change in the forecast loss for Rugby New Zealand 2011 Limited in 2010/11. The 2009/10
results recognised an increase in the Crown’s 67% share of forecast loss compared to the 2005/06 estimate
provided when the company was established (page 97).
Taitokerau Forests Limited
Loans to Taitokerau Forests Limited of $800,000 were advanced as per the Loan Agreement during 2010/11. No
impairment of the loans was necessary in 2010/11 as the valuation of the Taitokerau Forests Limited assets was
higher than the valuation of the loan liability to the Crown as at 30 June 2011 (page 98).

FINANCIAL STATEMENTS 2010/11 – Non-departmental
Page 95
Statement of Accounting Policies
for the year ended 30 June 2011
Reporting Entity
These non-departmental schedules and statements present financial information on public funds managed by the
Treasury on behalf of the Crown.
These non-departmental balances are consolidated into the Financial Statements of the Government for the year
ended 30 June 2011. For a full understanding of the Crown’s financial position, results of operations and cash
flows for the year, refer to the Financial Statements of the Government.
Basis of Preparation
The non-departmental schedules and statements have been prepared in accordance with the accounting policies
of the Financial Statements of the Government, Treasury Instructions and Treasury Circulars.
Measurement and recognition rules applied in the preparation of these non-departmental supplementary financial
schedules are consistent with NZ GAAP and Crown accounting policies and are detailed in the Financial
Statements of the Government.
The financial information reported in these schedules is consolidated into the Financial Statements of the
Government, and therefore readers of these schedules should also refer to the Financial Statements of the
Government for the year ended 30 June 2011.
Significant Accounting Policies
Foreign exchange
FX transactions are translated into New Zealand dollars using the exchange rates prevailing at the dates of the
transactions. FX gains and losses resulting from the settlement of such transactions and from the translation at
year-end exchange rates of monetary assets and liabilities denominated in foreign currencies are recognised in
the schedule of non-departmental income or expenses.
Goods and services tax
All items in the financial statements, including appropriation statements, are stated exclusive of GST. In
accordance with Treasury Instructions, GST is returned on revenue received on behalf of the Crown, where
applicable. However, an input tax deduction is not claimed on non-departmental expenditure. Instead, the amount
of GST applicable to non-departmental expenditure is recognised as a separate expense and eliminated against
GST revenue on consolidation of the Financial Statements of the Government.
Commitments
Future expenses and liabilities to be incurred on non-cancellable contracts that have been entered into at balance
date are disclosed as commitments to the extent that they are equally unperformed obligations.

FINANCIAL STATEMENTS 2010/11 – Non-departmental
Page 96
Schedule of Expenses
for the year ended 30 June 2011
The Schedule of Expenses summarises expenses that the Department administers on behalf of the Crown.
Details of non-departmental expenditure and appropriations are provided on pages 97 and 98.
2010 Actual
$000
2011 Actual
$000
2011 Main Estimates
$000
2011Supp. Estimates
$000
1,090 Non-departmental output classes 2,022 2,403 2,519
2,284,955 Borrowing expenses 3,040,302 3,058,421 3,031,738
718,053 Other expenses incurred by the Crown 2,436,635 796,357 3,083,955
Remeasurements:
- AMI discounted payable 2,000 - (72,600)
1,231,222 Change in GSF unfunded liability – actuarial (gains)/losses
574,000 - (287,246)
95,000 Change in NPF DBP(A) Scheme provision under Crown Guarantee – actuarial (gains)/losses
16,000 - -
591 Change in Rugby World Cup provision 816 - -
- Change in DGS receivable revaluation 236,436 - -
- Deposit Guarantee Scheme – full payout option (150,000) - (150,000)
- Earthquake Commission s25 emergency payments 86 - -
14,037 FX losses/(gains) incurred by the Treasury 13,254 - 8,403
- Grossing up of deposit guarantee payments (1,140,500) (19,000) (1,204,500)
- GST compensation for NPF and GSF recipients (9,918) - -
- National Provident Fund s72 (3,700) - (3,700)
(2,362) Taitokerau Forests loan impairment - (800) (1,500)
4,342,586 5,017,433 3,837,381 4,407,069
Vote Crown Research Institutes
7 Other expenses incurred by the Crown 3 - 755
7 3 - 755
4,342,593 Total Non-departmental Expenses 5,017,436 3,837,381 4,407,824
The Statement of Accounting Policies is an integral part of these supplementary financial schedules.
For a full understanding of the Crown’s financial position and the result of its operations for the year, refer to the consolidated Financial Statements of the Government for the year ended 30 June 2011.

FINANCIAL STATEMENTS 2010/11 – Non-departmental
Page 97
Statement of Expenditure and Appropriations
for the year ended 30 June 2011
The Statement of Expenditure and Appropriations details expenditure and capital payments incurred against
appropriations. The Department administers these appropriations on behalf of the Crown.
2010 Actual $000
2011 Actual$000
2011 Main Estimates
$000
2011Supp. Estimates
$000
Vote Finance
Non-departmental Output Classes
412 Management of New Zealand House, London 291 1,000 600
125 Management of Crown’s Obligations for Geothermal Wells 106 151 211
354 Guardians of New Zealand Superannuation 294 516 350
104 2025 Productivity Taskforce 121 81 148
- New Zealand Productivity Commission – Inquiries into Productivity-related Matters
1,160 655 1,160
- New Zealand Productivity Commission – Research into and Promotion of Productivity-related Matters
50 - 50
95 Regulatory Responsibility Taskforce - - -
1,090 2,022 2,403 2,519
Borrowing Expenses
2,284,955 Debt Servicing8 3,040,302 3,058,421 3,031,738
2,284,955 3,040,302 3,058,421 3,031,738
Other Expenses Incurred by the Crown
- Additional Payments to Facilitate Full Payout under the Crown Retail Deposit Guarantee Scheme
150,000 - 150,000
12,947 Crown Overseas Properties 11,814 16,200 14,700
67 Crown Residual Liabilities 1 230 230
- Earthquake Commission Land Insurance Payments 2,368 - 5,000
- Earthquake Commission Land Remediation 41,354 - 141,100
- Geothermal Liabilities - 500 500
4 Government Superannuation Appeals Board - 50 50
22,160 Government Superannuation Fund Authority – Crown’s Share of Expenses
8
25,823 23,760 24,760
633,160 Government Superannuation Fund Unfunded Liability8 635,659 684,117 629,128
- GST Compensation for Government Superannuation Fund and National Provident Fund Recipients
9,918 10,000 10,000
2,362 Impairment of Loans to Taitokerau Forests Limited - 800 1,500
- Impairment of Crown’s Interest in AMI 335,000 - 500,000
2,100 Maui Gas Contracts - - -
38,000 National Provident Fund Schemes – Liability under Crown Guarantee
8
37,000 60,000 58,700
(3,272) National Provident Fund – Crown Liability for Scheme Deficiency
8
1,516 - 16
136 Payments in Respect of NZECO Guarantees and Indemnities8 186 - 186
(24,643) Payments in Respect of Guarantees and Indemnities8 1,185,761 - 1,547,116
4,000 Rugby New Zealand 2011 Limited - - -
31 Taitokerau Forests Limited Grant 86 200 469
1 Unclaimed Money8 149 250 250
- Unclaimed Trust Money8 - 250 250
687,053 2,436,635 796,357 3,083,955
8 These expenses or capital expenditures have permanent legislative authority.

FINANCIAL STATEMENTS 2010/11 – Non-departmental
Page 98
2010 Actual $000
2011 Actual$000
2011 Main Estimates
$000
2011Supp. Estimates
$000
Capital Expenditure
- AMI Equity Injection 500,000 - 500,000
- Asian Development Bank 65,125 71,000 65,125
7,400 Hawkes Bay Airport Equity Injection - - -
- International Financial Institutions 183,255 - 148,000
16,056 Landcorp Protected Land Agreement 17,347 17,347 27,047
- Loan in Respect to Guarantees and Indemnities for the Crown Retail Deposit Guarantee Scheme
175,000 - 175,000
- New Zealand Productivity Commission Capital 500 500 500
250,000 New Zealand Superannuation Fund – Contributions - - -
30,000 Public Trust Capital Injection - - -
2,400 Taitokerau Forests Limited 800 800 1,500
305,856 942,027 89,647 917,172
3,278,954 Total Vote Finance 6,420,986 3,946,828 7,035,384
Vote Crown Research Institutes
Other Expenses Incurred by the Crown
7 CRI Residual Liabilities 3 - 755
7 Total Vote Crown Research Institutes 3 - 755
3,278,961 Total Non-departmental Expenditure and Appropriations 6,420,989 3,946,828 7,036,139
The Statement of Accounting Policies is an integral part of these supplementary financial schedules.
For a full understanding of the Crown’s financial position and the result of its operations for the year, refer to the consolidated Financial Statements of the Government for the year ended 30 June 2011.

FINANCIAL STATEMENTS 2010/11 – Non-departmental
Page 99
Statement of Unappropriated Expenditure
for the year ended 30 June 2011
There was one item of unappropriated expenditure in Vote Finance in the year ended 30 June 2011.
Appropriation Type Appropriation Name
Appropriated Expenditure in
2010/11$000
Total Expenditure, Expenses or
Liabilities Incurred$000
Unapproved Unappropriated
Expenses $000
Appropriated Expenditure in
2011/12$000
Non-departmental capital expenditure
Dispute Resolution Services Limited Equity Transfer
- 1,335 1,335 2,050
Funding for the transfer of equity of Dispute Resolution Services Limited from ACC to the Crown was
appropriated in the 2011/12 financial year; however, the actual transfer took place during 2010/11 resulting in
unappropriated expenditure.
The Statement of Accounting Policies is an integral part of these supplementary financial schedules.
For a full understanding of the Crown’s financial position and the result of its operations for the year, refer to the consolidated Financial Statements of the Government for the year ended 30 June 2011.
Schedule of Earthquake Expenditure under s25 Public Finance Act 1989
for the year ended 30 June 2011
2011 $000
Approval Given$000
Emergency works 80 5,000
Rapid inspections 6 500
Earthquake Expenditure 86 5,500
Earthquake expenditure was incurred for emergency works and rapid inspections for uninsured households in the
Canterbury region by EQC.
The Statement of Accounting Policies is an integral part of these supplementary financial schedules.
For a full understanding of the Crown’s financial position and the result of its operations for the year, refer to the consolidated Financial Statements of the Government for the year ended 30 June 2011.

FINANCIAL STATEMENTS 2010/11 – Non-departmental
Page 100
Schedule of Revenue
for the year ended 30 June 2011
2010 Actual
$000
2011Actual
$000
2011 Main Estimates
$000
2011Supp. Estimates
$000
Vote Finance 1,695,213 Capital charge 1,650,255 1,742,135 1,650,368
87,041 Crown Deposit Guarantee Scheme 38,075 32,064 35,498
76,455 Crown Wholesale Guarantee Facility 80,356 79,851 80,356
1,471 Dividends from Crown entities 4,870 4,521 4,871
813,448 Dividends from SOEs 895,784 466,289 888,758
2,634 Dividends – other 2,269 2,351 2,269
(377) Derivative gains/(losses) 271 - -
10,000 Earthquake Commission guarantee fee 10,000 10,000 10,000
36,395 Employers’ superannuation contributions 53,725 40,000 55,000
3,044 NZECO 4,386 9,367 4,802
246,463 Interest from investments 317,701 537,887 347,159
565 Interest income – other 7,389 1,359 5,661
163,972 Other income – NZDMO 175,910 190,754 176,180
381,955 Other expenses – NZDMO (incl. gains on derivatives) 363,302 258,421 346,738
1,763 Maui Gas contracts - - -
10,913 Rentals from Crown overseas properties 9,598 14,500 10,600
675,000 Reserve Bank of New Zealand notional surplus 290,000 - 290,000
79,000 Fair value gains/(losses) incurred by NZDMO 3,000 (82,000) (20,000)
3,000 FX gains/(losses) incurred by NZDMO 11,000 - 5,000
16,020 Other current revenue 142,330 324,670 311,158
- Other fees 17,312 - 15,000
1,327 Unclaimed money 2,381 500 1,724
4,305,302 4,079,914 3,632,669 4,221,142
Vote Crown Research Institutes
1,934 Dividends from CRIs 817 - 817
1,934 817 - 817
4,307,236 Total Non-departmental Revenue 4,080,731 3,632,669 4,221,959
Comparatives have been restated to reflect the change in accounting policy and to report the current year’s gain or loss in the correct statement.
The Statement of Accounting Policies is an integral part of these supplementary financial schedules.
For a full understanding of the Crown’s financial position and the result of its operations for the year, refer to the consolidated Financial Statements of the Government for the year ended 30 June 2011.

FINANCIAL STATEMENTS 2010/11 – Non-departmental
Page 101
Schedule of Capital Receipts
for the year ended 30 June 2011
The Schedule of Capital Receipts details non-departmental capital receipts that the Department administers on
behalf of the Crown.
2010 Actual
$000
2011Actual
$000
2011 Main Estimates
$000
2011Supp. Estimates
$000
Vote Finance
7,400 Hawkes Bay Airport Corporatisation - - -
15,267 Loan repayments from other parties 176,205 746 177,362
22,667 Total Capital Receipts 176,205 746 177,362
The Statement of Accounting Policies is an integral part of these supplementary financial schedules.
For a full understanding of the Crown’s financial position and the result of its operations for the year, refer to the consolidated Financial Statements of the Government for the year ended 30 June 2011.
Schedule of Assets
as at 30 June 2011
The Schedule of Assets summarises the assets that the Department administers on behalf of the Crown.
2010 Actual
$000
2011 Actual
$000
2011 Main Estimates
$000
2011Supp. Estimates
$000
Current Assets
8,157,851 Cash and cash equivalents 14,586,064 5,910,388 7,826,295
15,767 Accounts receivable 1,277,442 320,861 724,342
422,422 Advances 1,359,756 481,769 647,769
80 Derivatives 351 457 80
4,246,000 Marketable securities, deposits and derivatives in gain 6,105,000 5,671,000 6,322,000
78 Capital charge receivable - - -
42,156 Prepayments 52,505 - 42,864
12,884,354 Total Current Assets 23,381,118 12,384,475 15,563,350
Non-current Assets
6,276,056 Advances 5,583,069 6,443,000 6,499,756
257,950 Intangibles and goodwill 257,950 257,950 257,950
4,124,000 Marketable securities, deposits and derivatives in gain 1,909,000 5,978,000 7,190,000
161,927 Other share investments 225,310 175,964 237,793
178,307 Other equity-accounted investments 169,647 180,073 178,307
96,697 Property, plant and equipment 79,264 87,939 85,276
11,094,937 Total Non-current Assets 8,224,240 13,122,926 14,449,082
23,979,291 Total Non-departmental Assets 31,605,358 25,507,401 30,012,432
In addition, the Department monitors 15 SOEs and 14 Crown entities. The investment in these entities is
consolidated in the Crown financial statements on a line-by-line basis. The investment in these entities is not
included in this schedule.
The Statement of Accounting Policies is an integral part of these supplementary financial schedules.
For a full understanding of the Crown’s financial position and the result of its operations for the year, refer to the consolidated Financial Statements of the Government for the year ended 30 June 2011.

FINANCIAL STATEMENTS 2010/11 – Non-departmental
Page 102
Schedule of Liabilities
as at 30 June 2011
The Schedule of Liabilities summarises the liabilities that the Department administers on behalf of the Crown.
2010 Actual
$000
2011 Actual
$000
2011 Main Estimates
$000
2011Supp. Estimates
Voted $000
Current Liabilities
3,463,000 Crown balances with Westpac 3,823,000 2,741,000 3,232,000
81,450 Payables and accrued expenses 683,516 9,849 601,461
10,140,000 Borrowings 19,784,000 20,931,000 18,274,000
150,485 Deferred revenue – current 45,584 98,047 45,941
648,704 Government Superannuation Fund unfunded liability 679,000 695,000 678,479
791,062 Guarantee scheme payable/provision 37,314 - 36,320
2,627 Insurance premiums received in advance 3,320 1,688 2,627
3,728 NPF Crown liability for scheme deficiency s72 1,500 - -
15,158 Rugby World Cup provision 6,437 21,799 15,158
15,296,214 Total Current Liabilities 25,063,671 24,498,383 22,885,986
Non-current Liabilities
42,385,000 Borrowings 54,896,000 46,231,000 53,936,000
80,357 Deferred revenue 80,357 30,000 80,000
2,366 Insurance premiums received in advance 9,197 17,666 10,562
9,287,946 Government Superannuation Fund unfunded liability 9,473,892 8,121,656 8,589,380
1,003,503 NPF DBP(A) Scheme unfunded provision 981,303 883,203 964,503
52,759,172 Total Non-current Liabilities 65,440,749 55,283,525 63,580,445
68,055,386 Total Non-departmental Liabilities 90,504,420 79,781,908 86,466,431
The Statement of Accounting Policies is an integral part of these supplementary financial schedules.
For a full understanding of the Crown’s financial position and the result of its operations for the year, refer to the consolidated Financial Statements of the Government for the year ended 30 June 2011.

FINANCIAL STATEMENTS 2010/11 – Non-departmental
Page 103
Schedule of Commitments
as at 30 June 2011
This schedule sets out the level of commitment made against out-year appropriations and funding baselines for
non-departmental expenditure. The Department, on behalf of the Crown, has entered into non-cancellable
contracts in relation to New Zealand House in London.
2010 $000
2011 $000
Operating Commitments
By type:
1,314 Non-cancellable property lease 1,141
130 Other non-cancellable operating commitments 465
1,444 1,606
By term:
165 Less than one year 147
35 One to two years 147
104 Two to five years 326
1,140 More than five years 986
1,444 Total Commitments 1,606
The Statement of Accounting Policies is an integral part of these supplementary financial schedules.
For a full understanding of the Crown’s financial position and the result of its operations for the year, refer to the consolidated Financial Statements of the Government for the year ended 30 June 2011.

FINANCIAL STATEMENTS 2010/11 – Non-departmental
Page 104
Schedule of Contingent Liabilities
as at 30 June 2011
2010 $000
2011$000
Quantifiable Contingent Liabilities
17,060 Guarantees and indemnities 16,146
2,451,362 Uncalled capital 4,172,545
132 Legal proceedings and disputes 132
1,662,369 Other contingent liabilities 1,385,342
4,130,923 Total Contingent Liabilities 5,574,165
Contingent liabilities are costs that the Crown will have to face if a particular event occurs. Typically, contingent
liabilities consist of guarantees and indemnities, uncalled capital, legal disputes and claims. The contingent
liabilities managed by the Department on behalf of the Crown are a mixture of operating and balance sheet risks
and they vary greatly in magnitude and likelihood of realisation. In general, if a contingent liability were realised it
would have a negative impact on the operating balance, net Crown debt and net worth. However, in the case of
contingencies for uncalled capital, the negative impact would be restricted to net Crown debt.
Where contingent liabilities have arisen as a consequence of legal action being taken against the Crown, the
amount included is the amount claimed and thus the maximum potential cost. It does not represent either an
admission that the claim is valid or an estimation of the possible amount of any award against the Crown.
The majority of the quantified contingent liabilities shown above arise from the uncalled capital element of the
Crown’s investments in the Asian Development Bank and the World Bank, and promissory notes issued in favour
of IMF.
Significant decreases in contingent liabilities are owing to exchange rate fluctuations.
The Crown’s exposure to the DGS and WFGF is detailed in the Supplementary Financial Schedules – Overview
on pages 88 and 89.
Unquantifiable Contingent Liabilities
The Treasury also administers a number of contingent liabilities that cannot be quantified. These arise primarily from
institutional guarantees and indemnities. Readers are referred to the Financial Statements of the Government for
further details.
Contingent Assets
The Department, on behalf of the Crown, has no contingent assets (2010: nil).
The Statement of Accounting Policies is an integral part of these supplementary financial schedules.
For a full understanding of the Crown’s financial position and the result of its operations for the year, refer to the consolidated Financial Statements of the Government for the year ended 30 June 2011.

FINANCIAL STATEMENTS 2010/11 – Non-departmental
Page 105
Statement of Trust Monies
as at 30 June 2011
2010 $000
2011$000
1,719 Balance at the beginning of the year 1,768
276 Contribution 354
(292) Distribution (156)
65 Interest earned on trust money 71
1,768 Balance at the End of the Year 2,037
The Trust Account is established pursuant to section 67 of the Public Finance Act 1989, for the purposes of
depositing money paid to the Crown under section 77 of the Trustee Act 1956.
The source of funds is principally estates of deceased persons where the beneficiaries cannot be traced. Funds
are retained in the Trust Account for six years, and are then transferred to the Crown as unclaimed money.
Details of funds held in the Trust Account are gazetted annually.
The Statement of Accounting Policies is an integral part of these supplementary financial schedules.
For a full understanding of the Crown’s financial position and the result of its operations for the year, refer to the consolidated Financial Statements of the Government for the year ended 30 June 2011.

Page 106
New Zealand Debt Management Office
Schedule of Assets and Liabilities 107
Schedule of Revenues and Expenses 108
Risk Management 110
Funding Risk 110
Liquidity Risk 111
Credit Risk 112
Operational Risk 115
Market Risk 115
NZDMO is part of the New Zealand Treasury and is responsible for the efficient management of the
Crown’s debt and associated assets within an appropriate risk management framework. NZDMO’s
strategic objective is to maximise the long‐term economic return on the Crown’s financial assets
and debt in the context of the Government’s fiscal strategy, particularly its aversion to risk.
NZDMO’s major responsibilities involve:
financing the Crown’s borrowing requirement and managing a portfolio of assets and liabilities
disbursing cash to departments
advancing funds to government entities in accordance with government policy, and
providing capital markets services and derivative transactions for departments and Crown entities.
NZDMO managed $29.926 billion of assets, $76.154 billion of liabilities, $501 million of revenue
and $2.677 billion of expenses on behalf of the Crown for the year ended 30 June 2011. Further
information on NZDMO’s performance in managing the Crown’s sovereign‐issued debt and related
financial assets is provided on pages 35 to 39.
To facilitate a greater level of transparency regarding NZDMO operations, the following
supplementary financial schedules report the activity of NZDMO as though it were a stand‐alone
entity. Cross‐holdings or other financial positions between NZDMO and other government entities
are not eliminated. The financial information reported in these schedules is consolidated into the
Crown financial statements.

FINANCIAL STATEMENTS 2010/11 – NZDMO
Page 107
Schedule of Assets and Liabilities
as at 30 June 2011
2010 Carrying Value
$m
2010 Fair Value
$m
2011 Carrying Value
$m
2011Fair Value
$m
Assets
Cash, cash equivalents and receivables
6,988 6,988 Crown settlement account 13,060 13,060
16 16 Crown trust account 38 38
1,133 1,133 Foreign cash and cash equivalents 1,461 1,461
- - Debtors and receivables 536 536
Advances
2,727 2,727 RBNZ 2,438 2,438
1,494 1,494 Crown Health Financing Agency 1,750 1,750
1,835 1,835 Housing New Zealand 1,859 1,859
448 448 New Zealand Railways Corporation 505 505
- - New Zealand Transport Agency 110 110
- - Other Crown 4 4
86 88 Non-Crown 151 153
Financial assets
4,097 4,097 Marketable securities 3,242 3,242
467 467 External deposits 115 115
1,607 1,607 Derivatives in gain 2,489 2,489
2,199 2,199 IMF financial assets 2,168 2,168
23,097 23,099 Total Assets 29,926 29,928
Liabilities
Overdrafts and payables
3,463 3,463 Crown disbursement account9 3,823 3,823
66 66 Creditors and payables 127 127
Financial liabilities
7,823 7,825 Treasury bills – market 7,209 7,215
174 174 Treasury bills – non-market 50 50
30,705 31,727 Government bonds – market10 50,755 52,544
6,580 6,897 Government bonds – non-market 6,363 6,699
1,588 1,800 Inflation-indexed bonds – market 1,633 1,900
476 538 Inflation-indexed bonds – non-market 491 568
309 309 Kiwi bonds 261 262
- - Euro-commercial paper 180 180
809 809 Foreign currency debt 587 587
981 981 Collateral 1,417 1,417
860 860 Derivatives in loss 1,312 1,312
307 307 Departmental deposits 210 210
1,820 1,820 IMF allocation 1,648 1,648
92 92 Immigration investor policy bonds 87 87
1 2 Other 1 1
56,054 57,670 Total Liabilities 76,154 78,630
(32,957) (34,571) Net Assets/(Liabilities) (46,228) (48,702)
9 At the end of each banking day, the net balance of all departmental and Crown bank accounts held at Westpac is swept between the Westpac Crown Disbursement
account and the RBNZ Crown Settlement account. This daily sweep ensures that there is no end-of-day net exposures between the Crown and Westpac. Therefore, the Disbursement account balance effectively offsets the balances of departmental and Crown accounts at Westpac.
10 Government bonds – market includes $395 million of infrastructure bonds at June 2011 (June 2010: $395 million).

FINANCIAL STATEMENTS 2010/11 – NZDMO
Page 108
Schedule of Revenues and Expenses
for the year ended 30 June 2011
2010 $m
2011 $m
Revenue
Cash, cash equivalents and receivables
125 Crown settlement account 157
- Crown trust account 1
2 Foreign cash and cash equivalents 2
Advances
(2) RBNZ -
84 Crown Health Financing Agency 91
51 Housing New Zealand 56
19 New Zealand Railways Corporation 21
- New Zealand Transport Agency -
- Other Crown -
7 Non-Crown 11
Financial assets
113 Marketable securities 144
8 External deposits 10
4 IMF financial assets 8
411 Total Revenue 501
Expenses
224 Treasury bills – market 236
4 Treasury bills – non-market 2
1,439 Government bonds – market 2,151
392 Government bonds – non-market 402
107 Inflation-indexed bonds – market 119
32 Inflation-indexed bonds – non-market 37
14 Kiwi bonds 9
- Euro-commercial paper -
41 Foreign currency debt 36
1 Collateral 2
(381) Derivatives11 (363)
4 IMF allocation 7
3 Immigration investor policy bonds 5
23 Other 34
1,903 Total Expenses 2,677
3 Net FX gains/(losses) 11
79 Net Fair value (FV) gains/(losses)12 3
(1,410) Net Revenue/(Expenses) (2,162)
11 Net derivatives include interest (receipts and payments only) on all derivatives, both derivatives in gain and derivatives in loss. Net derivatives may be a net revenue or
net expense result for a reporting period. The net result is reported under expenses for reasons of consistency. FX gains/losses on derivatives are reported as part of the overall Net FX gains/(losses) line while fair value gains/losses are part of the overall Net FV gains/(losses) line.
12 Net FV gains/(losses) on all instruments measured at fair value are separately reported as part of the overall Net FV gains/(losses) line.

FINANCIAL STATEMENTS 2010/11 – NZDMO
Page 109
Classes and Categories of Financial Instruments
NZDMO designates its financial assets and liabilities under the following IFRS categories:
2010
Amortised Cost
13
$m
2010 Fair Value
Through Profit
or Loss14
$m
2010
Available for Sale
$m
2010
Carrying Value
$m
2011Amortised
Cost13
$m
2011 Fair Value
Through Profit
or Loss14
$m
2011Available
for Sale$m
2011Carrying
Value$m
Financial Assets
Cash, cash equivalents and receivables
6,988 - - 6,988 Crown settlement account 13,060 - - 13,060
16 - - 16 Crown trust account 38 - - 38
13 1,120 - 1,133 Foreign cash and cash equivalents 106 1,355 - 1,461
- - - - Debtors and receivables 536 - - 536
- Advances
- 2,727 - 2,727 RBNZ - 2,438 - 2,438
- 1,494 - 1,494 Crown Health Financing Agency - 1,750 - 1,750
858 977 - 1,835 Housing New Zealand 703 1,156 - 1,859
- 448 - 448 New Zealand Railways Corporation - 505 - 505
- - - - New Zealand Transport Agency - 110 - 110
- - - - Other Crown - 4 - 4
15 31 40 86 Non-Crown 31 75 45 151
Financial assets
- 4,097 - 4,097 Marketable securities - 3,242 - 3,242
- 467 - 467 External deposits - 115 - 115
- 1,607 - 1,607 Derivatives in gain - 2,489 - 2,489
2,199 - - 2,199 IMF financial assets 2,168 - - 2,168
10,089 12,968 40 23,097 Total Financial Assets by Designation 16,642 13,239 45 29,926
Financial Liabilities
3,463 - - 3,463 Crown disbursement account 3,823 - - 3,823
66 - - 66 Creditors and payables 127 - - 127
6,821 1,002 - 7,823 Treasury bills – market 6,605 604 - 7,209
174 - - 174 Treasury bills – non-market 50 - - 50
26,814 3,891 - 30,705 Government bonds – market 46,743 4,012 - 50,755
6,580 - - 6,580 Government bonds – non-market 6,363 - - 6,363
1,588 - - 1,588 Inflation-indexed bonds – market 1,633 - - 1,633
476 - - 476 Inflation-indexed bonds – non-market 491 - - 491
309 - - 309 Kiwi bonds 261 - - 261
- - - - Euro-commercial paper - 180 - 180
- 809 - 809 Foreign currency debt - 587 - 587
- 981 - 981 Collateral - 1,417 - 1,417
- 860 - 860 Derivatives in loss - 1,312 - 1,312
- 307 - 307 Departmental deposits - 210 - 210
1,820 - - 1,820 IMF allocation 1,648 - - 1,648
92 - - 92 Immigration investor policy bonds 87 - - 87
1 - - 1 Other 1 - - 1
48,204 7,850 - 56,054 Total Financial Liabilities by Designation 67,832 8,322 - 76,154
13 NZDMO’s amortised cost assets are designated as loans and receivables.
14 All “fair value through profit or loss” instruments are designated by management as FVPL, with the exception of derivatives which are classified as “held for trading”
and are automatically included in the FVPL category of financial instruments.

FINANCIAL STATEMENTS 2010/11 – NZDMO
Page 110
Derivatives
As at 30 June 2011, the value of derivatives was as follows:
2010 Carrying
Value in Gain
$m
2010 Carrying
Value in Loss
$m
2010 Net
Carrying Value
$m
2010 Notional
Value $m
2011Carrying Value in
Gain$m
2011 Carrying
Value in Loss
$m
2011 Net
Carrying Value
$m
2011Notional
Value$m
Derivatives
570 (530) 40 25,736 FX contracts 894 (764) 130 19,622
- - - - FX options - - - 23
395 (218) 177 7,686 Cross-currency swaps 1,015 (444) 571 9,218
642 (112) 530 8,481 Interest-rate swaps 580 (104) 476 7,811
1,607 (860) 747 41,903 Total Derivatives 2,489 (1,312) 1,177 36,674
Risk Management
NZDMO operates within a risk management framework that is approved by the Minister of Finance. The
framework specifies NZDMO’s policies for managing market risk, credit risk, liquidity risk, funding risk and
operational risk.
The risk management framework is subject to continuous improvement as information technology and analytical
techniques advance. NZDMO’s risk management framework and practices are subject to regular audit review,
and are also reviewed periodically by the Treasury’s Risk and Audit Committee, by the Controller and Auditor-
General and by external experts commissioned by NZDMO.
The risk management framework sets out the governance framework for NZDMO’s operations, including the
legislative provisions governing NZDMO’s borrowing and investment activities. Internal operations are governed
by an established risk culture, body of policies, ethical guidelines, defined responsibilities and formal delegations,
segregated duties and reporting and performance management requirements.
Funding Risk
Funding risk refers to the inability to raise funds at an acceptable price and tenor.
NZDMO’s funding policy is designed to spread refinancing risk over time, and to diversify funding sources by
maintaining access to a range of funding markets. To manage interest-rate risk and lower the cost of the
New Zealand-dollar portfolio, NZDMO maintains a mix of fixed‐rate and floating‐rate debt, and uses interest-rate
swaps. To manage refinancing risk, NZDMO places a limit on the percentage of outstanding debt that may be
composed of short-term funding (ie, maturity less than one year at issuance). Inflation‐indexed debt makes up a
component of the portfolio and is issued when it is costeffective to do so.
Bonds are issued into benchmark lines to improve liquidity in the domestic bond market and, consequently,
reduce the Crown’s cost of borrowing. NZDMO limits the tranche size of each maturity of marketable bonds
issued in New Zealand dollars. Benchmark size trades off between improving liquidity and managing refinancing
risk, and it is reviewed regularly.

FINANCIAL STATEMENTS 2010/11 – NZDMO
Page 111
Liquidity Risk
Liquidity risk is defined as not being able to meet expected and unexpected cash flow needs. The objective of
NZDMO’s liquidity policy is to ensure that NZDMO can meet all cash obligations as they fall due. To manage
liquidity risk in its foreign currency portfolios, liquid assets are required to be held in each currency to cover cash
flow obligations over one-day, two-day and six-week intervals. For New Zealand-dollar liquidity risk, NZDMO has
established cash management arrangements with the RBNZ to support effective management of overall Crown
cash flows.
Liquidity Management
As at 30 June 2011
Contractual Cash Flows
$m
0-12 Months
$m 1-2 Years
$m 2-5 Years
$m 5-10 Years
$m > 10 Years
$m
Overdrafts and Payables
Crown disbursement account 3,823 3,823 - - - -
Creditors and payables 127 127 - - - -
Financial Liabilities
Treasury bills – market 7,276 7,276 - - - -
Treasury bills – non-market 50 50 - - - -
Government bonds – market 64,577 10,323 11,825 13,019 28,962 448
Government bonds – non-market 7,965 1,510 1,739 1,765 2,951 -
Inflation-indexed bonds – market 2,112 78 78 1,956 - -
Inflation-indexed bonds – non-market 645 24 24 597 - -
Kiwi bonds 267 204 61 2 - -
Euro-commercial paper 181 181 - - - -
Foreign currency debt 599 306 168 90 35 -
Collateral 1,417 1,417 - - - -
Departmental deposits 210 210 - - - -
IMF allocation 1,648 1,648 - - - -
Immigration investor policy bonds 89 34 45 10 - -
Other - - - - - -
Total Non-derivative Liabilities 90,986 27,211 13,940 17,439 31,948 448
Derivative Inflows15
FX contracts 19,622 19,549 67 6 - -
Cross-currency swaps 10,614 1,193 1,146 6,361 1,914 -
Interest-rate swaps 1,784 387 328 729 340 -
Total Derivative Inflows 32,020 21,129 1,541 7,096 2,254 -
Derivative Outflows15
FX contracts 19,484 19,413 65 6 - -
Cross-currency swaps 9,691 980 951 6,008 1,752 -
Interest-rate swaps 1,275 189 198 575 313 -
Total Derivative Outflows 30,450 20,582 1,214 6,589 2,065 -
15 Derivative flows include both derivatives in gain and derivatives in loss.

FINANCIAL STATEMENTS 2010/11 – NZDMO
Page 112
Credit Risk
Credit risk is defined as the risk of loss in portfolio value owing to the downgrade or default of an institution or
security issuer.
NZDMO is exposed to credit loss when the issuer of a debt instrument defaults on interest or principal payments,
or when a counterparty in a transaction such as a swap agreement defaults on an obligation. Credit-related loss in
the value of the portfolio also occurs when the market value of a debt instrument falls owing to an increase in
credit risk.
Financial instruments that subject NZDMO to credit risk include bank balances, advances, investments, interest-
rate swaps, currency swaps, FX options and FX forward contracts.
NZDMO manages credit risk through the credit screening of counterparties, use of credit exposure limits and
counterparty collateral obligations. Credit exposures are maintained only with highly rated institutions for which
the probability of default is low. To diversify credit exposure, NZDMO limits its exposure to any one institution. The
creditworthiness of counterparties is monitored daily. Credit risk is further controlled by incorporating credit
support annexes into master swap agreements with swap and FX counterparties.
NZDMO lending to government entities, and to entities to which NZDMO is exposed as a matter of government
policy, is not managed under the credit policy.
2010 $m Credit Risk Management
2011$m
23,097 Total NZDMO Financial Assets 29,926
Less:
13,928 Crown-related balances 20,114
9,169 Total Credit Exposure for Financial Assets 9,812

FINANCIAL STATEMENTS 2010/11 – NZDMO
Page 113
Concentration of Credit Exposure as at 30 June 2011
By Credit Rating AAA
$m AA$m
A$m
Other $m
Non-rated $m
CreditExposure
$m
Foreign cash and cash equivalents 1,356 104 1 - - 1,461
Debtors and receivables - 504 32 - - 536
Advances to non-Crown - - - - 151 151
Marketable securities 1,294 1,835 - - - 3,129
External deposits - 115 - - - 115
Derivatives in gain - 1,633 588 - 31 2,252
IMF financial assets - - - - 2,168 2,168
Total Credit Exposure by Credit Rating 2,650 4,191 621 - 2,350 9,812
By Industry
Sovereign Issuers
$m
Supra-National
$m
NZ Banking Sector
$m
Foreign Banking
Sector $m
Other $m
Credit Exposure
$m
Foreign cash and cash equivalents 1,356 - 88 17 - 1,461
Debtors and receivables - - 493 43 - 536
Advances to non-Crown - - - - 151 151
Marketable securities 481 489 1,188 686 285 3,129
External deposits - - 115 - - 115
Derivatives in gain - - 1,427 692 133 2,252
IMF financial assets - 2,168 - - - 2,168
Total Credit Exposure by Industry 1,837 2,657 3,311 1,438 569 9,812
By Geographical Area
United States of America
$m Europe
$m Japan
$m Australia
$m NZ$m
Supra- National
$m Other
$m
Credit Exposure
$m
Foreign cash and cash equivalents
1,356 - - 1 89 - 15 1,461
Debtors and receivables - 11 - 32 493 - - 536
Advances to non-Crown - - - - 151 - - 151
Marketable securities 56 743 202 451 1,188 489 - 3,129
External deposits - - - - 115 - - 115
Derivatives in gain 280 436 - 78 1,458 - - 2,252
IMF financial assets - - - - - 2,168 - 2,168
Total Credit Exposure by Geographical Area
1,692 1,190 202 562 3,494 2,657 15 9,812

FINANCIAL STATEMENTS 2010/11 – NZDMO
Page 114
Concentration of Credit Exposure as at 30 June 2010
By Credit Rating AAA
$m AA$m
A$m
Other $m
Non-rated $m
CreditExposure
$m
Foreign cash and cash equivalents 1,056 75 2 - - 1,133
Debtors and receivables - - - - - -
Advances to non-Crown - - - - 86 86
Marketable securities 1,995 1,993 - - - 3,988
External deposits - 424 43 - - 467
Derivatives in gain - 841 431 - 24 1,296
IMF financial assets - - - - 2,199 2,199
Total Credit Exposure by Credit Rating 3,051 3,333 476 - 2,309 9,169
By Industry
Sovereign Issuers
$m
Supra-National
$m
NZ Banking Sector
$m
Foreign Banking
Sector $m
Other $m
Credit Exposure
$m
Foreign cash and cash equivalents 1,120 - 11 2 - 1,133
Debtors and receivables - - - - - -
Advances to non-Crown - - - - 86 86
Marketable securities 779 422 1,118 763 906 3,988
External deposits - - 424 43 - 467
Derivatives in gain - - 626 532 138 1,296
IMF financial assets - 2,199 - - - 2,199
Total Credit Exposure by Industry 1,899 2,621 2,179 1,340 1,130 9,169
By Geographical Area
United States of America
$m Europe
$m Japan
$m Australia
$m NZ$m
Supra- National
$m Other
$m
Credit Exposure
$m
Foreign cash and cash equivalents
1,056 - 64 2 11 - - 1,133
Debtors and receivables - - - - - - - -
Advances to non-Crown - - - - 86 - - 86
Marketable securities 120 1,354 337 434 1,216 422 105 3,988
External deposits - - - 43 424 - - 467
Derivatives in gain 248 354 - 44 650 - - 1,296
IMF financial assets - - - - - 2,199 - 2,199
Total Credit Exposure by Geographical Area
1,424 1,708 401 523 2,387 2,621 105 9,169

FINANCIAL STATEMENTS 2010/11 – NZDMO
Page 115
Operational Risk
Operational risk is defined as the risk of loss resulting from inadequate or failed internal processes, people and
systems or from external events. Risk events include resource failures or constraints, control and security
breaches or failures, transaction errors, compliance breaches, the breakdown of key relationships and disasters.
NZDMO’s generic objectives in respect of operational risk are to:
mitigate financial and reputational loss arising from operational failure by effectively managing operational
risks where it is cost effective to do so, and
establish a culture of continuous improvement of operational policies and practices.
Operational risks in NZDMO are managed in a number of ways. Controls include general Treasury policies,
NZDMO-specific policies, reporting and performance management requirements, delegations and systems
access restrictions. They are supported by close communications and regular management meetings that, in turn,
reinforce a strong team ethic. Independent experts provide additional support in managing operational risk.
Market Risk
Market risk is defined as the impact of changes in interest rates or exchange rates on portfolio value.
The objective of NZDMO’s market risk management is to limit this risk within parameters that allow for the
achievement of its other financial objectives, including earning a satisfactory rate of return on liquid assets and
adding value in its foreign currency execution activities.
NZDMO has implemented an asset and liability matching (ALM) policy to manage risk within its portfolios. The
policy aims to minimise the currency and interest-rate risks to NZDMO’s revenues and balance sheet, by
matching the characteristics of its assets to those of its liabilities, where practicable. The range of instruments
used to minimise exposure to market risk includes debt instruments, financial assets, FX contracts, currency
swaps, interest-rate swaps and futures contracts.
NZDMO is exposed to market risk when assets and liabilities are imperfectly matched. The risk is managed
through the use of VaR limits and stop-loss limits.
The VaR limit is expressed over daily, monthly and annual time horizons at 95% confidence level and reflects the
risk tolerance of the Government in respect of NZDMO’s activities. NZDMO uses back‐testing to evaluate the
performance of the VaR model, and stress‐testing is carried out to understand how extreme or unusual events
would impact on the portfolio. Monthly, quarterly and annual stop‐loss limits are in place to protect NZDMO from
further losses once actual losses reach a certain point.
Because NZDMO’s liabilities exceed its assets, it also incurs market risk associated with the net volume
of outstanding government debt. Fluctuations in the net market value of New Zealand-dollar debt as a result of
interest-rate movements are not actively managed, and unmatched debt is accounted for on an amortised
cost basis.

FINANCIAL STATEMENTS 2010/11 – NZDMO
Page 116
Foreign Currency Risk Management
NZDMO’s net foreign currency debt position is kept close to zero, as indicated in the schedules below.
As at 30 June 2011 NZD
$m USD
$m Yen$m
Euro$m
AUD $m
Other $m
Carrying Value
$m
Cash, Cash Equivalents and Receivables
Crown settlement account 13,060 - - - - - 13,060
Crown trust account 38 - - - - - 38
Foreign cash and cash equivalents - 1,356 20 13 39 33 1,461
Debtors and receivables 536 - - - - - 536
Advances
RBNZ - 1,447 - 991 - - 2,438
Crown Health Financing Agency 1,750 - - - - - 1,750
Housing New Zealand 1,859 - - - - - 1,859
New Zealand Railways Corporation 505 - - - - - 505
New Zealand Transport Agency 110 - - - - - 110
Other Crown 4 - - - - - 4
Non-Crown 151 - - - - - 151
Financial Assets
Marketable securities 1,355 1,132 202 - 506 47 3,242
External deposits 104 - - 11 - - 115
Derivatives in gain 14,508 (9,134) (185) (1,805) (438) (457) 2,489
IMF financial assets 8 905 203 808 - 244 2,168
Total Financial Assets 33,988 (4,294) 240 18 107 (133) 29,926
Overdrafts and Payables
Crown disbursement account 3,823 - - - - - 3,823
Creditors and payables 70 57 - - - - 127
Financial Liabilities
NZ-dollar government securities 66,762 - - - - - 66,762
Euro-commercial paper - 180 - - - - 180
Foreign currency debt - 248 317 - - 22 587
Collateral - 1,417 - - - - 1,417
Derivatives in loss 9,487 (6,911) (231) (800) 113 (346) 1,312
Departmental deposits - 15 - 192 - 3 210
IMF allocation - 691 155 616 - 186 1,648
Immigration investor policy bonds 87 - - - - - 87
Other 1 - - - - - 1
Total Financial Liabilities 80,230 (4,303) 241 8 113 (135) 76,154
Net Currency Holdings (46,242) 9 (1) 10 (6) 2 (46,228)

FINANCIAL STATEMENTS 2010/11 – NZDMO
Page 117
Financial Instruments: Fair Value Hierarchy
NZDMO measures some financial instruments at fair value based on the designation or classification of the
instruments into “Fair value through profit or loss” or “Available-for-sale” categories for financial instruments. The
following table provides a fair value hierarchy, as required by NZ IFRS7, that reflects the significance of the inputs
used in making the fair value measurements. The hierarchy levels are Level 1 (quoted market prices), Level 2
(observable inputs) and Level 3 (unobservable inputs).
As at 30 June 2011
Carrying Value
$m
Fair Value Measurement
$m
Hierarchy
Level 1$m
Level 2 $m
Level 316
$m
Cash, Cash Equivalents and Receivables
Crown settlement account 13,060 - - - -
Crown trust account 38 - - - -
Foreign cash and cash equivalents 1,461 1,355 - 1,355 -
Debtors and receivables 536 - - - -
Advances
RBNZ 2,438 2,438 - 2,438 -
Crown Health Financing Agency 1,750 1,750 - 1,750 -
Housing New Zealand 1,859 1,156 - 1,156 -
New Zealand Railways Corporation 505 505 - 505 -
New Zealand Transport Agency 110 110 - 110 -
Other Crown 4 4 - 4 -
Non-Crown 151 120 - 75 45
Financial Assets
Marketable securities 3,242 3,242 2,904 338 -
External deposits 115 115 - 115 -
Derivatives in gain 2,489 2,489 - 2,489 -
IMF financial assets 2,168 - - - -
Total Financial Assets 29,926 13,284 2,904 10,335 45
Overdrafts and Payables
Crown disbursement account 3,823 - - - -
Creditors and payables 127 - - - -
Financial Liabilities
Treasury bills – market 7,209 604 - 604 -
Treasury bills – non-market 50 - - - -
Government bonds – market 50,755 4,012 4,012 - -
Government bonds – non-market 6,363 - - - -
Inflation-indexed bonds – market 1,633 - - - -
Inflation-indexed bonds – non-market 491 - - - -
Kiwi bonds 261 - - - -
Euro-commercial paper 180 180 - 180 -
Foreign currency debt 587 587 - 587 -
Collateral 1,417 1,417 - 1,417 -
Derivatives in loss 1,312 1,312 - 1,312 -
Departmental deposits 210 210 - 210 -
IMF allocation 1,648 - - - -
Immigration investor policy bonds 87 - - - -
Other 1 - - - -
Total Financial Liabilities 76,154 8,322 4,012 4,310 -
16 For reasons of materiality, NZDMO has not completed the reconciliation from beginning to ending balances for Level 3 instruments.

FINANCIAL STATEMENTS 2010/11 – Audit Report
Page 118
Independent Auditor’s Report
To the Readers of the Treasury’s Financial Statements, Non-financial Performance Information and Schedules of Non-departmental Activities for the Year Ended 30 June 2011
The Auditor-General is the auditor of The Treasury (the Department). The Auditor-General has appointed me,
Godfrey Boyce, using the staff and resources of KPMG, to carry out the audit of the financial statements, the non-
financial performance information and the schedules of non-departmental activities of the Department on her
behalf.
We have audited:
the financial statements of the Department on pages 68 to 85, that comprise the statement of financial position,
statement of commitments, statement of contingent liabilities and contingent assets as at 30 June 2011, the
statement of comprehensive income, statement of changes in taxpayers’ funds, statement of departmental
capital expenditure, statement of departmental expenses and capital expenditure against appropriations,
statement of unappropriated expenditure and capital expenditure and statement of cash flows for the year
ended on that date and the notes to the financial statements that include accounting policies and other
explanatory information; and
the non-financial performance information of the Department that comprises the statement of service
performance on pages 27 to 64 and the report about outcomes on pages 8 to 20; and
the schedules of non-departmental activities of the Department on pages 95 to 117 that comprise the schedule of
assets, schedule of liabilities, schedule of commitments, schedule of contingent liabilities and schedule of trust
monies as at 30 June 2011, the schedule of expenses, schedule of expenditure and appropriations, schedule
of earthquake expenditure, statement of unappropriated and capital expenditure, schedule of revenue and
schedule of capital receipts for the year ended on that date and the notes to the schedules that include
accounting policies and other explanatory information
Opinion
In our opinion:
the financial statements of the Department on pages 68 to 85:
- comply with generally accepted accounting practice in New Zealand; and
- fairly reflect the Department’s:
- financial position as at 30 June 2011;
- financial performance and cash flows for the year ended on that date;
- expenses and capital expenditure incurred against each appropriation administered by the Department
and each class of outputs included in each output expense appropriation for the year ended 30 June
2011; and
- unappropriated expenses and capital expenditure for the year ended 30 June 2011; and
the non-financial performance information of the Department on pages 27 to 64 and 8 to 20:
- complies with generally accepted accounting practice in New Zealand; and
- fairly reflects the Department’s service performance and outcomes for the year ended 30 June 2011,
including for each class of outputs:
- its service performance compared with the forecasts in the statement of forecast service performance
at the start of the financial year; and

FINANCIAL STATEMENTS 2010/11 – Audit Report
Page 119
- its actual revenue and output expenses compared with the forecasts in the statement of forecast
service performance at the start of the financial year; and
the schedules of non-departmental activities of the Department on pages 95 to 117, fairly reflect:
- the assets, liabilities, contingencies, commitments and trust monies as at 30 June 2011 managed by the
Department on behalf of the Crown; and
- the revenues, expenses, expenditure and capital expenditure against appropriations and unappropriated
expenditure and capital expenditure for the year ended on that date managed by the Department on behalf
of the Crown.
Our audit was completed on 30 September 2011. This is the date at which our opinion is expressed.
The basis of our opinion is explained below. In addition, we outline the responsibilities of the Secretary to the
Treasury and our responsibilities, and we explain our independence.
Basis of opinion
We carried out our audit in accordance with the Auditor-General’s Auditing Standards, which incorporate the
International Standards on Auditing (New Zealand). Those standards require that we comply with ethical
requirements and plan and carry out our audit to obtain reasonable assurance about whether the financial
statements, the non-financial performance information and the schedules of non-departmental activities are free
from material misstatement.
Material misstatements are differences or omissions of amounts and disclosures that would affect a reader’s
overall understanding of the financial statements, the non-financial performance information and the schedules of
non-departmental activities. If we had found material misstatements that were not corrected, we would have
referred to them in our opinion.
An audit involves carrying out procedures to obtain audit evidence about the amounts and disclosures in the
financial statements, the non-financial performance information and the schedules of non-departmental activities.
The procedures selected depend on our judgement, including our assessment of risks of material misstatement of
the financial statements, the non-financial performance information and the schedules of non-departmental
activities, whether due to fraud or error. In making those risk assessments, we consider internal control relevant to
the Department’s preparation of the financial statements, the non-financial performance information and the
schedules of non-departmental activities that fairly reflect the matters to which they relate. We consider internal
control in order to design audit procedures that are appropriate in the circumstances but not for the purpose of
expressing an opinion on the effectiveness of the Department’s internal control.
An audit also involves evaluating:
the appropriateness of accounting policies used and whether they have been consistently applied;
the reasonableness of the significant accounting estimates and judgements made by the Secretary to the
Treasury;
the appropriateness of the reported non-financial performance information within the Department’s framework
for reporting performance;
the adequacy of all disclosures in the financial statements, the non-financial performance information and the
schedules of non-departmental activities; and
the overall presentation of the financial statements, the non-financial performance information and the
schedules of non-departmental activities.
We did not examine every transaction, nor do we guarantee complete accuracy of the financial statements, the
non-financial performance information and the schedules of non-departmental activities. We have obtained all the

FINANCIAL STATEMENTS 2010/11 – Audit Report
Page 120
information and explanations we have required and we believe we have obtained sufficient and appropriate audit
evidence to provide a basis for our audit opinion.
Responsibilities of the Secretary to the Treasury
The Secretary to the Treasury is responsible for preparing:
financial statements and non-financial performance information that:
- comply with generally accepted accounting practice in New Zealand;
- fairly reflect the Department’s financial position, financial performance, cash flows, expenses and capital
expenditure incurred against each appropriation and its unappropriated expenses and capital expenditure;
and
- fairly reflect its service performance and outcomes; and
schedules of non-departmental activities, in accordance with the Treasury Instructions 2010 that fairly reflect
those activities managed by the Department on behalf of the Crown.
The Secretary to the Treasury is also responsible for such internal control as is determined is necessary to enable
the preparation of financial statements, and non-financial performance information and schedules of non-
departmental activities that are free from material misstatement, whether due to fraud or error.
The Secretary to the Treasury’s responsibilities arise from the Public Finance Act 1989.
Responsibilities of the Auditor
We are responsible for expressing an independent opinion on the financial statements, the non-financial
performance information and the schedules of non-departmental activities and reporting that opinion to you based
on our audit. Our responsibility arises from section 15 of the Public Audit Act 2001 and the Public Finance Act
1989.
Independence
When carrying out the audit, we followed the independence requirements of the Auditor-General, which
incorporate the independence requirements of the New Zealand Institute of Chartered Accountants.
In addition to the audit we have carried out assignments in the areas of general accounting and advisory, which
are compatible with those independence requirements. Other than the audit and these assignments, we have no
relationship with or interests in the Department.
Godfrey Boyce
KPMG
On behalf of the Auditor-General
Wellington, New Zealand

THE TREASURY ANNUAL REPORT 2010/11 – Annexes
Page 121
Research and Policy Publications for the year ended 30 June 2011
The Treasury’s research and policy publications present work-in-progress perspectives on a variety of economic,
financial, trade and social issues. The Treasury’s aim in publishing them is to make the papers available to a
wider audience, and to inform and encourage public debate on important areas of work. All papers can be viewed
on our website: www.treasury.govt.nz/publications/research-policy
Papers added during 2010/11 include:
Policy Perspectives Papers 2010/11 Publishing Date and/or Paper Number
Saving in New Zealand: Issues and Options September 2010
Government and Economic Growth: Does Size Matter? April 2011 – TP 11/01
Working Towards Higher Living Standards for New Zealanders May 2011 – TP 11/02
Working Papers 2010/11 Publishing Date and/or Paper Number
New Zealand’s Exchange Rate Cycles: Impacts and Policy March 2011 – WP 11/01
Modelling Shocks to New Zealand’s Fiscal Position June 2011 – WP 11/02
Economic Imbalances: New Zealand’s Structural Challenge June 2011 – WP 11/03

THE TREASURY ANNUAL REPORT 2010/11 – Annexes
Page 122
Legislation as at 30 June 2011
Budget legislation administered by the Treasury during the year:
Appropriation Act(s)
Imprest Supply Act(s)
Delegated legislation administered by the Treasury:
Bank of New Zealand Order 1989
Cityline (NZ) Vesting Order 1992
Cook Islands Sterling Area Currency and Securities Exemption Notice 1957
Crown Entities (Capital Charge Rules) Regulations 2011
Crown Entities (Financial Powers) Regulations 2005
Crown Entities (Financial Powers) Amendment Regulations 2006
Crown Entities New Zealand (Fast Forward Fund Limited) Order 2008
Crown Entities New Zealand (Fast Forward Fund Limited) Order 2009
Crown Research Institutes Act Commencement Order 1998
Crown Solicitors Regulations 1994
Crown Solicitors Amendment Regulations 2004
Earthquake Commission Regulations 1993
Export Guarantee Amendment Act Commencement Order 1990
Fees and Travelling Allowances Regulations 1952
Finance Act Order (various)
Government Superannuation Orders and Regulations (various)
Housing New Zealand Limited Vesting Order 1993
International Finance Agreements Amendment Act Commencement Order 1978
International Finance Agreements Amendment Act Commencement Order 1993
KiwiSaver Act Commencement Order 2006
KiwiSaver Regulations 2006 (and various Amendment Regulations)
Local Authorities and Public Bodies (New Zealand Superannuation Scheme) Order 1974
National Provident Fund (Approval of Restructuring Proposal) Order 1991
National Provident Fund (Approval of Amendments to Restructuring Proposal) Order 1993
National Savings Investment Account Regulations (various)
New Zealand Planning Council Dissolution Act Commencement Order 1991
New Zealand Rail Limited Vesting Order (various)
New Zealand Railways Corporation Notice, Regulations and Orders (various)
New Zealand Railways Corporation Restructuring Act Orders (various)
New Zealand Staff Welfare Society Dissolution Act Commencement Order 1999
New Zealand Superannuation (Political Commitment) Order 2003
New Zealand Superannuation (Political Commitment) Order 2004
North City Bus Limited Vesting Order 1991
Overseas Investment Act Commencement Order 2005
Overseas Investment Regulations 2005
Overseas Investment Amendment Regulations (various)
Post Office Bank Amendment Act Commencement Orders (various)
Public Audit (West Coast Development Trust) Order 2002
Public Finance Act Orders (various)
Public Finance (Departmental Guarantees and Indemnities) Regulations 2007
Public Finance (Departmental Guarantees and Indemnities) Amendment Regulations 2010
Rail Operator Orders (various)
Rural Banking and Finance Corporation of New Zealand Act Commencement Order 1989
Rural Intermediate Credit (Limits on Advances) Notice 1982
Shipping Corporation of New Zealand Repeal Act Commencement Order (various)
Sink Benefit Fund Winding Up Order 1990
Social Security (Rates of Benefits and Allowances) Order (various)

THE TREASURY ANNUAL REPORT 2010/11 – Annexes
Page 123
Southland Electricity Act Commencement Order 1994
Southland Electricity Act Commencement Order 1998
Speedlink Carriers Limited Vesting Order 1991
Speedlink Parcels Limited Vesting Order Limited 1991
State Insurance Act (Vesting) Order 1990
State-Owned Enterprises Orders (various)
Television New Zealand (Separation of Transmission Business) Order 2003
Tourist Hotel Corporation of New Zealand Act Commencement Order 1990
Tourist Hotel Corporation of New Zealand Act (Vesting and Commencement) Order 1990
Travelling Allowance Regulations (various)
Westpac Banking Corporation Act Commencement Order 1982
Witness and Interpreters Fees Amendment Regulations 2004
Other legislation administered by the Treasury:
Aid to Water-Power Works Act 1910
Bank of New Zealand Act 1988
Crown Entities Act 2004 (Part 4)
Crown Forests Assets Act 1989
Crown Research Institutes Act 1992
Crown Retail Deposit Guarantee Scheme Act 2009
District Railways Purchasing Act 1885
Earthquake Commission Act 1993
Export Guarantee Act 1964
Farm and Fishing Vessel Ownership Savings Schemes (Closure) Act 1998
Farm Ownership Savings Act 1974
Finance Acts (various)
Fishing Vessel Ownership Savings Act 1977
Government Superannuation Fund Act 1956
Hawke’s Bay Earthquake Act 1931
Infrastructure (Amendments Relating to Utilities Access) Act 2010
International Finance Agreements Act 1961
KiwiSaver Act 2006 (only section 177 jointly with IRD)
National Expenditure Adjustment Act 1932
National Provident Fund Restructuring Act 1990
New Zealand Government Property Corporation Act 1953
New Zealand Planning Council Dissolution Act 1991
New Zealand Productivity Commission Act 2010
New Zealand Railways Corporation Act 1981
New Zealand Railways Corporation Restructuring Act 1990
New Zealand Railways Staff Welfare Society Dissolution Act 1999
New Zealand Superannuation and Retirement Income Act 2001 (various provisions)
Overseas Investment Act 2005
Post Office Bank Act 1987
Public Audit Act 2001
Public Finance Act 1989
Rural Banking and Finance Corporation of New Zealand Act 1989
Southland Electricity Act 1993
State Insurance Act 1990
State-Owned Enterprises Act 1986
State-Owned Enterprises (AgriQuality Limited and Asure New Zealand Limited) Act 2007
State-Owned Enterprises (Contact Energy Limited) Act 1998
State-Owned Enterprises (Meteorological Service of New Zealand Limited and Vehicle Testing New Zealand Limited) Amendment Act 1999
Tourist Hotel Corporation of New Zealand Act 1989
Treasurer (Statutory References) Act 1997
Utilities Access Act 2010

THE TREASURY ANNUAL REPORT 2010/11 – Annexes
Page 124
Monitoring of Crown Agencies
COMU has monitoring responsibility for the following:
Crown Financial Institutions:
Accident Compensation Commission (ACC) (Investments)
Earthquake Commission (EQC)
Government Superannuation Fund (GSF)
National Provident Fund (NPF)
New Zealand Superannuation Fund (NZSF)
State-Owned Enterprises:
Airways Corporation of New Zealand Ltd (Airways)
Animal Control Products Ltd (ACP)
AsureQuality Ltd (AsureQuality)
Electricity Corporation of New Zealand Ltd (ECNZ) (the residual company)
Genesis Power Ltd (Genesis)
Kordia Group Ltd (Kordia)
Landcorp Farming Ltd (Landcorp)
Learning Media Ltd (LML)
Meridian Energy Ltd (Meridian)
Meteorological Service of New Zealand Ltd (MetService)
Mighty River Power Ltd (Mighty River Power)
New Zealand Post Ltd (NZ Post)
New Zealand Railways Corporation (KiwiRail Group)
Quotable Value Ltd (Quotable Value)
Solid Energy New Zealand Ltd (Solid Energy)
Timberlands West Coast Ltd (Timberlands)
Transpower New Zealand Ltd (Transpower)
Other Crown companies:
Crown Fibre Holdings Ltd (CFH)
Health Benefits Ltd (HBL)
New Zealand Venture Investment Fund Ltd (NZVIF)
Radio New Zealand Ltd (RNZ)
Research and Education Advanced Network New Zealand Ltd (REANNZ)
Television New Zealand Ltd (TVNZ)
Crown Research Institutes: (from 1/2/2011 joint responsibility with Ministry of Science & Innovation)
AgResearch Ltd (AgResearch)
Industrial Research Ltd (IRL)
Institute of Environmental Science & Research Ltd (ESR)
Institute of Geological & Nuclear Sciences Ltd (GNS Science)
Landcare Research New Zealand Ltd (Landcare Research)
National Institute of Water & Atmospheric Research Ltd (NIWA)
New Zealand Forest Research Institute Ltd (Scion)
The New Zealand Institute for Plant & Food Research Ltd (Plant & Food Research)
Other:
Air New Zealand Ltd
Christchurch International Airport Ltd (CIAL)
Dunedin International Airport Ltd (DIAL)
Hawkes Bay Airport Ltd (HBAL)
Invercargill Airport Ltd (IAL)
New Zealand Lotteries Commission (Lotteries)
Pacific Forum Line Ltd (PFL)
Public Trust (Public Trust)
Rugby NZ (2011) Ltd
The Treasury administers the board appointment processes for all of the above companies/entities, except
ACC and PFL. Also, in addition, COMU administers the board appointment processes for the following entities:
2025 Taskforce, Crown Forestry Rental Trust, Government Superannuation Appeals Board, National
Infrastructure Advisory Board, Nominating Committee for the Guardians of New Zealand Superannuation Fund
and the Reserve Bank. The Treasury also serves the secretariat function for the Government Superannuation
Appeals Board.

THE TREASURY ANNUAL REPORT 2010/11 – Annexes
Page 125
List of Acronyms
ACC Accident Compensation Corporation
ALM Asset and Liability Matching
AMI AMI Insurance Limited
APEC Asia-Pacific Economic Cooperation
BASS Better Administrative and Support Services
BAU Business as Usual
BEFU Budget Economic and Fiscal Update
BIA Building Industry Association
BPS Budget Policy Statement
CAM Capital Asset Management
CCMAU Crown Company Monitoring Advisory Unit
CER Closer Economic Relations
CERA Canterbury Earthquake Recovery Authority
CFI Crown Financial Institution
COMU Crown Ownership Monitoring Unit
CPI Consumer Price Index
CRI Crown Research Institute
DBH Department of Building and Housing
DBP(A) Defined Benefit Plan (Annuitants)
DCEs Deputy Chief Executives
DGS Deposit Guarantee Scheme
DHB District Health Board
DIA Department of Internal Affairs
DICE Departmental Internal Control Evaluation
DPMC Department of Prime Minister and Cabinet
ECE Early Childhood Education
ECNZ Electricity Corporation of New Zealand
EEO Equal Employment Opportunities
ELT Executive Leadership Team
EML Equitable Mortgages Ltd
EQC Earthquake Commission
EQC Act 1993 Earthquake Commission Act 1993
ETCR Energy, Transport and Communications Regulation
FDI Foreign Direct Investment
FSR Fiscal Strategy Report
FX Foreign Exchange
GDP Gross Domestic Product
GSF Government Superannuation Fund
GST Goods and Services Tax
HYEFU Half-year Economic and Fiscal Update
IAAS Infrastructure as a Service
IFIs International Financial Institutions
IMF International Monetary Fund
IPANZ Institute of Public Administration New Zealand
IRD Inland Revenue Department

THE TREASURY ANNUAL REPORT 2010/11 – Annexes
Page 126
MCs Ministerial Correspondence
MED Ministry of Economic Development
MFAT Ministry of Foreign Affairs and Trade
MOE Ministry of Education
MOH Ministry of Health
MOIAs Ministry Official Information Act requests
MOU Memoranda of Understanding
MSD Ministry of Social Development
MSI Ministry of Science and Innovation
NCEA National Certificate of Educational Achievement
NEET Not in Education, Employment or Training
NIU National Infrastructure Unit
NPF National Provident Fund
NZ GAAP New Zealand Generally Accepted Accounting Practice
NZ IFRS New Zealand equivalents to International Financial Reporting Standards
NZDMO New Zealand Debt Management Office
NZECO New Zealand Export Credit Office
NZTA New Zealand Transport Agency
OAG Office of the Auditor-General
ODI Outward Direct Investment
OECD Organisation for Economic Cooperation and Development
OIAs Official Information Act requests
PAYE Pay-As-You-Earn
PIF Performance Improvement Framework
PLAs Permanent Legislative Authorities
PPPs Public Private Partnerships
PQs Parliamentary Questions
R&D Research and Development
RBNZ Reserve Bank of New Zealand
RWT Resident Withholding Tax
S&P Standard and Poor’s
SCF South Canterbury Finance
SOE State-Owned Enterprise
SOI Statement of Intent
SSC State Services Commission
STR Cabinet Strategy Committee
TOIAs Treasury Official Information Act requests
TVNZ Television New Zealand Limited
VaR Value at Risk
VfM Value for Money
WDC Waimakariri District Council
WFGF Wholesale Funding Guarantee Facility
WTO World Trade Organisation


![arXiv:0904.3204v4 [math.GT] 11 Mar 2010 - CiteSeerX](https://static.fdokumen.com/doc/165x107/633abe7f517c0feb7a07a046/arxiv09043204v4-mathgt-11-mar-2010-citeseerx.jpg)