©2007 Michaele Beth Manigrasso All Rights Reserved - RUcore
192
©2007 Michaele Beth Manigrasso All Rights Reserved
-
Upload
khangminh22 -
Category
Documents
-
view
4 -
download
0
Transcript of ©2007 Michaele Beth Manigrasso All Rights Reserved - RUcore

©2007
Michaele Beth Manigrasso
All Rights Reserved

IDENTIFICATION OF A KEY REGULATORY PATHWAY IN BONE
REGENERATION USING A NOVEL MOUSE FRACTURE MODEL
by
MICHAELE BETH MANIGRASSO
A Dissertation submitted to the
Graduate School-New Brunswick
Rutgers, The State University of New Jersey
and
The Graduate School of Biomedical Sciences
University of Medicine and Dentistry of New Jersey
in partial fulfillment of the requirements
for the degree of
Doctor of Philosophy
Graduate Program in Biomedical Engineering
written under the direction of
James Patrick O’Connor, PhD
and approved by
________________________
________________________
________________________
________________________
________________________
New Brunswick, New Jersey
October 2007

ABSTRACT OF THE DISSERTATION
IDENTIFICATION OF A KEY REGULATORY PATHWAY IN BONE
REGENERATION USING A NOVEL MOUSE FRACTURE MODEL
By Michaele Beth Manigrasso
Dissertation Director: James Patrick O’Connor, PhD
Fracture healing is the complex biological process that restores broken bones to
their original shape and function. While the fracture repair process follows a
definitive sequence of events, not all the molecular or chemical pathways are
completely understood. The development of animals with targeted mutations has
allowed for the examination of specific fracture healing pathways, making the use
of the mouse model an increasingly valuable tool in the field of orthopaedics.
Additionally, evaluating the healing tissues using a torsional mechanical testing
protocol is more reproducible and provides a better estimate of the
biomechanical properties. Therefore, the first section of this dissertation is
focused on the development and characterization of a murine femoral fracture
model suitable for torsional mechanical testing. The model developed was
tested using radiography, histology and mechanical testing and was shown to be
ii

comparable to other published femoral fracture models. After validation of this
model, the next experiment focused on exploring how a complex phenotype,
such as bone mineral density, may affect bone healing. Using inbred strains of
mice with established bone mineral density values, the radiographic, histologic
and biomechanical analyses of the healing femurs were evaluated. This data
showed that having a high bone mineral density actually results in lower
mechanical properties and therefore may be deleterious to fracture repair.
Finally, this mouse fracture model was used to see how altering the arachidonic
acid pathway affects fracture healing. Using genetically modified mice and the
fracture and mechanical testing protocols as described, the role of the
arachidonic acid pathway in fracture repair was examined. This data showed
that either inhibition or acceleration of fracture repair is achieved by manipulating
this pathway.
iii

Dedication
For My Mother,
Love Always, Your Michaele
I would first like to thank and remember my mother, Dolores Manigrasso.
This was the hardest page to write and the last one completed. While I am
saddened that you didn’t get the chance to see the end of all of this, I know I was
loved more than any one little girl deserved or needed. I am truly grateful for
having the opportunity of being your daughter, even if it was only for a short time.
I promise you that I will keep my head up and take my chances on everyday. I
love and miss you very much.
I would also like to acknowledge and thank my father, James Manigrasso.
If I had to bet money on who would have my back during all of this, I would have
lost and lost big. I want to thank you for showing up and for backing this horse. I
won’t forget it. I suppose this means I can no longer stick you in that nursing
home. Oh well, I guess you will have to live with me. I love you, Daddy.
To my committee, thank you for the all of the support and guidance.
Last, but never least, I would like to say thank you to my husband, Jay
Geiger. I would like to thank you for all the support these past three years and
for loving me in spite of everything I do. I couldn’t have picked a better man to
secure my financial future. Always remember, these are better days.
iv

Table of Contents
TITLE PAGE i
ABSTRACT OF THE DISSERTATION ii
ACKNOWLEDGEMENTS iv
TABLE OF CONTENTS v
LIST OF TABLES x
LIST OF FIGURES xiii
1.0.0 INTRODUCTION
1.1.0 Biology of Fracture Repair……………………………………………..1
1.1.1 Indirect Fracture Healing………............................................1
1.1.1.1 The Inflammatory Reaction Stage…………………..2
1.1.1.2 The Reparative Stage………………………………..3
1.1.1.3 The Bone Remodeling Stage………………………..5
1.1.2 Direct Fracture Healing…………………………………………5
1.2.0 Gene Expression During Fracture Healing…………………………..6
1.2.1 Transforming Growth Factor Beta (TGF-β) Superfamily……7
1.2.1.1 Transforming Growth Factor Beta (TGF-β)………...7
1.2.1.2 Bone Morphogenetic Proteins (BMPs)……………..8
1.2.2 Fibroblast Growth Factors (FGFs)…………………………….9
1.2.3 Platelet-Derived Growth Factors (PDGFs)…………………...9
1.2.4 Insulin-Like Growth Factors (IGFs)………………………….10
1.2.5 Pro-Inflammatory Cytokines………………………………….10
1.2.6 Angiogenic and Metalloproteinase Factors…………………11
v

1.3.0 Bone Mineral Density, Bone Quality and Fracture Risk…………...12
1.4.0 Arachidonic Acid Metabolism ………………………………………..14
1.4.1 Prostaglandin Biosynthesis…………………………………...15
1.4.1.1 Homeostatic versus Pro-Inflammatory Actions of
COX-1 and COX-2…………………………………..17
1.4.2 Leukotriene Biosynthesis……………………………………..18
1.4.3 Drugs Affecting Prostaglandin and Leukotriene Formation
and Action………………………………………………………20
1.5.0 Evaluation of Experimental Fracture Healing…………………….…22
1.5.1 Radiography……………………………………………………22
1.5.2 Histology and Histomorphometry………………………….…23
1.5.3 Mechanical Testing……………………………………………23
1.5.3.1 Three-Point Bending……………………………..…24
1.5.3.2 Four-Point Bending………………………………….25
1.5.3.3 Torsional Mechanical Testing…………………...…26
1.6.0 Models of Fracture Healing……………………………………...……27
2.0.0 RATIONALE AND HYPOTHESIS
3.0.0 MATERIALS AND METHODS
3.1.0 Mouse Strain Models…………………………………………….……33
3.1.1 Outbred Strains………………………………………...………33
3.1.2 Inbred Strains………………………………………..…………33
3.1.3 Gene-Deficient (Knock-Out) Strains…………………………34
3.1.3.1 Description of Cyclooxygenase-1 Deficient Mice..34
vi

3.1.3.2 Description of Cyclooxygenase-2 Deficient Mice..35
3.1.3.3 Description of 5-Lipoxygenase Deficient Mice…...36
3.2.0 General Health, Breeding and Maintenance of Animals……….….38
3.2.1 Cyclooxygenase-1 Deficient Mice……………………………38
3.2.2 Cyclooxygenase-2 Deficient Mice…………………………...38
3.2.3 5-Lipoxygenase Deficient Mice………………………………41
3.3.0 Tail Biopsy and Genotyping of Mice…………………………………42
3.4.0 Surgical Procedure and Fracture Model for Mice…………………..44
3.5.0 Radiography of Mouse Femur Fractures……………………………45
3.6.0 Histology and Histomorphometry of Mouse Femur Fractures…….46
3.6.1 Decalcified Histology of Fractured Femurs…………………46
3.6.2 Calcified Histology of Fractured Femurs…………………….47
3.6.3 Histomorphometry of Fractured Femurs…………………….48
3.6.3.1 Acquisition of Histological Images…………………48
3.6.3.2 Statistical Analysis of Histomorphometrical Data..48
3.7.0 Mechanical Testing of Intact and Fractured Mouse Femurs……...49
3.7.1 Preparation of Mouse Femurs for Mechanical Testing…….49
3.7.2 Torsional Testing Protocol for Mouse Femurs……………...49
3.7.3 Statistical Analysis of Torsional Mechanical Testing Data..50
3.8.0 Eicosanoid Levels in Fracture Callus………………………………..51
3.8.1 Fracture Callus Preparation…………………………………..51
3.8.2 Purification Technique of Fracture Callus Eicosanoids……52
3.8.3 Quantification of Fracture Callus Eicosanoids……………...52
vii

3.8.4 Statistical Analysis of Fracture Callus Eicosanoids………..53
4.0.0 RESULTS
4.1.0 Characterization of a Closed Murine Femoral Fracture Model…...54
4.1.1 Disposition of ICR Mice Used in This Study………………..54
4.1.2 Surgical Procedure for ICR Mice………………………….…54
4.1.3 Radiography of ICR Mouse Femurs…………………………55
4.1.4 Decalcified Histology of ICR Mouse Femurs………….……56
4.1.5 Calcified Histology of ICR Mouse Femurs…………….……57
4.1.6 Mechanical Testing of ICR Mouse Femurs…………..…….58
4.2.0 The Effect of Genetic Background on Fracture Repair……………67
4.2.1 Disposition of Inbred Animals Used in This Study…………67
4.2.2 Radiography of Inbred Mice…………………………….……68
4.2.3 Calcified Histology of Inbred Mouse Femurs……….………69
4.2.4 Histomorphometry of Inbred Mouse Femurs………….……70
4.2.5 Mechanical Testing of Inbred Mouse Femurs………………71
4.3.0 The Role of Cyclooxygenase in Fracture Healing………….………84
4.3.1 Disposition of COX Deficient Mice Used in This Study……84
4.3.2 Radiography of COX Deficient Mice…………………………86
4.3.3 Calcified Histology of COX Deficient Mouse Femurs…...…87
4.3.4 Histomorphometry of COX Deficient Mouse Femurs………88
4.3.5 Mechanical Testing of COX Deficient Mouse Femurs..……90
4.4.0 The Role of 5-Lipoxygenase (5-LO) in Fracture Healing………….96
viii

4.4.1 Disposition of 5-LO Deficient Mice Used in This
Study……………………………………………………………96
4.4.2 Radiography of 5-LO Deficient Mice…………………………97
4.4.3 Calcified Histology of 5-LO Deficient Mouse Femurs…...…98
4.4.4 Histomorphometry of 5-LO Deficient Mouse Femurs…...…99
4.4.5 Mechanical Testing of 5-LO Deficient Mouse Femurs…...100
4.4.6 Eicosanoid Levels in Fracture Callus of 5-LO Deficient
Mice……………………………………………………………101
5.0.0 DISCUSSION
5.1.0 Developing and Characterizing a Closed Murine Femoral Fracture
Model………………………………………………………………..…111
5.2.0 Genetic Background and Fracture Repair…………………………114
5.3.0 Cyclooxygenase and Fracture Repair……………………………..116
5.4.0 5-Lipoxygenase and Fracture Repair………………………………119
6.0.0 CONCLUSIONS
APPENDIX A- Protocols for Decalcified and Calcified Mouse Bone Specimens
and Mechanical Testing Equations…........................................126
APPENDIX B- Analysis and Statistical Summary Tables for Mechanical and
Histomorphometrical Data…………………………………………132
REFERENCES…………………………………………………………………….…154
CURRICULUM VITA…………………………………………………………………176
ix

LIST OF TABLES
TABLE TITLE PAGE
1.1 The Four Biomechanical Stages of Fracture Healing………………….28
3.1 Strain Descriptions and Nomenclature Used in This Dissertation……37
3.2 Mouse Primer Sequences and Amplification Sizes for PCR
Genotyping of Mice Used in These Studies……. ……………………...44
4.1 Disposition of the 246 ICR Mice Used in the Study……………………54
4.2 Average Pre-Surgical and Post-Sacrifice Weights of ICR Mice………55
4.3 Disposition of the 306 Inbred Mice Used in the Study………………...67
4.4 Average Pre-Surgical and Post-Sacrifice Weights of Inbred Mice…..68
4.5 Disposition of the 312 COX Deficient and Wild-Type Mice Used in This
Study ……………………………………………………………………….84
4.6 Average Pre-Surgical and Post-Sacrifice Weights of COX Deficient
and Wild-Type Mice…………….…………………………………………85
4.7 Disposition of the 168 5-LO Deficient and Wild-Type Mice Used in the
Study ……...........................................................................................96
4.8 Average Pre-Surgical and Post-Sacrifice Weights of 5-LO and WT
Mice…………………………………………………………………………97
B1 Summary of ICR Mouse Femur Mechanical Testing Data..…………133
B2 Inbred Mouse Fracture Callus Histomorphometrical Measurements
Summary. ………………………………………………………………...134
B3 Statistical Summary for Inbred Mouse Fracture Callus
Histomorphometrical Measurements…………………………………..138
x

B4 Summary of Inbred Mouse Femur Mechanical Testing Data………..139
B5 Statistical Summary for Raw and Normalized Inbred Mouse Femur
Mechanical Testing Data………………………………………………..140
B6 Weight Normalized Inbred Mouse Femur Mechanical Testing Data
Summary………………………………………………………………….141
B7 Statistical Summary for Weight Normalized Inbred Mouse Femur
Mechanical Testing…………………..................................................142
B8 Summary of Inbred Mouse Femur Mechanical Testing Data
Normalized to Femur Cross-Sectional Area…………………………..143
B9 Statistical Summary for Cross-Sectional Area Normalized Inbred
Mouse Femur Mechanical Testing……………………………………..144
B10 Summary of Inbred Mouse Femur Mechanical Testing Data
Normalized to Bone Mineral Density…………………………………...145
B11 Statistical Summary for Bone Mineral Density Normalized Inbred
Mechanical Testing………………………………………………………146
B12 Cox-1KO Mouse Fracture Callus Histomorphometry
Measurements……………………………………………………………147
B13 Cox-2KO Mouse Fracture Callus Histomorphometry
Measurements……………………………………………………………148
B14 Cox-2HET Mouse Fracture Callus Histomorphometry
Measurements……………………………………………………………149
B15 Cox-2WT Mouse Fracture Callus Histomorphometry
Measurements...................................................................................150
xi

B16 Summary of Cyclooxygenase Deficient Mouse Femur Mechanical
Testing Data………………………………………………………………151
B17 5-LOKO and 5-LOWT Mouse Fracture Callus Histomorphometry
Measurements……………………………………………………………152
B18 Summary of 5-LOKO and 5-LOWT Mouse Femur Mechanical Testing
Data..………………………………………………………………………153
xii

LIST OF FIGURES
Number Title Page
1.1 Arachidonic Acid Metabolism and Signaling…………………………….14
1.2 Three-Point Bending Mechanical Testing Schematic……………........25
1.3 Four-Point Bending Mechanical Testing Schematic………………......26
1.4 Torsional Mechanical Testing Schematic……………………………….27
4.1 Radiographic Assessment of Femur Fracture Healing in ICR Mice….61
4.2 Fracture Callus Maximum Diameter Changes Over Time in ICR
Mice…………………………………………………………………………62
4.3 Early Histological Events of Femur Fracture Healing in ICR Mice…..63
4.4 Late Histological Events of Femur Fracture Healing in ICR Mice……64
4.5 The Mechanical Properties of ICR Mouse Fractured Femurs………..65
4.6 Normalized Mechanical Testing Properties of ICR Mouse Fractured
Femurs……………………………………………………………………...66
4.7 Radiographic Assessment of Fracture Healing in Inbred Mice………75
4.8 Histological Events of Fracture Healing in Inbred Mice……………….76
4.9 Histomorphometric Measurements of Femur Fracture Healing in
Different Inbred Mouse Strains……………….....…………………….....77
4.10 The Effects of Different Mouse Genetic Backgrounds on the Torsional
Mechanical Testing Properties of Healing femurs at 28 Days Post-
Fracture……………………………………………………………………..78
xiii

4.11 Mechanical Testing Properties of Healing Femurs from Different Strains
of Inbred Mice at 28 Days After Fracture Normalized to Contralateral
Control Femurs. ………………………………………………………...…79
4.12 Mechanical Testing Properties of Healing Femurs from Different
Strains of Inbred Mice at 28 Days After Fracture Normalized to Body
Weight………………………………………………………………………80
4.13 Cross-Sectional Area of the Contralateral (Left) and Fractured (Right)
Femurs from Different Strains of Inbred Mice…………………………..81
4.14 Mechanical Testing Properties of Healing Femurs from Different
Strains of Inbred Mice at 28 Days After Fracture Normalized to Cross-
Sectional Area……………………………………………………………...82
4.15 Mechanical Testing Properties of Healing Femurs from Different
Strains of Inbred Mice at 28 Days After Fracture Normalized to Bone
Mineral Density…………………………………………………………….83
4.16 Radiographic Assessment of Fracture Repair in COX Deficient
Mice………………………………………………………………………....92
4.17 Histology of Fracture Healing in COX Deficient Mice…………………93
4.18 Histomorphometric Analysis of Fracture Healing in COX Deficient
Mice…………………………………………………………………………94
4.19 Mechanical Testing Properties of COX Deficient Mice at 28 and 84
Days Post-Fracture………………………………………………………..95
4.20 Radiographic Examination of Fracture Healing in 5-LOWT and 5-LOKO
Mice………………………………………………………………………..103
xiv

4.21 Accelerated Fracture Repair in 5-LOKO Mice is Observed in
Histological Sections From 7 to 21 Days Post-Fracture. ……………104
4.22 Histological Observations of Accelerated Endochondral Ossification
During Fracture Repair in 5-LOKO Mice………………………………105
4.23 Histomorphometric Analysis of 5-LOKO Fracture Calluses………….106
4.24 Fracture Calluses From 5-LOKO Mice Have Enhanced Mechanical
Properties………………………………………..………………………..107
4.25 Callus PGE2 Levels are Elevated in Cox-2KO and Cox-1KO
Fractures………………………………………………………………..…108
4.26 Callus PGF2α Levels are Diminished in Cox-2KO Fractures…...……109
4.27 Callus LTB4 Levels are Elevated in Cox-2KO Fractures……………..110
5.1 Hypothetical Model of COX-2 and 5-LO Function in Fracture
Healing..............................................................................................121
xv

1
1.0.0 Introduction
1.1.0 Biology of Fracture Repair
Fracture healing is a complex biological process that restores broken
bones to their original shape and function. Though the molecular and cellular
pathways that govern fracture healing are not completely understood, the
fracture repair process follows a definitive, multistage, chronological, and spatial
sequence of events involving the recruitment of cells to the fracture site and the
expression of particular genes during these stages (1-4). Clinically, fracture
healing has been broadly divided into two different processes: direct or primary
fracture healing and indirect or secondary fracture healing.
1.1.1 Indirect Fracture Healing
Indirect fracture healing is the natural biological process to restore broken
bones to their original shape and function. This repair process is characterized by
responses from the periosteum and surrounding external soft tissues with the
subsequent formation of a fracture callus (2,5,6). Formation of the callus is
generally enhanced by limited motion of the broken bone ends at the fracture site
and is inhibited by rigid fixation of the broken bone (7). Secondary fracture
healing forms new bone through intramembranous ossification and endochondral
ossification. Intramembranous ossification is the direct formation of bone,
without first forming cartilage, from committed osteoprogenitor and
undifferentiated mesenchymal cells residing in the periosteum (2). This results in
the formation of what is histologically referred to as the “hard callus”.

2
Endochondral ossification involves the recruitment, proliferation, and
differentiation of undifferentiated mesenchymal cells into cartilage. This newly
formed cartilage eventually becomes calcified and is replaced by bone during the
process of endochondral ossification (2).
In 1975, Cruess and Dumont proposed a sequence of three overlapping
stages to characterize the fracture healing cascade (8). The first stage was
defined as the inflammatory reaction stage, followed by the reparative stage and
finally bone remodeling stage. This scheme was based largely on descriptive
histology. Other groups have divided fracture healing into as many as five
phases or stages (2,7,9). For simplicity, the three stages as proposed by Cruess
and Dumont will be discussed. It should be noted that none of these events are
independent. In fact, the stages overlap with the results of the earlier stages
affecting the progress of the later stages.
1.1.1.1 The Inflammatory Reaction Stage
The inflammatory reaction stage is the period immediately following bone
fracture and is the initiating event of the fracture repair process. Due to the
disruption of skeletal integrity, normal vascular structures, and nutrient flow at the
fracture site, there is a reduction in oxygen tension and a disruption of the bone
marrow architecture. This causes the infiltration of inflammatory cells,
macrophages, and degranulation of platelets and results in the formation of a
blood clot, or hematoma (2,10). This clot serves as a reservoir for cytokines and
growth factors that begin the healing cascade (11). Inflammatory cells and

3
platelets within this clot release important factors needed for chemotaxis,
proliferation, angiogenesis and differentiation of mesenchymal cells into
osteoblasts or chondrocytes (11,12). The hematoma also establishes a fibrin
network that provides a pathway for further cell migration (8). While not all
pathways are known, it is presumed that various growth factors responsible for
regulating cell migration and differentiation, which are normally trapped in the
bone matrix, get released into the local environment during this time (13,14).
1.1.1.2 The Reparative Stage
Within a few days after fracture, intramembranous bone formation begins.
Cells in high cellular density regions become differentiated and take on an
osteoblastic phenotype (10). Additionally, osteoblasts lining the cortical bone
surface become activated and periosteal pre-osteoblasts divide and begin to
differentiate (2). This results in the formation of woven bone, or hard callus, near
the peripheral edges of the fracture site.
At the same time, granulation tissue is formed between the bone
fragments as the hematoma is removed by macrophages and giant cells. This
granulation tissue will begin to be replaced by cartilage that spans the fracture
gap and is referred to as soft callus. It is the soft callus that provides the initial
stabilization of the fracture site. This newly formed cartilage callus is initially
characterized by high levels of type II collagen expression. As the chondrocytes
of the soft callus located near the woven bone of the hard callus start to become
elongated, they form elaborate vesicular structures. As the chondrocytes mature,

4
they become hypertrophic and express type X collagen similar to the
hypertrophic chondrocytes of the growth plate (15-18). Matrix vesicles bud from
these chondrocytes and begin to detach from the cytoplasmic processes as they
migrate to the extracellular matrix. It is here that they appear to deposit
proteolytic enzymes responsible for breaking down the cartilage as it is prepared
for calcification (19). Phosphatases, also contained in matrix vesicles, are also
released to help degrade phosphodiesters. The phosphodiesters release
phosphate ions needed for calcium precipitation used in ossification (15). The
mineralization of the soft callus proceeds in an organized manner with
hypertrophy of chondrocytes and calcification beginning at the interface between
the maturing cartilage and newly formed woven bone. After the cartilage
calcifies, angiogenesis begins. Angiogenesis introduces a blood supply to the
fracture site and is crucial for the progression of fracture healing. Growth factors
that stimulate angiogenesis, such as fibroblast growth factor (FGF) and vascular
endothelial growth factor (VEGF) are present in the fracture site and potentially
enhance the healing process by affecting chondrocytes and osteoblasts (20-22).
As osteoblastic progenitors are brought into the area with the new blood vessels,
osteoclasts begin to resorb the calcified tissue. Chondrocytes in the area are
removed by a combination of apoptotic cell death and some cell necrosis.
However, there is no transdifferentiation of chondrocytes to osteoblasts (23).
Vascularization is necessary during this stage and is thought to be necessary for
recruitment of osteoblastic progenitors necessary for bone deposition (24). The

5
osteoblastic progenitors differentiate into osteoblasts that produce the woven
bone to unite the fracture ends.
1.1.1.3 The Bone Remodeling Stage
The final stage of the fracture healing is characterized by the remodeling
of the woven bone to reform the intramedullary canal and restore the mechanical
strength of the healing bone to that of intact bone. During remodeling, the
fracture callus diminishes until the bone regains its normal dimensions (25).
Also, the bones overall mechanical properties are enhanced by replacing the
mechanically poor woven bone with the mechanically stronger and more mature
lamellar bone. Osteoclasts resorb the woven bone which osteoblasts then
replace with lamellar bone. This process is responsive to the local mechanical
environment and allows the collagen fibers in the lamellar bone to be oriented in
alignment with the mechanical stresses of the bone (9).
1.1.2 Direct Fracture Healing
Primary fracture healing is an artificial process that arises by surgical
manipulation of the bone fragments. Primary fracture healing is sometimes
referred to as direct fracture healing. For primary fracture healing to occur, bone
on both sides of the fracture site must be juxtaposed to reestablish mechanical
continuity. This process only occurs when there is an anatomic restoration of the
fracture fragments using rigid internal fixation. This rigid fixation results in a
substantial decrease in the interfragmentary strain (7). This decrease in strain

6
allows bone resorbing cells to directly reestablish new haversian systems. The
haversian systems generated provide pathways for new blood vessels, along
with endothelial and perivascular mesenchymal cells, to infiltrate the damaged
area. It is these endothelial and perivascular mesenchymal cells that become
the osteoprogenitor cells for osteoblasts. This results in the formation of discrete
remodeling units that aid in restoring bone tissue continuity across the fracture
(7). Additionally, the removal of the periosteum during surgery results in little to
no periosteal response. Subsequently, there is very little fracture callus
formation observed (2,5-7) and healing proceeds by normal osteonal remodeling.
As an increasing number of osteons span the fracture site, the two sides become
united.
1.2.0 Gene Expression During Fracture Healing
While the fracture repair process is relatively well described, little is
understood about the coordinated regulation of events leading to successful
fracture repair. It is clear that fracture repair involves the regulation of cellular
chemotaxis, proliferation, and differentiation and that these events are regulated
by growth factor signaling. Many signaling molecules are involved in secondary
fracture healing that help contribute to the success in the initiation and control of
these biological processes. These include the transforming growth factor- beta
superfamily, pro-inflammatory cytokines and multiple angiogenic factors (12,26-
28).

7
1.2.1 Transforming Growth Factor Beta (TGF-β) Superfamily
The TGF-β superfamily is a large group of growth and differentiation
factors that includes transforming growth factor-beta (TGF-β), bone
morphogenetic proteins (BMP’s) as well as growth differentiation factors (GDFs),
activins and inhibins. These factors are made as high molecular weight
precursors that are activated by proteolytic enzymes and act on serine/threonine
kinase membrane receptors located on target cells (28,29). Specific members of
this superfamily help promote various stages of intramembranous and
endochondral bone ossification during fracture healing (1).
1.2.1.1 Transforming Growth Factor Beta (TGF-β)
During the initial inflammatory phase, platelets release TGF-β (11,30).
Due to the time of expression, it is thought to play a role in callus formation
(11,30). TGF-β is also produced by osteoblasts and chondrocytes and is stored
in the bone matrix (31). Its effect is mediated through Type-1 and Type-2
serine/threonine kinase receptors and is responsible for activating the Smad-2
and Smad-3 pathways (32). TGF-β enhances proliferation of mesenchymal stem
cells, pre-osteoblasts, osteoblasts and chondrocytes (31). TGF-β induces the
production of collagen, proteoglycans, osteopontin, osteonectin, alkaline
phostphatase as well as other extracellular proteins (4). While the main role of
TGF-β is thought to be during chondrogenesis (20), it may also initiate signaling
for BMP synthesis by osteoprogenitor cells and may inhibit osteoclastic activation
and promote osteoclast apoptosis (30,33).

8
1.2.1.2 Bone Morphogenetic Proteins (BMPs)
Bone morphogenetic proteins (BMPs) are pleiotropic morphogens that
play a critical role in differentiation, growth and apoptosis of multiple cell types,
including osteoblasts, chondrocytes and epithelial cells. BMPs bind to type II
serine/threonine kinase receptors which transphosphorylate type-I receptors
initiating the Smad intracellular signaling cascade that regulates the transcription
of target genes (34-37).
Cheng et al. proposed an osteogenic hierarchical model of BMPs. In
summary, this model suggested BMP-2, -6 and -9 may be the most potent to
induce osteoblast differentiaton from cells of mesenchymal origin while most
other BMPs (excluding BMP-3 and -13) can promote the end differentiation of
committed osteoblastic precursor cells and osteoblasts (38). BMPs are also
involved in the sequential cascade of events, including chemotaxis, cell
proliferation and differentiation, angiogenesis and extracellular matrix production,
necessary for chondrogenesis (3,34).
Another important function of BMPs is to stimulate the synthesis and
secretion of other necessary bone and angiogenic growth factors, specifically
insulin-like growth factor (IGF) and vascular- endothelial growth factor (VEGF)
(39). BMPs may also stimulate bone formation by activating endothelial cells to
promote angiogenesis (40,41).

9
1.2.2 Fibroblast Growth Factors (FGFs)
The fibroblast growth factors (FGFs) are a family of structurally related
polypeptides that are known to have a crucial role in angiogenesis and
mesenchymal cell mitogenesis (42-44). The most abundant FGFs in normal
adult tissue are acidic fibroblast growth factor (FGF-1 or α-FGF) and basic
fibroblast growth factor (FGF-2 or β-FGF). Both α-FGF and β-FGF promote
growth and differentiation in many cells such as fibroblasts, myocytes,
osteoblasts, and chondrocytes. The mitogenic effects of α-FGF have been
associated with chondrocyte proliferation (45,46), while β-FGF is expressed by
osteoblasts and is typically more potent (43,47,48).
The FGF family transduces signals by a group of four receptors that
contain distinct membrane-spanning tyrosine-kinase domains (47,49). Mutations
in the FGF receptors have been associated with abnormalities in
intramembranous and endochondral ossification resulting in several skeletal
dysplasias, including achrondroplasia, thanatophoric displasia, and
hypochondroplasia (50,51).
1.2.3 Platelet-Derived Growth Factors (PDGFs)
Platelet-derived growth factor (PDGF) is a homo or heterodimeric
polypeptide that has A and B poly-peptide chains (PDGF AA, PDGF BB and
PFGD AB) (52-54). The effects of PDGF are exerted through receptors that have
tyrosine kinase activity and is synthesized by platelets, macrophages, endothelial

10
cells, monocytes and osteoblasts and is a strong mitogen for mesenchymal cells
(55).
PDGF is released by platelets during the early stages of fracture healing
(56) and is stimulated by arachidonic acid (the precursor for prostaglandins) (57).
PDGF has a major proliferative and migratory stimulus for MSCs and osteoblasts
and a strong chemotactic stimulator for inflammatory cells (31). Interleukin-1 (IL-
1), tumor necrosis factor-alpha (TNF-α), and TGF-β effect how PDGF binds to
tyrosine kinase activity receptors (28,52).
1.2.4 Insulin–Like Growth Factors (IGFs)
Osteoblasts, endothelial cells and chondrocytes are the source for insulin
growth factor-I (IGF-I, somatomedin-C) and II (IGF-II, skeletal growth factor)
(28,31). IGF-I promotes bone matrix formation by fully differentiated osteoblasts
(58). IGF-II acts during the later stages of endochondral bone formation and
stimulates type 1 collagen production, cellular proliferation and cartilage matrix
synthesis (59). Although IGF-2 is the most abundant growth factor in bone, IGF-1
has been found to be more potent (31) and has been localized in the healing
fractures of rats and humans (60,61).
1.2.5 Pro-Inflammatory Cytokines
Pro-inflammatory cytokines, including interleukin-1 (IL-1), interleukin-6 (IL-
6), and tumor necrosis factor alpha (TNF-α) have been shown to play a role in
initiating the repair cascade or are expressed in the early stages of fracture repair

11
(12,62). While macrophages and inflammatory cells are responsible for secreting
these cytokines, they are also secreted by cells of mesenchymal origin located in
the periosteum (63). These cytokines recruit other inflammatory cells by
chemotaxis, they enhance extracellular matrix synthesis and stimulate
angiogenesis while recruiting endogenous fibrogenic cells to the injury site (63).
Their peak expression is during the first 24 hours post-fracture, then is lowered
during cartilage formation and finally rise again during remodeling (62,63).
Cytokines are also responsible for regulating endochondral bone
formation and remodeling (20). While TNF-α promotes recruitment of
mesenchymal stem cells, it also induces apoptosis of hypertrophic chondrocytes
during endochondral ossification and stimulates osteoclastic functions. Loss of
TNF-α results in a delay in the resorption of mineralized cartilage, leading to the
prohibition of new bone formation, resulting in an inhibition of fracture healing
(62).
1.2.6 Angiogenic and Metalloproteinase Factors
Matrix metalloproteinases (MMPs) are an enzyme family of more than 20
zinc-dependent proteases that are largely responsible for the degradation of
extra-cellular matrix and are therefore required for extra-cellular matrix
remodeling (64-66). During the last stages of endochondral ossification and
remodeling, matrix metalloproteinases degrade the cartilage and bone and
allows the infiltration of new blood vessels (27). During fracture healing, MMPs

12
2, 9, 13, and 14 are quantitatively expressed at the highest levels while lower
levels of MMP 16, 19, 23, and 24 expression are observed (67).
As stated earlier, angiogenesis that results in adequate blood supply to
the fracture site is essential for bone regeneration. There are two separate
pathways that are believed to help regulate angiogenesis. The first pathway is a
vascular-endothelial growth factor (VEGF) dependent pathway. The second is
the angiopoietin-dependent pathway (27). Both pathways are most likely
functional during fracture repair, with VEGF being essential in mediating new
angiogenesis and endothelial-cell mitogens (68) and angiopoietin 1 and 2 being
responsible for regulating vascular morphogenetic molecules responsible for
forming larger blood vessels and developing branches off of existing vessels
(27).
1.3.0 Bone Mineral Density, Bone Quality and Fracture Risk
Osteoporosis is a debilitating disease characterized by low bone mass
and structural deterioration of bone. This leads to bone fragility and an increased
risk of fracture (69). Fracture resistance is determined by the strength of the
bone, which is dependent on the geometric properties, the activities of cells in the
bone tissue, and the material properties of the bone tissue (70-72). However,
unlike fragility, which can only be measured by destructive means, bone mineral
density is readily accessible by non-invasive measures of bone mineral content.
Therefore, the most commonly used clinical indication of osteoporosis and
fracture risk is by measuring bone mineral density (73). Evidence suggests that

13
over 70% of peak bone mass is determined genetically in humans (74-80) and
studies have begun to investigate the genes that may be responsible for
acquiring adult peak bone density. In one report, it was suggested that vitamin
D receptor (VDR) alleles can be associated with, and possibly responsible for,
genetic variations in bone density (81). However, translating this data to human
populations has provided various results (82-84). These conflicting results are
thought to be attributed to the genetic heterogeneity of the human population
along with environmental differences in the studied populations.
In contrast, inbred mice possess identical genetic backgrounds and
therefore provide excellent animals to study the involvement of genetic factors
including bone mineral density. Inbred strains of mice were developed by
repeated matings between siblings for at least 20 consecutive generations (85).
This resulted in nearly 100% homozygosity at all alleles across the mouse
genome. This process was continued through the 60th generation, allowing
inbred mice to become 100% homozygous at all loci (except for any spontaneous
mutations which arose), thereby providing genetically identical mice. Because
every inbred strain is genetically different from every other inbred strain, planned
matings to study the segregation of genes essential for bone density is possible
(86).
A number of laboratories have used quantitative trait loci (QTL) methods
to scan the mouse genome to identify candidate genetic loci, and ultimately the
genes that affect bone properties (87-92). Mineral content also has been
correlated with a variety of whole bone properties (including stiffness, strain and

14
ultimate load) (93,94). Moreover, studies have also shown that bone becomes
more brittle when the mineral content exceeds a critical value (95) and less able
to bear load when mineral content is too low (96). This indicates that having a
high bone mineral density may help prevent a bone fracture. However, no data
exists suggesting that having high mineral bone density will result in faster
healing if a fracture was sustained.
1.4.0 Arachidonic Acid Metabolism
Because the inflammation stage is an important part of the repair process
in the normal response to infection or injury, it is important to study the pathways
that help mediate these responses. One important pathway is the arachidonic
acid pathway (Figure 1.1).

15
Arachidonic acid is an ω-6 polyunsaturated fatty acid that is converted into
biologically active lipid compounds termed eicosanoids (97). Eicosanoids
comprise a large family of biologically active lipid mediators that are produced by
two enzyme classes, cyclooxygenase (COX) and 5-lipoxygenase (LOX), which
then produce prostaglandins and leukotrienes, respectively (98-103).
Prostaglandins and leukotrienes are involved in diverse biological functions,
including cell proliferation (104,105), cell survival (106-108), modulate cell
adhesion and motility (105,106), angiogenesis (108,109), increased vascular
permeability (110,111), and inflammation (97,112),
1.4.1 Prostaglandin Biosynthesis
Prostaglandins are made by most cells of the body and act locally as
autocrine and paracrine lipid mediators (113). Osteoblasts synthesize
prostaglandins to stimulate bone formation and aid in bone resorption (114).
Prostaglandins are not stored, but are synthesized from membrane-released
arachidonic acid when cells are stimulated by mechanical trauma or by a specific
growth factor or cytokine. This signaling ultimately affects intracellular cAMP and
calcium levels by a specific receptor or group of receptors (97,115).
As seen on the left side of Figure 1.1, after stimulation, phosholipase A2
causes the hydrolysis of arachidonic acid from the glycerophospholipids of the
cell membrane (116-118). The COX enzyme converts the released arachidonic
acid into prostaglandin G2 (PGG2) by adding two oxygen molecules (119).
Additional peroxidase activity reduces this PGG2 to its 15-hydroxy analog,

16
prostaglandin H2 (PGH2) (113,120-122). Isomerases further convert PGH2 into
prostaglandin E2, prostaglandin D2, prostaglandin F2, prostaglandin I2 and
thromboxane A2 (113,120,121,123).
There are two main isoforms of the COX enzyme, prostaglandin
endoperoxide H synthases-1 and 2 (PGHS-1 and PGHS-2). These are more
commonly called cyclooxygenase-1 (COX-1) and cyclooxygenase-2 (COX-2).
COX-1 is always present in tissues, while COX-2 is induced by appropriate
physiological stimuli, such as cytokines, tumor promoters, and growth factors
(124,125). The genes for these two enzymes are about 65% homologous in their
coding regions and each have a molecular weight of approximately 70kD
(126,127). COX-1 and COX-2 are products of distinct, single-copy genes located
on different chromosomes (128-134). The promoter region of the COX-2 gene (or
Ptgs2) contains a TATA sequence, but the COX-1 gene (or Ptgs1) promoter
lacks a TATA box (116). Through crystallographic analysis, an important
difference between COX-1 and COX-2 was observed. The long hydrophobic
channel running from the membrane-binding surface of the enzyme to the active
site was somewhat larger in COX-2. Also, COX-2 had a small side pocket
pointing away from the catalytic site (116,119). While there are differences
between the two genes, the enzymatic activities and substrate specificities are
similar (116,135).

17
1.4.1.1 Homeostatic versus Pro-Inflammatory Actions of COX-1 and COX-2
COX-1 is the only cyclooxygenase isoform expressed in normal gastric
mucosa and is the only cyclooxygenase found in platelets (123). In the gastric
antrum (or the distal part of the stomach before the outlet lined with mucosa not
involved in acid production), PGE2 and PGI2, which are synthesized as a result of
COX-1 activity, promote vasodilation that maintains mucosal integrity (136). In
the kidney, COX-1 generates the vasodilatory prostaglandins PGE2 and PGI2 that
helps maintain blood flow and glomerular filtration rates (137,138). In platelets,
COX-1 is essential for production of thromboxane A2 (TBA2), which is necessary
for platelet aggregation (139). Therefore, it is suggested that the main function of
COX-1 is to maintain homeostasis and promote specific physiological activities.
Unlike COX-1, COX-2 is not detectable in most normal tissues, (113,120-
122,140). However, when macrophages and endothelial cells were challenged
with inflammatory mediators, COX-2 mRNA and COX-2 protein were up-
regulated at the sites of inflammation and detectable before the increase in local
prostaglandin production (141). While COX-1 was present in both macrophages
and endothelial cells, it was not upregulated after challenged with inflammatory
mediators. This suggested that COX-2 is an inducible enzyme that accounts for
the local increase in production of arachidonic acid metabolites at the sites of
inflammation. These metabolites are responsible for edema, vasodilation and
pain, all clinical signs of inflammation (141).
Recent investigations have shown that these are only generalizations of
the roles COX-1 and COX-2 play. Animal studies have shown that COX-2 also

18
plays a homeostatic role, as it is constitutively expressed in the kidney (142,143)
and brain (144,145). Furthermore, while it is induced by inflammatory responses,
it is also induced by physiological stimuli in the ovary (146), uterus (147,148),
kidney (142), brain (149), cartilage (150), and bone (151,152). In addition, COX-
1 has been shown to be inducible and not solely homeostatic. After radiation
injury, it is present in the crypt cells of the small intestine (153). It also may play
a role and contribute to inflammation (154). All of these findings indicate that the
individual roles of COX-1 and COX-2 need further investigation.
1.4.2 Leukotriene Biosynthesis
Leukotrienes are mainly made by inflammatory cells, such as
polymorphonuclear leukocytes, macrophages, and mast cells. Leukotrienes are
lipid mediators that are integral in immune responses and maintaining tissue
homeostasis (97). Synthesis of leukotrienes may be divided into two pathways,
one to create the slow reacting substances of anaphylaxis [(SRS-A) or cysteinyl
leukotrines (CysLTs)] and the other to create leukotriene B4 (LTB4) (155).
5-lipoxygenase (5-LO) is the key enzyme responsible in synthesizing
leukotrienes and is located in the nucleus and cytosol of different cell types (156).
This enzyme is a 72 to 80 kD monomeric soluble protein that contains a
nonheme iron believed to be necessary for catalysis (157). Furthermore, 5-LO
requires Ca2++ and is stimulated by ATP, membranes, phosphatidylcholine, and
lipid hydroperoxides (158).

19
Following cellular stimulation, arachidonic acid is released by
phospholipase A2 (Figure 1.1). Subsequently, 5-LO catalyzes the oxidation of
arachidonic acid at the five-position to produce 5-hydroperoxy eicosatetraenoic
acid (5-HpETE), which is dehydrated to produce the epoxide, leukotriene A4
(LTA4). LTA4 is the critical intermediate in the synthesis of inflammatory and
anaphylactic mediators. Depending on the cellular circumstance, LTA4 has three
possible fates: hydrolysis, conjugation with glutathione, or transcellular
metabolism to generate bioactive lipid mediators (159). In the neutrophil and
monocyte, LTA4 is mainly converted to the chemoattractant LTB4 by LTA4
hydrolase (160). In human eosinophils, mast cells and basophils, LTA4 is
conjugated with reduced glutathione by LTC4 synthase to form LTC4 (161).
Further enzymatic activity on LTC4 can subsequently generate the extracellular
metabolites, LTD4 and LTE4. LTC4, LTD4 and LTE4 make up the CysLTs, a
group of slow-reacting substances of anaphylaxis that sustain smooth muscle
contraction (99).
Lipoxins (lipoxygenase interaction products or LXs) are also generated
through the sequential lipoxygenation of arachidonic acid by 15- and 5-
lipoxygenase to yield an unstable epoxide intermediate, 5(6)epoxytetraene
(101,162). This intermediate may then be converted to the major bioactive
lipoxins, LXA4 and LXB4 through reactions catalyzed by LXA4 and LXB4
hydrolases (101,162). Lipoxin biosynthesis is greatly changed through
transcellular pathways if granulocytes are activated during co-incubation with
platelets (163-168). Platelets cannot generate lipoxins from arachidonic acid.

20
During transcellular interactions, however, platelets convert neutrophil-derived
LTA4 to 5(6)epoxytetraene through the action of platelet 12-lipoxygenase (12-LO)
(163-168). This same enzyme functions as 15-lipoxygenase (15-LO) when its
substrate is LTA4. Therefore, within the multicellular inflammatory environment,
LTA4 can serve as a crucial intermediate for both leukotriene and lipoxin
formation.
Leukotriene action requires G-protein-coupled receptors. These receptors
are members of the rhodopsin-like receptor superfamily (169,170). LTB4 signals
through either the BLT1 or BLT2 receptors which ultimately affect intracellular
cAMP or calcium levels (102,171-174). The CysLTs signal through the CysLT1
or CysLT2 receptors to affect intracellular calcium (175-177).
Similar to prostaglandins, the functions of all leukotrienes are not known
and their functions may possibly be cell-specific.
Additionally, 5-lipoxygenase activity is dependent on a protein cofactor, 5-
lipoxygenase activating protein, or FLAP. FLAP is an 18 kD membrane
associated arachidonic acid binding protein whose function is to optimally
present substrate to 5-LO (178).
1.4.3 Drugs Affecting Prostaglandin and Leukotriene Formation and Action
Nonsteroidal anti-inflammatory drugs (NSAIDs) function by inhibiting
cyclooxygenase activity. Traditionally, NSAIDs have inhibited COX-1 activity as
much or more than COX-2. For example, indomethacin acts primarily on COX-1,
while ibuprofen affects COX-1 and COX-2 equally (179). This activity resulted in

21
the desired outcome of decreased inflammation by inhibiting COX-2; however, it
also inhibited the prostaglandin production by COX-1, which is necessary for
normal cell function. Consequentially, this lead to multiple negative side effects,
such as gastric bleeding and ulceration (136,180-182). Estimates indicate that
about 25% of patients using traditional NSAIDs experience some side effects,
with about 2% developing serious health issues (183-185). In response to these
problems, drugs were developed that target the COX-2 enzyme more specifically
(COXIBs). The goal of this was to interfere with the production of prostaglandins
manufactured though the COX-2 pathway while simultaneously sparing the
prostaglandins produced by COX-1 that are necessary for normal tissue function
(179,186)
Leukotriene action may be blocked by inhibiting leukotriene production or
by inhibiting leukotrienes from binding to their cellular receptors (187). Because
leukotrienes work to contract smooth muscle, increase vascular permeability
increase mucus secretion and attract and activate inflammatory cells, most
leukotriene inhibitors were developed for patients with asthma (188). Zileuton, a
specific inhibitor of 5-LO, inhibits the production of leukotrienes, especially LTB4,
LTC4, LTD4 and LTE4. Zafirlukast and montelukast are both selective and
competitive leukotriene receptor antagonists of LTD4 and LTE4 (189,190).

22
1.5.0 Evaluation of Experimental Fracture Healing
1.5.1 Radiography
Radiography is one of the more useful diagnostic tools in assessing
fracture healing and is essential for identifying and defining a fracture (191).
Radiography provides a minimally invasive way to visualize callus formation after
mineralization (192,193). With the aid of anesthesia, animals may be serially
radiographed to allow assessment of fracture healing over time without sacrifice.
While many fractures are visible as an abnormal radiolucent line, some
fractures have no visible line, particularly those due to compression or other
pathological process. Since standard radiography only generates a two-
dimensional image, a minimum of two views is usually necessary. The views are
usually perpendicular to each other in order to adequately assess the fracture
and subsequent healing process (191).
High resolution radiography is useful by magnifying information not easily
detected using standard radiography. Magnifying a film is achieved by one of
two ways: by either optically enlarging the image using fine grain film or by
increased the distance between the specimen and the film. With a small x-ray
focal spot and an air gap to decrease scatter, a two to fourfold geometric
enlargement may be obtained (194,195).
In fracture healing animal studies, radiographs are typically taken
immediately after surgery to examine the location of the fracture and the quality
of the fixation. Additionally, post-sacrifice radiographs are also generally taken
and may be used for a variety of measurements, such as bone density or bone

23
dimensions. For long bone fractures, various healing parameters, such as
periosteal reaction (callus formation), quality of union and bone remodeling, may
be quantified on radiographs by using different scoring systems.
1.5.2 Histology and Histomorphometry
Histology is another basic parameter for assessing fracture healing in
animal models. Common histological parameters, including callus formation,
bone union, marrow changes and cortex remodeling, may be examined by using
stained calcified or decalcified sections cut through the fracture callus and
surrounding area (196,197).
Histomorphometry is another useful tool in evaluating fracture healing.
Slides prepared for histological examination may be used to calculate multiple
parameters, including specific cell counts, bone length and callus area.
However, unlike histology, which presents a qualitative assessment of fracture
healing, histomorphometry allows for quantitative assessment (198).
1.5.3 Mechanical Testing
Since one goal of fracture healing is to restore the mechanical integrity of
the bone, the mechanical properties of the healing fracture callus are important to
investigate. In order to evaluate the mechanical properties at the structural
(whole bone) or material (bone tissue) level, mechanical testing of the fractured
and contralateral control limb is frequently performed. Cross-sectional geometry
is determined from the measurement of the bone before testing or from

24
measuring the contralateral control bone. Structural properties (for example,
peak torque and rigidity) may then be measured or calculated from torsion or
bending tests. Material properties (shear stress and shear modulus) may also be
estimated by using the measured geometric and structural properties along with
appropriate engineering equations. Three types of tests are most commonly
used in estimating the mechanical properties of whole or fractured bone: three-
point bending, four-point bending and torsional testing (199).
1.5.3.1 Three-Point Bending
Standard three-point bending is performed by placing the specimen on
two supports. A center load is then placed equidistant between the supports to
equally distribute the force across the two supports (Figure 1.2, panels A and B).
The force generated by the center load that is required to bend the bone a
specific distance or break the bone is measured. In addition, the distance the
center load travels is also measured. The force generated from the center load
creates compressive and tensile forces on the specimen on opposite sides. Due
to its simplistic nature, many whole-bone studies implement the use of a three-
point bending model. However, this model is considered inadequate for fracture
healing studies since this type of bending test places a large center load on the
fracture site, leading to high shear stresses and inconsistent movement near the
midsection of the bone and distortion of the fracture callus during testing (Figure
1.2, Panel C) (200).

25
1.5.3.2 Four-Point Bending
A four-point bending mechanical test is another common protocol used in
many animal studies. Four-point bending is designed with the specimen placed
on two end supports. Two center loads are placed a uniform distance from the
two supports (Figure 1.3, Panels A and B) and the force generated by these two
loads that is required to bend the bone a specific distance or break the bone is
measured. The force generated from the center loads creates compressive and
tensile forces on the specimen on opposite sides. Four-point loading produces
pure bending between the upper two loading points. However, four-point
bending requires that the force at each loading point be equivalent. This is hard
to achieve when the material is irregularly shaped, such as with bone.
Additionally, the span of the specimen that is loaded must be sufficiently long
(usually sixteen times the thickness of the specimen) to reduce measurement
errors (200). This is because if the working length is very short, most of the
displacement induced by loading will be due to shear stresses and not bending.

26
To guarantee a length-to-width ratio of 16:1 in small animal models would be
nearly impossible. Also, various locations and sizes of the newly formed fracture
callus would further make consistent placement of the loads and supports more
complicated (Figure 1.3, Panel C). Finally, any internal fracture stabilization
would have to be removed prior to testing, potentially destroying the sample.
1.5.3.3 Torsional Mechanical Testing
Torsional mechanical tests are performed by rigidly securing (“potting”) the
two ends of the sample in place to prevent slipping, while the working length, or
gage length (GL), remains exposed. This test is performed by twisting one end
of the specimen while the other end is held fixed (Figure 1.4, Panels A and B).
Parameters calculated from torsion tests, such as torsional rigidity, shear stress,
and shear modulus are useful for determining the structural and material
properties of the healing tissue. This type of mechanical test requires the
specimen to be perpendicular to the potted ends and to be located on the neutral
axis to ensure accuracy. Therefore, uniform samples are better suited for this
type of mechanical testing. While the curved geometry of the tibia and the

27
confounding effect of the fibula make it unsuitable for torsional mechanical
testing, the femur is a relatively straight long bone that should be more ideal for
torsional testing. Furthermore, unlike bending tests, there is more flexibility as to
the location and size of the fracture callus and to the size of the sample
specimen (Figure 1.4, Panel C). Additionally, any internal fixation may remain
during testing without compromising the results. This is because the stabilization
should be located at the neutral axis and should not affect the testing (201).
Therefore, smaller animals, like the mouse, may also be tested effectively.
1.6.0 Models of Fracture Healing
Fracture healing has been evaluated using several animal models and
various fracture types. The selection of the model type is dependent on the aims
of the particular experiment. The challenges in experimental fracture models
involve the stability of the fixation and the reproducibility in creating a natural
fracture to give a valid representation of the fracture repair process (202,203). In

28
essence, a proper animal model must follow a highly reproducible order of events
beginning with hematoma formation followed by inflammation, cell migration and
proliferation, chondrocyte differentiation, endochondral ossification, and bone
remodeling. Furthermore, animals used for biomechanical models should follow
the four biomechanical stages of fracture healing as proposed by White et al. in
1977 (Table 1.1). These stages correlate with the progressive increases in the
average force and energy absorption to failure as healing progresses (204).
Table 1.1. The Four Biomechanical Stages of Fracture Healing (204).
Stage Description
I Bone fails through original fracture site. Low-stiffness with rubbery pattern.
II Bone fails through original fracture site. High-stiffness with hard-tissue pattern
III Bone fails partially through original fracture and partially through intact bone. High-stiffness with hard-tissue pattern.
IV Bone fails through intact bone. High-stiffness with hard-tissue pattern.
Animals most commonly used for fracture models are mice, rats, rabbits,
dogs, sheep and goats (203,205-207). Large animal models, like dogs, closely
resemble human bone and are valuable in orthopaedic studies (202). However,
the ultimate cost of using these models may be restricting. Some animal fracture
models (for example, the mouse and rat) differ physiologically from human
cortical bone by lacking normal haversian remodeling. Rodent cortical bone
remodeling occurs primarily along endosteal and periosteal surfaces (208). This
is a particularly important difference during remodeling. In spite of this, rodents
are widely used in orthopaedic research. While the rat has been extensively
used in fracture studies (209-215), recent literature suggests that in vivo murine

29
models are becoming increasingly important in bone research. Using the mouse
model allows investigators to examine the interactions between the mechanical,
metabolic and functional characterizations of bone in animals with targeted
genetic alterations.
Previous fracture models in the mouse have used the mandible, ribs, tibia,
and femur as the fracture site to study bone healing. Studies including the
distraction osteogenesis model for the mouse (216) and mandibular osteotomy
murine model (217) were used to explore intramembranous ossification in
genetically altered mice. Therefore, using these models is not suitable for
exploring the endochondral ossification response associated with fracture
healing. The mouse rib was fractured to study the expression of
metalloproteinase-13 during fracture healing (218). Unfortunately, mechanically
testing this type of bone using any method is difficult and inconsistent. Two
investigators have reported on the development of a tibial fracture model, both
non-stabilized (219) and stabilized (220). This tibial fracture model was
subsequently applied to study both the histological and gene expression patterns
during fracture healing in the mouse tibia (221-224). Lastly, the murine femoral
model has also been used to study genetic expression (225-233) and mechanical
properties (234-237) of fracture healing. However, in none of these studies were
the radiographic, histological, and mechanical testing analyses extensively used
to characterize the fracture healing pathway and none of the reports described
the torsional mechanical properties of the fractured limbs.

30
2.0.0 Rationale and Hypothesis
With the development of mice with targeted genetic mutations, in vivo
murine models are becoming increasing valuable in the field of orthopaedics.
Additionally, evaluating the healing tissues using a torsional testing protocol
better estimates the biomechanical properties and is more reproducible than
using other mechanical testing protocols, especially involving smaller specimens.
The development of a reproducible femur fracture model in the mouse suitable
for torsional mechanical testing would be important in the study of complex
genes and phenotypes associated with bone diseases.
While previous investigators have used the mouse as a fracture model,
none of these studies extensively explored the radiographic, histological, and
mechanical testing analyses used to characterize the fracture healing pathway.
Furthermore, none of the reports described the torsional mechanical properties of
the fractured limbs. Consequently, the first phase of this study was to develop a
murine femoral fracture model capable of torsional mechanical testing in an
outbred mouse strain. The parameters investigated in this study were chosen
due to their relevance to previous fracture model literature, and included
radiographical, early histological, late histological, early biomechanical and late
biomechanical analyses.
After fully characterizing and validating the mouse fracture model and
torsional testing protocol, the next phase of this study was to explore a complex
phenotype that may affect bone healing. Bone mineral density has received
much attention because of its connection with osteoporotic fracture risk. While it

31
is well-established that low bone mineral density is valuable in predicting bone
fracture risk, no data exists to suggest that a high bone mineral density would be
useful once a fracture is sustained. The second phase of this study focused on
examining the role bone mineral density plays in fracture healing success. To
that end, fracture healing was examined in three inbred mouse strains
specifically chosen based on previously published bone mineral density data.
Radiographic, histological, histomorphometric and biomechanical analyses were
used to evaluate fracture healing in these inbred mouse strains to better
understand the role bone mineral density plays in fracture healing.
The final phase of this work focused on how altering a single pathway
affects fracture healing. Leukotrienes and prostaglandins are produced by the
activity of three enzymes, namely 5-lipoxygenase, cyclooxygenase-1, and
cyclooxygenase-2, as part of the arachidonic acid pathway. The arachidonic acid
pathway, its products and the enzymes mediating their formation, play a crucial
role in multiple aspects of human physiology, including vascular homeostasis,
gastric protection, renal homeostasis, bone formation, and inflammation.
Because inflammation is also a vital stage in the fracture healing cascade, the
potential blocking of the arachidonic acid pathway may lead to deleterious results
in fracture healing. Additionally, manipulating the arachidonic acid pathway may
promote fracture healing. To explore how manipulating arachidonic acid
metabolism affected fracture healing, fractures in genetically modified mice were
assessed using the fracture model, torsional testing protocol, and parameters as
described above. Lastly, fracture callus eicosanoid levels were measured to

32
determine if the arachidonic acid cascade reroutes itself under genetic
conditions.
The hypothesis of this work was that the mouse is an exceptionally
valuable tool in studying various orthopaedic conditions that involve genetics and
complex phenotypes. Further, biomechanical testing provides a better
understanding of healing bone properties. Developing a useful mouse model in
conjunction with a suitable testing protocol will better estimate key properties to
assess fracture healing success. Understanding the mechanisms which cause
the fracture healing pathway to be inhibited or enhanced will provide potential
future treatments for fracture healing patients, as well as the normal mechanisms
needed for fracture healing success.

33
3.0.0 Materials and Methods
3.1.0 Mouse Strain Models
The experiments completed for this dissertation involved outbred, inbred
and knock-out mouse strains and phenotypes. Table 3.1 is a summary of all
animals bred and purchased for all experiments.
3.1.1 Outbred Strains
The mouse strain used to develop the fracture model and as a source of
controls was the ICR. The ICR mouse was chosen because it is a commercially
available, resilient, outbred stock. The ICR mouse was developed for its good
reproductive performance and fast growth rate. The ICR line is typically a docile
strain and produces large litter sizes (Taconic website). While relatively healthy,
ICR mice do carry a recessive gene, Pde6brdl. This mutation is known to cause
retinal degeneration (Taconic Website).
3.1.2 Inbred Strains
To examine the relationship between bone mineral density and fracture
healing, female C3H, DBA/2, and C57BL/6 inbred mouse strains were chosen
based on previously published bone mineral density data (C3H= 0.83 g/cm2;
DBA/2= 0.58 g/cm2; C57BL/6= 0.45 g/cm2) (238) Mice of an inbred strain are as
genetically alike as possible, being homozygous at virtually all of their loci (85).
While some traits may be influenced by diet and environment, many traits do not
vary from generation to generation. Furthermore, all inbred strains have a

34
unique set of characteristics that set them apart from all other inbred strain (85).
The three strains selected are widely used in genetic studies. Similar to the ICR,
the C3H also carried the recessive gene for Pde6brd1, which causes retinal
degeneration (Taconic website).
3.1.3 Gene-Deficient (Knock-Out) Strains Three knock-out mouse models were utilized to examine how the
regulation of arachidonic acid metabolism alters fracture repair. These are the
Ptgs1 deficient mouse, the Ptgs2 deficient mouse and the Alox5 deficient mouse.
All three of these mouse lines were developed to study inflammation and a
detailed description of each is found below.
3.1.3.1 Description of Cyclooxygenase-1 Deficient Mice
To study the physiological role of cyclooxygenase-1 (COX-1), the Ptgs1
gene that encodes COX-1 was disrupted to create the cyclooxygenase-1
deficient (Cox-1KO) mouse (154). The disruption of the gene before exon 11
was chosen based on literature that showed aspirin inactivates COX-1 by
acetylating Ser-530 (239-241). The targeting vector for disrupting COX-1 was
designed to replace approximately 1 kb of intron 10, the intron 10: exon 11 splice
junction and first 44 bp of exon 11 with the neomycin resistant (Neo) gene (154).
Any protein made from this resultant disrupted gene would lack the carboxy-
terminal 120 amino acids, which includes Ser-530 in the active site of the
enzymes. Splicing that resulted in the elimination of the Neo cassette would

35
result in the elimination of 14 amino acids and the loss of the proper reading
frame. Thus, this targeting should produce a null allele of COX-1. The targeting
vector was electroporated into E14TG2a embryonic stem cells. Positive stem
cells were injected into C57BL/6J blastocysts to generate mice with the COX-1
null allele.
Western blot analysis done by Langenbach et al. further showed that the
normal 70 kDa COX-1 protein was readily detectable in the kidney, stomach and
colon microsomes of wild-type F2 Ptgs1tm1Unc mice (154). However, normal-
sized or smaller COX-1 proteins fragments were detected in the same tissues
from homozygous Ptgs1tm1Unc mice. Further evaluation showed that the COX-1
protein levels were not significantly altered by lipopolysaccharide (LPS) in
macrophages from wild-type mice and was not detected in the homozygous
mutant mice. LPS did induce the COX-2 protein, COX-2 mRNA and PGE2,
similarly in peritoneal macrophages from wild-type and homozygous Ptgs1tm1Unc
mutant mice. These results show that the disruption on Ptgs1 prevents the
constitutive synthesis of COX-1, but does not alter Ptgs2 inducibility in
macrophages.
3.1.3.2 Description of Cyclooxygenase-2 Deficient Mice
To study the physiological role of the cyclooxygenase 2 (COX-2) isoform,
the Ptgs2 gene that encodes COX-2 was disrupted to create the
cyclooxygenase-2 deficient (Cox-2KO) mouse (242,243). The targeting vector
used to disrupt COX-2 introduces an insertion in exon 8 of Ptgs2 and
36
simultaneously deletes 104 bp from exon 8. This creates a null COX-2 allele.
The targeting vector was electroporated into E14TG2a embryonic stem cells.
Positive stem cells were injected into C57BL/6J blastocysts to generate mice with
the COX-2 null allele.
3.1.3.3 Description of 5-Lipoxygenase Deficient Mice
To study the physiological importance of leukotrienes, the 5-lipoxygenase
(5-LO) gene was disrupted by homologous recombination in embryonic stem
cells (244). The targeting vector was made by inserting a 1.7 kb PGK1neo
cassette into a Scal site in exon 6. The thymidine kinase gene was added to the
end of the targeting vector for negative selection using gancyclovir. The targeting
vector was electroporated into D3H-ES cells (245). Positive embryonic stem
cells were injected into C57BL/6J blastocytes and chimaeric offspring males
were mated with C57BL/6J females to pass this allele to future offspring.

3737
Strain Source Name Description Purpose
ICR Harlan Sprague Dawley Hsd:ICR (CD-1) Outbred Mouse Strain Development of torsion mouse
fracture model
ICR Taconic Farms IcrTac:ICR Outbred Mouse Strain Controls for bone mineral density and fracture healing
C3H Taconic Farms C3H/HeNTac-MTV Inbred Mouse Strain Bone mineral density and fracture healing
DBA/2 Taconic Farms DBA/2NTac Inbred Mouse Strain Bone mineral density and fracture healing
C57BL/6 Taconic Farms C57BL/6NTac Inbred Mouse Strain Bone mineral density and fracture healing
WT Jackson Laboratories C57BL/6J Inbred Mouse Strain Controls for Alox5-/- Arachidonic Acid Metabolism in Fracture Healing
Cox1-KO Taconic Farms and Bred in house
Cox1-/-; Ptgs1 knock-out mouse
Arachidonic Acid Metabolism in Fracture Healing
Cox1-HET Taconic Farms and Bred in House
Cox1+/-; Ptgs1 heterozygous mouse
Arachidonic Acid Metabolism in Fracture Healing
Cox1-WT Bred in house
B6;129P2-Ptgs1tm1Unc
Cox1+/+; Ptgs1 wild-type mouse
Arachidonic Acid Metabolism in Fracture Healing
Cox2-KO Taconic Farms and Bred in House
Cox2-/-; Ptgs2 knock-out mouse
Arachidonic Acid Metabolism in Fracture Healing
Cox2-HET Taconic Farms and Bred in house
Cox2+/-; Ptgs2 heterozygous mouse
Arachidonic Acid Metabolism in Fracture Healing
Cox2-WT Bred in house and Bred in house
B6;129P2- Ptgs2tm1Smi
Cox2+/+; Ptgs2 wild-type mouse
Arachidonic Acid Metabolism in Fracture Healing
5-LOKO Jackson Laboratories and Bred in House
*B6;129S2-Alox5tm1Fun/J
Alox5-/-; Alox5 knock-out mouse
Arachidonic Acid Metabolism in Fracture Healing
Table 3.1. Strain Descriptions and Nomenclature Used in This Dissertation. *This strain originated on a B6;129S2 background and has been backcrossed into the C57BL/6J background.

38
3.2.0 General Health, Breeding and Maintenance of Animals
3.2.1 Cyclooxygenase-1 Deficient Mice
The COX-1 deficient mouse develops normally and appears healthy.
Previously published necropsy and microscopic examination of selected tissues,
such as the heart, liver, and spleen showed no significant pathology (154).
However, there was a minimal difference noticed in the kidneys, mainly
characterized by one or two foci per section of basophilic, immature tubules in
the Cox-1KO mice (154).
Cox-1KO females and males are fertile. However, crosses between Cox-
1KO males and females result in smaller litter sizes (154). For these
experiments, initial matings involved a Cox-1KO male with a Cox-1HET female to
produce both Cox-1KO and Cox-1HET offspring. Preliminary data including the
Cox-1HET showed no significant differences when compared to the Cox-1KO
animals (data not shown). Thus, the mating scheme was altered to solely be
Cox-1KO males mating with Cox-1KO females to produce all Cox-1KO offspring,
as the Cox-1HET group was eliminated from future experiments.
3.2.2 Cyclooxygenase-2 Deficient Mice
The COX-2 deficient mouse was previously found to have specific peri-
natal kidney pathologies that lead to increased mortality among Cox-2KO mice
(242,243). Because of the high death incidence of Cox-2KO animals at about 8
weeks, Morham et al. examined Cox-2WT, Cox-2HET and Cox-2KO for any
pathological disorders in several tissues, including brain, heart, liver, spleen, and

39
kidney (242). While no noticeable physiological issues were reported with either
the Cox-2HET or Cox-2WT mice, these investigations showed that the Cox-2KO
mouse kidney had several significant and consistent genotype-related
abnormalities. Cox-2KO animals had kidney lesions ranging from mild to
extremely severe that were characterized by abnormal subcapsular parenchyma
with small immature glomeruli and tubules. These findings were consistent with
nephron hypoplasia. Other cases involved a thinned renal cortex, with reduced
numbers of glomeruli as compared to the wild-type kidneys. Glomeruli not in the
hypoplastic region were often enlarged. Other findings included cortical areas
with tubular atrophy and regeneration, tubular dilation, interstitial inflammation
and fibrosis, and papillary mineralization. These symptoms were more
pronounced in the male than the female. Furthermore, these abnormalities were
not present in Cox-2KO mice sacrificed at three days, suggesting that the kidney
problems observed are a postnatal developmental that increase in severity with
increasing age (242).
Other health problems observed by Morham et al. in the Cox-2KO animals
were cases of suppurative peritonitis in two-thirds of the examined animals at 8
weeks of age (242). While no abnormalities were observed in the Cox-2WT
animals, the male Cox-2KO mouse examined had acute suppurative peritonitis
and the female Cox-2KO mouse had chronic suppurative peritonitis. The Cox-
2KO female mouse had multiple adhesions around the abdominal organs. These
adhesions corresponded to abscesses and chronic inflammatory tissue bridged
the lobes of the liver and loops of the bowel. This peritonitis affected multiple

40
abdominal organs and was characterized by serosal exudation and focal
necrotizing inflammation penetrating into the superficial tissues of the viscera and
retroperitoneum (242).
While the experiments here did not specifically address a single organ or
organ system, differences among Cox-2KO animals compared to Cox-2HET and
Cox-2WT included a lower weight at surgery (Table 4.6), a higher death rate
associated with anesthesia (Table 4.5) and a higher instance of dying before
reaching the appropriate time point, as 8 out of 14 animals lost before reaching a
time point were Cox-2KO animals.
Cox-2KO male mice are fertile, but female Cox-2KO mice are infertile
(246). Therefore, Cox-2KO male mice were mated to Cox-2HET female mice.
Based upon Mendelian genetics, half of the offspring should be Cox-2KOs and
half should be Cox-2HETs. However, the number of Cox-2KO mice that were
weaned was approximately 25% of every litter, due to Cox-2KO pups having a
higher mortality rate than their control littermates. This was also shown by
Morham et al. and Dinchuk et al., who also found abnormal Mendelian ratios for
Cox-2KO mice that reached weaning (approximately 20 days old) (242,246).
Cox-2WT animals were produced by mating Cox-2HET males with Cox-2HET
females to produce the initial offspring. This mating scheme should theoretically
result in 25% of every litter being Cox-2WT, 50% Cox-2HET and 25% Cox-2KO.
However, in practice this resulted in approximately 40% Cox-2WT, 50% Cox-
2HET and 10% Cox-2KO. Subsequent Cox-2WT animals were produced by

41
mating male Cox-2WT animals with female Cox-2WT animals, resulting in an all
Cox-2WT population.
3.2.3 5-Lipoxygenase Deficient Mice
Previous studies found no physiological abnormalities 5-LOKO mice up to
ten months of age (244). The only noticeable difference was in the spleen being
statistically smaller (p<0.05) when compared to 5-LOWT animals (244).
Examination of total blood cell populations, differential cell counts and analysis of
bone marrow showed no evidence of abnormal precursor cells of any lineage in
either 5-LOKO or 5-LOWT animals (244). This indicated that 5-Lipoxygenase
products are not required for normal development and is not necessary in the
mouse under normal physiological conditions (244).
Male and female 5-LOKO animals are fertile. Therefore, 5-LOKO males
were mated to 5-LOKO females to produce all 5-LOKO offspring. Genotyping of
random 5-LOKO offspring was checked periodically to insure that mice being
produced were in fact 5-LOKO animals.
Matings to produce wild-type control animals for experiments using 5-
LOKO animals was not necessary, as the appropriate identical genetic
background control animals used in these experiments (C57BL/6, WT) were
commercially available and purchased from Jackson Laboratories (Bar Harbor,
ME).

42
3.3.0 Tail Biopsy and Genotyping of Mice
At weaning (approximately 28 days), a one to two centimeter section of tail
was clipped from each animal. Lysis and purification of the mouse tail DNA was
performed using a Qiagen DNeasy kit (Qiagen Inc., Valencia, CA) as per the
manufacturer’s specifications for purification of total DNA from rodent tails. To
obtain optimum DNA yield and quality, only a 0.4 to 0.6 cm sample of tail was
used for purification to prevent overloading of the DNeasy spin columns. The
expected yield of genomic DNA was between 10 and 40 μg per tail biopsy.
However, DNA yield was dependent on the strain, biopsy length and mouse age.
Briefly, samples were first lysed using proteinase K. The buffering
conditions are then adjusted to provide optimal DNA-binding conditions and the
lysate is loaded onto the DNeasy Mini spin column. After a brief centrifugation,
DNA is selectively bound to the DNeasy membrane as contaminants pass
through. Any remaining contaminants and enzyme inhibitors are then removed
in two steps. Finally, the DNA is eluted in either water or TE buffer and is ready
for analysis.
Polymerase chain reaction (PCR) was performed with the tail biopsy DNA
to determine mouse genotype. The 10μl reaction volume consisted of 1μl of
dNTP mix, 1μl of Pyrococcus woesei (Pwo) polymerase, 1μl of 10X Pwo buffer,
1μl of primer solution, 0.4μl of genomic DNA solution and 5.6μl of distilled water.
Primers were purchase from Integrated DNA Technologies Inc. (Coralville, IA).
The primer solution consisted of 5mM of the forward primer and 5 mM of the

43
reverse primer. The 10X Pwo buffer contained 100 mM Tris-Cl (pH 8.8), 500 mM
KCl, 25 mM MgCL2 and 1% Triton X-100.
Optimal thermocycler parameters were empirically determined for each
primer set. It was found that primers sets used to genotype Cox-1KO, Cox1-WT,
5-LOKO and 5-LOWT produced optimal results using Program 1 (see below)
while primer sets for Cox-2KO and Cox-2WT produced optimal results using
Program 2 (see below).
Primers used in these studies are listed in Table 3.2. In the primer
sequences: C represents cytosine, G represents guanosine, T represents
thymidine and A represents adenosine.
Program 1: Step 1: 95 ºC for two minutes Step 2: 95 ºC for fifteen seconds Step 3: 55 ºC for thirty seconds Step 4: 72 ºC for one minute Step 5: Repeat steps 2-4, 34 times Step 6: Hold at 15 ºC
Program 2: Step 1: 95 ºC for two minutes Step 2: 95 ºC for fifteen seconds Step 3: 60 ºC for thirty seconds Step 4: 72 ºC for one minute Step 5: Repeat steps 2-4, 39 times Step 6: Hold at 15ºC
The resultant PCR product obtained after amplification was separated by
electrophoresis in a 2% agarose gel using 1X Tris-Borate EDTA (TBE) buffer (pH
8.3, 89 mM Tris, 89 mM boric acid and 2 mM EDTA). The gel was stained with

44
ethidium bromide and photographed using an instant camera (FR-PDC-34,
Fisher Scientific, Springfield, NJ) and Polaroid film (Type 667, Polaroid Corp.,
Waltham, MA). The genotype of each animal was based upon the base pair
sizes of the PCR product as indicated in Table 3.2.
Table 3.2. Mouse Primer Sequences and Amplification Sizes for PCR Genotyping of Mice Used in These Studies.
Gene Approximate Product Size (bp)
Forward Primer 5' to 3'
Reverse Primer 5' to 3' Reference
Cox1-KO 600 GCA GCC TCT GTT CCA CAT
ACA C
AAT CTG ACT TTC TGA AGT
TGC C Forward: (247);
Reverse: This Study
Cox1-WT 700 AGG AGA TGG CTG CTG AGT
TGG
AAT CTG ACT TTC TGA AGT
TGC C Forward: (247);
Reverse: This Study
Cox2-KO 950 ACG CGT CAC CTT AAT ATG
CG
TCC CTT CAC TAA ATG CCC
TC Forward and
Reverse:(247)
Cox2-WT 800 CCG ACA CCT TCA ACA TTG AAG ACC AGG
TCC CTT CAC TAA ATG CCC
TC
Forward: This Study;
Reverse:(247)
5LO-KO 600 ATC GCC TTC TTG ACG AGT
TC
GCA GGA AGT GGC TAC TGT
GGA Forward and
Reverse: (248)
5LO-WT 164 TGC AAC CCA GTA CTC ATC
AAG
GCA GGA AGT GGC TAC TGT
GGA Forward and
Reverse:(248)
3.4.0 Surgical Procedure and Fracture Model for Mice
Mice were anesthetized by an intraperitoneal injection (0.01 ml/g body
weight) of 10% ketamine and 5% xylazine. The right leg was scrubbed with a
10% povidone-iodine solution in preparation of surgery. A three millimeter
parapatellar incision was created and the patella was dislocated laterally to
expose the femoral condyles. A hole was drilled into the femoral intramedullary
canal at the intracondylar notch using a thirty-gauge needle (Becton Dickinson

45
Co., Franklin Lakes, NJ). The medullary canal was further reamed to the
proximal femur using a three-quarter inch, twenty-seven gauge needle (Becton
Dickinson Co.). Next, a 0.01 inch diameter stainless steel wire (Small Parts Inc.,
Miami Lakes, FL) was inserted into the intramedullary canal to retain the
impending fracture. A thirty-gauge two millimeter long wedge, taken from the tip
of the thirty-gauge needle, was then lodged between the bone at the femoral
condyles and the intramedullary pin to stabilize the pin in place. The wire
extending past the femoral condyles was cut and discarded. The patella was
repositioned and the incision was closed in two layers using 5-0 synthetic
absorbable suture (Ethicon Inc., Somerville, NJ).
A closed diaphyseal fracture was produced in the right femur using a
custom-made, three-point bending device (BBC Specialty Automotive Center,
Linden, NJ), similar to the methods described by Bonnarens and Einhorn (209).
The unfractured, left femur was used an internal control. The animals were
allowed free, unrestricted weight bearing after recovery from anesthesia. The
animals were sacrificed at the necessary time points using halothane gas (Sigma
Chemical Co., St. Louis, MO.)
3.5.0 Radiography of Mouse Femur Fractures
Fracture healing was examined by dorsal-ventral radiographs of the mice.
All animals were radiographed immediately post-fracture to verify that a mid-
diaphyseal fracture had been produced and once again at sacrifice to check for
pin slippage. A subset of animals in each experiment was serially radiographed

46
to assess fracture healing over the course of several weeks to months in the
same animal. Radiographs were made using a Model 804 Faxitron (Field
Emission Corp., McMinnville, OR) and Kodak Min-R 2000 mammography film
(Eastman Kodak Co., Rochester, NY). Mice were either anesthetized or
euthanized, as described above, prior to radiography.
3.6.0 Histology and Histomorphometry of Mouse Femur Fractures
3.6.1 Decalcified Histology of Fractured Femurs
Animals scheduled for decalcified histology had the fractured and
contralateral control limbs harvested, cleaned of soft tissue without disturbing the
callus and fixed in 10% buffered formalin (Fisher Scientific, Fair Lawn, NJ) or
STF (Streck Laboratories Inc., La Vista, NE). The femora were decalcified using
a 5% formic acid solution (Immunocal Decal Chemical Corp., Congers, NY),
dehydrated through successive grades of ethanol, cleared using d-Limonene-
based solvent (CitriSolve, Fisher Scientific) and paraffin embedded in Paraplast
X-Tra Tissue embedding medium (Fisher Scientific). The complete decalcified
embedding protocol is located in Appendix A.
The embedded femurs were then cut sagittally in the medio-lateral plane
into six μm sections using a manual microtome, stained with Masson’s trichrome
and examined by light microscopy. The protocol for Masson’s trichrome is
located in Appendix A.

47
3.6.2 Calcified Histology of Fractured Femurs
Animals scheduled for calcified histology had the fractured and
contralateral control limbs harvested, cleaned of soft tissue without disturbing the
callus and fixed in 10% buffered formalin overnight. The femora were then
dehydrated through successive grades of ethanol, cleared using a d-Limonene-
based solvent (Citrisolve, Fisher Scientific) and embedded in
polymethylmethacrylate (PMMA) (249). The complete calcified embedding
protocol is located in Appendix A.
A medio-lateral sagittal section was cut from each femur sample using a
low-speed saw (Isomet 11-1180, Buehler, Ltd., Evanston, IL). The cut section
was than polished on one side and glued onto a plexiglass slide. Samples were
allowed to adhere overnight and then ground down through four successively
finer grits of Carbimet sandpaper (Buehler, Ltd.). After approaching a thickness
of approximately 100 μm, samples were polished using a Mastertex 8 inch cloth
(Buehler, Ltd.) and 1 μm and 0.05 μm deagglomerated alpha alumina
micropolish (Buehler, Ltd.). Samples were then stained with Stevenel’s Blue,
counterstained with Van Gieson’s Picrofuchsin and examined by light microscopy
(250). The protocol for Stevenel’s Blue and Van Gieson’s Picrofuchsin is located
in Appendix A.

48
3.6.3 Histomorphometry of Fractured Femurs
3.6.3.1 Acquisition of Histological Images
Histomorphometrical measurements were made using ImageProPlus
software (v. 5.0.1.11, Media Cybernetics Inc., Silver Spring, MD).
Histomorphometric data was collected from digital microscopic images captured
using a Nikon DXM1200F camera, the Nikon ACT-1 software package (version
2.63, Nikon Co, Japan) and an Olympus BH2-RFCA light microscope (Olympus
America Inc, Center Valley, PA). Histomorphometric measurements were made
to calculate the total fracture area (TA), amount of cartilage (CA), fibrous
granulation tissue (GT), mineralized tissue (MA) and original femur bone (B) in
each fracture callus. Callus area (CALLUS) was calculated by subtracting the
original femur bone from the total fracture area (TA-B=CALLUS). Due to callus
sizes varying by the size of the femur and location of the sagittal section, further
analysis was done involving the amount of MA, CA and GT as a percentage of
callus area (%MA, %CA, %GT).
3.6.3.2 Statistical Analysis of Histomorphometrical Data
Means and standard deviations were calculated and statistical analysis of
the data was performed using an analysis of variance (ANOVA) with appropriate
post-hoc tests, as required. Differences were considered to be significant at p <
0.05. Statistical analysis was performed using SigmaStat 3.0 software (SPSS
Inc., Chicago, IL).

49
3.7.0 Mechanical Testing of Intact and Fractured Mouse Femurs
3.7.1 Preparation of Mouse Femurs for Mechanical Testing
Both the fractured and contralateral femurs were harvested and cleaned of
soft tissue without disturbing the callus. Femur length and the maximum
anteroposterior and mediolateral dimensions of the external fracture callus were
measured using electronic calipers (Mitutoyo Corp., Japan). Similar
measurements were made of the contralateral femurs. To minimize the
disturbance to the fracture callus, the pin was left in the femur during torsional
testing. Since the pin is the axis of rotation of the bone during torsional
mechanical testing, it should have theoretically no effect on the torsional
mechanical testing results (201).
3.7.2 Torsional Testing Protocol for Mouse Femurs
The distal and proximal ends of the femurs were cemented vertically in
0.25 inch hexagon acorn nuts (Small Parts Inc.) with cyanoacrylate glue
(Electron Microscopy Sciences, Hatfield, PA). The acorn nuts were then filled
with a self-curing acrylic powder and liquid system (Seta-Tray, Accurate Set, Inc.,
Newark, NJ) to only expose the mid-diaphyseal region of the femur. The self-
curing acrylic was prepared by mixing 10 grams of power with 10 milliliters of
liquid. The powder and liquid were mixed thoroughly for 20 seconds and allowed
to set until the composition has a paste-like consistency. Specimens were
rehydrated after the potting process by allowing the potted femurs to soak in
0.9% saline for one hour prior to testing.

50
Torsional testing was conducted on a servohydraulic testing machine
(MTS Corp., Minneapolis, MN, U.S.A.) using a 20 Nm reaction torque load cell
(Interface, Scottsdale, AZ). Because bone is anisotropic, femurs were internally
rotated to failure at an angular rotation rate of 1°/sec. The peak torque and
angular rotation at failure were measured from the torque-angle deflection
curves. From the callus dimensions, the polar moment of inertia (J) was
calculated based upon a hollow ellipse model (251,252). In contrast, cross
sectional area (A) of the fracture site was based on a solid ellipse model. Shear
stress (τ) and shear modulus (G) were also calculated (253). The wall-thickness
(t) value used in all equations was taken by averaging wall thickness
measurements of ten randomly chosen intact femurs from every strain and
phenotype. Left intact femurs were embedded as described above for calcified
histology. Transverse sections were cut from the resulting blocks. Wall thickness
was measured in four places from every slide and then averaged for each animal
for all ten animals in every group to obtain the average wall thickness. All
mechanical testing equations used are described in Appendix B.
3.7.3 Statistical Analysis of Torsional Mechanical Testing Data
Only femurs harvested and tested without an adverse incident were used
in the final calculations. Means and standard deviations were calculated and
statistical analysis of the data was performed. Unpaired two-tailed Student’s t-
tests were used when comparing only two groups or the same group but at
different time points. Paired two-tailed Student’s t-tests were used when

51
comparing the fractured and control limb of the same animal. Analysis involving
multiple groups or time points was performed using ANOVA with appropriate
post-hoc tests, as required. Differences were considered to be significant at p <
0.05.
3.8.0 Eicosanoids Levels in Fracture Callus
3.8.1 Fracture Callus Preparation
Closed femur fractures were produced in 5-LOKO, Cox-2KO, Cox-2HET,
Cox-2WT, Cox-1KO and C57BL/6 (WT) mice as described above. In addition, a
subset of the Cox-2KO mice and Cox-1KO mice were treated with either the
COX-1 selective inhibitor, SC-560 (Cayman Chemical Co. Ann Arbor, MI), or the
COX-2 selective inhibitor, rofecoxib (Vioxx, Merck, West Point, PA) at a dose of
30 mg/kg by oral gavage, 2 hours prior to sacrifice, respectively. All mice were
sacrificed at four days after fracture. The fracture callus with surrounding muscle
was quickly resected and flash frozen in liquid nitrogen. The callus was weighed
and pulverized using a mortar and pestle. The pulverized callus was extracted
into 5 volumes of M-PER buffer reagent (Pierce Biotechnology, Inc., Rockford,
IL) that was supplemented with protease inhibitors (Sigma Aldrich, St. Louis,
MO). The samples were placed on a mixer at 4°C for 30 minutes. The extract
was clarified by centrifugation at 10,000 rpm for 10 minutes at 4°C. The
supernatant was collected and stored at -80°C. An aliquot of the clarified extract
from the fracture callus was used to partially purify eicosanoids.

52
3.8.2 Purification Technique of Fracture Callus Eicosanoids
Two milliliters of ethanol was added to 0.5 milliliters of clarified extract and
the precipitate proteins were removed by centrifugation at 3000 x g for 10
minutes. The supernatant was dried in vacuo, resuspended in 1 M citrate buffer,
pH 4, and applied to a 500 mg C18 column (Waters Sep-Pak) that had been pre-
activated by methanol and water washes. The columns were washed with water
and hexane. Eicosanoids were eluted from the C18 resin using 5 milliliters of
ethyl acetate containing 1% methanol. The eluate was dried in vacuo to remove
all organic materials and resuspended in EIA buffer (0.4 M sodium chloride; 0.1
M sodium phosphate, pH 7.4; 1 mM ethylene-diamine-tetra-acetic acid; and 0.1%
bovine serum albumin).
3.8.3 Quantification of Fracture Callus Eicosanoids
PGE2, PGF2α, and LTB4 were measured using enzyme-linked
immunoassays as described by the manufacturer (Cayman Chemical, Ann Arbor,
MI). To ensure eicosanoid levels were in the proper range of the standard curve,
dilutions for each assay were made using EIA buffer. The PGE2, PGF2α, and
LTB4 concentrations were normalized to total protein concentration measured
using bicinchoninic acid (BCA Protein Assay, Pierce Biotechnology, Inc.,
Rockford, IL) (254).

53
3.8.4 Statistical Analysis of Fracture Callus Eicosanoids
PGE2, PGF2α and LTB4 levels were normalized to soluble protein
concentration and levels were compared between mouse genotypes and
treatment groups using ANOVA and post-hoc Holm-Sidak tests using SigmaStat
software (SPSS). Differences were considered to be significant at p < 0.05.

54
4.0.0 RESULTS
4.1.0 Characterization of a Closed Murine Femoral Fracture Model
4.1.1 Disposition of ICR Mice Used in This Study
Female ICR mice (Harlan Sprague Dawley, Indianapolis, IN) weighing
30.8 ± 3.2 grams (mean ± standard deviation) were used in this experiment. All
animals were 10 to 12 weeks old at the beginning of the study. All experimental
procedures were approved by the New Jersey Medical School Institutional
Animal Care and Use Committee. Of the 246 mice used as part of this study,
185 were ultimately included in the radiographic, histologic, and mechanical
analyses. This resulted in an overall success rate of 75.2%. A more detailed
disposition of the mice used in this study may be found in Table 4.1.
Table 4.1. Disposition of the 246 ICR Mice Used in the Study. Surgical Errors Mechanical Testing Histology
Anesthesia Death
Fracture Destabilization
Poor Fracture
Potting Errors
User Errors
Total Analyzed
Total Used
Number 8 6 8 35 4 68 117 Percentage 3.3 2.4 3.3 14.2 1.6 27.6 47.6 * An average of 9.75 femurs (range 4-14) was examined for each of the 12 histology time points.
4.1.2 Surgical Procedure for ICR Mice
The surgical procedure to produce the mouse femur fractures was easily
accomplished. One problem that arose while defining the overall surgical
procedure was the loss of fracture fixation by slippage of the pin from the
intramedullary canal. Several methods were explored to stop the pin from
slipping, and it was found that staking the pin in place using a 2-mm wedge from

55
the tip of a 30-gauge needle provided the most dependable fixation. This wedge
stabilization was subsequently used for all future experiments described.
Femoral fracture production was also easily achieved. Fractures were
consistently transverse or slightly oblique with minimal comminutions. Only 3.3%
of the fractures were eliminated from the study due to poor fracture quality (Table
4.1). The animals began to bear weight on their hind legs within a few hours
after the surgical procedure. A slight decrease in weight was observed between
2 days and 10 days post-surgery and a weight gain was seen from 14 days to 84
days post-fracture (Table 4.2).
Table 4.2. Average Pre-Surgical and Post-Sacrifice Weights of ICR Mice.
Time Point n Pre-Surgical Weight in Grams (Mean ± SD)
Post-Sacrifice Weight in Grams (Mean ± SD)
6 Hours 7 34.0 ± 1.6 34.0 ± 1.6
2 Days 11 30.7 ± 1.6 30.6 ± 1.8
4 Days 12 31.5 ± 0.9 31.0 ± 1.0
7 Days 16 30.9 ± 1.0 29.9 ± 1.5
10 Days 17 30.1 ± 1.7 28.8 ± 1.2
14 Days 13 29.7 ± 1.6 30.2 ± 1.3
21 Days 33 31.2 ± 2.4 32.5 ± 1.4
28 Days 44 31.8 ± 3.0 32.6 ± 2.8
42 Days 39 28.9 ± 1.3 32.2 ± 2.3
84 Days 32 30.8 ± 2.1 37.2 ± 3.2
4.1.3 Radiography of ICR Mouse Femurs
Fracture healing was assessed by serial radiography at 7, 10, 14, 21, 28,
and 42 days post-fracture using a representative group of animals. This allowed
for visual assessment of the healing process and was an indication of the

56
reproducibility of fracture healing between animals. Figure 4.1 shows the
timeline of fracture healing in two representative ICR mice.
Analysis of the radiographs showed anatomical reduction at the fracture
with periosteal lifting around the callus site visible at 7 days. A radiolucent zone
at the fracture line was still apparent at 14 and 21 days after fracture. Bridging of
the peripheral callus was apparent by 21 days post-fracture. By 28 days, the
fracture was fully bridged with new bone and the external callus appeared
ossified. Remodeling appeared to begin by 21 days after fracture, as the callus
size visually appeared to be decreasing. Remodeling continued through 42 days
post fracture when the external callus appeared almost completely resorbed
(Figures 4.1 and 4.2). Maximum callus area peaked between 10 and 14 days
and then began to decrease (Figure 4.2).
4.1.4 Decalcified Histology of ICR Mouse Femurs
Murine femoral fracture healing was observed to undergo the key
regenerative processes of inflammation, callus formation, endochondral
ossification, and remodeling that are indicative of the fracture healing process
established in other models (219,220). Figure 4.3 shows the early events in
murine fracture healing using decalcified samples stained with Masson’s
trichrome. Hematoma formation was apparent six hours after fracture. By two
days after fracture, inflammation was seen at the fracture site. Additionally, the
surrounding soft-tissue appeared swollen based on the increased distance
between muscle fibers. Four days after fracture, large numbers of new cells

57
were present within the intramedullary canal at the fracture site and in the
external callus area. By seven days post-fracture, the callus had clearly defined
borders. Neither edema nor muscle fiber degeneration were evident at seven
days post-fracture. However, new bone formation was evident at the periphery
of the fracture callus at this time. While chondrocytes were present within the
external fracture callus at seven days post-fracture, the majority of the callus was
still populated with mesenchymal cells. By ten days post-fracture, chondrocytes
were abundantly present within the external callus between new bone at the
periphery of the external callus and mesenchymal cells at the center of the
callus. The histological appearance of the newly formed bone at the cartilage
interface within the external callus was consistent with endochondral ossification.
The fracture callus size appeared to peak at ten days post-fracture (see also
Figure 4.2). Fourteen days after fracture, endochondral ossification was clearly
evident in the fracture callus and the center of the external callus was no longer
populated with mesenchymal cells but completely with chondrocytes.
4.1.5 Calcified Histology of ICR Mouse Femurs
The calcified histology confirmed that endochondral ossification had
begun by 7 days post-fracture. Figure 4.4 shows regions of calcified cartilage in
the external fracture callus seven days after fracture. By 10 days post-fracture,
the amount of calcified cartilage had increased and was closer to the fracture
site. The center of the callus was filled with apparently undifferentiated
mesenchymal cells. However, undifferentiated mesenchymal cells were not

58
observable in the seven or ten day histology of the decalcified specimens (Figure
4.3). Fourteen days after fracture, the callus was filled with calcified cartilage
between new bone at the periphery and chondrocytes at the center. All of the
fractures were bridged with some new bone by 21 days post-fracture. Healing
continued through 28 days after fracture, with an increase in the amount of new
bone that occupied the fracture callus being observed. By 42 days post-fracture,
remodeling of the fracture callus was clearly evident based upon the lamellar
appearance of the bone spanning the fracture site.
4.1.6 Mechanical Testing of ICR Mouse Femurs
Fracture healing was also evaluated in the ICR mouse model using
torsional mechanical testing. The testing procedure provided reproducible
torque-angular displacement curves. Callus cross-sectional area (mm2) was
estimated based upon a solid elliptical geometry using the measured maximum
and minimum diameters from each bone prior to mechanical testing (Table B1).
The polar moment of inertia used to estimate shear modulus and shear stress
was calculated based upon a hollow ellipse model as described in the Materials
and Methods (Section 3.7.2). Similarly, the contralateral left femurs were also
mechanically tested as the control group. The measured peak torque, angle at
failure, working gauge length from the mechanical testing procedure, and the
calculated polar moment of inertia were used to determine torsional rigidity
(Nmm2/rad), shear modulus (GPa), and shear stress (MPa). All mechanical
testing parameters were analyzed at 21, 28, 42 and 84 days post-fracture for the

59
fractured limb and control femur. No statistical difference was observed when
comparing the control femurs from any time point for the parameters of peak
torque, rigidity, shear modulus, and shear stress (ANOVA p=0.204, p=0.576,
p=0.051, p=0.053, respectively). It was then decided to pool these samples into
one control group to be compared against all time points.
Figures 4.5, 4.6 and Table B1 summarize the mechanical testing results
obtained. Peak torque increased rapidly during healing to reach values near
82% of the unfractured femur values by 21 days (Figure 4.5, Panel A). This large
increase in torque can be accounted for by the structural changes in the fractured
femur as its diameter dramatically increases at the fracture callus. In contrast,
rigidity only showed a continual increase after 28 days of healing, which is
consistent with the observed radiological and histological bridging of the fracture
site with new bone occurring between 21 and 28 days after fracture (Figure 4.5,
Panel B). Similar to rigidity, the material properties of the healing femur began to
increase 28 days after healing. However, shear stress and shear modulus only
obtained 35% and 29%, respectively, of the contralateral control femur even after
84 days of healing (Figure 4.5, Panels C-D). Additionally, while some bone
bridging was seen in one-third of the fractured femurs tested at 21 days post-
fracture, bone bridging was seen in 100 percent of the specimens tested at 28
days post-fracture.
Figure 4.6 shows the mechanical testing results after the fractured femur
is normalized to its contralateral control femur. Normalized peak torque, (Panel
A), normalized rigidity (Panel B), normalized modulus values (Panel C) and

60
normalized shear stress values (Panel D) at 21 and 28 days correspond to
Stages I and II of the biomechanical stages proposed by White et al. (204), while
Stage III and the beginning of Stage IV correspond to 42 and 84 days post-
fracture. This correlation to White’s stages validates the mouse femoral fracture
as a valid biomechanical research model.

61

62

63

64

65

66

67
4.2.0 The Effect of Genetic Background on Fracture Repair
4.2.1 Disposition of Inbred Animals Used in This Study
Female C3H, DBA/2, C57BL/6 and ICR mice (Taconic Farms,
Germantown, NY) weighing 30.4 ± 3.0, 28.2 ± 2.9, 30.1 ± 3.1, and 40.5 ± 3.8
grams, respectively, were used in this experiment. All animals were purchased
as retired breeders and were approximately 6 to 9 months old at the beginning of
the study. All experimental procedures were approved by the New Jersey
Medical School Institutional Animal Care and Use Committee. Of the 306 mice
used in this phase of the study, 165 were ultimately included in the radiographic,
histologic, histomorphometric, and mechanical analyses. A more detailed
disposition of the mice used in this study may be found in Table 4.3.
Table 4.3. Disposition of the 306 Inbred Mice Used in the Study. Surgical Errors Mechanical Testing Histology
Anesthesia Death
Fracture Destabilization
Poor Fracture
Potting Errors
User Errors
Total Analyzed
Poor Slide
Total Analyzed
ICR 0 4 3 6 4 13 3 25
C3H 3 5 3 11 8 11 6 34
DBA/2 1 7 0 9 7 11 7 27
C57BL/6 4 9 14 10 8 11 9 33
It was observed that a high number of C57BL/6 mice had comminutions
from the surgical and fracture procedure, which resulted in poor or unstable
fractures and were ultimately excluded from the final analysis. This was largely
due to the quality of bone in this particular strain and not because of the fracture
procedure. Animals in all strains were able to bear weight on their hind legs

68
within a few hours after surgery and no significant decrease in weight over time
was noted (Table 4.4).
Table 4.4. Average Pre-Surgical and Post-Sacrifice Weights of Inbred Mice.
Strain Time Point n Pre-Surgical Weight
in Grams (Mean ± SD)
Post-Sacrifice Weight in Grams
(Mean ± SD)
7 Days 6 43.7 ± 5.9 43.0 ± 6.5 10 Days 4 41.0 ± 1.2 41.0 ± 1.2 14 Days 6 41.7 ± 2.7 41.3 ± 2.7 21 Days 6 37.0 ± 7.1 36.0 ± 2.8 28 Days 25 40.0 ± 3.4 37.2 ± 6.7
ICR
42 Days 4 39.5 ± 3.0 40.5 ± 1.9 7 Days 4 34.0 ± 1.6 34.0 ± 1.6 10 Days 4 32.0 ± 3.3 32.5 ± 2.5 14 Days 7 33.1 ± 1.1 33.4 ± 1.0 21 Days 7 30.0 ± 2.3 29.4 ± 2.2 28 Days 38 30.2 ± 2.9 28.7 ± 2.3
C3H
42 Days 10 27.8 ± 2.2 27.4 ± 2.3 7 Days 4 28.5 ± 3.4 28.5 ± 3.4 10 Days 4 29.5 ± 1.9 29.5 ± 1.9 14 Days 4 30.0 ± 4.3 30.0 ± 4.3 21 Days 6 25.7 ± 2.7 25.7 ± 2.7 28 Days 31 28.7 ± 2.8 26.6 ± 2.1
DBA/2
42 Days 12 27.2 ± 2.2 25.3 ± 2.6 7 Days 6 30.0 ± 1.3 30.0 ± 1.3 10 Days 5 32.8 ± 2.7 32.4 ± 3.6 14 Days 14 30.3 ± 3.1 30.7 ± 2.7 21 Days 6 26.7 ± 2.4 27.3 ± 3.0 28 Days 23 30.2 ± 2.7 29.7 ± 2.5
C57BL/6
42 Days 17 30.2 ± 3.2 29.4 ± 2.4
4.2.2 Radiography of Inbred Mice
All animals were radiographed immediately post-fracture to ensure the
placement of a mid-diaphyseal fracture and post-sacrifice to confirm pin

69
stabilization. In addition, a subset of animals was serially radiographed at 7, 10,
14, 21, 28 and 42 days post-fracture to establish a typical pattern of fracture
healing for each of the experimental strains (Figure 4.6). At 7 days post-fracture,
all fours strains appear to have a mid-diaphyseal femur fracture, but no periosteal
lifting is detected. By 10 days, periosteal lifting and a defined callus border are
apparent in the C3H and DBA/2 fracture calluses. However, the ICR and
C57BL/6 fractures show very little callus formation at this time point. By 21 days,
it visually appears that the C3H and DBA/2 fracture calluses were bridged, while
the ICR and C57BL/6 still have a radiolucent zone in the center of their callus
indicating bridging has not yet occurred. By 28 days, the fractures in all four
strains appear bridged. Furthermore, the C3H and DBA/2 fractures look like they
have begun to remodel. Remodeling appears to continue through 42 days post-
fracture in all four strains as callus size visually appears smaller compared to 28
days.
4.2.3 Calcified Histology of Inbred Mouse Femurs
Animals used for histology were sacrificed at 7, 10, 14, 21, 28 or 42 days
post-fracture. The histological assessment showed different results than the
radiographical analysis first indicated.
As seen in Figure 4.7, at 7 days post-fracture, the fracture calluses have
definitive borders and infiltration of multiple cell types is apparent in the fractures
from all four strains. By 10 days post-fracture, a large mass of chondrocytes is
evident in the DBA/2 and C57BL/6 calluses, while only a small amount of

70
cartilage was present in either the ICR or the C3H calluses. However, all three
inbred strains visually appear to have extremely similar cartilage and mineralized
areas by 14 days post-fracture, while the ICR mice continued to lag behind. By
21 days post-fracture, all cartilage in each of the inbred strains fractures seemed
to be replaced by mineralized tissue. However, the ICR mice still had a slight
amount of visible cartilage present. All cartilage was replaced by bone at
approximately 28 days in all strains. Remodeling of the fracture calluses had
occurred by 42 days, as was evident by the decrease in callus size and
reshaping of the callus toward the original femur dimensions.
4.2.4 Histomorphometry of Inbred Mouse Femurs
Histomorphometric measurements confirmed what was seen visually in
the histology (Figure 4.8). In order to reduce variability between sample cuts and
sample sizes, mineralized area, cartilage area and granulation tissue area were
normalized to the callus area for that specific sample.
C57BL/6 has the highest percentage of mineralized area (%MA) at 7 days
while C3H had the largest percentage of cartilage area (%CA) with respect to the
total callus area (CALLUS). The largest percentage of any parameter measured
at this time point in all strains was that of granulation tissue (%GT), which filled
between 46 to 70% of the callus area. At 10 days post-fracture, C57BL/6 had a
significantly greater %MA than C3H (p<0.001), DBA/2 (p<0.001), and ICR
(p=0.002). No measurable mineralized areas were detected in either the DBA/2
or C3H fractures. Both C3H and DBA/2 had significantly greater %CA than the

71
fracture calluses from the ICR (p= 0.009 and p= 0.004, respectively) or C57BL/6
mice (p= 0.048 and p= 0.021, respectively). All strains also showed a decrease
in %GT measured in the callus at 10 days post-fracture. At 14 days post-
fracture, over half of the C57BL/6 callus was filled with mineralized tissue and
DBA/2 and C3H both had significantly larger increases in %MA compared to their
own values at 10 days. By 21 days post-fracture, all strains had the majority of
their calluses filled with newly mineralized tissue. Percent cartilage area and
percent granulation tissue also had begun to decrease in the fracture calluses of
all strains, with only a slight amount of either remaining. By 28 days post-
fracture, no slide examined had any remaining measured granulation tissue or
cartilage present. All strains showed extensively mineralization covering
between 80 to 85% of the callus area. At 42 days post-fracture, %MA
decreased. This signaled that remodeling of the newly mineralized bone had
taken place and the bone was returning to its original shape. A summary table
and statistical analysis for all histomorphometrical parameters may be found in
Appendix B.
4.2.5 Mechanical Testing of Inbred Mouse Femurs
To assess how bone mineral density affects mechanical testing properties
of healing bone, the fractured (right) and contralateral control (left) femurs of the
mice were torsionally tested at 28 days post-fracture. When comparing the
control left femurs’ structural properties, peak torque and rigidity, the ICR and
C3H mice have significantly greater values than either DBA/2 or C57BL/6 mice.

72
Additionally, the material properties, shear modulus and shear stress, of the C3H
animals were far superior to all other experimental groups. This was expected,
as C3H animals having the highest published bone mineral density values
(Figure 4.9).
Assessment of the mechanical testing data for the right fractured femur
showed very different results. Peak torque and rigidity values were significantly
higher in the ICR and C57BL/6 animals than in either C3H or DBA/2 (Figure 4.9).
However, ICR values declined when analyzing the material properties. In
contrast, DBA/2 had significantly higher values compared to ICR and C3H and
comparable values to C57BL/6, suggesting more mature bone had developed in
this strain by 28 days post-fracture compared to ICR or C3H. Of surprise was
how well the C57BL/6 had healed. While this strain has the lowest bone mineral
density, both structural and material properties were significantly greater than
C3H animals. Tables summarizing the mechanical testing data and statistical
analyses are located in Appendix B.
One method used to minimize variability among the different strains is to
normalize the fractured data with some type of control. Because these four
strains had multiple variable parameters, several different normalization methods
were utilized. The first method was to normalize the fractured femur by its
contralateral control femur value for all parameters. These results are shown as
a percentage (Figure 4.10 and Table B4). This data had trends similar to the
data shown in Figure 4.9. While C57BL/6 has the lowest published bone mineral
density values, it has significantly higher values for all parameters when

73
compared to DBA/2 and C3H. Additionally, DBA/2 had significantly greater shear
stress values than C3H. This suggests that bone mineral density is inversely
proportional to fracture healing rate.
Due to a significant difference in the weights between strains, one
question that needed to be addressed was whether or not animal weight
influenced the mechanical testing outcomes. Since mechanical testing
parameters are based on cross-sectional area and various other geometric
measurements of the bone, variations in mouse strain body weight need to be
considered as a factor in the mechanical testing outcomes. After normalizing to
the animal’s body weight, different results were in fact observed, predominately
in the material properties of the fracture callus (Figure 4.11 and Table B6). For
the left femur, C3H had far superior shear modulus and shear stress compared
to all other strains. However, this changed when comparing the fractured femur.
DBA/2 and C3H had similar values of peak torque and rigidity. On a per gram
basis, the DBA/2 had a higher shear modulus value than all strains and a
comparable shear stress value to the C57BL/6.
It was observed that the cross-sectional areas of all strains were also
statistically different (Figure 4.12 and Table B4). Therefore, cross-sectional area
was another parameter used to normalize the data. The results obtained were
similar to those when normalizing to weight (Figure 4.13 and Table B8). This
was expected since there is a correlation between weight and bone size.
The last normalization method used was to normalize by the previously
published average values of bone mineral density (238). Because ICR did not

74
have published values, only C3H, DBA/2 and C57BL/6 were evaluated. When
looking at peak torque and rigidity values for the left femur, C57BL/6 had
significantly higher values than either C3H or DBA/2 (Figure 4.14 and Table
B10). Additionally, C3H and DBA/2 had similar values for the structural
properties examined. Upon investigating the fractured femur, similar results as
shown in Figure 4.9 were observed. Statistical analysis for all normalization
parameters is located in Appendix B.

7575

7676

77

78

79

80

81

82

83

84
4.3.0 The Role of Cyclooxygenase in Fracture Healing
4.3.1 Disposition of COX Deficient Mice Used in This Study
Female Cox2-KO, Cox-2HET, Cox-2WT and Cox-1KO mice weighing 21.7
± 2.2, 24.7 ± 2.9, 22.4 ± 2.2 and 23.6 ± 3.2 grams, respectively, were used in
this experiment. All animals used in these experiments were bred and
maintained in the Center for Comparative Medicine Resources at UMDNJ.
All animals were 10-12 weeks old at the beginning of the study. All
experimental procedures were approved by the New Jersey Medical
School Institutional Animal Care and Use Committee. Of the 312 mice
used in this study, 204 were ultimately included in the radiographic,
histologic, histomorphometric, and mechanical analyses. A more detailed
disposition of the mice used in this study may be found in Table 4.5.
Table 4.5. Disposition of the 312 COX Deficient and Wild-Type Mice Used in This Study. Surgical Errors Other Mechanical Testing Histology
Anesthesia Death
Fracture Destabilization
Poor Fracture
Non-Unions
Died Prematurely
Potting Errors
User Errors
Total Analyzed
Poor Slide
Total Used
Cox-1KO 2 0 1 3 4 8 1 24 8 26
Cox-2KO 7 1 0 0 8 0 0 17 6 27
Cox-2HET 6 1 3 0 1 12 2 24 19 38
Cox-2WT 3 0 1 0 1 3 0 19 7 29
Additionally, 3 Cox1-KO animals could not be mechanically tested
because they were non-unions at harvest and could not be potted. A total of 14
animals died before reaching a time point (Cox-2KO:8; Cox-2HET:1; Cox-2WT:1;

85
Cox-1KO:4). Therefore, these animals could not be used in any analysis for
these experiments. Animals were able to bear weight on their hind legs within a
few hours after surgery and no significant decrease in weight over time was
noted (Table 4.6).
Table 4.6. Average Pre-Surgical and Post-Sacrifice Weights of COX Deficient and Wild- Type Mice.
Strain Time Point n Pre-Surgical Weight in Grams (Mean ± SD)
Post-Sacrifice Weight in Grams (Mean ± SD)
7 Days 4 24.5 ± 1.0 24.5 ± 1.0 10 Days 4 23.0 ± 1.2 24.0 ± 0.0 14 Days 9 22.9 ± 2.7 23.1 ± 2.3 21 Days 4 19.5 ± 1.0 20.5 ± 1.0 28 Days 20 24.6 ± 3.6 26.3 ± 4.0 42 Days 4 26.5 ± 1.0 28.5 ± 1.0
Cox-1KO
84 Days 22 24.5 ± 1.8 26.9 ± 2.0 7 Days 6 24.4 ± 1.7 24.4 ± 1.7 10 Days 3 24.0 ± 0.0 24.7 ± 1.2 14 Days 8 21.5 ± 2.6 22.0 ± 2.8 21 Days 4 21.0 ± 1.2 22.0 ± 1.6 28 Days 16 22.4 ± 2.0 24.6 ± 1.7 42 Days 4 21.5 ± 1.9 22.0 ± 2.3
Cox-2WT
84 Days 15 22.7 ± 2.4 24.9 ± 2.5 7 Days 6 23.7 ± 1.5 24.0 ± 1.3 10 Days 7 23.0 ± 1.2 23.0 ± 1.2 14 Days 18 21.8 ± 1.8 22.3 ± 1.7 21 Days 4 24.5 ± 1.0 25.5 ± 1.0 28 Days 26 24.0 ± 2.7 24.8 ± 3.2 42 Days 6 22.3 ± 2.3 24.0 ± 2.2
Cox-2HET
84 Days 43 24.7 ± 2.9 26.2 ± 2.3 7 Days 5 21.2 ± 2.3 21.2 ± 2.3 10 Days 5 20.8 ± 1.1 21.2 ± 1.1 14 Days 5 21.6 ± 0.9 22.0 ± 0.0 21 Days 4 20.7 ± 2.3 21.3 ± 1.2 28 Days 13 21.2 ± 2.1 21.8 ± 1.7 42 Days 4 22.5 ± 1.9 24.0 ± 1.6
Cox-2KO
84 Days 16 22.5 ± 2.8 23.8 ± 2.2

86
4.3.2 Radiography of COX Deficient Mice
All animals were radiographed immediately post-fracture to verify the
placement of a mid-diaphyseal fracture and post-sacrifice to confirm constant pin
stabilization. In addition, a subset of animals from each strain was radiographed
at 7, 10, 14, 21, 28, and 84 days post-fracture for serial radiographical
comparison of fracture healing. Radiography clearly showed the importance of
COX-2 on fracture healing. While Cox-1KO, Cox-2HET and Cox-2WT all
showed a similar temporal pattern of healing from 7 to 84 days, fracture healing
in Cox-2KO mice appeared to severely lag behind (Figure 4.15). At 7 days, all
groups had similar radiographic findings of a clear transverse femoral fracture.
After 10 days, the fractures in the Cox-1KO, Cox-2HET and Cox-2WT animals
showed signs of periosteal lifting around the fracture edges. However, the
fractures in the Cox-2KO animals showed little callus formation by this time.
Robust callus was detected in the Cox-1KO, Cox-2HET and Cox-2WT at 14
days, but the Cox-2KO still showed very little callus formation. By 21 days post-
fracture, the fractures in the Cox-1KO, Cox-2HET and Cox-2WT mice appeared
fully bridged. Initial observations of the Cox-2KO fracture callus would suggest
that these calluses were also bridged. However, upon closer inspection, a faint
radio-opaque line down the center of the callus was detected. This line
represents the front edge and back edge of the callus overlapping. Remodeling
of the fracture callus was evident in all mouse genotypes by 28 days after
fracture. Remodeling continued through 84 days post-fracture when the
experiment was terminated.

87
4.3.3 Calcified Histology of COX Deficient Mouse Femurs
Histological analysis was evaluated at 7, 10, 14, 21, 28, 42 and 84 days
post-fracture (Figure 4.16). Fracture healing followed a similar histological
pattern in the Cox-1KO, Cox-2HET and Cox-2WT mice. At 7 days, a definitive
fracture callus was evident with cartilage and other cells invading the area. At 10
days, endochondral ossification was visible, along with continued cartilage
formation. By 14 days, a small amount of cartilage remained in the fracture
callus. However, mineralized cartilage was abundant. After 21 days of healing,
any cartilage remaining was replaced completely by mineralized tissue.
Furthermore, the femur fractures in all three of these strains were bridged by 21
days. By 28 days, remodeling of the fracture callus had begun in the Cox-1KO,
Cox-2HET and Cox-2WT animals. Subsequent remodeling continued from 42
through 84 days post-fracture, as the fracture callus for these three strains began
to reshape itself back to its original dimensions.
In contrast, the Cox-2KO fracture callus showed vastly different results
(Figure 4.16). At 7 days, fracture callus borders were clearly defined, although it
did appear smaller in size compared to the other three strains. By 10 days, only
a small amount of cartilage that stained with Stevenel’s Blue appeared on the
periphery of the fracture callus along with an abundance of fibrous tissue in the
center of the callus. By 14 days, cartilage formation appeared to have halted in
this strain, leaving a fibrous mass in the center of the callus, surrounded by the
beginning of mineralizing bone. This was further exaggerated by 21 days post-
fracture, when a huge mass of fibrotic tissue was still clearly present in the center

88
of the callus. Without clearly bridging the fracture gap, the fracture callus
appeared to begin remodeling at 28 days and continued through 84 days post-
fracture.
4.3.4 Histomorphometry of COX Deficient Mouse Femurs
The histomorphometry measurements confirmed the conclusions seen in
the histological observations. Histology and histomorphometry clearly showed
the importance of COX-2 on fracture repair. Callus area peaked at 14 days post-
fracture for Cox-1KO and Cox-2WT mice and at 21 days for Cox-2Het and Cox-
2KO mice (Figure 4.17-Panel A). At 7 days post-fracture, Cox1-KO, Cox2-HET
and Cox-2WT fractures all had similar percentages of mineralized area, while
Cox-2KO fractures had no measurable quantities (Figure 4.17-Panel B). Also, the
Cox-2KO callus had very little cartilage present and a statistically greater
percentage of granulation tissue (%GT) than Cox-1KO, Cox-2HET and Cox-2WT
fractures. Cox-2HET fractures had the largest percentage of cartilage area,
peaking at almost 22% of the callus area (Figure 4.17- Panel C).
At 10 days post-fracture, one Cox-2KO fracture slide had a measurable
percentage of mineralized area and the percentage of cartilage area (%CA)
increased from approximately 3% at 7 days to 11% at 10 days post-fracture in
these animals. However, this was the highest the cartilage percentage ever
reached and the majority of the callus area was still largely granulation tissue. In
contrast, almost a quarter of the callus was filled with newly mineralized tissue in
the Cox-1KO animals by 10 days post-fracture (Figure 4.17- Panel B). Cox-1KO

89
fracture calluses also saw the percentage of cartilage area increased from about
6.5% to almost 18% in three days. Additionally, the %GT decreased from 47% at
7 days to 31% at 10 days. The Cox-2Het and Cox-2WT animals also had
significant increases in the percentage of mineralized tissue in their calluses from
7 to 10 days post fracture, going from 7% and 8% to about 18% and 21%,
respectively. The percentage of cartilage area increased 50% or more from 7 to
10 days in the Cox-2Het and Cox-2WT animals (Figure 4.17-Panel C). Similar to
Cox-1KO, granulation tissue in the Cox-2HET animals fractures were roughly
one-third of the callus area. Cox-2WT animals had significantly less granulation
tissue in their calluses at 10 days than all other strains (Figure 6.3, Panel B).
By 14 days post-fracture, Cox-2KO animals began to show significant
increases in the percentage of new mineralized area, but was still significantly
less than all other strains compared (Figure 4.17-Panel B). The fractures of Cox-
1KO, Cox-2HET and Cox-2WT mice had %MA values from 40% to 50%
compared to the fractures of Cox-2KO value of 27%. Also, a large portion of the
Cox-2KO callus was still filled with granulation tissue, comprising roughly one-
third of the callus. In contrast, the fractures of Cox-1KO, Cox2-Het and Cox-2WT
%GT values had decreased to about 11%, 14% and 8%, respectively. The
percentage of cartilage in the callus at 14 days was highest in the Cox-1KO
animals at 15% (Figure 4.17- Panel C).
At 21 days post-fracture, Cox-1KO and Cox-2WT fractures no longer had
measurable cartilage or granulation tissue in the fracture callus. Of the Cox-
2HET specimens, one had some remaining granulation tissue in the callus,

90
however this was negligible. Cox-1KO, Cox-2HET and Cox-2WT animals had
between 62 and 72% of the callus area filled with mineralized tissue compared to
49% for Cox-2KO. Cox-2KO still had almost 17% of the callus area filled with
granulation tissue and a small amount of cartilage present (Figure 4.17- Panel
D).
By 28 days post-fracture, the %MA in Cox-1KO, Cox-2HET and Cox-2WT
fracture calluses decreased, signifying that remodeling had begun. In contrast,
the Cox-2KO callus %MA was still increasing and filled with about 12% of
granulation tissue. At 42 days, callus %MA still decreased in the Cox-1KO and
Cox2-WT animals, while slightly increasing in both the Cox-2KO and Cox-2HET
animals. Granulation tissue was still present in some of the Cox-2KO animal
fractures. By 84 days post-fracture, only mineralized tissue was seen in the
calluses of all strains. Similar to the histology examined, remodeling was present
in all strains.
4.3.5 Mechanical Testing of COX Deficient Mouse Femurs
Mechanical properties were evaluated at two time points, 28 and 84 days
post fracture. The results are summarized in Figure 4.18. As can be seen, the
Cox-2KO mice had significantly lower structural (peak torque, rigidity) and
material properties (shear modulus and maximum shear stress) at 28 days than
Cox-2HET, Cox-2WT and Cox-1KO mice. However, by 84 days post fracture,
the Cox-2KO animals regain some structural properties compared to those
values of the other groups. Material properties reflected similar results. Shear

91
modulus and maximum shear stress values were similar in the Cox-1KO, Cox-
2HET and Cox-2WT animals at 28 days. However, the Cox-2KO mice showed
significantly less material property values at this time point. After 84 days of
healing, the material properties in all experimental strains and genotypes
increased. However, Cox-2KO animals still had significantly less values when
compared to the other three groups. This signifies an immaturity in the new
bone’s material properties of the Cox-2KO mouse.
Of interest was the high average shear modulus value the Cox-1KO mice
reached. It should be addressed that ONLY femurs collected without incident
were used and if the specimen could be successfully potted, it was torsionally
tested. This may lead to skewing of the data as the Cox-1KO group had three
animals out of a possible 36 animals excluded due to non-unions. In essence,
only the best healed animals were tested for the Cox-1KO group which may have
lead to uncharacteristically high values for the mechanical testing parameters
obtained for this group.

9292

9393

94

95

96
4.4.0 The Role of 5-Lipoxygenase (5-LO) in Fracture Healing
4.4.1 Disposition of 5-LO Deficient Mice Used in This Study
Female 5-LOKO (bred in house) and C57BL/6 (WT) animals (Jackson
Laboratory, Bar Harbor, ME) weighing 20.0 ± 1.5, and 19.4 ± 1.3 grams,
respectively, were used in this experiment. All animals were 10-12 weeks
old at the beginning of the study. All experimental procedures were
approved by the New Jersey Medical School Institutional Animal Care and
Use Committee. Of the 168 mice used in this study, 140 were ultimately
included in the radiographic, histologic, histomorphometric, eicosanoid and
mechanical analyses. A more detailed disposition of the mice used in this
study may be found in Table 4.7.
Table 4.7. Disposition of the 168 5-LO Deficient and Wild-Type Mice Used in the Study.
Surgical Errors Mechanical Testing Histology Eicos. Levels
Anesthesia Death
Fracture Destabilization
Poor Fracture
Potting Errors
User Errors
Total Analyzed
Poor Slide
Total Used
Total Used
5-LOKO 5 0 0 3 1 19 6 23 6
WT 1 0 0 4 0 22 7 34 6
Cox-1KO 0 0 0 NA NA NA NA NA 4
Cox-1KO(Rx)a 1 0 0 NA NA NA NA NA 3
Cox-2WT 0 0 0 NA NA NA NA NA 6
Cox-2HET 0 0 0 NA NA NA NA NA 6
Cox-2KO 0 0 0 NA NA NA NA NA 6
Cox2-KO(Rx)b 0 0 0 NA NA NA NA NA 5
a = treated with 30 mg/kg of rofecoxib; b= treated with 30 mg/kg of SC-560

97
Animals were able to bear weight on their hind legs within a few hours
after surgery and no significant decrease in weight over time was noted (Table
4.8).
Table 4.8. Average Pre-Surgical and Post-Sacrifice Weights of 5-LO and WT Mice.
Strain Time Point n Pre-Surgical Weight
in Grams (Mean ± SD)
Post-Sacrifice Weight in Grams
(Mean ± SD)
7 Days 7 20.6 ± 1.0 20.3 ± 0.8 10 Days 12 20.7 ± 1.3 20.8 ± 1.3 14 Days 7 21.1 ± 1.1 21.4 ± 1.5 21 Days 5 21.2 ± 1.1 21.2 ± 1.1 28 Days 13 18.8 ± 1.0 20.6 ± 2.2
5-LOKO
84 Days 8 18.9 ± 1.0 21.3 ± 1.0 7 Days 6 21.0 ± 1.1 21.3 ± 1.0 10 Days 7 18.6 ± 1.0 20.0 ± 0.0 14 Days 21 19.2 ± 1.4 19.8 ± 0.9 21 Days 8 20.5 ± 1.4 21.3 ± 1.0 28 Days 12 18.8 ± 1.0 19.3 ± 1.0
WT
84 Days 14 19.3 ± 1.0 21.4 ± 1.2
4.4.2 Radiography of 5-LO Deficient Mice
All animals were radiographed immediately post-fracture to validate the
placement of a mid-diaphyseal fracture and post-sacrifice to confirm pin
stabilization. In addition, a subset of animals from each group was radiographed
at 7, 10, 14, 21 and 28 days post-fracture for serial radiographical comparison of
fracture healing (Figure 4.19). The 5-LOKO mouse showed a mineralized callus
at the periphery of the fracture site by 7 days post fracture as compared to 10
days in the control mice. At 10 days post-fracture, a large mineralized callus was
apparent in the 5-LOKO similar in appearance to the 14 day post-fracture callus

98
of the control mice. Fracture bridging with new bone was apparent by 14 days
after fracture in the 5-LOKO mice but not until 21 days post-fracture in the control
mice. After 28 days, the reduced size of the 5-LOKO callus suggested bone
remodeling had occurred as compared to the equivalent time in the control
fracture callus. This series of radiographs suggests that 5-LOKO mice have
accelerated fracture healing.
4.4.3 Calcified Histology of 5-LO Deficient Mouse Femurs
Histological analysis further supports the radiographic findings, as the 5-
LOKO fracture calluses appear to have more abundant cartilage formation at 7
days. Furthermore, there was visually more mineralized tissue by 10 days, callus
bridging by 14 days and substantial remodeling by 21 days, as compared to the
same time points in WT animals (Figure 4.20).
To see if this increased fracture healing was due to an increased response
in the endochondral ossification process or by potentially a different mechanism;
higher magnification histology at 7 days post-fracture was examined. As can be
seen in Figure 4.21-Panel A, histology at 4X the magnification of the wild-type
mouse fracture shows a cartilage region ahead of a slight amount of new
mineralization. Increased magnification to 20X (Figure 4.21-Panel B) shows this
cartilage becoming hypertrophic, with a slight amount of calcified cartilage at the
zone separating cartilage and bone. However, at 4X magnification, the 5-LOKO
mouse has a very visual robust cartilage area coupled with a strong
endochondral bone zone (Figure 4.21-Panel C). Further magnification to 20X

99
reveals hypertrophic chondrocytes with extensive mineralized cartilage on top of
a new bone layer (Figure 4.21-Panel D). This histology supports that the 5-LOKO
mice have an accelerated endochondral ossification process.
4.4.4 Histomorphometry of 5-LO Deficient Mouse Femurs
Histomorphometric measurements showed a slight increase in total callus
area (TA) and callus area (CALLUS) was observed in the 5-LOKO mice as
compared to WT controls at 7 days post-fracture. Furthermore there was a
significant increase in MA and CA and a significant decrease of GT in the 5-
LOKO as compared to WT controls at the same time point. By 10 days, these
effects seemed to have minimized, except the GT levels in the WT controls were
still significantly greater.
However, it has been reported that 5-LOKO mice have increased cortical
bone thickness (255). Since wall thickness directly affects the amount of original
femur bone present, thereby affecting the results of the callus area, this
information was taken into account. Therefore, a normalized percentage value of
MA, CA and GT (%MA, %CA, %GT) as compared to the calculated callus area
was used.
As seen in Figure 4.22, after taking the wall thickness into consideration, a
more pronounced effect is seen. With only seven days of healing, the 5-LOKO
shows a significantly greater percentage of mineralized and cartilage and a
significantly less amount of fibrous tissue (Figure 4.22-Panel A). While these
results are similar as before wall thickness was addressed, it is clearly more

100
apparent that the differences between these two groups are more definitive. At
ten days post-fracture, %MA is still significantly greater in the 5-LOKO animals as
compared to WT and %GT is still significantly less than WT (Figure 4.22-Panel
B). However, no significant differences were seen in any parameter past 10 days
(Figure 4.21-Panels C and D). This indicates that the accelerated fracture
healing observed in the 5-LOKO mice occurs because of changes during the
early stages of fracture healing.
4.4.5 Mechanical Testing of 5-LO Deficient Mouse Femurs
Since wall thickness is a main variable in the calculation of mechanical
properties, the normalized values of fractured femur as a percentage of the
unfractured contralateral were considered as a better representation of the data
(Figure 4.23).
It was observed that the structural properties of peak torque and rigidity of
the 5-LOKO fracture callus were approximately 20% and 40% higher for the 5-
LOKO mice than the control mice after 28 days (Figure 4.23- Panels A and B). In
addition, the material properties of maximum shear stress and shear modulus
were approximately 40% and 70% higher after 28 days of healing in the 5-LOKO
mice (Figure 4.23- Panels C and D). By 84 days, peak torque and maximum
shear stress remained significantly higher in the 5-LOKO mouse fractures than in
controls. This further demonstrates that the 5-LOKO fracture callus obtains
better structural and material properties sooner than control fracture callus.

101
4.4.6 Eicosanoid Levels in Fracture Callus of 5-LO Deficient Mice
Fracture callus levels of PGE2, PGF2α and LTB4 were assayed to validate
the hypothesis that the elimination of the COX-2 pathway leads to excess
arachidonic acid shunting into the 5-LO pathway resulting in excess leukotriene
production, reduced prostaglandin production, and ultimately impaired healing.
This was accomplished by measuring eicosanoid levels in extracts from 4-day
post-fracture calluses from mice of different genotypes.
The PGE2 levels did not appear to initially follow this hypothesis (Figure
4.24). Our hypothesis predicted elevated levels of PGE2 would be found in the 5-
LOKO mice, the values obtained seem to be similar to the values of the controls.
However, elevated levels of PGE2 were measured in the Cox-2KO and Cox-1KO
animals. Subsequently, Cox-2KO (Cox-2KOTreated) animals received a 30
mg/kg treatment with SC-560 (a COX-1 inhibitory drug) and Cox-1KO animals
(Cox-1KOTreated) received a 30 mg/kg treatment of rofecoxib (a COX-2
inhibitory drug), by oral gavage, two hours before sacrifice. Treatment with
these drugs showed that the elevated PGE2 levels observed in the COX-1KO or
COX-2KO mice was COX-2 or COX-1 dependent respectively.
PGF2α levels also were measured in the 4-day post-fracture callus extracts
(Figure 4.25). However, the results here were somewhat different. The 5-LOKO
mice again did not see an elevation of PGF2α, suggestion that pure shunting was
not occurring. Cox-1KO fractures showed significantly decreased PGF2α values
when compared to the 5-LOKO (p= 0.004), Cox2-HET (p= 0.003) and Cox2-WT
fractures (p= 0.003), but significantly increased values when compared to Cox-

102
2KO fractures (p= 0.005). However, Cox-1KO mice treated with rofecoxib had
further reduced PGF2α levels (p= 0.006) compared to the untreated Cox-1KO
animals. Unlike the PGE2 assay, which showed elevation of PGE2 in the Cox-
2KO, the levels of PGF2α in fracture callus extracts from the non-treated Cox-
2KO animals were very low. This suggests that PGF2α synthesis in the fracture
callus, but not PGE2 synthesis, is primarily dependent on COX-2 activity.
As expected, LTB4 levels were very low in the fracture callus extracts from
the 5-LOKO mice (Figure 4.26). However, shunting into the 5-LO pathway was
observed in the Cox-2KO mouse fracture callus. Treating animals with SC-560
resulted in the LTB4 levels decreasing back to normal values.

103

104

105

106

107

108

109

110

111
5.0.0 DISCUSSION
5.1.0 Developing and Characterizing a Closed Murine Femoral Fracture Model
The mouse femoral fracture model developed and characterized proved
consistent and reliable. The overall success rate of the mouse fracture model
was above 75%, with experimental losses due to the mechanical testing
preparation accounting for almost 16% of the number of animals used. Poor or
comminuted fracture production was minimal and represented only 3.3% of all
animals used (Table 4.1).
The murine femoral fracture model described proved to be analogous to
the rat closed femur fracture model developed by Bonnarens and Einhorn (209).
Fracture healing followed a reproducible order of events, including hematoma
formation, inflammation, endochondral ossification and remodeling (Figures 4.2
and 4.3). The processes observed were also similar to those seen in the rat
model. However, one observed difference was that bony bridging of the fracture
site in the mouse occurred between twenty-one and twenty-eight days post-
fracture, while it does not occur until after twenty-eight days in the rat.
The use of the relatively straight femur allowed for the analysis of the
torsional mechanical properties of a mouse fracture (Figure 4.5 and Table B1).
Temporal variations in the mechanical properties also followed an expected
pattern. Peak torque values increased rapidly to reach 82% of the contralateral
control femur by twenty-one days post fracture. The increase in torque is most
likely because of structural changes occurring in the fractured femur as its cross-
sectional area increases at the site of injury (Figure 4.1 and Table B1). However,

112
rigidity showed a slower increase in values after 28 days of healing. This was
consistent with the radiographical and histological data showing that the bridging
of the fracture gap with new bone occurred between twenty-one and twenty-eight
days post-fracture. Material properties also showed a slower increase in values.
These increases were seen after twenty-eight days of healing. In contrast to the
structural properties achieving similar values to controls quickly, the maximum
shear stress and shear modulus values only reached 35% and 29% of the
contralateral control femurs even after eighty-four days of healing post-fracture.
While it is assumed that bone remodeling should occur quickly in mice, and
therefore lead to increased material properties. The lower material properties
observed may be attributed to potential stress shielding by the intramedullary pin.
Generally, the structural mechanical properties (peak torque and rigidity)
increased faster, as opposed to the material mechanical properties (shear stress
and shear modulus), of the healing bones.
Other investigators have used additional murine femoral fracture models
since this work began. One report showed a bone defect model developed in the
distal metaphysic of the mouse femur (237). The healing process was followed
by histomorphometry, peripheral quantitative computed tomography (pQCT),
cantilever-bending mechanical testing, and molecular biological analyses. Bone
healing in this model mainly occurred by intramembranous ossification, as very
little cartilage was observed. Two reports described externally fixed femoral
osteotomies. In one, cell proliferation and apoptosis rates during healing were
characterized (232). In the other, radiography and four-point bending tests

113
evaluated fracture healing (236). Both of these reports showed results similar to
those found here, with the bridging of the defect occurring at twenty-one days
and stiffness values increasing over time.
Murine fracture callus cells also have been used as the a cell source for in
vitro culture experiments (229). Another study focused on exploring whether
traceable D1-BAG stromal cells would localize to the site of experimentally
induced fractures (227). Transplanted bone marrow cells were injected
intravenously into mice that sustained stabilized femoral shaft fractures. Callus
tissue and marrow were examined histologically at seven, fourteen, twenty-one,
twenty-eight, forty-two, fifty-six and seventy days post-fracture. In another
report, systemically administered mesenchymal stem cells transfected with
plasmids to express IGF-1 or β-galactosidase were quantified in the fracture
callus at fourteen, twenty-eight and forty-two days post-fracture (256). Internally
fixed, open femur fractures in mice were used to assess the effects of
simvastatin on fracture healing (230). Examination of histology at seven,
fourteen and twenty-one days post-fracture and mechanical testing by three-point
bending was utilized in this experiment. Consistent with the findings here,
fractures were found to be bridged at 21 days post fracture. Furthermore, the
simvastatin-treatment appeared to affect the early stages of fracture healing by
increasing the callus size at 14 days after fracture. However, this effect was
eliminated by three weeks post-fracture, as no significance between treated and
controls was noted at this time. The role of vascular endothelial growth factor
(VEGF) was explored using a soluble form of the VEGF receptor to reduce

114
circulating levels of VEGF (231). Fractures were examined at seven and
fourteen days post-fracture by microcomputer tomography and by histological
examination. Finally, one group developed a locking femur nail for mice (235).
Peak torque, rigidity and stiffness values were similar to the ones already
presented. However, no histological data was presented.
While these reports utilized the murine fracture model, the radiographic,
histological and mechanical testing analysis did not extensively characterize the
healing pathway and only one report discussed the torsional mechanical
properties (235). However, this report was published after the model presented
here had already been published (257).
5.2.0 Genetic Background and Fracture Repair
Bone mineral density (BMD) is the most commonly used clinical indication
of osteoporosis and fracture risk (73). Studies have shown that torsional strength
is proportional to and primarily dependent on mineral content (258,259). Having
a higher bone mineral density reduces the risk of a bone fracture. However,
there is no correlation on whether or not having a high bone mineral density
results in faster fracture healing once bone trauma has occurred. To determine if
a high BMD correlated with a stronger or faster bony union following a femoral
fracture, one outbred and three inbred strains of mice with previously published
bone mineral density values (238) were evaluated for fracture healing capacity.
Radiographical and histological analysis (Figure 4.6-4.7) would first
indicate that a high BMD leads to faster fracture repair. By 14 days, the mouse

115
with the highest BMD (C3H) appears bridged, while all other strains appear to lag
behind. Additionally, remodeling appeared to have begun by 28 days in C3H
animal. However, histomorphometry and mechanical testing results did not
support these initial findings (Figures 4.8-4.14). Histomorphometric
measurements showed that C57BL/6 fractures (lowest BMD) had the highest
percentage of mineralized tissue and cartilage area at the earliest time point.
Also, the C57BL/6 calluses have the least amount of granulation tissue at the
earliest time post-fracture. This suggests that the C57BL/6 callus (low BMD) has
healed faster than the C3H callus (high BMD).
Mechanical testing supports these findings. Analysis of the mechanical
testing properties shows that when the fractured femur was normalized to its
control unfractured femur, the C57BL/6 had the highest structural (peak torque
and rigidity) and material (maximum shear stress and shear modulus) properties.
C3H fractures, while having the highest bone mineral density values, have the
weakest normalized mechanical testing properties. This suggests an inverse
relationship between bone mineral density and fracture healing success exists.
As expected, when comparing the fractured to the unfractured control femur, the
C3H animal had significantly greater mechanical testing values. Therefore, a
high bone mineral density is valuable in minimizing fracture risk. However, after
a fracture is sustained, such as in a high impact accident, a genetic pre-
disposition to high bone mineral density may be deleterious to the fracture
healing progress.

116
5.3.0 Cyclooxygenase and Fracture Repair
Because prostaglandins are known to be modulators of bone metabolism,
the role of prostaglandin synthesis in bone healing has been of much interest.
The most abundant prostaglandin produced by osteoblasts, PGE2, has been
shown to play a crucial role in bone formation, mainly through the EP2 and EP4
prostaglandin receptor subtypes (260-262). Previous experiments that
systemically administered PGE2 showed an increase in bone formation, as well
as bone mass (263-266). In the rabbit, blood flow to the surrounding muscle,
bone and marrow was increased by PGE2 infusion (267), while callus formations
showed a dose-dependent stimulation response (268). Furthermore, PGE2
given to canines increased mineralization, indicating accelerated remodeling
(269,270). Collectively, there is ample scientific evidence to support the role
prostaglandins play in bone metabolism. However, to better understand the role
prostaglandins play in fracture repair, it is important to understand how
prostaglandins contribute to the fracture repair process.
During the inflammatory stage of fracture healing, pro-inflammatory
stimuli, cytokine and growth factors release influence prostaglandin production
(114,271,272). Prostaglandins were shown to accumulated in the fracture callus
in the first two weeks after injury and are abundantly produced by osteoblasts
(27,271,273). During the bone reparative phase, prostaglandins are responsible
for increasing the amount and activity of osteoclasts, thereby aiding subsequent
bone resorption (274) and PGE2 is the most potent agonist for stimulating bone
resorption and formation (266). Additionally, prostaglandin production in bone

117
and their future action on bone cells was shown to be indirectly enhanced by
COX-2 induction (151,274).
The two recognized isoforms of cyclooxygenase, COX-1 and COX-2, are
differentially expressed in bone. COX-1 is constitutively expressed in normal
bone and COX-2 is upregulated during the beginning stages of fracture repair
and inflammation (27,275-277). Because of these findings, much attention has
recently been given to studying how the blocking of prostaglandin synthesis,
specifically by non-selective, non-steroidal anti-inflammatory drugs (NSAIDs) and
selective COX-2 inhibitors (COXIBs), alters bone healing. Because of their anti-
inflammatory and analgesic properties, NSAIDs are widely prescribed to patients
with bone and joint ailments and musculoskeletal injuries (278,279). In normal
bones, long term NSAID use rarely causes adverse effects and is considered to
be therapeutic for bone loss prevention and osteoporosis (280). Furthermore,
NSAIDs are useful in preventing heterotopic ossification following joint
replacement surgery (281-286). However, the potential side effects associated
with traditional NSAID use resulted in the development of selective COX-2
inhibitors that would affect prostaglandin production by the COX-2 pathway, but
spare the prostaglandin production associated with the COX-1 pathway that are
necessary for normal tissue function (186).
Many preclinical models of fracture repair have evaluated NSAIDs
following fracture or osteotomy. For example, impaired bone healing in rats and
rabbits resulted after being treated with aspirin, diclofenac, ibuprofen,
indomethacin, and tenoxicam (287-304). Recent studies focusing on how

118
COXIBs effect bone healing have shown similar results (114,305,306). In
essence, these studies show a decreased callus size and inferior mechanical
properties indicative of inhibited fracture healing.
Because the strong pharmacological data that specific COX-2 inhibitors
impair fracture healing, this dissertation sought to determine if the impairment in
bone regeneration was caused by a pharmacological dosing side-effect or
whether COX-2 had a functional role in bone healing.
The radiographical, histological, histomorphometric, mechanical and callus
eicosanoid level information presented here clearly shows Cox-2KO mice have
an abnormal repair sequence when compared to controls (Figure 4.15-4.18).
Fracture callus levels of PGE2 were significantly higher (p<0.001) in both the
Cox-1KO and Cox-2KO animals compared to all other groups. While this may
seem counterintuitive, only half of the arachidonic acid pathway is blocked in
either of these strains of mice. One possible reason why Cox-2KO mice fail to
heal properly is that the excess PGE2 results in elevated bone resorption.
Eicosanoid levels also show that Cox-1KO animals have a high level of PGF2α,
while Cox-2KO fracture calluses have non-detectable amounts of PGF2α. This
implies that COX-2 governs PGF2α production. Since chondrogenesis is PGF2α
dependent, it follows that Cox-2KO mice would have low chondrocyte
populations. This is evident in the histology and histomorphometry results
presented (Figures 6.2-6.4). However, Cox-1KO fracture calluses show lower
than average levels of PGF2α. Therefore, Cox-1KO animals should still produce
chondrocytes. It is hypothesized that if the ratio of PGE2 to PGF2α is less than 1,

119
healing will occur normally. If the ratio of PGE2 to PGF2α is greater than 1, then
healing will occur abnormally. Because the Cox-1KO levels of PGE2 are higher
than the levels of PGF2α, this may explain the high number of non-unions seen in
these experiments. However, the difference between the PGE2 levels and the
PGF2α levels is not as drastic in the Cox-1KO mice as with the Cox-2 mice and
should occur less often.
Recently, one group published results in contrast to our findings (307). In
this randomized blinded study, a stabilized closed-tibial fracture was placed in 8-
10 week old male mice. These animals were then placed in one of seven
treatment groups to examine the effect of COX-2 inhibitors and non-steroidal
anti-inflammatory drugs on fracture healing. Animals in a treatment group
received oral NSAIDS delivered in peanut butter chow. Biochemical and three-
point biomechanical testing was completed at 28, 56 and 84 days post-fracture.
The results of this study found no differences in maximum load or stiffness
values between any treatment groups compared to control values and only the
animals in the ketorolac group exhibited differences in collagen expression with
decreased cartilage formation. However, the data presented in this dissertation
does not support the finding of this report, as the Cox-2KO animals examined
here showed severe fracture healing delays or complete non-unions.
5.4.0 5-Lipoxygenase and Fracture Repair
Animal studies have confirmed the importance of non-steroidal anti-
inflammatory drugs (NSAIDs) on fracture healing (287,288,291-293,308).

120
Because NSAIDs inhibit cyclooxygenase activity, one explanation for the
deleterious effects would be that COX-2 activity induced as part of the
inflammatory phase of fracture repair has a necessary function. Experiments
have shown that COX-2 selective NSAID treatments in the rat impair fracture
healing in the rat and that fracture healing is drastically inhibited in mice lacking
COX-2 function (306). In the clinical setting, NSAIDs are prescribed to reduce
heterotopic bone formation in humans and retrospective studies show that the
use of NSAIDs can lead to an increase of non-unions in humans (309-313).
Prostaglandins induce osteogenesis in animals and humans (314,315).
Therefore, one explanation would be that the loss of, or inhibition of, COX-2
activity would reduce bone formation during fracture repair. Little is known about
the specific cell types that produce prostaglandins or which cells respond to the
prostaglandins during fracture repair. While, in vitro data has shown that
osteoblasts, chondrocytes and endothelial cells synthesize and respond to
prostaglandins (316-331), this has yet to be proven in vivo during fracture repair.
This thesis hypothesizes that another mechanism could account for the
impaired fracture healing observed in Cox-2KO mice or in other animals treated
with NSAIDs. As part of the normal inflammatory response, COX-2 and 5-LO are
activated and induced. This leads to the normal production of prostaglandins
and leukotrienes (Figure 4.27-Panel A). When COX-2 function is absent,
arachidonic acid released by phospholipase A2 activity may potentially be
shunted into the 5-LO pathway leading to increase leukotrienes synthesis, a

121
decrease in prostaglandin synthesis, and ultimately impaired healing (Figure
4.27-Panel B).
Previous work has shown that in vitro treatment with LTB4 or 5-HETE can
reduce osteoblast proliferation and differentiation (332,333). It may be possible
that loss of 5-lipoxygenase activity could potentially reduce leukotriene levels,
increase prostaglandin levels and accelerate fracture healing (Figure 4.27-Panel
C).
Radiographic, histologic, and histomorphometric data support that genetic
ablation of 5-LO function accelerates tissue regeneration during fracture healing
(Figures 4.19-4.22). While a normal pattern of endochondral ossification was
observed, there was significantly more cartilage in the facture site than in control
mice by seven days post fracture. In addition, more mineralized tissue was
evident in the 5-LOKO mice at seven and ten days post-fracture. This data
signifies that bone regeneration occurred through an accelerated endochondral
ossification process in the 5-LOKO mice.

122
In accordance with the radiographic and histomorphometric results, the
mechanical data also provided compelling evidence that the 5-LOKO mice
experience acelerated healing (Figure 4.23). Normalized peak torque and rigidity
values were approximately 20% and 40% higher for the 5-LOKO mice than for
the control mice after 28 days of healing. Likewise, after 28 days of healing,
maximum shear modulus and shear stress were approximately 70% and 40%,
respectively, in the 5-LOKO mice. Peak torque and maximum shear stress
remained significantly higher in the 5-LOKO mice even after 84 days post-
fracture, demonstrating that the 5-LOKO fracture callus obtained better structural
and material properties faster than control mice.
To directly test the hypothesis that in the absence of COX-2, arachidonic
acid could shunt into the 5-LO pathway leading to excess leukotriene synthesis,
which is potentially responsible for the impairment of bone regeneration during
fracture healing, fracture callus levels of eicosanoids were also measured
(Figures 4.24-4.26). Callus eicosanoid data showed 5-LOKO mice had
significantly reduced levels of LTB4. This was expected since without 5-LO
function, these mice should have no leukotrienes or other 5-LO metabolites being
produced. Furthermore, fracture callus leukotriene levels were four-fold higher in
the Cox-2KO mice. However, true shunting was not observed, as 5-LOKO mice
did not have significantly higher levels of either PGE2 or PGF2α. So, while
arachidonic acid was being shunted into the 5-LO pathway in the absence of
COX-2, arachidonic acid was not being shunted in the absence of 5-LO. One
potential reason for this occurrence is that Five Lipoxygenase Activating Protein

123
(FLAP) is preventing this shunting from occurring. FLAP is the membrane bound
protein required for 5-LO function (334-336). In the absence of 5-LO, cPLA2 still
can interact with FLAP, thereby preventing full shunting from happening.
It is therefore proposed that when COX-2 activity is impaired, either
genetically or pharmacologically, the excess leukotrienes will impair healing.
When 5-LO activity is impaired, the amount of leukotrienes is decreased, thereby
accelerating fracture healing. Therefore, the pharmacological inhibition of 5-LO
and its other metabolites could be used to accelerate or enhance fracture repair.

124
6.0.0 CONCLUSIONS
The use of the mouse as a fracture model has proved useful in the field of
orthopaedics. With the development of these animals with targeted mutations, it
is now possible to study complex genes and phenotypes associated with bone
diseases. The further development of a biomechanical testing protocol that
would better approximate the mechanical properties of the healing tissue is also
important. While the three-point and four-point bending tests are commonly
used for biomechanical analyses, these tests are inadequate for fracture healing
studies involving small sized specimens. A more accurate biomechanical test for
small samples is the torsion test. Therefore, the development and
characterization of a murine femoral fracture model suitable for torsional
mechanical testing was completed. This model was validated using
radiographic, histologic and mechanical testing data. These parameters were
selected based on their relevance to previous literature and showed that mouse
heals similarly to other published fracture models.
Using this established model, a complex phenotype was then examined to
see its role in fracture healing. Mice with different genetic backgrounds were
selected to see how bone mineral density values affected fracture healing
success. It was found that while bone mineral density may aid in preventing a
fracture, the radiographic, histological, and mechanical testing data show a high
bone mineral density actually impedes fracture healing success.
The last part of this dissertation focused on how the altering of a single
pathway affects fracture healing. The arachidonic acid pathway, its products and

125
the enzymes mediating their formation play a crucial role in many aspects of
human physiology. Leukotrienes and prostaglandins are produced by the activity
of three enzymes, 5-lipoxygenase, cyclooxygenase-1 and cyclooxygenase-2, as
part of the arachidonic acid pathway. Manipulating this pathway, by the blocking
or rerouting of arachidonic acid, proved to be critical in fracture healing.
Radiography, histology and mechanical testing showed that mice with a genetic
deletion of cycloxygenase-2 (COX-2) showed greatly inhibited fracture healing
while mice with a genetic deletion of 5-Lipoxygenase showed accelerated
fracture healing. Furthermore, fracture callus eicosanoid levels showed that
arachidonic acid reroutes itself under genetic conditions.
The mouse has proven to be an exceptionally valuable research tool
involving orthopaedic conditions that involve genetics and complex phenotypes.
Biomechanical testing provides a better understanding of healing bone
properties. The mouse model along with a suitable mechanical testing protocol
allows for the better estimation of key structural and material properties crucial in
evaluating fracture healing success. This allows for the development of potential
future treatments for fracture healing patients and a better understanding of the
normal fracture healing mechanisms responsible for fracture healing success.
126
Appendix A
Protocols for Decalcified and Calcified Mouse Bone Specimens and Mechanical Testing Equations

127
Specimen Fixation Protocol for Calcified and Decalcified Samples Fixation:
10% Buffered Formalin 24 hours or longer Decalcification (Decalcified Samples ONLY):
Wash in running water 10 minutes Immunocal change daily for 2 to 4 days Wash in running water 30 minutes
Dehydration:
40% EtOH 8 hours 70% EtOH 16 hours 80% EtOH I 8 hours 80% EtOH II 16 hours 90% EtOH I 8 hours 90% EtOH II 16 hours 100% EtOH I 8 hours 100% EtOH II 16 hours
Clearing:
Hemo-De I 8 hours Hemo-De II 16 hours
Infiltration:
Calcified Samples: PMMA I 3 to 7 days PMMA II 3 to 7 days
PMMA III 3 to 7 days PMMA III Place tissues in specimen bottle
and place bottle in 37°C water bath
Decalcified Samples:
Paraffin I Overnight Paraffin II Overnight

128
Polymethylmethacrylate (PMMA) Solutions
PMMA I
100 mL Polymethylmethacrylate Monomer
PMMA II
100 mL Polymethylmethacrylate Monomer 1 gram dry benzoyl peroxide
PMMA III 100 ml Polymethylmethacrylate Monomer 2.5 grams dry benzoyl peroxide

129
Masson’s Trichrome Reagents and Equipment Required: Bouin’s solution Weigert’s Iron Hematoxylin Set. Prepare working solution according to label
instructions. Acetic Acid, 1%. Prepare by diluting 1 part Acetic Acid with 9 parts water Biebrich Scarlet-Acid Fuchsin Solution. Biebrich scarlet, 0.9%, acid fuchsin
0.1%, in acetic acid, 1% Phosphomolybdic Acid Solution, Phosphomolybdic Acid, 10% Aniline Blue Solution, Aniline blue, 2.4% and acetic acid 2% To Prepare Working Phosphotungstic/Phosphomolybdic Acid Solution:
Mix 1 volume of Phosphotungstic Acid Solution and 1 volume Phosphomolybdic Acid Solution with 2 volumes of deionized water. Discard after one use.
Standard Procedure:
1. Deparaffinize slides to deionized water. 2. Mordant in preheated Bouin’s solution at 56ºC for 15 minutes or at
room temperature overnight. 3. Cool slides in tap water contained in a Coplin jar. 4. Wash in running tap water to remove yellow color from sections. 5. Stain in Working Weigert’s Iron Hematoxylin Solution for 5 minutes. 6. Wash in running tap water for 5 minutes. 7. Rinse in deionized water. 8. Stain in Biebrich Scarlet-Acid Fuschin for 5 minutes 9. Rinse in deionized water. 10. Place slides in working Phosphotungstic/Phosphomolybdic Acid Solution
for 5 minutes. 11. Place slides in Aniline Blue Solution for 5 minutes 12. Place slides in Acetic Acid, 1%, for 2 minutes. Discard Solution. 13. Rinse Slides, dehydrate through alcohol, clear in xylene and mount
Results of stain: Cytoplasm and muscle fibers- red Collagen- blue

130
Stevenel’s Blue and Van Geison’s Picro-Fuchsin (SVG)
Stevenel’s Blue Stain:
Solution 1: 1 g of Methylene Blue (Fisher: M-291) 75 mL of distilled water
Solution 2: 1.5 g of Potassium Permanganate 75 mL of distilled water
Mix solutions 1 and 2 and place in a boiling water bath until the precipitate
dissolves. Allow the stain to reach room temperature, then filter. Van Geison Picro-Fuchsin: 0.1 g of Acid Fuchsin
10 mL of distilled water 100 mL of saturated Picric Acid
Mix the Acid Fuchsin with the distilled water to obtain a 1% aqueous solution. Mix the solution with the Picric Acid.
Standard Procedure:
1. Soak in Stevenel’s Blue in a water bath at 60 C for the following times: a. 10 minutes for bone, b. 1 minute 20 seconds for soft tissue c. 2 minutes for muscle
2. Rinse in distilled water in a water in a water bath at 60 C and blot dry 3. Soak in Van Geison’s Picro-Fuchsin for 2 minutes for all tissue types at
room temperature. 4. Rinse in 100% ethanol.
Results of stain:
Cells and extracellular structures not mineralized- shades of blue Collagen fibers- green to green-blue Bone-orange or purple Osteoid- yellow-green Muscle fibers- blue to blue-green

131
Mechanical Testing Data Equations Polar Moment of Inertia (J)
J= [π(ab3+a3b-(a-t)(b-t)3-(a-t)3(b-t)]/4
a = maximum callus or diaphyseal radius b = minimum callus or diaphyseal radius t = is the average bone thickness
Torsional Rigidity (R)
R= (Tmax x L)/ϕ
Tmax = maximum peak torque value L = working gauge length
ϕ = angle at failure in radians Shear Stress (τ)
T= (Tmax x c)/J
Tmax = maximum peak torque value c = maximum callus or diaphyseal radius J = polar moment of inertia
Shear Modulus (G)
G= (Tmax x L)/ (J x ϕ) Tmax = maximum peak torque value L = working gauge length J = polar moment of inertia ϕ = angle of failure in radians
Cross-Sectional Area (A)
A= abπ a = maximum callus or diaphyseal radius b = minimum callus or diaphyseal radius

132
Appendix B
Analysis and Statistical Summary Tables for Mechanical and Histomorphometrical Data

133
Table B1. Summary of ICR Mouse Femur Mechanical Testing Data. Fractured Femurs (Time Post-Fracture)
Pooled Control Femurs 21 Days 28 Days 42 Days 84 Days
Sample Size (n) 68 18 18 15 17
Cross-sectional Area (mm2) Fractured 8.84 ± 1.80 8.22 ± 1.44 5.02 ± 1.28 4.41 ± 0.71 Control 2.10 ± 0.27 2.22 ± 0.27 1.96 ± 0.24 1.95 ± 0.20 2.24 ± 0.24
Percent*** 403 ± 93 420 ± 63 256 ± 52 198 ± 33 paired t-test — <0.001 <0.001 <0.001 <0.001
Peak Torque (Nmm) Fractured 36.0 ± 11.0 33.9 ± 10.0 34.2 ± 8.6 42.8 ± 10.8 Control 43.8 ± 14.2 38.23 ± 12.39 46.34 ± 11.23 43.00 ± 13.09 47.60 ± 18.45Percent 102 ± 39 75 ± 22 84 ± 27 100 ± 39
paired t-test — 0.497 <0.001 0.013 0.28 Rigidity (Nmm2)
Fractured 567 ± 235 483 ± 226 563 ± 309 1,105 ± 415
Control 991.0 ± 425.8 940 ± 426 924 ± 344 1,117 ± 527 1,005 ± 419
Percent 69 ± 32 54 ± 23 55 ± 27 128 ± 65 paired t-test — 0.002 <0.001 <0.001 0.44
Shear Stress (MPa) Fractured 13.0 ± 5.0 13.6 ± 4.6 30.2 ± 13.6 44.4 ± 16.8 Control 160.0 ± 61.2 127 ± 57 187 ± 40 178 ± 65 152 ± 66 Percent 12 ± 6 8 ± 3 19 ± 11 35 ± 21
paired t-test — <0.001 <0.001 <0.001 <0.001 Shear Modulus (GPa)
Fractured 0.12 ± 0.06 0.11 ± 0.06 0.36 ± 0.22 0.82 ± 0.41 Control 3.94 ± 1.99 3.39 ± 2.12 4.21 ± 1.67 4.99 ± 2.43 3.31 ± 1.34 Percent 5 ± 3 3 ±1 8 ± 5 29 ± 18
paired t-test — <0.001 <0.001 <0.001 <0.001 Angle at Failure (degrees)
Fractured 22.6 ± 9.3 25.6 ± 10.9 19.2 ± 10.6 11.0 ± 3.9 Control 13.8 ± 6.1 12.8 ± 4.4 16.1 ± 5.4 11.8 ± 6.4 14.3 ± 7.6 Percent 203 ± 134 163 ± 61 1.83 ± 1.32 91 ± 41
paired t-test <0.001 <0.001 0.02 0.07 Polar Moment of Inertia (J) (mm4)
Fractured 5.4 ± 2.0 4.8 ± 1.5 1.9 ± 1.0 1.5 ± 0.5 Control 0.27 ± 0.09 0.31 ± 0.09 0.23 ± 0.06 0.23 ± 0.05 0.31 ± 0.09
Percent 1,878 ± 863 532,120 ± 595 819 ± 322 494 ± 191
paired t-test <0.001 <0.001 <0.001 <0.001 Gage Length (mm)
Fractured 5.6 ± 1.0 5.6 ± 1.5 4.3 ± 0.90 4.7 ± 1.1 Control 4.9 ± 1.0 5.0 ± 0.8 5.2 ± 1.2 4.6 ± 0.9 4.7 ± 1.1 Percent 115 ± 32 107 ± 20 95 ± 23 103 ± 26
paired t-test 0.14 0.24 0.18 0.95 Values shown for all parameters are the mean and standard deviation. Values for each parameter are listed from all the contra-lateral control femurs. Statistical comparisons were made by comparing fracture to control femur values within a time point (paired t-test). Mean percentage values and standard deviations were calculated from the percent fracture to control values for each animal.

134134
Table B2. Inbred Mouse Fracture Callus Histomorphometrical Measurements Summary.
ICR Histomorphometry Measurements Time Point n TA (mm2) B (mm2) MA (mm2) CA (mm2) GT (mm2) Void CALLUS
(mm2) %
MA/CALLUS%
CA/CALLUS %
GT/CALLUS
AVERAGE 14.04 2.67 0.00 0.72 7.27 3.38 11.37 0.00 6.23 63.73 SD 1.31 0.24 0.00 0.35 1.14 0.39 1.41 0.00 2.53 4.10 7 Days 6
SEM 0.54 0.10 0.00 0.14 0.47 0.16 0.58 0.00 1.03 1.68
AVERAGE 14.26 3.17 0.88 1.46 5.74 3.02 11.10 7.87 13.47 50.93 SD 1.05 0.53 0.39 0.58 2.01 0.27 1.51 3.44 5.60 11.22 10 Days 4
SEM 0.52 0.26 0.20 0.29 1.00 0.14 0.75 1.72 2.80 5.61
AVERAGE 16.53 3.08 3.86 1.93 5.28 2.39 13.45 28.54 14.45 39.62 SD 1.99 0.72 1.25 0.36 0.99 0.81 2.29 6.61 1.81 6.71 14 Days 5
SEM 0.89 0.32 0.56 0.16 0.44 0.36 1.02 2.96 0.81 3.00
AVERAGE 14.90 3.05 6.84 1.04 1.07 2.90 11.85 57.91 8.82 8.75 SD 0.75 0.39 0.64 0.07 0.94 0.41 0.62 7.64 0.90 7.64 21 Days 3
SEM 0.43 0.23 0.37 0.04 0.54 0.24 0.36 4.41 0.52 4.41
AVERAGE 12.71 2.27 8.40 0.00 0.00 2.04 10.44 81.05 0.00 0.00 SD 1.42 0.31 0.70 0.00 0.00 1.09 1.28 8.50 0.00 0.00 28 Days 3
SEM 0.82 0.18 0.40 0.00 0.00 0.63 0.74 4.91 0.00 0.00
AVERAGE 9.28 2.11 5.70 0.00 0.00 1.47 7.17 79.74 0.00 0.00 SD 1.10 0.47 0.69 0.00 0.00 0.36 1.03 2.23 0.00 0.00 42 Days 4
SEM 0.55 0.24 0.35 0.00 0.00 0.18 0.51 1.12 0.00 0.00

135135
C3H Histomorphometry Measurements Time Point n TA (mm2) B (mm2) MA (mm2) CA (mm2) GT (mm2) Void CALLUS
(mm2) %
MA/CALLUS%
CA/CALLUS %
GT/CALLUS AVERAGE 8.72 3.67 0.00 0.47 3.73 0.85 5.05 0.00 10.51 69.85
SD 1.88 0.18 0.00 0.06 1.94 0.05 2.00 0.00 3.81 13.65 7 Days 4 SEM 0.94 0.09 0.00 0.03 0.97 0.03 1.00 0.00 1.90 6.82
AVERAGE 13.31 4.22 0.15 2.87 5.00 1.07 9.09 1.67 31.30 55.14
SD 0.83 0.53 0.31 0.62 0.46 0.39 0.76 3.34 4.81 5.20 10 Days 4 SEM 0.41 0.26 0.16 0.31 0.23 0.20 0.38 1.67 2.40 2.60
AVERAGE 13.44 3.36 3.94 0.79 0.50 4.85 10.08 39.16 8.00 5.13
SD 0.89 0.64 1.26 0.12 0.28 1.44 1.20 11.66 2.15 2.96 14 Days 5 SEM 0.36 0.26 0.52 0.05 0.12 0.59 0.49 4.76 0.88 1.21
AVERAGE 13.40 3.61 6.20 0.12 0.20 2.88 9.79 63.20 1.39 2.15
SD 2.15 0.70 1.43 0.14 0.29 1.19 1.70 7.69 1.66 3.29 21 Days 4 SEM 1.07 0.35 0.71 0.07 0.14 0.49 0.85 3.84 0.83 1.65
AVERAGE 10.78 4.02 5.86 0.00 0.00 0.91 6.77 86.26 0.00 0.00
SD 1.28 0.93 1.17 0.00 0.00 0.35 1.13 6.42 0.00 0.00 28 Days 8 SEM 0.45 0.33 0.42 0.00 0.00 0.12 0.40 2.27 0.00 0.00
AVERAGE 8.07 2.71 3.54 0.00 0.00 1.83 5.37 65.68 0.00 0.00
SD 1.08 0.60 0.90 0.00 0.00 0.58 0.96 10.83 0.00 0.00 42 Days 9 SEM 0.36 0.20 0.30 0.00 0.00 0.19 0.32 3.61 0.00 0.00

136136
DBA/2 Histomorphometry Measurements Time Point n TA (mm2) B (mm2) MA (mm2) CA (
mm2) GT (mm2) Void CALLUS (mm2)
% MA/CALLUS
% CA/CALLUS
% GT/CALLUS
AVERAGE 7.67 2.36 0.00 0.21 2.40 2.71 5.31 0.00 4.02 46.56 SD 1.39 0.32 0.00 0.02 0.37 1.13 1.25 0.00 0.69 10.65 7 Days 3
SEM 0.80 0.19 0.00 0.01 0.22 0.66 0.72 0.00 0.40 6.15
AVERAGE 8.58 2.75 0.00 1.91 1.91 2.01 5.83 0.00 34.00 32.58 SD 0.98 0.42 0.00 0.64 0.50 1.20 0.82 0.00 14.44 6.75 10 Days 4
SEM 0.49 0.21 0.00 0.32 0.25 0.60 0.41 0.00 7.22 3.37
AVERAGE 12.27 2.63 1.90 2.40 1.01 4.33 9.64 21.13 24.05 9.88 SD 2.42 0.34 0.90 1.17 0.65 1.27 2.08 12.10 6.68 4.16 14 Days 3
SEM 1.40 0.20 0.52 0.68 0.38 0.74 1.20 6.98 3.85 2.40
AVERAGE 9.21 2.12 4.34 0.51 0.48 1.76 7.09 62.42 6.78 6.41 SD 1.66 0.48 0.94 0.31 0.29 0.95 1.32 15.62 3.87 3.63 21 Days 5
SEM 0.74 0.21 0.42 0.14 0.13 0.43 0.59 6.99 1.73 1.62
AVERAGE 7.52 2.46 3.94 0.05 0.00 1.06 5.05 79.42 0.87 0.00 SD 1.24 0.46 1.75 0.10 0.00 1.40 1.49 26.38 1.74 0.00 28 Days 4
SEM 0.62 0.23 0.88 0.05 0.00 0.70 0.75 13.19 0.87 0.00
AVERAGE 5.33 1.73 2.70 0.00 0.00 0.90 3.60 76.18 0.00 0.00 SD 0.64 0.29 0.44 0.00 0.00 0.65 0.58 14.88 0.00 0.00 42 Days 8
SEM 0.23 0.10 0.16 0.00 0.00 0.23 0.20 5.26 0.00 0.00

137137
C57BL/6 Histomorphometry Measurements Time Point n TA (mm2) B (mm2) MA (mm2) CA (mm2) GT (mm2) Void CALLUS
(mm2) %
MA/CALLUS%
CA/CALLUS %
GT/CALLUS AVERAGE 9.13 2.10 0.56 0.48 4.39 1.60 7.03 8.04 6.82 62.22
SD 0.82 0.70 0.22 0.04 1.01 0.68 0.23 3.25 0.74 13.33 7 Days 3 SEM 0.48 0.40 0.13 0.03 0.58 0.39 0.13 1.88 0.43 7.70
AVERAGE 13.38 2.52 1.75 2.02 1.92 5.16 10.86 16.02 18.68 17.57
SD 0.78 0.51 0.46 0.11 0.54 0.15 0.90 3.51 0.81 3.95 10 Days 4 SEM 0.39 0.26 0.23 0.05 0.27 0.07 0.45 1.76 0.40 1.97
AVERAGE 15.56 2.54 6.74 1.73 1.08 3.46 13.02 51.26 13.19 8.58
SD 1.25 0.46 1.65 0.57 0.44 0.53 1.14 8.43 3.49 4.01 14 Days 5 SEM 0.56 0.21 0.74 0.25 0.20 0.24 0.51 3.77 1.56 1.79
AVERAGE 16.40 2.78 10.54 0.10 0.00 2.99 13.62 76.40 0.82 0.00
SD 2.58 0.62 3.11 0.13 0.00 0.44 2.82 7.23 1.14 0.00 21 Days 5 SEM 1.15 0.28 1.39 0.06 0.00 0.20 1.26 3.23 0.51 0.00
AVERAGE 15.44 2.39 9.98 0.00 0.00 3.07 13.05 76.11 0.00 0.00
SD 1.94 0.24 1.97 0.00 0.00 0.77 1.90 6.60 0.00 0.00 28 Days 7 SEM 0.74 0.09 0.75 0.00 0.00 0.29 0.72 2.49 0.00 0.00
AVERAGE 12.84 2.37 7.36 0.00 0.00 3.10 10.46 69.76 0.00 0.00
SD 2.34 0.34 2.08 0.00 0.00 0.86 2.15 9.33 0.00 0.00 42 Days 9 SEM 0.78 0.11 0.70 0.00 0.00 0.29 0.72 3.11 0.00 0.00

138138
Table B3. Statistical Summary for Inbred Mouse Fracture Callus Histomorphometrical Measurements. 7 Day % Mineralized Area (ANOVA p <0.001) 10 Day % Mineralized Area (ANOVA p <0.001) 14 Day % Mineralized Area (ANOVA p =0.003) ICR C3H DBA/2 C57BL/6 ICR C3H DBA/2 C57BL/6 ICR C3H DBA/2 C57BL/6
ICR ---------- 1.000 1.000 <0.001 ICR ---------- 0.012 0.003 0.002 ICR ---------- 0.093 0.315 0.002 C3H ---------- 1.000 <0.001 C3H ---------- 0.442 <0.001 C3H ---------- 0.020 0.059
DBA/2 ---------- <0.001 DBA/2 ---------- <0.001 DBA/2 ---------- <0.001 C57BL/6 ---------- C57BL/6 ---------- C57BL/6 ----------
7 Day % Cartilage Area (ANOVA p = 0.032) 10 Day % Cartilage Area (ANOVA p = 0.010) 14 Day % Cartilage Area (ANOVA p <0.001) ICR C3H DBA/2 C57BL/6 ICR C3H DBA/2 C57BL/6 ICR C3H DBA/2 C57BL/6
ICR ---------- 0.023 0.241 0.749 ICR ---------- 0.009 0.004 0.382 ICR ---------- 0.007 0.002 0.567 C3H ---------- 0.006 0.082 C3H ---------- 0.647 0.048 C3H ---------- <0.001 0.024
DBA/2 ---------- 0.202 DBA/2 ---------- 0.021 DBA/2 ---------- <0.001 C57BL/6 ---------- C57BL/6 ---------- C57BL/6 ----------
7 Day % Granulation Tissue Area (ANOVA p =0.063) 10 Day % Granulation Tissue Area (ANOVA p <0.001) 14 Day % Granulation Tissue Area (ANOVA p
<0.001) ICR C3H DBA/2 C57BL/6 ICR C3H DBA/2 C57BL/6 ICR C3H DBA/2 C57BL/6
ICR ---------- N/A N/A N/A ICR ---------- 0.432 0.004 <0.001 ICR ---------- <0.001 <0.001 <0.001 C3H ---------- N/A N/A C3H ---------- <0.001 <0.001 C3H ---------- 0.168 0.238
DBA/2 ---------- N/A DBA/2 ---------- 0.013 DBA/2 ---------- 0.706 C57BL/6 ---------- C57BL/6 ---------- C57BL/6 ----------
21 Day % Mineralized Area (ANOVA p = 0.111) 28 Day % Mineralized Area (ANOVA p = 0.480) 42 Day Percent Mineralized Area (ANOVA p = 0.123)
ICR C3H DBA/2 C57BL/6 ICR C3H DBA/2 C57BL/6 ICR C3H DBA/2 C57BL/6 ICR ---------- N/A N/A N/A ICR ---------- N/A N/A N/A ICR ---------- N/A N/A N/A C3H ---------- N/A N/A C3H ---------- N/A N/A C3H ---------- N/A N/A
DBA/2 ---------- N/A DBA/2 ---------- N/A DBA/2 ---------- N/A C57BL/6 ---------- C57BL/6 ---------- C57BL/6 ----------
21 Day % Cartilage Area (ANOVA p <0.001) 28 Day % Cartilage Area (ANOVA p = 0.216) 42 Day % Cartilage Area (ANOVA p = 1.000) ICR C3H DBA/2 C57BL/6 ICR C3H DBA/2 C57BL/6 ICR C3H DBA/2 C57BL/6
ICR ---------- 0.001 0.264 <0.001 ICR ---------- N/A N/A N/A ICR ---------- N/A N/A N/A C3H ---------- 0.005 0.726 C3H ---------- N/A N/A C3H ---------- N/A N/A
DBA/2 ---------- 0.002 DBA/2 ---------- N/A DBA/2 ---------- N/A C57BL/6 ---------- C57BL/6 ---------- C57BL/6 ----------
21 Day % Granulation Tissue Area (ANOVA p = 0.030 28 Day % Granulation Tissue Area (ANOVA p =
1.000) 42 Day % Granulation Tissue Area (ANOVA p = 1.000)
ICR C3H DBA/2 C57BL/6 ICR C3H DBA/2 C57BL/6 ICR C3H DBA/2 C57BL/6 ICR ---------- 0.047 0.429 0.009 ICR ---------- N/A N/A N/A ICR ---------- N/A N/A N/A C3H ---------- 0.131 0.432 C3H ---------- N/A N/A C3H ---------- N/A N/A
DBA/2 ---------- 0.023 DBA/2 ---------- N/A DBA/2 ---------- N/A C57BL/6 ---------- C57BL/6 ---------- C57BL/6 ----------

139139
Table B4. Summary of Inbred Mouse Femur Mechanical Testing Data.
Peak Torque (Nmm) Area (mm2)
Polar Moment of Inertia (J)
Gage Length (mm)
Rigidity (Nmm2/rad)
Shear Modulus
(GPa)
Maximum Shear Stress
(MPa) Strain n
Left Right
%P
Left Right
%A
Left Right Left Right Left Right
%R
Left Right
%G
Left Right
%S
Average 44.94 37.19 84.70 2.36 9.59 409.18 0.38 6.21 4.82 5.39 1471.95 1027.75 72.29 3.35 0.15 4.42 118.06 12.88 11.32
SD 8.68 11.25 25.46 0.27 2.31 96.94 0.10 2.84 0.93 0.99 582.23 492.48 29.14 1.33 0.10 2.40 24.10 4.87 4.39 ICR 13
SEM 2.41 3.12 7.06 0.08 0.64 26.89 0.03 0.79 0.26 0.27 161.48 136.59 8.08 0.37 0.03 0.67 6.68 1.35 1.22
Average 39.57 21.47 56.21 2.02 7.71 382.26 0.14 4.16 5.33 5.67 1354.40 542.61 43.58 10.63 0.15 1.52 252.67 9.57 3.94
SD 6.69 3.72 14.90 0.20 1.15 51.83 0.04 1.30 0.95 1.39 433.81 138.90 17.65 5.46 0.07 0.62 48.80 2.82 1.49 C3H 11
SEM 2.02 1.12 4.49 0.06 0.35 15.63 0.01 0.39 0.29 0.42 130.80 41.88 5.32 1.65 0.02 0.19 14.71 0.85 0.45
Average 27.30 19.84 74.08 1.48 6.48 439.31 0.15 2.96 4.47 5.63 905.65 486.21 61.03 6.08 0.20 3.54 158.28 12.72 7.88
SD 5.41 6.28 24.31 0.11 1.45 101.67 0.02 1.24 1.02 1.50 311.12 186.64 33.23 2.05 0.12 2.19 29.72 6.55 3.49 DBA/2 11
SEM 1.63 1.90 7.33 0.03 0.44 30.66 0.01 0.37 0.31 0.45 93.81 56.28 10.02 0.62 0.04 0.66 8.96 1.98 1.05
Average 32.69 31.78 98.11 2.10 8.52 412.18 0.32 4.12 4.27 4.77 980.22 835.28 89.22 3.36 0.22 7.48 99.02 15.18 15.59
SD 3.81 9.09 29.45 0.26 1.56 93.80 0.08 1.32 0.80 0.81 400.52 344.80 33.75 1.88 0.11 3.93 20.90 6.24 6.36 C57BL/6 11
SEM 1.15 2.74 8.88 0.08 0.47 28.28 0.02 0.40 0.24 0.25 120.76 103.96 10.18 0.57 0.03 1.18 6.30 1.88 1.92

140140
Table B5. Statistical Summary for Raw and Normalized Inbred Mouse Femur Mechanical Testing Data. Peak Torque (Nmm) (ANOVA p <0.001) Peak Torque (Nmm) (p <0.001) Normalized Mechanical Properties ((Fx/Control)*100)
LEFT RIGHT Normalized Peak Torque (%) (ANOVA p = 0.002) ICR C3H DBA/2 C57BL/6 ICR C3H DBA/2 C57BL/6 ICR C3H DBA/2 C57BL/6
ICR ---------
- 0.051 <0.001 <0.001 ICR ---------
- <0.001 <0.001 0.118 ICR ---------- 0.006 0.290 0.183 C3H ---------- <0.001 0.018 C3H ---------- 0.647 0.006 C3H ---------- 0.090 <0.001
DBA/2 ---------- 0.059 DBA/2 ---------- 0.002 DBA/2 ---------- 0.025 C57BL/6 ---------- C57BL/6 ---------- C57BL/6 ----------
Rigidity (Nmm2) (ANOVA p = 0.008) Rigidity (Nmm2/rad) (ANOVA p <0.001) Normalized Rigidity (%) (ANOVA p = 0.006) ICR C3H DBA/2 C57BL/6 ICR C3H DBA/2 C57BL/6 ICR C3H DBA/2 C57BL/6
ICR ---------
- 0.528 0.004 0.011 ICR ---------
- <0.001 <0.001 0.165 ICR ---------- 0.021 0.351 0.164 C3H ---------- 0.024 0.058 C3H ---------- 0.693 0.045 C3H ---------- 0.168 <0.001
DBA/2 ---------- 0.700 DBA/2 ---------- 0.018 DBA/2 ---------- 0.029 C57BL/6 ---------- C57BL/6 ---------- C57BL/6 ----------
Shear Modulus (GPa) (ANOVA p <0.001) Shear Modulus (GPa) (ANOVA p = 0.241) Normalized Shear Modulus (%) (ANOVA p <0.001) ICR C3H DBA/2 C57BL/6 ICR C3H DBA/2 C57BL/6 ICR C3H DBA/2 C57BL/6
ICR ---------
- <0.001 0.036 0.997 ICR ---------
- NA NA NA ICR ---------- 0.009 0.411 0.006 C3H ---------- 0.001 <0.001 C3H ---------- NA NA C3H ---------- 0.071 <0.001
DBA/2 ---------- 0.044 DBA/2 ---------- NA DBA/2 ---------- <0.001 C57BL/6 ---------- C57BL/6 ---------- C57BL/6 ----------
Shear Stress (MPa) (ANOVA p <0.001) Shear Stress (MPa) (ANOVA p = 0.118) Normalized Shear Stress (%) (ANOVA p < 0.001) ICR C3H DBA/2 C57BL/6 ICR C3H DBA/2 C57BL/6 ICR C3H DBA/2 C57BL/6
ICR ---------
- <0.001 0.004 0.158 ICR ---------
- NA NA NA ICR ---------- <0.001 0.058 0.020 C3H ---------- <0.001 <0.001 C3H ---------- NA NA C3H ---------- 0.038 <0.001
DBA/2 ---------- <0.001 DBA/2 ---------- NA DBA/2 ---------- <0.001 C57BL/6 ---------- C57BL/6 ---------- C57BL/6 ----------

141141
Table B6. Weight Normalized Inbred Mouse Femur Mechanical Testing Data Summary.
Peak Torque (Nmm)/g Rigidity (Nmm2)/g Shear Modulus (MPa)/g Shear Stress (MPa)/g Strain n
Left Right Left Right Left Right Left Right Average 1.19 0.99 38.23 27.20 88.51 4.09 3.15 0.34
SD 0.27 0.32 13.05 13.33 36.63 2.92 0.80 0.14 ICR 13 SEM 0.07 0.09 3.62 3.70 10.16 0.81 0.22 0.04
Average 1.36 0.74 47.01 18.88 373.73 5.08 8.74 0.33
SD 0.19 0.15 16.38 5.39 212.43 2.42 1.88 0.10 C3H 11 SEM 0.06 0.05 4.94 1.62 64.05 0.73 0.57 0.03
Average 1.04 0.76 34.67 18.72 234.38 7.75 6.05 0.48
SD 0.24 0.26 13.27 7.65 92.66 4.49 1.39 0.23 DBA/2 11 SEM 0.07 0.08 4.00 2.31 27.94 1.35 0.42 0.07
Average 1.05 1.00 31.65 27.19 108.66 7.10 3.18 0.48
SD 0.20 0.26 14.34 13.08 65.77 3.79 0.84 0.18 C57BL/6 11 SEM 0.06 0.08 4.33 3.95 19.83 1.14 0.25 0.05

142142
Table B7. Statistical Summary for Weight Normalized Inbred Mouse Femur Mechanical Testing. LEFT RIGHT
Peak Torque/ Weight (Nmm/g) (ANOVA p = 0.007) Peak Torque/ Weight (Nmm/g) (ANOVA p = 0.025) ICR C3H DBA/2 C57BL/6 ICR C3H DBA/2 C57BL/6
ICR ---------- 0.082 0.117 0.141 ICR ---------- 0.027 0.035 0.867 C3H ---------- 0.002 0.010 C3H ---------- 0.907 0.022
DBA/2 ---------- 0.922 DBA/2 ---------- 0.030 C57BL/6 ---------- C57BL/6 ----------
Rigidity/ Weight (N/mm2g) (ANOVA p = 0.082) Rigidity/ Weight (N/mm2g) (ANOVA p = 0.081) ICR C3H DBA/2 C57BL/6 ICR C3H DBA/2 C57BL/6
ICR ---------- NA NA NA ICR ---------- NA NA NA C3H ---------- NA NA C3H ---------- NA NA
DBA/2 ---------- NA DBA/2 ---------- NA C57BL/6 ---------- C57BL/6 ----------
Shear Modulus/ Weight (GPa/g) (ANOVA p <0.001) Shear Modulus/ Weight (GPa/g) (ANOVA p = 0.048) ICR C3H DBA/2 C57BL/6 ICR C3H DBA/2 C57BL/6
ICR ---------- <0.001 0.005 0.682 ICR ---------- 0.491 0.014 0.040 C3H ---------- 0.009 <0.001 C3H ---------- 0.078 0.178
DBA/2 ---------- 0.017 DBA/2 ---------- 0.666 C57BL/6 ---------- C57BL/6 ----------
Shear Stress/ Weight (MPa/g) (ANOVA p <0.001) Shear Stress/ Weight (MPa/g) (ANOVA p = 0.060) ICR C3H DBA/2 C57BL/6 ICR C3H DBA/2 C57BL/6
ICR ---------- <0.001 <0.001 0.950 ICR ---------- NA NA NA C3H ---------- <0.001 <0.001 C3H ---------- NA NA
DBA/2 ---------- <0.001 DBA/2 ---------- NA C57BL/6 ---------- C57BL/6 ----------

143143
Table B8. Summary of Inbred Mouse Femur Mechanical Testing Data Normalized to Femur Cross-Sectional Area.
Peak Torque (N/mm2) Rigidity (N/mm4) Shear Modulus (GPa/mm2)
Shear Stress (MPa/mm2) Strain n
Left Right Left Right Left Right Left Right Average 19.15 4.07 446.89 115.24 1.46 0.02 51.37 1.48
SD 3.37 1.42 239.59 65.86 0.71 0.01 14.52 0.77 ICR 13 SEM 0.93 0.39 66.45 18.27 0.20 0.00 4.03 0.21
Average 19.54 2.83 683.43 72.72 5.52 0.02 127.46 1.31
SD 2.70 0.60 250.77 25.39 3.38 0.01 34.32 0.57 C3H 11 SEM 0.81 0.18 75.61 7.65 1.02 0.00 10.35 0.17
Average 18.46 3.30 611.20 81.82 4.15 0.04 107.80 2.21
SD 3.42 1.51 200.59 40.56 1.44 0.03 22.05 1.54 DBA/2 11 SEM 1.03 0.46 60.48 12.23 0.44 0.01 6.65 0.46
Average 15.81 3.90 482.33 100.92 1.68 0.03 48.65 1.92
SD 2.69 1.52 232.45 44.20 1.07 0.02 14.39 1.05 C57BL/6 11 SEM 0.81 0.46 70.09 13.33 0.32 0.01 4.34 0.32

144144
Table B9. Statistical Summary for Cross-Sectional Area Normalized Inbred Mouse Femur Mechanical Testing. LEFT RIGHT
Peak Torque/ Area (N/mm2) (ANOVA p = 0.028) Peak Torque/ Area (N/mm2) (ANOVA p = 0.112) ICR C3H DBA/2 C57BL/6 ICR C3H DBA/2 C57BL/6
ICR ---------- 0.761 0.588 0.011 ICR ---------- NA NA NA C3H ---------- 0.418 0.009 C3H ---------- NA NA
DBA/2 ---------- 0.050 DBA/2 ---------- NA C57BL/6 ---------- C57BL/6 ----------
Rigidity/ Area (N/mm4) (ANOVA p = 0.062) Rigidity/ Area (N/mm4) (ANOVA p = 0.140) ICR C3H DBA/2 C57BL/6 ICR C3H DBA/2 C57BL/6
ICR ---------- NA NA NA ICR ---------- NA NA NA C3H ---------- NA NA C3H ---------- NA NA
DBA/2 ---------- NA DBA/2 ---------- NA C57BL/6 ---------- C57BL/6 ----------
Shear Modulus/ Area (GPa/mm2) (ANOVA p <0.001) Shear Modulus/ Area (GPa/mm2) (ANOVA p = 0.099) ICR C3H DBA/2 C57BL/6 ICR C3H DBA/2 C57BL/6
ICR ---------- <0.001 0.001 0.780 ICR ---------- NA NA NA C3H ---------- 0.099 <0.001 C3H ---------- NA NA
DBA/2 ---------- 0.004 DBA/2 ---------- NA C57BL/6 ---------- C57BL/6 ----------
Shear Stress/ Area (MPa/mm2) (ANOVA p <0.001) Shear Stress/ Area (MPa/mm2) (ANOVA p = 0.164) ICR C3H DBA/2 C57BL/6 ICR C3H DBA/2 C57BL/6
ICR ---------- <0.001 <0.001 0.769 ICR ---------- NA NA NA C3H ---------- 0.047 <0.001 C3H ---------- NA NA
DBA/2 ---------- <0.001 DBA/2 ---------- NA C57BL/6 ---------- C57BL/6 ----------

145145
Table B10. Summary of Inbred Mouse Femur Mechanical Testing Data Normalized to Bone Mineral Density. Peak Torque
(Nmm)/(g/cm2)) Rigidity (N/mm)/(g/cm2) Shear Modulus (GPa)/(g/cm2)
Shear Stress (MPa)/(g/cm2) Strain n
Left Right Left Right Left Right Left Right Average 47.67 25.87 1631.80 653.75 12.81 176.17 304.42 11.53
SD 8.06 4.48 522.66 167.35 6.58 83.84 58.79 3.40 C3H 11 SEM 2.43 1.35 157.59 50.46 1.98 25.28 17.73 1.03
Average 47.07 34.21 1561.47 838.30 10.49 350.73 272.89 21.93
SD 9.32 10.83 536.42 321.80 3.54 211.80 51.24 11.30 DBA/2 11 SEM 2.81 3.27 161.74 97.03 1.07 63.86 15.45 3.41
Average 72.66 70.62 2178.27 1856.18 7.46 491.31 220.05 33.72
SD 8.47 20.20 890.05 766.21 4.18 247.88 46.44 13.87 C57BL/6 11 SEM 2.55 6.09 268.36 231.02 1.26 74.74 14.00 4.18

146146
Table B11. Statistical Summary for Bone Mineral Density Normalized Inbred Mechanical Testing.
LEFT RIGHT Peak Torque/BMD (Nmm)/(g/cm2) (ANOVA p <0.001) Peak Torque/BMD (Nmm)/(g/cm2) (ANOVA p <0.001) C3H DBA/2 C57BL/6 C3H DBA/2 C57BL/6
C3H ---------- 0.872 <0.001 C3H ---------- 0.157 <0.001 DBA/2 ---------- <0.001 DBA/2 ---------- <0.001
C57BL/6 ---------- C57BL/6 ---------- Rigidity (Nmm2)/(g/cm2) (ANOVA p = 0.078) Rigidity (Nmm2)/(g/cm2) (ANOVA p <0.001)
C3H DBA/2 C57BL/6 C3H DBA/2 C57BL/6 C3H ---------- NA NA C3H ---------- 0.384 <0.001
DBA/2 ---------- NA DBA/2 ---------- <0.001 C57BL/6 ---------- C57BL/6 ----------
Shear Modulus (GPa)/(g/cm2) (ANOVA p = 0.053) Shear Modulus (GPa)/(g/cm2) (ANOVA p = 0.003) C3H DBA/2 C57BL/6 C3H DBA/2 C57BL/6
C3H ---------- NA NA C3H ---------- 0.044 <0.001 DBA/2 ---------- NA DBA/2 ---------- 0.100
C57BL/6 ---------- C57BL/6 ---------- Shear Stress (MPa)/(g/cm2) (ANOVA p = 0.003) Shear Stress (MPa)/(g/cm2) (ANOVA p <0.001)
C3H DBA/2 C57BL/6 C3H DBA/2 C57BL/6 C3H ---------- 0.169 <0.001 C3H ---------- 0.027 <0.001
DBA/2 ---------- 0.025 DBA/2 ---------- 0.013 C57BL/6 ---------- C57BL/6 ----------

147147
Table B12. Cox-1KO Mouse Fracture Callus Histomorphometry Measurements. Time Point n TA
(mm2) B
(mm2) MA
(mm2) CA
(mm2) GT
(mm2) Void CALLUS (mm2) % MA/CALLUS % CA/CALLUS % GT/CALLUS
AVERAGE 9.49 2.67 0.45 0.45 3.14 2.77 6.82 6.82 6.60 47.02 SD 1.19 0.36 0.20 0.13 0.89 1.18 1.21 3.09 0.92 16.13 7 Days 4
SEM 0.59 0.18 0.10 0.06 0.45 0.59 0.60 1.55 0.46 8.07
AVERAGE 14.35 3.16 2.92 1.97 3.56 2.74 11.19 25.80 17.74 31.63 SD 0.85 0.63 1.03 0.52 0.76 0.93 0.96 7.30 5.22 4.68 10 Days 4
SEM 0.43 0.32 0.52 0.26 0.38 0.46 0.48 3.65 2.61 2.34
AVERAGE 16.92 4.00 5.20 1.96 1.45 4.31 12.93 40.38 14.99 11.27 SD 1.78 0.44 0.40 0.86 0.08 0.82 1.48 2.12 5.75 0.84 14 Days 3
SEM 1.03 0.26 0.23 0.50 0.05 0.47 0.86 1.22 3.32 0.49
AVERAGE 15.37 3.08 7.70 0.00 0.00 4.59 12.29 62.29 0.00 0.00 SD 1.92 0.37 1.74 0.00 0.00 0.56 2.26 3.21 0.00 0.00 21 Days 4
SEM 0.96 0.19 0.87 0.00 0.00 0.28 1.13 1.60 0.00 0.00
AVERAGE 10.55 2.32 4.81 0.00 0.00 3.41 8.23 57.83 0.00 0.00 SD 1.21 0.12 1.38 0.00 0.00 0.72 1.17 10.34 0.00 0.00 28 Days 4
SEM 0.60 0.06 0.69 0.00 0.00 0.36 0.58 5.17 0.00 0.00
AVERAGE 10.88 2.29 4.06 0.00 0.00 4.52 8.58 47.76 0.00 0.00 SD 1.90 0.42 0.48 0.00 0.00 1.08 1.49 4.33 0.00 0.00 42 Days 3
SEM 1.10 0.24 0.28 0.00 0.00 0.62 0.86 2.50 0.00 0.00
AVERAGE 8.87 2.10 3.42 0.00 0.00 3.36 6.77 50.60 0.00 0.00 SD 2.03 0.25 1.67 0.00 0.00 1.58 2.24 14.55 0.00 0.00 84 Days 4
SEM 1.02 0.13 0.83 0.00 0.00 0.79 1.12 7.27 0.00 0.00

148148
Table B13. Cox-2KO Mouse Fracture Callus Histomorphometry Measurements. Time Point n TA
(mm2) B
(mm2) MA
(mm2) CA
(mm2) GT
(mm2) Void CALLUS (mm2) % MA/CALLUS % CA/CALLUS % GT/CALLUS
AVERAGE 8.90 2.03 0.00 0.20 4.63 2.03 6.87 0.00 2.97 67.42 SD 0.27 0.11 0.00 0.08 0.57 0.56 0.19 0.00 1.21 7.81 7 Days 3
SEM 0.16 0.06 0.00 0.05 0.33 0.32 0.11 0.00 0.70 4.51
AVERAGE 11.01 3.12 0.52 0.86 3.68 2.83 7.89 6.64 10.99 46.54 SD 1.56 0.80 0.59 0.48 1.79 1.48 1.76 7.00 5.54 18.62 10 Days 5
SEM 0.70 0.36 0.26 0.21 0.80 0.66 0.79 3.13 2.48 8.33
AVERAGE 12.39 2.68 2.67 0.89 3.28 2.87 9.71 27.41 8.88 33.74 SD 1.41 1.02 1.30 0.61 0.77 0.63 0.80 13.13 5.49 7.26 14 Days 3
SEM 0.82 0.59 0.75 0.35 0.45 0.36 0.46 7.58 3.17 4.19
AVERAGE 14.50 2.93 5.59 0.49 1.93 3.57 11.57 48.66 4.26 16.94 SD 2.01 0.66 0.81 0.18 0.20 1.46 1.49 7.62 1.61 3.15 21 Days 4
SEM 1.00 0.33 0.41 0.09 0.10 0.73 0.75 3.81 0.81 1.58
AVERAGE 12.89 2.56 5.92 0.09 1.23 3.09 10.33 58.01 1.03 12.12 SD 1.52 0.53 1.22 0.18 1.19 1.52 1.55 13.86 2.06 12.25 28 Days 4
SEM 0.76 0.26 0.61 0.09 0.60 0.76 0.78 6.93 1.03 6.12
AVERAGE 12.34 1.96 6.09 0.18 0.54 3.57 10.38 60.24 1.40 4.24 SD 1.80 0.23 0.91 0.36 1.08 0.92 1.61 14.61 2.80 8.49 42 Days 4
SEM 0.90 0.12 0.46 0.18 0.54 0.46 0.80 7.30 1.40 4.25
AVERAGE 7.63 1.73 3.36 0.00 0.00 2.53 5.89 57.97 0.00 0.00 SD 1.73 0.46 0.36 0.00 0.00 0.96 1.30 6.00 0.00 0.00 84 Days 4
SEM 0.87 0.23 0.18 0.00 0.00 0.48 0.65 3.00 0.00 0.00
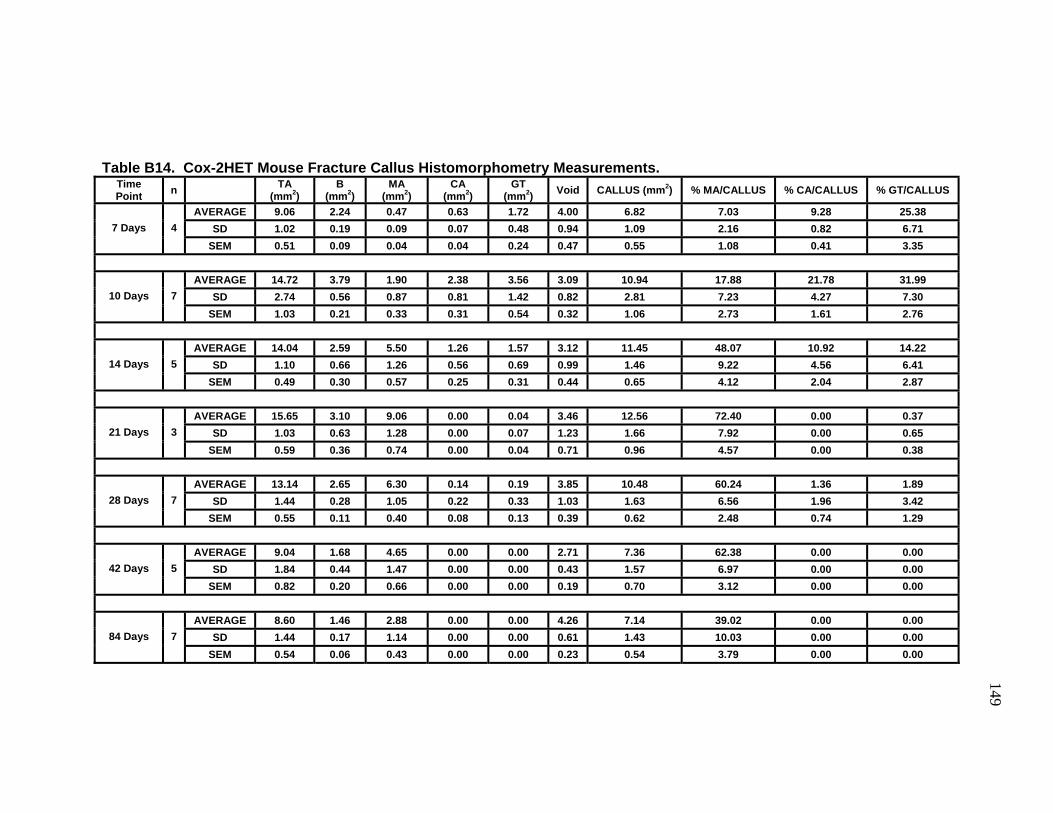
149149
Table B14. Cox-2HET Mouse Fracture Callus Histomorphometry Measurements.
Time Point n TA
(mm2) B
(mm2) MA
(mm2) CA
(mm2) GT
(mm2) Void CALLUS (mm2) % MA/CALLUS % CA/CALLUS % GT/CALLUS
AVERAGE 9.06 2.24 0.47 0.63 1.72 4.00 6.82 7.03 9.28 25.38 SD 1.02 0.19 0.09 0.07 0.48 0.94 1.09 2.16 0.82 6.71 7 Days 4
SEM 0.51 0.09 0.04 0.04 0.24 0.47 0.55 1.08 0.41 3.35
AVERAGE 14.72 3.79 1.90 2.38 3.56 3.09 10.94 17.88 21.78 31.99 SD 2.74 0.56 0.87 0.81 1.42 0.82 2.81 7.23 4.27 7.30 10 Days 7
SEM 1.03 0.21 0.33 0.31 0.54 0.32 1.06 2.73 1.61 2.76
AVERAGE 14.04 2.59 5.50 1.26 1.57 3.12 11.45 48.07 10.92 14.22 SD 1.10 0.66 1.26 0.56 0.69 0.99 1.46 9.22 4.56 6.41 14 Days 5
SEM 0.49 0.30 0.57 0.25 0.31 0.44 0.65 4.12 2.04 2.87
AVERAGE 15.65 3.10 9.06 0.00 0.04 3.46 12.56 72.40 0.00 0.37 SD 1.03 0.63 1.28 0.00 0.07 1.23 1.66 7.92 0.00 0.65 21 Days 3
SEM 0.59 0.36 0.74 0.00 0.04 0.71 0.96 4.57 0.00 0.38
AVERAGE 13.14 2.65 6.30 0.14 0.19 3.85 10.48 60.24 1.36 1.89 SD 1.44 0.28 1.05 0.22 0.33 1.03 1.63 6.56 1.96 3.42 28 Days 7
SEM 0.55 0.11 0.40 0.08 0.13 0.39 0.62 2.48 0.74 1.29
AVERAGE 9.04 1.68 4.65 0.00 0.00 2.71 7.36 62.38 0.00 0.00 SD 1.84 0.44 1.47 0.00 0.00 0.43 1.57 6.97 0.00 0.00 42 Days 5
SEM 0.82 0.20 0.66 0.00 0.00 0.19 0.70 3.12 0.00 0.00
AVERAGE 8.60 1.46 2.88 0.00 0.00 4.26 7.14 39.02 0.00 0.00 SD 1.44 0.17 1.14 0.00 0.00 0.61 1.43 10.03 0.00 0.00 84 Days 7
SEM 0.54 0.06 0.43 0.00 0.00 0.23 0.54 3.79 0.00 0.00

150150
Table B15. Cox-2WT Mouse Fracture Callus Histomorphometry Measurements.
Time Point n TA
(mm2) B
(mm2) MA
(mm2) CA
(mm2) GT
(mm2) Void CALLUS (mm2) % MA/CALLUS % CA/CALLUS % GT/CALLUS
AVERAGE 8.96 2.36 0.55 0.59 1.27 4.20 6.60 8.10 9.38 19.84 SD 1.03 0.36 0.22 0.21 0.49 1.26 1.26 2.22 4.22 9.00 7 Days 5
SEM 0.46 0.16 0.10 0.09 0.22 0.56 0.56 0.99 1.89 4.03
AVERAGE 15.20 2.36 2.73 2.40 2.22 5.50 12.84 21.07 18.62 17.29 SD 0.69 0.26 1.25 1.34 0.01 0.76 0.49 9.23 10.12 0.73 10 Days 3
SEM 0.40 0.15 0.72 0.78 0.00 0.44 0.28 5.33 5.84 0.42
AVERAGE 16.57 2.91 7.18 1.38 0.99 4.12 13.67 50.43 10.58 7.81 SD 2.71 0.91 3.25 0.43 0.58 0.29 2.91 14.56 4.65 5.41 14 Days 5
SEM 1.21 0.41 1.46 0.19 0.26 0.13 1.30 6.51 2.08 2.42
AVERAGE 16.18 2.50 9.54 0.21 0.00 3.93 13.68 69.75 1.20 0.00 SD 2.94 0.22 2.56 0.42 0.00 1.38 3.10 7.45 2.41 0.00 21 Days 4
SEM 1.47 0.11 1.28 0.21 0.00 0.69 1.55 3.73 1.20 0.00
AVERAGE 12.69 2.55 6.31 0.00 0.00 3.83 10.14 62.05 0.00 0.00 SD 1.71 0.63 1.64 0.00 0.00 1.07 1.74 9.57 0.00 0.00 28 Days 6
SEM 0.70 0.26 0.67 0.00 0.00 0.44 0.71 3.91 0.00 0.00
AVERAGE 8.59 1.45 2.79 0.00 0.00 4.35 7.14 39.04 0.00 0.00 SD 0.33 0.26 0.62 0.00 0.00 0.61 0.18 8.38 0.00 0.00 42 Days 3
SEM 0.19 0.15 0.36 0.00 0.00 0.35 0.11 4.84 0.00 0.00
AVERAGE 8.72 1.44 2.96 0.00 0.00 4.32 7.28 39.71 0.00 0.00 SD 1.85 0.25 1.16 0.00 0.00 0.78 1.78 8.63 0.00 0.00 84 Days 3
SEM 1.07 0.15 0.67 0.00 0.00 0.45 1.03 4.98 0.00 0.00

151151
Left Right Left Right Left Right Left Right Left Right Left Right Left RightAverage 37.73 26.87 80.85 1.55 5.84 377.66 0.17 2.25 4.34 4.37 1042.80 629.58 67.47 6.30 0.31 5.53 179.31 18.99 11.64
SD 11.97 7.74 38.48 0.11 1.05 75.57 0.03 0.74 0.67 0.83 586.46 278.12 35.02 3.62 0.17 3.65 48.82 6.02 5.28SEM 3.61 2.34 11.60 0.03 0.32 22.78 0.01 0.22 0.20 0.25 176.82 83.86 10.56 1.09 0.05 1.10 14.72 1.81 1.59
Average 39.21 30.32 77.38 1.36 6.49 477.51 0.12 2.74 4.90 4.28 1134.61 711.16 67.41 9.64 0.29 3.52 239.71 19.72 8.19SD 2.88 5.78 13.45 0.11 1.42 88.91 0.02 1.07 0.92 0.92 201.95 296.48 39.04 2.86 0.16 2.72 29.90 7.04 2.77
SEM 0.96 1.93 4.48 0.04 0.47 29.64 0.01 0.36 0.31 0.31 67.32 98.83 13.01 0.95 0.05 0.91 9.97 2.35 0.92Average 41.10 33.65 85.18 1.61 7.46 463.53 0.18 3.48 4.46 5.01 1075.93 900.97 88.75 6.08 0.26 4.57 186.66 17.81 9.60
SD 8.48 8.45 28.95 0.11 0.94 53.81 0.03 0.73 0.79 0.76 280.93 364.39 42.69 1.62 0.10 2.11 44.34 6.72 2.61SEM 2.68 2.67 9.15 0.04 0.30 17.02 0.01 0.23 0.25 0.24 88.84 115.23 13.50 0.51 0.03 0.67 14.02 2.12 0.83
Average 37.35 12.10 35.64 1.46 7.11 483.96 0.14 3.20 4.16 4.85 849.89 172.33 22.63 5.83 0.07 1.19 198.05 7.06 3.65SD 10.94 5.00 20.82 0.15 1.83 103.32 0.03 1.44 0.46 0.83 363.18 60.99 10.13 1.88 0.05 0.70 51.71 4.32 2.00
SEM 3.65 1.67 6.94 0.05 0.61 34.44 0.01 0.48 0.15 0.28 121.06 20.33 3.38 0.63 0.02 0.23 17.24 1.44 0.67
Left Right Left Right Left Right Left Right Left Right Left Right Left RightAverage 33.77 30.14 91.48 1.57 3.14 200.39 0.17 0.78 5.00 4.36 836.50 990.22 137.70 4.98 1.75 45.77 160.82 54.61 36.72
SD 6.08 7.47 25.09 0.10 0.99 61.64 0.02 0.49 0.92 0.61 296.37 268.69 68.04 1.78 1.09 44.16 34.67 20.13 19.44SEM 1.69 2.07 6.96 0.03 0.28 17.10 0.01 0.14 0.26 0.17 82.20 74.52 18.87 0.49 0.30 12.25 9.62 5.58 5.39
Average 32.45 31.91 97.72 1.55 3.52 227.50 0.17 1.00 4.70 4.69 920.89 817.56 98.49 6.04 1.00 19.72 155.39 48.60 31.70SD 7.99 10.00 15.31 0.19 1.10 63.79 0.04 0.72 0.74 0.79 359.30 309.54 46.31 2.86 0.53 13.57 28.86 18.21 10.73
SEM 2.53 3.16 4.84 0.06 0.35 20.17 0.01 0.23 0.23 0.25 113.62 97.89 14.65 0.91 0.17 4.29 9.13 5.76 3.39Average 31.07 27.27 89.41 1.54 3.32 215.96 0.16 0.85 4.63 4.77 925.13 829.50 98.53 6.22 1.19 21.30 155.98 45.62 29.94
SD 5.64 5.03 18.32 0.21 0.82 45.18 0.05 0.40 0.98 1.03 331.73 259.17 39.54 3.10 0.63 13.29 46.80 17.90 9.40SEM 1.51 1.34 4.90 0.06 0.22 12.08 0.01 0.11 0.26 0.27 88.66 69.27 10.57 0.83 0.17 3.55 12.51 4.79 2.51
Average 28.42 27.64 101.12 1.55 3.59 233.41 0.17 0.94 4.59 4.37 834.45 614.97 74.83 4.99 0.68 14.09 139.48 39.66 31.06SD 7.56 6.66 29.40 0.21 0.73 47.52 0.05 0.36 0.43 0.46 323.68 308.58 25.50 1.28 0.31 6.36 42.77 14.90 16.81
SEM 2.68 2.35 10.40 0.08 0.26 16.80 0.02 0.13 0.15 0.16 114.44 109.10 9.02 0.45 0.11 2.25 15.12 5.27 5.94
Shear Stress (MPa) %S
Peak Torque (Nmm) %P
Area (mm2)%A %R
Shear Modulus (GPa) %G
Cox-1KO 13
Strain nPolar Moment of Inertia (J)
Gage Length (mm) Rigidity (Nmm2)
%SStrain n %P %ARigidity (Nmm2)
Shear Modulus (GPa)
Cox-2KO 8
28 D
ays
84 D
ays Cox-2WT 10
Cox-2HET 14
Cox-2KO 9
Cox-2WT 9
Cox-2HET 10
Table B16. Summary of Cyclooxygenase Deficient Mouse Femur Mechanical Testing Data.Shear Stress
(MPa)
Cox-1KO 11
Peak Torque (Nmm) Area (mm2)
Polar Moment of Inertia (J)
Gage Length (mm) %R %G

152152
Time Point n TA (mm2) B (mm2) MA (mm2) CA (mm2) GT (mm2) Void CALLUS (mm2) % MA/CALLUS % CA/CALLUS % GT/CALLUSAVERAGE 12.70 2.22 2.57 3.22 1.31 3.37 10.47 24.56 30.84 12.48
SD 0.54 0.30 0.31 0.28 0.37 0.50 0.42 3.33 3.46 3.29SEM 0.24 0.13 0.14 0.13 0.17 0.22 0.19 1.49 1.55 1.47
AVERAGE 12.73 1.68 5.25 1.57 0.54 3.69 11.05 47.57 14.46 4.93SD 1.27 0.31 0.57 0.79 0.09 1.05 1.26 2.86 7.53 1.01
SEM 0.57 0.14 0.25 0.35 0.04 0.47 0.56 1.28 3.37 0.45
AVERAGE 14.74 2.31 6.38 0.35 0.00 5.71 12.43 51.46 2.73 0.00SD 1.09 0.54 0.65 0.49 0.00 1.20 1.22 5.38 3.71 0.00
SEM 0.49 0.24 0.29 0.22 0.00 0.54 0.55 2.41 1.66 0.00
AVERAGE 11.68 1.66 7.59 0.00 0.00 2.43 10.02 75.72 0.00 0.00SD 1.02 0.36 0.79 0.00 0.00 0.34 0.98 2.55 0.00 0.00
SEM 0.46 0.16 0.36 0.00 0.00 0.15 0.44 1.14 0.00 0.00
Time Point n TA (mm2) B (mm2) MA (mm2) CA (mm2) GT (mm2) Void CALLUS (mm2) % MA/CALLUS % CA/CALLUS % GT/CALLUSAVERAGE 11.71 2.77 1.18 0.72 3.81 3.24 8.94 12.89 7.84 43.75
SD 2.17 0.44 0.46 0.26 1.11 1.25 1.96 3.76 1.31 14.36SEM 0.97 0.20 0.21 0.12 0.50 0.56 0.88 1.68 0.59 6.42
AVERAGE 14.47 2.75 4.16 2.35 2.09 3.13 11.72 35.49 20.16 17.60SD 0.99 0.86 1.17 0.67 1.04 0.55 0.78 9.67 6.13 7.95
SEM 0.44 0.38 0.53 0.30 0.47 0.24 0.35 4.32 2.74 3.56
AVERAGE 16.26 2.04 6.33 0.53 0.11 7.24 14.21 44.66 3.63 0.85SD 1.36 0.21 1.04 0.23 0.17 1.15 1.26 7.14 1.37 1.28
SEM 0.61 0.09 0.46 0.10 0.08 0.51 0.56 3.19 0.61 0.57
AVERAGE 13.22 2.19 8.49 0.00 0.00 2.54 11.03 77.26 0.00 0.00SD 0.77 0.32 0.52 0.00 0.00 0.88 0.89 6.26 0.00 0.00
SEM 0.35 0.14 0.23 0.00 0.00 0.40 0.40 2.80 0.00 0.00
5
14 Days 5
5
7 Days 5
Table B17. 5-LOKO and 5-LOWT Mouse Fracture Callus Histomorphometry Measurements.
7 Days 5
10 Days 5
21 Days
21 Days 5
5-LOWT Histomorphometry Measurements
5-LOKO Histomorphometry Measurements
10 Days 5
14 Days

153153
Left Right Left Right Left Right Left Right Left Right Left Right Left Right
Average 24.84 28.56 115.49 1.49 4.56 308.37 0.16 1.29 4.26 4.14 687.80 614.77 91.52 4.24 0.52 12.88 126.37 34.50 28.15
SD 4.94 6.30 16.32 0.09 0.93 71.42 0.02 0.42 0.54 0.44 168.48 191.80 25.37 1.02 0.22 6.30 27.69 8.96 8.20
SEM 1.49 1.90 4.92 0.03 0.28 21.53 0.01 0.13 0.16 0.13 50.80 57.83 7.65 0.31 0.06 1.90 8.35 2.70 2.47
Average 31.89 29.63 94.64 1.63 5.57 344.06 0.20 1.79 4.69 4.58 819.41 490.94 63.59 4.24 0.30 7.48 143.59 26.96 19.46
SD 5.00 5.58 23.33 0.12 1.09 73.72 0.03 0.57 0.48 0.44 200.11 175.06 26.44 1.03 0.12 3.51 29.91 6.59 6.53
SEM 1.51 1.68 7.04 0.04 0.33 22.23 0.01 0.17 0.14 0.13 60.34 52.78 7.97 0.31 0.04 1.06 9.02 1.99 1.97
Average 23.84 24.97 107.90 1.40 2.85 204.19 0.14 0.58 4.94 4.53 645.22 492.57 81.12 4.53 0.94 21.91 129.58 53.28 43.06
SD 5.66 3.51 21.38 0.07 0.41 33.44 0.02 0.14 0.52 0.32 156.87 116.15 30.28 0.82 0.44 12.34 29.40 12.24 12.86
SEM 2.00 1.24 7.56 0.03 0.15 11.82 0.01 0.05 0.18 0.11 55.46 41.07 10.71 0.29 0.15 4.36 10.40 4.33 4.90
Average 37.19 29.72 83.92 1.71 3.96 233.14 0.21 1.03 4.65 4.35 784.48 756.95 98.63 3.75 0.80 23.29 155.96 43.78 30.25
SD 8.39 4.90 22.90 0.11 0.92 57.14 0.03 0.40 0.61 0.63 208.16 184.49 21.01 1.18 0.24 8.99 37.43 14.33 12.33
SEM 2.53 1.48 6.91 0.03 0.28 17.23 0.01 0.12 0.18 0.19 62.76 55.63 6.33 0.36 0.07 2.71 11.29 4.32 3.72
Table B18. Summary of 5-LOKO and 5-LOWT Mouse Femur Mechanical Testing Data.
Strain n
Peak Torque (Nmm) %P
Area (mm2)%A
Polar Moment of Inertia (J) %G
Shear Stress (MPa) %S
5-LOKO 11
Gage Length (mm)
Rigidity (Nmm2) %R
Shear Modulus (GPa)
28 D
ays
84 D
ays
5-LOKO 8
WT 11
WT 11

154
References
1. Cho TJ, Gerstenfeld LC, Einhorn TA 2002 Differential temporal expression of members of the transforming growth factor beta superfamily during murine fracture healing. J Bone Miner Res 17(3):513-20.
2. Einhorn TA 1998 The cell and molecular biology of fracture healing. Clin Orthop (355 Suppl):S7-21.
3. Reddi AH 2001 Bone morphogenetic proteins: from basic science to clinical applications. J Bone Joint Surg Am 83-A Suppl 1(Pt 1):S1-6.
4. Sandberg MM, Aro HT, Vuorio EI 1993 Gene expression during bone repair. Clin Orthop Relat Res (289):292-312.
5. Greenbaum MA, Kanat IO 1993 Current concepts in bone healing. Review of the literature. J Am Podiatr Med Assoc 83(3):123-9.
6. Crenshaw A 1992 General principles of fracture treatment. In: Crenshaw A (ed.) Campbell's Operative Orthopaedics, 8th ed. Mosby-Year Book, St. Louis.
7. McKibbin B 1978 The biology of fracture healing in long bones. J Bone Joint Surg Br 60-B(2):150-62.
8. Cruess R, Dumont J 1975 Healing of Bone, Tendon and Ligament. In: Rockwood C, Green D (eds.) Fractures. J.B. Lippincott, Philadelphia, pp 97.
9. Frost HM 1989 The biology of fracture healing. An overview for clinicians. Part I. Clin Orthop (248):283-93.
10. Brighton CT, Hunt RM 1991 Early histological and ultrastructural changes in medullary fracture callus. J Bone Joint Surg Am 73(6):832-47.
11. Bolander ME 1992 Regulation of fracture repair by growth factors. Proc Soc Exp Biol Med 200(2):165-70.
12. Einhorn TA, Majeska RJ, Rush EB, Levine PM, Horowitz MC 1995 The expression of cytokine activity by fracture callus. J Bone Miner Res 10(8):1272-81.
13. Mizuno K, Mineo K, Tachibana T, Sumi M, Matsubara T, Hirohata K 1990 The osteogenetic potential of fracture haematoma. Subperiosteal and intramuscular transplantation of the haematoma. J Bone Joint Surg Br 72(5):822-9.
14. Fisher LW, Termine JD 1985 Noncollagenous proteins influencing the local mechanisms of calcification. Clin Orthop Relat Res (200):362-85.
15. Einhorn TA, Trippel SB 1997 Growth factor treatment of fractures. Instr Course Lect 46:483-6.
16. Jingushi S, Joyce ME, Bolander ME 1992 Genetic expression of extracellular matrix proteins correlates with histologic changes during fracture repair. J Bone Miner Res 7(9):1045-55.
17. Topping RE, Bolander ME, Balian G 1994 Type X collagen in fracture callus and the effects of experimental diabetes. Clin Orthop Relat Res (308):220-8.

155
18. Becker RO, Murray DG 1967 A method for producing cellular dedifferentiation by means of very small electrical currents. Trans N Y Acad Sci 29(5):606-15.
19. Einhorn TA, Hirschman A, Kaplan C, Nashed R, Devlin VJ, Warman J 1989 Neutral protein-degrading enzymes in experimental fracture callus: a preliminary report. J Orthop Res 7(6):792-805.
20. Barnes GL, Kostenuik PJ, Gerstenfeld LC, Einhorn TA 1999 Growth factor regulation of fracture repair. J Bone Miner Res 14(11):1805-15.
21. Steinbrech DS, Mehrara BJ, Saadeh PB, Greenwald JA, Spector JA, Gittes GK, Longaker MT 2000 VEGF expression in an osteoblast-like cell line is regulated by a hypoxia response mechanism. Am J Physiol Cell Physiol 278(4):C853-60.
22. Rydziel S, Varghese S, Canalis E 1997 Transforming growth factor beta1 inhibits collagenase 3 expression by transcriptional and post-transcriptional mechanisms in osteoblast cultures. J Cell Physiol 170(2):145-52.
23. Lee FY, Choi YW, Behrens FF, DeFouw DO, Einhorn TA 1998 Programmed removal of chondrocytes during endochondral fracture healing. J Orthop Res 16(1):144-50.
24. Gerber HP, Vu TH, Ryan AM, Kowalski J, Werb Z, Ferrara N 1999 VEGF couples hypertrophic cartilage remodeling, ossification and angiogenesis during endochondral bone formation. Nat Med 5(6):623-8.
25. Hollinger J, Wong ME 1996 The integrated processes of hard tissue regeneration with special emphasis on fracture healing. Oral Surg Oral Med Oral Pathol Oral Radiol Endod 82(6):594-606.
26. Le AX, Miclau T, Hu D, Helms JA 2001 Molecular aspects of healing in stabilized and non-stabilized fractures. J Orthop Res 19(1):78-84.
27. Gerstenfeld LC, Cullinane DM, Barnes GL, Graves DT, Einhorn TA 2003 Fracture healing as a post-natal developmental process: molecular, spatial, and temporal aspects of its regulation. J Cell Biochem 88(5):873-84.
28. Solheim E 1998 Growth factors in bone. Int Orthop 22(6):410-6. 29. Massague J, Attisano L, Wrana JL 1994 The TGF-beta family and its
composite receptors. Trends Cell Biol 4(5):172-8. 30. Bostrom MP 1998 Expression of bone morphogenetic proteins in fracture
healing. Clin Orthop Relat Res (355 Suppl):S116-23. 31. Lieberman JR, Daluiski A, Einhorn TA 2002 The role of growth factors in
the repair of bone. Biology and clinical applications. J Bone Joint Surg Am 84-A(6):1032-44.
32. Heldin CH, Miyazono K, ten Dijke P 1997 TGF-beta signalling from cell membrane to nucleus through SMAD proteins. Nature 390(6659):465-71.
33. Mundy GR 1996 Regulation of bone formation by bone morphogenetic proteins and other growth factors. Clin Orthop Relat Res (324):24-8.
34. Sakou T 1998 Bone morphogenetic proteins: from basic studies to clinical approaches. Bone 22(6):591-603.

156
35. Fujii M, Takeda K, Imamura T, Aoki H, Sampath TK, Enomoto S, Kawabata M, Kato M, Ichijo H, Miyazono K 1999 Roles of bone morphogenetic protein type I receptors and Smad proteins in osteoblast and chondroblast differentiation. Mol Biol Cell 10(11):3801-13.
36. Onishi T, Ishidou Y, Nagamine T, Yone K, Imamura T, Kato M, Sampath TK, ten Dijke P, Sakou T 1998 Distinct and overlapping patterns of localization of bone morphogenetic protein (BMP) family members and a BMP type II receptor during fracture healing in rats. Bone 22(6):605-12.
37. ten Dijke P, Fu J, Schaap P, Roelen BA 2003 Signal transduction of bone morphogenetic proteins in osteoblast differentiation. J Bone Joint Surg Am 85-A Suppl 3:34-8.
38. Cheng H, Jiang W, Phillips FM, Haydon RC, Peng Y, Zhou L, Luu HH, An N, Breyer B, Vanichakarn P, Szatkowski JP, Park JY, He TC 2003 Osteogenic activity of the fourteen types of human bone morphogenetic proteins (BMPs). J Bone Joint Surg Am 85-A(8):1544-52.
39. Deckers MM, van Bezooijen RL, van der Horst G, Hoogendam J, van Der Bent C, Papapoulos SE, Lowik CW 2002 Bone morphogenetic proteins stimulate angiogenesis through osteoblast-derived vascular endothelial growth factor A. Endocrinology 143(4):1545-53.
40. Peng H, Wright V, Usas A, Gearhart B, Shen HC, Cummins J, Huard J 2002 Synergistic enhancement of bone formation and healing by stem cell-expressed VEGF and bone morphogenetic protein-4. J Clin Invest 110(6):751-9.
41. Valdimarsdottir G, Goumans MJ, Rosendahl A, Brugman M, Itoh S, Lebrin F, Sideras P, ten Dijke P 2002 Stimulation of Id1 expression by bone morphogenetic protein is sufficient and necessary for bone morphogenetic protein-induced activation of endothelial cells. Circulation 106(17):2263-70.
42. Lind M 1998 Growth factor stimulation of bone healing. Effects on osteoblasts, osteomies, and implants fixation. Acta Orthop Scand Suppl 283:2-37.
43. Wang JS 1996 Basic fibroblast growth factor for stimulation of bone formation in osteoinductive or conductive implants. Acta Orthop Scand Suppl 269:1-33.
44. Friesel RE, Maciag T 1995 Molecular mechanisms of angiogenesis: fibroblast growth factor signal transduction. Faseb J 9(10):919-25.
45. Jingushi S, Heydemann A, Kana SK, Macey LR, Bolander ME 1990 Acidic fibroblast growth factor (aFGF) injection stimulates cartilage enlargement and inhibits cartilage gene expression in rat fracture healing. J Orthop Res 8(3):364-71.
46. Rodan SB, Wesolowski G, Thomas K, Rodan GA 1987 Growth stimulation of rat calvaria osteoblastic cells by acidic fibroblast growth factor. Endocrinology 121(6):1917-23.
47. Xu X, Weinstein M, Li C, Deng C 1999 Fibroblast growth factor receptors (FGFRs) and their roles in limb development. Cell Tissue Res 296(1):33-43.

157
48. Nakamura T, Hara Y, Tagawa M, Tamura M, Yuge T, Fukuda H, Nigi H 1998 Recombinant human basic fibroblast growth factor accelerates fracture healing by enhancing callus remodeling in experimental dog tibial fracture. J Bone Miner Res 13(6):942-9.
49. Dionne CA, Jaye M, Schlessinger J 1991 Structural diversity and binding of FGF receptors. Ann N Y Acad Sci 638:161-6.
50. Deng C, Wynshaw-Boris A, Zhou F, Kuo A, Leder P 1996 Fibroblast growth factor receptor 3 is a negative regulator of bone growth. Cell 84(6):911-21.
51. Dietz F, Muschler G 2000 Update on the genetic basis of disorders with orthopaedic manifestations. In: Buckwalter J, Einhorn T, Simon S (eds.) Orthopaedic Basic Science. AAOS, Rosemont, pp 114.
52. Canalis E, Varghese S, McCarthy TL, Centrella M 1992 Role of platelet derived growth factor in bone cell function. Growth Regul 2(4):151-5.
53. Claesson-Welsh L, Heldin CH 1989 Platelet-derived growth factor. Three isoforms that bind to two distinct cell surface receptors. Acta Oncol 28(3):331-4.
54. Heldin CH, Westermark B 1987 PDGF-like growth factors in autocrine stimulation of growth. J Cell Physiol Suppl Suppl 5:31-4.
55. Andrew JG, Hoyland JA, Freemont AJ, Marsh DR 1995 Platelet-derived growth factor expression in normally healing human fractures. Bone 16(4):455-60.
56. Millis DL 1999 Bone- and non-bone-derived growth factors and effects on bone healing. Vet Clin North Am Small Anim Pract 29(5):1221-46.
57. Linder BL, Chernoff A, Kaplan KL, Goodman DS 1979 Release of platelet-derived growth factor from human platelets by arachidonic acid. Proc Natl Acad Sci U S A 76(8):4107-11.
58. Canalis E 1980 Effect of insulinlike growth factor I on DNA and protein synthesis in cultured rat calvaria. J Clin Invest 66(4):709-19.
59. Prisell PT, Edwall D, Lindblad JB, Levinovitz A, Norstedt G 1993 Expression of insulin-like growth factors during bone induction in rat. Calcif Tissue Int 53(3):201-5.
60. Andrew JG, Hoyland J, Freemont AJ, Marsh D 1993 Insulinlike growth factor gene expression in human fracture callus. Calcif Tissue Int 53(2):97-102.
61. Bak B, Jorgensen PH, Andreassen TT 1990 Dose response of growth hormone on fracture healing in the rat. Acta Orthop Scand 61(1):54-7.
62. Gerstenfeld LC, Cho TJ, Kon T, Aizawa T, Tsay A, Fitch J, Barnes GL, Graves DT, Einhorn TA 2003 Impaired fracture healing in the absence of TNF-alpha signaling: the role of TNF-alpha in endochondral cartilage resorption. J Bone Miner Res 18(9):1584-92.
63. Kon T, Cho TJ, Aizawa T, Yamazaki M, Nooh N, Graves D, Gerstenfeld LC, Einhorn TA 2001 Expression of osteoprotegerin, receptor activator of NF-kappaB ligand (osteoprotegerin ligand) and related proinflammatory cytokines during fracture healing. J Bone Miner Res 16(6):1004-14.

158
64. Visse R, Nagase H 2003 Matrix metalloproteinases and tissue inhibitors of metalloproteinases: structure, function, and biochemistry. Circ Res 92(8):827-39.
65. Shapiro SD 1998 Matrix metalloproteinase degradation of extracellular matrix: biological consequences. Curr Opin Cell Biol 10(5):602-8.
66. Stamenkovic I 2003 Extracellular matrix remodelling: the role of matrix metalloproteinases. J Pathol 200(4):448-64.
67. Lehmann W, Edgar CM, Wang K, Cho TJ, Barnes GL, Kakar S, Graves DT, Rueger JM, Gerstenfeld LC, Einhorn TA 2005 Tumor necrosis factor alpha (TNF-alpha) coordinately regulates the expression of specific matrix metalloproteinases (MMPS) and angiogenic factors during fracture healing. Bone 36(2):300-10.
68. Ferrara N, Keyt B 1997 Vascular endothelial growth factor: basic biology and clinical implications. Exs 79:209-32.
69. Raisz LG 2005 Pathogenesis of osteoporosis: concepts, conflicts, and prospects. J Clin Invest 115(12):3318-25.
70. Dalle Carbonare L, Giannini S 2004 Bone microarchitecture as an important determinant of bone strength. J Endocrinol Invest 27(1):99-105.
71. Lanyon L, Armstrong V, Ong D, Zaman G, Price J 2004 Is estrogen receptor alpha key to controlling bones' resistance to fracture? J Endocrinol 182(2):183-91.
72. Roschger P, Matsuo K, Misof BM, Tesch W, Jochum W, Wagner EF, Fratzl P, Klaushofer K 2004 Normal mineralization and nanostructure of sclerotic bone in mice overexpressing Fra-1. Bone 34(5):776-82.
73. Nguyen TV, Center JR, Pocock NA, Eisman JA 2004 Limited utility of clinical indices for the prediction of symptomatic fracture risk in postmenopausal women. Osteoporos Int 15(1):49-55.
74. Klein RF 2002 Genetic regulation of bone mineral density in mice. J Musculoskelet Neuronal Interact 2(3):232-6.
75. Evans RA, Marel GM, Lancaster EK, Kos S, Evans M, Wong SY 1988 Bone mass is low in relatives of osteoporotic patients. Ann Intern Med 109(11):870-3.
76. Jouanny P, Guillemin F, Kuntz C, Jeandel C, Pourel J 1995 Environmental and genetic factors affecting bone mass. Similarity of bone density among members of healthy families. Arthritis Rheum 38(1):61-7.
77. Kelly PJ, Harris M 1995 Genetic regulation of peak bone mass. Acta Paediatr Suppl 411:24-9; discussion 30.
78. Pocock NA, Eisman JA, Hopper JL, Yeates MG, Sambrook PN, Eberl S 1987 Genetic determinants of bone mass in adults. A twin study. J Clin Invest 80(3):706-10.
79. Slemenda CW, Christian JC, Williams CJ, Norton JA, Johnston CC, Jr. 1991 Genetic determinants of bone mass in adult women: a reevaluation of the twin model and the potential importance of gene interaction on heritability estimates. J Bone Miner Res 6(6):561-7.
80. Smith DM, Nance WE, Kang KW, Christian JC, Johnston CC, Jr. 1973 Genetic factors in determining bone mass. J Clin Invest 52(11):2800-8.

159
81. Morrison NA, Qi JC, Tokita A, Kelly PJ, Crofts L, Nguyen TV, Sambrook PN, Eisman JA 1994 Prediction of bone density from vitamin D receptor alleles. Nature 367(6460):284-7.
82. Looney JE, Yoon HK, Fischer M, Farley SM, Farley JR, Wergedal JE, Baylink DJ 1995 Lack of a high prevalence of the BB vitamin D receptor genotype in severely osteoporotic women. J Clin Endocrinol Metab 80(7):2158-62.
83. Hustmyer FG, Peacock M, Hui S, Johnston CC, Christian J 1994 Bone mineral density in relation to polymorphism at the vitamin D receptor gene locus. J Clin Invest 94(5):2130-4.
84. Howard G, Nguyen T, Morrison N, Watanabe T, Sambrook P, Eisman J, Kelly PJ 1995 Genetic influences on bone density: physiological correlates of vitamin D receptor gene alleles in premenopausal women. J Clin Endocrinol Metab 80(9):2800-5.
85. Bailey DW 1979 Definition of Inbred Strains. In: Altman PL, Katz DD (eds.) Inbred and Genetically Defined Strains of Laboratory Animals, vol. 1: Mouse and Rat. Federation of American Societies for Experimental Biology, Bethesda.
86. Cohen C 1979 Inbred Animals: History, Uses, and Classification. In: Altman PL, Katz DD (eds.) Inbred and Genetically Defined Strains of Laboratory Animals, vol. 1: Mouse and Rat. Federation of American Societies for Experimental Biology, Bethesda.
87. Koller DL, Liu G, Econs MJ, Hui SL, Morin PA, Joslyn G, Rodriguez LA, Conneally PM, Christian JC, Johnston CC, Jr., Foroud T, Peacock M 2001 Genome screen for quantitative trait loci underlying normal variation in femoral structure. J Bone Miner Res 16(6):985-91.
88. Beamer WG, Shultz KL, Churchill GA, Frankel WN, Baylink DJ, Rosen CJ, Donahue LR 1999 Quantitative trait loci for bone density in C57BL/6J and CAST/EiJ inbred mice. Mamm Genome 10(11):1043-9.
89. Beamer WG, Shultz KL, Donahue LR, Churchill GA, Sen S, Wergedal JR, Baylink DJ, Rosen CJ 2001 Quantitative trait loci for femoral and lumbar vertebral bone mineral density in C57BL/6J and C3H/HeJ inbred strains of mice. J Bone Miner Res 16(7):1195-206.
90. Volkman SK, Galecki AT, Burke DT, Miller RA, Goldstein SA 2004 Quantitative trait loci that modulate femoral mechanical properties in a genetically heterogeneous mouse population. J Bone Miner Res 19(9):1497-505.
91. Klein RF, Mitchell SR, Phillips TJ, Belknap JK, Orwoll ES 1998 Quantitative trait loci affecting peak bone mineral density in mice. J Bone Miner Res 13(11):1648-56.
92. Drake TA, Hannani K, Kabo JM, Villa V, Krass K, Lusis AJ 2001 Genetic loci influencing natural variations in femoral bone morphometry in mice. J Orthop Res 19(4):511-7.
93. Hornby SB, Evans GP, Hornby SL, Pataki A, Glatt M, Green JR 2003 Long-term zoledronic acid treatment increases bone structure and

160
mechanical strength of long bones of ovariectomized adult rats. Calcif Tissue Int 72(4):519-27.
94. Myers VS, Jr. 1965 Confusing radiologic variations at the distal end of the radius of the horse. J Am Vet Med Assoc 147(12):1310-2.
95. Gao H, Ji B, Jager IL, Arzt E, Fratzl P 2003 Materials become insensitive to flaws at nanoscale: lessons from nature. Proc Natl Acad Sci U S A 100(10):5597-600.
96. Shapiro R, Heaney RP 2003 Co-dependence of calcium and phosphorus for growth and bone development under conditions of varying deficiency. Bone 32(5):532-40.
97. Funk CD 2001 Prostaglandins and leukotrienes: advances in eicosanoid biology. Science 294(5548):1871-5.
98. Bergstroem S, Danielsson H, Samuelsson B 1964 The Enzymatic Formation of Prostaglandin E2 from Arachidonic Acid Prostaglandins and Related Factors 32. Biochim Biophys Acta 90:207-10.
99. Samuelsson B 1983 Leukotrienes: mediators of immediate hypersensitivity reactions and inflammation. Science 220(4597):568-75.
100. Pace-Asciak CR, Granstrom E, Samuelsson B 1983 Arachidonic acid epoxides. Isolation and structure of two hydroxy epoxide intermediates in the formation of 8,11,12- and 10,11,12-trihydroxyeicosatrienoic acids. J Biol Chem 258(11):6835-40.
101. Samuelsson B, Dahlen SE, Lindgren JA, Rouzer CA, Serhan CN 1987 Leukotrienes and lipoxins: structures, biosynthesis, and biological effects. Science 237(4819):1171-6.
102. Henderson WR, Jr. 1994 The role of leukotrienes in inflammation. Ann Intern Med 121(9):684-97.
103. Serhan CN 1994 Lipoxin biosynthesis and its impact in inflammatory and vascular events. Biochim Biophys Acta 1212(1):1-25.
104. Peppelenbosch MP, Tertoolen LG, Hage WJ, de Laat SW 1993 Epidermal growth factor-induced actin remodeling is regulated by 5-lipoxygenase and cyclooxygenase products. Cell 74(3):565-75.
105. Capodici C, Pillinger MH, Han G, Philips MR, Weissmann G 1998 Integrin-dependent homotypic adhesion of neutrophils. Arachidonic acid activates Raf-1/Mek/Erk via a 5-lipoxygenase- dependent pathway. J Clin Invest 102(1):165-75.
106. Tsujii M, DuBois RN 1995 Alterations in cellular adhesion and apoptosis in epithelial cells overexpressing prostaglandin endoperoxide synthase 2. Cell 83(3):493-501.
107. Tong WG, Ding XZ, Witt RC, Adrian TE 2002 Lipoxygenase inhibitors attenuate growth of human pancreatic cancer xenografts and induce apoptosis through the mitochondrial pathway. Mol Cancer Ther 1(11):929-35.
108. Romano M, Catalano A, Nutini M, D'Urbano E, Crescenzi C, Claria J, Libner R, Davi G, Procopio A 2001 5-lipoxygenase regulates malignant mesothelial cell survival: involvement of vascular endothelial growth factor. Faseb J 15(13):2326-36.

161
109. Tsujii M, Kawano S, Tsuji S, Sawaoka H, Hori M, DuBois RN 1998 Cyclooxygenase regulates angiogenesis induced by colon cancer cells. Cell 93(5):705-16.
110. Constantini S, Tamir J, Gomori MJ, Shohami E 1993 Tumor prostaglandin levels correlate with edema around supratentorial meningiomas. Neurosurgery 33(2):204-10; discussion 211.
111. Black KL, Hoff JT, McGillicuddy JE, Gebarski SS 1986 Increased leukotriene C4 and vasogenic edema surrounding brain tumors in humans. Ann Neurol 19(6):592-5.
112. Soberman RJ, Christmas P 2003 The organization and consequences of eicosanoid signaling. J Clin Invest 111(8):1107-13.
113. Dubois RN, Abramson SB, Crofford L, Gupta RA, Simon LS, Van De Putte LB, Lipsky PE 1998 Cyclooxygenase in biology and disease. Faseb J 12(12):1063-73.
114. Zhang X, Schwarz EM, Young DA, Puzas JE, Rosier RN, O'Keefe RJ 2002 Cyclooxygenase-2 regulates mesenchymal cell differentiation into the osteoblast lineage and is critically involved in bone repair. J Clin Invest 109(11):1405-15.
115. Breyer RM, Bagdassarian CK, Myers SA, Breyer MD 2001 Prostanoid receptors: subtypes and signaling. Annu Rev Pharmacol Toxicol 41:661-90.
116. Smith WL, DeWitt DL, Garavito RM 2000 Cyclooxygenases: structural, cellular, and molecular biology. Annu Rev Biochem 69:145-82.
117. Fujishima H, Sanchez Mejia RO, Bingham CO, 3rd, Lam BK, Sapirstein A, Bonventre JV, Austen KF, Arm JP 1999 Cytosolic phospholipase A2 is essential for both the immediate and the delayed phases of eicosanoid generation in mouse bone marrow-derived mast cells. Proc Natl Acad Sci U S A 96(9):4803-7.
118. Gilroy DW, Newson J, Sawmynaden P, Willoughby DA, Croxtall JD 2004 A novel role for phospholipase A2 isoforms in the checkpoint control of acute inflammation. Faseb J 18(3):489-98.
119. Hawkey CJ 1999 COX-2 inhibitors. Lancet 353(9149):307-14. 120. Davies P, Bailey PJ, Goldenberg MM, Ford-Hutchinson AW 1984 The role
of arachidonic acid oxygenation products in pain and inflammation. Annu Rev Immunol 2:335-57.
121. Vane JR 1971 Inhibition of prostaglandin synthesis as a mechanism of action for aspirin-like drugs. Nat New Biol 231(25):232-5.
122. Vane JR, Botting RM 1997 Mechanism of action of aspirin-like drugs. Semin Arthritis Rheum 26(6 Suppl 1):2-10.
123. Vane JR, Bakhle YS, Botting RM 1998 Cyclooxygenases 1 and 2. Annu Rev Pharmacol Toxicol 38:97-120.
124. Raz A, Wyche A, Needleman P 1989 Temporal and pharmacological division of fibroblast cyclooxygenase expression into transcriptional and translational phases. Proc Natl Acad Sci U S A 86(5):1657-61.

162
125. Fu JY, Masferrer JL, Seibert K, Raz A, Needleman P 1990 The induction and suppression of prostaglandin H2 synthase (cyclooxygenase) in human monocytes. J Biol Chem 265(28):16737-40.
126. Picot D, Loll PJ, Garavito RM 1994 The X-ray crystal structure of the membrane protein prostaglandin H2 synthase-1. Nature 367(6460):243-9.
127. Luong C, Miller A, Barnett J, Chow J, Ramesha C, Browner MF 1996 Flexibility of the NSAID binding site in the structure of human cyclooxygenase-2. Nat Struct Biol 3(11):927-33.
128. Kawaguchi H, Raisz LG, Voznesensky OS, Alander CB, Hakeda Y, Pilbeam CC 1994 Regulation of the two prostaglandin G/H synthases by parathyroid hormone, interleukin-1, cortisol, and prostaglandin E2 in cultured neonatal mouse calvariae. Endocrinology 135(3):1157-64.
129. Simmons DL, Levy DB, Yannoni Y, Erikson RL 1989 Identification of a phorbol ester-repressible v-src-inducible gene. Proc Natl Acad Sci U S A 86(4):1178-82.
130. Kujubu DA, Fletcher BS, Varnum BC, Lim RW, Herschman HR 1991 TIS10, a phorbol ester tumor promoter-inducible mRNA from Swiss 3T3 cells, encodes a novel prostaglandin synthase/cyclooxygenase homologue. J Biol Chem 266(20):12866-72.
131. O'Banion MK, Sadowski HB, Winn V, Young DA 1991 A serum- and glucocorticoid-regulated 4-kilobase mRNA encodes a cyclooxygenase-related protein. J Biol Chem 266(34):23261-7.
132. Wong WY, Richards JS 1991 Evidence for two antigenically distinct molecular weight variants of prostaglandin H synthase in the rat ovary. Mol Endocrinol 5(9):1269-79.
133. Xie WL, Chipman JG, Robertson DL, Erikson RL, Simmons DL 1991 Expression of a mitogen-responsive gene encoding prostaglandin synthase is regulated by mRNA splicing. Proc Natl Acad Sci U S A 88(7):2692-6.
134. Fletcher BS, Kujubu DA, Perrin DM, Herschman HR 1992 Structure of the mitogen-inducible TIS10 gene and demonstration that the TIS10-encoded protein is a functional prostaglandin G/H synthase. J Biol Chem 267(7):4338-44.
135. Golden BD, Abramson SB 1999 Selective cyclooxygenase-2 inhibitors. Rheum Dis Clin North Am 25(2):359-78.
136. Scheiman JM 1996 NSAIDs, gastrointestinal injury, and cytoprotection. Gastroenterol Clin North Am 25(2):279-98.
137. Zambraski EJ 1995 The effects of nonsteroidal anti-inflammatory drugs on renal function: experimental studies in animals. Semin Nephrol 15(3):205-13.
138. Breyer MD, Jacobson HR, Breyer RM 1996 Functional and molecular aspects of renal prostaglandin receptors. J Am Soc Nephrol 7(1):8-17.
139. Burch JW, Stanford N, Majerus PW 1978 Inhibition of platelet prostaglandin synthetase by oral aspirin. J Clin Invest 61(2):314-9.
140. Crofford LJ 1997 COX-1 and COX-2 tissue expression: implications and predictions. J Rheumatol Suppl 49:15-9.

163
141. Anderson GD, Hauser SD, McGarity KL, Bremer ME, Isakson PC, Gregory SA 1996 Selective inhibition of cyclooxygenase (COX)-2 reverses inflammation and expression of COX-2 and interleukin 6 in rat adjuvant arthritis. J Clin Invest 97(11):2672-9.
142. Harris RC, McKanna JA, Akai Y, Jacobson HR, Dubois RN, Breyer MD 1994 Cyclooxygenase-2 is associated with the macula densa of rat kidney and increases with salt restriction. J Clin Invest 94(6):2504-10.
143. Guan Y, Chang M, Cho W, Zhang Y, Redha R, Davis L, Chang S, DuBois RN, Hao CM, Breyer M 1997 Cloning, expression, and regulation of rabbit cyclooxygenase-2 in renal medullary interstitial cells. Am J Physiol 273(1 Pt 2):F18-26.
144. Kaufmann WE, Worley PF, Pegg J, Bremer M, Isakson P 1996 COX-2, a synaptically induced enzyme, is expressed by excitatory neurons at postsynaptic sites in rat cerebral cortex. Proc Natl Acad Sci U S A 93(6):2317-21.
145. Tocco G, Freire-Moar J, Schreiber SS, Sakhi SH, Aisen PS, Pasinetti GM 1997 Maturational regulation and regional induction of cyclooxygenase-2 in rat brain: implications for Alzheimer's disease. Exp Neurol 144(2):339-49.
146. Narko K, Ritvos O, Ristimaki A 1997 Induction of cyclooxygenase-2 and prostaglandin F2alpha receptor expression by interleukin-1beta in cultured human granulosa-luteal cells. Endocrinology 138(9):3638-44.
147. Chakraborty I, Das SK, Wang J, Dey SK 1996 Developmental expression of the cyclo-oxygenase-1 and cyclo-oxygenase-2 genes in the peri-implantation mouse uterus and their differential regulation by the blastocyst and ovarian steroids. J Mol Endocrinol 16(2):107-22.
148. Yang ZM, Das SK, Wang J, Sugimoto Y, Ichikawa A, Dey SK 1997 Potential sites of prostaglandin actions in the periimplantation mouse uterus: differential expression and regulation of prostaglandin receptor genes. Biol Reprod 56(2):368-79.
149. Miettinen S, Fusco FR, Yrjanheikki J, Keinanen R, Hirvonen T, Roivainen R, Narhi M, Hokfelt T, Koistinaho J 1997 Spreading depression and focal brain ischemia induce cyclooxygenase-2 in cortical neurons through N-methyl-D-aspartic acid-receptors and phospholipase A2. Proc Natl Acad Sci U S A 94(12):6500-5.
150. Amin AR, Attur M, Patel RN, Thakker GD, Marshall PJ, Rediske J, Stuchin SA, Patel IR, Abramson SB 1997 Superinduction of cyclooxygenase-2 activity in human osteoarthritis-affected cartilage. Influence of nitric oxide. J Clin Invest 99(6):1231-7.
151. Tai H, Miyaura C, Pilbeam CC, Tamura T, Ohsugi Y, Koishihara Y, Kubodera N, Kawaguchi H, Raisz LG, Suda T 1997 Transcriptional induction of cyclooxygenase-2 in osteoblasts is involved in interleukin-6-induced osteoclast formation. Endocrinology 138(6):2372-9.
152. Onoe Y, Miyaura C, Kaminakayashiki T, Nagai Y, Noguchi K, Chen QR, Seo H, Ohta H, Nozawa S, Kudo I, Suda T 1996 IL-13 and IL-4 inhibit

164
bone resorption by suppressing cyclooxygenase-2-dependent prostaglandin synthesis in osteoblasts. J Immunol 156(2):758-64.
153. Cohn SM, Schloemann S, Tessner T, Seibert K, Stenson WF 1997 Crypt stem cell survival in the mouse intestinal epithelium is regulated by prostaglandins synthesized through cyclooxygenase-1. J Clin Invest 99(6):1367-79.
154. Langenbach R, Morham SG, Tiano HF, Loftin CD, Ghanayem BI, Chulada PC, Mahler JF, Lee CA, Goulding EH, Kluckman KD, Kim HS, Smithies O 1995 Prostaglandin synthase 1 gene disruption in mice reduces arachidonic acid-induced inflammation and indomethacin-induced gastric ulceration. Cell 83(3):483-92.
155. Hedi H, Norbert G 2004 5-Lipoxygenase Pathway, Dendritic Cells, and Adaptive Immunity. J Biomed Biotechnol 2004(2):99-105.
156. Peters-Golden M, Brock TG 2001 Intracellular compartmentalization of leukotriene synthesis: unexpected nuclear secrets. FEBS Lett 487(3):323-6.
157. Rouzer CA, Shimizu T, Samuelsson B 1985 On the nature of the 5-lipoxygenase reaction in human leukocytes: characterization of a membrane-associated stimulatory factor. Proc Natl Acad Sci U S A 82(22):7505-9.
158. Radmark O 2002 Arachidonate 5-lipoxygenase. Prostaglandins Other Lipid Mediat 68-69:211-34.
159. Gronert K, Clish CB, Romano M, Serhan CN 1999 Transcellular regulation of eicosanoid biosynthesis. Methods Mol Biol 120:119-44.
160. Radmark O, Shimizu T, Jornvall H, Samuelsson B 1984 Leukotriene A4 hydrolase in human leukocytes. Purification and properties. J Biol Chem 259(20):12339-45.
161. Yoshimoto T, Soberman RJ, Spur B, Austen KF 1988 Properties of highly purified leukotriene C4 synthase of guinea pig lung. J Clin Invest 81(3):866-71.
162. Serhan CN 1997 Lipoxins and novel aspirin-triggered 15-epi-lipoxins (ATL): a jungle of cell-cell interactions or a therapeutic opportunity? Prostaglandins 53(2):107-37.
163. Serhan CN, Sheppard KA 1990 Lipoxin formation during human neutrophil-platelet interactions. Evidence for the transformation of leukotriene A4 by platelet 12-lipoxygenase in vitro. J Clin Invest 85(3):772-80.
164. Fiore S, Serhan CN 1990 Formation of lipoxins and leukotrienes during receptor-mediated interactions of human platelets and recombinant human granulocyte/macrophage colony-stimulating factor-primed neutrophils. J Exp Med 172(5):1451-7.
165. Romano M, Chen XS, Takahashi Y, Yamamoto S, Funk CD, Serhan CN 1993 Lipoxin synthase activity of human platelet 12-lipoxygenase. Biochem J 296 ( Pt 1):127-33.
166. Romano M, Serhan CN 1992 Lipoxin generation by permeabilized human platelets. Biochemistry 31(35):8269-77.

165
167. Papayianni A, Serhan CN, Phillips ML, Rennke HG, Brady HR 1995 Transcellular biosynthesis of lipoxin A4 during adhesion of platelets and neutrophils in experimental immune complex glomerulonephritis. Kidney Int 47(5):1295-302.
168. Edenius C, Haeggstrom J, Lindgren JA 1988 Transcellular conversion of endogenous arachidonic acid to lipoxins in mixed human platelet-granulocyte suspensions. Biochem Biophys Res Commun 157(2):801-7.
169. Goldman DW, Goetzl EJ 1982 Specific binding of leukotriene B4 to receptors on human polymorphonuclear leukocytes. J Immunol 129(4):1600-4.
170. Goldman DW, Goetzl EJ 1984 Heterogeneity of human polymorphonuclear leukocyte receptors for leukotriene B4. Identification of a subset of high affinity receptors that transduce the chemotactic response. J Exp Med 159(4):1027-41.
171. Kato K, Yokomizo T, Izumi T, Shimizu T 2000 Cell-specific transcriptional regulation of human leukotriene B(4) receptor gene. J Exp Med 192(3):413-20.
172. Yokomizo T, Kato K, Hagiya H, Izumi T, Shimizu T 2001 Hydroxyeicosanoids bind to and activate the low affinity leukotriene B4 receptor, BLT2. J Biol Chem 276(15):12454-9.
173. Kamohara M, Takasaki J, Matsumoto M, Saito T, Ohishi T, Ishii H, Furuichi K 2000 Molecular cloning and characterization of another leukotriene B4 receptor. J Biol Chem 275(35):27000-4.
174. Christie PE, Henderson WR, Jr. 2002 Lipid inflammatory mediators: leukotrienes, prostaglandins, platelet-activating factor. Clin Allergy Immunol 16:233-54.
175. Lynch KR, O'Neill GP, Liu Q, Im DS, Sawyer N, Metters KM, Coulombe N, Abramovitz M, Figueroa DJ, Zeng Z, Connolly BM, Bai C, Austin CP, Chateauneuf A, Stocco R, Greig GM, Kargman S, Hooks SB, Hosfield E, Williams DL, Jr., Ford-Hutchinson AW, Caskey CT, Evans JF 1999 Characterization of the human cysteinyl leukotriene CysLT1 receptor. Nature 399(6738):789-93.
176. Gronert K, Martinsson-Niskanen T, Ravasi S, Chiang N, Serhan CN 2001 Selectivity of recombinant human leukotriene D(4), leukotriene B(4), and lipoxin A(4) receptors with aspirin-triggered 15-epi-LXA(4) and regulation of vascular and inflammatory responses. Am J Pathol 158(1):3-9.
177. Mellor EA, Maekawa A, Austen KF, Boyce JA 2001 Cysteinyl leukotriene receptor 1 is also a pyrimidinergic receptor and is expressed by human mast cells. Proc Natl Acad Sci U S A 98(14):7964-9.
178. Mancini JA, Abramovitz M, Cox ME, Wong E, Charleson S, Perrier H, Wang Z, Prasit P, Vickers PJ 1993 5-lipoxygenase-activating protein is an arachidonate binding protein. FEBS Lett 318(3):277-81.
179. Katzung Be 2001 Basic and Clinical Pharmacology, 8th ed. McGraw-Hill, New York.
180. Schafer AI 1995 Effects of nonsteroidal antiinflammatory drugs on platelet function and systemic hemostasis. J Clin Pharmacol 35(3):209-19.

166
181. Patrono C 1994 Aspirin as an antiplatelet drug. N Engl J Med 330(18):1287-94.
182. Cryer B, Feldman M 1998 Cyclooxygenase-1 and cyclooxygenase-2 selectivity of widely used nonsteroidal anti-inflammatory drugs. Am J Med 104(5):413-21.
183. Griffin MR 1998 Epidemiology of nonsteroidal anti-inflammatory drug-associated gastrointestinal injury. Am J Med 104(3A):23S-29S; discussion 41S-42S.
184. Gabriel SE, Fehring RA 1992 Trends in the utilization of non-steroidal anti-inflammatory drugs in the United States, 1986-1990. J Clin Epidemiol 45(9):1041-4.
185. Nishida T, Tsujii M, Tsuji S 2004 [Are COX-2 inhibitors truly able to prevent NSAIDs-associated ulcer?]. Nippon Rinsho 62(3):561-5.
186. Elder CL, Dahners LE, Weinhold PS 2001 A cyclooxygenase-2 inhibitor impairs ligament healing in the rat. Am J Sports Med 29(6):801-5.
187. Drazen JM, Israel E, O'Byrne PM 1999 Treatment of asthma with drugs modifying the leukotriene pathway. N Engl J Med 340(3):197-206.
188. Drazen J 1998 Clinical pharmacology of leukotriene receptor antagonists and 5-lipoxygenase inhibitors. Am J Respir Crit Care Med 157(6 Pt 2):S233-7; discussion S247-8.
189. Bernstein PR 1998 Chemistry and structure--activity relationships of leukotriene receptor antagonists. Am J Respir Crit Care Med 157(6 Pt 2):S220-5; discussion S225-6, S247-8.
190. Aharony D 1998 Pharmacology of leukotriene receptor antagonists. Am J Respir Crit Care Med 157(6 Pt 2):S214-8; discussion S218-9, S247-8.
191. Schultz R 1972 The Language of Fractures. Williams and Wilkins, Baltimore.
192. Reichel H, Lebek S, Alter C, Hein W 1998 Biomechanical and densitometric bone properties after callus distraction in sheep. Clin Orthop Relat Res (357):237-46.
193. Robertson DM, Smith DC, Das SK, Kumar A 1980 Microdensitometry as a clinical tool for diagnosing the progress of fracture healing. J Oral Surg 38(10):740-3.
194. Milne EN 1974 Electronic magnification of the x-ray image. Radiology 113(3):521-8.
195. Rao GU, Clark RL 1970 Radiographic magnification versus optical magnification. Radiology 94(1):196.
196. Eriksen E, Axelrod D, Melsen Fse 1994 Bone histomorphometry. In: EF E (ed.), 1st ed. Raven Press Ltd, New York.
197. An Y, Barfield W, Knets I 2000 Methods of Evaluation for Bone Dimensions, Densities, Contents, Morphology, and Structures. In: An Y, Draughn R (eds.) Mechanical Testing of Bone and the Bone-Implant Interface, 1st ed. CRC Press, Boca Raton, pp 103-118.
198. Gerstenfeld LC, Wronski TJ, Hollinger JO, Einhorn TA 2005 Application of histomorphometric methods to the study of bone repair. J Bone Miner Res 20(10):1715-22.

167
199. An Y, Bell T 1999 Mechanical Properties and Testing Methods of Bone. In: An Y, Friedman R (eds.) Animal Models in Orthopaedic Research, 1st ed. CRC Press, Boca Raton.
200. Turner CH, Burr DB 1993 Basic biomechanical measurements of bone: a tutorial. Bone 14(4):595-608.
201. Bronk JT, Ilstrup D, An K-N 1995 Further characterization of the Bonnarens and Einhorn rat femur fracture model. Trans Orthop Res Soc. 20:587.
202. Arnoczky S, Wilson J 1986 Experimental Surgery of the Skeletal System. In: Gay W, Heavner J (eds.) Methods of Animal Experimentation, vol. VII. Academic Press, London, pp 67-108.
203. An Y, Friedman R 1999 Animal Selections in Orthopaedic Research. In: An Y, Friedman R (eds.) Animal Models in Orthopaedic Research, 1st ed. CRC Press, Boca Raton, pp 39-57.
204. White AA, 3rd, Panjabi MM, Southwick WO 1977 The four biomechanical stages of fracture repair. J Bone Joint Surg Am 59(2):188-92.
205. An Y, Friedman R, Draughn R 1999 Animal Models of Bone Fracture or Osteotomy. In: An Y, Friedman R (eds.) Animal Models in Orthopaedic Research, 1st ed. CRC Press, Boca Raton, pp 197-217.
206. Nunamaker DM 1998 Experimental models of fracture repair. Clin Orthop Relat Res (355 Suppl):S56-65.
207. Egermann M, Goldhahn J, Schneider E 2005 Animal models for fracture treatment in osteoporosis. Osteoporos Int 16 Suppl 2:S129-38.
208. Kelly PJ, Montgomery RJ, Bronk JT 1990 Reaction of the circulatory system to injury and regeneration. Clin Orthop Relat Res (254):275-88.
209. Bonnarens F, Einhorn TA 1984 Production of a standard closed fracture in laboratory animal bone. J Orthop Res 2(1):97-101.
210. Ekeland A, Engesaeter LB, Langeland N 1981 Mechanical properties of fractured and intact rat femora evaluated by bending, torsional and tensile tests. Acta Orthop Scand 52(6):605-13.
211. Ferretti JL, Capozza RF, Mondelo N, Zanchetta JR 1993 Interrelationships between densitometric, geometric, and mechanical properties of rat femora: inferences concerning mechanical regulation of bone modeling. J Bone Miner Res 8(11):1389-96.
212. Lepola V, Vaananen K, Jalovaara P 1993 The effect of immobilization on the torsional strength of the rat tibia. Clin Orthop Relat Res (297):55-61.
213. Mosekilde L, Danielsen CC, Sogaard CH, Thorling E 1994 The effect of long-term exercise on vertebral and femoral bone mass, dimensions, and strength--assessed in a rat model. Bone 15(3):293-301.
214. Peng Z, Tuukkanen J, Zhang H, Jamsa T, Vaananen HK 1994 The mechanical strength of bone in different rat models of experimental osteoporosis. Bone 15(5):523-32.
215. Raab DM, Smith EL, Crenshaw TD, Thomas DP 1990 Bone mechanical properties after exercise training in young and old rats. J Appl Physiol 68(1):130-4.

168
216. Isefuku S, Joyner CJ, Reed AA, Simpson AH 2004 Distraction osteogenesis in the Cbfa-1+/- mouse. J Orthop Res 22(6):1276-82.
217. Paccione MF, Warren SM, Spector JA, Greenwald JA, Bouletreau PJ, Longaker MT 2001 A mouse model of mandibular osteotomy healing. J Craniofac Surg 12(5):444-50.
218. Yamagiwa H, Tokunaga K, Hayami T, Hatano H, Uchida M, Endo N, Takahashi HE 1999 Expression of metalloproteinase-13 (Collagenase-3) is induced during fracture healing in mice. Bone 25(2):197-203.
219. Bourque WT, Gross M, Hall BK 1992 A reproducible method for producing and quantifying the stages of fracture repair. Lab Anim Sci 42(4):369-74.
220. Hiltunen A, Vuorio E, Aro HT 1993 A standardized experimental fracture in the mouse tibia. J Orthop Res 11(2):305-12.
221. Hiltunen A, Aro HT, Vuorio E 1993 Regulation of extracellular matrix genes during fracture healing in mice. Clin Orthop (297):23-7.
222. Fujii H, Kitazawa R, Maeda S, Mizuno K, Kitazawa S 1999 Expression of platelet-derived growth factor proteins and their receptor alpha and beta mRNAs during fracture healing in the normal mouse. Histochem Cell Biol 112(2):131-8.
223. Uusitalo H, Hiltunen A, Ahonen M, Gao TJ, Lefebvre V, Harley V, Kahari VM, Vuorio E 2001 Accelerated up-regulation of L-Sox5, Sox6, and Sox9 by BMP-2 gene transfer during murine fracture healing. J Bone Miner Res 16(10):1837-45.
224. Colnot C, Thompson Z, Miclau T, Werb Z, Helms JA 2003 Altered fracture repair in the absence of MMP9. Development 130(17):4123-33.
225. Nakayama T, Toguchida J, Wadayama B, Kanoe H, Aizawa S, Sasaki MS, Nakamura T 1996 Fracture healing is a process independent of p53 function. In Vivo 10(6):553-8.
226. Buzdon MM, Napolitano LM, Shi HJ, Ceresoli DM, Rauniya R, Bass BL 1999 Femur fracture induces site-specific changes in T-cell immunity. J Surg Res 82(2):201-8.
227. Devine MJ, Mierisch CM, Jang E, Anderson PC, Balian G 2002 Transplanted bone marrow cells localize to fracture callus in a mouse model. J Orthop Res 20(6):1232-9.
228. Napolitano LM, Koruda MJ, Meyer AA, Baker CC 1996 The impact of femur fracture with associated soft tissue injury on immune function and intestinal permeability. Shock 5(3):202-7.
229. Bhandari M, Schemitsch EH 2002 Bone formation following intramedullary femoral reaming is decreased by indomethacin and antibodies to insulin-like growth factors. J Orthop Trauma 16(10):717-22.
230. Skoglund B, Forslund C, Aspenberg P 2002 Simvastatin improves fracture healing in mice. J Bone Miner Res 17(11):2004-8.
231. Street J, Bao M, deGuzman L, Bunting S, Peale FV, Jr., Ferrara N, Steinmetz H, Hoeffel J, Cleland JL, Daugherty A, van Bruggen N, Redmond HP, Carano RA, Filvaroff EH 2002 Vascular endothelial growth factor stimulates bone repair by promoting angiogenesis and bone turnover. Proc Natl Acad Sci U S A 99(15):9656-61.

169
232. Li G, White G, Connolly C, Marsh D 2002 Cell proliferation and apoptosis during fracture healing. J Bone Miner Res 17(5):791-9.
233. Chhabra A, Zijerdi D, Zhang J, Kline A, Balian G, Hurwitz S 2005 BMP-14 deficiency inhibits long bone fracture healing: a biochemical, histologic, and radiographic assessment. J Orthop Trauma 19(9):629-34.
234. Ramasamy JG, Akkus O 2006 Local variations in the micromechanical properties of mouse femur: The involvement of collagen fiber orientation and mineralization. J Biomech.
235. Holstein JH, Menger MD, Culemann U, Meier C, Pohlemann T 2005 Development of a locking femur nail for mice. J Biomech.
236. Cheung KM, Kaluarachi K, Andrew G, Lu W, Chan D, Cheah KS 2003 An externally fixed femoral fracture model for mice. J Orthop Res 21(4):685-90.
237. Uusitalo H, Rantakokko J, Ahonen M, Jamsa T, Tuukkanen J, KaHari V, Vuorio E, Aro HT 2001 A metaphyseal defect model of the femur for studies of murine bone healing. Bone 28(4):423-9.
238. Beamer WG, Donahue LR, Rosen CJ, Baylink DJ 1996 Genetic variability in adult bone density among inbred strains of mice. Bone 18(5):397-403.
239. Smith WL, Eling TE, Kulmacz RJ, Marnett LJ, Tsai A 1992 Tyrosyl radicals and their role in hydroperoxide-dependent activation and inactivation of prostaglandin endoperoxide synthase. Biochemistry 31(1):3-7.
240. Ruf HH, Raab-Brill U, Blau C 1993 A model for the catalytic mechanism of prostaglandin endoperoxide synthase. Biochem Soc Trans 21 ( Pt 3)(3):739-44.
241. Shimokawa T, Smith WL 1992 Prostaglandin endoperoxide synthase. The aspirin acetylation region. J Biol Chem 267(17):12387-92.
242. Morham SG, Langenbach R, Loftin CD, Tiano HF, Vouloumanos N, Jennette JC, Mahler JF, Kluckman KD, Ledford A, Lee CA, Smithies O 1995 Prostaglandin synthase 2 gene disruption causes severe renal pathology in the mouse. Cell 83(3):473-82.
243. Norwood VF, Morham SG, Smithies O 2000 Postnatal development and progression of renal dysplasia in cyclooxygenase-2 null mice. Kidney Int 58(6):2291-300.
244. Chen XS, Sheller JR, Johnson EN, Funk CD 1994 Role of leukotrienes revealed by targeted disruption of the 5-lipoxygenase gene. Nature 372(6502):179-82.
245. Ramirez-Solis R, Davis AC, Bradley A 1993 Gene targeting in embryonic stem cells. Methods Enzymol 225:855-78.
246. Dinchuk JE, Car BD, Focht RJ, Johnston JJ, Jaffee BD, Covington MB, Contel NR, Eng VM, Collins RJ, Czerniak PM, et al. 1995 Renal abnormalities and an altered inflammatory response in mice lacking cyclooxygenase II. Nature 378(6555):406-9.
247. Li GQ, Xia HH, Chen MH, Gu Q, Wang JD, Peng JZ, Chan AO, Cho CH, So HL, Lam SK, Hu PJ, Liang YJ, Lin HL, Berg DE, Feng ZH, Langenbach R, Wong BC 2006 Effects of cyclooxygenase-1 and -2 gene disruption on

170
Helicobacter pylori-induced gastric inflammation. J Infect Dis 193(7):1037-46.
248. Mehrabian M, Allayee H, Wong J, Shi W, Wang XP, Shaposhnik Z, Funk CD, Lusis AJ 2002 Identification of 5-lipoxygenase as a major gene contributing to atherosclerosis susceptibility in mice. Circ Res 91(2):120-6.
249. Baron R, Vigney A, Neff L, Silvergate A, Santa Maria A 1983 Processing of undecalcified bone specimens for bone histomorphometry. In: Recker RR (ed.) Bone Histomorphometry: Techniques and Interpretation. CRC Press Inc., Boca Raton, FL, pp 13-35.
250. Maniatopoulos C, Rodriguez A, Deporter DA, Melcher AH 1986 An improved method for preparing histological sections of metallic implants. Int J Oral Maxillofac Implants 1(1):31-7.
251. Engesaeter LB, Ekeland A, Langeland N 1978 Methods for testing the mechanical properties of the rat femur. Acta Orthop Scand 49(6):512-8.
252. Bell GH, Cuthbertson DP, Orr J 1941 Strength and size of bone in relation to calcium intake. J Physiol 100(3):299-317.
253. Popov E 1968 Introduction to Mechanics of Materials. Prentice-Hall, Inc., Englewood Cliffs.
254. Smith PK, Krohn RI, Hermanson GT, Mallia AK, Gartner FH, Provenzano MD, Fujimoto EK, Goeke NM, Olson BJ, Klenk DC 1985 Measurement of protein using bicinchoninic acid. Anal Biochem 150(1):76-85.
255. Bonewald LF, Flynn M, Qiao M, Dallas MR, Mundy GR, Boyce BF 1997 Mice lacking 5-lipoxygenase have increased cortical bone thickness. Adv Exp Med Biol 433:299-302.
256. Shen FH, Visger JM, Balian G, Hurwitz SR, Diduch DR 2002 Systemically administered mesenchymal stromal cells transduced with insulin-like growth factor-I localize to a fracture site and potentiate healing. J Orthop Trauma 16(9):651-9.
257. Manigrasso MB, O'Connor JP 2004 Characterization of a closed femur fracture model in mice. J Orthop Trauma 18(10):687-95.
258. Currey JD 1984 Effects of differences in mineralization on the mechanical properties of bone. Philos Trans R Soc Lond B Biol Sci 304(1121):509-18.
259. Currey JD 2003 The many adaptations of bone. J Biomech 36(10):1487-95.
260. Akhter MP, Cullen DM, Gong G, Recker RR 2001 Bone biomechanical properties in prostaglandin EP1 and EP2 knockout mice. Bone 29(2):121-5.
261. Akhter MP, Cullen DM, Pan LC 2006 Bone biomechanical properties in EP4 knockout mice. Calcif Tissue Int 78(6):357-62.
262. Flanagan AM, Chambers TJ 1992 Stimulation of bone nodule formation in vitro by prostaglandins E1 and E2. Endocrinology 130(1):443-8.
263. Marks SC, Jr., Miller S 1988 Local infusion of prostaglandin E1 stimulates mandibular bone formation in vivo. J Oral Pathol 17(9-10):500-5.
264. Ringel RE, Brenner JI, Haney PJ, Burns JE, Moulton AL, Berman MA 1982 Prostaglandin-induced periostitis: a complication of long-term PGE1

171
infusion in an infant with congenital heart disease. Radiology 142(3):657-8.
265. Suponitzky I, Weinreb M 1998 Differential effects of systemic prostaglandin E2 on bone mass in rat long bones and calvariae. J Endocrinol 156(1):51-7.
266. Yang RS, Liu TK, Lin-Shiau SY 1993 Increased bone growth by local prostaglandin E2 in rats. Calcif Tissue Int 52(1):57-61.
267. Keller J, Hansen ES, He SZ, Kjaersgaard-Andersen P, Bunger C 1991 Early hemodynamic response to tibial osteotomy in rabbits: influence of indomethacin and prostaglandin E2. J Orthop Res 9(4):539-44.
268. Keller J 1996 Effects of indomethacin and local prostaglandin E2 on fracture healing in rabbits. Dan Med Bull 43(4):317-29.
269. Norrdin RW, Shih MS 1988 Systemic effects of prostaglandin E2 on vertebral trabecular remodeling in beagles used in a healing study. Calcif Tissue Int 42(6):363-8.
270. Shih MS, Norrdin RW 1986 Effect of prostaglandin E2 on rib fracture healing in beagles: histomorphometric study on periosteum adjacent to the fracture site. Am J Vet Res 47(7):1561-4.
271. Gajraj NM 2003 The effect of cyclooxygenase-2 inhibitors on bone healing. Reg Anesth Pain Med 28(5):456-65.
272. Gerstenfeld LC, Einhorn TA 2004 COX inhibitors and their effects on bone healing. Expert Opin Drug Saf 3(2):131-6.
273. Dekel S, Lenthall G, Francis MJ 1981 Release of prostaglandins from bone and muscle after tibial fracture. An experimental study in rabbits. J Bone Joint Surg Br 63-B(2):185-9.
274. Raisz LG 1999 Prostaglandins and bone: physiology and pathophysiology. Osteoarthritis Cartilage 7(4):419-21.
275. Mungo DV, Zhang X, O'Keefe RJ, Rosier RN, Puzas JE, Schwarz EM 2002 COX-1 and COX-2 expression in osteoid osteomas. J Orthop Res 20(1):159-62.
276. Miyauchi M, Hiraoka M, Oka H, Sato S, Kudo Y, Ogawa I, Noguchi K, Ishikawa I, Takata T 2004 Immuno-localization of COX-1 and COX-2 in the rat molar periodontal tissue after topical application of lipopolysaccharide. Arch Oral Biol 49(9):739-46.
277. Mohammed SI, Khan KN, Sellers RS, Hayek MG, DeNicola DB, Wu L, Bonney PL, Knapp DW 2004 Expression of cyclooxygenase-1 and 2 in naturally-occurring canine cancer. Prostaglandins Leukot Essent Fatty Acids 70(5):479-83.
278. Brooks PM, Day RO 1991 Nonsteroidal antiinflammatory drugs--differences and similarities. N Engl J Med 324(24):1716-25.
279. Vaile JH, Davis P 1998 Topical NSAIDs for musculoskeletal conditions. A review of the literature. Drugs 56(5):783-99.
280. Bauer DC, Orwoll ES, Fox KM, Vogt TM, Lane NE, Hochberg MC, Stone K, Nevitt MC 1996 Aspirin and NSAID use in older women: effect on bone mineral density and fracture risk. Study of Osteoporotic Fractures Research Group. J Bone Miner Res 11(1):29-35.

172
281. Burssens A, Thiery J, Kohl P, Molderez A, Haazen L 1995 Prevention of heterotopic ossification with tenoxicam following total hip arthroplasty: a double-blind, placebo-controlled dose-finding study. Acta Orthop Belg 61(3):205-11.
282. Kjaersgaard-Andersen P, Nafei A, Teichert G, Kristensen O, Schmidt SA, Keller J, Lucht U 1993 Indomethacin for prevention of heterotopic ossification. A randomized controlled study in 41 hip arthroplasties. Acta Orthop Scand 64(6):639-42.
283. Moed BR, Resnick RB, Fakhouri AJ, Nallamothu B, Wagner RA 1994 Effect of two nonsteroidal antiinflammatory drugs on heterotopic bone formation in a rabbit model. J Arthroplasty 9(1):81-7.
284. Persson PE, Sodemann B, Nilsson OS 1998 Preventive effects of ibuprofen on periarticular heterotopic ossification after total hip arthroplasty. A randomized double-blind prospective study of treatment time. Acta Orthop Scand 69(2):111-5.
285. Vielpeau C, Joubert JM, Hulet C 1999 Naproxen in the prevention of heterotopic ossification after total hip replacement. Clin Orthop Relat Res (369):279-88.
286. Wahlstrom O, Risto O, Djerf K, Hammerby S 1991 Heterotopic bone formation prevented by diclofenac. Prospective study of 100 hip arthroplasties. Acta Orthop Scand 62(5):419-21.
287. Allen HL, Wase A, Bear WT 1980 Indomethacin and aspirin: effect of nonsteroidal anti-inflammatory agents on the rate of fracture repair in the rat. Acta Orthop Scand 51(4):595-600.
288. Altman RD, Latta LL, Keer R, Renfree K, Hornicek FJ, Banovac K 1995 Effect of nonsteroidal antiinflammatory drugs on fracture healing: a laboratory study in rats. J Orthop Trauma 9(5):392-400.
289. Bo J, Sudmann E, Marton PF 1976 Effect of indomethacin on fracture healing in rats. Acta Orthop Scand 47(6):588-99.
290. Brown KM, Saunders MM, Kirsch T, Donahue HJ, Reid JS 2004 Effect of COX-2-specific inhibition on fracture-healing in the rat femur. J Bone Joint Surg Am 86-A(1):116-23.
291. Engesaeter LB, Sudmann B, Sudmann E 1992 Fracture healing in rats inhibited by locally administered indomethacin. Acta Orthop Scand 63(3):330-3.
292. Hogevold HE, Grogaard B, Reikeras O 1992 Effects of short-term treatment with corticosteroids and indomethacin on bone healing. A mechanical study of osteotomies in rats. Acta Orthop Scand 63(6):607-11.
293. Sudmann E, Dregelid E, Bessesen A, Morland J 1979 Inhibition of fracture healing by indomethacin in rats. Eur J Clin Invest 9(5):333-9.
294. Bichara J, Greenwell H, Drisko C, Wittwer JW, Vest TM, Yancey J, Goldsmith J, Rebitski G 1999 The effect of postsurgical naproxen and a bioabsorbable membrane on osseous healing in intrabony defects. J Periodontol 70(8):869-77.
295. Giordano V, Giordano M, Knackfuss IG, Apfel MI, Gomes RD 2003 Effect of tenoxicam on fracture healing in rat tibiae. Injury 34(2):85-94.

173
296. Jaffre B, Watrin A, Loeuille D, Gillet P, Netter P, Laugier P, Saied A 2003 Effects of antiinflammatory drugs on arthritic cartilage: a high-frequency quantitative ultrasound study in rats. Arthritis Rheum 48(6):1594-601.
297. Keller J, Bunger C, Andreassen TT, Bak B, Lucht U 1987 Bone repair inhibited by indomethacin. Effects on bone metabolism and strength of rabbit osteotomies. Acta Orthop Scand 58(4):379-83.
298. Lindholm TS, Tornkvist H 1981 Inhibitory effect on bone formation and calcification exerted by the anti-inflammatory drug ibuprofen. An experimental study on adult rat with fracture. Scand J Rheumatol 10(1):38-42.
299. Obeid G, Zhang X, Wang X 1992 Effect of ibuprofen on the healing and remodeling of bone and articular cartilage in the rabbit temporomandibular joint. J Oral Maxillofac Surg 50(8):843-9; discussion 849-50.
300. Riew KD, Long J, Rhee J, Lewis S, Kuklo T, Kim YJ, Yukawa Y, Zhu Y 2003 Time-dependent inhibitory effects of indomethacin on spinal fusion. J Bone Joint Surg Am 85-A(4):632-4.
301. Sato S, Kim T, Arai T, Maruyama S, Tajima M, Utsumi N 1986 Comparison between the effects of dexamethasone and indomethacin on bone wound healing. Jpn J Pharmacol 42(1):71-8.
302. Sudmann E, Bang G 1979 Indomethacin-induced inhibition of haversian remodelling in rabbits. Acta Orthop Scand 50(6 Pt 1):621-7.
303. Beck A, Krischak G, Sorg T, Augat P, Farker K, Merkel U, Kinzl L, Claes L 2003 Influence of diclofenac (group of nonsteroidal anti-inflammatory drugs) on fracture healing. Arch Orthop Trauma Surg 123(7):327-32.
304. Tornkvist H, Lindholm TS 1980 Effect of ibuprofen on mass and composition of fracture callus and bone. An experimental study on adult rat. Scand J Rheumatol 9(3):167-71.
305. Goodman S, Ma T, Trindade M, Ikenoue T, Matsuura I, Wong N, Fox N, Genovese M, Regula D, Smith RL 2002 COX-2 selective NSAID decreases bone ingrowth in vivo. J Orthop Res 20(6):1164-9.
306. Simon AM, Manigrasso MB, O'Connor JP 2002 Cyclo-oxygenase 2 function is essential for bone fracture healing. J Bone Miner Res 17(6):963-76.
307. Mullis BH, Copland ST, Weinhold PS, Miclau T, Lester GE, Bos GD 2006 Effect of COX-2 inhibitors and non-steroidal anti-inflammatory drugs on a mouse fracture model. Injury 37(9):827-37.
308. Huo MH, Troiano NW, Pelker RR, Gundberg CM, Friedlaender GE 1991 The influence of ibuprofen on fracture repair: biomechanical, biochemical, histologic, and histomorphometric parameters in rats. J Orthop Res 9(3):383-90.
309. Pritchett JW 1995 Ketorolac prophylaxis against heterotopic ossification after hip replacement. Clin Orthop Relat Res (314):162-5.
310. Moore KD, Goss K, Anglen JO 1998 Indomethacin versus radiation therapy for prophylaxis against heterotopic ossification in acetabular fractures: a randomised, prospective study. J Bone Joint Surg Br 80(2):259-63.

174
311. Burd TA, Lowry KJ, Anglen JO 2001 Indomethacin compared with localized irradiation for the prevention of heterotopic ossification following surgical treatment of acetabular fractures. J Bone Joint Surg Am 83-A(12):1783-8.
312. Burd TA, Hughes MS, Anglen JO 2003 Heterotopic ossification prophylaxis with indomethacin increases the risk of long-bone nonunion. J Bone Joint Surg Br 85(5):700-5.
313. Giannoudis PV, MacDonald DA, Matthews SJ, Smith RM, Furlong AJ, De Boer P 2000 Nonunion of the femoral diaphysis. The influence of reaming and non-steroidal anti-inflammatory drugs. J Bone Joint Surg Br 82(5):655-8.
314. Ueda K, Saito A, Nakano H, Aoshima M, Yokota M, Muraoka R, Iwaya T 1980 Cortical hyperostosis following long-term administration of prostaglandin E1 in infants with cyanotic congenital heart disease. J Pediatr 97(5):834-6.
315. Jee WS, Ueno K, Deng YP, Woodbury DM 1985 The effects of prostaglandin E2 in growing rats: increased metaphyseal hard tissue and cortico-endosteal bone formation. Calcif Tissue Int 37(2):148-57.
316. Yamaguchi DT, Green J, Merritt BS, Kleeman CR, Muallem S 1989 Modulation of osteoblast function by prostaglandins. Am J Physiol 257(5 Pt 2):F755-61.
317. Hakeda Y, Hotta T, Kurihara N, Ikeda E, Maeda N, Yagyu Y, Kumegawa M 1987 Prostaglandin E1 and F2 alpha stimulate differentiation and proliferation, respectively, of clonal osteoblastic MC3T3-E1 cells by different second messengers in vitro. Endocrinology 121(6):1966-74.
318. Feyen JH, Di Bon A, van der Plas A, Lowik CW, Nijweide PJ 1985 Effects of exogenous prostanoids on the proliferation of osteoblast-like cells in vitro. Prostaglandins 30(5):827-40.
319. Partridge NC, Hillyard CJ, Nolan RD, Martin TJ 1985 Regulation of prostaglandin production by osteoblast-rich calvarial cells. Prostaglandins 30(3):527-39.
320. Chyun YS, Raisz LG 1984 Stimulation of bone formation by prostaglandin E2. Prostaglandins 27(1):97-103.
321. Feyen JH, van der Wilt G, Moonen P, Di Bon A, Nijweide PJ 1984 Stimulation of arachidonic acid metabolism in primary cultures of osteoblast-like cells by hormones and drugs. Prostaglandins 28(6):769-81.
322. Nolan RD, Partridge NC, Godfrey HM, Martin TJ 1983 Cyclo-oxygenase products of arachidonic acid metabolism in rat osteoblasts in culture. Calcif Tissue Int 35(3):294-7.
323. Hakeda Y, Harada S, Matsumoto T, Tezuka K, Higashino K, Kodama H, Hashimoto-Goto T, Ogata E, Kumegawa M 1991 Prostaglandin F2 alpha stimulates proliferation of clonal osteoblastic MC3T3-E1 cells by up-regulation of insulin-like growth factor I receptors. J Biol Chem 266(31):21044-50.
324. Klein-Nulend J, Burger EH, Semeins CM, Raisz LG, Pilbeam CC 1997 Pulsating fluid flow stimulates prostaglandin release and inducible

175
prostaglandin G/H synthase mRNA expression in primary mouse bone cells. J Bone Miner Res 12(1):45-51.
325. Woodiel FN, Fall PM, Raisz LG 1996 Anabolic effects of prostaglandins in cultured fetal rat calvariae: structure-activity relations and signal transduction pathway. J Bone Miner Res 11(9):1249-55.
326. Li TF, Zuscik MJ, Ionescu AM, Zhang X, Rosier RN, Schwarz EM, Drissi H, O'Keefe RJ 2004 PGE2 inhibits chondrocyte differentiation through PKA and PKC signaling. Exp Cell Res 300(1):159-69.
327. Jakob M, Demarteau O, Suetterlin R, Heberer M, Martin I 2004 Chondrogenesis of expanded adult human articular chondrocytes is enhanced by specific prostaglandins. Rheumatology (Oxford) 43(7):852-7.
328. Kosher RA, Walker KH 1983 The effect of prostaglandins on in vitro limb cartilage differentiation. Exp Cell Res 145(1):145-53.
329. Chepenik KP, Ho WC, Waite BM, Parker CL 1984 Arachidonate metabolism during chondrogenesis in vitro. Calcif Tissue Int 36(2):175-81.
330. Diaz-Flores L, Gutierrez R, Valladares F, Varela H, Perez M 1994 Intense vascular sprouting from rat femoral vein induced by prostaglandins E1 and E2. Anat Rec 238(1):68-76.
331. Jiang H, Weyrich AS, Zimmerman GA, McIntyre TM 2004 Endothelial cell confluence regulates cyclooxygenase-2 and prostaglandin E2 production that modulate motility. J Biol Chem 279(53):55905-13.
332. Ren W, Dziak R 1991 Effects of leukotrienes on osteoblastic cell proliferation. Calcif Tissue Int 49(3):197-201.
333. Traianedes K, Dallas MR, Garrett IR, Mundy GR, Bonewald LF 1998 5-Lipoxygenase metabolites inhibit bone formation in vitro. Endocrinology 139(7):3178-84.
334. Miller DK, Gillard JW, Vickers PJ, Sadowski S, Leveille C, Mancini JA, Charleson P, Dixon RA, Ford-Hutchinson AW, Fortin R, et al. 1990 Identification and isolation of a membrane protein necessary for leukotriene production. Nature 343(6255):278-81.
335. Byrum RS, Goulet JL, Griffiths RJ, Koller BH 1997 Role of the 5-lipoxygenase-activating protein (FLAP) in murine acute inflammatory responses. J Exp Med 185(6):1065-75.
336. Flamand N, Lefebvre J, Surette ME, Picard S, Borgeat P 2006 Arachidonic acid regulates the translocation of 5-lipoxygenase to the nuclear membranes in human neutrophils. J Biol Chem 281(1):129-36.

176
CURRICULUM VITA
Michaele Beth Manigrasso 30 Asbury Avenue
Atlantic Highlands, NJ 07716-1414 Email: [email protected]
Education: Ph.D “The Development and Application of the Murine Femoral Fracture Model to
Examine the Effects of Genetics on Long Bone Fracture Healing” Biomedical Engineering, Anticipated October 2006 Rutgers University, New Brunswick, New Jersey and University of Medicine and Dentistry of New Jersey- New Jersey Medical School Principal Advisor: J. Patrick O’Connor Ph.D. Committee: J. Russell Parsons, Ph.D
Robert Harten, Ph.D. Vinciane Gaussin, Ph.D
David Denhardt, Ph.D
B.S. Syracuse University Syracuse, NY
Bioengineering, May 1997 Research Experience: 2000-Present University of Medicine & Dentistry of New Jersey- New Jersey
Medical School. Department of Orthopaedics Newark, NJ
1999-2000 Department of Biomedical Engineering- Rutgers University
Piscataway, NJ Graduate research assistant- Examined how signal processing with visual evoked potentials (VEP’s) are assessed in humans.
1998-1999 JFK Rehabilitation Institute
Edison, NJ Prosthetic training program student internship- Measured, designed and fitted upper and lower extremity prosthetic devices.
1995-1997 Syracuse University- Institute for Sensory Research
Syracuse, NY Undergraduate research assistant- Used vibrotactile psychophysics to examine how Pacinian corpuscles use recruitment in pain reception.
Publications: Manigrasso MB and O’Connor JP. Characterization of a Closed Femur Fracture Model in Mice. Journal of Orthopaedic Trauma. 2004 Nov-Dec;18(10):687-95. Simon AM, Manigrasso MB, and O’Connor JP. Cyclooxygenase-2 function is Essential For Bone Fracture Healing. Journal of Bone and Mineral Research. 2002 June; 17: 963-976.