20 MICRONS - BSE
253
® 20 MICRONS EE ! M ! T [= D CIN # L99999G]1987PLC009768 Ph. # 75 748 06350 E-Mail : co [email protected] Regd. Office : 9/10, GIDC Industrial Estate, WAGHODIA, Dist. : Vadodara 27 June, 2022 To: BSE LIMITED National Stock Exchange of India Department of Corporate Services Limited Phiroze Jeejeebhoy Towers, Listing Department, Exchange Dalal Street, Fort, Plaza, Bandra — Kurla Complex, Mumbai — 400 001. Bandra [East], Mumbai - 400 051. Scrip Code : 533022 Scrip Code : 20 MICRONS SUB: Submission of Annual Report for the year ended March 31, 2022 along with Notice of 35° Annual General Meeting to be held on July 22, 2022 Ref: Regulation 34 of SEBI (Listing Obligations and Disclosure Requirements) Regulations, 2015 Dear Sirs, We wish to inform you that the 35" Annual General Meeting (AGM) of the 20 Microns Limited (Company) is scheduled to be held on Friday, July 22, 2022 at 11.00 AM at the Conference Room at 347, GIDC Industrial, WAGHODIA, Dist.: Vadodara - 391 760 to transact the business set-out in the Notice of the AGM dated May 03, 2022. Pursuant to Regulations 34 of the SEBI (Listing Obligations and Disclosure Requirements) Regulation, 2015, we hereby submit the Annual Report of the Company for the Financial Year 2021-22 together with the Notice convening the 35" Annual General Meeting to be held on Friday, 22™ July, 2022. Kindly take the above on your record and acknowledge the same. Thanking you, Yours faithfully PPOP ad Mrcrane mites (Komal Pandey) _ Company Secretary [Komal Pandey] Company Secretary Membership No. : A37092 Encl.: as above.
-
Upload
khangminh22 -
Category
Documents
-
view
2 -
download
0
Transcript of 20 MICRONS - BSE
® 20 MICRONS EE ! M ! T [= D
CIN # L99999G]1987PLC009768 Ph. # 75 748 06350 E-Mail : co [email protected]
Regd. Office : 9/10, GIDC Industrial Estate, WAGHODIA, Dist. : Vadodara
27 June, 2022
To: BSE LIMITED National Stock Exchange of India Department of Corporate Services Limited
Phiroze Jeejeebhoy Towers, Listing Department, Exchange Dalal Street, Fort, Plaza, Bandra — Kurla Complex, Mumbai — 400 001. Bandra [East], Mumbai - 400 051. Scrip Code : 533022 Scrip Code : 20 MICRONS
SUB: Submission of Annual Report for the year ended March 31, 2022 along with Notice of 35° Annual General Meeting to be held on
July 22, 2022
Ref: Regulation 34 of SEBI (Listing Obligations and Disclosure Requirements) Regulations, 2015
Dear Sirs,
We wish to inform you that the 35" Annual General Meeting (AGM) of the 20 Microns Limited (Company) is scheduled to be held on Friday, July 22, 2022 at 11.00 AM at the Conference Room at 347, GIDC Industrial, WAGHODIA, Dist.: Vadodara - 391 760 to transact the business set-out in the Notice of the AGM dated May 03, 2022.
Pursuant to Regulations 34 of the SEBI (Listing Obligations and Disclosure
Requirements) Regulation, 2015, we hereby submit the Annual Report of the Company for the Financial Year 2021-22 together with the Notice convening the 35" Annual General Meeting to be held on Friday, 22™ July, 2022.
Kindly take the above on your record and acknowledge the same.
Thanking you,
Yours faithfully
PPOP ad Mrcrane mites
(Komal Pandey) _ Company Secretary
[Komal Pandey] Company Secretary Membership No. : A37092
Encl.: as above.

Annual Report
TRANSFORMING BEYOND.Shaping a Sustainable Future.
2021-22

Reporting period and scopeThis report covers financial and nonfinancial information and activities of 20 Microns Limited (‘the Company’ or ‘20ML’) during the period April 1, 2021, to March 31, 2022. The report’s financial figures have been audited by M/s. J.H. Mehta & Co., Chartered Accountants, Ahmedabad.
MaterialityWe cover key material aspects that have been identified through our ongoing stakeholder engagement and are addressed by various programmes or action points set by the key management personnel.
ResponsivenessOur reporting addresses a gamut of stakeholders, each having their own needs and interests. This report is one element of our interaction and communication. It reflects how we manage our operations by accounting and responding to stakeholder concerns.
Forward looking statementSome information in this report may contain forward-looking statements. We have based these forward-looking statements on our current beliefs, expectations and intentions as to facts, actions and events that will or may occur in the future. Such statements are identified by forward-looking words such as “believe,” “plan,” “anticipate,” “continue,” “estimate,” “expect,” “may,” “will” or other similar words. A forward-looking statement may include a statement of the assumptions or basis underlying the forward-looking statement. We have chosen these assumptions or basis in good faith, and we believe that they are reasonable in all material respects. However, we caution you that forward-looking statements and assumed facts or bases almost always vary from actual results, and the differences between the results implied by the forward-looking statements and assumed facts or bases and actual results can be material, depending on the circumstances.
WhAT’S INSIDE…Corporate Overview03 Knowing 20 Microns Limited
12 Key Financial Metrics
14 Chairman’s Message
16 Conversation with CEO & Managing Director
20 Business Enablers
24 Investment Propositions
28 Business Model
30 Empowering People
34 Caring for the Communities
36 Boards Profile
38 Corporate Information
Statutory Report39 Notice
58 Board’s Report
73 Management discussion and analysis
88 Report on Corporate Governance
Financial Statements108 Standalone Independent Auditor’s Report
118 Standalone Balance Sheet
119 Standalone Statement of Profit and Loss
120 Standalone Cash Flow Statement
122 Standalone Statement of Changes In Equity (SOCIE)
123 Notes to Standalone Financial Statements
177 Consolidated Independent Auditor’s Report
184 Consolidated Balance Sheet
185 Consolidated Statement of Profit and Loss
186 Consolidated Cash Flow Statement
188 Consolidated Statement of Changes in Equity (SOCIE)
189 Notes to Consolidated Financial Statements
Find this report online atwww.20microns.com

There comes a time in the journey of a business entity when it has to start making choices to grow from strength to strength and not be afraid of the consequences.
Over the years, we have fortified our position as a dynamic and agile player, constantly focused on changing ourselves and building our strength through a diversified portfolio. But most of these changes were in line with the changing needs of time and the changing needs of our customers.
Thus, we thought it’s time to transform ourselves by undertaking some conscious choices. And if the choice lines up correctly, it would help us grow at a faster rate and would make our growth a sustainable one.
Over the last few years, our major focus has been to transform 20 Microns Limited (20ML) from just another micronized mineral manufacturer to India’s numero uno producer of ultrafine industrial material and speciality chemicals. As we focused on transformation, we have put our imagination and our science to work to create innovative and improved industrial mineral and speciality chemicals, anticipating the needs of our customers.
Leveraging the transformation agenda, we unLeashed our potentiaL with a new veLocity to harness the unfoLding opportunities of the future.
TRANSFORMING BEYOND.

ShApING A SuSTAINABlE FuTuRE.
Infused with new energies, we are steering to our next phase of growth and expansion, through an increased focus on operational efficiencies and understanding the demands of an evolving industry.
Through strategic efforts, planned investments and an ardent emphasis on R&D efforts, we are continuously harnessing the power of portfolio and our people to prepare for the future and unlock our next phase of growth. Building on the legacy of our deep-rooted values and our sustainability focus, we are surging ahead to reinforce the trust of our customers on our brand.
In our quest to reach new and brighter horizons of performance and progress, we are investing in further investing the core of our business to drive greater sustainable and inclusive long-term growth.
Our range, quality, and attention to detail made our brands deeply trusted amongst some of the most respected corporates in India and abroad. At 20 Microns Limited (20ML), our strength lies in the confidence of our valued patrons. It is their trust and support that aids our endeavours to expand our horizons and capitalise on growing opportunities.
Today, more than ever before, we realise our responsibility to remain attuned to the demands of tomorrow. Valuing our inherent strengths and a clear roadmap to tackle the challenges on our path, we are identifying new trajectories lay the foundation for sustainable growth.
Annual Report 2021-22
2
20 Microns Limited
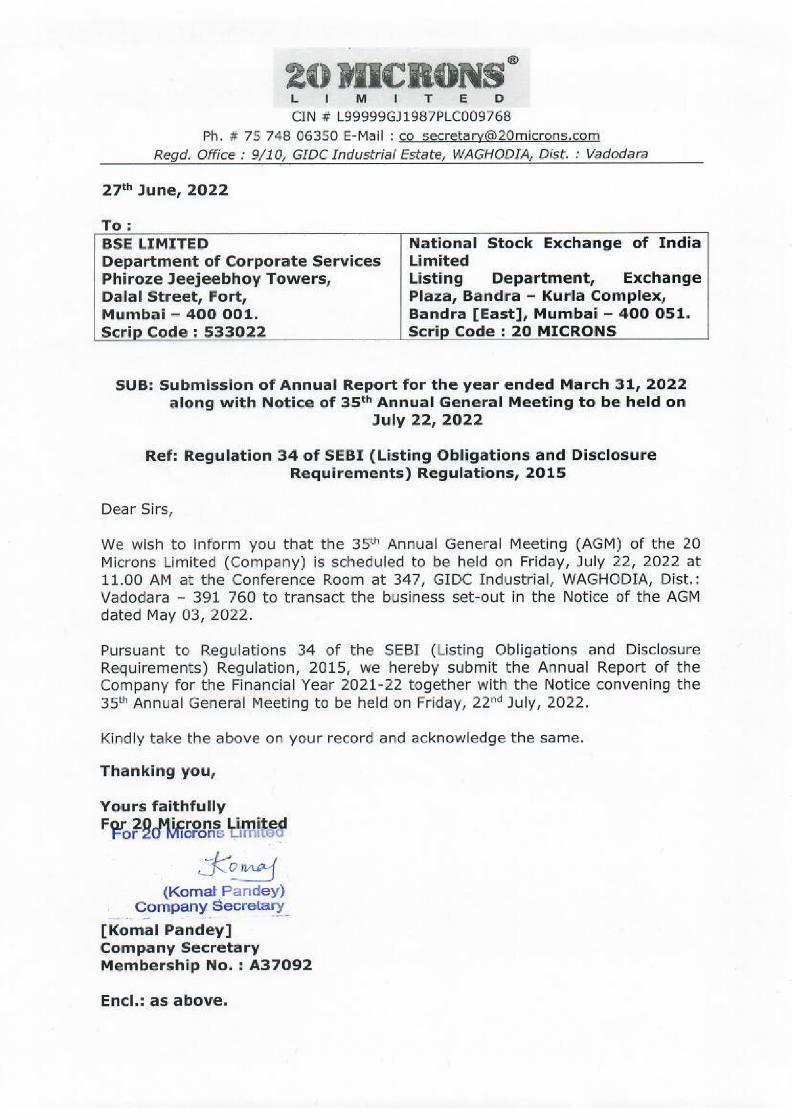
20 microns in a snapshot
35+Years of industry experience
lARGESTIndia’s largest producer of micronized industrial minerals
FIvECaptive mines acts as a strategic raw material source
NINEState-of-the-art warehouses strategically located across India
TWOTechnologically advanced research and development unit
700+Strong and dedicated workforce giving the Company people edge
41Number of new products introduced in FY22
9 STRATEGIcAllY lOcATED integrated manufacturing units
A niche player engaged in the production of micronization of minerals from regular size to sub microns to nano size
Comprehensive range of micronized industrial minerals, functional specialities and performance additive products which find application across diverse industries
Exports products to more than
65 countries across
6 continents
3
Corporate Overview Notice Statutory Reports Financial Statements
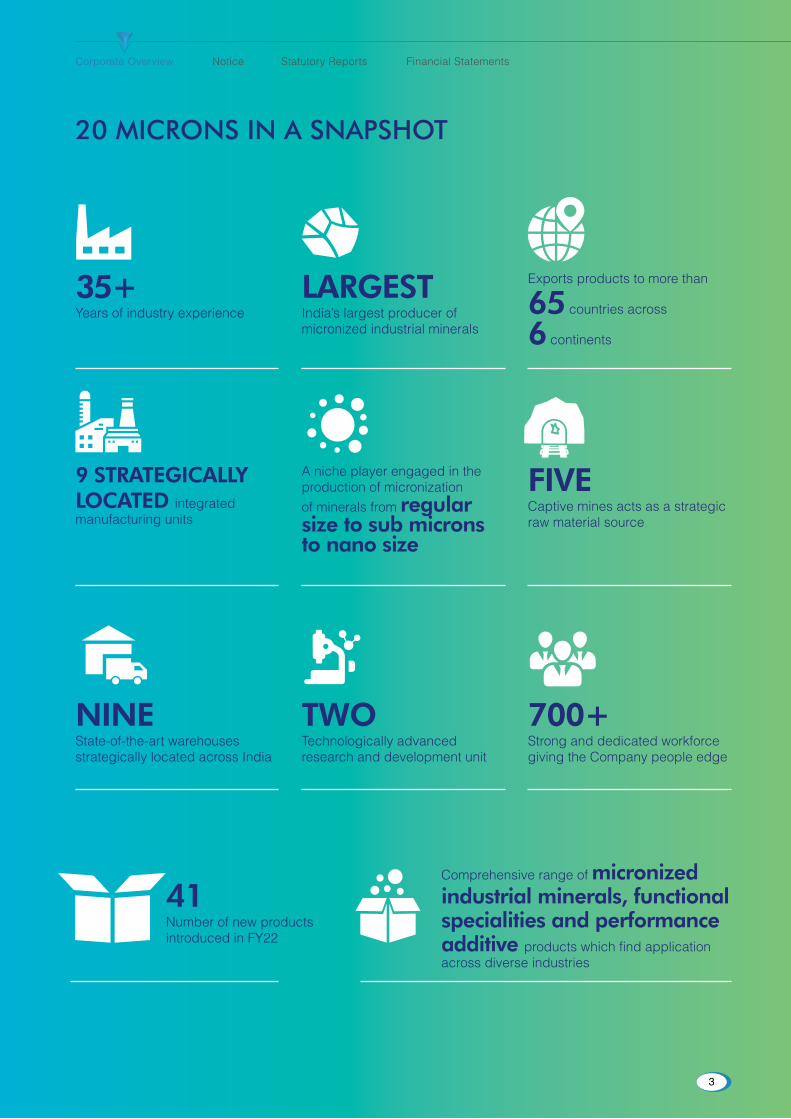
introducing 20 micron’s Limited
Established in 1987, 20 Microns Limited (20ML) is India’s largest producers of white minerals, ultrafine industrial minerals and specialty chemicals that help advance the everyday life of millions of people.
We have a successful track record of operating a robust B2B model, catering to the diverse ultrafine industrial minerals and specialty chemicals needs of a wide range of companies across vast end application industry. Our B2B model covers the manufacturing of nano-sized industrial minerals, functional additives and speciality chemicals. With a presence across the value chain from mining to micronizing to sub-microns to nano sizing, we focus on the manufacturing of innovative mineral-based products in the field of functional fillers, extenders and specialty chemicals.
At the core of our operational excellence is a future-focussed strategy that makes us energised for sustainable growth. Led by this approach, we value our ability to constantly deliver high-quality niche mineral products. We have established our credentials as a reliable and quality conscious manufacturer and supplier of micronized industrial minerals, functional specialities, and performance additives. With a commitment to quality and affordability, we ensure a steady supply of customer-centred materials and speciality chemical solutions. Over the years, we have made substantial investments in our manufacturing infrastructure to support our product portfolio. We have also significantly improved our R&D capabilities to consistently deliver improved products which helped us meet the changing needs of our customers. We help our clients manufacture products that are vital for everyday life.
Annual Report 2021-22
4
20 Microns Limited
Our ViSiOn Our brand promise and our deep
enrooted commitment is to build a robust, sustainable and responsible business in the long run.
Through adaptive improvement, we will continue to be a leader in the Industrial Minerals & Functional Additives space. We will advance these businesses through continued innovation, hard work and responsible care initiatives and to be known as the employer, supplier, neighbour and investment of choice.
Our MiSSiOn To provide exceptional product quality
which equally matches our excellence in problem-solving capabilities and technical customer services with an extensive operational network.
With a focus on markets and in-depth understanding of client needs, 20 Microns constantly endeavour to develop newer ultrafine industrial minerals and functional additives for the global markets by providing and enriching careers and creating shareholder value because we care about our employees, our customers and our communities.
To deliver performance for our shareholders, remaining innovative for our customers, building lasting relationships for our employees, partners and communities and being persistent with precise and efficient manufacturing.
To provide integral products to our valued clients while sustaining a stable and consistent reputation through innovative intelligence. We do this in a safe and healthy work environment for our employees and adhere to all local, national and international regulations.
5
Corporate Overview Notice Statutory Reports Financial Statements
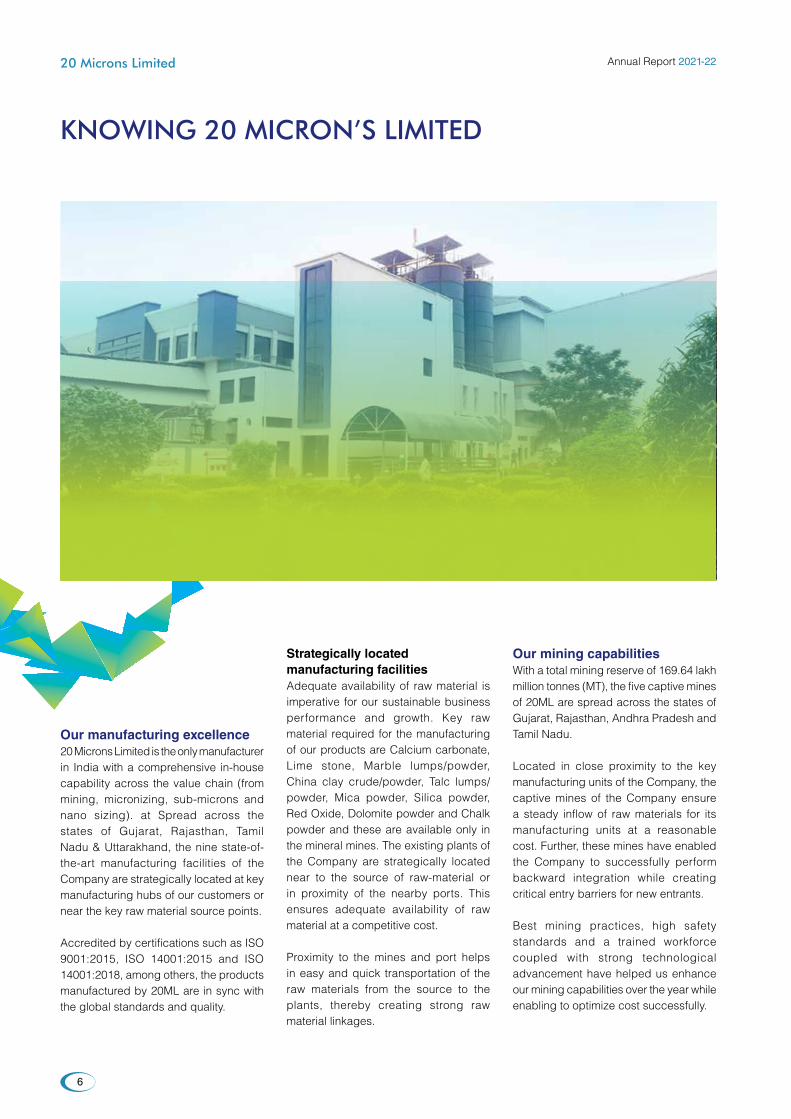
Knowing 20 micron’s Limited
Our manufacturing excellence20 Microns Limited is the only manufacturer in India with a comprehensive in-house capability across the value chain (from mining, micronizing, sub-microns and nano sizing). at Spread across the states of Gujarat, Rajasthan, Tamil Nadu & Uttarakhand, the nine state-of-the-art manufacturing facilities of the Company are strategically located at key manufacturing hubs of our customers or near the key raw material source points.
Accredited by certifications such as ISO 9001:2015, ISO 14001:2015 and ISO 14001:2018, among others, the products manufactured by 20ML are in sync with the global standards and quality.
Strategically located manufacturing facilitiesAdequate availability of raw material is imperative for our sustainable business performance and growth. Key raw material required for the manufacturing of our products are Calcium carbonate, Lime stone, Marble lumps/powder, China clay crude/powder, Talc lumps/powder, Mica powder, Silica powder, Red Oxide, Dolomite powder and Chalk powder and these are available only in the mineral mines. The existing plants of the Company are strategically located near to the source of raw-material or in proximity of the nearby ports. This ensures adequate availability of raw material at a competitive cost.
Proximity to the mines and port helps in easy and quick transportation of the raw materials from the source to the plants, thereby creating strong raw material linkages.
Our mining capabilitiesWith a total mining reserve of 169.64 lakh million tonnes (MT), the five captive mines of 20ML are spread across the states of Gujarat, Rajasthan, Andhra Pradesh and Tamil Nadu.
Located in close proximity to the key manufacturing units of the Company, the captive mines of the Company ensure a steady inflow of raw materials for its manufacturing units at a reasonable cost. Further, these mines have enabled the Company to successfully perform backward integration while creating critical entry barriers for new entrants.
Best mining practices, high safety standards and a trained workforce coupled with strong technological advancement have helped us enhance our mining capabilities over the year while enabling to optimize cost successfully.
Annual Report 2021-22
6
20 Microns Limited
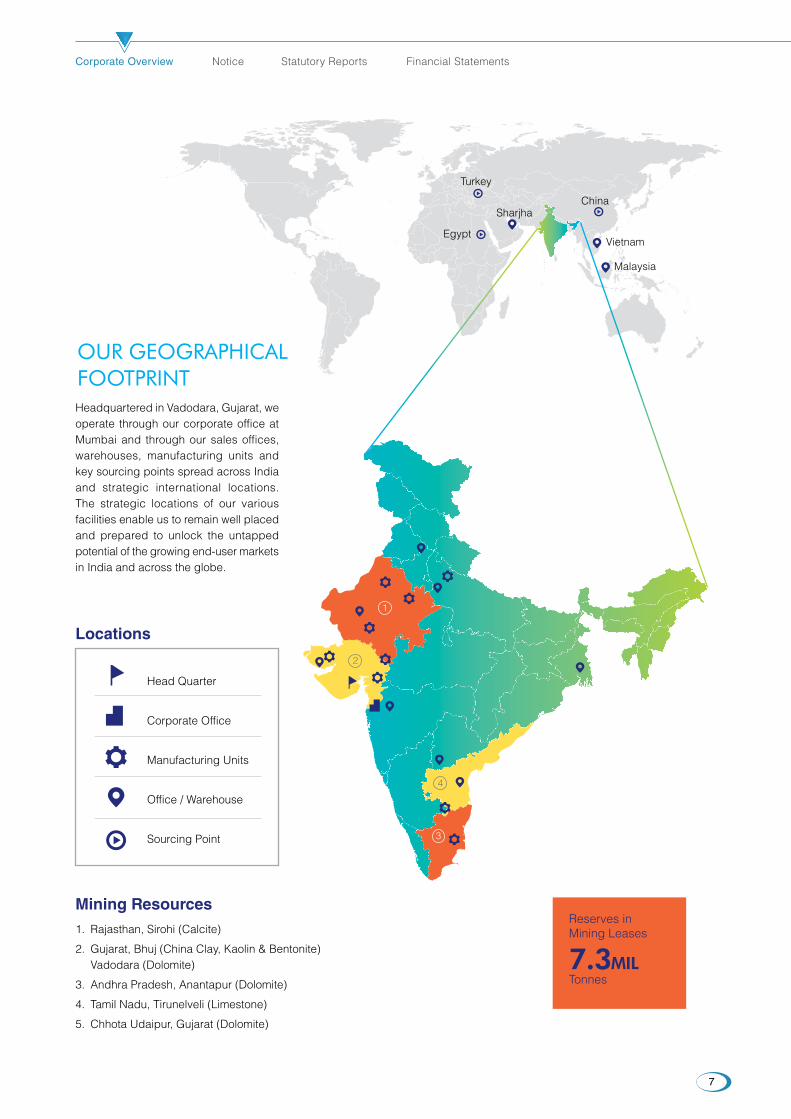
Our geOgraphical FOOtprintHeadquartered in Vadodara, Gujarat, we operate through our corporate office at Mumbai and through our sales offices, warehouses, manufacturing units and key sourcing points spread across India and strategic international locations. The strategic locations of our various facilities enable us to remain well placed and prepared to unlock the untapped potential of the growing end-user markets in India and across the globe.
Turkey
Egypt
SharjhaChina
Malaysia
Vietnam
Locations
Mining Resources1. Rajasthan, Sirohi (Calcite)
2. Gujarat, Bhuj (China Clay, Kaolin & Bentonite) Vadodara (Dolomite)
3. Andhra Pradesh, Anantapur (Dolomite)
4. Tamil Nadu, Tirunelveli (Limestone)
5. Chhota Udaipur, Gujarat (Dolomite)
Head Quarter
Corporate Office
Manufacturing Units
Office / Warehouse
Sourcing Point
7.3MIlTonnes
Reserves inMining Leases
1
3
2
4
7
Corporate Overview Notice Statutory Reports Financial Statements

what we have on offer
We believe in the strength of who we are, what we do, where we are located and what we have on offer.
Backed by our enviable R&D capabilities, insightful industry knowledge and strong understanding of the customer requirements, we have built a comprehensive range of reputed brands, comprising high-quality products, to cater to diversified needs of customers across industries and price-points. Over the years, we have aligned our portfolio to the evolving consumer and market trends, which we are continuously mapping and analysing to transform our offerings in tandem.
Industrial minerals Ground Calcium Carbonate
Dolomite
Hydrous Kaolin
Calcined Kaolin
Talc
Natural Barytes
Silica / Quartz
Muscovite Mica
Feldspar / Nepheline Syenite
Diatomaceous & Siliceous Earth
Bentonite & Attapulgite
Natural Red Oxide
Synthetic Red Oxide
Functional additives White / Buff & Colored
Rutile TiO2
White Pigment Opacifier
Synthetic Barium Sulphate
Micronized Wax
Erueca Mide, Olea Mide & Processing Aid
Anti-blocking Additives
Matting Agents
Rheological Additives
Inorganic thickeners
Flame Retardants
Calcium Oxide Desiccant
Activators for Rubber
High Aspect Ratio Talc
Sub-Micron CaCO3
Fumed, Precipitated & Amorphous Silica
Decorative Colored Quartz Sand
Key prOductS
Key end uSerS’ induStry
Paint and Coating
Ceramics
Inks and Pigments
Adhesive and sealant
Plastics and Polymer
Oil-well drilling
Paper
Agrochemicals
Rubber
Foundry and more
Cosmetics
Annual Report 2021-22
8
20 Microns Limited

Key clientS
& more
9
Corporate Overview Notice Statutory Reports Financial Statements
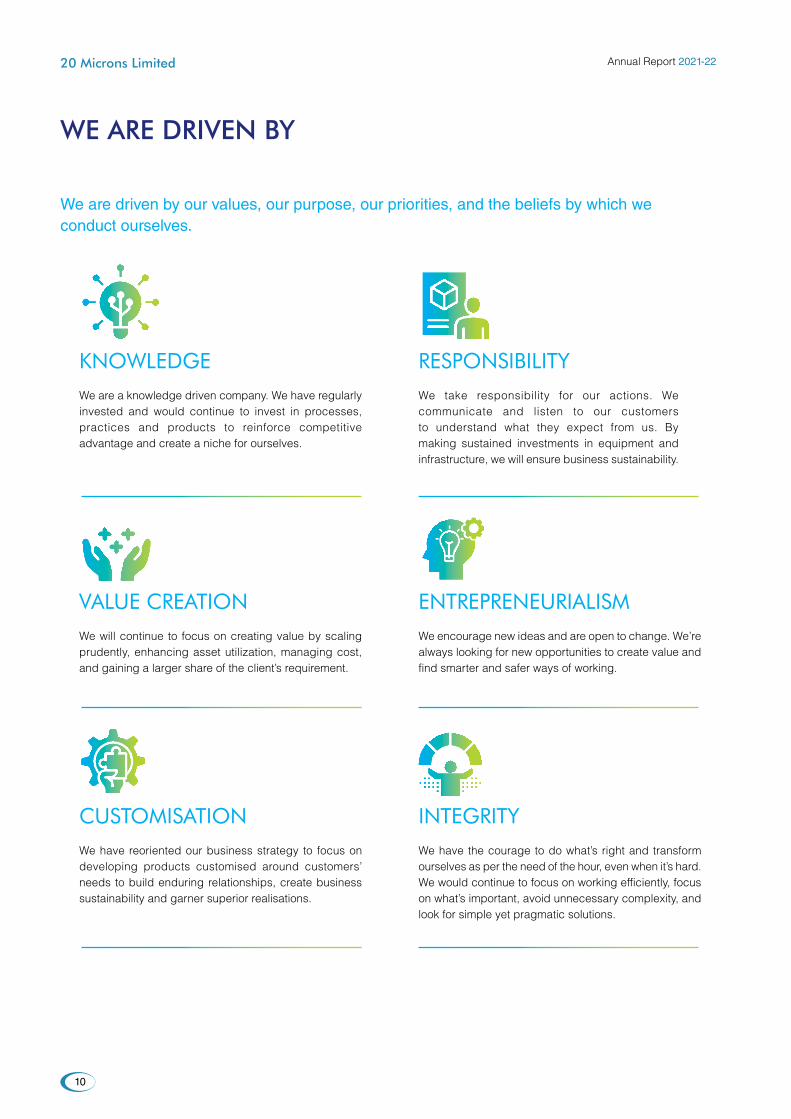
we are driven by
We are driven by our values, our purpose, our priorities, and the beliefs by which we conduct ourselves.
KnOwledgeWe are a knowledge driven company. We have regularly invested and would continue to invest in processes, practices and products to reinforce competitive advantage and create a niche for ourselves.
reSpOnSibilityWe take responsibility for our actions. We communicate and listen to our customers to understand what they expect from us. By making sustained investments in equipment and infrastructure, we will ensure business sustainability.
Value creatiOnWe will continue to focus on creating value by scaling prudently, enhancing asset utilization, managing cost, and gaining a larger share of the client’s requirement.
cuStOMiSatiOnWe have reoriented our business strategy to focus on developing products customised around customers’ needs to build enduring relationships, create business sustainability and garner superior realisations.
entrepreneurialiSMWe encourage new ideas and are open to change. We’re always looking for new opportunities to create value and find smarter and safer ways of working.
integrityWe have the courage to do what’s right and transform ourselves as per the need of the hour, even when it’s hard. We would continue to focus on working efficiently, focus on what’s important, avoid unnecessary complexity, and look for simple yet pragmatic solutions.
Annual Report 2021-22
10
20 Microns Limited
Our certiFicatiOnS
It has translated into many positives for 20ML, leading to healthy fiscal performance despite an extremely difficult macro environment. These strategies ensured continued improvement of our working capital cycle and healthy operating margins, along with better RoI, which cumulatively led to robustness in the balance sheet. It further helped us in emerging a near net debt free company during the year – a remarkable feat given the fact that the Company was in debt restricting a few years back.
With a prolonged emphasis on excellence, we have created many lasting relationships, developed a legacy of exceptional manufacturing excellence, and fostered a team of talented individuals. It is the strength of these improved synergies that now permeate through each and every organisational vertical, allowing us to consistently secure our position in a niche segment.
How these principles and priorities have helped 20ML?
We expect to transform ourselves to emerge as the preferred supplier of industrial minerals, functional additives and specialities to some of the globally renowned players across our key focus industries.
11
Corporate Overview Notice Statutory Reports Financial Statements

measuring our progress
Key financiaL metrics, fy 22
`522.95 crore Turnover
`30.87 crore Net Profit, FY22
5.97% PAT Margin
`8.75 Earnings per share (EPS)
`71.88 crore EBITDA
13.90% EBITDA Margin
`261.12 crore Market Cap
Annual Report 2021-22
12
20 Microns Limited

transforming with profitabLe growth
The various initiatives taken during the year have made 20ML an entity energised for holistic long-term growth. We remain focussed on a continuous increase in both the topline and the bottom-line through fast-paced strategic realignments to the changing business landscape. As we move forward to seize the opportunities of tomorrow across industries, we shall continue to reorient and transform ourselves to emerge sustainable in the near as well as long term.
Total revenue (` in crore)
2021-22
2020-21
2019-20
522.95
437.95
497.67
EBITDA (` in crore)
2021-22
2020-21
2019-20
71.88
56.07
66.45
EBITDA margin (in %)
2021-22
2020-21
2019-20
13.90
12.97
13.56
PAT (` in crore)
2021-22
2020-21
2019-20
30.87
22.45
24.97
Net profit (PAT) margin (in %)
2021-22
2020-21
2019-20
5.97
5.19
5.09
EPS (`)
2021-22
2020-21
2019-20
8.75
6.36
7.08
Net worth (` in crore)
2021-22
2020-21
2019-20
233.53
199.10
173.41
Return on capital employed (RoCE)(in %)2021-22
2020-21
2019-20
17.15
13.84
18.36
Debt-equity ratio
2021-22
2020-21
2019-20
0.45
0.44
0.64
Inventory turnover ratio
2021-22
2020-21
2019-20
6.94
6.26
7.26
Interest coverage ratio
2021-22
2020-21
2019-20
3.34
1.88
2.75
13
Corporate Overview Notice Statutory Reports Financial Statements
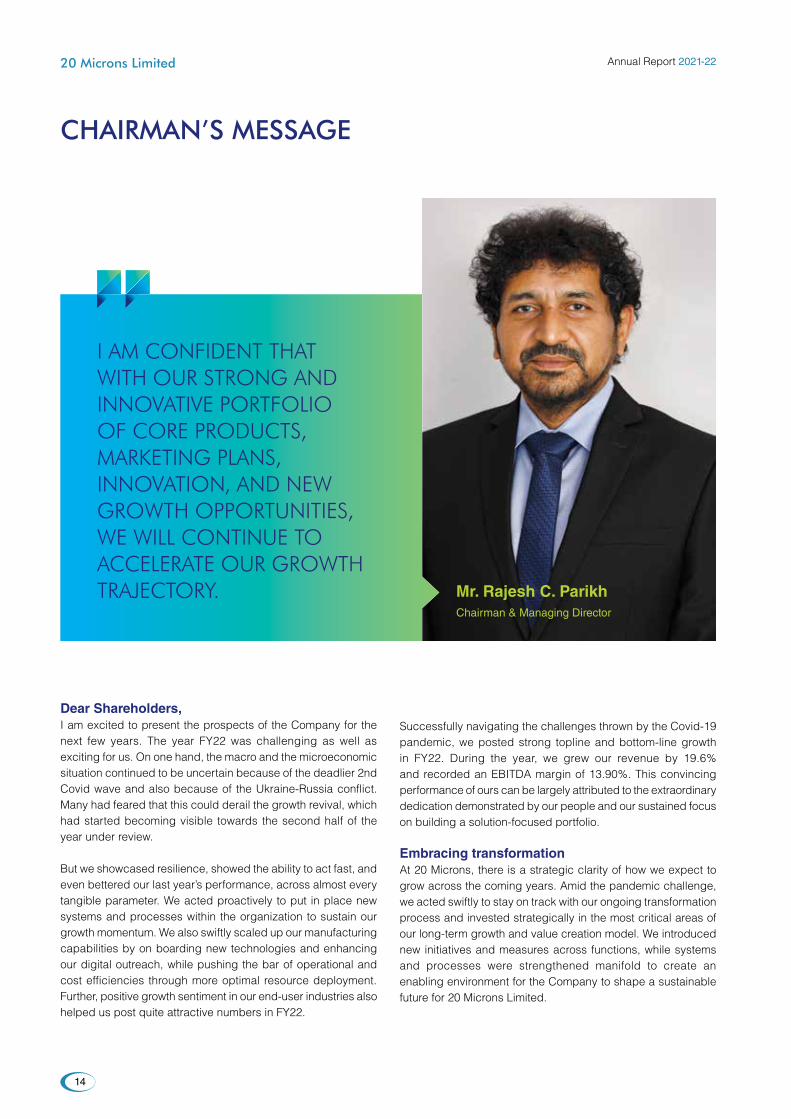
chairman’s message
I am confIdent that wIth our strong and InnovatIve portfolIo of core products, marketIng plans, InnovatIon, and new growth opportunItIes, we wIll contInue to accelerate our growth trajectory.
Dear Shareholders,I am excited to present the prospects of the Company for the next few years. The year FY22 was challenging as well as exciting for us. On one hand, the macro and the microeconomic situation continued to be uncertain because of the deadlier 2nd Covid wave and also because of the Ukraine-Russia conflict. Many had feared that this could derail the growth revival, which had started becoming visible towards the second half of the year under review.
But we showcased resilience, showed the ability to act fast, and even bettered our last year’s performance, across almost every tangible parameter. We acted proactively to put in place new systems and processes within the organization to sustain our growth momentum. We also swiftly scaled up our manufacturing capabilities by on boarding new technologies and enhancing our digital outreach, while pushing the bar of operational and cost efficiencies through more optimal resource deployment. Further, positive growth sentiment in our end-user industries also helped us post quite attractive numbers in FY22.
Successfully navigating the challenges thrown by the Covid-19 pandemic, we posted strong topline and bottom-line growth in FY22. During the year, we grew our revenue by 19.6% and recorded an EBITDA margin of 13.90%. This convincing performance of ours can be largely attributed to the extraordinary dedication demonstrated by our people and our sustained focus on building a solution-focused portfolio.
Embracing transformationAt 20 Microns, there is a strategic clarity of how we expect to grow across the coming years. Amid the pandemic challenge, we acted swiftly to stay on track with our ongoing transformation process and invested strategically in the most critical areas of our long-term growth and value creation model. We introduced new initiatives and measures across functions, while systems and processes were strengthened manifold to create an enabling environment for the Company to shape a sustainable future for 20 Microns Limited.
Mr. Rajesh C. ParikhChairman & Managing Director
Annual Report 2021-22
14
20 Microns Limited
At the outset of this strategic evolution, we recognized that to achieve our future growth ambitions, we would need to build on the organizational capabilities which have delivered such a strong performance track record. With the enhanced capabilities, we would ensure the company can continue to thrive in the years ahead.
We are using some of our learnings from the previous years to enable our people to work together in a simple, focused, and agile ways. We also focused on greater use of technology to ensure that we remain connected with our colleagues, vendors, dealers, and clients. Being a business entity that has never believed in the idea of just manufacturing products and marketing them to the target group, we undertook several small measures during the year, which can add up to make a significant difference in how evolve in the years ahead. At 20 Microns, differentiation has always been the key propeller of our growth strategy, and over the last few years, we added several new layers of distinctiveness to our business approach.
While the Covid outbreak was undoubtedly a catastrophic event, we saw in it the opportunity to fast-track our transformation process to emerge as a globally recognized player in the industrial mineral and specialty chemical space. We focused on enhancing our research and development (R&D) capabilities in such a way that it helps us in creating an innovative portfolio of products. A portfolio that actually fulfills the unmet and unarticulated needs of our customers.
Focussed strategic initiativesDuring the year, we have undertaken several targeted measures which helped us remain on track toward our goal of sustainable long-term growth. The infusion of new talent pool across different levels and functions has ushered a new level of dynamism into the organization as we gear up to become future-ready across functions, systems, processes, and people.
Further, we focused on strengthening our financial position during the year. We repaid all our long-term debts during the year and came out of CDR. This validates the financial discipline observed by 20 Microns and the progress we made over the years. Led by our inspiring leadership, we have remained dedicatedly focused on maintaining strong financial and operational discipline, which has been an integral facet of our transformational agenda. Instead of taking a short-term view to cut costs, we remained focused on steering our long-term strategy of rationalization and optimization, backed by digitalization and automation of systems and processes.
Concurrently, in line with our diversification and de-risking approach over the last couple of years, we have further
expanded our product basket to adapt it to evolving needs and aspirations of customers in these changing times. Our foray into the Mineral fertilizers, Construction Chemicals and nano-sized functional additive segments is aligned with this strategy, and in FY22, we undertook a conscious effort to expand our presence in these segments.
Towards a sustainable tomorrowThrough our marketing initiatives, we have put forth these value propositions of ours to our customers and different stakeholders. Further, we have built strong bonding with our customers and would continue to keep our ears to the ground to understand their needs better.
Today we stand at a juncture where have been successful in earning the trust of customers and stakeholders through the integrity of our promise, the quality of our products, and the insightful differentiation that delivers 100% value in every product we manufacture. We aim to retain the trust and transform our strategy for the future.
Way forwardFinally, I would like to take this opportunity to extend my personal gratitude and appreciation to all our employees for their dedicated contribution towards building the brand 20 Microns Limited as a trusted, respected, and reliable organization. As we continue to transform and move forward, I look forward to their continued support, and that of all our partners, vendors, influencers, distributors, and dealers, in our journey towards a sustainable future.
We have started our new financial year with good momentum. I am confident that with our strong and innovative portfolio of core products, marketing plans, innovation, and new growth opportunities, we will continue to accelerate our growth trajectory. Like others, we also expect to face some challenges in the years ahead like inflationary pressures but we are confident that we will minimize the impact on our business through revenue growth management, smart procurement planning, and other cost initiatives. We expect further progress against our key financial metrics in FY23 and beyond and are confident we will continue to deliver superior returns in the years ahead.
Thanks
Mr. Rajesh C. Parikh, Chairman & Managing Director
20 Microns Limited
15
Corporate Overview Notice Statutory Reports Financial Statements

in conversation with mr. atiL c. pariKh - ceo & managing director
realIzIng that It Is a marathon, we focused on settIng small mIlestones as walk towards our ‘velocIty 2026’ goals.
Q A
Q A
What are your top reflections as CEO of 20 Microns Limited in FY22?
I am grateful for the resilience and agility of our people as we continued to navigate through the crisis while building the future. There is nothing more important than the health and safety of our people, and I am proud of how our colleagues, customers, and suppliers continued to adapt and support one another.
Despite the challenges, this year, our transformation strategy gained momentum. We made sharp strategic shifts to restructure our systems and process internally, even as we responded with agility to further rationalize and optimize our operational and cost structures, keeping in mind the external environment. We installed many new types of machinery in FY22 such as the installation of superfine roller mills. With the installation of this machinery, we not only enhanced our productivity and capacity but also made substantial savings in overhead costs such as power. We focused our efforts on bringing in greater efficiencies and cost discipline, along with a seamless transition to the new normal of functioning in an environment of total safety for our people. Thus, by simplifying our processes and right-sizing our cost bases, we unlocked significant savings.
We also launched 41 new products in FY22. Through our direct subsidiary 20 Microns Nano Limited, we introduced 32 new products and under the banner of 20 Microns Limited, we launched 5 new products. We further strengthened our presence in the organic fertilizer segment with the introduction of 4 new products under the banner of Minfert. This helped in further strengthening our footprint in the import substitute segment. We also completed all the legal formalities regarding the JV with Dorfner during the year. Further, we embarked on our greenfield capacity expansion goals during the year.
Key highlights of FY22’s business performance?
We delivered another year of commendable performance in FY22. Taking some decisive steps, we recorded our highest-ever revenue, operating profit, and margin during the year. We saw a strong recovery in the paint, coatings, ink, rubber, ceramics, and construction industry in India and also abroad. Further, the key products of 20 Microns gained substantial traction in the market. Our innovations in the industrial mineral and specialty chemicals segment helped us stay ahead of the curve. All these factors cumulatively helped us post substantial growth numbers in FY22.
Annual Report 2021-22
16
20 Microns Limited

Q A
Q A
Q A
Our revenues for the year increased by 19.6% to stand at `522.95 crore in FY22. EBITDA for the year stood at `71.88 crore (13.90%) as compared to `56.07 crore (12.97%) in the previous year. Profit After Tax (PAT) stood at `30.87 crore as compared to `22.45 crore in the previous year. Our PAT margin in FY22 improved by 78 bps from the previous year. We maintained an EBITDA margin of 13.90% during the year.
What were the key initiatives that transpired during the year that are likely to help the Company adapt transformation at a quicker pace?
It was a combination of our strategic and functional changes that facilitated our transformation. One of the key strategic shifts that helped us grow even in the new business order was our decision to enhance our focus on the value-added segment and import substitute segment, where we saw significant emerging opportunity for growth in both, the near and long term. We introduced 3 new machineries during the year propagating our operational transformation at a cost outlay of ~`20 crore.
To deliver a more balanced and responsive stakeholder value proposition, we also strengthened our product proposition with a keen focus on growing segments such as the import substitute segment, fertilizer business and the value enhancing product segment, among others. We focussed on generating increased efficiencies by optimising our processes and costs in many ways.
How is the Company transforming with ‘Velocity 2026’ as the North Star?
‘Velocity 2026’ is a multiyear strategy, which we have set internally, to future-proof our business and adapt in a fast-changing world. It is focused on building our long-term strengths whilst embracing transformation across multiple dimensions. Building upon the momentum, since the introduction of the plan in 2021, we are accelerating progress on our five strategic pillars: delivering superior and balanced growth by increasing consumer and customer centricity; funding our growth through continuous productivity
improvements and cultivating a cost-conscious culture; emerge as the best integrated manufacturer of white minerals and speciality chemicals by focusing on automation and digitisation; stepping up in sustainability and responsibility quotient by undertaking different measures on these fronts; and unlock the full potential of our people by investing in talent and capabilities.
Riding on the back of Velocity 2026, we are entering an incredible next era of innovation and expansion at 20 Microns Limited. Our best days are ahead of us as we continue to deliver superior and balanced growth with innovation focused portfolio. New products and emerging business trends are helping us reimagine and revitalise our business strategies, bringing the joy of true togetherness to our consumers across the world.
What steps did the company undertake to enhance its sustainability quotient?
Sustainability is a critical enabler of our growth strategy, and we are making regular strategic investments in innovative initiatives, not just for our direct stakeholders but also for the society at large. Our steadfast commitment towards building a lean, green and clean organisation continues to translate into more eco-friendly products and processes across our business value chain.
As a part of our sustainable business initiative, during the year, we installed solar power plants at our Vadadala facility with an annual production capacity of 500 kva. Set up at a cost of `1.3 crores, this not only helps us meet our captive power requirement but also helps reduce our carbon footprint. Further, we have undertaken a feasibility study of setting up solar power plants across all our manufacturing facilities. Based on the feasibility study, we would decide on setting up new solar plants.
Further, under our sustainability focus, we embarked on building a water recycling facility at our Bhuj plan. Bhuj is itself is one of the driest landmasses in India and water is scarce across the region. We have been planning on this for almost a year now but
17
Corporate Overview Notice Statutory Reports Financial Statements
started building the plant in the last quarter of FY22. Costing around `3 crores, the plant is expected to be operational by the end of Q1 FY23. And, once operational, we expect to reuse over 80% of the water used in our Bhuj plan regularly.
How do you stay obsessively customer and consumer focused?
After a long history as a successful product manufacturer, we are now focused on increasing our customer and consumer-centricity. We are focused on revitalizing and renewing core business strategy while continuously innovating and exploring beyond the existing portfolio. We are also investing in consumer and customer-rooted innovation while boosting our digital prowess on the path to becoming more inter-connected with our customers.
During the year, we witnessed the unfolding sectorial reality around us with optimism. We observed more and more customers are preferring Indian manufacturers for their raw material requirements. As we remain close to our customers, we intend to leverage on this unprecedented tailwind to not just build a bigger company; we intend to build a modern Indian company that is a best-in class benchmark.
In the last couple of years, many of our existing customer’s approached us to manufacture products for them which they have been importing previously. We took this as an opportunity and embarked on the journey backed by our dedicated and state-of-the-art R&D units. Through our dedicated research and technological capabilities, in FY22, we have been able to offer our customers with import-substitute products which are of international quality but at a much lower cost. This did two things: saved a lot of cost for our customers and helped us grow our order book from the existing clients – a win-win situation for both of us.
Thus, the idea of transformation at 20 Microns is of greater importance, as it not only embodies the idea ‘Atmanirbhar India’ but also helps Indian businesses thrive by reducing their dependency on foreign companies.
What is your approach to long-term value creation?A: At 20 Microns Limited, we are a growth company and have a long history of delivering superior growth. Our ‘Velocity 2026’ plan heralds the shift from exponential growth to sustainable and balanced growth. We aim to strike the right balance between short-term goals and long-term sustainability plans, between top-line growth and overall stakeholder value creation. Our renewed value creation model and our innovation-focused portfolio, encapsulate our balanced ambition.
How did the Company approach tackling the logistical challenges faced in the last couple of years?
The logistical challenges that we faced in the last couple of years were beyond our control. So we focused on controlling the factors which we were under our control. Better planning, real-time coordination with the different teams, changing from need-based ordering to bulk orders, and better freight management, are some of the things that we did. It helped us mitigate the logistical issues to a large extent.
On the cost front, the logistical cost has gone up exponentially in the last couple of years, both domestic and international. However, the major area of concern is the internal ocean freight cost, which has gone up ridiculously in the last couple of years. For example, the ocean freight from India to the Middle East has gone up by ~400% in the last couple of years. It is something beyond our control, and I don’t think any Indian company gauged this kind of rise. So, as a precautionary measure, we have been upfront with our international clients when placing an order with us. We told them that the freight cost would be levied based on the prevailing freight cost at the time when the order is ready to be shipped and not the freight cost at the time of placing the order. This helps us to be transparent and generate trust.
How did the exports business shape up during the year under review?
Value-wise we witnessed a growth in FY22. But we can largely attribute this to the fact that we have been successful in passing on the cost escalation to our customers, who also solemnly supported us. But in terms of volume we have seen growth
Q A
Q A
Q A
Q A
Annual Report 2021-22
18
20 Microns Limited
compared to last year, but not much. However, one major achievement was that we entered South America for the 1st time in FY22. This not only helps us enhance our global presence but also increases the acceptance of our products in the international market. Today, we export to more than 65 countries across the globe.
Focusing keenly on maintaining our desired margin, we emphasized on consolidation of our export business in FY22 and came up with a clear road map in terms of reorientation of our international business model and strategy to grow exponentially in the coming years. We intend to focus on growing our FZE business in the international markets with a keen eye on a few important products like Calcined Kaolin, Fumed Silica, Modified Bentonite, Aluminium Trihydrite, Barium Sulphate Synthetic, Barium Sulphate Natural, Iron Oxide synthetic pigment Tio2. In FY23, our focus on the export business would majorly revolve around the value products and we slowly plan to exit the volume game. Also, our focus would be on building our competency in the specialty segment in the international market. We have seen that many of our specialty products are not yet up to the internationally accepted standards. Our research team is working hard to match the stringent global standards and also, we are contemplating joining hands with some established international players to bolster our competency in the international market. Further, we intend to grow our presence in the plastics and rubber segment within the specialty segment. Currently, our export business stands at ̀ 82.57 crore and contributes nearly ~16% to the overall revenue. But with a dedicated road map for our exports business, we expect our international business to almost double itself over the next five years.
What has been 20 Microns biggest learning in FY22?
The last two years have been exceptional learning for almost every business house. Our learning in FY22 was about the importance of balance. It is critical to keep an optimistic outlook yet be realistic and face the harsh truths. Move with agility and speed, yet take enough time to reflect on the opportunities.
Realizing that it is a marathon, we focused on setting small milestones as walk towards our ‘Velocity 2026’ goals. A positive outcome of our learnings can be validated by our focus on maintaining cost efficiencies blended with our measures to tighten our control on receivables and bolster recoveries to keep our performance on track.
What is the Company’s outlook for the next few years, particularly in context of ‘Velocity 2026’?
We launched our ‘Velocity 2026’ strategy in Dec, 2021 to future-proof our business and deliver superior, balanced growth for sustainable, long-term value creation. It requires us to constantly navigate the long-term transformation with focused short-term financial delivery under fast-changing external circumstances. We are encouraged by the progress made, validated by the convincing performance of our business in FY22, and we are happy with how ‘Velocity 2026’ is taking shape.
We remain optimistic about our prospects. The synergies we have steadfastly infused into the organization are expected to make us future-ready. They are likely to fortify us to harness the emerging opportunities in the short as well as long term. Keeping in mind our existing portfolio and how we are building our relations with the existing and new clients, we expect to grow our business at a much faster rate over the next five years and to take 20 Microns to a `1,000 crore plus revenue company by 2026. Reflecting our confidence in the long-term, we intend to further step up our investments in technology, brand building, our digital footprint, and sustainability initiatives. This investment will be partially offset by further delivery of gross savings from our productivity initiatives.
Thus, at 20 Microns, we are well poised to seize the opportunity, at the back of our strong credentials, and our exciting product mix that spans price points and diversified customer needs. Our technological and digital transformation journey, aimed at promoting operational and cost efficiencies, is another lever that we shall continue to accelerate as we move towards more targeted expansion into newer geographies and customer segments.
Q A
Q A
19
Corporate Overview Notice Statutory Reports Financial Statements

our business enabLers
SOurcing and prOcureMent
An effective and responsible supply chain management guarantees a sustainable supply of raw materials sourced from vendors spread across the globe. Our sourcing strategy, both domestic and international, revolves around the idea of creating a world-class operation that delivers sustainable and competitive results through creativity and collaboration with its suppliers and other functions.
Key achievement in FY22
Exceptional savings regardless of abnormal cost inflation
Continued supply of raw material in a challenging logistics environment
Today, we proudly associate with 1,000+ active direct suppliers spread across the globe, and over 45% of the total vendors have been associated with 20ML for more than two decades. Today, we source more than half of 20ML’s raw material requirements from various international sources. But we are concentrating on slowly increasing domestic raw material sources and importing in bulk quantities to save on cost and secure raw material availability.
Annual Report 2021-22
20
20 Microns Limited

Positive performance in a challenging environmentMany of our procurement performance indicators developed favorably during FY22. Our primary target, procurement savings, saw notable improvement during the year despite the challenges. We consider this our top key performance indicator because it has a high impact on 20ML’s profitability.
Another indicator we saw improve this year is cost-competitive country sourcing. By expanding procurement options to a wider range of countries and new domestic sources, we have been able to reduce costs while adding additional flexibility to our supplier network. Another key achievement for the team - ensuring that all our deliveries were on time and as per the schedule. It showcased our efficiency and accuracy in planning and management.
Targeted mitigating effortsFor 20 Microns, sourcing is a critical enabler of growth. If not properly planned and executed, it can lead to cost escalation and even order cancellation. Thereby, not only affecting the profitability but also the reputation of the Company.
In FY22, the Company witnessed an annual increase in raw material purchase, reflecting 20ML’s positive growth. However, over the last couple of years, we have witnessed an abrupt and absurd rise in the ocean freight. This presented an enormous challenge for the sourcing team.
We mitigated this challenge by changing our sourcing strategy from need-based sourcing to bulk sourcing. By increasing our purchases from carefully selected suppliers in cost-competitive countries,
we have been able to counter some of the price increases. Increased regular follow-up of suppliers, open dialogue and targeted negotiations are some ways we have dealt with the challenges.
Case-in-pointIn FY22, we did a bulk import of finished raw material of 11,000 metric tonnes from our Vietnam subsidiary, the first Indian mineral company to do so. Getting a bulk delivery is extremely challenging. It needs intricate planning, pristine decision making, and an immaculate execution strategy in terms of the required infrastructure to store, selecting the delivery ports, and the final delivery mechanism from port to plants. It took us 45 days of rigorous planning and coordination to execute this feat.
~45%Percentage of total vendors who have been associated with 20ML for more than two decades
But, thanks to the effort we have been able to reduce the per tonne freight cost by more than 30% and helped us negotiate better terms with the transporter. The cost we save saved through bulk sourcing has enabled us to remain price competitive. Further, it helped us negotiate for a longer credit term with the supplier, which in turn helped reduce the working capital requirement. Also, the bulk order strategy has helped us reduce the raw material cost by 5 to 10%, and owing to the large quantity, our vendors prioritized
21
Corporate Overview Notice Statutory Reports Financial Statements

reSearch and deVelOpMent (r&d)
Key focus areas of the R&D unit
Cost optimisation through process improvement
Identifying synergic products to enhance their properties
New product development which are more efficient and environment friendly
Product enhancement - value addition to existing products and the process wastes
Undertake quality checks both at the raw-material, final output level and at every process level
Use chemical modification technique to remove the impurities from the raw materials that we use
Launch 5 – 7 new products every year
A constant focus on R&D is and always has been essential for 20 Microns. This is, without a doubt, the most critical condition for the company to be able to deliver products and solutions of the highest quality to industries in India and around the world.
The goal of R&D is clear: maintain our leadership position in our key end-user industries. 20 Microns Limited is India’s largest producer of white minerals. We aim to sustain this leadership by offering innovative products in the field of functional fillers, extenders, and specialty chemicals with the help of R&D.
The Company’s growth rate and the tempo of its new product launches are constantly accelerating, and R&D plays a crucial role in maintaining this pace.
Recognized by the Department of Scientific and Industrial Research (DSIR) – Ministry of Science & Technology, Govt. of India, our research and development initiatives are focused on empowering our end-user industries to find the right product and solutions for their requirements of tomorrow and the challenges faced today. Our state-of-the-art R&D centers are equipped with high-end technical equipment sourced
Transforming 0pportunity into reality Exploiting waste for sustainable production
Silica is waste generated in our manufacturing process. As a proactive organisation, we tried to find opportunities in terms of how we can use this waste rather than just dumping it safely. Responsibly dumping silica attracted cost as it considered as hazardous material. Thanks to our research & development team, we did some value addition to the waste product and came up with a new product which found an application in few industries. Therefore, it opened up an additional revenue stream from us.
from some of the globally renowned manufacturers that focus on new product development and reusing the process wastes.
At 20 Microns, our R&D work is carried out through 2 ultra-modern R&D units located at Waghodia and Vadadala. At the end of FY22, R&D employed a total of 41 people, while R&D expenses for the year amounted to `1.87 crore.
Annual Report 2021-22
22
20 Microns Limited
Quality ManageMent
MarKeting
Quality is a cornerstone of 20ML’s culture and fundamental to the success of our customers and our business. 20ML supplies customers with sustainable solutions in the white minerals and speciality chemical segment based on high-quality technology, processes and services. Our quality focus aims to maximize customer satisfaction and loyalty through continuous improvement across the value chain.
We formed a quality management mechanism in line with our strategy to achieve the high-quality performance and to ensure that the entire value chain works in unison for our customers’ success. This requires a deep understanding of the customer needs and expectations, along with high-quality deliveries that cement positive long-term customer relationships.
Decades of hard work help in creating a brand value. But, once developed, it is one of the hardest working resources within a company. A good brand has to be necessarily backed by a quality product, but the opposite may not be always true. A quality product, for lack of better perception or brand value, may struggle in the marketplace. The right marketing strategy, based on the product and target group, helps create a powerful brand and the right perception about the company and its products amongst the target group.
At 20 Microns, we realize that equally important to our good and well spread-out product offering is its perception among our customers. Hence, we pay equal attention to the factors at play that decide people’s perception of
Our quality governance policy is carried out at every level of the organization be it corporate or production line. Steered by a team with representatives from all business lines and areas, our quality focus business model ensures the quality performance of all our operations in all locations.
Excellence in processes is a must at 20 Microns Limited. It includes the promise to constantly improve quality as well as health, safety, and environmental performance. We achieve this by documenting and communicating quality processes, monitoring these processes with performance indicators, and committing to continuous improvement. To ensure the quality of its product, the Company has set up in-house laboratories for testing the quality of raw materials and the end products. The
the products we manufacture across the three segments. Along with good quality, it entails meeting the diverse requirements of customers, competitive pricing, and, in the case of products like ours, timely availability. Product price is determined by the forces of demand and supply. However, our success is mapped by our ability to stay closer to customers, understand their requirement, and cater to their specific needs. Another key role player by the marketing team is that of a backward integration, i.e. we try to identify new markets and the products in demand in that market. Once we have all the information, we get all the information to our R&D team and who develops the product in-house and then market the product. Our core marketing strategy is based on quantitative and qualitative customer segmentation,
Company’s state-of-the-art lab has been equipped with sophisticated instruments, enabling it to meet the stringent quality requirement of our customers. Quality certifications such as ISO 9001:2015 and ISO 14001:2015 define the quality consciousness of the Company
To further improve the acceptance of the products manufactured by 20 Microns in the international market, the Company implemented a new initiative called ‘IMPACT’ to improve product quality and excellence. This initiative is expected to enhance the acceptance of 20 Micron’s products in the international market. A thorough review of the raw materials used and the newly developed products are expected to help the Company adhere to the internationally benchmarked quality standards.
which helps us in acquiring a better and deeper understanding of our existing and potential customers. It also helps us explore new opportunities with existing clients.
Over the years, we have built a strong network of dealers and distributors to reach target markets, which has helped us create a strong brand image of the Company within the industry space. In the international space, we work with some renowned brands. Additionally, we have undertaken strategic JVs to enhance our brand value and generate higher acceptance of our products. We have created multiple brands under the umbrella of 20 Microns to cater to the requirements of diverse customer requirements.
23
Corporate Overview Notice Statutory Reports Financial Statements

our investment propositions
What makes 20 Microns an interesting investment story?
Our business philosophy has been consistent for many years: investing for the long term while delivering cash-generative profit growth in the near term.
Our regained financial strength and strategic tie-ups with renowned international players is expected to propel our growth and would enable us to make long-term investments through the pandemic.
Our investments in technology, equipment, data driven processes and agile business processes are likely to accelerate our recovery from the pandemic, and we saw strong growth in order book in FY22.
We believe there are a few simple and interesting reasons to make 20 Microns Limited an interesting investment story.
Over the years, we have built an encompassing portfolio across two major product segments: ultrafine industrial minerals and speciality chemicals. Thanks to our unique portfolio with unrivalled balance, scale, and diversity, we have entrenched our presence in not just one end-user sector but across multiple sectors such as paints and coating, rubber, inks and pigments, paper, cosmetics, ceramics, textiles and agriculture, among others.
Over the years, we have consistently built our infrastructure with the addition of new and updated machineries and technology. Further, we have built a fantastic supply chain mechanism to provide us with a consistent supply required raw-materials and enable us to lead market growth. Across our key business segments, we continue to invest in the supply chain to support growth, efficiency and our sustainability targets. Beyond the supply chain we are investing in both our digital capability and IT infrastructure to ensure that the business is future fit to realise our growth ambitions.
Our deep-rooted presence
A well-invested infrastructure
In each business segment, we are the leading supplier of micronized industrial minerals and specialty chemicals in India and one of the emerging players in the global landscape, underpinning our strategic pillar of building a globally renowned brand name for 20 Microns Limited.
Focusing keenly on research and development, we embarked on developing and delivering products for our clients that not only meet their evolving needs but also helped them substitute their internationally sourced raw material with top-notch Indian substitutes of similar quality.
Unique product development strategy
A well-established brand
Annual Report 2021-22
24
20 Microns Limited
20ML has consistently focused on building a strong financial platform. Keeping this in mind, we reoriented our portfolio with a greater focus of higher value products and also focused on cost optimisation. This strategy enabled us to grow our topline and bottom-line at a steady rate over the last few years. It made our business a cash generative one, helped us come out of the debt restructuring and renegotiate attractive lending rates with our banking partners.
Since inception, we have consistently delivered positive growth to our different stakeholders. Over the last three decades, we stood tall against every challenge, including Covid-19 that came on our path and have flourished. We regularly upgraded our portfolio, keeping in mind the changing needs of our customers, and it helped us sustain our growth momentum.
A well-financed and cash generative business A track record of growth
Many of the products manufactured using the white minerals and specialised chemicals produced by 20ML are a consumer staple, meaning category performance is consistent, stable, and projected to grow. Growth is achievable through increasing consumption by innovating to meet emerging consumer needs, accessing new opportunities, and premiumization.
A resilient and growing category
We’re building a working environment where everyone belongs to one family. We have repurposed our work spaces to increase interactions, collaboration and opportunities for innovation with performance based on output rather than hours spent.
An engaged and agile workforce set up for success
In May 2021, we entered into a strategic JV with the globally renowned German firm Dorfner Holding GmbH & Co. KG. It not only gives us access to the esteemed European market for micronized minerals and specialty chemicals. But it would also enable us to develop, market, sell & distribute colored Quartz-related products in India and other high-growth emerging markets in Asia & Africa.
Majority of the products manufactured by 20ML are consumed by end-user industries which find application in the daily lives of millions of people across the world. Further, we have been working closely with some of the renowned players within each of the industry space. With the rising population and growing affordability, the demand for all these products is expected to see a constant rise in the years ahead. Thereby, can expect a sustainably growing demand for the niche products manufactured by 20ML.
Strategic JV with Dorfner A sustainable business
25
Corporate Overview Notice Statutory Reports Financial Statements
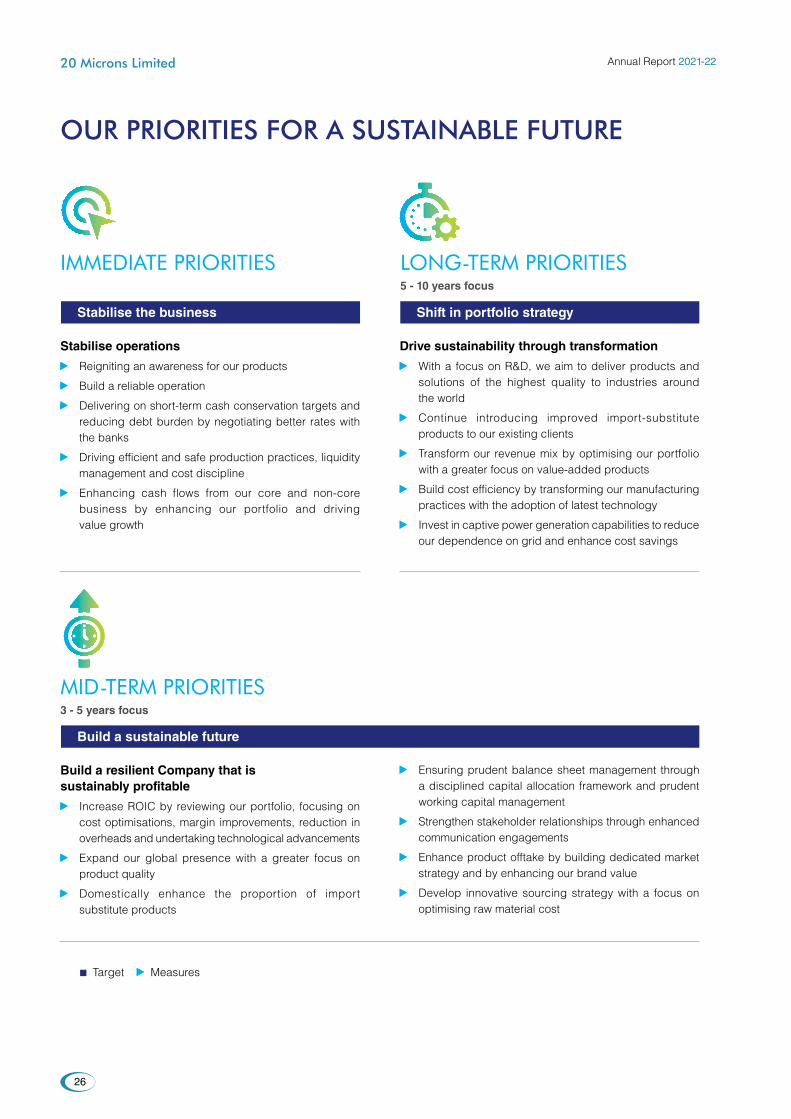
our priorities for a sustainabLe future
iMMediate priOritieS
Mid-terM priOritieS3 - 5 years focus
lOng-terM priOritieS5 - 10 years focus
Stabilise the business Shift in portfolio strategy
Build a sustainable future
Stabilise operations
Reigniting an awareness for our products
Build a reliable operation
Delivering on short-term cash conservation targets and reducing debt burden by negotiating better rates with the banks
Driving efficient and safe production practices, liquidity management and cost discipline
Enhancing cash flows from our core and non-core business by enhancing our portfolio and driving value growth
Drive sustainability through transformation
With a focus on R&D, we aim to deliver products and solutions of the highest quality to industries around the world
Continue introducing improved import-substitute products to our existing clients
Transform our revenue mix by optimising our portfolio with a greater focus on value-added products
Build cost efficiency by transforming our manufacturing practices with the adoption of latest technology
Invest in captive power generation capabilities to reduce our dependence on grid and enhance cost savings
Build a resilient Company that is sustainably profitable
Increase ROIC by reviewing our portfolio, focusing on cost optimisations, margin improvements, reduction in overheads and undertaking technological advancements
Expand our global presence with a greater focus on product quality
Domestically enhance the proportion of import substitute products
Ensuring prudent balance sheet management through a disciplined capital allocation framework and prudent working capital management
Strengthen stakeholder relationships through enhanced communication engagements
Enhance product offtake by building dedicated market strategy and by enhancing our brand value
Develop innovative sourcing strategy with a focus on optimising raw material cost
Target Measures
Annual Report 2021-22
26
20 Microns Limited
driving Long-term vaLue creation
In FY22, our focus centred around further strengthening our ongoing transformation efforts, aimed at overcoming the immediate short-term challenges while propelling our long-term profitable growth agenda.
Sustainable performance enables investments in growth and innovationWe aim for continuous improvement in our financial performance. We make good use of commercial strategies, tight cost control, materials, and energy efficiency, effective capital allocation, and efficient use of assets. We capture opportunities provided by our agile operating model while capitalizing on corporate synergies.
Value-enhancing growth Consumer mega-trends drive the demand growth for most of our products. This is further propelled by the burgeoning need for better living standards and products. We grow businesses with strong long-term demand fundamentals, where we have a clear competitive advantage. This underpins attractive returns on invested capital.
Responsibility is good business Sustainability is an important driver for growth and competitiveness for us. We capture the opportunities presented by increasingly responsible consumer choices and tightening regulations for mitigating climate change.
Innovating for a future beyond the convention We innovate new growth businesses with a unique competitive position in terms of cost and value addition. For example, the successful commercialisation and scale-up of our fertilizer business to a significant size. Use of mineral-based fertilisers not just restores the productivity of the land but restores on a long-term and sustainable basis.
An improving business portfolio drives profitability and valuation Increasing our share of sustainability-driven higher-margin growth businesses improves our long-term profitability and boosts the value of the Company. We focus on shifting our business strategy at a steady pace to emerge from a volume-based player to a value-based player.
Garnering strength from existing capabilitiesWe developed unique strengths and capabilities, such as niche product lines, sustainable raw material sources, well-strategized logistical plans, powerful brands, and category leadership that allowed us to increase our competitiveness and build market-leading positions. We would continue to do so going forward.
50%Rise in the share price of the Company in FY22 (i.e. from 1st April 2021 to 31st March 2022)
27
Corporate Overview Notice Statutory Reports Financial Statements
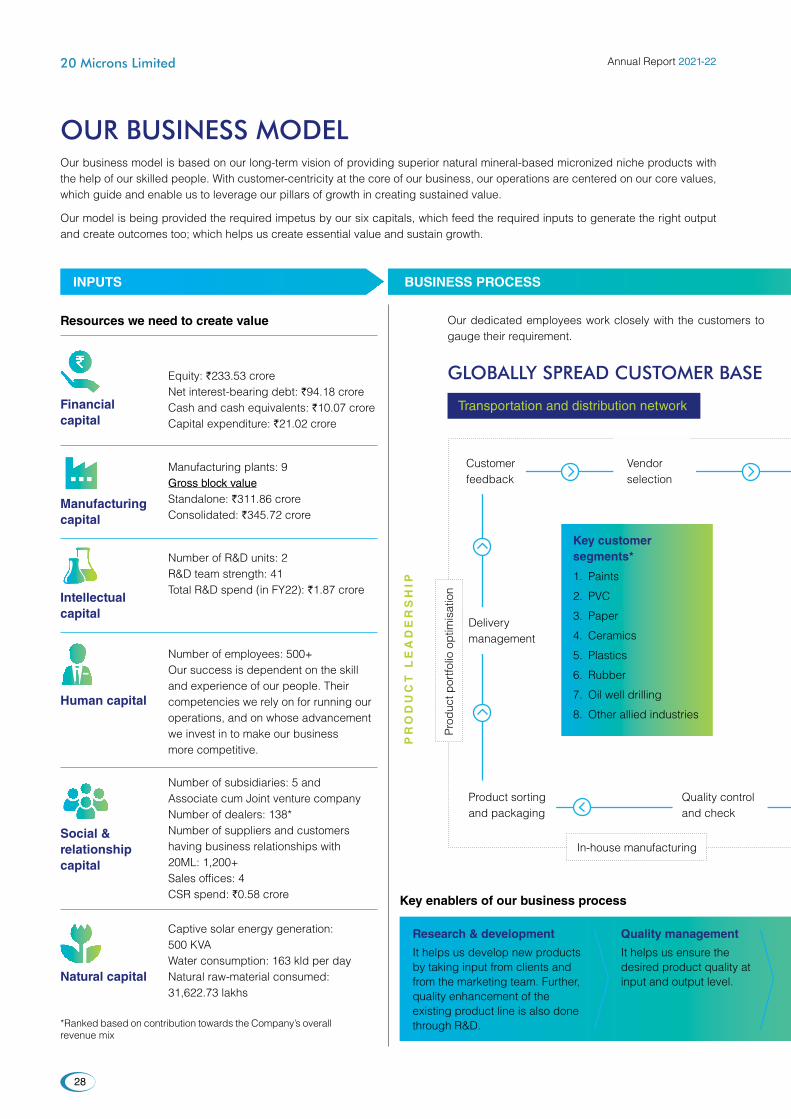
our business modeLOur business model is based on our long-term vision of providing superior natural mineral-based micronized niche products with the help of our skilled people. With customer-centricity at the core of our business, our operations are centered on our core values, which guide and enable us to leverage our pillars of growth in creating sustained value.
Our model is being provided the required impetus by our six capitals, which feed the required inputs to generate the right output and create outcomes too; which helps us create essential value and sustain growth.
INPUTS BUSINESS PROCESS
Resources we need to create value
Financial capital
Manufacturing capital
Intellectual capital
Human capital
Social & relationship capital
Natural capital
Equity: `233.53 croreNet interest-bearing debt: `94.18 croreCash and cash equivalents: `10.07 croreCapital expenditure: `21.02 crore
Manufacturing plants: 9Gross block valueStandalone: `311.86 croreConsolidated: `345.72 crore
Number of R&D units: 2R&D team strength: 41Total R&D spend (in FY22): `1.87 crore
Number of employees: 500+Our success is dependent on the skill and experience of our people. Their competencies we rely on for running our operations, and on whose advancement we invest in to make our business more competitive.
Number of subsidiaries: 5 and Associate cum Joint venture companyNumber of dealers: 138*Number of suppliers and customers having business relationships with 20ML: 1,200+Sales offices: 4CSR spend: `0.58 crore
Captive solar energy generation: 500 KVAWater consumption: 163 kld per dayNatural raw-material consumed: 31,622.73 lakhs
Our dedicated employees work closely with the customers to gauge their requirement.
Key enablers of our business process
Research & development
It helps us develop new products by taking input from clients and from the marketing team. Further, quality enhancement of the existing product line is also done through R&D.
Quality management
It helps us ensure the desired product quality at input and output level.
Key customer segments*
1. Paints
2. PVC
3. Paper
4. Ceramics
5. Plastics
6. Rubber
7. Oil well drilling
8. Other allied industries
In-house manufacturing
Prod
uct p
ortfo
lio o
ptim
isat
ion
PR
OD
UC
T L
EA
DE
RS
HIP
Customer feedback
Quality control and check
Product sorting and packaging
Delivery management
Vendor selection
gLobaLLy spread customer base
Transportation and distribution network
*Ranked based on contribution towards the Company’s overall revenue mix
Annual Report 2021-22
28
20 Microns Limited

OUTPUT OUTCOMES
Economic
Revenue: `517.13 crore (19.6% growth from the previous year)
EBITDA: `71.88 crore (28.2% growth from the previous year)
PAT: `30.87 crore (37.5% growth from the previous year)
EPS: `8.75 (37.5% growth from the previous year)
Social
Created direct and indirect employment
Improved employee competence through regular training
Enhanced customer loyalty and strengthened relationship
Bolstered trust and reputation amongst our domestic and international clients
Introduced 41 new products during the year to boost our portfolio
Environmental
More efficient processes enable us to use fewer natural resources, reduce our carbon footprint and reuse natural resources such as minerals and water
Greater use of technologies and improved processes enabled the production of customers’ products with less energy and water, fewer raw materials, and improved flexibility in fuel source selection to replace fossil fuels with renewable ones
We introduced a new solar power plant during the year to meet our captive power requirement
Paints and coatingsEngineered Kaolin | Calcium Carbonate | Opacifiers | Matting Agent
Polymers, Paper and RubberUncoated Calcium Carbonate | Coated Calcium Carbonate | Talc | Mica | Engineered Kaolin
Construction chemicalsTigersil | Koolsil | Gypsum | Colour Floor Silica
Agriculture and organic farmingMinfert – BLK | GBR | Geocare | Humicrons
Information Technology (IT)
It helps us accumulate and disseminate information in real-time across the organisation.
Human Resources
Utilising the expertise and experience of our people, we have collaborated as a team with a growth mindset to help us achieve our mission.
happy and growing customer
base
Ensuring product quality
PU
RS
UIT
OF
Ex
CE
LL
EN
CE
Raw-material quality check
Product management
Manufacturing
Supply chain and logistics management
gLobaLLy spread customer base
Transportation and distribution network
I N T E G R I T Y & T R A N S PA R E N C Y
29
Corporate Overview Notice Statutory Reports Financial Statements
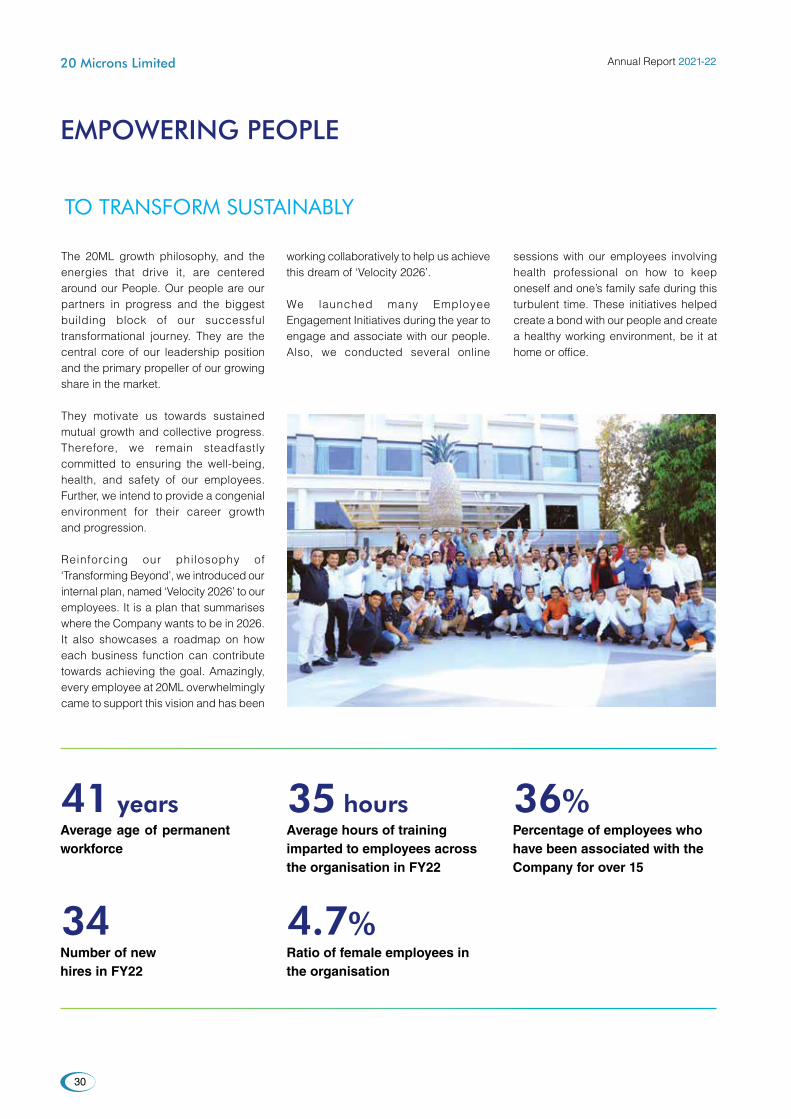
empowering peopLe
The 20ML growth philosophy, and the energies that drive it, are centered around our People. Our people are our partners in progress and the biggest building block of our successful transformational journey. They are the central core of our leadership position and the primary propeller of our growing share in the market.
They motivate us towards sustained mutual growth and collective progress. Therefore, we remain steadfastly committed to ensuring the well-being, health, and safety of our employees. Further, we intend to provide a congenial environment for their career growth and progression.
Reinforcing our philosophy of ‘Transforming Beyond’, we introduced our internal plan, named ‘Velocity 2026’ to our employees. It is a plan that summarises where the Company wants to be in 2026. It also showcases a roadmap on how each business function can contribute towards achieving the goal. Amazingly, every employee at 20ML overwhelmingly came to support this vision and has been
working collaboratively to help us achieve this dream of ‘Velocity 2026’.
We launched many Employee Engagement Initiatives during the year to engage and associate with our people. Also, we conducted several online
sessions with our employees involving health professional on how to keep oneself and one’s family safe during this turbulent time. These initiatives helped create a bond with our people and create a healthy working environment, be it at home or office.
41 years
34
35 hours
4.7%
36%Average age of permanent workforce
Number of new hires in FY22
Average hours of training imparted to employees across the organisation in FY22
Ratio of female employees in the organisation
Percentage of employees who have been associated with the Company for over 15
tO tranSFOrM SuStainably
Annual Report 2021-22
30
20 Microns Limited

eMplOyee engageMent actiVitieS
Women’s Day celebration
Republic day celebration
31
Corporate Overview Notice Statutory Reports Financial Statements
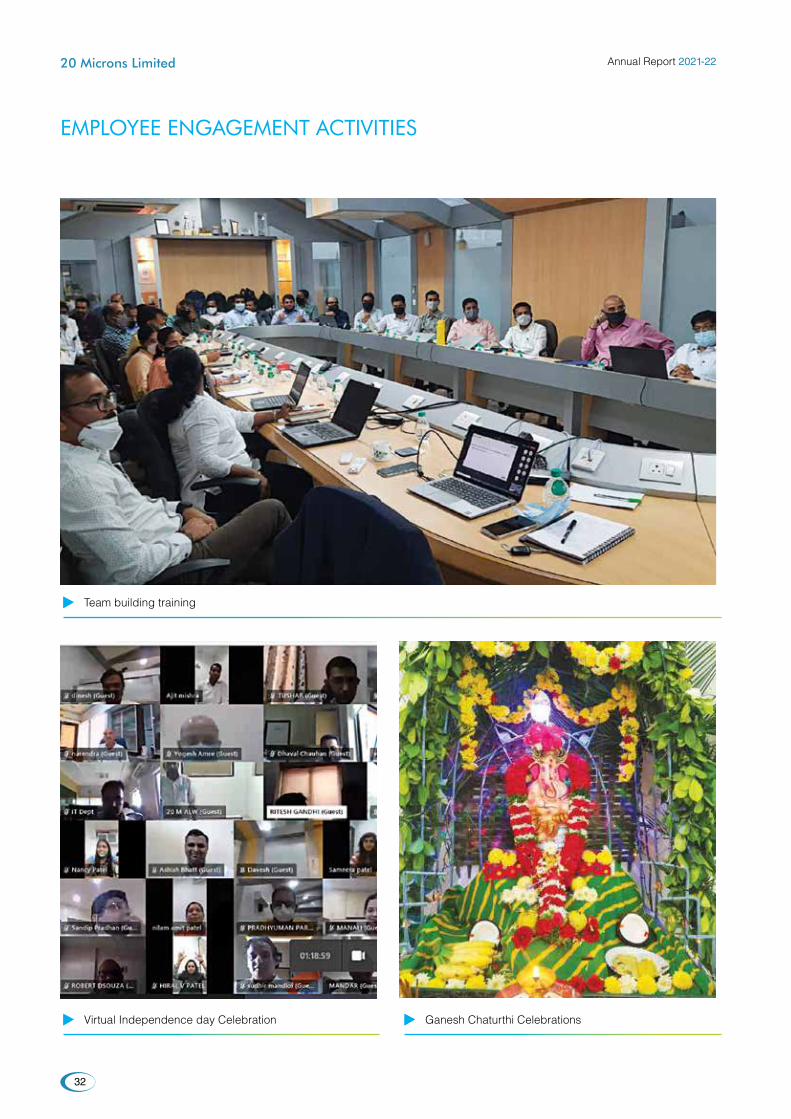
Team building training
Virtual Independence day Celebration Ganesh Chaturthi Celebrations
eMplOyee engageMent actiVitieS
Annual Report 2021-22
32
20 Microns Limited
transforming sustainabLy
Our apprOach tO SuStainabilityDoing good while doing well has been at the heart of 20ML’s ethos since the inception of the Company. This continues to this day, as we want to contribute positively to the people and the communities where we operate.
Accordingly, our sustainable business practices are embedded in every element of our business strategy. Our focus on the growth and well-being of both people and the planet is fundamental to 20ML’s resilience, delivering the value our stakeholders deserve and building a company of which we can all be proud.
Consumer Insight – why it is important for our sustainability?The starting point of our business is understanding how we can best meet the diverse requirements of our consumers and customers. We aim to build a longer-term view – understanding of the emerging trends and the wider context the category operates in, as well as current customer needs.
This enables us to research and develop products that our customers would love and deliver solutions that maximise the growth opportunity for our customers and, in turn, ours.
Case-in-point: By taking a cue from our customer’s feedback, we have been able to provide our customers with specialised products which they have been importing previously. This import-substitute material saved costs for our customers and opened up new business opportunities for us.
33
Corporate Overview Notice Statutory Reports Financial Statements
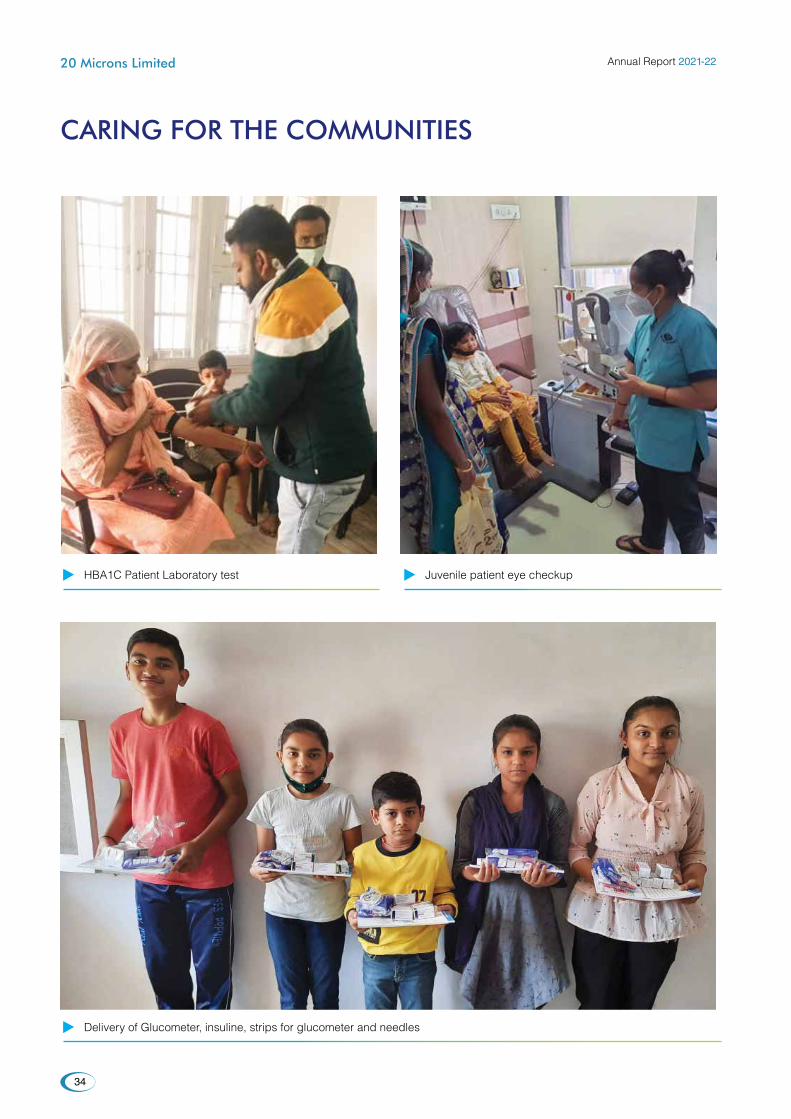
caring for the communities
HBA1C Patient Laboratory test
Delivery of Glucometer, insuline, strips for glucometer and needles
Juvenile patient eye checkup
Annual Report 2021-22
34
20 Microns Limited
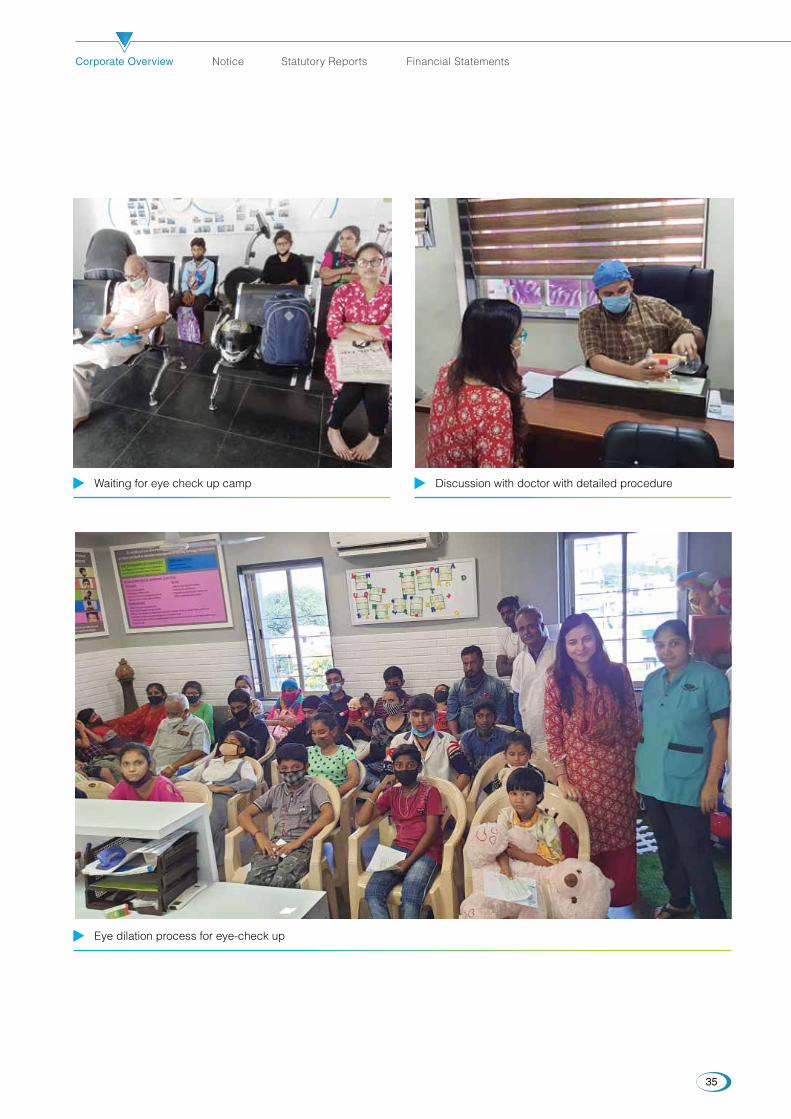
Eye dilation process for eye-check up
Waiting for eye check up camp Discussion with doctor with detailed procedure
35
Corporate Overview Notice Statutory Reports Financial Statements
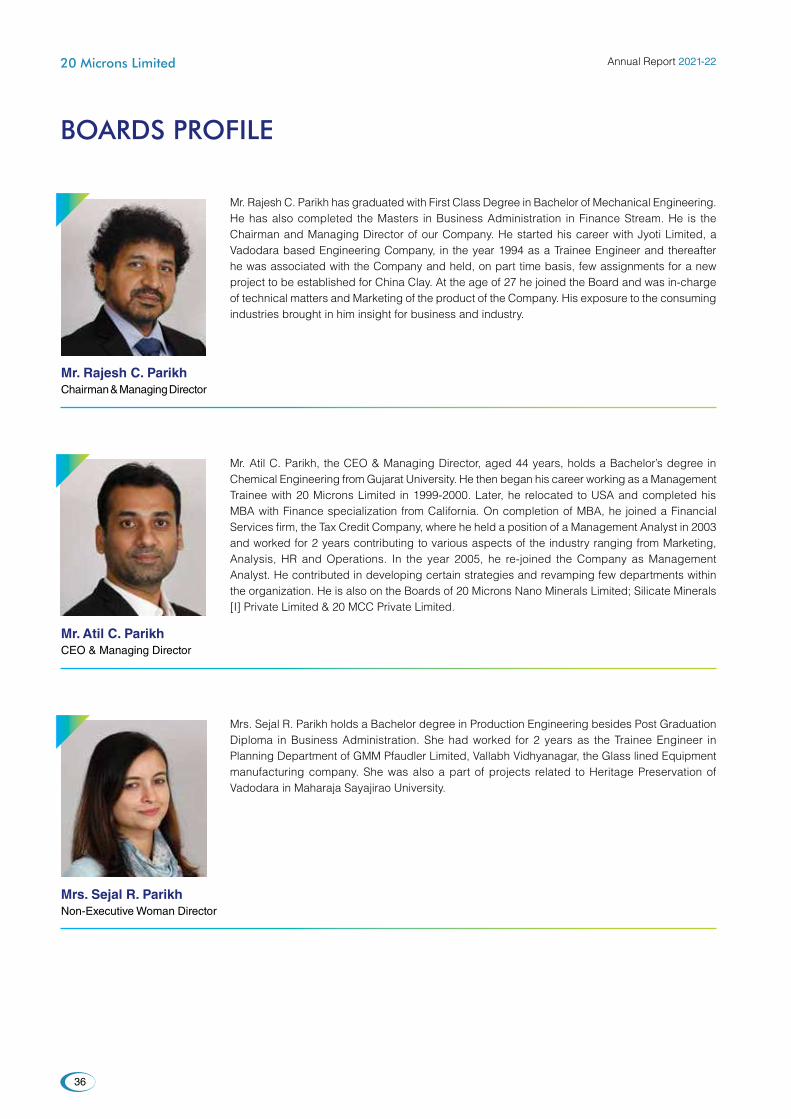
boards profiLe
Mr. Rajesh C. Parikh has graduated with First Class Degree in Bachelor of Mechanical Engineering. He has also completed the Masters in Business Administration in Finance Stream. He is the Chairman and Managing Director of our Company. He started his career with Jyoti Limited, a Vadodara based Engineering Company, in the year 1994 as a Trainee Engineer and thereafter he was associated with the Company and held, on part time basis, few assignments for a new project to be established for China Clay. At the age of 27 he joined the Board and was in-charge of technical matters and Marketing of the product of the Company. His exposure to the consuming industries brought in him insight for business and industry.
Mr. Atil C. Parikh, the CEO & Managing Director, aged 44 years, holds a Bachelor’s degree in Chemical Engineering from Gujarat University. He then began his career working as a Management Trainee with 20 Microns Limited in 1999-2000. Later, he relocated to USA and completed his MBA with Finance specialization from California. On completion of MBA, he joined a Financial Services firm, the Tax Credit Company, where he held a position of a Management Analyst in 2003 and worked for 2 years contributing to various aspects of the industry ranging from Marketing, Analysis, HR and Operations. In the year 2005, he re-joined the Company as Management Analyst. He contributed in developing certain strategies and revamping few departments within the organization. He is also on the Boards of 20 Microns Nano Minerals Limited; Silicate Minerals [I] Private Limited & 20 MCC Private Limited.
Mrs. Sejal R. Parikh holds a Bachelor degree in Production Engineering besides Post Graduation Diploma in Business Administration. She had worked for 2 years as the Trainee Engineer in Planning Department of GMM Pfaudler Limited, Vallabh Vidhyanagar, the Glass lined Equipment manufacturing company. She was also a part of projects related to Heritage Preservation of Vadodara in Maharaja Sayajirao University.
Mr. Rajesh C. ParikhChairman & Managing Director
Mr. Atil C. ParikhCEO & Managing Director
Mrs. Sejal R. ParikhNon-Executive Woman Director
Annual Report 2021-22
36
20 Microns Limited

Mr. Ramkisan A. Devidayal holds a Master’s degree in Commerce and Management. He has rich and extensive experience in the fields of Agrochemicals of about 36 years of which 20 years in the Senior – 1st Line Management of the Companies to which he has been associated as Director. He was the Vice Chairman of Baroda Citizen Council and involved in social activities of many NGOs. He has also been actively attached with various Associations, since last over a Decade, like Chamber of Commerce in Vadodara; Federations of Gujarat Industries; Gujarat Pesticides Formulators; etc. He has travelled widely round the Globe and participated in various International Seminars and led delegations several times. Mr. Ramkisan Devidayal is the Chairman of the Audit Committee of Directors, Nomination and Remuneration Committee of Directors and Stakeholder Relationships and Share Transfer Committee of Directors of the Company.
Mr. Atul H. Patel is a Graduate in Textile Engineering from VJTI, Bombay. He is a Managing Director of Tarak Chemicals Limited, Vadodara engaged in the manufacturing of Oil Field Chemicals and other Specialty Chemicals. He has been deeply involved in the activities of Industrial Association and was closely associated with Federation of Gujarat Industries [FGI, a body looking after interests of the Industries]. He had been President of FGI for 1991 and 1992. He was the President of Vadodara Industrial Employers’ Union for the period 1993-95 and also a Senate member of M.S. University of Baroda. He has also been attached with Charitable Organizations and Educational Institutions, presently the Trustee of United Way of Baroda and the past Chairman of Baroda Citizen Council, a body activist in the development of Baroda City. Besides, he is the Trustee of Gyana Yagna Vidhya Mandir, Atladra – Vadodara and Nar Seva Samaj, Dist. Kheda and also the Director of the Baroda Citizen Community Co-Operative Credit Society Ltd., Vadodara. Mr. Atul Patel is Member of the Audit Committee and Nomination and Remuneration Committee of the Board of Directors of the Company.
Dr. Ajay I. Ranka is Ph.D. in Polymer Science and Engg. from USA besides, a Chemical Engineer. He has worked with PPG Industries, USA, as R & D Specialist. He is recognized as a top-notch scientist for outstanding pioneering work in Polymer Chemistry and Nanotechnology. He has to his credit many American, European and Indian patents. He is associated with many social, business and trade organizations and a staunch supporter of education through philanthropy. He is presently working as Managing Director of Zydex Industries Pvt. Ltd. He is member of Audit Committee of the Company.
Mr. Jaideep B. Verma has bagged BSL, LLB degrees from Symbiosis Law College, Pune. Besides, iploma in Consumer Protection Laws from the University of Pune in 1993-94. Moreover, a Certificate Holder of Course on Patents jointly conducted by Government of Andhra Pradesh and CII. He has the Pan Gujarat Practice in District Courts, Revenue Courts, Consumer Courts, Judicial and quasi-judicial authorities, Documentation and Title Clearance work.
Mr. Ramkisan A. DevidayalIndependent Director
Mr. Atul H. PatelIndependent Director
Dr. Ajay I. RankaIndependent Director
Mr. Jaideep B. VermaIndependent Director
37
Corporate Overview Notice Statutory Reports Financial Statements

Annual Report 2021-22
38
20 Microns Limited
Corporate InformatIon(As on 3rd May, 2022)
Board of DirectorsMr. Rajesh C. Parikh – Chairman & Managing Director
Mr. Atil C. Parikh – CEO & Managing Director
Mrs. Sejal R. Parikh – Director
Mr. Ramkisan A. Devidayal – Independent Director
Mr. Atul H. Patel – Independent Director
Dr. Ajay I. Ranka – Independent Director
Mr. Jaideep B. Verma – Independent Director
Chief Financial OfficerMr. Narendra R. Patel
Company SecretaryMrs. Komal Pandey
Audit CommitteeMr. Ramkisan A. Devidayal – Chairman
Mr. Rajesh C. Parikh – Member
Mr. Atul H. Patel – Member
Dr. Ajay I. Ranka – Member
Nomination & Remuneration CommitteeMr. Ramkisan A. Devidayal – Chairman
Mr. Rajesh C Parikh – Member
Mr. Atul H. Patel – Member
Mr. Jaideep B. Verma – Member
Stakeholders’ Relationship and Share Transfer CommitteeMr. Ramkisan A. Devidayal – Chairman
Mr. Rajesh C. Parikh – Member
Mr. Atil C. Parikh – Member
CSR CommitteeMr. Rajesh C. Parikh – Chairman
Mr. Ramkisan A. Devidayal – Member
Mrs. Sejal R. Parikh – Member
Statutory AuditorsM/s. J.H. Mehta & Co., Chartered AccountantsAhmedabad[upto ensuing Annual General Meeting]
Bankers State Bank of IndiaBank of Baroda
Registered Office9/10, GIDC Industrial Estate,Waghodia – Dist. Vadodara – 391760Gujarat, IndiaE-Mail : [email protected] : +91 7574806350Fax : +91 2668 264003
Corporate Office134-135, Hindustan Kohinoor Industrial Estate,L. B. S. Marg, Vikhroli (W), Mumbai, IndiaTele-Fax : +91 22 25771325 / 1350 / 1333E-Mail : [email protected]
Registrars and Share Transfer AgentsCAMEO CORPORATE SERVICES LIMITED“Subramanian Building”,No. 1, Club House Road,Chennai - 600 002Tel : 044 4002 0734 / 0735Email ID : [email protected]
Websitehttp://www.20microns.com
Company Identification No.L99999GJ1987PLC009768
ISININE144J01027
39
Corporate Overview Notice Statutory Reports Financial Statements
notICe of annUaL GeneraL meetInG
NOTICE is hereby given that the 35th Annual General Meeting of the Shareholders of 20 Microns Limited will be held on Friday, the 22nd day of July, 2022 at 11.00 a.m. at conference room of 347, GIDC Industrial Estate, Waghodia, Dist: Vadodara-391760, Gujarat, India, to transact the following business -
Ordinary Business1. To receive, consider and adopt: a. the Audited Standalone Financial Statements of the
Company for the financial year ended March 31, 2022 including, the Statement of Profit and Loss and Cash Flow Statement for the year ended on that date, together with the Reports of the Board of Directors and the Auditors’ thereon and
b. the Audited Consolidated Financial Statements of the Company for the financial year ended March 31, 2022 including, the Statement of Profit and Loss, together with the Report of the Auditors’ thereon.
2. To appoint a Director in place of Mrs. Sejal R. Parikh (DIN 00140489), who retires by rotation at this Annual General Meeting, in terms of Section 152(6) of the Companies Act, 2013 and being eligible, has offered herself for re-appointment.
3. To appoint M/s. Manubhai & Shah LLP, Chartered Accountants, Ahmedabad as Statutory Auditors of the Company to hold office for a period of 5 (Five) consecutive financial years, from the conclusion of the 35th Annual General Meeting of the Company until the conclusion of the 40th Annual General Meeting of the Company and to authorise the Board of Directors of the Company to fix their remuneration.
To consider and if thought fit, to pass with or without modification(s), the following Resolution as an Ordinary Resolution:
“RESOLVED THAT pursuant to the provisions of Section 139, 142 and other applicable provisions, if any, of the Companies Act, 2013 and the Companies (Audit and Auditors) Rules, 2014 (including any statutory modification, amendment or enactment thereof, for the time being in force), M/s. Manubhai & Shah LLP, Chartered Accountants, Ahmedabad (Firm Registration No.: 106041W/W100136) be and are hereby appointed as Statutory Auditor of the Company in place of M/s. J H Mehta & Co., Chartered Accountants (Firm Registration No. 106227W), the retiring statutory auditor, to hold the office from the conclusion of
the 35th Annual General Meeting until the conclusion of the 40th Annual General Meeting of the Company to be held in the year 2027 at such remuneration plus applicable taxes and reimbursement of out-of-pocket expenses in connection with the Audit as may be mutually agreed between the Board of Directors of the Company and the Auditors.”
Special Business4. To ratify the remuneration of Cost Auditors for the
financial year ending March 31, 2023 and in this regard, pass the following resolution as an Ordinary Resolution:
To consider and if thought fit, to pass the following resolution as an Ordinary Resolution:
“RESOLVED THAT pursuant to the provisions of Section 148 and other applicable provisions, if any, of the Companies Act, 2013 read with the Companies (Audit and Auditors) Rules, 2014 (including any statutory modification(s) or re-enactment(s) thereof, for the time being in force), the remuneration of `90,000 p.a plus applicable taxes and out of pocket expenses, as recommended by the Audit committee and as approved by the Board of Directors to be paid to M/s. Y.S. Thaker & Co., Cost Accountants (Registration Number 000318) appointed by the Board of Directors of the Company, to conduct the audit of cost records of the Company for the financial year ending March 31, 2023, be and is hereby ratified.
5. Revision in remuneration of Mr. Rajesh C Parikh (DIN: 00041610), Chairman and Managing Director
To consider and if thought fit, to pass the following resolution as a Special Resolution:
“RESOLVED THAT in partial modification of special resolution passed at the 34th Annual General Meeting held on 28th September, 2021 for reappointment of Mr. Rajesh C Parikh, Chairman and Managing Director (DIN: 00041610) and pursuant to the provisions of Sections 197, 198 and other applicable provisions, if any, of the Companies Act, 2013 (“the Act”) read with Schedule V of the Act, including any statutory modification(s) or re-enactment thereof, as may be required and such other permissions, sanction(s) as may be required the consent of the Members of the Company, be and is hereby accorded for revision in the remuneration payable to Mr. Rajesh C Parikh,Chairman and Managing Director of the Company with effect from 1st April, 2022 for the remaining period of his present term of appointment upto 31st March, 2025, including
Annual Report 2021-22
40
20 Microns Limited
the remuneration to be paid to him in the event of loss or inadequacy of profits in any financial year during the aforesaid period, as set out in the agreement and as stated below.
I. Basic Salary: `13,57,027/- per month with annual increment up to 25% in the Basic Salary as may be decided by the Nomination & Remuneration Committee and the Board of Directors of the Company from time to time.
II. Perquisites: 19.6% of the Basic Salary. The detailed components of the perquisites shall be worked out by the Company in consultation with Mr. Rajesh C. Parikh.
III. Company’s contribution to Provident Fund, Gratuity and such other benefits as are available to other employees of the Company as per the Company’s rules.
IV. He may be entitled to other benefits as may be available to senior executives.
RESOLVED FURTHER THAT in the event of loss or inadequacy of profits in any financial year, Mr. Rajesh C Parikh shall be entitled to receive remuneration including perquisites, etc. upto the limit as approved by the members herein above, as minimum remuneration.
RESOLVED FURTHER THAT the Board shall have the discretion and authority to modify the aforesaid terms and remuneration within, however, the limit as approved by the members.”
6. Revision in remuneration of Mr. Atil C. Parikh (DIN: 00041712), CEO and Managing Director
To consider and if thought fit, to pass the following resolution as a Special Resolution:
“RESOLVED THAT in partial modification of special resolution passed at the 34th Annual General Meeting held on 28th September, 2021 for reappointment of Mr. Atil C. Parikh, CEO and Managing Director (DIN: 00041712) and pursuant to the provisions of Sections 197, 198 and other applicable provisions, if any, of the Companies Act, 2013 (“the Act”) read with Schedule V of the Act, including any statutory modification(s) or re-enactment thereof, as may be required and such other permissions, sanction(s) as may be required, the consent of the Members of the Company, be and is hereby accorded for revision in the maximum remuneration payable to Mr. Atil C. Parikh, CEO and Managing Director of the Company with effect from 1st April, 2022 for the remaining period of his present
term of appointment upto 31st March, 2025, including the remuneration to be paid to him in the event of loss or inadequacy of profits in any financial year during the aforesaid period, as set out in the agreement and as stated below,
I. Basic Salary: `10,90,160 /- per month with annual increment up to 25% in the Basic Salary as may be decided by the Nomination & Remuneration Committee and the Board of Directors of the Company from time to time.
II. Perquisites: 19.6% of the Basic Salary. The detailed components of the perquisites shall be worked out by the Company in consultation with Mr. Atil C. Parikh.
III. Company’s contribution to Provident Fund, Gratuity and such other benefits as are available to other employees of the Company as per the Company’s rules.
IV. He may be entitled to other benefits as may be available to senior executives.
RESOLVED FURTHER THAT in the event of loss or inadequacy of profits in any financial year, Mr. Atil C. Parikh shall be entitled to receive remuneration including perquisites, etc. upto the limit as approved by the members herein above, as minimum remuneration.
RESOLVED FURTHER THAT the Board shall have the discretion and authority to modify the aforesaid terms and remuneration within, however, the limit as approved by the members.”
7. Payment of Commission to the Non-Executive Directors
To consider and if thought fit, to pass the following resolution as a Special Resolution:
“RESOLVED THAT pursuant to Section 197 (1) (ii) (A) of the Companies Act, 2013 and SEBI (Listing Obligations and Disclosure Requirements) Regulations, 2015, the consent of the Shareholders be and is hereby accorded to pay a commission up to 1% of the net profits of the Company, computed in the manner laid down in Section 198 of the Companies Act, 2013 to all the Non-Executive Directors of the Company for FY 2021-22 as recommended/approved by Nomination & Remuneration Committee and Board of Directors of the Company.”
RESOLVED FURTHER THAT any one of Mr. Rajesh C Parikh, Chairman & Managing Director, Mr. Atil C. Parikh, CEO & Managing Director, CFO & CS of the Company be and are hereby severally authorized to do such acts, deeds

41
Corporate Overview Notice Statutory Reports Financial Statements
and things as may be considered necessary to implement this resolution.”
8. To consider and approve Circular of Unsecured Fixed Deposits Accepted by the Company from shareholders
To consider and if thought fit, to pass the following resolution as a Special Resolution:
“RESOLVED THAT in terms of the provisions of section 73(2) of the Companies Act, 2013 read with Companies [Acceptance of Deposits] Rules, 2014 as may be amended from time to time and the Fixed Deposit Schemes approved by the Shareholders of the Company in their extra-ordinary general meeting held on 22.05.2014, 23.09.2016 & 22.09.2017, consent of the members be and is hereby accorded to the Board of Directors of the Company to invite and accept fixed deposits from the members within limits prescribed in the Act and overall borrowing limits of the Company, as approved by the members from time to time and the draft of the Circular for inviting / accepting Deposits
from the Members and the terms and conditions contained therein and as given in the Explanatory Statement annexed hereto, be and the same is hereby approved.”
“RESOLVED FURTHER THAT the Board of Directors be and is hereby authorised to amend the terms and conditions of the said scheme as and when required and to sign and execute deeds, applications, documents and writings that may be required on behalf of the Company and generally to do all such other acts, deeds, matters and things as may be necessary, proper and expedient or incidental for giving effect to this resolution.”
By Order of the Board of Directors
Komal Pandey Company Secretary Place: Waghodia,Vadodara & Compliance OfficerDate: 03rd May, 2022 ACS: 37092

Annual Report 2021-22
42
20 Microns Limited
Notes:1. A MEMBER ENTITLED TO ATTEND AND VOTE AT
THE MEETING IS ENTITLED TO APPOINT A PROXY TO ATTEND AND VOTE INSTEAD OF HIMSELF/HERSELF AND A PROXY NEED NOT BE A MEMBER OF THE COMPANY.
A person can act as a proxy on behalf of members not exceeding fifty and holding in the aggregate not more than ten percent of the total share capital of the Company carrying voting rights. A member holding more than ten percent of the total share capital of the Company carrying voting rights may appoint a single person as proxy provided such person shall not act as a proxy for any other person or shareholder.
The Proxy form duly completed must reach at the Registered Office of the Company not later than forty-eight hours before the time of holding the meeting.
Members/Proxies should bring duly filled in and signed Attendance Slip sent herewith for attending the Meeting. The Members holding shares in de-materialized form are requested to bring their Client ID and DP ID for easy identification of attendance at the Meeting.
2. Corporate Members intending to send their authorized representatives to attend the Annual General Meeting are requested to send to the Company a certified copy of the Board Resolution authorizing their representative to attend and vote on their behalf at the Meeting.
3. The Registers of Members and Share Transfers shall remain closed from Friday, the 15th day of July, 2022 to Friday, the 22nd day of July, 2022 [both days inclusive].
4. All the work related to share registry in terms of both - physical and electronic - are being conducted by Company’s Registrars & Share Transfer Agents - M/s. Cameo Corporate Services Ltd., “Subramanian Building”, No. 1, Club House Road, Chennai - 600 002. Tel: 044- 4002 0734 / 0735. Email ID - [email protected] . The Shareholders are requested to send their communication to the aforesaid address in future.
5. The Company has appointed Mr. Umesh Parikh failing him Mr. Uday Dave partners of M/s Parikh Dave & Associates., the Practicing Company Secretary, as a Scrutinizer for conducting the e-voting process in a transparent manner.
6. In compliance with provisions of the Companies Act, 2013 the Company is pleased to offer e-voting facility, for all the Shareholders of the Company. For this purpose, the Company has entered into an agreement with NSDL for facilitating e-voting to enable the Shareholders to cast their votes electronically.
7. The Company also provides the facility for voting either through electronic voting system or ballot or polling paper at the meeting and the members attending the meeting
who have not already cast their vote by e-voting shall be able to exercise their Right at the meeting.
8. In accordance with Rule 20 of the Companies (Management and Administration) Amendment Rules,2015, the Company has fixed 15th July, 2022 as the “cut-off date” to determine the eligibility to vote by electronic means in the annual general meeting. A person whose name is recorded in the register of members or in the register of beneficial owners maintained by the depositories as on the cut-off date, i.e. 15th July, 2022, shall be entitled to avail the facility of remote e-voting or voting in the annual general meeting.
9. Pursuant to the provisions of Section 108 of the Companies Act, 2013 read with Rule 20 of the Companies (Management and Administration) Rules, 2014 (as amended) and Regulation 44 of SEBI (Listing Obligations & Disclosure Requirements) Regulations, 2015 (as amended) and the Circulars issued by the Ministry of Corporate Affairs dated April 08, 2020, April 13, 2020 and May 05, 2020 the Company is providing facility of remote e-Voting to its Members in respect of the business to be transacted at the AGM. For this purpose, the Company has entered into an agreement with National Securities Depository Limited (NSDL) for facilitating voting through electronic means, as the authorized agency. The facility of casting votes by a member using remote e-Voting system as well as venue voting on the date of the AGM will be provided by NSDL.
10. In compliance of the aforementioned MCA and SEBI Circulars the Company has sent notice of AGM only through electronic mode only to those shareholders whose e mail addresses are registered with Company or its RTA. In line with the Ministry of Corporate Affairs (MCA) Circular No. 17/2020 dated April 13, 2020, the Notice calling the AGM has been uploaded on the website of the Company at www.20microns.com. The Notice can also be accessed from the websites of the Stock Exchanges i.e. BSE Limited and National Stock Exchange of India Limited at www.bseindia.com and www.nseindia.com respectively and the AGM Notice is also available on the website of NSDL (agency for providing the Remote e-Voting facility) i.e. www.evoting.nsdl.com and on website of the Company www.20microns.com.
11. The Securities and Exchange Board of India (SEBI) has mandated the submission of Permanent Account Number (PAN) by every participant in securities market. Members holding shares in electronic form are, therefore, requested to submit the PAN to their Depository Participants with whom they are maintaining their demat accounts. Members holding shares in physical form can submit their PAN details to the Company or to the Registrar. Securities and Exchange Board of India has prohibited physical transfer of shares w.e.f. 01.04.2019.
12. Members seeking any information with regard to the accounts or any matter to be placed at the AGM, are
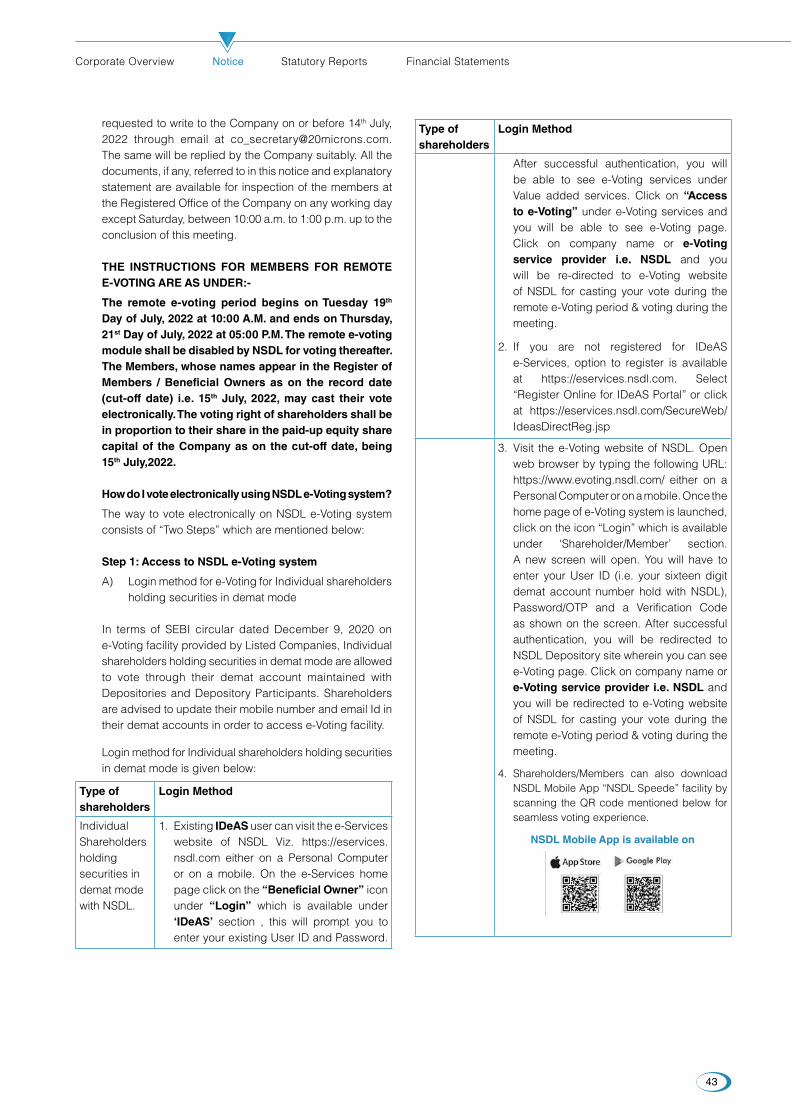
43
Corporate Overview Notice Statutory Reports Financial Statements
requested to write to the Company on or before 14th July, 2022 through email at [email protected]. The same will be replied by the Company suitably. All the documents, if any, referred to in this notice and explanatory statement are available for inspection of the members at the Registered Office of the Company on any working day except Saturday, between 10:00 a.m. to 1:00 p.m. up to the conclusion of this meeting.
THE INSTRUCTIONS FOR MEMBERS FOR REMOTE E-VOTING ARE AS UNDER:-
The remote e-voting period begins on Tuesday 19th Day of July, 2022 at 10:00 A.M. and ends on Thursday, 21st Day of July, 2022 at 05:00 P.M. The remote e-voting module shall be disabled by NSDL for voting thereafter. The Members, whose names appear in the Register of Members / Beneficial Owners as on the record date (cut-off date) i.e. 15th July, 2022, may cast their vote electronically. The voting right of shareholders shall be in proportion to their share in the paid-up equity share capital of the Company as on the cut-off date, being 15th July,2022.
How do I vote electronically using NSDL e-Voting system?
The way to vote electronically on NSDL e-Voting system consists of “Two Steps” which are mentioned below:
Step 1: Access to NSDL e-Voting system
A) Login method for e-Voting for Individual shareholders holding securities in demat mode
In terms of SEBI circular dated December 9, 2020 on e-Voting facility provided by Listed Companies, Individual shareholders holding securities in demat mode are allowed to vote through their demat account maintained with Depositories and Depository Participants. Shareholders are advised to update their mobile number and email Id in their demat accounts in order to access e-Voting facility.
Login method for Individual shareholders holding securities in demat mode is given below:
Type of shareholders
Login Method
Individual Shareholders holding securities in demat mode with NSDL.
1. Existing IDeAS user can visit the e-Services website of NSDL Viz. https://eservices.nsdl.com either on a Personal Computer or on a mobile. On the e-Services home page click on the “Beneficial Owner” icon under “Login” which is available under ‘IDeAS’ section , this will prompt you to enter your existing User ID and Password.
Type of shareholders
Login Method
After successful authentication, you will be able to see e-Voting services under Value added services. Click on “Access to e-Voting” under e-Voting services and you will be able to see e-Voting page. Click on company name or e-Voting service provider i.e. NSDL and you will be re-directed to e-Voting website of NSDL for casting your vote during the remote e-Voting period & voting during the meeting.
2. If you are not registered for IDeAS e-Services, option to register is available at https://eservices.nsdl.com. Select “Register Online for IDeAS Portal” or click at https://eservices.nsdl.com/SecureWeb/IdeasDirectReg.jsp
3. Visit the e-Voting website of NSDL. Open web browser by typing the following URL: https://www.evoting.nsdl.com/ either on a Personal Computer or on a mobile. Once the home page of e-Voting system is launched, click on the icon “Login” which is available under ‘Shareholder/Member’ section. A new screen will open. You will have to enter your User ID (i.e. your sixteen digit demat account number hold with NSDL), Password/OTP and a Verification Code as shown on the screen. After successful authentication, you will be redirected to NSDL Depository site wherein you can see e-Voting page. Click on company name or e-Voting service provider i.e. NSDL and you will be redirected to e-Voting website of NSDL for casting your vote during the remote e-Voting period & voting during the meeting.
4. Shareholders/Members can also download NSDL Mobile App “NSDL Speede” facility by scanning the QR code mentioned below for seamless voting experience.
NSDL Mobile App is available on
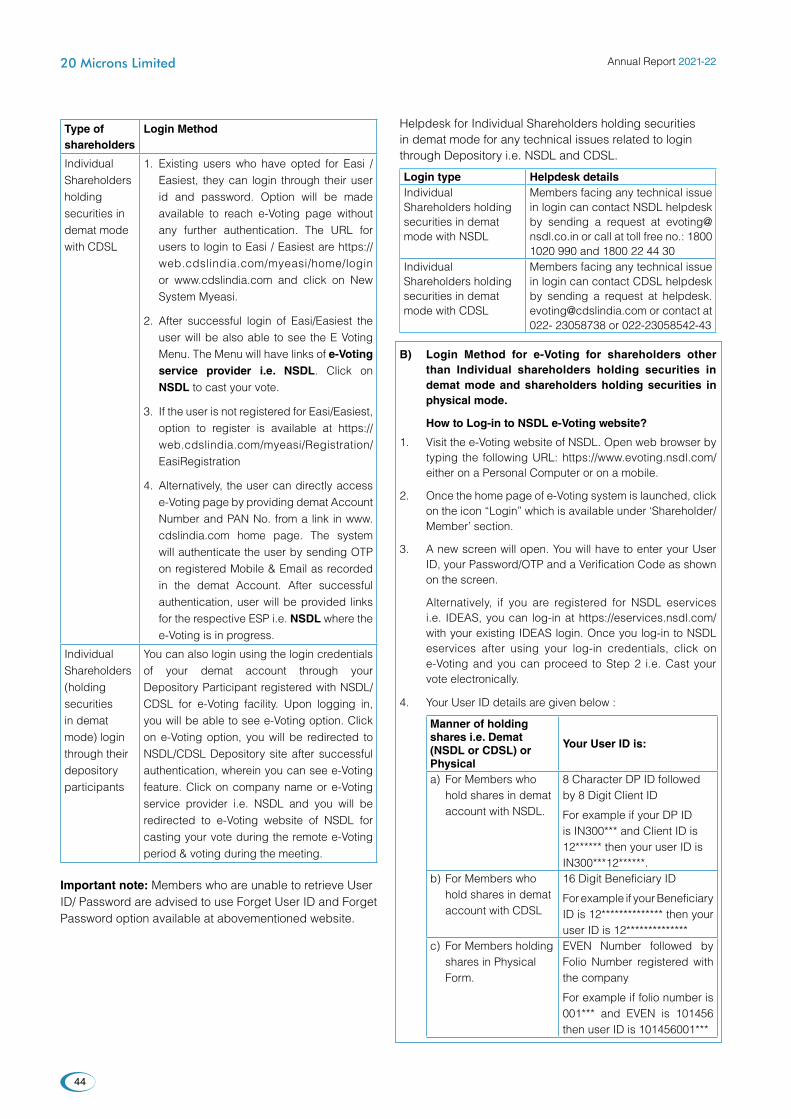
Annual Report 2021-22
44
20 Microns Limited
Type of shareholders
Login Method
Individual Shareholders holding securities in demat mode with CDSL
1. Existing users who have opted for Easi / Easiest, they can login through their user id and password. Option will be made available to reach e-Voting page without any further authentication. The URL for users to login to Easi / Easiest are https://web.cdslindia.com/myeasi/home/login or www.cdslindia.com and click on New System Myeasi.
2. After successful login of Easi/Easiest the user will be also able to see the E Voting Menu. The Menu will have links of e-Voting service provider i.e. NSDL. Click on NSDL to cast your vote.
3. If the user is not registered for Easi/Easiest, option to register is available at https://web.cdslindia.com/myeasi/Registration/EasiRegistration
4. Alternatively, the user can directly access e-Voting page by providing demat Account Number and PAN No. from a link in www.cdslindia.com home page. The system will authenticate the user by sending OTP on registered Mobile & Email as recorded in the demat Account. After successful authentication, user will be provided links for the respective ESP i.e. NSDL where the e-Voting is in progress.
Individual Shareholders (holding securities in demat mode) login through their depository participants
You can also login using the login credentials of your demat account through your Depository Participant registered with NSDL/CDSL for e-Voting facility. Upon logging in, you will be able to see e-Voting option. Click on e-Voting option, you will be redirected to NSDL/CDSL Depository site after successful authentication, wherein you can see e-Voting feature. Click on company name or e-Voting service provider i.e. NSDL and you will be redirected to e-Voting website of NSDL for casting your vote during the remote e-Voting period & voting during the meeting.
Important note: Members who are unable to retrieve User ID/ Password are advised to use Forget User ID and Forget Password option available at abovementioned website.
Helpdesk for Individual Shareholders holding securities in demat mode for any technical issues related to login through Depository i.e. NSDL and CDSL.
Login type Helpdesk detailsIndividual Shareholders holding securities in demat mode with NSDL
Members facing any technical issue in login can contact NSDL helpdesk by sending a request at [email protected] or call at toll free no.: 1800 1020 990 and 1800 22 44 30
Individual Shareholders holding securities in demat mode with CDSL
Members facing any technical issue in login can contact CDSL helpdesk by sending a request at [email protected] or contact at 022- 23058738 or 022-23058542-43
B) Login Method for e-Voting for shareholders other than Individual shareholders holding securities in demat mode and shareholders holding securities in physical mode.
How to Log-in to NSDL e-Voting website?
1. Visit the e-Voting website of NSDL. Open web browser by typing the following URL: https://www.evoting.nsdl.com/ either on a Personal Computer or on a mobile.
2. Once the home page of e-Voting system is launched, click on the icon “Login” which is available under ‘Shareholder/Member’ section.
3. A new screen will open. You will have to enter your User ID, your Password/OTP and a Verification Code as shown on the screen.
Alternatively, if you are registered for NSDL eservices i.e. IDEAS, you can log-in at https://eservices.nsdl.com/ with your existing IDEAS login. Once you log-in to NSDL eservices after using your log-in credentials, click on e-Voting and you can proceed to Step 2 i.e. Cast your vote electronically.
4. Your User ID details are given below :
Manner of holding shares i.e. Demat (NSDL or CDSL) or Physical
Your User ID is:
a) For Members who hold shares in demat account with NSDL.
8 Character DP ID followed by 8 Digit Client ID
For example if your DP ID is IN300*** and Client ID is 12****** then your user ID is IN300***12******.
b) For Members who hold shares in demat account with CDSL
16 Digit Beneficiary ID
For example if your Beneficiary ID is 12************** then your user ID is 12**************
c) For Members holding shares in Physical Form.
EVEN Number followed by Folio Number registered with the company
For example if folio number is 001*** and EVEN is 101456 then user ID is 101456001***
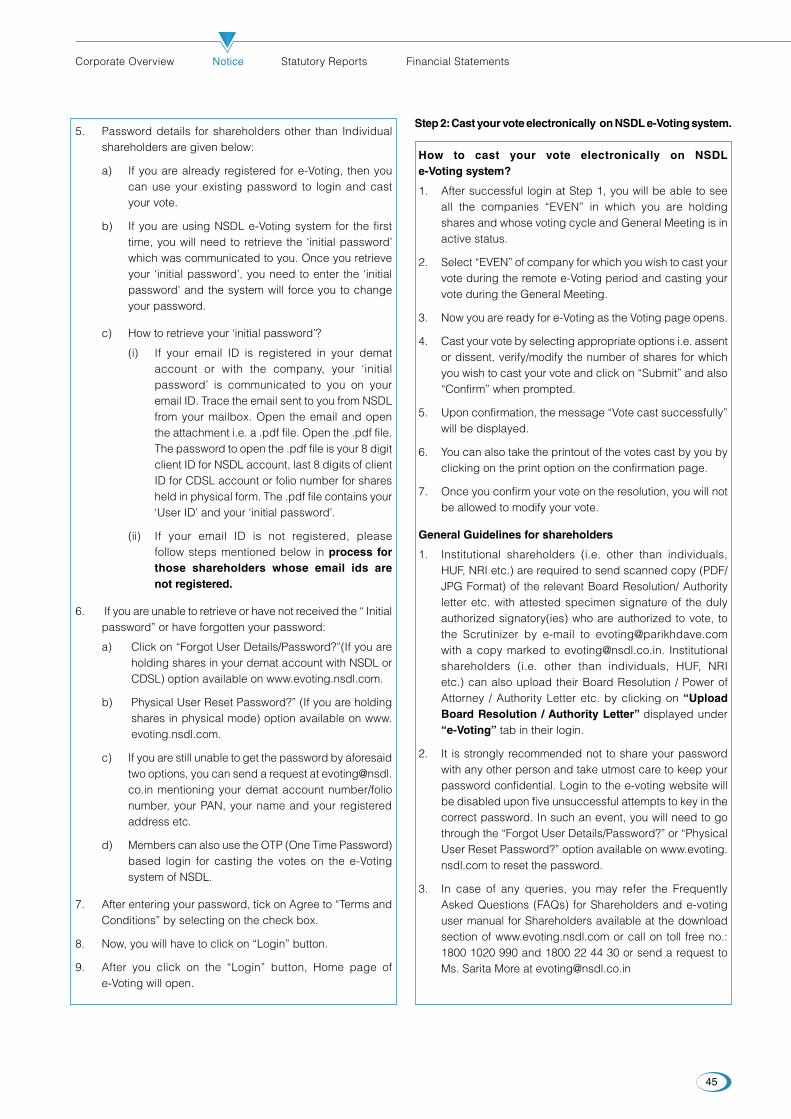
45
Corporate Overview Notice Statutory Reports Financial Statements
5. Password details for shareholders other than Individual shareholders are given below:
a) If you are already registered for e-Voting, then you can use your existing password to login and cast your vote.
b) If you are using NSDL e-Voting system for the first time, you will need to retrieve the ‘initial password’ which was communicated to you. Once you retrieve your ‘initial password’, you need to enter the ‘initial password’ and the system will force you to change your password.
c) How to retrieve your ‘initial password’?
(i) If your email ID is registered in your demat account or with the company, your ‘initial password’ is communicated to you on your email ID. Trace the email sent to you from NSDL from your mailbox. Open the email and open the attachment i.e. a .pdf file. Open the .pdf file. The password to open the .pdf file is your 8 digit client ID for NSDL account, last 8 digits of client ID for CDSL account or folio number for shares held in physical form. The .pdf file contains your ‘User ID’ and your ‘initial password’.
(ii) If your email ID is not registered, please follow steps mentioned below in process for those shareholders whose email ids are not registered.
6. If you are unable to retrieve or have not received the “ Initial password” or have forgotten your password:
a) Click on “Forgot User Details/Password?”(If you are holding shares in your demat account with NSDL or CDSL) option available on www.evoting.nsdl.com.
b) Physical User Reset Password?” (If you are holding shares in physical mode) option available on www.evoting.nsdl.com.
c) If you are still unable to get the password by aforesaid two options, you can send a request at [email protected] mentioning your demat account number/folio number, your PAN, your name and your registered address etc.
d) Members can also use the OTP (One Time Password) based login for casting the votes on the e-Voting system of NSDL.
7. After entering your password, tick on Agree to “Terms and Conditions” by selecting on the check box.
8. Now, you will have to click on “Login” button.
9. After you click on the “Login” button, Home page of e-Voting will open.
Step 2: Cast your vote electronically on NSDL e-Voting system.
How to cast your vote electronically on NSDL e-Voting system?
1. After successful login at Step 1, you will be able to see all the companies “EVEN” in which you are holding shares and whose voting cycle and General Meeting is in active status.
2. Select “EVEN” of company for which you wish to cast your vote during the remote e-Voting period and casting your vote during the General Meeting.
3. Now you are ready for e-Voting as the Voting page opens.
4. Cast your vote by selecting appropriate options i.e. assent or dissent, verify/modify the number of shares for which you wish to cast your vote and click on “Submit” and also “Confirm” when prompted.
5. Upon confirmation, the message “Vote cast successfully” will be displayed.
6. You can also take the printout of the votes cast by you by clicking on the print option on the confirmation page.
7. Once you confirm your vote on the resolution, you will not be allowed to modify your vote.
General Guidelines for shareholders
1. Institutional shareholders (i.e. other than individuals, HUF, NRI etc.) are required to send scanned copy (PDF/JPG Format) of the relevant Board Resolution/ Authority letter etc. with attested specimen signature of the duly authorized signatory(ies) who are authorized to vote, to the Scrutinizer by e-mail to [email protected] with a copy marked to [email protected]. Institutional shareholders (i.e. other than individuals, HUF, NRI etc.) can also upload their Board Resolution / Power of Attorney / Authority Letter etc. by clicking on “Upload Board Resolution / Authority Letter” displayed under “e-Voting” tab in their login.
2. It is strongly recommended not to share your password with any other person and take utmost care to keep your password confidential. Login to the e-voting website will be disabled upon five unsuccessful attempts to key in the correct password. In such an event, you will need to go through the “Forgot User Details/Password?” or “Physical User Reset Password?” option available on www.evoting.nsdl.com to reset the password.
3. In case of any queries, you may refer the Frequently Asked Questions (FAQs) for Shareholders and e-voting user manual for Shareholders available at the download section of www.evoting.nsdl.com or call on toll free no.: 1800 1020 990 and 1800 22 44 30 or send a request to Ms. Sarita More at [email protected]

Annual Report 2021-22
46
20 Microns Limited
Process for those shareholders whose email ids are not registered with the depositories for procuring user id and password and registration of e mail ids for e-voting for the resolutions set out in this notice:
1. In case shares are held in physical mode please provide Folio No., Name of shareholder, scanned copy of the share certificate (front and back), PAN (self attested scanned copy of PAN card), AADHAR (self attested scanned copy of Aadhar Card) by email to [email protected]
2. In case shares are held in demat mode, please provide DPID-CLID (16 digit DPID + CLID or 16 digit beneficiary ID), Name, client master or copy of Consolidated Account statement, PAN (self attested scanned copy of PAN card), AADHAR (self attested scanned copy of Aadhar Card) to [email protected]. If you are an Individual shareholders holding securities in demat mode, you are requested to refer to the login method explained at step 1 (A) i.e. Login method for e-Voting for Individual shareholders holding securities in demat mode.
3. Alternatively shareholder/members may send a request to [email protected] for procuring user id and password for e-voting by providing above mentioned documents.
4. In terms of SEBI circular dated December 9, 2020 on e-Voting facility provided by Listed Companies, Individual shareholders holding securities in demat mode are allowed to vote through their demat account maintained with Depositories and Depository Participants. Shareholders are required to update their mobile number and email ID correctly in their demat account in order to access e-Voting facility.
THE INSTRUCTIONS FOR MEMBERS FOR e-VOTING ON THE DAY OF THE AGM ARE AS UNDER:-
1. The procedure for e-Voting on the day of the AGM is same as the instructions mentioned above for remote e-voting.
2. Only those Members/ shareholders, who will be present in the AGM and have not casted their vote on the Resolutions through remote e-Voting and are otherwise not barred from doing so, shall be eligible to vote through e-Voting system in the AGM.
3. Members who have voted through Remote e-Voting will be eligible to attend the AGM. However, they will not be eligible to vote at the AGM.
4. The details of the person who may be contacted for any grievances connected with the facility for e-Voting on the day of the AGM shall be the same person mentioned for Remote e-voting.
The scrutinizer shall, give their consolidated Scrutinizer report of the total votes cast in favour or against the resolutions proposed in the notice of Annual General Meeting not later than two working days from conclusion of the meeting, to the Chairman or a person authorized by him in writing who shall countersign the same.
The Results will be declared on receipt of Scrutinizer’s Report at the Registered office of the Company. The Results declared along with the Scrutinizer’s Report shall be placed on the Company’s website www.20microns.com and will be submitted to Stock exchanges and depositories.
By Order of the Board of Directors
Komal Pandey Company Secretary & Compliance Officer ACS: 37092Place: Waghodia,VadodaraDate: 03rd May, 2022

47
Corporate Overview Notice Statutory Reports Financial Statements
EXPLANATORY STATEMENT PURSUANT TO THE PROVISIONS OF SECTION 102 OF THE COMPANIES ACT, 2013
Item No.3M/s. J H Mehta & Co., Chartered Accountants (Firm Registration No. 106227W) were appointed as statutory auditors of the company at the 30th AGM of the Company. In terms of their appointment made at the 30th AGM held on 05.08.2014, they are holding office as statutory auditors up to the conclusion of the 35th AGM and hence, would retire at the conclusion of the ensuing 35th AGM.
It is proposed to appoint M/s. Manubhai & Shah LLP, Chartered Accountants, Ahmedabad (Firm Registration No. 106041W/W100136) as statutory auditors of the company for a period of 5 years, commencing from the conclusion of 35th AGM till the conclusion of the 40th AGM, in place of retiring auditors.
M/s. Manubhai & Shah LLP, Chartered Accountants, have consented to the said appointment and confirmed that their appointment, if made, would be within the limits specified under Section 141(3)(g) of the Act. They have further confirmed that they are not disqualified to be appointed as statutory auditors in terms of the provisions of Section 139(1), Section 141(2) and Section 141(3) of the Act and the provisions of the Companies (Audit and Auditors) Rules, 2014. Accordingly, Board of Directors upon recommendation of Audit Committee has proposed resolution to be passed as an Ordinary Resolution.
Proposed statutory audit fee payable to auditors
Up to `12.95 lakhs of statutory audit fees for the period ending 31 March, 2023 in aggregate for the statutory auditors of the company as may be decided by the Board of Directors including any committee thereof.
Terms of appointment
Appointed for a period of Five years
Material change in fee payable
–
Basis of recommendation and auditor credentials
The same has been recommended by Audit Committee and Board of Directors.
Brief profile of Statutory Auditor is as follow:Manubhai & Shah LLP (the firm) was established in 1945 and having Head Office at Ahmedabad and branches at Ghaziabad (NCR), Mumbai, Vadodara, GIFT City (Gandhinagar), Rajkot and Udaipur. The firm has 17 partners with a staff strength of more than 700.
The firm’s audit services are reviewed by Peer Reviewers appointed by The Institute of Chartered Accountants of India. The firm has also been accredited with ISO 9001 certifications for its Quality Management Systems.
The firm is on the panel of consultants maintained by the World Bank, Asian Development Bank, Reserve Bank of India, Comptroller and Auditor General of India, Securities and Exchange Board of India, Government Departments, various regulatory bodies and institutions.
The firm provides services to clients in a broad spectrum of trade and industries as well as non-profit organizations catering to industry sectors such as banking & finance, infrastructure, manufacturing and services. The client groups include private and public sector corporates, government and semi government agencies, partnership firms and high net worth individuals.
None of the Directors/Key Managerial Personnel of the Company and their relatives are concerned or interested, financially or otherwise in the resolution set out at Item No. 3 of the notice.
The Board recommends the Resolution at Item No. 3 to be passed as an ordinary resolution.
Item No. 4M/s. Y.S Thaker & Co., Cost Accountants have been reappointed as the Cost Auditors of the Company for the Financial Year 2022-23 by the Board of Directors of the Company at its meeting held on 03rd May, 2022. The Board has on the recommendations of Audit Committee fixed remuneration of ̀ 90,000/- (Rupees Ninety Thousand only) plus Govt. Levies/Taxes as applicable and out of pocket expenses at actual. XBRL conversion charges, if any, would be levied extra. In terms of Section 148 of the Companies Act, 2013 and the Companies (Audit and Auditors) Rules, 2014, the remuneration of the Cost Auditors as fixed by the Board of Directors shall be ratified by the members.
In view of the same the Board of Directors of the Company recommends passing of the proposed resolution.
None of the Directors/Key Managerial Personnel of the Company/ their relatives, in any way, concerned or interested, financially or otherwise in the Resolution set out at item No. 4 of the Notice.
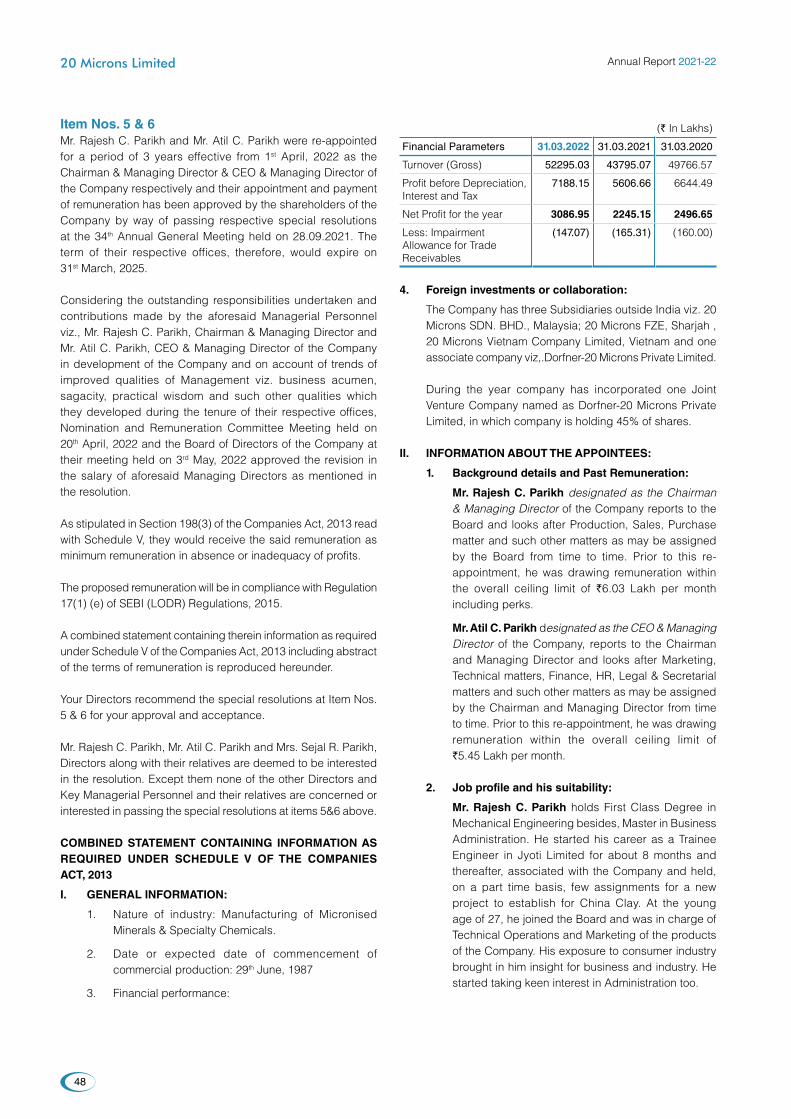
Annual Report 2021-22
48
20 Microns Limited
Item Nos. 5 & 6Mr. Rajesh C. Parikh and Mr. Atil C. Parikh were re-appointed for a period of 3 years effective from 1st April, 2022 as the Chairman & Managing Director & CEO & Managing Director of the Company respectively and their appointment and payment of remuneration has been approved by the shareholders of the Company by way of passing respective special resolutions at the 34th Annual General Meeting held on 28.09.2021. The term of their respective offices, therefore, would expire on 31st March, 2025.
Considering the outstanding responsibilities undertaken and contributions made by the aforesaid Managerial Personnel viz., Mr. Rajesh C. Parikh, Chairman & Managing Director and Mr. Atil C. Parikh, CEO & Managing Director of the Company in development of the Company and on account of trends of improved qualities of Management viz. business acumen, sagacity, practical wisdom and such other qualities which they developed during the tenure of their respective offices, Nomination and Remuneration Committee Meeting held on 20th April, 2022 and the Board of Directors of the Company at their meeting held on 3rd May, 2022 approved the revision in the salary of aforesaid Managing Directors as mentioned in the resolution.
As stipulated in Section 198(3) of the Companies Act, 2013 read with Schedule V, they would receive the said remuneration as minimum remuneration in absence or inadequacy of profits.
The proposed remuneration will be in compliance with Regulation 17(1) (e) of SEBI (LODR) Regulations, 2015.
A combined statement containing therein information as required under Schedule V of the Companies Act, 2013 including abstract of the terms of remuneration is reproduced hereunder.
Your Directors recommend the special resolutions at Item Nos. 5 & 6 for your approval and acceptance.
Mr. Rajesh C. Parikh, Mr. Atil C. Parikh and Mrs. Sejal R. Parikh, Directors along with their relatives are deemed to be interested in the resolution. Except them none of the other Directors and Key Managerial Personnel and their relatives are concerned or interested in passing the special resolutions at items 5&6 above.
COMBINED STATEMENT CONTAINING INFORMATION AS REQUIRED UNDER SCHEDULE V OF THE COMPANIES ACT, 2013
I. GENERAL INFORMATION:
1. Nature of industry: Manufacturing of Micronised Minerals & Specialty Chemicals.
2. Date or expected date of commencement of commercial production: 29th June, 1987
3. Financial performance:
(` In Lakhs)
Financial Parameters 31.03.2022 31.03.2021 31.03.2020
Turnover (Gross) 52295.03 43795.07 49766.57
Profit before Depreciation, Interest and Tax
7188.15 5606.66 6644.49
Net Profit for the year 3086.95 2245.15 2496.65
Less: Impairment Allowance for Trade Receivables
(147.07) (165.31) (160.00)
4. Foreign investments or collaboration:
The Company has three Subsidiaries outside India viz. 20 Microns SDN. BHD., Malaysia; 20 Microns FZE, Sharjah , 20 Microns Vietnam Company Limited, Vietnam and one associate company viz,.Dorfner-20 Microns Private Limited.
During the year company has incorporated one Joint Venture Company named as Dorfner-20 Microns Private Limited, in which company is holding 45% of shares.
II. INFORMATION ABOUT THE APPOINTEES:
1. Background details and Past Remuneration:
Mr. Rajesh C. Parikh designated as the Chairman & Managing Director of the Company reports to the Board and looks after Production, Sales, Purchase matter and such other matters as may be assigned by the Board from time to time. Prior to this re-appointment, he was drawing remuneration within the overall ceiling limit of `6.03 Lakh per month including perks.
Mr. Atil C. Parikh designated as the CEO & Managing Director of the Company, reports to the Chairman and Managing Director and looks after Marketing, Technical matters, Finance, HR, Legal & Secretarial matters and such other matters as may be assigned by the Chairman and Managing Director from time to time. Prior to this re-appointment, he was drawing remuneration within the overall ceiling limit of `5.45 Lakh per month.
2. Job profile and his suitability:
Mr. Rajesh C. Parikh holds First Class Degree in Mechanical Engineering besides, Master in Business Administration. He started his career as a Trainee Engineer in Jyoti Limited for about 8 months and thereafter, associated with the Company and held, on a part time basis, few assignments for a new project to establish for China Clay. At the young age of 27, he joined the Board and was in charge of Technical Operations and Marketing of the products of the Company. His exposure to consumer industry brought in him insight for business and industry. He started taking keen interest in Administration too.
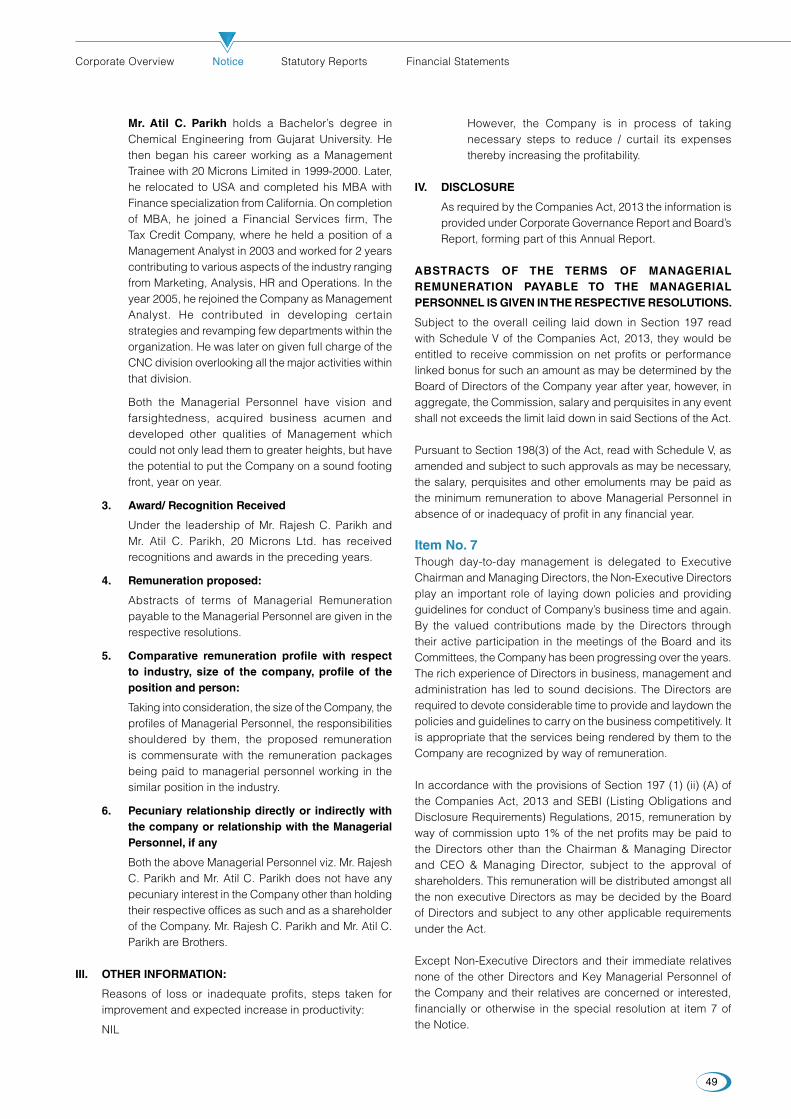
49
Corporate Overview Notice Statutory Reports Financial Statements
Mr. Atil C. Parikh holds a Bachelor’s degree in Chemical Engineering from Gujarat University. He then began his career working as a Management Trainee with 20 Microns Limited in 1999-2000. Later, he relocated to USA and completed his MBA with Finance specialization from California. On completion of MBA, he joined a Financial Services firm, The Tax Credit Company, where he held a position of a Management Analyst in 2003 and worked for 2 years contributing to various aspects of the industry ranging from Marketing, Analysis, HR and Operations. In the year 2005, he rejoined the Company as Management Analyst. He contributed in developing certain strategies and revamping few departments within the organization. He was later on given full charge of the CNC division overlooking all the major activities within that division.
Both the Managerial Personnel have vision and farsightedness, acquired business acumen and developed other qualities of Management which could not only lead them to greater heights, but have the potential to put the Company on a sound footing front, year on year.
3. Award/ Recognition Received
Under the leadership of Mr. Rajesh C. Parikh and Mr. Atil C. Parikh, 20 Microns Ltd. has received recognitions and awards in the preceding years.
4. Remuneration proposed:
Abstracts of terms of Managerial Remuneration payable to the Managerial Personnel are given in the respective resolutions.
5. Comparative remuneration profile with respect to industry, size of the company, profile of the position and person:
Taking into consideration, the size of the Company, the profiles of Managerial Personnel, the responsibilities shouldered by them, the proposed remuneration is commensurate with the remuneration packages being paid to managerial personnel working in the similar position in the industry.
6. Pecuniary relationship directly or indirectly with the company or relationship with the Managerial Personnel, if any
Both the above Managerial Personnel viz. Mr. Rajesh C. Parikh and Mr. Atil C. Parikh does not have any pecuniary interest in the Company other than holding their respective offices as such and as a shareholder of the Company. Mr. Rajesh C. Parikh and Mr. Atil C. Parikh are Brothers.
III. OTHER INFORMATION:
Reasons of loss or inadequate profits, steps taken for improvement and expected increase in productivity:
NIL
However, the Company is in process of taking necessary steps to reduce / curtail its expenses thereby increasing the profitability.
IV. DISCLOSURE
As required by the Companies Act, 2013 the information is provided under Corporate Governance Report and Board’s Report, forming part of this Annual Report.
ABSTRACTS OF THE TERMS OF MANAGERIAL REMUNERATION PAYABLE TO THE MANAGERIAL PERSONNEL IS GIVEN IN THE RESPECTIVE RESOLUTIONS.
Subject to the overall ceiling laid down in Section 197 read with Schedule V of the Companies Act, 2013, they would be entitled to receive commission on net profits or performance linked bonus for such an amount as may be determined by the Board of Directors of the Company year after year, however, in aggregate, the Commission, salary and perquisites in any event shall not exceeds the limit laid down in said Sections of the Act.
Pursuant to Section 198(3) of the Act, read with Schedule V, as amended and subject to such approvals as may be necessary, the salary, perquisites and other emoluments may be paid as the minimum remuneration to above Managerial Personnel in absence of or inadequacy of profit in any financial year.
Item No. 7Though day-to-day management is delegated to Executive Chairman and Managing Directors, the Non-Executive Directors play an important role of laying down policies and providing guidelines for conduct of Company’s business time and again. By the valued contributions made by the Directors through their active participation in the meetings of the Board and its Committees, the Company has been progressing over the years. The rich experience of Directors in business, management and administration has led to sound decisions. The Directors are required to devote considerable time to provide and laydown the policies and guidelines to carry on the business competitively. It is appropriate that the services being rendered by them to the Company are recognized by way of remuneration.
In accordance with the provisions of Section 197 (1) (ii) (A) of the Companies Act, 2013 and SEBI (Listing Obligations and Disclosure Requirements) Regulations, 2015, remuneration by way of commission upto 1% of the net profits may be paid to the Directors other than the Chairman & Managing Director and CEO & Managing Director, subject to the approval of shareholders. This remuneration will be distributed amongst all the non executive Directors as may be decided by the Board of Directors and subject to any other applicable requirements under the Act.
Except Non-Executive Directors and their immediate relatives none of the other Directors and Key Managerial Personnel of the Company and their relatives are concerned or interested, financially or otherwise in the special resolution at item 7 of the Notice.

Annual Report 2021-22
50
20 Microns Limited
Your Directors recommend the Resolution at item no. 7 to the notice, for your approval.
Item No. 8To consider and approve Circular of Unsecured Fixed Deposits Accepted by the CompanyThe Company has availed necessary approval from shareholders in its meeting held on 22.05.2014, 23.09.2016 & 22.09.2017 for approval of scheme of unsecured fixed deposit accepted from shareholders of the Company including change in interest rate
complying with the provision of Section 73(2) of the Companies Act, 2013 and rules made there under.
In terms of the provisions of the Companies Act, 2013 and Companies [Acceptance of Deposits] Rules, 2014 and the relevant Notifications/Circulars/Rules etc. the Company is required to obtain approval of its Shareholders to the above proposal for any change in the unsecured fixed deposits being accepted by the Company and therefore, the Special Resolution at item No. 8 is recommended for your approval.
The draft of the Circular for inviting / accepting Deposits from the Members is given hereunder :
CIRCULAR FOR ACCEPTANCE OF UNSECURED FIXED DEPOSITS FROM SHAREHOLDERS ONLY
[Pursuant to Section 73 (2)(a) and Rules 4(1) and 4(2) of the Companies (Acceptance of Deposits) Rules, 2014]
1. GENERAL INFORMATIONA. Name of Company 20 Microns Ltd.
9/10, GIDC Industrial Estate, Waghodia, Dist. Vadodara (Gujarat)Phone No. – 02668 - 264006 Fax No. 02668 - 264003Email ID – [email protected] – www.20microns.com
B. Date of Incorporation 29th June, 1987
C. Business carried on by the Company The Company is engaged in Manufacturing, Selling and Export of Micronized Minerals
D. Name of Subsidiaries & Associates 1. 20 Microns Nano Minerals Ltd2. 20 Microns FZE3. 20 Microns SDN. BHD.4. 20 Microns Vietnam Co. Ltd.5. 20 MCC Pvt. Ltd.6. Dorfner-20 Microns Pvt. Ltd.
E. Branches Vadodara, Waghodia, Vadadala, Chhota-Udaipur, Bhuj, Mumbai, Kolkata, Delhi, Chennai, Hosur, Udaipur, Alwar
F. Brief particulars of Management of the Company
The Company is managed by the Board of Directors.
G. Name, Address, Occupation and DIN of the Directors-
Name of Directors Address Occupation DIN
Mr. Rajesh C. Parikh Chairman & Managing Director
B-604, Bhadralok Apartment,Near Tube Company, Old Padra Road, Vadodara - 390 015
Businessman 00041610
Mr. Atil C. Parikh CEO & Managing Director
B-201, Silver Springs CHSL, Lokhandwala Complex, Andheri [West], Mumbai – 400 053.
Businessman 00041712
Mrs. Sejal R. ParikhDirector
604-B, Bhadralok Apartment,Near Tube Company, Old Padra Road, Vadodara - 390 015
Businessman 00238853
Mr. Ramkisan A. Devidayal Independent Director
33, Alkapuri Society, Alkapuri, Vadodara - 390 007 Businessman 00238853
Mr. Atul H. PatelIndependent Director
1 - 2, Akashvan Bunglows, Gotri - Sevasi Road,Vadodara - 391 101
Businessman 00009587
Dr. Ajay I. RankaIndependent Director
9/10, Akshwan Complex, Sevasi Vadodara – 391 101 Businessman 01676073
Mr. Jaideep B. VermaIndependent Director
Nirvaan, Opp. SRP Group-9, Makarpura Road, ONGC Col., Vadodara – 390 009
Professional 00323385
H. Management Perception of risk factors:- The deposits accepted by the company are unsecured and rank pari passu with other unsecured liabilities of the company.
Pursuant to the provisions of The Companies (Amendment) Act, 2017, now companies accepting deposits need not to take insurance for the deposits accepted by it.

51
Corporate Overview Notice Statutory Reports Financial Statements
The Company has not made any default in a. repayment of Deposits or interest thereon b. payment of statutory dues c. repayment of debentures of interest thereon d. Loan from Bank or Financial Institution and interest thereon
2. PARTICULARS OF DEPOSIT SCHEME
A. Date of Passing Board Resolution 10.04.2014, 08.08.2016, 22.05.2017, 21.04.2018,28.05.2019,08.06.2020,28.06.2021, 21.01.2022 & 03.05.2022
B. Date of Passing Resolution at General Meeting 24.05.2014, 23.09.2016, 22.09.2017
C. Type of Deposits Unsecured
D. Amount of Deposit the Company can raise by way of deposit as per the provisions of Companies Act, 2013 and Rules made thereunder
Deposits shall be accepted from the Share Holders / Members only upto 35% of aggregate of Paid Up share Capital, Free Reserves and Security Premium Account of the Company
E. The aggregate of deposits actually held on the last date of immediately preceding Financial Year i.e. 31st March, 2021 & as on date of issue of this Circular as per Companies Act, 2013 & Rules made thereunder-
(` in Lakhs)
Deposits held as on 31.03.2021 Deposits held as on 31.03.2022
From Shareholders 3195.2 3246.93
TOTAL 3195.2 3246.93
The amount which the company can raise under the Companies Act, 2013 and Companies (Acceptance of Deposit) Rules, 2014
From Shareholders ONLY – `61,23,06,358
Amount of Deposit repayable during FY 2022-23 `1673.70 Lakhs (01.04.2022 TO 31.03.2023)
F. Terms of Raising of Deposits:-
• Rate of Interest
SCHEME
Cumulative Deposit Plan - Interest payable on Maturity
Period Minimum ROI (P.A) %
Yield ROI (P.A) % (SC)
Yield (SC)Months Deposit `
12
50,000
7.25 7.38 7.50 7.64
24 7.75 8.21 8.00 8.49
36 8.25 9.15 8.50 9.46
(SC) = Senior Citizens
• THE COMPANY WILL ACCEPT UNSECURED FIXED DEPOSITS FROM ITS SHAREHOLDERS ONLY.
• In case of cumulative deposits, interest will be compounded on half yearly basis.
• No tax will be deducted at source on interest payment up to `5000/-in aggregate per annum.
• Outstation depositors may send demand drafts/cheques payable at VADODARA only
• Postdated interest warrants will be provided once in each financial year for yearly interest on unsecured deposits scheme.
• Interest will be paid at par at selected centers across the country.
• Senior citizens are required to submit any documents like (i) PAN card (ii) Driving License (iii) Passport copy (iv) Voter Card along with their application for unsecured deposits.
• Unsecured Deposit of Minimum amount stipulated in above Scheme held continuously for a period of 12, 24 or 36 Months can be renewed on maturity on receipt of duly signed prescribed request letter from shareholder within a time period of 30 days. In case no request is received from shareholder for the renewal of deposit within the timeline then the same will be repaid after a period of 30 days in their respective Bank Account held with the company.
• If any request is being received after a period of 30 days for the renewal of deposit , then it is upon the discretion of Management on case to case basis to process the said request or not.
• The First named Depositor will be regarded as the beneficial owner of the unsecured deposit and will be treated as the payee for the purpose of deduction of tax under Section 194A of the Income Tax Act, 1961.
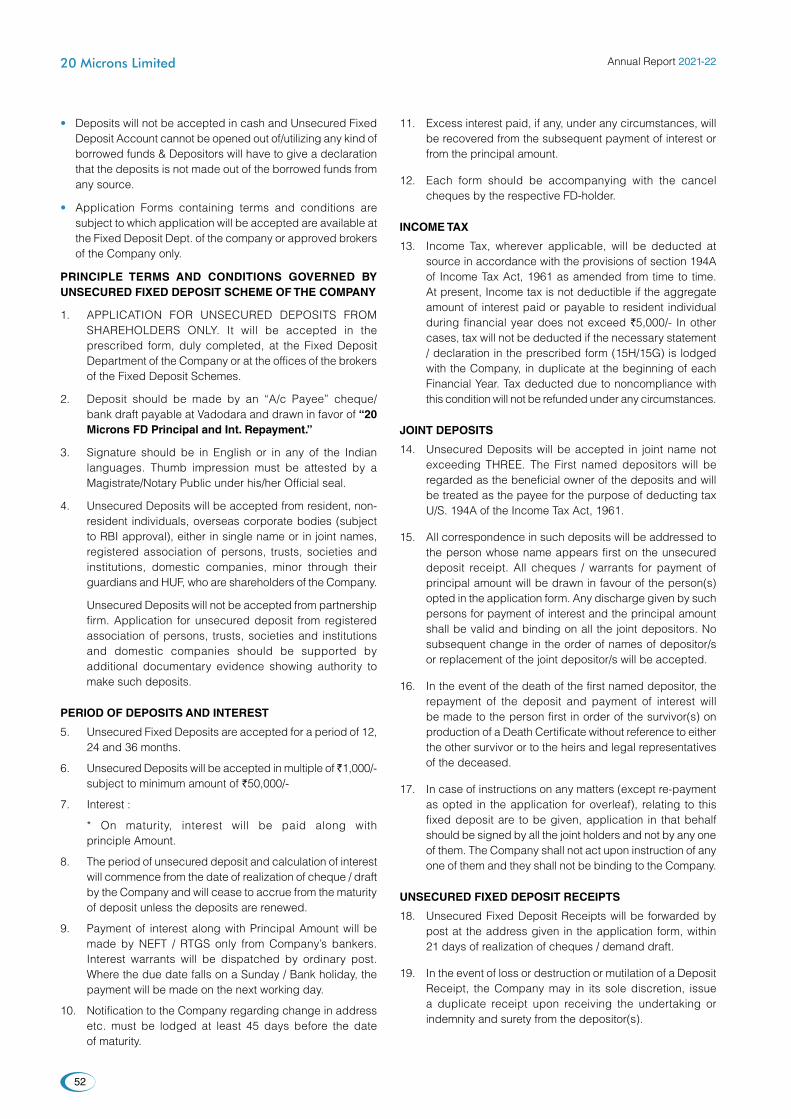
Annual Report 2021-22
52
20 Microns Limited
• Deposits will not be accepted in cash and Unsecured Fixed Deposit Account cannot be opened out of/utilizing any kind of borrowed funds & Depositors will have to give a declaration that the deposits is not made out of the borrowed funds from any source.
• Application Forms containing terms and conditions are subject to which application will be accepted are available at the Fixed Deposit Dept. of the company or approved brokers of the Company only.
PRINCIPLE TERMS AND CONDITIONS GOVERNED BY UNSECURED FIXED DEPOSIT SCHEME OF THE COMPANY
1. APPLICATION FOR UNSECURED DEPOSITS FROM SHAREHOLDERS ONLY. It will be accepted in the prescribed form, duly completed, at the Fixed Deposit Department of the Company or at the offices of the brokers of the Fixed Deposit Schemes.
2. Deposit should be made by an “A/c Payee” cheque/bank draft payable at Vadodara and drawn in favor of “20 Microns FD Principal and Int. Repayment.”
3. Signature should be in English or in any of the Indian languages. Thumb impression must be attested by a Magistrate/Notary Public under his/her Official seal.
4. Unsecured Deposits will be accepted from resident, non-resident individuals, overseas corporate bodies (subject to RBI approval), either in single name or in joint names, registered association of persons, trusts, societies and institutions, domestic companies, minor through their guardians and HUF, who are shareholders of the Company.
Unsecured Deposits will not be accepted from partnership firm. Application for unsecured deposit from registered association of persons, trusts, societies and institutions and domestic companies should be supported by additional documentary evidence showing authority to make such deposits.
PERIOD OF DEPOSITS AND INTEREST
5. Unsecured Fixed Deposits are accepted for a period of 12, 24 and 36 months.
6. Unsecured Deposits will be accepted in multiple of ̀ 1,000/- subject to minimum amount of `50,000/-
7. Interest :
* On maturity, interest will be paid along with principle Amount.
8. The period of unsecured deposit and calculation of interest will commence from the date of realization of cheque / draft by the Company and will cease to accrue from the maturity of deposit unless the deposits are renewed.
9. Payment of interest along with Principal Amount will be made by NEFT / RTGS only from Company’s bankers. Interest warrants will be dispatched by ordinary post. Where the due date falls on a Sunday / Bank holiday, the payment will be made on the next working day.
10. Notification to the Company regarding change in address etc. must be lodged at least 45 days before the date of maturity.
11. Excess interest paid, if any, under any circumstances, will be recovered from the subsequent payment of interest or from the principal amount.
12. Each form should be accompanying with the cancel cheques by the respective FD-holder.
INCOME TAX
13. Income Tax, wherever applicable, will be deducted at source in accordance with the provisions of section 194A of Income Tax Act, 1961 as amended from time to time. At present, Income tax is not deductible if the aggregate amount of interest paid or payable to resident individual during financial year does not exceed `5,000/- In other cases, tax will not be deducted if the necessary statement / declaration in the prescribed form (15H/15G) is lodged with the Company, in duplicate at the beginning of each Financial Year. Tax deducted due to noncompliance with this condition will not be refunded under any circumstances.
JOINT DEPOSITS
14. Unsecured Deposits will be accepted in joint name not exceeding THREE. The First named depositors will be regarded as the beneficial owner of the deposits and will be treated as the payee for the purpose of deducting tax U/S. 194A of the Income Tax Act, 1961.
15. All correspondence in such deposits will be addressed to the person whose name appears first on the unsecured deposit receipt. All cheques / warrants for payment of principal amount will be drawn in favour of the person(s) opted in the application form. Any discharge given by such persons for payment of interest and the principal amount shall be valid and binding on all the joint depositors. No subsequent change in the order of names of depositor/s or replacement of the joint depositor/s will be accepted.
16. In the event of the death of the first named depositor, the repayment of the deposit and payment of interest will be made to the person first in order of the survivor(s) on production of a Death Certificate without reference to either the other survivor or to the heirs and legal representatives of the deceased.
17. In case of instructions on any matters (except re-payment as opted in the application for overleaf), relating to this fixed deposit are to be given, application in that behalf should be signed by all the joint holders and not by any one of them. The Company shall not act upon instruction of any one of them and they shall not be binding to the Company.
UNSECURED FIXED DEPOSIT RECEIPTS
18. Unsecured Fixed Deposit Receipts will be forwarded by post at the address given in the application form, within 21 days of realization of cheques / demand draft.
19. In the event of loss or destruction or mutilation of a Deposit Receipt, the Company may in its sole discretion, issue a duplicate receipt upon receiving the undertaking or indemnity and surety from the depositor(s).
53
Corporate Overview Notice Statutory Reports Financial Statements
20. Deposit Receipts are neither transferable nor negotiable. Request for the addition of the name of deposit holder will not be entertained.
RENEWAL / REPAYMENT OF DEPOSITS :
21. Fixed Deposit will be repaid only on maturity, however, the Company at the request of depositor may refund Deposit before maturity subject to the provisions of the Companies (Acceptance of Deposit) Rules, 2014, and other Rules and Regulations as may be applicable.
22. The Unsecured Fixed Deposit Receipt, duly discharged on revenue stamp, should be sent to the office of the Company, 30 days before the date of maturity, to enable the Company to refund deposit on due date. In case of renewal of Deposit, application form for renewal duly filled in should be sent to the Company to its administrative address as stated above or through the brokers.
23. Where the date of repayment falls on a Sunday, a public or a Bank holiday or any other day on which the office of the Company is closed, repayment will be made to the depositor on the next working day.
GENERAL
24. In the event of death of the sole depositor fixed deposit amount together with the interest thereon, will be paid to the nominee of the depositor upon production of death certificate, and in absence of nomination to the legal heirs of the deceased on submission of death certificate of the depositor and such other documents viz., probate of the will succession certificate and letter of administration granted by a court of competent jurisdiction, as the case may be.
25. Nomination Facility (a) Individual Depositors, singly or jointly, can nominate
under this facility. Non - individuals including societies, trusts, bodies corporate, partnership firms, Kartas of Hindu Undivided Families and holders of power of attorney cannot nominate. The nominee shall have the right to receive the amount due in respect of deposits on death of all the depositors.
(b) The nomination stands automatically rescinded upon repayment/renewal of deposits made.
26. The company will not recognize any lien on or assignment of unsecured fixed Deposits and/or interest thereon.
27. The Company reserves the right, subject to the provisions of the Companies (Acceptance of Deposits) Rules, 2014 as amended from time to time.
(a) To accept deposit only for such period as it may decided from time to time
(b) To reject any application for a fresh deposit or for renewal without assigning any reason.
(c) To repay deposits prematurely before the due date.
28. Deposits will be subject to the Companies (Acceptance of Deposits) Rules, 2014 as amended from time to time and any other regulation prescribed by the Central Government, the Reserve Bank of India, or any other statutory authority.
29. In case of Deposit is made under Power of Attorney; the relevant Power of Attorney must be lodged with the Company at the time of Application.
30. All the correspondence for change of name, address, loss of Fixed Deposit Receipt/Interest Warrant etc., should be addressed to:
307-308, Arundeep Complex, Race Course Circle, VADODARA - 390 007. (GUJARAT STATE) Monday to Friday 9.30 to 13.00 hrs and 14.00 to 17.30 hrs (Except on Bank/Public Holidays)
Unsecured Fixed Deposits accepted are subject to Waghodia Jurisdiction.
A Stakeholders Relationship & Share Transfer Committee of Directors comprising of Mr. Ramkisan A. Devidayal, Mr. Rajesh C. Parikh and Mr. Atil C. Parikh has been re-constituted in terms of the resolution passed by the Board of Directors of the Company in their meeting held on 28.05.2019 for redressal of Share Transfers & Stakeholders’ Grievances. All complaints / grievances may be sent to any of the above committee members at the address of the company.
G. Proposed Schedule This Scheme is applicable on the date on which the
shareholders of the Company had approved the same. The Circular issued under this scheme is valid until expiry of the six months from the date of closure of Financial Year in which it is issued or until the date on which the financial statement is laid before the company in annual general meeting or, where the annual general meeting for any year has not been held, the latest day on which that meeting should have been held in accordance with the provisions of the Act, whichever is earlier.
H. Object of raising the deposits: To meet fund requirement for running the business of
the Company.
I. Extent of Deposit Insurance: Pursuant to the provisions of The Companies (Amendment)
Act, 2017, now companies accepting deposits need not to take insurance for the deposits accepted by it.
J. Credit Rating:- The Company is not falling under definition of Eligible Company and not accepting deposits from public. Therefore, the company is not taking credit rating from recognized credit rating agency.
K. The terms and conditions including rate of interest decided by the company for the acceptance of deposits, applicable to all other depositors are also applicable to Directors, Promoters or Key Managerial Personnel. No special financial or other material benefits are provided to them.
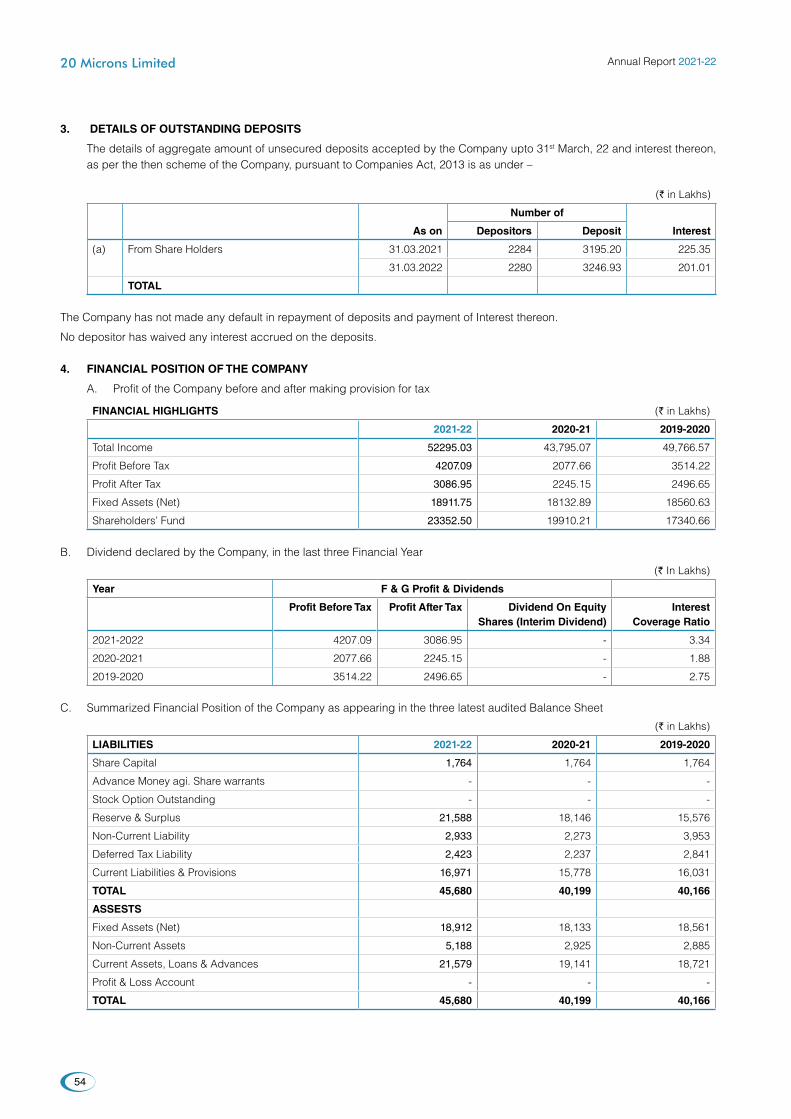
Annual Report 2021-22
54
20 Microns Limited
3. DETAILS OF OUTSTANDING DEPOSITS
The details of aggregate amount of unsecured deposits accepted by the Company upto 31st March, 22 and interest thereon, as per the then scheme of the Company, pursuant to Companies Act, 2013 is as under –
(` in Lakhs)
Number of
As on Depositors Deposit Interest
(a) From Share Holders 31.03.2021 2284 3195.20 225.35
31.03.2022 2280 3246.93 201.01
TOTAL
The Company has not made any default in repayment of deposits and payment of Interest thereon.
No depositor has waived any interest accrued on the deposits.
4. FINANCIAL POSITION OF THE COMPANY
A. Profit of the Company before and after making provision for tax
FINANCIAL HIGHLIGHTS (` in Lakhs)
2021-22 2020-21 2019-2020
Total Income 52295.03 43,795.07 49,766.57
Profit Before Tax 4207.09 2077.66 3514.22
Profit After Tax 3086.95 2245.15 2496.65
Fixed Assets (Net) 18911.75 18132.89 18560.63
Shareholders’ Fund 23352.50 19910.21 17340.66
B. Dividend declared by the Company, in the last three Financial Year
(` In Lakhs)
Year F & G Profit & Dividends
Profit Before Tax Profit After Tax Dividend On EquityShares (Interim Dividend)
Interest Coverage Ratio
2021-2022 4207.09 3086.95 - 3.34
2020-2021 2077.66 2245.15 - 1.88
2019-2020 3514.22 2496.65 - 2.75
C. Summarized Financial Position of the Company as appearing in the three latest audited Balance Sheet
(` in Lakhs)
LIABILITIES 2021-22 2020-21 2019-2020
Share Capital 1,764 1,764 1,764
Advance Money agi. Share warrants - - -
Stock Option Outstanding - - -
Reserve & Surplus 21,588 18,146 15,576
Non-Current Liability 2,933 2,273 3,953
Deferred Tax Liability 2,423 2,237 2,841
Current Liabilities & Provisions 16,971 15,778 16,031
TOTAL 45,680 40,199 40,166
ASSESTS
Fixed Assets (Net) 18,912 18,133 18,561
Non-Current Assets 5,188 2,925 2,885
Current Assets, Loans & Advances 21,579 19,141 18,721
Profit & Loss Account - - -
TOTAL 45,680 40,199 40,166

55
Corporate Overview Notice Statutory Reports Financial Statements
D. Audited Cash Flow Statement for the last Three Financial Year
(` in Lakhs)
2021-22 2020-21 2019-2020
Profit/ (Loss) Before Tax 4,207.09 2,077.66 3,514.22
Operating profit before Working Capital Change 7,108.08 5,594.41 6,267.65
Cash flow due to change in Working Capital 1,708.61 630.37 -1,353.56
Less : Direct Taxes Paid 952.09 -578.81 -888.25
[A] Cash Flow from operating Activities 4,447.38 5,645.97 4,025.84
[B] Cash Flow From Investing Activities -3240.11 -946.57 -1,038.31
[C] Cash Flow From Financing Activities -366.79 -4,799.66 -2,852.19
Net Increase In Cash and Cash Equivalents 840.47 -100.26 135.32
Cash and Cash Equivalents - Opening Balance 166.80 267.06 131.74
Cash and Cash Equivalents - Closing Balance 1,007.27 166.80 267.06
E. The Company has not changed its accounting policies during the last three years.
5. DECLARATIONS
The Directors hereby declare that:
a. the company has not defaulted in the repayment of deposits accepted either before or after the commencement of the Act or payment of interest on such deposits and where a default had occurred, the company made good the default and period of five years had lapsed since the date of making good the default; - No Default has been occurred in repayment of deposits ever.
b. the board of directors have satisfied themselves fully with respect to the affairs and prospects of the company and that they are of the opinion that having regard to the estimated future financial position of the company, the company will be able to meet its liabilities as and when they become due and that the company will not become insolvent within a period of one year from the date of issue of the circular or advertisement;
c. the company has complied with the provisions of the Act and the rules made thereunder;
d. the compliance with the Act and the rules does not imply that repayment of deposits is guaranteed by the Central Government;
e. the deposits accepted by the company before the commencement of the Act have been repaid with interest threreon.
f. In case of any adverse change in credit rating, depositors will be given a chance to withdraw deposits without any penalty; - Not applicable
g. the deposits shall be used only for the purposes indicated in the Circular or circular in the form of advertisement;
h. the deposits accepted by the company are unsecured and rank pari passu with other unsecured liabilities of the company.
The Board of Directors of the Company at its Meeting held on 03rd May, 2022 approved this Circular. -
For 20 Microns Limited
Sd/- [Rajesh C. Parikh] Chairman & Managing Director DIN: 00041610Place: Waghodia,VadodaraDate: 03rd May, 2022
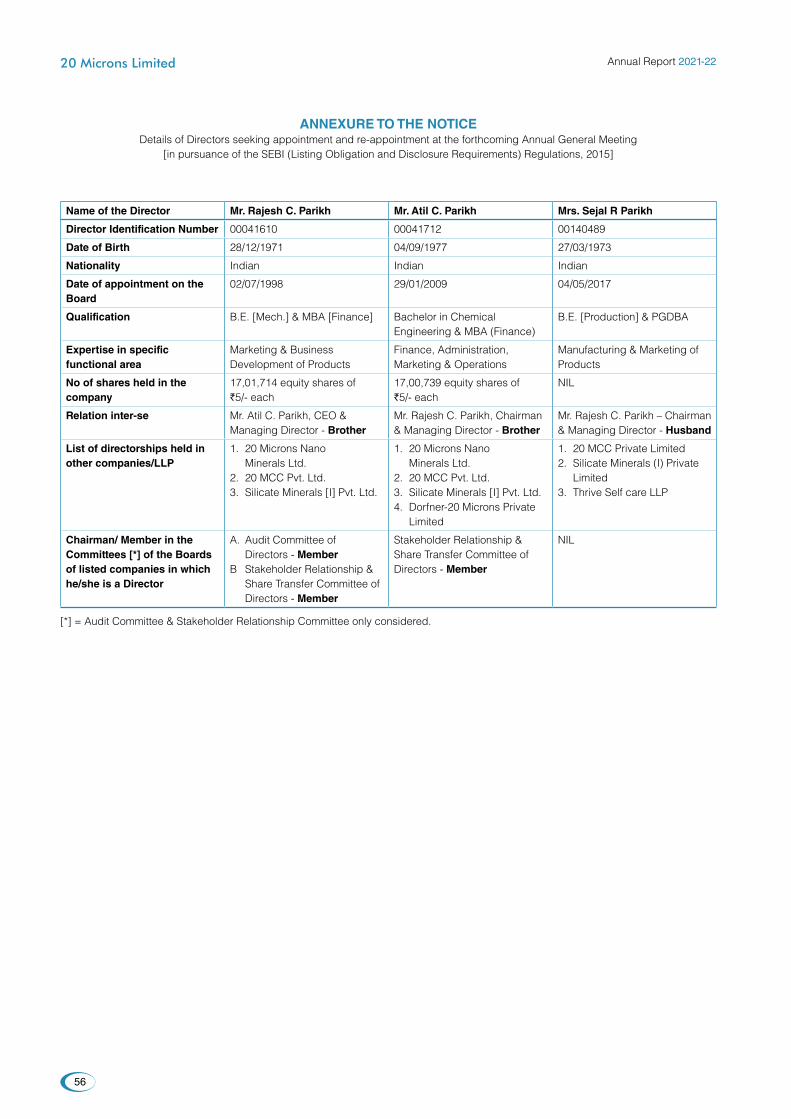
Annual Report 2021-22
56
20 Microns Limited
ANNEXURE TO THE NOTICEDetails of Directors seeking appointment and re-appointment at the forthcoming Annual General Meeting
[in pursuance of the SEBI (Listing Obligation and Disclosure Requirements) Regulations, 2015]
Name of the Director Mr. Rajesh C. Parikh Mr. Atil C. Parikh Mrs. Sejal R Parikh
Director Identification Number 00041610 00041712 00140489
Date of Birth 28/12/1971 04/09/1977 27/03/1973
Nationality Indian Indian Indian
Date of appointment on the Board
02/07/1998 29/01/2009 04/05/2017
Qualification B.E. [Mech.] & MBA [Finance] Bachelor in Chemical Engineering & MBA (Finance)
B.E. [Production] & PGDBA
Expertise in specific functional area
Marketing & Business Development of Products
Finance, Administration, Marketing & Operations
Manufacturing & Marketing of Products
No of shares held in the company
17,01,714 equity shares of `5/- each
17,00,739 equity shares of `5/- each
NIL
Relation inter-se Mr. Atil C. Parikh, CEO & Managing Director - Brother
Mr. Rajesh C. Parikh, Chairman & Managing Director - Brother
Mr. Rajesh C. Parikh – Chairman & Managing Director - Husband
List of directorships held in other companies/LLP
1. 20 Microns Nano Minerals Ltd.
2. 20 MCC Pvt. Ltd.3. Silicate Minerals [I] Pvt. Ltd.
1. 20 Microns Nano Minerals Ltd.
2. 20 MCC Pvt. Ltd.3. Silicate Minerals [I] Pvt. Ltd.4. Dorfner-20 Microns Private
Limited
1. 20 MCC Private Limited2. Silicate Minerals (I) Private
Limited3. Thrive Self care LLP
Chairman/ Member in the Committees [*] of the Boards of listed companies in which he/she is a Director
A. Audit Committee of Directors - Member
B Stakeholder Relationship & Share Transfer Committee of Directors - Member
Stakeholder Relationship & Share Transfer Committee of Directors - Member
NIL
[*] = Audit Committee & Stakeholder Relationship Committee only considered.
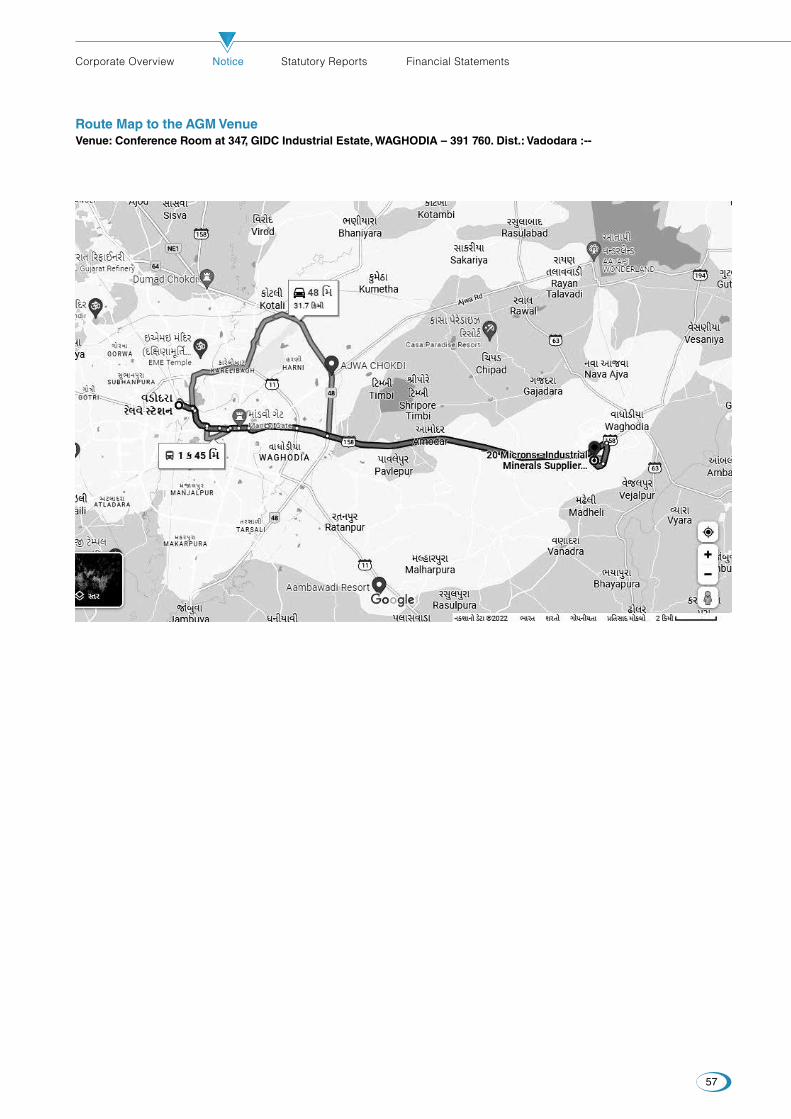
57
Corporate Overview Notice Statutory Reports Financial Statements
Route Map to the AGM VenueVenue: Conference Room at 347, GIDC Industrial Estate, WAGHODIA – 391 760. Dist.: Vadodara :--

Annual Report 2021-22
58
20 Microns Limited
Board’s report
Dear Members,
The Directors have pleasure to present their 35th Annual Report on the business and operations of the Company and the Audited Financial Statements for the year ended March 31, 2022.
Financial ResultsThe Company’s standalone and consolidated financial performance for the year ended March 31, 2022 is summarized below:
(` in Lakhs)
ParticularsStandalone Consolidated
2021-22 2020-21 2021-22 2020-21
Total Income 52295.03 43795.07 61537.05 48608.49
Profit before Depreciation, Interest and Tax (PBDITA) 7188.15 5606.66 8155.42 6102.35
Interest for the year 1800.14 2350.23 2024.42 2543.47
Depreciation for the year 1180.92 1178.77 1367.19 1382.99
Profit/(Loss) before tax and Exceptional items 4207.09 2077.66 4763.81 2175.89
Exceptional items – – – –
Profit/(loss) for the year 4207.09 2077.66 4763.81 2175.89
Tax liability :-
Current Tax 1041.65 537.52 1227.03 623.52
Deferred Tax 78.49 (705.02) 62.64 (748.66)
Prior period Tax – – – –
Net Profit/(Loss) for the year 3086.95 2245.15 3472.82 2301.03
DividendTo conserve the resources, your Directors have not recommended dividend during the year under consideration.
Transfer to ReservesThe Directors do not propose to transfer any amount to reserves.
State of Company’s AffairsDuring the year under consideration, following financial developments have taken place -
• Revenue for the FY22 was `52295.03 Lakhs as against `43795.07 Lakhs in FY21. The revenues has shown stagnation. As the company was focusing on the organic growth, value added products & robust price-mix effect in business.
• For FY22 EBITDA was at `7188.15 Lakhs compared to `5606.66 Lakhs in FY21
• The PAT for FY22 stood at `3086.95 Lakhs compare to `2245.15 Lakhs in FY21.
• Company’s debt-equity ratio came to 0.45 in 2022 from 0.44 in 2021.
• Net Worth of the Company is increased to `23352.50 Lakhs as on March 31, 2022 as compared to `19910.21 Lakhs as on March 31, 2021.
Investors Education and Protection FundDuring the year, Company was not liable to transfer any amount to the Investor Education and Protection Fund as required under Section 124 and 125 of the Companies Act, 2013. Pursuant to the provisions of Investor Education and Protection Fund (Uploading of Information regarding unpaid and unclaimed amounts lying with Companies) Rules, 2012, the Company has uploaded the details of unpaid and unclaimed amounts lying with the Company as on 31.03.2021 on the website of the Company, at web link - https://www.20microns.com/unpaid-dividend-deposit/
Material Changes and commitments affecting financial position between the end of the financial year and the date of reportNo material changes affecting financial position of the Company occurred between the end of the financial year and the date of report.
Corporate Governance Report and Management Discussions & AnalysisAs required by Schedule V(C) of the SEBI (Listing Obligations and Disclosure Requirements) Regulations, 2015, a detailed Report on Corporate Governance is given as a part of the Annual Report. The Company is in full compliance with the requirements and disclosures that have to be made in this regard. The Auditors’ Certificate of the compliance with Corporate Governance requirements by the Company is attached to the Report on Corporate Governance.
komal
Highlight
make it as 31.03.2022
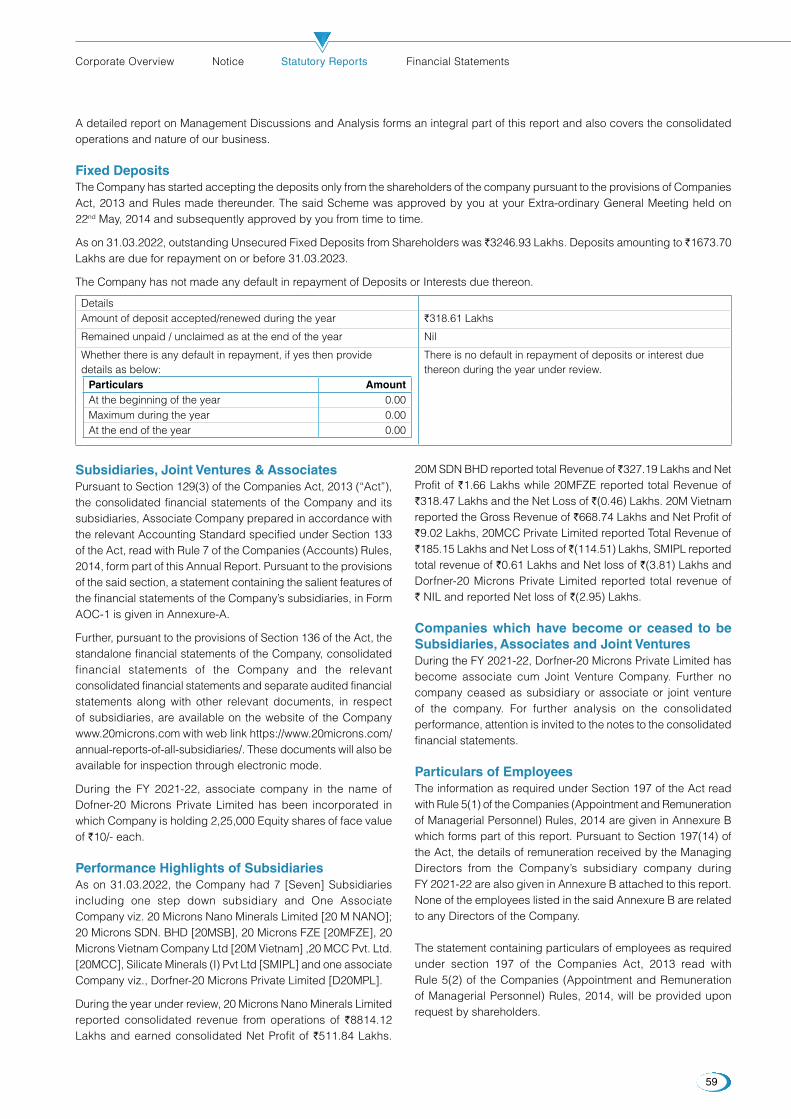
59
Corporate Overview Notice Statutory Reports Financial Statements
A detailed report on Management Discussions and Analysis forms an integral part of this report and also covers the consolidated operations and nature of our business.
Fixed Deposits The Company has started accepting the deposits only from the shareholders of the company pursuant to the provisions of Companies Act, 2013 and Rules made thereunder. The said Scheme was approved by you at your Extra-ordinary General Meeting held on 22nd May, 2014 and subsequently approved by you from time to time.
As on 31.03.2022, outstanding Unsecured Fixed Deposits from Shareholders was ̀ 3246.93 Lakhs. Deposits amounting to ̀ 1673.70 Lakhs are due for repayment on or before 31.03.2023.
The Company has not made any default in repayment of Deposits or Interests due thereon.
Details Amount of deposit accepted/renewed during the year `318.61 Lakhs
Remained unpaid / unclaimed as at the end of the year Nil
Whether there is any default in repayment, if yes then provide details as below:
There is no default in repayment of deposits or interest due thereon during the year under review.
Particulars AmountAt the beginning of the year 0.00Maximum during the year 0.00At the end of the year 0.00
Subsidiaries, Joint Ventures & AssociatesPursuant to Section 129(3) of the Companies Act, 2013 (“Act”), the consolidated financial statements of the Company and its subsidiaries, Associate Company prepared in accordance with the relevant Accounting Standard specified under Section 133 of the Act, read with Rule 7 of the Companies (Accounts) Rules, 2014, form part of this Annual Report. Pursuant to the provisions of the said section, a statement containing the salient features of the financial statements of the Company’s subsidiaries, in Form AOC-1 is given in Annexure-A.
Further, pursuant to the provisions of Section 136 of the Act, the standalone financial statements of the Company, consolidated financial statements of the Company and the relevant consolidated financial statements and separate audited financial statements along with other relevant documents, in respect of subsidiaries, are available on the website of the Company www.20microns.com with web link https://www.20microns.com/annual-reports-of-all-subsidiaries/. These documents will also be available for inspection through electronic mode.
During the FY 2021-22, associate company in the name of Dofner-20 Microns Private Limited has been incorporated in which Company is holding 2,25,000 Equity shares of face value of `10/- each.
Performance Highlights of SubsidiariesAs on 31.03.2022, the Company had 7 [Seven] Subsidiaries including one step down subsidiary and One Associate Company viz. 20 Microns Nano Minerals Limited [20 M NANO]; 20 Microns SDN. BHD [20MSB], 20 Microns FZE [20MFZE], 20 Microns Vietnam Company Ltd [20M Vietnam] ,20 MCC Pvt. Ltd. [20MCC], Silicate Minerals (I) Pvt Ltd [SMIPL] and one associate Company viz., Dorfner-20 Microns Private Limited [D20MPL].
During the year under review, 20 Microns Nano Minerals Limited reported consolidated revenue from operations of `8814.12 Lakhs and earned consolidated Net Profit of `511.84 Lakhs.
20M SDN BHD reported total Revenue of ̀ 327.19 Lakhs and Net Profit of `1.66 Lakhs while 20MFZE reported total Revenue of `318.47 Lakhs and the Net Loss of `(0.46) Lakhs. 20M Vietnam reported the Gross Revenue of `668.74 Lakhs and Net Profit of `9.02 Lakhs, 20MCC Private Limited reported Total Revenue of `185.15 Lakhs and Net Loss of ̀ (114.51) Lakhs, SMIPL reported total revenue of `0.61 Lakhs and Net loss of `(3.81) Lakhs and Dorfner-20 Microns Private Limited reported total revenue of ` NIL and reported Net loss of `(2.95) Lakhs.
Companies which have become or ceased to be Subsidiaries, Associates and Joint VenturesDuring the FY 2021-22, Dorfner-20 Microns Private Limited has become associate cum Joint Venture Company. Further no company ceased as subsidiary or associate or joint venture of the company. For further analysis on the consolidated performance, attention is invited to the notes to the consolidated financial statements.
Particulars of Employees The information as required under Section 197 of the Act read with Rule 5(1) of the Companies (Appointment and Remuneration of Managerial Personnel) Rules, 2014 are given in Annexure B which forms part of this report. Pursuant to Section 197(14) of the Act, the details of remuneration received by the Managing Directors from the Company’s subsidiary company during FY 2021-22 are also given in Annexure B attached to this report. None of the employees listed in the said Annexure B are related to any Directors of the Company.
The statement containing particulars of employees as required under section 197 of the Companies Act, 2013 read with Rule 5(2) of the Companies (Appointment and Remuneration of Managerial Personnel) Rules, 2014, will be provided upon request by shareholders.

Annual Report 2021-22
60
20 Microns Limited
In terms of Section 136 of the Companies Act, 2013, the Report and accounts are being sent to the members and others entitled thereto, excluding the information on employees’ particulars which is available for inspection by members at the Registered office of the Company during business hours on working days of the Company upto the ensuing Annual General Meeting.
Related Party TransactionsThere are no material related party transactions made by the Company during the year that require shareholders’ approval under Regulation 23(4) of the Listing Regulations or Section 188 of the Act. All related party transactions are reported to the Audit Committee. Prior approval of the Audit Committee is obtained on a yearly basis for the transactions which are planned and / or repetitive in nature.
Policy for determining material related party is available at l ink ht tps: / /www.20microns.com/wp-content /uploads/2022/01/20ML_related_party_transaction_policy.pdf
Particulars of transactions with related parties referred to in Section 188(1) of the Companies Act, 2013, in the prescribed Form AOC-2 is annexed in Annexure C hereto.
Annual Return The Annual Return for the Financial Year 2021-22 in prescribed Form No. MGT-7, as required under Section 92(1) of the Companies Act, 2013 read with Rule 11 of the Companies (Management and Administration) Rules, 2014 is placed on the Company’s Website at web link: https://www.20microns.com/wp-content/uploads/2022/05/20ml-Form_MGT_7_AnnualReturn2021-22.
Conservation of Energy, Technology Absorption, Foreign Exchange Earnings & OutgoInformation as per Companies (Disclosure of particulars in the Report of Board of Directors) Rules, 1988 relating to conservation of energy, technology absorption, foreign exchange earnings and outgo are given in Annexure - D forming part of this report.
Corporate Social Responsibility In compliance with Section 135 of the Act, the Company has undertaken CSR activities, projects and programs as provided in the CSR policy of the Company and as identified under Schedule VII to the Act.
The Board has framed a CSR Policy for the Company, on the recommendations of the CSR Committee. The Report on CSR activities as required under Companies (Corporate Social Responsibility) Rules, 2014, including a brief outline of the Company’s CSR Policy, total amount to be spent under CSR for the financial year and details of amount spent on CSR during the year is set out at Annexure – E forming part of this Report.
We have 141 Juvenile patients registered with us. Compared to previous year, 30% patients are increased. All of them are under the watch and availing facility given by us. They are taken to most reputed senior doctors (doing practice at Vadodara) for advice and now they are settled with comfortable life. To manage the work at Diabetes Centre and to reduce the fear of the patients, (having age group of more than 16 years) are called and allowed them to work for the centre.
Every month, we are getting new Type 1 patients from the hospitals of Vadodara which are financially week. We are providing them Insulin, Glucometer, Strips, and other stuffs related to Diabetes free of cost. We have arranged experienced doctors from Vadodara to visit our centre and check the health of Type 1 patients. Doctors are giving education to parents and making them understood the fact of the diabetes. On 21st October 2021, we have organized an Eye checkup camp for all Type 1 patients registered with us at no cost. Approximately more than 50 patients visited the facility of Dr. Sujit Desai, Subhanpura, Vadodara. On 14th November 2021, On the day of WORLD DIABETES DAY, we have arranged a function at Gotri, Sun & Sun School. More than 100 patients with their parents attended the function and expert doctors given a speech to all in connection with the latest researches done by WORLD DIABETES ASSOCIATION, UK.
Risk Management ImplementationThe Company operates in a competitive environment and is generally exposed to various risks at different times such as technological risks, business risks, operational risks, financial risks etc. The Board of Directors and Audit Committee of Directors of the Company periodically review the Risk of the Company so that the Management controls the risk through properly defined network. The Company has a system based approach to business risk management backed by strong internal control systems.
A range of responsibilities from strategy to the operations is specified. A strong independent internal audit function at the corporate level carries out risk focused audits across all businesses enabling identification of areas where risk managements processes may need to be improved. The Board reviews internal audit findings and provides strategic guidance on internal control, monitors internal control environment within the Company and ensures that Internal Audit recommendations are effectively implemented. The combination of policies and procedures adequately addresses the various risks associated with your company’s businesses.
Internal Finance Control System AdequacyThe Company has established proper and adequate system of internal control to ensure that all resources are put to optimum use and are well protected against loss and all transactions are authorized, recorded and reported correctly and there is proper adherence to policies and guidelines, safeguarding its assets, prevention and detection of frauds and errors, accuracy and completeness of the accounting records and timely preparation of reliable financial disclosures, processes in terms of efficiencies and effectiveness. The Company’s internal control systems are supplemented by an extensive program of internal audit by an independent firm.
All the transactions are conducted using the IT interface and the business processes are further audited by internal auditors.
The Company’s internal control systems are also periodically tested and certified by the internal auditors. The Audit Committee constituted by the Board constantly reviews the internal control systems.

61
Corporate Overview Notice Statutory Reports Financial Statements
Vigil Mechanism / Whistle Blower PolicyThe Vigil Mechanism of the Company, which also incorporates a whistle blower policy has been approved and adopted by Board of Directors of the Company in compliance with the provisions of Section 177 (10) of the Companies Act, 2013 and Regulation 22 of the Securities and Exchange Board of India (Listing Obligations and Disclosure Requirements) Regulations, 2015.
The Whistle Blower Policy of the Company provides a mechanism for employees / Board Members and others to raise good faith concerns about violation of any applicable law/ Code of Conduct of the Company, gross wastage or misappropriation of funds, substantial or specific danger to public health and safety, abuse of authority or unethical behavior and to protect the individuals who take such actions from retaliation or any threat of retaliation and also provides for direct access to the Chairman of the Audit Committee, in exceptional cases. The functioning of the Vigil mechanism is reviewed by the Audit Committee from time to time. During the financial year under review, the Company has not received any complaints against any employees/Board Members.
The policy of vigil mechanism may be accessed on the Company’s web link - https://www.20microns.com/wp-content/uploads/ 2022/06/20ML_vigil_mechanism_policy_2022.
Prevention of Sexual Harassment at Workplace The Company has adopted a policy with the name “Policy on Prevention of Sexual Harassment at Workplace”. The policy is applicable for all employees of the organization, which includes corporate office, branches, depots and manufacturing locations etc.
A Complaint Committee has also been set up to redress complaints received on sexual harassment as well as other forms of verbal, physical, written or visual harassment. During the financial year under review, the Company has not received any complaints of sexual harassment.
The policy of Prevention of Sexual Harassment at Workplace may be accessed on the Company’s web link - https://www.20microns.com/wp-content/uploads/2018/06/Policy-on-Prevention-of-Sexual-Harrasment-at-Work-Place.pdf
During the period under review, the Company has not received any complaint under this Policy.
Industrial RelationsDuring the year under review, industrial relations remained harmonious at all our offices and establishments.
General Shareholders Information General Shareholders Information is given in the Report on Corporate Governance forming part of this Annual Report.
Secretarial StandardsYour company has complied with the provisions of Secretarial Standards issued by Institute of Company Secretaries of India.
Particulars of Loan, Guarantees and InvestmentsLoans, guarantee and investment covered under Section 186 of the Companies Act, 2013 form part of the notes to the financial statements provided in this Annual Report.
Selection and Procedure for Nomination and Appointment of DirectorsThe Company has a Nomination and Remuneration Committee (“NRC”) which is responsible for developing competency requirements for the Board, based on the industry and strategy of the Company. The Board composition analysis reflects an in-depth understanding of the Company, including its strategies, environment, operations, financial condition and compliance requirements.
The NRC makes recommendations to the Board in regard to appointment of new Directors and Key Managerial Personnel (“KMP”) and senior management employees. The role of the NRC encompasses conducting a gap analysis to refresh the Board on a periodic basis, including each time a Director’s appointment or re-appointment is required.
Criteria for determining qualifications, positive attributes and independence of a DirectorIn terms of the provisions of Section 178(3) of the Companies Act, 2013 and Regulation 19 of the SEBI (Listing obligation and disclosure Requirements) Regulations, 2015, the NRC has formulated the criteria for determining qualifications, positive attributes and independence of Directors, the key features of which are as follows:
• Qualifications – The Board nomination process encourages diversity of thought, experience, knowledge, age and gender. It also ensures that the Board has an appropriate blend of functional and industry expertise.
• Positive Attributes - Apart from the duties of Directors as prescribed in the Act the Directors are expected to demonstrate high standards of ethical behavior, communication skills and independent judgment. The Directors are also expected to abide by the respective Code of Conduct as applicable to them.
• Independence - A Director will be considered independent if he / she meets the criteria laid down in Section 149(6) of the Companies Act, 2013 the Rules framed thereunder and Regulation 16(1)(b) of the SEBI (Listing Regulations and Obligations Requirements) Regulations, 2015.
Evaluation of Board of DirectorsThe Board of Directors has carried out an annual evaluation of its own performance, Board Committees and individual directors pursuant to the provisions of the Act and the Listing Regulations, 2015.
The Board evaluated its performance after seeking inputs from all the Directors on the basis of criteria such as the Board composition and structure, effectiveness of board processes, information and functioning, etc. The performance of the Committees was evaluated by the Board after seeking inputs
Annual Report 2021-22
62
20 Microns Limited
from the committee members on the basis of criteria such as the composition of committees, effectiveness of committee meetings, etc. The above criteria are as provided by the Guidance Note on Board Evaluation issued by the Securities and Exchange Board of India.
Remuneration PolicyPursuant to the provisions of Section 178(3) of the Act and Regulation 19 of the Listing Regulations, 2015, the NRC has formulated a policy relating to the remuneration for the Directors, Key Managerial Personnel (KMP), Senior Management and other employees. The philosophy for remuneration is based on the commitment of fostering a culture of leadership with trust. While formulating this policy, the NRC has considered the factors laid down in Section 178(4) of the Act which are as under:
• That the level and composition of remuneration is reasonable and sufficient to attract, retain and motivate Directors of the quality required to run the company successfully;
• Remuneration to Directors, KMP and Senior Management Employees involves a balance between fixed and incentive pay reflecting short and long-term performance objectives appropriate to the working of the Company and its goals.
Remuneration Policy of the Company is available at link https://www.20microns.com/wp-content/uploads/2019/12/20ML_Nomination-RemunerationPolicy_2019-.pdf
Remuneration for Independent Directors and Non-Executive-Non-Independent DirectorsThe Non-Executive Directors, including Independent Directors, are paid sitting fees for attending the meetings of the Board and committees of the Board. As per the Policy, the overall remuneration (sitting fees and commission) should be reasonable and sufficient to attract, retain and motivate Directors aligned to the requirements of the Company including considering the challenges faced by the Company and its future growth imperatives. The remuneration should also be reflective of the size of the Company, complexity of the business and the Company’s capacity to pay the remuneration.
Within the ceiling of 1% of net profits of the Company, computed under the applicable provisions of the Act, the Non-Executive Directors including Independent Directors were also paid a commission, the amount whereof was recommended by the NRC and approved by the Board during FY 2021-22 subject to approval of shareholders in the ensuing Annual General Meeting.
The basis of determining the specific amount of commission payable to a Non-Executive Director is related to his attendance at meetings, role and responsibility as Chairman or member of the Board / Committees and overall contribution as well as time spent on operational matters other than at the meetings.
Board of Directors and meetingsThe members of the Company’s Board of Directors are eminent persons of proven competence and integrity. Besides experience, strong financial acumen, strategic astuteness and leadership qualities, they have a significant degree of
commitment towards the Company and devote adequate time to the meetings and preparation.
The Board meets at regular intervals to discuss and decide on Company / business policy and strategy apart from other Board business. Intimation of Board Meeting date would be given in advance to help them plan their schedule and ensure meaningful participation in the meetings. Only in case of special and urgent business, if the need arises, the Board’s/Committee’s approval is taken by passing resolutions through circulation or by calling Board/Board Committee meetings at shorter notice, as permitted by law.
The Company has complied with Secretarial Standards issued by the Institute of Company Secretaries of India on Board Meetings and Annual General Meetings. The agenda for the Board and Committee meetings includes detailed notes on the items to be discussed to enable the Directors to take an informed decision. The Board of Directors had held six meetings during FY 2021-22. For further details, please refer to the Corporate Governance Report, which forms part of this Annual Report. The intervening gap between the meetings was within the period prescribed under the Act and the Listing Regulations, 2015.
Directors and Key Managerial PersonnelIn accordance with the Articles of Association of the Company, Mrs. Sejal C. Parikh, Non-Executive, Non-Independent Director, retires by rotation at this Annual General Meeting and being eligible offers herself for re-appointment. The Board recommends her appointment.
None of the Directors of the Company is disqualified under Section 164(2) of the Companies Act, 2013. As required by law, this position is also reflected in the Auditors’ Report.
In accordance with provisions of Section 149 of the Companies Act, 2013 and the SEBI (Listing Obligations and Disclosure Requirements) Regulations, 2015, Mr. Ramkisan A. Devidayal, Mr. Atul Patel, Dr. Ajay Ranka and Mr. Jaideep Verma have given a declaration to the Company that they meet the criteria of independence as mentioned in Section 149(6) of the Companies Act, 2013.
The composition of the Board, meetings of the Board held during the year and the attendance of the Directors thereat have been mentioned in the Report on Corporate Governance which forms part of this Annual Report.
Independent Directors’ DeclarationOur definition of ‘Independence’ of Directors is derived from Regulation 16(1)(b) of the Listing Regulations, 2015 and Section 149(6) of the Act and rules framed thereunder. The Independent Directors have also submitted a declaration that they meet the criteria of independence and that they are not aware of any circumstance or situation, which exist or may be reasonably anticipated, that could impair or impact their ability to discharge their duties with an objective independent judgment and without any external influence, pursuant to Regulation 25 of the Listing Regulations,2015.

63
Corporate Overview Notice Statutory Reports Financial Statements
Based on the confirmation / disclosures received from the Directors, the following Non-Executive Directors are Independent as on March 31, 2022:
1) Mr. Ramkisan A. Devidayal
2) Mr. Atul H. Patel
3) Dr. Ajay I. Ranka
4) Mr. Jaideep B. Verma
Committees of the BoardThe Company has four Board Committees as on March 31, 2022:
1) Audit Committee
2) Nomination and Remuneration Committee
3) Stakeholders Relationship & Share Transfer Committee
4) CSR Committee
Details of all the committees along with their main terms, composition and meetings held during the year under review are provided in the Report on Corporate Governance, a part of this Annual Report.
Board DiversityThe Company recognizes and embraces the importance of a diverse board in its success. The Company believes that a truly diverse board will leverage differences in thought, perspective, knowledge, skill, regional and industry experience, cultural and geographical background, age, ethnicity, race and gender, which will help the Company to retain its competitive advantage.
Familiarization Programme for Independent DirectorsAs trustees of shareholders, Independent Directors play a pivotal role in upholding corporate governance norms and ensuring fairness in decision making. Being experts in various fields, they also bring independent judgment on matters of strategy, risk management, controls and business performance.
At the time of appointing a new Independent Director, a formal letter of appointment is given to the Director, inter alia, explaining the role, duties and responsibilities of the Director.
The Director is also explained in detail the compliances required from him / her under the Act, SEBI Regulations and other relevant regulations. By way of an introduction to the Company, presentations are also made to the newly appointed Independent Director on relevant information like overview of the Company’s businesses, market and business environment, growth and performance, organizational set up of the Company, governance and internal control processes.
Ongoing familiarisation program aims to provide insights into the Company and the business environment to enable all the Independent Directors to be updated of newer challenges, risks and opportunities relevant in the Company’s context and to
lend perspective to the strategic direction of the Company. The details for familiarisation program for the Independent Directors are put up on the website of the Company. As required under Regulation 46(2)(i) of the Listing Regulations, 2015 and the same can be accessed at the link : https://www.20microns.com/wp-content/uploads/2019/04/20ML_Familiarization-Programme.pdf
Significant and material orders passed by the Regulators or CourtsThere are no significant and material orders passed by the Regulators or Courts or Tribunal impacting the going concern status and Company’s operations in future.
AuditorsA. Statutory Auditors M/s. J H Mehta & Co., Chartered Accountants (Firm
Registration No. 106227W) were appointed as statutory auditors of the company, at the conclusion of 30th AGM of the Company. In terms of their appointment made at the 30th AGM held on 05.08.2014, they are holding office of the auditors up to the conclusion of the 35th AGM and hence, would retire at the conclusion of the forthcoming 35th AGM.
Accordingly, M/s. Manubhai & Shah LLP, Chartered Accountants (Firm Registration No. 106041W/W100136) will be appointed as statutory auditors of the company, for a period of 5 years, commencing from the conclusion of 35th AGM till the conclusion of the 40th AGM subject to approval of shareholders in the ensuing Annual General Meeting.
M/s. Manubhai & Shah LLP, Chartered Accountants from Ahmedabad has furnished a certificate of their eligibility and consent under Section 139 and 141 of the Act and the Companies (Audit and Auditors) Rules 2014 for their continuance as the Auditors of the Company for the period of Five years. In terms of the Listing Regulations, 2015, the Auditors have confirmed that they hold a valid certificate issued by the Peer Review Board of the ICAI.
The Statutory Auditors’ Report received from M/s. J. H. Mehta & Co., Chartered Accountants for FY 2021-22 on the financial statement of the Company forms part of this Annual Report.
The Statutory Auditors’ report on the financial statements for FY 2021-2022 does not contain any qualifications, reservations or adverse remarks or disclaimer.
The Statutory Auditors of the Company have not reported any fraud as specified under the second proviso to Section 143(12) of the Act
B. Internal Auditors The Company has re-appointed M/s. Lalit R. Mehta &
Associates, Chartered Accountants, Vadodara as the Internal Auditors of the Company for the F.Y. 2022-23.
Annual Report 2021-22
64
20 Microns Limited
C. Cost Auditors Your Board has re-appointed M/s. Y. S. Thaker & Co,
Cost Accountants in Practice as Cost Auditors of the Company for conducting cost audit for the FY 2022-23. A resolution seeking approval of the members for ratifying the remuneration payable to the Cost Auditors for FY 2022-23 is provided in the Notice to the ensuing Annual General Meeting.
Cost Records The Cost accounts and records as required to be
maintained under Section 148 (1) of Act are duly made and maintained by the Company.
D. Secretarial Auditors The Secretarial Audit Report for the financial year 2021-
22 issued by M/s. J.J. Gandhi and Co. , Practicing Company Secretaries is annexed to this Report. There are no qualifications, observations or adverse remark or disclaimer in the said report.
For the FY 2022-23 Company has appointed M/s. Parikh Dave & Associates., Practicing Company Secretaries, Ahmedabad as the Secretarial Auditor of the Company to conduct secretarial audit and to ensure compliance by the Company with various Acts applicable to the Company.
Directors’ Responsibility StatementBased on the framework of internal financial controls and compliance systems established and maintained by the Company, work performed by the internal, statutory, cost and secretarial auditors including audit of internal financial controls over financial reporting by the statutory auditors and the reviews performed by the management and the relevant Board committees, including the audit committee, the Board is of the opinion that the Company’s internal financial controls were adequate and operating effectively during the FY 2021-2022.
Pursuant to Section 134(5) of the Act, the Board of Directors, to the best of their knowledge and ability, Your Directors hereby confirm that:
a) in the preparation of the annual accounts, the applicable accounting standards have been followed along with proper explanation relating to material departures;
b) the Directors have selected such accounting policies and applied them consistently and made judgments and estimates that are reasonable and prudent so as to give a true and fair view of the state of affairs of the Company at the end of the financial year and of the profit and loss of the Company for that period;
c) the Directors have taken proper and sufficient care for the maintenance of adequate accounting records in accordance with the provisions of the Companies Act,
2013 for safeguarding the assets of the Company and for preventing and detecting fraud and other irregularities;
d) the Directors have prepared the annual accounts on a going concern basis;
e) the Directors have laid down internal financial controls to be followed by the Company and that such internal financial controls are adequate and operating effectively;
f) adequate systems and processes, commensurate with the size of the Company and the nature of its business, have been put in place by the Company, to ensure compliance with the provisions of all applicable laws as per the Company’s Global Statutory Compliance Policy and that such systems and processes are operating effectively.
DISCLOSURE ABOUT THE APPLICATION AS MADE OR ANY PROCEEDING IS PENDING UNDER THE INSOLVENCY AND BANKRUPTCY CODE (IBC), 2016 DURING THE YEAR ALONG WITH THEIR STATUS AS AT THE END OF THE FINANCIAL YEAR.During the year under review no application has been made or any proceeding is pending under the Insolvency and Bankruptcy Code (IBC), 2016.
DISCLOSURE ABOUT THE DIFFERENCE BETWEEN THE AMOUNTS OF VALUATION EXECUTED AT THE TIME OF ONE TIME SETTLEMENT AND THE VALUATION DONE WHILE TAKING LOAN FROM THE BANKS OR FINANCIAL INSTITUION ALONG WITH THE REASON THEREOF.During the year under review no valuation has been executed with Bank for one time settlement although Company has changed its banker under consortium with State Bank of India from IDBI to Bank of Baroda.
AcknowledgementThe Directors wish to convey their deep appreciation to all the employees, bankers, customers, vendors, investors, and consultants/advisors of the Company for their sincere and dedicated services as well as their collective contribution to the Company’s performance.
The Directors also thank the Government of India, Governments of various States in India, Governments of various Countries and concerned Government departments for their cooperation.
For and on behalf of the Board of Directors
Rajesh C. Parikh Chairman & Managing DirectorPlace: Waghodia,Vadodara DIN: 00041610Date: 03rd May, 2022

65
Corporate Overview Notice Statutory Reports Financial Statements
Annexure AFORM AOC- 1
(Pursuant to first proviso to sub-section (3) of Section 129 read with Rule 5 of Companies (Accounts) Rules, 2014).
Statement containing salient features of the financial statement of subsidiaries companies or associate companies or joint venture.
Part A: Subsidiaries & Associate(C In Lakhs)
Sr. No.
Particulars 20 Microns Nano Minerals Limited (Consolidated)
20 Microns FZE
20 Microns SDN BHD
20 Microns Vietnam
Company Ltd
20 MCC Pvt. Ltd.
Dorfner-20 Microns Private
Limited1 The date since when
subsidiary was acquired
03.02.2010 07.02.2011 25.02.2008 04.07.2017 21.08.2018 08.10.2021
2 Share Capital 897.00 31.00 90.99 144.45 725.05 50.003 Reserve and surplus 2699.12 170.87 185.04 17.95 -369.12 -2.954 Total Assets 8390.96 306.60 288.99 361.24 395.16 59.495 Total Liabilities 4794.83 104.92 12.96 198.56 39.22 12.446 Details of Investment
(Except in caseof investment inSubsidiaries)
– – – – – –
7 Turnover 8814.72 318.47 327.19 668.74 176.16 Nil8 Profit before taxation 697.81 -9.25 2.06 22.34 -129.38 -2.959 Provision for taxation 185.97 -- 0.40 13.31 -30.16 0.0010 Profit after taxation 511.84 -9.25 1.65 9.02 -99.22 -2.9511 Proposed dividend – – – – – –
1. Name of the Subsidiary which is yet to commence operations –Nil
2. Name of the subsidiaries which have been liquidated or sold during the year: Nil
Sr. No.
Name of the Associate Dorfner-20 Microns Private Limited
1 Latest audited Balance Sheet Date 31.03.20222 Shares of Associates held by the company on the year end
No. of shares 225000 Equity sharesAmount of Investment in Associates (`) 22,50,000Extend of Holding % 45%
3 Description of how there is significant influence Joint venture4 Reason why the associate is not consolidated NA5 (i) Networth attributable to Shareholding as per latest audited Balance Sheet 0.00
(ii) Networth attributable to Shareholding as per unaudited Balance sheet as on 31/03/2022 (`) – Audited Profit / Loss for the FY 2021-22 (`) (2,49,952) Considered in Consolidation (`) Yes Not Considered in Consolidation (`) NA
1. Name of the Subsidiary which is yet to commence operations –Nil
2. Name of the subsidiaries which have been liquidated or sold during the year: Nil
The Company is having One Associate Company /Joint Venture Company as on 31st March, 2022.
For and on behalf of the Board
(Rajesh C. Parikh) (Atil C. Parikh) Place: Waghodia, Vadodara Chairman & Managing Director CEO & Managing DirectorDate: 3rd May,2022 (DIN:00041610) (DIN: 00041712)
PART B - Statement pursuant to Section 129 (3) of the Companies Act, 2013 related to Associate Companies and Joint Ventures

Annual Report 2021-22
66
20 Microns Limited
Annexure BParticulars of Employees
1. Details pertaining to remuneration as required under Section 197(12) of the Companies Act, 2013 read with Rule 5(1) of the Companies (Appointment and Remuneration of Managerial Personnel) Rules, 2014:
(i) The ratio of the remuneration of each Director to the Median Remuneration of the Employees of the Company for the Financial Year 2021-22
and
(ii) The percentage increase in remuneration of each Director, Chief Financial Officer, Chief Executive Officer, Company Secretary or Manager, if any, in the Financial Year.
Sr. No.
Name of Director / KMP and Designation Remuneration* of Director / KMP for
Financial Year2021-22
(D in Lakh)
% increase in Remuneration for the Financial Year
2022-23
Ratio ofRemuneration of
each Director/KMP to the Median
Remuneration of Employees
1 Mr. Rajesh C. Parikh Chairman & Managing Director
95.25 125.00 4.78
2 Mr. Atil C. Parikh CEO & Managing Director
86.08 100.00 5.29
3 Mrs. Sejal R. Parikh Non-Executive Director
– – –
4 Mr. Ramkisan A. Devidayal Non-Executive Independent Director
– – –
5 Mr. Atul H. Patel Non-Executive Independent Director
– – –
6 Dr. Ajay I. Ranka Non-Executive Independent Director
– – –
7 Mr. Jaideep B. Verma Non-Executive Independent Director
– – –
8 Mr. Narendrakumar R. Patel Chief Financial Officer
43.41 – 10.10
9 Mrs. Komal Pandey Company Secretary(*w.e.f 19.07.2021)
4.91 – 91.03
*Remuneration paid to Executive Directors and KMP does not include Incentive and Commission paid during the year.
The Independent Directors of the Company are entitled to sitting fees and commission as per the statutory provisions and within the limits approved by the Board of Directors and Shareholders. The details of remuneration of Independent Directors are provided in the Corporate Governance Report.
Remuneration for the purpose of the computation above, in the case of Executive Chairman & MD, CEO & MD, is considered as the income earned during the financial year 2021-22 excluding contribution to provident fund.
The Median Remuneration of Employee (MRE) including Whole Time Directors (WTDs) was `4.14 Lakhs in fiscal 2022. There was increase in MRE (including WTDs) in fiscal 2022, as compared to fiscal 2021 is 14.24%
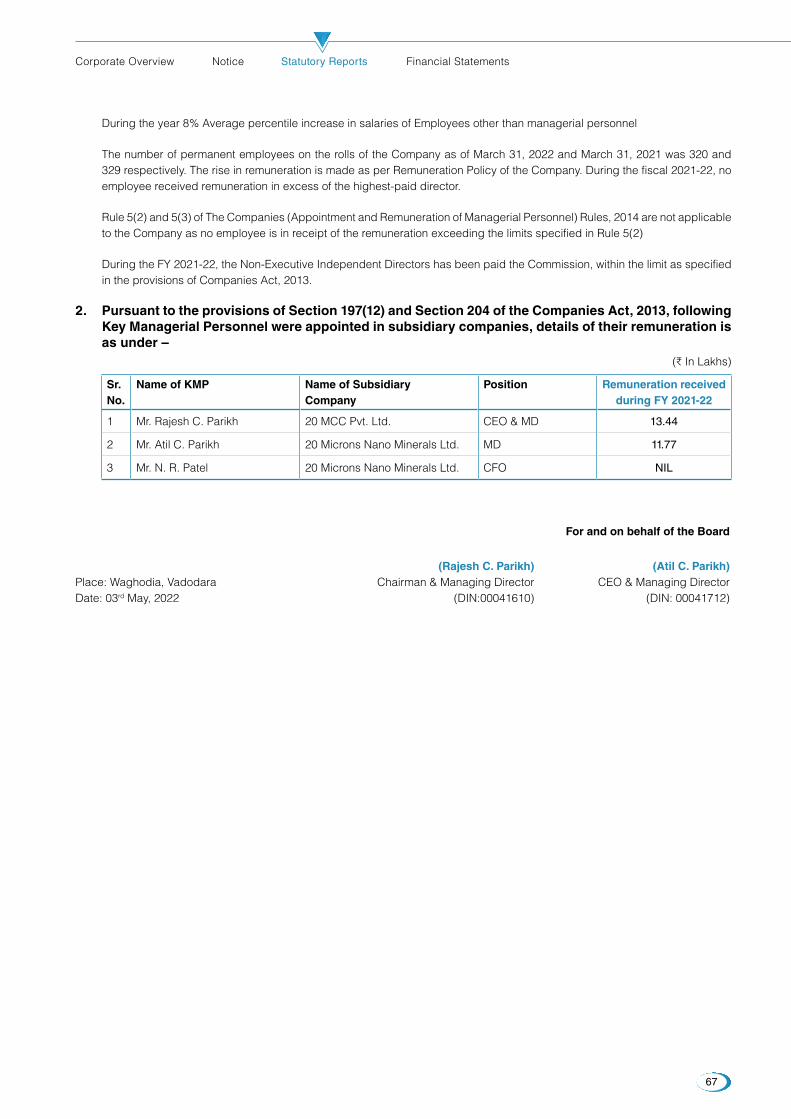
67
Corporate Overview Notice Statutory Reports Financial Statements
During the year 8% Average percentile increase in salaries of Employees other than managerial personnel
The number of permanent employees on the rolls of the Company as of March 31, 2022 and March 31, 2021 was 320 and 329 respectively. The rise in remuneration is made as per Remuneration Policy of the Company. During the fiscal 2021-22, no employee received remuneration in excess of the highest-paid director.
Rule 5(2) and 5(3) of The Companies (Appointment and Remuneration of Managerial Personnel) Rules, 2014 are not applicable to the Company as no employee is in receipt of the remuneration exceeding the limits specified in Rule 5(2)
During the FY 2021-22, the Non-Executive Independent Directors has been paid the Commission, within the limit as specified in the provisions of Companies Act, 2013.
2. Pursuant to the provisions of Section 197(12) and Section 204 of the Companies Act, 2013, following Key Managerial Personnel were appointed in subsidiary companies, details of their remuneration is as under –
(C In Lakhs)
Sr. No.
Name of KMP Name of SubsidiaryCompany
Position Remuneration received during FY 2021-22
1 Mr. Rajesh C. Parikh 20 MCC Pvt. Ltd. CEO & MD 13.44
2 Mr. Atil C. Parikh 20 Microns Nano Minerals Ltd. MD 11.77
3 Mr. N. R. Patel 20 Microns Nano Minerals Ltd. CFO NIL
For and on behalf of the Board
(Rajesh C. Parikh) (Atil C. Parikh) Place: Waghodia, Vadodara Chairman & Managing Director CEO & Managing DirectorDate: 03rd May, 2022 (DIN:00041610) (DIN: 00041712)
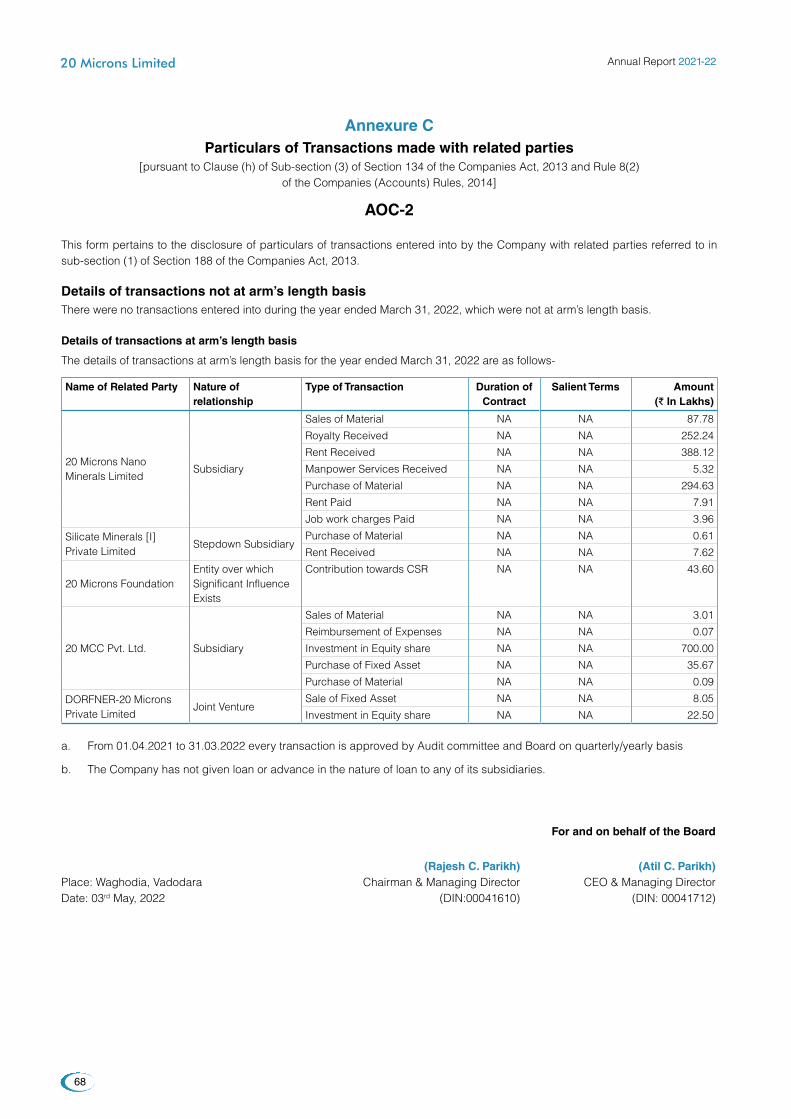
Annual Report 2021-22
68
20 Microns Limited
Annexure CParticulars of Transactions made with related parties
[pursuant to Clause (h) of Sub-section (3) of Section 134 of the Companies Act, 2013 and Rule 8(2) of the Companies (Accounts) Rules, 2014]
This form pertains to the disclosure of particulars of transactions entered into by the Company with related parties referred to in sub-section (1) of Section 188 of the Companies Act, 2013.
Details of transactions not at arm’s length basis There were no transactions entered into during the year ended March 31, 2022, which were not at arm’s length basis.
Details of transactions at arm’s length basis
The details of transactions at arm’s length basis for the year ended March 31, 2022 are as follows-
Name of Related Party Nature of relationship
Type of Transaction Duration of Contract
Salient Terms Amount (D In Lakhs)
20 Microns Nano Minerals Limited
Subsidiary
Sales of Material NA NA 87.78
Royalty Received NA NA 252.24
Rent Received NA NA 388.12
Manpower Services Received NA NA 5.32
Purchase of Material NA NA 294.63
Rent Paid NA NA 7.91
Job work charges Paid NA NA 3.96
Silicate Minerals [I] Private Limited
Stepdown SubsidiaryPurchase of Material NA NA 0.61
Rent Received NA NA 7.62
20 Microns FoundationEntity over which Significant Influence Exists
Contribution towards CSR NA NA 43.60
20 MCC Pvt. Ltd. Subsidiary
Sales of Material NA NA 3.01
Reimbursement of Expenses NA NA 0.07
Investment in Equity share NA NA 700.00
Purchase of Fixed Asset NA NA 35.67
Purchase of Material NA NA 0.09
DORFNER-20 Microns Private Limited
Joint VentureSale of Fixed Asset NA NA 8.05
Investment in Equity share NA NA 22.50
a. From 01.04.2021 to 31.03.2022 every transaction is approved by Audit committee and Board on quarterly/yearly basis
b. The Company has not given loan or advance in the nature of loan to any of its subsidiaries.
For and on behalf of the Board
(Rajesh C. Parikh) (Atil C. Parikh) Place: Waghodia, Vadodara Chairman & Managing Director CEO & Managing DirectorDate: 03rd May, 2022 (DIN:00041610) (DIN: 00041712)
AOC-2
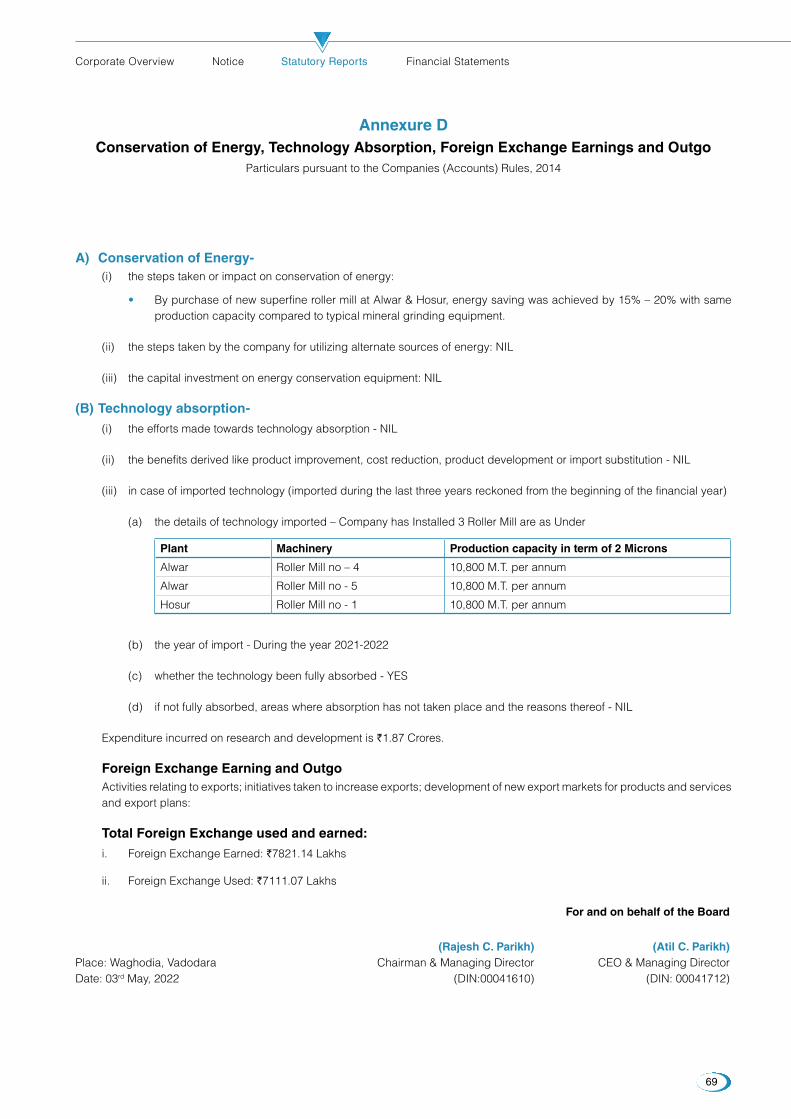
69
Corporate Overview Notice Statutory Reports Financial Statements
Annexure DConservation of Energy, Technology Absorption, Foreign Exchange Earnings and Outgo
Particulars pursuant to the Companies (Accounts) Rules, 2014
A) Conservation of Energy- (i) the steps taken or impact on conservation of energy:
• By purchase of new superfine roller mill at Alwar & Hosur, energy saving was achieved by 15% – 20% with same production capacity compared to typical mineral grinding equipment.
(ii) the steps taken by the company for utilizing alternate sources of energy: NIL
(iii) the capital investment on energy conservation equipment: NIL
(B) Technology absorption- (i) the efforts made towards technology absorption - NIL
(ii) the benefits derived like product improvement, cost reduction, product development or import substitution - NIL
(iii) in case of imported technology (imported during the last three years reckoned from the beginning of the financial year)
(a) the details of technology imported – Company has Installed 3 Roller Mill are as Under
Plant Machinery Production capacity in term of 2 Microns
Alwar Roller Mill no – 4 10,800 M.T. per annum
Alwar Roller Mill no - 5 10,800 M.T. per annum
Hosur Roller Mill no - 1 10,800 M.T. per annum
(b) the year of import - During the year 2021-2022
(c) whether the technology been fully absorbed - YES
(d) if not fully absorbed, areas where absorption has not taken place and the reasons thereof - NIL
Expenditure incurred on research and development is `1.87 Crores.
Foreign Exchange Earning and Outgo Activities relating to exports; initiatives taken to increase exports; development of new export markets for products and services
and export plans:
Total Foreign Exchange used and earned: i. Foreign Exchange Earned: `7821.14 Lakhs
ii. Foreign Exchange Used: `7111.07 Lakhs
For and on behalf of the Board
(Rajesh C. Parikh) (Atil C. Parikh) Place: Waghodia, Vadodara Chairman & Managing Director CEO & Managing DirectorDate: 03rd May, 2022 (DIN:00041610) (DIN: 00041712)

Annual Report 2021-22
70
20 Microns Limited
Annexure EAnnual Report on Corporate Social Responsibility (CSR) Activities 2021-22
1. Brief outline on CSR Policy of the Company: 20 Microns Ltd. recognizes that its business activities have wide impact on the societies in which it operates and therefore an
effective practice is required giving due consideration to the interests of its stakeholders including shareholders, customers, employees, suppliers, business partners, local communities and other organizations. The company endeavours to make CSR a key business process for sustainable development.
20 Microns is responsible to continuously enhance shareholders wealth; it is also committed to its other stakeholders to conduct its business in an accountable manner that creates a sustained positive impact on society. Our company is committed towards aligning with nature and has adopted eco-friendly practices. We set up 20 Microns Foundation Trust in 2001. This was done to focus on our CSR initiatives, long before the provision of the Companies Act, 2013, stating that the CSR activities undertaken by the Company has to be through a registered trust, came into force. The Company has also practice to carry out CSR by giving donation to other Trusts for the activities covered under Schedule VII of Companies Act, 2013.
2. Composition of CSR Committee:
Sl. No.
Name of Committee Member
Designation / Nature ofDirectorship
Number of meetings of CSR Committee
held during the year
Number of meetings of CSR Committee attended
during the year
1 Mr. Rajesh C Parikh Chairman 1 1
2 Mr. Ramkisan A. Devidayal Member 1 1
2 Mrs. Sejal R Parikh Member 1 1
3. Provide the web-link where Composition of CSR committee, CSR Policy and CSR projects approved by the board are disclosed on the website of the company: https://www.20microns.com/corporate-governance-investor/
4. Provide the details of Impact assessment of CSR projects carried out in pursuance of sub-rule (3) of rule 8 of the Companies (Corporate Social responsibility Policy) Rules, 2014, if applicable (attach the report): Not Applicable
5. Details of the amount available for set off in pursuance of sub-rule (3) of rule 7 of the Companies (Corporate Social responsibility Policy) Rules, 2014 and amount required for set off for the financial year, if any
a. FY 2020-2021 Company was required to spend `65.32 Lakhs but company has spent `79.42 Lakhs, excess amount of `14.10 Lakhs spent during 2020-21.
The Board of Directors at its meeting held on 28/06/2021 has authorised carrying forward excess payment of `14.10 Lakhs of FY: 2020-21 till next 3 Financial years.
b. In FY 2021-2022 Company was required to spend `64 Lakhs. Against which the Company has spent `57.88 Lakhs only.
The differential amount of `6.12 Lakhs will be set off from the excess amount spent in FY: 2020-21.
Balance amount of `7.98 Lakhs can be further set off in FY: 2022-23 and 2023-24.
6. Average net profit of the company as per section 135(5) (calculated for 3 preceding financial years i.e. FY 2018-19, FY 2019-20 & FY 2020-21: `3,193.06 Lakhs
7. (a) Two percent of average net profit of the company as per section 135(5): `64 Lakhs
(b) Surplus arising out of the CSR projects or programmes or activities of the previous financial years: NIL
(c) Amount required to be set off for the financial year, if any: `6.12 Lakhs
(d) Total CSR obligation for the financial year (7a+7b- 7c): `57.88 Lakhs
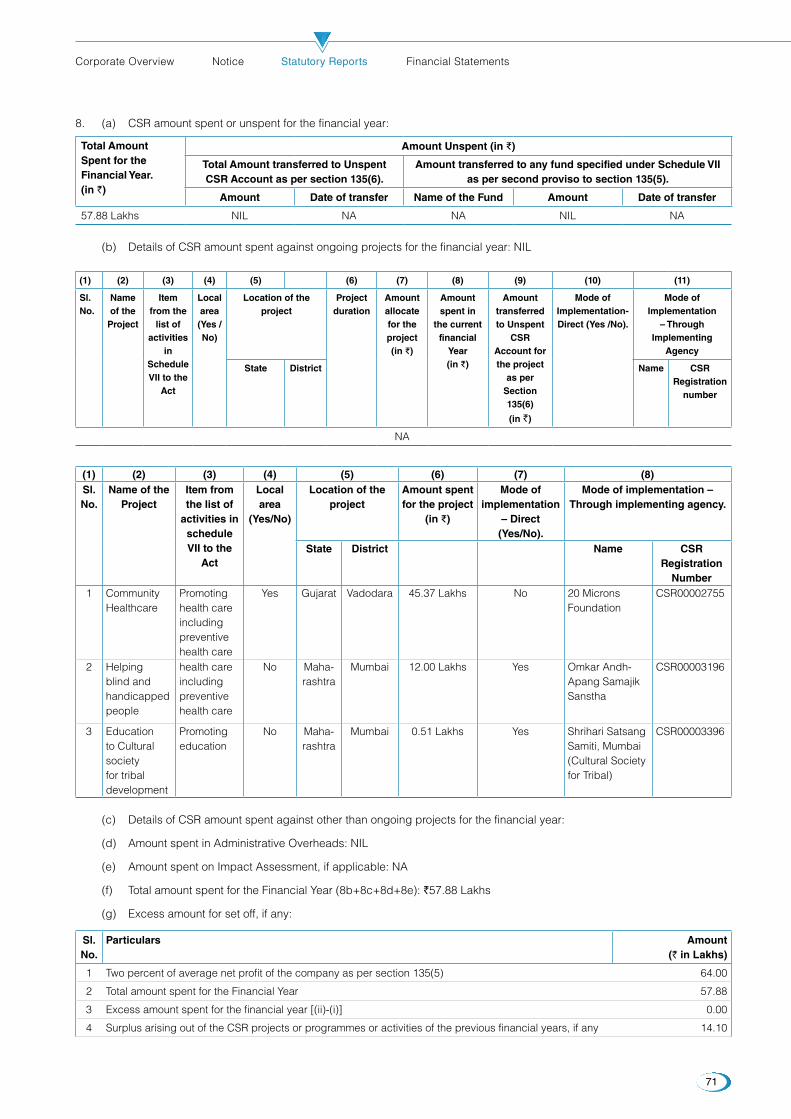
71
Corporate Overview Notice Statutory Reports Financial Statements
8. (a) CSR amount spent or unspent for the financial year:
Total Amount Spent for the Financial Year. (in `)
Amount Unspent (in D)
Total Amount transferred to Unspent CSR Account as per section 135(6).
Amount transferred to any fund specified under Schedule VII as per second proviso to section 135(5).
Amount Date of transfer Name of the Fund Amount Date of transfer
57.88 Lakhs NIL NA NA NIL NA
(b) Details of CSR amount spent against ongoing projects for the financial year: NIL
(1) (2) (3) (4) (5) (6) (7) (8) (9) (10) (11)
Sl. No.
Name of the
Project
Item from the
list of activities
in Schedule VII to the
Act
Local area (Yes /No)
Location of the project
Project duration
Amount allocate for the project (in D)
Amount spent in
the current financial
Year (in D)
Amount transferred to Unspent
CSR Account for the project
as perSection 135(6)
(in `)
Mode of Implementation- Direct (Yes /No).
Mode of Implementation
– Through Implementing
Agency
State District Name CSR Registration
number
NA
(1) (2) (3) (4) (5) (6) (7) (8)Sl. No.
Name of the Project
Item from the list of
activities in schedule VII to the
Act
Local area
(Yes/No)
Location of the project
Amount spent for the project
(in D)
Mode of implementation
– Direct (Yes/No).
Mode of implementation –Through implementing agency.
State District Name CSR Registration
Number1 Community
HealthcarePromoting health care including preventive health care
Yes Gujarat Vadodara 45.37 Lakhs No 20 Microns Foundation
CSR00002755
2 Helping blind and handicapped people
health care including preventive health care
No Maha-rashtra
Mumbai 12.00 Lakhs Yes Omkar Andh-Apang Samajik Sanstha
CSR00003196
3 Education to Cultural society for tribal development
Promoting education
No Maha-rashtra
Mumbai 0.51 Lakhs Yes Shrihari Satsang Samiti, Mumbai (Cultural Society for Tribal)
CSR00003396
(c) Details of CSR amount spent against other than ongoing projects for the financial year:
(d) Amount spent in Administrative Overheads: NIL
(e) Amount spent on Impact Assessment, if applicable: NA
(f) Total amount spent for the Financial Year (8b+8c+8d+8e): `57.88 Lakhs
(g) Excess amount for set off, if any:
Sl. No.
Particulars Amount (` in Lakhs)
1 Two percent of average net profit of the company as per section 135(5) 64.00
2 Total amount spent for the Financial Year 57.88
3 Excess amount spent for the financial year [(ii)-(i)] 0.00
4 Surplus arising out of the CSR projects or programmes or activities of the previous financial years, if any 14.10
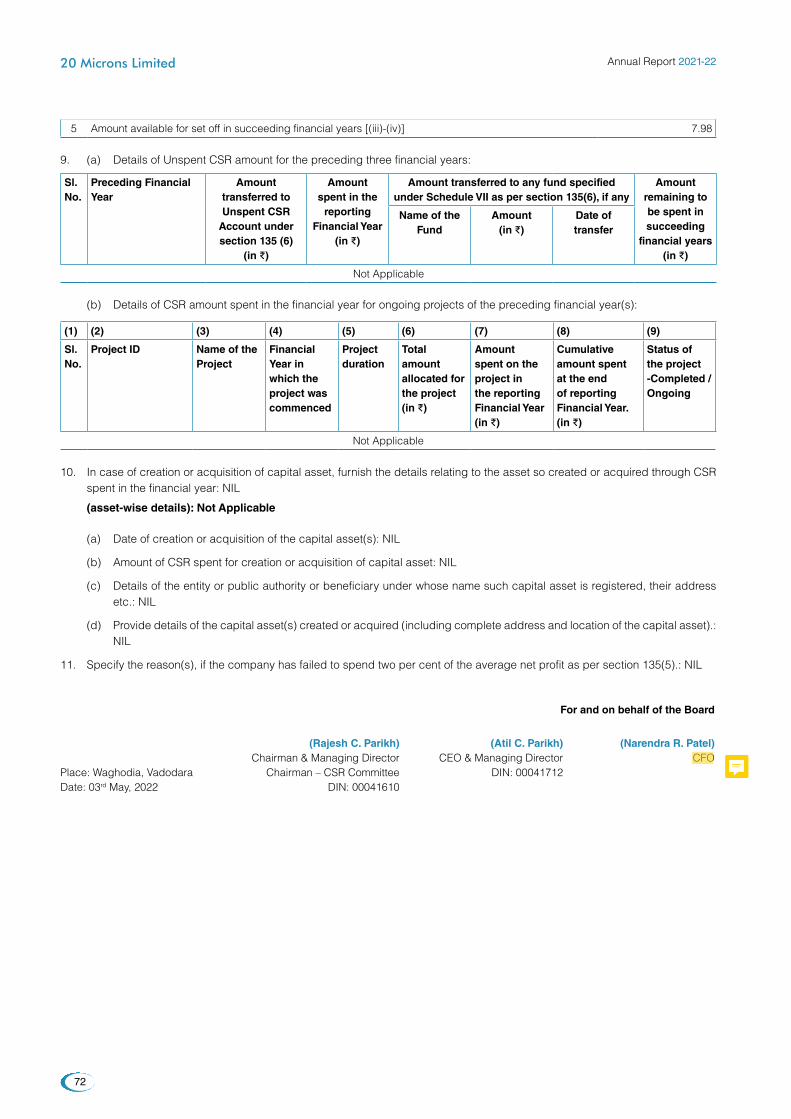
Annual Report 2021-22
72
20 Microns Limited
5 Amount available for set off in succeeding financial years [(iii)-(iv)] 7.98
9. (a) Details of Unspent CSR amount for the preceding three financial years:
Sl. No.
Preceding Financial Year
Amount transferred to Unspent CSR
Account under section 135 (6)
(in D)
Amount spent in the
reporting Financial Year
(in D)
Amount transferred to any fund specified under Schedule VII as per section 135(6), if any
Amount remaining to be spent insucceeding
financial years (in D)
Name of the Fund
Amount (in D)
Date of transfer
Not Applicable
(b) Details of CSR amount spent in the financial year for ongoing projects of the preceding financial year(s):
(1) (2) (3) (4) (5) (6) (7) (8) (9)
Sl. No.
Project ID Name of the Project
Financial Year in which the project was commenced
Project duration
Total amount allocated for the project (in D)
Amount spent on the project in the reporting Financial Year (in D)
Cumulative amount spent at the end of reporting Financial Year. (in D)
Status of the project -Completed /Ongoing
Not Applicable
10. In case of creation or acquisition of capital asset, furnish the details relating to the asset so created or acquired through CSR spent in the financial year: NIL
(asset-wise details): Not Applicable
(a) Date of creation or acquisition of the capital asset(s): NIL
(b) Amount of CSR spent for creation or acquisition of capital asset: NIL
(c) Details of the entity or public authority or beneficiary under whose name such capital asset is registered, their address etc.: NIL
(d) Provide details of the capital asset(s) created or acquired (including complete address and location of the capital asset).: NIL
11. Specify the reason(s), if the company has failed to spend two per cent of the average net profit as per section 135(5).: NIL
For and on behalf of the Board
(Rajesh C. Parikh) (Atil C. Parikh) (Narendra R. Patel) Chairman & Managing Director CEO & Managing Director CFOPlace: Waghodia, Vadodara Chairman – CSR Committee DIN: 00041712 Date: 03rd May, 2022 DIN: 00041610
komal
Highlight
komal
Sticky Note
please mention Chief financial officer in place of CFO

73
Corporate Overview Notice Statutory Reports Financial Statements
manaGement dIsCUssIon and anaLysIs
Global economy2020 will be etched in our minds as the year which marked the entry of the novel Corona Virus into our lives. And, since then, things have changed unprecedentedly across every sphere of human life. Battling the effects of Covid-19 across economies, the global economy entered the year 2022 in a much weaker position as the new Omicron variant of the Covid-19 virus continued to spread rapidly across countries. This resulted in a reimposition of mobility restrictions by the affected countries and it led to a decline in economic activities across the globe.
Further, the global economy remained stressed as the Ukraine and Russia war situation continues to roil financial markets, mainly because of the uncertainty surrounding the outcome of the war. Further, a steep rise in the oil prices following the war breakout is also expected to have a negative impact on the oil-dependent economies.
Dragged down by major issues such as high Covid-19 infection rates, above-target inflation, supply chain risks, and the recent war outbreak, the global economy is expected to moderate from 5.9% in 2021 to 4.4% in 2022. The slowdown will coincide with a widening divergence in growth rates between advanced economies and emerging & developing economies. Growth in advanced economies is expected to decline from 5% in 2021 to 3.8% in 2022 to 2.3% in 2023.
Regional Outlook:
East Asia and Pacific: Growth is projected to decelerate to 5.1% in 2022 before increasing slightly to 5.2% in 2023.
Europe and Central Asia: Growth is forecasted to slow down to 3% in 2022 and 2.9% in 2023.
Latin America and the Caribbean: Growth is projected to slow down to 2.6% in 2022 before increasing slightly to 2.7% in 2023.
The Middle East and North Africa: Growth is forecasted to accelerate to 4.4% in 2022 before slowing to 3.4% in 2023.
South Asia: Growth is projected to accelerate to 7.6% in 2022 before slowing down to 6.0% in 2023.
Sub-Saharan Africa: Growth is forecasted to accelerate slightly to 3.6% in 2022 and rise further to 3.8% in 2023.
In emerging and developing economies, growth is expected to drop from 6.3% in 2021 to 4.6% in 2022 and 4.4% in 2023. By 2023, all advanced economies are expected to achieve a full output recovery; yet output in emerging and developing economies will remain 4% below its pre-pandemic trend. For many vulnerable economies, the setback is even larger: the output of fragile and conflict-affected economies will be 7.5% below its pre-pandemic trend and the output of small island states would be 8.5% below.
Global growth projections
-6.0% -4.0% -2.0% 0.0% 2.0% 4.0% 6.0% 8.0%
2023#
4.7%
4.8%3.9%4.4%
6.5%4.0%5.9%
-2.0%-4.5%-3.1%
2.6%3.8%
2022#
2021*
2020*
Emerging markets and developing economies
Advanced economy Global economy
[Source: IMF, World Economic Outlook, January 2022]
[Note: *Estimated | #Projected]
In emerging and developing economies, growth is expected to drop from 6.3% in 2021 to 4.6% in 2022 and 4.4% in 2023.

Annual Report 2021-22
74
20 Microns Limited
Outlook Steady deployment of vaccination programs across economies and relaxation of pandemic-related lockdowns in many countries helped boost demand. This has led to the global economy surge by 5.5% to 5.9% in 2021, its strongest post-recession pace in 80 years. However, the resurgence of Covid-19 waves driven by the rapid spread of the Omicron variant and Russia’s invasion of Ukraine carries enormous risks for a world economy that’s yet to fully recover from the pandemic shock. The pandemic has left the global economy with two key points of vulnerability — high inflation and jittery financial markets. Aftershocks from the war could easily worsen both.
Further, according to economists in most countries, excess demand is driven mostly by constrained supply, not strong demand, resulting in the dominance of cost-push inflation. This is a type of inflation that is not being welcomed as it squeezes profit margins, erodes actual household income, and tends to self-correct when demand is weak. Thus, the global growth outlook, therefore, remains susceptible to a lingering pandemic, persistent labor market challenges, ongoing supply chain disruptions, rising inflation, and the outcome of the Russia-Ukraine war. As an ongoing economic impact of the war, rising crude oil prices are likely to have a significant toll on the oil-importing nations. Further, the recently imposed sanctions on Russia are expected to have a substantial impact on the global economy and financial markets, with significant spillovers to other countries.
Indian economyThe last couple of years have been difficult for the world on account of the regular Covid-19 waves, and India was no exception. Plagued by repeated Covid waves, supply chain disruptions and, more recently, inflation has created challenging times for the Indian policy makers. However, with a proactive government at the helm, the policy makers undertook key decisive measures and introduced a bouquet of safety-nets to cushion the impact on vulnerable sections of society and the business sector. Further, the government showcased consistent agility through different economic development measures, such as a significant increase in capital expenditure on infrastructure to build back medium-term demand as well as aggressively implemented supply side measures to prepare the economy for a sustained long-term expansion.
Backed by these positive measures, according to the government’s advanced estimates, industry expects the Indian economy to witness real GDP growth of 9.2% in 2021-22 after contracting in 2020-21, implying that overall economic activity has recovered past the pre-pandemic levels. This implies that the overall economic activity has recovered, past the pre-pandemic levels. Almost all indicators show that the economic impact of the second wave in Q1 was much smaller than anticipated even though the health impact was more severe. As mobility restrictions were lifted, many struggling industries came back to life. This is validated by the rapidly growing job market. The Naukri Job Speak index, an indicator of the nation’s job growth, climbed to its highest level in Feb 2022, with a sharp growth in
hiring in the insurance and retail sectors. There is a revival in employment in the auto industry along with other key industries, such as information technology (IT), hospitality, and financial services, remained robust.
Further, growth of the economy was driven by strong exports, thanks to the global economic recovery, and domestic private investment as businesses ramped up production to meet festive demand. Investments also maintained a steady pace of growth in the last two quarters of FY22 after declining for over a year, which indicates that the capital expenditure cycle is starting to gain traction.
Indian GDP growth (% annual growth)
FY22 9.2%
4.0%
6.5%
-7.3%
GDP growth
FY20
FY19
FY21
(Source: ET Article - Indian GDP may grow 9.2% this fiscal on base
effect, Jan 08, 2022)
Consumption demand, which has been a concern as the pandemic dented consumer finances and confidence, grew by 8.6% (YoY) – an enormous boost for the Indian economy. However, consumer spending lagged substantially from the pre–COVID-19 levels, suggesting that pandemic uncertainties are still weighing on consumers’ confidence and ability to spend.
OutlookAccording to the IMF, India’s prospects for 2023 are marked up on expected improvements to credit growth and, subsequently, investment and consumption, building on better-than-anticipated performance of the financial sector. The GDP is expected to grow in real terms by 8% to 8.5% in 2022-23. The industry expects the coming year to see an increase in private sector investment with the financial system in sturdy shape to support the country’s economic recovery. This projection is in line with the World Bank’s and Asian Development Bank’s recent predictions of 8.7% and 7.5% real GDP growth for FY23, respectively.
However, concerns surrounding the slow government spending to consolidate its expenses may pose a threat. India currently has the highest fiscal deficit among its peer nations and debt is at an all-time high. With the economy gradually coming out of the pandemic’s shadow and showing signs of a steady recovery, pent-up demand will probably sustain the growth momentum. This shows there is probably a lesser need for a stimulus package from the government. Besides, the government would like to build its capacity to respond to future adversities in case they arise. Another risk to the economy is the rising inflation

75
Corporate Overview Notice Statutory Reports Financial Statements
rates. Recent spikes in inflation have concerned policymakers as pent-up demand rose faster than supply.
FDI investments in IndiaForeign Direct Investment (FDI) is a critical enabler of any nation’s economic growth, as it is a major non-debt financial resource. Foreign companies invest in India to take advantage of relatively lower wages, and special investment privileges viz. tax exemption. Foreign investment also connotes to achieving technical know-how and generating employment.
The Indian Government’s favourable policy regime and robust business environment have ensured that foreign capital keeps flowing into the country. In recent years, the Government has taken many initiatives viz. relaxing FDI norms across sectors such as defense, PSU oil refineries, telecom, power exchanges, stock exchanges, etc.
However, owing to some recent adverse developments, India’s total foreign direct investment inflow witnessed a decline in 2021 and stood at US$ 74.01 billion. It is 15% lower than its previous year’s record US$ 87.55 billion, according to the data published by the Ministry of Commerce and Industry.
Key Foreign Direct Investments in India in the recent years
• In Jan 2022, Google announced an investment of US$ 1 billion in Indian telecom industry via a private player Bharti Airtel.
• Canada’s pension fund investment board invested US$ 160.49 million (`1,200 crores) as an anchor investor in the IPO of multiple Indian companies.
• According to the Ministry of New and Renewable Energy (MNRE), India’s green energy industry received FDI worth US$ 7.27 billion from 2014 to 15 to June 2021.
• Indian all-electric commercial original equipment manufacturer (OEM) EVage raised US$ 28 million from US-based venture capital firm Red Blue Capital.
• Swiggy raised US$ 700 million led by investment management company Invesco, with the food delivery startup now valued at US$ 10.7 billion.
• Analytics startup Fractal raised $360 million from private investment firm TPG Capital, elevating Fractal to unicorn status.
• B2B platform Moglix raised US$ 250 million, led by investors Tiger Global and Alpha Wave Global along with Hong Kong based Ward Ferry.
• Ola Electric raised US$ 200 million, led by Tekne Private Ventures, Alpine Opportunity Fund and Edelweiss, which now values the company at US$ 5 billion.
• Social commerce grocery startup Deal share raised US$ 165 million from Tiger Global and Alpha Wave Global.
• HR tech platform Darwin box raised US$ 72 million from investors, led by US-based Technology Crossover Ventures (TCV).
India’s Micro, Small and Medium Enterprises (MSME) sector The Indian MSME sector contributes significantly towards the economic and social development of the country by fostering entrepreneurship and generating large employment opportunities at comparatively lower capital cost, next only to agriculture.
Employing more than 100 million people, the Indian MSME sector forms the backbone of the economy as it helps generate employment and contribute a significant part to the nation’s GDP (Gross Development Product). The MSME sector has emerged as a highly vibrant and dynamic sector of the Indian economy over the last five decades. MSMEs are complementary to large industries as ancillary units, and this sector contributes significantly to the inclusive industrial development of the country. The MSMEs are widening their domain across sectors of the economy, producing a diverse range of products and services to meet demands of domestic as well as global markets. Over 63 million MSMEs spread across the country contributed 30.5% to India’s GDP in FY19 and 30% in FY20. Further, the MSME sector alone contributes to almost 45% of the total employment opportunities in the country, 50% of total exports from India, and 95% of total industrial units in the country. The Central Government expects a contribution of $2 trillion from the Micro Small and Medium Enterprises (MSMEs), which will eventually lead India, in accomplishing the goal of becoming a $5 trillion economy by 2024.
Key factors that are expected to aid in the sustainable growth of the MSME sector
Encouragement of FDIs: The influx of overseas players has poured considerable investment into the MSME sector. This aids MSMEs in adopting better technologies and resources, thereby ensuring improved productivity and competitiveness in the given marketplace.
Friendly industrial policies: Relaxed industrial policies have played a key role in boosting the MSME sector in India. The amicable norms pertaining to labour and regulatory requirements have enabled this sector to grow healthy.
Focus on Technology: The advent of cutting-edge technologies and improved production methods have aided MSMEs in improving their overall supply chain and productivity.
Government support: The government schemes like Credit Linked Capital Subsidy and Credit Guarantee Trust Fund for Micro & Small Enterprises are presently in action and facilitating easy funding without any hassle.
Access to capital: Several credit schemes launched by GOI are backing up MSMEs with adequate financial support to meet productivity needs with ease and maintain a healthy interplay with suppliers.

Annual Report 2021-22
76
20 Microns Limited
Key budget allocations to the Indian MSME Sector
• Budget Allocation for FY 2021-22 for the MSME more than doubled to `15,700 crore vis-à-vis `7,572 crore in 2020-21
• `10,000 crore corpus for provision of guarantee for borrowings - a huge relief to the sector
• Provisions for earlier announced Atma Nirbhar schemes (viz. Credit Guarantee Scheme for Subordinate Debt to MSMEs and Fund of Funds) to provide much needed financial succor and accessibility
• Proposed increase in capital expenditure to ̀ 7,50,246 crore, a 24.5% increase over the revised estimates of 2021-2022
• Extension of the Emergency Credit Line Guarantee Scheme (ECLGS) to March 2023, and expansion of guaranteed coverage to ̀ 5 lakh crores. This includes a special earmarked expenditure on hospitality and related enterprises. This scheme has provided additional credit to more than 130 lakh MSMEs so far.
• Proposed revamp of the Credit Guarantee Trust for Micro and Small Enterprises (CGTMSE) with an additional credit of `2 lakh crores to expand employment in the sector.
• PM Gati Shakti National Plan – A unified logistics platform comprising of integrated road, railway, airport, port, mass transport, waterway, and postal infrastructure for hassle-free delivery of material and packages.
• RAMP – Proposing the Raising and Accelerating MSME Performance Program with an investment of `6,000 crores over the next 5 years to make the MSME sector efficient, competitive, and resilient.
Indian mining industryIndustrial minerals are geological materials being mined for their commercial values. They are neither fuel nor sources of metals. Instead, they are being used in industries for their physical and chemical properties. They are used in their natural state or after beneficiation, either as raw materials or as additives, in a wide range of applications. Red ocher, limestone, clay, sand, gravel, diatomite, kaolin, bentonite, silica, barite, gypsum, pumice, potash, and talc are a few such.
These mined minerals are essential ingredients of our regular domestic and industrial products, catering to the sectors such as abrasives, various absorbents, cement, ceramics, chemicals, construction, drilling mud, electronics, filtration, flame retardants, foundry, glass, metallurgy, paint, pigment, plastics, papers, refractories, and synthetic fibres, among others. The existence of the mineral consuming market and its respective performance directly affect the demand and therefore the trade for mineral raw materials. The pattern of any industrial mineral trade hugely depends on the needs of the population and performing the economy, coupled with the availability of minerals.
The mining sector is an important segment of the Indian Economy. Since independence, there has been a pronounced growth in India’s mineral production, both quantity-wise and value creation wise. India produces around 95 minerals (including 4 fuels, 10 metallic, 23 non-metallic, 3 atomic, and 55 minor minerals). The mining industry in India contributes about 3% to the country’s gross domestic product. This industry is core to India’s growth ambition of becoming a USD5 trillion economy. Importantly, it is one of the largest generators of employment in the country, with this industry employing ~880,000 people in 2020-21.
Further, the allowance of Foreign direct investment (FDI) of 100% in exploration, mining, mineral processing and metallurgy through the automatic route, by way of equity participation in a company incorporated in India, for all non-fuel and non-atomic minerals (except for titanium-bearing minerals and ores).
GDP contribution of the Indian mining industryAs per the Ministry of Statistics and Program Implementation (MOSPI), GDP from mining increased to `798.32 billion in the fourth quarter of 2021 from `700.22 billion recorded in the 3rd quarter of 2021. According to Analysts’ expectations, GDP from Mining in India is expected to be `964.16 billion by the end of this quarter. In the long-term, India’s GDP contribution from mining is projected to trend around `901.22 billion in 2023 and `959.80 billion in 2024, according to econometric models. GDP from Mining in India averaged `735.55 billion from 2011 until 2021, reaching an all-time high of `1,056.74 billion in the 1st quarter of 2017 and a record low of `97.78 billion in the 1st quarter of 2019.
GDP contribution
Jan 2019
Jul 2019
Jul 2020
Jul 2021
Jan 2020
Jan 2021
Jan 2022
97.78
829.14
649.05
774.27
968.7
686.8
606.71
739.9
913.03
814.44
700.22
798.32
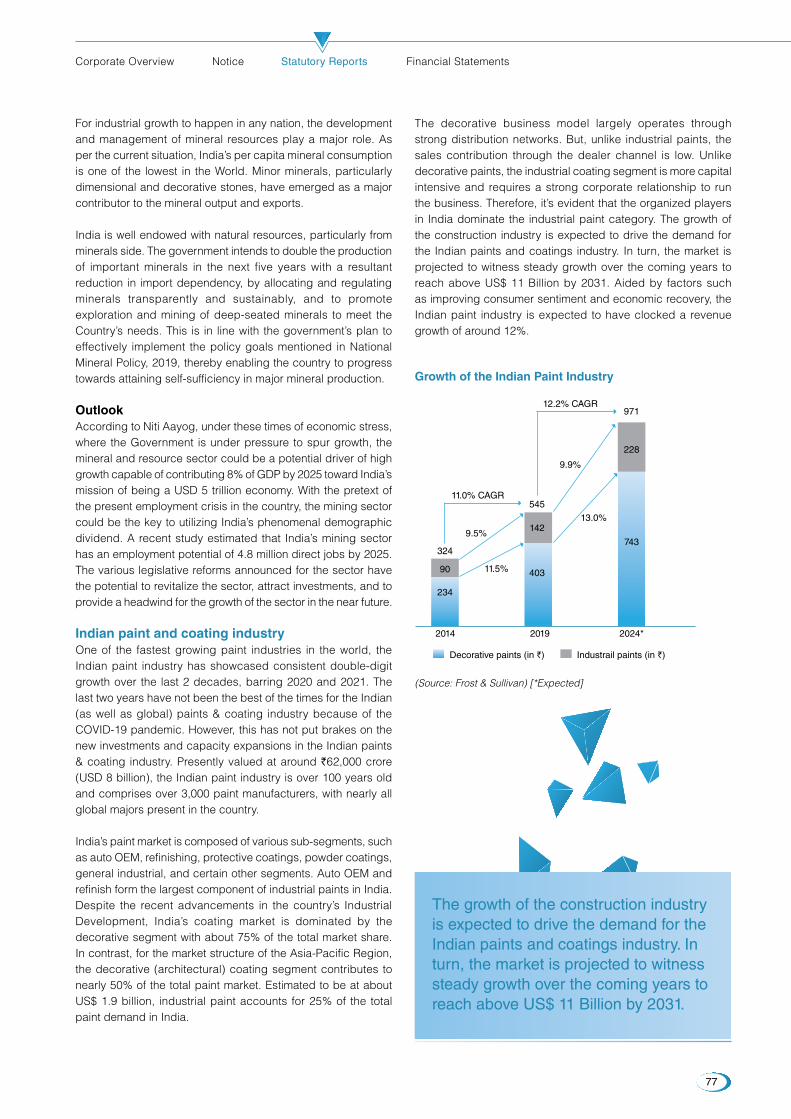
77
Corporate Overview Notice Statutory Reports Financial Statements
For industrial growth to happen in any nation, the development and management of mineral resources play a major role. As per the current situation, India’s per capita mineral consumption is one of the lowest in the World. Minor minerals, particularly dimensional and decorative stones, have emerged as a major contributor to the mineral output and exports.
India is well endowed with natural resources, particularly from minerals side. The government intends to double the production of important minerals in the next five years with a resultant reduction in import dependency, by allocating and regulating minerals transparently and sustainably, and to promote exploration and mining of deep-seated minerals to meet the Country’s needs. This is in line with the government’s plan to effectively implement the policy goals mentioned in National Mineral Policy, 2019, thereby enabling the country to progress towards attaining self-sufficiency in major mineral production.
OutlookAccording to Niti Aayog, under these times of economic stress, where the Government is under pressure to spur growth, the mineral and resource sector could be a potential driver of high growth capable of contributing 8% of GDP by 2025 toward India’s mission of being a USD 5 trillion economy. With the pretext of the present employment crisis in the country, the mining sector could be the key to utilizing India’s phenomenal demographic dividend. A recent study estimated that India’s mining sector has an employment potential of 4.8 million direct jobs by 2025. The various legislative reforms announced for the sector have the potential to revitalize the sector, attract investments, and to provide a headwind for the growth of the sector in the near future.
Indian paint and coating industryOne of the fastest growing paint industries in the world, the Indian paint industry has showcased consistent double-digit growth over the last 2 decades, barring 2020 and 2021. The last two years have not been the best of the times for the Indian (as well as global) paints & coating industry because of the COVID-19 pandemic. However, this has not put brakes on the new investments and capacity expansions in the Indian paints & coating industry. Presently valued at around `62,000 crore (USD 8 billion), the Indian paint industry is over 100 years old and comprises over 3,000 paint manufacturers, with nearly all global majors present in the country.
India’s paint market is composed of various sub-segments, such as auto OEM, refinishing, protective coatings, powder coatings, general industrial, and certain other segments. Auto OEM and refinish form the largest component of industrial paints in India. Despite the recent advancements in the country’s Industrial Development, India’s coating market is dominated by the decorative segment with about 75% of the total market share. In contrast, for the market structure of the Asia-Pacific Region, the decorative (architectural) coating segment contributes to nearly 50% of the total paint market. Estimated to be at about US$ 1.9 billion, industrial paint accounts for 25% of the total paint demand in India.
The decorative business model largely operates through strong distribution networks. But, unlike industrial paints, the sales contribution through the dealer channel is low. Unlike decorative paints, the industrial coating segment is more capital intensive and requires a strong corporate relationship to run the business. Therefore, it’s evident that the organized players in India dominate the industrial paint category. The growth of the construction industry is expected to drive the demand for the Indian paints and coatings industry. In turn, the market is projected to witness steady growth over the coming years to reach above US$ 11 Billion by 2031. Aided by factors such as improving consumer sentiment and economic recovery, the Indian paint industry is expected to have clocked a revenue growth of around 12%.
The growth of the construction industry is expected to drive the demand for the Indian paints and coatings industry. In turn, the market is projected to witness steady growth over the coming years to reach above US$ 11 Billion by 2031.
Growth of the Indian Paint Industry
228
971
9.9%
13.0%
9.5%
11.0% CAGR
12.2% CAGR
11.5%
743
403
545
234
90
324
142
2014
Decorative paints (in `) Industrail paints (in `)
2019 2024*
(Source: Frost & Sullivan) [*Expected]

Annual Report 2021-22
78
20 Microns Limited
Growing demand for paints in IndiaThe Indian paint and coatings industry in the last year witnessed a robust volume growth led by demand from repainting and new construction. Strong festive demand coupled with good monsoon aided the growth in the repainting segment in both urban and rural areas. Further, with the growing focus on the reviving the Indian construction and real estate sector from the government, the industry is expected to a steady rise in demand for fresh paints. Acceptance of better paint products in smaller towns, and up-gradation to premium brands in cities and large towns will enable the value growth for the players in the industry.
Further, critical value additions such as water-proofing abilities are likely to propel the demand for paints. The technology involved in producing water-proofing products and its business economics is very much similar to paints. Hence, this does not require any significant resources from paints companies and can be sold through their existing distribution channels.
New trends reorienting the Indian paint industryGrowing demand from smaller towns and rural areas: In the last few years, the paint industry witnessed the demand from smaller cities and towns growing at a faster pace than metro and Tier I cities.
Organised players focusing on growing their presence in smaller towns and cities: Paint companies have been proactively expanding their dealer base in Tier II, III and IV markets and rural areas to enhance presence.
Organised players focusing on innovation and value addition: More and more organised players in the paint industry have focused on value addition and innovation such as water-proofing capabilities and higher luminosity, among others.
Growing interest in premium segment: The Indian paint industry has been witnessing an increasing shift in upgradation/premiumisation for more than a decade now. Increased focus on aesthetics and enhanced availability of quality resources has led to growth in demand for upgradation and premiumisation.
Key demand drivers • Growing nuclearization of families
• Rising urbanization
• Supporting government policies: The government introduced many favourable policies, such as ‘Housing for all’, ‘Smart City’, Atal Mission for Rejuvenation and Urban Transformation (AMRUT) and ‘Affordable Housing’
• Shortening of re-painting cycle
• Growing demand from smaller towns and rural areas
• Growing focus on the part of the organised players on product innovation and value addition
• Rising demand for non-residential property
• Rising demand for commercial and personal vehicles
• Rising demand for consumer durable goods
• Increasing focus on the part of the government on the manufacturing segment
• Growing adoption of water-borne coatings due to low or no VOC emissions
Outlook for the paint industryA low per capita consumption compared to the global average, India’s average per capita consumption 4.1 kgs compared to the global average of ~13-15 kgs, gives the Indian player immense headroom for the domestic market to grow in the long term given that structural drivers of the industry and economy aiming to emerge as a $5 trillion economy. With onset of the pandemic, the impairment in the construction industry invariably has affected the paints and coatings market of the country. However, with the opening up of the economy and withdrawal of the travel restrictions, the economy has returned on its growth track. This has resulted in a steady rise in demand along with a rise in the real estate and infrastructure activities.
The Indian paint industry has been witnessing a gradual shift in the preferences of people from the traditional whitewash to high-quality paints, like emulsions and enamel paints, which is providing the basic stability for growth of Indian paint industry. Besides, it is creating a strong competitive market, where players are utilizing different strategies to tap the growing demand in the market for a larger share. Moreover, rise in disposable income of the average middle class coupled with increasing investment on education; urbanization; development of the rural market; and various launches of many innovative products, like friendly, odour free, and dust & water-resistant paints, are major drivers that are propelling the growth of the paint market in India.
Indian plastics industryPlastics constitute a very important and one of the fastest-growing segments of the Indian economy. It contributes significantly to the growth of various key sectors in the country such as automotive, agriculture, construction, electronics, healthcare, textiles, and FMCG, among others, being an integral part of the industrial value chain. Plastic is a highly desirable material with wide industrial applications because of its properties viz. low cost, lightweight, durability, and high strength.
Recognised across the globe as the plastic hub of the world because of its low production cost and huge plastic demand, the Indian plastics industry employs about 40 lakh workers and comprises around 30,000 processing units and 2,000 exporters.
The Indian plastics industry produces and export a wide range of raw materials, plastic-moulded extruded goods, polyester films, moulded/ soft luggage items, writing instruments, plastic woven sacks and bags, polyvinyl chloride (PVC), leather cloth and sheeting, packaging, consumer goods, sanitary fittings, electrical accessories, laboratory/ medical surgical ware, tarpaulins, laminates, fishnets, travel ware, and others.
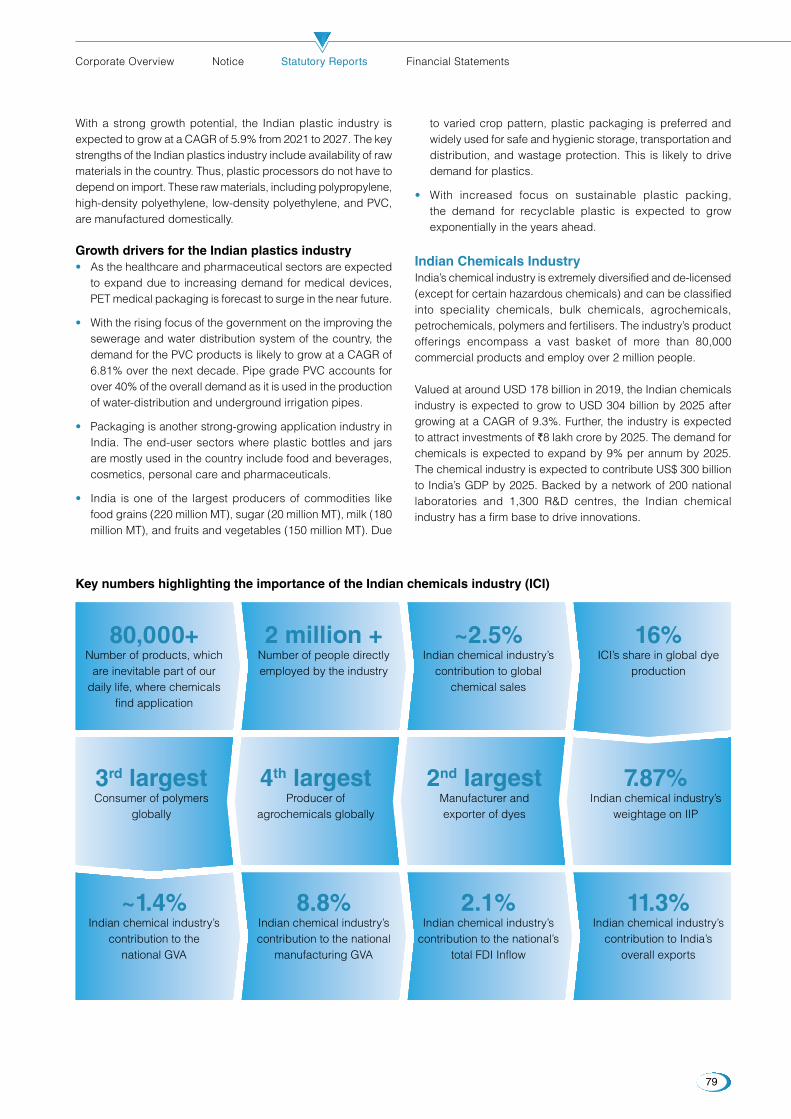
79
Corporate Overview Notice Statutory Reports Financial Statements
With a strong growth potential, the Indian plastic industry is expected to grow at a CAGR of 5.9% from 2021 to 2027. The key strengths of the Indian plastics industry include availability of raw materials in the country. Thus, plastic processors do not have to depend on import. These raw materials, including polypropylene, high-density polyethylene, low-density polyethylene, and PVC, are manufactured domestically.
Growth drivers for the Indian plastics industry • As the healthcare and pharmaceutical sectors are expected
to expand due to increasing demand for medical devices, PET medical packaging is forecast to surge in the near future.
• With the rising focus of the government on the improving the sewerage and water distribution system of the country, the demand for the PVC products is likely to grow at a CAGR of 6.81% over the next decade. Pipe grade PVC accounts for over 40% of the overall demand as it is used in the production of water-distribution and underground irrigation pipes.
• Packaging is another strong-growing application industry in India. The end-user sectors where plastic bottles and jars are mostly used in the country include food and beverages, cosmetics, personal care and pharmaceuticals.
• India is one of the largest producers of commodities like food grains (220 million MT), sugar (20 million MT), milk (180 million MT), and fruits and vegetables (150 million MT). Due
to varied crop pattern, plastic packaging is preferred and widely used for safe and hygienic storage, transportation and distribution, and wastage protection. This is likely to drive demand for plastics.
• With increased focus on sustainable plastic packing, the demand for recyclable plastic is expected to grow exponentially in the years ahead.
Indian Chemicals IndustryIndia’s chemical industry is extremely diversified and de-licensed (except for certain hazardous chemicals) and can be classified into speciality chemicals, bulk chemicals, agrochemicals, petrochemicals, polymers and fertilisers. The industry’s product offerings encompass a vast basket of more than 80,000 commercial products and employ over 2 million people.
Valued at around USD 178 billion in 2019, the Indian chemicals industry is expected to grow to USD 304 billion by 2025 after growing at a CAGR of 9.3%. Further, the industry is expected to attract investments of `8 lakh crore by 2025. The demand for chemicals is expected to expand by 9% per annum by 2025. The chemical industry is expected to contribute US$ 300 billion to India’s GDP by 2025. Backed by a network of 200 national laboratories and 1,300 R&D centres, the Indian chemical industry has a firm base to drive innovations.
Key numbers highlighting the importance of the Indian chemicals industry (ICI)
80,000+Number of products, which
are inevitable part of our daily life, where chemicals
find application
~1.4%Indian chemical industry’s
contribution to the national GVA
3rd largestConsumer of polymers
globally
2 million +Number of people directly employed by the industry
8.8%Indian chemical industry’s contribution to the national
manufacturing GVA
4th largestProducer of
agrochemicals globally
~2.5%Indian chemical industry’s
contribution to global chemical sales
2.1%Indian chemical industry’s
contribution to the national’s total FDI Inflow
2nd largestManufacturer and exporter of dyes
16%ICI’s share in global dye
production
11.3%Indian chemical industry’s
contribution to India’s overall exports
7.87%Indian chemical industry’s
weightage on IIP
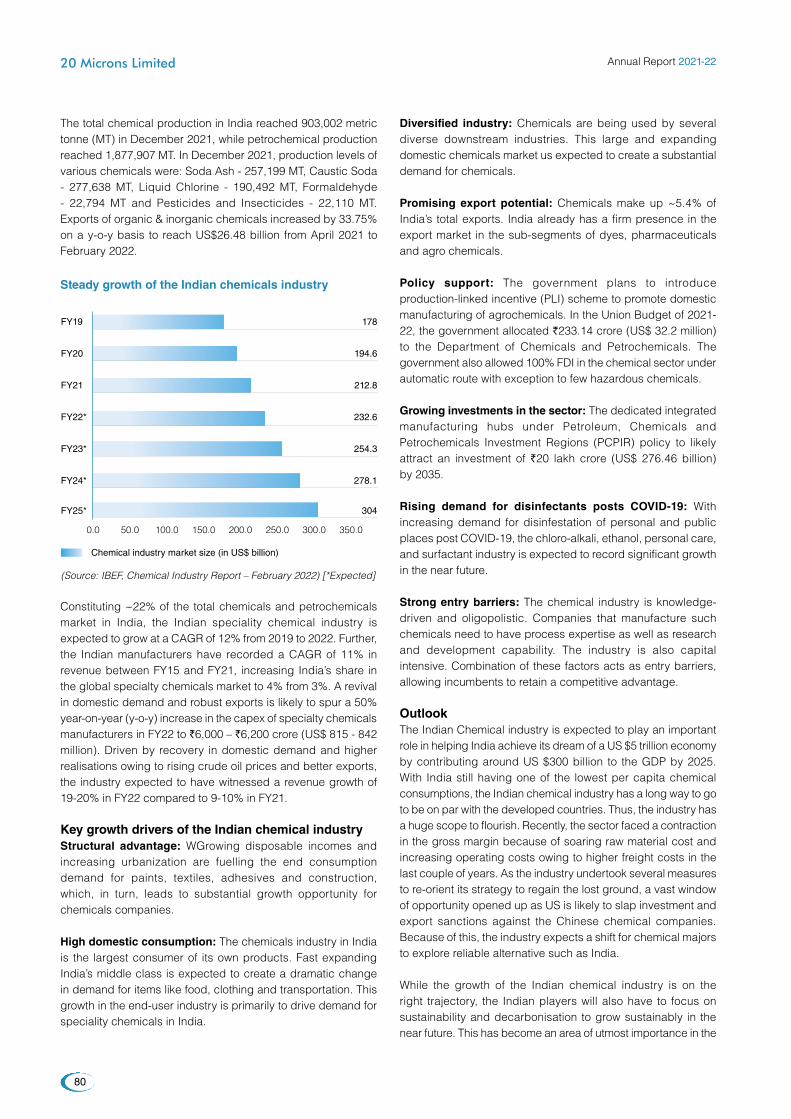
Annual Report 2021-22
80
20 Microns Limited
The total chemical production in India reached 903,002 metric tonne (MT) in December 2021, while petrochemical production reached 1,877,907 MT. In December 2021, production levels of various chemicals were: Soda Ash - 257,199 MT, Caustic Soda - 277,638 MT, Liquid Chlorine - 190,492 MT, Formaldehyde - 22,794 MT and Pesticides and Insecticides - 22,110 MT. Exports of organic & inorganic chemicals increased by 33.75% on a y-o-y basis to reach US$26.48 billion from April 2021 to February 2022.
Constituting ~22% of the total chemicals and petrochemicals market in India, the Indian speciality chemical industry is expected to grow at a CAGR of 12% from 2019 to 2022. Further, the Indian manufacturers have recorded a CAGR of 11% in revenue between FY15 and FY21, increasing India’s share in the global specialty chemicals market to 4% from 3%. A revival in domestic demand and robust exports is likely to spur a 50% year-on-year (y-o-y) increase in the capex of specialty chemicals manufacturers in FY22 to `6,000 – `6,200 crore (US$ 815 - 842 million). Driven by recovery in domestic demand and higher realisations owing to rising crude oil prices and better exports, the industry expected to have witnessed a revenue growth of 19-20% in FY22 compared to 9-10% in FY21.
Key growth drivers of the Indian chemical industryStructural advantage: WGrowing disposable incomes and increasing urbanization are fuelling the end consumption demand for paints, textiles, adhesives and construction, which, in turn, leads to substantial growth opportunity for chemicals companies.
High domestic consumption: The chemicals industry in India is the largest consumer of its own products. Fast expanding India’s middle class is expected to create a dramatic change in demand for items like food, clothing and transportation. This growth in the end-user industry is primarily to drive demand for speciality chemicals in India.
Steady growth of the Indian chemicals industry
FY19 178
194.6
212.8
232.6
254.3
278.1
304
Chemical industry market size (in US$ billion)
FY20
FY21
FY22*
FY23*
FY24*
FY25*
0.0 350.0300.0250.0200.0150.0100.050.0
(Source: IBEF, Chemical Industry Report – February 2022) [*Expected]
Diversified industry: Chemicals are being used by several diverse downstream industries. This large and expanding domestic chemicals market us expected to create a substantial demand for chemicals.
Promising export potential: Chemicals make up ~5.4% of India’s total exports. India already has a firm presence in the export market in the sub-segments of dyes, pharmaceuticals and agro chemicals.
Policy support: The government plans to introduce production-linked incentive (PLI) scheme to promote domestic manufacturing of agrochemicals. In the Union Budget of 2021-22, the government allocated `233.14 crore (US$ 32.2 million) to the Department of Chemicals and Petrochemicals. The government also allowed 100% FDI in the chemical sector under automatic route with exception to few hazardous chemicals.
Growing investments in the sector: The dedicated integrated manufacturing hubs under Petroleum, Chemicals and Petrochemicals Investment Regions (PCPIR) policy to likely attract an investment of `20 lakh crore (US$ 276.46 billion) by 2035.
Rising demand for disinfectants posts COVID-19: With increasing demand for disinfestation of personal and public places post COVID-19, the chloro-alkali, ethanol, personal care, and surfactant industry is expected to record significant growth in the near future.
Strong entry barriers: The chemical industry is knowledge-driven and oligopolistic. Companies that manufacture such chemicals need to have process expertise as well as research and development capability. The industry is also capital intensive. Combination of these factors acts as entry barriers, allowing incumbents to retain a competitive advantage.
OutlookThe Indian Chemical industry is expected to play an important role in helping India achieve its dream of a US $5 trillion economy by contributing around US $300 billion to the GDP by 2025. With India still having one of the lowest per capita chemical consumptions, the Indian chemical industry has a long way to go to be on par with the developed countries. Thus, the industry has a huge scope to flourish. Recently, the sector faced a contraction in the gross margin because of soaring raw material cost and increasing operating costs owing to higher freight costs in the last couple of years. As the industry undertook several measures to re-orient its strategy to regain the lost ground, a vast window of opportunity opened up as US is likely to slap investment and export sanctions against the Chinese chemical companies. Because of this, the industry expects a shift for chemical majors to explore reliable alternative such as India.
While the growth of the Indian chemical industry is on the right trajectory, the Indian players will also have to focus on sustainability and decarbonisation to grow sustainably in the near future. This has become an area of utmost importance in the
81
Corporate Overview Notice Statutory Reports Financial Statements
recent times, reason being US and European Union are rapidly moving up the sustainability chain for the chemical industry. With more and more Indian chemical companies aligning themselves with the sustainability goals, it opens up a huge opportunity for the Indian players. Most of these companies have already charted out their plans for increased investment
in green, recycling technology, R&D, digitization etc to achieve their sustainability goals. On the policy front, Production Linked Incentives (PLI) is a good measure as it incentivizes the industry to quickly put-up investment and start commercializing sales. Chemical industry also needs to be incentivized to push making India a global manufacturing hub.
Indian rubber industryIndia’s rubber business has grown into a significant part of the country’s economy. India ranks third and fourth in worldwide rubber output and consumption, respectively.
The commercialisation of the Indian rubber industry began in 1902 when forward-thinking Indian farmers realised the benefits of rubber as a financially viable crop. Initially, large rubber estates dominated the industry structure. However, currently, over 76% of rubber estates are currently smaller than 200 hectares, and nearly 34% are smaller than 40 hectares. With over 6,000 production units, the rubber manufacturing business is divided amongst 30 large-scale, 300 medium-scale, and around 5600 tiny production units.
Employing more than 4,00,000 people, India’s rubber industry expected to have clocked $5.6 billion in revenue. India’s synthetic rubber demand stood at 671 thousand tonnes in FY 2021. However, the industry is forecasted to reach 1,055.30 thousand tonnes by 2030, growing at a healthy CAGR of 5.16% until FY 2030. This market growth attributes to the proprietary advantages of synthetic rubber. Synthetic rubber is elastic.
Most of the rubber consumption in India comes from the transportation sector, followed by the footwear industry. Export products included automotive tires and tubes, footwear, pharmaceutical goods and hoses, cots, and aprons.
Indian speciality chemical industryA highly diversified industry, the Indian speciality chemicals industry is valued at about $25 billion, has successfully delivered 13% growth over the past five years, primarily led by strong domestic consumption. By constituting about 3% of the global speciality chemicals market, this sector has great potential. Backed by favourable domestic and international demand, the industry is expected to grow to $80-100 billion in 2023.
The applications of the speciality chemicals market includes advanced ceramic materials, construction chemicals, cosmetic chemicals, water management chemicals, oil field chemicals, textile chemicals, food additives, and others such as rubber processing chemicals, and speciality paper chemicals. Speciality chemicals by functions include adhesives and sealants, catalysts, corrosion inhibitors, antioxidants, flame retardants, separation membranes, synthetic dyes, speciality pigments, demulsifiers, rheology modifiers, and water-soluble polymers.
Further, the experts expect the industry to outpace its Chinese counterpart and double its share in the global market to ~6% by 2026 from 3 to 4% in FY21. This will ride on a strong revenue growth of 18-20% in the current fiscal and 14-15% in the next, compared with single-digit growth in the previous two fiscals.
Growth of the industry is expected to be powered by strong tailwinds in exports due a shift in global supply chain driven by the China+1 policy of vendors and demand recovery in domestic end-user segments.
Potential growth drivers of the Indian speciality chemicals industry
• The speciality chemical industry is a key enabler for other industries. As chemicals are consumed in varying proportion by every industry (rightly from electronics to paints, from pharmaceuticals to cosmetics), without the speciality chemicals sustainable development of other sectors is not possible.
• The growth for speciality chemicals is driven by both domestic consumption and exports. Speciality chemicals have applications across consumer (e.g. personal care chemicals), industrial (e.g. water chemicals) and infrastructure (e.g. construction chemicals) segments are driven by the overall growth of the Indian economy.
• Tightening environmental norms in developed countries and the slowdown in China are expected to contribute towards the growth of exports.
• “Make in India” campaign is also expected to add impetus to the emergence of India as a manufacturing hub for the chemicals industry in the medium term.
• Agrochemical growth has a strong linkage to the growth of the rural economy. In certain segments (such as agrochemicals, dyes and pigments, flavours and fragrances), a significant proportion of production in India is exported. Exports are growing rapidly as India is becoming an important manufacturing hub for such chemicals.
Annual Report 2021-22
82
20 Microns Limited
Indian ceramic industryThe second largest manufacturer of ceramic tiles, the Indian ceramic industry accounts for 7% (~955 mio sqm) of the global production. Valued at around US$ 3720.2 million in 2019, the industry is expected to reach US$ 7,144.7 million by 2027, growing at a CAGR rate of 8.6%. The India ceramic tiles market is primarily driven by the rapidly expanding residential and commercial sectors. In addition to this, the government of India (GOI) has launched several programs that favourably impact the ceramic tile industry, which is providing an impetus to the market growth.
The Indian ceramic tile industry witnessed various challenges from the economy coupled with the unorganised sector over the past few years. Nearly ~40% of the industry was organised, whereas the remaining 60% was mainly unorganised, constituting players from regions such as Morbi, Rajkot and various clusters, among others.
The industry is driven by higher infrastructure spending by the Government, increasing urbanisation and transformation in consumer preferences, which is boosting the demand for ceramic tiles in commercial and residential establishments. The new projects undertaken along with the growing
Company Overview20 Microns is one of India’s leading and fastest-growing micronized industrial minerals and speciality chemical manufacturing companies offering a wide range of innovative products which finds application across different industries such as paints, polymers, paper, plastic, ceramics, rubber, oil well drilling, agrochemicals, and adhesives & sealants, among others. Incorporated in 1987, 20ML today is India’s largest producer of white minerals. Backed by seven mines (five captive and two
leased), nine state-of-the-art manufacturing facilities and two R&D centres, the company’s white minerals help the Company cater to a cross section of industry across the globe. With the best manufacturing practices and ultra-modern R&D centers the international business forms one-fourth of the company’s business with a firm presence in more than 65 countries across Europe, Africa, Australia, South America and Asia Pacific.
application of tiles in replacement and renovation projects are fuelling the demand for ceramic tiles. Moreover, the replacement market is anticipated to capture robust growth, steering the growth of ceramic tiles. The Indian ceramic tile industry is anticipated to grow at a CAGR of 8% in the next few years.
Growth drivers for the industryRising domestic consumption and exports to drive the ceramics industry
• Major Export markets: Middle East and Europe
• 20% of the total ceramics export is shipped to Saudi Arabia
Growth in real estate market, upcoming government initiatives for low-cost housing along with Swachh Bharat programme to push the demand for sanitary ware from ~12% to 15%
• Tableware category being largely unorganized and under penetrated shows great potential- reason being demand for a better lifestyle and increased spending on designed products
• Technical ceramics market in India is currently at a nascent stage. Growing popularity of this segment is expected to drive growth.
Grow and strengthen network
advantage
Deliver operational and organisational
efficiencies
Disciplined allocation of capital and
improved cash flow generation
Innovate offerings and services to
create new value
Build a talented workforce
Our core strengthsResearch – Insights and expertise into complex mineralogy and continued focus on research & development.
Market leadership – The Company is a market leader in the industry segments it operates and enjoys domestic leadership in key segments such as Paint, Coating and Plastic among others.
Product portfolio – The product portfolio comprises niche products assuring integration and synergy in operating facilities.
Strong collaborations – The Company has well-founded technical partnerships with renowned global players.
Synergies – The Company lays great emphasis on synergies, which has augmented its quest for global leadership and helps to keep its competitive advantage.
83
Corporate Overview Notice Statutory Reports Financial Statements
Our operational excellenceWe have integrated operations with processes ranging from manufacturing micro sized to nano-sized industrial mineral and speciality chemicals to niche and complex ones. This allows us flexibility to focus on manufacturing products that enjoy encouraging demand and offer better price. We leveraged this advantage to run our manufacturing units at optimum capacity utilisation to cater to the rising demand.
We undertake initiatives like improving process efficiencies and dedicated research and development on an ongoing basis to drive operational excellence. Our manufacturing is supported by robust inbound and outbound logistics and distribution network that ensure supply reliability. Further, we are focused on enhanced usage of data and analytics to take real-time and focused decisions.
Business segment reviewSegment IPaints and Coatings One of the core focus sectors for the Company, paints and coatings segment contributes 51.6% to the overall revenue mix. The Company is one of the leading suppliers of industrial minerals of different particle sizes from coarser to fine to ultra-fine sizes. Today, the Company is one of the Level1 supplier of micronized industrial minerals to all the leading paint and coating manufacturing companies. We introduced 32 new products during the year, to further bolster our presence in the segment.
Core productsEngineered Kaolin | Calcium Carbonate | Opacifiers | Matting Agent | Inorganic Rheological Modifiers | Coloured Quartz | Wax & Wax Emulsion | Mica | Talc | Silica | Barytes
Industries servedPaint | Ink | Pigments
Segmental growth drivers • Rising population leading to growing demand for houses and
home beautification. More house means higher requirement of paints.
• Growing aesthetics sense, large youth population, and rising affordability have resulted in growing demand for premium and value-added products.
• Rising demand from the rural and semi urban areas is expected to drive demand for the paint industry
• Rising affordability has led to the steady growth of the Indian automobile industry and the Indian real estate industry over the last decade.
Segment IIPolymers | Paper & RubberThe second most important sector, after the paint and coatings industry, and contributes nearly 33.3% to the overall revenue mix. In FY22, the Company continued to cement its market position in India in the polymer, paper and rubber segment. The growth strategy was driven by introduction of innovative
and value-added products, expansion of our product footprint in new geographies, and increase the base of OEM clients. We periodically introduced innovative products in this segment to bolster our presence.
Core productsUncoated Calcium Carbonate | Coated Calcium Carbonate | Talc | Mica | Engineered Kaolin | Micronized Waxes | Opacifiers | Calcium Oxides | Barium Sulfates | Fumed Silica | Feldspar | Diatomaceous Earth | ATH
Industries ServedPolymers | Rubber | Cosmetics | Paper
Segmental growth drivers • Increasing focus on using biodegradable plastics.
• With the economy on the recovery path, the Indian automobile industry witnessed a considerable growth in demand in FY22. Resulting in the Indian rubber and chemical industry witnessing a steady growth in demand in FY22.
• The Indian cosmetics and grooming industry witnessed a steady growth in the demand and is expected to touch $28,985.33 million by FY26 after growing a CAGR of 16.39%. The growth is expected to be aided by rising affordability, huge youth and working-class population and growing penetration of the ecommerce industry. In addition, rapid urbanisation, easy access to the internet, and the high penetration of smartphones are expected to catalyse the demand for beauty products across India.
• India’s rising literacy rate and growing focus on sustainable packaging is like to drive growth of the Indian paper industry.
Segment IIIAllied DivisionThe third largest division amongst 20ML’s revenue mix, the division caters to different industries such as Ceramic, Adhesive and Sealants, Construction Chemicals, Agro Chemicals, Hydrocarbon, Foundry and other verticals.
The key strategy of the division is to continuously offer new products to make our customer’s products more competitive in terms of quality and also to offer competitive products against global mineral players.
We are focused upon manufacturing new and innovative products for Ceramics and Refractory industry at our dedicated ceramics application center. Commercial trials for the multi-functional mineral products for selective ceramics sub-applications have been completed and we have also launched a new range of products in the market for which have received positive feedback from our customers. Having established dedicated blending platforms of scalable volume for the various grades, we are looking forward to higher sales volume in the foreseeable future in this segment.
Core productsKaolin | Calcined Kaolin | Ball Clay | Calcium Carbonate | Tigersil | Koolsil | Gypsum | Colour Floor Silica | Minfert – BLK GBR | Geocare | Humicrons
Annual Report 2021-22
84
20 Microns Limited
Key application industryReal estate | Housing industry | Agro chemicals | Fertilizer
Segmental growth drivers • India is the second largest producer of Ceramic products
following China. Because of the recent geopolitical scenario, the industry witnessed a quick upturn. Hence, the demand for Indian ceramic products has increased drastically, which has resulted in generating higher revenue for us during the year.
• India is a bright spot in the rising crop protection industry. Despite the pandemic, in the last couple of year, the industry witnessed a steady growth in sales in line with the expectations.
• Expanding population and scarcity of natural resources and arable land are expected to create a stronger demand for Agro-chemical products. This is likely to create a demand for sustainable solutions to extract more out of the land with less use of water, energy, chemicals, leading to lower carbon footprint and food wastage.
• Indian agriculture industry has been on a growth trajectory and investments in the agrochemicals sector for developing new molecules have grown here as more Indian companies have increased their expenditures in research and innovation.
• Favourable government policies, the Indian fertilizer and agro chemicals industry is expected witness vigorous growth in the years ahead.
• Indian real estate industry is on a rise thanks rising number of nuclear families and rising working population.
• The government announced different key initiatives and schemes which have helped in the steady growth of home ownership in India. These schemes are likely to provide the required impetus for growth for the nation’s affordable housing segment.
• Record low home loan interest rates, coupled with income tax incentives and concessional stamp duty rates, are expected to bolster the demand for affordable housing and especially for first-time homeowners.
• In other industry segments, like Adhesive and Sealant, Construction Chemicals, Hydrocarbon, Detergent and Foundry among others, we have been working to enhance the product portfolios to enhance our offerings and services and to add more value-added products. Value-added products are likely to help 20ML to increase our global market share through deeper penetration and to strengthen the presence in existing markets.
Our agriculture and organic farming products USP • Our thoughtfully designed product and solutions portfolio addresses the evolving needs of farmers that help the farmers
increase the productivity by 14% to 18%.
• Use of natural mineral-based products helps restore the fertility of the land over the long-term.
• Helps reduce the usage of synthetic fertilisers and pesticides, making the products healthy
• Our products are natural which encourages organic farming
Way forwardOne of the growing segments within 20ML’s product portfolio, it is our goal to grow our geographical footprint in the international market for additional industries by exploring newer segments over the next few years. We started exploring global market with a proper strategy to identify the potential market for selective industries like Agro Chemicals, Ceramics, Construction and Hydrocarbon industries etc. for which some of our products are economically viable when it is catered from India. Domestically, the eastern market is the focus area for the coming years for which initial exploration is underway. Detergent, foundry and cattle feed and other application is the focus for exploring in the next few years, especially for the south and southwest area. Further, we intend to explore our opportunities in the commodity segment more aggressively in the coming years.
Segment IVConstruction ChemicalsOne of our growing division’s, the construction chemical segment has grown considerably over the years. Today we are one of India’s fastest growing construction chemical company with a stable and growing portfolio.
The key strategy of the division is to periodically offer new products to emerge as a solution provider. We have been able to achieve competitive strength in a hard-fought market thanks to our products which are top-notch in terms of quality and applicability. With our innovative product-line, we preserve the integrity of concrete, mortar, plaster and other architectural supports used to construct a building’s foundation. We are the specialists available around-the-clock for all construction needs.
Key function of construction chemicalsConstruction chemicals are nothing but chemical compounds that play a crucial role in strengthening building structures. Its primary use is to speed up the workflow in the formations of various construction sites that may be underdeveloped or already developed. Furthermore, they are blended up with various structure materials to enhance productivity, add strength, durability, boost functionality and act as a protective shield for the other materials.
Core productsCracksil | Tigersil | Nanosil | Metakrete | Micronsil 30C Plus | Micronsil 30C |
Key application industryReal estate | Housing industry
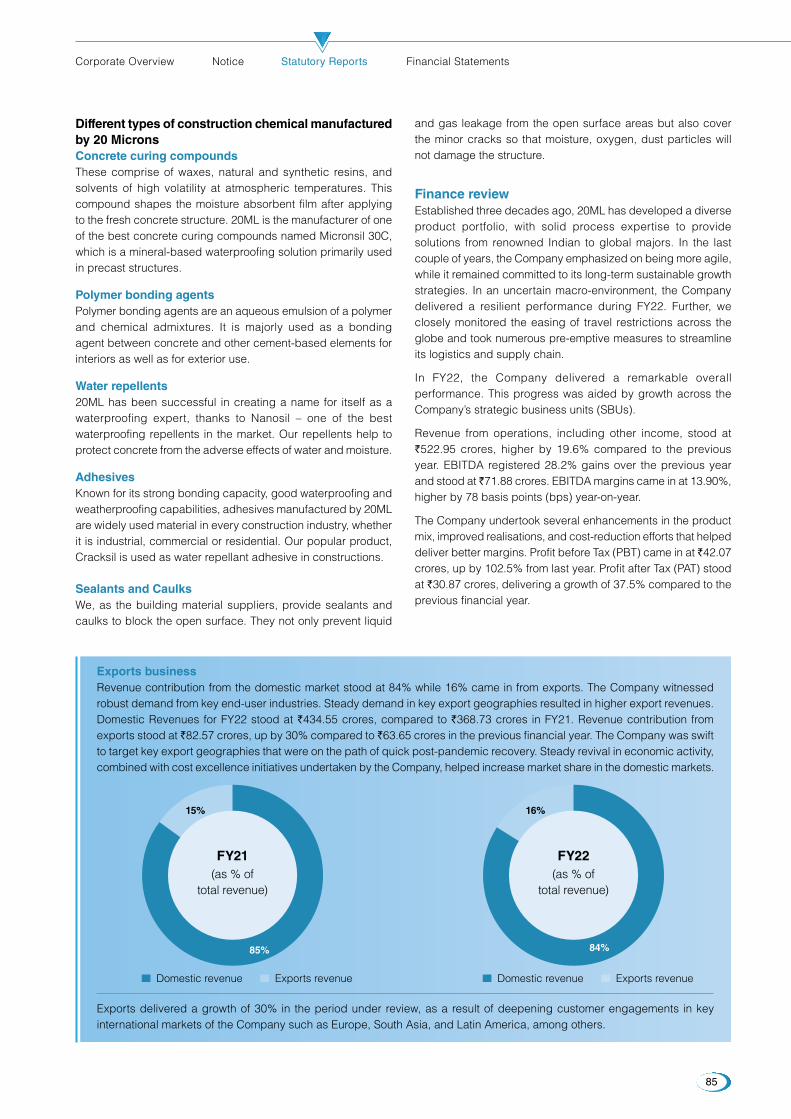
85
Corporate Overview Notice Statutory Reports Financial Statements
Different types of construction chemical manufactured by 20 MicronsConcrete curing compounds These comprise of waxes, natural and synthetic resins, and solvents of high volatility at atmospheric temperatures. This compound shapes the moisture absorbent film after applying to the fresh concrete structure. 20ML is the manufacturer of one of the best concrete curing compounds named Micronsil 30C, which is a mineral-based waterproofing solution primarily used in precast structures.
Polymer bonding agents Polymer bonding agents are an aqueous emulsion of a polymer and chemical admixtures. It is majorly used as a bonding agent between concrete and other cement-based elements for interiors as well as for exterior use.
Water repellents 20ML has been successful in creating a name for itself as a waterproofing expert, thanks to Nanosil – one of the best waterproofing repellents in the market. Our repellents help to protect concrete from the adverse effects of water and moisture.
Adhesives Known for its strong bonding capacity, good waterproofing and weatherproofing capabilities, adhesives manufactured by 20ML are widely used material in every construction industry, whether it is industrial, commercial or residential. Our popular product, Cracksil is used as water repellant adhesive in constructions.
Sealants and Caulks We, as the building material suppliers, provide sealants and caulks to block the open surface. They not only prevent liquid
and gas leakage from the open surface areas but also cover the minor cracks so that moisture, oxygen, dust particles will not damage the structure.
Finance reviewEstablished three decades ago, 20ML has developed a diverse product portfolio, with solid process expertise to provide solutions from renowned Indian to global majors. In the last couple of years, the Company emphasized on being more agile, while it remained committed to its long-term sustainable growth strategies. In an uncertain macro-environment, the Company delivered a resilient performance during FY22. Further, we closely monitored the easing of travel restrictions across the globe and took numerous pre-emptive measures to streamline its logistics and supply chain.
In FY22, the Company delivered a remarkable overall performance. This progress was aided by growth across the Company’s strategic business units (SBUs).
Revenue from operations, including other income, stood at `522.95 crores, higher by 19.6% compared to the previous year. EBITDA registered 28.2% gains over the previous year and stood at ̀ 71.88 crores. EBITDA margins came in at 13.90%, higher by 78 basis points (bps) year-on-year.
The Company undertook several enhancements in the product mix, improved realisations, and cost-reduction efforts that helped deliver better margins. Profit before Tax (PBT) came in at ̀ 42.07 crores, up by 102.5% from last year. Profit after Tax (PAT) stood at `30.87 crores, delivering a growth of 37.5% compared to the previous financial year.
Exports business Revenue contribution from the domestic market stood at 84% while 16% came in from exports. The Company witnessed robust demand from key end-user industries. Steady demand in key export geographies resulted in higher export revenues. Domestic Revenues for FY22 stood at `434.55 crores, compared to `368.73 crores in FY21. Revenue contribution from exports stood at ̀ 82.57 crores, up by 30% compared to ̀ 63.65 crores in the previous financial year. The Company was swift to target key export geographies that were on the path of quick post-pandemic recovery. Steady revival in economic activity, combined with cost excellence initiatives undertaken by the Company, helped increase market share in the domestic markets.
Domestic revenue Exports revenue Domestic revenue Exports revenue
15%
85%
FY21(as % of
total revenue)
16%
84%
FY22(as % of
total revenue)
Exports delivered a growth of 30% in the period under review, as a result of deepening customer engagements in key international markets of the Company such as Europe, South Asia, and Latin America, among others.

Annual Report 2021-22
86
20 Microns Limited
Resilient realisation gains and healthy volume growth aided the financial performance. During the year, the Company’s efforts to add innovative products to its portfolio complemented its growth trajectory. End-user demand remained strong, and 20ML capitalized on this opportunity by demonstrating agility throughout its operations.
Total borrowings of 20ML as of 31st March, 2022 stood at ̀ 104.26 crore vis-à-vis `88.37 crore as on 31st March, 2021. Reduced interest cost by 23% during the year from `23.50 crore in FY21 to `18.00 crore in FY22. The Company came out of CDR during the year, showcasing it strong financial performance in FY22.
As on March 31st March, 2022, the Company’s Equity Capital stood at `233.53 crores compared to `199.10 crores as of 31st March, 2021. This is because of 19% increase in reserves and surplus during the year.
The Company’s trade payable was of `81.24 crores as on March 31, 2022, as against ̀ 79.03 crores as at March 31, 2021.
The Company’s net fixed assets stood at `189.12 crores as at March 31, 2022, as against ̀ 181.33 crore as at March 31, 2021.
The Company’s trade receivable was of `95.45 crores as on March 31, 2022, as against ̀ 82.46 crores as at March 31, 2021. Holding days of receivable reduced to 68 days in FY22 from 70 days in FY21.
Risk managementGiven the nature of our business, we are often exposed to various risks owing to the changing marketing dynamics and volatile external environment. Here are some of the key risks and mitigation strategies adopted by the company:
Economic uncertainty: The prolong demand & supply disruption due to the pandemic significantly affected the growth prospects of the Indian and global economy. The recent second wave of COVID-19 has further dampened the growth potential. Therefore, it might have an adverse impact on the Company’s operations.
Mitigation: The Company constantly monitors changes in the macroeconomic environment and assesses its potential impact on the company’s operations. It enables the Company to respond swiftly to changing market trends and safeguard its operations against uncertainty. Further, the Company focused on safeguarding its business by building a strong relationship with its existing clients and also focused on expanding its order book from the existing clients.
Competition risk: The Company faces competition from domestic and international players. The Company’s inability to deliver new and innovative solutions and keep up with dynamic changes in the market may lead to loss of customer base and revenues. Further, competition may also result in pricing pressure, leading to an impact on its margins and profitability.
Mitigation: Over the years, 20 Microns have established a firm foothold in the key markets and industries, and have also built a strong and healthy relationship with customers. It also significantly invests towards research and development of new, improved and innovative products, aligned with the changing customer needs and help the Company emerge as a solution provider. This has enabled the Company to further strengthen its reputation, giving the Company a competitive edge over its peers.
Quality risk: The Company’s inability to abide by stringent quality standards might adversely affect operations, leading to monetary and intangible losses. Further, the Company may lose its brand value, resulting in a shrinking of the client base.
Mitigation: 20 Microns Limited has established a dedicated research and development and quality assurance department consisting of experienced and qualified personnel to ensure adherence to strict quality standards. The Company has put in place a robust quality check mechanism wherein the input materials and the output products undergo strict quality checks. Also, quality checks are undertaken at every step of the production. The Company’s products undergo stringent quality checks. The Company follows the IS (Indian Standard) /ISO (International Organization for Standardization) standards for quality check. Further, as and when required also takes the help form third party labs such as CSIR (Council of Scientific and Industrial Research) for ensuring product quality. This validates its position as a reliable business entity.
Logistical risk: Inability to procure quality raw materials at competitive price and inability of the Company to ensure timely delivery of the product may cause operational, reputation and financial loss.
Mitigation: The Company has put in place dedicated domestic and international procurement team. These teams, with their strategic planning and effective vendor management system has ensured timely and steady supply of raw materials at competitive prices. Further, the Company has entered into strategic contracts with different delivery partners to ensure timely delivery of finished products in India and abroad.
Retention and acquisition of skilled employees: To ensure smooth operations and long-term sustainability, it is vital to have a dedicated and committed team in place. Unable to retain or acquire competent and experienced employees may hamper the Company’s ability to pursue its sustainable growth strategies effectively.
Mitigation: The Company’s HR team constantly strives to hire talented employees and aims to retain existing people with attractive opportunities for professional growth. It also organizes various training and development initiatives to upskill employees and prepare them for challenging circumstances.

87
Corporate Overview Notice Statutory Reports Financial Statements
Internal control system and adequacyThe Company has in place strong internal control procedures commensurate with its size and operations. The Company believes that safeguarding of assets and business efficiency can be prolonged by exercising adequate internal controls and standardizing operational processes. The internal control and risk management system is structured and applied in accordance with the principles and criteria established in the corporate governance code of the organisation. It is an integral part of the general organizational structure of the Company and Group and involves a range of personnel who act in a coordinated manner while executing their respective responsibilities.
The Board of Directors offers its guidance and strategic supervision to the Executive Directors and management, monitoring and support committees.
Human resource We believe that our intellectual capital is the true asset of our business and losing them could have a material adverse effect on the Company’s performance. At 20ML, we believe that to ensure skill development and to be able to face up to major challenges, we need teams who deliver and who are motivated. Our human capital is our greatest tool for shaping the future of the Company and is also critical for our smooth functioning. Discovering talented people and retaining them is the key aim of our HR policy.
Our people are our greatest strength as a company and the bedrock of our organization. That’s why our highest priority is to provide a rewarding workplace that’s safe, welcoming, and supportive of professional development. Our company enjoys the support of committed and well satisfied human capital. Compensation packages offered by the Company, best of class methods in terms of recruitment, training, motivation, and performance appraisal, attract and retain the best in talent. As of 31st March 2022, the total workforce of 20ML is 500+ employees.
Health and safety measuresKeeping our people safe at work is our foremost priority. Our safety focus is spearheaded by the factory heads, who conducts regular factory-wide review on aspects related to health, safety and the environment (HSE). With their valuable input, we have undertaken different measures to enhance the health and safety measures of our people. Further, we have formed small teams at each of our manufacturing locations to quickly identify and effectively address safety issues. Our Company has an exhaustive set of health and safety policies and procedures that are stringently followed at all locations, by all people.
The focus on health and safety protocols was further stepped up during the year in response to the pandemic. Apart from following the government guidelines, we carried out regular sanitisation and ensured adequate physical distancing. We also swiftly introduced measures to periodically test employees and regulated entry through the oximeter and thermal screening. We also launched wellness programmes for employees and their families to help build resilience, manage change, and enhance their wellbeing during this challenging period.
Cautionary statement The statements made in the Management Discussion and Analysis describing the Company’s objectives, projections, estimates, expectations may be “forward-looking statements” within the meaning of applicable securities laws & regulations. Actual results could differ from those expressed or implied. Important factors that could make a difference to the Company’s operations include economic conditions affecting demand-supply and price conditions in the domestic & overseas markets in which the Company operates, changes in the government regulations, tax laws & other statutes & other incidental factors.
Annual Report 2021-222021-22
88
20 Microns Limited20 Microns Limited
REPORT ON CORPORATE GOVERNANCEREPORT ON CORPORATE GOVERNANCE
Compliance of the Corporate Governance Code is given below which forms part of the Board’s Report for the year 2021-22:
CORPORATE GOVERNANCECORPORATE GOVERNANCECompany’s Philosophy on Corporate Governance:Effective corporate governance practices constitute the strong foundation on which successful commercial enterprises are built to last. The Company’s philosophy on corporate governance oversees business strategies and ensures fiscal accountability, ethical corporate behavior and fairness to all stakeholders comprising regulators, employees, customers, vendors, investors and the society at large.
Board of DirectorsBoard of DirectorsCompositionThe Company has a very balanced and diversed Board of Directors, which primarily take care of the business needs and stakeholders’ interest. The Non-executive Directors including Independent Directors on the Board are experienced, competent and highly renowned persons from the various fields of manufacturing, finance and taxation, economics, law, governance etc. They take active part at the Board and Committee Meetings by providing valuable guidance to the Management on various aspects of business, policy direction, governance, compliance etc. and play important role on strategic issues, which enhances the transparency and add value in the decision making process of the Board of Directors.
The strength of Board as on March 31, 2022 is 7 [Seven] Directors. The Board comprises of Executive and Non-Executive Directors. The Chairman & Managing Director, CEO & Managing Director are the two Executive Directors. There are Five Non-Executive Directors, of which Four Directors are Independent Directors. The Board also consists of one Woman Non-Executive Non-Independent Director. The number of Independent Directors on the Board is in conformity with the requirement of Regulation 17 of SEBI (Listing Obligations and Disclosure Requirements) Regulations, 2015.
The Board is of opinion that the Independent Directors fulfill the conditions as specified in Section 149 of the Act and Regulation 16(1)(b) of the Listing Regulations and are independent of the management.
Mr. Rajesh C. Parikh, Chairman and Managing Director is brother of Mr. Atil C. Parikh, CEO & Managing Director and spouse of Mrs. Sejal R. Parikh, Non-Executive Non-Independent Director.
Profile of DirectorsProfile of DirectorsThe brief profile of each Director is given below:
Mr. Rajesh C. Parikh has graduated with First Class Degree in Bachelor of Mechanical Engineering. He has also completed the
Masters in Business Administration in Finance Stream. He is the Chairman and Managing Director of your Company. He started his career with Jyoti Limited, a Vadodara based Engineering Company, in the year 1994 as a Trainee Engineer and thereafter he was associated with this Company and held, on part time basis, few assignments of new projects to be established for China Clay. At the age of 27, he joined the Board and was in-charge of Technical matters and Marketing of the product of the Company. His exposure to the consuming industries brought in him insight for business and industry. He holds 17,01,714 Equity Shares representing 4.82% of the paid-up equity share capital of the Company as on March 31, 2022.
Mr. Atil C. Parikh, the CEO & Managing Director, holds a Bachelor’s degree in Chemical Engineering from Gujarat University. He then began his career working as a Management Trainee with 20 Microns Limited in 1999-2000. Later, he relocated to USA and completed his MBA with Finance specialization from California. On completion of MBA, he joined a Financial Services firm, the Tax Credit Company, where he held a position of a Management Analyst in 2003 and worked for 2 years contributing to various aspects of the industry ranging from Marketing, Analysis, HR and Operations. In the year 2005, he re-joined the Company as Management Analyst. He contributed in developing certain strategies and revamping few departments within the organization. He is also on the Boards of 20 Microns Nano Minerals Limited; Silicate Minerals [I] Private Limited, 20 MCC Private Limited & Dorfner-20 Microns Private Limited. He holds 17,00,739 Equity Shares representing 4.82% of the paid-up equity share Capital of the Company as on March 31, 2022.
Mrs. Sejal R. Parikh, the Non-Executive Woman Director, holds a Bachelor degree in Production Engineering and also Post Graduation Diploma in Business Administration. She had worked for 2 years as the Trainee Engineer in Planning Department of GMM Pfaudler Limited, Vallabh Vidhyanagar, the Glass lined Equipment manufacturing company. She was also a part of projects related to Heritage Preservation of Vadodara in Maharaja Sayajirao University. She is also on the Boards of 20 MCC Private Limited and Silicate Minerals [I] Private Limited.
Mr. Ramkisan A. Devidayal, the Independent Director, holds Master’s degree in Commerce and Management. He has rich and extensive experience in the fields of Agrochemicals of about 36 years of which 20 years in the Senior – 1st Line Management of the Companies to which he has been associated as Director. He was the Vice Chairman of Baroda Citizen Council and involved in Social activities of many NGOs. He has also been actively attached with various Associations like Chamber of Commerce in Vadodara; Federations of Gujarat Industries; Gujarat Pesticides Formulators; etc. over a decade. He has travelled widely round the Globe and participated in various International Seminars and led delegations several times. Mr. Ramkisan Devidayal is
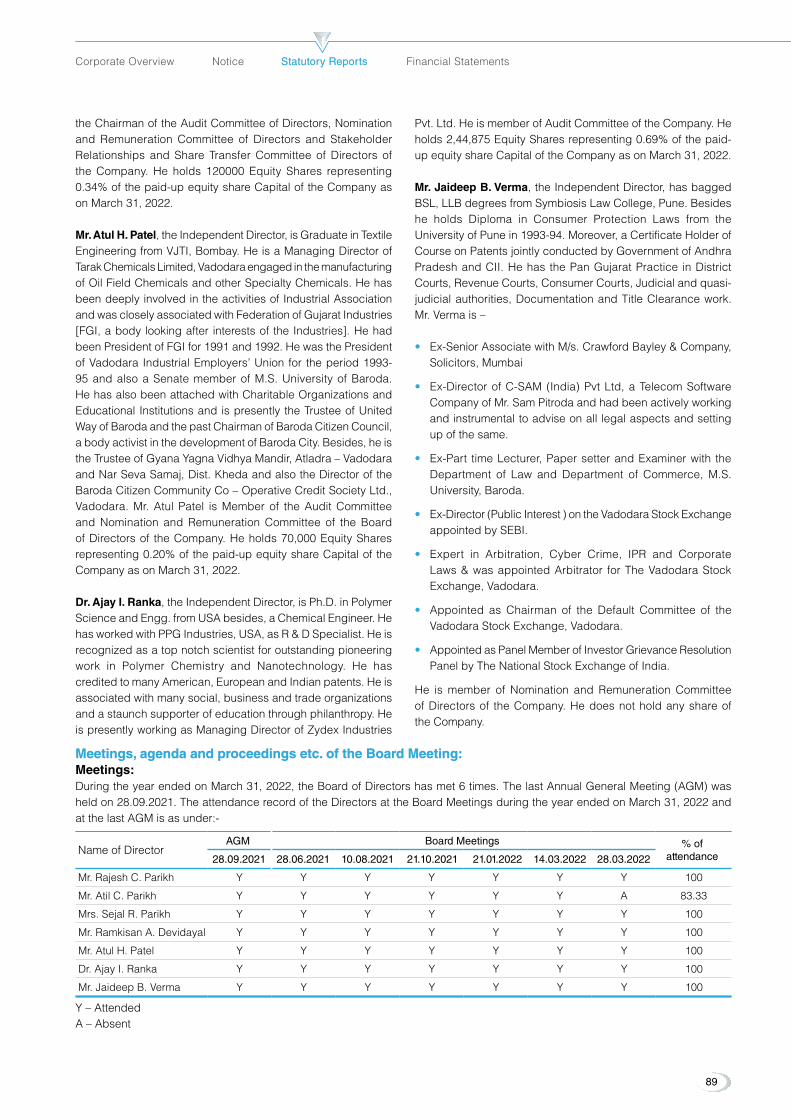
89
Corporate Overview Notice Statutory ReportsStatutory Reports Financial Statements
the Chairman of the Audit Committee of Directors, Nomination and Remuneration Committee of Directors and Stakeholder Relationships and Share Transfer Committee of Directors of the Company. He holds 120000 Equity Shares representing 0.34% of the paid-up equity share Capital of the Company as on March 31, 2022.
Mr. Atul H. Patel, the Independent Director, is Graduate in Textile Engineering from VJTI, Bombay. He is a Managing Director of Tarak Chemicals Limited, Vadodara engaged in the manufacturing of Oil Field Chemicals and other Specialty Chemicals. He has been deeply involved in the activities of Industrial Association and was closely associated with Federation of Gujarat Industries [FGI, a body looking after interests of the Industries]. He had been President of FGI for 1991 and 1992. He was the President of Vadodara Industrial Employers’ Union for the period 1993-95 and also a Senate member of M.S. University of Baroda. He has also been attached with Charitable Organizations and Educational Institutions and is presently the Trustee of United Way of Baroda and the past Chairman of Baroda Citizen Council, a body activist in the development of Baroda City. Besides, he is the Trustee of Gyana Yagna Vidhya Mandir, Atladra – Vadodara and Nar Seva Samaj, Dist. Kheda and also the Director of the Baroda Citizen Community Co – Operative Credit Society Ltd., Vadodara. Mr. Atul Patel is Member of the Audit Committee and Nomination and Remuneration Committee of the Board of Directors of the Company. He holds 70,000 Equity Shares representing 0.20% of the paid-up equity share Capital of the Company as on March 31, 2022.
Dr. Ajay I. Ranka, the Independent Director, is Ph.D. in Polymer Science and Engg. from USA besides, a Chemical Engineer. He has worked with PPG Industries, USA, as R & D Specialist. He is recognized as a top notch scientist for outstanding pioneering work in Polymer Chemistry and Nanotechnology. He has credited to many American, European and Indian patents. He is associated with many social, business and trade organizations and a staunch supporter of education through philanthropy. He is presently working as Managing Director of Zydex Industries
Pvt. Ltd. He is member of Audit Committee of the Company. He holds 2,44,875 Equity Shares representing 0.69% of the paid-up equity share Capital of the Company as on March 31, 2022.
Mr. Jaideep B. Verma, the Independent Director, has bagged BSL, LLB degrees from Symbiosis Law College, Pune. Besides he holds Diploma in Consumer Protection Laws from the University of Pune in 1993-94. Moreover, a Certificate Holder of Course on Patents jointly conducted by Government of Andhra Pradesh and CII. He has the Pan Gujarat Practice in District Courts, Revenue Courts, Consumer Courts, Judicial and quasi-judicial authorities, Documentation and Title Clearance work. Mr. Verma is –
•• Ex-Senior Associate with M/s. Crawford Bayley & Company, Solicitors, Mumbai
•• Ex-Director of C-SAM (India) Pvt Ltd, a Telecom Software Company of Mr. Sam Pitroda and had been actively working and instrumental to advise on all legal aspects and setting up of the same.
•• Ex-Part time Lecturer, Paper setter and Examiner with the Department of Law and Department of Commerce, M.S. University, Baroda.
•• Ex-Director (Public Interest ) on the Vadodara Stock Exchange appointed by SEBI.
•• Expert in Arbitration, Cyber Crime, IPR and Corporate Laws & was appointed Arbitrator for The Vadodara Stock Exchange, Vadodara.
•• Appointed as Chairman of the Default Committee of the Vadodara Stock Exchange, Vadodara.
•• Appointed as Panel Member of Investor Grievance Resolution Panel by The National Stock Exchange of India.
He is member of Nomination and Remuneration Committee of Directors of the Company. He does not hold any share of the Company.
Meetings, agenda and proceedings etc. of the Board Meeting:Meetings, agenda and proceedings etc. of the Board Meeting:Meetings:During the year ended on March 31, 2022, the Board of Directors has met 6 times. The last Annual General Meeting (AGM) was held on 28.09.2021. The attendance record of the Directors at the Board Meetings during the year ended on March 31, 2022 and at the last AGM is as under:-
Name of DirectorAGM Board Meetings % of
attendance28.09.2021 28.06.2021 10.08.2021 21.10.2021 21.01.2022 14.03.2022 28.03.2022
Mr. Rajesh C. Parikh Y Y Y Y Y Y Y 100
Mr. Atil C. Parikh Y Y Y Y Y Y A 83.33
Mrs. Sejal R. Parikh Y Y Y Y Y Y Y 100
Mr. Ramkisan A. Devidayal Y Y Y Y Y Y Y 100
Mr. Atul H. Patel Y Y Y Y Y Y Y 100
Dr. Ajay I. Ranka Y Y Y Y Y Y Y 100
Mr. Jaideep B. Verma Y Y Y Y Y Y Y 100
Y – AttendedA – Absent

Annual Report 2021-222021-22
90
20 Microns Limited20 Microns Limited
Matrix of Skill/Expertise/Competencies of the Board of DirectorsIn terms of the requirements of the SEBI Listing Regulations, the Board has identified and approved the list of core skills/ expertise/competencies as required in the context of Company’s business (es) and sector(s) for it to function effectively. Broadly, the essential skill sets identified by the Board are categorised as under:
a. Strategy & Planning b. Research & Developmentc. Operations & Technology d. Promotion & Marketinge. International Exposure f. Finance, Accounts & Auditg. Governance, Legal, Risk & Compliance
Sr. No.
Name of DirectorStrategy & Planning
Research & Development
Operations &Technology
Promotion & Marketing
International Exposure
Finance, Accounts &
Audit
Governance, Legal, Risk & Compliance
1 Mr. Rajesh C. Parikh Expert Expert Expert Expert Expert Expert Expert
2 Mr. Atil C. Parikh Expert Expert Expert Expert Expert Expert Expert
3 Mrs. Sejal R. Parikh Expert Proficient Proficient Proficient Proficient Expert Expert
4 Mr. Ramkisan Devidayal Expert Proficient Proficient Expert Proficient Expert Expert
5 Mr. Atul H. Patel Expert Proficient Expert Expert Expert Expert Proficient
6 Dr. Ajay I. Ranka Expert Expert Expert Proficient Expert Expert Proficient
7 Mr. Jaideep B. Verma Expert Proficient Proficient Proficient Proficient Expert Expert
The identified skills / competences are broad-based and marking of ‘Proficient’ against a particular member does not necessarily mean the member does not possess the corresponding skills / competences.
Separate Meeting of Independent Directors:Separate Meeting of Independent Directors:As stipulated by the Code of Independent Directors under the Companies Act, 2013 and the Listing Regulations, 2015, a separate meeting of the Independent Directors of the Company was held on 21st January, 2022 to review the performance of Non-Independent Directors (including the Chairman) and the Board as a whole and also reviewed performance of the Chairman of the Company, taking into account the views of Executive Directors and Non-Executive Directors. The Independent Directors also reviewed the quality, content and timeliness of the flow of information between the Management and the Board and its Committees which is necessary to effectively and reasonably perform and discharge their duties. The Independent Directors found the same quiet satisfactory.
Agenda:Agenda:All the meetings are conducted as per well designed and structured agenda. All the agenda items are backed by necessary supporting information and documents (except for the critical price sensitive information, which is circulated at the meeting) to enable the Board to take informed decisions. Agenda also includes minutes of the previous meetings of all the Board, Committees and Subsidiaries for the information of the Board. Additional agenda items in the form of “Any Other Agenda” are included with the permission of the Chairman. Agenda papers are generally circulated seven days prior to the Board Meeting. In addition, for any business exigencies, the resolutions are passed by circulation and later placed in the Board Meeting for noting.
Invitees and Proceedings:Invitees and Proceedings:Apart from the Board members, the Company Secretary and the CFO are invited to attend all the Board Meetings. Other
senior management executives and consultants are called as and when necessary, to provide additional inputs for the items being discussed by the Board. The CFO makes presentation on the quarterly and annual operating and financial performance and on annual operating and capex budget. The Managing Directors, CFO and other senior executives make presentations on capex proposals and progress, operational, health and safety and other business issues.
Post Meeting Action:Post Meeting Action:Post meetings, all important decisions taken at the meeting are communicated to the concerned officials and departments. Action Taken Report is prepared and reviewed periodically by the Board for the action taken / pending to be taken.
Support and Role of Company Secretary:Support and Role of Company Secretary:The Company Secretary is responsible for convening the Board and Committee meetings, preparation and distribution of Agenda and other documents and recording of the Minutes of the meetings. She acts as interface between the Board and the Management and provides required assistance and assurance to the Board and the Management on compliance and governance aspects.
Other Directorships etc.:Other Directorships etc.:None of the Directors is a Director in more than 10 Public Limited Companies or acts as an Independent Director in more than 7 Listed Companies. Further, none of the Directors acts as a member of more than 10 committees or acts as a Chairman of more than 5 Committees across all Public Limited Companies in which he/she is a Director.
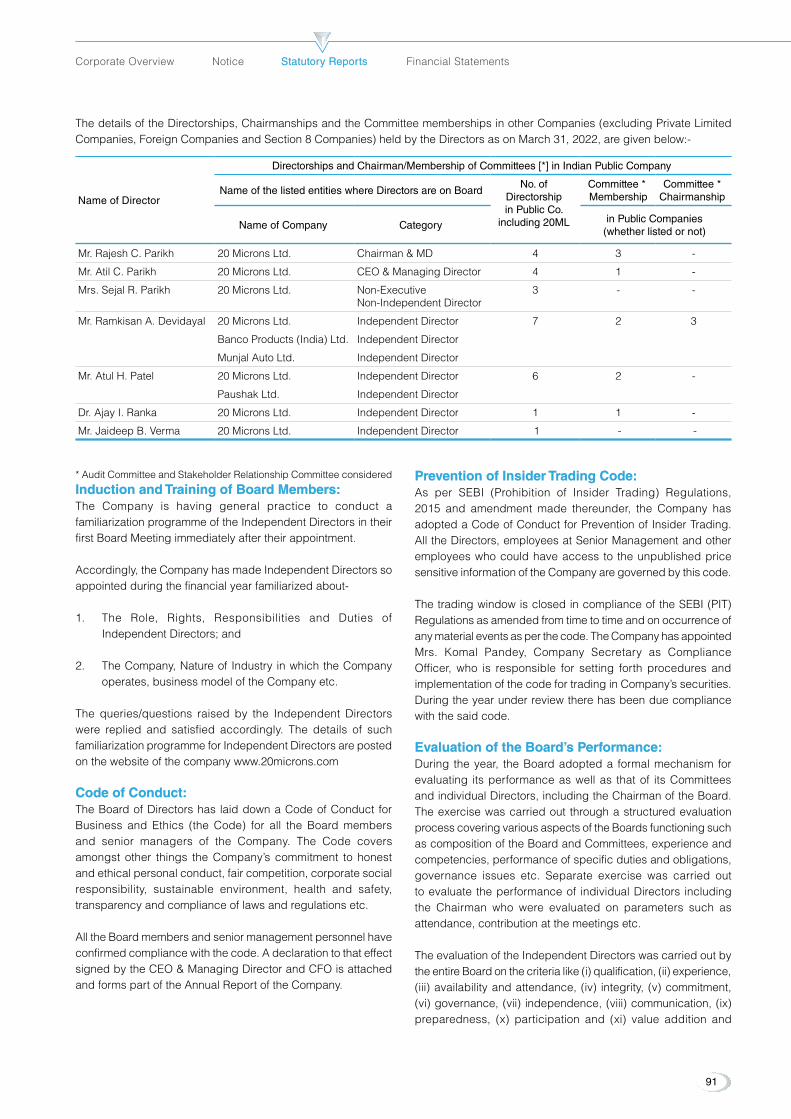
91
Corporate Overview Notice Statutory ReportsStatutory Reports Financial Statements
The details of the Directorships, Chairmanships and the Committee memberships in other Companies (excluding Private Limited Companies, Foreign Companies and Section 8 Companies) held by the Directors as on March 31, 2022, are given below:-
Name of Director
Directorships and Chairman/Membership of Committees [*] in Indian Public Company
Name of the listed entities where Directors are on BoardNo. of
Directorship in Public Co.
including 20ML
Committee * Membership
Committee *Chairmanship
Name of Company Categoryin Public Companies
(whether listed or not)
Mr. Rajesh C. Parikh 20 Microns Ltd. Chairman & MD 4 3 -
Mr. Atil C. Parikh 20 Microns Ltd. CEO & Managing Director 4 1 -
Mrs. Sejal R. Parikh 20 Microns Ltd. Non-Executive Non-Independent Director
3 - -
Mr. Ramkisan A. Devidayal 20 Microns Ltd. Independent Director 7 2 3
Banco Products (India) Ltd. Independent Director
Munjal Auto Ltd. Independent Director
Mr. Atul H. Patel 20 Microns Ltd. Independent Director 6 2 -
Paushak Ltd. Independent Director
Dr. Ajay I. Ranka 20 Microns Ltd. Independent Director 1 1 -
Mr. Jaideep B. Verma 20 Microns Ltd. Independent Director 1 - -
* Audit Committee and Stakeholder Relationship Committee considered
Induction and Training of Board Members:Induction and Training of Board Members:The Company is having general practice to conduct a familiarization programme of the Independent Directors in their first Board Meeting immediately after their appointment.
Accordingly, the Company has made Independent Directors so appointed during the financial year familiarized about-
1. The Role, Rights, Responsibilities and Duties of Independent Directors; and
2. The Company, Nature of Industry in which the Company operates, business model of the Company etc.
The queries/questions raised by the Independent Directors were replied and satisfied accordingly. The details of such familiarization programme for Independent Directors are posted on the website of the company www.20microns.com
Code of Conduct:Code of Conduct:The Board of Directors has laid down a Code of Conduct for Business and Ethics (the Code) for all the Board members and senior managers of the Company. The Code covers amongst other things the Company’s commitment to honest and ethical personal conduct, fair competition, corporate social responsibility, sustainable environment, health and safety, transparency and compliance of laws and regulations etc.
All the Board members and senior management personnel have confirmed compliance with the code. A declaration to that effect signed by the CEO & Managing Director and CFO is attached and forms part of the Annual Report of the Company.
Prevention of Insider Trading Code:Prevention of Insider Trading Code:As per SEBI (Prohibition of Insider Trading) Regulations, 2015 and amendment made thereunder, the Company has adopted a Code of Conduct for Prevention of Insider Trading. All the Directors, employees at Senior Management and other employees who could have access to the unpublished price sensitive information of the Company are governed by this code.
The trading window is closed in compliance of the SEBI (PIT) Regulations as amended from time to time and on occurrence of any material events as per the code. The Company has appointed Mrs. Komal Pandey, Company Secretary as Compliance Officer, who is responsible for setting forth procedures and implementation of the code for trading in Company’s securities. During the year under review there has been due compliance with the said code.
Evaluation of the Board’s Performance:Evaluation of the Board’s Performance:During the year, the Board adopted a formal mechanism for evaluating its performance as well as that of its Committees and individual Directors, including the Chairman of the Board. The exercise was carried out through a structured evaluation process covering various aspects of the Boards functioning such as composition of the Board and Committees, experience and competencies, performance of specific duties and obligations, governance issues etc. Separate exercise was carried out to evaluate the performance of individual Directors including the Chairman who were evaluated on parameters such as attendance, contribution at the meetings etc.
The evaluation of the Independent Directors was carried out by the entire Board on the criteria like (i) qualification, (ii) experience, (iii) availability and attendance, (iv) integrity, (v) commitment, (vi) governance, (vii) independence, (viii) communication, (ix) preparedness, (x) participation and (xi) value addition and
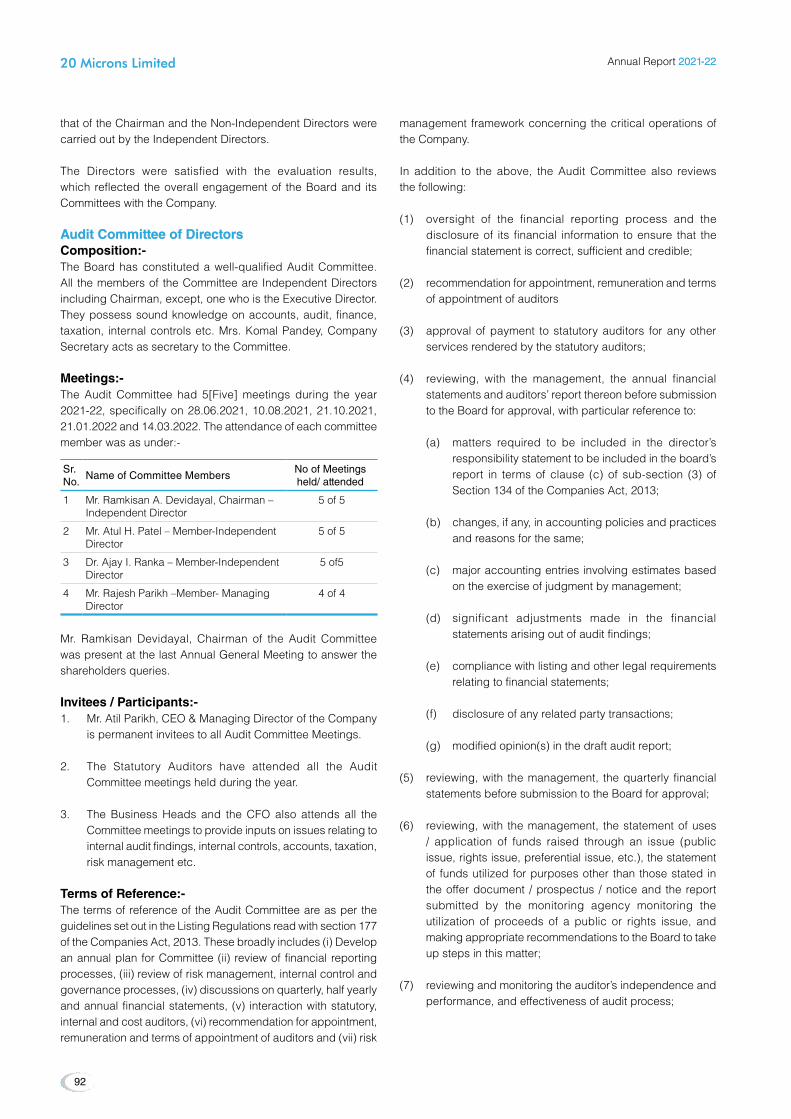
Annual Report 2021-222021-22
92
20 Microns Limited20 Microns Limited
that of the Chairman and the Non-Independent Directors were carried out by the Independent Directors.
The Directors were satisfied with the evaluation results, which reflected the overall engagement of the Board and its Committees with the Company.
Audit Committee of DirectorsAudit Committee of DirectorsComposition:-The Board has constituted a well-qualified Audit Committee. All the members of the Committee are Independent Directors including Chairman, except, one who is the Executive Director. They possess sound knowledge on accounts, audit, finance, taxation, internal controls etc. Mrs. Komal Pandey, Company Secretary acts as secretary to the Committee.
Meetings:-The Audit Committee had 5[Five] meetings during the year 2021-22, specifically on 28.06.2021, 10.08.2021, 21.10.2021, 21.01.2022 and 14.03.2022. The attendance of each committee member was as under:-
Sr. No.
Name of Committee MembersNo of Meetings held/ attended
1 Mr. Ramkisan A. Devidayal, Chairman – Independent Director
5 of 5
2 Mr. Atul H. Patel – Member-Independent Director
5 of 5
3 Dr. Ajay I. Ranka – Member-Independent Director
5 of5
4 Mr. Rajesh Parikh –Member- Managing Director
4 of 4
Mr. Ramkisan Devidayal, Chairman of the Audit Committee was present at the last Annual General Meeting to answer the shareholders queries.
Invitees / Participants:-1. Mr. Atil Parikh, CEO & Managing Director of the Company
is permanent invitees to all Audit Committee Meetings.
2. The Statutory Auditors have attended all the Audit Committee meetings held during the year.
3. The Business Heads and the CFO also attends all the Committee meetings to provide inputs on issues relating to internal audit findings, internal controls, accounts, taxation, risk management etc.
Terms of Reference:-The terms of reference of the Audit Committee are as per the guidelines set out in the Listing Regulations read with section 177 of the Companies Act, 2013. These broadly includes (i) Develop an annual plan for Committee (ii) review of financial reporting processes, (iii) review of risk management, internal control and governance processes, (iv) discussions on quarterly, half yearly and annual financial statements, (v) interaction with statutory, internal and cost auditors, (vi) recommendation for appointment, remuneration and terms of appointment of auditors and (vii) risk
management framework concerning the critical operations of the Company.
In addition to the above, the Audit Committee also reviews the following:
(1) oversight of the financial reporting process and the disclosure of its financial information to ensure that the financial statement is correct, sufficient and credible;
(2) recommendation for appointment, remuneration and terms of appointment of auditors
(3) approval of payment to statutory auditors for any other services rendered by the statutory auditors;
(4) reviewing, with the management, the annual financial statements and auditors’ report thereon before submission to the Board for approval, with particular reference to:
(a) matters required to be included in the director’s responsibility statement to be included in the board’s report in terms of clause (c) of sub-section (3) of Section 134 of the Companies Act, 2013;
(b) changes, if any, in accounting policies and practices and reasons for the same;
(c) major accounting entries involving estimates based on the exercise of judgment by management;
(d) significant adjustments made in the financial statements arising out of audit findings;
(e) compliance with listing and other legal requirements relating to financial statements;
(f) disclosure of any related party transactions;
(g) modified opinion(s) in the draft audit report;
(5) reviewing, with the management, the quarterly financial statements before submission to the Board for approval;
(6) reviewing, with the management, the statement of uses / application of funds raised through an issue (public issue, rights issue, preferential issue, etc.), the statement of funds utilized for purposes other than those stated in the offer document / prospectus / notice and the report submitted by the monitoring agency monitoring the utilization of proceeds of a public or rights issue, and making appropriate recommendations to the Board to take up steps in this matter;
(7) reviewing and monitoring the auditor’s independence and performance, and effectiveness of audit process;

93
Corporate Overview Notice Statutory ReportsStatutory Reports Financial Statements
(8) approval or any subsequent modification of transactions with related parties;
(9) Scrutiny of inter-corporate loans and investments;
(10) valuation of undertakings or assets, wherever it is necessary;
(11) evaluation of internal financial controls and risk management systems;
(12) reviewing, with the management, performance of statutory and internal auditors, adequacy of the internal control systems;
(13) reviewing the adequacy of internal audit function, if any, including the structure of the internal audit department, staffing and seniority of the official heading the department, reporting structure coverage and frequency of internal audit;
(14) discussion with internal auditors of any significant findings and follow up there on;
(15) reviewing the findings of any internal investigations by the internal auditors into matters where there is suspected fraud or irregularity or a failure of internal control systems of a material nature and reporting the matter to the Board;
(16) discussion with statutory auditors before the audit commences, about the nature and scope of audit as well as post-audit discussion to ascertain any area of concern;
(17) to look into the reasons for substantial defaults in the payment to the depositors, debenture holders, shareholders (in case of non-payment of declared dividends) and creditors;
(18) to review the functioning of the whistle blower mechanism;
(19) approval of appointment of chief financial officer after assessing the qualifications, experience and background, etc. of the candidate;
(20) reviewing the utilization of loans and/ or advances from/investment by the holding company in the subsidiary exceeding rupees 100 crore or 10% of the asset size of the subsidiary, whichever is lower including existing loans / advances / investments existing as on the date of coming into force of this provision.
(21) To review following –
(1) Management discussion and analysis of financial condition and results of operations;
(2) statement of significant related party transactions, submitted by management;
(3) management letters/letters of internal control weaknesses issued by the statutory auditors;
(4) internal audit reports relating to internal control weaknesses;
(5) the appointment, removal and terms of remuneration of the chief internal auditor
(6) statement of deviations:
(a) quarterly statement of deviation(s) including report of monitoring agency, if applicable, submitted to stock exchange(s)
(b) annual statement of funds utilized for purposes other than those stated in the offer document/prospectus/notice.
(22) Carrying out any other function as added in the terms of reference of the audit committee, by the Regulatory Authorities, from time to time
Nomination and Remuneration Committee of Nomination and Remuneration Committee of DirectorsDirectorsComposition and Attendance at the MeetingThe Nomination and Remuneration Committee comprises of the members as stated below. The Committee during the year ended on March 31, 2022 had one meeting on 22.06.2021. The attendance of the members was as under:-
Sr. No.
Name of Committee MembersNo of Meetings held/ attended
1 Mr. Ramkisan A. Devidayal, Chairman - Independent Director
1 of 1
2 Mr. Atul H. Patel, Member - Independent Director
1 of 1
3 Mr. Rajesh C Parikh, Member - Chairman and Managing Director
1 of 1
4 Mr. Jaideep B. Verma, Member – Independent Director
1 of 1
Terms of Reference of the Nomination and Remuneration Committee:(1) formulation of the criteria for determining qualifications,
positive attributes and independence of a director and recommend to the Board a policy relating to, the remuneration of the directors, key managerial personnel and other employees;
(2) formulation of criteria for evaluation of performance of Independent Directors and the Board of Directors;
(3) devising a policy on diversity of Board of Directors;
(4) identifying persons who are qualified to become Directors and who may be appointed in senior management in accordance with the criteria laid down, and recommend to the Board of Directors their appointment and removal.

Annual Report 2021-222021-22
94
20 Microns Limited20 Microns Limited
(5) whether to extend or continue the term of appointment of the Independent Director, on the basis of the report of performance evaluation of independent directors.
(6) recommend to the Board, all remuneration, in whatever form, payable to senior management.
Remuneration PolicyRemuneration to Executive Directors have been paid to them in terms of the approval given by Shareholders of the Company under the Sections 196, 197 and other applicable provisions
of the Companies Act, 2013 and the resolution passed in that behalf and as recommended by the Nomination & Remuneration Committee of Directors duly constituted pursuant to the Schedule V of the Companies Act, 2013.
The remuneration to the Executive Directors consists of fixed salary, allowances, incentive and other perquisites as per the Rules of the Company and commission on Net profit as calculated as per Section 198 of the Companies Act, 2013. The Provident Fund is contributed as per Provident Fund Act and Rules, the details of which is as under -
(` in Lakh)
Names of Directors Basic HRA Medical PF Incentive Commission TOTAL
MANAGING DIRECTORS :
Mr. Rajesh C. Parikh 72.37 10.86 3.33 8.69 0 0 95.25
Mr. Atil C. Parikh 65.41 9.81 3.01 7.85 0 0 86.08
Apart from the above remuneration details no other kind of fixed components, performance link incentives are given to the Directors.
Executive Directors of the Company were not paid any Commission during the year.
The Company has entered into service agreements with respective Managing Directors for period of 03 years effective from 01.04.2022. Notice period according to said service agreement is 90 days from either side or equivalent payment of salary in lieu thereof.
During the year, the company has not issued stock option to any Directors of the company.
The Non-Executive Independent Directors had been paid the sitting fees for attending the Board and Committee Meetings and also recommended to pay Commission for the year subject to approval of shareholders in the ensuing Annual General Meeting, within the limit as specified in the provisions of Companies Act, 2013 which is commensurate with their skills, expertise, experience and time devoted to the Company and also taking into account profits of the Company. .The details of payment made to Non-Executive Directors are as under:
(` In Lakhs)
Non-Executive Directors Sitting fees Commission Paid for
FY: 2021-22
Mrs. Sejal R. Parikh 1.15 1.75
Mr. Ramkisan A. Devidayal 2.85 3.50
Mr. Atul H. Patel 2.75 1.75
Dr. Ajay I. Ranka 2.40 1.75
Mr. Jaideep B. Verma 1.15 1.75
Apart from aforementioned payment and shareholding there is no other pecuniary relationship of non-executive directors with the Company.
Directors’ ShareholdingShareholding of the Directors in the company as on March 31, 2022:
Names of DirectorsNo. of shares held in the Company *
Percentage of holding
**Late Mr. Chandresh S. Parikh 37,27,246 10.56
Mr. Rajesh C. Parikh 17,01,714 4.82
Mr. Atil C. Parikh 17,00,739 4.82
Mrs. Sejal R. Parikh Nil Nil
Mr. Ramkisan A. Devidayal 1,20,000 0.34
Mr. Atul H. Patel 70,000 0.20
Dr. Ajay I. Ranka 2,44,875 0.69
Mr. Jaideep B. Verma Nil NIL
* considered holding as a first holder**Transmission of shares held by Late Mr. Chandresh S. Parikh, Former Executive Director in favor of his legal heirs is under process.
In terms of Article 152 of the Articles of Association of the company, the Directors are not required to hold any qualification shares.
Remuneration to Key Managerial Personnel, Senior Management and other employees contained a balance between fixed and variable pay reflecting short and long term performance objectives of the employees in line with the working of the Company and its goals. For Directors, the Performance Pay will be linked to achievement of Business Plans.
Stakeholder Relationship and Share Transfer CommitteeThe Stakeholders Relationship and Share Transfer Committee is responsible for the satisfactory redressal of investors’ complaints and recommends measures for overall improvement in the quality of investor services.

95
Corporate Overview Notice Statutory ReportsStatutory Reports Financial Statements
The Committee consists of the members as stated below. During the year ended on March 31, 2022, this Committee had 01 meeting on 21.01.2022 which was attended by the members as under:-
Sr. No.
Name of Committee MembersNo of Meetings held/ attended
1 Mr. Ramkisan A. Devidayal- Chairman 1 of 1
2 Mr. Rajesh C. Parikh, Member 1 of 1
3 Mr. Atil C. Parikh – Member 1 of 1
Mrs. Komal Pandey, Company secretary acts as Compliance Officer.
Terms of Reference of Stakeholders Relationship and Share Transfer Committee
(1) Resolving the grievances of the security holders of the company including complaints related to transfer/transmission of shares, non-receipt of annual report, non-receipt of declared dividends, issue of new/duplicate certificates, general meetings etc.
(2) Review of measures taken for effective exercise of voting rights by shareholders.
(3) Review of adherence to the service standards adopted by company in respect of various services being rendered by the Registrar & Share Transfer Agent.
(4) Review of the various measures and initiatives taken by the listed entity for reducing the quantum of unclaimed dividends and ensuring timely receipt of dividend warrants/annual reports/statutory notices by the shareholders of the company.
Status of Investors ComplaintsStatus of Investors ComplaintsDuring the period under review, the Company has not received any complaint from any shareholder and the company has reported on quarterly basis to BSE and NSE to that effect.
CSR Committee of DirectorsCSR Committee of DirectorsThe Company has constituted a CSR Committee as required under Section 135 of the Companies Act, 2013. The Committee was headed by Mr. Rajesh Parikh, Chairman & Managing Director of the company and consists of the members as stated below. During the year one Committee Meeting was held
on 22.06.2021. The CSR Committee, as on March 31, 2022, comprised of the following members:
Sr. No.
Name of Committee MembersNo of Meetings held/ attended
1 Mr. Rajesh C. Parikh – Chairman 1 of 1
2 Mrs. Sejal R. Parikh – Member 1 of 1
3 Mr. Ramkisan Devidayal –Member 1 of 1
Policies/CodesPolicies/Codesa. Vigil Mechanism / Whistle Blower Policy The Company promotes ethical behavior in all its business
activities and has put in place a mechanism for reporting illegal or unethical behavior. The Company has a Vigil Mechanism policy under which the employees are free to report violations of applicable laws and regulations and the Code of Conduct. The reportable matters may be disclosed to the Ethics and Compliance Task Force which operates under the supervision of the Audit Committee. Employees may also report to the Chairman of the Audit Committee. During the year under review, no employee reported to the Audit Committee in this regard. The policy of vigil mechanism may be accessed on the Company’s website https://www.20microns.com/wp-content/uploads/ 2022/06/20ML_vigil_mechanism_policy_2022.
It is affirmed that no personnel of the Company has been denied access to the Audit Committee.
b. The Sexual Harassment of Women at Workplace (Prevention, Prohibition and Redressal) Act, 2013
The Company has in place an Anti-Sexual Harassment Policy in line with the requirements of the Sexual Harassment of Women at Workplace (Prevention, Prohibition and Redressal) Act, 2013. Internal Complaints Committee (ICC) has been set up to redress complaints received regarding sexual harassment. All employees (permanent, contractual, temporary, trainees) are covered under this Policy. The Policy is gender neutral. During the year under review, no sexual Harassment Complaint has been received by the Company. The policy of Sexual Harassment at workplace may be accessed at the web-link – https://www.20microns.com/wp-content/uploads/2018/06/Policy-on-Prevention-of-Sexual-Harrasment-at-Work-Place.pdf

Annual Report 2021-222021-22
96
20 Microns Limited20 Microns Limited
General Body MeetingsGeneral Body Meetings(i) Annual General Meeting (AGM):The details of Annual General Meetings held in last 3 years are as under:-
Financial Year
Date Location TimeNo. of Special Resolutions
passed
2020-21 28.09.2021 Video Conference (VC) or Other Audio Visual Means (OAVM) in the Conference Room at 347, GIDC Industrial Estate, Waghodia, Dist.: Vadodara.
3.00 p.m. 03
2019-20 25.09.2020 Video Conference (VC) or Other Audio Visual Means (OAVM) in the Conference Room at 347, GIDC Industrial Estate, Waghodia, Dist.: Vadodara.
3.00 p.m 01
2018-19 13.08.2019 Conference Room at 347, GIDC Industrial Estate, Waghodia, Dist.: Vadodara. 3.00 p.m. 06
(ii) Extra Ordinary General Meetings:During the year, no Extra-ordinary General Meeting was held.
(iii) Postal Ballot:During the year, no resolution was passed through Postal Ballot. It is not proposed to conduct any Special resolution through Postal Ballot as on date.
Management review and responsibilityManagement review and responsibility •• Formal evaluation of officers
The Nomination and Remuneration Committee of the Board approves the compensation and benefits for all Sr. Management Employees.
•• Board interaction with clients, employees, institutional investors, the government and the media. The Chairman and the MDs represent the Company in interactions with investors, the media and various government authorities.
•• We have an integrated approach to managing risks inherent in various aspects of our business.
•• A detailed report on our Management’s discussions and analysis forms part of this Annual Report.
DisclosuresDisclosures1. Suitable disclosure as required by the Ind AS 24 for related
party transactions has been made in the Annual Report. The Company has identified that there are no materially significant transactions that may have potential conflict with interest of company at large pursuant to the material related party transaction policy formulated by the Company. The said policy is available at web-link - https://www.20microns.com/wp-content/uploads/2022/01/20ML_related_party_transaction_policy.
2. The Company has followed all relevant Indian Accounting Standards notified by the Companies (Indian Accounting Standards) Rules, 2015 while preparing Financial Statements.
3. No penalties or strictures have been imposed on the Company by Stock Exchange or any statutory authority on any matter related to capital markets during the last three years .
4. The Company has in place a mechanism to inform the Board members about the Risk assessment and mitigation plans and periodical reviews to ensure that the critical risks are controlled by the executive management. The Company has complied with all the mandatory requirements of the listing regulations in respect of Corporate Governance.
5. As on 31.03.2022, the Company has no material subsidiary as defined in Regulation 16(1)(c) of the Listing Regulation, 2015. Although the Company has framed a policy for determining “material subsidiary” and the same is disclosed on the Company’s website at www.20microns.com
6. The Independent Directors have confirmed that they meet the criteria of ‘Independence’ as stipulated in Section 149(7) of the Companies Act, 2013.
The Company has received Certificate from Devesh R Desai, Practicing Company Secretaries certifying that none of the Directors on the Board of the Company have been debarred or disqualified from being appointed or continuing as Directors of the Company by the Board/Ministry of Corporate Affairs or any such statutory Authority. The certificate forms part of this report.
TOTAL FEES FOR ALL SERVICES PAID BY THE LISTED ENTITY ON A CONSOLIDATED BASIS
During the year `9.64 Lakhs was paid to Statutory Auditor including out of pocket expenses, further M/s. J. H. Mehta & Co. Statutory Auditor of the Company has not provided any statutory service to its Indian and Foreign Subsidiary including associate company during the year.
The Company has complied with corporate governance requirements specified in regulation 17 to 27 and clause (b) to (i) of Sub regulation (2) of regulation 46 of SEBI (Listing Obligations and Disclosure Requirements Regulations, 2015).
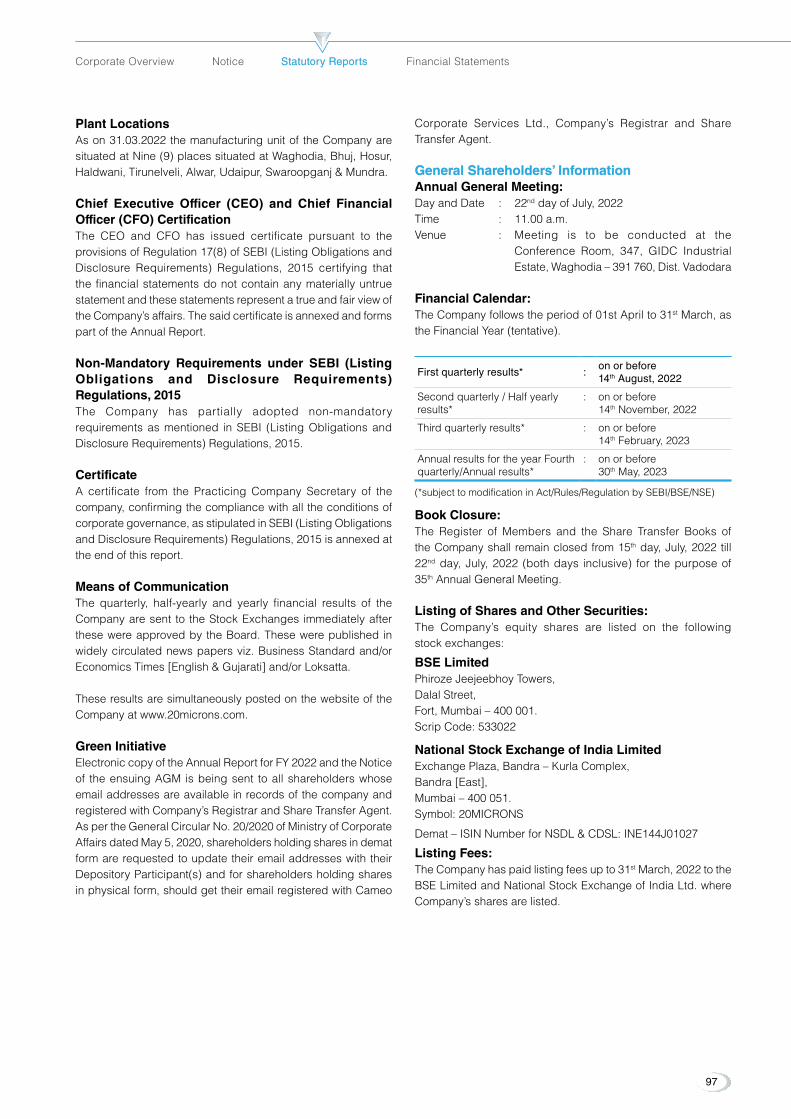
97
Corporate Overview Notice Statutory ReportsStatutory Reports Financial Statements
Plant LocationsAs on 31.03.2022 the manufacturing unit of the Company are situated at Nine (9) places situated at Waghodia, Bhuj, Hosur, Haldwani, Tirunelveli, Alwar, Udaipur, Swaroopganj & Mundra.
Chief Executive Officer (CEO) and Chief Financial Officer (CFO) CertificationThe CEO and CFO has issued certificate pursuant to the provisions of Regulation 17(8) of SEBI (Listing Obligations and Disclosure Requirements) Regulations, 2015 certifying that the financial statements do not contain any materially untrue statement and these statements represent a true and fair view of the Company’s affairs. The said certificate is annexed and forms part of the Annual Report.
Non-Mandatory Requirements under SEBI (Listing Obligations and Disclosure Requirements) Regulations, 2015The Company has partially adopted non-mandatory requirements as mentioned in SEBI (Listing Obligations and Disclosure Requirements) Regulations, 2015.
CertificateA certificate from the Practicing Company Secretary of the company, confirming the compliance with all the conditions of corporate governance, as stipulated in SEBI (Listing Obligations and Disclosure Requirements) Regulations, 2015 is annexed at the end of this report.
Means of CommunicationThe quarterly, half-yearly and yearly financial results of the Company are sent to the Stock Exchanges immediately after these were approved by the Board. These were published in widely circulated news papers viz. Business Standard and/or Economics Times [English & Gujarati] and/or Loksatta.
These results are simultaneously posted on the website of the Company at www.20microns.com.
Green InitiativeElectronic copy of the Annual Report for FY 2022 and the Notice of the ensuing AGM is being sent to all shareholders whose email addresses are available in records of the company and registered with Company’s Registrar and Share Transfer Agent. As per the General Circular No. 20/2020 of Ministry of Corporate Affairs dated May 5, 2020, shareholders holding shares in demat form are requested to update their email addresses with their Depository Participant(s) and for shareholders holding shares in physical form, should get their email registered with Cameo
Corporate Services Ltd., Company’s Registrar and Share Transfer Agent.
General Shareholders’ InformationGeneral Shareholders’ InformationAnnual General Meeting:Day and Date : 22nd day of July, 2022Time : 11.00 a.m.Venue : Meeting is to be conducted at the
Conference Room, 347, GIDC Industrial Estate, Waghodia – 391 760, Dist. Vadodara
Financial Calendar:The Company follows the period of 01st April to 31st March, as the Financial Year (tentative).
First quarterly results* :on or before 14th August, 2022
Second quarterly / Half yearly results*
: on or before 14th November, 2022
Third quarterly results* : on or before 14th February, 2023
Annual results for the year Fourth quarterly/Annual results*
: on or before 30th May, 2023
(*subject to modification in Act/Rules/Regulation by SEBI/BSE/NSE)
Book Closure:The Register of Members and the Share Transfer Books of the Company shall remain closed from 15th day, July, 2022 till 22nd day, July, 2022 (both days inclusive) for the purpose of 35th Annual General Meeting.
Listing of Shares and Other Securities:The Company’s equity shares are listed on the following stock exchanges:
BSE Limited Phiroze Jeejeebhoy Towers,Dalal Street,Fort, Mumbai – 400 001.Scrip Code: 533022
National Stock Exchange of India LimitedExchange Plaza, Bandra – Kurla Complex,Bandra [East],Mumbai – 400 051.Symbol: 20MICRONS
Demat – ISIN Number for NSDL & CDSL: INE144J01027
Listing Fees:The Company has paid listing fees up to 31st March, 2022 to the BSE Limited and National Stock Exchange of India Ltd. where Company’s shares are listed.

Annual Report 2021-222021-22
98
20 Microns Limited20 Microns Limited
MARKET PRICE DATAMARKET PRICE DATAThe monthly high and low prices of the shares of the company as quoted on Bombay Stock Exchange Limited and National Stock Exchange of India Limited for the FY 2021-22 are given hereunder:
MonthBSE Ltd. National Stock Exchange of India Ltd.
High Price Low Price Close Price High Price Low Price Close PriceApr-21 41.50 29.25 38.35 40.5 38.05 38.2May-21 74.80 37.25 64.20 66.3 63.00 64.1Jun-21 69.85 58.45 60.30 61.95 59.75 60.15Jul-21 69.40 58.45 67.25 68.65 62.70 66.5Aug-21 70.05 48.60 53.95 54.9 53.60 53.95Sep-21 68.40 52.10 61.35 65.15 60.70 61.2Oct-21 65.70 55.50 58.50 60.00 58.05 58.55Nov-21 68.50 55.90 58.15 60.00 57.50 58.10Dec-21 74.50 54.50 63.40 66.60 63.00 63.45Jan-22 108.25 58.30 91.50 99.75 89.65 91.50Feb-22 94.25 67.35 71.25 72.40 67.00 71.20Mar-22 80.40 68.50 74.00 77.25 73.00 73.85
20 MICRONS20 MICRONS Share Price Movement v/s NSE Nifty Share Price Movement v/s NSE Nifty
20 M
ICR
ON
S SH
AR
E PR
ICE
NSE
Sen
sex
18,000.00
17,000.00
16,000.00
15,000.00
14,000.00
90
100
80
70
60
50
40
30
20
10
0Apr21 May21 Jun21 Jul21 Aug21 Sep21 Oct21 Nov21 Dec21 Jan22 Feb22 Mar22
20 Microns Share Price NSE Nifty
20 MICRONS20 MICRONS Share Price Movement v/s BSE Sensex Share Price Movement v/s BSE Sensex
20 M
ICR
ON
S SH
AR
E PR
ICE
BSE
Sen
sex
60,000.00
58,000.00
56,000.00
54,000.00
52,000.00
50,000.00
48,000.00
90
100
80
70
60
50
40
30
20
10
0Apr21 May21 Jun21 Jul21 Aug21 Sep21 Oct21 Nov21 Dec21 Jan22 Feb22 Mar22
20 Microns Share Price BSE Sensex
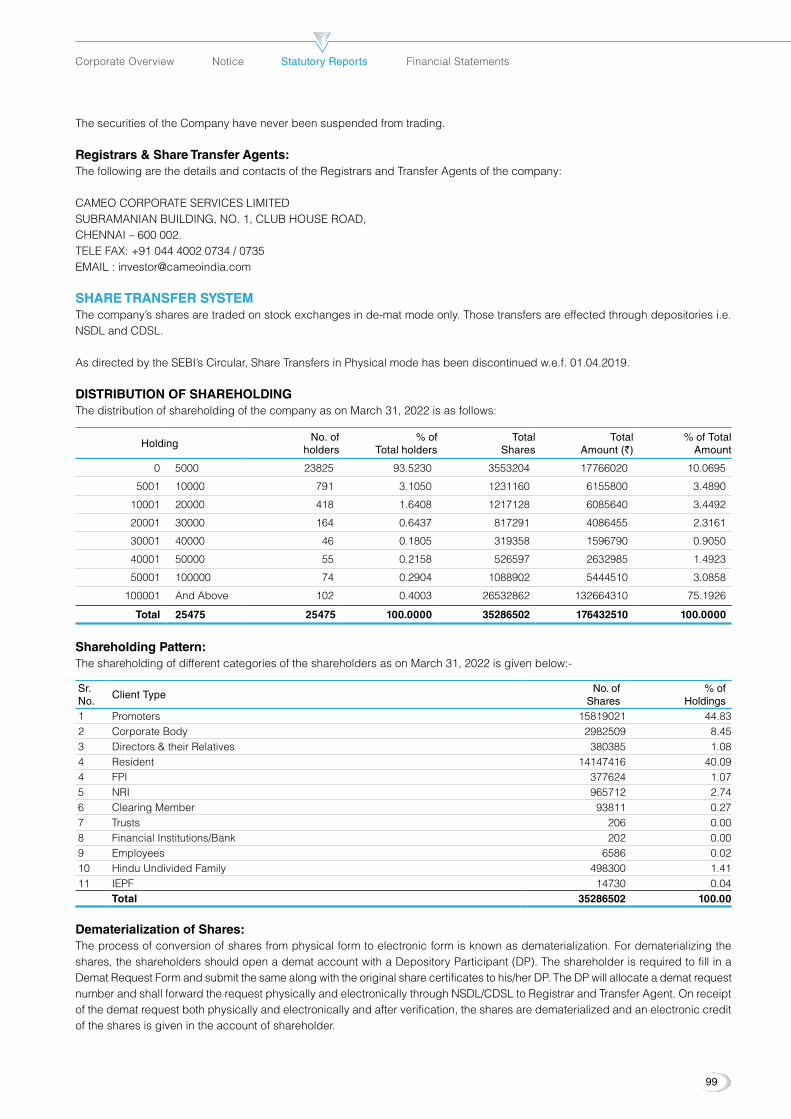
99
Corporate Overview Notice Statutory ReportsStatutory Reports Financial Statements
The securities of the Company have never been suspended from trading.
Registrars & Share Transfer Agents:The following are the details and contacts of the Registrars and Transfer Agents of the company:
CAMEO CORPORATE SERVICES LIMITEDSUBRAMANIAN BUILDING, NO. 1, CLUB HOUSE ROAD,CHENNAI – 600 002.TELE FAX: +91 044 4002 0734 / 0735EMAIL : [email protected]
SHARE TRANSFER SYSTEMSHARE TRANSFER SYSTEMThe company’s shares are traded on stock exchanges in de-mat mode only. Those transfers are effected through depositories i.e. NSDL and CDSL.
As directed by the SEBI’s Circular, Share Transfers in Physical mode has been discontinued w.e.f. 01.04.2019.
DISTRIBUTION OF SHAREHOLDINGThe distribution of shareholding of the company as on March 31, 2022 is as follows:
HoldingNo. of
holders% of
Total holdersTotal
SharesTotal
Amount (`)% of Total
Amount
0 5000 23825 93.5230 3553204 17766020 10.0695
5001 10000 791 3.1050 1231160 6155800 3.4890
10001 20000 418 1.6408 1217128 6085640 3.4492
20001 30000 164 0.6437 817291 4086455 2.3161
30001 40000 46 0.1805 319358 1596790 0.9050
40001 50000 55 0.2158 526597 2632985 1.4923
50001 100000 74 0.2904 1088902 5444510 3.0858
100001 And Above 102 0.4003 26532862 132664310 75.1926
Total 25475 25475 100.0000 35286502 176432510 100.0000
Shareholding Pattern:The shareholding of different categories of the shareholders as on March 31, 2022 is given below:-
Sr. No.
Client TypeNo. of
Shares% of
Holdings1 Promoters 15819021 44.832 Corporate Body 2982509 8.453 Directors & their Relatives 380385 1.084 Resident 14147416 40.094 FPI 377624 1.075 NRI 965712 2.746 Clearing Member 93811 0.277 Trusts 206 0.008 Financial Institutions/Bank 202 0.009 Employees 6586 0.0210 Hindu Undivided Family 498300 1.4111 IEPF 14730 0.04 Total 35286502 100.00
Dematerialization of Shares:The process of conversion of shares from physical form to electronic form is known as dematerialization. For dematerializing the shares, the shareholders should open a demat account with a Depository Participant (DP). The shareholder is required to fill in a Demat Request Form and submit the same along with the original share certificates to his/her DP. The DP will allocate a demat request number and shall forward the request physically and electronically through NSDL/CDSL to Registrar and Transfer Agent. On receipt of the demat request both physically and electronically and after verification, the shares are dematerialized and an electronic credit of the shares is given in the account of shareholder.
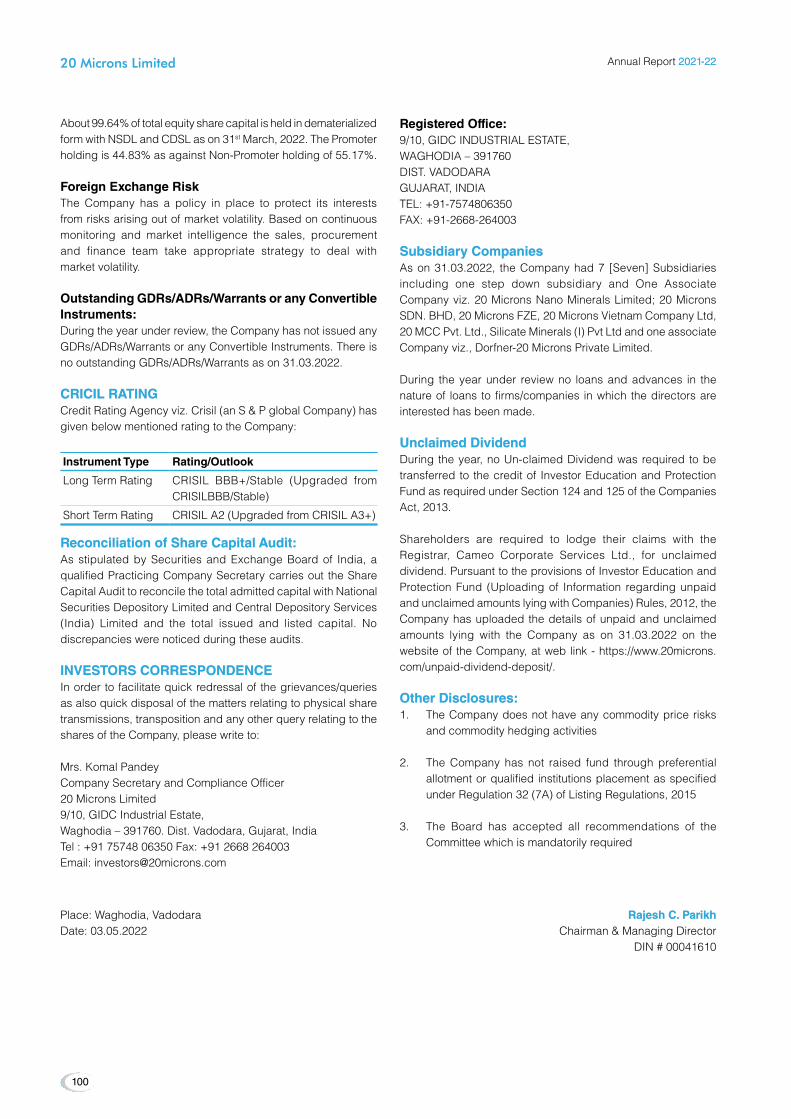
Annual Report 2021-222021-22
100
20 Microns Limited20 Microns Limited
About 99.64% of total equity share capital is held in dematerialized form with NSDL and CDSL as on 31st March, 2022. The Promoter holding is 44.83% as against Non-Promoter holding of 55.17%.
Foreign Exchange RiskThe Company has a policy in place to protect its interests from risks arising out of market volatility. Based on continuous monitoring and market intelligence the sales, procurement and finance team take appropriate strategy to deal with market volatility.
Outstanding GDRs/ADRs/Warrants or any Convertible Instruments:During the year under review, the Company has not issued any GDRs/ADRs/Warrants or any Convertible Instruments. There is no outstanding GDRs/ADRs/Warrants as on 31.03.2022.
CRICIL RATINGCRICIL RATINGCredit Rating Agency viz. Crisil (an S & P global Company) has given below mentioned rating to the Company:
Instrument Type Rating/Outlook
Long Term Rating CRISIL BBB+/Stable (Upgraded from CRISILBBB/Stable)
Short Term Rating CRISIL A2 (Upgraded from CRISIL A3+)
Reconciliation of Share Capital Audit:Reconciliation of Share Capital Audit:As stipulated by Securities and Exchange Board of India, a qualified Practicing Company Secretary carries out the Share Capital Audit to reconcile the total admitted capital with National Securities Depository Limited and Central Depository Services (India) Limited and the total issued and listed capital. No discrepancies were noticed during these audits.
INVESTORS CORRESPONDENCEINVESTORS CORRESPONDENCEIn order to facilitate quick redressal of the grievances/queries as also quick disposal of the matters relating to physical share transmissions, transposition and any other query relating to the shares of the Company, please write to:
Mrs. Komal PandeyCompany Secretary and Compliance Officer20 Microns Limited9/10, GIDC Industrial Estate,Waghodia – 391760. Dist. Vadodara, Gujarat, IndiaTel : +91 75748 06350 Fax: +91 2668 264003Email: [email protected]
Registered Office:9/10, GIDC INDUSTRIAL ESTATE,WAGHODIA – 391760DIST. VADODARAGUJARAT, INDIATEL: +91-7574806350FAX: +91-2668-264003
Subsidiary CompaniesSubsidiary CompaniesAs on 31.03.2022, the Company had 7 [Seven] Subsidiaries including one step down subsidiary and One Associate Company viz. 20 Microns Nano Minerals Limited; 20 Microns SDN. BHD, 20 Microns FZE, 20 Microns Vietnam Company Ltd, 20 MCC Pvt. Ltd., Silicate Minerals (I) Pvt Ltd and one associate Company viz., Dorfner-20 Microns Private Limited.
During the year under review no loans and advances in the nature of loans to firms/companies in which the directors are interested has been made.
Unclaimed DividendUnclaimed DividendDuring the year, no Un-claimed Dividend was required to be transferred to the credit of Investor Education and Protection Fund as required under Section 124 and 125 of the Companies Act, 2013.
Shareholders are required to lodge their claims with the Registrar, Cameo Corporate Services Ltd., for unclaimed dividend. Pursuant to the provisions of Investor Education and Protection Fund (Uploading of Information regarding unpaid and unclaimed amounts lying with Companies) Rules, 2012, the Company has uploaded the details of unpaid and unclaimed amounts lying with the Company as on 31.03.2022 on the website of the Company, at web link - https://www.20microns.com/unpaid-dividend-deposit/.
Other Disclosures:Other Disclosures:1. The Company does not have any commodity price risks
and commodity hedging activities
2. The Company has not raised fund through preferential allotment or qualified institutions placement as specified under Regulation 32 (7A) of Listing Regulations, 2015
3. The Board has accepted all recommendations of the Committee which is mandatorily required
Place: Waghodia, Vadodara Rajesh C. ParikhRajesh C. ParikhDate: 03.05.2022 Chairman & Managing Director
DIN # 00041610

101
Corporate Overview Notice Statutory ReportsStatutory Reports Financial Statements
Annexure-I
CERTIFICATE OF NON-DISQUALIFICATION OF DIRECTORSCERTIFICATE OF NON-DISQUALIFICATION OF DIRECTORS(pursuant to Regulation 34(3) and Schedule V Para C clause (10)(i) of the SEBI
(Listing Obligations and Disclosure Requirements) Regulations, 2015)
To,The Members of20 Microns Limited9/10, GIDC Industrial Estate,Waghodia, Dist: Vadodara,Gujarat-391750, India
I have examined the relevant registers, records, forms, returns and disclosures received from the Directors of 20 Microns Limited having CIN L99999GJ1987PLC009768 and having registered office at 9-10, G.I.D.C. Industrial Estate, Waghodia-391760, Dist.: Vadodara, Gujarat, India (hereinafter referred to as ‘the Company’), produced before me/us by the Company for the purpose of issuing this Certificate, in accordance with Regulation 34(3) read with Schedule V Para-C Sub clause 10(i) of the Securities Exchange Board of India (Listing Obligations and Disclosure Requirements) Regulations, 2015.
In my opinion and to the best of our information and according to the verifications (including Directors Identification Number (DIN) status at the portal (www.mca.gov.in) as considered necessary and explanations furnished to me by the Company & its officers, I hereby certify that none of the Directors on the Board of the Company as stated below for the Financial Year ending on March 31, 2022 have been debarred or disqualified from being appointed or continuing as Directors of companies by the Securities and Exchange Board of India, Ministry of Corporate Affairs, or any such other Statutory Authority.
Sr. No.
Name of Director DINDate of Appointment
in Company*
1 RAJESH CHANDRESH PARIKH 00041610 01.04.2013
2 ATIL CHANDRESH PARIKH 00041712 29.01.2009
3 SEJAL RAJESH PARIKH 00140489 04.05.2017
4 RAMKISAN AMIRCHAND DEVIDAYAL 00238853 13.10.2007
5 AJAY ISHWARLAL RANKA 01676073 27.09.2014
6 ATULBHAI HARIBHAI PATEL 00009587 27.08.2009
7 JAIDEEP BHANUSHANKAR VERMA 00323385 28.05.2019
*the date of appointment is as per the MCA Portal.
Ensuring the eligibility of for the appointment / continuity of every Director on the Board is the responsibility of the management of the Company. Our responsibility is to express an opinion on these based on our verification. This certificate is neither an assurance as to the future viability of the Company nor of the efficiency or effectiveness with which the management has conducted the affairs of the Company.
Place: VadodaraDate: 03.05.2022
Devesh R. DesaiDevesh R. DesaiPracticing Company Secretary
ACS#11332 CP#7484UDIN Number: A011332D000275563

Annual Report 2021-222021-22
102
20 Microns Limited20 Microns Limited
CHIEF FINANCIAL OFFICER & CHIEF ExECUTIVE OFFICER CERTIFICATECHIEF FINANCIAL OFFICER & CHIEF ExECUTIVE OFFICER CERTIFICATE
The Board of Directors20 Microns Limited
Dear Members of the Board,
1. We have reviewed Audited Financial statements and the cash flow statement of 20 Microns Limited for the year ended 31st March, 2022 and that to the best of our knowledge and belief :
i) these statements do not contain any materially untrue statement or omit any material fact or contain statements that might be misleading;
ii) these statements together present a true and fair view of the Company’s affairs and are in compliance with existing Indian Accounting Standards, applicable laws and regulations.
2. To the best of our knowledge and information, no transactions are entered into by the Company during the year ended 31st March, 2022, which are fraudulent, illegal and violative of the Company’s Code of Conduct.
3. We accept responsibility for establishing and maintaining internal controls for financial reporting. In order to evaluate the effectiveness of internal control systems, pertaining to financial reporting and for risk management we have established internal framework to carry out independent study at regular intervals on risk management and internal controls, which helps in forming the opinion for CEO/CFO certification as required.
4. We have informed to the Auditors and the Audit Committee:
i) There are no Significant changes in the internal control over financial reporting during the year;
ii) There are no Significant changes in accounting policies during the year and
iii) There are no instances of significant fraud of which we have become aware.
5. We have provided protection to Whistle Blower from unfair termination and other unfair or prejudicial employment practices.
6. We further declare that all Board Members and Senior Management Personnel have affirmed compliance with code of conduct and ethics for the year covered by this report.
Place: Waghodia, Vadodara Narendra R. PatelNarendra R. Patel Atil C. ParikhAtil C. ParikhDate: 03.05.2022 Chief Financial Officer CEO and Managing Director
103
Corporate Overview Notice Statutory ReportsStatutory Reports Financial Statements
PRACTICING COMPANY SECRETARY CERTIFICATE PRACTICING COMPANY SECRETARY CERTIFICATE FOR COMPLIANCE OF CORPORATE GOVERNANCEFOR COMPLIANCE OF CORPORATE GOVERNANCE
To,The Members of20 Microns Limited
1. I, Devesh R. Desai, Company Secretary in Practice, have examined the compliance of conditions of Corporate Governance of M/s 20 Microns Limited having CIN L99999GJ1987PLC009768 and having registered office at 9-10, G.I.D.C. Industrial Estate, Waghodia-391760, Dist.: Vadodara, Gujarat, India (hereinafter referred to as ‘the Company’), for the year ended on 31st March 2022, as stipulated in regulations 17 to 27 and clauses (b) to (i) of regulation 46(2) and paras C and D of Schedule V of the SEBI (Listing Obligations and Disclosure Requirements) Regulations, 2015 and amendments from time to time(the “Listing Regulations”).
MANAGEMENT’S RESPONSIBILITYMANAGEMENT’S RESPONSIBILITY2. The compliance of conditions of Corporate Governance is the responsibility of the Management. This responsibility includes
the design, implementation and maintenance of internal control and procedures to ensure compliance with the conditions of the Corporate Governance stipulated in the Listing Regulations.
AUDITORS’ RESPONSIBILITYAUDITORS’ RESPONSIBILITY3. My responsibility is limited to examining the procedures and implementation thereof adopted by the Company for ensuring
compliance with the conditions of the Corporate Governance. It is neither an audit nor an expression of opinion on the financial statements of the Company.
4. I have examined the relevant records and documents maintained by the Company for the purposes of providing reasonable assurance on the compliance with Corporate Governance requirements by the Company.
OPINIONOPINION5. Based on my examination of the relevant records and according to the information and explanations provided to me and
the representations provided by the Management, I certify that the Company has complied with the conditions of Corporate Governance as stipulated in regulations 17 to 27 and clauses (b) to (i) of regulation 46(2) and paras C and D of Schedule V of the Listing Regulations during the year ended 31st March 2022.
6. I state that such compliance is neither an assurance as to the future viability of the Company nor the efficiency or effectiveness with which the Management has conducted the affairs of the Company Reporting of internal auditor directly to the Audit Committee.
Place: VadodaraDate: 3rd May, 2022
Devesh R. DesaiDevesh R. DesaiPracticing Company Secretary
ACS#11332 CP#7484UDIN Number: AO11332D000275596
Annual Report 2021-222021-22
104
20 Microns Limited20 Microns Limited
Secretarial Audit ReportSecretarial Audit Report(For the Financial year ended on 31st March, 2022)
[Pursuant to section 204(1) of the Companies Act, 2013 and Rule No. 9 of theCompanies (Appointment and Remuneration of Managerial Personnel) Rules, 2014]
To,The Members,20 Microns Ltd.9 – 10, GIDC Industrial Estate,Waghodia, Baroda – 391760
Dear Sirs,
We have conducted the secretarial audit of the compliance of applicable statutory provisions and the adherence to good corporate practice by 20 Microns Ltd. (hereinafter called “the Company”). Secretarial Audit was conducted in a manner that provided us a reasonable basis for evaluating the corporate conducts/ statutory compliances and expressing our opinion thereon.
Based on our verification of the Company’s books, papers, minutes books, forms and returns filed and other records maintained by the Company and also the information provided by the Company, its officers, agents and authorized representatives during the conduct of secretarial audit, we hereby report that in our opinion, the Company has, during the audit period covering the financial year ended on 31st March, 2022, complied with the statutory provisions listed hereunder and also that the Company has proper Board processes and compliance mechanism in place to the extent, in the manner and subject to the reporting made hereinafter:
We have examined the books, papers, minute books, forms and returns filed and other records maintained by the Company, for the financial year ended on 31st March, 2022, according to the provisions of:
1. The Companies Act, 2013 (the Act) and the rules made thereunder.
2. The Securities Contracts (Regulation) Act, 1956 (‘SCRA’) and the rules made thereunder;
3. The Depositories Act, 1996 and the Regulations and Bye-laws framed thereunder;
4. Foreign Exchange Management Act, 1999 and the rules and regulations made thereunder to the extent of Foreign Direct Investment and Overseas Direct Investment and External Commercial Borrowings. - As reported to us there were no FDI, ODI and ECB transactions in the Company during the Audit period.
5. The following Regulations and Guidelines prescribed under the Securities and Exchange Board of India Act, 1992 (‘SEBI Act’).
A. The Securities and Exchange Board of India (Substantial Acquisition of Shares and Takeovers) Regulations, 2011.
B. The Securities and Exchange Board of India (Prohibition of Insider Trading) Regulations, 2015.
C. The Securities and Exchange Board of India (Issue of Capital and Disclosure Requirements) Regulations, 2009 - Not Applicable as the Company did not issue any security during the financial year under review.
D. The Securities and Exchange Board of India (Employee Stock Option Scheme and Employee Stock Purchase Scheme) Guidelines, 1999. – Not Applicable as the Company has not granted any options to its employees during the financial year under review.
E. The Securities and Exchange Board of India (Issue and Listing of Debt Securities) Regulations, 2008. - Not Applicable as the Company neither issue nor listed any debt securities during the financial year under review.
F. The Securities and Exchange Board of India (Registrars to an Issue and Share Transfer Agents) Regulations, 1993 regarding the Companies Act and dealing with client – The Company is not registered as Registrar to Issue and Share Transfer Agent.
G. The Securities and Exchange Board of India (Delisting of Equity Shares) Regulations, 2009. - Not Applicable as the Company has not delisted its equity shares from any stock exchange during the financial year under review.
105
Corporate Overview Notice Statutory ReportsStatutory Reports Financial Statements
H. The Securities and Exchange Board of India (Buyback of Securities) Regulations, 1998. - Not Applicable as the Company did not buy back any security during the financial year under review.
6. Considering representation of management and products, process and location of the Company, following laws are applicable specifically to the Company. Having regard to the compliance system prevailing in the Company and on examination of the relevant records on test check basis, we further report that the Company has complied with the following laws;
A. The Water (prevention and control of pollution) Act, 1974
B. The Air (Prevention and Control of Pollution) Act, 1981
C. The Environment (Protection) Act, 1984
D. The Mines Act, 1952
E. The Mines and Minerals (Development & Regulations) Act, 1957
F. The Mines and Minerals (Development & Regulations) Amendment Ordinance, 2015
We have also examined compliance with the applicable clauses of the following;
(i) The Mandatory Secretarial Standards issued by The Institute of Company Secretaries of India.
(ii) The Securities and Exchange Board of India (Listing Obligations and Disclosure Requirements) Regulations, 2015.
During the period under review the Company has complied with the provisions of the Act, Rules, Regulations, Guidelines, Standards mentioned above.
We further report that;The Board of Directors of the Company is duly constituted with proper balance of Executive Directors, Non-Executive Directors and Independent Directors. The changes in the composition of the Board of Directors that took place during the year under review were carried out in compliance with the provisions of the Act.
Adequate notice is given to all directors to schedule the Board Meetings, agenda and detailed notes on agenda were sent atleast seven days in advance, (except where meetings are held on shorter notice with consent) and a system exists for seeking and obtaining further information and clarifications on the agenda items before the meeting and for meaningful participation at the meeting.
We further report that as per the minutes of the meetings duly recorded and signed by the Chairman, the decisions were carried at meetings without any dissent.
We further report that there are adequate systems and processes in the Company commensurate with the size and operations of the Company to monitor and ensure compliance with applicable laws, rules, regulations and guidelines.
Place: VadodaraDate: 3rd May, 2022
for J. J. Gandhi & Co.Practising Company Secretaries
(J. J. Gandhi)(J. J. Gandhi)Proprietor
FCS No. 3519 and CP No. 2515UDIN number:F003519D000261293
This report is to be read with our letter of even date which is annexed as Annexure and forms an integral part of this report.
Annual Report 2021-222021-22
106
20 Microns Limited20 Microns Limited
Annexure to Secretarial Audit ReportAnnexure to Secretarial Audit Report
Date:3rd May, 2022
To,The Members,20 Microns Ltd.9 – 10, GIDC Industrial Estate,Waghodia, Baroda – 391760
Our report of even date is to be read along with this letter.
1. Maintenance of secretarial record is the responsibility of the management of the company. Our responsibility is to express an opinion on these secretarial records based on our audit.
2. We have followed the audit practices and the processes as were appropriate to obtain reasonable assurance about the correctness of the contents of the secretarial records. The verification was done on test basis to ensure that correct facts are reflected in secretarial records. We believe that the processes and the practices, we followed provided a reasonable basis for our opinion.
3. We have not verified the correctness and appropriateness of financial records and Books of Accounts of the company. The Compliance of applicable financial laws like direct and indirect laws have not been reviewed in this Audit since the same have been subject to review by Statutory Financial Audit and Other designated professionals.
4. Wherever required, we have obtained the Management representation about the compliance of laws, rules and regulations and happening of events etc.
5. The compliance of the provisions of corporate and other applicable laws, rules, regulations, standards is the responsibility of management. Our examination was limited to the verification of procedures on test basis.
6. The Secretarial Audit report is neither an assurance as to the future viability of the company nor of the efficacy or effectiveness with which the management has conducted the affairs of the company.
for J. J. Gandhi & Co.Practising Company Secretaries
(J. J. Gandhi)(J. J. Gandhi)Proprietor
FCS No. 3519 and CP No. 2515

107
Financial Statements108 Standalone Independent Auditor’s Report
118 Standalone Balance Sheet
119 Standalone Statement of Profit and Loss
120 Standalone Cash Flow Statement
122 Standalone Statement of Changes In Equity (SOCIE)
123 Notes to Standalone Financial Statements
177 Consolidated Independent Auditor’s Report
184 Consolidated Balance Sheet
185 Consolidated Statement of Profit and Loss
186 Consolidated Cash Flow Statement
188 Consolidated Statement of Changes in Equity (SOCIE)
189 Notes to Consolidated Financial Statements
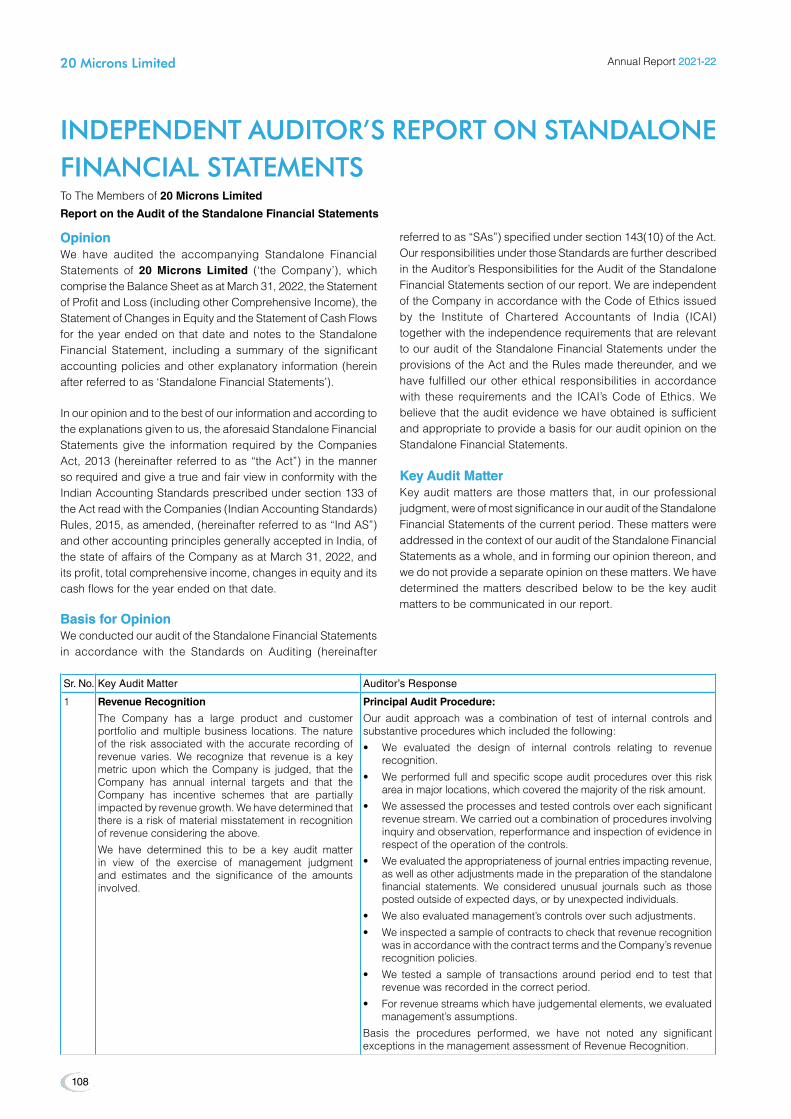
INDEPENDENT AUDITOR’S REPORT ON STANDALONE INDEPENDENT AUDITOR’S REPORT ON STANDALONE FINANCIAL STATEMENTSFINANCIAL STATEMENTSTo The Members of 20 Microns Limited
Report on the Audit of the Standalone Financial Statements
OpinionOpinionWe have audited the accompanying Standalone Financial Statements of 20 Microns Limited (‘the Company’), which comprise the Balance Sheet as at March 31, 2022, the Statement of Profit and Loss (including other Comprehensive Income), the Statement of Changes in Equity and the Statement of Cash Flows for the year ended on that date and notes to the Standalone Financial Statement, including a summary of the significant accounting policies and other explanatory information (herein after referred to as ‘Standalone Financial Statements’).
In our opinion and to the best of our information and according to the explanations given to us, the aforesaid Standalone Financial Statements give the information required by the Companies Act, 2013 (hereinafter referred to as “the Act”) in the manner so required and give a true and fair view in conformity with the Indian Accounting Standards prescribed under section 133 of the Act read with the Companies (Indian Accounting Standards) Rules, 2015, as amended, (hereinafter referred to as “Ind AS”) and other accounting principles generally accepted in India, of the state of affairs of the Company as at March 31, 2022, and its profit, total comprehensive income, changes in equity and its cash flows for the year ended on that date.
Basis for OpinionBasis for OpinionWe conducted our audit of the Standalone Financial Statements in accordance with the Standards on Auditing (hereinafter
referred to as “SAs”) specified under section 143(10) of the Act. Our responsibilities under those Standards are further described in the Auditor’s Responsibilities for the Audit of the Standalone Financial Statements section of our report. We are independent of the Company in accordance with the Code of Ethics issued by the Institute of Chartered Accountants of India (ICAI) together with the independence requirements that are relevant to our audit of the Standalone Financial Statements under the provisions of the Act and the Rules made thereunder, and we have fulfilled our other ethical responsibilities in accordance with these requirements and the ICAI’s Code of Ethics. We believe that the audit evidence we have obtained is sufficient and appropriate to provide a basis for our audit opinion on the Standalone Financial Statements.
Key Audit MatterKey Audit MatterKey audit matters are those matters that, in our professional judgment, were of most significance in our audit of the Standalone Financial Statements of the current period. These matters were addressed in the context of our audit of the Standalone Financial Statements as a whole, and in forming our opinion thereon, and we do not provide a separate opinion on these matters. We have determined the matters described below to be the key audit matters to be communicated in our report.
Sr. No. Key Audit Matter Auditor’s Response
1 Revenue Recognition
The Company has a large product and customer portfolio and multiple business locations. The nature of the risk associated with the accurate recording of revenue varies. We recognize that revenue is a key metric upon which the Company is judged, that the Company has annual internal targets and that the Company has incentive schemes that are partially impacted by revenue growth. We have determined that there is a risk of material misstatement in recognition of revenue considering the above.
We have determined this to be a key audit matter in view of the exercise of management judgment and estimates and the significance of the amounts involved.
Principal Audit Procedure:
Our audit approach was a combination of test of internal controls and substantive procedures which included the following:
• We evaluated the design of internal controls relating to revenuerecognition.
• Weperformedfullandspecificscopeauditproceduresover thisriskarea in major locations, which covered the majority of the risk amount.
• Weassessedtheprocessesandtestedcontrolsovereachsignificantrevenue stream. We carried out a combination of procedures involving inquiry and observation, reperformance and inspection of evidence in respect of the operation of the controls.
• Weevaluatedtheappropriatenessofjournalentriesimpactingrevenue,as well as other adjustments made in the preparation of the standalone financial statements. We considered unusual journals such as those posted outside of expected days, or by unexpected individuals.
• Wealsoevaluatedmanagement’scontrolsoversuchadjustments.
• Weinspectedasampleofcontractstocheckthatrevenuerecognitionwas in accordance with the contract terms and the Company’s revenue recognition policies.
• We tested a sample of transactions around period end to test thatrevenue was recorded in the correct period.
• Forrevenuestreamswhichhavejudgementalelements,weevaluatedmanagement’s assumptions.
Basis the procedures performed, we have not noted any significant exceptions in the management assessment of Revenue Recognition.
Annual Report 2021-222021-22
108
20 Microns Limited20 Microns Limited
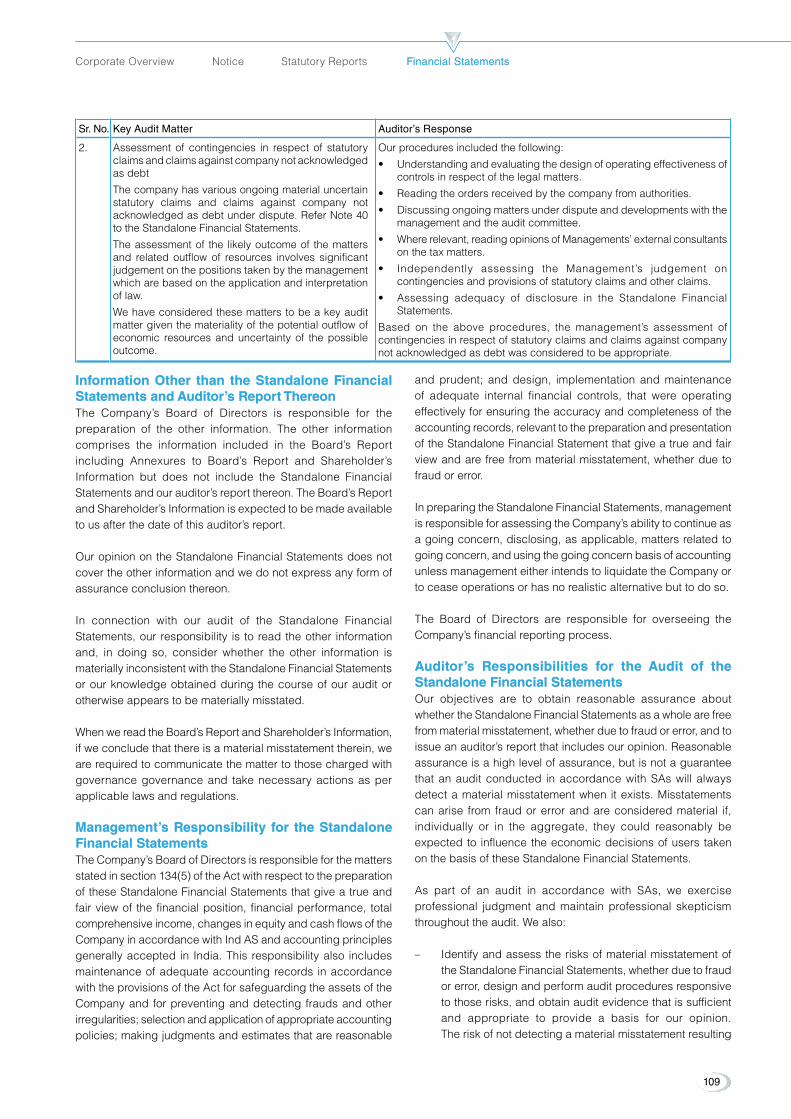
Sr. No. Key Audit Matter Auditor’s Response
2. Assessment of contingencies in respect of statutory claims and claims against company not acknowledged as debt
The company has various ongoing material uncertain statutory claims and claims against company not acknowledged as debt under dispute. Refer Note 40 to the Standalone Financial Statements.
The assessment of the likely outcome of the matters and related outflow of resources involves significant judgement on the positions taken by the management which are based on the application and interpretation of law.
We have considered these matters to be a key audit matter given the materiality of the potential outflow of economic resources and uncertainty of the possible outcome.
Our procedures included the following:
• Understandingandevaluatingthedesignofoperatingeffectivenessofcontrols in respect of the legal matters.
• Readingtheordersreceivedbythecompanyfromauthorities.
• Discussingongoingmattersunderdisputeanddevelopmentswiththemanagement and the audit committee.
• Whererelevant,readingopinionsofManagements’externalconsultantson the tax matters.
• Independently assessing the Management’s judgement oncontingencies and provisions of statutory claims and other claims.
• Assessing adequacy of disclosure in the Standalone FinancialStatements.
Based on the above procedures, the management’s assessment of contingencies in respect of statutory claims and claims against company not acknowledged as debt was considered to be appropriate.
Information Other than the Standalone Financial Information Other than the Standalone Financial Statements and Auditor’s Report ThereonStatements and Auditor’s Report ThereonThe Company’s Board of Directors is responsible for thepreparation of the other information. The other information comprises the information included in the Board’s Report including Annexures to Board’s Report and Shareholder’s Information but does not include the Standalone Financial Statements and our auditor’s report thereon. The Board’s Report and Shareholder’s Information is expected to be made available to us after the date of this auditor’s report.
Our opinion on the Standalone Financial Statements does not cover the other information and we do not express any form of assurance conclusion thereon.
In connection with our audit of the Standalone Financial Statements, our responsibility is to read the other information and, in doing so, consider whether the other information is materially inconsistent with the Standalone Financial Statements or our knowledge obtained during the course of our audit or otherwise appears to be materially misstated.
When we read the Board’s Report and Shareholder’s Information, if we conclude that there is a material misstatement therein, we are required to communicate the matter to those charged with governance governance and take necessary actions as per applicable laws and regulations.
Management’s Responsibility for the Standalone Management’s Responsibility for the Standalone Financial StatementsFinancial StatementsTheCompany’sBoardofDirectorsisresponsibleforthemattersstated in section 134(5) of the Act with respect to the preparation of these Standalone Financial Statements that give a true and fair view of the financial position, financial performance, total comprehensive income, changes in equity and cash flows of the Company in accordance with Ind AS and accounting principles generally accepted in India. This responsibility also includes maintenance of adequate accounting records in accordance with the provisions of the Act for safeguarding the assets of the Company and for preventing and detecting frauds and other irregularities; selection and application of appropriate accounting policies; making judgments and estimates that are reasonable
and prudent; and design, implementation and maintenance of adequate internal financial controls, that were operating effectively for ensuring the accuracy and completeness of the accounting records, relevant to the preparation and presentation of the Standalone Financial Statement that give a true and fair view and are free from material misstatement, whether due to fraud or error.
In preparing the Standalone Financial Statements, management is responsible for assessing the Company’s ability to continue as a going concern, disclosing, as applicable, matters related to going concern, and using the going concern basis of accounting unless management either intends to liquidate the Company or to cease operations or has no realistic alternative but to do so.
The Board of Directors are responsible for overseeing theCompany’s financial reporting process.
Auditor’s Responsibilities for the Audit of the Auditor’s Responsibilities for the Audit of the Standalone Financial StatementsStandalone Financial StatementsOur objectives are to obtain reasonable assurance about whether the Standalone Financial Statements as a whole are free from material misstatement, whether due to fraud or error, and to issue an auditor’s report that includes our opinion. Reasonable assurance is a high level of assurance, but is not a guarantee that an audit conducted in accordance with SAs will always detect a material misstatement when it exists. Misstatements can arise from fraud or error and are considered material if, individually or in the aggregate, they could reasonably be expected to influence the economic decisions of users taken on the basis of these Standalone Financial Statements.
As part of an audit in accordance with SAs, we exercise professional judgment and maintain professional skepticism throughout the audit. We also:
– Identify and assess the risks of material misstatement of the Standalone Financial Statements, whether due to fraud or error, design and perform audit procedures responsive to those risks, and obtain audit evidence that is sufficient and appropriate to provide a basis for our opinion. The risk of not detecting a material misstatement resulting
109
Corporate Overview Notice Statutory Reports Financial StatementsFinancial Statements
from fraud is higher than for one resulting from error, as fraud may involve collusion, forgery, intentional omissions, misrepresentations, or the override of internal control.
– Obtain an understanding of internal financial controls relevant to the audit in order to design audit procedures thatareappropriateinthecircumstances.Undersection143(3)(i) of the Act, we are also responsible for expressing our opinion on whether the Company has an adequate internal financial controls system in place and the operating effectiveness of such controls.
– Evaluate the appropriateness of accounting policies used and the reasonableness of accounting estimates and related disclosures made by management.
– Conclude on the appropriateness of management’s use of the going concern basis of accounting and, based on the audit evidence obtained, whether a material uncertainty exists related to events or conditions that may cast significant doubt on the Company’s ability to continue as a going concern. If we conclude that a material uncertainty exists, we are required to draw attention in our auditor’s report to the related disclosures in the Standalone Financial Statements or, if such disclosures are inadequate, to modify our opinion. Our conclusions are based on the audit evidence obtained up to the date of our auditor’s report. However, future events or conditions may cause the Company to cease to continue as a going concern.
– Evaluate the overall presentation, structure and content of the standalone financial statements, including the disclosures, and whether the Standalone Financial Statements represent the underlying transactions and events in a manner that achieves fair presentation.
We communicate with those charged with governance regarding, among other matters, the planned scope and timing of the audit and significant audit findings, including any significant deficiencies in internal control that we identify during our audit.
We also provide those charged with governance with a statement that we have complied with relevant ethical requirements regarding independence, and to communicate with them all relationships and other matters that may reasonably be thought to bear on our independence, and where applicable, related safeguards.
From the matters communicated with those charged with governance, we determine those matters that were of most significance in the audit of the Standalone Financial Statements of the current period and are therefore the key audit matters. We describe these matters in our auditor’s report unless law or regulation precludes public disclosure about the matter or when, in extremely rare circumstances, we determine that a matter should not be communicated in our report because the adverse consequences of doing so would reasonably be expected to outweigh the public interest benefits of such communication.
Report on Other Legal and Regulatory Requirements Report on Other Legal and Regulatory Requirements 1. As required by Section 143 (3) of the Act,based on our
audit we report that:
a) We have sought and obtained all the information and explanations which to the best of our knowledge and belief were necessary for the purposes of our audit.
b) In our opinion proper books of account as required by law have been kept by the Company so far as it appears from our examination of those books.
c) The Balance Sheet, the Statement of Profit and Loss (including Other Comprehensive Income), the Statement of Changes in Equity,and the Statement of Cash Flows dealt with by this Report are in agreement with the books of account.
d) In our opinion, the aforesaid Standalone Financial Statements comply with the Ind AS specified under Section 133 of the Act.
e) On the basis of the written representations received from the directors as on March 31, 2022 taken on recordbytheBoardofDirectors,noneofthedirectorsis disqualified as on March 31, 2022 from being appointed as a director in terms of Section 164 (2) of the Act.
f) With respect to the adequacy of internal financial control over financial reporting of the Company and the operating effectiveness of such controls, refer to our separate Report in Annexure A. Our report expresses an unmodified opinion on the adequacy and operating effectiveness of the Company’s internal financial control over financial reporting.
g) With respect to the other matters to be included in the Auditor’s Report in accordance with the requirements of section 197(16) of the Act, as amended, we report that,in our opinion and to the best of our information and according to the explanations given to us, the remuneration paid by the Company to its ManagingandExecutiveDirectorsduringtheyearisin accordance with the provisions of section 197 of the Act.
h) With respect to the other matters to be included in the Auditor’s Report in accordance with Rule 11 of the Companies (Audit and Auditors) Rules, 2014, as amended,in our opinion and to the best of our information and according to the explanations given to us:
(i) The Company has disclosed the impact of pending litigations on its financial position in its Standalone Financial Statements – Refer Note 40 to the Standalone Financial Statements.
Annual Report 2021-222021-22
110
20 Microns Limited20 Microns Limited

(ii) The Company did not have any long-term contracts including derivative contracts for which there were any material foreseeable losses.
(iii) There were no amounts which were required to be transferred to the Investor Education and Protection Fund by the Company during the year ended March 31, 2022.
(iv) a) The Management has represented that, to the best of its knowledge and belief, no funds (which are material either individually or in the aggregate) have been advanced or loaned or invested (either from borrowed funds or share premium or any other sources or kind of funds) by the Company to or in any other person or entity, including foreign entity (“Intermediaries”), with the understanding, whether recorded in writing or otherwise, that the Intermediary shall, whether, directly or indirectly lend or invest in other persons or entities identified in any manner whatsoever by or on behalf oftheCompany(“UltimateBeneficiaries”)or provide any guarantee, security or the likeonbehalfoftheUltimateBeneficiaries;
b) The Management has represented, that, to the best of its knowledge and belief, no funds (which are material either individually or in the aggregate) have been received by the Company from any person or entity, including foreign entity (“Funding Parties”), with the understanding, whether recorded in writing or otherwise, that the Company shall, whether, directly or indirectly, lend
or invest in other persons or entities identified in any manner whatsoever by or onbehalfof theFundingParty(“UltimateBeneficiaries”) or provide any guarantee, security or the like on behalf of the UltimateBeneficiaries;
c) Based on the audit procedures that have been considered reasonable and appropriate in the circumstances, nothing has come to our notice that has caused us to believe that the representations under sub-clause (i) and (ii) of Rule 11(e), as provided under (a) and (b) above, contain any material misstatement.
(v) The company has not declared any dividend in the previous year and hence reporting requirement for compliance with section 123 of the Act is not applicable.
2. As required by the Companies (Auditor’s Report) Order, 2020 (“the Order”) issued by the Central Government in terms of section 143 (11) of the Act, we give in the Annexure B, a statement on the matters specified in the paragraphs 3 and 4 of the order.
For, J. H. Mehta & Co.Chartered Accountants
ICAI Firm Regn. No. 106227W
(Naitik J Mehta)Place: Ahemdabad PartnerDate: 03/05/2022 Membership No. 130010 UDIN: 22130010AIRQVQ9562
111
Corporate Overview Notice Statutory Reports Financial StatementsFinancial Statements

ANNExURE - AANNExURE - ATO THe INDePeNDeNT AUDITOR’S RePORT
(Referred to in paragraph 1(f)under “Report on Other Legal and Regulatory Requirements” section of our report the members of 20 Microns Limited of even date)
Report on the Internal Financial Controls over Report on the Internal Financial Controls over Financial Reporting under Clause (i) of Sub-Financial Reporting under Clause (i) of Sub-section 3 of Section 143 of the Companies Act, 2013 section 3 of Section 143 of the Companies Act, 2013 (“the Act”)(“the Act”)In conjunction with our audit of the Standalone Financial statements of 20 Microns Limited(“the Company”) as of and for the year ended March 31, 2022, we have also audited the internal financial controls over financial reporting of the Company.
Management’s Responsibility for Internal Financial Management’s Responsibility for Internal Financial Controls Controls The Company’s management is responsible for establishing and maintaining internal financial controls based on the internal control over financial reporting criteria established by the Company considering the essential components of internal control stated in the Guidance Note on Audit of Internal Financial Controls over Financial Reporting issued by the Institute of Chartered Accountants of India (‘ICAI’). These responsibilities include the design, implementation and maintenance of adequate internal financial controls that were operating effectively for ensuring the orderly and efficient conduct of its business, including adherence to company’s policies, the safeguarding of its assets, the prevention and detection of frauds and errors, the accuracy and completeness of the accounting records, and the timely preparation of reliable financial information, as required under the Companies Act, 2013.
Auditor’s Responsibility Auditor’s Responsibility Our responsibility is to express an opinion on the Company’s internal financial controls over financial reporting based on our audit. We conducted our audit in accordance with the Guidance Note on Audit of Internal Financial Controls over Financial Reporting (the “Guidance Note”) and the Standards on Auditing, issued by ICAI and deemed to be prescribed under section 143(10) of the Companies Act, 2013, to the extent applicable to an audit of internal financial controls, both applicable to an audit of Internal Financial Controls and, both issued by the ICAI. Those Standards and the Guidance Note require that we comply with ethical requirements and plan and perform the audit to obtain reasonable assurance about whether adequate internal financial controls over financial reporting was established and maintained and if such controls operated effectively in all material respects.
Our audit involves performing procedures to obtain audit evidence about the adequacy of the internal financial controls system over financial reporting and their operating effectiveness. Our audit of internal financial controls over financial reporting included obtaining an understanding of internal financial controls over financial reporting, assessing the risk that a material weakness exists, and testing and evaluating the design and operating effectiveness of internal control based on the assessed risk. The procedures selected depend on the auditor’s judgment, including the assessment of the risks of material misstatement of the Standalone Financial Statements, whether due to fraud or error.
We believe that the audit evidence we have obtained is sufficient and appropriate to provide a basis for our audit opinion on the Company’s internal financial controls system over financial reporting.
Meaning of Internal Financial Controls over Meaning of Internal Financial Controls over Financial Reporting Financial Reporting A company’s internal financial control over financial reporting is a process designed to provide reasonable assurance regarding the reliability of financial reporting and the preparation of Standalone Financial Statements for external purposes in accordance with generally accepted accounting principles. A company’s internal financial control over financial reporting includes those policies and procedures that:
1) pertain to the maintenance of records that, in reasonable detail, accurately and fairly reflect the transactions and dispositions of the assets of the company;
2) provide reasonable assurance that transactions are recorded as necessary to permit preparation of Standalone Financial Statements in accordance with generally accepted accounting principles, and that receipts and expenditures of the company are being made only in accordance with authorizations of management and directors of the company; and
3) provide reasonable assurance regarding prevention or timely detection of unauthorized acquisition, use, or disposition of the company’s assets that could have a material effect on the Standalone Financial Statements.
Annual Report 2021-222021-22
112
20 Microns Limited20 Microns Limited

Inherent Limitations of Internal Financial Controls Inherent Limitations of Internal Financial Controls over Financial Reporting over Financial Reporting Because of the inherent limitations of internal financial controls over financial reporting, including the possibility of collusion or improper management override of controls, material misstatements due to error or fraud may occur and not be detected. Also, projections of any evaluation of the internal financial controls over financial reporting to future periods are subject to the risk that the internal financial control over financial reporting may become inadequate because of changes in conditions, or that the degree of compliance with the policies or procedures may deteriorate.
Opinion Opinion In our opinion, the Company has, in all material respects, an adequate internal financial controls system over financial
reporting and such internal financial controls over financial reporting were operating effectively as atMarch 31,2022, based on the internal control over financial reporting criteria established by the Company considering the essential components of internal control stated in the Guidance Note.
For, J. H. Mehta & Co.Chartered Accountants
ICAI Firm Regn. No. 106227W
(Naitik J Mehta)Place: Ahemdabad PartnerDate: 03/05/2022 Membership No. 130010 UDIN: 22130010AIRQVQ9562
113
Corporate Overview Notice Statutory Reports Financial StatementsFinancial Statements

ANNExURE - BANNExURE - BTO THe INDePeNDeNT AUDITOR’S RePORT
(Referred to in paragraph 2 under “Report on Other Legal and Regulatory Requirements” section of our report the members of 20 Microns Limited of even date)
Report on the Companies (Auditor’ Report) Order, Report on the Companies (Auditor’ Report) Order, 2020, issued in terms of section 143 (11) of the 2020, issued in terms of section 143 (11) of the Companies Act, 2013(‘the Act’) of 20 Microns Companies Act, 2013(‘the Act’) of 20 Microns Limited (‘the Company’)Limited (‘the Company’)(i) (a) A. The Company has maintained proper records
showing full particulars, including quantitative details and situation of Property, Plant and Equipment, Capital work in progress and relevant details of right of use Assets.
B. The Company is maintaining proper records showing full particulars of Intangible Assets.
(b) The Property, Plant and Equipment are physically verified by the Management according to a phased programme designed to cover all the items over a period of three years which, in our opinion, is reasonable having regard to the size of the Company and the nature of its assets. Pursuant to the programme, certain Property, Plant and Equipment have been physically verified by the Management during the year no material discrepancies were noticed during the process of physical verification of assets.
(c) According to the information and explanations given to us and on the basis of our examination of the records of the Company provided to us, we report that, the title in respect of self-constructed buildings and title deeds of all other immovable properties (other than properties where the company is the lessee and the lease agreements are duly executed in favour of the lessee), disclosed in the financial statements are held in the name of the Company as at 31st March 2022.
(d) The Company has not revalued any of its property, plantandequipment(includingRightofUseassets)and intangible assets during the year.
(e) According to the information and explanations given to us and on the basis of our examination of the records of the Company,no proceedings have been initiated during the year or are pending against the Company as at 31st March 2022 for holding any benami property under the Benami Transactions (Prohibition) Act, 1988 (as amended in 2016) and rules made thereunder.
(ii) (a) The inventories were physically verified during the year by the Management at reasonable intervals.
In our opinion and according to the information and explanations given to us, the coverage and procedure of such verification by the Management is appropriate having regard to the size of the Company and the nature of its operations. No discrepancies of 10% or more in the aggregate for each class of inventories were noticed on such physical verification of inventories when compared with books of account.
(b) According to the information and explanations given to us, the Company has been sanctioned working capital limits in excess of `5 crores, in aggregate, at points of time during the year, from banks on the basis of security of current assets. In our opinion and according to the information and explanations given to us, the quarterly returns and statements comprising stock and creditor statements, book debt statements and other stipulated financial information filed by the Company with such banks are not having material difference with the unaudited books of account of the Company, of the respective quarters.
(iii) The Company has not provided any guarantee or security, and granted any loans or advances in the nature of loans, secured or unsecured, to companies, firms, or Limited Liability Partnerships during the year. However the company has made investments in shares of subsidiary and associate companies which is, in our opinion, prima facie, not prejudicial to the Company’s interest.
(a) Duringtheyear,theCompanyhasprovidedloanstoother parties in respect of which:
- aggregate amount of loan provided to other parties (Employees) is `19.81 Lakh and balance outstanding at the balance sheet date is `24.92 Lakh.
(b) In our opinion, terms and conditions of grant of loans, during the year, prima facie, not prejudicial to the interest of the Company.
(c) In respect of loans granted by the Company, the schedule of repayment of principal and payment of interest, wherever applicable, have been stipulated and the repayments of principal amounts and receipts of interest have generally been regular as per stipulation.
Annual Report 2021-222021-22
114
20 Microns Limited20 Microns Limited

(d) In respect of loans granted by the Company, there is no overdue amount remaining outstanding as at the balance sheet date.
(e) No loan granted by the Company which has fallen due during the year, has been renewed or extended or fresh loans granted to settle the overdues of existing loans given to the same parties.
(f) The Company has not granted any loans or advances in the nature of loans either repayable on demand or without specifying any terms or period of repayment during the year. Hence, reporting under clause 3(iii)(f) is not applicable.
(iv) In our opinion and according to the information and explanations given to us, the Company has complied with the provisions of section 185 and 186 of the Act, with respect to the loans granted, investments made and guarantees and securities provided.
(v) In our opinion the Company has complied with the provisions of Sections 73 to 76 or any other relevant provisions of the Companies Act, 2013 and the Companies (AcceptanceofDeposits)Rules,2014,asamended,withregard to the deposits accepted and amounts deemed to be deposits accepted. According to the information and explanations given to us, no order has been passed by the Company Law Board or the National Company Law Tribunal or the Reserve Bank of India or any Court or any other Tribunal against the Company in this regard.
(vi) The maintenance of cost records has been specified by the Central Government under section 148(1) of the Companies Act, 2013. We have broadly reviewed the
books of account maintained by the Company pursuant to the Companies (Cost Records and Audit) Rules, 2014, as amended, prescribed by the Central Government for maintenance of cost records under Section 148(1) of the Companies Act, 2013, and are of the opinion that, prima facie, the prescribed cost records have been made and maintained by the Company. We have, however, not made a detailed examination of the cost records with a view to determine whether they are accurate or complete.
(vii) (a) According to the information and explanations given to us and the records of the Company examined by us, in our opinion, In respect of Undisputedstatutory dues, including Goods and Service tax, Provident Fund, Employees’ State Insurance, Income-tax, Sales Tax, Service Tax, duty of Custom, Value Added Tax, cess and other material statutory dues applicable to the Company have generally been regularly deposited by it with the appropriate authorities during the year.
According to the information and explanations given to us and the records of the Company examined by us, in our opinion, there were no undisputed amounts payable as applicable were in arrears as at March 31, 2022 for a period of more than six months from the date they became payable.
(b) According to the information and explanations given to us and the records of the Company examined by us, there are nodues of ExciseDuty,GoodsandService Tax, Custom duty and other material statutory dues which have not been deposited on account of any dispute.
The particulars of dues of Income Tax as at 31st March 2022 which have not been deposited on account of a dispute, are as follows:
Name of Statute Nature of DuesAmount
(` in Lakhs)Period to which the amount relates
Forum where the dispute is pending
Income Tax Act, 1961 Income Tax 5.96 Assessment Year 2009-10
Commissioner of Income Tax, Appeals
Income Tax Act, 1961 Income Tax 4.64 Assessment Year 2014-15
Commissioner of Income Tax, Appeals have passed their order and order giving effect of the order of CIT(A) is pending with Assessing officer.
Gujarat Minerals (Prevention of illegal mining, transportation and storage) rules, 2017
Mining Royalty 419.13 -- The Commissioner (Geology & Mining, Gandhinagar)
425.09
(viii) There were no transactions relating to previously unrecorded income that were surrendered or disclosed as income in the tax assessments under the Income Tax Act, 1961 (43 of 1961) during the year.
(ix) (a) In our opinion, the company has not defaulted in repayment of loans or other borrowings or in the payment of interest thereon to the lender during the year.
115
Corporate Overview Notice Statutory Reports Financial StatementsFinancial Statements

(b) We are of the opinion that, the Company has not been declared wilful defaulter by any bank or financial institution or other lender.
(c) To the best of our knowledge and belief, in our opinion, term loans availed by the Company were, applied by the Company during the year for the purposes for which the loans were obtained.
(d) On an overall examination of the Standalone Financial Statements of the Company, funds raised on short-termbasis have, prima facie, not been used during the year for long-term purposes by the Company.
(e) On an overall examination of the Standalone Financial Statements of the Company, the Company has not taken any funds from any entity or person on account of or to meet the obligations of its subsidiaries, associates or joint ventures.
(f) The Company has not raised loans during the year on the pledge of securities held in its subsidiaries or joint ventures or associate companies.
(x) (a) The Company has not raised moneys by way of initial public offer or further public offer (including debt instruments) during the year and hence reporting under clause 3(x)(a) of the Order is not applicable.
(b) During the year the Company has notmade anypreferential allotment or private placement of shares or convertible debentures (fully or partly or optionally) and hence reporting under clause 3(x)(b) of the Order is not applicable to the Company.
(xi) (a) Duringthecourseofourexaminationofthebooksandrecords of the Company, carried out in accordance with the generally accepted auditing practices in India, and according to the information and explanations given to us, no fraud by the Company and no material fraud on the Company has been, noticed or reported during the year, nor we have been informed of any such case by the Management
(b) To the best of our knowledge, no report under sub-section (12) of section 143 of the Companies Act has beenfiledinFormADT-4asprescribedunderrule13of Companies (Audit and Auditors) Rules, 2014 with the Central Government, during the year and upto the date of this report.
(c) As represented to us by the Management, there were no whistle blower complaints received by the Company during the year and upto the date of this report.
(xii) In our opinion, the Company is not a Nidhi Company and hence reporting under clause 3(xii) of the Order is not applicable.
(xiii) According to the information and explanations given to us and based on our examination of the records of the Company, transactions with the related parties are in compliance with sections 177 and 188 of the Companies Act,2013.Detailsofsuchtransactionshavebeendisclosedin the Standalone Financial Statements as required by the applicable Indian Accounting Standards.
(xiv) (a) In our opinion the Company has an internal audit system commensurate with the size and the nature of its business.
(b) We have considered, the internal audit reports issued to the Company during the year and covering the period upto Month of March 2022.
(xv) In our opinion during the year the Company has not entered into any non-cash transactions with its directors or persons connected with its directors and hence provisions of section 192 of the Companies Act, 2013 are not applicable to the Company.
(xvi) (a) The Company is not required to be registered under section 45-IA of the Reserve Bank of India Act, 1934. Hence, reporting under clauses 3 (xvi)(a), (b) and (c) of the Order are not applicable.
(b) The Group does not have any CIC as part of the group and accordingly reporting under clause 3 (xvi)(d) of the Order is not applicable.
(xvii) The Company has not incurred cash losses during the financial year covered by our audit and the immediately preceding financial year.
(xviii) There has been no resignation of the statutory auditors of the Company during the year.
(xix) According to the information and explanations given to us and on the basis of the financial ratios, ageing and expected dates of realization of financial assets and payment of financial liabilities, other information accompanying the Standalone Financial Statements and our knowledge of the Board of Directors andManagement plans andbased on our examination of the evidence supporting the assumptions, nothing has come to our attention, which causes us to believe that any material uncertainty exists as on the date of the audit report indicating that Company is not capable of meeting its liabilities existing at the date of balance sheet as and when they fall due within a period of
Annual Report 2021-222021-22
116
20 Microns Limited20 Microns Limited

one year from the balance sheet date. We, however, state that this is not an assurance as to the future viability of the Company. We further state that our reporting is based on the facts up to the date of the audit report and we neither give any guarantee nor any assurance that all liabilities falling due within a period of one year from the balance sheet date, will get discharged by the Company as and when they fall due.
(xx) The Company has fully spent the required amount towards Corporate Social Responsibility (CSR) and there are no unspent CSR amount for the year requiring a transfer to a Fund specified in Schedule VII to the Companies Act
or special account in compliance with the provision of sub-section (6) of section 135 of the said Act. Accordingly, reporting under clause 3(xx) of the Order is not applicable for the year.
For, J. H. Mehta & Co.Chartered Accountants
ICAI Firm Regn. No. 106227W
(Naitik J Mehta)Place: Ahemdabad PartnerDate: 03/05/2022 Membership No. 130010 UDIN: 22130010AIRQVQ9562
117
Corporate Overview Notice Statutory Reports Financial StatementsFinancial Statements

(` In Lakhs)
ParticularsNotes No.
As at As at 3131stst March, 2022 March, 2022
As at 31st March, 2021
I. ASSeTSI. ASSeTS 1 Non-current assets (a) Property, Plant and Equipment & Intangible Assets (i) Property, Plant and Equipment 3.1 18,190.11 17,705.03 (ii) Capital Work in Progress 3.2 454.58 162.04 (iii) Intangible Assets 4 267.06 265.82 (b) Investments in Subsidiaries 5 2,581.15 1,833.59 (c) Financial Assets (i) Investments 6 864.35 413.04 (ii) Other Financial Assets 7 534.89 313.14 (d) Other Non-Current Assets 8 1,208.09 365.16 Total Non-Current Assets 24,100.24 21,057.82 2 Current assets (a) Inventories 9 8,649.25 7,501.37 (b) Financial Assets (i) Trade receivables 10 9,544.84 8,246.10 (ii) Cash and Cash Equivalents 11 1,007.27 168.24 (iii) Bank Balances other than (ii) above 12 323.99 493.62 (iv) Loans 13 38.05 18.89 (v) Other Financial Assets 14 297.21 255.54 (c) Other Current Assets 15 1,718.87 2,326.92 (d) Asset Classified as Held for Sale 16 - 130.00 Total Current Assets 21,579.48 19,140.69 TOTAL ASSeTS 45,679.71 40,198.51 II. eQUITY AND LIABILITIeSII. eQUITY AND LIABILITIeS 1 equity (a) Equity Share Capital 17 1,764.33 1,764.33 (b) Other Equity 18 21,588.18 18,145.88 Total equity 23,352.50 19,910.21 2 Liabilities Non-Current Liabilities (a) Financial Liabilities (i) Borrowings 19 2,741.87 2,177.96 (ii) Trade Payables 23 Total outstanding dues of Micro and Small Enterprise - - Total outstanding dues of Creditors other than Micro and Small Enterprise 84.32 - (iii) Lease Liabilities 80.56 72.95 (iv) Other Financial Liabilities 20 25.92 22.46 (b) DeferredTaxLiabilities(Net) 21 2,423.46 2,236.75 Total Non-Current Liabilities 5,356.12 4,510.11 Current Liabilities (a) Financial Liabilities (i) Borrowings 22 7,683.78 6,659.05 (ii) Trade receivables 23 Total outstanding dues of Micro and Small Enterprise 26.53 121.86 Total outstanding dues of Creditors other than Micro and Small Enterprise 8,013.10 7,781.25 (iii) Lease liability 123.64 119.25 (iv) Other Financial Liabilities 24 783.59 903.98 (b) Other Current Liabilities 25 259.64 134.13 (c) Provisions 26 15.78 58.66 (d) Current Tax Liabilities (Net) 27 65.03 - Total Current Liabilities 16,971.09 15,778.18 Total Liabilities 22,327.21 20,288.30 TOTAL eQUITY AND LIABILITIeS 45,679.71 40,198.51 See accompanying notes to the financial statements
STANDALONE BALANCE ShEETSTANDALONE BALANCE ShEETas at 31st March, 2022
As per Our Report Attached
For J. H. Mehta & Co.J. H. Mehta & Co. ForandonbehalfofBoardofDirectorsChartered AccountantsFirm Reg. No. 106227W
Naitik J Mehta Rajesh C. Prikh Atil C. Parikh N. R. Patel Komal PandeyNaitik J Mehta Rajesh C. Prikh Atil C. Parikh N. R. Patel Komal PandeyPartner Chairman&MD CEO&MD ChiefFinancialOfficer CompanySecretaryM.No.130010 DINNo.:00041610 DINNo.:00041712 M.NO.A-37092
Place : Waghodia Place : WaghodiaDate:03/05/2022 Date:03/05/2022
Annual Report 2021-222021-22
118
20 Microns Limited20 Microns Limited

STANDALONE STATEMENT OF PROFIT AND LOSSSTANDALONE STATEMENT OF PROFIT AND LOSSfor the year ended on 31st March, 2022
(` In Lakhs)
ParticularsNotes No.
For the year ended For the year ended 3131st st March, 2022March, 2022
For the year ended 31st March, 2021
Revenue
I. Revenue from Operations 28 51,712.50 43,237.67
II. Other income 29 582.53 557.40
III. Total Income (I+II) 52,295.03 43,795.07
IV. expenses
a) Cost of materials consumed 30 26,617.63 22,689.76
b) Changes in inventories of finished goods, stock in trade and work-in-progress
31 92.73 104.18
c) Employee Benefits Expenses 32 3,944.08 3,075.79
d) Finance Costs 33 1,800.14 2,350.23
e) Depreciation,AmortisationandImpairmentexpense 34 1,180.92 1,178.77
f) Other Expenses 35 14,452.45 12,318.68
Total expenses (IV) 48,087.95 41,717.41
V. Profit Before Exceptional Items and Tax (III-IV) 4,207.09 2,077.66
VI. Exceptional Items - -
VII. Profit Before Tax (V-VI) 4,207.09 2,077.66
VIII. Tax expense: 37
Current Tax 1,041.65 537.52
DeferredTax 78.49 (705.02)
IX. Profit for the period (VII-VIII) 3,086.95 2,245.15
X. Other Comprehensive Income 38
A. (i) Items that will not be reclassified to profit or loss 463.57 424.71
(ii) Income tax related to items that will not be reclassified to profit or loss (108.22) (100.31)
B. (i) Items that will be reclassified to profit or loss - -
(ii) Income tax related to items that will be reclassified to profit or loss - -
Total Other Comprehensive Income (X) 355.35 324.40
XI. Total Comprehensive Income for the period (IX+X) 3,442.30 2,569.55
Earnings per equity share of Face Value of ` 5 each 39
Basic 8.75 6.36
Diluted 8.75 6.36
See accompanying notes to the financial statements 01 to 50
As per Our Report Attached
For J. H. Mehta & Co.J. H. Mehta & Co. ForandonbehalfofBoardofDirectorsChartered AccountantsFirm Reg. No. 106227W
Naitik J Mehta Rajesh C. Prikh Atil C. Parikh N. R. Patel Komal PandeyNaitik J Mehta Rajesh C. Prikh Atil C. Parikh N. R. Patel Komal PandeyPartner Chairman&MD CEO&MD ChiefFinancialOfficer CompanySecretaryM.No.130010 DINNo.:00041610 DINNo.:00041712 M.NO.A-37092
Place : Waghodia Place : WaghodiaDate:03/05/2022 Date:03/05/2022
119
Corporate Overview Notice Statutory Reports Financial StatementsFinancial Statements
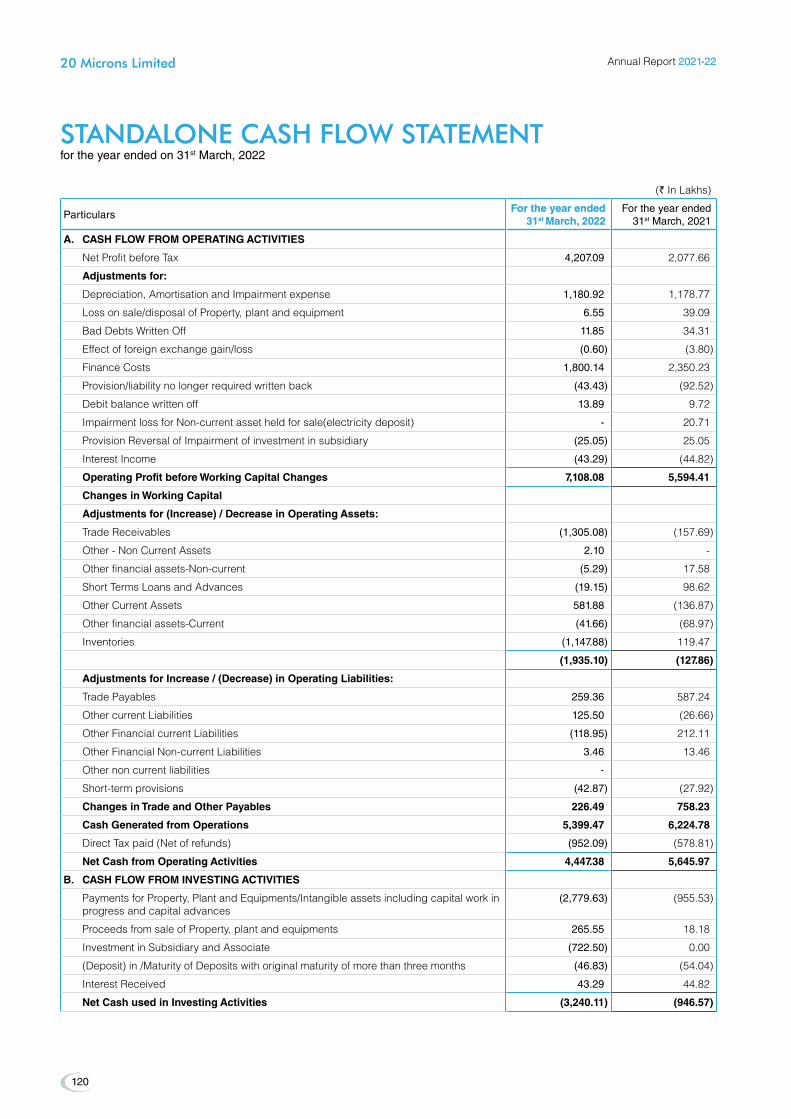
STANDALONE CASh FLOW STATEMENTSTANDALONE CASh FLOW STATEMENTfor the year ended on 31st March, 2022
(` In Lakhs)
ParticularsFor the year ended For the year ended
3131st st March, 2022March, 2022For the year ended
31st March, 2021
A. CASH FLOW FROM OPeRATING ACTIVITIeS
Net Profit before Tax 4,207.09 2,077.66
Adjustments for:
Depreciation,AmortisationandImpairmentexpense 1,180.92 1,178.77
Loss on sale/disposal of Property, plant and equipment 6.55 39.09
BadDebtsWrittenOff 11.85 34.31
Effect of foreign exchange gain/loss (0.60) (3.80)
Finance Costs 1,800.14 2,350.23
Provision/liability no longer required written back (43.43) (92.52)
Debitbalancewrittenoff 13.89 9.72
Impairment loss for Non-current asset held for sale(electricity deposit) - 20.71
Provision Reversal of Impairment of investment in subsidiary (25.05) 25.05
Interest Income (43.29) (44.82)
Operating Profit before Working Capital Changes 7,108.08 5,594.41
Changes in Working Capital
Adjustments for (Increase) / Decrease in Operating Assets:
Trade Receivables (1,305.08) (157.69)
Other - Non Current Assets 2.10 -
Other financial assets-Non-current (5.29) 17.58
Short Terms Loans and Advances (19.15) 98.62
Other Current Assets 581.88 (136.87)
Other financial assets-Current (41.66) (68.97)
Inventories (1,147.88) 119.47
(1,935.10) (127.86)
Adjustments for Increase / (Decrease) in Operating Liabilities:
Trade Payables 259.36 587.24
Other current Liabilities 125.50 (26.66)
Other Financial current Liabilities (118.95) 212.11
Other Financial Non-current Liabilities 3.46 13.46
Other non current liabilities -
Short-term provisions (42.87) (27.92)
Changes in Trade and Other Payables 226.49 758.23
Cash Generated from Operations 5,399.47 6,224.78
DirectTaxpaid(Netofrefunds) (952.09) (578.81)
Net Cash from Operating Activities 4,447.38 5,645.97
B. CASH FLOW FROM INVeSTING ACTIVITIeS
Payments for Property, Plant and Equipments/Intangible assets including capital work in progress and capital advances
(2,779.63) (955.53)
Proceeds from sale of Property, plant and equipments 265.55 18.18
Investment in Subsidiary and Associate (722.50) 0.00
(Deposit)in/MaturityofDepositswithoriginalmaturityofmorethanthreemonths (46.83) (54.04)
Interest Received 43.29 44.82
Net Cash used in Investing Activities (3,240.11) (946.57)
Annual Report 2021-222021-22
120
20 Microns Limited20 Microns Limited
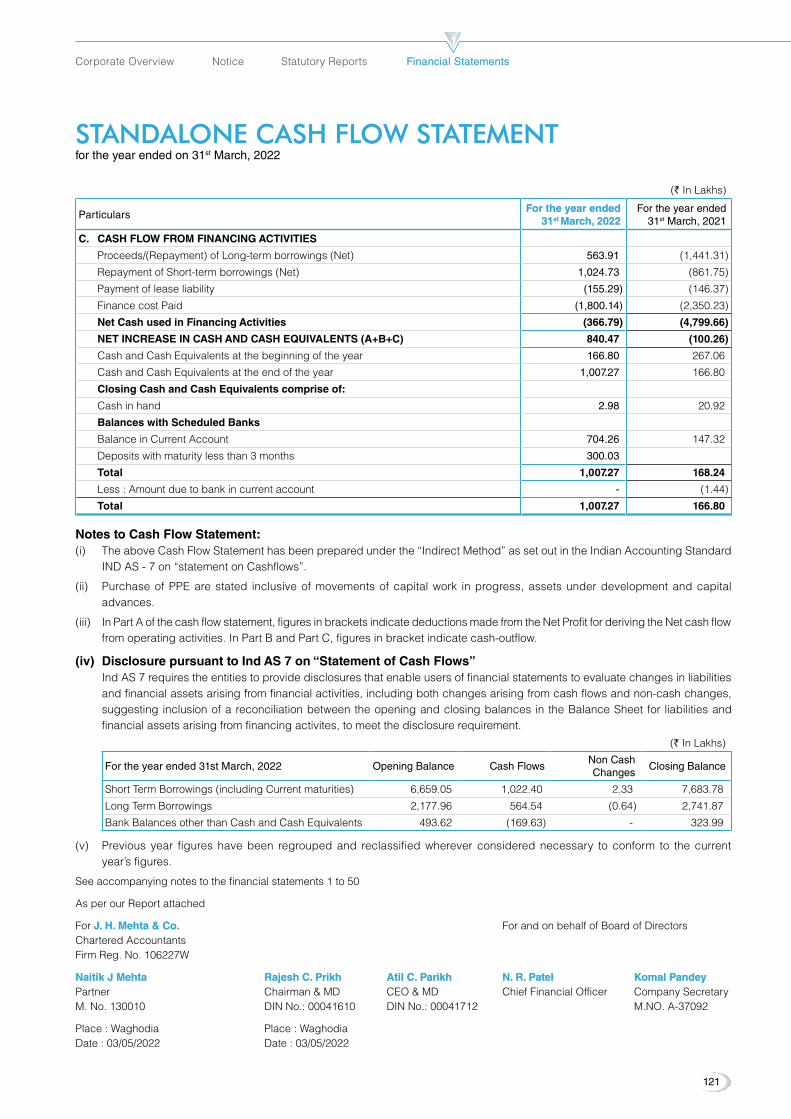
STANDALONE CASh FLOW STATEMENTSTANDALONE CASh FLOW STATEMENTfor the year ended on 31st March, 2022
(` In Lakhs)
ParticularsFor the year ended For the year ended
3131st st March, 2022March, 2022For the year ended
31st March, 2021
C. CASH FLOW FROM FINANCING ACTIVITIeS
Proceeds/(Repayment) of Long-term borrowings (Net) 563.91 (1,441.31)
Repayment of Short-term borrowings (Net) 1,024.73 (861.75)
Payment of lease liability (155.29) (146.37)
Finance cost Paid (1,800.14) (2,350.23)
Net Cash used in Financing Activities (366.79) (4,799.66)
NeT INCReASe IN CASH AND CASH eQUIVALeNTS (A+B+C) 840.47 (100.26)
Cash and Cash Equivalents at the beginning of the year 166.80 267.06
Cash and Cash Equivalents at the end of the year 1,007.27 166.80
Closing Cash and Cash equivalents comprise of:
Cash in hand 2.98 20.92
Balances with Scheduled Banks
Balance in Current Account 704.26 147.32
Depositswithmaturitylessthan3months 300.03
Total 1,007.27 168.24
Less : Amount due to bank in current account - (1.44)
Total 1,007.27 166.80
Notes to Cash Flow Statement: (i) The above Cash Flow Statement has been prepared under the “Indirect Method” as set out in the Indian Accounting Standard
INDAS-7on“statementonCashflows”.
(ii) Purchase of PPE are stated inclusive of movements of capital work in progress, assets under development and capital advances.
(iii) In Part A of the cash flow statement, figures in brackets indicate deductions made from the Net Profit for deriving the Net cash flow from operating activities. In Part B and Part C, figures in bracket indicate cash-outflow.
(iv) Disclosure pursuant to Ind AS 7 on “Statement of Cash Flows” Ind AS 7 requires the entities to provide disclosures that enable users of financial statements to evaluate changes in liabilities
and financial assets arising from financial activities, including both changes arising from cash flows and non-cash changes, suggesting inclusion of a reconciliation between the opening and closing balances in the Balance Sheet for liabilities and financial assets arising from financing activites, to meet the disclosure requirement.
(` In Lakhs)
For the year ended 31st March, 2022 Opening Balance Cash FlowsNon Cash Changes
Closing Balance
Short Term Borrowings (including Current maturities) 6,659.05 1,022.40 2.33 7,683.78
Long Term Borrowings 2,177.96 564.54 (0.64) 2,741.87
Bank Balances other than Cash and Cash Equivalents 493.62 (169.63) - 323.99
(v) Previous year figures have been regrouped and reclassified wherever considered necessary to conform to the current year’s figures.
See accompanying notes to the financial statements 1 to 50
As per our Report attached
For J. H. Mehta & Co.J. H. Mehta & Co. ForandonbehalfofBoardofDirectorsChartered AccountantsFirm Reg. No. 106227W
Naitik J Mehta Rajesh C. Prikh Atil C. Parikh N. R. Patel Komal PandeyNaitik J Mehta Rajesh C. Prikh Atil C. Parikh N. R. Patel Komal PandeyPartner Chairman&MD CEO&MD ChiefFinancialOfficer CompanySecretaryM.No.130010 DINNo.:00041610 DINNo.:00041712 M.NO.A-37092
Place : Waghodia Place : WaghodiaDate:03/05/2022 Date:03/05/2022
121
Corporate Overview Notice Statutory Reports Financial StatementsFinancial Statements

STANDALONE STATEMENT OF ChANGES IN EQUITY (SOCIE)STANDALONE STATEMENT OF ChANGES IN EQUITY (SOCIE) for the year ended on 31st March, 2022
(a) equity share capital(` In Lakhs)
Equity share capitalAs at As at
3131stst March 2022 March 2022For the year ended
31st March, 2021
Balance at the beginning of the reporting period 1,764.33 1,764.33
Changes in equity share capital during the year - -
Balance at the end of the reporting period 1,764.33 1,764.33
(b) Other equity (` In Lakhs)
Attributable to Equity Holders of the Company
Reserves and SurplusOther
Comprehensive Income - Total Other
Equity
Other equity General Reserve
Securities Premium
Retained earnings
Equity Instruments through OCI
Balance at 1st April, 2020 (A) 120.54 3,980.33 11,585.02 (109.56) 15,576.33
Add: Profit during the Period - - 2,245.15 2,245.15
Add/(less): Other Comprehensive Income for the year (Net of Tax)
269.61 269.61
Add/(less): Remeasurements of post-employment benefit obligation, net of tax
- - 54.79 - 54.79
Balance at 31st March, 2021 (B) 120.54 3,980.33 13,884.96 160.05 18,145.88
Less: Share issue expenditure - - -
Add: Profit during the Period - - 3,086.95 3,086.95
Add/(less): Other Comprehensive Income for the year (Net of Tax)
346.18 346.18
Add/(less): Remeasurements of post-employment benefit obligation, net of tax
- - 9.17 - 9.17
Closing Balance 120.54 3,980.33 16,981.08 506.23 21,588.18
Note (i): The Company has selected to recognise changes in the fair value of investments which are not held for trading in equity securities in other comprehensive income. These changes are accumulated within the Equity instruments through OCI.
Note (ii): Nature and purpose of each reserve is disclosed under note no. 18 -’Other equity’
See accompanying notes to the financial statements
As per Our Report Attached
For J. H. Mehta & Co.J. H. Mehta & Co. ForandonbehalfofBoardofDirectorsChartered AccountantsFirm Reg. No. 106227W
Naitik J Mehta Rajesh C. Prikh Atil C. Parikh N. R. Patel Komal PandeyNaitik J Mehta Rajesh C. Prikh Atil C. Parikh N. R. Patel Komal PandeyPartner Chairman&MD CEO&MD ChiefFinancialOfficer CompanySecretaryM.No.130010 DINNo.:00041610 DINNo.:00041712 M.NO.A-37092
Place : Waghodia Place : WaghodiaDate:03/05/2022 Date:03/05/2022
Annual Report 2021-222021-22
122
20 Microns Limited20 Microns Limited

NOTES TO STANDALONE FINANCIAL STATEMENTS NOTES TO STANDALONE FINANCIAL STATEMENTS for the year ended on 31st March, 2022
Authorization of financial statements:Authorization of financial statements:The Standalone Financial Statements were authorized for issue in accordance with a resolution passed in meeting of Board of theDirectorsheldon03/05/2022.
Notes to Standalone Financial statements for the Notes to Standalone Financial statements for the year ended 31year ended 31stst March 2022 March 2022
Note 1. Corporate Information Corporate Information20 Microns Limited (“Company”) is a public limited company domiciled in India and incorporated under the provisions of the Companies Act, 1956. The registered office of the Company is locatedat 9 –10,GIDC,Waghodia,Vadodara –391760,Gujarat, India.
The Company is engaged in Business of Industrial Micronised Minerals and Speciality Chemicals.
Note 2. Significant Accounting Policies Significant Accounting PoliciesThis note provides a list of the significant accounting policies adopted in the preparation of these financial statements. These policies have been consistently applied to all the years presented, unless otherwise stated.
2.1 Basis of Preparation and Presentation of Financial Statements
2.1.1 Statement of Compliance with Ind AS 2.1.1 Statement of Compliance with Ind AS (a) The standalone financial statements has
been prepared in accordance and comply in all material aspects with Indian Accounting Standards (Ind AS) notified under the Companies (Indian Accounting Standards) Rules, 2015 as amended from time to time, the relevant provisions of the Companies Act, 2013 (“the Act’’) and guidelines issued by the Securities and Exchange Board of India (SEBI), as applicable.
(b) All assets and liabilities have been classified as current or non-current as per the Company’s normal operating cycle and other criteria set out in the Schedule III to the Companies Act, 2013.
(c) Accounting policies have been consistently applied except where a newly issued accounting standard is initially adopted or a revision to an existing accounting standard requires a change in the accounting policy hitherto in use..
2.1.2 Historical Cost Convention 2.1.2 Historical Cost Convention These financial statements have been prepared and
presented under the historical cost convention, on the accrual basis of accounting except for certain
financial assets and financial liabilities that are measured at fair values at the end of each reporting period, as stated in the accounting policies set out below. The accounting policies have been applied consistently over all the periods presented in these financial statements.
2.2 Use of estimates and Judgements TThe presentation of the financial statements are in
conformity with the Ind AS which requires the management to make estimates, judgments and assumptions that affect the reported amounts of assets and liabilities, revenues and expenses and disclosure of contingent liabilities. Such estimates and assumptions are based on management’s evaluation of relevant facts and circumstances as on the date of financial statements. The actual outcome may differ from these estimates.
Estimates and underlying assumptions are reviewed on an ongoing basis. Revisions to the accounting estimates are recognised in the period in which the estimates are revised and in any future periods affected.
This note provides an overview of the areas that involved a higher degree of judgement or complexity, and of items which are more likely to be materially adjusted due to estimates and assumptions turning out to be different thanthoseoriginallyassessed.Detailedinformationabouteach of these estimates and judgements is included in relevant notes together with information about the basis of calculation for each affected line item in the financial statements.
Information about assumptions and estimation uncertainties that have a significant risk of resulting in a material adjustment within the next financial year are included in the following notes:
Note 37 Current/deferred tax expense
Note 40 Contingent liabilities and assets
Note 10 Expected credit loss for receivables
Note 43 Measurement of defined benefit obligations
2.3 Property, Plant and equipment An item of Property, plant and equipment that qualifies
as an assets is measured at their cost. Following initial recognition, items of property, plant and equipment are carried at cost less accumulated depreciation and accumulated impairment losses.
The Company identifies and determines the cost of each part of an item of property, plant and equipment separately,
123
Corporate Overview Notice Statutory Reports Financial StatementsFinancial Statements
if the part has a cost which is significant to the total cost of that item of property, plant and equipment and has useful life that is materially different from that of the remaining item.
The cost of an item of property, plant and equipment comprises of its purchase price including import duties and other non-refundable purchase taxes or levies, directly attributable cost of bringing the asset to its working condition for its intended use and the initial estimate of decommissioning, restoration and similar liabilities, if any. Any trade discounts and rebates are deducted in arriving at the purchase price. Cost includes cost of replacing a part of a plant and equipment if the recognition criteria are met. Expenses directly attributable to new manufacturing facility during its construction period are capitalized if the recognition criteria are met. Expenditure related to plans, designs and drawings of buildings or plant and machinery is capitalized under relevant heads of property, plant and equipment if the recognition criteria are met.
Items such as spare parts, stand-by equipment and servicing equipment that meet the definition of property, plant and equipment are capitalized at cost and depreciated over their useful life.
Subsequent expenditures, including replacement costs where applicable,incurred for an item of Property plant and equipment are added to its books value only if they increase the future benefits from the existing asset beyond its previously assessed standard of performance and the cost of the item can be measured reliably. The carrying amount of any component accounted for as a separate asset is de-recognised when replaced.
Costs in nature of repairs and maintenance are recognized in the Statement of Profit and Loss as and when incurred.
Any item of property, plant and equipment and any significant part initially recognised is derecognised upon disposal or when no future economic benefits are expected from its use or disposal. Any gain or loss arising on derecognition of the asset (calculated as the difference between the net disposal proceeds and the carrying amount of the asset) is charged to revenue in the income statement when the asset is derecognised.
The cost and related accumulated depreciation are eliminated from the financial statements upon sale or retirement of the asset.
2.4 Capital Work in Progress: Expenditure on projects pending capitalization is shown
under the head “Capital Work In Progress” which will be
capitalized to respective heads of Property, Plant and Equipment on commencement of commercial production.
All the directly identifiable and ascertainable expenditure, incidental and related to construction incurred during the period of construction on a project, till it is commissioned, is kept as Capital work in progress (CWIP) and after commissioning the same is transferred / allocated to the respective “Property, Plant and Equipment”.
Further, advances paid towards the acquisition of property, plant and equipment outstanding at each balance sheet date are classified and disclosed as capital advances under Other Non-Current Assets.
2.5 Investment Properties Investment properties comprises of Immovable Property
that are held for rental yield and/or capital appreciation.
Investment property is measured initially at its cost, including related transaction costs and where applicable borrowing costs. Subsequent expenditure is capitalised to the asset’s carrying amount only when it is probable that future economic benefits associated with the item will flow to the Company and the cost of the item can be measured reliably. All other repairs and maintenance costs are expensed as and when incurred. When part of an investment property is replaced, the carrying amount of the replaced part is derecognised.
2.6 Intangible Assets Intangible asset is recognized only where it is probable
that future economic benefits attributable to the asset will accrue to the enterprise and cost can be measured reliably. Intangible assets acquired separately are measured on initial recognition at cost. Internally generated intangibles including research cost are not capitalized and the related expenditure is recognized in the Statement of Profit and Loss in the period in which the expenditure is incurred. Following initial recognition, intangible assets are carried at cost less accumulated amortization and accumulated impairment loss, if any.
Acquired Intangible Assets in the form of “Process Know How” is recognized at the cost of acquisition and amortized on straight line basis over a period of five years, depending on their estimated useful life.
Capitalized software includes cost on Enterprise Resource Planning (ERP) project and other Software cost including license fees, which provides significant future benefits. ERP Project fees are amortized over a period of seven years.
NOTES TO STANDALONE FINANCIAL STATEMENTS NOTES TO STANDALONE FINANCIAL STATEMENTS for the year ended on 31st March, 2022
Annual Report 2021-222021-22
124
20 Microns Limited20 Microns Limited

Costs of all other software are amortized over a period of five years.
Expenses incurred during development of Process know how or Product development is shown under the head “Intangible asset under development”.
Any item of intangible assets is derecognised upon disposal or when no future economic benefits are expected from its use or disposal. Any gain or loss arising on derecognition of the intangible asset (calculated as the difference between the net disposal proceeds and the carrying amount of the intangible asset) is recognised in the statement of Profit and Loss when the asset is derecognised.
2.7 Depreciation and amortisation methods, estimated useful lives and residual values
Depreciation iscalculatedtosystematicallyallocate thecost of property, plant and equipment, intangible asset and investment property net of the estimated residual values overtheestimateduseful life.Depreciation iscomputedusing Straight Line Method (SLM) over the useful lives of the assets as specified in Schedule II to the Companies Act, 2013.
The estimate of the useful life of the assets has been assessed based on technical advice which considers the nature of the asset, the usage of the asset, expected physical wear and tear, the operating conditions of the asset, anticipated technological changes, manufacturers warranties and maintenance support, etc. The management believes that these useful lives are realistic and reflect fair approximation of the period over which the assets are likely to be used. The useful lives are reviewed by the management at each financial year end and revised, if appropriate. In case of a revision, the unamortised depreciable amount (remaining net value of assets) is charged over the revised remaining useful lives.
Based on management estimate, residual value of 5% is considered for respective PPE except Lease hold land.
Intangible assets are amortized over their individual estimated useful lives on a Straight Line basis, commencing from the year in which the same are available to the company for its intended use. The useful lives as estimated by the management for the intangible assets are as follows:
a) Process Know How (Acquired ProductDevelopment)
5 Years
b) ERP Software 7 Years
c) Other Software’s 5 Years
Freehold land is not depreciated. Cost of lease-hold land is amortized equally over the remaining period of lease.
The residual values, useful lives and methods of depreciation of property, plant and equipment are reviewed at the end of each financial year and adjusted prospectively if appropriate.
Component accounting of assets: If significant parts of an item of property, plant and equipment have different useful lives, then they are accounted for as separate items (major components) of property, plant and equipment and accordingly depreciated at the useful lives specified as above.
Depreciationon itemsofproperty,plantandequipmentacquired / disposed off during the year is provided on pro-rata basis with reference to the date of addition / disposal.
Investment properties are depreciated based on the useful life prescribed in Schedule II to the Companies Act, 2013.
2.8 Impairment of non-financial assets In accordance with Ind AS 36 on “Impairment of Assets” at
the balance sheet date, non-financial assets are reviewed for impairment losses whenever events or changes in circumstances indicate that the carrying amount may not be recoverable. For the purpose of assessing impairment, the smallest identifiable group of assets that generates cash inflows from continuing use that are largely independent of the cash inflows from other assets or groups of assets, is considered as a cash generating unit. If any such indication exists, an estimate of the recoverable amount of the asset/cash generating unit is made. The recoverable amount of an asset is the greater of its fair value less cost to sell and value in use. To calculate value in use, the estimated future cash flows are discounted to their present value using a pre-tax discount rate that reflects current market rates and the risk specific to the asset. For an asset that does not generate largely independent cash inflows, the recoverable amount is determined for theCGU towhich the assetbelongs. Fair value less cost to sell is the best estimate of the amount obtainable from the sale of an asset in an arm’s length transaction between knowledgeable, willing parties, less the cost of disposal. Assets whose carrying value exceeds their recoverable amount are written down to the recoverable amount. Recoverable amount is higher of an asset’s or cash generating unit’s net selling price and its value in use.
NOTES TO STANDALONE FINANCIAL STATEMENTS NOTES TO STANDALONE FINANCIAL STATEMENTS for the year ended on 31st March, 2022
125
Corporate Overview Notice Statutory Reports Financial StatementsFinancial Statements

Assessment is also done at each Balance Sheet date as to whether there is any indication that an impairment loss recognized for an asset in prior accounting periods may no longer exist or may have decreased.
Impairment losses of continuing operations, including impairment on inventories, are recognised in the statement of profit and loss, except for properties previously revalued with the revaluation surplus taken to Other Comprehensive Income (OCI). For such properties, the impairment is recognised in OCI up to the amount of any previous revaluation surplus.
2.9 Revenue recognition Revenue from contracts with customers is recognized
when control of the goods or services are transferred to the customer at an amount that reflects the consideration to which the company expects to be entitled in exchange for those goods or services.
Revenue is measured based on the transaction price, which is the consideration, adjusted for discounts and other incentives, if any, as specified in the contract with the customer. Revenue also excludes taxes or other amounts collected from customers in its capacity as an agent. If the consideration in a contract includes a variable amount, the company estimates the amount of consideration to which it will be entitled in exchange for transferring the goods to the customer. The variable consideration is estimated at contract inception and constrained until it is highly probable that a significant revenue reversal in the amount of cumulative revenue recognised will not occur when the associated uncertainty with the variable consideration is subsequently resolved.
The accounting policies for the specific revenue streams of the company as summarized below:
i) Interest income is recognised on Effective Interest Rate (EIR) basis considering the amount outstanding and the applicable interest rate as set out in Ind AS 109.
ii) Export benefits available under the prevalent schemes are recognized when there exists no significant uncertainty regards to its realisation.
iii) Dividendincomeisaccountedforwhentherighttoreceive income is established.
iv) Royalty income is recognised on accrual basis in accordance with the substance of the agreement.
v) Rental income is recognised as revenue on accrual basis as per the terms of the underlying contract with customers.
vi) Other operating income and misc. income are accounted on accrual basis as and when the right to receive arises
Contract Balances: Contract Balances:
Contract assets
A contract asset is the right to consideration in exchange for goods or services transferred to the customer. If the company performs by transferring goods or services to a customer before the customer pays consideration or before payment is due, a contract asset is recognised for the earned consideration that is conditional.
Trade receivables
A receivable represents the company’s right to an amount of consideration that is unconditional i.e. only the passage of time is required before payment of consideration is due.
Contract liabilities
A contract liability is the obligation to transfer goods or services to a customer for which the company has received consideration (or an amount of consideration is due) from the customer. Contract liabilities are recognised as revenue when the company performs obligations under the contract.
2.10 Borrowing Borrowings are initially recognised at fair value, net of
transaction costs incurred. Borrowings –interest bearing loans are subsequently measured at amortised cost by using the effective interest method (EIR method). Any difference between the proceeds (net of transaction costs) and the redemption amount is recognised in profit or loss over the period of borrowing using the effective interest method (EIR). The EIR Amortization is included as Finance Costs in the statement of profit and loss.
Fees paid on the establishment of loan facilities are recognised as transaction costs of loan to the extent that it is probable that some or all the facility will be draw down. In this case, the fee is deferred until the draw down occurs. To the extent there is no evidence that it is probable that some or all of the facility will be drawn down, the fee is deferred as a payment for liquidity services and amortised over the period of the facility to which it relates.
NOTES TO STANDALONE FINANCIAL STATEMENTS NOTES TO STANDALONE FINANCIAL STATEMENTS for the year ended on 31st March, 2022
Annual Report 2021-222021-22
126
20 Microns Limited20 Microns Limited

Borrowings are removed from the balance sheet when the obligation specified in the contract is discharged, cancelled or expired. The difference between the carrying amount of a financial liability that has been extinguished or transferred to another party and the consideration paid, including any non-cash assets transferred or liabilities assumed, is recognised in profit or loss as other income or other expenses as well as through the EIR amortization process.
Borrowings are classified as current liabilities unless the Company has an unconditional right to defer settlement of the liability for at least 12 months after the reporting period. Where there is a breach of a material provision of a long term loan arrangement on or before the end of reporting period with the effect that the liability becomes payable on demand on the reporting date, the Company does not classify the liability as current, if the lender agreed, after the reporting period and before the approval of the financial statement for issue, not to demand payment as a consequence of the breach.
2.11 Borrowing Cost The Company is capitalising general and specific
borrowing costs that are directly attributable to the acquisition or construction of qualifying asset up to the date of commissioning. Qualifying assets are assets that necessarily take a substantial period of time to get ready for their intended use or sale. The Expenses incurred in connection with the arrangement of specific borrowings are capitalized over the period of the borrowing and every year such cost is apportioned to assets based on the actual amount borrowed during the year. All other borrowing costs are recognized as expense in the period in which they are incurred and charged to the statement of profit and loss.
Investment income earned on the temporary investment of specific borrowing pending their expenditure on qualifying assets is deducted from the borrowing costs eligible for capitalisation.
2.12 Financial Instruments A financial instrument is any contract that gives rise to
a financial asset of one entity and a financial liability or equity instrument of another entity.
2.12.1 Financial Asset 2.12.1 Financial Asset
Initial Recognition A financial asset or a financial liability is recognised
in the balance sheet only when, the Company becomes party to the contractual provisions of the instrument.
Initial Measurement At initial recognition, the Company measures a
financial asset or financial liability at its fair value plus or minus, in the case of a financial asset or financial liability not at fair value through profit or loss, transaction costs that are directly attributable to the acquisition or issue of the financial asset or financial liability.
Subsequent Measurement For purpose of subsequent measurement, financial
assets are classified into:
• Financialassetsmeasuredatamortisedcost;
• Financialassetsmeasuredatfairvaluethroughprofit or loss (FVTPL); and
• Financialassetsmeasuredatfairvaluethroughother comprehensive income (FVTOCI).
The Company classifies its financial assets in the above mentioned categories based on:
• TheCompany’sbusinessmodelformanagingthe financial assets, and
• Thecontractualcashflowscharacteristicsofthe financial asset.
A financial assets is measured at amortised cost if both of the following conditions are met:
• Thefinancialasset isheldwithinabusinessmodel whose objective is to hold financial assets in order to collect contractual cash flows and
• Thecontractual termsof thefinancialassetsgive rise on specified dates to cash flows that are solely payments of principal and interest (SPPI) on the principal amount outstanding.
Financial assets are subsequently measured at amortised cost using the effective interest rate (EIR) method. Amortised cost is calculated by taking into account any discount or premium on acquisition and fees or costs that are an integral part of the EIR. The EIR amortisation is included in finance income in the profit or loss. The losses arising from impairment are recognised in the profit or loss.
NOTES TO STANDALONE FINANCIAL STATEMENTS NOTES TO STANDALONE FINANCIAL STATEMENTS for the year ended on 31st March, 2022
127
Corporate Overview Notice Statutory Reports Financial StatementsFinancial Statements

A financial asset is measured at fair value through other comprehensive income if both of the following conditions are met:
• Thefinancialasset isheldwithinabusinessmodel whose objective is achieved by both collecting the contractual cash flows and selling financial assets and
• The assets contractual cash flowsrepresent SPPI.
A financial asset is measured at fair value through profit or loss unless it is measured at amortised cost or at fair value through other comprehensive income. In addition, the Company may elect to designate a financial asset, which otherwise meets amortized cost or FVTOCI criteria, as at FVTPL. However, such election is allowed only if doing so reduces or eliminates a measurement or recognition inconsistency (referred to as ‘accounting mismatch’).
equity Investments: All equity investments in scope of Ind AS 109 are
measured at fair value. Equity instruments which are held for trading are classified as at FVTPL. For all other equity instruments, the Company may make an irrevocable election to present in other comprehensive income subsequent changes in the fair value. The Company makes such election on an instrument by-instrument basis. The classification is made on initial recognition and is irrevocable.
If the Company decides to classify an equity instrument as at FVTOCI, then all fair value changes on the instrument, excluding dividends, are recognized in the OCI. There is no recycling of the amounts from OCI to statement of profit and loss, even on sale of investment. However, the Company may transfer the cumulative gain or loss within equity. Equity instruments included within the FVTPL category are measured at fair value with all changes recognized in the Profit andLoss.
De-recognition A financial asset (or, where applicable, a part of a
financial asset or part of a group of similar financial assets) is primarily derecognised (i.e. removed from the Company’s balance sheet) when:
1. The contractual rights to the cash flows from the financial asset have expired, or
2. The Company has transferred its rights to receive cash flows from the asset or has assumed an obligation to pay the received cash flows in full without material delay to a third party under a ‘pass-through’ arrangement; and either
(1) The Company has transferred substantially all the risks and rewards of the asset, or
(2) The Company has neither transferred nor retained substantially all the risks and rewards of the asset, but has transferred control of the asset.
When the Company has transferred its rights to receive cash flows from an asset or has entered into a pass-through arrangement, it evaluates if and to what extent it has retained the risks and rewards of ownership. When it has neither transferred nor retained substantially all of the risks and rewards of the asset, nor transferred control of the asset, the Company continues to recognise the transferred asset to the extent of the Company’s continuing involvement. In that case, the Company also recognises an associated liability. The transferred asset and the associated liability are measured on a basis that reflects the rights and obligations that the Company has retained.
Continuing involvement that takes the form of a guarantee over the transferred asset is measured at the lower of the original carrying amount of the asset and the maximum amount of consideration that the Company could be required to repay.
Impairment of Financial Assets The Company assesses impairment based on
expected credit loss (ECL) model to the following:
• Financialassetsmeasuredatamortisedcost
• Financialassetsmeasuredatfairvaluethroughother comprehensive income
Expected credit losses are measured through a loss allowance at an amount equal to:
• The 12-months expected credit losses(expected credit losses that result from those default events on the financial instrument that are possible within 12 months after the reporting date); or
NOTES TO STANDALONE FINANCIAL STATEMENTS NOTES TO STANDALONE FINANCIAL STATEMENTS for the year ended on 31st March, 2022
Annual Report 2021-222021-22
128
20 Microns Limited20 Microns Limited

• Full time expected credit losses (expectedcredit losses that result from all possible default events over the life of the financial instrument).
The Company follows ‘simplified approach’ for recognition of impairment loss allowance on trade receivables or contract revenue receivables. Under the simplified approach, the Companyis not required to track changes in credit risk. Rather, it recognises impairment loss allowance based on lifetime ECLs together with appropriate management estimates for credit loss at each reporting date, right from its initial recognition.
The Company uses a provision matrix to determine impairment loss allowance on the portfolio of trade receivables. The provision matrix is based on its historically observed default rates over the expected life of the trade receivable and is adjusted for forward looking estimates. At every reporting date, the historical observed default rates are updated and changes in the forward-looking estimates are analysed.
ECL impairment loss allowance (or reversal) recognized during the period is recognized as income/ expense in the statement of profit and loss. This amount is reflected under the head ‘other expenses’ in the statement of Profit and Loss. The balance sheet presentation for various financial instruments is described below:
• Financial assetsmeasured as at amortisedcost and contractual revenue receivables - ECL is presented as an allowance, i.e., as an integral part of the measurement of those assets in the balance sheet. The allowance reduces the net carrying amount. Until theasset meets write-off criteria, the company does not reduce impairment allowance from the gross carrying amount.
• FinancialassetsmeasuredatFVTOCI-Sincefinancial assets are already reflected at fair value, impairment allowance is not further reduced from its value. Rather, ECL amount is presented as accumulated impairment amount in the OCI.
For assessing increase in credit risk and impairment loss, the Company combines financial instruments on the basis of shared credit risk characteristics with the objective of facilitating an analysis that is designed to enable significant increases in credit risk to be identified on a timely basis.
The Company does not have any purchased or originated credit-impaired (POCI) financial assets, i.e., financial assets which are credit impaired on purchase/ origination.
2.12.2 Financial Liabilities 2.12.2 Financial Liabilities
Initial recognition and measurement Financial liabilities are classified, at initial
recognition, as financial liabilities at fair value through profit or loss, loans and borrowings, payables, or as derivatives designated as financial instruments in an effective hedge, as appropriate.
All financial liabilities are recognised initially at fair value and, in case of loans and borrowings and payables, net of directly attributable transaction costs.
The Company’s financial liabilities include trade and other payables, loan and borrowings including bank overdrafts, financial guarantee contracts and derivative financial instruments.
Subsequent measurement • Financialliabilitiesmeasuredatamortisedcost
• Financialliabilitiessubsequentlymeasuredatfair value through profit or loss
Financial liabilities at fair value through profit or loss include financial liabilities held for trading and financial liabilities designated upon initial recognition as at fair value through profit or loss. Financial liabilities are classified as held for trading if they are incurred for the purpose of repurchasing in the near term. Gains or losses on liabilities held for trading are recognised in the profit or loss.
Financial liabilities designated upon initial recognition at fair value through profit or loss are designated as such at the initial date of recognition, and only if the criteria in Ind AS 109 are satisfied. For liabilities designated as FVTPL, fair value gains/ losses attributable to changes in own credit risk are recognized in OCI. These gains/ loss are not subsequently transferred to Profit andLoss. However, the Company may transfer the cumulative gain or loss within equity. All other changes in fair value of such liability are recognised in the statement of profit or loss. The Company has not designated any financial liability as at fair value through profit and loss.
NOTES TO STANDALONE FINANCIAL STATEMENTS NOTES TO STANDALONE FINANCIAL STATEMENTS for the year ended on 31st March, 2022
129
Corporate Overview Notice Statutory Reports Financial StatementsFinancial Statements

Financial Guarantee Contracts Financial guarantee contracts issued by the
Company are those contracts that require a payment to be made to reimburse the holder for a loss it incurs because the specified debtor fails to make a payment when due in accordance with the terms of a debt instrument. Financial guarantee contracts are recognised initially as a liability at fair value, adjusted for transaction costs that are directly attributable to the issuance of the guarantee. Subsequently, the liability is measured at the higher of the amount of loss allowance determined as per impairment requirements of Ind AS 109 and the amount recognised less cumulative amortisation.
Loan and Borrowings After initial recognition, interest-bearing loans
and borrowings are subsequently measured at amortised cost using the Effective Interest Rate (EIR) method. Gains and losses are recognised in profit or loss when the liabilities are derecognised as well as through the EIR amortisation process. Amortised cost is calculated by taking into account any discount or premium on acquisition and fees or costs that are an integral part of the EIR. The EIR amortisation is included as finance costs in the statement of profit and loss.
Derecognition A financial liability is derecognised when the
obligation under the liability is discharged or cancelled or expires. When an existing financial liability is replaced by another from the same lender on substantially different terms, or the terms of an existing liability are substantially modified, such an exchange or modification is treated as the derecognition of the original liability and the recognition of a new liability. The difference in the respective carrying amounts is recognised in the statement of profit or loss.
2.12.3 Derivative Financial Instruments and Hedge 2.12.3 Derivative Financial Instruments and Hedge Accounting Accounting
The Company uses derivative financial instruments such as foreign currency forward contracts to mitigate the risk of changes exchange rates. At the inception of a hedge relationship, the Company formally designates and documents the hedge relationship to which the Company wishes to apply hedge accounting and the risk management objective and strategy for undertaking the hedge. Such derivative financial instruments are initially recognised at fair value on the date on which a
derivative contract is entered into and are also subsequentlymeasuredatfairvalue.Derivativesare carried as Financial Assets when the fair value is positive and as Financial Liabilities when the fair value is negative.
Any gains or losses arising from changes in the fair value of derivatives are taken directly to Statement of Profit and Loss, except for the effective portion of cash flow hedge which is recognised in Other Comprehensive Income and later to Statement of Profit and Loss when the hedged item affects profit or loss or is treated as basis adjustment if a hedged forecast transaction subsequently results in the recognition of a Non-Financial Assets or Non-Financial liability.
Fair Value Hedges: The Company designates derivative contracts
or non-derivative Financial Assets / Liabilities as hedging instruments to mitigate the risk of change in fair value of hedged item due to movement in foreign exchange rates. Changes in the fair value of hedging instruments and hedged items that are designated and qualify as fair value hedges are recorded in the Statement of Profit and Loss. If the hedging relationship no longer meets the criteria for hedge accounting, the adjustment to the carrying amount of a hedged item for which the effective interest method is used is amortised to Statement of Profit and Loss over the period of maturity.
2.12.4 Offsetting financial instruments 2.12.4 Offsetting financial instruments Financial assets and liabilities are offset and the
net amount is reported in the balance sheet where there is a legally enforceable right to offset the recognised amounts and there is an intention to settle on a net basis or realise the asset and settle the liability simultaneously. The legally enforceable right must not be contingent on future events and must be enforceable in the normal course of business and in the event of default, insolvency or bankruptcy of the group or the counterparty.
2.13 Fair Value The Company measures certain financial instruments at fair
value at each balance sheet date.
Fair value is the price that would be received to sell an asset or paid to transfer a liability in an orderly transaction between market participants at the measurement date. The fair value measurement is based on the presumption that
NOTES TO STANDALONE FINANCIAL STATEMENTS NOTES TO STANDALONE FINANCIAL STATEMENTS for the year ended on 31st March, 2022
Annual Report 2021-222021-22
130
20 Microns Limited20 Microns Limited

the transaction to sell the asset or transfer the liability takes place either:
• Intheprincipalmarketfortheassetorliability,or
• In the absence of a principal market, in the mostadvantageous market for the asset or liability.
The principal or the most advantageous market must be accessible by the Company. The fair value of an asset or a liability is measured using the assumptions that market participants would use when pricing the asset or liability, assuming that market participants act in their economic best interest.
The Company uses valuation techniques that are appropriate in the circumstances and for which sufficient data are available to measure fair value, maximising the use of relevant observable inputs and minimising the use of unobservable inputs.
All assets and liabilities for which fair value is measured or disclosed in the financial statements are categorised within the fair value hierarchy, described as under, based on the lowest level input that is significant to the fair value measurement as a whole:
• Level1-Quoted(unadjusted)marketpricesinactivemarkets for identical assets or liabilities.
• Level2-Valuationtechniquesforwhichthelowestlevelinput that is significant to the fair value measurement is directly or indirectly observable.
• Level3-Valuationtechniquesforwhichthelowestlevelinput that is significant to the fair value measurement is unobservable.
For assets and liabilities that are recognised in the financial statements on a recurring basis, the Company determines whether transfers have occurred between levels in the hierarchy by re-assessing categorisation (based on the lowest level input that is significant to the fair value measurement as a whole) at the end of each reporting period.
The Company’s management determines the policies and procedures for both recurring fair value measurement, such as unquoted financial assets measured at fair value, and for non-recurring measurement, such as assets held for distribution in discontinued operations. The management comprises of theManagingDirector andChief FinancialOfficer.
External valuers are involved for valuation of significant assets, such as unquoted financial assets. Involvement of external valuers is decided upon annually by the Valuation Committee after discussion with and approval by the management. Selection criteria include market knowledge, reputation, independence and whether professional standards are maintained. Valuers are normally rotated every three years. The management decides, after discussions with the Company’s external valuers, which valuation techniques and inputs to use for each case.
At each reporting date, the management analyses the movements in the values of assets and liabilities which are required to be re-measured or re-assessed as per the Company’s accounting policies. For this analysis, the management verifies the major inputs applied in the latest valuation by agreeing the information in the valuation.
The management, in conjunction with the Company’s external valuers, also compares the change in the fair value of each asset and liability with relevant external sources to determine whether the change is reasonable.
For the purpose of fair value disclosures, the Company has determined classes of assets and liabilities on the basis of the nature, characteristics and risks of the asset or liability and the level of the fair value hierarchy as explained above.
This note summarises accounting policy for fair value. Other fair value related disclosures are given in the relevant notes. (refer note 41)
1. Disclosures for valuation methods, significantestimates and assumptions.
2. Quantitat ive disclosures of fair value measurement hierarchy.
3. Investment in unquoted equity shares.
4. Financial instruments (including those carried at amortised cost).
2.14 Inventories Raw materials, work-in-progress, finished goods, packing
materials, stores, spares, components, consumables and stock-in trade are carried at the lower of cost and net realizable value. However, materials and other items held for use in production of inventories are not written down below cost if the finished goods in which they will be incorporated are expected to be sold at or above cost. The comparison of cost and net realizable value is made on an item-by item basis.
NOTES TO STANDALONE FINANCIAL STATEMENTS NOTES TO STANDALONE FINANCIAL STATEMENTS for the year ended on 31st March, 2022
131
Corporate Overview Notice Statutory Reports Financial StatementsFinancial Statements
In determining the cost of raw materials, packing materials, stock-in-trade, stores, spares, components and consumables, weighted average cost method is used. Cost of inventory comprises all costs of purchase, duties, taxes (other than those subsequently recoverable from tax authorities) and all other costs incurred in bringing the inventory to their present locationand condition.
Cost of finished goods and work-in-progress includes the cost of raw materials, packing materials, an appropriate share of fixed and variable production overheads, excise duty as applicable and other costs incurred in bringing the inventories to their present location and condition. Fixed production overheads are allocated on the basis of normal capacity of production facilities.
2.15 Non-current assets held for sale and discontinued operation
Non-current assets are classified as held for sale if their carrying amount will be recovered principally through a sale transaction rather than through continuing use and a sale is considered highly probable. They are measured at the lower of their carrying amount and fair value less costs to sell, except for assets such as deferred tax assets, assets arising from employee benefits, financial assets and contractual rights under insurance contracts, which are specifically exempt from this requirement.
An impairment loss is recognised for any initial or subsequent write-down of the asset to fair value less costs to sell. A gain is recognised for any subsequent increases in fair value less costs to sell of an asset, but not in excess of any cumulative impairment loss previously recognised. A gain or loss not previously recognised by the date of the sale of the non-current asset (or disposal group) is recognised at the date of de-recognition.
Non-current assets are not depreciated or amortised while they are classified as held for sale. Non-current assets classified as held for sale are presented separately from the other assets in the balance sheet.
A discontinued operation is a component of the Company that has been disposed of or is classified as held for sale and that represents a separate major line of business or geographical area of operations, is part of a single co-ordinated plan to dispose of such a line of business or area of operations, or is a subsidiary acquired exclusively with a view to resale. The results of discontinued operations are presented separately in the statement of profit and loss.
2.16 Foreign Currency Transactions 2.16.1 Functional and Presentation Currency 2.16.1 Functional and Presentation Currency Items included in the financial statements are
measured using the currency of the primary economic environment in which the Company operates (‘the functional currency’). The financial statements are presented in Indian rupee (`), which is the functional and presentation currency of the Company.
2.16.2 Transactions and balances 2.16.2 Transactions and balances Foreign currency transactions are translated into
the functional currency using the exchange rates at the date of the transactions. Foreign exchange gains and losses resulting from the settlement of such transactions and from the translation of monetary assets and liabilities denominated in foreign currencies at the year-end exchange rates are generally recognised in profit or loss.
All foreign exchange gains and losses are presented in the statement of profit and loss on a net basis within other income or other expenses.
Non-monetary items that are measured in terms of historical cost in a foreign currency are translated using the exchange rates at the dates of the initial transactions. Non-monetary items that are measured at fair value in a foreign currency are translated using the exchange rates at the date when the fair value was determined. Translation differences on assets and liabilities carried at fair value are reported as part of the fair value gain or loss.
2.17 employee Benefits Employees Benefits are provided in the books as per Ind
AS -19 on “Employee Benefits” in the following manner:
2.17.1 Post-employment Benefit Plans 2.17.1 Post-employment Benefit Plans DefinedContributionPlan
Defined contribution plans are employee stateinsurance scheme and Government administered pension fund scheme for all applicable employees and superannuation scheme for eligible employees. The Company does not carry any other obligation apart from the monthly contribution.
The Company recognizes contribution payable to a defined contribution plan as an expense in the Statement of Profit and Loss when the employees
NOTES TO STANDALONE FINANCIAL STATEMENTS NOTES TO STANDALONE FINANCIAL STATEMENTS for the year ended on 31st March, 2022
Annual Report 2021-222021-22
132
20 Microns Limited20 Microns Limited
render services to the Company during the reporting period. If the contributions payable for services received from employees before the reporting date exceeds the contributions already paid, the deficit payable is recognized as a liability after deducting the contribution already paid. If the contribution already paid exceeds the contribution due for services received before the reporting date, the excess is recognized as an asset to the extent that the prepayment will lead to, for example, a reduction in future payments or a cash refund.
Defined Benefit Plans The company provides for gratuity, a defined
benefit plan covering eligible employees in accordance with the Payment of Gratuity Act, 1972, through an approved Gratuity Fund. The Gratuity Fund is separately administered through a Trust/Scheme. Contributions in respect of gratuity are made to the approved Gratuity Fund.
All expenses represented by current service cost, past service cost, if any, and net interest on the defined benefit liability / (asset) are recognized in the Statement of Profit and Loss. Remeasurements of the net defined benefit liability / (asset) comprising actuarial gains and losses and the return on the plan assets (excluding amounts included in net interest on the net defined benefit liability/asset), are recognized in Other Comprehensive Income. Such remeasurements are not reclassified to the Statement of Profit and Loss in the subsequent periods.
The Company presents the above liability/(asset) as current and non-current in the Balance Sheet as per actuarial valuation by the independent actuary; however, the entire liability towards gratuity is considered as current as the Company will contribute this amount to the gratuity fund within the next twelve months.
2.17.2 Short Term employee Benefits 2.17.2 Short Term employee Benefits The undiscounted amount of short term employee
benefits expected to be paid in exchange for services rendered by employees is recognized during the period when the employee renders the services. Short term employee benefits includes salary and wages, bonus, incentive and ex-gratia and also includes accrued leave benefits, which are expected to be availed or en-cashed within 12 months from the end of the year.
2.18 Leases The determination of whether an arrangement is (or contains)
a lease is based on the substance of the arrangement at the inception of the lease. The arrangement is, or contains, a lease if fulfilment of the arrangement is dependent on the use of a specific asset or assets and the arrangement conveys a right to use the asset or assets, even if that right is not explicitly specified in an arrangement.
As a lessee As a lessee The Company’s leased assets consist of leases for
buildings& vehicles. The Company assesses whether a contract contains a lease, at inception of a contract. A contract is, or contains, a lease if the contract conveys the right to control the use of an identified asset for a period of time in exchange for consideration. To assess whether a contract conveys the right to control the use of an identified asset, the Company assesses whether: (i) the contract involves the use of an identified asset (ii) the Company has substantially all of the economic benefits from use of the asset through the period of the lease and (iii) the Company has the right to direct the use of the asset.
At the date of commencement of the lease, the Companyrecognizesaright-of-useasset(“ROU”)andacorresponding lease liability for all lease arrangements in which it is a lessee, except for leases with a term of twelve months or less (short-term leases) and low value leases. For these short-term and low value leases, the Company recognizes the lease payments as an operating expense as per the terms of the lease.
The right-of-use assets are initially recognized at cost, which comprises the initial amount of the lease liability adjusted for any lease payments made at or prior to the commencement date of the lease plus any initial direct costs less any lease incentives. They are subsequently measured at cost less accumulated depreciation and impairment losses.
Right-of-use assets are subsequently depreciated from the commencement date on a straight-line basis over the shorter of the lease term and useful life of the underlying asset. The estimated useful lives of right-of-use assets are determined on the same basis as those of Property, Plant and Equipment. In addition, the right-of-use asset is periodically reduced by impairment losses, if any, and adjusted for certain remeasurements of the lease liability.
The lease liability is initially measured at the present value of the lease payments that are not paid at the commencement date, discounted using the interest rate implicit in the lease or, if that rate cannot be readily determined, the Company’s
NOTES TO STANDALONE FINANCIAL STATEMENTS NOTES TO STANDALONE FINANCIAL STATEMENTS for the year ended on 31st March, 2022
133
Corporate Overview Notice Statutory Reports Financial StatementsFinancial Statements

incremental borrowing rate. Generally, the Company uses its incremental borrowing rate as the discount rate.
The lease liability is subsequently measured at amortised cost using the effective interest method. It is remeasured when there is a change in future lease payments arising from a change in an index or rate, if there is a change in the Company’s estimate of the amount expected to be payable under a residual value guarantee, or if the Company changes its assessment of whether it will exercise a purchase, extension or termination option.
When the lease liability is remeasured in this way, a corresponding adjustment is made to the carrying amount of the right-of-use asset, or is recorded in profit or loss if the carrying amount of the right-of-use asset has been reduced to zero.
Lease liability and ROU assets have been separatelypresented in the Balance Sheet and lease payments have been classified as financing cash flows.
As a lessor Leases for which the Company is a lessor is classified as a
finance or operating lease. Whenever the terms of the lease transfer substantially all the risks and rewards of ownership to the lessee, the contract is classified as a finance lease. All other leases are classified as operating leases. When the Company is an intermediate lessor, it accounts for its interests in the head lease and the sublease separately. The sublease is classified as a finance or operating lease byreferencetotheROUassetarisingfromtheheadlease.For operating leases, rental income is recognized on a straight line basis over the term of the relevant lease.
2.19 Taxation Tax expenses is the aggregate amount included in the
determination of profit or loss for the period in respect of current tax (i.e. amount of tax for the period determined in accordance with the Income Tax Law) and deferred tax (reflecting the tax effects of timing differences between accounting income and taxable income for the period). Income tax expenses are recognised in statement of profit or loss except tax expenses related to items recognised directly in reserves (including statement of other comprehensive income)which are recognised with the underlying items.
2.19.1 Current Tax 2.19.1 Current Tax The current tax expense or credit for the period
is the tax payable on the current period’s taxable income based on the applicable income tax rate for each jurisdiction adjusted by changes in
deferred tax assets and liabilities attributable to temporary differences and to unused tax losses.
The current income tax charge is calculated on the basis of the tax laws enacted or substantively enacted at the end of the reporting period i.e. as per the provisions of the Income Tax Act, 1961, as amended from time to time. Management periodically evaluates positions taken in tax returns with respect to situations in which applicable tax regulation is subject to interpretation. It establishes provisions where appropriate on the basis of amounts expected to be paid to the tax authorities.
Advance taxes and provisions for current income taxes are presented in the balance sheet after off-setting advance tax paid and income tax provision arising in the same tax jurisdiction for relevant tax paying units and where the Company is able to and intends to settle the asset and liability on a net basis.
2.19.2 Deferred Taxes 2.19.2 Deferred Taxes Deferred tax is provided in full on temporary
difference arising between the tax bases of the assets and liabilities and their carrying amounts in financialstatementsatthereportingdate.Deferredtaxes are recognised in respect of deductible temporary differences being the difference between taxable income and accounting income that originate in one period and are capable of reversal in one or more subsequent periods., the carry forward of unused tax losses and the carry forward of unused tax credits.
Deferredincometaxisdeterminedusingtaxrates(and laws) that have been enacted or substantially enacted by the end of the reporting period and are expected to apply when the related deferred income tax asset is realised, or the deferred income tax liability is settled.
Deferred tax assets are recognised for alldeductible temporary differences and unused tax losses only if it is probable that future taxable amounts will be available to utilise those temporary differences and losses. In case of temporary differences that arise from initial recognition of assets or liabilities in a transaction (other than business combination) that affect neither the taxable profit nor the accounting profit, deferred tax assets are not recognised.
NOTES TO STANDALONE FINANCIAL STATEMENTS NOTES TO STANDALONE FINANCIAL STATEMENTS for the year ended on 31st March, 2022
Annual Report 2021-222021-22
134
20 Microns Limited20 Microns Limited

The carrying amount of deferred tax assets is reviewed at each reporting date and reduced to the extent that it is no longer probable that sufficient taxable profit will be available to allow all or part of the deferred tax asset to be utilised. Unrecogniseddeferredtaxassetsarere-assessedat each reporting date and are recognised to the extent that it has become probable that future taxable profits will allow the deferred tax asset to be recovered.
Any tax credit available including Minimum Alternative Tax (MAT) under the provision of the Income Tax Act, 1961 is recognised as deferred tax to the extent that it is probable that future taxable profit will be available against which the unused tax credits can be utilised. The said asset is created by way of credit to the statement of profit and loss and shown under the head deferred tax asset.
Deferredtaxassetsandliabilitiesareoffsetwhenthere is a legally enforceable right to offset current tax assets and liabilities and when the deferred tax balances relate to the same taxation authority. Current tax assets and tax liabilities are offset where the Company has a legally enforceable right to offset and intends either to settle on a net basis, or to realise the asset and settle the liability simultaneously.
Current and deferred tax is recognised in profit or loss, except to the extent that it relates to items recognised in other comprehensive income or directly in equity. In this case, the tax is also recognised in other comprehensive income or directly in equity, respectively.
2.20 earnings Per Share Basic earnings per share Basic earnings per share Basic earnings per share is calculated by dividing
the profit attributable to owners of the Company by the weighted average number of equity shares outstanding during the period. Earnings considered in ascertaining the company’s earnings per share is the net profit for the period after deducting preference dividends, if any, and any attributable distribution tax thereto for the period.
Diluted earnings per share Diluted earnings per share Diluted earningsper share adjusts the figures used in
the determination of basic earnings per share to take into account the after income tax effect of interest and other financing costs associated with dilutive potential equity
shares and the weighted average number of additional equity shares that would have been outstanding assuming the conversion of all dilutive potential equity shares.
2.21 Provisions, Contingent Liabilities and Contingent Assets
Provisions are recognised when the Company has a present obligation (legal or constructive) as a result of a past event, it is probable that an outflow of resources embodying economic benefits will be required to settle the obligation and a reliable estimate can be made of the amount of the obligation. Provision for contractual obligation is disclosed based on management’s assessment of the probable outcome with reference to the available information supplemented by experience of similar transactions. When the Company expects some or all of a provision to be reimbursed, the reimbursement is recognised as a separate asset, but only when the reimbursement is virtually certain. The expense relating to a provision is presented in the statement of profit and loss net of any reimbursement.
Provision in respect of loss contingencies relating to claims, litigation, assessment, fines, penalties etc. are recognised when it is probable that a liability has been incurred and the amount can be estimated reliably.
Provisions are not recognised for future operating Provisions are not recognised for future operating losses.losses.
Where there are a number of similar obligations, the likelihood that an outflow will be required in settlement is determined by considering the class of obligations as a whole. A provision is recognised even if the likelihood of an outflow with respect to any one item included in the same class of obligations may be small.
Provisions are measured at management’s best estimate of the expenditure required to settle the present obligation at the end of the reporting period and are not discounted to present value.The estimates of outcome and financial effect are determined by the judgment of the management, supplemented by experience of similar transactions and, in some cases, reports from independent experts.
The measurement of provision for restructuring includes only direct expenditures arising from the restructuring, which are both necessarily entailed by the restructuring and not associated with the ongoing activities of the Company.
Contingent liability is disclosed in the case of:
1. A present obligation arising from the past events, when it is not probable that an outflow of resources will be required to settle the obligation;
NOTES TO STANDALONE FINANCIAL STATEMENTS NOTES TO STANDALONE FINANCIAL STATEMENTS for the year ended on 31st March, 2022
135
Corporate Overview Notice Statutory Reports Financial StatementsFinancial Statements
2. A present obligation arising from the past events, when no reliable estimate is possible;
3. A possible obligation arising from the past events, unless the probability of outflow of resources is remote.
Contingent liabilities are not provided for and if material, are disclosed by way of notes to financial statements.
A contingent asset is a possible asset that arises from past events and whose existence will be confirmed only by the occurrence or non-occurrence of one or more uncertain future events not wholly within the control of the entity.
Contingent assets are not recognised in financial statements since this may result in the recognition of income that may never be realised. However, Contingent assets are assessed continually and if it is virtually certain that an inflow of economic benefits will arise, the asset and related income are recognised in the period in which the change occurs.
A contingent asset is disclosed by way of notes to financial statements, where an inflow of economic benefits is probable.
Provisions, contingent liabilities and contingent assets are reviewed at each balance sheet date.
2.22 Segment Reporting The Company primarily operates in the segment of
IndustrialMicronized Minerals and Speciality chemicals. TheManagingDirectoroftheCompanyallocateresourcesand assess the performance of the Company, thus they are theChiefOperatingDecisionMaker(CODM).TheCODMmonitors the operating results of the business as a one, hence no separate segment need to be disclosed.
2.23 Cash equivalents Cash and cash equivalents comprise cash and deposits
with banks and corporations. The Company considers all highly liquid investments with original maturities of three months or less and that are readily convertible to known amounts of cash to be cash equivalents.
For the purpose of presentation in the statement of cash flows, cash and cash equivalents includes cash on hand, deposits held at call with financial institutions and other short term, highly liquid investments with original maturities of three months or less that are readily convertible to known amounts of cash and which are subject to an insignificant risk of changes in value.
2.24 Statement of Cash Flows Cash flows are reported using the indirect method, whereby
profit before tax is adjusted for the effects of transactions of a non-cash nature, any deferrals or accruals of past or future operating cash receipts or payments and item of income or expenses associated with investing or financing cash flows. The cash flows from operating, investing and financing activities of the Company are segregated.
2.25 Dividends The Company recognises a liability for dividends to equity
holders of the Company when the dividend is authorised and the dividend is no longer at the discretion of the Company. As per the corporate laws in India, a dividend is authorised when it is approved by the shareholders. A corresponding amount is recognised directly in equity.
2.26 Insurance Claims The company accounts for insurance claims when there is
certainty that the claims are realizable and acknowledged by insurance company and amount recognized in books of accounts is as under:
• Incaseoflossofasset/goodsbytransferring,eitherthe carrying cost of the relevant asset / goods or insurance value (subject to deductibles), whichever is lower under the head “Claims Recoverable-Insurance”.
• Incaseinsuranceclaimis,lessthancarryingcostthedifference is charged to Profit and Loss statement. As and when claims are finally received from insurer, the difference, if any, between Claims Recoverable-Insurance and claims received is adjusted to Profit and Loss statement.
2.27 Research and Development Expenditure on research is recognized as an expense
when it is incurred. Expenditure on development which does not meet the criteria for recognition as an intangible asset is recognized as an expense when it is incurred.
Items of property, plant and equipment and acquired IntangibleAssetsutilizedforResearchandDevelopmentare capitalized and depreciated in accordance with the policies stated for Property, Plant and Equipment and Intangible Assets.
2.28 events occurring after the Reporting Date Adjusting events (that provides evidence of condition
that existed at the balance sheet date) occurring after the balance sheet date are recognized in the financial statements. Material non-adjusting events (that are inductive of conditions that arose subsequent to the
NOTES TO STANDALONE FINANCIAL STATEMENTS NOTES TO STANDALONE FINANCIAL STATEMENTS for the year ended on 31st March, 2022
Annual Report 2021-222021-22
136
20 Microns Limited20 Microns Limited
NOTES TO STANDALONE FINANCIAL STATEMENTS NOTES TO STANDALONE FINANCIAL STATEMENTS for the year ended on 31st March, 2022
balance sheet date) occurring after the balance sheet date that represents material change and commitment affecting thefinancialpositionaredisclosedintheDirectors’Report.
2.29 exceptional Items Certain occasions, the size, type or incidence of an item
of income or expense, pertaining to the ordinary activities of the Company is such that its disclosure improves the understanding of the performance of the Company, such income or expense is classified as an exceptional item and accordingly, disclosed in the notes accompanying to the financial statements.
2.30 Rounding off All amounts disclosed in the financial statements and notes
have been rounded off to the nearest Lakhs as per the requirements of Schedule III, unless otherwise stated.
2.31 Recent accounting pronouncements Ministry of Corporate Affairs (“MCA”) notifies new standard
or amendments to the existing standards under Companies (Indian Accounting Standards) Rules as issued from time to time. On March 23, 2022, MCA amended the Companies (Indian Accounting Standards) Amendment Rules, 2022, applicable from April 1st, 2022, as below:
Ind AS 103 – Reference to Conceptual Framework
The amendments specifiy that to qualify for recognition as part of applying the acquisition method, the identifiable assets acquired and liabilities assumed must meet the definitions of assets and liabilities in the Conceptual Framework for Financial Reporting under Indian Accounting Standards (Conceptual Framework) issued by the Institute of Chartered Accountants of India at the
acquisition date. These changes do not significantly change the requirements of Ind AS 103. The Company does not expect the amendment to have any significant impact in its financial statements.
Ind AS 16 – Proceeds before intended use
The amendments mainly prohibit an entity from deducting from the cost of property, plant and equipment amounts received from selling items produced while the company is preparing the asset for its intended use. Instead, an entity will recognise such sales proceeds and related cost in profit or loss. The Company does not expect the amendments to have any impact in its recognition of its property, plant and equipment in its financial statements.
Ind AS 37 – Onerous Contracts - Costs of Fulfilling a Contract
The amendments specify that that the ‘cost of fulfilling’ a contract comprises the ‘costs that relate directly to the contract’. Costs that relate directly to a contract can either be incremental costs of fulfilling that contract (examples would be direct labour, materials) or an allocation of other costs that relate directly to fulfilling contracts. The amendment is essentially a clarification and the Company does not expect the amendment to have any significant impact in its financial statements.
Ind AS 109 – Annual Improvements to Ind AS (2021)
The amendment clarifies which fees an entity includes when it applies the ‘10 percent’ test of Ind AS 109 in assessing whether to derecognise a financial liability. The Company does not expect the amendment to have any significant impact in its financial statements.
137
Corporate Overview Notice Statutory Reports Financial StatementsFinancial Statements
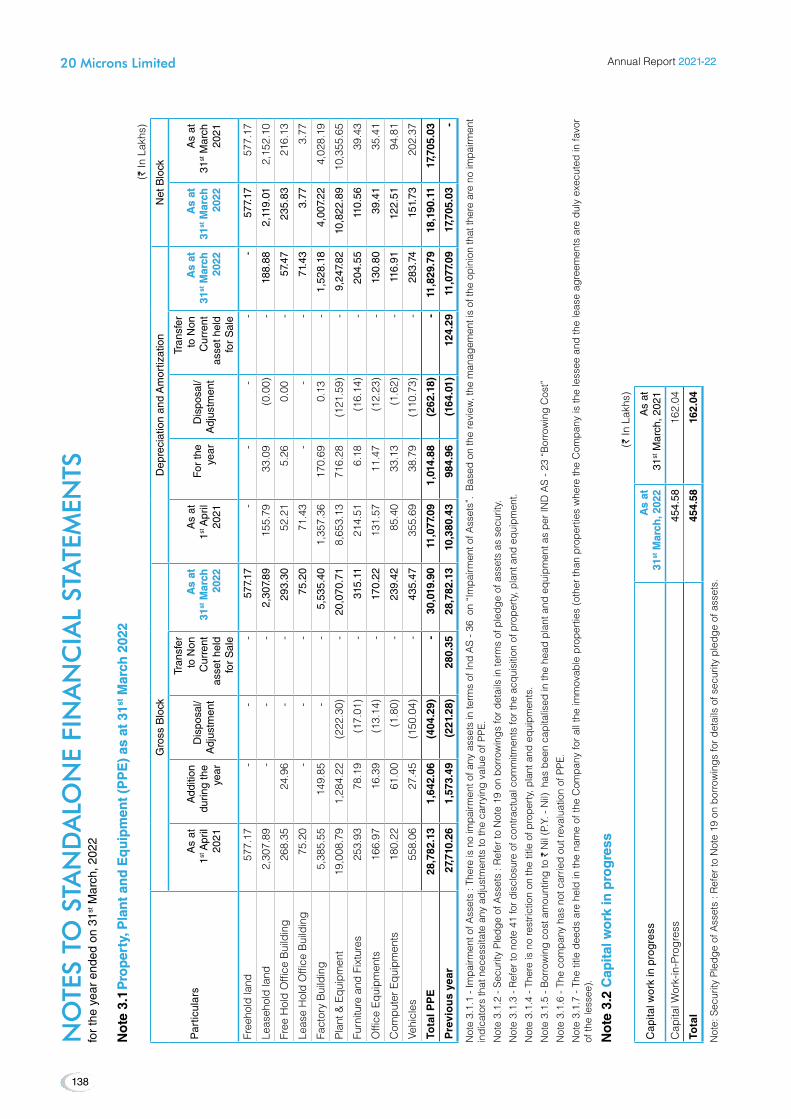
No
te 3
.1 P
rop
erty
, Pla
nt
and
eq
uip
men
t (P
Pe
) as
at
31 P
rop
erty
, Pla
nt
and
eq
uip
men
t (P
Pe
) as
at
31stst M
arch
202
2 M
arch
202
2(`
In L
akhs
)
Par
ticul
ars
Gro
ss B
lock
D
epre
ciat
ion
and
Am
ortiz
atio
n
Net
Blo
ck
As
at
1st A
pril
2021
Add
ition
du
ring
the
year
Dis
posa
l/ A
djus
tmen
t
Tra
nsfe
r to
Non
C
urre
nt
asse
t hel
d fo
r S
ale
As
at
As
at
3131stst M
arch
M
arch
20
22
2022
As
at
1st A
pril
2021
For
the
year
D
ispo
sal/
Adj
ustm
ent
Tra
nsfe
r to
Non
C
urre
nt
asse
t hel
d fo
r S
ale
As
at
As
at
3131stst M
arch
M
arch
20
22
2022
As
at
As
at
3131stst M
arch
M
arch
20
22
2022
As
at
31st M
arch
20
21
Free
hold
land
577
.17
-
-
-
577
.17
-
-
-
-
-
577
.17
577
.17
Leas
ehol
d la
nd 2
,307
.89
-
-
-
2,3
07.8
9 1
55.7
9 3
3.09
(0
.00)
-
188
.88
2,1
19.0
1 2
,152
.10
Free
Hol
d O
ffice
Bui
ldin
g 2
68.3
5 2
4.96
-
-
2
93.3
0 5
2.21
5
.26
0.0
0 -
5
7.47
2
35.8
3 2
16.1
3
Leas
e H
old
Offi
ce B
uild
ing
75.
20
-
-
-
75.
20
71.
43
-
-
-
71.
43
3.7
7 3
.77
Fact
ory
Bui
ldin
g 5
,385
.55
149
.85
-
-
5,5
35.4
0 1
,357
.36
170
.69
0.1
3 -
1
,528
.18
4,0
07.2
2 4
,028
.19
Plan
t & E
quip
men
t 1
9,00
8.79
1
,284
.22
(222
.30)
-
20,
070.
71
8,6
53.1
3 7
16.2
8 (1
21.5
9) -
9
,247
.82
10,
822.
89
10,
355.
65
Furn
iture
and
Fix
ture
s 2
53.9
3 7
8.19
(1
7.01
) -
3
15.1
1 2
14.5
1 6
.18
(16.
14)
-
204
.55
110
.56
39.
43
Offi
ce E
quip
men
ts 1
66.9
7 1
6.39
(1
3.14
) -
1
70.2
2 1
31.5
7 1
1.47
(1
2.23
) -
1
30.8
0 3
9.41
3
5.41
Com
pute
r Equ
ipm
ents
180
.22
61.
00
(1.8
0) -
2
39.4
2 8
5.40
3
3.13
(1
.62)
-
116
.91
122
.51
94.
81
Vehi
cles
558
.06
27.
45
(150
.04)
-
435
.47
355
.69
38.
79
(110
.73)
-
283
.74
151
.73
202
.37
Tota
l PP
e 2
8,78
2.13
1
,642
.06
(40
4.29
) -
3
0,01
9.90
1
1,07
7.09
1
,014
.88
(26
2.18
) -
1
1,82
9.79
1
8,19
0.11
1
7,70
5.03
Pre
vio
us
year
27,
710.
26
1,5
73.4
9 (
221.
28)
280
.35
28,
782.
13
10,
380.
43
984
.96
(16
4.01
) 1
24.2
9 1
1,07
7.09
1
7,70
5.03
-
Not
e 3.
1.1
- Im
pairm
ent o
f Ass
ets
: The
re is
no
impa
irmen
t of a
ny a
sset
s in
term
s of
Ind
AS
- 36
on
“Im
pairm
ent o
f Ass
ets”
. B
ased
on
the
revi
ew, t
he m
anag
emen
t is
of th
e op
inio
n th
at th
ere
are
no im
pairm
ent
indi
cato
rs th
at n
eces
sita
te a
ny a
djus
tmen
ts to
the
carr
ying
val
ue o
f PPE
.
Not
e 3.
1.2
- Sec
urity
Ple
dge
of A
sset
s : R
efer
to N
ote
19 o
n bo
rrow
ings
for d
etai
ls in
term
s of
ple
dge
of a
sset
s as
sec
urity
.
Not
e 3.
1.3
- Ref
er to
not
e 41
for d
iscl
osur
e of
con
tract
ual c
omm
itmen
ts fo
r the
acq
uisi
tion
of p
rope
rty,
pla
nt a
nd e
quip
men
t.
Not
e 3.
1.4
- The
re is
no
rest
rictio
n on
the
title
of p
rope
rty,
pla
nt a
nd e
quip
men
ts.
Not
e 3.
1.5
- Bor
row
ing
cost
am
ount
ing
to `
Nil(P.Y.-Nil)h
asbee
nca
pitalised
inth
ehe
adplantand
equ
ipmen
taspe
rINDAS-2
3“B
orrowingCos
t”
Not
e 3.
1.6
- The
com
pany
has
not
car
ried
out r
eval
uatio
n of
PPE
.
Not
e 3.
1.7
- Th
e tit
le d
eeds
are
hel
d in
the
nam
e of
the
Com
pany
for
all t
he im
mov
able
pro
pert
ies
(oth
er th
an p
rope
rtie
s w
here
the
Com
pany
is th
e le
ssee
and
the
leas
e ag
reem
ents
are
dul
y ex
ecut
ed in
favo
r of
the
less
ee).
No
te 3
.2 C
apit
al w
ork
in p
rog
ress
Cap
ital
wo
rk in
pro
gre
ss(`
In L
akhs
)
Cap
ital w
ork
in p
rogr
ess
As
at
As
at
3131stst M
arch
, 202
2 M
arch
, 202
2A
s at
31
st M
arch
, 202
1
Cap
ital W
ork-
in-P
rogr
ess
454.
5816
2.04
Tota
l 4
54.5
8 1
62.0
4
Not
e: S
ecur
ity P
ledg
e of
Ass
ets
: Ref
er to
Not
e 19
on
borr
owin
gs fo
r det
ails
of s
ecur
ity p
ledg
e of
ass
ets.
NO
TES
TO S
TAN
DA
LON
E FI
NA
NC
IAL
STA
TEM
ENTS
N
OTE
S TO
STA
ND
ALO
NE
FIN
AN
CIA
L ST
ATE
MEN
TS
for
the
year
end
ed o
n 31
st M
arch
, 202
2
Annual Report 2021-222021-22
138
20 Microns Limited20 Microns Limited

No
te 3
.3 A
gei
ng
Sch
edu
le A
gei
ng
Sch
edu
le
As
on
31
Mar
ch 2
022:
(` In
Lak
hs)
Cap
ital w
ork
in p
rogr
ess
Am
ou
nt
in C
WIP
for
a p
erio
d o
fA
mo
un
t in
CW
IP fo
r a
per
iod
of
Tota
lTo
tal
Les
s th
an 1
Yea
rL
ess
than
1 Y
ear
1-2
Year
s1-
2 Ye
ars
2-3
Year
s2-
3 Ye
ars
Mo
re t
han
3 Y
ears
Mo
re t
han
3 Y
ears
Proj
ects
in P
rogr
ess
454
.58
-
-
-
454
.58
Proj
ects
tem
pora
rily
susp
ende
d -
-
-
-
-
To
tal
454
.58
-
-
-
454
.58
As
on
31
Mar
ch 2
021:
(` In
Lak
hs)
Cap
ital w
ork
in p
rogr
ess
Am
ount
in C
WIP
for
a pe
riod
ofTo
tal
Less
than
1 Y
ear
1-2
Year
s2-
3 Ye
ars
Mor
e th
an 3
Yea
rsPr
ojec
ts in
Pro
gres
s 1
43.8
7 4
.39
13.
78
-
162
.04
Proj
ects
tem
pora
rily
susp
ende
d -
-
-
-
-
To
tal
143
.87
4.3
9 1
3.78
-
1
62.0
4
No
te 3
.3.1
- Th
ere
are
no p
roje
cts
in C
WIP
who
se c
ompl
etio
n is
ove
rdue
or h
as e
xcee
ded
cost
com
pare
d to
orig
inal
pla
n.
No
te 4
. In
tan
gib
le a
sset
s as
at
31 In
tan
gib
le a
sset
s as
at
31stst M
arch
202
2 M
arch
202
2(`
In L
akhs
)
Par
ticul
ars
Gro
ss B
lock
A
mor
tizat
ion
N
et B
lock
As
at
1st A
pril
2021
Add
ition
du
ring
the
year
Dis
posa
l/ A
djus
tmen
t
Tra
nsfe
r to
N
on
Cur
rent
as
set h
eld
for
Sal
e
As
at
As
at
3131stst M
arch
M
arch
20
22
2022
As
at
1st A
pril
2021
For
the
year
D
ispo
sal/
Adj
ustm
ent
Tra
nsfe
r to
Non
C
urre
nt
asse
t hel
d fo
r S
ale
As
at
As
at
3131stst M
arch
M
arch
20
22
2022
As
at
As
at
3131stst M
arch
M
arch
20
22
2022
As
at
31st M
arch
20
21
SAP
"ER
P" L
icen
se a
nd
Dev
elop
men
tFee
s 1
19.6
6 -
-
-
1
19.6
6 2
5.84
1
6.72
-
-
4
2.56
7
7.10
9
3.82
RightofU
se 4
24.6
2 1
67.2
9 -
-
5
91.9
1 2
52.6
2 1
49.3
2 -
-
4
01.9
4 1
89.9
6 1
72.0
0 To
tal I
nta
ng
ible
Ass
ets
544
.28
167
.29
-
-
711
.57
278
.46
166
.04
-
-
444
.51
267
.06
265
.82
Pre
vio
us
year
1,0
09.5
1 3
9.66
5
04.9
0 -
5
44.2
8 5
94.7
8 1
67.7
4 4
84.0
6 -
2
78.4
6 2
65.8
2 -
Note4.1.1.Produ
ctDev
elop
men
tisac
quire
dkn
owhow
.The
use
fullife
ofthe
produ
ctdev
elop
men
tistake
n5ye
ars.
Note4.1.2So
ftwareinclud
esSAPER
PLice
ncean
dDev
elop
men
tFee
san
dOthersoftwares
.ForSAPER
PLice
ncean
dDev
elop
men
tFee
sus
efullifeiscon
side
redas
7yea
rsand
foro
thersoftwares
theus
eful
life
is 5
yea
rs.
Not
e 4.
1.3-
Impa
irmen
t of A
sset
s : T
here
is n
o im
pairm
ent o
f any
ass
ets
in te
rms
of In
d A
S - 3
6 o
n “I
mpa
irmen
t of A
sset
s”.
Bas
ed o
n th
e re
view
, the
man
agem
ent i
s of
the
opin
ion
that
ther
e ar
e no
impa
irmen
t in
dica
tors
that
nec
essi
tate
any
adj
ustm
ents
to th
e ca
rryi
ng v
alue
of i
ntan
gibl
e as
sets
.
Not
e 4.
1.4
- The
re is
no
rest
rictio
n on
the
title
of i
ntan
gibl
e as
sets
.
Not
e 4.
1.5
- The
re a
re n
o in
tang
ible
ass
et u
nder
dev
elop
men
t as
at 3
1st M
arch
, 202
2 an
d 31
st M
arch
, 202
1 he
nce
disc
losu
re w
ith re
gard
s to
sam
e is
not
requ
ired
to m
ake.
Not
e 4.
1.6
- The
com
pany
has
not
car
ried
out r
eval
uatio
n of
inta
ngib
le a
sset
s.
NO
TES
TO S
TAN
DA
LON
E FI
NA
NC
IAL
STA
TEM
ENTS
N
OTE
S TO
STA
ND
ALO
NE
FIN
AN
CIA
L ST
ATE
MEN
TS
for
the
year
end
ed o
n 31
st M
arch
, 202
2
139
Corporate Overview Notice Statutory Reports Financial StatementsFinancial Statements
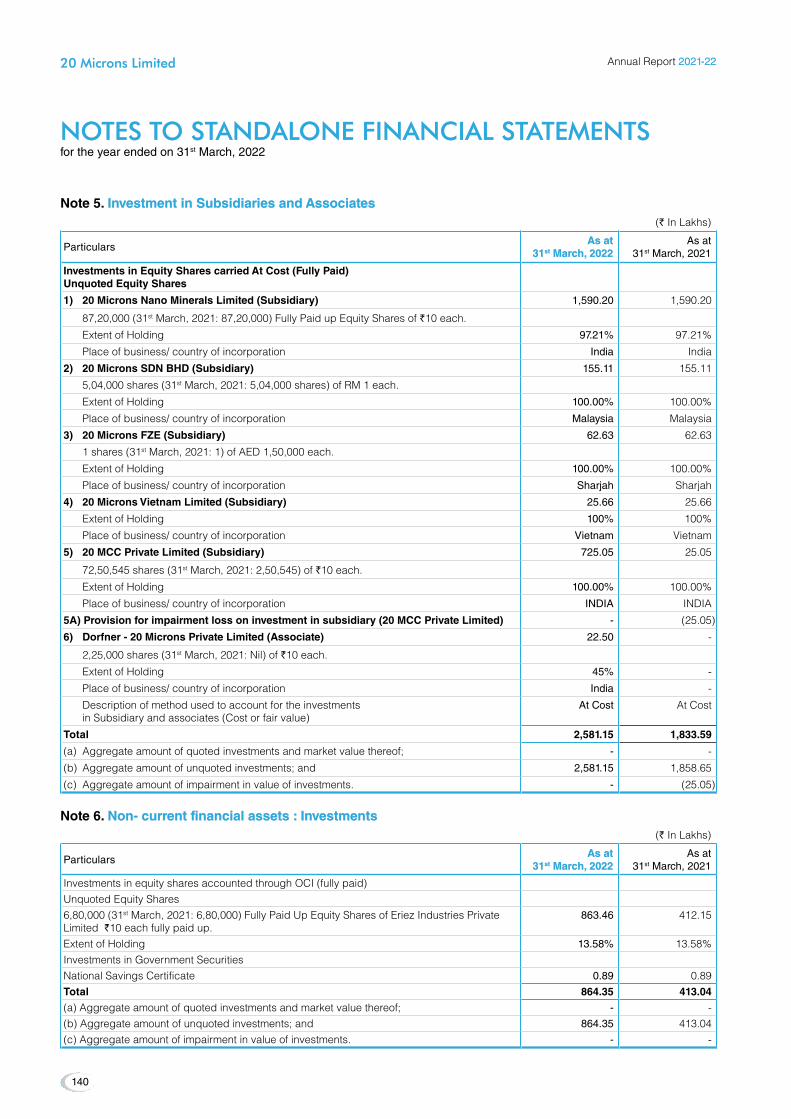
Note 5. Investment in Subsidiaries and Associates Investment in Subsidiaries and Associates(` In Lakhs)
ParticularsAs atAs at
3131stst March, 2022 March, 2022As at
31st March, 2021
Investments in equity Shares carried At Cost (Fully Paid) Unquoted equity Shares
1) 20 Microns Nano Minerals Limited (Subsidiary) 1,590.20 1,590.20
87,20,000 (31st March, 2021: 87,20,000) Fully Paid up Equity Shares of `10 each.
Extent of Holding 97.21% 97.21%
Place of business/ country of incorporation India India
2) 20 Microns SDN BHD (Subsidiary) 155.11 155.11
5,04,000 shares (31st March, 2021: 5,04,000 shares) of RM 1 each.
Extent of Holding 100.00% 100.00%
Place of business/ country of incorporation Malaysia Malaysia
3) 20 Microns FZe (Subsidiary) 62.63 62.63
1 shares (31stMarch,2021:1)ofAED1,50,000each.
Extent of Holding 100.00% 100.00%
Place of business/ country of incorporation Sharjah Sharjah
4) 20 Microns Vietnam Limited (Subsidiary) 25.66 25.66
Extent of Holding 100% 100%
Place of business/ country of incorporation Vietnam Vietnam
5) 20 MCC Private Limited (Subsidiary) 725.05 25.05
72,50,545 shares (31st March, 2021: 2,50,545) of `10 each.
Extent of Holding 100.00% 100.00%
Place of business/ country of incorporation INDIA INDIA
5A) Provision for impairment loss on investment in subsidiary (20 MCC Private Limited) - (25.05)
6) Dorfner - 20 Microns Private Limited (Associate) 22.50 -
2,25,000 shares (31st March, 2021: Nil) of `10 each.
Extent of Holding 45% -
Place of business/ country of incorporation India -
Descriptionofmethodusedtoaccountfortheinvestments in Subsidiary and associates (Cost or fair value)
At Cost At Cost
Total 2,581.15 1,833.59
(a) Aggregate amount of quoted investments and market value thereof; - -
(b) Aggregate amount of unquoted investments; and 2,581.15 1,858.65
(c) Aggregate amount of impairment in value of investments. - (25.05)
Note 6. Non- current financial assets : Investments Non- current financial assets : Investments(` In Lakhs)
ParticularsAs at As at
3131stst March, 2022 March, 2022As at
31st March, 2021
Investments in equity shares accounted through OCI (fully paid)UnquotedEquityShares6,80,000 (31stMarch,2021:6,80,000)FullyPaidUpEquitySharesofEriezIndustriesPrivateLimited `10 each fully paid up.
863.46 412.15
Extent of Holding 13.58% 13.58%Investments in Government SecuritiesNational Savings Certificate 0.89 0.89 Total 864.35 413.04
(a) Aggregate amount of quoted investments and market value thereof; - - (b) Aggregate amount of unquoted investments; and 864.35 413.04 (c) Aggregate amount of impairment in value of investments. - -
NOTES TO STANDALONE FINANCIAL STATEMENTS NOTES TO STANDALONE FINANCIAL STATEMENTS for the year ended on 31st March, 2022
Annual Report 2021-222021-22
140
20 Microns Limited20 Microns Limited
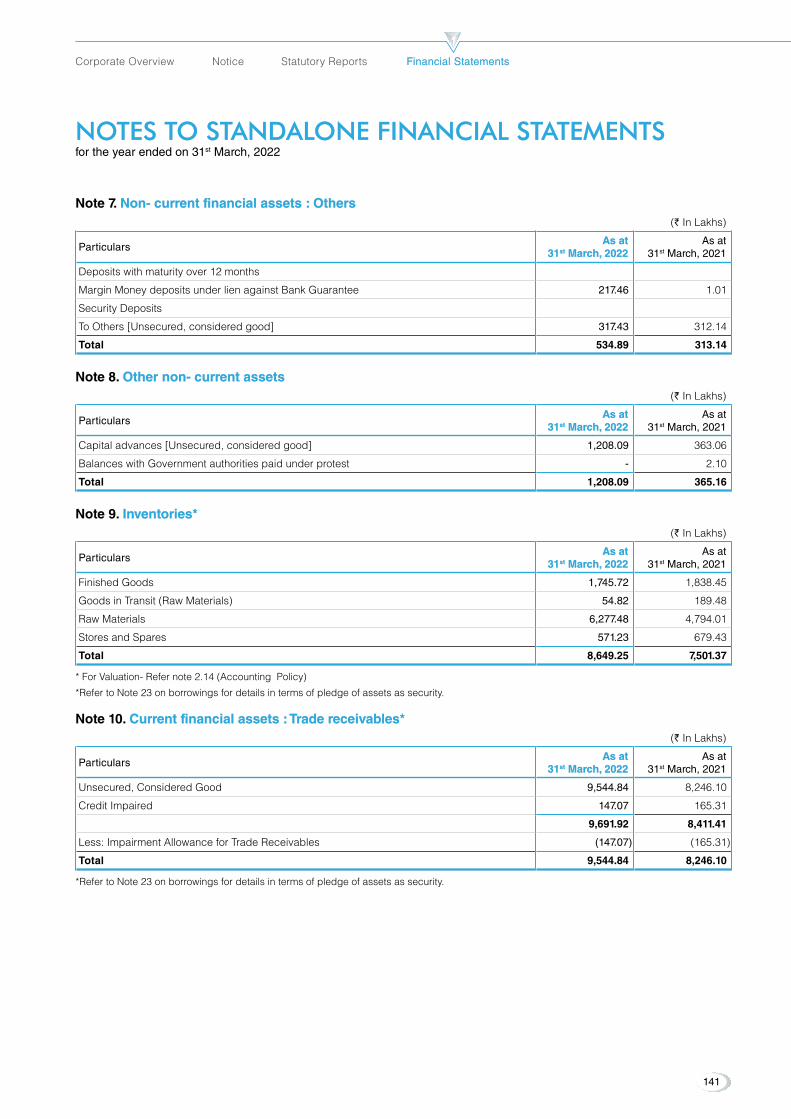
NOTES TO STANDALONE FINANCIAL STATEMENTS NOTES TO STANDALONE FINANCIAL STATEMENTS for the year ended on 31st March, 2022
Note 7. Non- current financial assets : Others Non- current financial assets : Others(` In Lakhs)
ParticularsAs at As at
3131stst March, 2022 March, 2022As at
31st March, 2021
Depositswithmaturityover12months
Margin Money deposits under lien against Bank Guarantee 217.46 1.01
SecurityDeposits
ToOthers[Unsecured,consideredgood] 317.43 312.14
Total 534.89 313.14
Note 8. Other non- current assets Other non- current assets(` In Lakhs)
ParticularsAs at As at
3131stst March, 2022 March, 2022As at
31st March, 2021
Capitaladvances[Unsecured,consideredgood] 1,208.09 363.06
Balances with Government authorities paid under protest - 2.10
Total 1,208.09 365.16
Note 9. Inventories* Inventories* (` In Lakhs)
ParticularsAs at As at
3131stst March, 2022 March, 2022As at
31st March, 2021
Finished Goods 1,745.72 1,838.45
Goods in Transit (Raw Materials) 54.82 189.48
Raw Materials 6,277.48 4,794.01
Stores and Spares 571.23 679.43
Total 8,649.25 7,501.37
* For Valuation- Refer note 2.14 (Accounting Policy)
*Refer to Note 23 on borrowings for details in terms of pledge of assets as security.
Note 10. Current financial assets : Trade receivables* Current financial assets : Trade receivables* (` In Lakhs)
ParticularsAs at As at
3131stst March, 2022 March, 2022As at
31st March, 2021
Unsecured,ConsideredGood 9,544.84 8,246.10
Credit Impaired 147.07 165.31
9,691.92 8,411.41
Less: Impairment Allowance for Trade Receivables (147.07) (165.31)
Total 9,544.84 8,246.10
*Refer to Note 23 on borrowings for details in terms of pledge of assets as security.
141
Corporate Overview Notice Statutory Reports Financial StatementsFinancial Statements
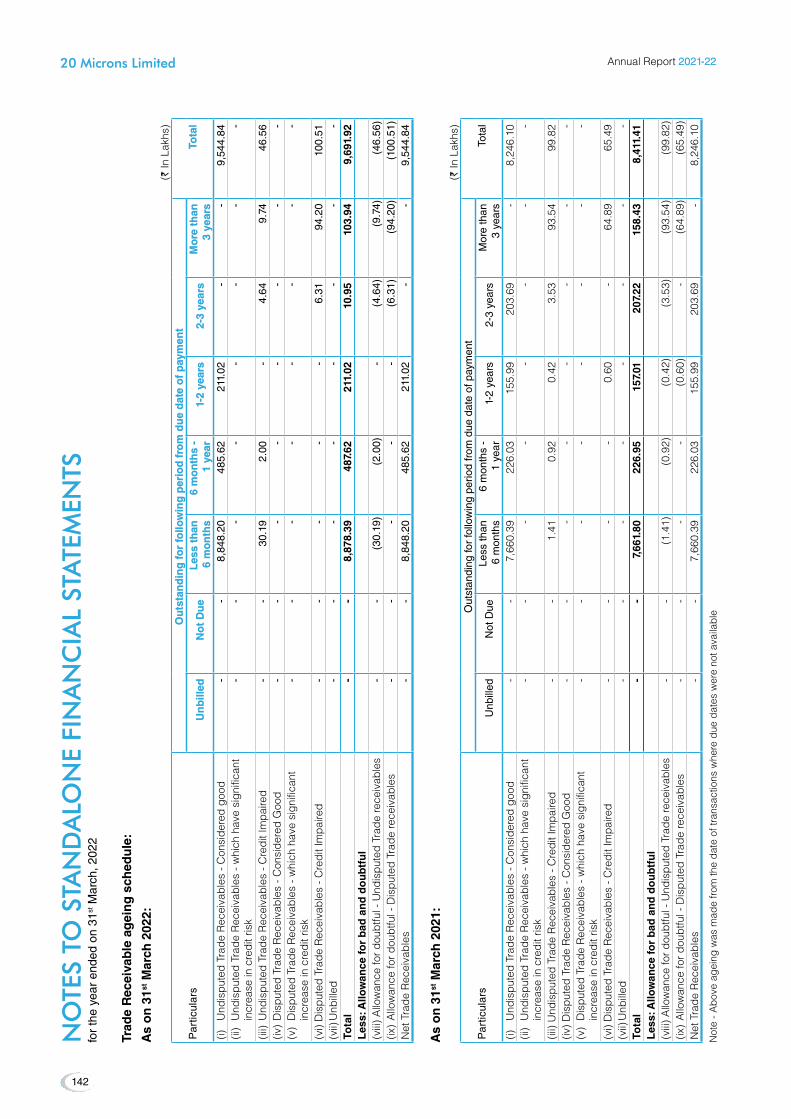
NO
TES
TO S
TAN
DA
LON
E FI
NA
NC
IAL
STA
TEM
ENTS
N
OTE
S TO
STA
ND
ALO
NE
FIN
AN
CIA
L ST
ATE
MEN
TS
for
the
year
end
ed o
n 31
st M
arch
, 202
2
Trad
e R
ecei
vab
le a
gei
ng
sch
edu
le:
As
on
31st
Mar
ch 2
022:
(` In
Lak
hs)
Par
ticul
ars
Ou
tsta
nd
ing
for
follo
win
g p
erio
d f
rom
du
e d
ate
of
pay
men
tO
uts
tan
din
g fo
r fo
llow
ing
per
iod
fro
m d
ue
dat
e o
f p
aym
ent
Tota
lTo
tal
Un
bill
edU
nb
illed
No
t D
ue
No
t D
ue
Les
s th
an
Les
s th
an
6 m
on
ths
6 m
on
ths
6 m
on
ths
- 6
mo
nth
s -
1 ye
ar1
year
1-2
year
s1-
2 ye
ars
2-3
year
s2-
3 ye
ars
Mo
re t
han
M
ore
th
an
3 ye
ars
3 ye
ars
(i)Und
ispu
tedTrad
eRec
eiva
bles
-Con
side
redgo
od -
-
8
,848
.20
485
.62
211
.02
-
-
9,5
44.8
4 (ii)Und
ispu
tedTrad
eRec
eiva
bles
-which
hav
esign
ifica
nt
incr
ease
in c
redi
t ris
k -
-
-
-
-
-
-
-
(iii)Und
ispu
tedTrad
eRec
eiva
bles
-CreditImpa
ired
-
-
30.
19
2.0
0 -
4
.64
9.7
4 4
6.56
(iv
)Dispu
tedTrad
eRec
eiva
bles
-Con
side
redGoo
d -
-
-
-
-
-
-
-
(v)Dispu
tedTrad
eRec
eiva
bles
-which
hav
esign
ifica
nt
incr
ease
in c
redi
t ris
k -
-
-
-
-
-
-
-
(vi)Dispu
tedTrad
eRec
eiva
bles
-CreditImpa
ired
-
-
-
-
-
6.3
1 9
4.20
1
00.5
1 (vii)Unb
illed
-
-
-
-
-
-
-
-
Tota
l -
-
8
,878
.39
487
.62
211
.02
10.
95
103
.94
9,6
91.9
2 L
ess:
Allo
wan
ce fo
r b
ad a
nd
do
ub
tfu
l(viii) A
llowan
cefo
rdou
btful-Und
ispu
tedTrad
erece
ivab
les
-
-
(30
.19)
(2.
00)
-
(4.
64)
(9.
74)
(46
.56)
(ix)Allowan
cefo
rdou
btful-Dispu
tedTrad
erece
ivab
les
-
-
-
-
-
(6.
31)
(94
.20)
(10
0.51
)N
et T
rade
Rec
eiva
bles
-
-
8,8
48.2
0 4
85.6
2 2
11.0
2 -
-
9
,544
.84
As
on
31st
Mar
ch 2
021:
(` In
Lak
hs)
Par
ticul
ars
Out
stan
ding
for
follo
win
g pe
riod
from
due
dat
e of
pay
men
tTo
tal
Unb
illed
Not
Due
Less
than
6
mon
ths
6 m
onth
s -
1 ye
ar1-
2 ye
ars
2-3
year
sM
ore
than
3
year
s(i)Und
ispu
tedTrad
eRec
eiva
bles
-Con
side
redgo
od -
-
7
,660
.39
226
.03
155
.99
203
.69
-
8,2
46.1
0 (ii)Und
ispu
tedTrad
eRec
eiva
bles
-which
hav
esign
ifica
nt
incr
ease
in c
redi
t ris
k -
-
-
-
-
-
-
-
(iii)Und
ispu
tedTrad
eRec
eiva
bles
-CreditImpa
ired
-
-
1.4
1 0
.92
0.4
2 3
.53
93.
54
99.
82
(iv)D
ispu
tedTrad
eRec
eiva
bles
-Con
side
redGoo
d -
-
-
-
-
-
-
-
(v)Dispu
tedTrad
eRec
eiva
bles
-which
hav
esign
ifica
nt
incr
ease
in c
redi
t ris
k -
-
-
-
-
-
-
-
(vi)Dispu
tedTrad
eRec
eiva
bles
-CreditImpa
ired
-
-
-
-
0.6
0 -
6
4.89
6
5.49
(vii)Unb
illed
-
-
-
-
-
-
-
-
Tota
l -
-
7
,661
.80
226
.95
157
.01
207
.22
158
.43
8,4
11.4
1 L
ess:
Allo
wan
ce fo
r b
ad a
nd
do
ub
tfu
l(viii) A
llowan
cefo
rdou
btful-Und
ispu
tedTrad
erece
ivab
les
-
-
(1.4
1) (0
.92)
(0.4
2) (3
.53)
(93.
54)
(99.
82)
(ix)Allowan
cefo
rdou
btful-Dispu
tedTrad
erece
ivab
les
-
-
-
-
(0.6
0) -
(6
4.89
) (6
5.49
)N
et T
rade
Rec
eiva
bles
-
-
7,6
60.3
9 2
26.0
3 1
55.9
9 2
03.6
9 -
8
,246
.10
Not
e - A
bove
age
ing
was
mad
e fro
m th
e da
te o
f tra
nsac
tions
whe
re d
ue d
ates
wer
e no
t ava
ilabl
e
Annual Report 2021-222021-22
142
20 Microns Limited20 Microns Limited
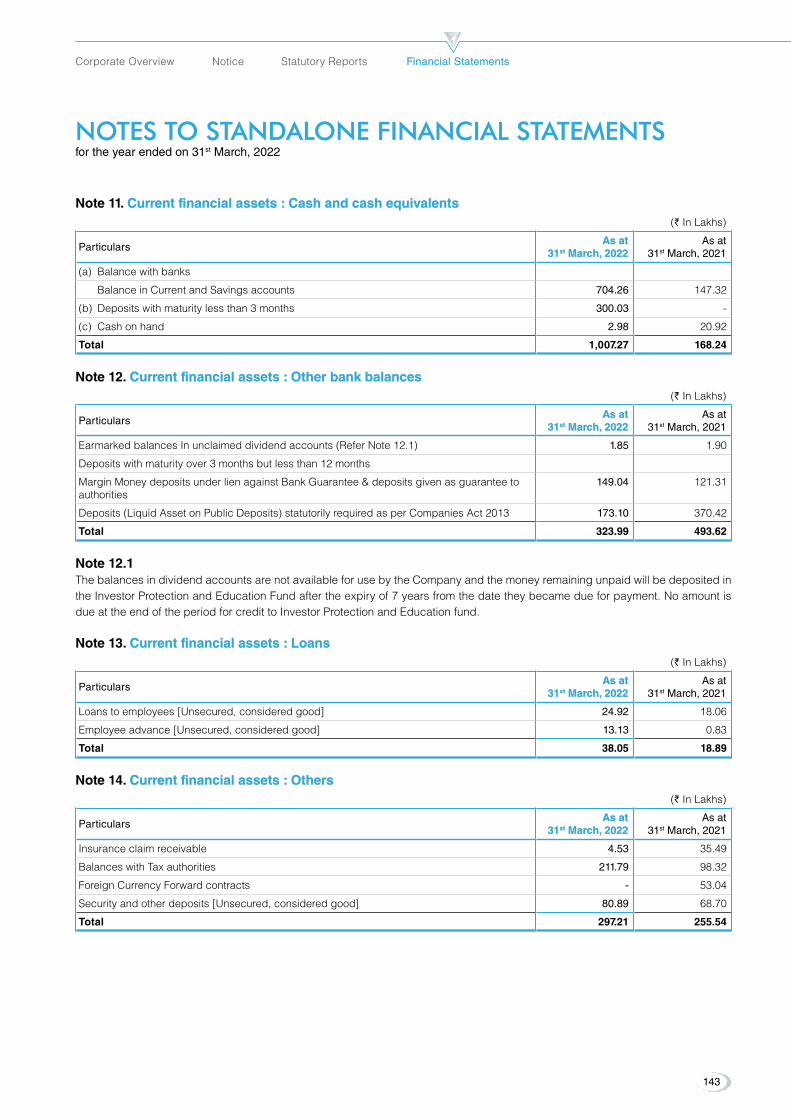
NOTES TO STANDALONE FINANCIAL STATEMENTS NOTES TO STANDALONE FINANCIAL STATEMENTS for the year ended on 31st March, 2022
Note 11. Current financial assets : Cash and cash equivalents Current financial assets : Cash and cash equivalents (` In Lakhs)
ParticularsAs at As at
3131stst March, 2022 March, 2022As at
31st March, 2021
(a) Balance with banks
Balance in Current and Savings accounts 704.26 147.32
(b) Depositswithmaturitylessthan3months 300.03 -
(c) Cash on hand 2.98 20.92
Total 1,007.27 168.24
Note 12. Current financial assets : Other bank balances Current financial assets : Other bank balances (` In Lakhs)
ParticularsAs at As at
3131stst March, 2022 March, 2022As at
31st March, 2021
Earmarked balances In unclaimed dividend accounts (Refer Note 12.1) 1.85 1.90
Depositswithmaturityover3monthsbutlessthan12months
Margin Money deposits under lien against Bank Guarantee & deposits given as guarantee to authorities
149.04 121.31
Deposits(LiquidAssetonPublicDeposits)statutorilyrequiredasperCompaniesAct2013 173.10 370.42
Total 323.99 493.62
Note 12.1 The balances in dividend accounts are not available for use by the Company and the money remaining unpaid will be deposited in the Investor Protection and Education Fund after the expiry of 7 years from the date they became due for payment. No amount is due at the end of the period for credit to Investor Protection and Education fund.
Note 13. Current financial assets : Loans Current financial assets : Loans (` In Lakhs)
ParticularsAs at As at
3131stst March, 2022 March, 2022As at
31st March, 2021
Loanstoemployees[Unsecured,consideredgood] 24.92 18.06
Employeeadvance[Unsecured,consideredgood] 13.13 0.83
Total 38.05 18.89
Note 14. Current financial assets : Others Current financial assets : Others (` In Lakhs)
ParticularsAs at As at
3131stst March, 2022 March, 2022As at
31st March, 2021
Insurance claim receivable 4.53 35.49
Balances with Tax authorities 211.79 98.32
Foreign Currency Forward contracts - 53.04
Securityandotherdeposits[Unsecured,consideredgood] 80.89 68.70
Total 297.21 255.54
143
Corporate Overview Notice Statutory Reports Financial StatementsFinancial Statements
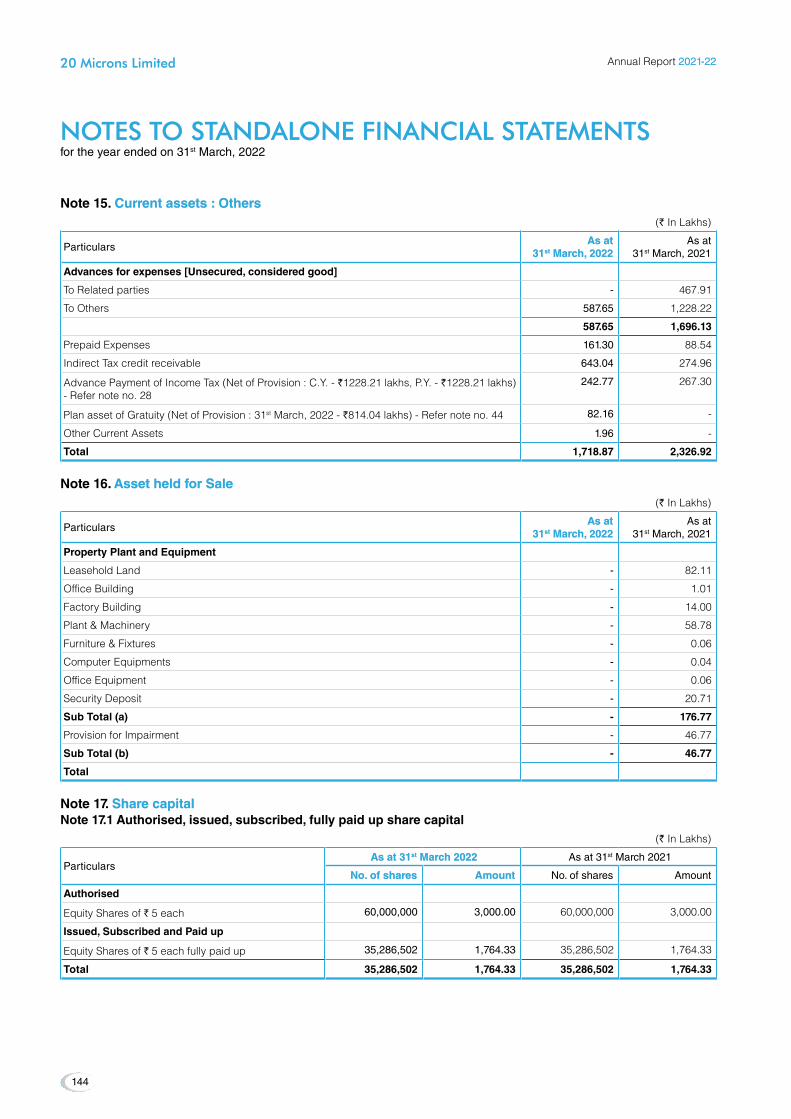
NOTES TO STANDALONE FINANCIAL STATEMENTS NOTES TO STANDALONE FINANCIAL STATEMENTS for the year ended on 31st March, 2022
Note 15. Current assets : Others Current assets : Others (` In Lakhs)
ParticularsAs atAs at
3131stst March, 2022 March, 2022As at
31st March, 2021
Advances for expenses [Unsecured, considered good]
To Related parties - 467.91
To Others 587.65 1,228.22
587.65 1,696.13
Prepaid Expenses 161.30 88.54
Indirect Tax credit receivable 643.04 274.96
Advance Payment of Income Tax (Net of Provision : C.Y. - `1228.21 lakhs, P.Y. - `1228.21 lakhs) - Refer note no. 28
242.77 267.30
Plan asset of Gratuity (Net of Provision : 31st March, 2022 - `814.04 lakhs) - Refer note no. 44 82.16 -
Other Current Assets 1.96 -
Total 1,718.87 2,326.92
Note 16. Asset held for Sale Asset held for Sale (` In Lakhs)
ParticularsAs at As at
3131stst March, 2022 March, 2022As at
31st March, 2021
Property Plant and equipment
Leasehold Land - 82.11
Office Building - 1.01
Factory Building - 14.00
Plant & Machinery - 58.78
Furniture & Fixtures - 0.06
Computer Equipments - 0.04
Office Equipment - 0.06
SecurityDeposit - 20.71
Sub Total (a) - 176.77
Provision for Impairment - 46.77
Sub Total (b) - 46.77
Total
Note 17. Share capital Share capital Note 17.1 Authorised, issued, subscribed, fully paid up share capital
(` In Lakhs)
Particulars As at 31 As at 31stst March 2022 March 2022 As at 31st March 2021
No. of sharesNo. of shares AmountAmount No. of shares Amount
Authorised
Equity Shares of ` 5 each 60,000,000 3,000.00 60,000,000 3,000.00
Issued, Subscribed and Paid up
Equity Shares of ` 5 each fully paid up 35,286,502 1,764.33 35,286,502 1,764.33
Total 35,286,502 1,764.33 35,286,502 1,764.33
Annual Report 2021-222021-22
144
20 Microns Limited20 Microns Limited

NOTES TO STANDALONE FINANCIAL STATEMENTS NOTES TO STANDALONE FINANCIAL STATEMENTS for the year ended on 31st March, 2022
Note 17.2 Reconciliation of shares outstanding at the beginning and at the end of the reporting period(` In Lakhs)
Particulars
As at 31 As at 31stst March 2022 March 2022 As at 31st March 2021
equity Shares of equity Shares of `̀ 5 each fully paid 5 each fully paid Equity Shares of ` 5 each fully paid
No. of sharesNo. of shares AmountAmount No. of shares Amount
Shares outstanding at the beginning of the period 35,286,502 1,764.33 35,286,502 1,764.33
Shares outstanding at the end of the period 35,286,502 1,764.33 35,286,502 1,764.33
Note 17.3 Terms/ rights attached to equity shares i The Company has only one class of shares referred to as equity shares having a par value of ` 5 each.
ii Each holder of equity shares is entitled to one vote per share which can be exercised either personally or by an attorney or by proxy.
iii ThedividendproposedifanybytheBoardofDirectorsissubjecttoapprovaloftheshareholdersintheensuinggeneralmeetingexcept in the case of interim dividend.
iv In the event of liquidation of the Company, the holders of equity shares shall be entitled to receive assets of the Company, after distribution of all preferential amounts. The amount distributed will be in proportion to the number of equity shares held by the shareholders.
Note 17.4 Shareholders holding more than 5 % of total share capital(` In Lakhs)
Name of Shareholder
As at 31 As at 31stst March 2022 March 2022 As at 31st March 2021
No. of No. of Shares heldShares held
% of Holding % of Holding No. of
Shares held% of Holding
Equity Shares of ` 5 each fully paid
Eriez Industries Private Limited 8,591,838 24.35% 8,591,838 24.35%
Late Shri Chandresh S. Parikh 3,727,246 10.56% 3,790,728 10.74%
Pratik Minerals Private Limited NA NA 3,036,206 8.60%
Total 12,319,084 34.91% 15,418,772 43.70%
Note 17.4.1 Equity shares held by Late Shri Chandresh S. Parikh is in the process of transfer to legal heirs as per the succession agreement.
Disclosures of Shareholding of Promoters - Shares held by the Promoters:
(` In Lakhs)
Promoter nameClass of Shares
As at 31 As at 31stst March 2022 March 2022 As at 31st March 2021 % Change during the
yearNo. of No. of
Shares heldShares held% of % of
Holding Holding No. of
Shares held% of Holding
Chandresh S. Parikh Equity 3,727,246 10.56% 3,790,728 10.74% -1.67%
Atil Chandresh Parikh Equity 1,700,739 4.82% 1,700,739 4.82% 0.00%
Rajesh Chandresh Parikh Equity 1,701,714 4.82% 1,701,714 4.82% 0.00%
Ilaben Chandresh Parikh Equity 97,482 0.28% 34,000 0.10% 186.71%
Vedika Rajesh Parikh Equity 2 - - - -
Eriez Industries Private Limited Equity 8,591,838 24.35% 8,591,838 24.35% 0.00%
Note 17.6 The Company has not bought back any equity shares, has not allotted any shares as fully paid up pursuant to contracts without payment being received in cash and has not allotted bonus shares, for the period of five years immediately preceding 31st March, 2022.
145
Corporate Overview Notice Statutory Reports Financial StatementsFinancial Statements

NOTES TO STANDALONE FINANCIAL STATEMENTS NOTES TO STANDALONE FINANCIAL STATEMENTS for the year ended on 31st March, 2022
Note 18. OTHeR eQUITY OTHeR eQUITY (` In Lakhs)
ParticularsAs at As at
3131stst March, 2022 March, 2022As at
31st March, 2021
(A)(A) Reserves & SurplusReserves & Surplus
a. General Reserve
Opening Balance 120.54 120.54
Closing Balance 120.54 120.54
b. Securities Premium Account
Opening Balance 3,980.33 3,980.33
Closing Balance 3,980.33 3,980.33
c. Retained earnings
Opening balance 13,884.96 11,585.02
Add: Profit during the year 3,086.95 2,245.15
Add: Remeasurements of post-employment benefit obligation, net of tax 9.17 54.79
Closing Balance 16,981.08 13,884.96
Total (A) 21,081.95 17,985.83
(B)(B) equity instrument through OCIequity instrument through OCI
Opening Balance 160.05 (109.56)
Change in fair value of equity instrument 451.32 351.49
Income tax relating to above item (105.14) (81.88)
Total (B) 506.23 160.05
Total other equity (A+B) 21,588.18 18,145.88
Nature and purpose of reserves :a. General reservea. General reserve The general reserve is used from time to time to transfer profits from retained earnings for appropriation purpose. As the general
reserve is created by transfer from one component of equity to another and is not an item of other comprehensive income, items included in the general reserve will not be reclassified subsequently to profit and loss.
b. Securities Premium Accountb. Securities Premium Account Securities premium account represent the premium received at the time of issue of equity share capital.
c. Retained earningsc. Retained earnings Retained earnings represents surplus / accumulated earnings of the company available for distribution to shareholders.
d. equity instrument through OCId. equity instrument through OCI The Company has elected to recognise changes in the fair value of certain investments in equity securities in other comprehensive
income. These changes are accumulated within the Equity instrument through OCI reserve within equity.
Note 19. Non- current financial liabilities : Borrowings Non- current financial liabilities : Borrowings (` In Lakhs)
Particulars As at 31 As at 31stst March 2022 March 2022 As at 31st March 2021
Non-CurrentNon-Current Current*Current* Non-Current Current*SecuredTerm Loan from Banks 1,119.84 503.97 737.76 500.08 Total secured borrowing [A] 1,119.84 503.97 737.76 500.08 UnsecuredDepositsFrom Public & Members 1,528.03 820.91 1,288.20 913.45 From Related Parties 94.00 6.00 152.00 12.00 Total unsecured borrowing [B] 1,622.03 826.91 1,440.20 925.45 TOTAL [A+B] 2,741.87 1,330.88 2,177.96 1,425.53
*Amount disclosed under the head “Current financial liabilities : Borrowings” (Note 23)
Annual Report 2021-222021-22
146
20 Microns Limited20 Microns Limited
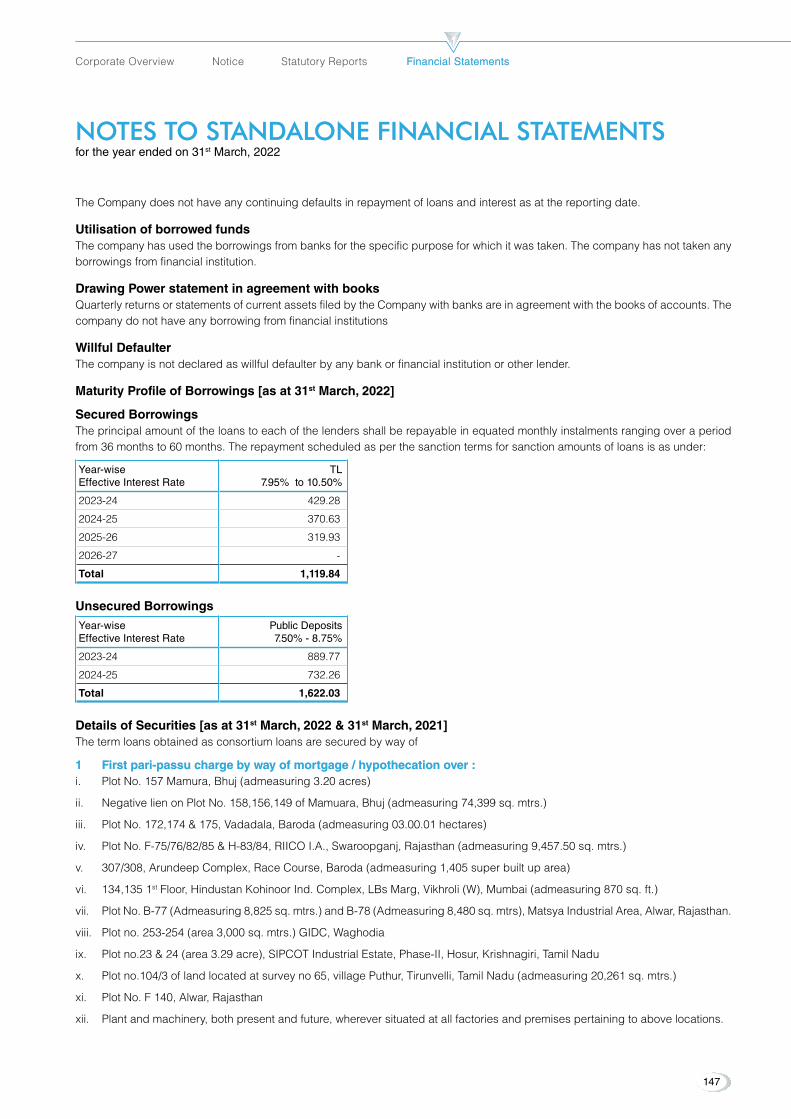
NOTES TO STANDALONE FINANCIAL STATEMENTS NOTES TO STANDALONE FINANCIAL STATEMENTS for the year ended on 31st March, 2022
The Company does not have any continuing defaults in repayment of loans and interest as at the reporting date.
Utilisation of borrowed fundsThe company has used the borrowings from banks for the specific purpose for which it was taken. The company has not taken any borrowings from financial institution.
Drawing Power statement in agreement with booksQuarterly returns or statements of current assets filed by the Company with banks are in agreement with the books of accounts. The company do not have any borrowing from financial institutions
Willful DefaulterThe company is not declared as willful defaulter by any bank or financial institution or other lender.
Maturity Profile of Borrowings [as at 31st March, 2022]
Secured BorrowingsThe principal amount of the loans to each of the lenders shall be repayable in equated monthly instalments ranging over a period from 36 months to 60 months. The repayment scheduled as per the sanction terms for sanction amounts of loans is as under:
Year-wise Effective Interest Rate
TL7.95% to 10.50%
2023-24 429.28
2024-25 370.63
2025-26 319.93
2026-27 -
Total 1,119.84
Unsecured BorrowingsYear-wise Effective Interest Rate
Public Deposits 7.50% - 8.75%
2023-24 889.77
2024-25 732.26
Total 1,622.03
Details of Securities [as at 31st March, 2022 & 31st March, 2021]The term loans obtained as consortium loans are secured by way of
1 First pari-passu charge by way of mortgage / hypothecation over :1 First pari-passu charge by way of mortgage / hypothecation over :i. Plot No. 157 Mamura, Bhuj (admeasuring 3.20 acres)
ii. Negative lien on Plot No. 158,156,149 of Mamuara, Bhuj (admeasuring 74,399 sq. mtrs.)
iii. Plot No. 172,174 & 175, Vadadala, Baroda (admeasuring 03.00.01 hectares)
iv. Plot No. F-75/76/82/85 & H-83/84, RIICO I.A., Swaroopganj, Rajasthan (admeasuring 9,457.50 sq. mtrs.)
v. 307/308, Arundeep Complex, Race Course, Baroda (admeasuring 1,405 super built up area)
vi. 134,135 1st Floor, Hindustan Kohinoor Ind. Complex, LBs Marg, Vikhroli (W), Mumbai (admeasuring 870 sq. ft.)
vii. Plot No. B-77 (Admeasuring 8,825 sq. mtrs.) and B-78 (Admeasuring 8,480 sq. mtrs), Matsya Industrial Area, Alwar, Rajasthan.
viii. Plotno.253-254(area3,000sq.mtrs.)GIDC,Waghodia
ix. Plot no.23 & 24 (area 3.29 acre), SIPCOT Industrial Estate, Phase-II, Hosur, Krishnagiri, Tamil Nadu
x. Plot no.104/3 of land located at survey no 65, village Puthur, Tirunvelli, Tamil Nadu (admeasuring 20,261 sq. mtrs.)
xi. Plot No. F 140, Alwar, Rajasthan
xii. Plant and machinery, both present and future, wherever situated at all factories and premises pertaining to above locations.
147
Corporate Overview Notice Statutory Reports Financial StatementsFinancial Statements

NOTES TO STANDALONE FINANCIAL STATEMENTS NOTES TO STANDALONE FINANCIAL STATEMENTS for the year ended on 31st March, 2022
2 Second pari-passu charge by way of mortgage / hypothecation over :2 Second pari-passu charge by way of mortgage / hypothecation over : Current assets, both present and future, wherever situated, but pertaining to the division/factory/premises at Vadadala, Waghodia
and Bhuj (all in Gujarat), Alwar and Swaroopganj (both in Rajasthan), Hosur and Tirunvelli (both in Tamil Nadu) and Vikhroli (W), Mumbai.
33 All the term loans are further collaterally secured by personal guarantee of whole time directors & corporate guarantee by “Eriez Industries Private Limited”, a company where significant influence exists.
44 Term loans having from bank includes loans obtained for acquisition of vehicles having outstanding balance of Nil (31st March, 2021: ` 52.95 Lakhs) are secured only by the hypothecation of the respective assets financed.Note 12. C
Note 20. Other Non Current Financial Liabilities Other Non Current Financial Liabilities (` In Lakhs)
ParticularsAs at As at
3131stst March, 2022 March, 2022As at
31st March, 2021
SecurityDeposits 25.92 22.46
Total 25.92 22.46
Note 21. Deferred tax Liabilities Deferred tax Liabilities(a) Deferred tax balances and movement for FY 2021-22
(` In Lakhs)
ParticularsAs at
April 1, 2021Recognised in
profit or lossRecognised
in OCIOther
As atAs at 3131stst March, 2022 March, 2022
Deferred tax Liabilities
Property, plant and equipment and Intangible Assets
2,266.62 47.46 - - 2,314.09
Investments 73.88 (1.18) 105.14 - 177.85
Loans and borrowings 18.81 (9.18) - - 9.63
Total 2,359.31 37.11 105.14 - 2,501.56
Deferred tax asset
Employee benefits 11.77 (29.36) (3.08) - (20.68)
Provisions 44.61 (3.61) - - 40.99
Disallowanceu/s43BofIncomeTaxAct,1961 6.03 0.35 - - 6.39
Impairment loss on asset held for sale 11.77 (11.77) - - -
Lease liability 48.38 3.02 - - 51.40
Total 122.56 (41.38) (3.08) - 78.10
Net deferred tax Liabilities 2,236.75 78.49 108.22 - 2,423.46
The company offsets tax assets and liabilities if and only if it has a legally enforceable right to set off current tax assets and current tax liabilities and the deferred tax assets and deferred tax liabilities relate to income taxes levied by the same tax authority.
Significant management judgment is required in determining provision for income tax, deferred income tax assets and liabilities and recoverability of deferred income tax assets. The recoverability of deferred income tax assets is based on estimates of taxable income by each jurisdiction in which the relevant entity operates and the period over which deferred income tax assets will be recovered.
Annual Report 2021-222021-22
148
20 Microns Limited20 Microns Limited
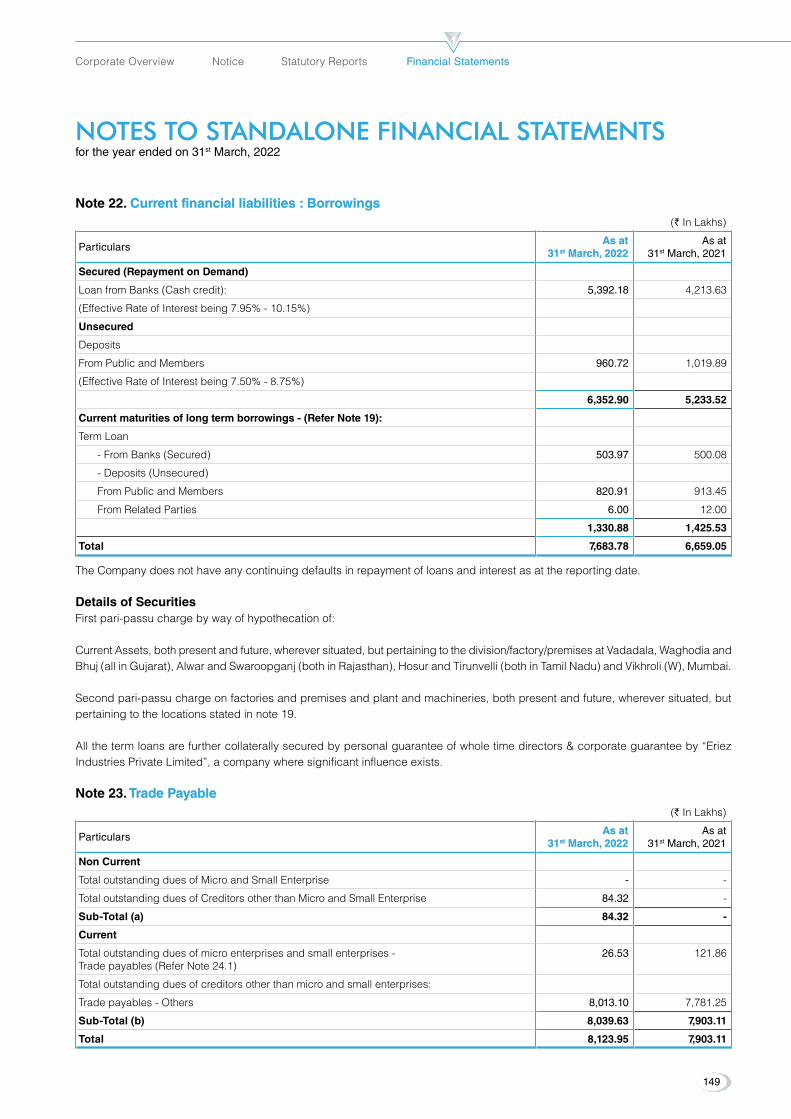
NOTES TO STANDALONE FINANCIAL STATEMENTS NOTES TO STANDALONE FINANCIAL STATEMENTS for the year ended on 31st March, 2022
Note 22. Current financial liabilities : Borrowings Current financial liabilities : Borrowings (` In Lakhs)
ParticularsAs atAs at
3131stst March, 2022 March, 2022As at
31st March, 2021
Secured (Repayment on Demand)
Loan from Banks (Cash credit): 5,392.18 4,213.63
(Effective Rate of Interest being 7.95% - 10.15%)
Unsecured
Deposits
From Public and Members 960.72 1,019.89
(Effective Rate of Interest being 7.50% - 8.75%)
6,352.90 5,233.52
Current maturities of long term borrowings - (Refer Note 19):
Term Loan
- From Banks (Secured) 503.97 500.08
-Deposits(Unsecured)
From Public and Members 820.91 913.45
From Related Parties 6.00 12.00
1,330.88 1,425.53
Total 7,683.78 6,659.05
The Company does not have any continuing defaults in repayment of loans and interest as at the reporting date.
Details of SecuritiesFirst pari-passu charge by way of hypothecation of:
Current Assets, both present and future, wherever situated, but pertaining to the division/factory/premises at Vadadala, Waghodia and Bhuj (all in Gujarat), Alwar and Swaroopganj (both in Rajasthan), Hosur and Tirunvelli (both in Tamil Nadu) and Vikhroli (W), Mumbai.
Second pari-passu charge on factories and premises and plant and machineries, both present and future, wherever situated, but pertaining to the locations stated in note 19.
All the term loans are further collaterally secured by personal guarantee of whole time directors & corporate guarantee by “Eriez Industries Private Limited”, a company where significant influence exists.
Note 23. Trade Payable Trade Payable (` In Lakhs)
ParticularsAs at As at
3131stst March, 2022 March, 2022As at
31st March, 2021
Non Current
Total outstanding dues of Micro and Small Enterprise - -
Total outstanding dues of Creditors other than Micro and Small Enterprise 84.32 -
Sub-Total (a) 84.32 -
Current
Total outstanding dues of micro enterprises and small enterprises - Trade payables (Refer Note 24.1)
26.53 121.86
Total outstanding dues of creditors other than micro and small enterprises:
Trade payables - Others 8,013.10 7,781.25
Sub-Total (b) 8,039.63 7,903.11
Total 8,123.95 7,903.11
149
Corporate Overview Notice Statutory Reports Financial StatementsFinancial Statements

NOTES TO STANDALONE FINANCIAL STATEMENTS NOTES TO STANDALONE FINANCIAL STATEMENTS for the year ended on 31st March, 2022
Note 23.1 The details of amount outstanding to Micro, Small and Medium Enterprises under the Micro, Small and Medium Enterprises DevelopmentAct,2006(MSMEDAct),basedontheavailableinformationwiththeCompanyareasunder:
(` In Lakhs)
ParticularsAs at As at
3131stst March, 2022 March, 2022As at
31st March, 2021
the principal amount remaining unpaid to any supplier at the end of each accounting year 26.53 121.86
Interest due on (1) above and remaining unpaid as at the end of accounting period 0.22 1.17
the amount of interest paid by the buyer in terms of section 16 of the Micro, Small and Medium EnterprisesDevelopmentAct,2006(27of2006),alongwiththeamountofthepaymentmadetothe supplier beyond the appointed day during each accounting year Interest paid on all delayed paymentsunderMSMEDAct,2006
- -
the amount of interest due and payable for the period of delay in making payment (which has been paid but beyond the appointed day during the year) but without adding the interest specified undertheMicro,SmallandMediumEnterprisesDevelopmentAct,2006;
- -
the amount of further interest remaining due and payable even in the succeeding years, until such date when the interest dues above are actually paid to the small enterprise, for the purpose of disallowance of a deductible expenditure under section 23 of the Micro, Small and Medium EnterprisesDevelopmentAct,2006
- -
Trade Payable ageing schedule: As on 31st March 2022:
(` In Lakhs)
Particulars
Outstanding for following period from due date of paymentOutstanding for following period from due date of paymentTotalTotal
UnbilledUnbilled Not DueNot DueLess than Less than
1 Year1 Year1-2 years1-2 years 2-3 years2-3 years
More than More than 3 years3 years
(i) MSME - - 26.53 - - - 26.53
(ii) Others - - 8,066.67 12.06 18.70 - 8,097.42
(iii) Disputeddues-MSME - - - - - - -
(iv)Disputeddues-Others - - - - - - -
(v) Unbilled - - - - - - -
Total - - 8,093.19 12.06 18.70 - 8,123.95
As on 31st March 2021:(` In Lakhs)
Particulars
Outstanding for following period from due date of payment
TotalUnbilled Not Due
Less than 1 Year
1-2 years 2-3 yearsMore than
3 years
(i) MSME - - 121.86 - - - 121.86
(ii) Others - - 7,750.68 27.31 2.73 0.53 7,781.25
(iii) Disputeddues-MSME - - - - - - -
(iv)Disputeddues-Others - - - - - - -
(v) Unbilled - - - - - - -
Total - - 7,872.54 27.31 2.73 0.53 7,903.11
Note - Above ageing was made from the date of transactions where due dates were not available
Annual Report 2021-222021-22
150
20 Microns Limited20 Microns Limited
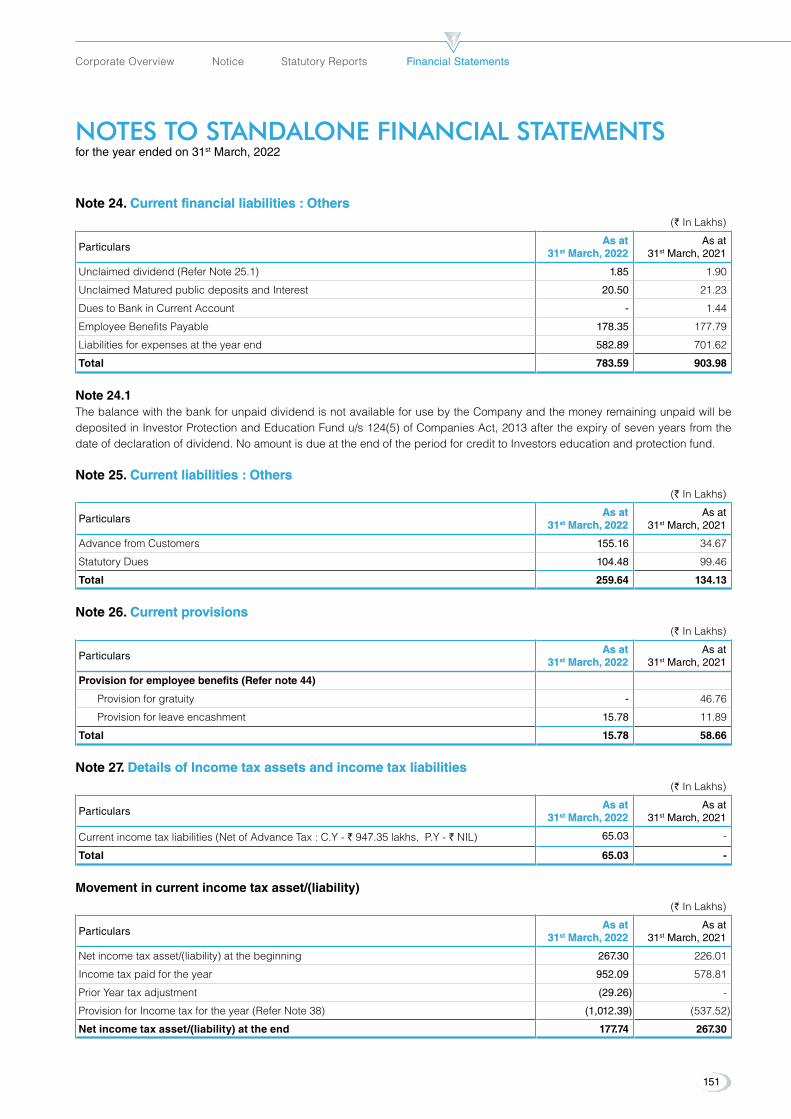
NOTES TO STANDALONE FINANCIAL STATEMENTS NOTES TO STANDALONE FINANCIAL STATEMENTS for the year ended on 31st March, 2022
Note 24. Current financial liabilities : Others Current financial liabilities : Others (` In Lakhs)
ParticularsAs at As at
3131stst March, 2022 March, 2022As at
31st March, 2021
Unclaimeddividend(ReferNote25.1) 1.85 1.90
UnclaimedMaturedpublicdepositsandInterest 20.50 21.23
DuestoBankinCurrentAccount - 1.44
Employee Benefits Payable 178.35 177.79
Liabilities for expenses at the year end 582.89 701.62
Total 783.59 903.98
Note 24.1 The balance with the bank for unpaid dividend is not available for use by the Company and the money remaining unpaid will be deposited in Investor Protection and Education Fund u/s 124(5) of Companies Act, 2013 after the expiry of seven years from the date of declaration of dividend. No amount is due at the end of the period for credit to Investors education and protection fund.
Note 25. Current liabilities : Others Current liabilities : Others (` In Lakhs)
ParticularsAs at As at
3131stst March, 2022 March, 2022As at
31st March, 2021
Advance from Customers 155.16 34.67
StatutoryDues 104.48 99.46
Total 259.64 134.13
Note 26. Current provisions Current provisions (` In Lakhs)
ParticularsAs at As at
3131stst March, 2022 March, 2022As at
31st March, 2021
Provision for employee benefits (Refer note 44)
Provision for gratuity - 46.76
Provision for leave encashment 15.78 11.89
Total 15.78 58.66
Note 27. Details of Income tax assets and income tax liabilities Details of Income tax assets and income tax liabilities (` In Lakhs)
ParticularsAs at As at
3131stst March, 2022 March, 2022As at
31st March, 2021
Current income tax liabilities (Net of Advance Tax : C.Y - ` 947.35 lakhs, P.Y - ` NIL) 65.03 -
Total 65.03 -
Movement in current income tax asset/(liability) (` In Lakhs)
ParticularsAs at As at
3131stst March, 2022 March, 2022As at
31st March, 2021
Net income tax asset/(liability) at the beginning 267.30 226.01
Income tax paid for the year 952.09 578.81
Prior Year tax adjustment (29.26) -
Provision for Income tax for the year (Refer Note 38) (1,012.39) (537.52)
Net income tax asset/(liability) at the end 177.74 267.30
151
Corporate Overview Notice Statutory Reports Financial StatementsFinancial Statements
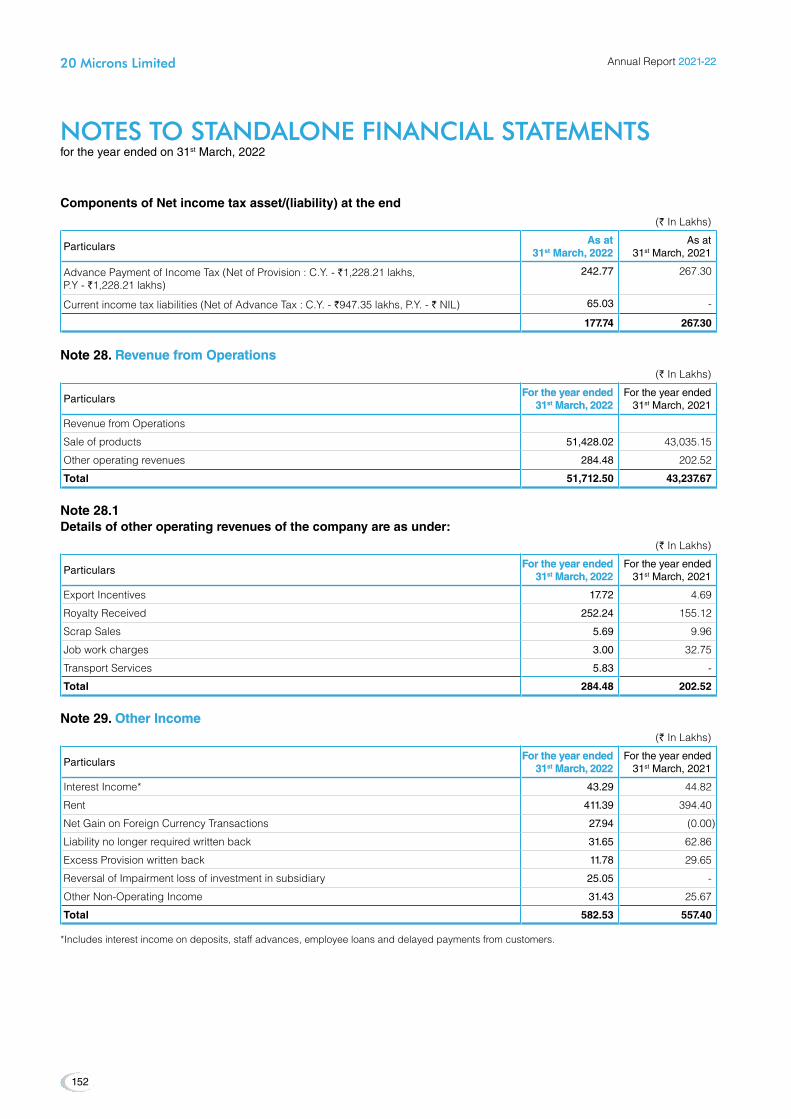
Components of Net income tax asset/(liability) at the end (` In Lakhs)
ParticularsAs at As at
3131stst March, 2022 March, 2022As at
31st March, 2021
Advance Payment of Income Tax (Net of Provision : C.Y. - `1,228.21 lakhs, P.Y - `1,228.21 lakhs)
242.77 267.30
Current income tax liabilities (Net of Advance Tax : C.Y. - `947.35 lakhs, P.Y. - ` NIL) 65.03 -
177.74 267.30
Note 28. Revenue from Operations Revenue from Operations (` In Lakhs)
ParticularsFor the year endedFor the year ended
3131stst March, 2022 March, 2022For the year ended
31st March, 2021
Revenue from Operations
Sale of products 51,428.02 43,035.15
Other operating revenues 284.48 202.52
Total 51,712.50 43,237.67
Note 28.1Details of other operating revenues of the company are as under:
(` In Lakhs)
ParticularsFor the year endedFor the year ended
3131stst March, 2022 March, 2022For the year ended
31st March, 2021
Export Incentives 17.72 4.69
Royalty Received 252.24 155.12
Scrap Sales 5.69 9.96
Job work charges 3.00 32.75
Transport Services 5.83 -
Total 284.48 202.52
Note 29. Other Income Other Income (` In Lakhs)
ParticularsFor the year endedFor the year ended
3131stst March, 2022 March, 2022For the year ended
31st March, 2021
Interest Income* 43.29 44.82
Rent 411.39 394.40
Net Gain on Foreign Currency Transactions 27.94 (0.00)
Liability no longer required written back 31.65 62.86
Excess Provision written back 11.78 29.65
Reversal of Impairment loss of investment in subsidiary 25.05 -
Other Non-Operating Income 31.43 25.67
Total 582.53 557.40
*Includes interest income on deposits, staff advances, employee loans and delayed payments from customers.
NOTES TO STANDALONE FINANCIAL STATEMENTS NOTES TO STANDALONE FINANCIAL STATEMENTS for the year ended on 31st March, 2022
Annual Report 2021-222021-22
152
20 Microns Limited20 Microns Limited
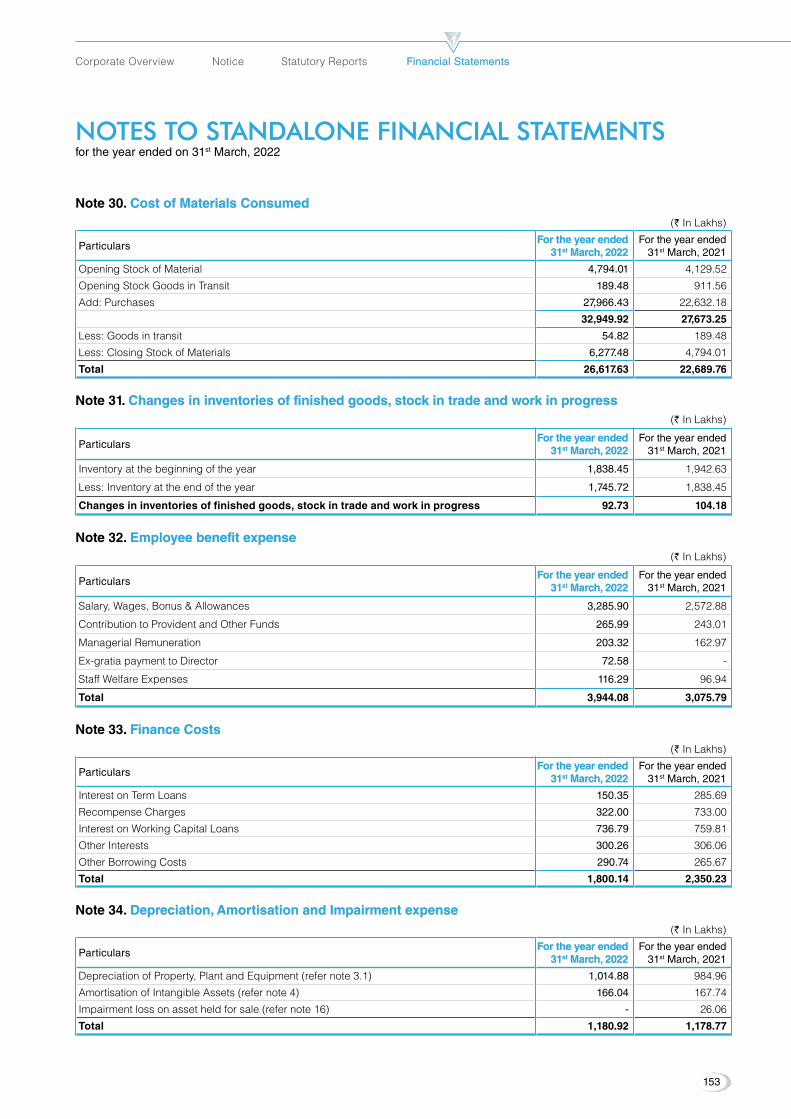
NOTES TO STANDALONE FINANCIAL STATEMENTS NOTES TO STANDALONE FINANCIAL STATEMENTS for the year ended on 31st March, 2022
Note 30. Cost of Materials Consumed Cost of Materials Consumed (` In Lakhs)
ParticularsFor the year endedFor the year ended
3131stst March, 2022 March, 2022For the year ended
31st March, 2021
Opening Stock of Material 4,794.01 4,129.52
Opening Stock Goods in Transit 189.48 911.56
Add: Purchases 27,966.43 22,632.18
32,949.92 27,673.25
Less: Goods in transit 54.82 189.48
Less: Closing Stock of Materials 6,277.48 4,794.01
Total 26,617.63 22,689.76
Note 31. Changes in inventories of finished goods, stock in trade and work in progress Changes in inventories of finished goods, stock in trade and work in progress (` In Lakhs)
ParticularsFor the year endedFor the year ended
3131stst March, 2022 March, 2022For the year ended
31st March, 2021
Inventory at the beginning of the year 1,838.45 1,942.63
Less: Inventory at the end of the year 1,745.72 1,838.45
Changes in inventories of finished goods, stock in trade and work in progress 92.73 104.18
Note 32. employee benefit expense employee benefit expense (` In Lakhs)
ParticularsFor the year endedFor the year ended
3131stst March, 2022 March, 2022For the year ended
31st March, 2021
Salary, Wages, Bonus & Allowances 3,285.90 2,572.88
Contribution to Provident and Other Funds 265.99 243.01
Managerial Remuneration 203.32 162.97
Ex-gratiapaymenttoDirector 72.58 -
Staff Welfare Expenses 116.29 96.94
Total 3,944.08 3,075.79
Note 33. Finance Costs Finance Costs (` In Lakhs)
ParticularsFor the year endedFor the year ended
3131stst March, 2022 March, 2022For the year ended
31st March, 2021
Interest on Term Loans 150.35 285.69
Recompense Charges 322.00 733.00
Interest on Working Capital Loans 736.79 759.81
Other Interests 300.26 306.06
Other Borrowing Costs 290.74 265.67
Total 1,800.14 2,350.23
Note 34. Depreciation, Amortisation and Impairment expense Depreciation, Amortisation and Impairment expense (` In Lakhs)
ParticularsFor the year endedFor the year ended
3131stst March, 2022 March, 2022For the year ended
31st March, 2021
DepreciationofProperty,PlantandEquipment(refernote3.1) 1,014.88 984.96
Amortisation of Intangible Assets (refer note 4) 166.04 167.74
Impairment loss on asset held for sale (refer note 16) - 26.06
Total 1,180.92 1,178.77
153
Corporate Overview Notice Statutory Reports Financial StatementsFinancial Statements

NOTES TO STANDALONE FINANCIAL STATEMENTS NOTES TO STANDALONE FINANCIAL STATEMENTS for the year ended on 31st March, 2022
Note 35. Other expenses Other expenses (` In Lakhs)
ParticularsFor the year endedFor the year ended
3131stst March, 2022 March, 2022For the year ended
31st March, 2021
Note 35.1
Manufacturing expenses
Consumption of Stores and Spare Parts 646.28 515.98
Power and Fuel 3,775.82 3,046.72
Rent 84.51 125.57
Repairs :
Buildings 24.27 14.16
Plant and Machinery 206.41 229.19
DetentionandDemurrage - 600.19
Other Manufacturing & Factory Expenses 286.02 288.10
Sub Total (A) 5,023.30 4,819.90
Note 35.2
Administrative & Other expenses
Rent 9.00 11.56
Rates & Taxes 7.45 7.30
Insurance 87.88 78.28
Post, Telephone & Courier 72.43 66.14
Printing and Stationary expenses 20.74 22.18
Legal, Licenses and Renewal expenses 36.37 53.18
Software and Computer Maintenance 42.42 68.25
Travelling & Conveyance 87.86 56.40
Vehicle Running & Maintenance 81.57 64.50
Professional Fees 147.77 119.41
Auditors Remuneration (refer note 36.4) 9.64 9.49
DirectorsSittingFees 11.25 9.50
LossonDisposalofTangibleAssets(Net) 6.55 39.09
Donation 0.42 0.01
RemissionofDebitbalance 13.89 9.72
Provision for Impairment loss of investment in subsidiary - 25.05
Impairment in asset held for sale (electricity deposit) - 20.71
Fine and penalty 1.72 8.56
Miscellaneous Expenses 133.36 115.21
Loss on Foreign Currency Transactions - 14.31
CSR Expenditure (refer note no. 37) 57.88 79.42
Sub Total (B) 828.20 878.29
Note 35.3
Marketing, Selling & Distribution expenses :
Selling Expenses
Travelling Expenses 188.11 155.02
Sales Commission 73.18 70.09
BadDebtswrittenoff 11.85 9.63
Rent 178.91 83.61
Other Selling Expenses 117.64 119.60
Annual Report 2021-222021-22
154
20 Microns Limited20 Microns Limited

NOTES TO STANDALONE FINANCIAL STATEMENTS NOTES TO STANDALONE FINANCIAL STATEMENTS for the year ended on 31st March, 2022
(` In Lakhs)
ParticularsFor the year endedFor the year ended
3131stst March, 2022 March, 2022For the year ended
31st March, 2021
Distribution expenses
FreightandLogisticExpenses(Domestic) 5,419.58 4,779.95
Freight and Logistic Expenses (Export) 2,611.69 1,372.59
Sub Total (c) 8,600.94 6,620.49
Total 14,452.45 12,318.68
Note 35.4Payment to Auditors
(` In Lakhs)
ParticularsFor the year endedFor the year ended
3131stst March, 2022 March, 2022For the year ended
31st March, 2021
Audit Fees 8.70 8.70
In Other Capacity 0.48 0.71
Out of Pocket Expense 0.47 0.08
Total 9.64 9.49
Note 36. Corporate Social Responsibilty Corporate Social Responsibilty (` In Lakhs)
ParticularsFor the year endedFor the year ended
3131stst March, 2022 March, 2022For the year ended
31st March, 2021
Gross amount required to be spent by the company during the year 64.00 65.32
Excess Amount spent in last year carried forward to this financial year 14.10 -
Amount spend and paid on CSR activities included in the statement of profit and loss for the year 57.88 79.42
Amount utilised from amount carried forward from last year 6.12 -
Amount carried forward to Next year 7.98 14.10
Spend details
Promoting healthcare and environment 57.88 79.42
Chief minister distress relief fund - -
Rural development and education promotion - -
Contribution to trust controlled by the Company (refer note - 44.2) 43.60 44.85
Note 37. Tax expense Tax expense (a) Amounts recognised in profit and loss
(` In Lakhs)
ParticularsFor the year endedFor the year ended
3131stst March, 2022 March, 2022For the year ended
31st March, 2021
Current Tax
(a) Current income tax 1,012.39 537.52
(b) Short/(Excess) provision of Income Tax in respect of previous years 29.26 -
Sub Total (a) 1,041.65 537.52
Deferred tax
(a) Deferredtaxexpense/(Income)-net
Change in Tax rate - (691.50)
Origination and reversal of temporary differences 78.49 (13.52)
758.49 (705.02)
(b) Recognition of tax credit
Sub Total (b) 78.49 (705.02)
Tax expense for the year (a+b) 1,120.14 (167.50)
155
Corporate Overview Notice Statutory Reports Financial StatementsFinancial Statements

NOTES TO STANDALONE FINANCIAL STATEMENTS NOTES TO STANDALONE FINANCIAL STATEMENTS for the year ended on 31st March, 2022
(b) Reconciliation of effective tax rate (` In Lakhs)
ParticularsFor the year endedFor the year ended
3131stst March, 2022 March, 2022For the year ended
31st March, 2021
Profit before tax 4,207.09 2,077.66
Tax using the Company’s domestic tax rate (Current year 25.17% and Previous Year 25.17%) 1,059.01 522.99
Tax effect of:
ExpensesDisallowed 353.15 384.43
Expenses Allowed (399.69) (369.90)
Short/(Excess) provision of income tax in respect of previous years 29.26 -
Tax at special rate - -
Current Tax Provision (A) 1,041.73 537.52
Increase/(Decrease)inDeferredTaxLiability 37.11 (809.74)
Decrease/(Increase)InDeferredTaxAssets 41.38 104.72
Deferred Tax Provision (B) 78.49 (705.02)
Total 1,120.21 (167.50)
The Current Tax Rate for the reconciliation has been considered as per the prevailing tax rate and deferred tax is recognised considering the tax rate applicable to the Company in subsequent years.
Note 38. Statement of other comprehensive income Statement of other comprehensive income (` In Lakhs)
ParticularsFor the year endedFor the year ended
3131stst March, 2022 March, 2022For the year ended
31st March, 2021
(i) Items that will not be reclassified to profit or loss
equity Instruments through Other Comprehensive Income
Fair value of unquoted investments - Gain /(loss) 451.32 351.49
Tax impact on unquoted investments (105.14) (81.88)
Remeasurement gains (losses) on defined benefit plans
Actuarial gains and losses - Gain /(loss) 12.25 73.22
Tax impact on Actuarial gains and losses (3.08) (18.43)
Total (i) 355.35 324.40
(ii) Items that will be reclassified to profit or loss
Income tax relating to items that will be reclassified to profit or loss - Gain /(loss) - -
Total (ii) - -
Total 355.35 324.40
Note 39. earning per Share - (ePS) earning per Share - (ePS) earnings per equity share of FV of ` 5 each Basic EPS amounts are calculated by dividing the profit for the year attributable to equity holders of the Company by the weighted average number of Equity shares outstanding during the year.
DilutedEPSamountsarecalculatedbydividingtheprofitattributabletoequityholdersoftheCompanybytheweightedaveragenumber of Equity shares outstanding during the year plus the weighted average number of Equity shares that would be issued on conversion of all the dilutive potential Equity shares into Equity shares.
Annual Report 2021-222021-22
156
20 Microns Limited20 Microns Limited

NOTES TO STANDALONE FINANCIAL STATEMENTS NOTES TO STANDALONE FINANCIAL STATEMENTS for the year ended on 31st March, 2022
The following reflects the income and share data used in the basic and diluted ePS computations:(` In Lakhs)
ParticularsFor the year endedFor the year ended
3131stst March, 2022 March, 2022For the year ended
31st March, 2021
Profit for the year (Profit attributable to equity shareholders) (` In Lakhs) 3,086.95 2,245.15
Weighted average number of ordinary equity shares for Basic EPS (in Nos.) 35,286,502 35,286,502
WeightedaveragenumberofordinaryequitysharesforDilutedEPS(inNos.) 35,286,502 35,286,502
Face Value of equity share (`) 5.00 5.00
Basic EPS (`) 8.75 6.36
DilutedEPS(`) 8.75 6.36
Note 40. Gent Liabilities & Contingent Assets and Capital Commitments Gent Liabilities & Contingent Assets and Capital Commitments A) Contingent Liabilities
(` In Lakhs)
Contingent liabilities (to the extent not provided for)As at As at
3131stst March, 2022 March, 2022As at
31st March, 2021
(a) Statutory claims (Refer Note 40.1) 388.85 410.57
(b) Claims against the company not acknowledged as debt (Refer Note 40.2) 438.51 438.51
(c) Guarantees Given to subsidiary company 1,225.00 1,225.00
Total 2,052.36 2,074.08
Note 40.1Statutory claims
(` In Lakhs)
ParticularsAs at As at
3131stst March, 2022 March, 2022As at
31st March, 2021
DemandofIncomeTax(NetofRefundadjustedandpaidunderprotest) 10.60 32.32
Labour disputed cases 378.25 378.25
VAT and CST Assessment pending at various forums for various Assessment Years Not ascertainable Not ascertainable
Total 388.85 410.57
Note 40.2 Claims against the company not acknowledged as debt
40.2.1 The Company had received an Order dated 06thAugust,2016,fromGeologyandMiningDepartment,Bhuj,Kutchforexcavatingthe mine beyond the approved lease area, situated at Survey No. 483, Mamuara, Bhuj, Kutch whereby a penalty of ` 419.13 lakhs isleviedontheCompany.CompanyhadfiledanappealagainsttheorderoftheGeologyandMiningDepartmentwiththeappellateauthority as per the rules of Gujarat Mineral (Prevention of Illegal Mining, Transportation and Storage) Rules, 2005. The appellate authority(additionaldirector[Appealandflyingsquad],videitsorderdated17th January, 2020 has passed final order and continued order dated 06th August, 2016 passed by the Geologist, Bhuj. The company Filed a REVISION application on dated 20/02/2020 to TheCommissionerShri(Geology&Mining,Gandhinagar)againsttheorderpassedbyAdditionalDirector(Appeal&FlyingSquad),Gandhinagar, dated 17/01/2020.
40.2.2Vendors of the company have made claims against company amouting to `19.38 Lakh (P.Y. - `19.38 Lakh)
B) CONTINGeNT ASSeTS The company is having certain claims which are pursuing through legal processes. The Management believe that probable
outcome in all suchclaims are uncertain. Hence, the disclosure of such claims is not required in the financial statements.
C) CAPITAL COMMITMeNTS Estimated amount of contracts remaining to be executed on capital account as on 31st March, 2022, not provided for amounting to
`322.20 Lakhs (Net of Advance `1,208.09 Lakhs) [31st March, 2021 `601.07 Lakhs (Net of Advance `363.06Lakhs)]
157
Corporate Overview Notice Statutory Reports Financial StatementsFinancial Statements
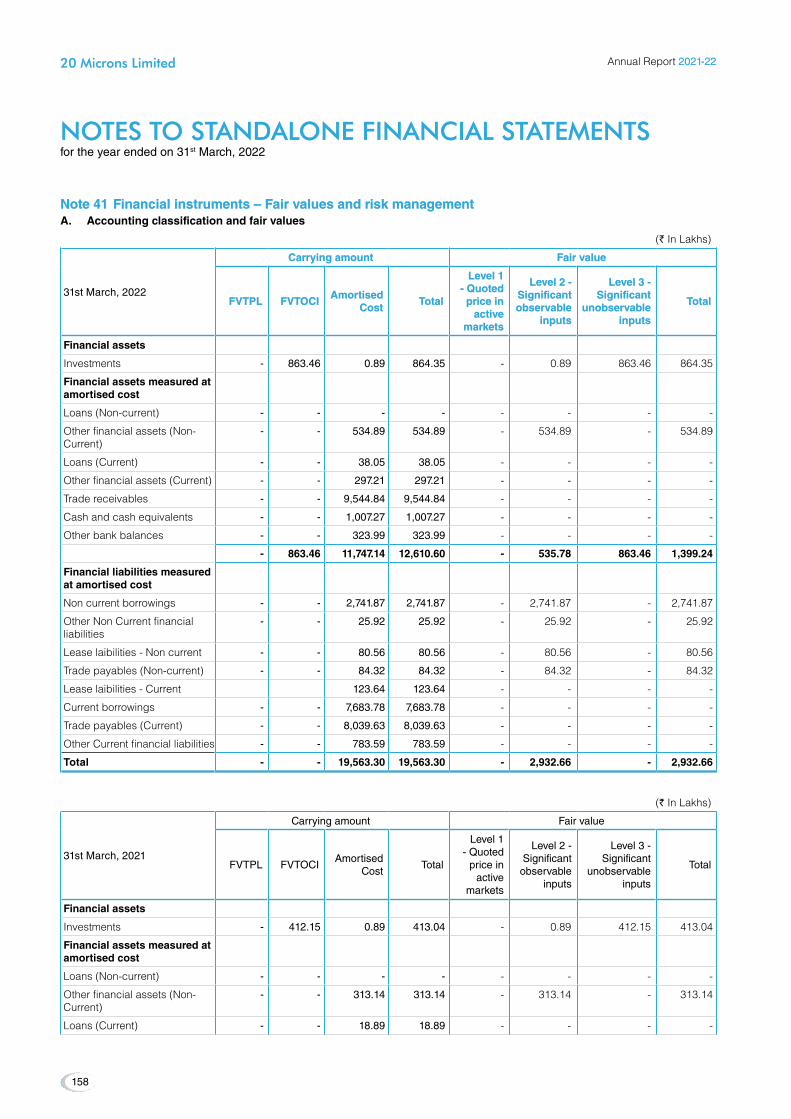
NOTES TO STANDALONE FINANCIAL STATEMENTS NOTES TO STANDALONE FINANCIAL STATEMENTS for the year ended on 31st March, 2022
Note 41 Financial instruments – Fair values and risk managementNote 41 Financial instruments – Fair values and risk managementA. Accounting classification and fair values
(` In Lakhs)
31st March, 2022
Carrying amount Carrying amount Fair value Fair value
FVTPL FVTPL FVTOCI FVTOCI Amortised Amortised
Cost Cost Total Total
Level 1 Level 1 - Quoted - Quoted price in price in
active active markets markets
Level 2 - Level 2 - Significant Significant observable observable
inputs inputs
Level 3 - Level 3 - Significant Significant
unobservable unobservable inputs inputs
Total Total
Financial assets
Investments - 863.46 0.89 864.35 - 0.89 863.46 864.35
Financial assets measured at amortised cost
Loans (Non-current) - - - - - - - -
Other financial assets (Non-Current)
- - 534.89 534.89 - 534.89 - 534.89
Loans (Current) - - 38.05 38.05 - - - -
Other financial assets (Current) - - 297.21 297.21 - - - -
Trade receivables - - 9,544.84 9,544.84 - - - -
Cash and cash equivalents - - 1,007.27 1,007.27 - - - -
Other bank balances - - 323.99 323.99 - - - -
- 863.46 11,747.14 12,610.60 - 535.78 863.46 1,399.24
Financial liabilities measured at amortised cost
Non current borrowings - - 2,741.87 2,741.87 - 2,741.87 - 2,741.87
Other Non Current financial liabilities
- - 25.92 25.92 - 25.92 - 25.92
Lease laibilities - Non current - - 80.56 80.56 - 80.56 - 80.56
Trade payables (Non-current) - - 84.32 84.32 - 84.32 - 84.32
Lease laibilities - Current 123.64 123.64 - - - -
Current borrowings - - 7,683.78 7,683.78 - - - -
Trade payables (Current) - - 8,039.63 8,039.63 - - - -
Other Current financial liabilities - - 783.59 783.59 - - - -
Total - - 19,563.30 19,563.30 - 2,932.66 - 2,932.66
(` In Lakhs)
31st March, 2021
Carrying amount Fair value
FVTPL FVTOCI Amortised
Cost Total
Level 1 - Quoted
price in active
markets
Level 2 - Significant observable
inputs
Level 3 - Significant
unobservable inputs
Total
Financial assets
Investments - 412.15 0.89 413.04 - 0.89 412.15 413.04
Financial assets measured at amortised cost
Loans (Non-current) - - - - - - - -
Other financial assets (Non-Current)
- - 313.14 313.14 - 313.14 - 313.14
Loans (Current) - - 18.89 18.89 - - - -
Annual Report 2021-222021-22
158
20 Microns Limited20 Microns Limited
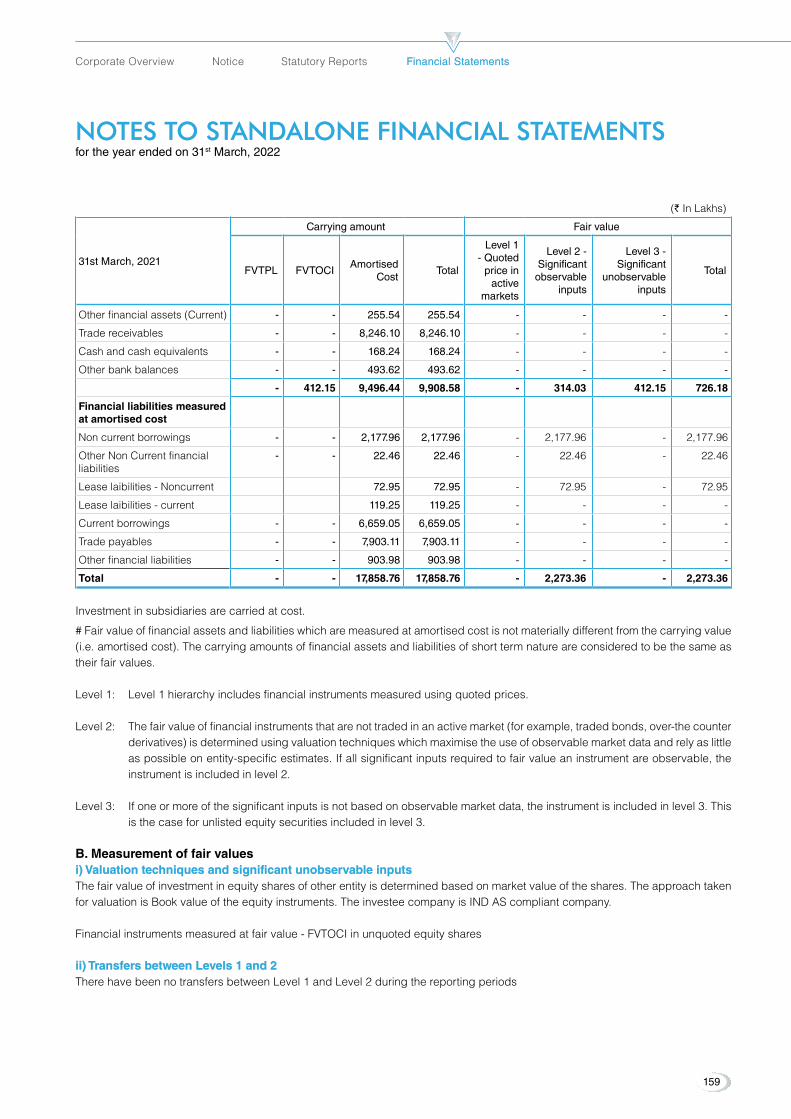
NOTES TO STANDALONE FINANCIAL STATEMENTS NOTES TO STANDALONE FINANCIAL STATEMENTS for the year ended on 31st March, 2022
(` In Lakhs)
31st March, 2021
Carrying amount Fair value
FVTPL FVTOCI Amortised
Cost Total
Level 1 - Quoted
price in active
markets
Level 2 - Significant observable
inputs
Level 3 - Significant
unobservable inputs
Total
Other financial assets (Current) - - 255.54 255.54 - - - -
Trade receivables - - 8,246.10 8,246.10 - - - -
Cash and cash equivalents - - 168.24 168.24 - - - -
Other bank balances - - 493.62 493.62 - - - -
- 412.15 9,496.44 9,908.58 - 314.03 412.15 726.18
Financial liabilities measured at amortised cost
Non current borrowings - - 2,177.96 2,177.96 - 2,177.96 - 2,177.96
Other Non Current financial liabilities
- - 22.46 22.46 - 22.46 - 22.46
Lease laibilities - Noncurrent 72.95 72.95 - 72.95 - 72.95
Lease laibilities - current 119.25 119.25 - - - -
Current borrowings - - 6,659.05 6,659.05 - - - -
Trade payables - - 7,903.11 7,903.11 - - - -
Other financial liabilities - - 903.98 903.98 - - - -
Total - - 17,858.76 17,858.76 - 2,273.36 - 2,273.36
Investment in subsidiaries are carried at cost.
# Fair value of financial assets and liabilities which are measured at amortised cost is not materially different from the carrying value (i.e. amortised cost). The carrying amounts of financial assets and liabilities of short term nature are considered to be the same as their fair values.
Level 1: Level 1 hierarchy includes financial instruments measured using quoted prices.
Level 2: The fair value of financial instruments that are not traded in an active market (for example, traded bonds, over-the counter derivatives) is determined using valuation techniques which maximise the use of observable market data and rely as little as possible on entity-specific estimates. If all significant inputs required to fair value an instrument are observable, the instrument is included in level 2.
Level 3: If one or more of the significant inputs is not based on observable market data, the instrument is included in level 3. This is the case for unlisted equity securities included in level 3.
B. Measurement of fair valuesi) Valuation techniques and significant unobservable inputsi) Valuation techniques and significant unobservable inputsThe fair value of investment in equity shares of other entity is determined based on market value of the shares. The approach taken forvaluationisBookvalueoftheequityinstruments.TheinvesteecompanyisINDAScompliantcompany.
Financial instruments measured at fair value - FVTOCI in unquoted equity shares
ii) Transfers between Levels 1 and 2ii) Transfers between Levels 1 and 2There have been no transfers between Level 1 and Level 2 during the reporting periods
159
Corporate Overview Notice Statutory Reports Financial StatementsFinancial Statements

iii) Level 3 fair valuesiii) Level 3 fair valuesMovements in the values of unquoted equity instruments for the period ended 31st March 2022 and 31 st March 21 is as below:
(` In Lakhs)
ParticularsAs at As at
3131stst March, 2022 March, 2022As at
31st March, 2021
Opening Balance 412.15 60.66
Acquisitions/ (disposals) - -
Gains/ (losses) recognised in other comprehensive income 451.32 351.49
Gains/ (losses) recognised in statement of profit or loss - -
Closing Balance 863.46 412.15
Transfer out of Level 3There were no movement in level 3 in either directions during the year ended 31st March 2022 and the year ended 31st March 2021.
Ind AS 101 allows an entity to designate certain investments in equity instruments as fair valued through the OCI on the basis of the facts and circumstances at the transition date to Ind AS. The Company has elected to apply this exemption for its investment in equity shares.
Sensitivity analysisBased on the valuation report for investments in unquoted shares, the sensitivity as as 31st March 2022is provided below.
(` In Lakhs)
Significant observable inputsAs at 31As at 31stst March, 2022 March, 2022
OCI (Decrease)/Increase OCI (Decrease)/Increase As at 31st March, 2021
OCI (Decrease)/Increase
Equity securities in unquoted investments measured through OCI)
If increase in market value of investments made in Eriez Finance and Investment Limited by 5%
43.17 20.61
If decrease in market value of investments made in Eriez Finance and Investment Limited by 5%
(43.17) (20.61)
C. Financial risk managementThe Company has exposure to the following risks arising from financial instruments:
Credit risk, Liquidity risk, and Market risk
i. Risk management frameworkThe Company’s board of directors has overall responsibility for the establishment and oversight of the Company’s risk management framework. The Company has a well-define Risk Management framework for reviewing the major risks and taking care of all the financial risks. The risk management framework aims to :
a. create a stable business planning environment by reducing the impact of currency and interest rate fluctuation on company’s business plan.
b. achieve greater predictability to earnings by determining the financial value of the expected earning in advance.
Risk management policies and systems are reviewed regularly to reflect changes in market conditions and the Company’s activities. The Company, through its training and management standards and procedures, aims to maintain a disciplined and constructive control environment in which all employees understand their roles and obligations.
The audit committee oversees how management monitors compliance with the company’s risk management policies and procedures, and reviews the adequacy of the risk management framework in relation to the risks faced by the Company. The audit committee is
NOTES TO STANDALONE FINANCIAL STATEMENTS NOTES TO STANDALONE FINANCIAL STATEMENTS for the year ended on 31st March, 2022
Annual Report 2021-222021-22
160
20 Microns Limited20 Microns Limited
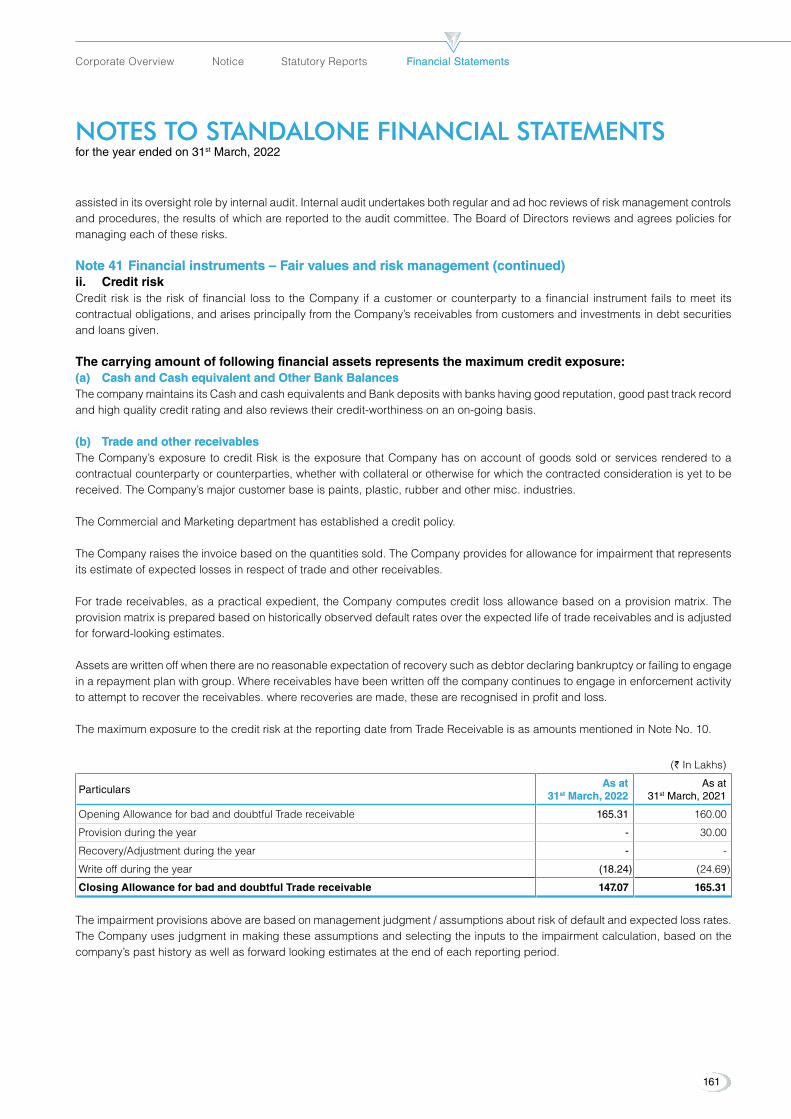
NOTES TO STANDALONE FINANCIAL STATEMENTS NOTES TO STANDALONE FINANCIAL STATEMENTS for the year ended on 31st March, 2022
assisted in its oversight role by internal audit. Internal audit undertakes both regular and ad hoc reviews of risk management controls andprocedures,theresultsofwhicharereportedtotheauditcommittee.TheBoardofDirectorsreviewsandagreespoliciesformanaging each of these risks.
Note 41 Financial instruments – Fair values and risk management (continued)Note 41 Financial instruments – Fair values and risk management (continued)ii. Credit riskCredit risk is the risk of financial loss to the Company if a customer or counterparty to a financial instrument fails to meet its contractual obligations, and arises principally from the Company’s receivables from customers and investments in debt securities and loans given.
The carrying amount of following financial assets represents the maximum credit exposure:(a) Cash and Cash equivalent and Other Bank Balances(a) Cash and Cash equivalent and Other Bank BalancesThe company maintains its Cash and cash equivalents and Bank deposits with banks having good reputation, good past track record and high quality credit rating and also reviews their credit-worthiness on an on-going basis.
(b) Trade and other receivables(b) Trade and other receivablesThe Company’s exposure to credit Risk is the exposure that Company has on account of goods sold or services rendered to a contractual counterparty or counterparties, whether with collateral or otherwise for which the contracted consideration is yet to be received. The Company’s major customer base is paints, plastic, rubber and other misc. industries.
The Commercial and Marketing department has established a credit policy.
The Company raises the invoice based on the quantities sold. The Company provides for allowance for impairment that represents its estimate of expected losses in respect of trade and other receivables.
For trade receivables, as a practical expedient, the Company computes credit loss allowance based on a provision matrix. The provision matrix is prepared based on historically observed default rates over the expected life of trade receivables and is adjusted for forward-looking estimates.
Assets are written off when there are no reasonable expectation of recovery such as debtor declaring bankruptcy or failing to engage in a repayment plan with group. Where receivables have been written off the company continues to engage in enforcement activity to attempt to recover the receivables. where recoveries are made, these are recognised in profit and loss.
The maximum exposure to the credit risk at the reporting date from Trade Receivable is as amounts mentioned in Note No. 10.
(` In Lakhs)
ParticularsAs at As at
3131stst March, 2022 March, 2022As at
31st March, 2021
Opening Allowance for bad and doubtful Trade receivable 165.31 160.00
Provision during the year - 30.00
Recovery/Adjustment during the year - -
Write off during the year (18.24) (24.69)
Closing Allowance for bad and doubtful Trade receivable 147.07 165.31
The impairment provisions above are based on management judgment / assumptions about risk of default and expected loss rates. The Company uses judgment in making these assumptions and selecting the inputs to the impairment calculation, based on the company’s past history as well as forward looking estimates at the end of each reporting period.
161
Corporate Overview Notice Statutory Reports Financial StatementsFinancial Statements

NOTES TO STANDALONE FINANCIAL STATEMENTS NOTES TO STANDALONE FINANCIAL STATEMENTS for the year ended on 31st March, 2022
(c) Loans and deposits(c) Loans and depositsCompany has given loans to employees and security deposits. The maximum exposure to the credit risk at the reporting date from above amounts to `436.36 Lakhs on 31st March, 2022 and `399.73 Lakhs on 31st March, 2021.
iii. Liquidity riskLiquidity risk is the risk that the Company will encounter difficulty in meeting the obligations associated with its financial liabilities that are settled by delivering cash or another financial asset. The Company’s approach to managing liquidity is to ensure, as far as possible, that it will have sufficient liquidity to meet its liabilities when they are due, under both normal and stressed conditions, without incurring unacceptable losses or risking damage to the Company’s reputation.
The Company maintains the following lines of credit outstanding:(a) Term loans from banks and financial institution of `1623.81 Lakhs (at amortised cost) that is secured as mentioned in Note 19.
Interest would be payable at the rate of varying from 7.95% to 10.50%.
(b) The company has also accepted deposit from share holders and directors amounting to `3409.66 Lakhs (at amortised cost) of unsecured nature. Interest would be payable at the rate of varying from 7.50% - 8.75%.
(c) For maintaining working capital liquidity company avails cash credit limit from bank. The amount availed as at 31/03/2022 is `5392.18 Lakhs (at amortised cost). Effective Rate of Interest is 7.95 to 10.50%
exposure to liquidity riskThe following are the remaining contractual maturities of financial liabilities at the reporting date. The amounts are gross and undiscounted, and exclude the impact of netting agreements.
(` In Lakhs)
March 31, 2022
Contractual cash flowsContractual cash flows
Carrying Carrying amountamount
Less than Less than 12 months12 months
1-5 years1-5 yearsMore than More than
5 years5 yearsTotalTotal
Non-derivative financial liabilities
Non current borrowings 2,741.87 - 2,741.87 - 2,741.87
Non current financial liabilities 25.92 - 25.92 - 25.92
Lease laibilities - Noncurrent 80.56 - 80.56 - 80.56
Trade payables (Non-current) 84.32 - 84.32 - 84.32
Lease laibilities - current 123.64 123.64 - - 123.64
Short term Borrowings 7,683.78 7,683.78 - - 7,683.78
Current Trade payables 8,039.63 8,039.63 - - 8,039.63
Current Other financial liabilities 783.59 783.59 - - 783.59
19,563.30 16,630.63 2,932.66 - 19,563.30
Annual Report 2021-222021-22
162
20 Microns Limited20 Microns Limited

NOTES TO STANDALONE FINANCIAL STATEMENTS NOTES TO STANDALONE FINANCIAL STATEMENTS for the year ended on 31st March, 2022
(` In Lakhs)
March 31, 2021
Contractual cash flows
Carrying amount
Less than 12 months
1-5 years More than
5 years Total
Non-derivative financial liabilities
Non current borrowings 2,177.96 - 2,177.96 - 2,177.96
Non current financial liabilities 22.46 - 22.46 - 22.46
Lease laibilities - Noncurrent 72.95 - 72.95 - 72.95
Lease laibilities - current 119.25 119.25 - - 119.25
Short term Borrowings 6,659.05 6,659.05 - - 6,659.05
Current Trade payables 7,903.11 7,903.11 - - 7,903.11
Current Other financial liabilities 903.98 903.98 - - 903.98
17,858.76 15,585.39 2,273.36 - 17,858.76
The gross inflows/(outflows) disclosed in the above table represent the contractual undiscounted cash flows relating to non-derivative financial liabilities held for risk management purposes and which are not usually closed out before contractual maturity.
iv. Market riskMarket risk is the risk that the fair value of future cash flows of a financial instrument will fluctuate because of changes in market prices. Market risk comprises three types of risk: interest rate risk, currency risk and other price risk, such as equity price risk and commodity risk. Financial instruments affected by market risk include loans and borrowings, deposits and FVTOCI investments.
a) Currency riska) Currency riskThe functional currency of the Company is Indian Rupee. The Company have transaction of import of materials, other foreign expenditures and export of goods. hence the company is exposed to currency risk on account of payables and receivables in foreign currency.CompanyhaveoutstandingbalancesinEuro,USDandGBP.
(` In Lakhs)
ParticularsAs at As at
3131stst March, 2022 March, 2022As at
31st March, 2021
Foreign currency short term borrowing
USD - 2,373.13
Trade and Other Payables
Euro 12.54 18.56
USD 841.68 921.41
Trade Receivables and advances
Euro 54.04 39.44
USD 1,632.65 1,342.87
GBP 54.03 24.42
Sensitivity analysisProfit or loss is sensitive to higher/lower Exchange rate of currency. A possible 5% change in exchange rate would affect profit/loss at the reporting date by amount shown below:
As at 31st March 2022(` In Lakhs)
Details of foreign currency balancesProfit or (Loss)Profit or (Loss) equity (net of tax)equity (net of tax)
5% increase5% increase 5 % Decrease5 % Decrease 5% increase5% increase 5 % Decrease5 % Decrease
Trade and Other Payables (42.71) 42.71 (31.96) 31.96
Trade Receivables and advances 87.04 (87.04) 65.13 (65.13)
163
Corporate Overview Notice Statutory Reports Financial StatementsFinancial Statements
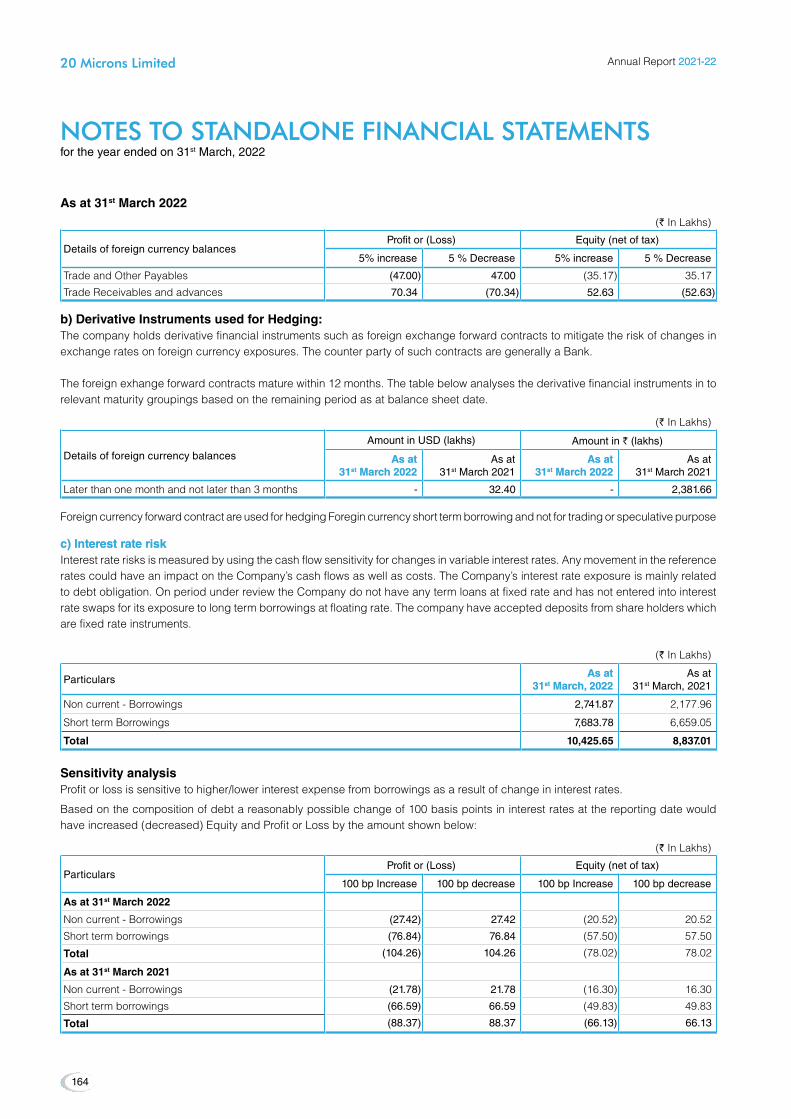
As at 31st March 2022(` In Lakhs)
Details of foreign currency balancesProfit or (Loss) Equity (net of tax)
5% increase 5 % Decrease 5% increase 5 % Decrease
Trade and Other Payables (47.00) 47.00 (35.17) 35.17
Trade Receivables and advances 70.34 (70.34) 52.63 (52.63)
b) Derivative Instruments used for Hedging:The company holds derivative financial instruments such as foreign exchange forward contracts to mitigate the risk of changes in exchange rates on foreign currency exposures. The counter party of such contracts are generally a Bank.
The foreign exhange forward contracts mature within 12 months. The table below analyses the derivative financial instruments in to relevant maturity groupings based on the remaining period as at balance sheet date.
(` In Lakhs)
Details of foreign currency balances
Amount in USD (lakhs) Amount in ` (lakhs)
As at As at 3131stst March 2022 March 2022
As at 31st March 2021
As at As at 3131stst March 2022 March 2022
As at 31st March 2021
Later than one month and not later than 3 months - 32.40 - 2,381.66
Foreign currency forward contract are used for hedging Foregin currency short term borrowing and not for trading or speculative purpose
c) Interest rate riskc) Interest rate riskInterest rate risks is measured by using the cash flow sensitivity for changes in variable interest rates. Any movement in the reference rates could have an impact on the Company’s cash flows as well as costs. The Company’s interest rate exposure is mainly related to debt obligation. On period under review the Company do not have any term loans at fixed rate and has not entered into interest rate swaps for its exposure to long term borrowings at floating rate. The company have accepted deposits from share holders which are fixed rate instruments.
(` In Lakhs)
ParticularsAs at As at
3131stst March, 2022 March, 2022As at
31st March, 2021
Non current - Borrowings 2,741.87 2,177.96
Short term Borrowings 7,683.78 6,659.05
Total 10,425.65 8,837.01
Sensitivity analysisProfit or loss is sensitive to higher/lower interest expense from borrowings as a result of change in interest rates.
Based on the composition of debt a reasonably possible change of 100 basis points in interest rates at the reporting date would have increased (decreased) Equity and Profit or Loss by the amount shown below:
(` In Lakhs)
ParticularsProfit or (Loss) Equity (net of tax)
100 bp Increase 100 bp decrease 100 bp Increase 100 bp decrease
As at 31st March 2022
Non current - Borrowings (27.42) 27.42 (20.52) 20.52
Short term borrowings (76.84) 76.84 (57.50) 57.50
Total (104.26) 104.26 (78.02) 78.02
As at 31st March 2021
Non current - Borrowings (21.78) 21.78 (16.30) 16.30
Short term borrowings (66.59) 66.59 (49.83) 49.83
Total (88.37) 88.37 (66.13) 66.13
NOTES TO STANDALONE FINANCIAL STATEMENTS NOTES TO STANDALONE FINANCIAL STATEMENTS for the year ended on 31st March, 2022
Annual Report 2021-222021-22
164
20 Microns Limited20 Microns Limited
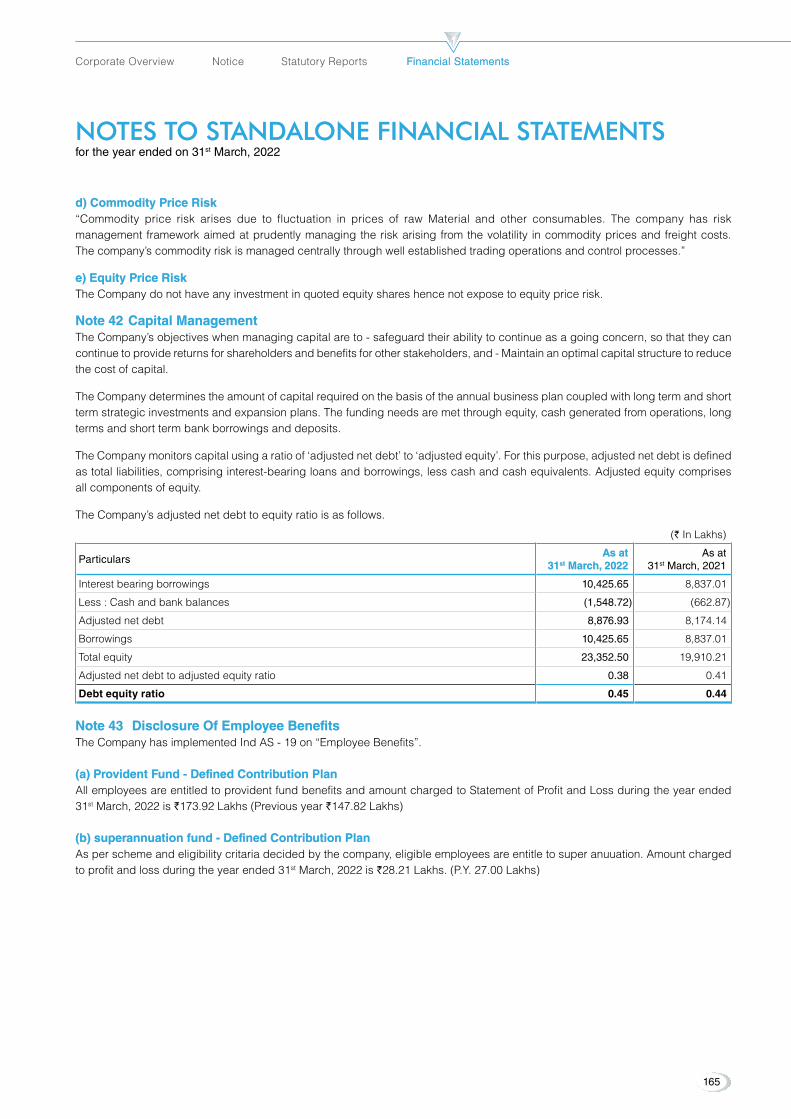
NOTES TO STANDALONE FINANCIAL STATEMENTS NOTES TO STANDALONE FINANCIAL STATEMENTS for the year ended on 31st March, 2022
d) Commodity Price Riskd) Commodity Price Risk“Commodity price risk arises due to fluctuation in prices of raw Material and other consumables. The company has risk management framework aimed at prudently managing the risk arising from the volatility in commodity prices and freight costs. The company’s commodity risk is managed centrally through well established trading operations and control processes.”
e) equity Price Riske) equity Price RiskThe Company do not have any investment in quoted equity shares hence not expose to equity price risk.
Note 42 Capital ManagementNote 42 Capital ManagementThe Company’s objectives when managing capital are to - safeguard their ability to continue as a going concern, so that they can continue to provide returns for shareholders and benefits for other stakeholders, and - Maintain an optimal capital structure to reduce the cost of capital.
The Company determines the amount of capital required on the basis of the annual business plan coupled with long term and short term strategic investments and expansion plans. The funding needs are met through equity, cash generated from operations, long terms and short term bank borrowings and deposits.
The Company monitors capital using a ratio of ‘adjusted net debt’ to ‘adjusted equity’. For this purpose, adjusted net debt is defined as total liabilities, comprising interest-bearing loans and borrowings, less cash and cash equivalents. Adjusted equity comprises all components of equity.
The Company’s adjusted net debt to equity ratio is as follows.
(` In Lakhs)
ParticularsAs at As at
3131stst March, 2022 March, 2022As at
31st March, 2021
Interest bearing borrowings 10,425.65 8,837.01
Less : Cash and bank balances (1,548.72) (662.87)
Adjusted net debt 8,876.93 8,174.14
Borrowings 10,425.65 8,837.01
Total equity 23,352.50 19,910.21
Adjusted net debt to adjusted equity ratio 0.38 0.41
Debt equity ratio 0.45 0.44
Note 43 Disclosure Of employee BenefitsNote 43 Disclosure Of employee BenefitsThe Company has implemented Ind AS - 19 on “Employee Benefits”.
(a) Provident Fund - Defined Contribution Plan(a) Provident Fund - Defined Contribution PlanAll employees are entitled to provident fund benefits and amount charged to Statement of Profit and Loss during the year ended 31st March, 2022 is `173.92 Lakhs (Previous year `147.82 Lakhs)
(b) superannuation fund - Defined Contribution Plan(b) superannuation fund - Defined Contribution PlanAs per scheme and eligibility critaria decided by the company, eligible employees are entitle to super anuuation. Amount charged to profit and loss during the year ended 31st March, 2022 is `28.21 Lakhs. (P.Y. 27.00 Lakhs)
165
Corporate Overview Notice Statutory Reports Financial StatementsFinancial Statements
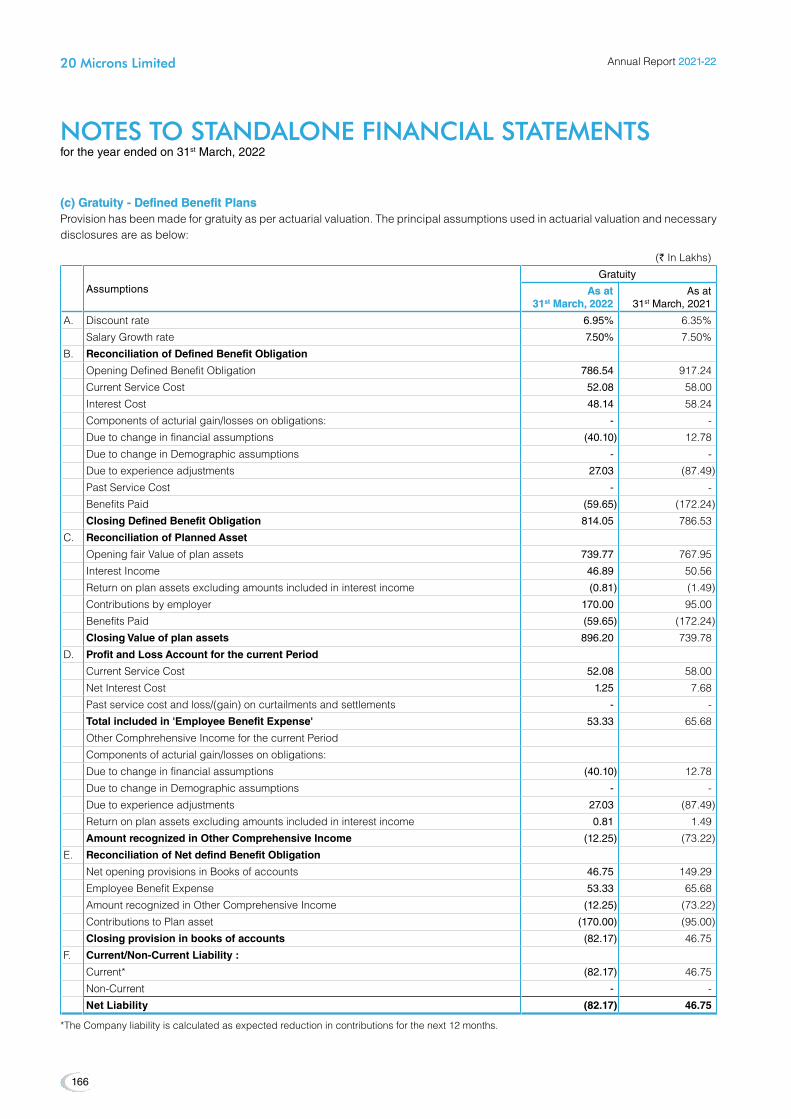
NOTES TO STANDALONE FINANCIAL STATEMENTS NOTES TO STANDALONE FINANCIAL STATEMENTS for the year ended on 31st March, 2022
(c) Gratuity - Defined Benefit Plans(c) Gratuity - Defined Benefit PlansProvision has been made for gratuity as per actuarial valuation. The principal assumptions used in actuarial valuation and necessary disclosures are as below:
(` In Lakhs)
AssumptionsGratuity
As atAs at 3131stst March, 2022 March, 2022
As at 31st March, 2021
A. Discountrate 6.95% 6.35%
Salary Growth rate 7.50% 7.50%
B. Reconciliation of Defined Benefit Obligation
OpeningDefinedBenefitObligation 786.54 917.24
Current Service Cost 52.08 58.00
Interest Cost 48.14 58.24
Components of acturial gain/losses on obligations: - -
Duetochangeinfinancialassumptions (40.10) 12.78
DuetochangeinDemographicassumptions - -
Duetoexperienceadjustments 27.03 (87.49)
Past Service Cost - -
Benefits Paid (59.65) (172.24)
Closing Defined Benefit Obligation 814.05 786.53
C. Reconciliation of Planned Asset
Opening fair Value of plan assets 739.77 767.95
Interest Income 46.89 50.56
Return on plan assets excluding amounts included in interest income (0.81) (1.49)
Contributions by employer 170.00 95.00
Benefits Paid (59.65) (172.24)
Closing Value of plan assets 896.20 739.78
D. Profit and Loss Account for the current Period
Current Service Cost 52.08 58.00
Net Interest Cost 1.25 7.68
Past service cost and loss/(gain) on curtailments and settlements - -
Total included in 'employee Benefit expense' 53.33 65.68
Other Comphrehensive Income for the current Period
Components of acturial gain/losses on obligations:
Duetochangeinfinancialassumptions (40.10) 12.78
DuetochangeinDemographicassumptions - -
Duetoexperienceadjustments 27.03 (87.49)
Return on plan assets excluding amounts included in interest income 0.81 1.49
Amount recognized in Other Comprehensive Income (12.25) (73.22)
E. Reconciliation of Net defind Benefit Obligation
Net opening provisions in Books of accounts 46.75 149.29
Employee Benefit Expense 53.33 65.68
Amount recognized in Other Comprehensive Income (12.25) (73.22)
Contributions to Plan asset (170.00) (95.00)
Closing provision in books of accounts (82.17) 46.75
F. Current/Non-Current Liability :
Current* (82.17) 46.75
Non-Current - -
Net Liability (82.17) 46.75
*The Company liability is calculated as expected reduction in contributions for the next 12 months.
Annual Report 2021-222021-22
166
20 Microns Limited20 Microns Limited
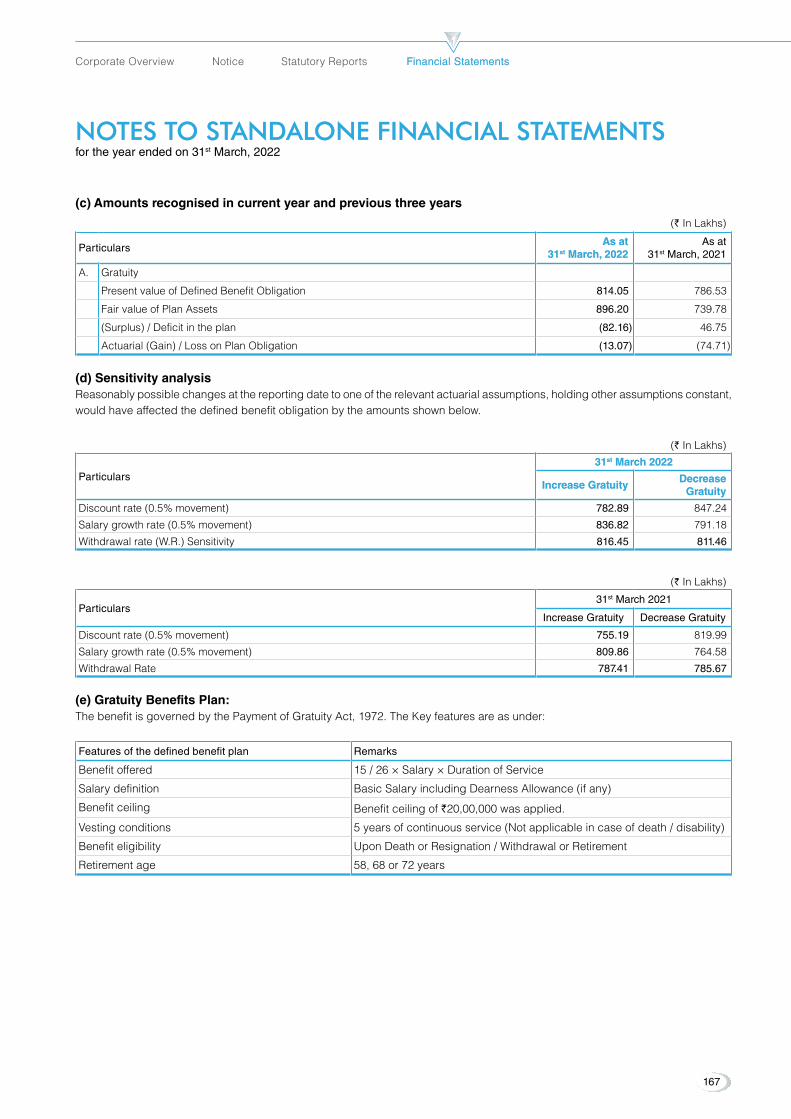
NOTES TO STANDALONE FINANCIAL STATEMENTS NOTES TO STANDALONE FINANCIAL STATEMENTS for the year ended on 31st March, 2022
(c) Amounts recognised in current year and previous three years
(` In Lakhs)
ParticularsAs at As at
3131stst March, 2022 March, 2022As at
31st March, 2021
A. Gratuity
PresentvalueofDefinedBenefitObligation 814.05 786.53
Fair value of Plan Assets 896.20 739.78
(Surplus)/Deficitintheplan (82.16) 46.75
Actuarial (Gain) / Loss on Plan Obligation (13.07) (74.71)
(d) Sensitivity analysisReasonably possible changes at the reporting date to one of the relevant actuarial assumptions, holding other assumptions constant, would have affected the defined benefit obligation by the amounts shown below.
(` In Lakhs)
Particulars 31 31stst March 2022 March 2022
Increase GratuityIncrease Gratuity Decrease Decrease
Gratuity Gratuity
Discountrate(0.5%movement) 782.89 847.24
Salary growth rate (0.5% movement) 836.82 791.18
Withdrawal rate (W.R.) Sensitivity 816.45 811.46
(` In Lakhs)
Particulars 31st March 2021
Increase Gratuity Decrease Gratuity
Discountrate(0.5%movement) 755.19 819.99
Salary growth rate (0.5% movement) 809.86 764.58
Withdrawal Rate 787.41 785.67
(e) Gratuity Benefits Plan:The benefit is governed by the Payment of Gratuity Act, 1972. The Key features are as under:
Features of the defined benefit plan Remarks
Benefit offered 15/26×Salary×DurationofService
Salary definition BasicSalaryincludingDearnessAllowance(ifany)
Benefit ceiling Benefit ceiling of `20,00,000 was applied.
Vesting conditions 5 years of continuous service (Not applicable in case of death / disability)
Benefit eligibility UponDeathorResignation/WithdrawalorRetirement
Retirement age 58, 68 or 72 years
167
Corporate Overview Notice Statutory Reports Financial StatementsFinancial Statements
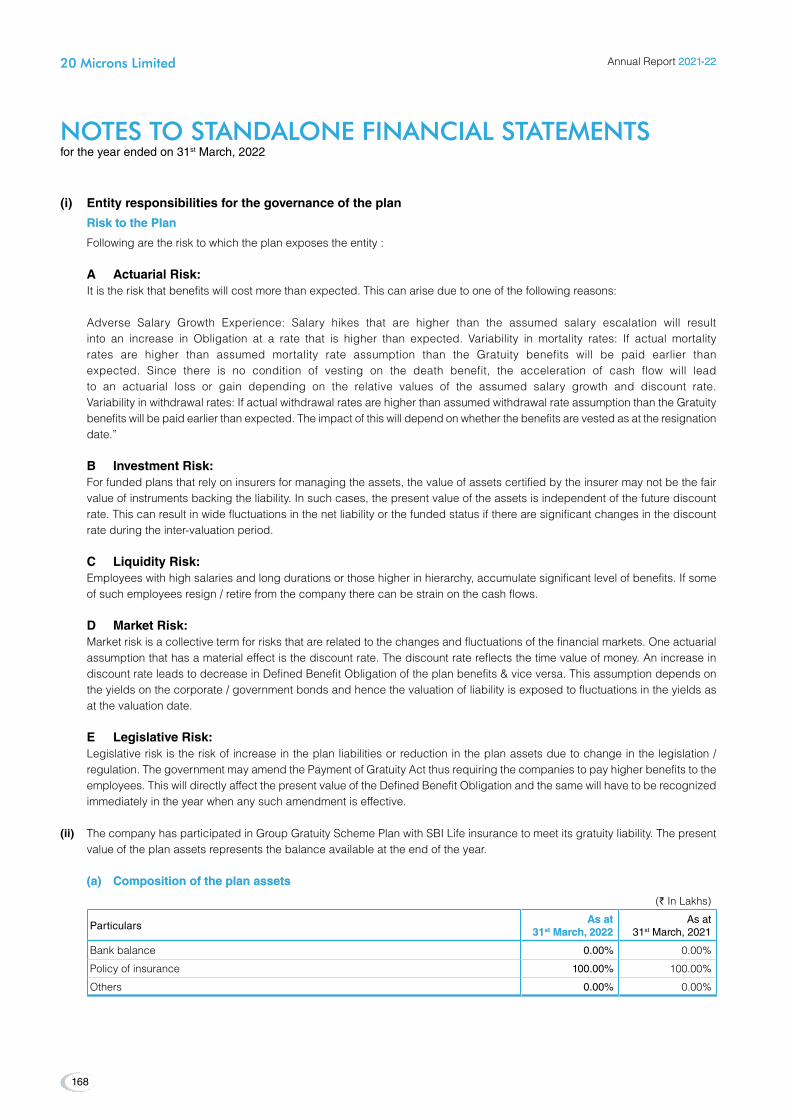
(i) entity responsibilities for the governance of the plan
Risk to the Plan Risk to the Plan
Following are the risk to which the plan exposes the entity :
A Actuarial Risk: It is the risk that benefits will cost more than expected. This can arise due to one of the following reasons:
Adverse Salary Growth Experience: Salary hikes that are higher than the assumed salary escalation will result into an increase in Obligation at a rate that is higher than expected. Variability in mortality rates: If actual mortality rates are higher than assumed mortality rate assumption than the Gratuity benefits will be paid earlier than expected. Since there is no condition of vesting on the death benefit, the acceleration of cash flow will lead to an actuarial loss or gain depending on the relative values of the assumed salary growth and discount rate. Variability in withdrawal rates: If actual withdrawal rates are higher than assumed withdrawal rate assumption than the Gratuity benefits will be paid earlier than expected. The impact of this will depend on whether the benefits are vested as at the resignation date.”
B Investment Risk: For funded plans that rely on insurers for managing the assets, the value of assets certified by the insurer may not be the fair
value of instruments backing the liability. In such cases, the present value of the assets is independent of the future discount rate. This can result in wide fluctuations in the net liability or the funded status if there are significant changes in the discount rate during the inter-valuation period.
C Liquidity Risk: Employees with high salaries and long durations or those higher in hierarchy, accumulate significant level of benefits. If some
of such employees resign / retire from the company there can be strain on the cash flows.
D Market Risk: Market risk is a collective term for risks that are related to the changes and fluctuations of the financial markets. One actuarial
assumption that has a material effect is the discount rate. The discount rate reflects the time value of money. An increase in discountrateleadstodecreaseinDefinedBenefitObligationoftheplanbenefits&viceversa.Thisassumptiondependsonthe yields on the corporate / government bonds and hence the valuation of liability is exposed to fluctuations in the yields as at the valuation date.
e Legislative Risk: Legislative risk is the risk of increase in the plan liabilities or reduction in the plan assets due to change in the legislation /
regulation. The government may amend the Payment of Gratuity Act thus requiring the companies to pay higher benefits to the employees.ThiswilldirectlyaffectthepresentvalueoftheDefinedBenefitObligationandthesamewillhavetoberecognizedimmediately in the year when any such amendment is effective.
(ii) The company has participated in Group Gratuity Scheme Plan with SBI Life insurance to meet its gratuity liability. The present value of the plan assets represents the balance available at the end of the year.
(a) Composition of the plan assets (a) Composition of the plan assets
(` In Lakhs)
ParticularsAs at As at
3131stst March, 2022 March, 2022As at
31st March, 2021
Bank balance 0.00% 0.00%
Policy of insurance 100.00% 100.00%
Others 0.00% 0.00%
NOTES TO STANDALONE FINANCIAL STATEMENTS NOTES TO STANDALONE FINANCIAL STATEMENTS for the year ended on 31st March, 2022
Annual Report 2021-222021-22
168
20 Microns Limited20 Microns Limited

NOTES TO STANDALONE FINANCIAL STATEMENTS NOTES TO STANDALONE FINANCIAL STATEMENTS for the year ended on 31st March, 2022
(b)(b) The trustees of the plan have outsourced the investment management of the fund to an insurance company. The insurance company in turn manages these funds as per the mandate provided to them by the trustees and the asset allocation which is withinthepermissiblelimitsprescribedintheinsuranceregulations.Duetotherestrictionsinthetypeofinvestmentsthatcanbe held by the fund, it may not be possible to explicitly follow an asset-liability matching strategy to manage risk actively in a conventional fund.
(c) expected benefit payments as on 31st March 2022(c) expected benefit payments as on 31st March 2022
(` In Lakhs)
Particulars 1-5 years 6-10 years
Cash flow (`) 380.95 345.16
Distribution(in%) 24.70% 22.60%
(g) Other Notes:(g) Other Notes: (i) The expected rate of return on Plan Assets is determined considering several applicable factors, mainly the composition
of Plan Assets held, assessed risks, historical results of return on Plan Assets and the Company’s policy for the Plan Assets management.
(ii) The actuarial valuation takes into account the estimates of future salary increases, inflation, seniority, promotion and other relevant factors such as supply and demand in the employment market. The management has relied on the overall actuarial valuation conducted by the actuary.
Note 44 Related Party Transactions:Note 44 Related Party Transactions:Note 44.1 List of Related Parties
Sr. No. Name of Related Parties Nature of Relationship
1 20 Microns Nano Minerals Limited Subsidiary Company
2 20 MCC Private Limited Subsidiary Company
3 20MicronsSDNBHD Subsidiary Company
4 20 Microns FZE Subsidiary Company
5 Silicate Minerals Private Limited SubsidiaryCompany(StepDown)
6 20 Microns Vietnam Limited SubsidiaryCompany(StepDown)
7 DORFNER-20MicronsPrivateLimited Associate Company
8 20 Microns Foundation trust Entity over which Significant Influence Exists
9 ShriChandreshS.Parikh(Upto09.06.2021) Chairman&ManagingDirector,KeyManagementPersonnel
10 Shri Rajesh C. Parikh Chairman&ManagingDirector,KeyManagementPersonnel
11 Shri. Atil C. Parikh CEO&ManagingDirector,KeyManagementPersonnel
12 Smt. Sejal R. Parikh Director,KeyManagementPersonnel
13 Smt. Ilaben C. Parikh Relative of Key Management Personnel
14 Smt. Purvi A. Parikh Relative of Key Management Personnel
15 Smt. Vedika R. Parikh Relative of Key Management Personnel
16 Mr Narendra R Patel Chief Financial Officer, Key Management Personnel
17 Smt.AnujaK.Muley(Upto15.05.2021) Company Secretary, Key Management Personnel
18 Smt.Komal Pandy (from 19.07.2021) Company Secretary, Key Management Personnel
19 Shri.RamkisanA.Devidayal IndependentDirector
20 Shri. Atul H. Patel IndependentDirector
21 Dr.AjayI.Ranka IndependentDirector
22 Mr.Jaideep B. Verma IndependentDirector
169
Corporate Overview Notice Statutory Reports Financial StatementsFinancial Statements
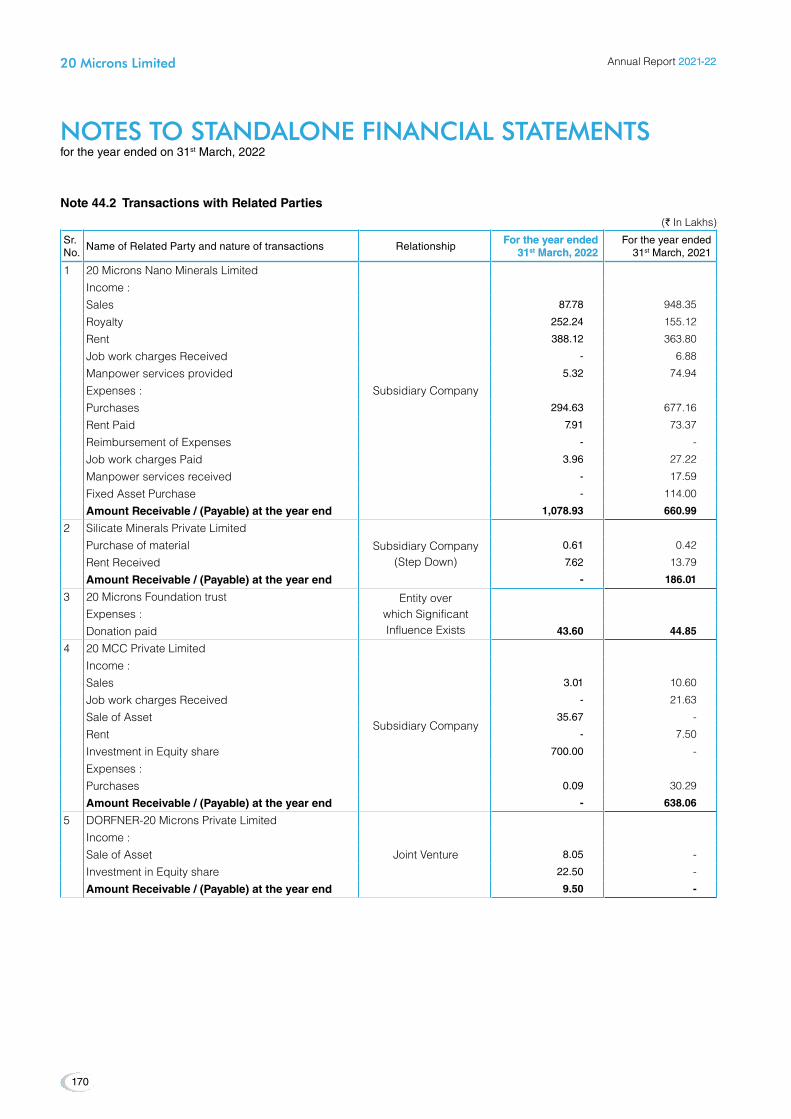
NOTES TO STANDALONE FINANCIAL STATEMENTS NOTES TO STANDALONE FINANCIAL STATEMENTS for the year ended on 31st March, 2022
Note 44.2 Transactions with Related Parties (` In Lakhs)
Sr. No.
Name of Related Party and nature of transactions RelationshipFor the year ended For the year ended
3131stst March, 2022 March, 2022For the year ended
31st March, 2021
1 20 Microns Nano Minerals Limited
Subsidiary Company
Income :Sales 87.78 948.35
Royalty 252.24 155.12
Rent 388.12 363.80
Job work charges Received - 6.88
Manpower services provided 5.32 74.94
Expenses :Purchases 294.63 677.16
Rent Paid 7.91 73.37
Reimbursement of Expenses - -
Job work charges Paid 3.96 27.22
Manpower services received - 17.59
Fixed Asset Purchase - 114.00
Amount Receivable / (Payable) at the year end 1,078.93 660.99
2 Silicate Minerals Private Limited
Subsidiary Company (StepDown)
Purchase of material 0.61 0.42
Rent Received 7.62 13.79
Amount Receivable / (Payable) at the year end - 186.01
3 20 Microns Foundation trust Entity over which Significant Influence Exists
Expenses :Donationpaid 43.60 44.85
4 20 MCC Private Limited
Subsidiary Company
Income :Sales 3.01 10.60
Job work charges Received - 21.63
Sale of Asset 35.67 -
Rent - 7.50
Investment in Equity share 700.00 -
Expenses :Purchases 0.09 30.29
Amount Receivable / (Payable) at the year end - 638.06
5 DORFNER-20MicronsPrivateLimited
Joint VentureIncome :Sale of Asset 8.05 -
Investment in Equity share 22.50 -
Amount Receivable / (Payable) at the year end 9.50 -
Annual Report 2021-222021-22
170
20 Microns Limited20 Microns Limited

NOTES TO STANDALONE FINANCIAL STATEMENTS NOTES TO STANDALONE FINANCIAL STATEMENTS for the year ended on 31st March, 2022
(` In Lakhs)
Sr. No.
Name of Related Party and nature of transactions RelationshipFor the year ended For the year ended
3131stst March, 2022 March, 2022For the year ended
31st March, 2021
6 ShriChandreshS.Parikh(Upto09.06.2021)
Chairman & Managing Director,Key
Management Personnel
Expenses :Remuneration paidshort-term employee benefits 15.26 49.76
other long-term benefits 1.75 5.52
Other Benefit 108.74
InterestonDeposit - 8.33
Others :DepositReceived/Renewed - 70.00
DepositPaidDuringtheYear 80.00 50.00
DepositOutstanding - 80.00
7 Shri Rajesh C. Parikh
Chairman & Managing Director,Key
Management Personnel
Expenses :Remuneration paidshort-term employee benefits 86.56 59.80
other long-term benefits 8.69 4.22
8 Shri. Atil C. Parikh
CEO & Managing Director,Key
Management Personnel
Expenses :Remuneration paidshort-term employee benefits 78.23 51.86
other long-term benefits 7.85 3.45
InterestonDeposit 0.46 0.54
Others :DepositReceived/Renewed - 5.00
DepositPaidDuringtheYear - 5.00
DepositOutstanding 5.00 5.00
9 Smt. Ilaben C. Parikh
Relative of Key Management Personnel
Expenses :Compansation paid 18.00 -
InterestonDeposit 8.70 1.89
Others :DepositReceived/Renewed 95.50 -
DepositPaid 15.50 -
DepositOutstanding 95.50 15.50
10 Smt. Sejal R. Parikh
Director,KeyManagement Personnel
Expenses :InterestonDeposit 0.10 0.12
Rent 9.85 8.93
Other Benefit 1.75 -
DirectorSittingfees 1.35 1.15
Others :DepositReceived/Renewed -
DepositOutstanding 1.00 1.00
Note 44.2 Transactions with Related Parties (Contd.)
171
Corporate Overview Notice Statutory Reports Financial StatementsFinancial Statements
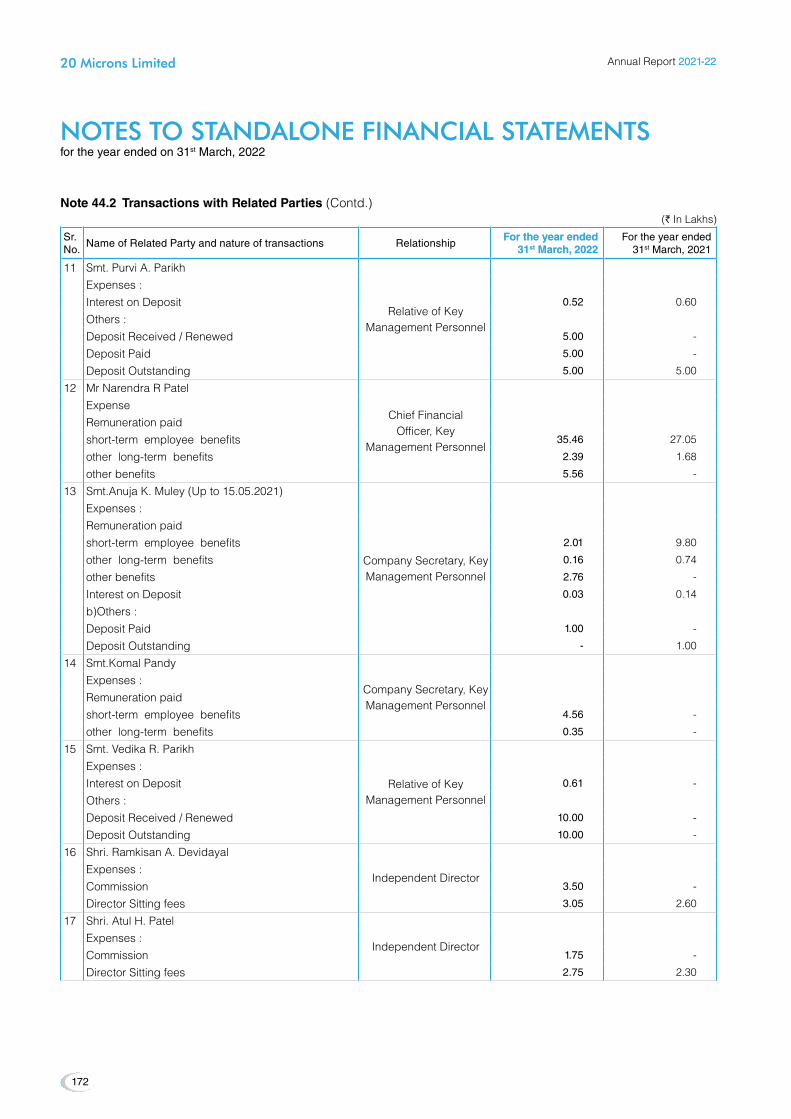
(` In Lakhs)
Sr. No.
Name of Related Party and nature of transactions RelationshipFor the year ended For the year ended
3131stst March, 2022 March, 2022For the year ended
31st March, 2021
11 Smt. Purvi A. Parikh
Relative of Key Management Personnel
Expenses :InterestonDeposit 0.52 0.60
Others :DepositReceived/Renewed 5.00 -
DepositPaid 5.00 -
DepositOutstanding 5.00 5.00
12 Mr Narendra R Patel
Chief Financial Officer, Key
Management Personnel
ExpenseRemuneration paidshort-term employee benefits 35.46 27.05
other long-term benefits 2.39 1.68
other benefits 5.56 -
13 Smt.AnujaK.Muley(Upto15.05.2021)
Company Secretary, Key Management Personnel
Expenses :Remuneration paidshort-term employee benefits 2.01 9.80
other long-term benefits 0.16 0.74
other benefits 2.76 -
InterestonDeposit 0.03 0.14
b)Others :DepositPaid 1.00 -
DepositOutstanding - 1.00
14 Smt.Komal Pandy
Company Secretary, Key Management Personnel
Expenses :Remuneration paidshort-term employee benefits 4.56 -
other long-term benefits 0.35 -
15 Smt. Vedika R. Parikh
Relative of Key Management Personnel
Expenses :InterestonDeposit 0.61 -
Others :DepositReceived/Renewed 10.00 -
DepositOutstanding 10.00 -
16 Shri.RamkisanA.Devidayal
IndependentDirectorExpenses :Commission 3.50 -
DirectorSittingfees 3.05 2.60
17 Shri. Atul H. Patel
IndependentDirectorExpenses :Commission 1.75 -
DirectorSittingfees 2.75 2.30
NOTES TO STANDALONE FINANCIAL STATEMENTS NOTES TO STANDALONE FINANCIAL STATEMENTS for the year ended on 31st March, 2022
Note 44.2 Transactions with Related Parties (Contd.)
Annual Report 2021-222021-22
172
20 Microns Limited20 Microns Limited

(` In Lakhs)
Sr. No.
Name of Related Party and nature of transactions RelationshipFor the year ended For the year ended
3131stst March, 2022 March, 2022For the year ended
31st March, 2021
18 Dr.AjayI.Ranka
IndependentDirectorExpenses :Commission 1.75 -
DirectorSittingfees 2.60 2.15
19 Mr.Jaideep B. Verma
IndependentDirectorExpenses :
Commission 1.75 -
DirectorSittingfees 1.50 1.30
Notes1 20MicronsNanoMineralsLtd,20MicronsSDNBHD,20MicronsFZE&20MCCPrivateLimitedhavebeenusingsoftware
package being “SAP” by 20 Microns Limited without payment of Consideration.
2 As the liability for gratuity are provided on actuarial basis for the Company as a whole, the amounts mentioned are exclusive of gratuity.
Note 45Note 45Segment ReportingTheCompanyprimarilyoperatesinthesegmentofMicronizedMinerals.TheMD/CEOoftheCompanyallocateresourcesandassesstheperformanceoftheCompany,thusaretheChiefOperatingDecisionMaker(CODM).TheCODMmonitorstheoperatingresultsof the business as a one, hence no separate segment need to be disclosed.
a) Information about product and services: Sale of Minerals : `51,413.71 Lakhs (P.Y. - `42,980.38 Lakhs)
Sale of Herbal Pharma Products : `14.31 Lakhs (P.Y. - `23.49 Lakhs)
b) Information about geographical areas: 1. The Company have revenues from external customers attributable to all foreign countries amounting to `8,257.06 Lakhs
(P.Y. - `6,360.76 lakhs) and entity’s country of domicile amounting to `43,170.96 Lakhs (P.Y. - `36,834.60 lakhs).
2. None of the company’s Non Current assets are located outside India hence entity wide disclosure is not applicable to the Company.
c) Information about major customers: There is three (P.Y. - two) customers to the company which accounts for more than 10% of aggregate sales. Net sales made
to this customer amounts to `21,370.79 lakhs (P.Y. `12,391.21 Lakhs).
Note 46 Disclosure of IND AS 115 “Contract with Customers”Note 46 Disclosure of IND AS 115 “Contract with Customers”Contract Balances
(` In Lakhs)
ParticularsAs at As at
3131stst March, 2022 March, 2022As at
31st March, 2021
Trade receivables 9,544.84 8,246.10
Contract Assets - -
Contract Liabilities 155.16 34.67
Revenue recognised in the reporting period that was included in the contract liability balance at the beginning of the period amounts to `34.67 Lakhs.
NOTES TO STANDALONE FINANCIAL STATEMENTS NOTES TO STANDALONE FINANCIAL STATEMENTS for the year ended on 31st March, 2022
Note 44.2 Transactions with Related Parties (Contd.)
173
Corporate Overview Notice Statutory Reports Financial StatementsFinancial Statements

Reconciliation of the amount of revenue reconised in the statement of profit and loss and contracted price(` In Lakhs)
ParticularsAs at As at
3131stst March, 2022 March, 2022As at
31st March, 2021Revenue as per contracted price 51,757.20 43,409.16 Adjustments Discounts (44.71) (171.49)Contract Liabilities 51,712.50 43,237.67
Note 47 Disclosures pursuant to Ind AS 116:Note 47 Disclosures pursuant to Ind AS 116:Following are the changes in the carrying value of right of use assets for the year ended March 31, 2022:
(` In Lakhs)
Category of Right of use AssetsCategory of Right of use Assets Gross Gross Block Block
Accumulated Accumulated Depreciation Depreciation
Carrying Carrying Amount Amount
Buildings Balance as at 01st April, 2021 424.62 252.62 172.00 Additions - 108.74 (108.74)Deletions - - - Balance as at 31st March, 2022 424.62 361.36 63.26
Vehicles Balance as at 01st April, 2021 - - - Additions 167.28 40.58 126.70 Deletions - - - Balance as at 31st March, 2022 167.28 40.58 126.70
The aggregate depreciation expense amounting to `149.32lakhsonROUassetsisincludedunderDepreciationandAmortizationExpense in the Statement of Profit and Loss.
The following is the break-up of current and non-current lease liabilities as at 31st March, 2022:
(` In Lakhs)
ParticularsAs at As at
3131stst March, 2022 March, 2022As at
31st March, 2021Current lease liabilities 123.64 119.25Non current lease liabilities 80.56 72.95
204.20 192.20
The following is the movement in lease liabilities during the year ended 31st March, 2022:
(` In Lakhs)
ParticularsAs at As at
3131stst March, 2022 March, 2022As at
31st March, 2021Balance as at April 01 192.20 359.38 Additions 168.29 - Finance cost accrued 27.72 35.24 Deletions - 23.58 Payment of lease liabilities 184.01 178.84 Balance as at March 31 204.20 192.20
The table below provides details regarding the contractual maturities of lease liabilities as at 31st March, 2022 on an undiscounted basis:
(` In Lakhs)
ParticularsAs at As at
3131stst March, 2022 March, 2022As at
31st March, 2021Less than one year 100.43 135.80 One to five years 148.26 83.69 More than five years - -
248.69 219.49
Rental expense for short-term leases recognised in the Statement of Profit and Loss was ̀ 272.42 lakhs for the year ended March 31, 2022 (P.Y. - `220.74 Lakhs).
NOTES TO STANDALONE FINANCIAL STATEMENTS NOTES TO STANDALONE FINANCIAL STATEMENTS for the year ended on 31st March, 2022
Annual Report 2021-222021-22
174
20 Microns Limited20 Microns Limited
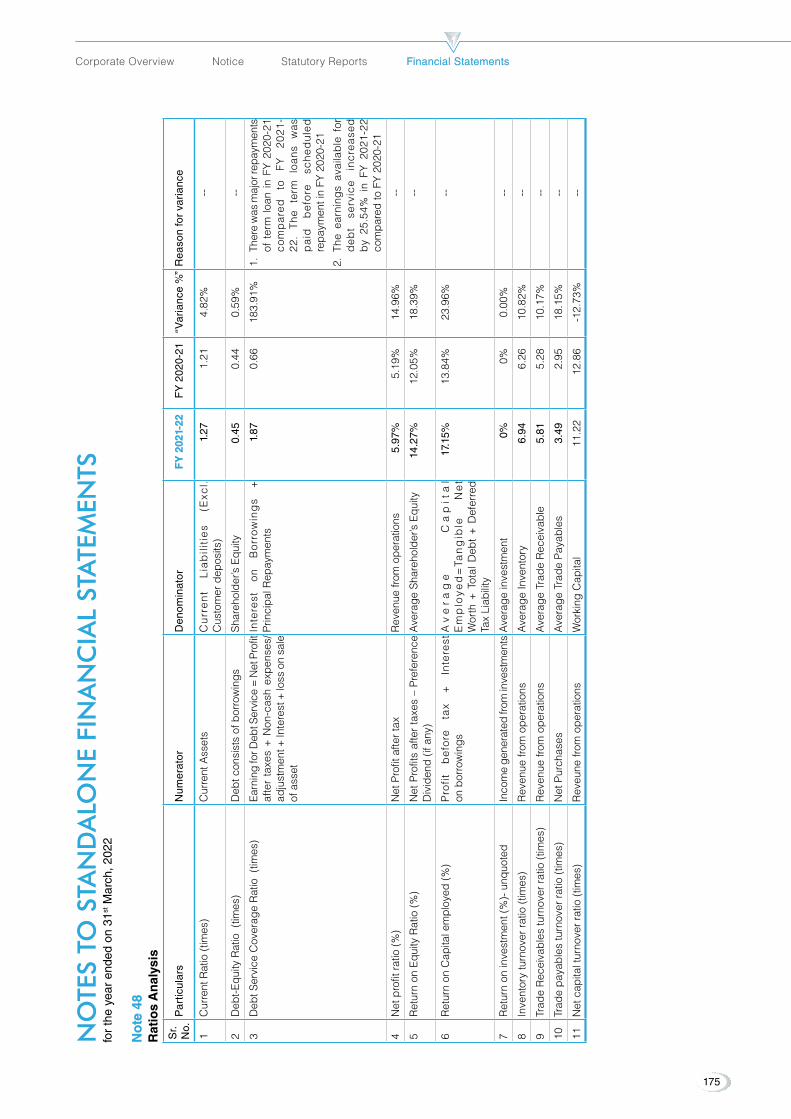
NO
TES
TO S
TAN
DA
LON
E FI
NA
NC
IAL
STA
TEM
ENTS
N
OTE
S TO
STA
ND
ALO
NE
FIN
AN
CIA
L ST
ATE
MEN
TS
for
the
year
end
ed o
n 31
st M
arch
, 202
2
No
te 4
8
N
ote
48
Rat
ios
An
alys
isS
r. N
o.P
artic
ular
sN
umer
ator
Den
omin
ator
FY
202
1-22
FY
202
1-22
FY
202
0-21
“Var
ianc
e %
”R
easo
n fo
r va
rian
ce
1C
urre
nt R
atio
(tim
es)
Cur
rent
Ass
ets
Cu
rre
nt
Lia
bili
tie
s (E
xcl.
Cus
tom
er d
epos
its)
1.2
7 1
.21
4.82
%--
2Deb
t-Equ
ityRatio(tim
es)
Deb
tcon
sistsofborrowings
Shar
ehol
der’s
Equ
ity 0
.45
0.4
4 0.
59%
--
3Deb
tService
Cov
erag
eRatio(tim
es)
EarningforD
ebtS
ervice
=NetProfit
afte
r ta
xes
+ N
on-c
ash
exp
ense
s/ad
just
men
t + In
tere
st +
loss
on
sale
of
ass
et
Inte
rest
on
B
orro
win
gs
+
Prin
cipa
l Rep
aym
ents
1.8
7 0
.66
183.
91%
1. T
here
was
maj
or re
paym
ents
of
ter
m l
oan
in F
Y 2
020-
21
com
par
ed
to
FY
2021
-22
. Th
e te
rm
loan
s w
as
pai
d
bef
ore
sche
dul
ed
repa
ymen
t in
FY 2
020-
21
2. T
he e
arni
ngs
avai
lab
le f
or
deb
t se
rvic
e in
crea
sed
by
25.5
4% i
n FY
202
1-22
co
mpa
red
to F
Y 20
20-2
1
4N
et p
rofit
ratio
(%)
Net
Pro
fit a
fter t
axR
even
ue fr
om o
pera
tions
5.97
%5.
19%
14.9
6%--
5R
etur
n on
Equ
ity R
atio
(%)
Net
Pro
fits
afte
r ta
xes
– Pr
efer
ence
Dividen
d(ifany
)A
vera
ge S
hare
hold
er’s
Equ
ity14
.27%
12.0
5%18
.39%
--
6R
etur
n on
Cap
ital e
mpl
oyed
(%)
Pro
fit
bef
ore
tax
+
Inte
rest
on
bor
row
ings
Av
era
ge
C
ap
ita
l Emplo
yed=Ta
ngib
le
Net
Worth+
TotalD
ebt+D
eferred
Tax
Liab
ility
17.1
5%13
.84%
23.9
6%--
7R
etur
n on
inve
stm
ent (
%)-
unq
uote
dIn
com
e ge
nera
ted
from
inve
stm
ents
Ave
rage
inve
stm
ent
0%0%
0.00
%--
8In
vent
ory
turn
over
ratio
(tim
es)
Rev
enue
from
ope
ratio
nsA
vera
ge In
vent
ory
6.9
4 6
.26
10.8
2%--
9Tr
ade
Rec
eiva
bles
turn
over
ratio
(tim
es)
Rev
enue
from
ope
ratio
nsA
vera
ge T
rade
Rec
eiva
ble
5.8
1 5
.28
10.1
7%--
10Tr
ade
paya
bles
turn
over
ratio
(tim
es)
Net
Pur
chas
es
Ave
rage
Tra
de P
ayab
les
3.4
9 2
.95
18.1
5%--
11N
et c
apita
l tur
nove
r rat
io (t
imes
)R
eveu
ne fr
om o
pera
tions
Wor
king
Cap
ital
11.
22
12.
86
-12.
73%
--
175
Corporate Overview Notice Statutory Reports Financial StatementsFinancial Statements
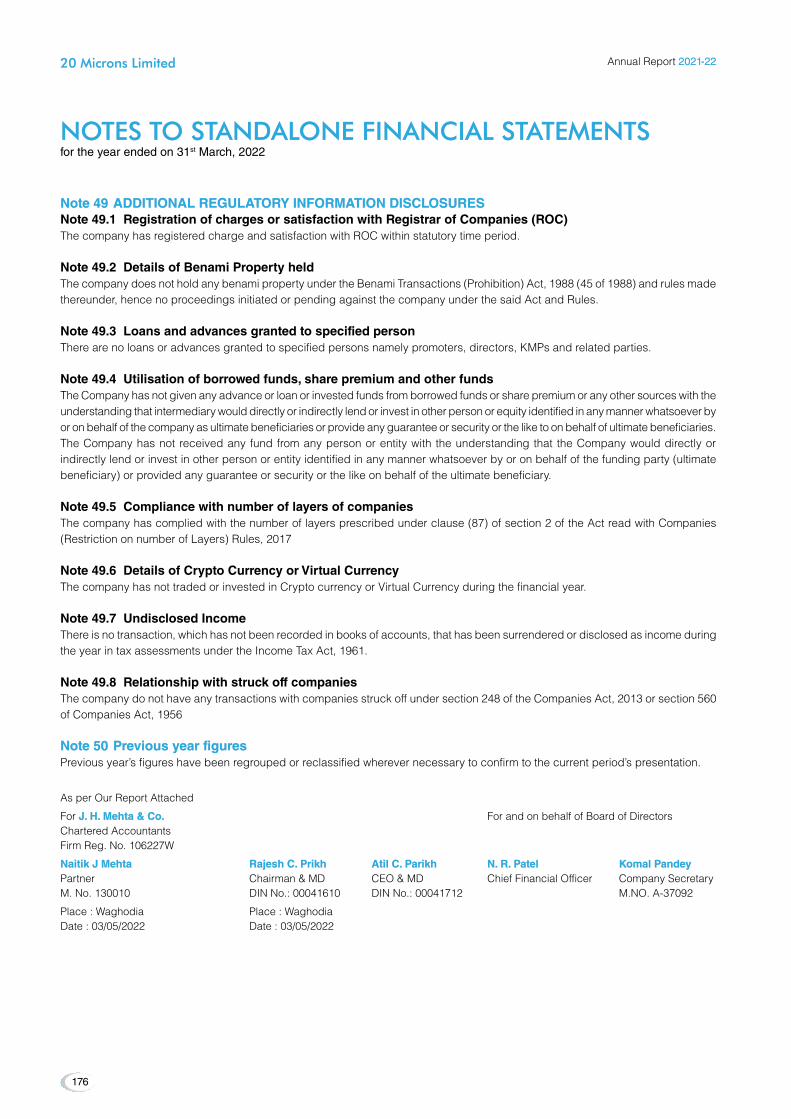
Note 49 ADDITIONAL ReGULATORY INFORMATION DISCLOSUReSNote 49 ADDITIONAL ReGULATORY INFORMATION DISCLOSUReSNote 49.1 Registration of charges or satisfaction with Registrar of Companies (ROC)The company has registered charge and satisfaction with ROC within statutory time period.
Note 49.2 Details of Benami Property heldThe company does not hold any benami property under the Benami Transactions (Prohibition) Act, 1988 (45 of 1988) and rules made thereunder, hence no proceedings initiated or pending against the company under the said Act and Rules.
Note 49.3 Loans and advances granted to specified personThere are no loans or advances granted to specified persons namely promoters, directors, KMPs and related parties.
Note 49.4 Utilisation of borrowed funds, share premium and other fundsThe Company has not given any advance or loan or invested funds from borrowed funds or share premium or any other sources with the understanding that intermediary would directly or indirectly lend or invest in other person or equity identified in any manner whatsoever by or on behalf of the company as ultimate beneficiaries or provide any guarantee or security or the like to on behalf of ultimate beneficiaries. The Company has not received any fund from any person or entity with the understanding that the Company would directly or indirectly lend or invest in other person or entity identified in any manner whatsoever by or on behalf of the funding party (ultimate beneficiary) or provided any guarantee or security or the like on behalf of the ultimate beneficiary.
Note 49.5 Compliance with number of layers of companiesThe company has complied with the number of layers prescribed under clause (87) of section 2 of the Act read with Companies (Restriction on number of Layers) Rules, 2017
Note 49.6 Details of Crypto Currency or Virtual CurrencyThe company has not traded or invested in Crypto currency or Virtual Currency during the financial year.
Note 49.7 Undisclosed IncomeThere is no transaction, which has not been recorded in books of accounts, that has been surrendered or disclosed as income during the year in tax assessments under the Income Tax Act, 1961.
Note 49.8 Relationship with struck off companiesThe company do not have any transactions with companies struck off under section 248 of the Companies Act, 2013 or section 560 of Companies Act, 1956
Note 50 Previous year figuresNote 50 Previous year figuresPrevious year’s figures have been regrouped or reclassified wherever necessary to confirm to the current period’s presentation.
NOTES TO STANDALONE FINANCIAL STATEMENTS NOTES TO STANDALONE FINANCIAL STATEMENTS for the year ended on 31st March, 2022
As per Our Report Attached
For J. H. Mehta & Co.J. H. Mehta & Co. ForandonbehalfofBoardofDirectorsChartered AccountantsFirm Reg. No. 106227W
Naitik J Mehta Rajesh C. Prikh Atil C. Parikh N. R. Patel Komal PandeyNaitik J Mehta Rajesh C. Prikh Atil C. Parikh N. R. Patel Komal PandeyPartner Chairman&MD CEO&MD ChiefFinancialOfficer CompanySecretaryM.No.130010 DINNo.:00041610 DINNo.:00041712 M.NO.A-37092
Place : Waghodia Place : WaghodiaDate:03/05/2022 Date:03/05/2022
Annual Report 2021-222021-22
176
20 Microns Limited20 Microns Limited
INDEPENDENT AUDITOR’S REPORT ON INDEPENDENT AUDITOR’S REPORT ON cONSOlIDATED FINANcIAl STATEMENTScONSOlIDATED FINANcIAl STATEMENTSTo The Members of 20 Microns Limited
Report on the Audit of the Consolidated Financial Statements
OpinionOpinionWe have audited the accompanying Consolidated Financial Statements of 20 Microns Limited (‘the Company’ or ‘the Holding Company’), its subsidiaries and associate company (the Holding company, its subsidiaries and associate company together referred to as “the Group”) which comprise the Consolidated Balance Sheet as at March 31, 2022, the Consolidated Statement of Profit and Loss (including Other Comprehensive Income), the Consolidated Statement of Cash Flow and the Consolidated Statement of Changes in Equity for the year ended on that date and notes to the Consolidated Financial Statements, including a summary of the significant accounting policies and other explanatory information (herein after referred to as the ‘Consolidated Financial Statements’).
In our opinion and to the best of our information and according to the explanations given to us, and based on the consideration of reports of the auditors on separate financial statements of the subsidiaries and associate company referred to in the Other Matters section below, the aforesaid Consolidated Financial Statements give the information required by the Companies Act, 2013 (“the Act”) in the manner so required and give a true and fair view in conformity with the Indian Accounting Standards prescribed under section 133 of the Act read with the Companies (Indian Accounting Standards) Rules, 2015, as amended (‘Ind AS’) and other accounting principles generally
accepted in India, of the consolidated state of affairs of the Group as at March 31, 2022 and their consolidated profit, their consolidated total comprehensive income, their consolidated cash flows and their consolidated changes in equity for the year ended on that date.
Basis for OpinionBasis for OpinionWe conducted our audit of the Consolidated Financial Statements in accordance with the Standards on Auditing (hereinafter referred to as “SAs”) specified under section 143 (10) of the Act. Our responsibilities under those Standards are further described in the Auditor’s Responsibilities for the Audit of the Consolidated Financial Statements section of our report. We are independent of the Group in accordance with the Code of Ethics issued by the Institute of Chartered Accountants of India (hereinafter referred to as “ICAI”) together with the ethical requirements that are relevant to our audit of the Consolidated Financial Statements under the provisions of the Act and the Rules made thereunder, and we have fulfilled our other ethical responsibilities in accordance with these requirements and the ICAI’s Code of Ethics. We believe that the audit evidence obtained by us and the audit evidence obtained by the other auditors in terms of their reports referred to in the paragraph of the Other Matters section below, is sufficient and appropriate to provide a basis for our audit opinion on the Consolidated Financial Statements.
Key Audit MatterKey Audit MatterKey audit matters are those matters that, in our professional judgment, were of most significance in our audit of the Consolidated Financial Statements of the current period. These matters were addressed in the context of our audit of the Consolidated Financial Statements as a whole, and in forming our opinion thereon, and we do not provide a separate opinion on these matters. We have determined the matters described below to be the key audit matters to be communicated in our report.
Sr. No. Key Audit Matter Auditor’s Response
1 Revenue Recognition
The Group has large product and customer portfolio and multiple business locations. The nature of the risk associated with the accurate recording of revenue varies. We recognise that revenue is a key metric upon which the Group is judged, that the Group has annual internal targets, and that the Group has incentive schemes that are partially impacted by revenue growth. We have determined that there is a risk of material misstatement in recognition of revenue considering the above.
We have determined this to be a key audit matter in view of exercise of management judgement and estimates and the significance of the amounts involved.
Principal Audit Procedure:
Our audit approach was a combination of test of internal controls and substantive procedures which included the following:
• We evaluated the design of internal controls relating to revenuerecognition.
• Weperformedfullandspecificscopeauditproceduresoverthisriskarea in major locations, which covered majority of the risk amount.
• Weassessedtheprocessesandtestedcontrolsovereachsignificantrevenue stream. We carried out a combination of procedures involving enquiry and observation, reperformance and inspection of evidence in respect of operation of the controls.
• We evaluated the appropriateness of journal entries impactingrevenue, as well as other adjustments made in the preparation of the Consolidated Financial Statements. We considered unusual journals such as those posted outside of expected days, or by unexpected individuals.
• Wealsoevaluatedmanagement’scontrolsoversuchadjustments.
177
Corporate Overview Notice Statutory Reports Financial StatementsFinancial Statements

Sr. No. Key Audit Matter Auditor’s Response
• Weinspectedasampleofcontractstocheckthatrevenuerecognitionwas in accordance with the contract terms and the group’s revenue recognition policies.
• We tested a sample of transactions around period end to test thatrevenue was recorded in the correct period.
• Forrevenuestreamswhichhavejudgementalelements,weevaluatedmanagement’s assumptions.
Basis the procedures performed, we have not noted any significant exceptions in the management assessment of Revenue Recognition.
2. Assessment of contingencies in respect of statutory claims and claims against Group not acknowledged as debt.
The group has various ongoing material uncertain statutory claims and claims against group not acknowledged as debt under dispute. Refer Note 41 to the Consolidated Financial Statements.
The assessment of the likely outcome of the matters and related outflow of resources involves significant judgement on the positions taken by the management which are based on the application and interpretation of law.
We have considered these matters to be a key audit matter given the materiality of the potential outflow of economic resources and uncertainty of the possible outcome.
Our procedures included the following:
• Understandingandevaluatingthedesignofoperatingeffectivenessofcontrols in respect of the legal matters.
• Readingtheordersreceivedbythecompanyfromauthorities.
• Discussingongoingmattersunderdisputeanddevelopmentswiththemanagement and the audit committee.
• Whererelevant,readingopinionsofManagements’externalconsultantson the tax matters.
• Independently assessing the Management’s judgement oncontingencies and provisions of statutory claims and other claims.
• Assessing adequacy of disclosure in the Consolidated FinancialStatements.
Based on the above procedures, the management’s assessment of contingencies in respect of statutory claims and claims against group not acknowledged as debt was considered to be appropriate.
Information Other than the Consolidated Financial Information Other than the Consolidated Financial Statements and Auditor’s Report ThereonStatements and Auditor’s Report ThereonTheHoldingCompany’sBoardofDirectors isresponsibleforthe preparation of the other information. The other information comprises the information included in the Board’s Report including Annexures to Board’s Report and Shareholder’s Information but does not include the Consolidated Financial Statements and our auditor’s report thereon. The other information is expected to be made available to us after the date of this auditor’s report.
Our opinion on the Consolidated Financial Statements does not cover the other information and we do not and will not express any form of assurance conclusion thereon.
In connection with our audit of the Consolidated Financial Statements, our responsibility is to read the other information identified above when it becomes available, compare with the financial statements of the subsidiaries and associate Company audited by the other auditors, to the extent it relates to these entities and, in doing so, place reliance on the work of the other auditors and consider whether the other information is materially inconsistent with the Consolidated Financial Statements or our knowledge obtained during the course of our audit or otherwise appears to be materially misstated. Other information so far as it relates to the subsidiaries and associate Company, is traced from their financial statements audited by other auditors.
When we read the Other Information, if we conclude that there is a material misstatement therein, we are required to communicate the matter to those charged with governance as required under SA 720 ‘The Auditor’s responsibilities Relating to Other Information’.
Management’s Responsibility for the Consolidated Management’s Responsibility for the Consolidated Financial StatementsFinancial StatementsTheHoldingCompany’sBoardofDirectors isresponsibleforthe matters stated in section 134(5) of the Act with respect to the preparation of these Consolidated Financial Statements that give a true and fair view of the consolidated financial position, consolidated financial performance, consolidated total comprehensive income, consolidated changes in equity and consolidated cash flows of the Group in accordance with the Ind AS and other accounting principles generally accepted in India. TherespectiveBoardofDirectorsof thecompanies includedin the Group are responsible for maintenance of adequate accounting records in accordance with the provisions of the Act for safeguarding of the assets of the Group and for preventing and detecting frauds and other irregularities; selection and application of appropriate accounting policies; making judgments and estimates that are reasonable and prudent; and the design, implementation and maintenance of adequate internal financial controls, that were operating effectively for ensuring the accuracy and completeness of the accounting records, relevant to the preparation and presentation of the Consolidated Financial Statements that give a true and fair view and are free from material misstatement, whether due to fraud or error, which have been used for the purpose of preparation oftheConsolidatedFinancialStatementsbytheDirectorsoftheHolding Company, as aforesaid.
In preparing the Consolidated Financial Statements, the respectiveBoardofDirectors of the companies included inthe Group are responsible for assessing Group’s the ability to continue as a going concern, disclosing, as applicable, matters related to going concern and using the going concern basis of accounting unless management either intends to liquidate the
Annual Report 2021-222021-22
178
20 Microns Limited20 Microns Limited
Group or to cease operations, or has no realistic alternative but to do so.
TherespectiveBoardofDirectorsofthecompaniesincludedinthe Group are responsible for overseeing the financial reporting of the Group.
Auditor’s Responsibilities for the Audit of the Auditor’s Responsibilities for the Audit of the Consolidated Financial StatementsConsolidated Financial StatementsOur objectives are to obtain reasonable assurance about whether the Consolidated Financial Statements as a whole are free from material misstatement, whether due to fraud or error, and to issue an auditor’s report that includes our opinion. Reasonable assurance is a high level of assurance, but is not a guarantee that an audit conducted in accordance with SAs will always detect a material misstatement when it exists. Misstatements can arise from fraud or error and are considered material if, individually or in the aggregate, they could reasonably be expected to influence the economic decisions of users taken on the basis of these Consolidated Financial Statements.
As part of an audit in accordance with SAs, we exercise professional judgment and maintain professional skepticism throughout the audit. We also:
- Identify and assess the risks of material misstatement of the Consolidated Financial Statements, whether due to fraud or error, design and perform audit procedures responsive to those risks, and obtain audit evidence that is sufficient and appropriate to provide a basis for our opinion. The risk of not detecting a material misstatement resulting from fraud is higher than for one resulting from error, as fraud may involve collusion, forgery, intentional omissions, misrepresentations, or the override of internal control.
- Obtain an understanding of internal financial controls relevant to the audit in order to design audit procedures that areappropriateinthecircumstances.Undersection143(3)(i) of the Companies Act, 2013, we are also responsible for expressing our opinion on whether the company has adequate internal financial controls system in place and the operating effectiveness of such controls.
- Evaluate the appropriateness of accounting policies used and the reasonableness of accounting estimates and related disclosures made by management.
- Conclude on the appropriateness of management’s use of the going concern basis of accounting and, based on the audit evidence obtained, whether a material uncertainty exists related to events or conditions that may cast significant doubt on the Group’s ability to continue as a going concern. If we conclude that a material uncertainty exists, we are required to draw attention in our auditor’s report to the related disclosures in the Consolidated Financial Statements or, if such disclosures are inadequate, to modify our opinion. Our conclusions are based on the audit evidence obtained up to the date of our auditor’s
report. However, future events or conditions may cause the Group to cease to continue as a going concern.
- Evaluate the overall presentation, structure and content of the Consolidated Financial Statements, including the disclosures, and whether the Consolidated Financial Statements represent the underlying transactions and events in a manner that achieves fair presentation.
- Obtain sufficient appropriate audit evidence regarding the financial information of the entities within the Group to express an opinion on the Consolidated Financial Statements. We are responsible for the direction, supervision and performance of the audit of the financial statements of such entity included in the Consolidated Financial Statements of which we are the independent auditors. For the other entity included in the Consolidated Financial Statements, which have been audited by other auditor, such other auditor remain responsible for the direction, supervision and performance of the audits carried out by them. We remain solely responsible for our audit opinion.
We communicate with those charged with governance of the Holding Company regarding, among other matters, the planned scope and timing of the audit and significant audit findings, including any significant deficiencies in internal control that we identify during our audit.
We also provide those charged with governance with a statement that we have complied with relevant ethical requirements regarding independence, and to communicate with them all relationships and other matters that may reasonably be thought to bear on our independence, and where applicable, related safeguards.
From the matters communicated with those charged with governance, we determine those matters that were of most significance in the audit of the Consolidated Financial Statements of the current period and are therefore the key audit matters. We describe these matters in our auditor’s report unless law or regulation precludes public disclosure about the matter or when, in extremely rare circumstances, we determine that a matter should not be communicated in our report because the adverse consequences of doing so would reasonably be expected to outweigh the public interest benefits of such communication.
Other MattersOther MattersWe did not audit the financial statements of 5 subsidiaries, whose financial statements reflect total assets of `9,736.44 Lakh as at 31st March, 2022, total revenues of `9,704.58 Lakh, total net profit after tax (before consolidation adjustments) of `403.23 Lakh, total comprehensive income (before consolidation adjustments) of ̀ 402.08 Lakh and cashflows (net) amounting to `27.99 Lakh for the year ended on that date, as considered in the Consolidated Financial Statements. The Consolidated financial statements also include Group’s share of net profit/(loss) after tax of `1.33 Lakh and total comprehensive income/
179
Corporate Overview Notice Statutory Reports Financial StatementsFinancial Statements

(loss) of `1.33 Lakhs for the year ended on 31st March, 2022 in respect of an associate. These financial statements have been audited by other auditors whose reports have been furnished to us by the Management and our opinion on the Consolidated Financial Statements, in so far as it relates to the amounts and disclosures included in respect of these subsidiaries, and our report in terms of subsection (3) of Section 143 of the Act, in so far as it relates to the aforesaid subsidiaries and associate is based solely on the reports of the other auditors.
Our opinion on the Consolidated Financial Statements, and our Report on other legal and regulatory requirements below, is not modified in respect of the above matters with respect to our reliance on the work done and the report of the other auditors.
Report on Other Legal and Regulatory RequirementsReport on Other Legal and Regulatory Requirements1. As required by Section 143(3) of the Act, based on our audit
and on the consideration of the reports of other auditors on the separate financial statements of the subsidiaries and associate Company referred to in the Other Matters section above we report, to the extent applicable that:
a) We have sought and obtained all the information and explanations which to the best of our knowledge and belief were necessary for the purposes of our audit of the aforesaid Consolidated Financial Statements.
b) In our opinion proper books of account as required by law relating to preparation of the aforesaid Consolidated Financial Statements have been kept so far as it appears from our examination of those books and report of other auditors.
c) The Consolidated Balance Sheet, the Consolidated Statement of Profit and Loss including Other Comprehensive Income, Consolidated Statement of Changes in Equity and Consolidated the statement of Cash Flow dealt with by this Report are in agreement with the relevant books of account maintained for the purpose of preparation of the Consolidated Financial Statements.
d) In our opinion, the aforesaid Consolidated Financial Statements comply with the Ind AS specified under Section 133 of the Act.
e) On the basis of the written representations received from the directors of the Holding Company as on April 01, 2021 taken on record by the Board of Directors of the Holding Company and report ofstatutory auditor of its subsidiaries and associate companies, none of the directors of the Group Companies is disqualified as on March 31, 2022 from being appointed as a director in terms of Section 164 (2) of the Act.
f) With respect to the adequacy of the internal financial controls over financial reporting of the Group and
the operating effectiveness of such controls, refer to our separate report in Annexure A which is based on the auditors’ reports of the Holding company and subsidiaries and associated company incorporated in India. Our report expresses an unmodified opinion on the adequacy and operating effectiveness of the internal financial controls over financial reporting.
g) With respect to the other matters to be included in the Auditor’s Report in accordance with the requirements of section 197(16) of the Act, as amended, we report that, in our opinion and to the best of our information and according to the explanations given to us, the remuneration paid by the Group to its Managing and ExecutiveDirectorsduringtheyearisinaccordancewith the provisions of section 197 of the Act.
h) With respect to the other matters to be included in the Auditor’s Report in accordance with Rule 11 of the Companies (Audit and Auditors) Rules, 2014, in our opinion and to the best of our information and according to the explanations given to us:
(i) The Consolidated Financial Statements disclose the impact of pending litigations on the consolidated financial position of the Group– Refer Note 41 to the Consolidated Financial Statements.
(ii) The Group did not have any material foreseeable losses on long-term contracts including derivative contracts.
(iii) There were no amounts which were required to be transferred to the Investor Education and Protection Fund by the Group during the year ended March 31, 2022
(iv) a) The Management of the Holding Company has represented that, to the best of its knowledge and belief, no funds (which are material either individually or in the aggregate) have been advanced or loaned or invested (either from borrowed funds or share premium or any other sources or kind of funds) by the Holding Company to or in any other person or entity, including foreign entity (“Intermediaries”), with the understanding, whether recorded in writing or otherwise, that the Intermediary shall, directly or indirectly lend or invest in other persons or entities identified in any manner whatsoever by or on behalf of the Holding Company (“Ultimate Beneficiaries”) orprovide any guarantee, security or the like onbehalfoftheUltimateBeneficiaries;
Annual Report 2021-222021-22
180
20 Microns Limited20 Microns Limited
b) The Management of the Holding Company has represented, that, to the best of its knowledge and belief, no funds (which are material either individually or in the aggregate) have been received by the Hodling Company from any person or entity, including foreign entity (“Funding Parties”), with the understanding, whether recorded in writing or otherwise, that the Holding Company shall, directly or indirectly, lend or invest in other persons or entities identified in any manner whatsoever by or on behalf of the Funding Party(“UltimateBeneficiaries”)orprovideany guarantee, security or the like on behalfoftheUltimateBeneficiaries;
c) Based on the audit procedures that have been considered reasonable and appropriate in the circumstances, performed by us on the Holding Company, nothing has come to our notice that has caused us to believe that the representations under sub-clause (i) and (ii) of Rule 11(e), as provided under (a) and (b) above, contain any material misstatement.
(v) The company has not declared any dividend in the previous year and hence reporting requirement for compliance with section 123 of the Act is not applicable.
(vi) With respect to the matters specified in paragraphs 3(xxi) and 4 of the Companies (Auditor’s Report) Order, 2020 (the “Order”/ “CARO”) issued by the Central Government in terms of Section 143(11) of the Act, to be included in the Auditor’s report, according to the information and explanations given to us, and based on the CARO reports issued by the auditors of the subsidiaries and associate company included in the Consolidated Financial Statements of the Company, to which reporting under CARO is applicable, provided to us by the Management of the Company and based on the identification of matters of qualifications or adverse remarks in their CARO reports by the respective component auditors and provided to us, we report that the auditors of such companies have not reported any qualifications or adverse remarks in their CARO report.
For, J. H. Mehta & Co.Chartered Accountants
ICAI Firm Regn. No. 106227W
(Naitik J Mehta)Place: Ahemdabad PartnerDate: 03/05/2022 Membership No. 130010 UDIN: 22130010AIRRHR7015
181
Corporate Overview Notice Statutory Reports Financial StatementsFinancial Statements
ANNExURE - AANNExURE - ATO THe INDePeNDeNT AUDITOR’S RePORT
(Referred to in paragraph 1(f)under “Report on Other Legal and Regulatory Requirements” section of our report to the members of 20 Microns Limited of even date)
Report on the Internal Financial Controls over Report on the Internal Financial Controls over Financial Reporting under Clause (i) of Sub-Financial Reporting under Clause (i) of Sub-section 3 of Section 143 of the Companies Act, 2013 section 3 of Section 143 of the Companies Act, 2013 (“the Act”)(“the Act”)In conjunction with our audit of the Consolidated Financial Statements of 20 Microns Limited (hereinafter referred to as “Holding Company”) and it’s subsidiaries and associated company, incorporated in India, as of that date, as of and for the year ended March 31, 2022, we have also audited the internal financial controls over financial reporting of the Companies.
Management’s Responsibility for Internal Financial Management’s Responsibility for Internal Financial Controls Controls TherespectiveBoardofDirectorsoftheHoldingCompanyandits subsidiaries and associate company, incorporated in India, are responsible for establishing and maintaining internal financial controls based on the internal control over financial reporting criteria established by these Companies considering the essential components of internal control stated in the Guidance Note on Audit of Internal Financial Controls over Financial Reporting issued by the Institute of Chartered Accountants of India (“the ICAI”). These responsibilities include the design, implementation and maintenance of adequate internal financial controls that were operating effectively for ensuring the orderly and efficient conduct of its business, including adherence to the Company’s policies, the safeguarding of its assets, the prevention and detection of frauds and errors, the accuracy and completeness of the accounting records, and the timely preparation of reliable financial information, as required under the Act.
Auditor’s Responsibility Auditor’s Responsibility Our responsibility is to express an opinion on the internal financial controls over financial reporting of the Company and its subsidiaries and associate company, incorporated in India, based on our audit. We conducted our audit in accordance with the Guidance Note on Audit of Internal Financial Controls Over Financial Reporting (the “Guidance Note”) issued by the Institute of Chartered Accountants of India and the Standards on Auditing, prescribed under Section 143(10) of the Companies Act, 2013, to the extent applicable to an audit of internal financial controls. Those Standards and the Guidance Note require that we comply with ethical requirements and plan and perform the audit to obtain reasonable assurance about whether adequate internal financial controls over financial reporting was established and maintained and if such controls operated effectively in all material respects.
Our audit involves performing procedures to obtain audit evidence about the adequacy of the internal financial controls system over financial reporting and their operating effectiveness. Our audit of internal financial controls over financial reporting included obtaining an understanding of internal financial controls over financial reporting, assessing the risk that a material weakness exists, and testing and evaluating the design and operating effectiveness of internal control based on the assessed risk. The procedures selected depend on the auditor’s judgment, including the assessment of the risks of material misstatement of the Consolidated Financial Statements, whether due to fraud or error.
We believe that the audit evidence we have obtained is sufficient and appropriate to provide a basis for our audit opinion on the internal financial controls system over financial reporting of the Holding Company and its subsidiaries and associate company, incorporated in India.
Meaning of Internal Financial Controls over Meaning of Internal Financial Controls over Financial Reporting Financial Reporting A company’s internal financial control over financial reporting is a process designed to provide reasonable assurance regarding the reliability of financial reporting and the preparation of financial statements for external purposes in accordance with generally accepted accounting principles. A company’s internal financial control over financial reporting includes those policies and procedures that:
1) pertain to the maintenance of records that, in reasonable detail, accurately and fairly reflect the transactions and dispositions of the assets of the company;
2) provide reasonable assurance that transactions are recorded as necessary to permit preparation of financial statements in accordance with generally accepted accounting principles, and that receipts and expenditures of the company are being made only in accordance with authorizations of management and directors of the company; and
3) provide reasonable assurance regarding prevention or timely detection of unauthorized acquisition, use, or disposition of the company’s assets that could have a material effect on the financial statements.
Inherent Limitations of Internal Financial Controls Inherent Limitations of Internal Financial Controls over Financial Reporting over Financial Reporting Because of the inherent limitations of internal financial controls over financial reporting, including the possibility of collusion or improper management override of controls, material misstatements due to error or fraud may occur and not be detected. Also, projections of any evaluation of the internal
Annual Report 2021-222021-22
182
20 Microns Limited20 Microns Limited
financial controls over financial reporting to future periods are subject to the risk that the internal financial control over financial reporting may become inadequate because of changes in conditions, or that the degree of compliance with the policies or procedures may deteriorate.
OpinionOpinionIn our opinion, the Holding Company and its subsidiaries and associate company, incorporated in India, have, in all material respects, an adequate internal financial controls system over financial reporting and such internal financial controls over financial reporting were operating effectively as at March 31, 2022, based on the internal control over financial reporting criteria established by these Companies considering the essential components of internal control stated in the Guidance Note on Audit of Internal Financial Controls Over Financial Reporting issued by the Institute of Chartered Accountants of India
Other Matters Other Matters Our aforesaid report under section 143(3)(i) of the Act on the adequacy and operating effectiveness of the internal financial controls over financial reporting insofar as it relates to its subsidiaries and associate company, incorporated in India, is based on the corresponding reports of the auditors of the company.
For, J. H. Mehta & Co.Chartered Accountants
ICAI Firm Regn. No. 106227W
(Naitik J Mehta)Place: Ahemdabad PartnerDate: 03/05/2022 Membership No. 130010 UDIN: 22130010AIRRHR7015
183
Corporate Overview Notice Statutory Reports Financial StatementsFinancial Statements
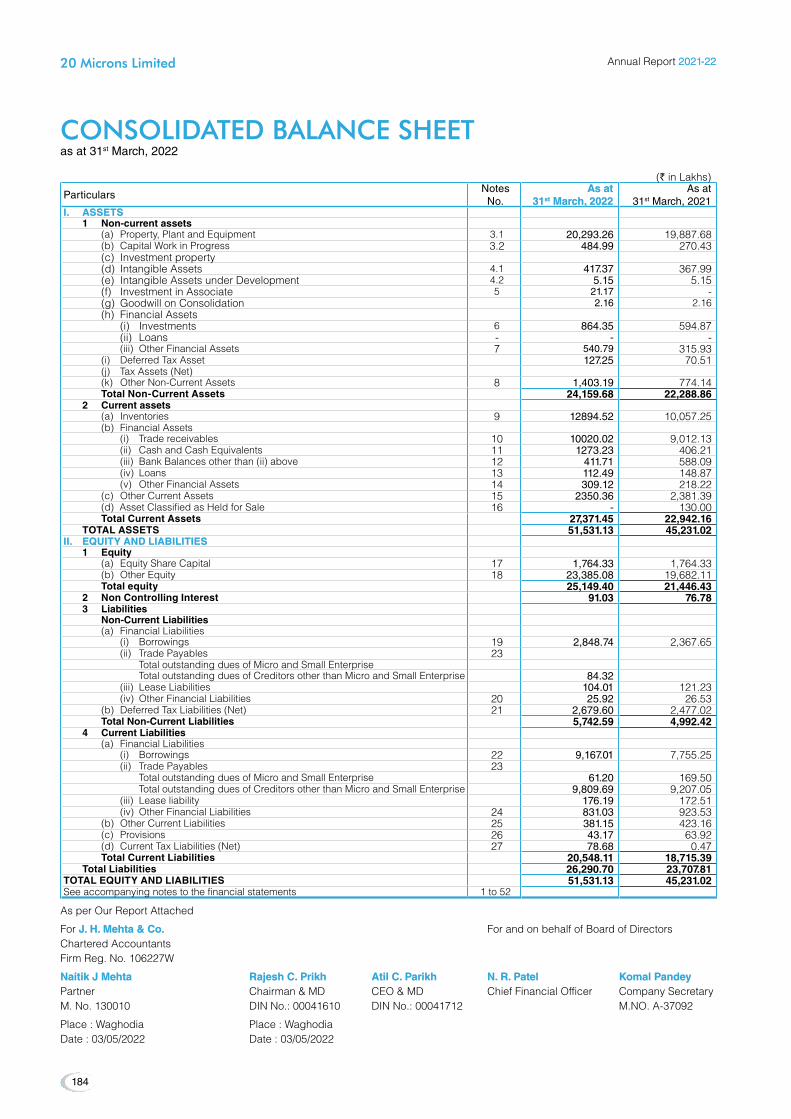
(` in Lakhs)
ParticularsNotes No.
As at As at 3131stst March, 2022 March, 2022
As at 31st March, 2021
I. ASSeTSI. ASSeTS 1 Non-current assets (a) Property, Plant and Equipment 3.1 20,293.26 19,887.68 (b) Capital Work in Progress 3.2 484.99 270.43 (c) Investment property (d) Intangible Assets 4.1 417.37 367.99 (e) IntangibleAssetsunderDevelopment 4.2 5.15 5.15 (f) Investment in Associate 5 21.17 - (g) Goodwill on Consolidation 2.16 2.16 (h) Financial Assets (i) Investments 6 864.35 594.87 (ii) Loans - - - (iii) Other Financial Assets 7 540.79 315.93 (i) DeferredTaxAsset 127.25 70.51 (j) Tax Assets (Net) (k) Other Non-Current Assets 8 1,403.19 774.14 Total Non-Current Assets 24,159.68 22,288.86 2 Current assets (a) Inventories 9 12894.52 10,057.25 (b) Financial Assets (i) Trade receivables 10 10020.02 9,012.13 (ii) Cash and Cash Equivalents 11 1273.23 406.21 (iii) Bank Balances other than (ii) above 12 411.71 588.09 (iv) Loans 13 112.49 148.87 (v) Other Financial Assets 14 309.12 218.22 (c) Other Current Assets 15 2350.36 2,381.39 (d) Asset Classified as Held for Sale 16 - 130.00 Total Current Assets 27,371.45 22,942.16 TOTAL ASSeTS 51,531.13 45,231.02 II. eQUITY AND LIABILITIeSII. eQUITY AND LIABILITIeS 1 equity (a) Equity Share Capital 17 1,764.33 1,764.33 (b) Other Equity 18 23,385.08 19,682.11 Total equity 25,149.40 21,446.43 2 Non Controlling Interest 91.03 76.78 3 Liabilities Non-Current Liabilities (a) Financial Liabilities (i) Borrowings 19 2,848.74 2,367.65 (ii) Trade Payables 23 Total outstanding dues of Micro and Small Enterprise Total outstanding dues of Creditors other than Micro and Small Enterprise 84.32 (iii) Lease Liabilities 104.01 121.23 (iv) Other Financial Liabilities 20 25.92 26.53 (b) DeferredTaxLiabilities(Net) 21 2,679.60 2,477.02 Total Non-Current Liabilities 5,742.59 4,992.42 4 Current Liabilities (a) Financial Liabilities (i) Borrowings 22 9,167.01 7,755.25 (ii) Trade Payables 23 Total outstanding dues of Micro and Small Enterprise 61.20 169.50 Total outstanding dues of Creditors other than Micro and Small Enterprise 9,809.69 9,207.05 (iii) Lease liability 176.19 172.51 (iv) Other Financial Liabilities 24 831.03 923.53 (b) Other Current Liabilities 25 381.15 423.16 (c) Provisions 26 43.17 63.92 (d) Current Tax Liabilities (Net) 27 78.68 0.47 Total Current Liabilities 20,548.11 18,715.39 Total Liabilities 26,290.70 23,707.81 TOTAL eQUITY AND LIABILITIeS 51,531.13 45,231.02 See accompanying notes to the financial statements 1 to 52
cONSOlIDATED BAlANcE ShEETcONSOlIDATED BAlANcE ShEETas at 31st March, 2022
As per Our Report Attached
For J. H. Mehta & Co.J. H. Mehta & Co. ForandonbehalfofBoardofDirectorsChartered AccountantsFirm Reg. No. 106227W
Naitik J Mehta Rajesh C. Prikh Atil C. Parikh N. R. Patel Komal PandeyNaitik J Mehta Rajesh C. Prikh Atil C. Parikh N. R. Patel Komal PandeyPartner Chairman&MD CEO&MD ChiefFinancialOfficer CompanySecretaryM.No.130010 DINNo.:00041610 DINNo.:00041712 M.NO.A-37092
Place : Waghodia Place : WaghodiaDate:03/05/2022 Date:03/05/2022
Annual Report 2021-222021-22
184
20 Microns Limited20 Microns Limited
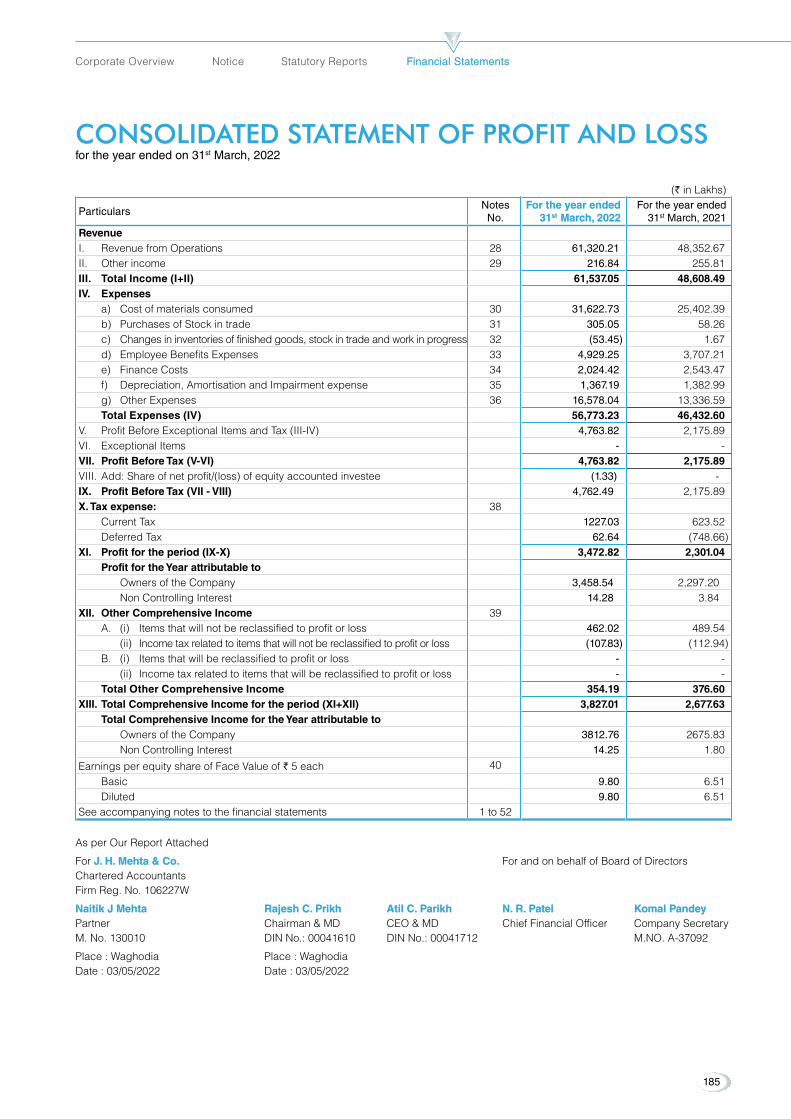
As per Our Report Attached
For J. H. Mehta & Co.J. H. Mehta & Co. ForandonbehalfofBoardofDirectorsChartered AccountantsFirm Reg. No. 106227W
Naitik J Mehta Rajesh C. Prikh Atil C. Parikh N. R. Patel Komal PandeyNaitik J Mehta Rajesh C. Prikh Atil C. Parikh N. R. Patel Komal PandeyPartner Chairman&MD CEO&MD ChiefFinancialOfficer CompanySecretaryM.No.130010 DINNo.:00041610 DINNo.:00041712 M.NO.A-37092
Place : Waghodia Place : WaghodiaDate:03/05/2022 Date:03/05/2022
cONSOlIDATED STATEMENT OF PROFIT AND lOSScONSOlIDATED STATEMENT OF PROFIT AND lOSSfor the year ended on 31st March, 2022
(` in Lakhs)
ParticularsNotes No.
For the year ended For the year ended 3131st st March, 2022March, 2022
For the year ended 31st March, 2021
RevenueI. Revenue from Operations 28 61,320.21 48,352.67 II. Other income 29 216.84 255.81 III. Total Income (I+II) 61,537.05 48,608.49 IV. expenses a) Cost of materials consumed 30 31,622.73 25,402.39 b) Purchases of Stock in trade 31 305.05 58.26 c) Changes in inventories of finished goods, stock in trade and work in progress 32 (53.45) 1.67 d) Employee Benefits Expenses 33 4,929.25 3,707.21 e) Finance Costs 34 2,024.42 2,543.47 f) Depreciation,AmortisationandImpairmentexpense 35 1,367.19 1,382.99 g) Other Expenses 36 16,578.04 13,336.59 Total expenses (IV) 56,773.23 46,432.60 V. Profit Before Exceptional Items and Tax (III-IV) 4,763.82 2,175.89 VI. Exceptional Items - - VII. Profit Before Tax (V-VI) 4,763.82 2,175.89 VIII. Add: Share of net profit/(loss) of equity accounted investee (1.33) - IX. Profit Before Tax (VII - VIII) 4,762.49 2,175.89 X. Tax expense: 38 Current Tax 1227.03 623.52 DeferredTax 62.64 (748.66)XI. Profit for the period (IX-X) 3,472.82 2,301.04 Profit for the Year attributable to Owners of the Company 3,458.54 2,297.20 Non Controlling Interest 14.28 3.84 XII. Other Comprehensive Income 39 A. (i) Items that will not be reclassified to profit or loss 462.02 489.54 (ii) Income tax related to items that will not be reclassified to profit or loss (107.83) (112.94) B. (i) Items that will be reclassified to profit or loss - - (ii) Income tax related to items that will be reclassified to profit or loss - - Total Other Comprehensive Income 354.19 376.60 XIII. Total Comprehensive Income for the period (XI+XII) 3,827.01 2,677.63 Total Comprehensive Income for the Year attributable to Owners of the Company 3812.76 2675.83 Non Controlling Interest 14.25 1.80
Earnings per equity share of Face Value of ` 5 each 40
Basic 9.80 6.51 Diluted 9.80 6.51See accompanying notes to the financial statements 1 to 52
185
Corporate Overview Notice Statutory Reports Financial StatementsFinancial Statements
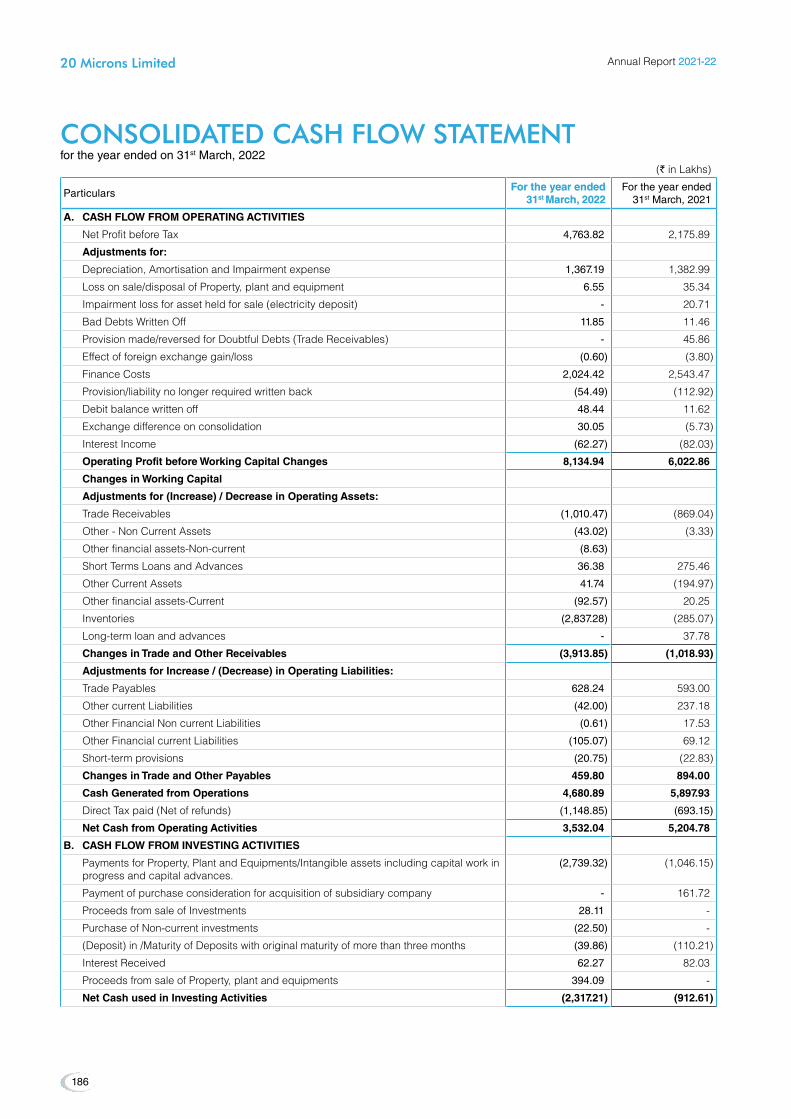
cONSOlIDATED cASh FlOW STATEMENTcONSOlIDATED cASh FlOW STATEMENTfor the year ended on 31st March, 2022
(` in Lakhs)
ParticularsFor the year ended For the year ended
3131st st March, 2022March, 2022For the year ended
31st March, 2021
A. CASH FLOW FROM OPeRATING ACTIVITIeS
Net Profit before Tax 4,763.82 2,175.89
Adjustments for:
Depreciation,AmortisationandImpairmentexpense 1,367.19 1,382.99
Loss on sale/disposal of Property, plant and equipment 6.55 35.34
Impairment loss for asset held for sale (electricity deposit) - 20.71
BadDebtsWrittenOff 11.85 11.46
Provisionmade/reversedforDoubtfulDebts(TradeReceivables) - 45.86
Effect of foreign exchange gain/loss (0.60) (3.80)
Finance Costs 2,024.42 2,543.47
Provision/liability no longer required written back (54.49) (112.92)
Debitbalancewrittenoff 48.44 11.62
Exchange difference on consolidation 30.05 (5.73)
Interest Income (62.27) (82.03)
Operating Profit before Working Capital Changes 8,134.94 6,022.86
Changes in Working Capital
Adjustments for (Increase) / Decrease in Operating Assets:
Trade Receivables (1,010.47) (869.04)
Other - Non Current Assets (43.02) (3.33)
Other financial assets-Non-current (8.63)
Short Terms Loans and Advances 36.38 275.46
Other Current Assets 41.74 (194.97)
Other financial assets-Current (92.57) 20.25
Inventories (2,837.28) (285.07)
Long-term loan and advances - 37.78
Changes in Trade and Other Receivables (3,913.85) (1,018.93)
Adjustments for Increase / (Decrease) in Operating Liabilities:
Trade Payables 628.24 593.00
Other current Liabilities (42.00) 237.18
Other Financial Non current Liabilities (0.61) 17.53
Other Financial current Liabilities (105.07) 69.12
Short-term provisions (20.75) (22.83)
Changes in Trade and Other Payables 459.80 894.00
Cash Generated from Operations 4,680.89 5,897.93
DirectTaxpaid(Netofrefunds) (1,148.85) (693.15)
Net Cash from Operating Activities 3,532.04 5,204.78
B. CASH FLOW FROM INVeSTING ACTIVITIeS
Payments for Property, Plant and Equipments/Intangible assets including capital work in progress and capital advances.
(2,739.32) (1,046.15)
Payment of purchase consideration for acquisition of subsidiary company - 161.72
Proceeds from sale of Investments 28.11 -
Purchase of Non-current investments (22.50) -
(Deposit)in/MaturityofDepositswithoriginalmaturityofmorethanthreemonths (39.86) (110.21)
Interest Received 62.27 82.03
Proceeds from sale of Property, plant and equipments 394.09 -
Net Cash used in Investing Activities (2,317.21) (912.61)
Annual Report 2021-222021-22
186
20 Microns Limited20 Microns Limited
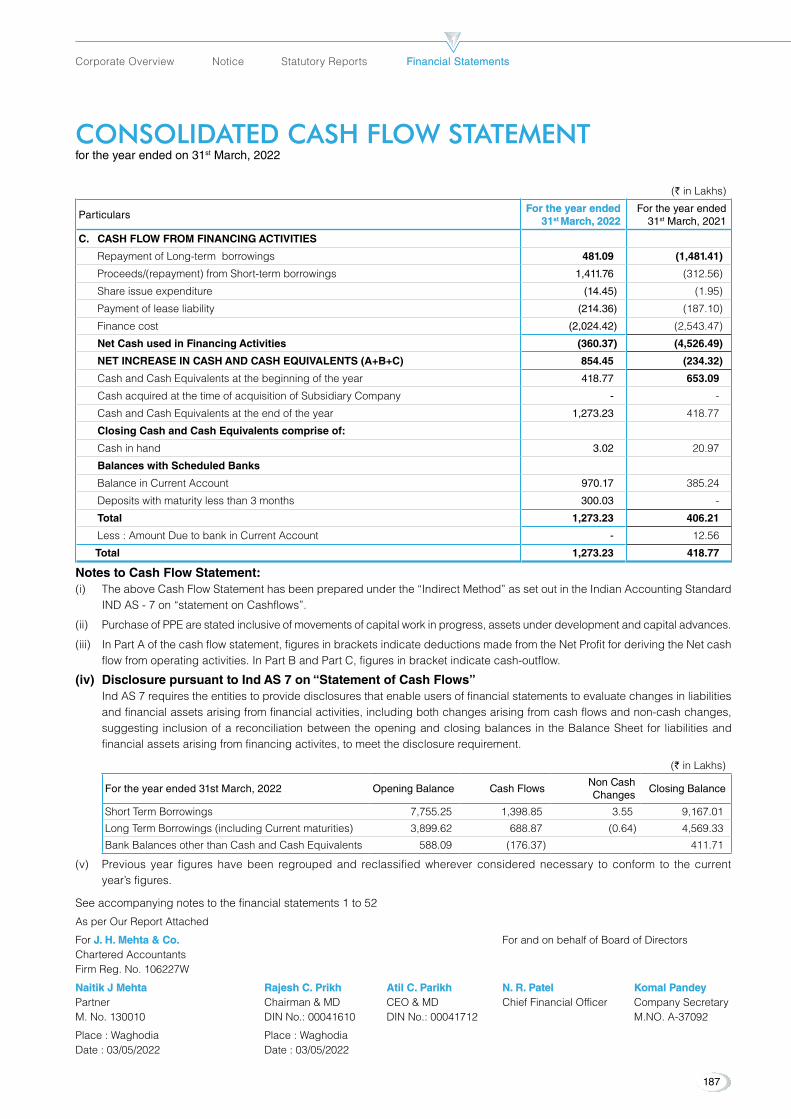
cONSOlIDATED cASh FlOW STATEMENTcONSOlIDATED cASh FlOW STATEMENTfor the year ended on 31st March, 2022
(` in Lakhs)
ParticularsFor the year ended For the year ended
3131st st March, 2022March, 2022For the year ended
31st March, 2021
C. CASH FLOW FROM FINANCING ACTIVITIeS
Repayment of Long-term borrowings 481.09 (1,481.41)
Proceeds/(repayment) from Short-term borrowings 1,411.76 (312.56)
Share issue expenditure (14.45) (1.95)
Payment of lease liability (214.36) (187.10)
Finance cost (2,024.42) (2,543.47)
Net Cash used in Financing Activities (360.37) (4,526.49)
NeT INCReASe IN CASH AND CASH eQUIVALeNTS (A+B+C) 854.45 (234.32)
Cash and Cash Equivalents at the beginning of the year 418.77 653.09
Cash acquired at the time of acquisition of Subsidiary Company - -
Cash and Cash Equivalents at the end of the year 1,273.23 418.77
Closing Cash and Cash equivalents comprise of:
Cash in hand 3.02 20.97
Balances with Scheduled Banks
Balance in Current Account 970.17 385.24
Depositswithmaturitylessthan3months 300.03 -
Total 1,273.23 406.21
Less:AmountDuetobankinCurrentAccount - 12.56
Total 1,273.23 418.77
Notes to Cash Flow Statement:(i) The above Cash Flow Statement has been prepared under the “Indirect Method” as set out in the Indian Accounting Standard
INDAS-7on“statementonCashflows”.
(ii) Purchase of PPE are stated inclusive of movements of capital work in progress, assets under development and capital advances.
(iii) In Part A of the cash flow statement, figures in brackets indicate deductions made from the Net Profit for deriving the Net cash flow from operating activities. In Part B and Part C, figures in bracket indicate cash-outflow.
(iv) Disclosure pursuant to Ind AS 7 on “Statement of Cash Flows” Ind AS 7 requires the entities to provide disclosures that enable users of financial statements to evaluate changes in liabilities
and financial assets arising from financial activities, including both changes arising from cash flows and non-cash changes, suggesting inclusion of a reconciliation between the opening and closing balances in the Balance Sheet for liabilities and financial assets arising from financing activites, to meet the disclosure requirement.
(` in Lakhs)
For the year ended 31st March, 2022 Opening Balance Cash FlowsNon Cash Changes
Closing Balance
Short Term Borrowings 7,755.25 1,398.85 3.55 9,167.01
Long Term Borrowings (including Current maturities) 3,899.62 688.87 (0.64) 4,569.33
Bank Balances other than Cash and Cash Equivalents 588.09 (176.37) 411.71
(v) Previous year figures have been regrouped and reclassified wherever considered necessary to conform to the current year’s figures.
See accompanying notes to the financial statements 1 to 52
As per Our Report Attached
For J. H. Mehta & Co.J. H. Mehta & Co. ForandonbehalfofBoardofDirectorsChartered AccountantsFirm Reg. No. 106227W
Naitik J Mehta Rajesh C. Prikh Atil C. Parikh N. R. Patel Komal PandeyNaitik J Mehta Rajesh C. Prikh Atil C. Parikh N. R. Patel Komal PandeyPartner Chairman&MD CEO&MD ChiefFinancialOfficer CompanySecretaryM.No.130010 DINNo.:00041610 DINNo.:00041712 M.NO.A-37092
Place : Waghodia Place : WaghodiaDate:03/05/2022 Date:03/05/2022
187
Corporate Overview Notice Statutory Reports Financial StatementsFinancial Statements
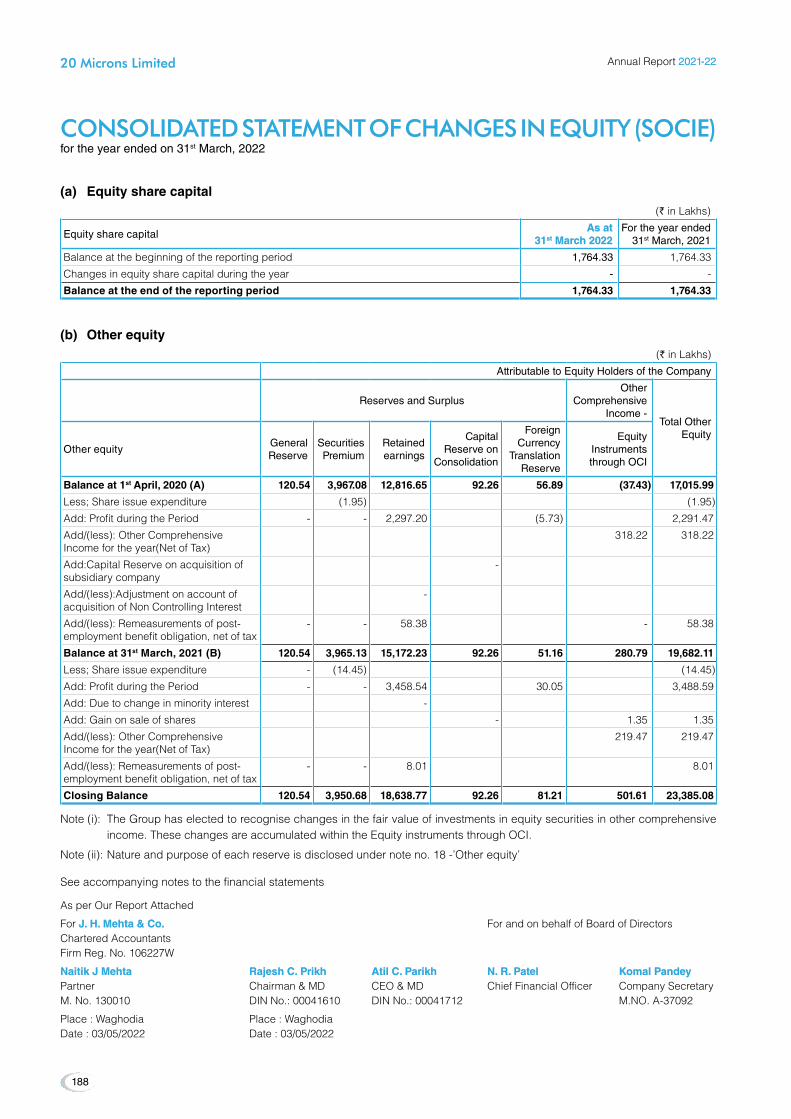
cONSOlIDATED STATEMENT OF chANGES IN EQUITY (SOcIE)cONSOlIDATED STATEMENT OF chANGES IN EQUITY (SOcIE) for the year ended on 31st March, 2022
(a) equity share capital(` in Lakhs)
Equity share capitalAs at As at
3131stst March 2022 March 2022For the year ended
31st March, 2021
Balance at the beginning of the reporting period 1,764.33 1,764.33
Changes in equity share capital during the year - -
Balance at the end of the reporting period 1,764.33 1,764.33
(b) Other equity (` in Lakhs)
Attributable to Equity Holders of the Company
Reserves and SurplusOther
Comprehensive Income -
Total Other Equity
Other equity General Reserve
Securities Premium
Retained earnings
Capital Reserve on
Consolidation
Foreign Currency
Translation Reserve
Equity Instruments through OCI
Balance at 1st April, 2020 (A) 120.54 3,967.08 12,816.65 92.26 56.89 (37.43) 17,015.99
Less; Share issue expenditure (1.95) (1.95)
Add: Profit during the Period - - 2,297.20 (5.73) 2,291.47
Add/(less): Other Comprehensive Income for the year(Net of Tax)
318.22 318.22
Add:Capital Reserve on acquisition of subsidiary company
-
Add/(less):Adjustment on account of acquisition of Non Controlling Interest
-
Add/(less): Remeasurements of post-employment benefit obligation, net of tax
- - 58.38 - 58.38
Balance at 31st March, 2021 (B) 120.54 3,965.13 15,172.23 92.26 51.16 280.79 19,682.11
Less; Share issue expenditure - (14.45) (14.45)
Add: Profit during the Period - - 3,458.54 30.05 3,488.59
Add:Duetochangeinminorityinterest -
Add: Gain on sale of shares - 1.35 1.35
Add/(less): Other Comprehensive Income for the year(Net of Tax)
219.47 219.47
Add/(less): Remeasurements of post-employment benefit obligation, net of tax
- - 8.01 8.01
Closing Balance 120.54 3,950.68 18,638.77 92.26 81.21 501.61 23,385.08
Note (i): The Group has elected to recognise changes in the fair value of investments in equity securities in other comprehensive income. These changes are accumulated within the Equity instruments through OCI.
Note (ii): Nature and purpose of each reserve is disclosed under note no. 18 -’Other equity’
See accompanying notes to the financial statements
As per Our Report Attached
For J. H. Mehta & Co.J. H. Mehta & Co. ForandonbehalfofBoardofDirectorsChartered AccountantsFirm Reg. No. 106227W
Naitik J Mehta Rajesh C. Prikh Atil C. Parikh N. R. Patel Komal PandeyNaitik J Mehta Rajesh C. Prikh Atil C. Parikh N. R. Patel Komal PandeyPartner Chairman&MD CEO&MD ChiefFinancialOfficer CompanySecretaryM.No.130010 DINNo.:00041610 DINNo.:00041712 M.NO.A-37092
Place : Waghodia Place : WaghodiaDate:03/05/2022 Date:03/05/2022
Annual Report 2021-222021-22
188
20 Microns Limited20 Microns Limited

Authorization of financial statements:Authorization of financial statements:The Consolidated Financial Statements were authorized for issue in accordance with a resolution passed in meeting of Board of theDirectorsheldon03/05/2022.
Notes to Consolidated Financial statements for the Notes to Consolidated Financial statements for the year ended 31st March 2022 year ended 31st March 2022
Note 1. Corporate Information & Basis of Corporate Information & Basis of ConsolidationConsolidation20 Microns Limited (“Parent Company”) is a public limited company domiciled in India and incorporated under the provisions of the Companies Act, 1956. The registered office of theCompanyislocatedat9–10,GIDC,Waghodia,Vadodara– 391760, Gujarat, India.
The Group is engaged in Business of Industrial Micronised Minerals and Speciality Chemicals.
Basis of Consolidation:The consolidated financial statements comprise the financial statements of the company and its subsidiaries as at 31st March, 2021. Control is achieved when the group is exposed or has right, to variable returns from its involvement with the investee and has the ability to affect those returns through power over the investee. Specifically, the group controls an investee if and only if the group has;
• Powerover the investee(i.e.existingrights thatgive it thecurrent liability to direct the relevant activities of investee)
• Exposureorrightstovariablereturnsfromtheinvolvementwith the investee, and
• The ability to use its power over the investee to affectits returns
Generally, there us a presumption that a majority of the voting rights result in control. To support this presumption and when the group has less than a majority of the voting or similar rights of an investee, the group consider all relevant facts and circumstances in assessing whether it has power over an investee, including:
• Thecontractualarrangementwiththeothervoteholdersofthe investee
• Rightsarisingfromothercontractualarrangement
• TheGroup’svotingrightsandpotentialvotingrights
• Thesizeof theGroup’sholdingofvotingrightsrelative tothe size and dispersion of the holdings of the other voting rights holders.
The group re-assesses whether or not it control an investee if facts and circumstances indicate that there are changes to one or more of the three elements of control. Consolidation
of a subsidiary begins when the Group obtains control over the subsidiary and ceases when the Group loses control of the subsidiary. Assets, liabilities, income and expenses of a subsidiary acquired or disposed of during the year are included in the consolidated financial statements from the dare the Group gains control until the date the Group ceases to control the subsidiary.
Consolidated financial statements are prepared using uniform accounting policies for like transactions and other events in similar circumstances.
The financial statements of each of the subsidiaries used for the purpose of consolidation are drawn up to same reporting date as that of the Company, i.e year ended on 31st March
Consolidation Procedure:The consolidated Financial Statements include the financial statements of 20 Microns Limited and its subsidiaries & Associate (The Group).
SubsidiariesThe Consolidated Financial Statements of the group have been prepared in accordance with Indian Accounting Standard 110 ‘Consolidated Financial Statements’ as notified under section 133 of the Companies Act, 2013 read with the Companies (Indian Accounting Standard) Rules, 2015 as amended thereunder.
Consolidated Financial Statements normally include consolidated balance sheets, consolidated statement of profit and loss, consolidated statement of cash flows and notes to the consolidated financial statements and explanatory statements that form an integral part thereof. The consolidated financial statements are presented, to the extent possible, in the same format as that adopted by the parent for its separate financial statements.
The consolidated financial statements have been combined on a line-by-line basis by adding the book value of like items of assets, liabilities, income and expenses after eliminating intra-group balance/transactions and resulting unrealized profits in full. The amounts shown in respect of reserves comprise the amount of the relevant reserves as per the balance sheet of the parent company and its share in the post-acquisition increase in the relevant reserves of the entity to be consolidated. In case of foreign subsidiary, being non-integral foreign operations, revenue items are consolidated at the average rate prevailing during the year. All assets and liabilities are converted at rates prevailing at the end of the year. Any exchange difference arising on consolidation is recognized in the Foreign Currency Translation Reserve.
NOTES TO cONSOlIDATED FINANcIAl STATEMENTS NOTES TO cONSOlIDATED FINANcIAl STATEMENTS for the year ended on 31st March, 2022
189
Corporate Overview Notice Statutory Reports Financial StatementsFinancial Statements

The difference between the cost of investment in the subsidiaries, over the net assets at the time of acquisition of shares in the subsidiaries is recognized in the financial statements as Goodwill or Capital Reserve as the case may be.
AssociateInvestment in associate has been accounted for using Equity Method in accordance with Ind AS 28 - Investments in Associates andJointVentures.Under theequitymethodofaccounting,the investments are initially recognised at cost and adjusted thereafter to recognise the group’s share of the post-acquisition profits or losses of the investee in profit and loss, and the group’s share of other comprehensive income of the investee in other comprehensiveincome.Dividendsreceivedorreceivablefromassociates and joint ventures are recognised as a reduction in the carrying amount of the investment.
Any excess / short of the amount of Investment in an associate over the cost of acquisition at the date of Investment is considered as Capital Reserve and has been included in carrying amount of Investment and disclosed separately. The carrying amount
of Investment is adjusted thereafter for the post acquisition changes in the Share of net Asset of associate.
When the group’s share of losses in an equity-accounted investment equals or exceeds its interest in the entity, including any other unsecured long-term receivables, the group does not recognise further losses, unless it has incurred obligations or madepaymentsonbehalfoftheotherentity.Unrealisedgainson transactions between the group and its associates are eliminated to the extent of the group’s interest in these entities. Unrealised lossesarealsoeliminatedunless the transactionprovides evidence of an impairment of the asset transferred. Accounting policies of equity accounted investees have been changed where necessary to ensure consistency with the policies adopted by the group.
The financial statements of associates are prepared up to the same reporting date as that of the company i.e. 31st March 2022 for the current year.
Particulars of Consolidation:The lists of Subsidiary Companies are as under:
Company Year EndCountry of
Incorporation
Proportion of Ownership
As At As At 31st March 202231st March 2022
As At 31st March 2021
20MicronsSDNBHD
(Foreign Subsidiary) March 31, 2022 Malaysia 100% 100%
20 Microns Nano Minerals Limited (Indian Subsidiary)
March 31, 2022 India 97.21% 97.21%
20 Microns Vietnam Limited (Foreign subsidiary) March 31, 2022 Vietnam 100% 100%
20 Microns FZE
(Foreign subsidiary) March 31, 2022 Sharjah 100% 100%
20 MCC Private Limited
(Indian Subsidiary) March 31, 2022 India 100% 100%
Dorfner-20MicronsPrivateLimited March 31, 2022 India 45% --
Note 2 - Significant Accounting Policies Significant Accounting PoliciesThis note provides a list of the significant accounting policies adopted in the preparation of these financial statements. These policies have been consistently applied to all the years presented, unless otherwise stated.
2.1 Basis of Preparation of Financial Statements2.1.1 Statement of Compliance with Ind AS2.1.1 Statement of Compliance with Ind AS(a) The financial statements has been prepared in accordance
and comply in all material aspects with Indian Accounting Standards (Ind AS) notified under the Companies (Indian
Accounting Standards) Rules, 2015 as amended from time to time, the relevant provisions of the Companies Act, 2013 (“the Act’’) and guidelines issued by the Securities and Exchange Board of India (SEBI), as applicable.
(b) All assets and liabilities have been classified as current or non-current as per the Group’s normal operating cycle and other criteria set out in the Schedule III to the Companies Act, 2013.
(c) Accounting policies have been consistently applied except where a newly issued accounting standard is initially
NOTES TO cONSOlIDATED FINANcIAl STATEMENTS NOTES TO cONSOlIDATED FINANcIAl STATEMENTS for the year ended on 31st March, 2022
As far as possible, the consolidated financial statements are prepared using uniform accounting policies for like transactions and other events in similar circumstances and are presented in the same manner as the Group’s separate financial statements.
Annual Report 2021-222021-22
190
20 Microns Limited20 Microns Limited

adopted or a revision to an existing accounting standard requires a change in the accounting policy hitherto in use.
2.1.2 Historical Cost Convention2.1.2 Historical Cost ConventionThese financial statements have been prepared and presented under the historical cost convention, on the accrual basis of accounting except for certain financial assets and financial liabilities that are measured at fair values at the end of each reporting period, as stated in the accounting policies set out below. The accounting policies have been applied consistently over all the periods presented in these financial statements.
2.2 Use of estimates and JudgementsThe presentation of the financial statements are in conformity with the Ind AS which requires the management to make estimates, judgments and assumptions that affect the reported amounts of assets and liabilities, revenues and expenses and disclosure of contingent liabilities. Such estimates and assumptions are based on management’s evaluation of relevant facts and circumstances as on the date of financial statements. The actual outcome may differ from these estimates.
Estimates and underlying assumptions are reviewed on an ongoing basis. Revisions to the accounting estimates are recognised in the period in which the estimates are revised and in any future periods affected.
This note provides an overview of the areas that involved a higher degree of judgement or complexity, and of items which are more likely to be materially adjusted due to estimates and assumptions turning out to be different than those originally assessed.Detailedinformationabouteachoftheseestimatesand judgements is included in relevant notes together with information about the basis of calculation for each affected line item in the financial statements.
Information about assumptions and estimation uncertainties that have a significant risk of resulting in a material adjustment within the next financial year are included in the following notes:
Note 38 Current/deferred tax expense
Note 41 Contingent liabilities and assets
Note 10 Expected credit loss for receivables
Note 44 Measurement of defined benefit obligations
2.3 Business Combination and Goodwill:Acquisition of subsidiaries and businesses are accounted for using the purchase method. The consideration transferred in each business combination is measured at the aggregate of the acquisition date fair values of asset given, liabilities incurred by the Group to the former owners of the acquire, and equity interest issued by the Group in exchange for control of the acquire.
Acquisition related costs are recognised in the consolidated statement of Profit and Loss.
Goodwill arising on acquisition is recognised as an asset and measured at cost, being excess of the consideration transferred in the business combination over the Group’s interest in the net fair value of the identifiable assets acquired, liabilities assumed and contingent liabilities recognised. Where the fair value of the identifiable assets and liabilities exceed the cost of acquisition, after reassessing the fair values of the net assets and contingent liabilities, the excess is recognised as capital reserve on consolidation.
Once control has been achieved, any subsequent acquisition where the group does not originally hold hundred percent interest in subsidiary are treated as an acquisition of shares from non-controlling shareholders. The identifiable net assets are not subject to further fair value adjustments and the difference between the cost of acquisition of the non-controlling interest and the net book value of the additional proportion acquired is measured either at the non-controlling interests proportion of the net fair value of the assets, liabilities and contingent liabilities recognised or at fair value.
2.4 Property, Plant and equipmentAn item of Property, plant and equipment that qualifies as an assets is measured at their cost. Following initial recognition, items of property, plant and equipment are carried at cost less accumulated depreciation and accumulated impairment losses.
The Group identifies and determines the cost of each part of an item of property, plant and equipment separately, if the part has a cost which is significant to the total cost of that item of property, plant and equipment and has useful life that is materially different from that of the remaining item.
The cost of an item of property, plant and equipment comprises of its purchase price including import duties and other non-refundable purchase taxes or levies, directly attributable cost of bringing the asset to its working condition for its intended use and the initial estimate of decommissioning, restoration and similar liabilities, if any. Any trade discounts and rebates are deducted in arriving at the purchase price. Cost includes cost of replacing a part of a plant and equipment if the recognition criteria are met. Expenses directly attributable to new manufacturing facility during its construction period are capitalized if the recognition criteria are met. Expenditure related to plans, designs and drawings of buildings or plant and machinery is capitalized under relevant heads of property, plant and equipment if the recognition criteria are met.
Items such as spare parts, stand-by equipment and servicing equipment that meet the definition of property, plant and
NOTES TO cONSOlIDATED FINANcIAl STATEMENTS NOTES TO cONSOlIDATED FINANcIAl STATEMENTS for the year ended on 31st March, 2022
191
Corporate Overview Notice Statutory Reports Financial StatementsFinancial Statements

equipment are capitalized at cost and depreciated over their useful life.
Subsequent expenditures, including replacement costs where applicable, incurred for an item of Property plant and equipment are added to its books value only if they increase the future benefits from the existing asset beyond its previously assessed standard of performance and the cost of the item can be measured reliably. The carrying amount of any component accounted for as a separate asset is de-recognised when replaced.
Costs in nature of repairs and maintenance are recognized in the Statement of Profit and Loss as and when incurred.
Any item of property, plant and equipment and any significant part initially recognised is derecognised upon disposal or when no future economic benefits are expected from its use or disposal. Any gain or loss arising on derecognition of the asset (calculated as the difference between the net disposal proceeds and the carrying amount of the asset) is charged to revenue in the income statement when the asset is derecognised.
The cost and related accumulated depreciation are eliminated from the financial statements upon sale or retirement of the asset.
2.5 Capital Work in Progress:Expenditure on projects pending capitalization is shown under the head “Capital Work In Progress” which will be capitalized to respective heads of Property, Plant and Equipment on commencement of commercial production.
All the directly identifiable and ascertainable expenditure, incidental and related to construction incurred during the period of construction on a project, till it is commissioned, is kept as Capital work in progress (CWIP) and after commissioning the same is transferred / allocated to the respective “Property, Plant and Equipment”.
Further, advances paid towards the acquisition of property, plant and equipment outstanding at each balance sheet date are classified and disclosed as capital advances under Other Non-Current Assets.
2.6 Investment PropertiesInvestment properties comprises of Immovable Property that are held for rental yield and/or capital appreciation.
Investment property is measured initially at its cost, including related transaction costs and where applicable borrowing costs. Subsequent expenditure is capitalised to the asset’s carrying amount only when it is probable that future economic benefits associated with the item will flow to the Group and the cost of the item can be measured reliably. All other repairs and
maintenance costs are expensed as and when incurred. When part of an investment property is replaced, the carrying amount of the replaced part is derecognised.
2.7 Intangible AssetsIntangible asset is recognized only where it is probable that future economic benefits attributable to the asset will accrue to the enterprise and cost can be measured reliably. Intangible assets acquired separately are measured on initial recognition at cost. Internally generated intangibles including research cost are not capitalized and the related expenditure is recognized in the Statement of Profit and Loss in the period in which the expenditure is incurred. Following initial recognition, intangible assets are carried at cost less accumulated amortization and accumulated impairment loss, if any.
Acquired Intangible Assets in the form of “Process Know How” is recognized at the cost of acquisition and amortized on straight line basis over a period of five years, depending on their estimated useful life.
Capitalized software includes cost on Enterprise Resource Planning (ERP) project and other Software cost including license fees, which provides significant future benefits. ERP Project fees are amortized over a period of seven years. Costs of all other software are amortized over a period of five years.
Expenses incurred during development of Process know how or Product development is shown under the head “Intangible asset under development”.
Any item of intangible assets is derecognised upon disposal or when no future economic benefits are expected from its use or disposal. Any gain or loss arising on derecognition of the intangible asset (calculated as the difference between the net disposal proceeds and the carrying amount of the intangible asset) is recognised in the statement of Profit and Loss when the asset is derecognised.
2.8 Depreciation and amortisation methods, estimated useful lives and residual valuesDepreciationiscalculatedtosystematicallyallocatethecostofproperty, plant and equipment, intangible asset and investment property net of the estimated residual values over the estimated usefullife.DepreciationiscomputedusingStraightLineMethod(SLM) over the useful lives of the assets as specified in Schedule II to the Companies Act, 2013.
The estimate of the useful life of the assets has been assessed based on technical advice which considers the nature of the asset, the usage of the asset, expected physical wear and tear, the operating conditions of the asset, anticipated technological changes, manufacturers warranties and maintenance support,
NOTES TO cONSOlIDATED FINANcIAl STATEMENTS NOTES TO cONSOlIDATED FINANcIAl STATEMENTS for the year ended on 31st March, 2022
Annual Report 2021-222021-22
192
20 Microns Limited20 Microns Limited
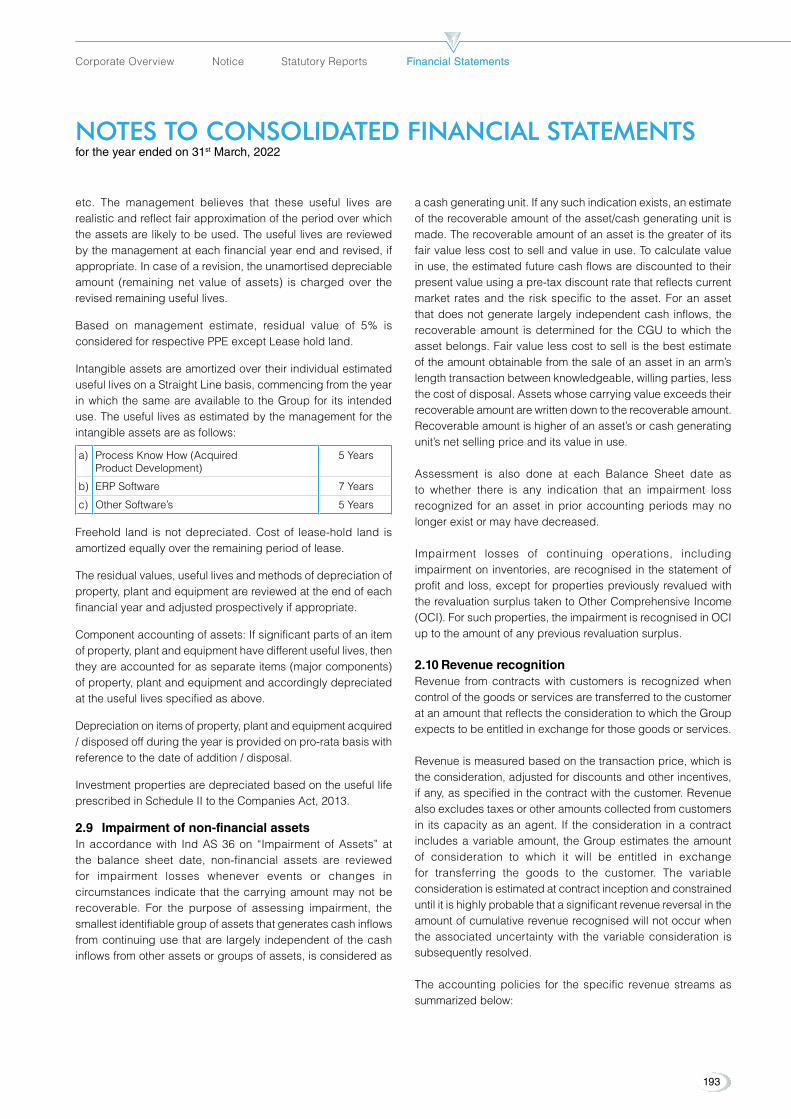
etc. The management believes that these useful lives are realistic and reflect fair approximation of the period over which the assets are likely to be used. The useful lives are reviewed by the management at each financial year end and revised, if appropriate. In case of a revision, the unamortised depreciable amount (remaining net value of assets) is charged over the revised remaining useful lives.
Based on management estimate, residual value of 5% is considered for respective PPE except Lease hold land.
Intangible assets are amortized over their individual estimated useful lives on a Straight Line basis, commencing from the year in which the same are available to the Group for its intended use. The useful lives as estimated by the management for the intangible assets are as follows:
a) Process Know How (Acquired ProductDevelopment)
5 Years
b) ERP Software 7 Years
c) Other Software’s 5 Years
Freehold land is not depreciated. Cost of lease-hold land is amortized equally over the remaining period of lease.
The residual values, useful lives and methods of depreciation of property, plant and equipment are reviewed at the end of each financial year and adjusted prospectively if appropriate.
Component accounting of assets: If significant parts of an item of property, plant and equipment have different useful lives, then they are accounted for as separate items (major components) of property, plant and equipment and accordingly depreciated at the useful lives specified as above.
Depreciationonitemsofproperty,plantandequipmentacquired/ disposed off during the year is provided on pro-rata basis with reference to the date of addition / disposal.
Investment properties are depreciated based on the useful life prescribed in Schedule II to the Companies Act, 2013.
2.9 Impairment of non-financial assetsIn accordance with Ind AS 36 on “Impairment of Assets” at the balance sheet date, non-financial assets are reviewed for impairment losses whenever events or changes in circumstances indicate that the carrying amount may not be recoverable. For the purpose of assessing impairment, the smallest identifiable group of assets that generates cash inflows from continuing use that are largely independent of the cash inflows from other assets or groups of assets, is considered as
a cash generating unit. If any such indication exists, an estimate of the recoverable amount of the asset/cash generating unit is made. The recoverable amount of an asset is the greater of its fair value less cost to sell and value in use. To calculate value in use, the estimated future cash flows are discounted to their present value using a pre-tax discount rate that reflects current market rates and the risk specific to the asset. For an asset that does not generate largely independent cash inflows, the recoverableamount isdetermined for theCGUtowhich theasset belongs. Fair value less cost to sell is the best estimate of the amount obtainable from the sale of an asset in an arm’s length transaction between knowledgeable, willing parties, less the cost of disposal. Assets whose carrying value exceeds their recoverable amount are written down to the recoverable amount. Recoverable amount is higher of an asset’s or cash generating unit’s net selling price and its value in use.
Assessment is also done at each Balance Sheet date as to whether there is any indication that an impairment loss recognized for an asset in prior accounting periods may no longer exist or may have decreased.
Impairment losses of continuing operations, including impairment on inventories, are recognised in the statement of profit and loss, except for properties previously revalued with the revaluation surplus taken to Other Comprehensive Income (OCI). For such properties, the impairment is recognised in OCI up to the amount of any previous revaluation surplus.
2.10 Revenue recognitionRevenue from contracts with customers is recognized when control of the goods or services are transferred to the customer at an amount that reflects the consideration to which the Group expects to be entitled in exchange for those goods or services.
Revenue is measured based on the transaction price, which is the consideration, adjusted for discounts and other incentives, if any, as specified in the contract with the customer. Revenue also excludes taxes or other amounts collected from customers in its capacity as an agent. If the consideration in a contract includes a variable amount, the Group estimates the amount of consideration to which it will be entitled in exchange for transferring the goods to the customer. The variable consideration is estimated at contract inception and constrained until it is highly probable that a significant revenue reversal in the amount of cumulative revenue recognised will not occur when the associated uncertainty with the variable consideration is subsequently resolved.
The accounting policies for the specific revenue streams as summarized below:
NOTES TO cONSOlIDATED FINANcIAl STATEMENTS NOTES TO cONSOlIDATED FINANcIAl STATEMENTS for the year ended on 31st March, 2022
193
Corporate Overview Notice Statutory Reports Financial StatementsFinancial Statements
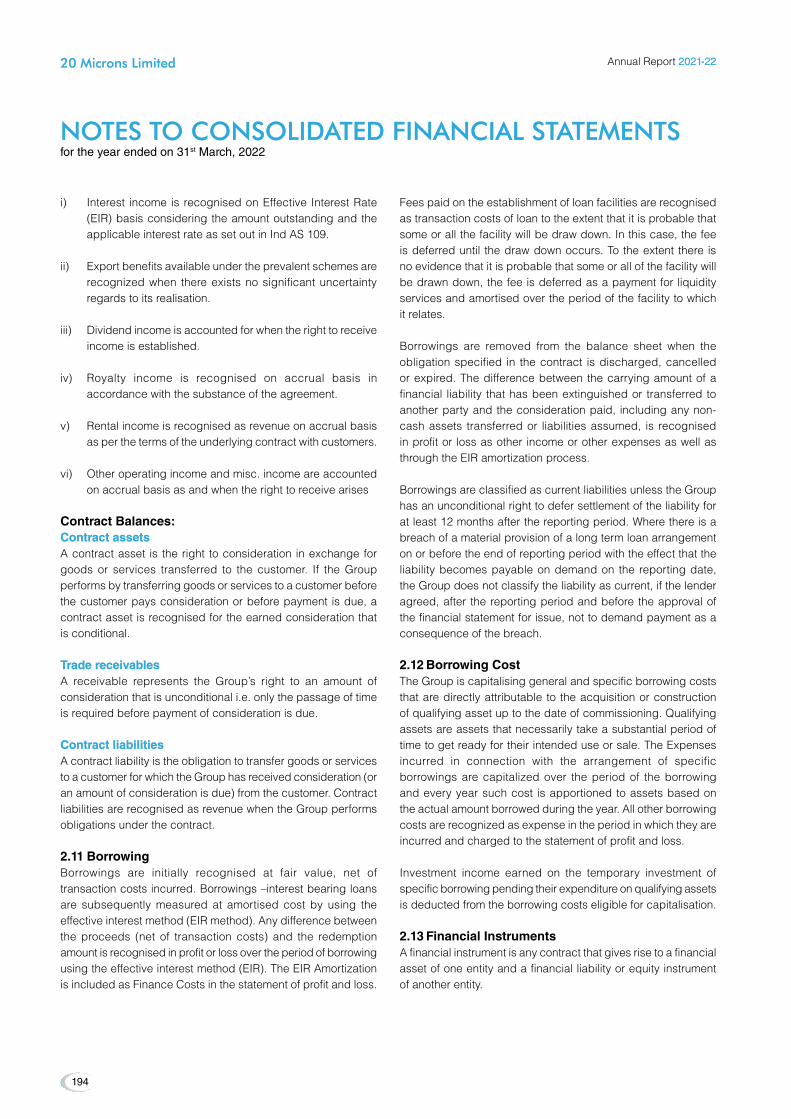
i) Interest income is recognised on Effective Interest Rate (EIR) basis considering the amount outstanding and the applicable interest rate as set out in Ind AS 109.
ii) Export benefits available under the prevalent schemes are recognized when there exists no significant uncertainty regards to its realisation.
iii) Dividendincomeisaccountedforwhentherighttoreceiveincome is established.
iv) Royalty income is recognised on accrual basis in accordance with the substance of the agreement.
v) Rental income is recognised as revenue on accrual basis as per the terms of the underlying contract with customers.
vi) Other operating income and misc. income are accounted on accrual basis as and when the right to receive arises
Contract Balances:Contract assetsContract assetsA contract asset is the right to consideration in exchange for goods or services transferred to the customer. If the Group performs by transferring goods or services to a customer before the customer pays consideration or before payment is due, a contract asset is recognised for the earned consideration that is conditional.
Trade receivablesTrade receivablesA receivable represents the Group’s right to an amount of consideration that is unconditional i.e. only the passage of time is required before payment of consideration is due.
Contract liabilitiesContract liabilitiesA contract liability is the obligation to transfer goods or services to a customer for which the Group has received consideration (or an amount of consideration is due) from the customer. Contract liabilities are recognised as revenue when the Group performs obligations under the contract.
2.11 BorrowingBorrowings are initially recognised at fair value, net of transaction costs incurred. Borrowings –interest bearing loans are subsequently measured at amortised cost by using the effective interest method (EIR method). Any difference between the proceeds (net of transaction costs) and the redemption amount is recognised in profit or loss over the period of borrowing using the effective interest method (EIR). The EIR Amortization is included as Finance Costs in the statement of profit and loss.
Fees paid on the establishment of loan facilities are recognised as transaction costs of loan to the extent that it is probable that some or all the facility will be draw down. In this case, the fee is deferred until the draw down occurs. To the extent there is no evidence that it is probable that some or all of the facility will be drawn down, the fee is deferred as a payment for liquidity services and amortised over the period of the facility to which it relates.
Borrowings are removed from the balance sheet when the obligation specified in the contract is discharged, cancelled or expired. The difference between the carrying amount of a financial liability that has been extinguished or transferred to another party and the consideration paid, including any non-cash assets transferred or liabilities assumed, is recognised in profit or loss as other income or other expenses as well as through the EIR amortization process.
Borrowings are classified as current liabilities unless the Group has an unconditional right to defer settlement of the liability for at least 12 months after the reporting period. Where there is a breach of a material provision of a long term loan arrangement on or before the end of reporting period with the effect that the liability becomes payable on demand on the reporting date, the Group does not classify the liability as current, if the lender agreed, after the reporting period and before the approval of the financial statement for issue, not to demand payment as a consequence of the breach.
2.12 Borrowing CostThe Group is capitalising general and specific borrowing costs that are directly attributable to the acquisition or construction of qualifying asset up to the date of commissioning. Qualifying assets are assets that necessarily take a substantial period of time to get ready for their intended use or sale. The Expenses incurred in connection with the arrangement of specific borrowings are capitalized over the period of the borrowing and every year such cost is apportioned to assets based on the actual amount borrowed during the year. All other borrowing costs are recognized as expense in the period in which they are incurred and charged to the statement of profit and loss.
Investment income earned on the temporary investment of specific borrowing pending their expenditure on qualifying assets is deducted from the borrowing costs eligible for capitalisation.
2.13 Financial InstrumentsA financial instrument is any contract that gives rise to a financial asset of one entity and a financial liability or equity instrument of another entity.
NOTES TO cONSOlIDATED FINANcIAl STATEMENTS NOTES TO cONSOlIDATED FINANcIAl STATEMENTS for the year ended on 31st March, 2022
Annual Report 2021-222021-22
194
20 Microns Limited20 Microns Limited

2.13.1 Financial Asset2.13.1 Financial AssetInitial RecognitionInitial RecognitionA financial asset or a financial liability is recognised in the balance sheet only when, the Group becomes party to the contractual provisions of the instrument.
Initial MeasurementInitial MeasurementAt initial recognition, the Group measures a financial asset or financial liability at its fair value plus or minus, in the case of a financial asset or financial liability not at fair value through profit or loss, transaction costs that are directly attributable to the acquisition or issue of the financial asset or financial liability.
Subsequent MeasurementSubsequent MeasurementFor purpose of subsequent measurement, financial assets are classified into:
• Financialassetsmeasuredatamortisedcost;
• Financialassetsmeasuredat fairvaluethroughprofitorloss (FVTPL); and
• Financial assets measured at fair value through othercomprehensive income (FVTOCI).
The Group classifies its financial assets in the above mentioned categories based on:
• TheGroup’sbusinessmodel formanagingthefinancialassets, and
• The contractual cash flows characteristics of thefinancial asset.
A financial assets is measured at amortised cost if both of the following conditions are met:
• Thefinancialassetisheldwithinabusinessmodelwhoseobjective is to hold financial assets in order to collect contractual cash flows and
• The contractual terms of the financial assets giverise on specified dates to cash flows that are solely payments of principal and interest (SPPI) on the principal amount outstanding.
Financial assets are subsequently measured at amortised cost using the effective interest rate (EIR) method. Amortised cost is calculated by taking into account any discount or premium on acquisition and fees or costs that are an integral part of the EIR. The EIR amortisation is included in finance income in the profit or loss. The losses arising from impairment are recognised in the profit or loss.
A financial asset is measured at fair value through other comprehensive income if both of the following conditions are met:
• Thefinancialassetisheldwithinabusinessmodelwhoseobjective is achieved by both collecting the contractual cash flows and selling financial assets and
• TheassetscontractualcashflowsrepresentSPPI.
A financial asset is measured at fair value through profit or loss unless it is measured at amortised cost or at fair value through other comprehensive income. In addition, the Group may elect to designate a financial asset, which otherwise meets amortized cost or FVTOCI criteria, as at FVTPL. However, such election is allowed only if doing so reduces or eliminates a measurement or recognition inconsistency (referred to as ‘accounting mismatch’).
equity Investments:equity Investments:All equity investments in scope of Ind AS 109 are measured at fair value. Equity instruments which are held for trading are classified as at FVTPL. For all other equity instruments, the Group may make an irrevocable election to present in other comprehensive income subsequent changes in the fair value. The Group makes such election on an instrument by-instrument basis. The classification is made on initial recognition and is irrevocable.
If the Group decides to classify an equity instrument as at FVTOCI, then all fair value changes on the instrument, excluding dividends, are recognized in the OCI. There is no recycling of the amounts from OCI to statement of profit and loss, even on sale of investment. However, the Group may transfer the cumulative gain or loss within equity. Equity instruments included within the FVTPL category are measured at fair value with all changes recognized in the Profit and Loss.
De-recognitionDe-recognitionA financial asset (or, where applicable, a part of a financial asset or part of a group of similar financial assets) is primarily derecognised (i.e. removed from the Group’s balance sheet) when:
1. The contractual rights to the cash flows from the financial asset have expired, or
2. The Group has transferred its rights to receive cash flows from the asset or has assumed an obligation to pay the received cash flows in full without material delay to a third party under a ‘pass-through’ arrangement; and either
(1) The Group has transferred substantially all the risks and rewards of the asset, or
NOTES TO cONSOlIDATED FINANcIAl STATEMENTS NOTES TO cONSOlIDATED FINANcIAl STATEMENTS for the year ended on 31st March, 2022
195
Corporate Overview Notice Statutory Reports Financial StatementsFinancial Statements
(2) The Group has neither transferred nor retained substantially all the risks and rewards of the asset, but has transferred control of the asset.
When the Group has transferred its rights to receive cash flows from an asset or has entered into a pass-through arrangement, it evaluates if and to what extent it has retained the risks and rewards of ownership. When it has neither transferred nor retained substantially all of the risks and rewards of the asset, nor transferred control of the asset, the Group continues to recognise the transferred asset to the extent of the Group’s continuing involvement. In that case, the Group also recognises an associated liability. The transferred asset and the associated liability are measured on a basis that reflects the rights and obligations that the Group has retained.
Continuing involvement that takes the form of a guarantee over the transferred asset is measured at the lower of the original carrying amount of the asset and the maximum amount of consideration that the Group could be required to repay.
Impairment of Financial AssetsImpairment of Financial AssetsThe Group assesses impairment based on expected credit loss (ECL) model to the following:
• Financialassetsmeasuredatamortisedcost
• Financial assets measured at fair value through othercomprehensive income
Expected credit losses are measured through a loss allowance at an amount equal to:
• The12-monthsexpectedcredit losses(expectedcreditlosses that result from those default events on the financial instrument that are possible within 12 months after the reporting date); or
• Full timeexpectedcredit losses(expectedcredit lossesthat result from all possible default events over the life of the financial instrument).
The Group follows ‘simplified approach’ for recognition of impairment loss allowance on trade receivables or contract revenue receivables. Under the simplified approach, theGroup is not required to track changes in credit risk. Rather, it recognises impairment loss allowance based on lifetime ECLs together with appropriate management estimates for credit loss at each reporting date, right from its initial recognition.
The Group uses a provision matrix to determine impairment loss allowance on the portfolio of trade receivables. The provision matrix is based on its historically observed default rates over the expected life of the trade receivable and is adjusted for forward looking estimates. At every reporting date, the historical
observed default rates are updated and changes in the forward-looking estimates are analysed.
ECL impairment loss allowance (or reversal) recognized during the period is recognized as income/ expense in the statement of profit and loss. This amount is reflected under the head ‘other expenses’ in the statement of Profit and Loss. The balance sheet presentation for various financial instruments is described below:
• Financial assets measured as at amortised cost andcontractual revenue receivables - ECL is presented as an allowance, i.e., as an integral part of the measurement of those assets in the balance sheet. The allowance reduces thenetcarryingamount.Until theassetmeetswrite-offcriteria, the Group does not reduce impairment allowance from the gross carrying amount.
• Financial assetsmeasuredat FVTOCI -Since financialassets are already reflected at fair value, impairment allowance is not further reduced from its value. Rather, ECL amount is presented as accumulated impairment amount in the OCI.
For assessing increase in credit risk and impairment loss, the Group combines financial instruments on the basis of shared credit risk characteristics with the objective of facilitating an analysis that is designed to enable significant increases in credit risk to be identified on a timely basis.
The Group does not have any purchased or originated credit-impaired (POCI) financial assets, i.e., financial assets which are credit impaired on purchase/ origination.
2.13.2 Financial Liabilities2.13.2 Financial LiabilitiesInitial recognition and measurementInitial recognition and measurementFinancial liabilities are classified, at initial recognition, as financial liabilities at fair value through profit or loss, loans and borrowings, payables, or as derivatives designated as hedging instruments in an effective hedge, as appropriate.
All financial liabilities are recognised initially at fair value and, in case of loans and borrowings and payables, net of directly attributable transaction costs.
The Group’s financial liabilities include trade and other payables, loan and borrowings including bank overdrafts, financial guarantee contracts and derivative financial instruments.
Subsequent measurementSubsequent measurement• Financialliabilitiesmeasuredatamortisedcost
• Financial liabilitiessubsequentlymeasuredat fairvaluethrough profit or loss
NOTES TO cONSOlIDATED FINANcIAl STATEMENTS NOTES TO cONSOlIDATED FINANcIAl STATEMENTS for the year ended on 31st March, 2022
Annual Report 2021-222021-22
196
20 Microns Limited20 Microns Limited
Financial liabilities at fair value through profit or loss include financial liabilities held for trading and financial liabilities designated upon initial recognition as at fair value through profit or loss. Financial liabilities are classified as held for trading if they are incurred for the purpose of repurchasing in the near term. Gains or losses on liabilities held for trading are recognised in the profit or loss.
Financial liabilities designated upon initial recognition at fair value through profit or loss are designated as such at the initial date of recognition, and only if the criteria in Ind AS 109 are satisfied. For liabilities designated as FVTPL, fair value gains/ losses attributable to changes in own credit risk are recognized in OCI. These gains/ loss are not subsequently transferred to Profit and Loss. However, the Group may transfer the cumulative gain or loss within equity. All other changes in fair value of such liability are recognised in the statement of profit or loss. The Group has not designated any financial liability as at fair value through profit and loss.
Financial Guarantee ContractsFinancial Guarantee ContractsFinancial guarantee contracts issued by the Group are those contracts that require a payment to be made to reimburse the holder for a loss it incurs because the specified debtor fails to make a payment when due in accordance with the terms of a debt instrument. Financial guarantee contracts are recognised initially as a liability at fair value, adjusted for transaction costs that are directly attributable to the issuance of the guarantee. Subsequently, the liability is measured at the higher of the amount of loss allowance determined as per impairment requirements of Ind AS 109 and the amount recognised less cumulative amortisation.
Loan and BorrowingsLoan and BorrowingsAfter initial recognition, interest-bearing loans and borrowings are subsequently measured at amortised cost using the Effective Interest Rate (EIR) method. Gains and losses are recognised in profit or loss when the liabilities are derecognised as well as through the EIR amortisation process. Amortised cost is calculated by taking into account any discount or premium on acquisition and fees or costs that are an integral part of the EIR. The EIR amortisation is included as finance costs in the statement of profit and loss.
DerecognitionDerecognitionA financial liability is derecognised when the obligation under the liability is discharged or cancelled or expires. When an existing financial liability is replaced by another from the same lender on substantially different terms, or the terms of an existing liability are substantially modified, such an exchange or modification is treated as the derecognition of the original liability and the recognition of a new liability. The difference in the respective carrying amounts is recognised in the statement of profit or loss.
2.13.3 Derivative Financial Instruments and Hedge 2.13.3 Derivative Financial Instruments and Hedge AccountingAccountingThe Group uses derivative financial instruments such as foreign currency forward contracts to mitigate the risk of changes exchange rates. At the inception of a hedge relationship, the Group formally designates and documents the hedge relationship to which the Group wishes to apply hedge accounting and the risk management objective and strategy for undertaking the hedge. Such derivative financial instruments are initially recognised at fair value on the date on which a derivative contract is entered into and are also subsequently measured at fairvalue.DerivativesarecarriedasFinancialAssetswhenthefair value is positive and as Financial Liabilities when the fair value is negative.
Any gains or losses arising from changes in the fair value of derivatives are taken directly to Statement of Profit and Loss, except for the effective portion of cash flow hedge which is recognised in Other Comprehensive Income and later to Statement of Profit and Loss when the hedged item affects profit or loss or is treated as basis adjustment if a hedged forecast transaction subsequently results in the recognition of a Non-Financial Assets or Non-Financial liability.
Fair Value HedgesFair Value HedgesThe Group designates derivative contracts or non-derivative Financial Assets / Liabilities as hedging instruments to mitigate the risk of change in fair value of hedged item due to movement in foreign exchange rates. Changes in the fair value of hedging instruments and hedged items that are designated and qualify as fair value hedges are recorded in the Statement of Profit and Loss. If the hedging relationship no longer meets the criteria for hedge accounting, the adjustment to the carrying amount of a hedged item for which the effective interest method is used is amortised to Statement of Profit and Loss over the period of maturity.
2.13.4 Offsetting financial instruments2.13.4 Offsetting financial instrumentsFinancial assets and liabilities are offset and the net amount is reported in the balance sheet where there is a legally enforceable right to offset the recognised amounts and there is an intention to settle on a net basis or realise the asset and settle the liability simultaneously. The legally enforceable right must not be contingent on future events and must be enforceable in the normal course of business and in the event of default, insolvency or bankruptcy of the group or the counterparty.
2.14 Fair ValueThe Group measures certain financial instruments at fair value at each balance sheet date.
Fair value is the price that would be received to sell an asset or paid to transfer a liability in an orderly transaction between
NOTES TO cONSOlIDATED FINANcIAl STATEMENTS NOTES TO cONSOlIDATED FINANcIAl STATEMENTS for the year ended on 31st March, 2022
197
Corporate Overview Notice Statutory Reports Financial StatementsFinancial Statements
market participants at the measurement date. The fair value measurement is based on the presumption that the transaction to sell the asset or transfer the liability takes place either:
• Intheprincipalmarketfortheassetorliability,or
• In the absence of a principal market, in the mostadvantageous market for the asset or liability.
The principal or the most advantageous market must be accessible by the Group. The fair value of an asset or a liability is measured using the assumptions that market participants would use when pricing the asset or liability, assuming that market participants act in their economic best interest.
The Group uses valuation techniques that are appropriate in the circumstances and for which sufficient data are available to measure fair value, maximising the use of relevant observable inputs and minimising the use of unobservable inputs.
All assets and liabilities for which fair value is measured or disclosed in the financial statements are categorised within the fair value hierarchy, described as under, based on the lowest level input that is significant to the fair value measurement as a whole:
• Level 1 -Quoted (unadjusted)market prices in activemarkets for identical assets or liabilities.
• Level2-Valuationtechniquesforwhichthe lowest levelinput that is significant to the fair value measurement is directly or indirectly observable.
• Level3-Valuationtechniquesforwhichthe lowest levelinput that is significant to the fair value measurement is unobservable.
For assets and liabilities that are recognised in the financial statements on a recurring basis, the Group determines whether transfers have occurred between levels in the hierarchy by re-assessing categorisation (based on the lowest level input that is significant to the fair value measurement as a whole) at the end of each reporting period.
The Group’s management determines the policies and procedures for both recurring fair value measurement, such as unquoted financial assets measured at fair value, and for non-recurring measurement, such as assets held for distribution in discontinued operations. The management comprises of the ManagingDirectorandChiefFinancialOfficer.
External valuers are involved for valuation of significant assets, such as unquoted financial assets. Involvement of external
valuers is decided upon annually by the Valuation Committee after discussion with and approval by the management. Selection criteria include market knowledge, reputation, independence and whether professional standards are maintained. Valuers are normally rotated every three years. The management decides, after discussions with the Group’s external valuers, which valuation techniques and inputs to use for each case.
At each reporting date, the management analyses the movements in the values of assets and liabilities which are required to be re-measured or re-assessed as per the Group’s accounting policies. For this analysis, the management verifies the major inputs applied in the latest valuation by agreeing the information in the valuation.
The management, in conjunction with the Group’s external valuers, also compares the change in the fair value of each asset and liability with relevant external sources to determine whether the change is reasonable.
For the purpose of fair value disclosures, the Group has determined classes of assets and liabilities on the basis of the nature, characteristics and risks of the asset or liability and the level of the fair value hierarchy as explained above.
This note summarises accounting policy for fair value. Other fair value related disclosures are given in the relevant notes. (refer note 41)
1. Disclosures forvaluationmethods,significantestimatesand assumptions.
2. Quantitative disclosures of fair value measurement hierarchy.
3. Investment in unquoted equity shares.
4. Financial instruments (including those carried at amortised cost).
2.15 InventoriesRaw materials, work-in-progress, finished goods, packing materials, stores, spares, components, consumables and stock-in trade are carried at the lower of cost and net realizable value. However, materials and other items held for use in production of inventories are not written down below cost if the finished goods in which they will be incorporated are expected to be sold at or above cost. The comparison of cost and net realizable value is made on an item-by item basis.
In determining the cost of raw materials, packing materials, stock-in-trade, stores, spares, components and consumables, weighted average cost method is used. Cost of inventory comprises all costs of purchase, duties, taxes (other than those
NOTES TO cONSOlIDATED FINANcIAl STATEMENTS NOTES TO cONSOlIDATED FINANcIAl STATEMENTS for the year ended on 31st March, 2022
Annual Report 2021-222021-22
198
20 Microns Limited20 Microns Limited
subsequently recoverable from tax authorities) and all other costs incurred in bringing the inventory to their present location and condition.
Cost of finished goods and work-in-progress includes the cost of raw materials, packing materials, an appropriate share of fixed and variable production overheads, excise duty as applicable and other costs incurred in bringing the inventories to their present location and condition. Fixed production overheads are allocated on the basis of normal capacity of production facilities.
2.16 Non-current assets held for sale and discontinued operationNon-current assets are classified as held for sale if their carrying amount will be recovered principally through a sale transaction rather than through continuing use and a sale is considered highly probable. They are measured at the lower of their carrying amount and fair value less costs to sell, except for assets such as deferred tax assets, assets arising from employee benefits, financial assets and contractual rights under insurance contracts, which are specifically exempt from this requirement.
An impairment loss is recognised for any initial or subsequent write-down of the asset to fair value less costs to sell. A gain is recognised for any subsequent increases in fair value less costs to sell of an asset, but not in excess of any cumulative impairment loss previously recognised. A gain or loss not previously recognised by the date of the sale of the non-current asset (or disposal group) is recognised at the date of de-recognition.
Non-current assets are not depreciated or amortised while they are classified as held for sale. Non-current assets classified as held for sale are presented separately from the other assets in the balance sheet.
A discontinued operation is a component of the Group that has been disposed of or is classified as held for sale and that represents a separate major line of business or geographical area of operations, is part of a single co-ordinated plan to dispose of such a line of business or area of operations, or is a subsidiary acquired exclusively with a view to resale. The results of discontinued operations are presented separately in the statement of profit and loss.
2.17 Foreign Currency Transactions2.17.1 Functional and Presentation Currency2.17.1 Functional and Presentation CurrencyItems included in the financial statements are measured using the currency of the primary economic environment in which the Group operates (‘the functional currency’). The financial statements are presented in Indian rupee (`), which is the functional and presentation currency of the Group.
2.17.2 Transactions and balances2.17.2 Transactions and balancesForeign currency transactions are translated into the functional currency using the exchange rates at the date of the transactions. Foreign exchange gains and losses resulting from the settlement of such transactions and from the translation of monetary assets and liabilities denominated in foreign currencies at the year-end exchange rates are generally recognised in profit or loss.
All foreign exchange gains and losses are presented in the statement of profit and loss on a net basis within other income or other expenses.
Non-monetary items that are measured in terms of historical cost in a foreign currency are translated using the exchange rates at the dates of the initial transactions. Non-monetary items that are measured at fair value in a foreign currency are translated using the exchange rates at the date when the fair value was determined. Translation differences on assets and liabilities carried at fair value are reported as part of the fair value gain or loss.
2.18 employee BenefitsEmployees Benefits are provided in the books as per Ind AS -19 on “Employee Benefits” in the following manner:
2.18.1 Post-employment Benefit Plans2.18.1 Post-employment Benefit PlansDefined Contribution PlanDefinedcontributionplansareemployeestateinsuranceschemeand Government administered pension fund scheme for all applicable employees and superannuation scheme for eligible employees. The Group does not carry any other obligation apart from the monthly contribution.
The Group recognizes contribution payable to a defined contribution plan as an expense in the Statement of Profit and Loss when the employees render services to the Group during the reporting period. If the contributions payable for services received from employees before the reporting date exceeds the contributions already paid, the deficit payable is recognized as a liability after deducting the contribution already paid. If the contribution already paid exceeds the contribution due for services received before the reporting date, the excess is recognized as an asset to the extent that the prepayment will lead to, for example, a reduction in future payments or a cash refund.
Defined Benefit PlansDefined Benefit PlansThe Group provides for gratuity, a defined benefit plan covering eligible employees in accordance with the Payment of Gratuity Act, 1972, through an approved Gratuity Fund. The Gratuity Fund is separately administered through a Trust/Scheme. Contributions in respect of gratuity are made to the approved Gratuity Fund.
NOTES TO cONSOlIDATED FINANcIAl STATEMENTS NOTES TO cONSOlIDATED FINANcIAl STATEMENTS for the year ended on 31st March, 2022
199
Corporate Overview Notice Statutory Reports Financial StatementsFinancial Statements

All expenses represented by current service cost, past service cost, if any, and net interest on the defined benefit liability / (asset) are recognized in the Statement of Profit and Loss. Remeasurements of the net defined benefit liability / (asset) comprising actuarial gains and losses and the return on the plan assets (excluding amounts included in net interest on the net defined benefit liability/asset), are recognized in Other Comprehensive Income. Such remeasurements are not reclassified to the Statement of Profit and Loss in the subsequent periods.
The Group presents the above liability/(asset) as current and non-current in the Balance Sheet as per actuarial valuation by the independent actuary; however, the entire liability towards gratuity is considered as current as the Group will contribute this amount to the gratuity fund within the next twelve months.
2.18.2 Short Term employee Benefits2.18.2 Short Term employee BenefitsThe undiscounted amount of short term employee benefits expected to be paid in exchange for services rendered by employees is recognized during the period when the employee renders the services. Short term employee benefits includes salary and wages, bonus, incentive and ex-gratia and also includes accrued leave benefits, which are expected to be availed or en-cashed within 12 months from the end of the year.
2.19 LeasesThe determination of whether an arrangement is (or contains) a lease is based on the substance of the arrangement at the inception of the lease. The arrangement is, or contains, a lease if fulfilment of the arrangement is dependent on the use of a specific asset or assets and the arrangement conveys a right to use the asset or assets, even if that right is not explicitly specified in an arrangement.
As a lesseeAs a lesseeThe Group’s leased assets consist of leases for buildings & Vehciles. The Group assesses whether a contract contains a lease, at inception of a contract. A contract is, or contains, a lease if the contract conveys the right to control the use of an identified asset for a period of time in exchange for consideration. To assess whether a contract conveys the right to control the use of an identified asset, the Group assesses whether: (i) the contract involves the use of an identified asset (ii) the Group has substantially all of the economic benefits from use of the asset through the period of the lease and (iii) the Group has the right to direct the use of the asset.
At the date of commencement of the lease, the Group recognizes aright-of-useasset(“ROU”)andacorrespondingleaseliabilityfor all lease arrangements in which it is a lessee, except for leases with a term of twelve months or less (short-term leases) and low value leases. For these short-term and low value leases,
the Group recognizes the lease payments as an operating expense as per the terms of the lease.
The right-of-use assets are initially recognized at cost, which comprises the initial amount of the lease liability adjusted for any lease payments made at or prior to the commencement date of the lease plus any initial direct costs less any lease incentives. They are subsequently measured at cost less accumulated depreciation and impairment losses.
Right-of-use assets are subsequently depreciated from the commencement date on a straight-line basis over the shorter of the lease term and useful life of the underlying asset. The estimated useful lives of right-of-use assets are determined on the same basis as those of Property, Plant and Equipment. In addition, the right-of-use asset is periodically reduced by impairment losses, if any, and adjusted for certain remeasurements of the lease liability.
The lease liability is initially measured at the present value of the lease payments that are not paid at the commencement date, discounted using the interest rate implicit in the lease or, if that rate cannot be readily determined, the Group’s incremental borrowing rate. Generally, the Group uses its incremental borrowing rate as the discount rate.
The lease liability is subsequently measured at amortised cost using the effective interest method. It is remeasured when there is a change in future lease payments arising from a change in an index or rate, if there is a change in the Group’s estimate of the amount expected to be payable under a residual value guarantee, or if the Group changes its assessment of whether it will exercise a purchase, extension or termination option.
When the lease liability is remeasured in this way, a corresponding adjustment is made to the carrying amount of the right-of-use asset, or is recorded in profit or loss if the carrying amount of the right-of-use asset has been reduced to zero.
LeaseliabilityandROUassetshavebeenseparatelypresentedin the Balance Sheet and lease payments have been classified as financing cash flows.
As a lessorAs a lessorLeases for which the Group is a lessor is classified as a finance or operating lease. Whenever the terms of the lease transfer substantially all the risks and rewards of ownership to the lessee, the contract is classified as a finance lease. All other leases are classified as operating leases. When the Group is an intermediate lessor, it accounts for its interests in the head lease and the sublease separately. The sublease is classified asafinanceoroperatingleasebyreferencetotheROUassetarising from the head lease. For operating leases, rental income
NOTES TO cONSOlIDATED FINANcIAl STATEMENTS NOTES TO cONSOlIDATED FINANcIAl STATEMENTS for the year ended on 31st March, 2022
Annual Report 2021-222021-22
200
20 Microns Limited20 Microns Limited

is recognized on a straight line basis over the term of the relevant lease.
Refer note 48 for transition disclosures.
2.20 TaxationTax expenses is the aggregate amount included in the determination of profit or loss for the period in respect of current tax (i.e. amount of tax for the period determined in accordance with the Income Tax Law) and deferred tax (reflecting the tax effects of timing differences between accounting income and taxable income for the period). Income tax expenses are recognised in statement of profit or loss except tax expenses related to items recognised directly in reserves (including statement of other comprehensive income) which are recognised with the underlying items.
2.20.1 Current Tax2.20.1 Current TaxThe current tax expense or credit for the period is the tax payable on the current period’s taxable income based on the applicable income tax rate for each jurisdiction adjusted by changes in deferred tax assets and liabilities attributable to temporary differences and to unused tax losses.
The current income tax charge is calculated on the basis of the tax laws enacted or substantively enacted at the end of the reporting period i.e. as per the provisions of the Income Tax Act, 1961, as amended from time to time. Management periodically evaluates positions taken in tax returns with respect to situations in which applicable tax regulation is subject to interpretation. It establishes provisions where appropriate on the basis of amounts expected to be paid to the tax authorities.
Advance taxes and provisions for current income taxes are presented in the balance sheet after off-setting advance tax paid and income tax provision arising in the same tax jurisdiction for relevant tax paying units and where the Group is able to and intends to settle the asset and liability on a net basis.
2.20.2 Deferred Taxes2.20.2 Deferred TaxesDeferredtaxisprovidedinfullontemporarydifferencearisingbetween the tax bases of the assets and liabilities and their carrying amounts in financial statements at the reporting date.Deferredtaxesarerecognisedinrespectofdeductibletemporary differences being the difference between taxable income and accounting income that originate in one period and are capable of reversal in one or more subsequent periods., the carry forward of unused tax losses and the carry forward of unused tax credits.
Deferredincometaxisdeterminedusingtaxrates(andlaws)that have been enacted or substantially enacted by the end of the reporting period and are expected to apply when the related
deferred income tax asset is realised, or the deferred income tax liability is settled.
Deferredtaxassetsarerecognisedforalldeductibletemporarydifferences and unused tax losses only if it is probable that future taxable amounts will be available to utilise those temporary differences and losses. In case of temporary differences that arise from initial recognition of assets or liabilities in a transaction (other than business combination) that affect neither the taxable profit nor the accounting profit, deferred tax assets are not recognised.
The carrying amount of deferred tax assets is reviewed at each reporting date and reduced to the extent that it is no longer probable that sufficient taxable profit will be available to allow allorpartofthedeferredtaxassettobeutilised.Unrecogniseddeferred tax assets are re-assessed at each reporting date and are recognised to the extent that it has become probable that future taxable profits will allow the deferred tax asset to be recovered.
Any tax credit available including Minimum Alternative Tax (MAT) under the provision of the Income Tax Act, 1961 is recognised as deferred tax to the extent that it is probable that future taxable profit will be available against which the unused tax credits can be utilised. The said asset is created by way of credit to the statement of profit and loss and shown under the head deferred tax asset.
Deferred taxassetsand liabilitiesareoffsetwhen there isalegally enforceable right to offset current tax assets and liabilities and when the deferred tax balances relate to the same taxation authority. Current tax assets and tax liabilities are offset where the Group has a legally enforceable right to offset and intends either to settle on a net basis, or to realise the asset and settle the liability simultaneously.
Current and deferred tax is recognised in profit or loss, except to the extent that it relates to items recognised in other comprehensive income or directly in equity. In this case, the tax is also recognised in other comprehensive income or directly in equity, respectively.
2.21 earnings Per ShareBasic earnings per shareBasic earnings per shareBasic earnings per share is calculated by dividing the profit attributable to owners of the Parent Company by the weighted average number of equity shares outstanding during the period. Earnings considered in ascertaining the Group’s earnings per share is the net profit for the period after deducting preference dividends, if any, and any attributable distribution tax thereto for the period.
NOTES TO cONSOlIDATED FINANcIAl STATEMENTS NOTES TO cONSOlIDATED FINANcIAl STATEMENTS for the year ended on 31st March, 2022
201
Corporate Overview Notice Statutory Reports Financial StatementsFinancial Statements
Diluted earnings per shareDiluted earnings per shareDiluted earnings per share adjusts the figures used in thedetermination of basic earnings per share to take into account the after income tax effect of interest and other financing costs associated with dilutive potential equity shares and the weighted average number of additional equity shares that would have been outstanding assuming the conversion of all dilutive potential equity shares.
2.22 Provisions, Contingent Liabilities and Contingent AssetsProvisions are recognised when the Group has a present obligation (legal or constructive) as a result of a past event, it is probable that an outflow of resources embodying economic benefits will be required to settle the obligation and a reliable estimate can be made of the amount of the obligation. Provision for contractual obligation is disclosed based on management’s assessment of the probable outcome with reference to the available information supplemented by experience of similar transactions. When the Group expects some or all of a provision to be reimbursed, the reimbursement is recognised as a separate asset, but only when the reimbursement is virtually certain. The expense relating to a provision is presented in the statement of profit and loss net of any reimbursement.
Provision in respect of loss contingencies relating to claims, litigation, assessment, fines, penalties etc. are recognised when it is probable that a liability has been incurred and the amount can be estimated reliably.
Provisions are not recognised for future operating losses.
Where there are a number of similar obligations, the likelihood that an outflow will be required in settlement is determined by considering the class of obligations as a whole. A provision is recognised even if the likelihood of an outflow with respect to any one item included in the same class of obligations may be small.
Provisions are measured at management’s best estimate of the expenditure required to settle the present obligation at the end of the reporting period and are not discounted to present value. The estimates of outcome and financial effect are determined by the judgment of the management, supplemented by experience of similar transactions and, in some cases, reports from independent experts.
The measurement of provision for restructuring includes only direct expenditures arising from the restructuring, which are both necessarily entailed by the restructuring and not associated with the ongoing activities of the Group.
Contingent liability is disclosed in the case of:
1. A present obligation arising from the past events, when it is not probable that an outflow of resources will be required to settle the obligation;
2. A present obligation arising from the past events, when no reliable estimate is possible;
3. A possible obligation arising from the past events, unless the probability of outflow of resources is remote.
Contingent liabilities are not provided for and if material, are disclosed by way of notes to financial statements.
A contingent asset is a possible asset that arises from past events and whose existence will be confirmed only by the occurrence or non-occurrence of one or more uncertain future events not wholly within the control of the entity.
Contingent assets are not recognised in financial statements since this may result in the recognition of income that may never be realised. However, Contingent assets are assessed continually and if it is virtually certain that an inflow of economic benefits will arise, the asset and related income are recognised in the period in which the change occurs.
A contingent asset is disclosed by way of notes to financial statements, where an inflow of economic benefits is probable.
Provisions, contingent liabilities and contingent assets are reviewed at each balance sheet date.
2.23 Segment ReportingThe Group primarily operates in the segment of Industrial Micronized Minerals and Speciality chemicals. The Managing Director of the Group allocate resources and assess theperformance of the Group, thus they are the Chief Operating DecisionMaker (CODM).TheCODMmonitors theoperatingresults of the business as a one, hence no separate segment need to be disclosed.
2.24 Cash equivalentsCash and cash equivalents comprise cash and deposits with banks and corporations. The Group considers all highly liquid investments with original maturities of three months or less and that are readily convertible to known amounts of cash to be cash equivalents.
For the purpose of presentation in the statement of cash flows, cash and cash equivalents includes cash on hand, deposits held at call with financial institutions and other short term, highly liquid investments with original maturities of three months or less that are readily convertible to known amounts of cash and which are subject to an insignificant risk of changes in value.
2.25 Statement of Cash FlowsCash flows are reported using the indirect method, whereby profit before tax is adjusted for the effects of transactions of a non-cash nature, any deferrals or accruals of past or future operating cash receipts or payments and item of income or
NOTES TO cONSOlIDATED FINANcIAl STATEMENTS NOTES TO cONSOlIDATED FINANcIAl STATEMENTS for the year ended on 31st March, 2022
Annual Report 2021-222021-22
202
20 Microns Limited20 Microns Limited

expenses associated with investing or financing cash flows. The cash flows from operating, investing and financing activities of the Group are segregated.
2.26 DividendsThe Group recognises a liability for dividends to equity holders of the Group when the dividend is authorised and the dividend is no longer at the discretion of the Group. As per the corporate laws in India, a dividend is authorised when it is approved by the shareholders. A corresponding amount is recognised directly in equity.
2.27 Insurance ClaimsThe Group accounts for insurance claims when there is certainty that the claims are realizable and acknowledged by insurance Group and amount recognized in books of accounts is as under:
• Incaseoflossofasset/goodsbytransferring,eitherthecarrying cost of the relevant asset / goods or insurance value (subject to deductibles), whichever is lower under the head “Claims Recoverable-Insurance”.
• Incase insuranceclaim is, less thancarryingcost thedifference is charged to Profit and Loss statement. As and when claims are finally received from insurer, the difference, if any, between Claims Recoverable-Insurance and claims received is adjusted to Profit and Loss statement.
2.28 Research and DevelopmentExpenditure on research is recognized as an expense when it is incurred. Expenditure on development which does not meet the criteria for recognition as an intangible asset is recognized as an expense when it is incurred.
Items of property, plant and equipment and acquired Intangible AssetsutilizedforResearchandDevelopmentarecapitalizedand depreciated in accordance with the policies stated for Property, Plant and Equipment and Intangible Assets.
2.29 events occurring after the Reporting DateAdjusting events (that provides evidence of condition that existed at the balance sheet date) occurring after the balance sheet date are recognized in the financial statements. Material non-adjusting events (that are inductive of conditions that arose subsequent to the balance sheet date) occurring after the balance sheet date that represents material change and commitment affecting the financial position are disclosed in the Directors’Report.
2.30 exceptional ItemsCertain occasions, the size, type or incidence of an item of income or expense, pertaining to the ordinary activities of the Group is such that its disclosure improves the understanding of the performance of the Group, such income or expense is classified as an exceptional item and accordingly, disclosed in the notes accompanying to the financial statements.
2.31 Rounding offAll amounts disclosed in the financial statements and notes have been rounded off to the nearest Lakhs as per the requirements of Schedule III, unless otherwise stated.
2.32 Recent accounting pronouncementsMinistry of Corporate Affairs (“MCA”) notifies new standard or amendments to the existing standards under Companies (Indian Accounting Standards) Rules as issued from time to time. On March 23, 2022, MCA amended the Companies (Indian Accounting Standards) Amendment Rules, 2022, applicable from April 1st, 2022, as below:
Ind AS 103 – Reference to Conceptual FrameworkThe amendments specifiy that to qualify for recognition as part of applying the acquisition method, the identifiable assets acquired and liabilities assumed must meet the definitions of assets and liabilities in the Conceptual Framework for Financial Reporting under Indian Accounting Standards (Conceptual Framework) issued by the Institute of Chartered Accountants of India at the acquisition date. These changes do not significantly change the requirements of Ind AS 103. The Company does not expect the amendment to have any significant impact in its financial statements.
Ind AS 16 – Proceeds before intended useThe amendments mainly prohibit an entity from deducting from the cost of property, plant and equipment amounts received from selling items produced while the company is preparing the asset for its intended use. Instead, an entity will recognise such sales proceeds and related cost in profit or loss. The Company does not expect the amendments to have any impact in its recognition of its property, plant and equipment in its financial statements.
Ind AS 37 – Onerous Contracts - Costs of Fulfilling a ContractThe amendments specify that that the ‘cost of fulfilling’ a contract comprises the ‘costs that relate directly to the contract’. Costs that relate directly to a contract can either be incremental costs of fulfilling that contract (examples would be direct labour, materials) or an allocation of other costs that relate directly to fulfilling contracts. The amendment is essentially a clarification and the Company does not expect the amendment to have any significant impact in its financial statements.
Ind AS 109 – Annual Improvements to Ind AS (2021)The amendment clarifies which fees an entity includes when it applies the ‘10 percent’ test of Ind AS 109 in assessing whether to derecognise a financial liability. The Company does not expect the amendment to have any significant impact in its financial statements.
NOTES TO cONSOlIDATED FINANcIAl STATEMENTS NOTES TO cONSOlIDATED FINANcIAl STATEMENTS for the year ended on 31st March, 2022
203
Corporate Overview Notice Statutory Reports Financial StatementsFinancial Statements
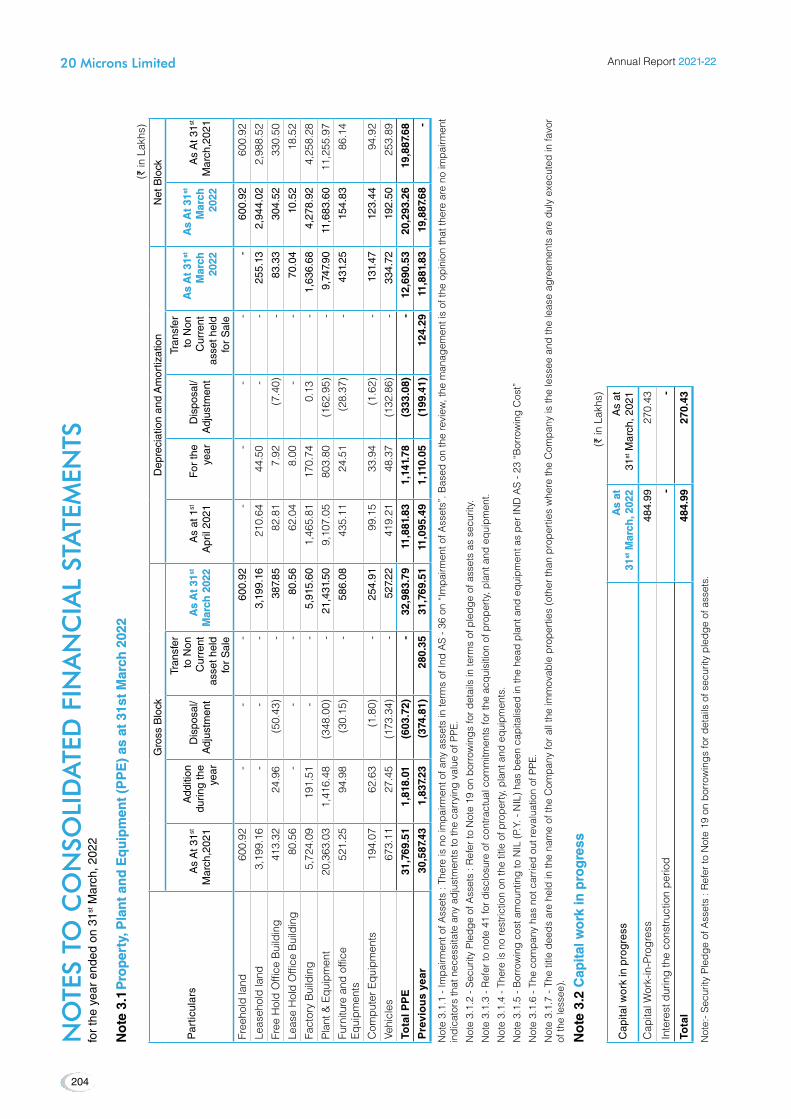
NO
TES
TO c
ON
SOlI
DA
TED
FIN
AN
cIA
l ST
ATE
MEN
TS
NO
TES
TO c
ON
SOlI
DA
TED
FIN
AN
cIA
l ST
ATE
MEN
TS
for
the
year
end
ed o
n 31
st M
arch
, 202
2
No
te 3
.1 P
rop
erty
, Pla
nt
and
eq
uip
men
t (P
Pe
) as
at
31st
Mar
ch 2
022
Pro
per
ty, P
lan
t an
d e
qu
ipm
ent
(PP
e)
as a
t 31
st M
arch
202
2(`
in L
akhs
)
Par
ticul
ars
Gro
ss B
lock
D
epre
ciat
ion
and
Am
ortiz
atio
n
Net
Blo
ck
As
At 3
1st
Mar
ch,2
021
Add
ition
du
ring
the
year
Dis
posa
l/ A
djus
tmen
t
Tra
nsfe
r to
Non
C
urre
nt
asse
t hel
d fo
r S
ale
As
At
31A
s A
t 31
stst
Mar
ch 2
022
Mar
ch 2
022
As
at 1
st
Apr
il 20
21
For
the
year
D
ispo
sal/
Adj
ustm
ent
Tra
nsfe
r to
Non
C
urre
nt
asse
t hel
d fo
r S
ale
As
At
31A
s A
t 31
stst
Mar
ch
Mar
ch
2022
2022
As
At
31 A
s A
t 31
stst
Mar
ch
Mar
ch
2022
20
22
As
At 3
1st
Mar
ch,2
021
Free
hold
land
600
.92
-
-
-
600
.92
-
-
-
-
-
600
.92
600
.92
Leas
ehol
d la
nd 3
,199
.16
-
-
-
3,1
99.1
6 2
10.6
4 4
4.50
-
-
2
55.1
3 2
,944
.02
2,9
88.5
2
Free
Hol
d O
ffice
Bui
ldin
g 4
13.3
2 2
4.96
(5
0.43
) -
3
87.8
5 8
2.81
7
.92
(7.4
0) -
8
3.33
3
04.5
2 3
30.5
0
Leas
e H
old
Offi
ce B
uild
ing
80.
56
-
-
-
80.
56
62.
04
8.0
0 -
-
7
0.04
1
0.52
1
8.52
Fact
ory
Bui
ldin
g 5
,724
.09
191
.51
-
-
5,9
15.6
0 1
,465
.81
170
.74
0.1
3 -
1
,636
.68
4,2
78.9
2 4
,258
.28
Plan
t & E
quip
men
t 2
0,36
3.03
1
,416
.48
(348
.00)
-
21,
431.
50
9,1
07.0
5 8
03.8
0 (1
62.9
5) -
9
,747
.90
11,
683.
60
11,
255.
97
Furn
iture
and
offi
ce
Equi
pmen
ts 5
21.2
5 9
4.98
(3
0.15
) -
5
86.0
8 4
35.1
1 2
4.51
(2
8.37
) -
4
31.2
5 1
54.8
3 8
6.14
Com
pute
r Equ
ipm
ents
194
.07
62.
63
(1.8
0) -
2
54.9
1 9
9.15
3
3.94
(1
.62)
-
131
.47
123
.44
94.
92
Vehi
cles
673
.11
27.
45
(173
.34)
-
527
.22
419
.21
48.
37
(132
.86)
-
334
.72
192
.50
253
.89
Tota
l PP
e 3
1,76
9.51
1
,818
.01
(60
3.72
) -
3
2,98
3.79
1
1,88
1.83
1
,141
.78
(33
3.08
) -
1
2,69
0.53
2
0,29
3.26
1
9,88
7.68
Pre
vio
us
year
30,
587.
43
1,8
37.2
3 (
374.
81)
280
.35
31,
769.
51
11,
095.
49
1,1
10.0
5 (
199.
41)
124
.29
11,
881.
83
19,
887.
68
-
Not
e 3.
1.1
- Im
pairm
ent o
f Ass
ets
: The
re is
no
impa
irmen
t of a
ny a
sset
s in
term
s of
Ind
AS
- 36
on
“Im
pairm
ent o
f Ass
ets”
. Bas
ed o
n th
e re
view
, the
man
agem
ent i
s of
the
opin
ion
that
ther
e ar
e no
impa
irmen
t in
dica
tors
that
nec
essi
tate
any
adj
ustm
ents
to th
e ca
rryi
ng v
alue
of P
PE.
Not
e 3.
1.2
- Sec
urity
Ple
dge
of A
sset
s : R
efer
to N
ote
19 o
n bo
rrow
ings
for d
etai
ls in
term
s of
ple
dge
of a
sset
s as
sec
urity
.
Not
e 3.
1.3
- Ref
er to
not
e 41
for d
iscl
osur
e of
con
tract
ual c
omm
itmen
ts fo
r the
acq
uisi
tion
of p
rope
rty,
pla
nt a
nd e
quip
men
t.
Not
e 3.
1.4
- The
re is
no
rest
rictio
n on
the
title
of p
rope
rty,
pla
nt a
nd e
quip
men
ts.
Note3.1.5-B
orrowingco
stamou
ntingtoNIL(P
.Y.-NIL)h
asbee
nca
pitalised
inth
ehe
adplantand
equ
ipmen
taspe
rINDAS-2
3“B
orrowingCos
t”
Not
e 3.
1.6
- The
com
pany
has
not
car
ried
out r
eval
uatio
n of
PPE
.
Not
e 3.
1.7
- Th
e tit
le d
eeds
are
hel
d in
the
nam
e of
the
Com
pany
for
all t
he im
mov
able
pro
pert
ies
(oth
er th
an p
rope
rtie
s w
here
the
Com
pany
is th
e le
ssee
and
the
leas
e ag
reem
ents
are
dul
y ex
ecut
ed in
favo
r of
the
less
ee).
No
te 3
.2 C
apit
al w
ork
in p
rog
ress
Cap
ital
wo
rk in
pro
gre
ss(`
in L
akhs
)
Cap
ital w
ork
in p
rogr
ess
As
at
As
at
3131stst M
arch
, 202
2 M
arch
, 202
2A
s at
31
st M
arch
, 202
1
Cap
ital W
ork-
in-P
rogr
ess
484.
9927
0.43
Inte
rest
dur
ing
the
cons
truct
ion
perio
d -
-
Tota
l 4
84.9
9 2
70.4
3
Not
e:- S
ecur
ity P
ledg
e of
Ass
ets
: Ref
er to
Not
e 19
on
borr
owin
gs fo
r det
ails
of s
ecur
ity p
ledg
e of
ass
ets.
Annual Report 2021-222021-22
204
20 Microns Limited20 Microns Limited

NO
TES
TO c
ON
SOlI
DA
TED
FIN
AN
cIA
l ST
ATE
MEN
TS
NO
TES
TO c
ON
SOlI
DA
TED
FIN
AN
cIA
l ST
ATE
MEN
TS
for
the
year
end
ed o
n 31
st M
arch
, 202
2
No
te 3
.3 A
gei
ng
Sch
edu
le A
gei
ng
Sch
edu
le
As
on
31
Mar
ch 2
022:
(` in
Lak
hs)
Cap
ital w
ork
in p
rogr
ess
Am
ou
nt
in C
WIP
for
a p
erio
d o
fA
mo
un
t in
CW
IP fo
r a
per
iod
of
Tota
lTo
tal
Les
s th
an 1
Yea
rL
ess
than
1 Y
ear
1-2
Year
s1-
2 Ye
ars
2-3
Year
s2-
3 Ye
ars
Mo
re t
han
3 Y
ears
Mo
re t
han
3 Y
ears
Proj
ects
in P
rogr
ess
484
.99
-
-
-
484
.99
Proj
ects
tem
pora
rily
susp
ende
d -
-
-
-
-
To
tal
484
.99
-
-
-
484
.99
As
on
31
Mar
ch 2
021:
(` in
Lak
hs)
Cap
ital w
ork
in p
rogr
ess
Am
ount
in C
WIP
for
a pe
riod
ofTo
tal
Less
than
1 Y
ear
1-2
Year
s2-
3 Ye
ars
Mor
e th
an 3
Yea
rsPr
ojec
ts in
Pro
gres
s 2
52.2
6 4
.39
13.
78
-
270
.43
Proj
ects
tem
pora
rily
susp
ende
d -
-
-
-
-
To
tal
252
.26
4.3
9 1
3.78
-
2
70.4
3
No
te 3
.3.1
- Th
ere
are
no p
roje
cts
in C
WIP
who
se c
ompl
etio
n is
ove
rdue
or h
as e
xcee
ded
cost
com
pare
d to
orig
inal
pla
n.
No
te 4
.1 -
Inta
ng
ible
ass
ets
as a
t 31
st M
arch
202
2 In
tan
gib
le a
sset
s as
at
31st
Mar
ch 2
022
(` in
Lak
hs)
Par
ticul
ars
Gro
ss B
lock
A
mor
tizat
ion
N
et B
lock
As
At 3
1st
Mar
ch,2
021
Add
ition
du
ring
the
year
Dis
posa
l/ A
djus
tmen
t
Tra
nsfe
r to
N
on
Cur
rent
as
set h
eld
for
Sal
e
As
at
As
at
3131stst M
arch
M
arch
20
22
2022
As
at
1st A
pril
2021
For
the
year
D
ispo
sal/
Adj
ustm
ent
Tra
nsfe
r to
Non
C
urre
nt
asse
t hel
d fo
r S
ale
As
at
As
at
3131stst M
arch
M
arch
20
22
2022
As
at
As
at
3131stst M
arch
M
arch
20
22
2022
As
at
31st M
arch
20
21
Proc
ess
Kno
w h
ow 8
3.39
7
3.98
-
-
1
57.3
7 8
3.38
0
.04
-
-
83.
42
73.
94
0.0
0
Softw
ares
119
.66
-
-
-
119
.66
25.
84
16.
72
-
-
42.
57
77.
09
93.
82
MineDev
elop
men
t30
.17
-
-
-
30.
17
22.2
82.
64 -
-
2
4.93
5
.25
7.8
9
Rightto
Use
590.
48 2
00.8
2 -
-
7
91.2
9 32
4.20
206
.01
-
-
530
.21
261
.09
266
.28
Tota
l In
tan
gib
le A
sset
s 8
23.7
0 2
74.8
0 -
-
1
,098
.49
455
.71
225
.41
-
-
681
.12
417
.37
367
.99
Pre
vio
us
year
1,3
49.1
3 6
3.79
5
89.2
3 -
8
23.7
0 7
76.3
8 2
46.8
9 5
67.5
6 -
4
55.7
1 3
67.9
9 -
Note4.1.1.Produ
ctDev
elop
men
tisac
quire
dkn
owhow
.The
use
fullife
ofthe
produ
ctdev
elop
men
tistake
n5ye
ars.
Note4.1.2So
ftwareinclud
esSAPER
PLice
ncean
dDev
elop
men
tFee
san
dOthersoftwares
.ForSAPER
PLice
ncean
dDev
elop
men
tFee
sus
efullifeiscon
side
redas
7yea
rsand
foro
thersoftwares
theus
eful
life
is 5
yea
rs.
Not
e 4.
1.3-
Impa
irmen
t of A
sset
s : T
here
is n
o im
pairm
ent o
f any
ass
ets
in te
rms
of In
d A
S -
36 o
n “I
mpa
irmen
t of A
sset
s”. B
ased
on
the
revi
ew, t
he m
anag
emen
t is
of th
e op
inio
n th
at th
ere
are
no im
pairm
ent
indi
cato
rs th
at n
eces
sita
te a
ny a
djus
tmen
ts to
the
carr
ying
val
ue o
f int
angi
ble
asse
ts.
Not
e 4.
1.4
- The
re is
no
rest
rictio
n on
the
title
of i
ntan
gibl
e as
sets
.
Not
e 4.
1.5
- The
com
pany
has
not
car
ried
out r
eval
uatio
n of
inta
ngib
le a
sset
s.
205
Corporate Overview Notice Statutory Reports Financial StatementsFinancial Statements
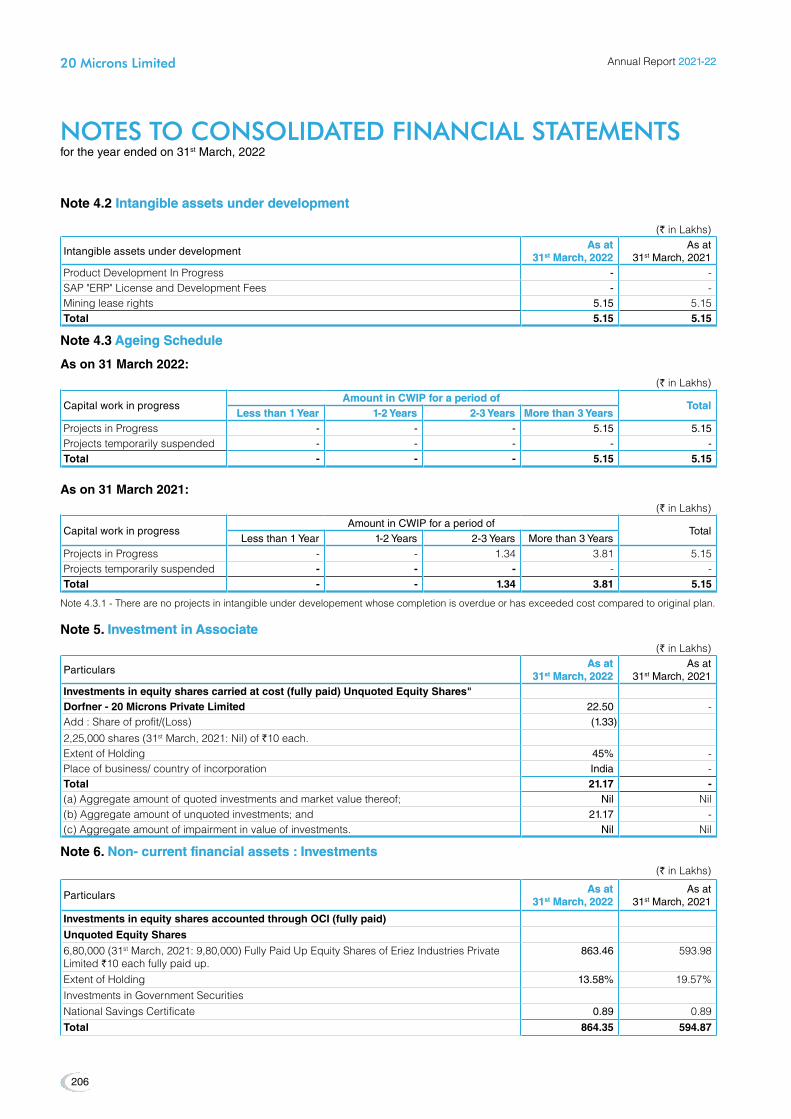
NOTES TO cONSOlIDATED FINANcIAl STATEMENTS NOTES TO cONSOlIDATED FINANcIAl STATEMENTS for the year ended on 31st March, 2022
Note 4.2 Intangible assets under development Intangible assets under development
(` in Lakhs)
Intangible assets under developmentAs at As at
3131stst March, 2022 March, 2022As at
31st March, 2021ProductDevelopmentInProgress - - SAP"ERP"LicenseandDevelopmentFees - - Mining lease rights 5.15 5.15 Total 5.15 5.15
Note 4.3 Ageing Schedule Ageing Schedule
As on 31 March 2022:(` in Lakhs)
Capital work in progressAmount in CWIP for a period ofAmount in CWIP for a period of
TotalTotalLess than 1 YearLess than 1 Year 1-2 Years1-2 Years 2-3 Years2-3 Years More than 3 YearsMore than 3 Years
Projects in Progress - - - 5.15 5.15 Projects temporarily suspended - - - - - Total - - - 5.15 5.15
As on 31 March 2021:(` in Lakhs)
Capital work in progressAmount in CWIP for a period of
TotalLess than 1 Year 1-2 Years 2-3 Years More than 3 Years
Projects in Progress - - 1.34 3.81 5.15 Projects temporarily suspended - - - - - Total - - 1.34 3.81 5.15
Note 4.3.1 - There are no projects in intangible under developement whose completion is overdue or has exceeded cost compared to original plan.
Note 5. Investment in Associate Investment in Associate(` in Lakhs)
ParticularsAs at As at
3131stst March, 2022 March, 2022As at
31st March, 2021Investments in equity shares carried at cost (fully paid) Unquoted equity Shares"Dorfner - 20 Microns Private Limited 22.50 - Add : Share of profit/(Loss) (1.33)
2,25,000 shares (31st March, 2021: Nil) of `10 each.Extent of Holding 45% - Place of business/ country of incorporation India - Total 21.17 - (a) Aggregate amount of quoted investments and market value thereof; Nil Nil (b) Aggregate amount of unquoted investments; and 21.17 - (c) Aggregate amount of impairment in value of investments. Nil Nil
Note 6. Non- current financial assets : Investments Non- current financial assets : Investments(` in Lakhs)
ParticularsAs at As at
3131stst March, 2022 March, 2022As at
31st March, 2021
Investments in equity shares accounted through OCI (fully paid)
Unquoted equity Shares
6,80,000 (31stMarch,2021:9,80,000)FullyPaidUpEquitySharesofEriezIndustriesPrivateLimited `10 each fully paid up.
863.46 593.98
Extent of Holding 13.58% 19.57%Investments in Government SecuritiesNational Savings Certificate 0.89 0.89 Total 864.35 594.87
Annual Report 2021-222021-22
206
20 Microns Limited20 Microns Limited

NOTES TO cONSOlIDATED FINANcIAl STATEMENTS NOTES TO cONSOlIDATED FINANcIAl STATEMENTS for the year ended on 31st March, 2022
(` in Lakhs)
ParticularsAs at As at
3131stst March, 2022 March, 2022As at
31st March, 2021
(a) Aggregate amount of quoted investments and market value thereof; Nil Nil(b) Aggregate amount of unquoted investments; and 864.35 594.87 (c) Aggregate amount of impairment in value of investments. Nil Nil
Note 7. Non- current financial assets : Others Non- current financial assets : Others(` in Lakhs)
ParticularsAs at As at
3131stst March, 2022 March, 2022As at
31st March, 2021
SecurityDeposits
ToOthers[Unsecured,consideredgood] 320.77 312.14
DepositswithBankshavingmaturityover12months -
Margin Money deposits under lien against Bank Guarantee 217.46 3.79
Others 2.56 -
Total 540.79 315.93
Note 8. Other non- current assets Other non- current assets(` in Lakhs)
ParticularsAs at As at
3131stst March, 2022 March, 2022As at
31st March, 2021
Capitaladvances[Unsecured,consideredgood] 1,395.04 760.58
Balances with Government authorities paid under protest 8.14 13.56
Total 1,403.19 774.14
Note 9. Inventories* Inventories* (` in Lakhs)
ParticularsAs at As at
3131stst March, 2022 March, 2022As at
31st March, 2021
Finished Goods 2,429.58 2,361.05
Goods in Transit (Raw Materials) 493.01 189.80
Raw Materials 9,123.96 6,534.93
Stores and Spares 810.15 921.45
Stock in trade 37.82 50.02
Total 12,894.52 10,057.25
* For Valuation- Refer note 2.14 (Accounting Policy)**Refer to Note 19 on borrowings for details in terms of pledge of assets as security.
Note 10. Current financial assets : Trade receivables* Current financial assets : Trade receivables* (` in Lakhs)
ParticularsAs at As at
3131stst March, 2022 March, 2022As at
31st March, 2021
Unsecured,ConsideredGood 10,020.02 9,012.14
Credit Impaired 185.55 204.67
10,205.57 9,216.81
Less: Impairment Allowance for Trade Receivables (185.55) (204.67)
Total 10,020.02 9,012.13
*Refer to Note 19 on borrowings for details in terms of pledge of assets as security.
207
Corporate Overview Notice Statutory Reports Financial StatementsFinancial Statements
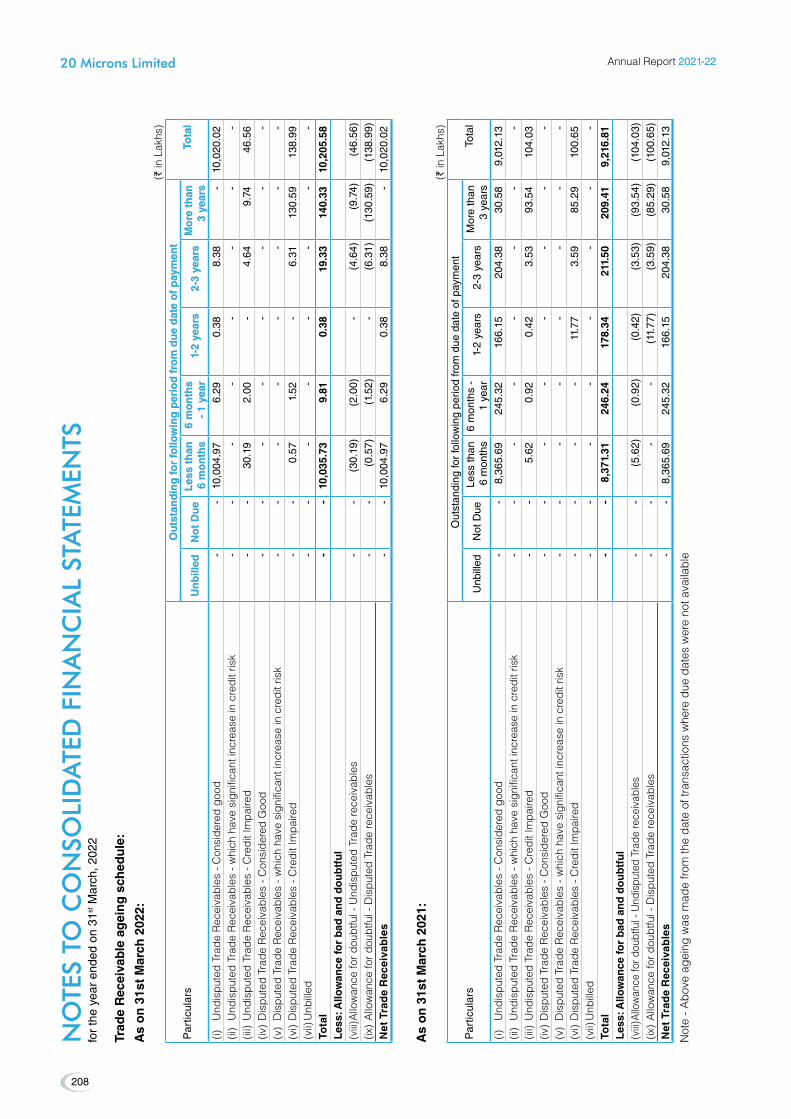
NO
TES
TO c
ON
SOlI
DA
TED
FIN
AN
cIA
l ST
ATE
MEN
TS
NO
TES
TO c
ON
SOlI
DA
TED
FIN
AN
cIA
l ST
ATE
MEN
TS
for
the
year
end
ed o
n 31
st M
arch
, 202
2
Trad
e R
ecei
vab
le a
gei
ng
sch
edu
le:
As
on
31s
t M
arch
202
2:(`
in L
akhs
)
Par
ticul
ars
Ou
tsta
nd
ing
for
follo
win
g p
erio
d f
rom
du
e d
ate
of
pay
men
tO
uts
tan
din
g fo
r fo
llow
ing
per
iod
fro
m d
ue
dat
e o
f p
aym
ent
Tota
lTo
tal
Un
bill
edU
nb
illed
No
t D
ue
No
t D
ue
Les
s th
an
Les
s th
an
6 m
on
ths
6 m
on
ths
6 m
on
ths
6 m
on
ths
- 1
year
- 1
year
1-2
year
s1-
2 ye
ars
2-3
year
s2-
3 ye
ars
Mo
re t
han
M
ore
th
an
3 ye
ars
3 ye
ars
(i)Und
ispu
tedTrad
eRec
eiva
bles
-Con
side
redgo
od -
-
1
0,00
4.97
6
.29
0.3
8 8
.38
-
10,
020.
02
(ii)Und
ispu
tedTrad
eRec
eiva
bles
-which
hav
esign
ifica
ntin
crea
sein
creditrisk
-
-
-
-
-
-
-
-
(iii)Und
ispu
tedTrad
eRec
eiva
bles
-CreditImpa
ired
-
-
30.
19
2.0
0 -
4
.64
9.7
4 4
6.56
(iv
)Dispu
tedTrad
eRec
eiva
bles
-Con
side
redGoo
d -
-
-
-
-
-
-
-
(v)Dispu
tedTrad
eRec
eiva
bles
-which
hav
esign
ifica
ntin
crea
sein
creditrisk
-
-
-
-
-
-
-
-
(vi)Dispu
tedTrad
eRec
eiva
bles
-CreditImpa
ired
-
-
0.5
7 1
.52
-
6.3
1 1
30.5
9 1
38.9
9 (vii)Unb
illed
-
-
-
-
-
-
-
-
Tota
l -
-
1
0,03
5.73
9
.81
0.3
8 1
9.33
1
40.3
3 1
0,20
5.58
L
ess:
Allo
wan
ce fo
r b
ad a
nd
do
ub
tfu
l(v
iii)A
llowan
cefo
rdou
btful-Und
ispu
tedTrad
erece
ivab
les
-
-
(30
.19)
(2.
00)
-
(4.
64)
(9.
74)
(46
.56)
(ix)Allowan
cefo
rdou
btful-Dispu
tedTrad
erece
ivab
les
-
-
(0.
57)
(1.
52)
-
(6.
31)
(13
0.59
) (
138.
99)
Net
Tra
de
Rec
eiva
ble
s -
-
1
0,00
4.97
6
.29
0.3
8 8
.38
-
10,
020.
02
As
on
31s
t M
arch
202
1:(`
in L
akhs
)
Par
ticul
ars
Out
stan
ding
for
follo
win
g pe
riod
from
due
dat
e of
pay
men
tTo
tal
Unb
illed
Not
Due
Less
than
6
mon
ths
6 m
onth
s -
1 ye
ar1-
2 ye
ars
2-3
year
sM
ore
than
3
year
s(i)Und
ispu
tedTrad
eRec
eiva
bles
-Con
side
redgo
od -
-
8
,365
.69
245
.32
166
.15
204
.38
30.
58
9,0
12.1
3 (ii)Und
ispu
tedTrad
eRec
eiva
bles
-which
hav
esign
ifica
ntin
crea
sein
creditrisk
-
-
--
--
- -
(iii)Und
ispu
tedTrad
eRec
eiva
bles
-CreditImpa
ired
-
-
5.6
2 0
.92
0.4
2 3
.53
93.
54
104
.03
(iv)Dispu
tedTrad
eRec
eiva
bles
-Con
side
redGoo
d -
-
-
--
--
-
(v)Dispu
tedTrad
eRec
eiva
bles
-which
hav
esign
ifica
ntin
crea
sein
creditrisk
-
-
--
--
- -
(vi)Dispu
tedTrad
eRec
eiva
bles
-CreditImpa
ired
-
-
--
11.
77
3.5
9 8
5.29
1
00.6
5 (vii)Unb
illed
-
-
--
--
- -
To
tal
-
-
8,3
71.3
1 2
46.2
4 1
78.3
4 2
11.5
0 2
09.4
1 9
,216
.81
Les
s: A
llow
ance
for
bad
an
d d
ou
btf
ul
(viii)A
llowan
cefo
rdou
btful-U
ndispu
tedTrad
erece
ivab
les
-
-
(5.
62)
(0.
92)
(0.
42)
(3.
53)
(93
.54)
(10
4.03
)(ix
)Allowan
cefo
rdou
btful-Dispu
tedTrad
erece
ivab
les
-
-
-
-
(11
.77)
(3.
59)
(85
.29)
(10
0.65
)N
et T
rad
e R
ecei
vab
les
-
-
8,3
65.6
9 2
45.3
2 1
66.1
5 2
04.3
8 3
0.58
9
,012
.13
Not
e - A
bove
age
ing
was
mad
e fro
m th
e da
te o
f tra
nsac
tions
whe
re d
ue d
ates
wer
e no
t ava
ilabl
e
Annual Report 2021-222021-22
208
20 Microns Limited20 Microns Limited
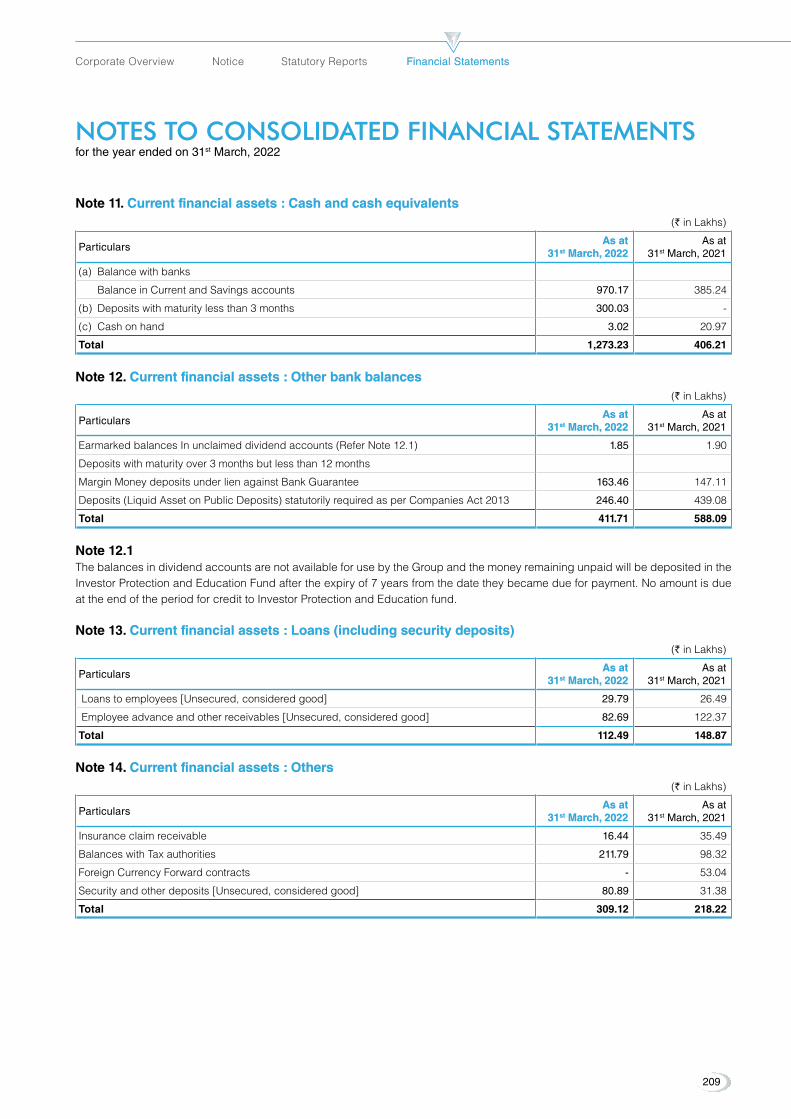
Note 11. Current financial assets : Cash and cash equivalents Current financial assets : Cash and cash equivalents (` in Lakhs)
ParticularsAs at As at
3131stst March, 2022 March, 2022As at
31st March, 2021
(a) Balance with banks
Balance in Current and Savings accounts 970.17 385.24
(b) Depositswithmaturitylessthan3months 300.03 -
(c) Cash on hand 3.02 20.97
Total 1,273.23 406.21
Note 12. Current financial assets : Other bank balances Current financial assets : Other bank balances (` in Lakhs)
ParticularsAs at As at
3131stst March, 2022 March, 2022As at
31st March, 2021
Earmarked balances In unclaimed dividend accounts (Refer Note 12.1) 1.85 1.90
Depositswithmaturityover3monthsbutlessthan12months
Margin Money deposits under lien against Bank Guarantee 163.46 147.11
Deposits(LiquidAssetonPublicDeposits)statutorilyrequiredasperCompaniesAct2013 246.40 439.08
Total 411.71 588.09
Note 12.1 The balances in dividend accounts are not available for use by the Group and the money remaining unpaid will be deposited in the Investor Protection and Education Fund after the expiry of 7 years from the date they became due for payment. No amount is due at the end of the period for credit to Investor Protection and Education fund.
Note 13. Current financial assets : Loans (including security deposits) Current financial assets : Loans (including security deposits) (` in Lakhs)
ParticularsAs at As at
3131stst March, 2022 March, 2022As at
31st March, 2021
Loanstoemployees[Unsecured,consideredgood] 29.79 26.49
Employeeadvanceandotherreceivables[Unsecured,consideredgood] 82.69 122.37
Total 112.49 148.87
Note 14. Current financial assets : Others Current financial assets : Others (` in Lakhs)
ParticularsAs at As at
3131stst March, 2022 March, 2022As at
31st March, 2021
Insurance claim receivable 16.44 35.49
Balances with Tax authorities 211.79 98.32
Foreign Currency Forward contracts - 53.04
Securityandotherdeposits[Unsecured,consideredgood] 80.89 31.38
Total 309.12 218.22
NOTES TO cONSOlIDATED FINANcIAl STATEMENTS NOTES TO cONSOlIDATED FINANcIAl STATEMENTS for the year ended on 31st March, 2022
209
Corporate Overview Notice Statutory Reports Financial StatementsFinancial Statements

NOTES TO cONSOlIDATED FINANcIAl STATEMENTS NOTES TO cONSOlIDATED FINANcIAl STATEMENTS for the year ended on 31st March, 2022
Note 15. Current assets : Others Current assets : Others (` in Lakhs)
ParticularsAs atAs at
3131stst March, 2022 March, 2022As at
31st March, 2021
Advances for expenses[Unsecured, considered good]
To Staff 0.48 1.36
To Others 869.82 1,530.25
870.30 1,531.61
Prepaid Expenses 196.61 109.43
Indirect Tax credit receivable 871.36 403.14
Advance Payment of Income Tax (Net of Provision : C.Y - `1399.87 lakhs, P.Y - `1689.06 lakhs) - Refer note no. 27
333.24 337.21
Plan asset of Gratuity (Net of Provision : 31st March, 2022 - `843.85 lakhs) - Refer note no. 44 75.65 -
Other Current Assets 3.20
Total 2,350.36 2,381.39
Note 16. Asset held for Sale Asset held for Sale (` in Lakhs)
ParticularsAs at As at
3131stst March, 2022 March, 2022As at
31st March, 2021
Leasehold Land - 82.11
Office Building - 1.01
Factory Building - 14.00
Plant & Machinery - 58.78
Furniture & Fixtures - 0.06
Computer Equipments - 0.04
Office Equipment - 0.06
SecurityDeposit - 20.71
Sub Total (a) - 176.77
Provision for Impairment - 46.77
Sub Total (b) - 46.77
Total (a-b) - 130.00
Note 17. Share capital Share capital Note 17.1 Authorised, issued, subscribed, fully paid up share capital
(` in Lakhs)
Particulars As at 31 As at 31stst March 2022 March 2022 As at 31st March 2021
No. of sharesNo. of shares AmountAmount No. of shares Amount
Authorised
Equity Shares of ` 5 each 6,00,00,000 3,000.00 6,00,00,000 3,000.00
Issued, Subscribed and Paid up
Equity Shares of ` 5 each fully paid up 3,52,86,502 1,764.33 3,52,86,502 1,764.33
Total 3,52,86,502 1,764.33 3,52,86,502 1,764.33
Annual Report 2021-222021-22
210
20 Microns Limited20 Microns Limited

NOTES TO cONSOlIDATED FINANcIAl STATEMENTS NOTES TO cONSOlIDATED FINANcIAl STATEMENTS for the year ended on 31st March, 2022
Note 17.2 Reconciliation of shares outstanding at the beginning and at the end of the reporting period(` in Lakhs)
Particulars
As at 31 As at 31stst March 2022 March 2022 As at 31st March 2021
equity Shares of equity Shares of `̀ 5 each fully paid 5 each fully paid Equity Shares of ` 5 each fully paid
No. of sharesNo. of shares AmountAmount No. of shares Amount
Shares outstanding at the beginning of the period 3,52,86,502 1,764.33 3,52,86,502 1,764.33
Shares outstanding at the end of the period 3,52,86,502 1,764.33 3,52,86,502 1,764.33
Note 17.3 Terms/ rights attached to equity shares i The Parent company has only one class of shares referred to as equity shares having a par value of `5 each.
ii Each holder of equity shares is entitled to one vote per share which can be exercised either personally or by an attorney or by proxy.
iii ThedividendproposedifanybytheBoardofDirectorsissubjecttoapprovaloftheshareholdersintheensuinggeneralmeetingexcept in the case of interim dividend.
iv In the event of liquidation of the Parent company, the holders of equity shares shall be entitled to receive assets of the Company, after distribution of all preferential amounts. The amount distributed will be in proportion to the number of equity shares held by the shareholders.
Note 17.4 Shareholders holding more than 5 % of total share capital(` in Lakhs)
Name of Shareholder
As at 31 As at 31stst March 2022 March 2022 As at 31st March 2021
No. of No. of Shares heldShares held
% of Holding % of Holding No. of
Shares held% of Holding
Equity Shares of `5 each fully paid
Eriez Industries Private Limited 85,91,838 24.35% 85,91,838 24.35%
Chandresh S. Parikh 37,90,728 10.74% 37,90,728 10.74%
Pratik Minerals Private Limited NA NA 30,36,206 8.60%
Total 1,23,82,566 35.09% 1,54,18,772 43.70%
Note 17.4.1 Equity shares held by Late Shri Chandresh S. Parikh is in the process of transfer to legal heirs as per the succession agreement.
Disclosures of Shareholding of Promoters - Shares held by the Promoters:
(` in Lakhs)
Promoter name
As at 31 As at 31stst March 2022 March 2022 As at 31st March 2021 % Change during the
yearNo. of No. of
Shares heldShares held% of % of
Holding Holding No. of
Shares held% of Holding
Chandresh S. Parikh (Equity) 37,27,246 10.56% 37,90,728 10.74% -1.67%
Atil Chandresh Parikh (Equity) 17,00,739 4.82% 17,00,739 4.82% 0.00%
Rajesh Chandresh Parikh (Equity) 17,01,714 4.82% 17,01,714 4.82% 0.00%
Ilaben Chandresh Parikh (Equity) 97,482 0.28% 34,000 0.10% 186.71%
Vedika Rajesh Parikh (Equity) 2 - - - -
Eriez Industries Private Limited (Equity) 85,91,838 24.35% 85,91,838 24.35% 0.00%
Note 17.6 The Parent company has not bought back any equity shares, has not allotted any shares as fully paid up pursuant to contracts without payment being received in cash and has not allotted bonus shares, for the period of five years immediately preceding 31st March, 2022.
211
Corporate Overview Notice Statutory Reports Financial StatementsFinancial Statements

NOTES TO cONSOlIDATED FINANcIAl STATEMENTS NOTES TO cONSOlIDATED FINANcIAl STATEMENTS for the year ended on 31st March, 2022
Note 18. OTHeR eQUITY OTHeR eQUITY (` in Lakhs)
ParticularsAs at As at
3131stst March, 2022 March, 2022As at
31st March, 2021
(A)(A) Reserves & SurplusReserves & Surplus
a. General Reserve
Opening Balance 120.54 120.54
Closing Balance 120.54 120.54
b. Securities Premium Account
Opening Balance 3,965.13 3,967.08
Add: received for shares issued during the Period -
Less; Share issue expenditure (14.45) (1.95)
Closing Balance 3,950.68 3,965.13
c. Retained earnings
Opening balance 15,172.23 12,816.65
Add: Profit during the Period 3,458.54 2,297.20
Add: Remeasurements of post-employment benefit obligation, net of tax 8.01 58.38
Closing Balance 18,638.77 15,172.23
d. Foreign Currency Translation Reserve
Opening balance 51.16 56.89
Add:ChangeDuringtheyear 30.05 (5.73)
Balance at the end of the year 81.21 51.16
e. Capital reserve on consolidation 92.26 92.26
Closing Balance 92.26 92.26
Total (A) 22,883.46 19,401.31
(B) equity instrument through OCI
Opening Balance 280.79 (37.43)
Add/(Less): Gain on Sale of Shares 1.35 -
Change in fair value of equity instrument 324.61 412.23
Income tax relating to above item (105.14) (94.01)
Total (B) 501.61 280.79
Total other equity (A+B) 23,385.08 19,682.11
Nature and purpose of reserves :a General reservea General reserve The general reserve is used from time to time to transfer profits from retained earnings for appropriation purpose. As the general
reserve is created by transfer from one component of equity to another and is not an item of other comprehensive income, items included in the general reserve will not be reclassified subsequently to profit and loss.
b Securities Premium Accountb Securities Premium Account Securities premium account represent the premium received at the time of issue of equity share capital.
c Retained earningsc Retained earnings Retained earnings represents surplus / accumulated earnings of the company available for distribution to shareholders.
d Foreign Currency Translation Reserved Foreign Currency Translation Reserve Foreign Currency Translation Reserve created due to conversion of foreign subsidiaries in to functional currency of holding
company & elimination of equity of foreign subsidiaries and investment values in the books of accounts of holding company.
Annual Report 2021-222021-22
212
20 Microns Limited20 Microns Limited
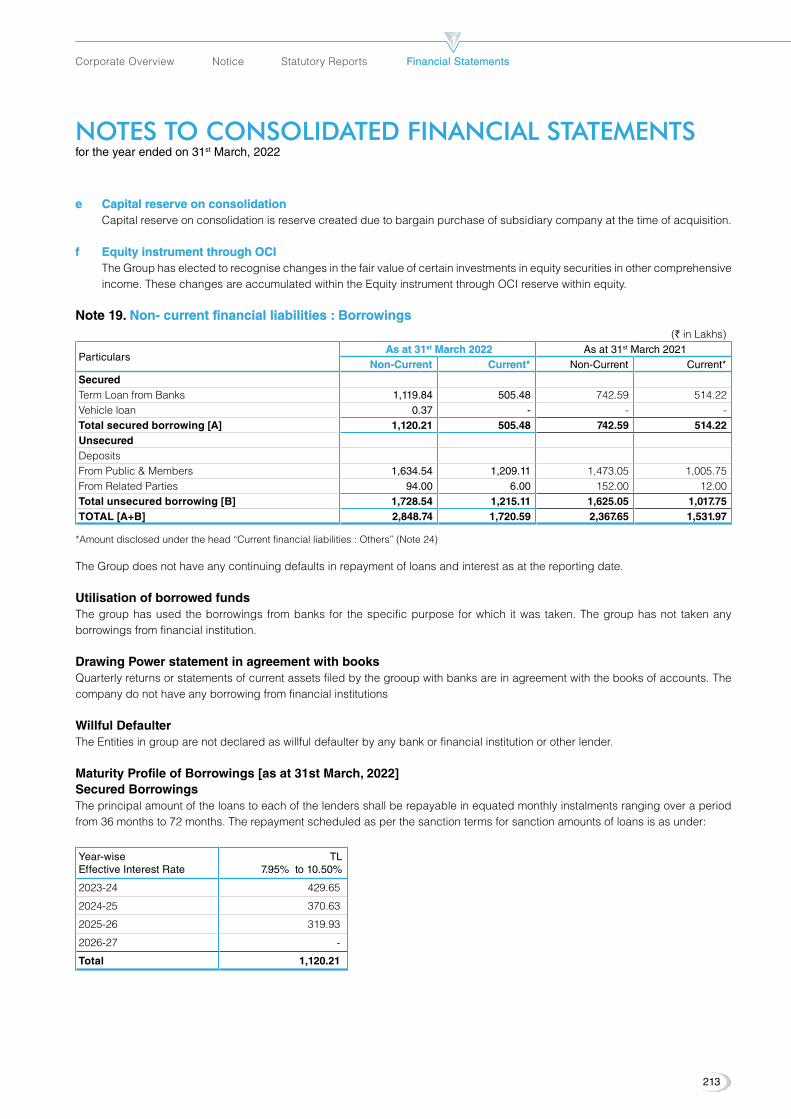
NOTES TO cONSOlIDATED FINANcIAl STATEMENTS NOTES TO cONSOlIDATED FINANcIAl STATEMENTS for the year ended on 31st March, 2022
e Capital reserve on consolidatione Capital reserve on consolidation Capital reserve on consolidation is reserve created due to bargain purchase of subsidiary company at the time of acquisition.
f equity instrument through OCIf equity instrument through OCI The Group has elected to recognise changes in the fair value of certain investments in equity securities in other comprehensive
income. These changes are accumulated within the Equity instrument through OCI reserve within equity.
Note 19. Non- current financial liabilities : Borrowings Non- current financial liabilities : Borrowings (` in Lakhs)
Particulars As at 31 As at 31stst March 2022 March 2022 As at 31st March 2021
Non-CurrentNon-Current Current*Current* Non-Current Current*SecuredTerm Loan from Banks 1,119.84 505.48 742.59 514.22 Vehicle loan 0.37 - - - Total secured borrowing [A] 1,120.21 505.48 742.59 514.22 UnsecuredDepositsFrom Public & Members 1,634.54 1,209.11 1,473.05 1,005.75 From Related Parties 94.00 6.00 152.00 12.00 Total unsecured borrowing [B] 1,728.54 1,215.11 1,625.05 1,017.75 TOTAL [A+B] 2,848.74 1,720.59 2,367.65 1,531.97
*Amount disclosed under the head “Current financial liabilities : Others” (Note 24)
The Group does not have any continuing defaults in repayment of loans and interest as at the reporting date.
Utilisation of borrowed fundsThe group has used the borrowings from banks for the specific purpose for which it was taken. The group has not taken any borrowings from financial institution.
Drawing Power statement in agreement with booksQuarterly returns or statements of current assets filed by the grooup with banks are in agreement with the books of accounts. The company do not have any borrowing from financial institutions
Willful DefaulterThe Entities in group are not declared as willful defaulter by any bank or financial institution or other lender.
Maturity Profile of Borrowings [as at 31st March, 2022]Secured BorrowingsThe principal amount of the loans to each of the lenders shall be repayable in equated monthly instalments ranging over a period from 36 months to 72 months. The repayment scheduled as per the sanction terms for sanction amounts of loans is as under:
Year-wise Effective Interest Rate
TL7.95% to 10.50%
2023-24 429.65
2024-25 370.63
2025-26 319.93
2026-27 -
Total 1,120.21
213
Corporate Overview Notice Statutory Reports Financial StatementsFinancial Statements
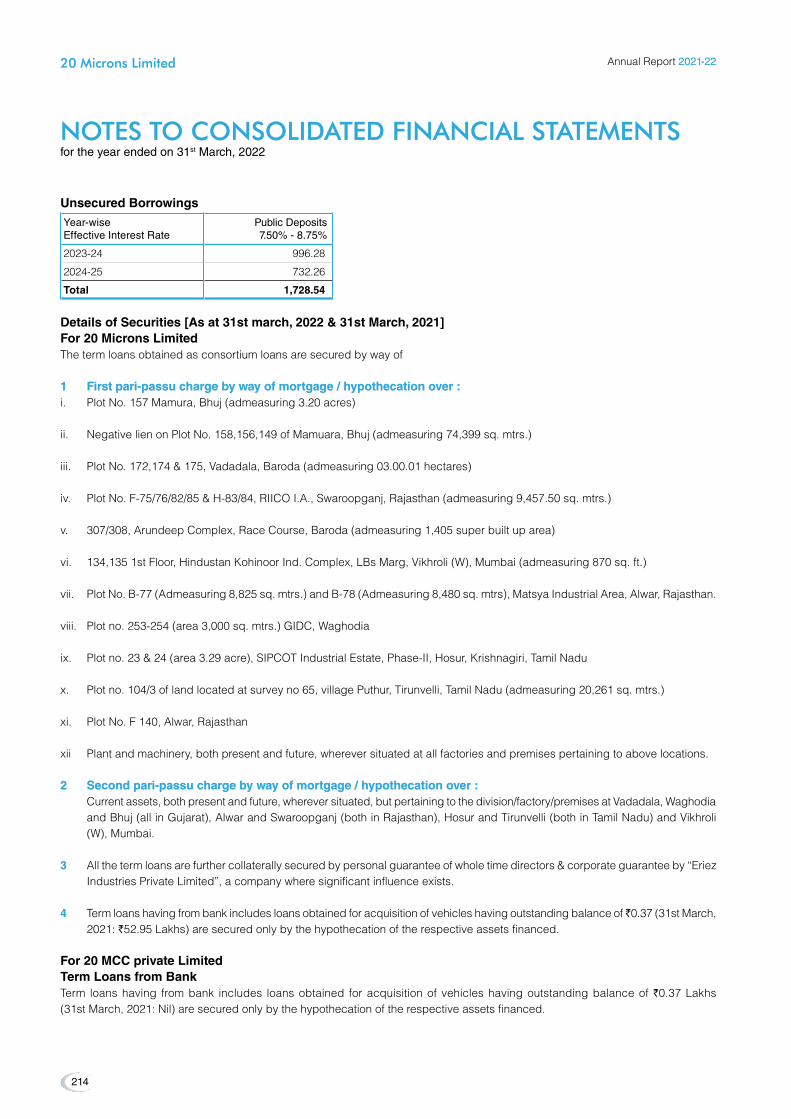
NOTES TO cONSOlIDATED FINANcIAl STATEMENTS NOTES TO cONSOlIDATED FINANcIAl STATEMENTS for the year ended on 31st March, 2022
Unsecured BorrowingsYear-wise Effective Interest Rate
Public Deposits 7.50% - 8.75%
2023-24 996.28
2024-25 732.26
Total 1,728.54
Details of Securities [As at 31st march, 2022 & 31st March, 2021]For 20 Microns LimitedThe term loans obtained as consortium loans are secured by way of
1 First pari-passu charge by way of mortgage / hypothecation over :1 First pari-passu charge by way of mortgage / hypothecation over :i. Plot No. 157 Mamura, Bhuj (admeasuring 3.20 acres)
ii. Negative lien on Plot No. 158,156,149 of Mamuara, Bhuj (admeasuring 74,399 sq. mtrs.)
iii. Plot No. 172,174 & 175, Vadadala, Baroda (admeasuring 03.00.01 hectares)
iv. Plot No. F-75/76/82/85 & H-83/84, RIICO I.A., Swaroopganj, Rajasthan (admeasuring 9,457.50 sq. mtrs.)
v. 307/308, Arundeep Complex, Race Course, Baroda (admeasuring 1,405 super built up area)
vi. 134,135 1st Floor, Hindustan Kohinoor Ind. Complex, LBs Marg, Vikhroli (W), Mumbai (admeasuring 870 sq. ft.)
vii. Plot No. B-77 (Admeasuring 8,825 sq. mtrs.) and B-78 (Admeasuring 8,480 sq. mtrs), Matsya Industrial Area, Alwar, Rajasthan.
viii. Plotno.253-254(area3,000sq.mtrs.)GIDC,Waghodia
ix. Plot no. 23 & 24 (area 3.29 acre), SIPCOT Industrial Estate, Phase-II, Hosur, Krishnagiri, Tamil Nadu
x. Plot no. 104/3 of land located at survey no 65, village Puthur, Tirunvelli, Tamil Nadu (admeasuring 20,261 sq. mtrs.)
xi. Plot No. F 140, Alwar, Rajasthan
xii Plant and machinery, both present and future, wherever situated at all factories and premises pertaining to above locations.
2 Second pari-passu charge by way of mortgage / hypothecation over :2 Second pari-passu charge by way of mortgage / hypothecation over : Current assets, both present and future, wherever situated, but pertaining to the division/factory/premises at Vadadala, Waghodia
and Bhuj (all in Gujarat), Alwar and Swaroopganj (both in Rajasthan), Hosur and Tirunvelli (both in Tamil Nadu) and Vikhroli (W), Mumbai.
33 All the term loans are further collaterally secured by personal guarantee of whole time directors & corporate guarantee by “Eriez Industries Private Limited”, a company where significant influence exists.
44 Term loans having from bank includes loans obtained for acquisition of vehicles having outstanding balance of ̀ 0.37 (31st March, 2021: `52.95 Lakhs) are secured only by the hypothecation of the respective assets financed.
For 20 MCC private LimitedTerm Loans from BankTerm loans having from bank includes loans obtained for acquisition of vehicles having outstanding balance of `0.37 Lakhs (31st March, 2021: Nil) are secured only by the hypothecation of the respective assets financed.
Annual Report 2021-222021-22
214
20 Microns Limited20 Microns Limited

NOTES TO cONSOlIDATED FINANcIAl STATEMENTS NOTES TO cONSOlIDATED FINANcIAl STATEMENTS for the year ended on 31st March, 2022
Note 20. Other Non Current Financial Liabilities Other Non Current Financial Liabilities (` in Lakhs)
ParticularsAs at As at
3131stst March, 2022 March, 2022As at
31st March, 2021
SecurityDeposits 25.92 26.53
Total 25.92 26.53
Note 21. Deferred tax Liabilities Deferred tax Liabilities(a) Deferred tax balances and movement for FY 2021-22
(` in Lakhs)
ParticularsAs at
April 1, 2021Recognised in
profit or lossRecognised
in OCIOther
As atAs at 3131stst March, 2022 March, 2022
Deferred tax Liabilities
Property, plant and equipment and Intangible Assets
2,591.64 60.85 - - 2,652.49
Investments 92.08 (1.53) 105.14 - 195.68
Loans and borrowings 20.10 (9.18) - - 10.93
Employee benefits (0.00) (5.83) - - (5.83)
Total 3,443.91 44.32 105.14 - 2,853.28
Deferred tax asset
Employee benefits 16.84 (29.83) (2.69) - (15.68)
Tax credit 23.83 - - - 23.83
Provisions 53.70 (3.83) - - 49.88
Disallowanceu/s43BofIncomeTaxAct,1961 6.03 0.35 - - 6.39
Carried forward tax losses and unabsorbed depreciation
- - -
Carry forward losses 38.16 38.16
Impairment loss on asset held for sale 11.77 (11.77) - - (0.00)
Lease liability 73.93 (3.41) - - 70.53
Share issue expense 2.52 - - (1.95) 0.57
Total 226.80 (48.48) (2.69) (1.95) 173.67
Net deferred tax Liabilities 2,477.02 92.80 107.83 1.95 2,679.60
The Group offsets tax assets and liabilities if and only if it has a legally enforceable right to set off current tax assets and current tax liabilities and the deferred tax assets and deferred tax liabilities relate to income taxes levied by the same tax authority.
Significant management judgment is required in determining provision for income tax, deferred income tax assets and liabilities and recoverability of deferred income tax assets. The recoverability of deferred income tax assets is based on estimates of taxable income by each jurisdiction in which the relevant entity operates and the period over which deferred income tax assets will be recovered.
215
Corporate Overview Notice Statutory Reports Financial StatementsFinancial Statements
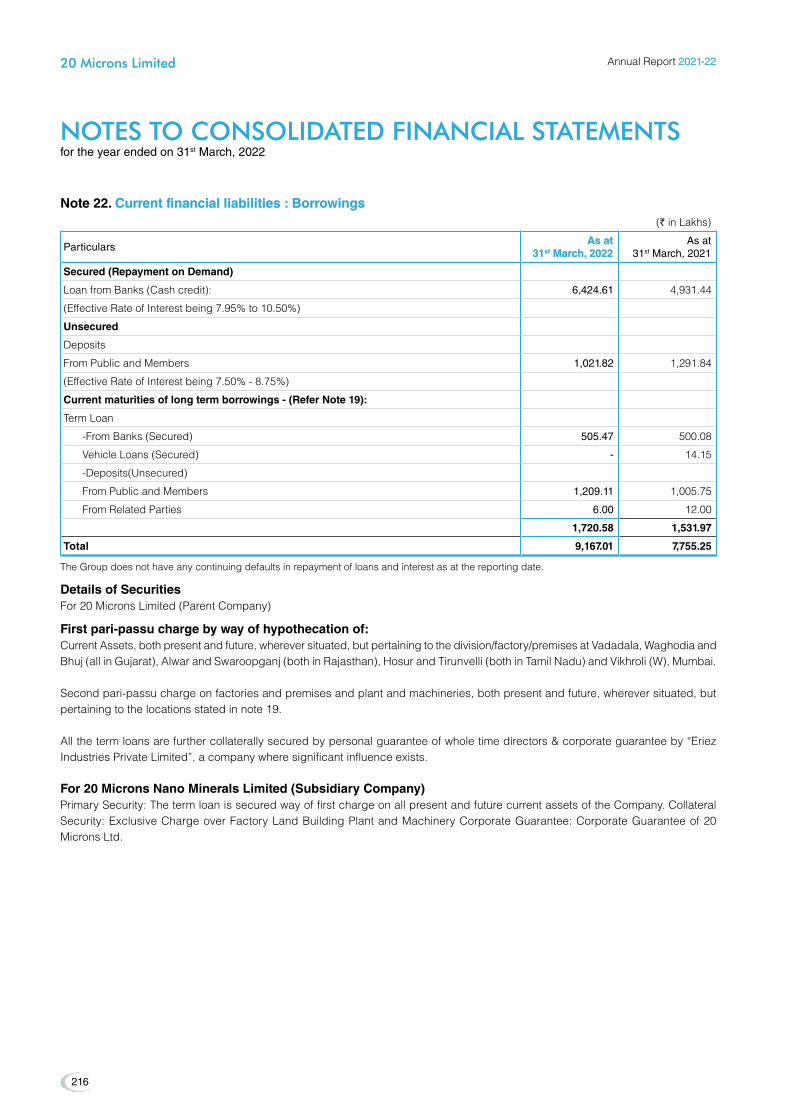
NOTES TO cONSOlIDATED FINANcIAl STATEMENTS NOTES TO cONSOlIDATED FINANcIAl STATEMENTS for the year ended on 31st March, 2022
Note 22. Current financial liabilities : Borrowings Current financial liabilities : Borrowings (` in Lakhs)
ParticularsAs atAs at
3131stst March, 2022 March, 2022As at
31st March, 2021
Secured (Repayment on Demand)
Loan from Banks (Cash credit): 6,424.61 4,931.44
(Effective Rate of Interest being 7.95% to 10.50%)
Unsecured
Deposits
From Public and Members 1,021.82 1,291.84
(Effective Rate of Interest being 7.50% - 8.75%)
Current maturities of long term borrowings - (Refer Note 19):
Term Loan
-From Banks (Secured) 505.47 500.08
Vehicle Loans (Secured) - 14.15
-Deposits(Unsecured)
From Public and Members 1,209.11 1,005.75
From Related Parties 6.00 12.00
1,720.58 1,531.97
Total 9,167.01 7,755.25
The Group does not have any continuing defaults in repayment of loans and interest as at the reporting date.
Details of SecuritiesFor 20 Microns Limited (Parent Company)
First pari-passu charge by way of hypothecation of:Current Assets, both present and future, wherever situated, but pertaining to the division/factory/premises at Vadadala, Waghodia and Bhuj (all in Gujarat), Alwar and Swaroopganj (both in Rajasthan), Hosur and Tirunvelli (both in Tamil Nadu) and Vikhroli (W), Mumbai.
Second pari-passu charge on factories and premises and plant and machineries, both present and future, wherever situated, but pertaining to the locations stated in note 19.
All the term loans are further collaterally secured by personal guarantee of whole time directors & corporate guarantee by “Eriez Industries Private Limited”, a company where significant influence exists.
For 20 Microns Nano Minerals Limited (Subsidiary Company)Primary Security: The term loan is secured way of first charge on all present and future current assets of the Company. Collateral Security: Exclusive Charge over Factory Land Building Plant and Machinery Corporate Guarantee: Corporate Guarantee of 20 Microns Ltd.
Annual Report 2021-222021-22
216
20 Microns Limited20 Microns Limited

NOTES TO cONSOlIDATED FINANcIAl STATEMENTS NOTES TO cONSOlIDATED FINANcIAl STATEMENTS for the year ended on 31st March, 2022
Note 23. Current financial liabilities : Trade payables Current financial liabilities : Trade payables (` in Lakhs)
ParticularsAs at As at
3131stst March, 2022 March, 2022As at
31st March, 2021
Non Current
Total outstanding dues of Micro and Small Enterprise - -
Total outstanding dues of Creditors other than Micro and Small Enterprise 84.32 -
Sub-Total (a) 84.32 -
Current
Total outstanding dues of micro enterprises and small enterprises - Trade payables (Refer Note 23.1)
61.20 169.50
Total outstanding dues of creditors other than micro enterprises and small enterprises:- 9,809.69 9,207.05
Sub-Total (b) 9,870.89 9,376.55
Total 9,955.21 9,376.55
Note 23.1The details of amount outstanding to Micro, Small and Medium Enterprises under the Micro, Small and Medium Enterprises DevelopmentAct,2006(MSMEDAct),basedontheavailableinformationwiththeCompanyareasunder:
(` in Lakhs)
ParticularsAs at As at
3131stst March, 2022 March, 2022As at
31st March, 2021
the principal amount remaining unpaid to any supplier at the end of each accounting year 61.20 169.50
Interest due on (1) above and remaining unpaid as at the end of accounting period 0.69 1.65
the amount of interest paid by the buyer in terms of section 16 of the Micro, Small and Medium EnterprisesDevelopmentAct,2006(27of2006),alongwiththeamountofthepaymentmadetothe supplier beyond the appointed day during each accounting yearInterest paid on all delayed paymentsunderMSMEDAct,2006
- -
the amount of interest due and payable for the period of delay in making payment (which has been paid but beyond the appointed day during the year) but without adding the interest specified undertheMicro,SmallandMediumEnterprisesDevelopmentAct,2006;
- -
the amount of further interest remaining due and payable even in the succeeding years, until such date when the interest dues above are actually paid to the small enterprise, for the purpose of disallowance of a deductible expenditure under section 23 of the Micro, Small and MediumEnterprisesDevelopmentAct,2006
- -
Trade Payable ageing schedule: As on 31st March 2022:
(` in Lakhs)
Particulars
Outstanding for following period from due date of paymentOutstanding for following period from due date of paymentTotalTotal
UnbilledUnbilled Not DueNot DueLess than Less than
1 Year1 Year1-2 years1-2 years 2-3 years2-3 years
More than More than 3 years3 years
(i) MSME - - 61.20 - - - 61.20
(ii) Others - - 9,853.57 20.53 19.92 - 9,894.01
(iii) Disputeddues-MSME - - - - - - -
(iv)Disputeddues-Others - - - - - - -
(v) Unbilled - - - - - - -
Total - - 9,914.76 20.53 19.92 - 9,955.21
217
Corporate Overview Notice Statutory Reports Financial StatementsFinancial Statements
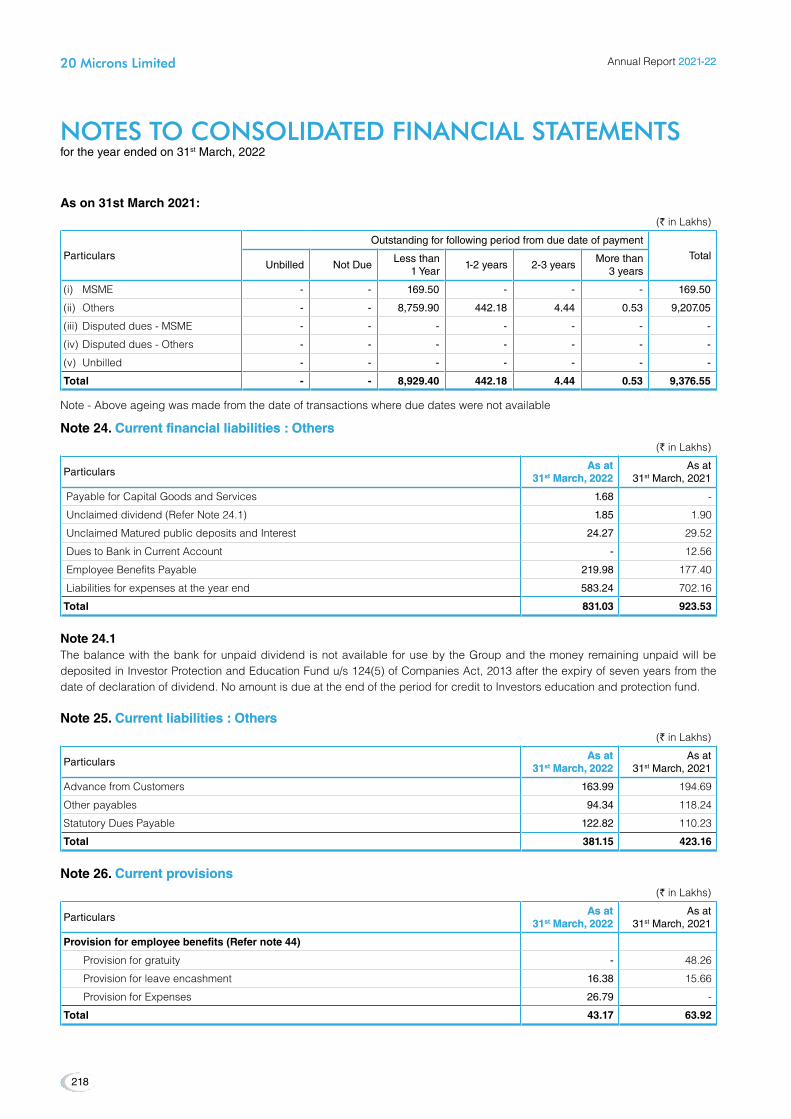
NOTES TO cONSOlIDATED FINANcIAl STATEMENTS NOTES TO cONSOlIDATED FINANcIAl STATEMENTS for the year ended on 31st March, 2022
As on 31st March 2021:(` in Lakhs)
Particulars
Outstanding for following period from due date of payment
TotalUnbilled Not Due
Less than 1 Year
1-2 years 2-3 yearsMore than
3 years
(i) MSME - - 169.50 - - - 169.50
(ii) Others - - 8,759.90 442.18 4.44 0.53 9,207.05
(iii) Disputeddues-MSME - - - - - - -
(iv)Disputeddues-Others - - - - - - -
(v) Unbilled - - - - - - -
Total - - 8,929.40 442.18 4.44 0.53 9,376.55
Note - Above ageing was made from the date of transactions where due dates were not available
Note 24. Current financial liabilities : Others Current financial liabilities : Others (` in Lakhs)
ParticularsAs at As at
3131stst March, 2022 March, 2022As at
31st March, 2021
Payable for Capital Goods and Services 1.68 -
Unclaimeddividend(ReferNote24.1) 1.85 1.90
UnclaimedMaturedpublicdepositsandInterest 24.27 29.52
DuestoBankinCurrentAccount - 12.56
Employee Benefits Payable 219.98 177.40
Liabilities for expenses at the year end 583.24 702.16
Total 831.03 923.53
Note 24.1The balance with the bank for unpaid dividend is not available for use by the Group and the money remaining unpaid will be deposited in Investor Protection and Education Fund u/s 124(5) of Companies Act, 2013 after the expiry of seven years from the date of declaration of dividend. No amount is due at the end of the period for credit to Investors education and protection fund.
Note 25. Current liabilities : Others Current liabilities : Others (` in Lakhs)
ParticularsAs at As at
3131stst March, 2022 March, 2022As at
31st March, 2021
Advance from Customers 163.99 194.69
Other payables 94.34 118.24
StatutoryDuesPayable 122.82 110.23
Total 381.15 423.16
Note 26. Current provisions Current provisions (` in Lakhs)
ParticularsAs at As at
3131stst March, 2022 March, 2022As at
31st March, 2021
Provision for employee benefits (Refer note 44)
Provision for gratuity - 48.26
Provision for leave encashment 16.38 15.66
Provision for Expenses 26.79 -
Total 43.17 63.92
Annual Report 2021-222021-22
218
20 Microns Limited20 Microns Limited

NOTES TO cONSOlIDATED FINANcIAl STATEMENTS NOTES TO cONSOlIDATED FINANcIAl STATEMENTS for the year ended on 31st March, 2022
Note 27. Details of Income tax assets and income tax liabilities Details of Income tax assets and income tax liabilities (` in Lakhs)
ParticularsAs at As at
3131stst March, 2022 March, 2022As at
31st March, 2021
Current income tax liabilities (Net of Advance Tax : C.Y - `947.35 lakhs, P.Y- `Nil Lakhs) 78.68 0.47
Net Asset (Asset - Liability) 78.68 0.47
Movement in current income tax asset/(liability) (` in Lakhs)
ParticularsAs at As at
3131stst March, 2022 March, 2022As at
31st March, 2021
Net current income tax asset/(liability) at the beginning 336.75 267.11
Income tax paid for the year 1,148.85 693.16
Provision for Income tax for the year (Refer Note 38) (1,197.77) (609.82)
Prior year tax /refund adjusted with tax / other items (33.26) (13.70)
Adjustment/Reclassification to MAT - -
Net current income tax asset/(liability) at the end 254.57 336.75
Components of Net income tax asset/(liability) at the end (` in Lakhs)
ParticularsAs at As at
3131stst March, 2022 March, 2022As at
31st March, 2021
Advance Payment of Income Tax (Net of Provision : C.Y- `1228.21 lakhs, P.Y - `1689.06 lakhs) 333.24 337.21
Current income tax liabilities (Net of Advance Tax : C.Y - `947.35 lakhs, P.Y - `NIL) 78.68 0.47
254.57 336.75
Note 28. Revenue from Operations Revenue from Operations (` in Lakhs)
ParticularsFor the year endedFor the year ended
3131stst March, 2022 March, 2022For the year ended
31st March, 2021
Revenue from Operations
Sale of products 61,144.27 48,331.24
Other operating revenues 175.95 21.43
Total 61,320.21 48,352.67
Note 28.1Details of other operating revenues of the Group are as under:
(` in Lakhs)
ParticularsFor the year endedFor the year ended
3131stst March, 2022 March, 2022For the year ended
31st March, 2021
Export Incentives 17.72 4.69
Scrap Sales 5.69 9.96
Jobwork Charges 125.05 4.25
Other 27.49 2.53
Total 175.95 21.43
219
Corporate Overview Notice Statutory Reports Financial StatementsFinancial Statements
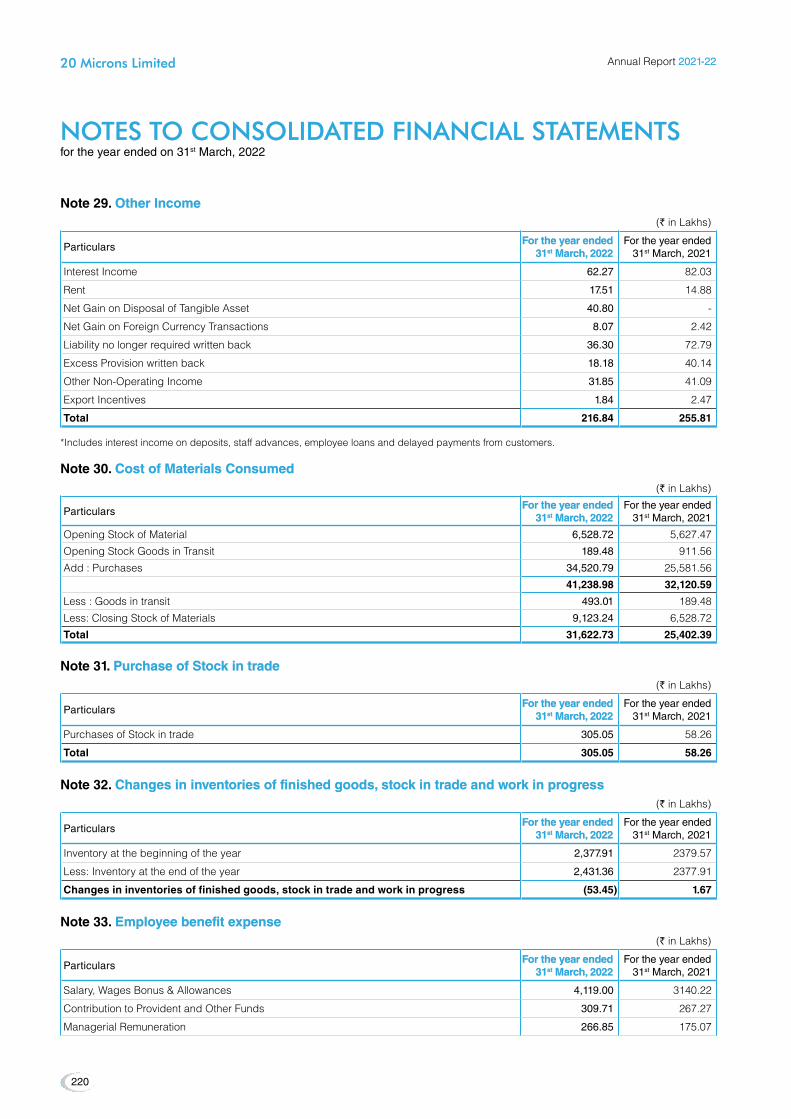
NOTES TO cONSOlIDATED FINANcIAl STATEMENTS NOTES TO cONSOlIDATED FINANcIAl STATEMENTS for the year ended on 31st March, 2022
Note 29. Other Income Other Income (` in Lakhs)
ParticularsFor the year endedFor the year ended
3131stst March, 2022 March, 2022For the year ended
31st March, 2021
Interest Income 62.27 82.03
Rent 17.51 14.88
NetGainonDisposalofTangibleAsset 40.80 -
Net Gain on Foreign Currency Transactions 8.07 2.42
Liability no longer required written back 36.30 72.79
Excess Provision written back 18.18 40.14
Other Non-Operating Income 31.85 41.09
Export Incentives 1.84 2.47
Total 216.84 255.81
*Includes interest income on deposits, staff advances, employee loans and delayed payments from customers.
Note 30. Cost of Materials Consumed Cost of Materials Consumed (` in Lakhs)
ParticularsFor the year endedFor the year ended
3131stst March, 2022 March, 2022For the year ended
31st March, 2021
Opening Stock of Material 6,528.72 5,627.47
Opening Stock Goods in Transit 189.48 911.56
Add : Purchases 34,520.79 25,581.56
41,238.98 32,120.59
Less : Goods in transit 493.01 189.48
Less: Closing Stock of Materials 9,123.24 6,528.72
Total 31,622.73 25,402.39
Note 31. Purchase of Stock in trade Purchase of Stock in trade (` in Lakhs)
ParticularsFor the year endedFor the year ended
3131stst March, 2022 March, 2022For the year ended
31st March, 2021
Purchases of Stock in trade 305.05 58.26
Total 305.05 58.26
Note 32. Changes in inventories of finished goods, stock in trade and work in progress Changes in inventories of finished goods, stock in trade and work in progress (` in Lakhs)
ParticularsFor the year endedFor the year ended
3131stst March, 2022 March, 2022For the year ended
31st March, 2021
Inventory at the beginning of the year 2,377.91 2379.57
Less: Inventory at the end of the year 2,431.36 2377.91
Changes in inventories of finished goods, stock in trade and work in progress (53.45) 1.67
Note 33. employee benefit expense employee benefit expense (` in Lakhs)
ParticularsFor the year endedFor the year ended
3131stst March, 2022 March, 2022For the year ended
31st March, 2021
Salary, Wages Bonus & Allowances 4,119.00 3140.22
Contribution to Provident and Other Funds 309.71 267.27
Managerial Remuneration 266.85 175.07
Annual Report 2021-222021-22
220
20 Microns Limited20 Microns Limited
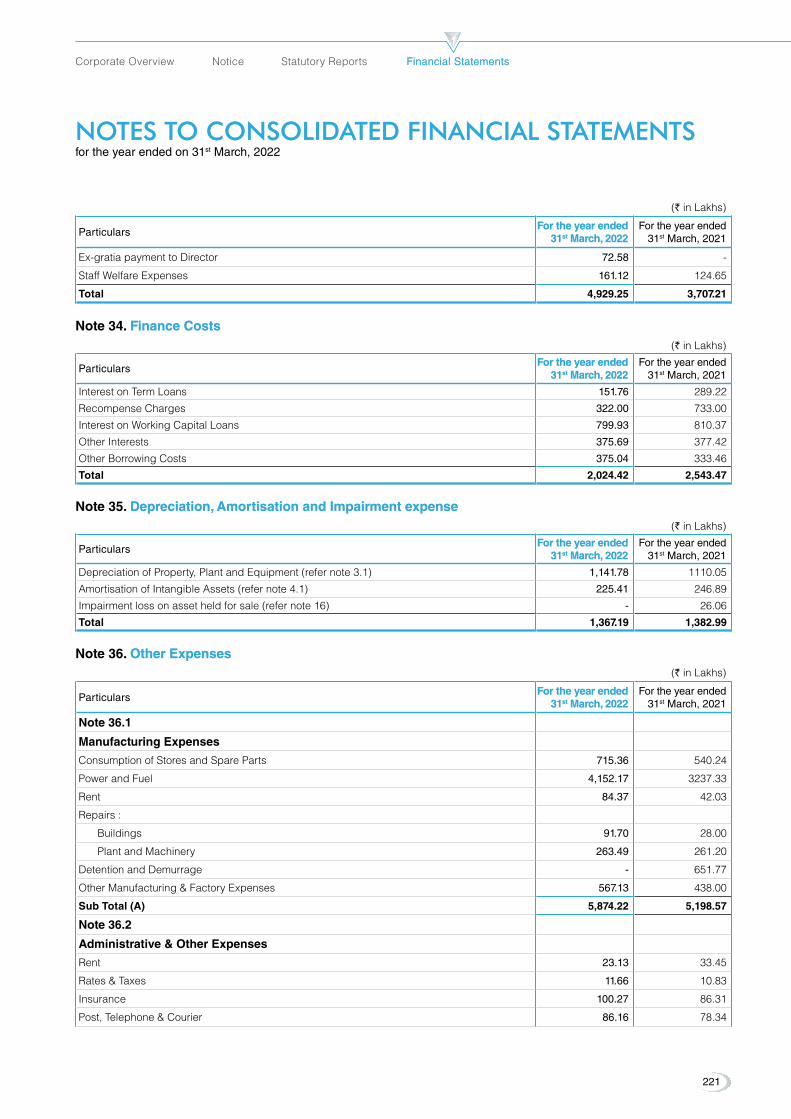
NOTES TO cONSOlIDATED FINANcIAl STATEMENTS NOTES TO cONSOlIDATED FINANcIAl STATEMENTS for the year ended on 31st March, 2022
(` in Lakhs)
ParticularsFor the year endedFor the year ended
3131stst March, 2022 March, 2022For the year ended
31st March, 2021
Ex-gratiapaymenttoDirector 72.58 -
Staff Welfare Expenses 161.12 124.65
Total 4,929.25 3,707.21
Note 34. Finance Costs Finance Costs (` in Lakhs)
ParticularsFor the year endedFor the year ended
3131stst March, 2022 March, 2022For the year ended
31st March, 2021
Interest on Term Loans 151.76 289.22
Recompense Charges 322.00 733.00
Interest on Working Capital Loans 799.93 810.37
Other Interests 375.69 377.42
Other Borrowing Costs 375.04 333.46
Total 2,024.42 2,543.47
Note 35. Depreciation, Amortisation and Impairment expense Depreciation, Amortisation and Impairment expense (` in Lakhs)
ParticularsFor the year endedFor the year ended
3131stst March, 2022 March, 2022For the year ended
31st March, 2021
DepreciationofProperty,PlantandEquipment(refernote3.1) 1,141.78 1110.05
Amortisation of Intangible Assets (refer note 4.1) 225.41 246.89
Impairment loss on asset held for sale (refer note 16) - 26.06
Total 1,367.19 1,382.99
Note 36. Other expenses Other expenses (` in Lakhs)
ParticularsFor the year endedFor the year ended
3131stst March, 2022 March, 2022For the year ended
31st March, 2021
Note 36.1
Manufacturing expenses
Consumption of Stores and Spare Parts 715.36 540.24
Power and Fuel 4,152.17 3237.33
Rent 84.37 42.03
Repairs :
Buildings 91.70 28.00
Plant and Machinery 263.49 261.20
DetentionandDemurrage - 651.77
Other Manufacturing & Factory Expenses 567.13 438.00
Sub Total (A) 5,874.22 5,198.57
Note 36.2
Administrative & Other expenses
Rent 23.13 33.45
Rates & Taxes 11.66 10.83
Insurance 100.27 86.31
Post, Telephone & Courier 86.16 78.34
221
Corporate Overview Notice Statutory Reports Financial StatementsFinancial Statements

NOTES TO cONSOlIDATED FINANcIAl STATEMENTS NOTES TO cONSOlIDATED FINANcIAl STATEMENTS for the year ended on 31st March, 2022
(` in Lakhs)
ParticularsFor the year endedFor the year ended
3131stst March, 2022 March, 2022For the year ended
31st March, 2021
Printing and Stationary expenses 29.16 30.07
Legal, Licenses and Renewal expenses 51.58 66.52
Software and Computer Maintenance 48.36 69.25
Travelling & Conveyance 106.82 69.20
Vehicle Running & Maintenance 94.59 74.95
Professional Fees 206.00 162.01
Auditors Remuneration (refer note no. 36.4) 16.02 13.90
DirectorsSittingFees 17.05 14.64
LossonDisposalofTangibleAssets(Net) 6.55 35.34
Donation 0.42 0.12
RemissionofDebitbalance 48.44 11.62
Impairment in asset held for sale (electricity deposit) - 20.71
Fine and penalty 1.72 8.56
Miscellaneous Expenses 257.71 207.58
Loss on Foreign Currency Transactions 2.92 36.03
CSR Expenditure (refer note no. 37) 57.88 79.42
Royalty Paid 8.78 0.00
Sub Total (B) 1,175.22 1,108.84
Note 36.3
Marketing, Selling & Distribution expenses :
Selling Expenses
Travelling Expenses 251.43 190.87
Sales Commission 77.02 75.18
BadDebtswrittenoff 11.85 11.46
Allowance for impairment loss - 45.86
Rent 175.24 86.46
Other Selling Expenses 518.31 138.83
Other Expense 20.90 2.70
DistributionExpenses
FreightandLogisticExpenses(Domestic) 5,642.98 5,006.12
Freight and Logistic Expenses (Export) 2,776.51 1,437.82
Export Expenses 54.37 33.88
Sub Total (c) 9,528.60 7,029.18
Total (A+B+C) 16,578.04 13,336.59
Note 36.4Payment to Auditors
(` in Lakhs)
ParticularsFor the year endedFor the year ended
3131stst March, 2022 March, 2022For the year ended
31st March, 2021
Audit Fees 15.07 13.11
In Other Capacity 0.48 0.71
Out of Pocket Expense 0.47 0.08
Total 16.02 13.90
Annual Report 2021-222021-22
222
20 Microns Limited20 Microns Limited
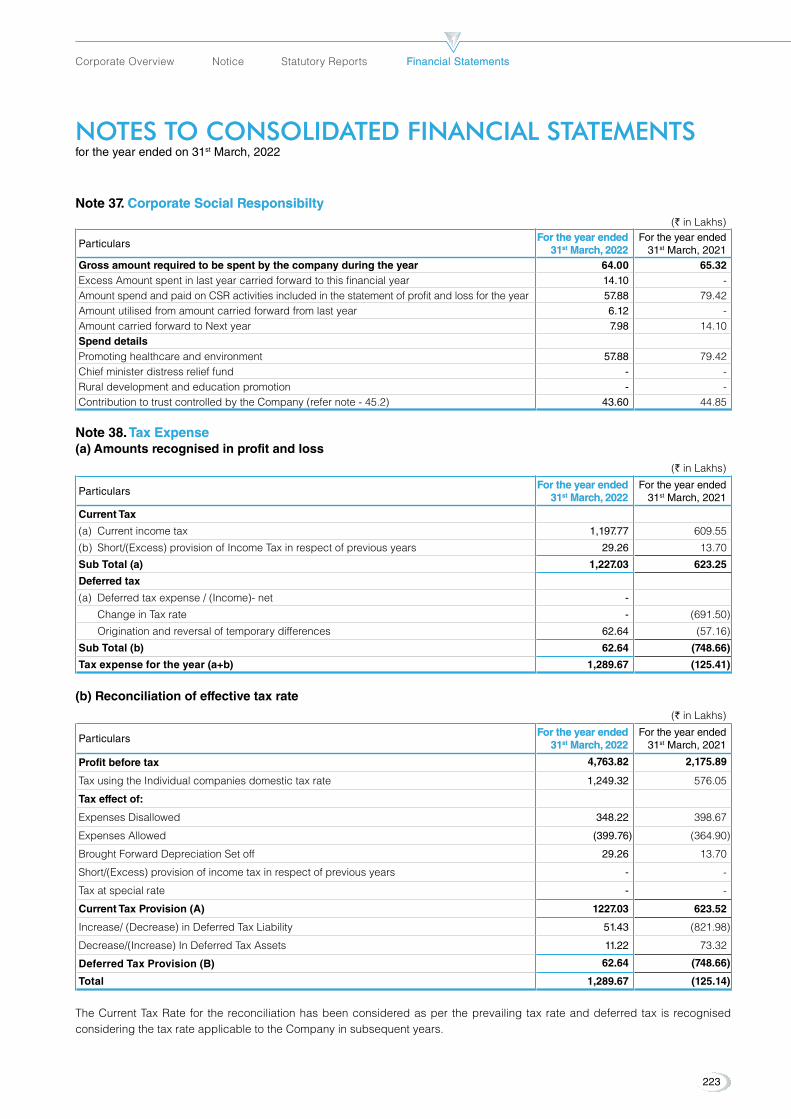
NOTES TO cONSOlIDATED FINANcIAl STATEMENTS NOTES TO cONSOlIDATED FINANcIAl STATEMENTS for the year ended on 31st March, 2022
Note 37. Corporate Social Responsibilty Corporate Social Responsibilty (` in Lakhs)
ParticularsFor the year endedFor the year ended
3131stst March, 2022 March, 2022For the year ended
31st March, 2021Gross amount required to be spent by the company during the year 64.00 65.32 Excess Amount spent in last year carried forward to this financial year 14.10 - Amount spend and paid on CSR activities included in the statement of profit and loss for the year 57.88 79.42 Amount utilised from amount carried forward from last year 6.12 - Amount carried forward to Next year 7.98 14.10 Spend detailsPromoting healthcare and environment 57.88 79.42 Chief minister distress relief fund - - Rural development and education promotion - - Contribution to trust controlled by the Company (refer note - 45.2) 43.60 44.85
Note 38. Tax expense Tax expense (a) Amounts recognised in profit and loss
(` in Lakhs)
ParticularsFor the year endedFor the year ended
3131stst March, 2022 March, 2022For the year ended
31st March, 2021
Current Tax
(a) Current income tax 1,197.77 609.55
(b) Short/(Excess) provision of Income Tax in respect of previous years 29.26 13.70
Sub Total (a) 1,227.03 623.25
Deferred tax
(a) Deferredtaxexpense/(Income)-net -
Change in Tax rate - (691.50)
Origination and reversal of temporary differences 62.64 (57.16)
Sub Total (b) 62.64 (748.66)
Tax expense for the year (a+b) 1,289.67 (125.41)
(b) Reconciliation of effective tax rate (` in Lakhs)
ParticularsFor the year endedFor the year ended
3131stst March, 2022 March, 2022For the year ended
31st March, 2021
Profit before tax 4,763.82 2,175.89
Tax using the Individual companies domestic tax rate 1,249.32 576.05
Tax effect of:
ExpensesDisallowed 348.22 398.67
Expenses Allowed (399.76) (364.90)
BroughtForwardDepreciationSetoff 29.26 13.70
Short/(Excess) provision of income tax in respect of previous years - -
Tax at special rate - -
Current Tax Provision (A) 1227.03 623.52
Increase/(Decrease)inDeferredTaxLiability 51.43 (821.98)
Decrease/(Increase)InDeferredTaxAssets 11.22 73.32
Deferred Tax Provision (B) 62.64 (748.66)
Total 1,289.67 (125.14)
The Current Tax Rate for the reconciliation has been considered as per the prevailing tax rate and deferred tax is recognised considering the tax rate applicable to the Company in subsequent years.
223
Corporate Overview Notice Statutory Reports Financial StatementsFinancial Statements
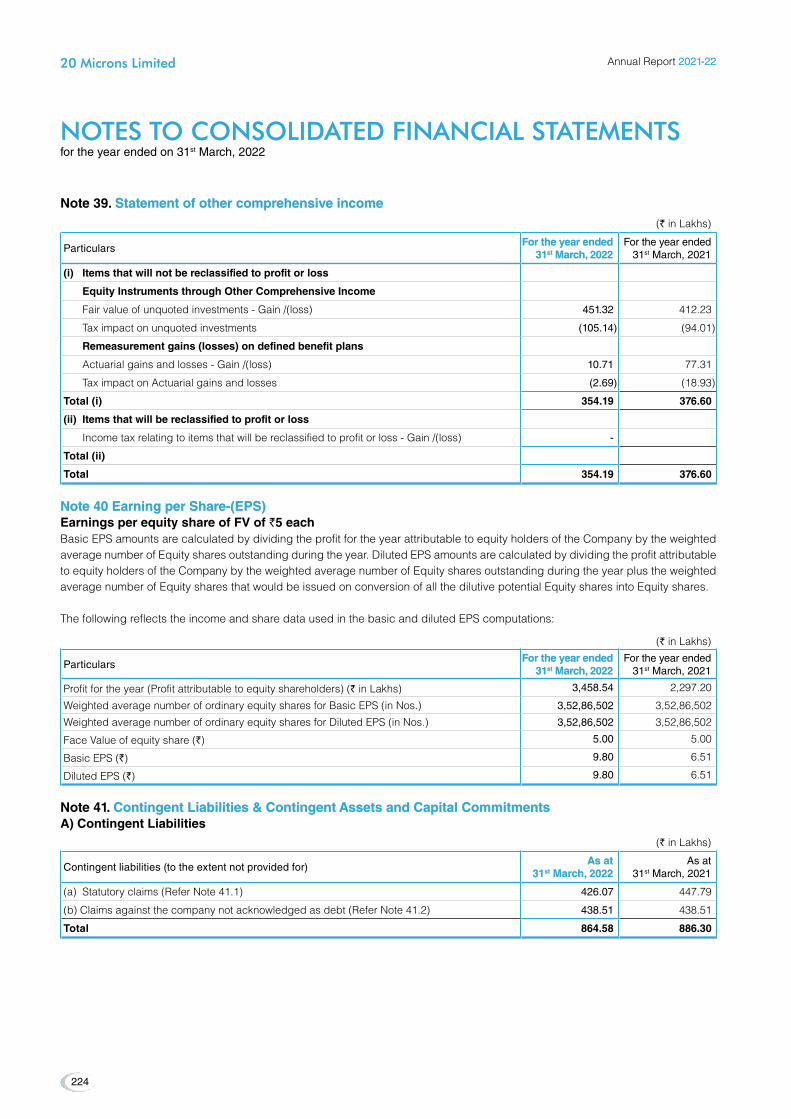
NOTES TO cONSOlIDATED FINANcIAl STATEMENTS NOTES TO cONSOlIDATED FINANcIAl STATEMENTS for the year ended on 31st March, 2022
Note 39. Statement of other comprehensive income Statement of other comprehensive income (` in Lakhs)
ParticularsFor the year endedFor the year ended
3131stst March, 2022 March, 2022For the year ended
31st March, 2021
(i) Items that will not be reclassified to profit or loss
equity Instruments through Other Comprehensive Income
Fair value of unquoted investments - Gain /(loss) 451.32 412.23
Tax impact on unquoted investments (105.14) (94.01)
Remeasurement gains (losses) on defined benefit plans
Actuarial gains and losses - Gain /(loss) 10.71 77.31
Tax impact on Actuarial gains and losses (2.69) (18.93)
Total (i) 354.19 376.60
(ii) Items that will be reclassified to profit or loss
Income tax relating to items that will be reclassified to profit or loss - Gain /(loss) -
Total (ii)
Total 354.19 376.60
Note 40 earning per Share-(ePS)Note 40 earning per Share-(ePS)earnings per equity share of FV of `5 eachBasic EPS amounts are calculated by dividing the profit for the year attributable to equity holders of the Company by the weighted averagenumberofEquitysharesoutstandingduringtheyear.DilutedEPSamountsarecalculatedbydividingtheprofitattributableto equity holders of the Company by the weighted average number of Equity shares outstanding during the year plus the weighted average number of Equity shares that would be issued on conversion of all the dilutive potential Equity shares into Equity shares.
The following reflects the income and share data used in the basic and diluted EPS computations:
(` in Lakhs)
ParticularsFor the year endedFor the year ended
3131stst March, 2022 March, 2022For the year ended
31st March, 2021
Profit for the year (Profit attributable to equity shareholders) (` in Lakhs) 3,458.54 2,297.20
Weighted average number of ordinary equity shares for Basic EPS (in Nos.) 3,52,86,502 3,52,86,502
WeightedaveragenumberofordinaryequitysharesforDilutedEPS(inNos.) 3,52,86,502 3,52,86,502
Face Value of equity share (`) 5.00 5.00
Basic EPS (`) 9.80 6.51
DilutedEPS(`) 9.80 6.51
Note 41. Contingent Liabilities & Contingent Assets and Capital Commitments Contingent Liabilities & Contingent Assets and Capital CommitmentsA) Contingent Liabilities
(` in Lakhs)
Contingent liabilities (to the extent not provided for)As at As at
3131stst March, 2022 March, 2022As at
31st March, 2021
(a) Statutory claims (Refer Note 41.1) 426.07 447.79
(b) Claims against the company not acknowledged as debt (Refer Note 41.2) 438.51 438.51
Total 864.58 886.30
Annual Report 2021-222021-22
224
20 Microns Limited20 Microns Limited

NOTES TO cONSOlIDATED FINANcIAl STATEMENTS NOTES TO cONSOlIDATED FINANcIAl STATEMENTS for the year ended on 31st March, 2022
Note 41.1Statutory claims
(` in Lakhs)
ParticularsAs at As at
3131stst March, 2022 March, 2022As at
31st March, 2021
DemandofSalesTax,ValueAddedTaxandCentralSalesTax[NetofAnamountof`4.50 lacs deposited under protest (P.Y. `4.5lacsdepositedunderprotest)]
37.22 37.22
DemandofIncomeTax(NetofRefundadjustedandpaidunderprotest) 10.60 32.32
Labour disputed cases 378.25 378.25
VAT and CST Assessment pending at various forums for various Assessment Years in Holding Company
Not ascertainable Not ascertainable
Total 426.07 447.79
Note 41.2 Claims against the company not acknowledged as debt
41.2.1 TheCompanyhadreceivedanOrderdated06thAugust,2016,fromGeologyandMiningDepartment,Bhuj,Kutchforexcavatingthe mine beyond the approved lease area, situated at Survey No. 483, Mamuara, Bhuj, Kutch whereby a penalty of `419.13 lakhs is leviedontheCompany.CompanyhadfiledanappealagainsttheorderoftheGeologyandMiningDepartmentwiththeappellateauthority as per the rules of Gujarat Mineral (Prevention of Illegal Mining, Transportation and Storage) Rules, 2005. The appellate authority(additionaldirector[Appealandflyingsquad],videitsorderdated17thJanuary,2020haspassedfinalorderandcontinuedorder dated 06th August, 2016 passed by the Geologist, Bhuj. The company Filed a REVISION application on dated 20/02/2020 to TheCommissionerShri(Geology&Mining,Gandhinagar)againsttheorderpassedbyAdditionalDirector(Appeal&FlyingSquad),Gandhinagar, dated 17/01/2020.The Commissioner shri has directed geology department to submit detailed report on the same.
41.2.2Vendors of the company have made claims against company amouting to ` 19.38 Lakh (P.Y - 19.38 Lakh)
A) CONTINGeNT ASSeTS The Group is having certain claims which are pursuing through legal processes. The Management believe that probable
outcome in all such claims are uncertain. Hence, the disclosure of such claims is not required in the financial statements.
B) CAPITAL COMMITMeNTS Estimated amount of contracts remaining to be executed on capital account, not provided for amounting to ̀ 322.20 Lakhs (Net
of Advance `1208.09 Lakhs) [31st March, 2021 `601.07 Lakhs (Net of Advance `363.06Lakhs)]
Note 42. Financial instruments – Fair values and risk management Financial instruments – Fair values and risk managementA. Accounting classification and fair values
(` in Lakhs)
31st March, 2022
Carrying amount Carrying amount Fair value Fair value
FVTPL FVTPL FVTOCI FVTOCI Amortised Amortised
Cost Cost Total Total
Level 1 Level 1 - Quoted - Quoted price in price in
active active markets markets
Level 2 - Level 2 - Significant Significant observable observable
inputs inputs
Level 3 - Level 3 - Significant Significant
unobservable unobservable inputs inputs
Total Total
Financial assets
Investments - 863.46 0.89 864.35 - 0.89 863.46 864.35
Financial assets measured at amortised cost
- -
Loans (Non-current) - - - - - - - -
Other financial assets (Non-Current)
- - 540.79 540.79 - 540.79 - 540.79
Loans (Current) - - 112.49 112.49 - - - -
225
Corporate Overview Notice Statutory Reports Financial StatementsFinancial Statements

(` in Lakhs)
31st March, 2022
Carrying amount Carrying amount Fair value Fair value
FVTPL FVTPL FVTOCI FVTOCI Amortised Amortised
Cost Cost Total Total
Level 1 Level 1 - Quoted - Quoted price in price in
active active markets markets
Level 2 - Level 2 - Significant Significant observable observable
inputs inputs
Level 3 - Level 3 - Significant Significant
unobservable unobservable inputs inputs
Total Total
Other financial assets (Current) - - 309.12 309.12 - - - -
Trade receivables - - 10,020.02 10,020.02 - - - -
Cash and cash equivalents - - 1,273.23 1,273.23 - - - -
Other bank balances - - 411.71 411.71 - - - -
- 863.46 12,668.24 13,531.71 - 541.68 863.46 1,405.14
Financial liabilities measured at amortised cost
Non current borrowings - - 2,848.74 2,848.74 - 2,848.74 - 2,848.74
Other Non Current financial liabilities
- - 25.92 25.92 - 25.92 - 25.92
Lease laibilities - Non-current - - 104.01 104.01 - 104.01 - 104.01
Trade payables (Non-current) - - 84.32 84.32 - 84.32 - 84.32
Lease laibilities - current - - 176.19 176.19 - - - -
Current borrowings - - 9,167.01 9,167.01 - - - -
Trade payables (Current) - - 9,870.89 9,870.89 - - - -
Other Current financial liabilities - - 831.03 831.03 - - - -
Total - - 23,108.10 23,108.10 - 3,062.99 - 3,062.99
(` in Lakhs)
31st March, 2021
Carrying amount Fair value
FVTPL FVTOCI Amortised
Cost Total
Level 1 - Quoted
price in active
markets
Level 2 - Significant observable
inputs
Level 3 - Significant
unobservable inputs
Total
Financial assets
Investments - 593.98 0.89 594.87 - 0.89 593.98 594.87
Financial assets measured at amortised cost
-
Loans (Non-current) - - - - - - - -
Other financial assets (Non-Current)
- - 315.93 315.93 - 315.93 - 315.93
Loans (Current) - - 148.87 148.87 - - - -
Other financial assets (Current) - - 218.22 218.22 - - - -
Trade receivables - - 9,012.13 9,012.13 - - - -
Cash and cash equivalents - - 406.21 406.21 - - - -
Other bank balances - - 588.09 588.09 - - - -
- 593.98 10,690.34 11,284.32 - 316.82 593.98 910.79
Financial liabilities measured at amortised cost
Non current borrowings - - 2,367.65 2,367.65 - 2,367.65 - 2,367.65
Other Non Current financial liabilities
- - 26.53 26.53 - 26.53 - 26.53
NOTES TO cONSOlIDATED FINANcIAl STATEMENTS NOTES TO cONSOlIDATED FINANcIAl STATEMENTS for the year ended on 31st March, 2022
Annual Report 2021-222021-22
226
20 Microns Limited20 Microns Limited
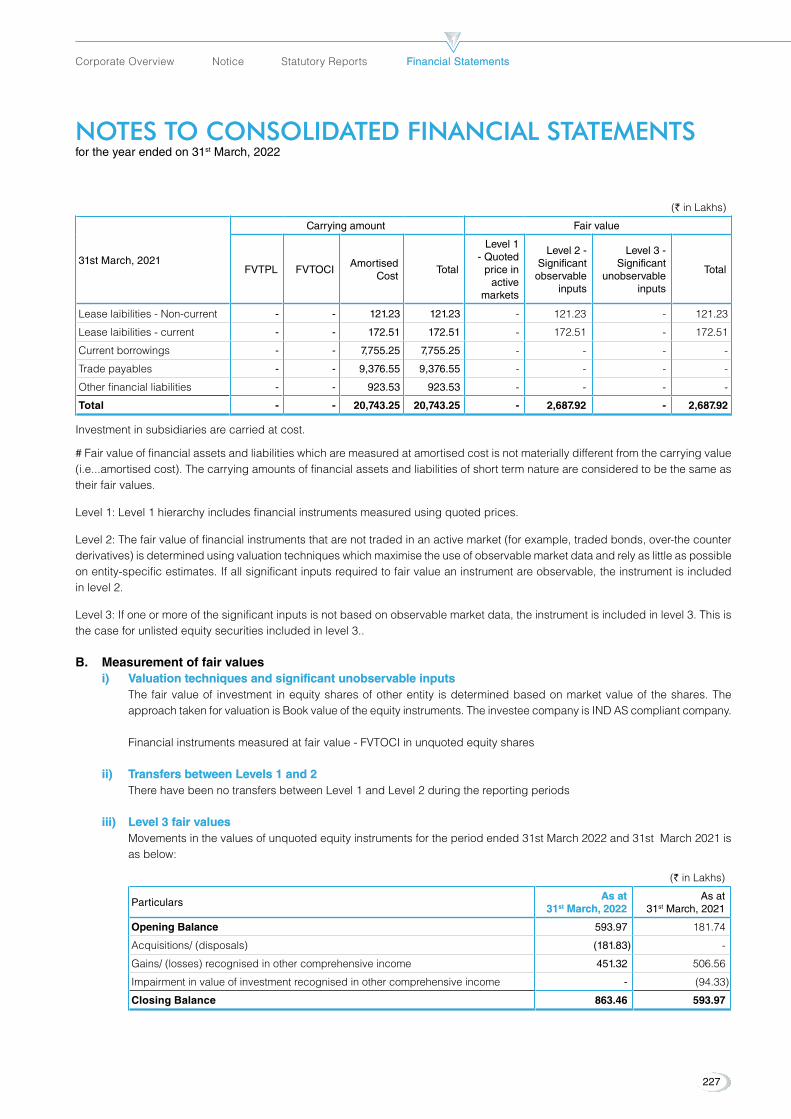
(` in Lakhs)
31st March, 2021
Carrying amount Fair value
FVTPL FVTOCI Amortised
Cost Total
Level 1 - Quoted
price in active
markets
Level 2 - Significant observable
inputs
Level 3 - Significant
unobservable inputs
Total
Lease laibilities - Non-current - - 121.23 121.23 - 121.23 - 121.23
Lease laibilities - current - - 172.51 172.51 - 172.51 - 172.51
Current borrowings - - 7,755.25 7,755.25 - - - -
Trade payables - - 9,376.55 9,376.55 - - - -
Other financial liabilities - - 923.53 923.53 - - - -
Total - - 20,743.25 20,743.25 - 2,687.92 - 2,687.92
Investment in subsidiaries are carried at cost.
# Fair value of financial assets and liabilities which are measured at amortised cost is not materially different from the carrying value (i.e...amortised cost). The carrying amounts of financial assets and liabilities of short term nature are considered to be the same as their fair values.
Level 1: Level 1 hierarchy includes financial instruments measured using quoted prices.
Level 2: The fair value of financial instruments that are not traded in an active market (for example, traded bonds, over-the counter derivatives) is determined using valuation techniques which maximise the use of observable market data and rely as little as possible on entity-specific estimates. If all significant inputs required to fair value an instrument are observable, the instrument is included in level 2.
Level 3: If one or more of the significant inputs is not based on observable market data, the instrument is included in level 3. This is the case for unlisted equity securities included in level 3..
B. Measurement of fair values i) Valuation techniques and significant unobservable inputs i) Valuation techniques and significant unobservable inputs The fair value of investment in equity shares of other entity is determined based on market value of the shares. The
approachtakenforvaluationisBookvalueoftheequityinstruments.TheinvesteecompanyisINDAScompliantcompany.
Financial instruments measured at fair value - FVTOCI in unquoted equity shares
ii) Transfers between Levels 1 and 2 ii) Transfers between Levels 1 and 2 There have been no transfers between Level 1 and Level 2 during the reporting periods
iii) Level 3 fair values iii) Level 3 fair values Movements in the values of unquoted equity instruments for the period ended 31st March 2022 and 31st March 2021 is
as below:
(` in Lakhs)
ParticularsAs at As at
3131stst March, 2022 March, 2022As at
31st March, 2021
Opening Balance 593.97 181.74
Acquisitions/ (disposals) (181.83) -
Gains/ (losses) recognised in other comprehensive income 451.32 506.56
Impairment in value of investment recognised in other comprehensive income - (94.33)
Closing Balance 863.46 593.97
NOTES TO cONSOlIDATED FINANcIAl STATEMENTS NOTES TO cONSOlIDATED FINANcIAl STATEMENTS for the year ended on 31st March, 2022
227
Corporate Overview Notice Statutory Reports Financial StatementsFinancial Statements

Transfer out of Level 3 There were no movement in level 3 in either directions during the year ended 31st March 2022 and the year ended
31st March 2021.
Ind AS 101 allows an entity to designate certain investments in equity instruments as fair valued through the OCI on the basis of the facts and circumstances at the transition date to Ind AS.
The Group has elected to apply this exemption for its investment in equity shares.
Sensitivity analysis The sensitivity analysis for investments as as 31st March 2020 is provided below.
(` in Lakhs)
Significant observable inputs
As at 31As at 31stst March 2022 March 2022 As at 31st March 2021
OCI OCI OCI
(Decrease)/Increase (Decrease)/Increase (Decrease)/Increase
Equity securities in unquoted investments measured through OCI)
If increase in market value of investments made by 5% 43.17 29.70
If decrease in market value of investments made by 5% (43.17) (29.70)
C. Financial risk management The Company has exposure to the following risks arising from financial instruments:
•• Credit risk;
•• Liquidity risk; and
•• Market risk
i. Risk management framework Board of directors has overall responsibility for the establishment and oversight of the Group’s risk management framework.
The Group has a well-define Risk Management framework for reviewing the major risks and taking care of all the financial risks. The risk management framework aims to :
a. create a stable business planning environment by reducing the impact of currency and interest rate fluctuation on company’s business plan.
b. achieve greater predictability to earnings by determining the financial value of the expected earning in advance.
Risk management policies and systems are reviewed regularly to reflect changes in market conditions and the Company’s activities. The Company, through its training and management standards and procedures, aims to maintain a disciplined and constructive control environment in which all employees understand their roles and obligations.
The audit committee oversees how management monitors compliance with the company’s risk management policies and procedures, and reviews the adequacy of the risk management framework in relation to the risks faced by the Company. The audit committee is assisted in its oversight role by internal audit. Internal audit undertakes both regular and ad hoc reviews of risk management controls and procedures, the results of which are reported to the audit committee. The Board ofDirectorsreviewsandagreespoliciesformanagingeachoftheserisks.
ii. Credit risk Credit risk is the risk of financial loss to the Group if a customer or counterparty to a financial instrument fails to meet
its contractual obligations, and arises principally from the Group’s receivables from customers and investments in debt securities and loans given.
NOTES TO cONSOlIDATED FINANcIAl STATEMENTS NOTES TO cONSOlIDATED FINANcIAl STATEMENTS for the year ended on 31st March, 2022
Annual Report 2021-222021-22
228
20 Microns Limited20 Microns Limited

The carrying amount of following financial assets represents the maximum credit exposure: (a) Cash and Cash equivalent and Other Bank Balances (a) Cash and Cash equivalent and Other Bank Balances The Group maintains its Cash and cash equivalents and Bank deposits with banks having good reputation, good
past track record and high quality credit rating and also reviews their credit-worthiness on an on-going basis.
(b) Trade and other receivables (b) Trade and other receivables The Group’s exposure to credit Risk is the exposure that Group has on account of goods sold or services rendered to a
contractual counterparty or counterparties, whether with collateral or otherwise for which the contracted consideration is yet to be received. The Group’s major customer base is paints, plastic, rubber and other misc. industries.
The Commercial and Marketing department has established a credit policy.
The Group raises the invoice based on the quantities sold. The Group provides for allowance for impairment that represents its estimate of expected losses in respect of trade and other receivables.
For trade receivables, as a practical expedient, the Group computes credit loss allowance based on a provision matrix. The provision matrix is prepared based on historically observed default rates over the expected life of trade receivables and is adjusted for forward-looking estimates.
Assets are written off when there are no reasonable expectation of recovery such as debtor declaring bankruptcy or failing to engage in a repayment plan with group. Where receivables have been written off the company continues to engage in enforcement activity to attempt to recover the receivables. where recoveries are made, these are recognised in profit and loss.
The maximum exposure to the credit risk at the reporting date from Trade Receivable is as amounts mentioned in Note No. 10.
Movement in Allowance for bad and doubtful Trade receivable
(` in Lakhs)
ParticularsAs at As at
3131stst March, 2022 March, 2022As at
31st March, 2021
Opening Allowance for bad and doubtful Trade receivable 204.67 210.93
Provision during the year 39.38 (45.86)
Recovery/Adjustment during the year
Write off during the year (58.50) 39.60
Closing Allowance for bad and doubtful Trade receivable 185.55 204.67
The impairment provisions above are based on management judgment / assumptions about risk of default and expected loss rates. The Group uses judgment in making these assumptions and selecting the inputs to the impairment calculation, based on the Group’s past history as well as forward looking estimates at the end of each reporting period.
(c) Loans and deposits (c) Loans and deposits Group has given inter corporate deposit, loan to employees and security deposits. The maximum exposure to the
credit risk at the reporting date from above amounts to `433.26 Lakhs on 31st March, 2022 and `461.01 Lakhs on 31st March, 2021.
iii. Liquidity risk Liquidity risk is the risk that the Group will encounter difficulty in meeting the obligations associated with its financial
liabilities that are settled by delivering cash or another financial asset. The Group’s approach to managing liquidity is to ensure, as far as possible, that it will have sufficient liquidity to meet its liabilities when they are due, under both normal and stressed conditions, without incurring unacceptable losses or risking damage to the Group’s reputation.
NOTES TO cONSOlIDATED FINANcIAl STATEMENTS NOTES TO cONSOlIDATED FINANcIAl STATEMENTS for the year ended on 31st March, 2022
229
Corporate Overview Notice Statutory Reports Financial StatementsFinancial Statements

The Group maintains the following lines of credit outstanding: (a) Term loans from banks and financial institution of `1624.18 Lakhs (at amortised cost) that is secured as mentioned
in Note 19. Interest would be payable at the rate of varying from 7.95% to 10.50%.
(b) The Group has also accepted deposit from share holders and directors amounting to `3957.26 Lakhs (at amortised cost) of unsecured nature. Interest would be payable at the rate of varying from 7.50% - 8.75%.
(c) For maintaining working capital liquidity Group avails cash credit limit from bank. The amount availed as at 31/03/2022 is `6424.61 Lakhs (at amortised cost). Effective Rate of Interest is 7.95% to 10.50%.
exposure to liquidity risk The following are the remaining contractual maturities of financial liabilities at the reporting date. The amounts are gross
and undiscounted, and exclude the impact of netting agreements.
(` in Lakhs)
March 31, 2022Contractual cash flowsContractual cash flows
Carrying Carrying amountamount
Less than Less than 12 months12 months
1-5 years1-5 yearsMore than More than
5 years5 yearsTotalTotal
Non-derivative financial liabilities
Non current borrowings 2,848.74 - 2,848.74 - 2,848.74
Non current financial liabilities 25.92 - 25.92 - 25.92
Lease laibilities - Noncurrent 104.01 - 104.01 - 104.01
Trade payables (Non-current) 84.32 - 84.32 - 84.32
Lease laibilities - current 176.19 176.19 - - 176.19
Current Borrowings 9,167.01 9,167.01 - - 9,167.01
Current Trade payables 9,870.89 9,870.89 - - 9,870.89
Current Other financial liabilities 831.03 831.03 - - 831.03
23,108.10 20,045.12 3,062.99 - 23,108.10
(` in Lakhs)
March 31, 2021Contractual cash flows
Carrying amount
Less than 12 months
1-5 years More than
5 years Total
Non-derivative financial liabilities
Non current borrowings 2,367.65 - 2,367.65 - 2,367.65
Non current financial liabilities 26.53 - 26.53 - 26.53
Lease laibilities - Noncurrent 121.23 - 121.23 - 121.23
Lease laibilities - current 172.51 - 172.51 - 172.51
Current Borrowings 7,755.25 7,755.25 - - 7,755.25
Current Trade payables 9,376.55 9,376.55 - - 9,376.55
Current Other financial liabilities 923.53 923.53 - - 923.53
20,743.25 18,055.34 2,687.92 - 20,743.25
The gross inflows/(outflows) disclosed in the above table represent the contractual undiscounted cash flows relating to non-derivative financial liabilities held for risk management purposes and which are not usually closed out before contractual maturity.
iv. Market risk Market risk is the risk that the fair value of future cash flows of a financial instrument will fluctuate because of changes in
market prices. Market risk comprises three types of risk: interest rate risk, currency risk and other price risk, such as equity price risk and commodity risk. Financial instruments affected by market risk include loans and borrowings, deposits and FVTOCI investments.
a) Currency risk a) Currency risk The functional currency of the Group is Indian Rupee. The Group have transaction of import of materials, other
foreign expenditures and export of goods. hence the Group is exposed to currency risk on account of payables and receivablesinforeigncurrency.GrouphaveoutstandingbalancesinEuro,USDandGBP.
NOTES TO cONSOlIDATED FINANcIAl STATEMENTS NOTES TO cONSOlIDATED FINANcIAl STATEMENTS for the year ended on 31st March, 2022
Annual Report 2021-222021-22
230
20 Microns Limited20 Microns Limited

(` in Lakhs)
ParticularsAs at As at
3131stst March, 2022 March, 2022As at
31st March, 2021Trade and Other PayablesEuro 12.54 18.56 USD 901.09 1,124.42 Trade Receivables and advancesEuro 54.04 45.63 USD 1,809.47 1,589.24 GBP 54.03 24.42
Sensitivity analysis Profit or loss is sensitive to higher/lower Exchange rate of currency. A possible 5% change in exchange rate would
affect profit/loss at the reporting date by amount shown below:
As at 31st March 2022(` in Lakhs)
Details of foreign currency balancesProfit or (Loss)Profit or (Loss) equity (net of tax)equity (net of tax)
5% increase5% increase 5 % Decrease5 % Decrease 5% increase5% increase 5 % Decrease5 % Decrease
Trade and Other Payables (45.05) 45.05 (45.05) 45.05 Trade Receivables and advances 95.88 (95.88) 95.88 (95.88)
As at 31st March 2021(` in Lakhs)
Details of foreign currency balancesProfit or (Loss) Equity (net of tax)
5% increase 5 % Decrease 5% increase 5 % Decrease
Trade and Other Payables (56.22) 56.22 (56.22) 56.22 Trade Receivables and advances 82.96 (82.96) 82.96 (82.96)
b) Derivative Instruments used for Hedging: b) Derivative Instruments used for Hedging: The company holds derivative financial instruments such as foreign exchange forward contracts to mitigate the risk
of changes in exchange rates on foreign currency exposures. The counter party of such contracts are generally a Bank.
The foreign exhange forward contracts mature within 12 months. The table below analyses the derivative financial instruments in to relevant maturity groupings based on the remaining period as at balance sheet date.
(` in Lakhs)
Nature of instrumentAmount in USD (lakhs) Amount in ` (lakhs)
As at As at 3131stst March 2022 March 2022
As at 31st March 2021
As at As at 3131stst March 2022 March 2022
As at 31st March 2021
Later than one month and not later than 3 months
- 32.40 - 2,381.66
Foreign currency forward contract are used for hedging Foregin currency short term borrowing and not for trading or speculative purpose
c) Interest rate risk c) Interest rate risk Interest rate risks is measured by using the cash flow sensitivity for changes in variable interest rates. Any movement
in the reference rates could have an impact on the Group’s cash flows as well as costs. The Group’s interest rate exposure is mainly related to debt obligation. On period under review the Group do not have any term loans at fixed rate and has not entered into interest rate swaps for its exposure to long term borrowings at floating rate. The Group have accepted deposits from share holders which are fixed rate instruments.
NOTES TO cONSOlIDATED FINANcIAl STATEMENTS NOTES TO cONSOlIDATED FINANcIAl STATEMENTS for the year ended on 31st March, 2022
231
Corporate Overview Notice Statutory Reports Financial StatementsFinancial Statements
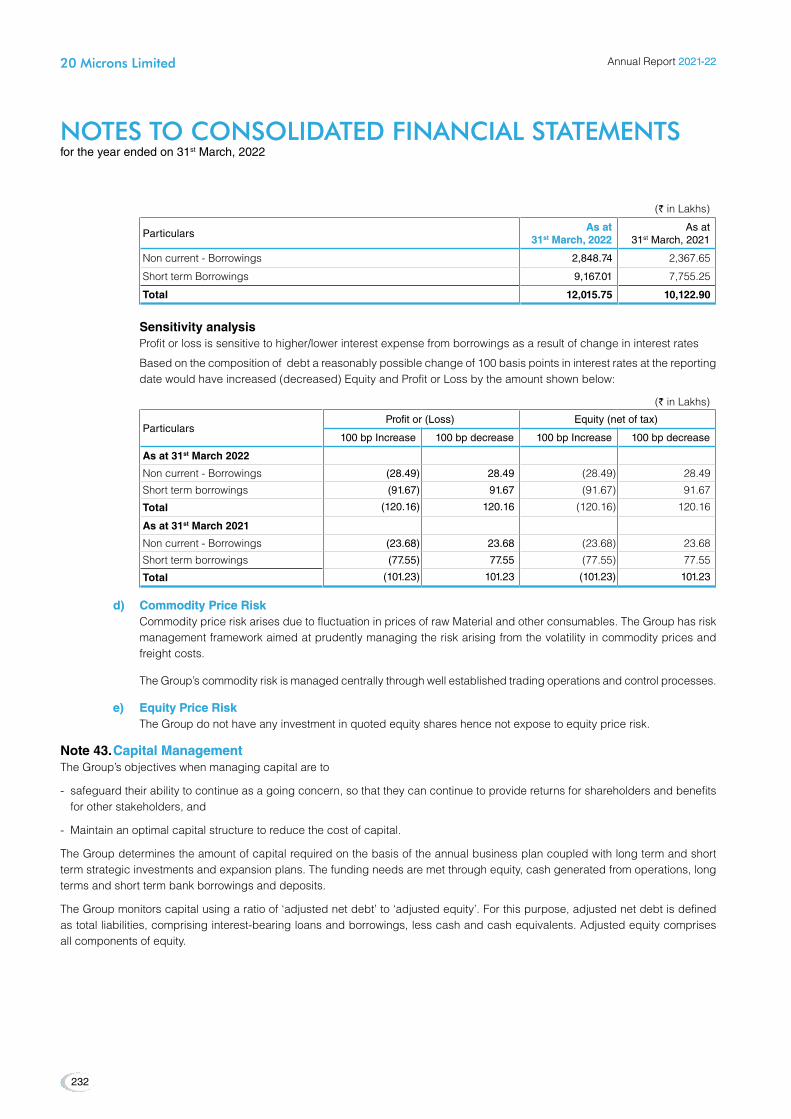
(` in Lakhs)
ParticularsAs at As at
3131stst March, 2022 March, 2022As at
31st March, 2021
Non current - Borrowings 2,848.74 2,367.65
Short term Borrowings 9,167.01 7,755.25
Total 12,015.75 10,122.90
Sensitivity analysis Profit or loss is sensitive to higher/lower interest expense from borrowings as a result of change in interest rates
Based on the composition of debt a reasonably possible change of 100 basis points in interest rates at the reporting date would have increased (decreased) Equity and Profit or Loss by the amount shown below:
(` in Lakhs)
ParticularsProfit or (Loss) Equity (net of tax)
100 bp Increase 100 bp decrease 100 bp Increase 100 bp decrease
As at 31st March 2022
Non current - Borrowings (28.49) 28.49 (28.49) 28.49
Short term borrowings (91.67) 91.67 (91.67) 91.67
Total (120.16) 120.16 (120.16) 120.16
As at 31st March 2021
Non current - Borrowings (23.68) 23.68 (23.68) 23.68
Short term borrowings (77.55) 77.55 (77.55) 77.55
Total (101.23) 101.23 (101.23) 101.23
d) Commodity Price Risk d) Commodity Price Risk Commodity price risk arises due to fluctuation in prices of raw Material and other consumables. The Group has risk
management framework aimed at prudently managing the risk arising from the volatility in commodity prices and freight costs.
The Group’s commodity risk is managed centrally through well established trading operations and control processes.
e) equity Price Risk e) equity Price Risk The Group do not have any investment in quoted equity shares hence not expose to equity price risk.
Note 43. Capital Management Capital ManagementThe Group’s objectives when managing capital are to
- safeguard their ability to continue as a going concern, so that they can continue to provide returns for shareholders and benefits for other stakeholders, and
- Maintain an optimal capital structure to reduce the cost of capital.
The Group determines the amount of capital required on the basis of the annual business plan coupled with long term and short term strategic investments and expansion plans. The funding needs are met through equity, cash generated from operations, long terms and short term bank borrowings and deposits.
The Group monitors capital using a ratio of ‘adjusted net debt’ to ‘adjusted equity’. For this purpose, adjusted net debt is defined as total liabilities, comprising interest-bearing loans and borrowings, less cash and cash equivalents. Adjusted equity comprises all components of equity.
NOTES TO cONSOlIDATED FINANcIAl STATEMENTS NOTES TO cONSOlIDATED FINANcIAl STATEMENTS for the year ended on 31st March, 2022
Annual Report 2021-222021-22
232
20 Microns Limited20 Microns Limited
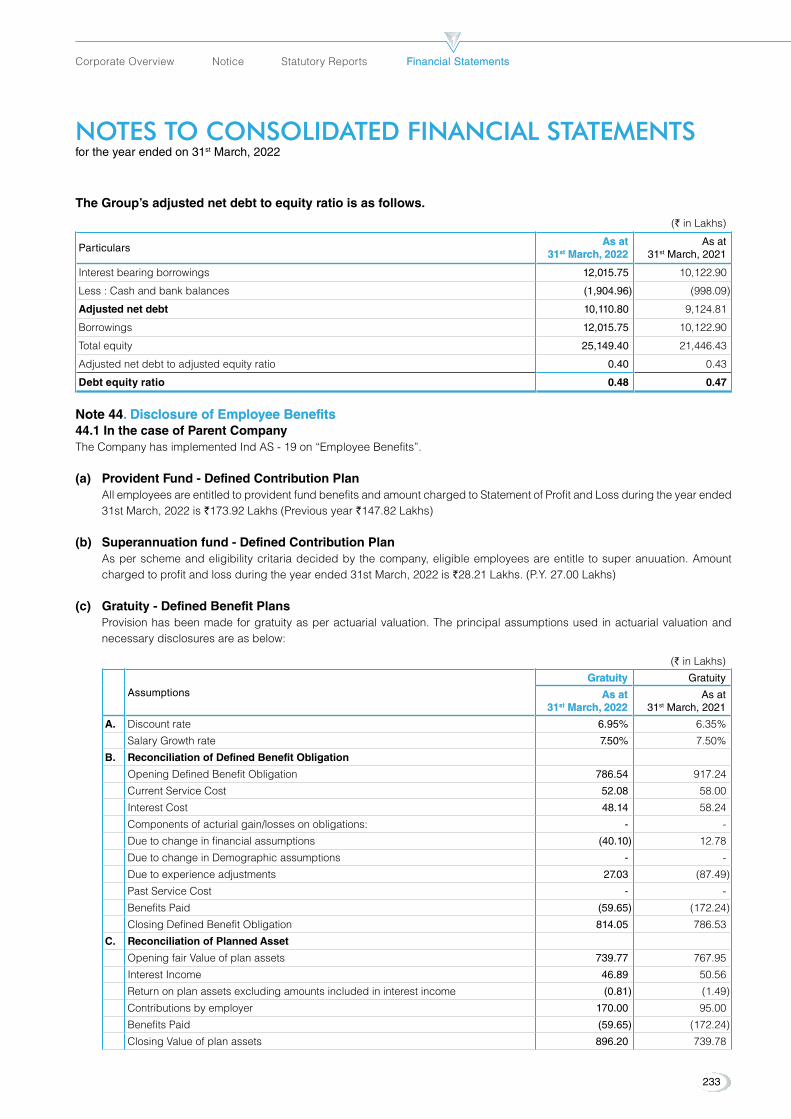
The Group’s adjusted net debt to equity ratio is as follows.
(` in Lakhs)
ParticularsAs at As at
3131stst March, 2022 March, 2022As at
31st March, 2021
Interest bearing borrowings 12,015.75 10,122.90
Less : Cash and bank balances (1,904.96) (998.09)
Adjusted net debt 10,110.80 9,124.81
Borrowings 12,015.75 10,122.90
Total equity 25,149.40 21,446.43
Adjusted net debt to adjusted equity ratio 0.40 0.43
Debt equity ratio 0.48 0.47
Note 44. Disclosure of employee Benefits. Disclosure of employee Benefits44.1 In the case of Parent Company The Company has implemented Ind AS - 19 on “Employee Benefits”.
(a) Provident Fund - Defined Contribution Plan All employees are entitled to provident fund benefits and amount charged to Statement of Profit and Loss during the year ended
31st March, 2022 is `173.92 Lakhs (Previous year `147.82 Lakhs)
(b) Superannuation fund - Defined Contribution Plan As per scheme and eligibility critaria decided by the company, eligible employees are entitle to super anuuation. Amount
charged to profit and loss during the year ended 31st March, 2022 is `28.21 Lakhs. (P.Y. 27.00 Lakhs)
(c) Gratuity - Defined Benefit Plans Provision has been made for gratuity as per actuarial valuation. The principal assumptions used in actuarial valuation and
necessary disclosures are as below:
(` in Lakhs)
AssumptionsGratuityGratuity Gratuity
As atAs at 3131stst March, 2022 March, 2022
As at 31st March, 2021
A. Discountrate 6.95% 6.35%
Salary Growth rate 7.50% 7.50%
B. Reconciliation of Defined Benefit Obligation
OpeningDefinedBenefitObligation 786.54 917.24
Current Service Cost 52.08 58.00
Interest Cost 48.14 58.24
Components of acturial gain/losses on obligations: - -
Duetochangeinfinancialassumptions (40.10) 12.78
DuetochangeinDemographicassumptions - -
Duetoexperienceadjustments 27.03 (87.49)
Past Service Cost - -
Benefits Paid (59.65) (172.24)
ClosingDefinedBenefitObligation 814.05 786.53
C. Reconciliation of Planned Asset
Opening fair Value of plan assets 739.77 767.95
Interest Income 46.89 50.56
Return on plan assets excluding amounts included in interest income (0.81) (1.49)
Contributions by employer 170.00 95.00
Benefits Paid (59.65) (172.24)
Closing Value of plan assets 896.20 739.78
NOTES TO cONSOlIDATED FINANcIAl STATEMENTS NOTES TO cONSOlIDATED FINANcIAl STATEMENTS for the year ended on 31st March, 2022
233
Corporate Overview Notice Statutory Reports Financial StatementsFinancial Statements
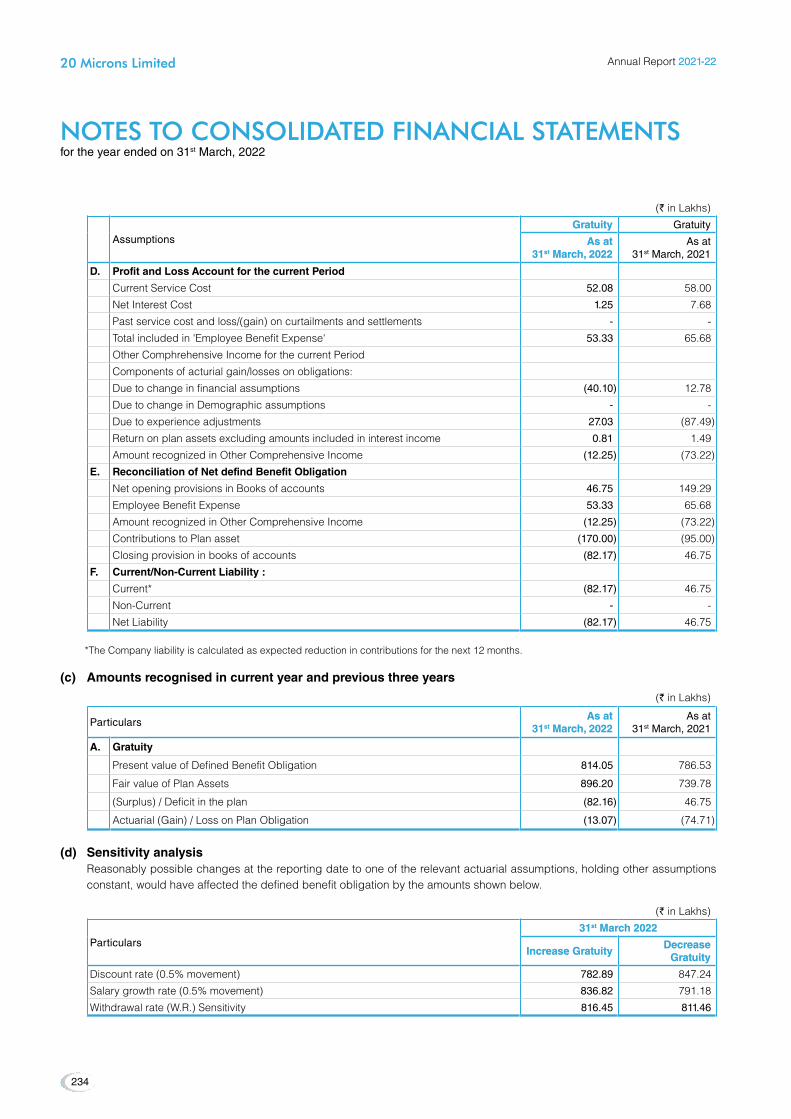
(` in Lakhs)
AssumptionsGratuityGratuity Gratuity
As atAs at 3131stst March, 2022 March, 2022
As at 31st March, 2021
D. Profit and Loss Account for the current Period
Current Service Cost 52.08 58.00
Net Interest Cost 1.25 7.68
Past service cost and loss/(gain) on curtailments and settlements - -
Total included in 'Employee Benefit Expense' 53.33 65.68
Other Comphrehensive Income for the current Period
Components of acturial gain/losses on obligations:
Duetochangeinfinancialassumptions (40.10) 12.78
DuetochangeinDemographicassumptions - -
Duetoexperienceadjustments 27.03 (87.49)
Return on plan assets excluding amounts included in interest income 0.81 1.49
Amount recognized in Other Comprehensive Income (12.25) (73.22)
e. Reconciliation of Net defind Benefit Obligation
Net opening provisions in Books of accounts 46.75 149.29
Employee Benefit Expense 53.33 65.68
Amount recognized in Other Comprehensive Income (12.25) (73.22)
Contributions to Plan asset (170.00) (95.00)
Closing provision in books of accounts (82.17) 46.75
F. Current/Non-Current Liability :
Current* (82.17) 46.75
Non-Current - -
Net Liability (82.17) 46.75
*The Company liability is calculated as expected reduction in contributions for the next 12 months.
(c) Amounts recognised in current year and previous three years
(` in Lakhs)
ParticularsAs at As at
3131stst March, 2022 March, 2022As at
31st March, 2021
A. Gratuity
PresentvalueofDefinedBenefitObligation 814.05 786.53
Fair value of Plan Assets 896.20 739.78
(Surplus)/Deficitintheplan (82.16) 46.75
Actuarial (Gain) / Loss on Plan Obligation (13.07) (74.71)
(d) Sensitivity analysis Reasonably possible changes at the reporting date to one of the relevant actuarial assumptions, holding other assumptions
constant, would have affected the defined benefit obligation by the amounts shown below.
(` in Lakhs)
Particulars 31 31stst March 2022 March 2022
Increase GratuityIncrease Gratuity Decrease Decrease
Gratuity Gratuity
Discountrate(0.5%movement) 782.89 847.24
Salary growth rate (0.5% movement) 836.82 791.18
Withdrawal rate (W.R.) Sensitivity 816.45 811.46
NOTES TO cONSOlIDATED FINANcIAl STATEMENTS NOTES TO cONSOlIDATED FINANcIAl STATEMENTS for the year ended on 31st March, 2022
Annual Report 2021-222021-22
234
20 Microns Limited20 Microns Limited

(` in Lakhs)
Particulars 31st March 2021
Increase Gratuity Decrease Gratuity
Discountrate(0.5%movement) 755.19 819.99
Salary growth rate (0.5% movement) 809.86 764.58
Withdrawal Rate 787.41 785.67
(e) Gratuity Benefits Plan: The benefit is governed by the Payment of Gratuity Act, 1972. The Key features are as under:
Features of the defined benefit plan Remarks
Benefit offered 15/26×Salary×DurationofService
Salary definition BasicSalaryincludingDearnessAllowance(ifany)
Benefit ceiling Benefit ceiling of `20,00,000 was applied.
Vesting conditions 5 years of continuous service (Not applicable in case of death / disability)
Benefit eligibility UponDeathorResignation/WithdrawalorRetirement
Retirement age 58,68 or 72 years
(i) entity responsibilities for the governance of the plan
Risk to the Plan Risk to the Plan
Following are the risk to which the plan exposes the entity
A Actuarial Risk: It is the risk that benefits will cost more than expected. This can arise due to one of the following reasons:
Adverse Salary Growth Experience: Salary hikes that are higher than the assumed salary escalation will result into an increase in Obligation at a rate that is higher than expected.
Variability in mortality rates: If actual mortality rates are higher than assumed mortality rate assumption than the Gratuity benefits will be paid earlier than expected. Since there is no condition of vesting on the death benefit, the acceleration of cash flow will lead to an actuarial loss or gain depending on the relative values of the assumed salary growth and discount rate.
Variability in withdrawal rates: If actual withdrawal rates are higher than assumed withdrawal rate assumption than the Gratuity benefits will be paid earlier than expected. The impact of this will depend on whether the benefits are vested as at the resignation date.
B Investment Risk: For funded plans that rely on insurers for managing the assets, the value of assets certified by the insurer may not be the
fair value of instruments backing the liability. In such cases, the present value of the assets is independent of the future discount rate. This can result in wide fluctuations in the net liability or the funded status if there are significant changes in the discount rate during the inter-valuation period.
C Liquidity Risk: Employees with high salaries and long durations or those higher in hierarchy, accumulate significant level of benefits. If
some of such employees resign / retire from the company there can be strain on the cash flows.
D Market Risk: Market risk is a collective term for risks that are related to the changes and fluctuations of the financial markets. One
actuarial assumption that has a material effect is the discount rate. The discount rate reflects the time value of money. An increaseindiscountrateleadstodecreaseinDefinedBenefitObligationoftheplanbenefits&viceversa.Thisassumption
NOTES TO cONSOlIDATED FINANcIAl STATEMENTS NOTES TO cONSOlIDATED FINANcIAl STATEMENTS for the year ended on 31st March, 2022
235
Corporate Overview Notice Statutory Reports Financial StatementsFinancial Statements

depends on the yields on the corporate / government bonds and hence the valuation of liability is exposed to fluctuations in the yields as at the valuation date.
e Legislative Risk: Legislative risk is the risk of increase in the plan liabilities or reduction in the plan assets due to change in the legislation /
regulation. The government may amend the Payment of Gratuity Act thus requiring the companies to pay higher benefits totheemployees.ThiswilldirectlyaffectthepresentvalueoftheDefinedBenefitObligationandthesamewillhavetoberecognized immediately in the year when any such amendment is effective.
(ii) The company has participated in Group Gratuity Scheme Plan with SBI Life insurance to meet its gratuity liability. The present value of the plan assets represents the balance available at the end of the year.
(a) Composition of the plan assets (a) Composition of the plan assets
(` in Lakhs)
ParticularsAs at As at
3131stst March, 2022 March, 2022As at
31st March, 2021
Bank balance 0.00% 0.00%
Policy of insurance 100.00% 100.00%
Others 0.00% 0.00%
(b) (b) The trustees of the plan have outsourced the investment management of the fund to an insurance company. The insurance company in turn manages these funds as per the mandate provided to them by the trustees and the asset allocation which iswithinthepermissiblelimitsprescribedintheinsuranceregulations.Duetotherestrictionsinthetypeofinvestmentsthat can be held by the fund, it may not be possible to explicitly follow an asset-liability matching strategy to manage risk actively in a conventional fund.
(c) expected benefit payments as on 31st March 2022 (c) expected benefit payments as on 31st March 2022
(` in Lakhs)
Particulars 1-5 years 6-10 years
Cash flow (`) 380.95 345.16
Distribution(in%) 24.70% 22.60%
(g) Other Notes: (i) The expected rate of return on Plan Assets is determined considering several applicable factors, mainly the composition of
Plan Assets held, assessed risks, historical results of return on Plan Assets and the Company’s policy for the Plan Assets management.
(ii) The actuarial valuation takes into account the estimates of future salary increases, inflation, seniority, promotion and other relevant factors such as supply and demand in the employment market. The management has relied on the overall actuarial valuation conducted by the actuary.
44.2 For 20 Micron Nano Minerals Limited The Group has implemented Ind AS - 19 on “Employee Benefits”.
NOTES TO cONSOlIDATED FINANcIAl STATEMENTS NOTES TO cONSOlIDATED FINANcIAl STATEMENTS for the year ended on 31st March, 2022
Annual Report 2021-222021-22
236
20 Microns Limited20 Microns Limited
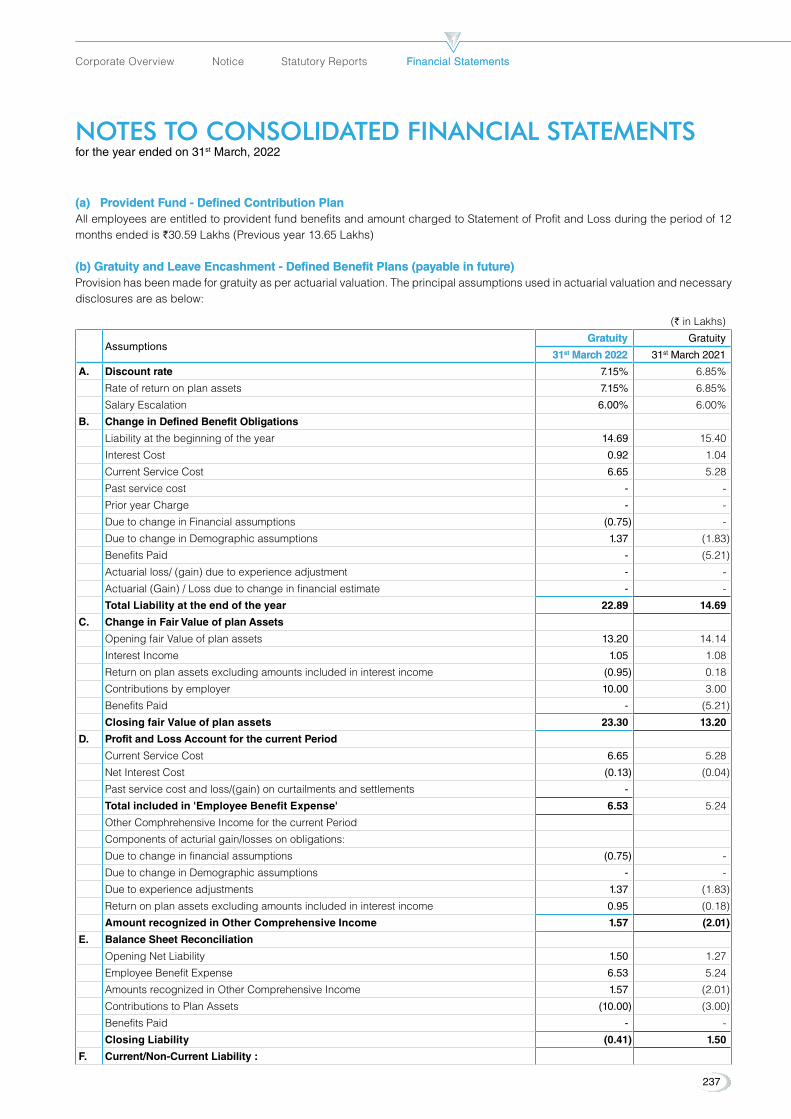
(a) Provident Fund - Defined Contribution Plan (a) Provident Fund - Defined Contribution Plan All employees are entitled to provident fund benefits and amount charged to Statement of Profit and Loss during the period of 12 months ended is `30.59 Lakhs (Previous year 13.65 Lakhs)
(b) Gratuity and Leave encashment - Defined Benefit Plans (payable in future)(b) Gratuity and Leave encashment - Defined Benefit Plans (payable in future)Provision has been made for gratuity as per actuarial valuation. The principal assumptions used in actuarial valuation and necessary disclosures are as below:
(` in Lakhs)
Assumptions Gratuity Gratuity Gratuity
31 31stst March 2022 March 2022 31st March 2021
A. Discount rate 7.15% 6.85%
Rate of return on plan assets 7.15% 6.85%
Salary Escalation 6.00% 6.00%
B. Change in Defined Benefit Obligations
Liability at the beginning of the year 14.69 15.40
Interest Cost 0.92 1.04
Current Service Cost 6.65 5.28
Past service cost - -
Prior year Charge - -
DuetochangeinFinancialassumptions (0.75) -
DuetochangeinDemographicassumptions 1.37 (1.83)
Benefits Paid - (5.21)
Actuarial loss/ (gain) due to experience adjustment - -
Actuarial (Gain) / Loss due to change in financial estimate - -
Total Liability at the end of the year 22.89 14.69
C. Change in Fair Value of plan Assets
Opening fair Value of plan assets 13.20 14.14
Interest Income 1.05 1.08
Return on plan assets excluding amounts included in interest income (0.95) 0.18
Contributions by employer 10.00 3.00
Benefits Paid - (5.21)
Closing fair Value of plan assets 23.30 13.20
D. Profit and Loss Account for the current Period
Current Service Cost 6.65 5.28
Net Interest Cost (0.13) (0.04)
Past service cost and loss/(gain) on curtailments and settlements -
Total included in 'employee Benefit expense' 6.53 5.24
Other Comphrehensive Income for the current Period
Components of acturial gain/losses on obligations:
Duetochangeinfinancialassumptions (0.75) -
DuetochangeinDemographicassumptions - -
Duetoexperienceadjustments 1.37 (1.83)
Return on plan assets excluding amounts included in interest income 0.95 (0.18)
Amount recognized in Other Comprehensive Income 1.57 (2.01)
e. Balance Sheet Reconciliation
Opening Net Liability 1.50 1.27
Employee Benefit Expense 6.53 5.24
Amounts recognized in Other Comprehensive Income 1.57 (2.01)
Contributions to Plan Assets (10.00) (3.00)
Benefits Paid - -
Closing Liability (0.41) 1.50
F. Current/Non-Current Liability :
NOTES TO cONSOlIDATED FINANcIAl STATEMENTS NOTES TO cONSOlIDATED FINANcIAl STATEMENTS for the year ended on 31st March, 2022
237
Corporate Overview Notice Statutory Reports Financial StatementsFinancial Statements

(` in Lakhs)
Assumptions Gratuity Gratuity Gratuity
31 31stst March 2022 March 2022 31st March 2021
Current* (0.41) 1.50
Non-Current - -
*The Group liability is calculated as expected reduction in contributions for the next 12 months.
(c) Amounts recognised in current year and previous three years (c) Amounts recognised in current year and previous three years
(` in Lakhs)
Particulars As at As at
3131stst March 2022 March 2022 As at
31st March 2021
A. Gratuity
PresentvalueofDefinedBenefitObligation 22.89 14.69
Fair value of Plan Assets 23.30 13.20
(Surplus)/Deficitintheplan (0.41) 1.50
Actuarial (Gain) / Loss on Plan Obligation 0.62 (1.83)
Actuarial Gain / (Loss) on Plan Assets 0.95 (0.18)
(d) Sensitivity analysis (d) Sensitivity analysis Reasonably possible changes at the reporting date to one of the relevant actuarial assumptions, holding other assumptions constant, would have affected the defined benefit obligation by the amounts shown below.
(` in Lakhs)
Particulars3131stst March 2022 March 2022
Increase Gratuity Increase Gratuity Decrease Gratuity Decrease Gratuity
Discountrate(0.5%movement) 21.72 24.16
Salary growth rate (0.5% movement) 24.06 21.79
Withdrawal rate (W.R.) Sensitivity 22.86 22.91
(` in Lakhs)
Particulars31st March 2021
Increase Gratuity Decrease Gratuity
Discountrate(0.5%movement) 14.03 15.41
Salary growth rate (0.5% movement) 15.37 14.04
Withdrawal rate (W.R.) Sensitivity 14.67 14.71
(e) Gratuity Benefits Plan: (e) Gratuity Benefits Plan: The benefit is governed by the Payment of Gratuity Act, 1972. The Key features are as under:
NOTES TO cONSOlIDATED FINANcIAl STATEMENTS NOTES TO cONSOlIDATED FINANcIAl STATEMENTS for the year ended on 31st March, 2022
Annual Report 2021-222021-22
238
20 Microns Limited20 Microns Limited
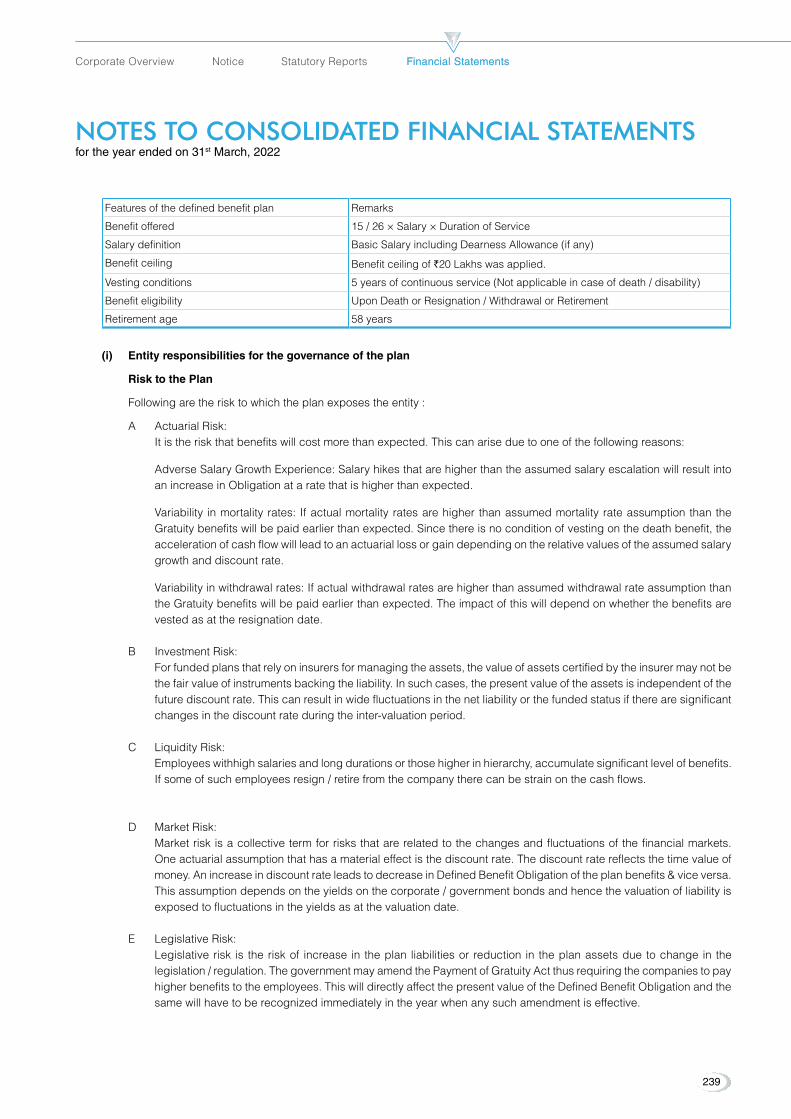
Features of the defined benefit plan Remarks
Benefit offered 15/26×Salary×DurationofService
Salary definition BasicSalaryincludingDearnessAllowance(ifany)
Benefit ceiling Benefit ceiling of `20 Lakhs was applied.
Vesting conditions 5 years of continuous service (Not applicable in case of death / disability)
Benefit eligibility UponDeathorResignation/WithdrawalorRetirement
Retirement age 58 years
(i) entity responsibilities for the governance of the plan
Risk to the Plan
Following are the risk to which the plan exposes the entity :
A Actuarial Risk: It is the risk that benefits will cost more than expected. This can arise due to one of the following reasons:
Adverse Salary Growth Experience: Salary hikes that are higher than the assumed salary escalation will result into an increase in Obligation at a rate that is higher than expected.
Variability in mortality rates: If actual mortality rates are higher than assumed mortality rate assumption than the Gratuity benefits will be paid earlier than expected. Since there is no condition of vesting on the death benefit, the acceleration of cash flow will lead to an actuarial loss or gain depending on the relative values of the assumed salary growth and discount rate.
Variability in withdrawal rates: If actual withdrawal rates are higher than assumed withdrawal rate assumption than the Gratuity benefits will be paid earlier than expected. The impact of this will depend on whether the benefits are vested as at the resignation date.
B Investment Risk: For funded plans that rely on insurers for managing the assets, the value of assets certified by the insurer may not be
the fair value of instruments backing the liability. In such cases, the present value of the assets is independent of the future discount rate. This can result in wide fluctuations in the net liability or the funded status if there are significant changes in the discount rate during the inter-valuation period.
C Liquidity Risk: Employees withhigh salaries and long durations or those higher in hierarchy, accumulate significant level of benefits.
If some of such employees resign / retire from the company there can be strain on the cash flows.
D MarketRisk: Market risk is a collective term for risks that are related to the changes and fluctuations of the financial markets.
One actuarial assumption that has a material effect is the discount rate. The discount rate reflects the time value of money.AnincreaseindiscountrateleadstodecreaseinDefinedBenefitObligationoftheplanbenefits&viceversa.This assumption depends on the yields on the corporate / government bonds and hence the valuation of liability is exposed to fluctuations in the yields as at the valuation date.
E Legislative Risk: Legislative risk is the risk of increase in the plan liabilities or reduction in the plan assets due to change in the
legislation / regulation. The government may amend the Payment of Gratuity Act thus requiring the companies to pay higherbenefitstotheemployees.ThiswilldirectlyaffectthepresentvalueoftheDefinedBenefitObligationandthesame will have to be recognized immediately in the year when any such amendment is effective.
NOTES TO cONSOlIDATED FINANcIAl STATEMENTS NOTES TO cONSOlIDATED FINANcIAl STATEMENTS for the year ended on 31st March, 2022
239
Corporate Overview Notice Statutory Reports Financial StatementsFinancial Statements

(ii) The Group has participated in Group Gratuity Scheme Plan with SBI Life insurance to meet its gratuity liability. The present value of the plan assets represents the balance available at the end of the year.
(a) Composition of the plan assets
(` in Lakhs)
Particulars As at As at
3131stst March 2022 March 2022 As at
31st March 2021
Bank balance 0.00% 0.00%
Policy of insurance 100.00% 100.00%
Others 0.00% 0.00%
(b) The trustees of the plan have outsourced the investment management of the fund to an insurance company. The insurance company in turn manages these funds as per the mandate provided to them by the trustees and the asset allocationwhichiswithinthepermissiblelimitsprescribedintheinsuranceregulations.Duetotherestrictionsinthetype of investments that can be held by the fund, it may not be possible to explicitly follow an asset-liability matching strategy to manage risk actively in a conventional fund.
(c) Expected benefit payments as on 31 March 2022.
Particulars 1-5 years 6-10 years
Cash flow (`) 17.55 5.58
Distribution(in%) 30.50% 17.10%
(g) Other Notes: (g) Other Notes: (i) The expected rate of return on Plan Assets is determined considering several applicable factors, mainly the composition
of Plan Assets held, assessed risks, historical results of return on Plan Assets and the group’s policy for the Plan Assets management.
(ii) The actuarial valuation takes into account the estimates of future salary increases, inflation, seniority, promotion and other relevant factors such as supply and demand in the employment market. The management has relied on the overall actuarial valuation conducted by the actuary.
44.3 For 20 MCC Private Limited (a) Provident Fund - Defined Contribution Plan (a) Provident Fund - Defined Contribution Plan Company has contributed ` 6.29 Lakh (P.Y. 9.37 Lakh) towards Provident Fund Contribution during the financial year
2021-22 for all eligible employees and the same has been charged to Statement Of Profit & Loss.
(b) Gratuity-DefinedBenefitPlans
Provision has been made for gratuity according to the actuarial valuation. Principal assumptions used in actuarial assumptions are disclosed below:
AssumptionsGratuity Gratuity Gratuity
31 31stst March 2022 March 2022 31st March 2021 A. Discount rate 6.90% 6.35%
Rate of return on plan assets N.A N.AWithdrawal Rates 30.00% p.a at younger ages reducing to
2.00% p.a% at older agesSalary Growth rate 7.50% 7.50%
B. Reconciliation of Defined Benefit ObligationOpeningDefinedBenefitObligation 4.09 2.91 Current Service Cost 2.58 3.07 Interest Cost 0.26 0.19 Components of acturial gain/losses on obligations:Duetochangeinfinancialassumptions (0.34) 0.17
NOTES TO cONSOlIDATED FINANcIAl STATEMENTS NOTES TO cONSOlIDATED FINANcIAl STATEMENTS for the year ended on 31st March, 2022
Annual Report 2021-222021-22
240
20 Microns Limited20 Microns Limited
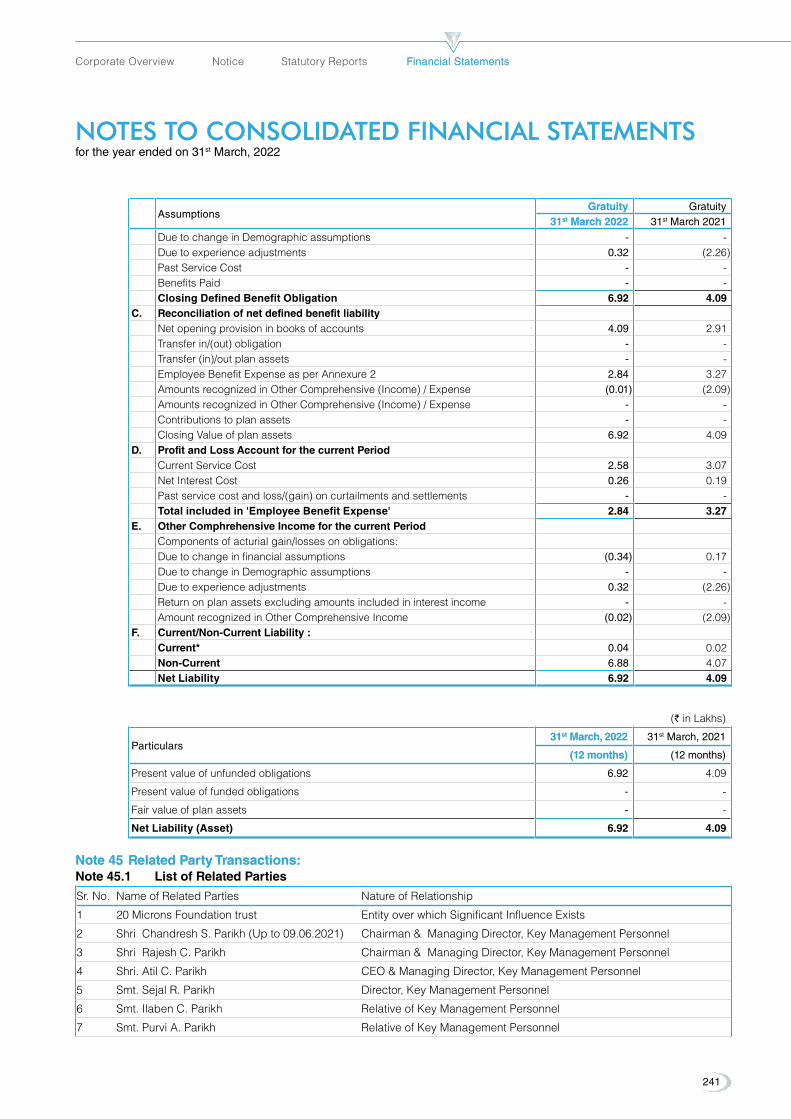
AssumptionsGratuity Gratuity Gratuity
31 31stst March 2022 March 2022 31st March 2021
DuetochangeinDemographicassumptions - - Duetoexperienceadjustments 0.32 (2.26)Past Service Cost - - Benefits Paid - - Closing Defined Benefit Obligation 6.92 4.09
C. Reconciliation of net defined benefit liabilityNet opening provision in books of accounts 4.09 2.91 Transfer in/(out) obligation - - Transfer (in)/out plan assets - - Employee Benefit Expense as per Annexure 2 2.84 3.27 Amounts recognized in Other Comprehensive (Income) / Expense (0.01) (2.09)Amounts recognized in Other Comprehensive (Income) / Expense - - Contributions to plan assets - - Closing Value of plan assets 6.92 4.09
D. Profit and Loss Account for the current PeriodCurrent Service Cost 2.58 3.07 Net Interest Cost 0.26 0.19 Past service cost and loss/(gain) on curtailments and settlements - - Total included in 'employee Benefit expense' 2.84 3.27
e. Other Comphrehensive Income for the current PeriodComponents of acturial gain/losses on obligations:Duetochangeinfinancialassumptions (0.34) 0.17 DuetochangeinDemographicassumptions - - Duetoexperienceadjustments 0.32 (2.26)Return on plan assets excluding amounts included in interest income - - Amount recognized in Other Comprehensive Income (0.02) (2.09)
F. Current/Non-Current Liability :Current* 0.04 0.02 Non-Current 6.88 4.07 Net Liability 6.92 4.09
(` in Lakhs)
Particulars3131stst March, 2022 March, 2022 31st March, 2021
(12 months)(12 months) (12 months)
Present value of unfunded obligations 6.92 4.09
Present value of funded obligations - -
Fair value of plan assets - -
Net Liability (Asset) 6.92 4.09
Note 45 Related Party Transactions:Note 45 Related Party Transactions:Note 45.1 List of Related Parties
Sr. No. Name of Related Parties Nature of Relationship
1 20 Microns Foundation trust Entity over which Significant Influence Exists
2 ShriChandreshS.Parikh(Upto09.06.2021) Chairman&ManagingDirector,KeyManagementPersonnel
3 Shri Rajesh C. Parikh Chairman&ManagingDirector,KeyManagementPersonnel
4 Shri. Atil C. Parikh CEO&ManagingDirector,KeyManagementPersonnel
5 Smt. Sejal R. Parikh Director,KeyManagementPersonnel
6 Smt. Ilaben C. Parikh Relative of Key Management Personnel
7 Smt. Purvi A. Parikh Relative of Key Management Personnel
NOTES TO cONSOlIDATED FINANcIAl STATEMENTS NOTES TO cONSOlIDATED FINANcIAl STATEMENTS for the year ended on 31st March, 2022
241
Corporate Overview Notice Statutory Reports Financial StatementsFinancial Statements

8 Smt. Vedika R. Parikh Relative of Key Management Personnel
9 Mr Narendra R Patel Chief Financial Officer, Key Management Personnel
10 Smt.AnujaK.Muley(Upto15.05.2021) Company Secretary, Key Management Personnel
11 Smt.Komal Pandy (from 19.07.2021) Company Secretary, Key Management Personnel
12 Shri.RamkisanA.Devidayal IndependentDirector
13 Shri. Atul H. Patel IndependentDirector
14 Dr.AjayI.Ranka IndependentDirector
15 Mr.Jaideep B. Verma IndependentDirector
Note 45.2 Transactions with Related Parties (HIn Lakhs)
Sr. No.
Name of Related Party and nature of transactions RelationshipFor the year ended For the year ended
3131stst March, 2022 March, 2022For the year ended
31st March, 2021
1 20 Microns Foundation trust Entity over which Significant Influence Exists
expenses :
Donationpaid 43.60 44.85
2 Shri Chandresh S. Parikh (Up to 09.06.2021)
Chairman & Managing Director,Key
Management Personnel
expenses :
Remuneration paid
short-term employee benefits 15.26 49.76
other long-term benefits 1.75 5.52
Other Benefit 108.74
InterestonDeposit 2.56 8.33
Others :
DepositReceived/Renewed - 70.00
DepositPaidDuringtheYear 80.00 50.00
DepositOutstanding - 80.00
3 Shri Rajesh C. Parikh
Chairman & Managing Director,Key
Management Personnel
Expenses :Remuneration paid
short-term employee benefits 100.00 59.80
other long-term benefits 8.69 4.22
4 Shri. Atil C. Parikh
CEO & Managing Director,Key
Management Personnel
expenses :
Remuneration paid
short-term employee benefits 90.00 51.86
other long-term benefits 7.85 3.45
InterestonDeposit 0.46 0.54
Others :
DepositReceived/Renewed - 5.00
DepositPaidDuringtheYear - 5.00
DepositOutstanding 5.00 5.00
NOTES TO cONSOlIDATED FINANcIAl STATEMENTS NOTES TO cONSOlIDATED FINANcIAl STATEMENTS for the year ended on 31st March, 2022
Annual Report 2021-222021-22
242
20 Microns Limited20 Microns Limited

(HIn Lakhs)
Sr. No.
Name of Related Party and nature of transactions RelationshipFor the year ended For the year ended
3131stst March, 2022 March, 2022For the year ended
31st March, 2021
5 Smt. Ilaben C. Parikh
Relative of Key Management Personnel
expenses :
Compansation paid 18.00 -
InterestonDeposit 8.70 1.89
Others :
DepositReceived/Renewed 95.50 -
DepositPaid 15.50 -
DepositOutstanding 95.50 15.50
6 Smt. Sejal R. Parikh
Director,KeyManagement Personnel
expenses :
InterestonDeposit 0.10 0.12
Rent 9.85 8.93
Other Benefit 1.75 -
DirectorSittingfees 1.35 1.15
Others :
DepositReceived/Renewed - -
DepositOutstanding 1.00 1.00
7 Smt. Purvi A. Parikh
Relative of Key Management Personnel
expenses :
InterestonDeposit 0.52 0.60
Others :
DepositReceived/Renewed 5.00 -
DepositPaid 5.00 -
DepositOutstanding 5.00 5.00
8 Mr Narendra R Patel
Chief Financial Officer, Key
Management Personnel
expense
Remuneration paid
short-term employee benefits 35.46 27.05
other long-term benefits 2.39 1.68
other benefits 5.56 -
9 Smt.Anuja K. Muley (Up to 15.05.2021)
Company Secretary, Key Management Personnel
expenses :
Remuneration paid
short-term employee benefits 2.75 13.52
other long-term benefits 0.16 0.74
other benefits 2.76 -
InterestonDeposit 0.03 0.14
b) Others :
DepositPaid 1.00 -
DepositOutstanding - 1.00
10 Smt.Komal Pandy
Company Secretary, Key Management Personnel
expenses :
Remuneration paid
short-term employee benefits 4.56 -
other long-term benefits 0.35 -
NOTES TO cONSOlIDATED FINANcIAl STATEMENTS NOTES TO cONSOlIDATED FINANcIAl STATEMENTS for the year ended on 31st March, 2022
243
Corporate Overview Notice Statutory Reports Financial StatementsFinancial Statements
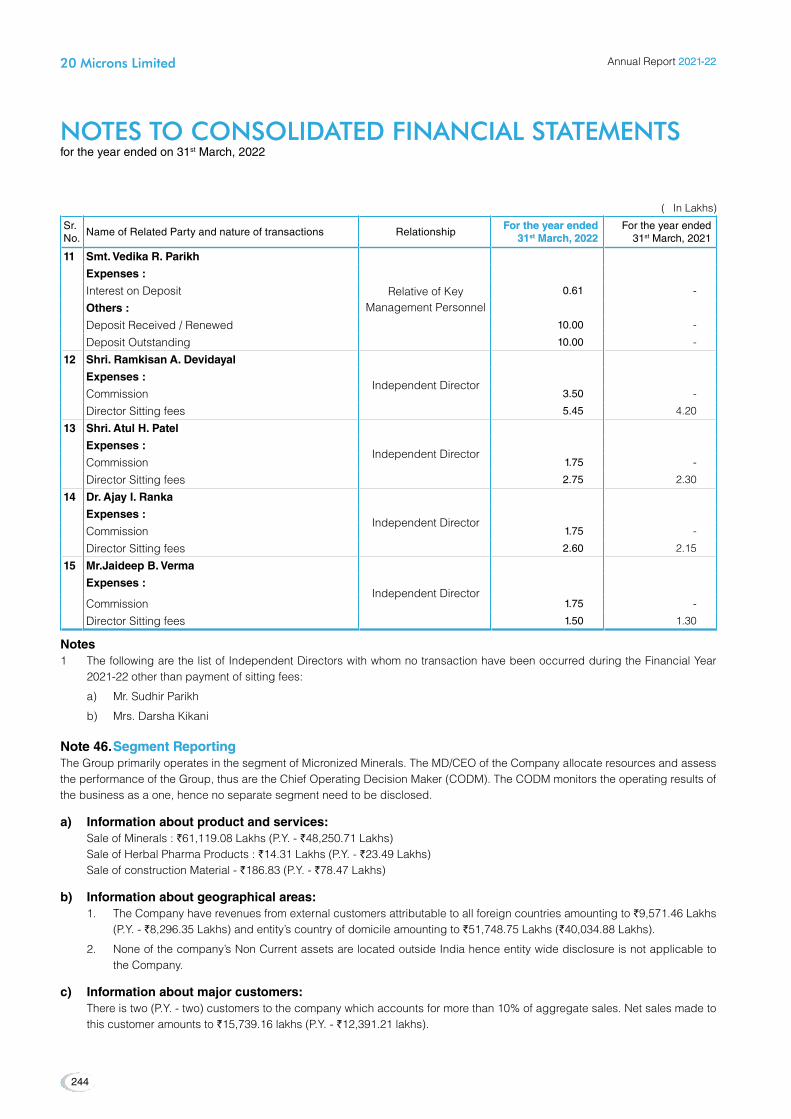
(HIn Lakhs)
Sr. No.
Name of Related Party and nature of transactions RelationshipFor the year ended For the year ended
3131stst March, 2022 March, 2022For the year ended
31st March, 2021
11 Smt. Vedika R. Parikh
Relative of Key Management Personnel
expenses :
InterestonDeposit 0.61 -
Others :
DepositReceived/Renewed 10.00 -
DepositOutstanding 10.00 -
12 Shri. Ramkisan A. Devidayal
IndependentDirectorexpenses :
Commission 3.50 -
DirectorSittingfees 5.45 4.20
13 Shri. Atul H. Patel
IndependentDirectorexpenses :
Commission 1.75 -
DirectorSittingfees 2.75 2.30
14 Dr. Ajay I. Ranka
IndependentDirectorexpenses :
Commission 1.75 -
DirectorSittingfees 2.60 2.15
15 Mr.Jaideep B. Verma
IndependentDirectorexpenses :
Commission 1.75 -
DirectorSittingfees 1.50 1.30
Notes1 ThefollowingarethelistofIndependentDirectorswithwhomnotransactionhavebeenoccurredduringtheFinancialYear
2021-22 other than payment of sitting fees:
a) Mr. Sudhir Parikh
b) Mrs.DarshaKikani
Note 46. Segment Reporting Segment ReportingTheGroupprimarilyoperatesinthesegmentofMicronizedMinerals.TheMD/CEOoftheCompanyallocateresourcesandassesstheperformanceoftheGroup,thusaretheChiefOperatingDecisionMaker(CODM).TheCODMmonitorstheoperatingresultsofthe business as a one, hence no separate segment need to be disclosed.
a) Information about product and services: Sale of Minerals : `61,119.08 Lakhs (P.Y. - `48,250.71 Lakhs) Sale of Herbal Pharma Products : `14.31 Lakhs (P.Y. - `23.49 Lakhs) Sale of construction Material - `186.83 (P.Y. - `78.47 Lakhs)
b) Information about geographical areas: 1. The Company have revenues from external customers attributable to all foreign countries amounting to `9,571.46 Lakhs
(P.Y. - `8,296.35 Lakhs) and entity’s country of domicile amounting to `51,748.75 Lakhs (`40,034.88 Lakhs).
2. None of the company’s Non Current assets are located outside India hence entity wide disclosure is not applicable to the Company.
c) Information about major customers: There is two (P.Y. - two) customers to the company which accounts for more than 10% of aggregate sales. Net sales made to
this customer amounts to `15,739.16 lakhs (P.Y. - `12,391.21 lakhs).
NOTES TO cONSOlIDATED FINANcIAl STATEMENTS NOTES TO cONSOlIDATED FINANcIAl STATEMENTS for the year ended on 31st March, 2022
Annual Report 2021-222021-22
244
20 Microns Limited20 Microns Limited
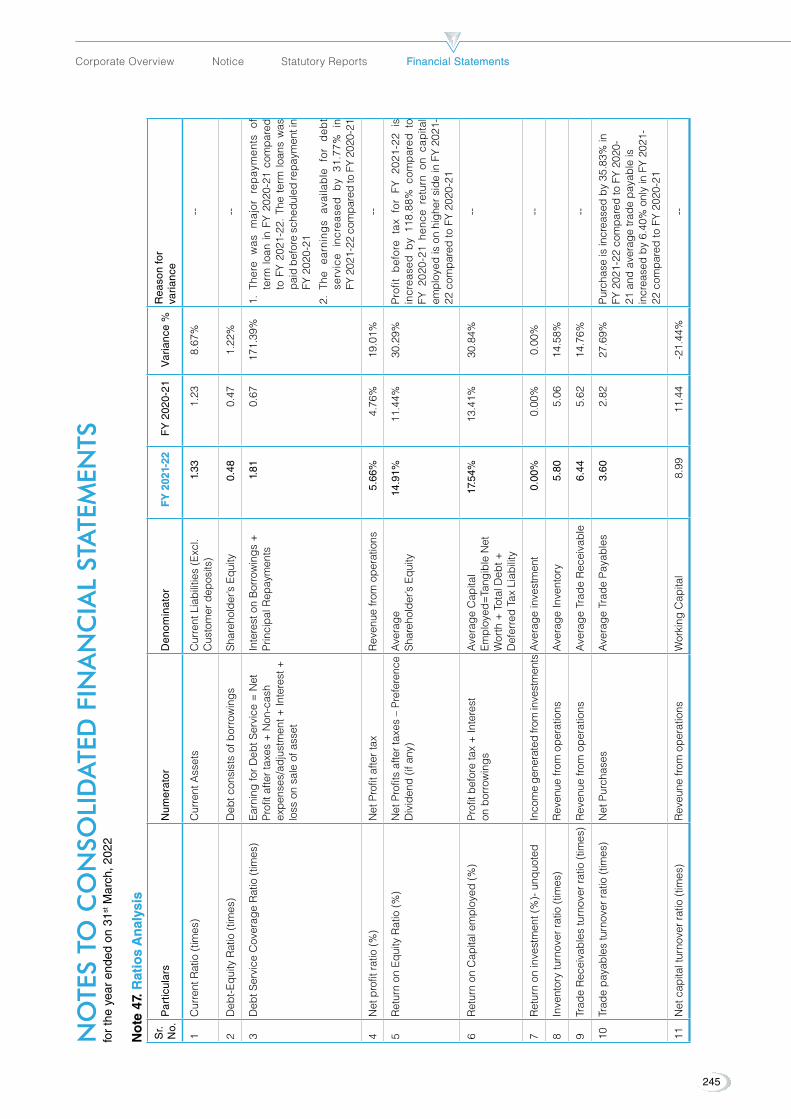
NO
TES
TO c
ON
SOlI
DA
TED
FIN
AN
cIA
l ST
ATE
MEN
TS
NO
TES
TO c
ON
SOlI
DA
TED
FIN
AN
cIA
l ST
ATE
MEN
TS
for
the
year
end
ed o
n 31
st M
arch
, 202
2
No
te 4
7. R
atio
s A
nal
ysis
Rat
ios
An
alys
is
Sr.
No.
Par
ticul
ars
Num
erat
orD
enom
inat
orF
Y 2
021-
22F
Y 2
021-
22F
Y 2
020-
21V
aria
nce
%R
easo
n fo
r
vari
ance
1C
urre
nt R
atio
(tim
es)
Cur
rent
Ass
ets
Cur
rent
Lia
bilit
ies
(Exc
l. C
usto
mer
dep
osits
) 1
.33
1.2
3 8.
67%
--
2Deb
t-Equ
ityRatio(tim
es)
Deb
tcon
sistsofborrowings
Shar
ehol
der’s
Equ
ity 0
.48
0.4
7 1.
22%
--
3Deb
tService
Cov
erag
eRatio(tim
es)
EarningforD
ebtS
ervice
=Net
Prof
it af
ter t
axes
+ N
on-c
ash
expe
nses
/adj
ustm
ent +
Inte
rest
+
loss
on
sale
of a
sset
Inte
rest
on
Bor
row
ings
+
Prin
cipa
l Rep
aym
ents
1.8
1 0
.67
171.
39%
1. T
here
w
as
maj
or
rep
aym
ents
of
te
rm lo
an in
FY
2020
-21
com
pare
d to
FY
2021
-22.
The
ter
m lo
ans
was
pa
id b
efor
e sc
hedu
led
repa
ymen
t in
FY 2
020-
21
2. T
he
earn
ing
s av
aila
ble
fo
r d
ebt
serv
ice
incr
ease
d b
y 31
.77%
in
FY 2
021-
22 c
ompa
red
to F
Y 20
20-2
1
4N
et p
rofit
ratio
(%)
Net
Pro
fit a
fter t
axR
even
ue fr
om o
pera
tions
5.66
%4.
76%
19.0
1%--
5R
etur
n on
Equ
ity R
atio
(%)
Net
Pro
fits
afte
r tax
es –
Pre
fere
nce
Dividen
d(ifany
)A
vera
ge
Shar
ehol
der’s
Equ
ity14
.91%
11.4
4%30
.29%
Pro
fit b
efor
e ta
x fo
r FY
202
1-22
is
incr
ease
d b
y 11
8.88
% c
omp
ared
to
FY 2
020-
21 h
ence
ret
urn
on c
apita
l em
ploy
ed is
on
high
er s
ide
in F
Y 20
21-
22 c
ompa
red
to F
Y 20
20-2
1
6R
etur
n on
Cap
ital e
mpl
oyed
(%)
Prof
it be
fore
tax
+ In
tere
st
on b
orro
win
gsA
vera
ge C
apita
l Em
ploy
ed=Ta
ngibleNet
Worth+TotalDeb
t+
DeferredTa
xLiab
ility
17.5
4%13
.41%
30.8
4%--
7R
etur
n on
inve
stm
ent (
%)-
unq
uote
dIn
com
e ge
nera
ted
from
inve
stm
ents
Ave
rage
inve
stm
ent
0.00
%0.
00%
0.00
%--
8In
vent
ory
turn
over
ratio
(tim
es)
Rev
enue
from
ope
ratio
nsA
vera
ge In
vent
ory
5.8
0 5
.06
14.5
8%
9Tr
ade
Rec
eiva
bles
turn
over
ratio
(tim
es)
Rev
enue
from
ope
ratio
nsA
vera
ge T
rade
Rec
eiva
ble
6.4
4 5
.62
14.7
6%--
10Tr
ade
paya
bles
turn
over
ratio
(tim
es)
Net
Pur
chas
esA
vera
ge T
rade
Pay
able
s 3
.60
2.8
2 27
.69%
Purc
hase
is in
crea
sed
by 3
5.83
% in
FY
202
1-22
com
pare
d to
FY
2020
-21
and
ave
rage
trad
e pa
yabl
e is
in
crea
sed
by 6
.40%
onl
y in
FY
2021
-22
com
pare
d to
FY
2020
-21
11N
et c
apita
l tur
nove
r rat
io (t
imes
)R
eveu
ne fr
om o
pera
tions
Wor
king
Cap
ital
8.9
9 1
1.44
-2
1.44
%--
245
Corporate Overview Notice Statutory Reports Financial StatementsFinancial Statements
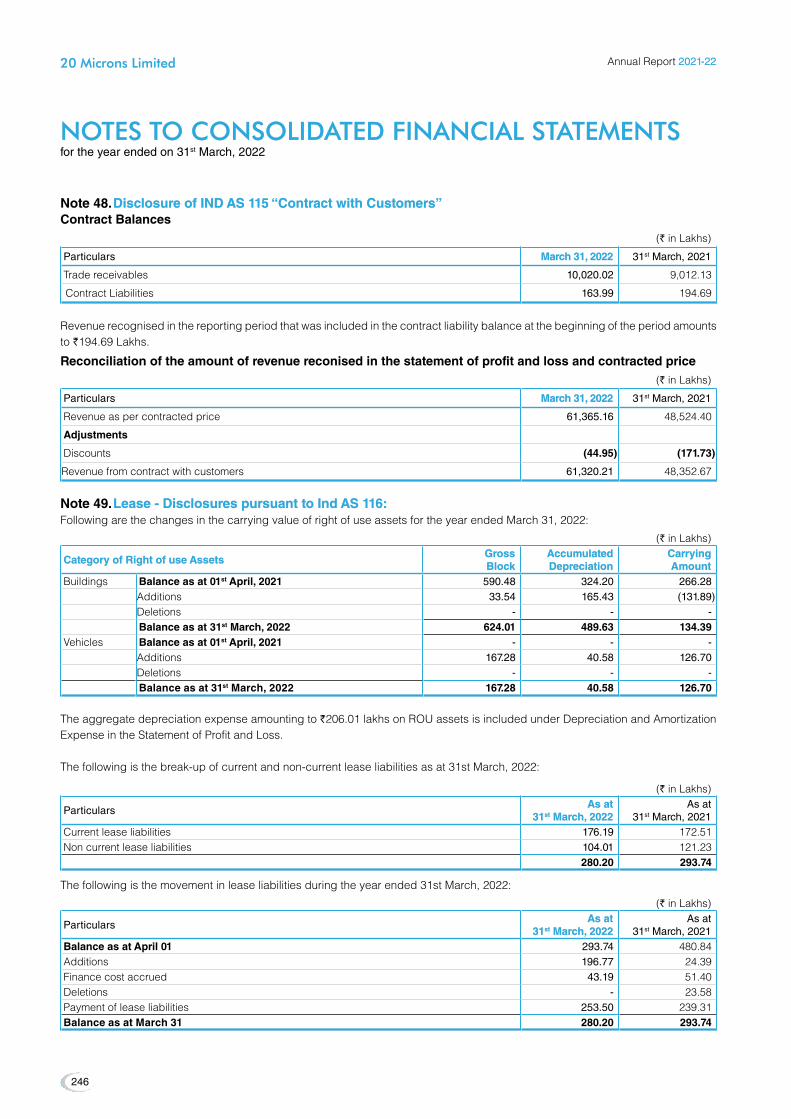
NOTES TO cONSOlIDATED FINANcIAl STATEMENTS NOTES TO cONSOlIDATED FINANcIAl STATEMENTS for the year ended on 31st March, 2022
Note 48. Disclosure of IND AS 115 “Contract with Customers” Disclosure of IND AS 115 “Contract with Customers”Contract Balances
(` in Lakhs)
Particulars March 31, 2022March 31, 2022 31st March, 2021
Trade receivables 10,020.02 9,012.13
Contract Liabilities 163.99 194.69
Revenue recognised in the reporting period that was included in the contract liability balance at the beginning of the period amounts to `194.69 Lakhs.
Reconciliation of the amount of revenue reconised in the statement of profit and loss and contracted price(` in Lakhs)
Particulars March 31, 2022March 31, 2022 31st March, 2021
Revenue as per contracted price 61,365.16 48,524.40
Adjustments
Discounts (44.95) (171.73)
Revenue from contract with customers 61,320.21 48,352.67
Note 49. Lease - Disclosures pursuant to Ind AS 116: Lease - Disclosures pursuant to Ind AS 116:Following are the changes in the carrying value of right of use assets for the year ended March 31, 2022:
(` in Lakhs)
Category of Right of use AssetsCategory of Right of use Assets Gross Gross Block Block
Accumulated Accumulated Depreciation Depreciation
Carrying Carrying Amount Amount
Buildings Balance as at 01st April, 2021 590.48 324.20 266.28 Additions 33.54 165.43 (131.89)Deletions - - - Balance as at 31st March, 2022 624.01 489.63 134.39
Vehicles Balance as at 01st April, 2021 - - - Additions 167.28 40.58 126.70 Deletions - - - Balance as at 31st March, 2022 167.28 40.58 126.70
The aggregate depreciation expense amounting to `206.01lakhsonROUassetsisincludedunderDepreciationandAmortizationExpense in the Statement of Profit and Loss.
The following is the break-up of current and non-current lease liabilities as at 31st March, 2022:
(` in Lakhs)
ParticularsAs at As at
3131stst March, 2022 March, 2022As at
31st March, 2021Current lease liabilities 176.19 172.51 Non current lease liabilities 104.01 121.23
280.20 293.74
The following is the movement in lease liabilities during the year ended 31st March, 2022:
(` in Lakhs)
ParticularsAs atAs at
3131stst March, 2022 March, 2022As at
31st March, 2021Balance as at April 01 293.74 480.84Additions 196.77 24.39Finance cost accrued 43.19 51.40Deletions - 23.58Payment of lease liabilities 253.50 239.31Balance as at March 31 280.20 293.74
Annual Report 2021-222021-22
246
20 Microns Limited20 Microns Limited

NOTES TO cONSOlIDATED FINANcIAl STATEMENTS NOTES TO cONSOlIDATED FINANcIAl STATEMENTS for the year ended on 31st March, 2022
The table below provides details regarding the contractual maturities of lease liabilities as at 31st March, 2022 on an undiscounted basis:
(` in Lakhs)
ParticularsAs at As at
3131stst March, 2022 March, 2022As at
31st March, 2021Less than one year 152.98 189.06 One to five years 171.72 131.97 More than five years - -
324.70 321.03
Rental expense for short-term leases recognised in the Statement of Profit and Loss was ₹ 282.74 Lakhs (P.Y. - 161.94 lakhs) for the year ended March 31, 2022.
Note 50 ADDITIONAL ReGULATORY INFORMATION DISCLOSUReSNote 50 ADDITIONAL ReGULATORY INFORMATION DISCLOSUReSNote 50.1 Registration of charges or satisfaction with Registrar of Companies (ROC)The group has registered charge and satisfaction with ROC within statutory time period.
Note 50.2 Details of Benami Property heldThe group does not hold any benami property under the Benami Transactions (Prohibition) Act, 1988 (45 of 1988) and rules made thereunder, hence no proceedings initiated or pending against the group under the said Act and Rules.
Note 50.3 Loans and advances granted to specified personThere are no loans or advances granted to specified persons namely promoters, directors, KMPs and related parties.
Note 50.4 Utilisation of borrowed funds, share premium and other fundsThe group has not given any advance or loan or invested funds from borrowed funds or share premium or any other sources with the understanding that intermediary would directly or indirectly lend or invest in other person or equity identified in any manner whatsoever by or on behalf of the group as ultimate beneficiaries or provide any guarantee or security or the like to on behalf of ultimate beneficiaries. The group has not received any fund from any person or entity with the understanding that the group would directly or indirectly lend or invest in other person or entity identified in any manner whatsoever by or on behalf of the funding party (ultimate beneficiary) or provided any guarantee or security or the like on behalf of the ultimate beneficiary.
Note 50.5 Compliance with number of layers of companiesThe group has complied with the number of layers prescribed under clause (87) of section 2 of the Act read with Companies (Restriction on number of Layers) Rules, 2017
Note 50.6 Details of Crypto Currency or Virtual CurrencyThe group has not traded or invested in Crypto currency or Virtual Currency during the financial year.
Note 50.7 Undisclosed IncomeThere is no transaction, which has not been recorded in books of accounts, that has been surrendered or disclosed as income during the year in tax assessments under the Income Tax Act, 1961.
Note 50.8 Relationship with struck off companiesThe group do not have any transactions with companies struck off under section 248 of the Companies Act, 2013 or section 560 of Companies Act, 1956
247
Corporate Overview Notice Statutory Reports Financial StatementsFinancial Statements
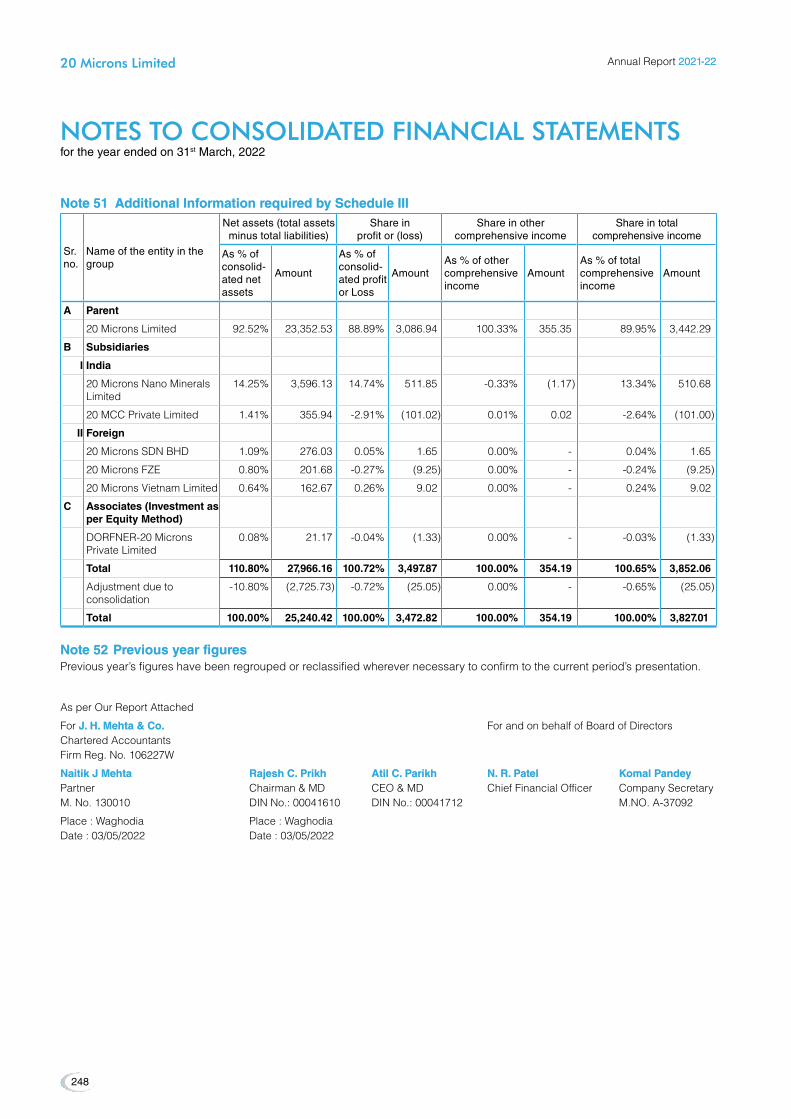
NOTES TO cONSOlIDATED FINANcIAl STATEMENTS NOTES TO cONSOlIDATED FINANcIAl STATEMENTS for the year ended on 31st March, 2022
Note 51 Additional Information required by Schedule IIINote 51 Additional Information required by Schedule III
Sr. no.
Name of the entity in the group
Net assets (total assets minus total liabilities)
Share in profit or (loss)
Share in other comprehensive income
Share in total comprehensive income
As % of consolid-ated net assets
Amount
As % of consolid-ated profit or Loss
AmountAs % of other comprehensive income
AmountAs % of total comprehensive income
Amount
A Parent
20 Microns Limited 92.52% 23,352.53 88.89% 3,086.94 100.33% 355.35 89.95% 3,442.29
B Subsidiaries
I India
20 Microns Nano Minerals Limited
14.25% 3,596.13 14.74% 511.85 -0.33% (1.17) 13.34% 510.68
20 MCC Private Limited 1.41% 355.94 -2.91% (101.02) 0.01% 0.02 -2.64% (101.00)
II Foreign
20MicronsSDNBHD 1.09% 276.03 0.05% 1.65 0.00% - 0.04% 1.65
20 Microns FZE 0.80% 201.68 -0.27% (9.25) 0.00% - -0.24% (9.25)
20 Microns Vietnam Limited 0.64% 162.67 0.26% 9.02 0.00% - 0.24% 9.02
C Associates (Investment as per equity Method)
DORFNER-20MicronsPrivate Limited
0.08% 21.17 -0.04% (1.33) 0.00% - -0.03% (1.33)
Total 110.80% 27,966.16 100.72% 3,497.87 100.00% 354.19 100.65% 3,852.06
Adjustment due to consolidation
-10.80% (2,725.73) -0.72% (25.05) 0.00% - -0.65% (25.05)
Total 100.00% 25,240.42 100.00% 3,472.82 100.00% 354.19 100.00% 3,827.01
Note 52 Previous year figuresNote 52 Previous year figuresPrevious year’s figures have been regrouped or reclassified wherever necessary to confirm to the current period’s presentation.
As per Our Report Attached
For J. H. Mehta & Co.J. H. Mehta & Co. ForandonbehalfofBoardofDirectorsChartered AccountantsFirm Reg. No. 106227W
Naitik J Mehta Rajesh C. Prikh Atil C. Parikh N. R. Patel Komal PandeyNaitik J Mehta Rajesh C. Prikh Atil C. Parikh N. R. Patel Komal PandeyPartner Chairman&MD CEO&MD ChiefFinancialOfficer CompanySecretaryM.No.130010 DINNo.:00041610 DINNo.:00041712 M.NO.A-37092
Place : Waghodia Place : WaghodiaDate:03/05/2022 Date:03/05/2022
Annual Report 2021-222021-22
248
20 Microns Limited20 Microns Limited

Conceptualized and Developed By

Registered Office9/10, GIDC Industrial Estate,Waghodia – Dist. Vadodara - 391760, Gujarat, IndiaE-Mail: [email protected]: www.20microns.com
L99999GJ1987PLC009768
Corporate Office134-135, Hindustan Kohinoor Industrial Estate,L. B. S. Marg, Vikhroli (W), Mumbai, MaharashtraIndia